Work hard, play hard: selling Kelowna, BC, as year-round playground
Upload
khangminh22Category
view
1download
0
1
Designing High Hard
Block Content
Thermoplastic
Polyurethane (TPU)
Resins for Composite
Applications
A thesis submitted to The University of Manchester for the degree of
Doctor of Philosophy
in the Faculty of Engineering and Physical Sciences
2015
CHINEMELUM NEDOLISA
School of Materials

2
TABLE OF CONTENTS
LIST OF TABLES .................................................................................................................. 9
LIST OF FIGURES .............................................................................................................. 10
ABSTRACT ........................................................................................................................... 13
DECLARATION................................................................................................................... 14
COPYRIGHT STATEMENT .............................................................................................. 15
ACKNOWLEDGEMENTS ................................................................................................. 16
CHAPTER 1 INTRODUCTION AND LITERATURE REVIEW........................... 18
1.1 INTRODUCTION ......................................................................................................... 18
1.1.1 THE RELEVANCE OF TPUs .................................................................................. 18
1.2 OUTLINE OF THE THESIS ......................................................................................... 19
1.3 AIMS OF THE RESEARCH WORK ........................................................................... 20
LITERATURE REVIEW ........................................................................ 21
1.4 POLYURETHANES ....................................................................................................... 21
1.4.1 CHEMISTRY OF PUs .............................................................................................. 22
1.5 THERMOPLASTIC POLYURETHANES (TPUs) ..................................................... 26
1.5.1 SYNTHESES OF TPUs ............................................................................................ 27
1.5.2 APPLICATIONS OF TPUs ...................................................................................... 29
1.6 FIBRE REINFORCED POLYMER COMPOSITES.................................................. 30
1.6.1 FIBRE ....................................................................................................................... 30
1.6.1.1 GLASS FIBRE ................................................................................................... 30
1.6.2 MATRIX ................................................................................................................... 32
1.6.2.1 THERMOPLASTICS ........................................................................................ 32
1.6.2.2 THERMOSETS ................................................................................................. 33
1.6.3 RULE OF MIXTURES IN DETERMINING THE PROPERTIES OF FIBRE
REINFORCED COMPOSITES ......................................................................................... 33
1.6.4 APPLICATIONS OF FIBRE REINFORCED COMPOSITES ................................ 36
1.7 STRUCTURE-PROPERTY RELATIONSHIPS OF TPUs ...................................... 36
1.7.1 EFFECT OF CHAIN EXTENDERS ........................................................................ 37
1.7.2 EFFECT OF HARD SEGMENT CONCENTRATION ........................................... 41
1.7.3 EFFECT OF ANNEALING ON THE THERMODYNAMIC, STRUCTURAL,
THERMO-MECHANICAL AND MECHANICAL PROPERTIES OF TPUs ................. 45
1.7.4 THERMODYNAMIC, STRUCTURAL, THERMO-MECHANICAL AND
MECHANICAL PROPERTIES OF TPU COMPOSITES ................................................ 48
CHAPTER 2 MATERIALS AND METHODS ......................................................... 53
2.1 MATERIALS .................................................................................................................. 53
2.1.1 CHEMICALS USED ................................................................................................ 53

3
2.2 SYNTHETIC - CASTING - MOULDING PROCESSES ........................................... 54
2.2.1 SYNTHETIC ROUTE .............................................................................................. 54
2.2.2 TPU FORMULATION CALCULATION ................................................................ 56
2.2.3 DESCRIPTION OF TPU SYNTHESIS ................................................................... 62
2.2.4 SOLVENT CASTING .............................................................................................. 65
2.2.5 COMPRESSION MOULDING ................................................................................ 66
2.3 EXPERIMENTAL TECHNIQUES .............................................................................. 69
2.3.1 GEL PERMEATION CHROMATOGRAPHY (GPC) ............................................ 69
2.3.1.1 THEORETICAL ACCOUNT ............................................................................ 69
2.3.1.2 PARAMETERS USED ...................................................................................... 72
2.3.2 DIFFERENTIAL SCANNING CALORIMETRY (DSC) ........................................ 72
2.3.2.1 THEORETICAL ACCOUNT ............................................................................ 72
2.3.2.2 PARAMETERS USED ...................................................................................... 75
2.3.3 WIDE ANGLE X-RAY SCATTERING (WAXS) ................................................... 76
2.3.3.1 THEORETICAL ACCOUNT ............................................................................ 76
2.3.3.2 PARAMETERS USED ...................................................................................... 77
2.3.4 SMALL ANGLE X-RAY SCATTERING (SAXS) ................................................. 78
2.3.4.1 THEORETICAL ACCOUNT ............................................................................ 78
2.3.4.2 PARAMETERS USED ...................................................................................... 80
2.3.5 THERMO-GRAVIMETRIC ANALYSIS (TGA) .................................................... 81
2.3.5.1 THEORETICAL ACCOUNT ............................................................................ 81
2.3.5.2 PARAMETERS USED ...................................................................................... 82
2.3.6 TOMOGRAPHY ...................................................................................................... 83
2.3.6.1 THEORETICAL ACCOUNT ............................................................................ 83
2.3.6.2 PARAMETERS USED ...................................................................................... 85
2.3.7 RHEOMETRY .......................................................................................................... 85
2.3.7.1 THEORETICAL ACCOUNT ............................................................................ 85
2.3.7.2 PARAMETERS USED ...................................................................................... 86
2.3.8 DYNAMIC MECHANICAL THERMAL ANALYSIS (DMTA) ........................... 86
2.3.8.1 THEORETICAL ACCOUNT ............................................................................ 86
2.3.8.2 PARAMETERS USED ...................................................................................... 89
2.3.9 TENSILE TESTING ................................................................................................. 90
2.3.9.1 PARAMETERS USED ...................................................................................... 90
2.3.10 CREEP TESTING .................................................................................................. 90
2.3.10.1 THEORETICAL ACCOUNT .......................................................................... 90
2.3.10.2 PARAMETERS USED .................................................................................... 92

4
2.3.11 OPTICAL MICROSCOPY ..................................................................................... 93
2.3.11.1 PARAMETERS USED .................................................................................... 93
CHAPTER 3 RESULTS AND DISCUSSION (I) TPUs .................................. 94
3.1 WEIGHT LOSS PROPERTIES .................................................................................... 94
3.2 THERMODYNAMIC - STRUCTURE PROPERTIES .......................................... 105
3.2.1 EFFECT OF CHAIN EXTENDERS AND HARD SEGMENT CONCENTRATION
......................................................................................................................................... 105
3.2.1.1 CAST TPUs ..................................................................................................... 105
3.2.1.2 MELT-QUENCHED TPUs ............................................................................. 114
3.2.1.3 SLOW-COOLED TPUs ................................................................................... 118
3.2.1.4 MOULDED TPUs............................................................................................ 121
3.2.1.5 ANNEALED MOULDED TPUs ..................................................................... 127
CHAPTER 4 RESULTS AND DISCUSSION (II) TPU COMPOSITES ..... 131
4.1 MELT VISCOSITY ...................................................................................................... 131
4.2 COMPOSITE ARCHITECTURE - TOMOGRAPHY ............................................. 134
4.3 OPTICAL MICROSCOPY ...................................................................................... 136
4.4 THERMO-MECHANICAL PROPERTIES .............................................................. 138
4.4.1 MASS AND VOLUME FRACTIONS OF TPU, POLYPROPYLENE AND
ISOPLAST COMPOSITES ............................................................................................. 138
4.4.2 DMTA OF UNANNEALED AND ANNEALED TPU COMPOSITES................ 139
4.4.2.1 2M13PD TPU COMPOSITES ......................................................................... 140
4.4.2.2 15PD TPU COMPOSITES .............................................................................. 143
4.4.2.3 16HD TPU COMPOSITES ............................................................................. 146
4.4.2.4 17HPD TPU COMPOSITES ........................................................................... 149
4.4.2.5 18OD TPU COMPOSITES ............................................................................. 151
4.4.2.6 14CHDM TPU COMPOSITES ....................................................................... 154
4.4.3 TPU COMPOSITES vs POLYPROPYLENE and ISOPLAST COMPOSITES . 157
4.4.3.1 70%HS TPU COMPOSITES vs POLYPROPYLENE vs ISOPLAST ............ 157
4.4.3.2 100%HS TPU COMPOSITES vs POLYPROPYLENE vs ISOPLAST .......... 161
CHAPTER 5 RESULTS AND DISCUSSION (III)................................................. 163
SPECIFIC TESTS ON 15PD TPUs .................................................... 163
5.1 ANNEALING STUDIES ON MELT-QUENCHED 15PD TPUs .......................... 163
5.1.1 MELT-QUENCHED 15PD TPUs (CONTROL SAMPLES) ............................... 163
5.1.2 ISOTHERMAL ANNEALING STUDIES ............................................................. 165
5.2 TENSILE PROPERTIES OF 15PD COMPOSITES vs POLYPROPYLENE vs
ISOPLAST COMPOSITES ............................................................................................... 172
5.2.1 UNANNEALED AND ANNEALED COMPOSITES ........................................... 172

5
5.3 CREEP PROPERTIES OF 15PD COMPOSITES vs POLYPROPYLENE and
ISOPLAST COMPOSITES ............................................................................................... 175
5.3.1 UNANNEALED AND ANNEALED COMPOSITES ........................................... 175
CHAPTER 6 CONCLUSIONS AND FUTURE WORK ....................................... 180
6.1 CONCLUSIONS ........................................................................................................... 180
6.2 FUTURE WORK .......................................................................................................... 182
6
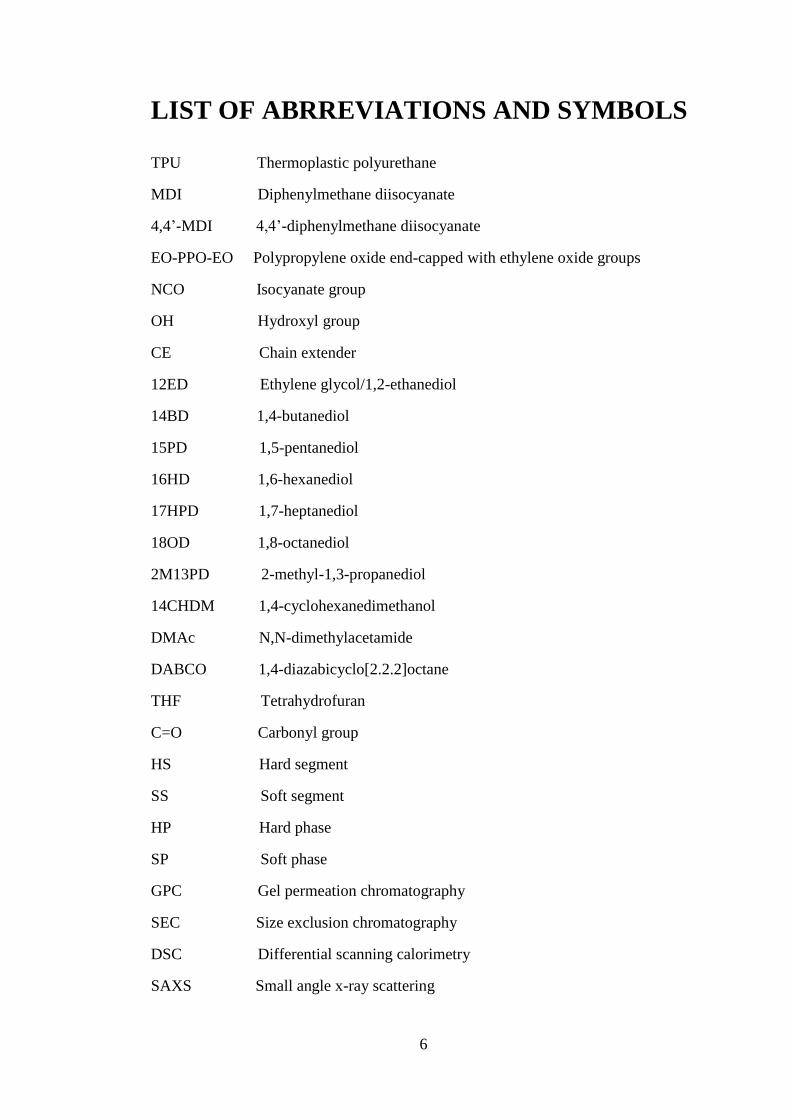
LIST OF ABRREVIATIONS AND SYMBOLS
TPU Thermoplastic polyurethane
MDI Diphenylmethane diisocyanate
4,4’-MDI 4,4’-diphenylmethane diisocyanate
EO-PPO-EO Polypropylene oxide end-capped with ethylene oxide groups
NCO Isocyanate group
OH Hydroxyl group
CE Chain extender
12ED Ethylene glycol/1,2-ethanediol
14BD 1,4-butanediol
15PD 1,5-pentanediol
16HD 1,6-hexanediol
17HPD 1,7-heptanediol
18OD 1,8-octanediol
2M13PD 2-methyl-1,3-propanediol
14CHDM 1,4-cyclohexanedimethanol
DMAc N,N-dimethylacetamide
DABCO 1,4-diazabicyclo[2.2.2]octane
THF Tetrahydrofuran
C=O Carbonyl group
HS Hard segment
SS Soft segment
HP Hard phase
SP Soft phase
GPC Gel permeation chromatography
SEC Size exclusion chromatography
DSC Differential scanning calorimetry
SAXS Small angle x-ray scattering
7
WAXD/S Wide angle x-ray diffraction/scattering
TGA Thermo-gravimetric analysis
DTG Derivative thermogravimetry
TMA Thermo-mechanical analysis
CT Computer tomography
FTIR Fourier transform infrared spectroscopy
DMTA Dynamic mechanical thermal analysis
SEM Scanning electron microscopy
w Weight-average molecular weight
n Number-average molecular weight
PDI Polydispersity index
Tg Glass transition temperature
Tm Melting temperature
TgHS Hard segment glass transition temperature
TgSS Soft segment glass transition temperature
TgHP Hard phase glass transition temperature
TgSP Soft phase glass transition temperature
TgMP Mixed phase glass transition temperature
TMMT Microphase mixing transition
TMST Microphase separation transition
TA Annealing endotherm
TM Melting transition (ordered hard segments after annealing)
ΔCp Heat capacity change
ΔCpHS Heat capacity change in hard segment
ΔCpSS Heat capacity change in soft segment
q* Scattering maximum (SAXS)
q Scattering vector (SAXS)
G’/ E’ Storage modulus
G’’/E’’ Loss modulus
8
Tan δ Damping factor
E Young’s modulus
σ Stress
ε Strain

9
LIST OF TABLES Table 1.1: Names and structures of chain extenders .............................................................. 25
Table 1.2: Mechanical properties of PU elastomers prepared by the four routes61
............... 29
Table 1.3: Krenchel factors for various fibre groupings ........................................................ 35
Table 2.1: Names, structures, acronyms and molar masses of the chemicals used for the
synthesis of TPUs .................................................................................................................... 53
Table 2.2: Molecular weights and polydispersity indices of synthesized TPUs ..................... 64
Table 3.1: Weight losses of 14bd TPUs .................................................................................. 97
Table 3.2: Weight losses of 14chdm TPUs ............................................................................. 99
Table 3.3: Weight losses of 2m13pd TPUs ........................................................................... 100
Table 3.4: Weight losses of 15pd, 16hd, 17hpd and 18od TPUs .......................................... 103
Table 3.5: Calculated d-spacings of the crystalline peaks of 70% HS- 15pd, 16hd, 17hpd
and 18od TPUs ..................................................................................................................... 112
Table 3.6: Calculated and observed d-spacings of Blackwell and Ross, and Born et al X-ray
studies of structure of polyurethane hard segments (MDI and 1,4-butanediol) ................... 112
Table 3.7: Calculated d-spacings of the crystalline peaks of annealed moulded 100% HS-
15pd, 16hd, 17hpd, 18od and 14chdm TPUs ........................................................................ 130
Table 4.1: Weight and volume fractions of TPU composites ................................................ 138
Table 4.2: Storage moduli data of unannealed and annealed 70% TPU vs Polypropylene vs
Isoplast composites ............................................................................................................... 158
Table 4.3: Storage moduli data of unannealed and annealed 100% TPU vs Polypropylene
and Isoplast composites ........................................................................................................ 162
Table 5.1: 1st heating DSC phase transitions of annealed melt-quenched 15pd TPU series171
Table 5.2: Data of the tensile properties of unannealed 15pd TPU composites vs
polypropylene and Isoplast composites ................................................................................ 172
Table 5.3: Data of the tensile properties of annealed 15pd TPU composites vs polypropylene
and Isoplast composites ........................................................................................................ 173
Table 5.4: Creep properties of the unannealed composites ................................................. 177
Table 5.5: Creep properties of the annealed composites ..................................................... 178

10
LIST OF FIGURES Figure 1.1 Urethane linkage ................................................................................................... 22
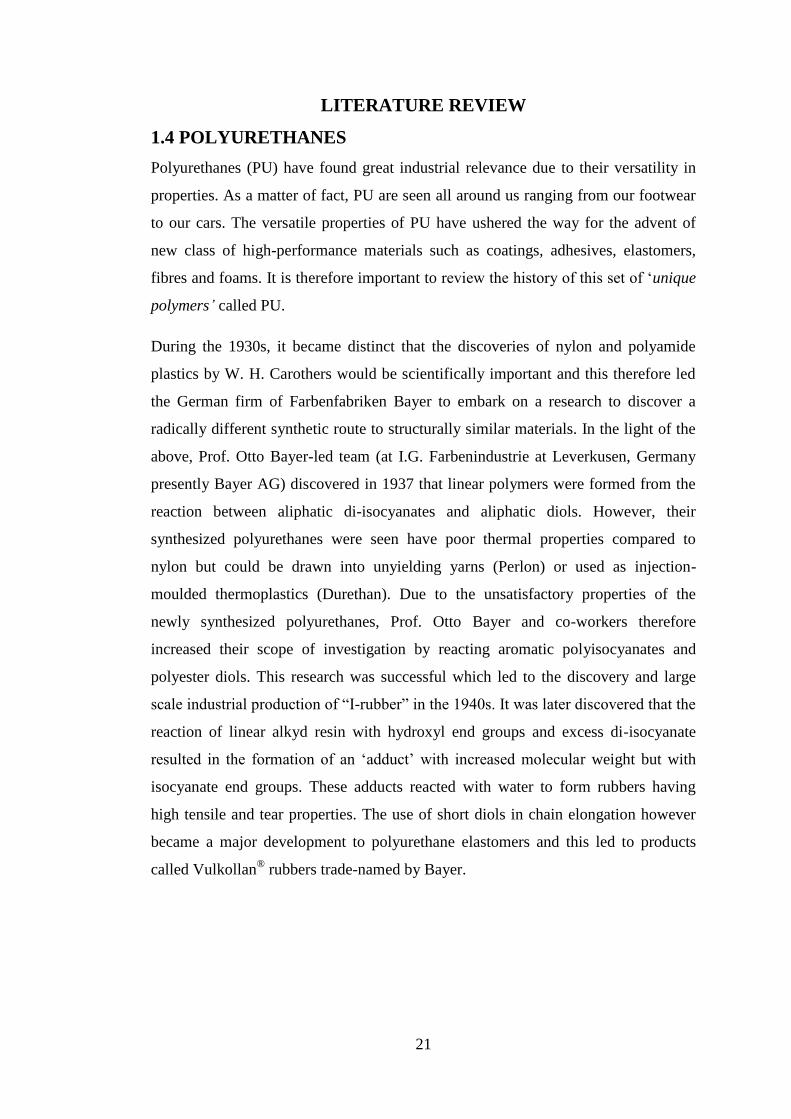
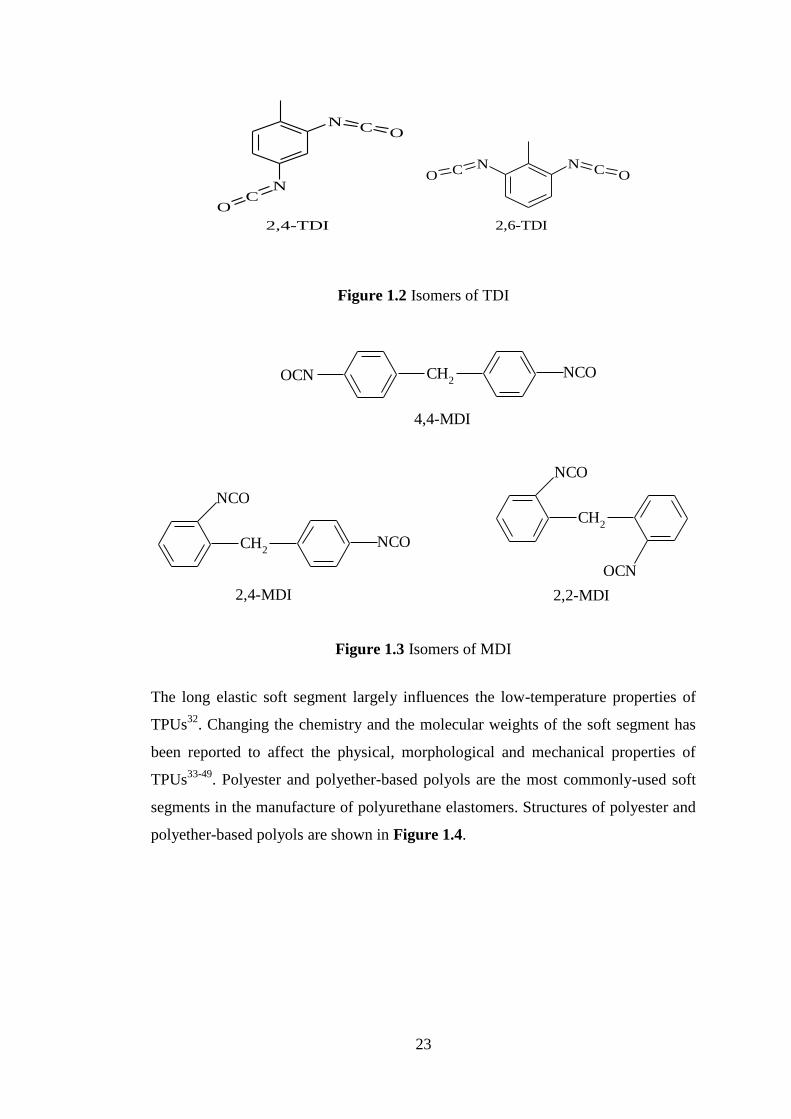
Figure 1.2 Isomers of TDI ...................................................................................................... 23
Figure 1.3 Isomers of MDI .................................................................................................... 23
Figure 1.4 Structures of polyester and polyether polyols ....................................................... 24
Figure 1.5 Schematic illustration of hard and soft segments of a thermoplastic polyurethane
(TPU) ...................................................................................................................................... 26
Figure 1.6 Schematic representation of phase separation occurring in TPUs63
..................... 27
Figure 1.7 Values of efficiency factor or Krenchel factor for different fibre orientations82
.. 35
Figure 1.8 Hard-segment melting temperature versus number of methylene units of alkane
diol94
........................................................................................................................................ 38
Figure 1.9 Geometric isomerism of (a) even-numbered diol TPU and (b) odd-numbered diol
TPU94
...................................................................................................................................... 38
Figure 1.10 (a) Melting temperature and (b) melting/crystallization enthalpy versus number
of methylene units95
................................................................................................................ 39
Figure 1.11 Parallel and anti-parallel arrangements of odd and even-numbered diol-TPUs.
(a) Parallel and anti-parallel arrangements are possible for the odd-numbered diol-TPU
whereas only (b) anti-parallel arrangement is possible for even-numbered diol-TPU95
......... 40
Figure 1.12 Model showing the morphologies of TPUs in melt-quenched and microphase-
separated states60
..................................................................................................................... 43
Figure 1.13 Change in heat capacity of the soft segment glass transition as a function of
hard segment concentration108
................................................................................................. 43
Figure 1.14 Orientations of the fibres in the TPU matrix ...................................................... 51
Figure 2.1 Synthetic protocol used to synthesize the TPU .................................................... 55
Figure 2.2 The experimental set-up for TPU synthesis .......................................................... 62
Figure 2.3 (a) Schematic diagram of the mould and (b) photograph of the cast TPU-70
(15pd) sample.......................................................................................................................... 65
Figure 2.4 The schematic diagram of the compression moulding process ............................ 66
(a) The mould was first preheated in the compression moulder, (b) the polymer films and
fibre mats were layered together in the preheated mould, (c) the stacked-up polymer films
and fibre mats were compressed, (d) the compressed sample was left in the moulder to cool
to about room temperature and (e) the composite was then extracted from the mould .......... 66
Figure 2.5 Schematic diagram of GPC apparatus .................................................................. 69
Figure 2.6 Elution processes of large and small molecules ................................................... 69
Figure 2.7 Cell designs of power-compensation and heat-flux DSC instruments (where TS
and TR stand for the temperatures of the sample and reference respectively, ES and ER stand
for the heat energies of the sample and reference respectively. .............................................. 74
Figure 2.8 The thermal protocol of DSC runs ........................................................................ 75
Figure 2.9 X-ray diffraction process ...................................................................................... 76
Figure 2.10 Schematic diagram of small angle x-ray scattering technique............................ 78
Figure 2.11 Schematic diagram of thermo-gravimetric technique ......................................... 81
Figure 2.12 Schematic diagram of Computer Tomography instrumentation ......................... 83
Figure 2.13 Schematic representation of the squeeze-flow technique ................................... 85
11
Figure 2.14 Phase lag in displacement of strain in comparison to the applied stress............. 87
Figure 2.15 Elastic deformation ............................................................................................. 87
Figure 2.16 Viscous deformation ........................................................................................... 88
Figure 2.17 Viscoelastic deformation .................................................................................... 88
Figure 2.18 Schematic diagram of dual cantilever DMTA method ....................................... 89
Figure 2.19 The relative response of stress – strain and their effect on creep modulus ......... 91
Figure 2.20 Creep diagram showing the three parts of strain responses of a material under
constant stress ......................................................................................................................... 92
Figure 3.1 Weight losses of TPU constituents ....................................................................... 95
Figure 3.2 12ed TPU series TGA curves obtained for the (a) weight loss (b) derivative
weight loss versus temperature ............................................................................................... 96
Figure 3.3 14bd TPU series TGA curves obtained for the (a) weight loss (b) derivative
weight loss versus temperature ............................................................................................... 97
Figure 3.4 14chdm TPU series TGA curves obtained for the (a) weight loss (b) derivative
weight loss versus temperature ............................................................................................... 99
Figure 3.5 2m13pd TPU series with hard segment concentrations (a) weight loss (b)
derivative weight loss as a function of temperature .............................................................. 100
Figure 3.6 (a) Weight losses (b) Derivative weight losses as a function of temperature of (I)
15pd TPUs, (II) 16hd TPUs, (III) 17hpd TPUs and (IV) 18od TPUs ................................... 103
Figure 3.7 1st DSC heating cycles of cast TPUs (a) 70%HS and (b) 100%HS ................... 105
Figure 3.7 (c) Microphase mixing temperature versus number of methylene units ............. 107
Figure 3.7 SAXS of cast TPUs (d) 70%HS and (e) 100%HS .............................................. 108
Figure 3.7 WAXS of cast TPUs (f) 70%HS and (g) 100%HS ............................................. 109
Figure 3.8 Projection of the conformation of Poly(MDI-Butanediol) proposed by Blackwell
and Nagarajan193
.................................................................................................................... 111
Figure 3.9 1st DSC heating cycles of melt-quenched TPUs (a) 70%HS and (b) 100%HS . 114
Figure 3.9 SAXS of melt-quenched TPUs (c) 70%HS and (d) 100%HS ............................ 116
Figure 3.9 WAXS of melt-quenched TPUs (e) 70%HS and (f) 100%HS ........................... 117
Figure 3.10 2nd DSC heating cycles of slow-cooled TPUs (c) 70%HS and (d) 100%HS .. 119
Figure 3.11 1st DSC heating cycles of moulded TPUs (a) 70%HS and (b) 100%HS ......... 121
Figure 3.11 (c) partially melted to 157°C, (d) cooled to -90°C, (e) reheated to 220°C and (f)
cooled to 25°C ...................................................................................................................... 123
Figure 3.11 SAXS of moulded TPUs (g) 70%HS and (h) 100%HS .................................... 125
Figure 3.11 WAXS of moulded TPUs (i) 70%HS and (j) 100%HS .................................... 126
Figure 3.12 1st DSC heating cycles of annealed moulded TPUs (a) 70%HS and (b) 100%HS127
Figure 3.12 WAXS of annealed moulded TPUs (e) 70%HS and (f) 100%HS .................... 129
Figure 4.1 Melt-viscosity properties of TPUs with different chain extenders ..................... 132
Figure 4.2 (a), (b) and (c) The internal architecture of the glass-TPU composite ............... 136
Figure 4.3 (a) and (b) Optical microscopy images of the TPU composite ........................... 137
Figure 4.4 (a) Storage modulus (b) tan delta of (I) unannealed 2m13pd TPU composites (II)
annealed 2m13pd TPU composites ....................................................................................... 140

12
Figure 4.5 Storage moduli bar graph of (a) unannealed and (b) annealed 2m13pd TPU
composites............................................................................................................................. 141
Figure 4.6 (a) Storage modulus (b) tan delta of (I) unannealed 15pd TPU composites (II)
annealed 15pd TPU composites ............................................................................................ 143
Figure 4.7 Storage moduli bar graph of (a) unannealed and (b) annealed 15pd TPU
composites............................................................................................................................. 144
Figure 4.8 (a) Storage modulus (b) tan delta of (I) unannealed 16hd TPU composites (II)
annealed 16hd TPU composites ............................................................................................ 146
Figure 4.9 Storage moduli bar graph of (a) unannealed and (b) annealed 16hd TPU
composites............................................................................................................................. 147
Figure 4.10 (a) Storage modulus (b) tan delta of (I) unannealed 17hpd TPU composites (II)
annealed 17hpd TPU composites .......................................................................................... 149
Figure 4.11 Storage moduli bar graph of (a) unannealed and (b) annealed 17hpd TPU
composites............................................................................................................................. 150
Figure 4.12 (a) Storage modulus (b) tan delta of (I) unannealed 18od TPU composites (II)
annealed 18od TPU composites ............................................................................................ 151
Figure 4.13 Storage moduli bar graph of (a) unannealed and (b) annealed 18od TPU
composites............................................................................................................................. 152
Figure 4.14 (a) Storage modulus (b) tan delta of (I) unannealed 14chdm TPU composites
(II) annealed 14chdm TPU composites ................................................................................. 154
Figure 4.15 Storage moduli bar graph of (a) unannealed and (b) annealed 14chdm TPU
composites............................................................................................................................. 155
Figure 5.1 (a) 1st heating cycles (b) 2
nd heating cycles of melt-quenched 15pd TPUs ........ 163
Figure 5.2 1st heating DSC cycles of (a) 100%HS (b) 90%HS (c) 80%HS and (d) 70%HS
melt-quenched 15pd TPUs annealed at different annealing times (8, 24, 72 and 168 hours)166
Figure 5.3 TMMT/TM and TA vs HS concentration of 70%, 80%, 90% and 100%HS annealed
melt-quenched TPUs annealed for 8hrs ................................................................................ 169
Figure 5.4 ΔHtotal of TMMT/TM and ΔHtotal of TA vs hard segment concentration of 70%, 80%,
90% and 100%HS annealed melt-quenched TPUs annealed for 8hrs .................................. 170
Figure 5.5 Tensile properties of unannealed 15pd TPU composites vs polypropylene and
Isoplast composites ............................................................................................................... 172
Figure 5.6 Tensile properties of annealed 15pd TPU composites vs polypropylene and
Isoplast composites ............................................................................................................... 173
Figure 5.7 Creep properties of unannealed 15pd TPU composites vs PP and I composites 175
Figure 5.8 Creep properties of annealed 15pd TPU composites vs PP and I composites .... 177

13
ABSTRACT
The effect of different chain extenders and hard segment (HS) concentrations on the
properties of thermoplastic polyurethanes (TPUs) and TPU composites were
investigated. The chain extenders used were 2-methyl-1,3-propanediol (2m13pd),
1,2-ethanediol (12ed), 1,4-butanediol (14bd), 1,5-pentanediol (15pd), 1,6-hexanediol
(16hd), 1,7-heptanediol (17hpd), 1,8-octanediol (18od) and 1,4-
cyclohexanedimethanol (14chdm). The hard segment concentrations of the TPUs
investigated were 70%, 80%, 90% and 100%. Only 70% and 100%HS were
investigated for the 17hpd and 18od TPUs. DSC results revealed that the cast
2m13pd and 14chdm TPUs had little or no melting transitions. Cast 14chdm TPUs
were amorphous which was attributed to the mixture of cis- and trans- geometric
isomers present in the 1,4-cyclohexanedimethanol chain extender. The reason for the
low crystallinities of 2m13pd TPUs was attributed to the branched structure of the
2m13pd extender as the methyl (–CH3–) pendant group hinders the crystallization of
the polymer chains which also imparts flexibility to the polymer chains. 12ed and
14bd TPUs displayed the highest melting transitions (about 220°C) and melting
enthalpies (ΔHTot) due to their high crystallinity levels. Similar trends in thermal
properties were observed for the 70%HS cast TPUs chain-extended with 15pd, 16hd,
17hpd and 18od. The microphase mixing transition (TMMT) values of 70%HS cast
TPUs chain-extended with 15pd, 16hd, 17hpd and 18od were 180±0.3, 190±0.5,
164±0.5 and 182±0.5°C. The TMMT values show that the even-numbered chain-
extended TPUs have higher melting transitions than the odd-numbered chain
extended TPUs. This observation could be linked to the odd-even effect of odd-
numbered and even-numbered diols (chain extenders). Multiple endothermic
transitions were observed for the melt-quenched and slow-cooled TPUs chain-
extended with 16hd, 17hpd and 18od. These multiple endothermic transitions were
attributed to the existence of polymorphic structures in the polymer chains. The
melt-quenching and compression moulding processes decreased the crystallinities of
the TPUs whereas the annealing process increased the degrees of crystallinity of all
TPU samples. Phase separation was observed for all the cast 70% and 100%HS
TPUs as revealed in the SAXS results. The SAXS peaks observed for the 70%HS
TPUs come from the HS-Soft Segment (SS) phase whereas the SAXS peaks
observed for the 100%HS TPUs come from the crystalline HS and the amorphous
HS. Crystalline peaks were seen on the amorphous halos of linear chain-extended
cast 70% and 100%HS TPUs as revealed by WAXS results. These peaks correspond
to the crystallinity of hard segments. It was observed that annealing the moulded
TPU samples at 80°C for 168 hours induced the formation of crystal structures
which have d-spacings of about 4.6Å (otherwise known as type-II crystals).
Compression-moulded TPU composites reinforced with woven glass-fibre mats
displayed storage moduli above 2 GPa at 25°C as revealed by the DMTA results.
Upon annealing, the storage moduli of the TPU composites increased above 4 GPa.
The storage moduli of the unannealed and annealed TPU composites compare well
with those of unannealed and annealed composites with polypropylene and
commercial TPU matrices. Tensile testing showed that the Young’s moduli of the
unannealed and annealed 15pd TPU composites were similar to those of
polypropylene and commercial TPU composites.
14
DECLARATION
No portion of the work referred to in the thesis has been submitted in support of an
application for another degree or qualification of this or any other university or other
institute of learning.
15
COPYRIGHT STATEMENT
The author of this thesis (including any appendices and/or schedules to this thesis)
owns certain copyright or related rights in it (the “Copyright”) and he has given The
University of Manchester certain rights to use such Copyright, including for
administrative purposes.
Copies of this thesis, either in full or in extracts and whether in hard or electronic
copy, may be made only in accordance with the Copyright, Designs and Patents Act
1988 (as amended) and regulations issued under it or, where appropriate, in
accordance with licensing agreements which the University has from time to time.
This page must form part of any such copies.
The ownership of certain Copyright, patents, designs, trademarks and other
intellectual property (the “Intellectual Property”) and any reproductions of copyright
works in the thesis, for example graphs and tables (“Reproduction”), which may be
described in this thesis, may not be owned by the author and may be owned by third
parties. Such Intellectual Property and Reproductions cannot and must not be made
available for use without the prior written permission of the owner(s) of the relevant
Intellectual Property and/or Reproductions.
Further information on the conditions under which disclosure, publication and
commercialization of this thesis, the Copyright and any Intellectual Property and/or
Reproductions described in it may take place is available in the University IP Policy
(see http://www.campus.manchester.ac.uk/medialibrary/policies/intellectual-
property.pdf), in any relevant Thesis restriction declarations deposited in the
University Library, The University Library’s regulations (see
http://www.manchester.ac.uk/library/aboutus/regulations) and in The University’s
policy on presentation of Theses.

16
ACKNOWLEDGEMENTS
I give all my thanks to the Almighty God for His goodness, mercies,
guidance, protection, unprecedented assistance and favour all through the period of
my research work and throughout my entire academic life till date.
I also express my heartfelt gratitude to my academic supervisor, Dr. Alberto
Saiani for the favour and assistance he showed to me in the pursuit of my PhD
programme. I really appreciate your care, support, guidance and tutelage shown
towards me throughout my research work. It was a great delight to work with you as
my supervisor.
I thank Prof. Aline Miller and my colleagues at the Polymers and Peptides
group for their contributions in the group meetings throughout my research work.
You all were helpful in many different ways.
I particularly thank Prof. Ian Kinloch, Dr. Arthur Wilkinson, Dr. Alan
Nesbitt, Mr. Andrew Zadoroshnyj, Mrs. Polly Crook, members of Materials Science
Centre workshop crew and members of Materials Science Centre IT team for their
academic and technical assistance throughout my research work.
I also thank my course mates for many years; Shicheng Li, Amir-Hossein
Milani and Basheer Al-Shammari for their lovely friendship and the fun times we
shared together. You guys are fun to be around.
I genuinely express my warm gratitude to my dearly beloved parents and
siblings for their massive encouragement, interest and support that kept me forging
ahead in my academic endeavour. Your words of encouragement and belief were
boosters to my undying academic pursuit even through thick and thin. I love and
thank you all so much. You all mean so much to me.
Finally, I deeply thank the Dr. Chris Lindsay, Huntsman Corporation
(Huntsman Polyurethane) and the School of Materials for their interest and funding
towards this research work. I am honoured to be a part and parcel of the Huntsman
organization in embarking on this research work.
My God shall bless you all and all the works of your hands. You all will be
remembered for the good you have done to me.

17
QUOTATION
On the road to success, failures are inevitable roadblocks that must be pushed aside
Chinemelum Nedolisa

18
CHAPTER 1
INTRODUCTION AND LITERATURE
REVIEW
1.1 INTRODUCTION
1.1.1 THE RELEVANCE OF TPUs
Thermosetting polymers have been widely used as composite matrices in various
applications especially in the automotive and aerospace sectors. Thermosetting
materials have excellent mechanical and thermo-mechanical properties largely due to
their cross-linked network-like architecture. Thermosetting polymers such as epoxy
and polyester resins have low viscosities which make them excellent materials to be
used as matrices in composite manufacture. Their low viscosities make them viable
materials to be used in different processing techniques such as compression
moulding, injection moulding, extrusion moulding, resin infusion etc. These
processing techniques are commonly used in the automotive and aerospace
industries. Moreso, their low viscosities make them compatible with different fibres
as there is ease of penetration within the fibre bundles and consequently, this aids the
formation of good fibre-matrix interfacial properties and therefore leading to
excellent mechanical and thermo-mechanical properties. Thermosetting composites
have good weight-to-strength ratio and are able to withstand external impacts1-14
.
Despite the excellent properties of thermosetting polymers which are advantageous
to them being used in structural applications, thermosetting polymers are non-
reprocessable and non-recyclable. The consequence is that many damaged
thermosetting materials become waste.
Thermoplastic polymers such as isotactic polypropylene (PP) have been widely used
in the manufacture of glass fibre reinforced composite materials15-29
. PP possesses
good mechanical properties which originate from its high level of crystallinity. The
disadvantage associated with the use of PP is mainly due to its high viscosity. The
high viscosity of PP often leads to the distortion of fibres during composite
processing.
Having established the significant disadvantages associated with thermosetting
materials as well as PP, the use of thermoplastic polymers therefore forms the main

19
crux of this research work. Thermoplastic polyurethane (TPU) is used as our choice
of thermoplastic polymer in this research work primarily due to its versatile physical
properties. TPU is a linear, segmented copolymer consisting of alternating hard and
soft segments. Being a copolymer, these versatile physical properties of TPU
originate from its microphase separation due to thermodynamic incompatibility
existing between the hard and soft segments. TPU can be employed in different
composite processing techniques due to its low viscosity. The recyclability and
reprocessability of TPU make it an excellent thermoplastic material to be used.
Furthermore, the properties of TPU can be attuned by varying the amounts of its
constituents as well as changing their chemical compositions and structures.
1.2 OUTLINE OF THE THESIS
This thesis consists of six distinct chapters.
Chapter 1 begins with the introduction of PU and TPU. The chemistry, syntheses
and applications of PU and TPU are also introduced. The constituents, processing
and applications of fibre reinforced composites are also highlighted. Furthermore,
different literatures about the structure-property relationships of TPUs and TPU
composites are reviewed. The aim of the research work is also revealed.
Chapter 2 gives comprehensive information on the starting raw materials, the
synthetic processes of the TPUs, the processing method of the TPUs/TPU
composites and the characterization techniques employed during the research work.
Chapter 3 provides information on the first part of the Results and Discussion. This
focuses on the weight loss, thermodynamic and structural properties of different
post-treated TPUs (i.e. casted, melt-quenched, slow-cooled, moulded and annealed
moulded TPUs).
Chapter 4 provides information on the second part of the Results and Discussion.
This focuses on the melt-viscosity, wettability, interfacial and thermo-mechanical
properties of TPU composites.
Chapter 5 provides information on the third part of the Results and Discussion. This
focuses on specific tests (tensile and creep) carried out on 15pd TPU composites.
The tensile and creep properties of 15pd TPU composites are evaluated.

20
Chapter 6 highlights on the conclusions derived from the research work and also
provide suggestions for possible research work that could be carried out for further
study.
1.3 AIMS OF THE RESEARCH WORK
The aim of this research work is to design high hard block content thermoplastic
polyurethane (TPU) resins which will be used for composite applications especially
in automotive and aerospace applications. In this research work, the thermodynamic,
structural, morphological, thermo-mechanical and mechanical properties of TPUs
and their composites are extensively investigated. This research work is divided into
two broad parts namely:
1. Understanding the thermodynamic, structural and morphological properties
of designed TPUs.
2. Elucidating the thermodynamic, structural, interfacial, architectural, thermo-
mechanical and mechanical properties of the designed TPUs as matrices in
glass fibre-reinforced composite making.
To broaden the scope of this research work, it was decided that the properties of the
TPUs and their composites can be attuned by changing certain parameters and
variables. These parameters and variables are as follows:
A. The effect of different chain extenders
B. The effect of increasing hard segment concentration
C. The effect of annealing
21
LITERATURE REVIEW
1.4 POLYURETHANES
Polyurethanes (PU) have found great industrial relevance due to their versatility in
properties. As a matter of fact, PU are seen all around us ranging from our footwear
to our cars. The versatile properties of PU have ushered the way for the advent of
new class of high-performance materials such as coatings, adhesives, elastomers,
fibres and foams. It is therefore important to review the history of this set of ‘unique
polymers’ called PU.
During the 1930s, it became distinct that the discoveries of nylon and polyamide
plastics by W. H. Carothers would be scientifically important and this therefore led
the German firm of Farbenfabriken Bayer to embark on a research to discover a
radically different synthetic route to structurally similar materials. In the light of the
above, Prof. Otto Bayer-led team (at I.G. Farbenindustrie at Leverkusen, Germany
presently Bayer AG) discovered in 1937 that linear polymers were formed from the
reaction between aliphatic di-isocyanates and aliphatic diols. However, their
synthesized polyurethanes were seen have poor thermal properties compared to
nylon but could be drawn into unyielding yarns (Perlon) or used as injection-
moulded thermoplastics (Durethan). Due to the unsatisfactory properties of the
newly synthesized polyurethanes, Prof. Otto Bayer and co-workers therefore
increased their scope of investigation by reacting aromatic polyisocyanates and
polyester diols. This research was successful which led to the discovery and large
scale industrial production of “I-rubber” in the 1940s. It was later discovered that the
reaction of linear alkyd resin with hydroxyl end groups and excess di-isocyanate
resulted in the formation of an ‘adduct’ with increased molecular weight but with
isocyanate end groups. These adducts reacted with water to form rubbers having
high tensile and tear properties. The use of short diols in chain elongation however
became a major development to polyurethane elastomers and this led to products
called Vulkollan® rubbers trade-named by Bayer.

22
1.4.1 CHEMISTRY OF PUs
The basic chemistry of PUs involves the reaction of the three major constituents,
namely: a diisocyanate, a polyol and a chain extender30
. The reaction of an
isocyanate and a hydroxyl group produces a urethane linkage as shown in Figure
1.1.
R1
N C O R2
O H R1
N
H
C
O
O R2
+
Isocyanate Hydroxyl Urethane
Figure 1.1 Urethane linkage
In the hydrogen bonding mechanism of PUs, the N-H group acts as proton donor
whereas the neighbouring oxygen from the carbonyl group or the oxygen from the
soft segments act as proton acceptors31
.
Diisocyanates are divided into aromatic and aliphatic. Aromatic isocyanates are
much more reactive than aliphatic isocyanates as the electron extracting property of
the benzene ring tends to uncover the isocyanate carbon for nucleophilic attack
whereas the electron-donating groups close to the isocyanate carbon tend to reduce
the reaction rate of the isocyanate group. Aliphatic isocyanates are preferred to
aromatic isocyanates when colour retention and clarity of materials in sunlight are
required.
Two commonly used aromatic isocyanates in PU production are toluene diisocyanate
(TDI) and diphenylmethane diisocyanate (MDI). TDI comprises of a mixture of the
2,4- and 2,6- isomers. The commonly used TDI product has 80% 2,4-isomer and
20% 2,6- isomer. MDI has three isomers: 4,4- MDI, 2,4- MDI and 2,2- MDI; these
can be polymerised to form oligomeric products with three or more functionalities.
Figures 1.2 and 1.3 show the isomeric structures of TDI and MDI.
23
N
N
CO
C O
2,4-TDI
NN C OCO
2,6-TDI
Figure 1.2 Isomers of TDI
CH2
NCOOCN
4,4-MDI
CH2
NCO
NCO
2,4-MDI
CH2
NCO
OCN
2,2-MDI
Figure 1.3 Isomers of MDI
The long elastic soft segment largely influences the low-temperature properties of
TPUs32
. Changing the chemistry and the molecular weights of the soft segment has
been reported to affect the physical, morphological and mechanical properties of
TPUs33-49
. Polyester and polyether-based polyols are the most commonly-used soft
segments in the manufacture of polyurethane elastomers. Structures of polyester and
polyether-based polyols are shown in Figure 1.4.
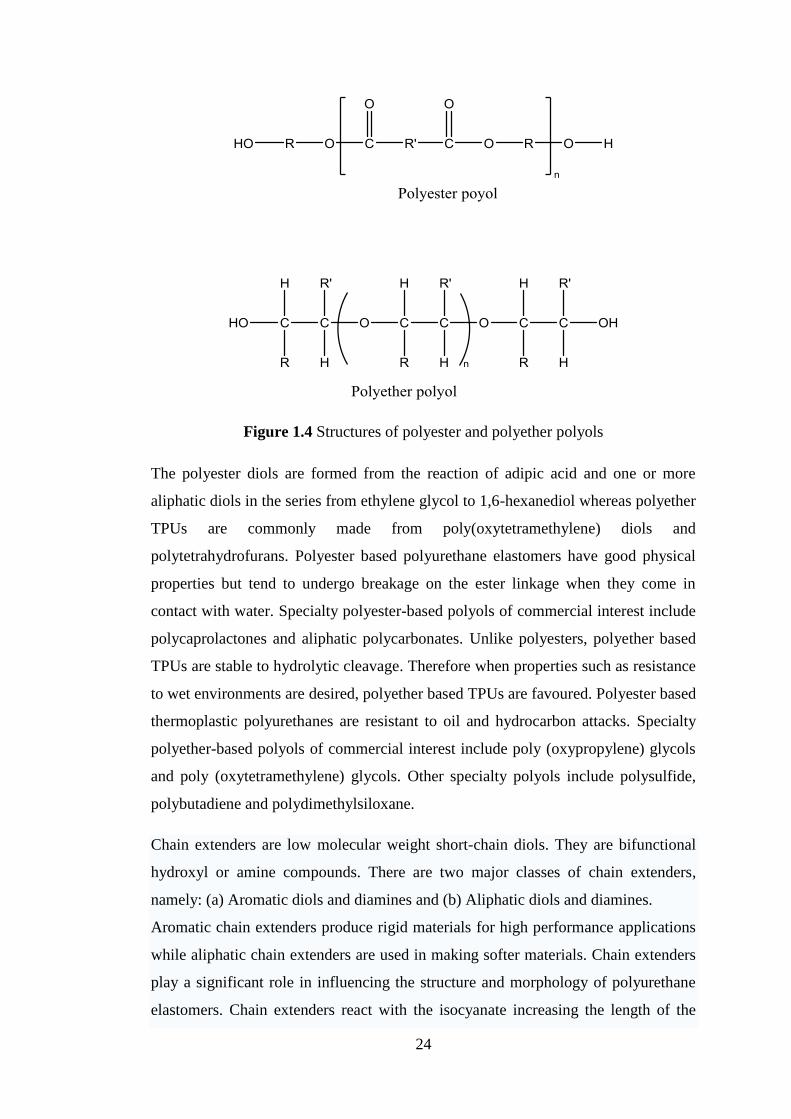
24
Figure 1.4 Structures of polyester and polyether polyols
The polyester diols are formed from the reaction of adipic acid and one or more
aliphatic diols in the series from ethylene glycol to 1,6-hexanediol whereas polyether
TPUs are commonly made from poly(oxytetramethylene) diols and
polytetrahydrofurans. Polyester based polyurethane elastomers have good physical
properties but tend to undergo breakage on the ester linkage when they come in
contact with water. Specialty polyester-based polyols of commercial interest include
polycaprolactones and aliphatic polycarbonates. Unlike polyesters, polyether based
TPUs are stable to hydrolytic cleavage. Therefore when properties such as resistance
to wet environments are desired, polyether based TPUs are favoured. Polyester based
thermoplastic polyurethanes are resistant to oil and hydrocarbon attacks. Specialty
polyether-based polyols of commercial interest include poly (oxypropylene) glycols
and poly (oxytetramethylene) glycols. Other specialty polyols include polysulfide,
polybutadiene and polydimethylsiloxane.
Chain extenders are low molecular weight short-chain diols. They are bifunctional
hydroxyl or amine compounds. There are two major classes of chain extenders,
namely: (a) Aromatic diols and diamines and (b) Aliphatic diols and diamines.
Aromatic chain extenders produce rigid materials for high performance applications
while aliphatic chain extenders are used in making softer materials. Chain extenders
play a significant role in influencing the structure and morphology of polyurethane
elastomers. Chain extenders react with the isocyanate increasing the length of the
25
hard segment chains. Chain extenders having a functionality of 3 or 4 are known as
cross-linkers. Chain extenders are added to isocyanate units to allow for hard
segment separation. This therefore results in an increment in modulus and the hard
segment glass transition temperature (Tg) of the TPU. Commonly used chain
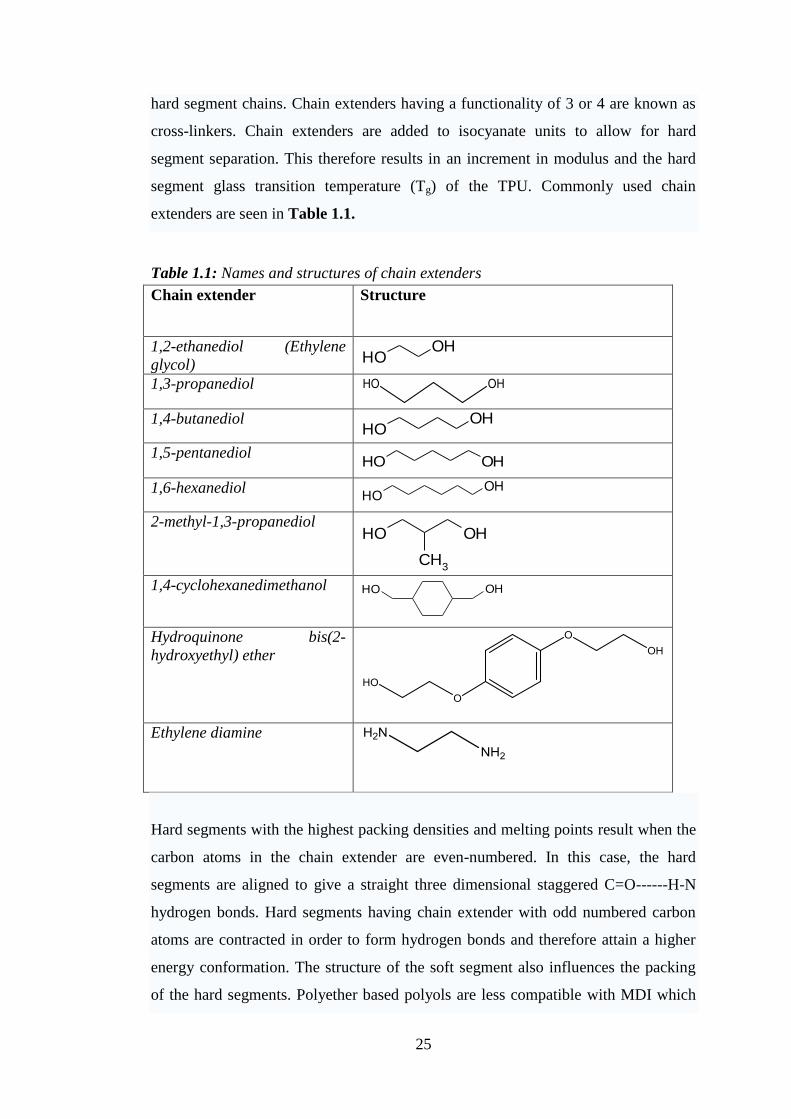
extenders are seen in Table 1.1.
Table 1.1: Names and structures of chain extenders
Chain extender Structure
1,2-ethanediol (Ethylene
glycol) OHOH
1,3-propanediol
1,4-butanediol OH
OH
1,5-pentanediol OH OH
1,6-hexanediol OH
OH
2-methyl-1,3-propanediol OH OH
CH3
1,4-cyclohexanedimethanol OHOH
Hydroquinone bis(2-
hydroxyethyl) ether
Ethylene diamine
Hard segments with the highest packing densities and melting points result when the
carbon atoms in the chain extender are even-numbered. In this case, the hard
segments are aligned to give a straight three dimensional staggered C=O------H-N
hydrogen bonds. Hard segments having chain extender with odd numbered carbon
atoms are contracted in order to form hydrogen bonds and therefore attain a higher
energy conformation. The structure of the soft segment also influences the packing
of the hard segments. Polyether based polyols are less compatible with MDI which
26
therefore leads to stronger phase separation. Polyether based TPUs have more
complicated hard phase domains than polyester based TPUs. However, an increase
in the hydrocarbon chain length as well as molecular weights of polyether and
polyester polyols affect the phase separation of TPU50-55
.
1.5 THERMOPLASTIC POLYURETHANES (TPUs)
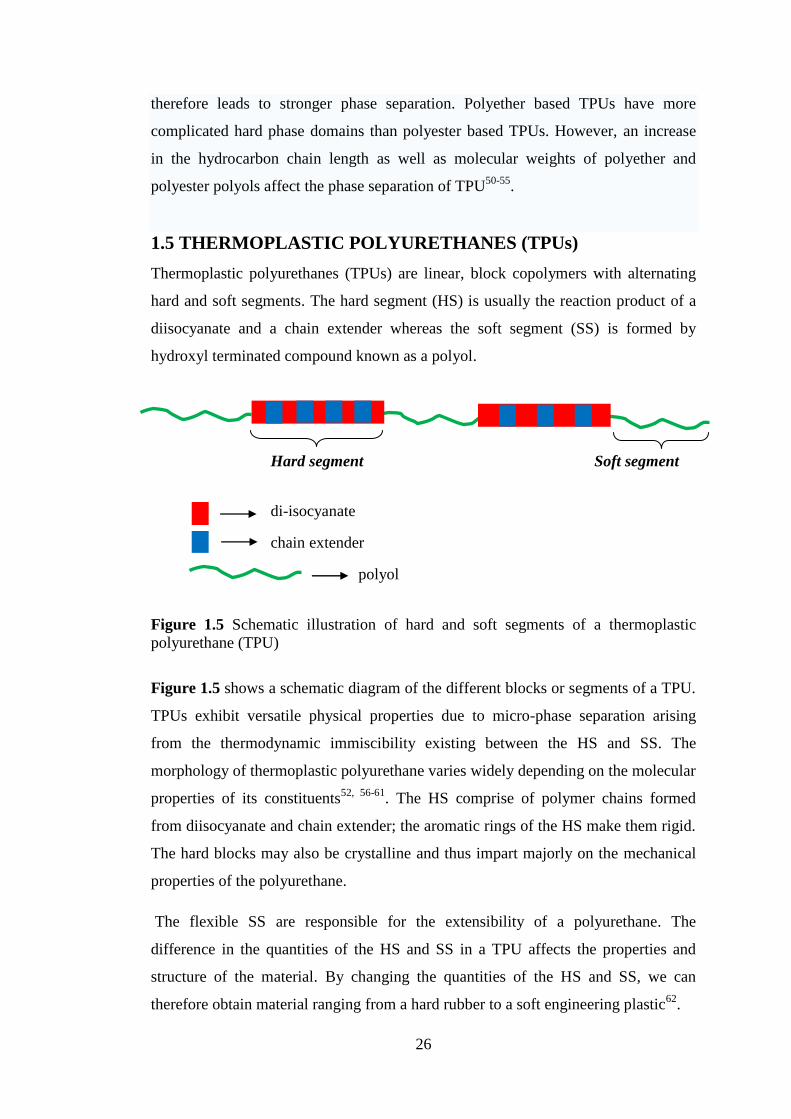
Thermoplastic polyurethanes (TPUs) are linear, block copolymers with alternating
hard and soft segments. The hard segment (HS) is usually the reaction product of a
diisocyanate and a chain extender whereas the soft segment (SS) is formed by
hydroxyl terminated compound known as a polyol.
Hard segment Soft segment
di-isocyanate
chain extender
polyol
Figure 1.5 Schematic illustration of hard and soft segments of a thermoplastic
polyurethane (TPU)
Figure 1.5 shows a schematic diagram of the different blocks or segments of a TPU.
TPUs exhibit versatile physical properties due to micro-phase separation arising
from the thermodynamic immiscibility existing between the HS and SS. The
morphology of thermoplastic polyurethane varies widely depending on the molecular
properties of its constituents52, 56-61
. The HS comprise of polymer chains formed
from diisocyanate and chain extender; the aromatic rings of the HS make them rigid.
The hard blocks may also be crystalline and thus impart majorly on the mechanical
properties of the polyurethane.
The flexible SS are responsible for the extensibility of a polyurethane. The
difference in the quantities of the HS and SS in a TPU affects the properties and
structure of the material. By changing the quantities of the HS and SS, we can
therefore obtain material ranging from a hard rubber to a soft engineering plastic62
.
27
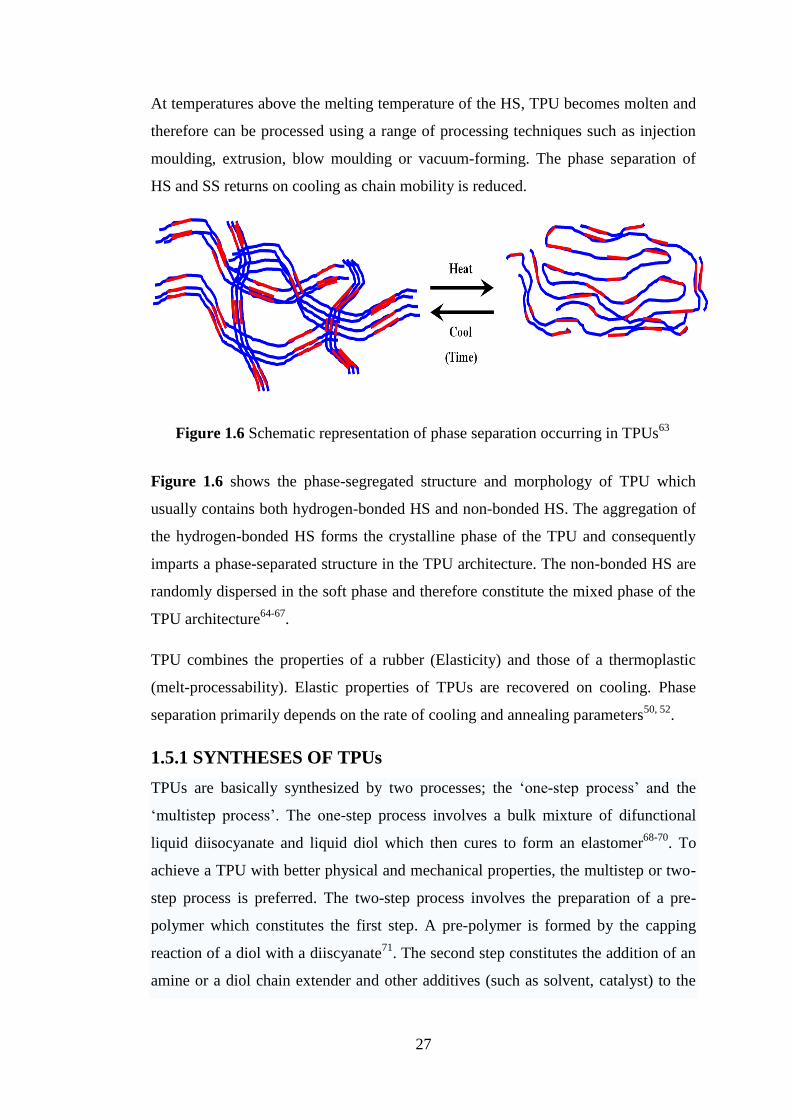
At temperatures above the melting temperature of the HS, TPU becomes molten and
therefore can be processed using a range of processing techniques such as injection
moulding, extrusion, blow moulding or vacuum-forming. The phase separation of
HS and SS returns on cooling as chain mobility is reduced.
Figure 1.6 Schematic representation of phase separation occurring in TPUs63
Figure 1.6 shows the phase-segregated structure and morphology of TPU which
usually contains both hydrogen-bonded HS and non-bonded HS. The aggregation of
the hydrogen-bonded HS forms the crystalline phase of the TPU and consequently
imparts a phase-separated structure in the TPU architecture. The non-bonded HS are
randomly dispersed in the soft phase and therefore constitute the mixed phase of the
TPU architecture64-67
.
TPU combines the properties of a rubber (Elasticity) and those of a thermoplastic
(melt-processability). Elastic properties of TPUs are recovered on cooling. Phase
separation primarily depends on the rate of cooling and annealing parameters50, 52
.
1.5.1 SYNTHESES OF TPUs
TPUs are basically synthesized by two processes; the ‘one-step process’ and the
‘multistep process’. The one-step process involves a bulk mixture of difunctional
liquid diisocyanate and liquid diol which then cures to form an elastomer68-70
. To
achieve a TPU with better physical and mechanical properties, the multistep or two-
step process is preferred. The two-step process involves the preparation of a pre-
polymer which constitutes the first step. A pre-polymer is formed by the capping
reaction of a diol with a diiscyanate71
. The second step constitutes the addition of an
amine or a diol chain extender and other additives (such as solvent, catalyst) to the

28
pre-polymer already formed in the first step50, 54
. The one step process is mainly
employed in industry whereas the two-step process is mainly employed in research.
Po Hung Chen et al. reported on the preparation of polyurethane materials using bulk
polymerisation which involves the combination of different chain extenders (1,4–
butanediol and 1,6-hexanediol). The mixture of chain extenders decreased the
crystallinity of the hard segment thus improving the transparency of the TPU and
subsequently its mechanical properties56
.
Huibo Zhang et al. investigated four different synthetic methods. The 1st method
involved putting the polyol into a reaction flask with a mechanical stirrer and a
thermometer. Vacuum was applied at temperature of 100-120°C for 2 hours.
Temperature was then reduced to 50°C. Diisocyanate was then added dropwise into
the polyol as temperature was increased to 80°C and kept for 1 hour. A chain
extender and a catalyst were subsequently added to the reaction mixture. The 2nd
method consisted of the addition of polyol, diisocyanate and catalyst into the glass
reaction flask having a mechanical stirrer and a thermometer. Vacuum was applied
and the reaction was kept at temperature of 100-120°C for 2 hours. Temperature was
then reduced to 50°C. Chain extender was added and stirred for 10 minutes. The 3rd
method was quite similar to the 1st method having the same reaction conditions but
in this case polyol was added to diisocyanate in a drop-wise manner before the
addition of a chain extender and a catalyst. The 4th
method was entirely different
from other methods. In this method, polyol, chain extender and catalyst were first put
into the reaction flask. Vacuum was applied and the reaction was kept at temperature
of 100-120°C for 2 hours. Temperature was then reduced to 50°C. Diisocyanate was
finally added and stirred. Reaction was kept for 10 minutes. All four methods had
their mixtures cast into a preheated aluminum mould coated with Teflon, which were
then post cured in an oven at 120°C for 4 hours. All four polyurethane elastomers
from different synthetic methods gave different properties but polyurethane
elastomer from the 1st method was reported to have the best properties. From the
above synthetic methods, it can be observed that the dropwise addition of the
diisocyanate to the polyol employed in the 1st method proved to be the best synthetic
route in achieving TPUs with good mechanical properties. This is because there is
better bonding between the diisocyanate and polyol units and therefore microphase

29
separation is improved61
. Table 1.2 shows the mechanical properties of the PU
elastomers prepared by the four routes.
Table 1.2: Mechanical properties of PU elastomers prepared by the four routes61
Route 1 2 3 4
Tensile strength (MPa) 3.0 1.7 2.9 1.3
Elongation at break (%) 568 514 579 487
Hardness shore A 76 79 75 74
Modulus of elasticity (MPa) 5.5 2.3 4.9 1.7
1.5.2 APPLICATIONS OF TPUs
The unique and versatile properties of TPUs make them important materials for a
wide range of applications. These properties arise from the micro-phase structure and
morphology of TPU. Properties such as toughness, high resilience, low compression
set, resistance to abrasion, weather, tears, hydrocarbons and good low temperature
flexibility make TPUs good materials. TPUs also exhibit biocompatibility and this
property makes them tremendously useful in the medical world such as in
cardiovascular applications and making of some artificial organs (artificial heart).
Depending on the range of hardness, TPUs are used make certain automotive parts
such as fuel line connectors and seals amongst others. Abrasion resistant rollers of
some engineering machines are made of hard TPU. Other applications of TPU
include the making of wrist watches, football boots and other sports shoes such as
ski boots. The low temperature flexibility and impact resistance of TPU are
fundamental properties in the manufacture of ski boots52, 54
.
Films of TPUs have outstanding properties: abrasion resistance, puncture and tear
resistance, high elasticity, bondability and weldability. These films are therefore
often used for conveyor belts, welded hollow bodies, textile lamination, protective
coverings, sealing of foams and abrasion resistant coatings. Different types of hoses
are manufactured from TPUs. Due to properties such as good recovery after
deformation, cut resistance, good weathering properties and resistance to oil and
fuel, TPU can be injection moulded to form exterior automotive parts. Other
automotive applications include bearing bushings and gaskets for wheel components.
Polyether based TPUs display excellent compatibility with human blood and tissues;
they are therefore used in making catheters and tubes for blood50, 55
.

30
1.6 FIBRE REINFORCED POLYMER COMPOSITES
Fibre reinforced polymer composites are materials which consist of fibres (natural or
synthetic) incorporated within a matrix. The composite material possesses good
properties owning to the blend of individual properties of its constituents (fibre and
matrix). The physical and chemical properties of the fibre and matrix however stay
unaltered while in this bonded state. In general terms, the fibres are accountable for
the load-bearing ability of the composite whereas the matrix is responsible for
positioning and holding firm the ordering of the fibres. The matrix also functions as
load transfer path between the fibres and safeguards them from hazardous
environmental conditions such as humidity. There has been increasing demand in the
use of fibre reinforced materials over the last few years especially in engineering
applications. This increasing demand of fibre reinforced materials has led to the
decrease in the use of traditional materials, particularly metals. Composite materials
have shown to exhibit certain preferred features over metals. They find relevance in
applications requiring high mechanical properties as well as lightweight properties.
Properties such as physical strength, stiffness, impact resistance and dimensional
stability are generally improved when glass fibres are mixed with plastics. The
specific gravity of glass fibre reinforced composites is seen to be about one-fifth that
of steel and this plays a vital role in applications where light weight is required. Fibre
reinforced composites also display low thermal expansion compared to metals. They
also can be easily moulded or formed into various complicated parts and damaged
parts are easily reparable72-75
.
1.6.1 FIBRE
Commonly used fibres employed in polymer composites are glass and carbon fibres.
Glass fibres are most commonly used and are versatile in diverse applications. Other
fibres, such as boron, silicon carbide and aluminum oxide are used in small amounts.
Fibres are aligned in the matrix in either a continuous or discontinuous (chopped)
lengths74-76
.
1.6.1.1 GLASS FIBRE
Glass fibres are made of silica (SiO2), often combined with oxides of calcium, boron,
sodium, iron and aluminum. The vitreous state of silica is in the form of glass
whereas the crystalline state of silica is in the form of quartz. To achieve

31
crystallization, silica must be heated above 1200° C for a very long period of time.
The melting point of glass fibres remains unclear but they undergo softening at
2000° C and often begin to degrade at that point. Upon rapid cooling, the aligned
structure of glass fibre is distorted. In the polymeric form, glass fibre attains a
tetrahedral configuration consisting of SiO4 where the oxygen atoms are attached to
a central Si atom. Glass fibres are mostly non-crystalline but crystallisation can be
induced after long-term heating at elevated temperatures and thereby leading to
reduced strength. Certain materials are often added to the glass fibres to improve and
enhance certain properties of the glass fibre. This process is known as sizing. Size is
usually added at 0.5 to 20 % by weight. Size may include lubricants, binders and/or
coupling agents. Lubricants are applied in order to protect glass fibres from any form
of abrasion and breakage. Coupling agents are applied to glass fibres to enhance their
affinity to react with certain polymer matrices. In the case of thermoplastic
polyurethane (TPU) based glass fibre composite, the glass fibres will be much better
if they are functionalized with N-H groups. This aids in the reaction of N-H groups
with the isocyanate groups (N=C=O) of the thermoplastic polyurethane matrix and
will lead to the strong fibre-matrix cohesion of the composite material. Binders
and/or coupling agents also improve resin wet-out and reinforce the strength of the
fibre-matrix interface.
The most commonly used glass fibres for composite applications are E-glass (E
stands for electrical, known for great strength, stiffness, electrical and weathering
properties), C-glass (C stands for corrosion, exhibits better corrosion resistance than
E-glass but has low strength) and S-glass (S stands for strength, are costlier than E-
glass and has greater strength). E-glass accounts for most quantities of the world’s
glass production. Being in an amorphous form, the properties of glass fibres are
isotropic, that is to say, their properties are the same along the fibre as well as across
the fibre. The mechanical properties of fine glass fibres are outstanding as their
tensile strength is reported to be 35000 kgf cm-2
and this high tensile strength is due
to the fact that cracks are not present on the surface of the fibre. Damage caused by
the mishandling of the fibres would lead to the decrease in strength of the fibres.
Glass fibres show no degradation when exposed to sunlight and are very resistant to
chemical attacks. They can withstand temperatures as high as 500°C and will not
singe. They display a perfect Hookean elasticity when stretched without having a
32
yield point. The strength, high modulus and elasticity of glass fibres make them
excellent reinforcement for composite engineering applications. Applications of
glass fibres vary widely as seen in boats, automotive, aerospace, electrical and
sport75-76
.
1.6.2 MATRIX
Matrix is a group of materials used in making composites and they are usually used
in the form of resins, sheets or films. Commonly used polymer matrices for
engineering applications are thermoplastics and thermosets.
1.6.2.1 THERMOPLASTICS
Thermoplastics possess the simplest molecular architecture with chemically
unrestricted macromolecules. They are not crosslinked structures and therefore can
be easily melted and moulded into different shapes and forms. The long chain-like
molecules of thermoplastic material are held together by weak Van der Waals forces.
When heat is applied on a thermoplastic material, it becomes soft and pliable and
subsequently at high temperatures, it becomes a viscous melt. Upon cooling, the
material solidifies again. Several heating and cooling treatments can be repeatedly
carried out on thermoplastics without any noticeable degradation, giving room for
reprocessing and recycling. Stiffness and strength of thermoplastics originate from
the individual properties of the monomers that make up the long polymer chain.
Morphology also plays a role in the mechanical properties of the thermoplastics.
High molecular weight also plays a vital role in the properties of thermoplastics. An
important aspect of thermoplastics is related to whether they are crystalline (ordered)
or amorphous (random/disordered) in structure. In practical terms, it is not possible
for the structure of a moulded thermoplastic to be fully crystalline due to the
complicated physical nature of molecular chains. Some thermoplastics such as
polyethylene and nylon which are capable of achieving high level of crystallinity are
more correctly referred to as partially crystalline or semi-crystalline. The presence of
crystallinity inherent in thermoplastics that are susceptible to crystallization is related
to their thermal history as well as the processing parameters employed in making the
thermoplastics. Thermoplastics such as polystyrene and acrylics are always non-
crystalline. Generally, thermoplastics usually have higher density when they are in
their crystalline forms which are related to the close packing of the molecules.

33
Examples are polyethylene, polypropylene, polyvinyl chloride, polystyrene amongst
many others72, 74, 77-80
.
1.6.2.2 THERMOSETS
Thermosets possess a three-dimensional molecular network as a result of chemical
crosslinking of the polymeric chains and therefore leads to stiffening of the material.
They often require the combination of a resin and a binder. Thermosets are cured in
order to undergo complete polymerization. Curing in most cases takes place at room
temperature but can also be carried out at programmed heating processes in order to
achieve better characteristics. During curing, the long molecular chains of the
thermosetting material are interlinked by strong bonds so that the resultant material
sets and is no longer softened by the application of heat. If excess heat is applied to
the thermosetting material, they will only char and degrade rather than melt.
Mechanical properties of thermosets rely on the monomers involved in the build-up
of the polymer chain as well as the length and degree of crosslinking these
monomers undergo. Unlike thermoplastics, the final products are not reprocessable
and recyclable. Thermosets are rigid due to their high degree of crosslinking and
therefore exhibit brittleness on impact. Epoxy, unsaturated polyester and vinyl ester
are the three most commonly used thermosetting resins in composite applications72,
74, 77-78.
1.6.3 RULE OF MIXTURES IN DETERMINING THE
PROPERTIES OF FIBRE REINFORCED COMPOSITES
The rule of mixtures states that the modulus of a unidirectional fibre composite is
proportional to the volume fractions of the materials in the composite. This rule
explains that the modulus of the composite is simply the sum of the weighted
average between the moduli of the two composite constituents, depending only on
the volume fraction of fibres. The rule of mixtures can be used to determine the
density of a composite as well as other properties such as Poisson’s Ratio, strength,
thermal conductivity and electrical conductivity along the fibre axis74, 80-81
. The
properties of a composite material are derived from the individual properties of the
composite constituents (fibre and matrix). Thus if a stress is applied along the path of
the fibre alignment in a unidirectional composite, it is expected both constituents
should exhibit the same strain along the fibre axis, assuming that there is no

34
interfacial misalignment. The Young’s modulus of the composite can therefore be
written as74, 80
:
(Equation 1.1)
where Ec = Young’s modulus of composite
Ef = Young’s modulus of fibre
Em = Young’s modulus of matrix
Vf = Volume fraction of fibre
Vm = Volume fraction of matrix
The above equation is known as the isostrain rule of mixtures. For a composite
material in which the fibres are stiffer than the matrix, the fibre therefore is subjected
to higher stresses than the matrix and there is a re-allocation of the load.
In order to use the rule of mixtures to determine the properties of fibre reinforced
composites, the efficiency factor or Krenchel factor must be employed. The
Krenchel factor is used to predict the influence of fibre orientation on stiffness. This
is a term used to factor the rule of mixtures formula according to the fibre angle. The
Krenchel factor predicts that an estimate of an elastic response of a general multi-ply
laminate can be calculated by a summation analysis and of the contributions from
each bundle of fibres lying at a specific angle, θ, to the applied stress82
. An overall
composite efficiency factor or Krenchel factor, ηθ, can be defined as:
(Equation 1.2)
The approximate composite modulus can then be calculated using a modified rule of
mixtures as:
(Equation 1.3)
Values of the efficiency factor or Krenchel factor, ηθ, for a range of fibre
distributions can be seen in Figure 1.7 and Table 1.3.

35
Figure 1.7 Values of efficiency factor or Krenchel factor for different fibre
orientations82
Table 1.3: Krenchel factors for various fibre groupings
Composite type/Fibre orientation Krenchel factor, ηθ
Unidirectional composite loaded parallel to fibres 1.0
Biaxial composite loaded parallel to fibres 0.5
Random in-plane fibre orientation 0.375
Biaxial composite loaded ±45°to fibres 0.25
Random 3D fibre orientation 0.2
Unidirectional composite loaded perpendicular to fibres 0

36
1.6.4 APPLICATIONS OF FIBRE REINFORCED COMPOSITES
The benefits of using thermoplastic polyurethane (TPU) based fibre reinforced
composites in the manufacture of sporting materials are their light weight, vibration
reduction and flexibility properties. These properties play key role in the
manufacture of tennis rackets, helmets, surfboards, ski poles, hockey sticks amongst
others. Due to the different ranges of hardness of thermoplastic polyurethane
materials, certain thermoplastic polyurethane based composites are used in making
sport shoes, bags, gloves, jackets, mobile phone cases amongst others52
.
Epoxy based carbon fibre reinforced composites or those mixed with Kevlar fibres
are commonly used in making the wing and fuselage parts of aircrafts. These
composite materials can last for long stretch of years without any mechanical failures
as a result of their low coefficient of thermal expansion and high fatigue resistance
under cyclic loading at stresses. The structural integrity and durability created by
these composite materials have increased interests of their applications in making
other aerospace parts. Due to their low specific gravities, giving high strength-weight
ratios and modulus-weight ratios, epoxy based composite materials are used in
making the rotor blades for various helicopters. The flexibility of these blades makes
for easy swinging and twisting in the air and also adaptable to air resistance.
Fibre reinforced composites also play important role in automotive applications.
Epoxy resin based carbon fibre reinforced composites are used to make the body
parts of formula one (F1) cars. The fuel and driver lies in the survivor cell which is
made of advanced composites. The steering and brakes of the formula-one cars are
made of carbon composites due to their thermal and frictional properties. The helmet
worn by the driver is made of high performance carbon composites75
.
1.7 STRUCTURE-PROPERTY RELATIONSHIPS OF TPUs
The micro-phase separation arising from the thermodynamic immiscibility existing
between the HS and SS imparts the versatile physical properties of TPUs. However,
certain parameters contribute to the morphological, structural, thermodynamic,
thermo-mechanical and mechanical properties of TPUs. These parameters range
from the nature/composition of the TPU constituents to the processing/post-
treatment processing.
37
1.7.1 EFFECT OF CHAIN EXTENDERS
The use of chain extenders in the chain extension of TPUs proved to be prominent in
the manufacture of TPUs50
. The chemical structures and characteristics of chain
extenders (chain length, degree of branching etc) have been extensively reported to
influence the extent of interaction between the HS and SS30, 83-91
.
Wang and Kenney92
reported that 1,4-butanediol based TPU showed better thermal
properties than those of 1,5-pentanediol and 1,3-butanediol. The reason was that the
1,4-butanediol based TPU had strong crystal structures whereas 1,5-pentanediol and
1,3-butanediol TPUs had weak crystal structures due to their random intermolecular
arrangement. Phase segregation was lowest for 1,3-butanediol based TPU due to its
amorphous nature. Their FTIR results also showed that the hydrogen-bonded C=O
region of the 1,3-butanediol TPU was lower than the free C=O region. The reason
for the observation was due to the fact that only a small part of the hard segments
have been hydrogen-bonded.
In another publication, Sanchez-Adsuar and Martin-Martinez30
reported that ethylene
glycol based TPU showed better thermal properties than those of 1,4-butanediol and
1,6-hexanediol. The reason for their observation was that the short chain extenders
are easier to join with the pre-polymer during polymerization than the longer chain
extenders. This therefore results in high molecular weights of the TPU and
consequently leading to higher crystallinity and phase segregation.
Studies have shown that the glass transition temperatures (Tg) of the TPUs decreased
with increasing chain extender length. The decrease in Tg of the TPUs was attributed
to the polarity and the flexibility of the chain extenders. The polarity of the chain
extender decreases with increase in the number of methylene units in the chain
extender and therefore decreases in polarity results in low TgHS. Furthermore, as the
length of the chain extender increases, the flexibility of the TPU material increases
and consequently lowering its Tg93
. Camberlin et al94
reported that the Tm of the 1,2-
ethanediol, 1,3-propanediol and 1,4-butanediol HS (from 200°C to 208°C) were
higher than the other TPUs. Figure 1.8 shows that 1,4-butanediol TPU has the
highest melting temperature indicating its high crystallinity and stronger bonding.
However, the increase of the length of the chain extender decreases the Tm of the
TPU as well as the degree of cohesion. This was reported to be due to the structural

38
arrangement of the odd-numbered and even-numbered diols in the HS architecture.
Figure 1.9 shows that the even-numbered methylene units display hydrogen-bonded
carbonyl groups in a trans- arrangement whereas the odd-numbered methylene units
displayed hydrogen-bonded carbonyl groups in a cis- arrangement. The difference in
geometric arrangements could be traceable to the variations in the Tm.
2 4 6 8 10
160
170
180
190
200
210
Mel
ting
tem
pera
ture
(C
)
Number of methylene units, n
Figure 1.8 Hard-segment melting temperature versus number of methylene units of
alkane diol94
(a) trans (b) cis
Figure 1.9 Geometric isomerism of (a) even-numbered diol TPU and (b) odd-
numbered diol TPU94
In another publication, Fernandez et al95
investigated on the crystallization of linear
aliphatic TPUs with linear chain extenders with methylene units ranging from 5 (1,5-
pentanediol) to 12 (1,12-dodecanediol). It was reported that the Tm decreased with
increase in the methylene units for both odd- and even-numbered diols as a result of
the decrease in the hydrogen bonding interactions. It was also observed that the
melting and crystallization enthalpies for the odd- and even-numbered diols increase

39
with increase in the methylene units as shown in Figure 1.10. The flexibility
imparted by the increased methylene units promotes crystallization process.
4 5 6 7 8 9 10 11 12 13
110
120
130
140
150
160
170
Me
ltin
g te
mp
era
ture
(C
)
Number of methylene units, n
4 5 6 7 8 9 10 11 12 13
60
70
80
90
100
110
120
130
Mel
ting
enth
alpy
(J/
g)
Number of methylene units, n
Figure 1.10 (a) Melting temperature and (b) melting/crystallization enthalpy versus
number of methylene units95
The characteristic zig-zag plot shown above depicts an odd-even effect, as the even-
numbered diol-TPUs have higher melting transitions than their immediate odd-
numbered diol-TPUs. This occurs as a result of the arrangement of the polymeric
chains. The odd-numbered diol-TPUs were reported to have hydrogen bonds
arranged in either parallel or anti-parallel configuration whereas the even-numbered
diol-TPUs only take up anti-parallel configuration as shown in Figure 1.11. The
(a)
(b)
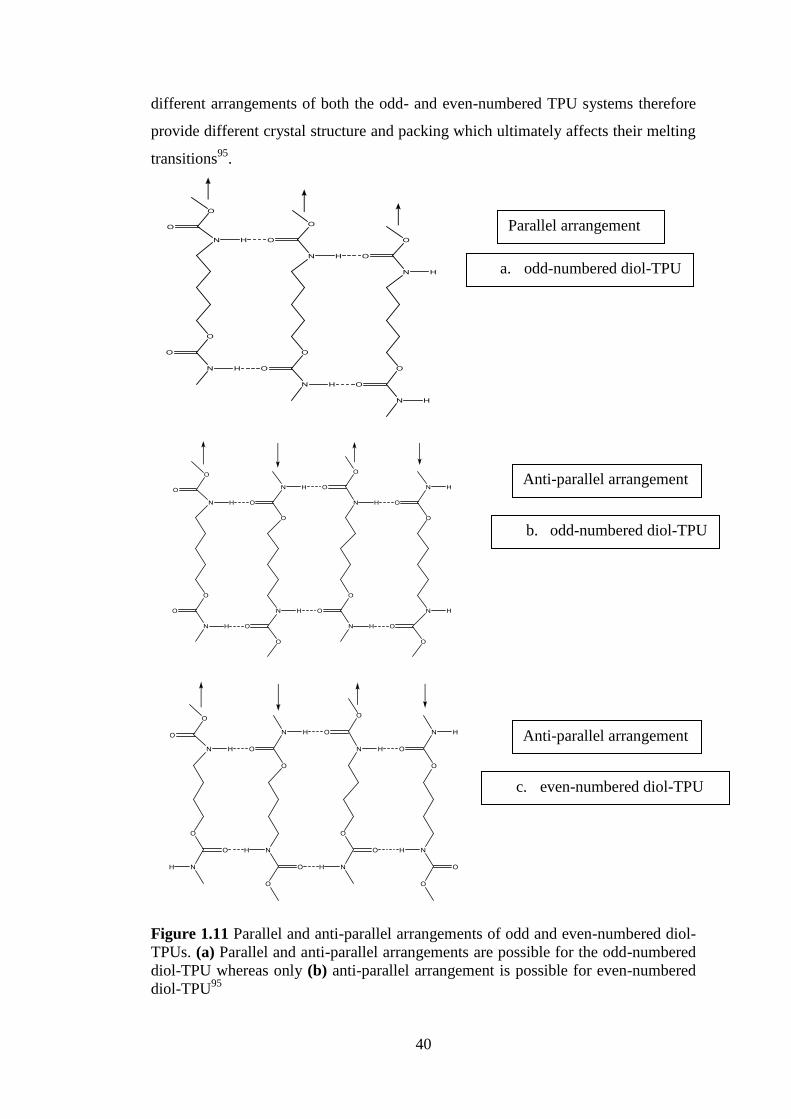
40
different arrangements of both the odd- and even-numbered TPU systems therefore
provide different crystal structure and packing which ultimately affects their melting
transitions95
.
Figure 1.11 Parallel and anti-parallel arrangements of odd and even-numbered diol-
TPUs. (a) Parallel and anti-parallel arrangements are possible for the odd-numbered
diol-TPU whereas only (b) anti-parallel arrangement is possible for even-numbered
diol-TPU95
a. odd-numbered diol-TPU
Parallel arrangement
b. odd-numbered diol-TPU
Anti-parallel arrangement
c. even-numbered diol-TPU
Anti-parallel arrangement
41
It can be observed that there is a difference in Tm in relation to the number of
methylene units, n as seen in Figure 1.8 and Figure 1.10 (a). The difference occurs
mainly due to the different synthetic routes employed by the two groups. Fernandez
et al used di-tert-butyl tricarbonate which is highly selective and reactive whereas
Camberlain et al used tetrahydrofuran solvent. It can therefore be deduced that the
use of di-tert-butyl tricarbonate yielded better phase-separated and uniform-
microstructured TPUs. The odd-even effect of n-aliphatic polyurethanes was clearly
shown in the results obtained by Fernandez et al, which corresponded to the odd-
even effect of TPUs reported by other authors96-102
. However, the -cis and -trans
configurations (Figure 1.9) observed by Camberlain et al corresponded to the anti-
parallel and parallel arrangements (Figure 1.11) observed for Fernandez et al.
1.7.2 EFFECT OF HARD SEGMENT CONCENTRATION
The multiple thermodynamic transitions in TPUs arise mainly from both the
chemical properties and the physical treatments carried out on the TPUs. Hard
segment concentration of TPUs also has a significant influence in the
thermodynamic, structural, mechanical and thermo-mechanical properties of
TPUs103-106
.
Frontini et al107
in their study discovered the existence of multiple Tgs for a 100%
hard segment (consisting of only MDI and 1,4-butanediol) PU cured at 110°C. An
exothermic transition and multiple endothermic transitions were present on the DSC
thermograph. Two Tgs for the 100% hard segment TPU occurred at 50°C (Ti,
intermediate transition) and 100°C (Th, hard segment glass transition). They showed
that for a 90% hard segment TPU (MDI, 1-4 butanediol and 10% polyol), there were
three transitions found and were assigned as Ts (soft segment glass transition), Ti and
Th. Ts and Th are usually associated with TPUs and they primarily constitute the
make-up of TPUs. The third Ti (intermediate transition) was reported by this group
to have originated from the rate of cooling administered to the TPUs from the melt
state. Due to the proximity of Ti and Th, it was reported that Ti was affiliated with the
HS107
.
Saiani et al58
in their thermodynamic investigation of freshly melt-quenched TPUs
using 2-methyl-1,3-propanediol as chain extender, reported that a broad Tg was
observed for a TPU with a hard segment content of 50%, indicating the presence of a

42
mixed phase system. For melt-quenched TPU samples with hard segment
concentration of 75% and above, Tg typical of HS (TgHS) was observed. The TgHS
values indicated the presence of an almost ‘pure’ hard segment. It was observed that
the TgHS values were seen to slightly increase with increasing hard segment
concentration, due primarily to the presence of SS residing within the HS.
Furthermore, the slight increase in TgHS may be due to the length of the hard segment
decreasing with increasing SS concentration. It was also observed that the heat
capacity change (ΔCpHS) resulting from TgHS decreases with decrease in hard
segment content. DSC showed that TPU with a hard segment concentration of 65%
did not exhibit TgHS despite the amount of hard segment present in the TPU system.
The reason for the observation was that a considerable amount of the hard segments
were dissolved with the soft segments in a mixed phase. It suggests that the 65% HS
TPU is in a homogeneous state. However, for TPUs with HS content higher than
65%, it was therefore suggested that the TPU system is no longer in a
homogeneous/mixed state but heterogeneous where 65% equivalent of the HS would
be involved in the mixed phase while the rest of the HS will account for the ‘pure’
TgHS. The high temperature transitions observed for the TPUs were attributed to the
mixing of the HS and SS and therefore referred to as ‘microphase mixing
temperature’ (TMMT). After annealing of the melt-quenched TPU samples two
endothermic transitions were observed. The first endotherm was reported to have
arisen from the melting of the ordered HS induced during the annealing process (TM)
whereas the second melting peak was due to the mixed phase of HS and SS
(TMMT)58
.
In another publication60
, SAXS results showed that phase separation of the hard and
soft phases decreased with increasing hard segment concentration. It was also
observed that the scattering maximum (q*) was the same for all the TPUs. The
reason for the observation was that the size of the electron density fluctuations that
influence the scattering maximum is the same for all the TPU samples. It was
therefore suggested that the microphase-separated morphology was the same for the
TPU samples having 2-methy-1,3-propanediol as chain extender60
. Figure 1.12
shows morphological models created for TPU samples with high hard block
concentration (> 65%) which suggests the morphologies of melt-quenched and
microphase-separated phase occurring in TPUs.

43
Figure 1.12 Model showing the morphologies of TPUs in melt-quenched and
microphase-separated states60
The effect of hard segment concentration on the phase transitions occurring in TPUs
was investigated by Koberstein et al108
. TgSS was observed for compression-moulded
TPU with low hard segment concentration (20%). The TgSS was seen to increase with
increase in hard segment concentration whereas change in specific heat capacity
(ΔCp) decreased with increase in hard segment concentration as shown in Figure
1.13.
20 30 40 50 60 70
0.02
0.04
0.06
0.08
0.10
0.12
0.14
0.16
0.18
Cp o
f sof
t seg
men
ts J
/(g.C
)
Hard segment concentration (%)
Figure 1.13 Change in heat capacity of the soft segment glass transition as a
function of hard segment concentration108
The reduction of ΔCp for SS (ΔCpSS) in higher HS content TPUs denotes that some
soft phase has been dissolved into the HS and interphase regions and thus was not
involved in the ‘pure TgSS’. The existence of multiple endothermic transitions was

44
traceable to the melting and melt re-crystallization processes occurring in MDI/1,4-
butanediol crystallites. It was also observed that a transition occurred in the range of
50- 90°C for TPU samples with HS concentration from 30% and above. This
transition was assigned to the hard segment glass transition temperature (TgHS)108
.
Koberstein and Stein proposed a model for microdomain structure based on a
concept of critical length of the hard segment units. They reported that hard segment
chains shorter than the critical length would be dissolved in the SS whereas HS
chains longer than the critical length would result in the formation of phase-
separated hard microdomains with a lamellar structure109-110
. This model also
proposed that the thickness of the hard segment is controlled by the critical hard
segment length. This therefore means that below the critical length, a mixed phase
structure with non-crystalline morphology is obtained.
Several authors have reported that the TgHS increased with increase in NCO content.
The increase in NCO content consequently decreases OH content and this therefore
decreases the soft TgSS. The intensities of the melting peaks (enthalpies) and Tm of
the TPUs were observed to increase with increase in hard segment aggregation111-113
.
WAXS results showed that amorphous halos were predominant for the TPUs with
hard segment content up to 50% with no trace of crystalline peaks whereas
crystalline peaks were observed on the amorphous halos of TPUs with hard segment
concentration of more than 50%. Tensile results showed that mechanical properties
such as Young’s Modulus and tensile strength increased with increase in hard
segment concentration (especially TPUs with hard segment content with more than
50%). The aforementioned mechanical properties are influenced by the degree of
hard segment concentration inherent in the TPU system. However, elongation and
yield strength decreased with increased hard segment content113
From the literatures reviewed, it is important to note that TgHS increases with increase
in hard segment concentration. It was also noted that TPUs with hard segment
concentration from 65% and below exhibited a mixed phase glass transition (TgMP).
This is primarily due to the mixture of HS and SS and is usually indicated by a broad
transition. Tensile properties such as Young’s modulus and tensile strength of TPUs
were increased relatively to the increase in their hard segment contents.
45
1.7.3 EFFECT OF ANNEALING ON THE THERMODYNAMIC,
STRUCTURAL, THERMO-MECHANICAL AND MECHANICAL
PROPERTIES OF TPUs
Goyert and Hespe114
reported that a distribution of crystallite size originated from the
cooling of molten TPU which was not only influenced by the length distribution of
the hard segmental chains but also by the kinetics of crystallization. DSC results
showed that moulded TPU (based on MDI, 1,4-butanediol and ethanediol-
butanediol-polyadipate) displayed multiple melting transitions of which the highest
melting peak was at 205°C. By annealing the TPU samples at different temperatures
(118, 135, 180 and 205°C) for 5 minutes, melting temperature increased to about
230°C. It was also observed that the melting range for the TPU sample annealed at
different temperatures contracted at the same time. The reason for the observation
was attributed to the incomplete melting of the HS as well as to recrystallization of
larger hard segment crystallites with better packing order. To better understand the
process of crystallization on annealing, the following illustration was made: When a
TPU is quickly cooled from melt; the hard segments form crystals that are
disarranged from one another. The crystal thickness of the HS is therefore relatively
low due to its less thermodynamically favorable arrangement. Upon annealing, the
crystal structures become ordered and therefore leading to a more
thermodynamically favourable organization. This organization subsequently leads to
the improvement of the melting transitions primarily due to the increase in crystal
thickness114
.
Several authors have reported that the crystallites formed as a result of annealing
were due to the presence of short-range and long-range dissociation of the HS in
their investigative studies on the morphological changes in TPUs via DSC
analysis115-116
.
Frontini et al. observed that the melting enthalpies and TgHS are dependent on
annealing temperature. It was reported that crystallization reaches a minimum with
respect to annealing temperature and then becomes negligible and this was due to the
fact that a non-crystalline materials can result for higher annealing temperatures. It
was reported the TgHS values increased with increase in annealing temperature but
subsequently reaches a constant value irrespective of the annealing temperature

46
employed. The above observation indicated that the degree of polymerization has
reached its maximum and therefore at this point, non-crystalline materials are
formed. Amorphous TPUs were formed by heating the TPU samples at a
temperature above the melting temperature (290°C) and then rapidly cooling. DSC
thermographs showed that the melt-quenched TPU samples had only TgSS and TgHS.
The reason for heating the TPU samples to such high temperature was to destroy
every form of crystallinity and thereby erasing the thermal histories inherent in the
TPU samples. It was observed that by employing different annealing treatments,
crystallinity was induced in the amorphous (melt-quenched) TPUs. WAXS results
also showed that the diffraction peaks increased with increase in annealing
temperatures and the change in crystalline peaks was traceable to some degree of
ordering of the hard segment chains. The crystalline peaks also suggested the
presence of more than one crystalline form (existence of polymorphs) in the
TPUs107
.
In another publication, this group investigated the effect of annealing on TPU and
Isoplast. The TPU sample which comprised 80% hard segment concentration (MDI
and the mixture of 4:1 molar ratio mixture of 1,4-butanediol and 1-phenyl-1,2-
ethanediol) and the polyol was a 1:1 ratio of polypropylene oxide diol and
polypropylene oxide endcapped with ethylene oxide. DSC results showed that the
TPU sample displayed Tgs namely: soft segment glass transition temperature (Ts) = -
50°C, intermediate transition (Ti) = 50°C and hard segment glass transition
temperature (Th) = 100°C. It was observed that the TPU sample was amorphous as
there was no melting transition. After annealing, the non-crystalline TPU sample
showed melting transitions indicating the presence of crystallites induced by
annealing. Melting endotherms and melting enthalpies were also seen to increase
with increasing annealing temperatures. However, Tgs observed for the untreated
TPU samples remained unchanged after the annealing process. Like the TPU sample,
Ti and Th were the same for the Isoplast (a commercial TPU) sample except that the
SS glass transition temperature (Ts) was at -20°C. Annealed Isoplast showed larger
melting endotherms and increased melting temperatures with consequent increase in
annealing temperature117
.
Saiani et al59
investigated the effect of annealing temperature on the thermodynamic
properties of TPUs. For isochronal annealing, the TPU samples were annealed
47
within the same duration of time (96 hours) at different annealing temperatures (60,
90, 120 and 160°C). It was observed that when TPU samples are annealed above the
TgHS, phase separation ensues. After annealing at 120 and 160°C, a Tg at -65°C was
observed for TPU with hard segment content of 65% and 75%. This low glass
transition was attributed to the soft phase glass transition temperature (TgSP). The
value of TgSP (-65°C) was observed to be higher than that of the pure SS glass
transition temperature (-73°C) and the reason for the observation was due to the
anchoring of the HS on the SS. As hard segment concentration increases, TgSP was
not observed for TPU with HS content of 85% and 95%, this was due to the
increased mobility restriction of the HS and therefore the small amounts of soft
segments anchoring on the HS were not able to contribute to TgSP. After annealing at
120°C, two endothermic transitions were observed for HS concentrations of 65%,
75% and 85% except 95%. The first endothermic transition was assigned to the
melting of the ordered HS initiated during annealing, (TM) whereas the second
endothermic transition was assigned to the microphase mixing of both the HS and
SS, which is otherwise called microphase mixing temperature (TMMT). It was also
observed that there were no endothermic transitions observed for 95% HS
concentration after annealing at 120°C. At 95% HS content, TMMT is not expected to
be observed however, since hard segments were ordered during the annealing
process but it was expected to observe TM. It was therefore suggested that after 96
hours of annealing, the hard phase of 95% HS content was still amorphous. After
annealing at 160°C, a clear, sharp melting transition was observed for TPU with
95% HS content. It was suggested that higher ordering of the HS occurred at higher
annealing temperature. This was confirmed by the presence of weak diffraction
peaks on the WAXS diffractogram. It was also observed that clear, sharp melting
peaks were observed by 65%, 75% and 85% HS contents. The reason for the
observation was due to the merging of TM and TMMT (i.e. TM + TMMT) at higher
annealing temperatures. The melting temperatures of these three samples (65%,
75% and 85%) were seen to be higher than that of 95% HS content and this therefore
confirms that only TM was observed for 95% HS content. After annealing at 60°C
and 90°C (annealing temperatures below TgHS), all the TPU samples except 95% HS
content had melting transitions at 180°C which corresponded to TMMT. TgSP at -65°C
were observed for TPUs with 65% and 75% HS content when annealed at 90°C.
48
This also confirmed that phase separation occurred even at low annealing
temperatures. However, no TgSP was observed for the TPU samples when annealed at
60°C. SAXS results showed the presence of scattering peaks for TPU with 65% HS
concentration annealed at 60, 90, 120 and 160°C for 72 hours. This therefore
suggests the presence of a phase-separated morphology for all the samples. As
annealing temperatures increased, it was also observed that there was no significant
decrease in the scattering peaks and therefore this suggested that the maximum level
of phase separation has been attained at higher annealing temperatures. Furthermore,
phase separation was seen to decrease with increasing annealing temperatures and
also scattering maximum (q*) shifted to smaller q values with increase in annealing
temperatures59
.
Annealing has shown to be a vital post-treatment process employed to effect better
thermodynamic, structural, thermo-mechanical and mechanical properties of TPUs.
This post-treatment process has led to extensive investigations elucidating its effect
on TPUs as reported in numerous publications33, 39-40, 46, 116, 118-127
.
From the literature review, it was imperative to note that although annealing
improves the properties of TPUs; however, increase in annealing temperature and
time also is very crucial in optimizing the properties of the TPUs. Crystallinity and
TgHS of the TPUs are improved due to annealing effect. For a 100% HS TPU, only
TM (melting of the HS) is observed whereas TM and TMMT (mixing of the HS and SS)
are observed for TPUs with lower HS concentrations (especially HS% of 70 to 90).
1.7.4 THERMODYNAMIC, STRUCTURAL, THERMO-
MECHANICAL AND MECHANICAL PROPERTIES OF TPU
COMPOSITES
Several studies have shown that the thermo-mechanical and mechanical properties of
TPU were improved when reinforcements were added. Impact studies of TPU
composites revealed that the glass fibre reinforcement contributed to the fracture
resistance of the TPU below its glass transition temperature. Fracture of the
composites often takes place between the interface of the fibre and matrix128-130
.
Jancar128
concluded that the presence of the short glass fibres helped in the increase
of the yield strength on the fibre-matrix interface of the composite. Therefore
deformation was drastically reduced in the fibre-matrix interface instead fracture
49
took place between the interface and the bulk TPU. Mateen et al129
found out that the
increase in the volume fraction of the glass fibre in a composite material led to a
steady increase in the impact resistance of the composite.
The stress-strain curve of the TPU composites showed that the stiffness of the TPU
was improved as glass fibres were incorporated into the TPU matrix. However, the
elongation properties of the TPU composites upon failure reduced drastically on
addition of glass fibres to the TPU matrix. The Young’s moduli of the TPU
composites were seen to increase with increasing glass fibre content (volume
fraction of glass fibres). The fracture toughness of the TPU composites were also
observed to increase linearly with increase in volume fraction of glass fibre131
.
Incorporation of fillers (calcium carbonate and mica) into pultruded glass fibre
reinforced TPU composites was seen to increase the mechanical (flexural strength
and flexural modulus) and thermal (heat distortion temperature; HDT) properties of
the composites as the mica and calcium carbonate content increased. Post curing in
the range of 100-150°C also facilitated better mechanical and thermal properties of
the composite materials132-133
.
Correa et al studied the properties of short fibre reinforced TPU elastomer
composites containing carbon and aramid fibres. It was reported that the addition of
the short fibres into the TPU elastomer gave significant improvements in hardness,
abrasion resistance and compression set. The aramid reinforced composites showed
better abrasion resistance when compared to carbon fibre. This was due to the fact
that the carbon fibres used were fragile and were easily broken. This caused the
reduction in the properties of the carbon fibre reinforced composite. According to the
tear resistance tests conducted for all the composite samples, the values of the
composites were higher compared to that of the pure TPU matrix. The aramid
reinforced composite had the highest tear resistance134
. In another publication, it was
reported the aramid fibre-based composites were seen to degrade above 400°C
which is higher than both carbon fibre-based composites and pure thermoplastic
polyurethane. The aramid fibre-based composites showed better properties than the
carbon fibre-based composites because of their better fibre-matrix interaction
(aramid-TPU interfacial bonding)135
.

50
Tensile and storage moduli of TPU composites made with short aramid fibre were
reported to increase with subsequent increase in fibre content embedded in the
composite materials. It was reported that the effect of increasing fibre content on the
modulus of the composite was pronounced at temperatures above the glass transition
temperature (Tg) of the thermoplastic polyurethane (-36.6˚ C). Damping properties of
the composites were also much improved with higher fibre quantity. Viscosity was
heightened and shear rate was reduced as the amount of fibre is enhanced. This
observation was as a result of the TPU elastomer-aramid fibre interaction136
.
Mothe et al. also investigated the thermal and mechanical properties of TPU
composites using a plant fibre known as ‘Curaua fibre’. In their study, it was
reported that increase in the weight of the curaua fibres into the TPU matrix led the
improvement in the storage modulus at a temperature range below the softening
region of the HS. This observation was reported to be influenced primarily by the
specific interaction of the curaua fibre with the HS domain of the TPU137
.
Kutty and Nando138
investigated on the mechanical and thermo-mechanical
properties of short Kevlar-Thermoplastic polyurethane composites. In their study, it
was observed that the tensile strength exhibited by the TPU composites was
attributed to the increase in fibre reinforcement of the TPU matrix. At low fibre
concentrations, the TPU matrix was observed not to have bonded properly onto the
fibres due to the fact that the matrix is not been restrained by enough fibres. This
lack of restraint resulted in poor interfacial bonding between the fibres and matrix.
As a result of the observation, there is a complete separation of the matrix away from
the debonded fibres at low strain as there is localized strain concentration within the
TPU matrix. At high fibre concentration, there is more restraint in the mobility of the
matrix and the stress is more uniform throughout the composite system. The
softening of the TPU matrix is lessened due to the improved reinforcement from the
fibres. DMTA results showed that the storage moduli of TPU composites increased
with increasing fibre content and the effect of the fibre reinforcement was more
noticeable especially after the glass transition temperature (Tg) of the TPU. The glass
transition temperature (Tg) of the TPU remained the same irrespective of the level of
the fibre concentration. Tan delta (tan δ) curves showed that the Tg values of the
TPU composites remained the same but the transition peaks broadened with increase
in fibre content. The broadening of the tan delta (tan δ) peaks due to fibres was

51
attributed to an interaction existing at the fibre-matrix interface. It was also reported
that a polymer entrapped in fibres exist in a different state compared to a polymer
without any reinforcement. The tan δmax peak was seen to decrease with increasing
fibre concentration and this can be attributed to the improvement in the damping
properties of the TPU composite. The observation is a characteristic feature of
Kevlar-TPU composites138
.
In other publications, Kutty and Nando reported that the Young’s modulus and
tensile strength of a pure, non-reinforced TPU decreased with increase in
temperature whereas the elongation at break was seen to increase. The decrease in
the mechanical properties of the TPU with increased temperature was attributed to
the softening of the TPU. At 20 phr (parts per hundred parts of rubber) of fibre
loading, the stiffness of the TPU increased with increasing temperatures. It was also
observed that the orientation of the fibres has an effect on the properties of the
composites. In this study, fibres were layered in longitudinal and transverse
directions as shown in Figure 1.14.
Figure 1.14 Orientations of the fibres in the TPU matrix
The difference in the orientation of the fibres led to the decrease of the appearance of
flaws in the TPU composite. In the transverse direction, the fibres were parallel to
the direction of fracture proliferation and therefore there is ease of fracture. This
form of fracture was seen to be synonymous with the fracture of the pure, non-
reinforced TPU matrix. In the longitudinal direction, the fibres were more resistant to
fracture proliferation139-142
.

52
Several authors have reported on the influence of the reinforcement on the
mechanical and thermo-mechanical properties of TPU. However, the mechanical and
thermo-mechanical properties of TPU composites were observed to be related to
fibre-matrix interaction. The fibre-matrix interfacial properties play a significant role
in the improvement of the overall properties of TPU composites1, 143-155
.

53
CHAPTER 2
MATERIALS AND METHODS
2.1 MATERIALS
2.1.1 CHEMICALS USED
The names, structures, acronyms and molar masses of the chemicals used in this
work are shown in Table 2.1. The suppliers of the chemicals are also listed.
Table 2.1: Names, structures, acronyms and molar masses of the chemicals used for
the synthesis of TPUs
Name Acronym Structure Molar
mass
(gmol-1
)
Supplier
4,4'-
diphenylmethane
diisocyanate
4,4-MDI
CH
2NCOOCN
250 Sigma
Aldrich
Voranol EP 2010 EO-PPO-
EO
C
H
H
C
H
H
* O C
H
H
C
H
C HH
H
O C C O
H H
H H
*o
n
m
n
2004 Dow
Chemicals
Ethylene glycol 12ED
OHOH
62.07 Sigma
Aldrich
1,4-butanediol 14BD
OHOH
90.12 Sigma
Aldrich
1,5-pentanediol 15PD
OH OH
104.15 Sigma
Aldrich
1,6-hexanediol 16HD
OH
OH
118.17 Sigma
Aldrich
1,7-heptanediol 17HPD
OH OH
132.20 Alfa Aesar
1,8-octanediol 18OD
OH
OH
146.23 Alfa Aesar
2-methyl-1,3-
propanediol
2M13PD
OH OH
CH3
90.12 Sigma
Aldrich
1,4-
cyclohexanedimeth
anol
14CHDM
OHOH
144.21 Sigma
Aldrich
N,N-
dimethylacetamide
DMAc
N
O
87.12 Sigma
Aldrich
1,4-
diazabicyclo[2.2.2]
octane
DABCO
N
N
112.17 Air
Products
Tetrahydrofuran
HPLC grade
THF O
72.11 Sigma
Aldrich
54
2.2 SYNTHETIC - CASTING - MOULDING PROCESSES
2.2.1 SYNTHETIC ROUTE
The TPUs used in this work were synthesized using a pre-polymer route. This
synthetic route involves two steps as schematically shown in Figure 2.1. Step 1 –
Synthesis of the pre-polymer by reacting the MDI with the polyol and Step 2 –
Synthesis of the TPU by reacting the pre-polymer with additional MDI and the chain
extender.

55
STEP 1 – PRE-POLYMER SYNTHESIS
C
H
H
OCN NCO C
H
H
C
H
H
O C
H
H
C
H
CH H
H
O C
H
H
C
H
H
On
m
n
* *
o
C
H
H
N C
H
O
O C
H
H
C
H
H
O C
H
H
C
H
CH H
H
O C
H
H
C
H
H
O C
O
N
H
C
H
H
n
m
n
OCN NCO
o
C
H
H
OCN NCO
n
STEP 2 – TPU SYNTHESIS
C
H
H
N C
H
O
O C
H
H
C
H
H
O C
H
H
C
H
CH H
H
O C
H
H
C
H
H
O C
O
N
H
C
H
H
n
m
n
OCN NCO
o
C
H
H
OCN NCO OH R OH
C
H
H
C
H
H
O C
H
H
C
H
CH H
H
O C
H
H
C
H
H
O C
O
N
H
C
H
H
n
m
n
* N C
H
O
O R O *o
p
Figure 2.1 Synthetic protocol used to synthesize the TPU
80°C for 2 hours
4,4-MDI Polyol (EO-PPO-EO)
Pre-polymer (polyol encapped with reactive MDI units)
excess
Chain extender
DMAc + DABCO 80°C for 2 hours
Thermoplastic Polyurethane (TPU)

56
2.2.2 TPU FORMULATION CALCULATION
The general formulation calculation for the synthesis of TPU is given with the
following sets of equations below. Prior to the synthesis, only three (3) quantities
were known and they include: (i) the total mass of TPU to be synthesized, (ii) the
mass of HS to be formulated and (iii) Isocyanate index (Isoindex).
A solution of 25% TPU (w/w) in DMAc was formed in the TPU synthesis and in
order to derive the amount of DMAc required for the TPU synthesis, the following
set of equations hold:
(Equation 2.1)
(Equation 2.2)
(Equation 2.3)
where mTPU = mass of TPU
mDMAc = mass of DMAc
Having known the mass of HS to be formulated, the following sets of equations
below reveal the constituents involved in the different steps of the synthetic process.
The mass of HS is the sum of the mass of MDI and chain extender.
(Equation 2.4)
where mHS = mass of hard segment,
mMDI = mass of MDI,
mCE = mass of chain extender,
Since
, (Equation 2.5)
where HS% = % hard segment
We can therefore deduce that
(Equation 2.6)
57
Addition of MDI was carried out in the two steps involved in the synthesis and the
equation is as follows:
(Equation 2.7)
where mMDI (STEP 1) = mass of MDI added in Step 1
mMDI (STEP 2) = mass of MDI added in Step 2
From Equation 2.4, we can therefore do the following expansion:
(Equation 2.8)
The major constituents of TPU are shown in the equation below:
(Equation 2.9)
where mSS = mass of soft segment,
The soft segment is also known as polyol and can be derived as follows:
(Equation 2.10)
where mpolyol = mass of polyol
We can also deduce that,
(Equation 2.11)
The polyol was only added in STEP 1 which involves the formation of the pre-
polymer and hence the following equation holds:
(Equation 2.12)
where mpre-polymer = mass of pre-polymer,
mpolyol = mass of polyol added in Step 1
Whereas STEP 2 involves the addition of the pre-polymer formed in STEP 1, more
MDI and chain extender to make up the TPU formulation
(Equation 2.13)
58
Having established the set of equations leading to the formulation of the TPU, it is
therefore important to know how the amounts of different constituents were derived.
Prior to commencing STEP 1, calculations were made in order to ascertain the
correct amounts of constituents involved in the synthetic process. The pre-polymer
formulation used in this research is calculated around having a molar ratio of the
number of moles of MDI and polyol as 6:1 respectively. With respect to the molar
ratio, the number of moles of MDI and polyol in the pre-polymer is 0.2568 and
0.0428 respectively. The calculated masses of the MDI and polyol needed for the
pre-polymer formulation are 64.2g and 85.8g respectively (See Chapter 2.2.3 for
details). The reasons for the above formulation were: (i) to ensure that the polyol is
completely reacted with the isocyanate units and there are still isocyanate reactive
sites left in the pre-polymer in order to build high HS concentration, (ii) to create
reactive sites which allow for the increase of more MDI units in the polymer
structure and as well as the addition of the chain extender (diol) units onto the MDI
units in STEP 2.
Having known the Isoindex (the amount of isocyanate needed to react with the
hydroxyl units calculated in terms of stoichiometric equivalents), we can therefore
calculate the amount of HS required in the STEP 2 of the synthesis.
(Equation 2.14)
where nNCO = number of moles of NCO
nOH = number of moles of OH
The number of moles of hydroxyl groups is therefore the sum of the number of
moles of hydroxyl groups in the polyol and the number of moles of hydroxyl groups
in the chain extender (diol). The following equation therefore holds:
(Equation 2.15)
where nOH-CE = number of moles of OH in chain extender
nOH-polyol = number of moles of OH in polyol
Equation 2.14 can be re-written as:

59
(Equation 2.16)
By incorporating Equation 2.15 into Equation 2.16, Equation 2.16 can be re-written
as follows:
(Equation 2.17)
The number of moles, n is calculated as follows:
(Equation 2.18)
where fn = functionality
m = mass
M = molar mass
The number of moles of OH per gram polyol, nOH-polyol is derived from its hydroxyl
value, OHv. The hydroxyl value of a polyol is the number of milligrams of potassium
hydroxide, KOH required to titrate the hydroxyl groups in the polyol.
The number of moles of OH per gram polyol is therefore given as:
(Equation 2.19)
where mKOH = mass of potassium hydroxide
MKOH = molar mass of potassium hydroxide in milligrams = 56100mg
Hydroxyl value, OHv has the units mgKOH/g polyol and therefore Equation 2.19 can
be re-written as:
(Equation 2.20)
Taking information from Equations 2.18 and 2.20, Equation 2.17 can be re-written
as follows:
(Equation 2.21)
where fnMDI and fnCE = functionalities of MDI and chain extender respectively,
MMDI and MCE = molar masses of MDI and chain extender respectively,
60
From Equation 2.21, the total amount of MDI, MMDI needed for the synthesis can be
derived by making it the subject of the equation.
When the total mass of MDI, mMDI needed for the synthesis is known, mass of chain
extender, mCE needed is gotten by subtracting the total mass of MDI, mMDI from the
mass of HS, mHS as shown in the equation below.
(Equation 2.22)
The amount of mass of MDI, mMDI (STEP 1) needed for the pre-polymer synthesis
(STEP 1) could therefore be derived from the following equation below
(Equation 2.23)
where mMDI (PP formulation) and mpolyol (PP formulation) are the masses calculated from the 6:1
molar ratio pre-polymer formulation of the MDI and polyol respectively. The masses
of the MDI and polyol needed for the pre-polymer formulation are 64.2g and 85.8g
respectively (as discussed earlier).
Having known mMDI (STEP 1) and mCE, the amount of MDI, mMDI (STEP 2) needed for the
TPU synthesis (STEP 2) can simply be gotten as follows
– (Equation 2.24)
Numerical example of the above TPU calculation formulation
Synthesis of 1,5-pentanediol TPU-70%HS
The calculations below were formulated for the synthesis of 100g of TPU for 70%
HS concentration.

61
From Equation 2.21, we can calculate the total amount of MDI required for the
synthesis.
From Equation 2.22, we can calculate the amount of chain extender, MCE from the
total mass of MDI, MMDI calculated in Equation 2.21.
From Equation 2.23, we can then calculate the amount of MDI, MMDI (STEP 1) needed
in STEP 1 – Pre-polymer Synthesis
Equation 2.24 then gives us the additional amount of MDI needed in STEP 2 – TPU
Synthesis
Total amount of TPU synthesized from the above calculations is given below as
shown in Equation 2.9
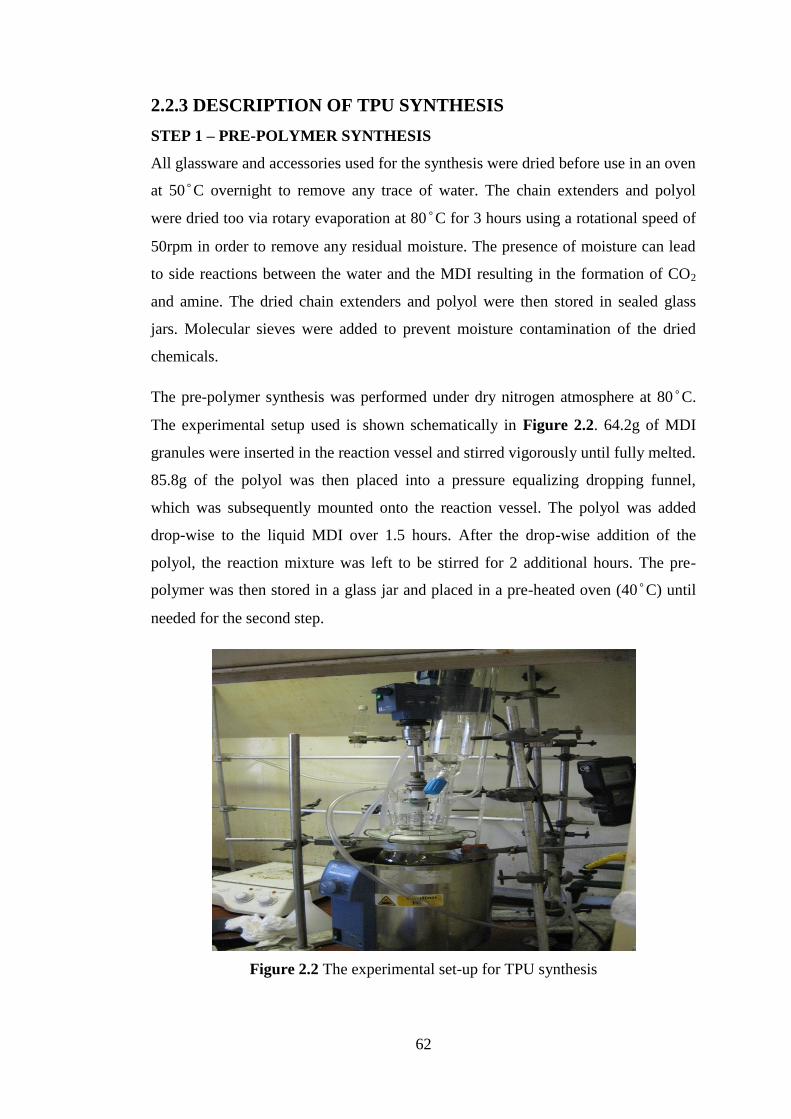
62
2.2.3 DESCRIPTION OF TPU SYNTHESIS
STEP 1 – PRE-POLYMER SYNTHESIS
All glassware and accessories used for the synthesis were dried before use in an oven
at 50°C overnight to remove any trace of water. The chain extenders and polyol
were dried too via rotary evaporation at 80°C for 3 hours using a rotational speed of
50rpm in order to remove any residual moisture. The presence of moisture can lead
to side reactions between the water and the MDI resulting in the formation of CO2
and amine. The dried chain extenders and polyol were then stored in sealed glass
jars. Molecular sieves were added to prevent moisture contamination of the dried
chemicals.
The pre-polymer synthesis was performed under dry nitrogen atmosphere at 80°C.
The experimental setup used is shown schematically in Figure 2.2. 64.2g of MDI
granules were inserted in the reaction vessel and stirred vigorously until fully melted.
85.8g of the polyol was then placed into a pressure equalizing dropping funnel,
which was subsequently mounted onto the reaction vessel. The polyol was added
drop-wise to the liquid MDI over 1.5 hours. After the drop-wise addition of the
polyol, the reaction mixture was left to be stirred for 2 additional hours. The pre-
polymer was then stored in a glass jar and placed in a pre-heated oven (40°C) until
needed for the second step.
Figure 2.2 The experimental set-up for TPU synthesis
63
STEP 2 – TPU SYNTHESIS
First, the required amount of chain extender, catalyst and solvent were introduced in
a dry reaction vessel. The vessel was then placed in the pre-heated oil bath (80°C)
and the mixture stirred mechanically. The vessel was then put under dry nitrogen
atmosphere.
In a separate dry glass jar, the required amount of the pre-polymer, MDI and DMAc
were added. The mixture was then stirred vigorously with a magnetic stirrer until the
MDI granules were dissolved. The above mixture was then poured into a pressure-
equalizing dropping funnel and then added drop-wise over 1.5 hours to the reaction
vessel. 180g of DMAc was added into the pressure-equalizing funnel and added
drop-wise. The reaction mixture was the left to be stirred for 2 hours. The
synthesized TPUs were stored in glass jars and kept in a dry, cool place.
Small amounts of samples were collected and diluted in THF for GPC analysis.
Table 2.2 below shows the number-average molecular weight n, weight-average
molecular weight w and molecular weight distribution MWD of the synthesized
TPUs. Molecular weight distribution is the same as polydispersity index.

64
Table 2.2: Molecular weights and polydispersity indices of synthesized TPUs
Synthesized TPUs w (g/mol) n (g/mol) Polydispersity Index
12ed-70
66440±4828
21020±2276
3.16±0.1
12ed-80
67250±7096
25280±2513
2.66±0.01
12ed-90
138700±14457
60690±6299
2.29
12ed-100
162400±18354
91960±9516
1.77±0.01
14bd-70
73850±7826
23920±2619
3.09±0.01
14bd-80
54760±5399
22150±2349
2.47±0.01
14bd-90
68320±6869
26010±2567
2.63
14bd-100
123500±13223
39070±3802
3.16±0.03
15pd-70
109130±11394
29936±3293
3.65±0.02
15pd-80
107400±11428
41000±4513
2.62±0.01
15pd-90
81515±8567
30650±3029
2.66±0.01
15pd-100
106710±10913
36090±3639
2.96
16hd-70
82450±8545
30860±2295
2.67±0.02
16hd-80
84910±9004
33450±3238
2.54±0.02
16hd-90
74660±7759
29490±2890
2.53±0.02
16hd-100
78920±8309
26470±2789
2.98
17hpd-70
87570±9726
39350±3989
2.23±0.01
17hpd-100
57090±6317
27460±2793
2.08±0.02
18od-70
59780±6366
22700±2436
2.63±0.01
18od-100
112400±12339
37380±3727
3.01±0.02
2m13pd-70
69730±7351
19160±1945
3.64±0.01
2m13pd-80
59400±6204
15550±1518
3.82±0.02
2m13pd-90
75770±7794
23930±2487
3.17±0.01
2m13pd-100
77870±8347
29390±2882
2.65±0.02
14chdm-70
48380±4926
14730±1609
3.29±0.03
14chdm-80
56840±5814
20560±2164
2.76
14chdm-90
79960±8618
36010±3736
2.22±0.01
14chdm-100
64550±6869
25700±2884
2.51±0.01

65
2.2.4 SOLVENT CASTING
Figure 2.3 (a) Schematic diagram of the mould and (b) photograph of the cast TPU-
70 (15pd) sample
The mould used comprises three layers: a polytetrafluoroethylene (Teflon) plate, a
hollow aluminum frame and a steel plate all with external dimensions of 125 x 125
mm. The thicknesses of the Teflon plate, hollow aluminum frame and steel plate
were 6, 10 and 10 mm respectively. The hollow aluminum frame had inner
dimensions of 100 x 100 mm. The Teflon plate was placed between the steel slab
(a)
(b)
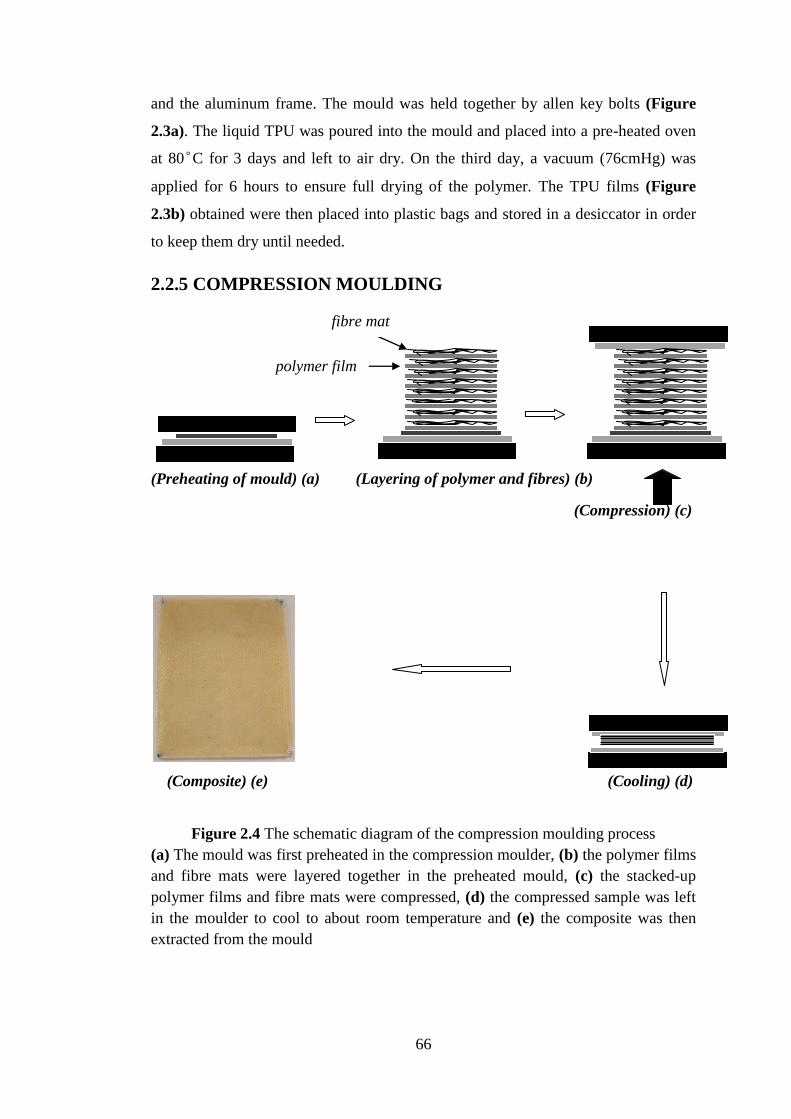
66
and the aluminum frame. The mould was held together by allen key bolts (Figure
2.3a). The liquid TPU was poured into the mould and placed into a pre-heated oven
at 80°C for 3 days and left to air dry. On the third day, a vacuum (76cmHg) was
applied for 6 hours to ensure full drying of the polymer. The TPU films (Figure
2.3b) obtained were then placed into plastic bags and stored in a desiccator in order
to keep them dry until needed.
2.2.5 COMPRESSION MOULDING
(Preheating of mould) (a) (Layering of polymer and fibres) (b)
(Compression) (c)
(Composite) (e) (Cooling) (d)
Figure 2.4 The schematic diagram of the compression moulding process
(a) The mould was first preheated in the compression moulder, (b) the polymer films
and fibre mats were layered together in the preheated mould, (c) the stacked-up
polymer films and fibre mats were compressed, (d) the compressed sample was left
in the moulder to cool to about room temperature and (e) the composite was then
extracted from the mould
fibre mat
polymer film

67
Compression moulding was used for three distinct purposes: (1) preparation of thin
TPU films, (2) preparation of composites and (3) preparation of melt-quenched
samples.
The TPU samples were first flattened (compressed) in order to enable their proper
layering with the glass fibre mats for composite making. Flattening of the TPU
samples was done just below the melting temperature (160°C) of the TPU polymer.
The compression press was first preheated to 150°C - 160°C. The cast TPU sample
was put between two release films, placed in the preheated moulder and then
compressed. The thickness of the flattened film formed was about 0.45 mm. The
flattened film was then taken out of the press and left to cool.
Secondly, TPU samples and TPU composites were compression-moulded in a 150 x
100 mm flash type mould. The thickness of the mould was 2 mm. In this process, the
fibre mats were cut into sizes. The mass of the fibre mats were weighed and
recorded. The mould used was first preheated to 180ºC. The flattened TPU films
were then stacked up together with the fibre mats, put into the pre-heated mould and
then compressed. The compression pressure was 10 MPa. The compression in the
moulder lasted about 3 minutes and then the composite was cooled via water
cooling. Cooling process lasted about 12-14 minutes. The schematic diagram of the
compression moulding process is shown in Figure 2.4. Composite was then weighed
after the completion of the compression moulding process bearing in mind the pre-
weighed masses of the glass fibres mats. The mass of the polymer used was
obtained by the subtraction of the mass of glass fibre from the mass of the
composite.
(Equation 2.25)
where Mp = mass of the polymer,
Mc = mass of the composite, and
Mf = mass of the fibre
The composites used in this research all have 2 mm of thickness and contain 8 glass
fibre-mat layers. The percentage weight fractions of the polymer and fibre of the
composites were about 50:50%.
68
The composites of commercially available PP and Isoplast were also compression-
moulded and were used as benchmarks in comparison with our TPUs. PP granules
(100-CA50) were purchased from Ineos Polyolefins. Isoplast is a brand name for a
TPU resin manufactured by Lubrizol Advanced Materials Inc. Isoplast TPUs are
designed for rigid polymer requirements due to their high tensile strength and impact
resistance. These specialty TPUs combine the toughness and dimensional stability of
amorphous resins with chemical resistance of crystalline materials. Isoplast TPUs are
available in impact modified, clear and glassy grades. PP and Isoplast composites
were moulded at 200ºC and 240 ºC respectively. The PP and Isoplast polymers were
obtained in form of granules. The granules were first flattened in the compression
moulder at temperatures below the melting temperatures of the PP (180ºC) and
Isoplast (200ºC) polymers as the flattening procedure follows the same procedure as
earlier described. For PP and Isoplast composites, moulds were preheated to 200ºC
and 240ºC respectively. The thicknesses of the flattened PP and Isoplast films were
about 0.40mm.
The third purpose of using the compression moulding process is the making of melt-
quenched TPU samples. Melt-quenching of TPU samples was done in the press at
220˚C. The melt-quench procedure is outlined as follows: The mould was first
preheated to 220˚C in the press. The TPU sample was put into the preheated mould
between two release films and then compressed. The sample was left for 2-3 minutes
in the press and then cooled rapidly in liquid nitrogen.
The glass fibre mats used in making the composites was E-glass plain weave mat.
The glass fibre mats were sized with silane. The fibre mat had a thickness of 0.16
mm and density of 170g/sq.m. Glass fibre mats were composed of warp and weft
yarns. The ratio of the warp and weft was 50:50. The glass fibre fabric tape was
obtained from Glasplies Company.
Polytetrafluoroethylene (PTFE) glass coated release fabric/film was used in the
compression moulding and the melt-quenching process employed in this research
work. The PTFE glass coated release fabric was purchased from UMEC Process
Materials Limited.
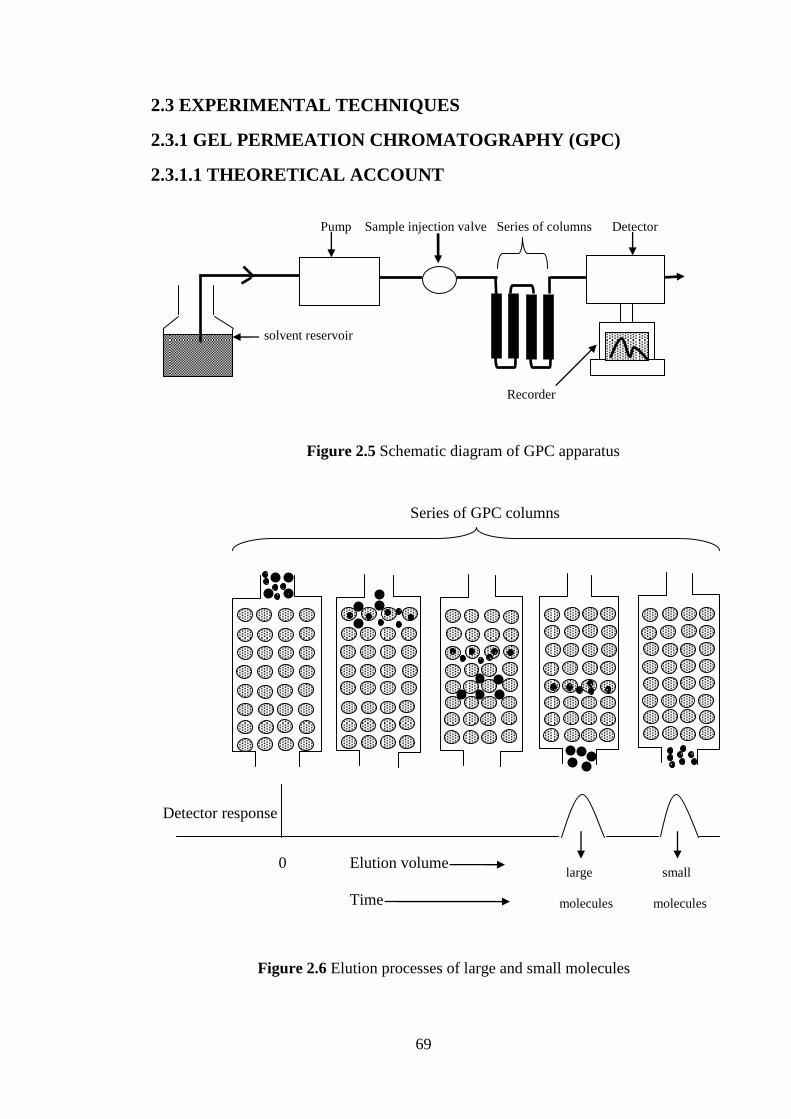
69
2.3 EXPERIMENTAL TECHNIQUES
2.3.1 GEL PERMEATION CHROMATOGRAPHY (GPC)
2.3.1.1 THEORETICAL ACCOUNT
Pump Sample injection valve Series of columns Detector
solvent reservoir
Recorder
Figure 2.5 Schematic diagram of GPC apparatus
Series of GPC columns
Detector response
0 Elution volume
Time
Figure 2.6 Elution processes of large and small molecules
large small
molecules molecules
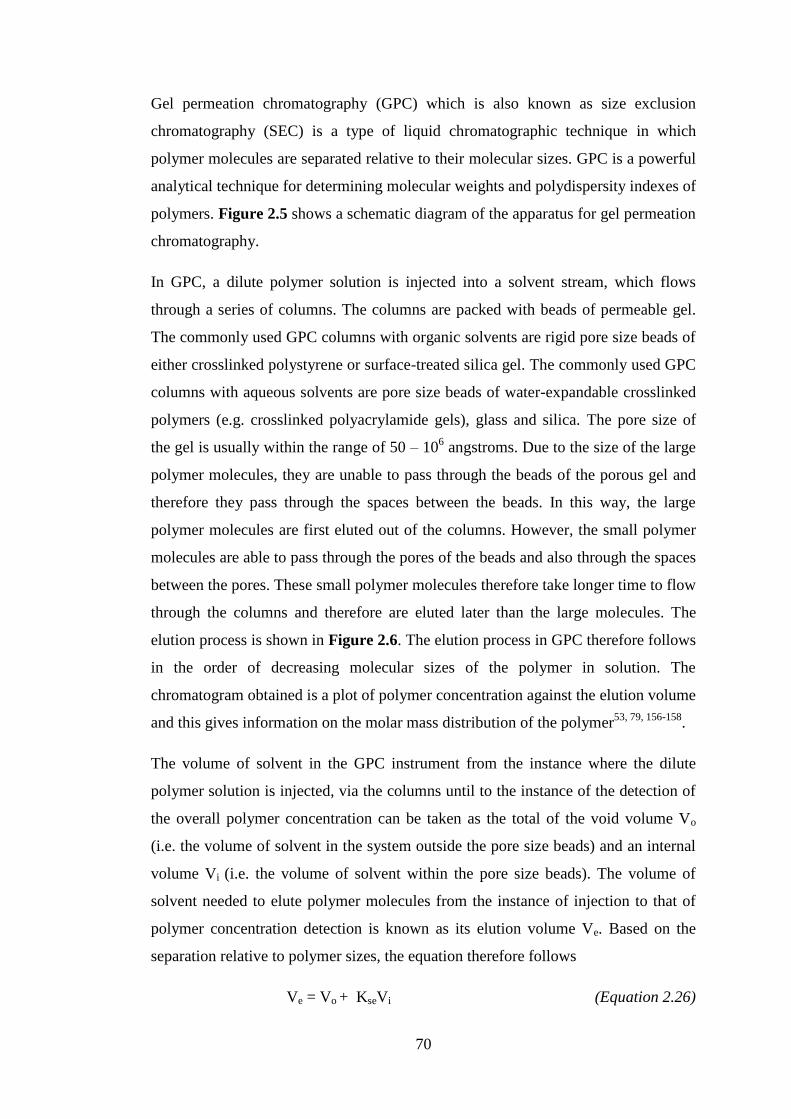
70
Gel permeation chromatography (GPC) which is also known as size exclusion
chromatography (SEC) is a type of liquid chromatographic technique in which
polymer molecules are separated relative to their molecular sizes. GPC is a powerful
analytical technique for determining molecular weights and polydispersity indexes of
polymers. Figure 2.5 shows a schematic diagram of the apparatus for gel permeation
chromatography.
In GPC, a dilute polymer solution is injected into a solvent stream, which flows
through a series of columns. The columns are packed with beads of permeable gel.
The commonly used GPC columns with organic solvents are rigid pore size beads of
either crosslinked polystyrene or surface-treated silica gel. The commonly used GPC
columns with aqueous solvents are pore size beads of water-expandable crosslinked
polymers (e.g. crosslinked polyacrylamide gels), glass and silica. The pore size of
the gel is usually within the range of 50 – 106 angstroms. Due to the size of the large
polymer molecules, they are unable to pass through the beads of the porous gel and
therefore they pass through the spaces between the beads. In this way, the large
polymer molecules are first eluted out of the columns. However, the small polymer
molecules are able to pass through the pores of the beads and also through the spaces
between the pores. These small polymer molecules therefore take longer time to flow
through the columns and therefore are eluted later than the large molecules. The
elution process is shown in Figure 2.6. The elution process in GPC therefore follows
in the order of decreasing molecular sizes of the polymer in solution. The
chromatogram obtained is a plot of polymer concentration against the elution volume
and this gives information on the molar mass distribution of the polymer53, 79, 156-158
.
The volume of solvent in the GPC instrument from the instance where the dilute
polymer solution is injected, via the columns until to the instance of the detection of
the overall polymer concentration can be taken as the total of the void volume Vo
(i.e. the volume of solvent in the system outside the pore size beads) and an internal
volume Vi (i.e. the volume of solvent within the pore size beads). The volume of
solvent needed to elute polymer molecules from the instance of injection to that of
polymer concentration detection is known as its elution volume Ve. Based on the
separation relative to polymer sizes, the equation therefore follows
Ve = Vo + KseVi (Equation 2.26)

71
where Kse is a fraction of the inner pore volume penetrated by some polymer
molecules. For the small polymer molecules that are able to pass through the inner
pore volume, Kse = 1 and therefore Ve = Vo + Vi, whereas for the very large polymer
molecules that are unable to pass through the inner pore volume Kse = 0 and thus Ve
= Vo. The commonly used flow rates in GPC systems is 1cm3 min
-1 and it has been
observed that Ve is unrelated to the flow rate. This therefore signifies that there is
adequate amount of time for the polymer molecules to pass in and out of the porous
beads until equilibrium concentrations, ci and co of the polymer molecules are
established within and outside the porous beads respectively. Since equilibrium
conditions are necessary for polymer-size separation, Kse can therefore be taken as
the equilibrium constant which is defined by Kse = ci / co (it is therefore worthy to
note that the rate of penetration of the polymer molecules into the porous beads is the
same with the solvent which therefore means ci = co and Kse = 1).
The following common parameters are measured in GPC experiments namely:
number-average molar mass ( n), weight-average molar mass ( w) and
polydispersity index (PDI).
The number-average molar mass ( n) is defined as the summation of the products
of the molar mass of each molecular specie multiplied by its mole fraction.
That is, n (Equation 2.27)
Where Xi is the mole fraction of molecules of the molar mass Mi and is defined as
the ratio of Ni to the total number of molecules. The above equation therefore can be
re-written as follows:
n (Equation 2.28)
The above equation depicts the arithmetic mean of the molar mass distribution.
The weight-average molar mass (Mw) is defined as the summation of the products of
the molar mass of each molecular specie multiplied by its weight fraction.
That is, w (Equation 2.29)
Weight fraction (wi) is defined as the mass of the molecules of molar mass Mi
divided by the overall mass of all the molecules available

72
That is, (Equation 2.30)
By integrating Equation 2.30 with Equation 2.29, Mw can be written as follows:
w (Equation 2.31)
Polydispersity index (PDI) is the ratio of weight-average molar mass ( w) to
number-average molar mass ( n).
w / n (Equation 2.32)
2.3.1.2 PARAMETERS USED
The parameters used in the GPC preparation of the synthesized liquid TPUs are as
follows. 80mg of liquid (DMAc) TPU was put into a small glass jar. 10ml of
tetrahydrofuran (THF) was then added to the glass jar containing the liquid TPU in
order to dissolve and dilute the polymer. A magnetic stirrer bar was put into the jar
to enable the stirring of the polymer solution. The solution was stirred and heated at
50° C for 2 days. On the 2nd
day, 4 drops of diphenyl ether (DPE) were added to the
solution. Diphenyl ether (DPE) is an organic compound which is used as an elution
standard. The solution was then filtered with a 5-micron filter to get rid of dust and
large contaminants which might create blockages in the GPC columns. The filtered
solution is then injected into the GPC instrument. Each GPC run takes about 35 to 40
minutes to complete. Diphenyl ether (DPE) peak marks the end of a GPC run.
2.3.2 DIFFERENTIAL SCANNING CALORIMETRY (DSC)
2.3.2.1 THEORETICAL ACCOUNT
Differential scanning calorimetry is a thermo-analytical technique which measures
the difference in the input of energy to a sample and reference necessary to keep
them at the same temperature as both materials undergo heating or cooling at
controlled rate. The sample and reference are both retained at temperature preset by
the instrument programme during a thermal change (heating or cooling) occurring in
the sample. The quantity of energy needed to be supplied to or withdrawn from the
sample to sustain zero temperature difference between the sample and the reference
is the property measured in DSC. The sample and reference are kept in the same
surroundings, metal pans with separate platforms which contain a platinum
resistance thermometer and a heater. The mass of the sample and reference holders
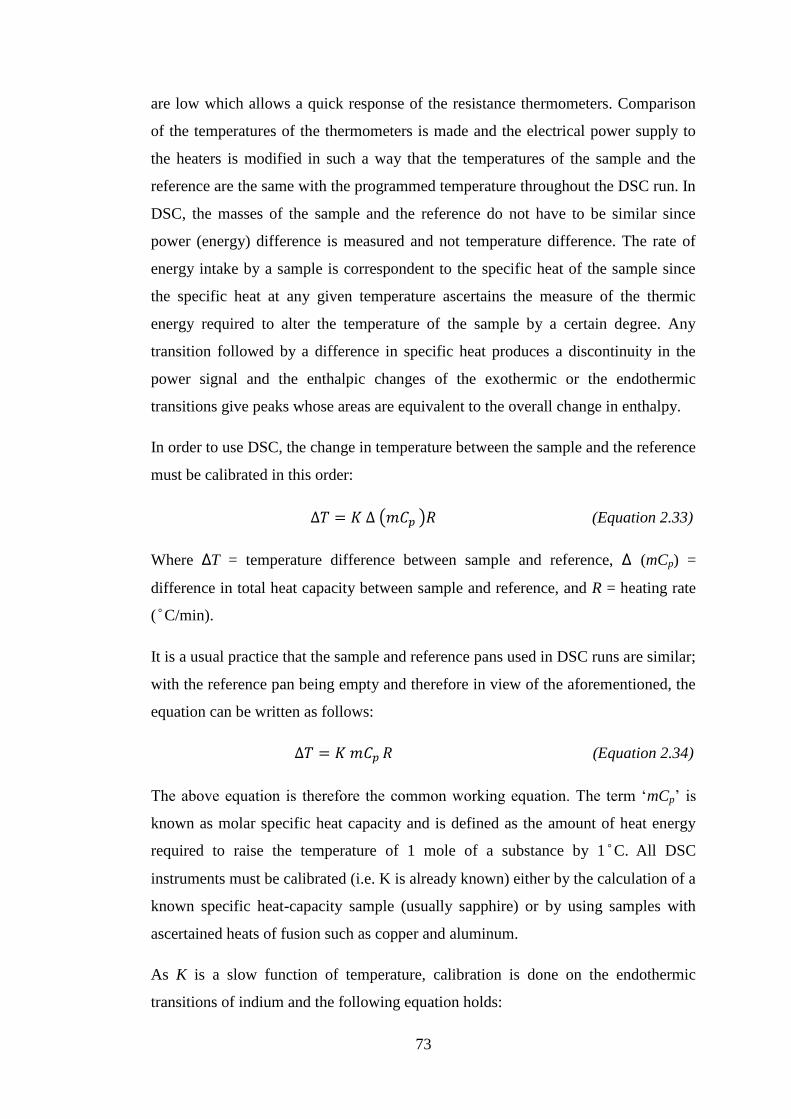
73
are low which allows a quick response of the resistance thermometers. Comparison
of the temperatures of the thermometers is made and the electrical power supply to
the heaters is modified in such a way that the temperatures of the sample and the
reference are the same with the programmed temperature throughout the DSC run. In
DSC, the masses of the sample and the reference do not have to be similar since
power (energy) difference is measured and not temperature difference. The rate of
energy intake by a sample is correspondent to the specific heat of the sample since
the specific heat at any given temperature ascertains the measure of the thermic
energy required to alter the temperature of the sample by a certain degree. Any
transition followed by a difference in specific heat produces a discontinuity in the
power signal and the enthalpic changes of the exothermic or the endothermic
transitions give peaks whose areas are equivalent to the overall change in enthalpy.
In order to use DSC, the change in temperature between the sample and the reference
must be calibrated in this order:
(Equation 2.33)
Where ΔT = temperature difference between sample and reference, Δ (mCp) =
difference in total heat capacity between sample and reference, and R = heating rate
(°C/min).
It is a usual practice that the sample and reference pans used in DSC runs are similar;
with the reference pan being empty and therefore in view of the aforementioned, the
equation can be written as follows:
(Equation 2.34)
The above equation is therefore the common working equation. The term ‘mCp’ is
known as molar specific heat capacity and is defined as the amount of heat energy
required to raise the temperature of 1 mole of a substance by 1°C. All DSC
instruments must be calibrated (i.e. K is already known) either by the calculation of a
known specific heat-capacity sample (usually sapphire) or by using samples with
ascertained heats of fusion such as copper and aluminum.
As K is a slow function of temperature, calibration is done on the endothermic
transitions of indium and the following equation holds:

74
(Equation 2.35)
There are two main types of differential scanning calorimetry: (a) Power-
compensation DSC (b) Heat flux DSC. The cell designs of power-compensation and
heat-flux DSCs are shown in Figure 2.7.
Power-Compensation DSC Cell Design
Sample Reference
TS ES ER TR
Heat-Flux DSC Cell Design
Sample Reference
TS TR
Figure 2.7 Cell designs of power-compensation and heat-flux DSC instruments
(where TS and TR stand for the temperatures of the sample and reference
respectively, ES and ER stand for the heat energies of the sample and reference
respectively.
In the power-compensation DSC, there are different heating systems (furnace) for
the sample and the reference whereas in the heat-flux DSC, sample and reference are
heated in the same furnace. The temperature difference of the sample and reference
is always zero (0) in power compensation DSC whereas temperature differences are
measured in the heat-flux DSC. However, calibration becomes difficult in heat-flux
DSC when the temperature differences are to be converted to energy differences.
Single
heater for
sample and
reference
Separate
heaters for
sample and
reference

75
Power-compensation DSC gives a direct measurement of the energy difference
between both materials under heating or cooling conditions. In the power-
compensation DSC trace, the exothermic transitions (crystallisation, decomposition,
polymerisation and curing) appear as negative displacements whereas the
endothermic transitions (melting, vaporisation) appear as positive displacements.
Power-compensation DSC has heating rate up to 600° C. In the heat-flux DSC trace,
the exothermic transitions (crystallisation, decomposition, polymerisation and
curing) appear as positive displacements whereas the endothermic transitions
(melting, vaporisation) appear as negative displacements. Heat-flux DSC measures
temperature differences of the sample and reference79, 156-162
.
2.3.2.2 PARAMETERS USED
In this project, the thermodynamic properties of TPU, PP and Isoplast were
measured using a heat-flux DSC. 10mg of sample was cut and put into and
aluminum hermetic pan and sealed with hermetic lid. The pans were placed in the
DSC analyzer to begin the runs. All the samples were characterized from an initial
temperature of -90° C to a final temperature of 220° C at ramp rate of 20° C/min.
The samples underwent 4 cycles (heating and cooling cycles). The thermal protocol
for the DSC experiment is shown in Figure 2.8. The instrument used was DSC Q100
(TA INSTRUMENTS).
-175
-150
-125
-100
-75
-50
-25
0
25
50
75
100
125
150
175
200
225
250
TgHS
TgSS
Te
mp
era
ture
(C
)
Time
Melt-quenched sample
1st cooling
TMMT
2nd heating
Full DSC run for all samples
Annealed sample
1st heating Moulded sample
Figure 2.8 The thermal protocol of DSC runs

76
2.3.3 WIDE ANGLE X-RAY SCATTERING (WAXS)
2.3.3.1 THEORETICAL ACCOUNT
Figure 2.9 X-ray diffraction process
Wide Angle X-Ray Scattering (WAXS) is a method that is used in the determination
of the crystallinities of materials. This technique measures scattering in electron
density observed at lengths lower than 100 Angstroms (Å) and therefore leading to
diffraction maxima of scattered intensity at larger angles say greater than 5°.
Information on d-spacing between 0.1 and 1nm are provided.
In this technique, incident x-rays are scattered by atoms in all directions and could
led to the occurrence of two sets of scattered beams. Firstly, the incident x-rays
scattered by the atoms in the planes (see Figure 2.9) are totally in phase and
therefore consolidate one another to form a diffracted beam of rays. The interaction
of diffracted beam of rays is known as constructive interference. Secondly, there is
also the occurrence of the scattered x-rays being out of phase in other angles of space
and therefore cancel out themselves. This phenomenon is known as destructive
interference and in this case, there is no scattering. From the above explanations, it is
therefore worthy to note that the crucial condition of scattering beam being
completely in phase must be achieved if diffraction is to occur and this gave rise to
the concept of Bragg’s law.
Bragg’s law gives an insight on the concept of x-ray diffraction by the following
equation; it is also known as the Bragg Equation
77
(Equation 2.36)
where n is called the order of diffraction and thus may assume any integer value that
is congruent with sinθ not greater than unity, is the wavelength of incident wave, d
is the spacing between the planes in the atomic lattice and θ is the angle between the
incident ray and the scattering planes.
Diffraction occurs only when the scattering taking place in an atomic lattice has
satisfied Bragg’s law. The consolidation of the diffracted x-rays makes them stronger
than the total of all the scattered rays in the same direction but is weak in relation to
the incident x-rays and this is because the atoms of any crystalline structure scatter
only a tiny amount of the energy emergent on them160, 163-165
.
The sharp peak observed from a typical WAXS curve is due to scattering from the
crystalline region whereas the broad underlying ‘halo’ is due to scattering from the
amorphous region. The shape of the amorphous halo can be obtained by melt-
quenching (rapid cooling) a molten sample. The mass fraction of the crystals xc can
be obtained by
(Equation 2.37)
where Aa is the area under the amorphous halo and Ac is the area remaining under
the crystalline peak.
On an x-ray diffractometer, the sample which is usually powder is positioned so that
its surface is parallel to the top of the sample holder. A slightly divergent x-ray beam
is then irradiated on the sample which is rotated slowly. Diffraction maxima occur at
positions where the planes lying parallel to the surface fulfil Bragg’s Law156
.
2.3.3.2 PARAMETERS USED
In this project, samples were measured in Philips X’Pert APD (PW 3710) with
generator settings of 40 mA, 50 kV. The anode material of the instrument is Copper
(Cu). Analysis was done from 5.0750 °2θ (start position) to 70.9450 °2θ (end
position). The scan type and scan step time used were continuous and 10s
respectively. The step size used was 0.0700 °2θ.

78
2.3.4 SMALL ANGLE X-RAY SCATTERING (SAXS)
2.3.4.1 THEORETICAL ACCOUNT
Figure 2.10 Schematic diagram of small angle x-ray scattering technique
Small Angle X-Ray Scattering (SAXS) is a technique where the elastic scattering of
x-rays (with wavelength range of 0.1 to 0.2nm) by a sample which contains
structural irregularities in the nanometer region, is measured at very low angles
(normally 0.1 to 10°). Small Angle X-Ray Scattering (SAXS) is a similar technique
to WAXS. In SAXS technique, the distance between sample to the detector is longer,
that is to say, the electron density fluctuations are observed at lengths in the range of
100 Angstroms (Å) or higher and therefore scattered intensities are produced at
angles 2θ less than 5°. Variations in intensities mainly originate from the differences
in electron density and/or compositions of the polymer samples. Small angle x-ray
scattering is used to determine the particle shapes or their variations in sizes.
Structural irregularities can be seen in copolymeric materials and thus phase
separation of the copolymers can be measured by SAXS technique. Schematic
diagram of small-angle x-ray technique is shown in Figure 2.10.
SAXS can be used to produce peaks in intensity of long-range ordered structures.
The extent and angular spacing of the scattered intensity give information on the size
of minute particles or their surface area per unit volume, irrespective of the sample

79
or particles being either crystalline or amorphous. Long-ordered structures are
commonly seen in polymers and biological materials. The peaks of these samples
measured by SAXS indicate the uniformity or the difference in electron density in
varying directions156, 163
.
In a SAXS instrument, a monochromatic beam of x-rays is radiated to a sample from
which some x-rays scatter, while most of the x-rays go through the sample with no
contact with it. The scattered x-rays therefore create a pattern which is then detected
by a detector placed behind the sample. The detector is perpendicular to the path of
the main beam that hits the sample.
When a beam is incident on a material with a wave vector (k0), the atoms within the
material having been irradiated by the incident beam become origins of spherical
waves. The wave vector (k0) which can also be considered as the transmitted beam is
given as:
(Equation 2.38)
As in SAXS, elastic scatterings are marked by zero energy transfers in such a way
that the intensity of the scattered beam (k1) is equal to that of the transmitted beam
(k0) such that
(Equation 2.39)
SAXS patterns are expressed as scattered intensity as a result of the intensity of the
scattering vector (q). The scattering vector (q) can be seen as the criterion on which a
sample is detected and is an important factor to analyze the zero energy transfer
interactions such that
(Equation 2.40)
From Bragg’s law, distance probed is inversely relative to scattering vector (q) and is
given as:
(Equation 2.41)

80
(Equation 2.42)
where 2θ is the angle between the incident x-ray beam and the detector measuring
the scattered intensity and λ is the wavelength of the x-rays.
SAXS patterns are typically seen as scattered intensity as a function of the
magnitude of the scattering vector . One explanation about the
scattering vector is that it is a parameter with which a sample is detected. For
instance, in the case of two-phase sample (e.g. small particles in a liquid suspension),
the only difference that will result in scattering is the Δρ, which is difference in the
average electron density between the small particles and its immediate environment.
Variations in density due to atomic structures can only detected at higher angles in
the WAXS region. This therefore means that the total intensity of 3-dimensional
SAXS pattern is an invariant quantity corresponding to the square Δρ2. For an
isotropic pattern, this invariant quantity becomes where the integral
runs from q = 0 to wherever the SAXS pattern is assumed to end and the WAXS
pattern begins. There is also an assumption that the density does not vary in the
liquid or inside the small particles, that is to say, there is binary contrast.
At the high resolution end of SAXS pattern, scattering comes primarily from the
interface between two phases and therefore intensity should decrease with the fourth
power of q if the interface is smooth. In this regime, any other structural features of
the phases are random and have no effect on scattering parameters. This is known as
Porod’s law.
(Equation 2.43)
This therefore allows the surface area S of the particle to be measured by SAXS165
.
2.3.4.2 PARAMETERS USED
In this project, samples were measured in Hecus S3-MICRO X-ray scattering
facility. All tests were carried out using tungsten (W) filter and the scan time was
1000s. Silver Behemate (AgBeh) was used to calibrate the instrument before any
sample run. The thickness of the sample run was in the range of 1 – 2 mm. The
results were later analysed using fit2d software.
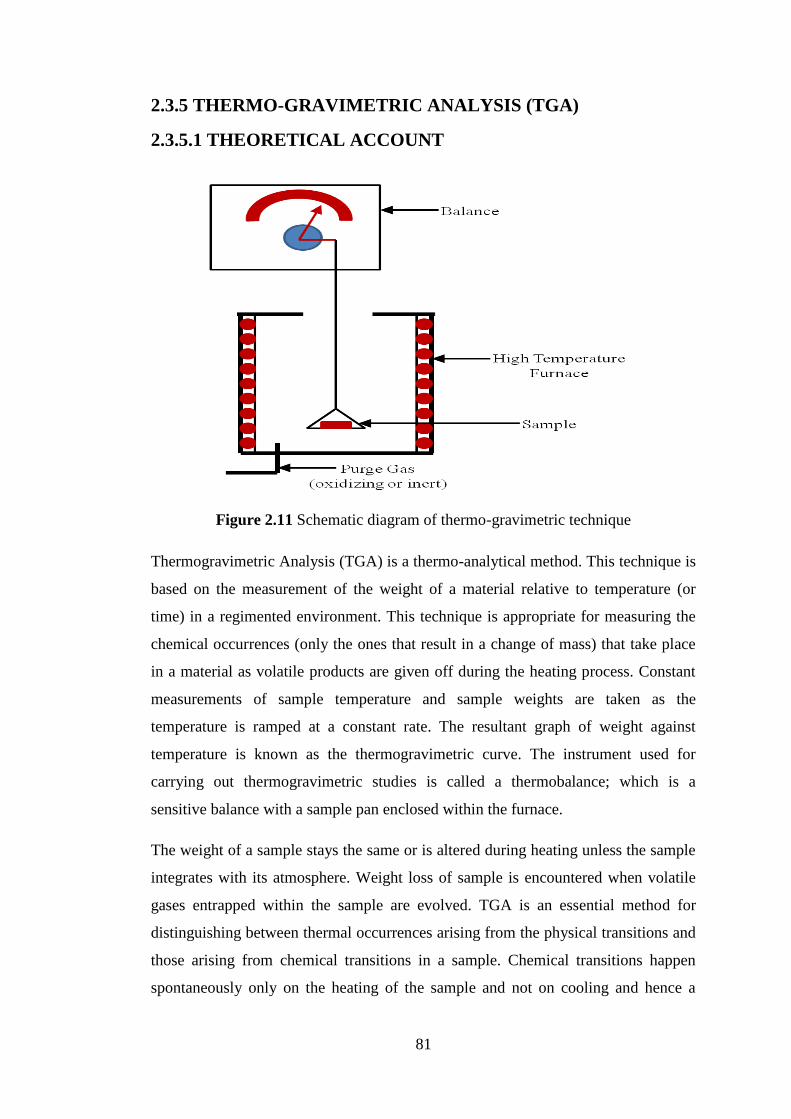
81
2.3.5 THERMO-GRAVIMETRIC ANALYSIS (TGA)
2.3.5.1 THEORETICAL ACCOUNT
Figure 2.11 Schematic diagram of thermo-gravimetric technique
Thermogravimetric Analysis (TGA) is a thermo-analytical method. This technique is
based on the measurement of the weight of a material relative to temperature (or
time) in a regimented environment. This technique is appropriate for measuring the
chemical occurrences (only the ones that result in a change of mass) that take place
in a material as volatile products are given off during the heating process. Constant
measurements of sample temperature and sample weights are taken as the
temperature is ramped at a constant rate. The resultant graph of weight against
temperature is known as the thermogravimetric curve. The instrument used for
carrying out thermogravimetric studies is called a thermobalance; which is a
sensitive balance with a sample pan enclosed within the furnace.
The weight of a sample stays the same or is altered during heating unless the sample
integrates with its atmosphere. Weight loss of sample is encountered when volatile
gases entrapped within the sample are evolved. TGA is an essential method for
distinguishing between thermal occurrences arising from the physical transitions and
those arising from chemical transitions in a sample. Chemical transitions happen
spontaneously only on the heating of the sample and not on cooling and hence a

82
controlled cooling process is rarely employed in TGA. The thermogravimetric curve
shows sequences of weight-loss events as consecutive reactions resulting in the
evolution of gases take place at different temperatures (in particular, within different
temperature ranges) during the regimented heating process. Isothermal weight-loss
measurements resulting in weight versus time graphs are also employed specifically
for kinetic studies of decomposition reactions. TGA is also used to look essentially
at sample degradation. The schematic diagram of thermo-gravimetric analysis is
shown in Figure 2.11.
Apart from the common weight-loss curve (thermogravimetry), the thermobalance
can also be used for two other types of measurements namely: (i) Derivative
thermogravimetry (DTG) and (ii) Differential thermogravimetry.
In derivative thermogravimetry (DTG), the degree of the sample weight loss is taken
relatively as a result of the sample temperature. The derivative thermogravimetry
(DTG) curve shows better outcome of two or more processes taking place at the
same temperature than the common weight-loss TGA graph and the DTG graphs are
simpler to compare with the results obtained from other thermal analysis
techniques156-159, 166
.
2.3.5.2 PARAMETERS USED
All samples were placed on platinum pans and heated in an inert environment. The
sample weight is about 20mg. The temperature range for the controlled heating
process was 0°C - 1000°C. All experiments were carried out on a modulated TGA
2950 (TA Instruments).

83
2.3.6 TOMOGRAPHY
2.3.6.1 THEORETICAL ACCOUNT
Figure 2.12 Schematic diagram of Computer Tomography instrumentation
Tomography is a technique that employs the use of x-rays to measure cross-
sectional, two-dimensional representations of a body or an object. This technique has
various applications such as airport screening, medical imaging etc. One of the
important parameters associated with radiation is its intensity I. Intensity I, is defined
as the quantity of photonic energy radiated through unit area per unit time.
Mathematically, it can be expressed as follows:
(Equation 2.44)
where h is Planck’s constant, v is the frequency of the photon of radiation emitted, S
is area and t is time.
When an X-ray beam of intensity I(0) is aimed at an object, some physical
transformations happen within the object. These transformations are accountable for
the attenuation of the radiation, its dissipation of energy and the attendant increase in
the temperature of the object. The mechanisms involved in these transformations
within the object include: (a) the photoelectric effect (absorption) and (b) coherent
and incoherent scattering.

84
For the photoelectric effect, the radiated photonic X-ray beams interact with the
electron shells of the atoms within the irradiated sample. Some of the incident beam
is used to overpower the binding energy of ejected electrons whereas some beams
interact with the photoelectrons in the form of kinetic energy.
(Equation 2.45)
where Eb is the electron binding energy, Ek is the kinetic energy transferred to the
photoelectron, Ei = hv is the energy of the incident photon.
The spaces in the lower electron shells enable other electrons from the higher shells
to migrate into them. The difference in energy between the electron that has migrated
to the lower shell and the electron that has moved from the higher shell is radiated as
a quantum of the secondary X-ray energy. In each element, only specific transitions
between electron shells are allowed and therefore the quanta of radiated beams have
well-defined intrinsic wavelengths.
Attenuation of radiated beams can also be influenced by both coherent (Rayleigh)
and incoherent (Compton) scattering. For the case of Rayleigh scattering, incident X-
ray photons on the sample diffract without loss of energy (elastic scattering) whereas
for Compton scattering, the radiated beams are diffracted and lose energy on
interaction with the electrons on the sample (inelastic scattering). The remaining
energy of the scattered quantum energy can be expressed by
(Equation 2.46)
where ζ is the ratio of the incident quantum energy to the remaining energy of the
target electron with which the quantum interacts, ξ is the angle of scattering, En =
hv’ is the energy of the scattered quantum, and v’ is the frequency of the scattered
quantum.
Having considered the factors that account for the attenuation of radiation, the total
value of the factor responsible for the attenuation can therefore be determined. This
is called the mass attenuation coefficient or the linear attenuation coefficient. This
coefficient is given as:
(Equation 2.47)

85
where μa is the true absorption coefficient caused by the photoelectric effect
(absorption), μc is the scattering coefficient for the coherent (Rayleigh) scattering, μn
is the scattering coefficient for the incoherent scattering167
. The schematic diagram
of computer tomography instrumentation is seen in Figure 2.12.
2.3.6.2 PARAMETERS USED
The processes involve capturing the images of the TPU composites and subsequently
reconstructing the captured images. Captured tomograms were analyzed with the
Avizo software. Several programs such as Orthoslice and Isosurface used to clearly
view the surface, cross-sectional and internal properties of the TPU composites.
Experiments were carried out on a X-Tek XT H 225 tomography machine.
2.3.7 RHEOMETRY
2.3.7.1 THEORETICAL ACCOUNT
Figure 2.13 Schematic representation of the squeeze-flow technique
Rheology can simply be defined as the flow and deformation of materials. In
rheology, the flow aspect of materials is more emphasized than the deformation
aspect.
Rheology measurements (eg. viscosity) are used to evaluate the flow of a substance
especially liquids but also for soft solids or solids under conditions in which they
melt-flow. Rheological measurements are carried out on materials that have a
86
complex structure and morphology such as polymers. The flow of materials cannot
be ascertained by a single value of viscosity at a particular temperature. Viscosity of
a material can be influenced by a range of factors such as increase in temperature
affects the viscosity of polymeric substances. There are two groups of liquids
according to their viscosities, namely (a) Newtonian and (b) Non-Newtonian liquids.
A Newtonian liquid is one whose viscosity changes with temperature and pressure
but is not affected by the rate of deformation or time. A Newtonian liquid does not
exhibit any elastic properties or extensional irregularities. Conversely, a Non-
Newtonian liquid is one whose viscosity is affected by the rate of deformation and
time. It exhibits elastic properties and extensional irregularities168-169
.
A squeeze-flow technique developed by Huntsman Polyurethanes (Figure 2.13) was
used for rheological measurements. The essence of the rheology measurement was to
determine the melt-flow of the TPU especially when it is used to make composites.
The melt flow of the polymer (matrix) into the fibre mats influences the nature of the
fibre/matrix interface.
2.3.7.2 PARAMETERS USED
The TPU films were cut into 2mm-thick discs and placed on the platens of the
rheometer. The TPUs were heated according to their melting temperature range. The
melting temperature range used for the TPUs is from 160°C to 270°C. The normal
force and shear stress used were 5N and 0.2Pa respectively. The ramp rate, %strain
and frequency values used were 3°C/min, 0.5 and 1Hz respectively. All experiments
were carried out on an AR 2000 Rheometer (TA instruments).
2.3.8 DYNAMIC MECHANICAL THERMAL ANALYSIS (DMTA)
2.3.8.1 THEORETICAL ACCOUNT
Dynamic mechanical thermal analysis (DMTA) measures molecular mobility in
polymers. DMTA determines the changes in mechanical properties (such as modulus
and damping) as a function of temperature and/or frequency. The technique depends
on applying a small sinusoidally changing stress on a material which consequently
varies the strain of the material. DMTA also gives information on the different
temperature transitions (glass transition temperatures) undergone by the materials
during the period of characterisation. The following are the properties measured by

87
DMTA instrument: (i) Storage modulus: E’ or G’, (ii) Loss modulus: E’’ or G’’ and
(iii) Damping factor: tan δ = (E’’/E’) or = (G’’/G’)
There are two methods of DMTA techniques namely: (a) Decay of free oscillations
and (b) Forced oscillations. Forced oscillation method is the most commonly used.
In this method, force is applied to the material and then allowed to vibrate after the
stress has been removed; hence the deformation of the sample is evaluated.
Deformation of the sample under stress makes it easy to measure the modulus
(stiffness) of the sample. By measuring the displacement in phase lag of the strain in
comparison to the applied force, the damping properties of the sample can be
ascertained. The damping is called tan delta and it is seen as the tangent of the phase
lag, which is an angle. The glass transition temperature (Tg) of the sample is seen on
the tan delta (tan δ) curve. This phase lag is shown in Figure 2.14.
Applied stress
Calculated Strain
δ
1.0s 1.5s 2.0s
Figure 2.14 Phase lag in displacement of strain in comparison to the applied stress
Depending on the nature of sample, there can be different responses to the sinusoidal
stress applied to the sample. For elastic samples, the stress and strain are in phase
and in this way, there is no energy loss. Tan δ is 0°. This is shown below in Figure
2.15.
Figure 2.15 Elastic deformation
Stress
Strain

88
Viscous materials have stress and strain totally out of phase and also energy is
completely lost. Tan δ is 90°. This is shown in Figure 2.16.
Stress Strain
Figure 2.16 Viscous deformation
Viscoelastic materials exhibit characteristics of both elastic and viscous materials
and as such some energy is reserved while some energy is lost. Tan δ is greater than
0° and less than 90° (0° < δ < 90°). This is shown in Figure 2.17.
Figure 2.17 Viscoelastic deformation
Dynamic mechanical parameters are described by the following equations;
Stress (σ) can be described mathematically as
(Equation 2.48)
where is the stress amplitude, is the cyclic frequency and is the time. The
mean stress for reversed loading in which the tensile and compressive amplitudes
are equal is zero. For a viscoelastic solid, there is a phase lag of strain behind the
stress. The resultant strain is
(Equation 2.49)
where is the strain amplitude and is the mean strain.
The dynamic mechanical features of a polymer are therefore explained in terms of a
complex dynamic modulus:
(Equation 2.50)
Stress Strain

89
where is known as the storage modulus and is a measure of the degree of
recoverable strain energy (elasticity of a material) and when the force applied is
small, it becomes approximately similar to Young’s modulus. is known as loss
modulus and it measures the degree of unrecoverable energy dissipation (viscous
property of a material). The phase angle ( ) is given by
(Equation 2.51)
The stiffness and the damping properties of a material can be explained by any two
of the quantities , and tan (the ‘loss’ tangent)156
.
DMTA is useful in determining the properties of viscoelastic materials such as
polymers. A material can be subjected to different mechanical tests using different
DMTA clamp designs. These various DMTA head designs are (a) Dual Cantilever
(b) Single Cantilever (c) Compression (d) Shear (e) Tension.
Although DSC is used for investigating the phase transitions of materials, DMTA is
a more sensitive technique and these phase transitions (Tgs) are easier to investigate.
Furthermore, DMTA is capable of evaluating weak transitions such as secondary
relaxations (sub-Tg transitions such as beta, gamma and delta relaxations). These
weak transitions are due to the rotation of branches of functional groups and the re-
ordering of crystalline regions53, 156-157, 170
.
2.3.8.2 PARAMETERS USED
In this research, the properties of the samples were measured using dual
cantilever clamp method. It is a flexural test which involves a fixed clamping of both
ends of a sample whereas the midpoint of the sample is oscillated under stress as the
temperature of sample is changed over time. Schematic diagram of dual cantilever
method is shown in Figure 2.18.
Composite material
Figure 2.18 Schematic diagram of dual cantilever DMTA method

90
The properties of different TPU, PP and Isoplast composites were measured. Firstly,
a rectangular shape of the sample was cut. The length, width and thickness of the
samples were 35mm, 12.8mm and 2mm repectively. Amplitude and frequency used
for the measurements were 10 microns and 1Hz respectively. The ramp rate was 3°
C/min. The start to final temperatures used was -100 to 170° C. The instrument used
was a DMA Q800 (TA Instruments).
2.3.9 TENSILE TESTING
2.3.9.1 PARAMETERS USED
The composite samples measured were cut in rectangular strips. The original
dimensions of the composite samples used for the tensile testing are 150 mm in
length and 12 mm in width. Composite tabs (with dimensions of 40 mm in length
and 12 mm in width) were glued to the composite ends. The final dimensions of the
composite sample used are as follows: the gauge length of the composite sample was
70 mm and the width; 12 mm. The test extension rate of the tensile testing was
2mm/min. The load cell was 25kN and an MTS 634.31F-24 extensometer set at
20mm gauge length was used. All experiments were carried out on an Instron 5569
at room temperature. BlueHill 2 software was used to run and analyze the composite
samples.
2.3.10 CREEP TESTING
2.3.10.1 THEORETICAL ACCOUNT
Creep is a time-dependent mechanical property and is a measure of deformation
undergone by a polymer subjected to constant stress. In creep tests, polymers exhibit
large strains and their response is non-linear. If the stress is held over a period of
time, the strain increases and consequently creep sets in. The shortcoming of creep is
that the modulus of the material also decreases during the period of time the load is
applied, i.e. stress, σ is directly proportional strain, ε. This can be mathematically
written as follows:
(Equation 2.52)
where E is Young’s modulus. Since ε is not consistent with constant σ, E also varies
and E in this case is known as creep modulus. Figure 2.19 shows a diagram
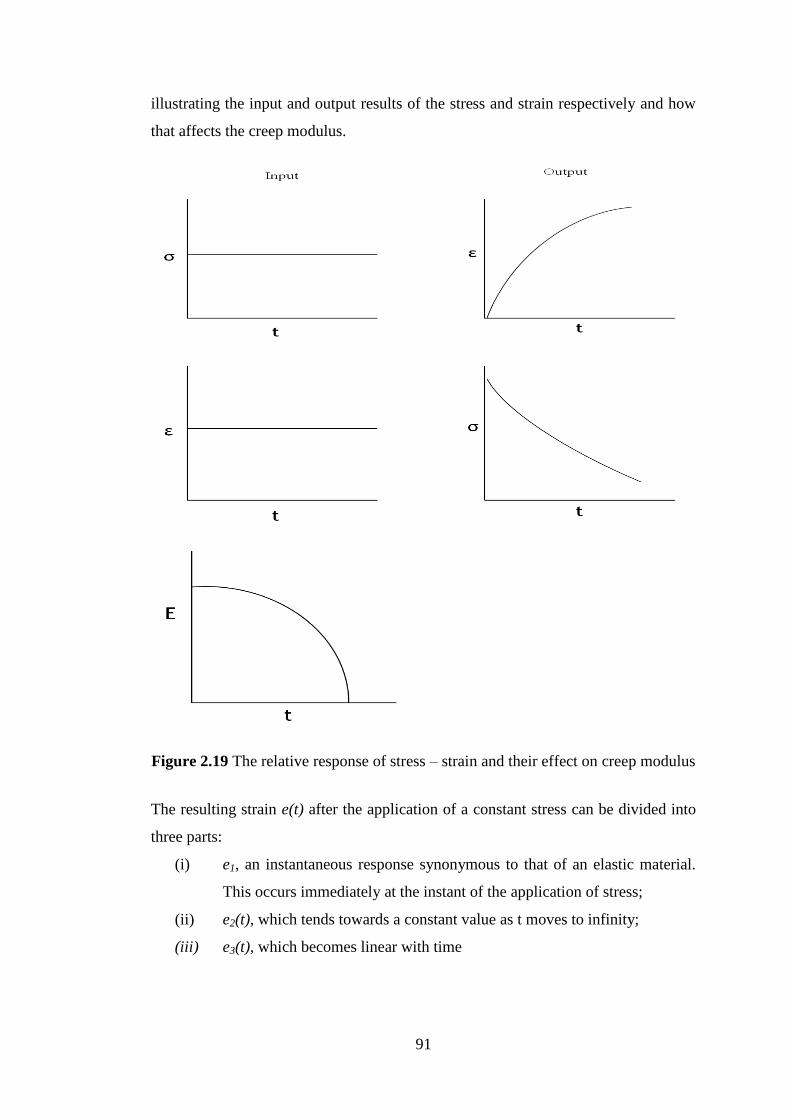
91
illustrating the input and output results of the stress and strain respectively and how
that affects the creep modulus.
Figure 2.19 The relative response of stress – strain and their effect on creep modulus
The resulting strain e(t) after the application of a constant stress can be divided into
three parts:
(i) e1, an instantaneous response synonymous to that of an elastic material.
This occurs immediately at the instant of the application of stress;
(ii) e2(t), which tends towards a constant value as t moves to infinity;
(iii) e3(t), which becomes linear with time

92
The representation of the aforementioned parts of strain under constant stress can be
seen Figure 2.20.
Figure 2.20 Creep diagram showing the three parts of strain responses of a material
under constant stress
From Figure 2.20, if we assume that the creep process is linear; that is to say, each
part of the strain is proportional to the constant stress applied, a time-dependent
creep compliance J(t) can be defined as
(Equation 2.53)
The Boltzmann superposition principle explains that the strain observed at any
particular time in a viscoelastic system is dependent on the stress history of that
viscoelastic system to that time. This principle also assumes that every change in
stress makes an individual contribution to the strain at any particular time and these
individual contributions sum up the total strain observed on the sample53, 80-81, 160, 171-
172. The equation of the total strain can be seen as follows:
(Equation 2.54)
2.3.10.2 PARAMETERS USED
The composite samples measured had length and width specifications of 50mm and
12mm respectively. A 3-point bending clamp was used. Different duration of creep
measurements was also employed. All samples were carried out isothermally at
25°C. All experiments were carried out on a DMA Q800 (TA Instruments). The
93
stress applied for all the samples was 10MPa. The sample was loaded for 20 minutes
and the recovery time was 20 minutes.
2.3.11 OPTICAL MICROSCOPY
In this research work, the reason for the use of the optical microscopy technique was
to evaluate the interfacial properties of the TPU composite. The mechanical
properties of a composite material are dependent on its fibre/matrix interfacial
bonding. This technique therefore reveals the adhesion and wettability of the fibre by
the matrix. The optical microscope also enables us to see the defects and voids that
might be present in the composite material. These defects and voids could adversely
affect the properties of the composite material.
2.3.11.1 PARAMETERS USED
Prior to use of the optical microscope, the TPU composite was first embedded in a
Kleerset polyester resin and allowed to cure overnight. The composite sample was
then ground on silicon carbide sheets with specifications of P240, P400, P800 and
P1200. The composite sample was then later diamond-polished with grit
specifications of 6μm, 1μm, 1/4μm and the final polishing was on 0.04μm with
colloidal silica. Micrographs were captured on Olympus BH-2-reflected light
compound-microscope with a Zeiss MRm digital camera.
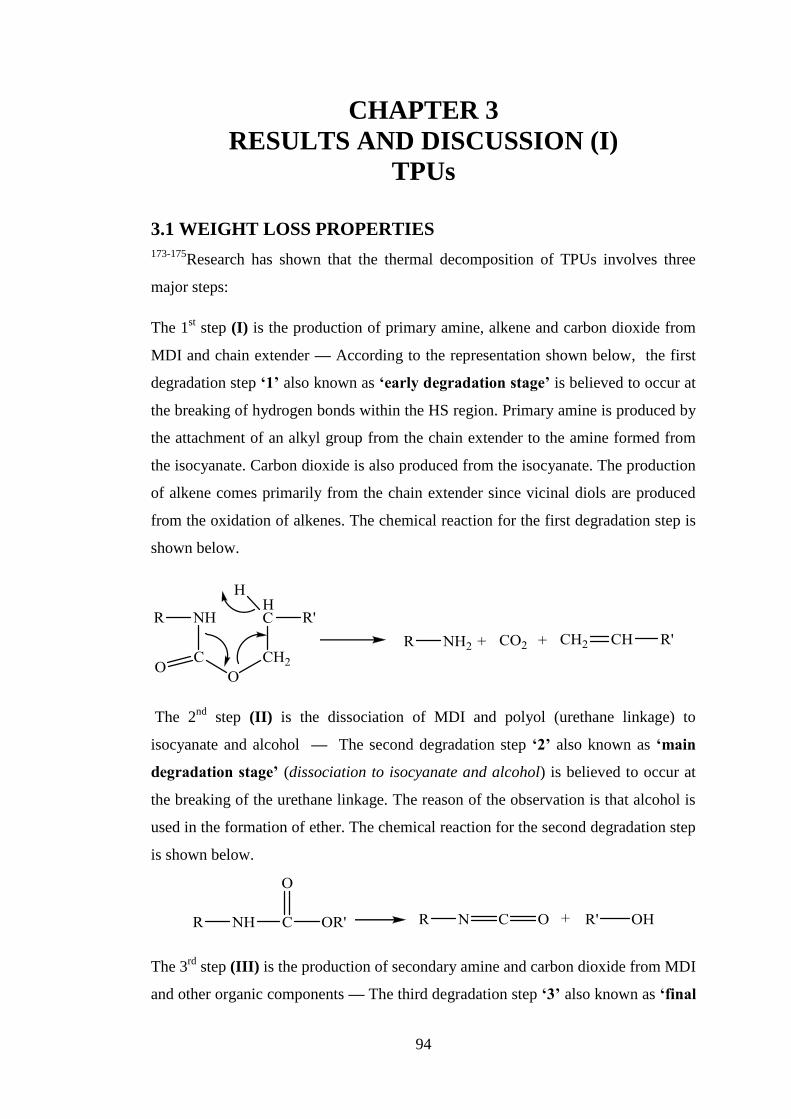
94
CHAPTER 3
RESULTS AND DISCUSSION (I)
TPUs
3.1 WEIGHT LOSS PROPERTIES
173-175Research has shown that the thermal decomposition of TPUs involves three
major steps:
The 1st step (I) is the production of primary amine, alkene and carbon dioxide from
MDI and chain extender — According to the representation shown below, the first
degradation step ‘1’ also known as ‘early degradation stage’ is believed to occur at
the breaking of hydrogen bonds within the HS region. Primary amine is produced by
the attachment of an alkyl group from the chain extender to the amine formed from
the isocyanate. Carbon dioxide is also produced from the isocyanate. The production
of alkene comes primarily from the chain extender since vicinal diols are produced
from the oxidation of alkenes. The chemical reaction for the first degradation step is
shown below.
The 2nd
step (II) is the dissociation of MDI and polyol (urethane linkage) to
isocyanate and alcohol — The second degradation step ‘2’ also known as ‘main
degradation stage’ (dissociation to isocyanate and alcohol) is believed to occur at
the breaking of the urethane linkage. The reason of the observation is that alcohol is
used in the formation of ether. The chemical reaction for the second degradation step
is shown below.
The 3rd
step (III) is the production of secondary amine and carbon dioxide from MDI
and other organic components — The third degradation step ‘3’ also known as ‘final

95
degradation stage’ (production of secondary amine and carbon dioxide) comes
primarily from the further combustion of isocyanate and other organic matters which
leads to the production of secondary amine and carbon dioxide. Char is also
produced after the evolution of volatile gases from the TPU in the final combustion
stages176-177
. The chemical reaction for the third degradation step is shown below
A representation illustrating the dissociation of TPU constituents is shown below.
MDI CE MDI PolyolCEMDIPolyol **
where MDI = Isocyanate, CE = Chain extender
The full elucidation of the degradation process of the polymers synthesized for this
work is beyond the scope of this thesis. TGA was used to assess the stability of the
samples and measure the onset of thermal degradation to inform the development of
processing protocols of these materials as will be addressed later. Figure 3.1 shows
the weight loss profiles of TPU constituents namely: MDI, polyol and chain
extenders (12ed, 14bd, 14chdm, 2m13pd, 15pd, 16hd, 17hpd and 18od).
0 200 400 600 800 1000
-20
0
20
40
60
80
100
Wei
ght (
%)
Temperature (ºC)
MDI
Polyol
12ed
14bd
14chdm
2m13pd
15pd
16hd
17hpd
18od
Figure 3.1 Weight losses of TPU constituents
2 1 3
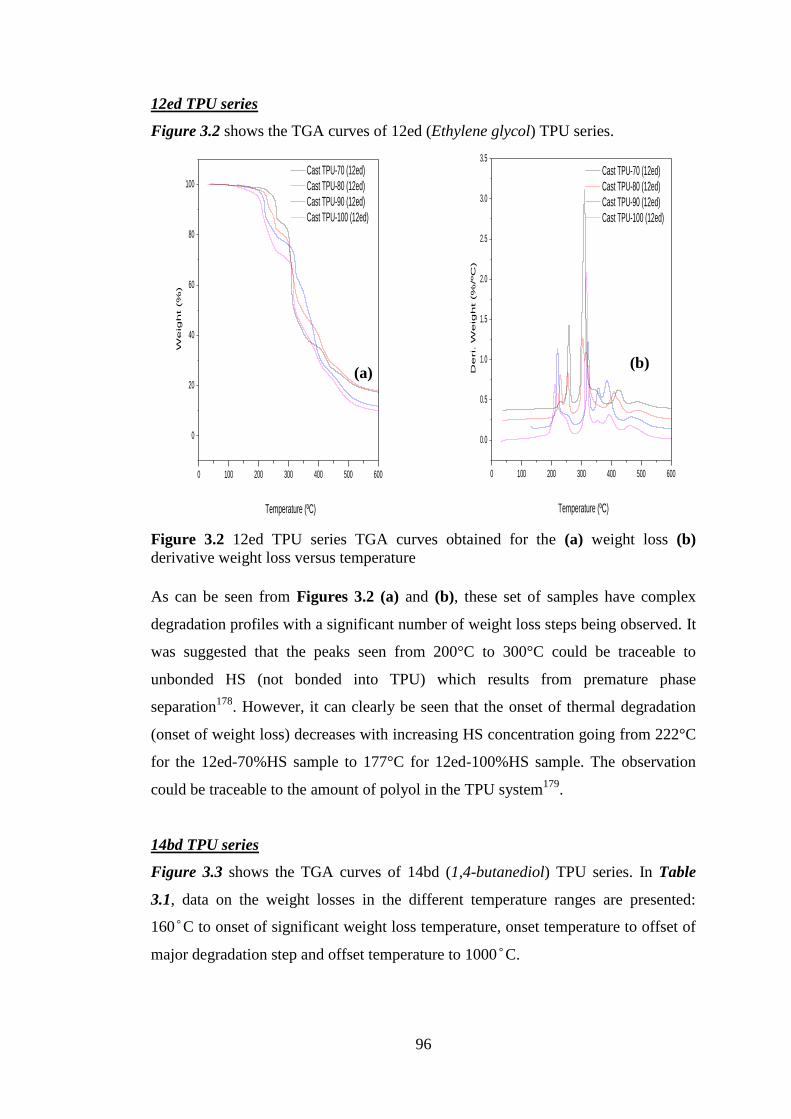
96
12ed TPU series
Figure 3.2 shows the TGA curves of 12ed (Ethylene glycol) TPU series.
Figure 3.2 12ed TPU series TGA curves obtained for the (a) weight loss (b)
derivative weight loss versus temperature
As can be seen from Figures 3.2 (a) and (b), these set of samples have complex
degradation profiles with a significant number of weight loss steps being observed. It
was suggested that the peaks seen from 200°C to 300°C could be traceable to
unbonded HS (not bonded into TPU) which results from premature phase
separation178
. However, it can clearly be seen that the onset of thermal degradation
(onset of weight loss) decreases with increasing HS concentration going from 222°C
for the 12ed-70%HS sample to 177°C for 12ed-100%HS sample. The observation
could be traceable to the amount of polyol in the TPU system179
.
14bd TPU series
Figure 3.3 shows the TGA curves of 14bd (1,4-butanediol) TPU series. In Table
3.1, data on the weight losses in the different temperature ranges are presented:
160°C to onset of significant weight loss temperature, onset temperature to offset of
major degradation step and offset temperature to 1000°C.
0 100 200 300 400 500 600
0
20
40
60
80
100
Cast TPU-70 (12ed)
Cast TPU-80 (12ed)
Cast TPU-90 (12ed)
Cast TPU-100 (12ed)
We
igh
t (%
)
Temperature (ºC)
0 100 200 300 400 500 600
0.0
0.5
1.0
1.5
2.0
2.5
3.0
3.5
Cast TPU-70 (12ed)
Cast TPU-80 (12ed)
Cast TPU-90 (12ed)
Cast TPU-100 (12ed)
De
ri. W
eig
ht (%
/ºC
)
Temperature (ºC)
(b) (a)

97
Figure 3.3 14bd TPU series TGA curves obtained for the (a) weight loss (b)
derivative weight loss versus temperature
Table 3.1: Weight losses of 14bd TPUs
Casted
TPUs
Weight loss
T(onset)/˚C
Region I
(160˚C-288˚C)
%Weight loss
Region II
(288˚C-329˚C)
%Weight loss
Region III
(329˚C-1000˚C)
%Weight loss
14bd-70 288±0.74 1 63 36
14bd-80 253±0.78 4 54 40
14bd-90 146±0.05 6 44 50
14bd-100 174±0.28 12 46 42
Figure 3.3 shows that the 14bd TPUs are more thermally stable than the 12ed TPUs.
The 14bd-100%HS TPU was seen to have the highest weight loss (12%) within the
temperature range of 160°C and 288°C. The above observation is due to the early
degradation of the HS as earlier discussed. From Figure 3.1, it can be observed that
the main degradation of MDI and 14bd occurred at temperatures of 179°C and
171°C respectively. These temperatures are similar to the onset of thermal
degradation (T(onset)) of 14bd-100%HS TPU reported to be at 174°C as shown in
Table 3.1. Remarkably pronounced in Figure 3.3 (a) is the thermal stability of
0 100 200 300 400 500 600
0
2
4
6
8
10
12 Cast TPU-70 (14bd)
Cast TPU-80 (14bd)
Cast TPU-90 (14bd)
Cast TPU-100 (14bd)
De
ri. W
eig
ht (%
/ºC
)Temperature (ºC)
0 100 200 300 400 500 600
0
20
40
60
80
100
Cast TPU-70 (14bd)
Cast TPU-80 (14bd)
Cast TPU-90 (14bd)
Cast TPU-100 (14bd)
We
igh
t (%
)
Temperature (ºC)
(a)
(b)
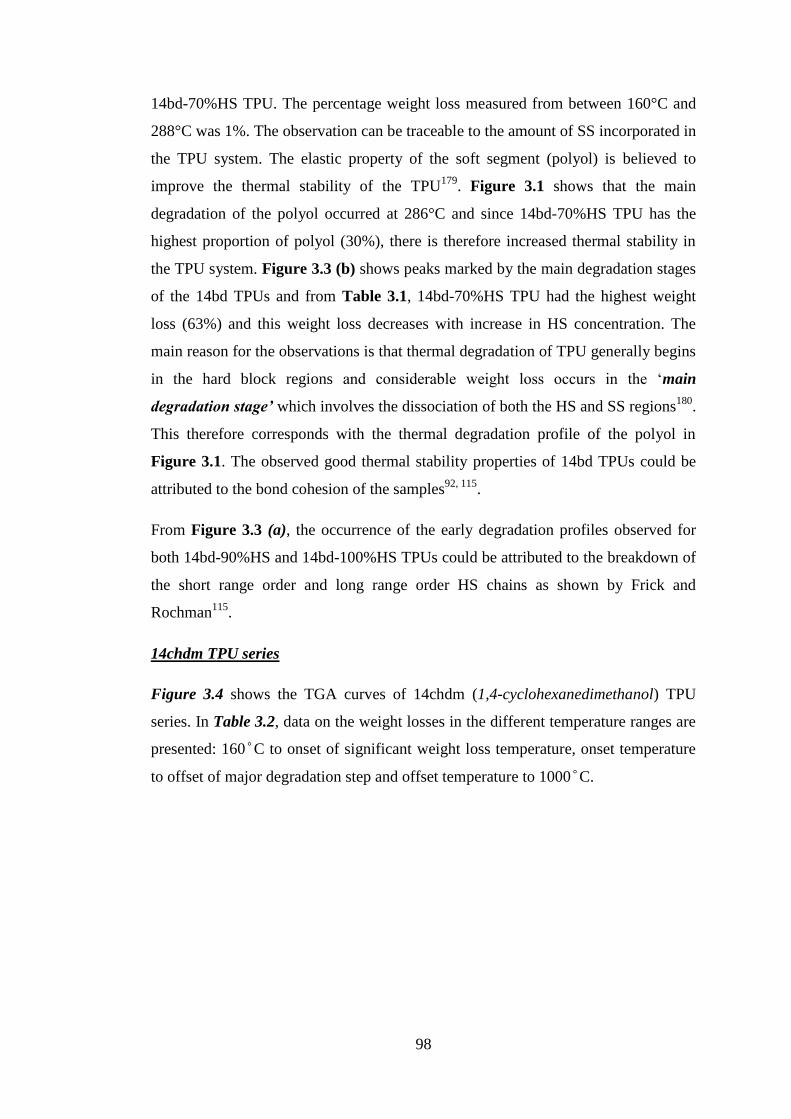
98
14bd-70%HS TPU. The percentage weight loss measured from between 160°C and
288°C was 1%. The observation can be traceable to the amount of SS incorporated in
the TPU system. The elastic property of the soft segment (polyol) is believed to
improve the thermal stability of the TPU179
. Figure 3.1 shows that the main
degradation of the polyol occurred at 286°C and since 14bd-70%HS TPU has the
highest proportion of polyol (30%), there is therefore increased thermal stability in
the TPU system. Figure 3.3 (b) shows peaks marked by the main degradation stages
of the 14bd TPUs and from Table 3.1, 14bd-70%HS TPU had the highest weight
loss (63%) and this weight loss decreases with increase in HS concentration. The
main reason for the observations is that thermal degradation of TPU generally begins
in the hard block regions and considerable weight loss occurs in the ‘main
degradation stage’ which involves the dissociation of both the HS and SS regions180
.
This therefore corresponds with the thermal degradation profile of the polyol in
Figure 3.1. The observed good thermal stability properties of 14bd TPUs could be
attributed to the bond cohesion of the samples92, 115
.
From Figure 3.3 (a), the occurrence of the early degradation profiles observed for
both 14bd-90%HS and 14bd-100%HS TPUs could be attributed to the breakdown of
the short range order and long range order HS chains as shown by Frick and
Rochman115
.
14chdm TPU series
Figure 3.4 shows the TGA curves of 14chdm (1,4-cyclohexanedimethanol) TPU
series. In Table 3.2, data on the weight losses in the different temperature ranges are
presented: 160°C to onset of significant weight loss temperature, onset temperature
to offset of major degradation step and offset temperature to 1000°C.

99
0 200 400 600
0
20
40
60
80
100
We
igh
t (%
)
Temperature (ºC)
Cast TPU-70 (14chdm)
Cast TPU-80 (14chdm)
Cast TPU-90 (14chdm)
Cast TPU-100 (14chdm)
Figure 3.4 14chdm TPU series TGA curves obtained for the (a) weight loss (b)
derivative weight loss versus temperature
Table 3.2: Weight losses of 14chdm TPUs
Casted
TPUs
Weight loss
T(onset)/˚C
Region I
(160˚C- 290˚C)
% Weight loss
Region II
(290˚C-345˚C)
% Weight loss
Region III
(345˚C-1000˚C)
% Weight loss
14chdm-70
198±0.36 7 59 34
14chdm-80
148±0.02 16 43 41
14chdm-90
149±0.11 18 35 47
14chdm-100 158±0.69 24 0 0
From Figure 3.4, the 14chdm TPUs generally showed very low thermal stability.
The percentage weight loss of 14chdm-100%HS between 160°C and 290°C was
measured to be 24%. 14chdm-70%HS TPU showed the lowest thermal degradation
(7% weight loss) between 160°C and 290°C. However, 14chdm-70%HS TPU had
the highest weight loss (59%) in the main degradation stage (290˚C - 345˚C) which
is mainly characterized by the degradation of the soft blocks as seen in Table 3.2.
(b) (a)
0 100 200 300 400 500 600
-10
0
10
20
30
40
50
Cast TPU-70 (14chdm)
Cast TPU-80 (14chdm)
Cast TPU-90 (14chdm)
Cast TPU-100 (14chdm)
De
ri. W
eig
ht (%
/ºC
)
Temperature (ºC)

100
One of the reasons for the observations could be traceable to the tacky nature of the
TPU samples arising from the molecular architecture of the chain extender.
2m13pd TPU series
0 200 400 600
-20
0
20
40
60
80
100
We
igh
t (%
)
Temperature (ºC)
Cast TPU-70 (2m13pd)
Cast TPU-80 (2m13pd)
Cast TPU-90 (2m13pd)
Cast TPU-100 (2m13pd)
Figure 3.5 2m13pd TPU series with hard segment concentrations (a) weight loss (b)
derivative weight loss as a function of temperature
Figure 3.5 shows the TGA curves of 2m13pd (2-methyl-1,3-propanediol) TPU
series. In Table 3.3, data on the weight losses in the different temperature ranges are
presented: 160°C to onset of significant weight loss temperature, onset temperature
to offset of major degradation step and offset temperature to 1000°C.
Table 3.3: Weight losses of 2m13pd TPUs
Casted TPUs
Weight loss
T(onset)/˚C
Region I
(160˚C-270˚C)
% Weight loss
Region II
(270˚C-311˚C)
% Weight loss
Region III
(311˚C-1000˚C)
% Weight loss
2m13pd -70
216±0.96 4 41 55
2m13pd -80
153±0.35 5 39 56
2m13pd -90
128±0.73 9 32 59
2m13pd -100
145±0.92 14 0 0
0 100 200 300 400 500 600
0
10
20
30
40
50
Cast TPU-70 (2m13pd)
Cast TPU-80 (2m13pd)
Cast TPU-90 (2m13pd)
Cast TPU-100 (2m13pd)
De
ri. W
eig
ht (%
/ºC
)
Temperature (ºC)
(b)
(a)

101
In Figure 3.5, 2m13pd TPUs show similar degradation trend as 14chdm TPUs
discussed earlier except that the 2m13pd TPUs have better thermal stability
properties. Table 3.3 showed that from the temperature range of 160˚C to 270˚C, the
% weight losses of TPUs increased with increase in HS aggregation. Like the
14chdm TPUs, the 2m13pd TPUs are tacky as well due to the chemical structure of
the 2m13pd chain extender. The branched structure of the 2m13pd extender does not
allow easy packing of the polymer chains as the methyl (–CH3–) pendant group
distorts the crystallization of the polymer chains and also imparts flexibility on the
polymer chains181-182
.
It can also be suggested that from the above observations, the TPU samples (2m13pd
and 14chdm) are likely to still have residual solvent in them after the casting process
and therefore due to the tacky nature of the samples (especially the 80%, 90% and
100%HS samples), there is more likelihood for the samples to retain the solvent. The
boiling point of the solvent (DMAc) used in the synthesis of the TPUs is 165°C and
the entrapment of the solvent within the polymer will impart low thermal stability
properties of the polymer.
15pd, 16hd, 17hpd and 18od TPU series
Figure 3.6 shows the weight losses of 15pd (1,5-pentanediol), 16hd (1,6-
hexanediol), 17hpd (1,7-heptanediol) and 18od (1,8-octanediol) TPU series having
different HS concentrations (70%, 80%, 90% and 100%HS) whereas Table 3.4
shows a full data on the weight losses of 15pd, 16hd, 17hpd and 18od TPUs.
0 100 200 300 400 500 600
0
2
4
6
8
10
Cast TPU-70 (15pd)
Cast TPU-80 (15pd)
Cast TPU-90 (15pd)
Cast TPU-100 (15pd)
De
ri. W
eig
ht (%
/ºC
)
Temperature (ºC)
0 100 200 300 400 500 600
0
20
40
60
80
100
Cast TPU-70 (15pd)
Cast TPU-80 (15pd)
Cast TPU-90 (15pd)
Cast TPU-100 (15pd)
We
igh
t (%
)
Temperature (ºC)
(b)
(a) I.
102
0 100 200 300 400 500 600
0
20
40
60
80
100
Cast TPU-70 (16hd)
Cast TPU-80 (16hd)
Cast TPU-90 (16hd)
Cast TPU-100 (16hd)
We
igh
t (%
)
Temperature (ºC)
0 200 400 600
0
2
4
6
8
10
12
Cast TPU-70 (16hd)
Cast TPU-80 (16hd)
Cast TPU-90 (16hd)
Cast TPU-100 (16hd)
De
ri. W
eig
ht (%
/ºC
)
Temperature (ºC)
(b)
(a)
0 100 200 300 400 500 600
0
2
4
6
8
10
Cast TPU-70 (17hpd)
Cast TPU-100 (17hpd)
De
ri. W
eig
ht (%
/ºC
)
Temperature (ºC)
0 100 200 300 400 500 600
0
20
40
60
80
100
Cast TPU-70 (17hpd)
Cast TPU-100 (17hpd)
We
igh
t (%
)
Temperature (ºC)
(b)
(a)
II.
III.

103
Figure 3.6 (a) Weight losses (b) Derivative weight losses as a function of
temperature of (I) 15pd TPUs, (II) 16hd TPUs, (III) 17hpd TPUs and (IV) 18od
TPUs
Table 3.4: Weight losses of 15pd, 16hd, 17hpd and 18od TPUs
Casted TPUs
Weight loss
T(onset)/˚C
Region I
(160˚C - 300˚C)
% Weight loss
Region II
(300˚C - 346˚C)
% Weight loss
Region III
(346˚C-1000˚C)
% Weight loss 15pd-70
300±0.91 2 63 35
15pd-80
240±0.31 6 48 46
15pd-90
185±0.93 10 49 41
15pd-100
164±0.96 14 53 33
16hd-70
281±0.97 4 66 30
16hd-80
237±0.69 5 49 46
16hd-90
220±0.37 8 46 46
16hd-100
138±0.80 9 51 40
17hpd-70
292±0.36 2 71 27
17hpd-100
177±0.38 10 55 35
18od-70
300±0.91 2 66 32
18od-100
159±0.78 8 66 26
0 100 200 300 400 500 600
0
20
40
60
80
100
Cast TPU-70 (18od)
Cast TPU-100 (18od)
We
igh
t (%
)
Temperature (ºC)
0 100 200 300 400 500 600
-2
0
2
4
6
8
10
12
14 Cast TPU-70 (18od)
Cast TPU-100 (18od)
De
ri. W
eig
ht (%
/ºC
)
Temperature (ºC)
(b)
(a)
IV.

104
In Figure 3.6, the weight loss TGA curves of 15pd, 16hd, 17hpd and 18od TPUs are
alike and follow a similar trend to the 14bd TPUs discussed earlier. These set of
TPUs are generally stable within the temperature region of 160°C to 300°C. The
thermal stability of these samples could be attributed to the linearity of the chain
extenders and hence, there is better packing of the HS chains for crystallization. The
100% samples have the highest % weight losses in the early degradation stages
(160˚C - 300˚C) whereas the 70%HS TPUs have the highest % weight losses in the
main degradation stages (300˚C - 346˚C) of TPU. The reason for the high % weight
losses of the 70%HS TPUs is due to the degradation of the SS which occur primarily
at the main degradation stages of the TPU as earlier shown in Figure 3.1.
The reason for the high % weight losses of the 100%HS TPUs at early degradation
stages could be seen in the DSC melting endothermic transitions of the samples
which will be discussed later in this chapter. The 100%HS TPUs were seen to have
the lowest melting temperatures and this is ultimately due to the absence of the SS.
The melting transitions of TPUs involve the melting of both the HS and SS
(Microphase Mixing Temperature) as shown in studies carried out by Saiani et al 58-
60.
From the TGA results discussed, we can observe that the 70%HS samples of all the
different chain-extended TPUs showed the highest thermal stability whereas the
100% HS samples showed the least. The reason was due to the thermal stability of
the polyether based polyol as confirmed by the TGA result of the polyol (see Figure
3.1). However, the linear chain-extended TPUs (12ed, 14bd, 15pd, 16hd, 17hpd and
18od TPUs) showed better overall thermal stability properties than non linear chain-
extended TPUs (2m13pd TPUs) and cyclic chain-extended TPUs (14chdm TPUs).
The reason was due to the higher degree of crystallinity of the linear chain-extended
TPUs as well as the chemical structures of the linear chain extenders.
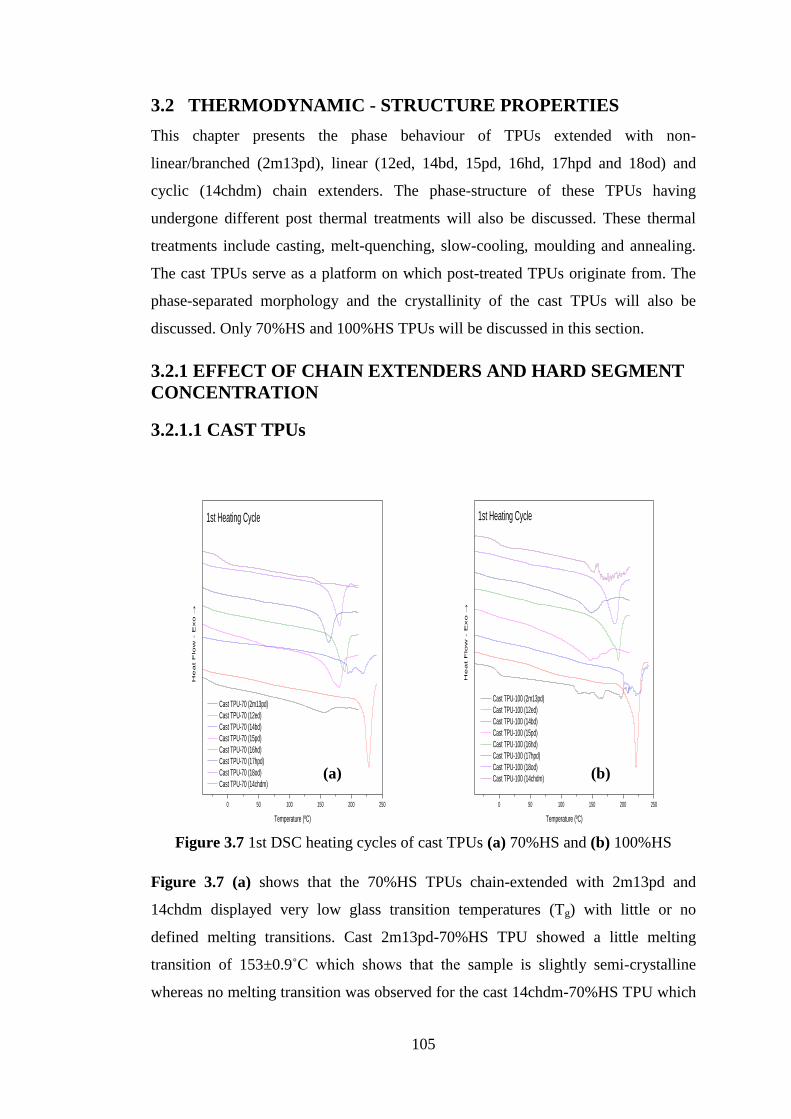
105
3.2 THERMODYNAMIC - STRUCTURE PROPERTIES
This chapter presents the phase behaviour of TPUs extended with non-
linear/branched (2m13pd), linear (12ed, 14bd, 15pd, 16hd, 17hpd and 18od) and
cyclic (14chdm) chain extenders. The phase-structure of these TPUs having
undergone different post thermal treatments will also be discussed. These thermal
treatments include casting, melt-quenching, slow-cooling, moulding and annealing.
The cast TPUs serve as a platform on which post-treated TPUs originate from. The
phase-separated morphology and the crystallinity of the cast TPUs will also be
discussed. Only 70%HS and 100%HS TPUs will be discussed in this section.
3.2.1 EFFECT OF CHAIN EXTENDERS AND HARD SEGMENT
CONCENTRATION
3.2.1.1 CAST TPUs
0 50 100 150 200 250
1st Heating Cycle
He
at F
low
- E
xo
Cast TPU-70 (2m13pd)
Cast TPU-70 (12ed)
Cast TPU-70 (14bd)
Cast TPU-70 (15pd)
Cast TPU-70 (16hd)
Cast TPU-70 (17hpd)
Cast TPU-70 (18od)
Cast TPU-70 (14chdm)
Temperature (ºC)
0 50 100 150 200 250
1st Heating Cycle
He
at F
low
- E
xo
Cast TPU-100 (2m13pd)
Cast TPU-100 (12ed)
Cast TPU-100 (14bd)
Cast TPU-100 (15pd)
Cast TPU-100 (16hd)
Cast TPU-100 (17hpd)
Cast TPU-100 (18od)
Cast TPU-100 (14chdm)
Temperature (ºC)
Figure 3.7 1st DSC heating cycles of cast TPUs (a) 70%HS and (b) 100%HS
Figure 3.7 (a) shows that the 70%HS TPUs chain-extended with 2m13pd and
14chdm displayed very low glass transition temperatures (Tg) with little or no
defined melting transitions. Cast 2m13pd-70%HS TPU showed a little melting
transition of 153±0.9˚C which shows that the sample is slightly semi-crystalline
whereas no melting transition was observed for the cast 14chdm-70%HS TPU which
(b) (a)

106
reveals that the sample is non-crystalline. The amorphous nature of the 14chdm TPU
samples could be attributed to the mixture of cis- and trans- geometric isomers
present in the 1,4-cyclohexanedimethanol chain extender. Non-crystallinity of the
TPUs could arise due to irregularities in the polymer chain arrangements183
. Also,
the presence of cyclohexane (bulky group) can restrict the mobility of the HS leading
to poor chain arrangement in the TPUs.
For the linear chain-extended TPUs, a similar thermodynamic trend was observed.
All samples showed melting transitions and these suggest that the samples are semi-
crystalline. No Tg was observed for these sets of TPUs. However, the melting
transitions observed for the 70%HS TPUs are referred to as microphase mixing
transition (TMMT) and is assigned to the mixing of the HS and SS. Pronounced is the
high melting transitions and melting enthalpies (ΔHTot) seen for the cast 12ed-
70%HS and 14bd-70%HS TPUs. These sets of samples have high crystallinity and
therefore melted at 220°C which is above the melting temperature of TPUs generally
observed in this research work. 14bd TPUs have been reported in several literatures
to have high crystallinity92, 112, 115, 184
. Melting temperatures of 14bd TPUs above
220°C were reported to coincide with the onset degradation temperatures of TPUs58
.
High crystallinity of the samples was confirmed by the high enthalpy values
associated with the melting transitions. It was also observed that the cast 12ed-
70%HS TPU displayed sharp, single melting peak. The observation is attributed to
the existence of a single crystalline structure in the polymer chains94, 125
.
Similar trend was observed for 70%HS cast TPUs chain-extended with 15pd, 16hd,
17hpd and 18od. The TMMT values of 70% cast TPUs chain-extended with 15pd,
16hd, 17hpd and 18od are 180±0.3, 190±0.5, 164±0.5 and 182±0.5°C. The TMMT
values show that the even-numbered chain-extended TPUs have higher melting
transitions than the odd-numbered chain extended TPUs. This observation could be
linked to the odd-even effect of odd-numbered and even-numbered diols (chain
extenders) used in the syntheses of TPUs as reported by several authors94-102
. The
odd-even effect was first reported for nylons which explain the formation of
hydrogen bonds based on the alignment of polymeric chains185-192
.
Fernandez et al95
reported on a characteristic zig-zag plot depicting odd-even effect
as the even-numbered diol-TPUs have higher melting transitions than their

107
immediate odd-numbered diol-TPUs. The reason for their observation is as a result
of the arrangement of the polymeric chains. The odd-numbered diol-TPUs were
reported to have hydrogen bonds arranged in either parallel or anti-parallel
configuration whereas the even-numbered diol-TPUs only take up anti-parallel
configuration (see Figures 1.10 and 1.11). The different arrangements of both the
odd- and even-numbered TPU systems therefore provide different crystal structure
and packing which ultimately imparts their melting transitions. Their characteristic
zig-zag plot of odd-even effect corresponds to our observation. The zig-zag plot of
the TMMT values of the 70%HS cast TPUs chain-extended with 15pd, 16hd, 17hpd
and 18od is shown in Figure 3.7 (c).
5 6 7 8
160
165
170
175
180
185
190
Mic
rop
ha
se M
ixin
g T
em
pe
ratu
re (C
)
Number of methylene units, n
Figure 3.7 (c) Microphase mixing temperature versus number of methylene units
In Figure 3.7 (b), the melting transitions of all the 100%HS TPUs are referred to as
melting of the HS (TM). Tgs and irregularities in melting transitions were observed
for the cast 2m13pd-100%HS and 14chdm-100%HS TPUs. The low Tgs observed for
these 100%HS samples means that the Tg has not arisen from to the soft segment
because the 100%HS TPUs contain no soft segment. The reason for this observation
is likely due to the presence of residual solvents in the samples. As a result of this,
these samples after the casting process were tacky. This observation can be
supported by the TGA results shown in Figures 3.4 and 3.5. TGA results of the cast
2m13pd and 14chdm TPUs showed early weight loss especially for the 100%HS
(c)

108
samples. The early weight loss was primarily due to solvent evaporation. The %
weight loss values of the cast 2m13pd-100%HS and 14chdm-100%HS TPUs were
14% and 23% respectively. The % weight loss (solvent evaporation) was seen to
decrease with decrease in HS concentration. It is therefore observed that more
solvent was retained in TPUs with higher HS concentration due to the increasing
amount of the HS. It can therefore be suggested that the irregularities in the melting
transitions could be attributed to the evaporation of the solvent in the TPU samples
(since the boiling point of DMAc is 165°C).
For the linear chain-extended TPUs (especially 15pd, 16hd, 17hpd and 18od), the
melting transitions of the 100%HS TPUs were observed to be lower than those of the
70%HS TPUs. The reason is that whereas TMMT for the 70%HS TPUs is assigned to
the mixing of the HS and SS whereas TM for the 100%HS TPUs is assigned to only
the HS. The low melting temperatures of the 100%HS TPUs is therefore due to the
absence of SS in the TPU structure. The odd-even effect in terms of melting
temperatures was also observed for the 100%HS TPUs.
1 2
0
380
760
1140
1520
1900
Cast TPU-70 (2m13pd)
Cast TPU-70 (12ed)
Cast TPU-70 (14bd)
Cast TPU-70 (15pd)
Cast TPU-70 (16hd)
Cast TPU-70 (17hpd)
Cast TPU-70 (18od)
Cast TPU-70 (14chdm)
I (a
.u
)
q (nm-1)
1 2
160
320
480
640
800
Cast TPU-100 (2m13pd)
Cast TPU-100 (12ed)
Cast TPU-100 (14bd)
Cast TPU-100 (15pd)
Cast TPU-100 (16hd)
Cast TPU-100 (17hpd)
Cast TPU-100 (18od)
Cast TPU-100 (14chdm)
I (a
.u
)
q (nm-1)
Figure 3.7 SAXS of cast TPUs (d) 70%HS and (e) 100%HS
Phase separation was observed for most of the 70%HS TPUs as seen in Figure 3.7
(d). Phase separation was observed as scattering peaks and the scattering maxima lie
(e) (d)
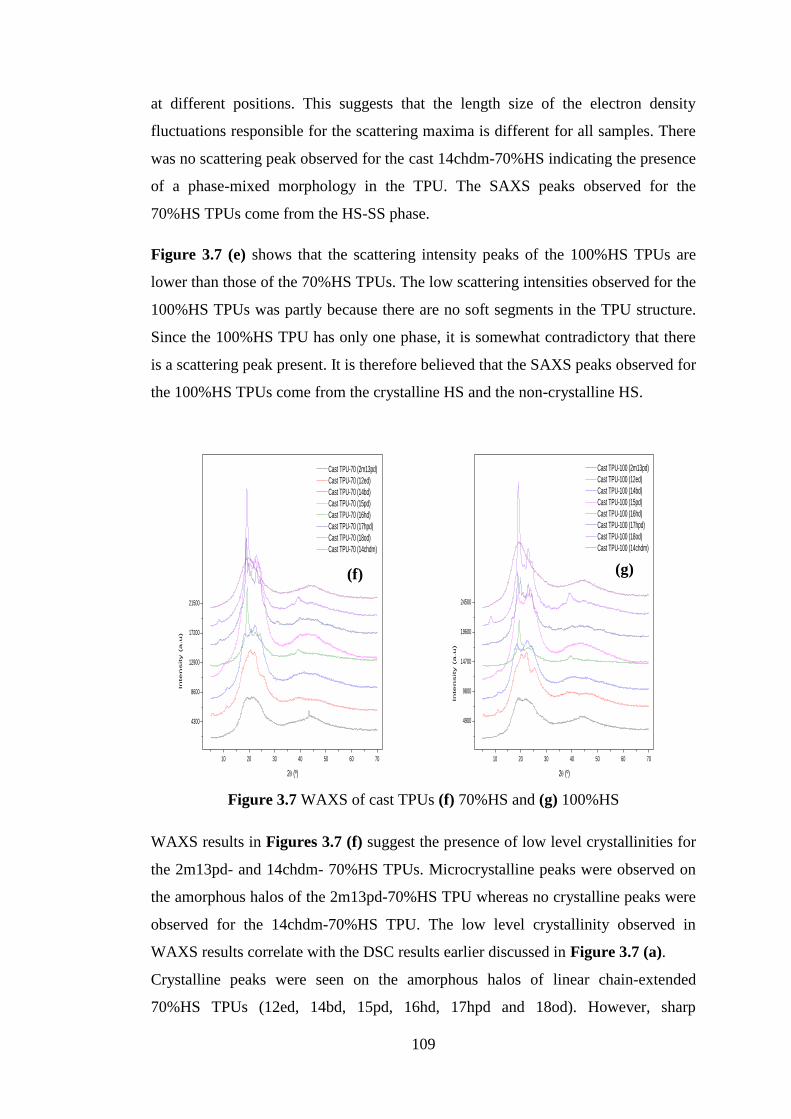
109
at different positions. This suggests that the length size of the electron density
fluctuations responsible for the scattering maxima is different for all samples. There
was no scattering peak observed for the cast 14chdm-70%HS indicating the presence
of a phase-mixed morphology in the TPU. The SAXS peaks observed for the
70%HS TPUs come from the HS-SS phase.
Figure 3.7 (e) shows that the scattering intensity peaks of the 100%HS TPUs are
lower than those of the 70%HS TPUs. The low scattering intensities observed for the
100%HS TPUs was partly because there are no soft segments in the TPU structure.
Since the 100%HS TPU has only one phase, it is somewhat contradictory that there
is a scattering peak present. It is therefore believed that the SAXS peaks observed for
the 100%HS TPUs come from the crystalline HS and the non-crystalline HS.
10 20 30 40 50 60 70
4300
8600
12900
17200
21500
In
te
nsity (a
.u
)
Cast TPU-70 (2m13pd)
Cast TPU-70 (12ed)
Cast TPU-70 (14bd)
Cast TPU-70 (15pd)
Cast TPU-70 (16hd)
Cast TPU-70 (17hpd)
Cast TPU-70 (18od)
Cast TPU-70 (14chdm)
2 (º)
10 20 30 40 50 60 70
4900
9800
14700
19600
24500
Cast TPU-100 (2m13pd)
Cast TPU-100 (12ed)
Cast TPU-100 (14bd)
Cast TPU-100 (15pd)
Cast TPU-100 (16hd)
Cast TPU-100 (17hpd)
Cast TPU-100 (18od)
Cast TPU-100 (14chdm)
In
te
nsity (a
.u
)
2 (º)
Figure 3.7 WAXS of cast TPUs (f) 70%HS and (g) 100%HS
WAXS results in Figures 3.7 (f) suggest the presence of low level crystallinities for
the 2m13pd- and 14chdm- 70%HS TPUs. Microcrystalline peaks were observed on
the amorphous halos of the 2m13pd-70%HS TPU whereas no crystalline peaks were
observed for the 14chdm-70%HS TPU. The low level crystallinity observed in
WAXS results correlate with the DSC results earlier discussed in Figure 3.7 (a).
Crystalline peaks were seen on the amorphous halos of linear chain-extended
70%HS TPUs (12ed, 14bd, 15pd, 16hd, 17hpd and 18od). However, sharp
(g) (f)

110
crystalline peaks were observed for the 70%HS TPUs chain-extended with 15pd,
16hd, 17hpd and 18od. The most prominent peaks observed for the 70%HS TPUs
chain-extended with 15pd, 16hd, 17hpd and 18od were seen at 19.01°, 19.34°,
18.90° and 19.19° respectively. These results correspond with the results reported by
Blackwell et al97-98, 125, 193-197
.
Blackwell et al97-98, 193-194
proposed a triclinic unit cell structure for Poly(MDI-
Butanediol) with unit cell dimensions: a = 5.2Å, b = 4.8Å, c = 35.0Å, α = 115°, β =
121°, and γ = 85°. The triclinic cell unit structure has a space group of P
(Pinacoidal) and contains two monomer units of a single chain. The above
propositions were made from single crystal x-ray analysis of the structure of a model
compound methanol-capped MDI (Me-M-Me). It was also proposed that the
Poly(MDI- Butanediol) has a monomer repeat of 18.95Å and the conformational
analysis showed that the polymer chains are arranged in a fully extended and
staggered structure (i.e. all trans). The conformational structure of Poly(MDI-
Butanediol) can be seen in Figure 3.8. However, it was also proposed that
Poly(MDI-Ethylene glycol) and Poly(MDI-Propanediol) adopt contracted and
unstaggered structures having monomer repeats of 15.0Å and 16.2Å respectively.
These monomer repeats are shorter than the predicted fully extended structure of
Poly(MDI-Butanediol) and are also seen to contain some gauche conformations.
These conformations have higher energy than the fully-extended all-trans structure.
It was observed that for butanediol and longer diol chain extenders, the structure
depends whether or not the diol chain extender is even or odd. The even diol
polymers adopt the lowest energy fully-extended conformation and this allows for
hydrogen bonding to take place in both direction perpendicular to the chain axis. In
contrast, such hydrogen bonding is not possible for the odd diol polymers in the
extended conformation and therefore they attain a contracted structure with higher
energy conformations.
It was also observed that both even and odd diol polymers adopted staggered chain
conformations with triclinic unit cells; however, the even diol polymers possess
higher crystalline order. In contrast to the above observation, the first two chain
extenders (ethylene glycol and propanediol) in the homologous series behave
differently. Ethylene glycol and propanediol- polymers adopt contracted unstaggered
structures. The reason was that the two diols are too short to allow the same order of
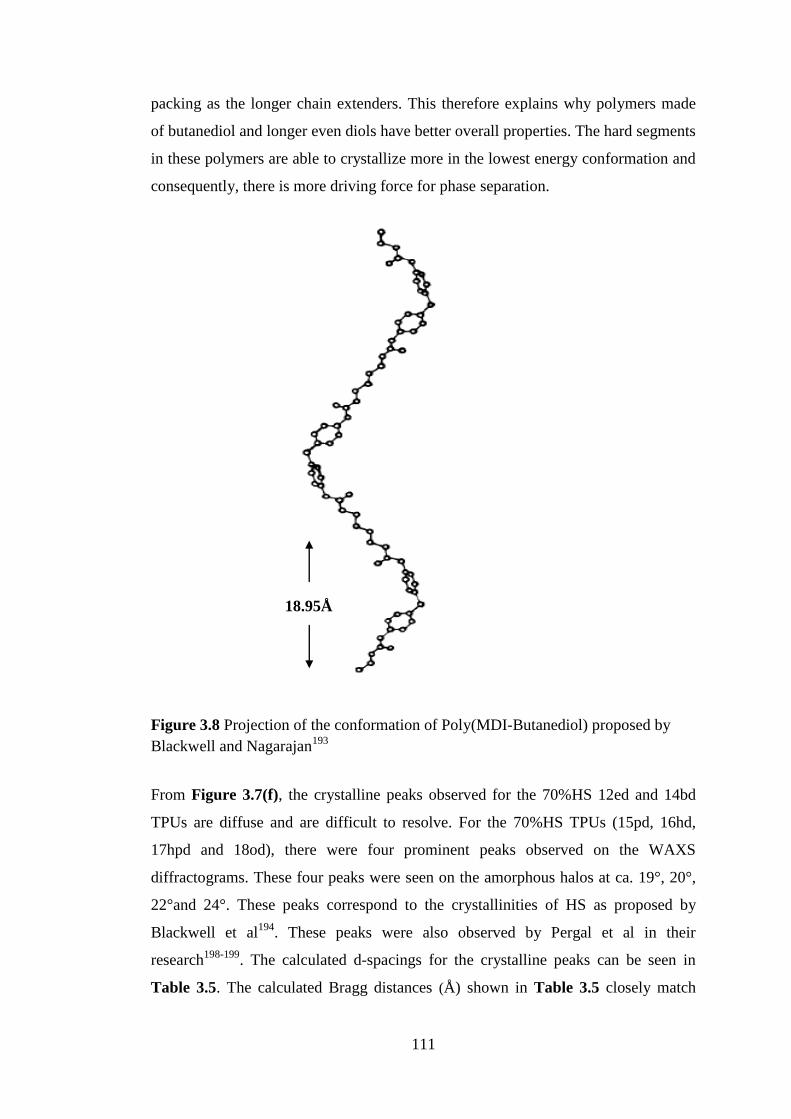
111
packing as the longer chain extenders. This therefore explains why polymers made
of butanediol and longer even diols have better overall properties. The hard segments
in these polymers are able to crystallize more in the lowest energy conformation and
consequently, there is more driving force for phase separation.
Figure 3.8 Projection of the conformation of Poly(MDI-Butanediol) proposed by
Blackwell and Nagarajan193
From Figure 3.7(f), the crystalline peaks observed for the 70%HS 12ed and 14bd
TPUs are diffuse and are difficult to resolve. For the 70%HS TPUs (15pd, 16hd,
17hpd and 18od), there were four prominent peaks observed on the WAXS
diffractograms. These four peaks were seen on the amorphous halos at ca. 19°, 20°,
22°and 24°. These peaks correspond to the crystallinities of HS as proposed by
Blackwell et al194
. These peaks were also observed by Pergal et al in their
research198-199
. The calculated d-spacings for the crystalline peaks can be seen in
Table 3.5. The calculated Bragg distances (Å) shown in Table 3.5 closely match
18.95Å
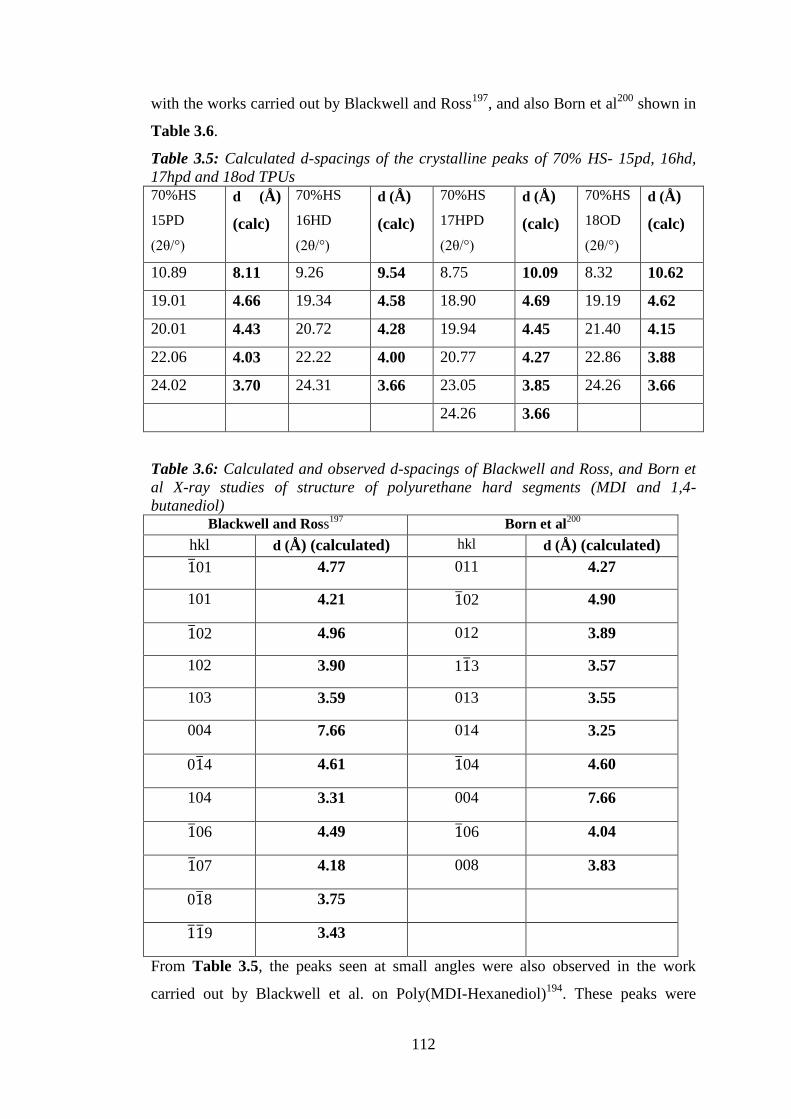
112
with the works carried out by Blackwell and Ross197
, and also Born et al200
shown in
Table 3.6.
Table 3.5: Calculated d-spacings of the crystalline peaks of 70% HS- 15pd, 16hd,
17hpd and 18od TPUs
70%HS
15PD
(2θ/°)
d (Å)
(calc)
70%HS
16HD
(2θ/°)
d (Å)
(calc)
70%HS
17HPD
(2θ/°)
d (Å)
(calc)
70%HS
18OD
(2θ/°)
d (Å)
(calc)
10.89 8.11 9.26 9.54 8.75 10.09 8.32 10.62
19.01 4.66 19.34 4.58 18.90 4.69 19.19 4.62
20.01 4.43 20.72 4.28 19.94 4.45 21.40 4.15
22.06 4.03 22.22 4.00 20.77 4.27 22.86 3.88
24.02 3.70 24.31 3.66 23.05 3.85 24.26 3.66
24.26 3.66
Table 3.6: Calculated and observed d-spacings of Blackwell and Ross, and Born et
al X-ray studies of structure of polyurethane hard segments (MDI and 1,4-
butanediol) Blackwell and Ross
197 Born et al
200
hkl d (Å) (calculated) hkl d (Å) (calculated)
01 4.77 011 4.27
101 4.21 02 4.90
02 4.96 012 3.89
102 3.90 1 3 3.57
103 3.59 013 3.55
004 7.66 014 3.25
0 4 4.61 04 4.60
104 3.31 004 7.66
06 4.49 06 4.04
07 4.18 008 3.83
0 8 3.75
9 3.43
From Table 3.5, the peaks seen at small angles were also observed in the work
carried out by Blackwell et al. on Poly(MDI-Hexanediol)194
. These peaks were

113
attributed to one of the ten reflections observed for the X-ray pattern of Poly(MDI-
Hexanediol). The d-spacing of the peak was observed to be 8.71Å. However, no
further explanation was given concerning the peak observed at small angle.
Blackwell et al. also observed that the x-ray patterns of Poly(MDI-Hexanediol) were
sharper than those of other diols. However, from Figure 3.7(f), the x-ray patterns of
15pd, 16hd, 17hpd and 18od TPUs were seen to be sharper than those of 12ed and
14bd TPUs.
The prominent peaks seen for the 70%HS 15pd, 16hd, 17hpd and 18od TPUs at
about 19° with d-spacing of about 4.6Å were also observed by many authors201-204
.
Briber and Thomas attributed the intense reflection at about 4.6Å to a type-II crystal
form. They commented that the type-II crystal structure is highly ordered and forms
classical negatively birefringent spherulites. The type-II crystal form is found in
unoriented films201
. This is therefore the case for our cast TPU samples.
The prominent peak intensities of the 70%HS 16hd, 17hpd and 18od TPUs were
seen to higher than that of the 70%HS 15pd TPU. The reason could be attributed to
higher monomer repeat. Blackwell et al observed that the monomer repeats of
Poly(MDI-Hexanediol), Poly(MDI-Heptanediol) and Poly(MDI-Octanediol) were
20.8Å, 20.7Å and 22.8Å whereas that of Poly(MDI-Pentanediol) was 18.6Å194, 205
.
In Figure 3.7(g), the crystalline peaks for the 100%HS TPUs chain-extended with
15pd, 16hd, 17hpd and 18od correspond with those of the 70%HS TPUs previously
discussed. However, their peak intensities were lower than those of 70%HS TPUs.
This observation could be attributed to the absence of SS in the polymeric chain.
This is because the soft segments contribute to the structural and morphological
integrity of the polymer. The 100%HS TPU chain-extended with 18od had the
highest prominent peak. The peaks at small angles were not too noticeable for the
100%HS TPUs.

114
3.2.1.2 MELT-QUENCHED TPUs
0 50 100 150 200
1st Heating CycleH
ea
t F
low
- E
xo
MQ TPU-70 (2m13pd)
MQ TPU-70 (15pd)
MQ TPU-70 (16hd)
MQ TPU-70 (17hpd)
MQ TPU-70 (18od)
Temperature (ºC)
0 50 100 150 200
1st Heating Cycle
He
at F
low
- E
xo
MQ TPU-100 (2m13pd)
MQ TPU-100 (15pd)
MQ TPU-100 (16hd)
MQ TPU-100 (17hpd)
MQ TPU-100 (18od)
Temperature (ºC)
Figure 3.9 1st DSC heating cycles of melt-quenched TPUs (a) 70%HS and (b)
100%HS
Due to the high melting temperatures associated with 12ed and 14bd TPUs, they
were not melt-processed for further thermal studies. Having established that 14chdm
TPUs are amorphous, it was therefore not necessary for them to undergo melt-
quenching processes.
It can be said that after the melting process, the TPU segments (HS and SS) are in a
homogeneous mixed state and therefore upon fast cooling, the polymeric molecules
do not have sufficient time to relax and attain an equilibrium state therefore they
quickly become immobile. Fast cooling of melted TPUs was done by dipping the
melted samples directly into a flask containing liquid nitrogen.
In Figure 3.9(a), broad Tgs were observed for the 70%HS TPUs chain-extended with
2m13pd, 15pd and 16hd. After the melt-quenching process, the TPU samples are in a
mixed state/phase and the broad transition observed is known as mixed phase glass
transition temperature (TgMP) as shown by Saiani et al58-60
. The mixed phase is a
dispersion of the SS with HS. TgMP values for the 70%HS TPUs chain-extended with
2m13pd, 15pd and 16hd were seen to be 40±0.6°C, 26±0.3°C and 22±0.1°C
(b) (a)

115
respectively. It was observed that as the samples are further heated, there appeared a
phase separation peak known as the microphase separation transition (TMST) marked
by an exotherm. Immediately after the microphase separation transition, an
endothermic transition known as the microphase mixing transition (TMMT) is
observed58-59
. After this transition, the HS and SS are once again in a homogenous
mixed state. No TMST was observed for 70%HS TPUs chain-extended with 17hpd
and 18od.
Pronounced melting-recrystallization-melting peaks were observed for the 70%HS
TPUs chain-extended with 16hd, 17hpd and 18od, that is to say, double melting
peaks and a recrystallization peak. DSC studies have revealed the occurrence of
multiple endothermic transitions of polyurethanes116, 118, 121, 206-209
. It is possible that
these multiple endothermic transition can be explained by the existence of
polymorphic structures in the polymer chain. The presence of polymorphic structures
for 14bd and 16hd TPUs has been reported125
.
Only a TgHS was observed for all the 100%HS TPUs as shown in Figure 3.9(b). This
is because the 100%HS TPU has no soft segment. The TgHS values of 100%HS TPUs
chain-extended with 2m13pd, 15pd, 16hd, 17hpd and 18od were 77±0.7°C,
69±0.4°C, 66±0.7°C, 43±0.3°C and 56±0.2°C. Having established that the
exothermic transitions observed for the melt-quenched 70%HS TPUs were as a
result of microphase separation (TMST); however, it is not enough to say that the
exothermic transition was only due to microphase separation because the same
exothermic transitions were observed for the 100%HS TPUs. Therefore, the
exothermic transition observed for the 100%HS TPUs is due to cold crystallization
(Tcc). The observed cold crystallization is as result of the frozen state of the HS
during the cooling process. During the cooling process, the hard segments do not
have sufficient time to crystallize before they vitrify.
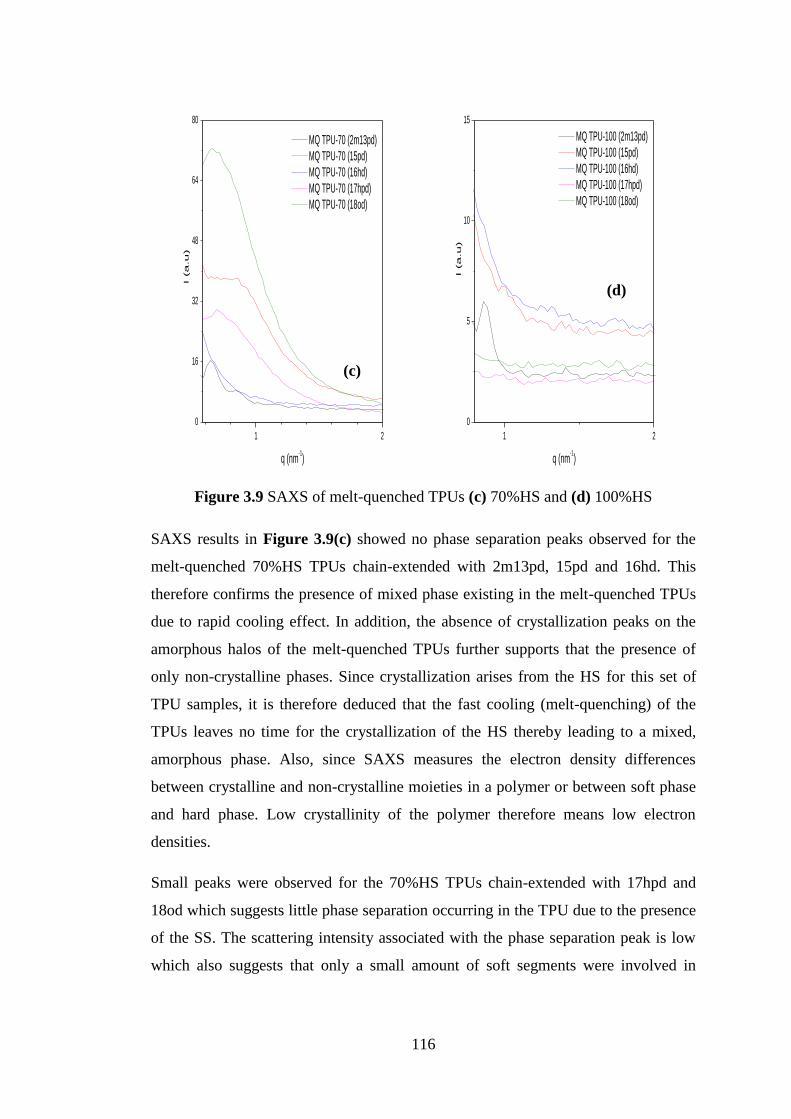
116
1 2
0
16
32
48
64
80
MQ TPU-70 (2m13pd)
MQ TPU-70 (15pd)
MQ TPU-70 (16hd)
MQ TPU-70 (17hpd)
MQ TPU-70 (18od)
I (a
.u
)
q (nm-1)
1 2
0
5
10
15
MQ TPU-100 (2m13pd)
MQ TPU-100 (15pd)
MQ TPU-100 (16hd)
MQ TPU-100 (17hpd)
MQ TPU-100 (18od)
I (a
.u
)q (nm
-1)
Figure 3.9 SAXS of melt-quenched TPUs (c) 70%HS and (d) 100%HS
SAXS results in Figure 3.9(c) showed no phase separation peaks observed for the
melt-quenched 70%HS TPUs chain-extended with 2m13pd, 15pd and 16hd. This
therefore confirms the presence of mixed phase existing in the melt-quenched TPUs
due to rapid cooling effect. In addition, the absence of crystallization peaks on the
amorphous halos of the melt-quenched TPUs further supports that the presence of
only non-crystalline phases. Since crystallization arises from the HS for this set of
TPU samples, it is therefore deduced that the fast cooling (melt-quenching) of the
TPUs leaves no time for the crystallization of the HS thereby leading to a mixed,
amorphous phase. Also, since SAXS measures the electron density differences
between crystalline and non-crystalline moieties in a polymer or between soft phase
and hard phase. Low crystallinity of the polymer therefore means low electron
densities.
Small peaks were observed for the 70%HS TPUs chain-extended with 17hpd and
18od which suggests little phase separation occurring in the TPU due to the presence
of the SS. The scattering intensity associated with the phase separation peak is low
which also suggests that only a small amount of soft segments were involved in
(d)
(c)

117
phase separation. This therefore implies the phase separation observed for the
70%HS TPUs is negligible.
There was no phase separation peak observed for all the melt-quenched 100%HS
TPUs as shown in Figure 3.9(d). This indicates that there were no differences in
electron densities between the crystalline HS and the non-crystalline HS.
10 20 30 40 50 60 70
1800
3600
5400
7200
9000
MQ TPU-70 (2m13pd)
MQ TPU-70 (15pd)
MQ TPU-70 (16hd)
MQ TPU-70 (17hpd)
MQ TPU-70 (18od)
In
te
nsity (a
.u
)
2 (º)
10 20 30 40 50 60 70
2100
4200
6300
8400
10500In
te
nsity (a
.u
)
MQ TPU-100 (2m13pd)
MQ TPU-100 (15pd)
MQ TPU-100 (16hd)
MQ TPU-100 (17hpd)
MQ TPU-100 (18od)
2 (º)
Figure 3.9 WAXS of melt-quenched TPUs (e) 70%HS and (f) 100%HS
WAXS results in Figures 3.9 (e) and (f) showed that there are no crystalline peaks
observed for the melt-quenched samples. The absence of crystalline peaks on the
amorphous halos therefore confirms that the melt-quenched TPU samples are
amorphous. However, the sharp peak seen on the 100%HS 18od-TPU in Figure
3.9(f) can be attributed to impurities or artefacts arising from the WAXS instrument.
(e) (f)

118
3.2.1.3 SLOW-COOLED TPUs
0 50 100 150 200
1st Cooling Cycle
He
at F
low
- E
xo
SC TPU-70 (2m13pd)
SC TPU-70 (15pd)
SC TPU-70 (16hd)
SC TPU-70 (17hpd)
SC TPU-70 (18od)
SC TPU-70 (14chdm)
Temperature (ºC)
0 50 100 150 200
1st Cooling CycleH
ea
t F
low
- E
xo
SC TPU-100 (2m13pd)
SC TPU-100 (15pd)
SC TPU-100 (16hd)
SC TPU-100 (17hpd)
SC TPU-100 (18od)
SC TPU-100 (14chdm)
Temperature (ºC)
Figure 3.10 1st DSC cooling cycles of slow-cooled TPUs (a) 70%HS and (b)
100%HS
Figure 3.10(a) showed that there were no transitions (such as crystallization)
observed for 70%HS TPUs chain-extended with 2m13pd and 14chdm in the DSC
cooling process. It can therefore be suggested that the melted TPUs remained phase-
mixed upon cooling.
We can observe the presence of crystallization exotherms for the 70%HS TPUs
chain-extended with 15pd, 16hd, 17hpd and 18od. From the 1st heating DSC results
for cast TPUs earlier discussed, the samples are believed to be semi-crystalline
owning to their melting transitions. It is therefore suggested that crystallinity is
expected to increase with increasing HS concentration, that is to say, crystallization
peaks should be seen for higher hard block TPUs. However, this is not the case for
100%HS samples as seen in Figure 3.10(b). The crystallization peak noticed for
only the 70%HS TPUs chain-extended with 15pd, 16hd, 17hpd and 18od is related to
mobility of polymeric chains rather than the amount of crystallizable units present in
the polymer. The SS (polyol) used in this research work was reported to play a
plasticizing role in the TPU transitions observed in the DSC thermographs58
. This
plasticizing effect of the polyol can be said to play a vital role in the crystallization
(b) (a)
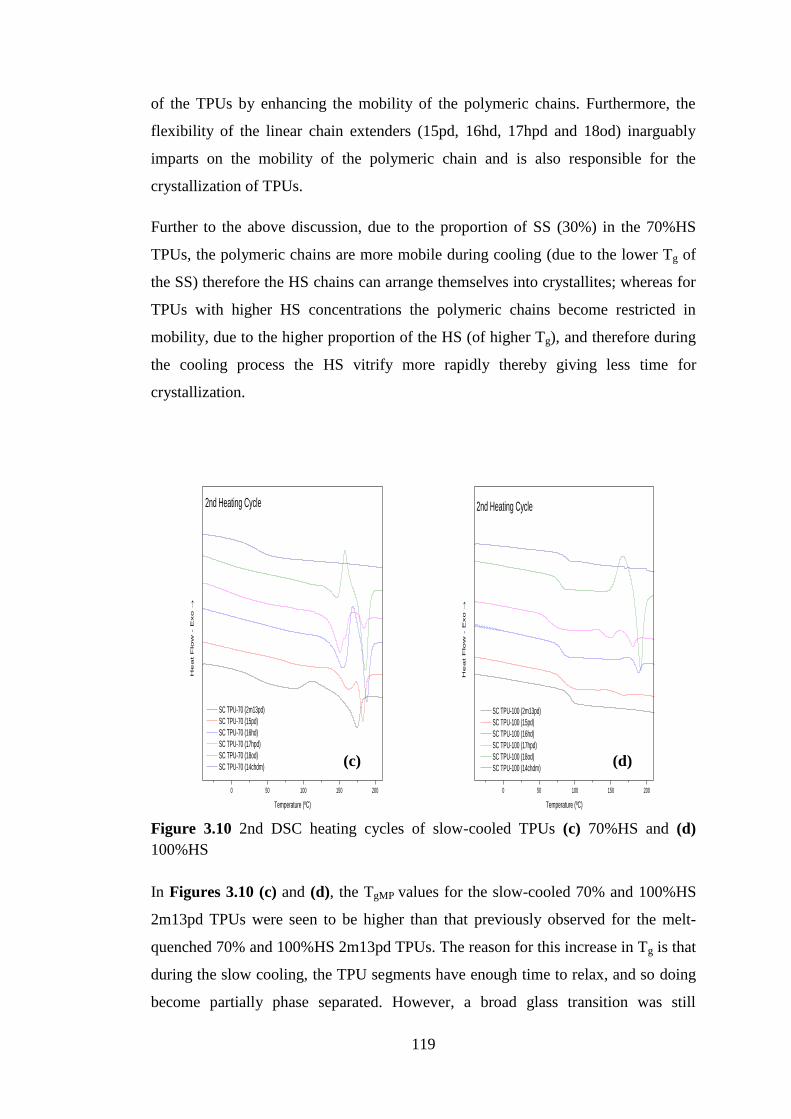
119
of the TPUs by enhancing the mobility of the polymeric chains. Furthermore, the
flexibility of the linear chain extenders (15pd, 16hd, 17hpd and 18od) inarguably
imparts on the mobility of the polymeric chain and is also responsible for the
crystallization of TPUs.
Further to the above discussion, due to the proportion of SS (30%) in the 70%HS
TPUs, the polymeric chains are more mobile during cooling (due to the lower Tg of
the SS) therefore the HS chains can arrange themselves into crystallites; whereas for
TPUs with higher HS concentrations the polymeric chains become restricted in
mobility, due to the higher proportion of the HS (of higher Tg), and therefore during
the cooling process the HS vitrify more rapidly thereby giving less time for
crystallization.
0 50 100 150 200
SC TPU-70 (2m13pd)
SC TPU-70 (15pd)
SC TPU-70 (16hd)
SC TPU-70 (17hpd)
SC TPU-70 (18od)
SC TPU-70 (14chdm)
He
at F
low
- E
xo
Temperature (ºC)
2nd Heating Cycle
0 50 100 150 200
2nd Heating Cycle
He
at F
low
- E
xo
SC TPU-100 (2m13pd)
SC TPU-100 (15pd)
SC TPU-100 (16hd)
SC TPU-100 (17hpd)
SC TPU-100 (18od)
SC TPU-100 (14chdm)
Temperature (ºC)
Figure 3.10 2nd DSC heating cycles of slow-cooled TPUs (c) 70%HS and (d)
100%HS
In Figures 3.10 (c) and (d), the TgMP values for the slow-cooled 70% and 100%HS
2m13pd TPUs were seen to be higher than that previously observed for the melt-
quenched 70% and 100%HS 2m13pd TPUs. The reason for this increase in Tg is that
during the slow cooling, the TPU segments have enough time to relax, and so doing
become partially phase separated. However, a broad glass transition was still
(d) (c)

120
observed for 70%HS 2m13pd TPU. This therefore means that the 70%HS TPU
segments are still phase-mixed after the slow cooling and are phase separated on
further heating. At HS concentrations higher than 70%HS, the melt-quenched TPUs
are no longer a homogeneous mixed phase thereby leading to the formation of a hard
phase and a mixed phase. It was reported by Saiani et al58
for 65% HS that part of
the hard segments are incorporated with the soft segments in a mixed phase with a
ratio of 1.8 : 1 and the rest comprises an almost pure hard segment phase 58-60
. As a
result of the restriction in the mobility of the mixed phase caused by the HS, TgMP is
not observed for samples with higher hard segment concentrations. It can therefore
be said TgHP was observed for HS higher than 70% (except 100%) since little amount
of soft segments still reside in them whereas only TgHS was observed for the
100%HS TPU. The Tg values of the 100%HS samples were also seen to increase due
to the restriction in mobility of the HS during the slow cooling process. There were
no melting transitions observed for 100%HS. The reason for the observation is due
to the increase of non-crystalline hard phases originating from the increased amount
of the 2m13pd chain extender in the TPU system. Due to the shortness of the chain
extender as well as its branched chemical structure, mobility of the HS chains tends
to be difficult and there are irregularities in the alignment of the TPU polymeric
chains. Furthermore, at high hard block concentrations (100%HS), we do not expect
to observe microphase mixing transition (TMMT).
As seen in Figure 3.10(c), only endothermic transitions were observed for the
70%HS TPUs chain-extended with 15pd, 16hd, 17hpd and 18od. This is due to the
crystallization that has taken place in the cooling process. After the cooling process,
the samples are still semi-crystalline; however, there was no Tg observed. No
endothermic transition was observed for the 70%HS TPU chain-extended with
14chdm which confirms that the sample is amorphous.
In Figure 3.10(d), TgHS was observed for all the 100%HS TPUs. The TgHS values of
the 100%HS TPUs chain-extended with 2m13pd, 15pd, 16hd, 17hpd, 18od and
14chdm were 93±0.6°C, 83±0.2°C, 80±0.7°C, 62±0.2°C, 80°C and 88±0.6°C. The
TgHS values observed for the slow-cooled 100%HS TPUs was seen to be higher than
that of the melt-quenched 100%HS TPUs. The reason was that during the slow-
cooling process, the HS chains had sufficient time to relax and attain equilibrium.
This means that the HS chains are better ordered, therefore TgHS is increased. It was

121
observed that the 100%HS 2m13pd and 14chdm TPUs had the highest TgHS values.
This could be attributed to the non-crystalline nature of the samples and hence there
was no melting transition observed for them. Prominent endothermic transition was
observed for the 100%HS 18od TPU and this suggests that it is more crystalline than
others.
3.2.1.4 MOULDED TPUs
0 50 100 150 200
He
at F
low
- E
xo
Moulded TPU-70 (2m13pd)
Moulded TPU-70 (15pd)
Moulded TPU-70 (16hd)
Moulded TPU-70 (17hpd)
Moulded TPU-70 (18od)
Moulded TPU-70 (14chdm)
Temperature (ºC)
1st Heating Cycle
0 50 100 150 200
1st Heating Cycle
He
at F
low
- E
xo
Moulded TPU-100 (2m13pd)
Moulded TPU-100 (15pd)
Moulded TPU-100 (16hd)
Moulded TPU-100 (17hpd)
Moulded TPU-100 (18od)
Moulded TPU-100 (14chdm)
Temperature (ºC)
Figure 3.11 1st DSC heating cycles of moulded TPUs (a) 70%HS and (b) 100%HS
In Figure 3.11(a), it is observed that decreased melting enthalpies were seen for the
moulded 70%HS 2m13pd and 15pd TPUs compared to those of their corresponding
cast TPUs. The reason is because moulding decreases the crystallinity of the TPU
samples due to the heating and rapid-cooling. For the moulded 70%HS 2m13pd
TPU, the observation of low Tg (TgMP) was similar to that seen for the cast TPU
(which was previously discussed) although the moulded TPU has slightly higher Tg
value than the cast TPU. We can suggest that due to temperature and pressure, a new
mixed phase state was induced for the moulded TPU samples. The reason is because
the boiling point of the solvent (DMAc) is 165°C and therefore is expected to have
evaporated at the moulding temperature (which is 180°C). After TgMP, phase
(b) (a)

122
separation peak was observed. This suggests that phase separation occurred during
the moulding process or during heating in the DSC.
For the moulded 70%HS 14chdm TPU, low Tg was still observed. No melting
transition was observed for the moulded 70%HS 14chdm TPU implying that the
sample is amorphous.
Single endothermic transition was observed for the 70%HS 15pd TPU whereas for
the moulded 70%HS 16hd, 17hpd and 18od TPUs, melting-recrystallization-melting
peaks were observed. These endothermic transitions suggest the presence of
polymorphic structures in the TPUs. However, these endothermic transitions were
not present in the 1st heating DSC cycles of the cast 70%HS 16hd, 17hpd and 18od
TPUs. This therefore means that the polymorphic structures were formed during the
moulding of the cast TPUs (especially during the cooling process).
The above observations for the moulded 70%HS TPUs correlate with those of the
moulded 100%HS TPUs as shown in Figure 3.11(b). The striking difference is that
TgMP was observed for the moulded 70%HS TPUs whereas TgHS was observed for the
moulded 100%HS TPUs.
To explain the existence of polymorphism in the 16hd, 17hpd and 18od TPUs, the
moulded 70% and 100%HS 16hd TPU samples were partially melted in order to
understand the nature of the multiple endotherms in the TPUs. The DSC traces are
shown in Figures 3.11 (c) to (f).

123
Figure 3.11 (c) partially melted to 157°C, (d) cooled to -90°C, (e) reheated to 220°C
and (f) cooled to 25°C
0 50 100 150
He
at F
low
- E
xo
Moulded TPU-70 (partially melted)
Moulded TPU-100 (partially melted)
Temperature (ºC)
1st Cooling Cycle CE: 16hd
0 50 100 150
He
at F
low
- E
xo
Moulded TPU-70 (partially melted)
Moulded TPU-100 (partially melted)
Temperature (ºC)
1st Heating Cycle CE: 16hd
(d) (c)
50 100 150 200
He
at F
low
- E
xo
Moulded TPU-70 (partially melted)
Moulded TPU-100 (partially melted)
Temperature (ºC)
2nd Cooling Cycle CE: 16hd
0 50 100 150 200
He
at F
low
- E
xo
Moulded TPU-70 (partially melted)
Moulded TPU-100 (partially melted)
Temperature (ºC)
2nd Heating Cycle CE: 16hd
(f) (e)

124
In Figure 3.11(c), the moulded TPUs were melted to about 160°C, that is between
the two melting temperatures. The 1st melting endotherms showed low enthalpies.
The TPUs were then cooled to -90°C (Figure 3.11(d)). The 1st cooling DSC
thermographs show that there is no crystallization peak observed on cooling. After
the cooling, only the second melting peaks were observed at higher temperatures.
The melting temperatures of the 70% and 100%HS TPUs were 191±0.1°C and
170±0.5°C respectively as shown in Figure 3.11(e). Figure 3.11(f) shows that
crystallization peak for 70%HS TPU was observed on cooling.
From the above observations, it is therefore clear to state that there are two distinct
crystal structures that melt at different temperatures. This therefore confirms the
existence of polymorphs in the 16hd, 17hpd and 18od TPUs. These results
correspond to those reported by Blackwell and Lee125
. Blackwell and Lee reported
on the existence/development of polymorphic/crystalline structures for TPU chain-
extended with 1,3-propanediol (PDO) 1,4-butanediol (BDO) and 1,6-hexanediol
(HDO); the HS concentrations of these TPUs were 51%, 52% and 54% respectively.
The development of polymorphic structures for these TPUs were apparent after
prolonged stretching and annealing as evidenced by their x-ray data. For the HDO
polymer, DSC data showed that a second/new peak of a contracted conformation
was observed at 190°C than that of an extended form already seen at a lower
temperature. A melt-quenching/reheating procedure as seen in Figures 3.11 (c) and
(e) was carried on the HDO polymer and it confirmed the existence of a second/new
peak of a contracted crystal form as only the second peak was observed after
quenching; this was also evidenced by their x-ray photographs. For the BDO and
PDO polymers, second/new peaks of extended conformations were observed at
lower temperatures than those of the contracted forms already seen at higher
temperatures.
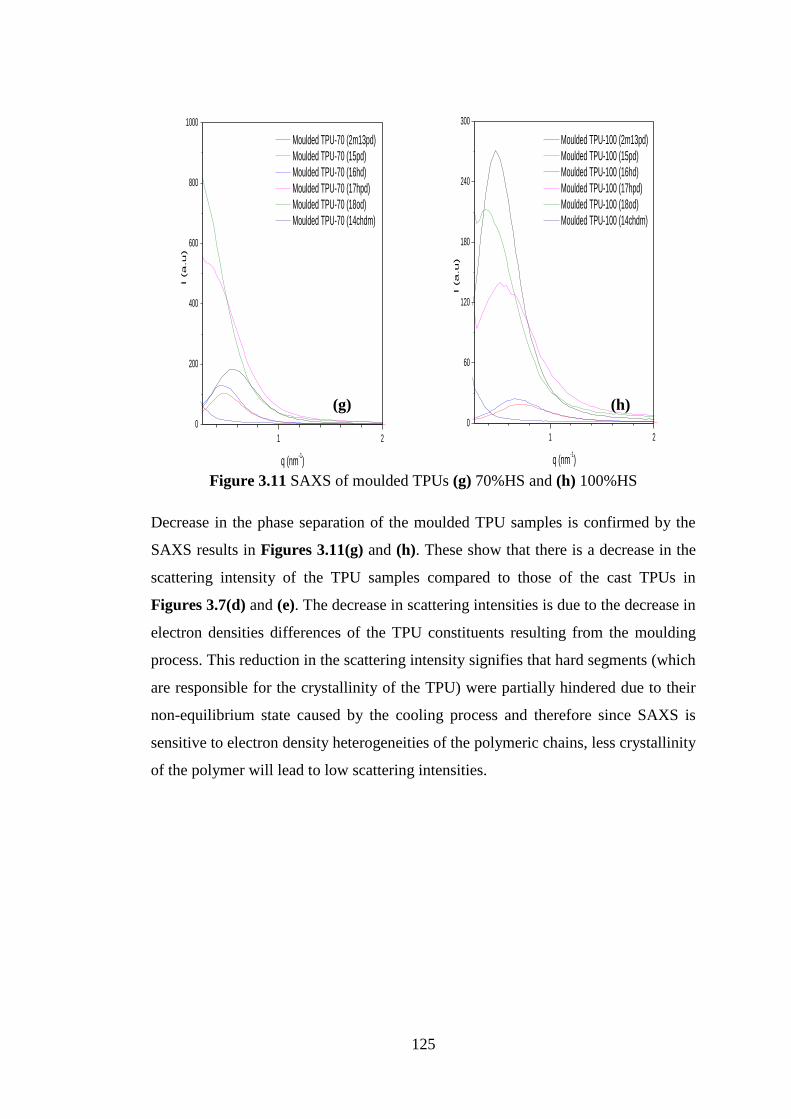
125
1 2
0
200
400
600
800
1000
Moulded TPU-70 (2m13pd)
Moulded TPU-70 (15pd)
Moulded TPU-70 (16hd)
Moulded TPU-70 (17hpd)
Moulded TPU-70 (18od)
Moulded TPU-70 (14chdm)
I (a
.u
)
q (nm-1)
1 2
0
60
120
180
240
300
Moulded TPU-100 (2m13pd)
Moulded TPU-100 (15pd)
Moulded TPU-100 (16hd)
Moulded TPU-100 (17hpd)
Moulded TPU-100 (18od)
Moulded TPU-100 (14chdm)
I (a
.u
)q (nm
-1)
Figure 3.11 SAXS of moulded TPUs (g) 70%HS and (h) 100%HS
Decrease in the phase separation of the moulded TPU samples is confirmed by the
SAXS results in Figures 3.11(g) and (h). These show that there is a decrease in the
scattering intensity of the TPU samples compared to those of the cast TPUs in
Figures 3.7(d) and (e). The decrease in scattering intensities is due to the decrease in
electron densities differences of the TPU constituents resulting from the moulding
process. This reduction in the scattering intensity signifies that hard segments (which
are responsible for the crystallinity of the TPU) were partially hindered due to their
non-equilibrium state caused by the cooling process and therefore since SAXS is
sensitive to electron density heterogeneities of the polymeric chains, less crystallinity
of the polymer will lead to low scattering intensities.
(h) (g)

126
10 20 30 40 50 60 70
3700
7400
11100
14800
18500
Moulded TPU-70 (2m13pd)
Moulded TPU-70 (15pd)
Moulded TPU-70 (16hd)
Moulded TPU-70 (17hpd)
Moulded TPU-70 (18od)
Moulded TPU-70 (14chdm)
In
te
nsity (a
.u
)
2 (º)
10 20 30 40 50 60 70
3200
6400
9600
12800
16000
Moulded TPU-100 (2m13pd)
Moulded TPU-100 (15pd)
Moulded TPU-100 (16hd)
Moulded TPU-100 (17hpd)
Moulded TPU-100 (18od)
Moulded TPU-100 (14chdm)
In
te
nsity (a
.u
)2 (º)
Figure 3.11 WAXS of moulded TPUs (i) 70%HS and (j) 100%HS
In Figures 3.11 (i) and (j), there are very small crystalline peaks observed in the
amorphous halos of the moulded TPUs. The WAXS results therefore confirmed that
the crystallinity of the TPUs was reduced during the moulding process. Rapid
cooling involved in the moulding process decreases the rate of crystallization of the
HS. However, the small crystalline peaks still seen on the amorphous halos of the
moulded TPUs suggest that some crystallizable parts of the TPUs remained
crystalline after the moulding process.
(j) (i)

127
3.2.1.5 ANNEALED MOULDED TPUs
0 50 100 150 200
1st Heating Cycle
Ann. Moulded TPU-70 (2m13pd)
Ann. Moulded TPU-70 (15pd)
Ann. Moulded TPU-70 (16hd)
Ann. Moulded TPU-70 (17hpd)
Ann. Moulded TPU-70 (18od)
Ann. Moulded TPU-70 (14chdm)
He
at F
low
- E
xo
Temperature (ºC)
0 50 100 150 200
He
at F
low
- E
xo
Ann. Moulded TPU-100 (2m13pd)
Ann. Moulded TPU-100 (15pd)
Ann. Moulded TPU-100 (16hd)
Ann. Moulded TPU-100 (17hpd)
Ann. Moulded TPU-100 (18od)
Ann. Moulded TPU-100 (14chdm)
Temperature (ºC)
1st Heating Cycle
Figure 3.12 1st DSC heating cycles of annealed moulded TPUs (a) 70%HS and (b)
100%HS
In Figures 3.12 (a) and (b), it was observed that after the annealing process, the TPU
samples showed melting transitions with sharp melting peaks. The melting
enthalpies of the annealed moulded TPUs were higher than those of the moulded
TPUs due to annealing. The sharp melting transitions were as a result of the ordering
of the HS during the annealing process118-119, 210
. Contrary to the 1st heating DSC
results obtained from the moulded 100%HS 2m13pd TPU where there was no
melting transition (Figure 3.11(b)), annealing above the TgHS induced the
development of ordered structure within the hard phase53
.
For the annealed moulded 14chdm TPUs, melting transitions were observed. These
melting transitions were formed as a result of increased crystallinity/ordering of the
HS due to prolonged annealing. Broad glass transition (TgMP) was observed for the
70%HS TPUs at -2±0.1°C and TgHS was observed for the 100%HS TPU at
71±0.1°C. A second melting peak was observed for the 70%HS TPU and this peak
(b) (a)

128
could be assigned to the melting of an ordered HS formed during annealing as
reported by Saiani et al58
.
For the annealed moulded 15pd and 17hpd TPUs, only single melting peaks were
observed whereas for the annealed moulded 16hd and 18od TPUs, recrystallization
peaks and double endotherms were observed. The melting enthalpies of these
annealed moulded samples were higher than their corresponding moulded samples as
during the annealing process, more HS crystallites are formed.
1 2
0
280
560
840
1120
1400
I (a
.u
)
Ann. Moulded TPU-70 (2m13pd)
Ann. Moulded TPU-70 (15pd)
Ann. Moulded TPU-70 (16hd)
Ann. Moulded TPU-70 (17hpd)
Ann. Moulded TPU-70 (18od)
Ann. Moulded TPU-70 (14chdm)
q (nm-1)
1 2
0
70
140
210
280
350
I (a
.u
)
Ann. Moulded TPU-100 (2m13pd)
Ann. Moulded TPU-100 (15pd)
Ann. Moulded TPU-100 (16hd)
Ann. Moulded TPU-100 (17hpd)
Ann. Moulded TPU-100 (18od)
Ann. Moulded TPU-100 (14chdm)
q (nm-1)
Figure 3.12 SAXS of annealed moulded TPUs (c) 70%HS and (d) 100%HS
Figures 3.12 (c) and (d) revealed that the scattering intensities of annealed moulded
TPUs were once again increased due to the annealing compared to the decrease in
scattering intensities observed in the SAXS results of the moulded samples (see
Figures 3.11 (g) and (h)). The increase in scattering intensities is due to increased
phase separation and crystallinity of the TPU segments.
(d) (c)
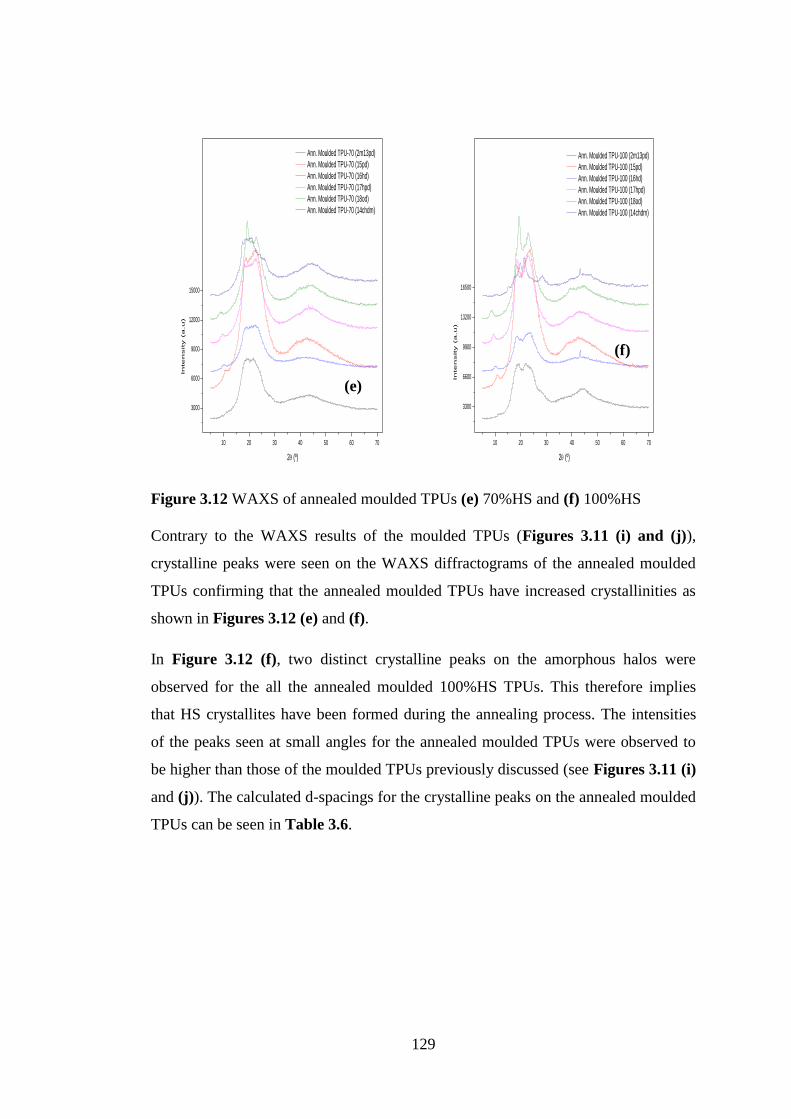
129
10 20 30 40 50 60 70
3000
6000
9000
12000
15000
In
te
nsity (a
.u
)
Ann. Moulded TPU-70 (2m13pd)
Ann. Moulded TPU-70 (15pd)
Ann. Moulded TPU-70 (16hd)
Ann. Moulded TPU-70 (17hpd)
Ann. Moulded TPU-70 (18od)
Ann. Moulded TPU-70 (14chdm)
2 (º)
10 20 30 40 50 60 70
3300
6600
9900
13200
16500
In
te
nsity (a
.u
)
Ann. Moulded TPU-100 (2m13pd)
Ann. Moulded TPU-100 (15pd)
Ann. Moulded TPU-100 (16hd)
Ann. Moulded TPU-100 (17hpd)
Ann. Moulded TPU-100 (18od)
Ann. Moulded TPU-100 (14chdm)
2 (º)
Figure 3.12 WAXS of annealed moulded TPUs (e) 70%HS and (f) 100%HS
Contrary to the WAXS results of the moulded TPUs (Figures 3.11 (i) and (j)),
crystalline peaks were seen on the WAXS diffractograms of the annealed moulded
TPUs confirming that the annealed moulded TPUs have increased crystallinities as
shown in Figures 3.12 (e) and (f).
In Figure 3.12 (f), two distinct crystalline peaks on the amorphous halos were
observed for the all the annealed moulded 100%HS TPUs. This therefore implies
that HS crystallites have been formed during the annealing process. The intensities
of the peaks seen at small angles for the annealed moulded TPUs were observed to
be higher than those of the moulded TPUs previously discussed (see Figures 3.11 (i)
and (j)). The calculated d-spacings for the crystalline peaks on the annealed moulded
TPUs can be seen in Table 3.6.
(e)
(f)

130
Table 3.7: Calculated d-spacings of the crystalline peaks of annealed moulded 100%
HS- 15pd, 16hd, 17hpd, 18od and 14chdm TPUs 100%HS
15PD
(2θ/°)
d (Å)
(calc)
100%HS
16HD
(2θ/°)
d (Å)
(calc)
100%HS
17HPD
(2θ/°)
d (Å)
(calc)
100%HS
18OD
(2θ/°)
d (Å)
(calc)
100%HS
14CHDM
(2θ/°)
d (Å)
(calc)
10.76 8.24 10.14 8.71 9.42 9.38 8.51 10.38 15.13 5.85
18.52 4.79 18.52 4.79 18.59 4.77 19.19 4.62 17.56 5.05
23.51 3.78 23.77 3.74 22.99 3.86 22.81 3.89 19.76 4.49
21.44 4.14
28.61 3.12
Some of the peaks observed in Table 3.7 correspond to those observed for the cast
TPUs seen in Table 3.5. It can therefore be deduced that annealing the moulded TPU
samples at 80°C for 168 hours induced the formation of type-II crystals and the
results are consistent with the findings of Briber and Thomas211
.
From the results discussed, it can be observed that TM (melting of the HS) was
observed for the 100%HS samples whereas TMMT (mixing of the HS and SS) was
observed for the 70%HS samples. The broad glass transition seen for the melt-
quenched, slow-cooled and moulded 70%HS 2m13pd TPUs suggested the presence
of a mixed phase system. Cast 14chdm TPUs were seen to be non-crystalline which
is due to the chemical structure of the chain extender. However, crystallinities of
2m13pd and 14chdm TPUs were increased on annealing. Multiple endothermic
transitions were observed for the 16hd, 17hpd and 18od TPUs. This was due to the
presence of polymorphic structures existing in the TPUs. Annealing improved the
thermodynamic and structural properties of the linear chain-extended TPUs.
Furthermore, the odd-even effect influenced the thermodynamic properties of the
linear chain-extended TPUs. The linear chain-extended TPUs showed better
thermodynamic and structural properties than the non linear and cyclic chain
extended TPUs. This is also due to the higher degree of crystallinity inherent in the
linear chain-extended TPUs. WAXS results showed that the reflections observed for
the cast and annealed moulded TPU samples were consistent with the findings of
Blackwell et al as well as Briber and Thomas.
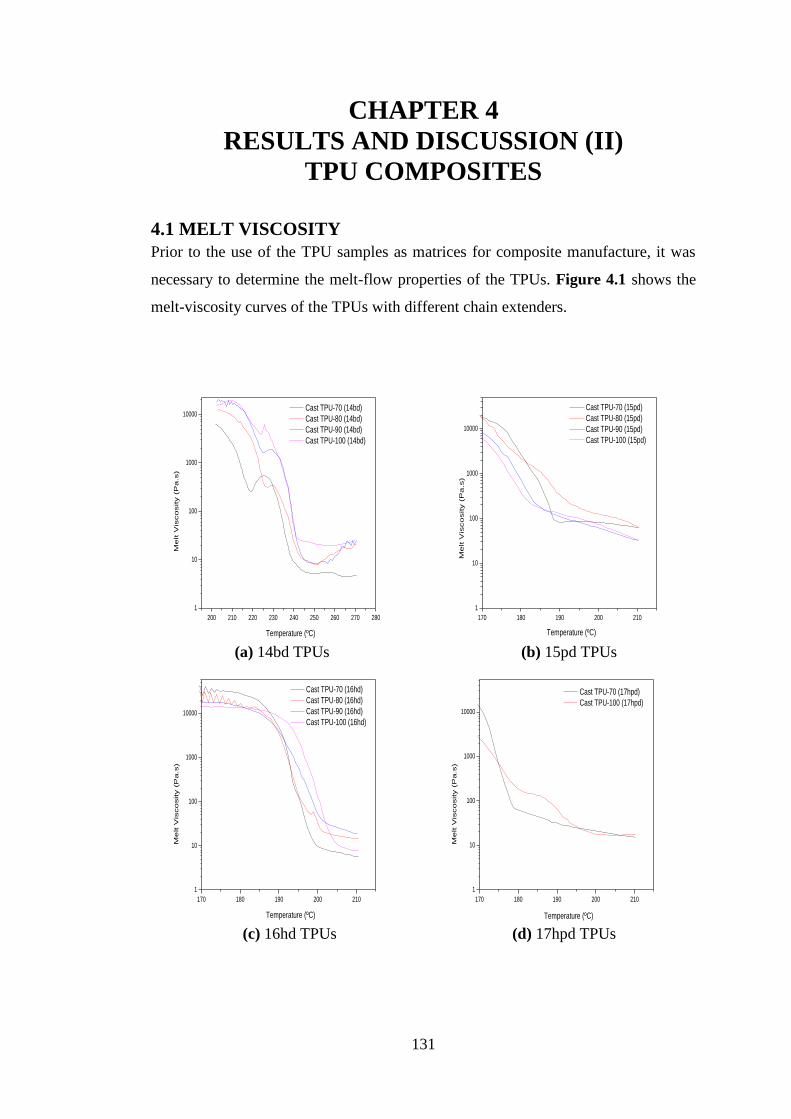
131
CHAPTER 4
RESULTS AND DISCUSSION (II)
TPU COMPOSITES
4.1 MELT VISCOSITY
Prior to the use of the TPU samples as matrices for composite manufacture, it was
necessary to determine the melt-flow properties of the TPUs. Figure 4.1 shows the
melt-viscosity curves of the TPUs with different chain extenders.
200 210 220 230 240 250 260 270 280
1
10
100
1000
10000 Cast TPU-70 (14bd)
Cast TPU-80 (14bd)
Cast TPU-90 (14bd)
Cast TPU-100 (14bd)
Me
lt V
iscosity (
Pa.s
)
Temperature (ºC)
170 180 190 200 210
1
10
100
1000
10000
Cast TPU-70 (15pd)
Cast TPU-80 (15pd)
Cast TPU-90 (15pd)
Cast TPU-100 (15pd)
Me
lt V
isco
sity (
Pa
.s)
Temperature (ºC) (a) 14bd TPUs (b) 15pd TPUs
170 180 190 200 210
1
10
100
1000
10000
Cast TPU-70 (16hd)
Cast TPU-80 (16hd)
Cast TPU-90 (16hd)
Cast TPU-100 (16hd)
Me
lt V
iscosity (
Pa.s
)
Temperature (ºC)
170 180 190 200 210
1
10
100
1000
10000
Cast TPU-70 (17hpd)
Cast TPU-100 (17hpd)
Me
lt V
iscosity (
Pa.s
)
Temperature (ºC) (c) 16hd TPUs (d) 17hpd TPUs

132
170 180 190 200 210
1
10
100
1000
10000
Me
lt V
iscosity (
Pa
.s)
Temperature (ºC)
Cast TPU-70 (18od)
Cast TPU-100 (18od)
170 180 190 200 210
1
10
100
1000
Cast TPU-70 (2m13pd)
Cast TPU-80 (2m13pd)
Cast TPU-90 (2m13pd)
Cast TPU-100 (2m13pd)
Me
lt V
isco
sity (
Pa
.s)
Temperature (ºC) (e) 18od TPUs (f) 2m13pd TPUs
170 180 190 200 210
1
10
100
Cast TPU-70 (14chdm)
Cast TPU-80 (14chdm)
Cast TPU-90 (14chdm)
Cast TPU-100 (14chdm)
Me
lt V
iscosity (
Pa.s
)
Temperature (ºC) (g) 14chdm TPUs
Figure 4.1 Melt-viscosity properties of TPUs with different chain extenders
Figure 4.1 (a) shows melting curves for 14bd TPUs. 12ed and 14bd TPU samples
melted at high temperatures as earlier shown by their DSC thermographs in Figures
3.7 (a) and (b). The melting curves of 12ed TPUs were not presented and the reason
being that during the rheology test, the 12ed TPUs acted as a thermosetting polymers
showing random, zig-zag transitions. The melting range for these TPU samples was
seen to be between 200°C and 270°C. The observed melting range corresponded to
the degradation temperatures (from 220°C) of the TPUs. The reason for the high
melt-viscosity profiles observed for these TPU samples was primarily due to their
high degree of crystallinity and therefore they were resistant to melt easily92, 112, 115,
184. The high crystallinity primarily results from the hydrogen bonding existing

133
between the HS chains. The efficiency of the hydrogen bonding existing between the
HS depends on the chain extender. It was reported that the short-chain linear
extenders join effectively with the isocyanate units during polymerization30
. Due to
the high melting temperatures of 12ed and 14bd TPUs, they cannot be processed
without degradation and as a result, these TPU samples cannot be used as matrices
for the fabrication of composites in this research work.
Figure 4.1 (b) shows that the 15pd TPUs exhibited steady decrease in melt viscosity
with increasing temperature. The samples showed melt-viscosities which decreased
with increase in HS concentration. The observation corresponds to the 1st heating
DSC thermographs seen in Figures 3.7 (a) and (b) – the melting temperatures of
100%HS TPU was seen to be lower than that of 70%HS TPU.
Figure 4.1 (c) shows that the melt-viscosity curves of 16hd TPUs were higher than
those of 15pd TPUs. This observation also corresponded to the 1st heating DSC
thermographs seen in Figures 3.7 (a) and (b) – the melting temperatures of the 70%
and 100%HS 16hd TPUs were observed to be higher than those of the 70% and
100%HS 15pd TPUs. All samples were seen to begin to melt steadily from
approximately 190°C. However, during moulding these TPU samples melted easily
and this was due primarily to the impact of the applied pressure.
Figure 4.1 (d) shows that the 17hpd TPUs exhibited relatively little decrease in melt
viscosity with increasing temperature. It was however noticed that there was a sharp
decrease in the melt viscosities of the TPUs as samples began to melt from 170°C.
This observation also corresponded with the DSC traces of 17hpd TPUs in Figures
3.7 (a) and (b). The rheological traces of 17hpd TPUs were observed to be similar to
those of 15pd TPUs.
Figure 4.1 (e) shows that the rheological traces of 18od TPUs were similar to those
of 16hd TPUs. Melting began at about 185°C for 70% TPU and about 190°C for
100% TPU. Rheological curves showing an increase in melting temperatures of the
18od TPUs confirmed the DSC transitions shown in Figures 3.7 (a) and (b).
Figures 4.1 (f) and (g) show the melting profiles of 2m13pd and 14chdm TPUs
respectively. The melt viscosity profile of 2m13pd TPUs is the same as that of 15pd
TPUs. 2m13pd and 14chdm TPU samples exhibited relatively little decrease in

134
viscosity with increasing temperature. The DSC traces of these TPU samples
revealed that they displayed little or no melting transitions (see Figures 3.7 (a) and
(b)). 14chdm TPUs were observed to display the lowest viscosity properties
compared to all other TPU samples. The reason for the observation is due to the
amorphous nature of TPU samples owning primarily for the geometric isomerism
(mixture of cis- and trans- isomers) of the chain extender as discussed in the DSC
results in Chapter 3.
From the above discussion on the melt-viscosity traces of the TPUs, it is evident that
15pd, 16hd, 17hpd, 18od, 2m13pd and 14chdm TPUs were suitable matrices to be
used for composite making due to their easy melt-flow. Furthermore, it was observed
that there were similarities in the melting profiles of some of the linear chain-
extended TPUs. The melting profile of 15pd TPUs was similar to that of 17hpd
TPUs whereas the melting profile of 16hd TPUs was similar to that of 18od TPUs.
These similarities in melting transitions were also observed in the DSC results of the
TPUs as shown in Chapter 3 and were seen as the presence of the odd-even effect in
these TPUs94-102
.
4.2 COMPOSITE ARCHITECTURE - TOMOGRAPHY
After the compression moulding of the TPU composites, it was necessary to view the
internal features of the composite. The internal features of the composites were
viewed through x-ray tomography. These internal features include the arrangement
and alignment of the glass fibre mats in the composite material.
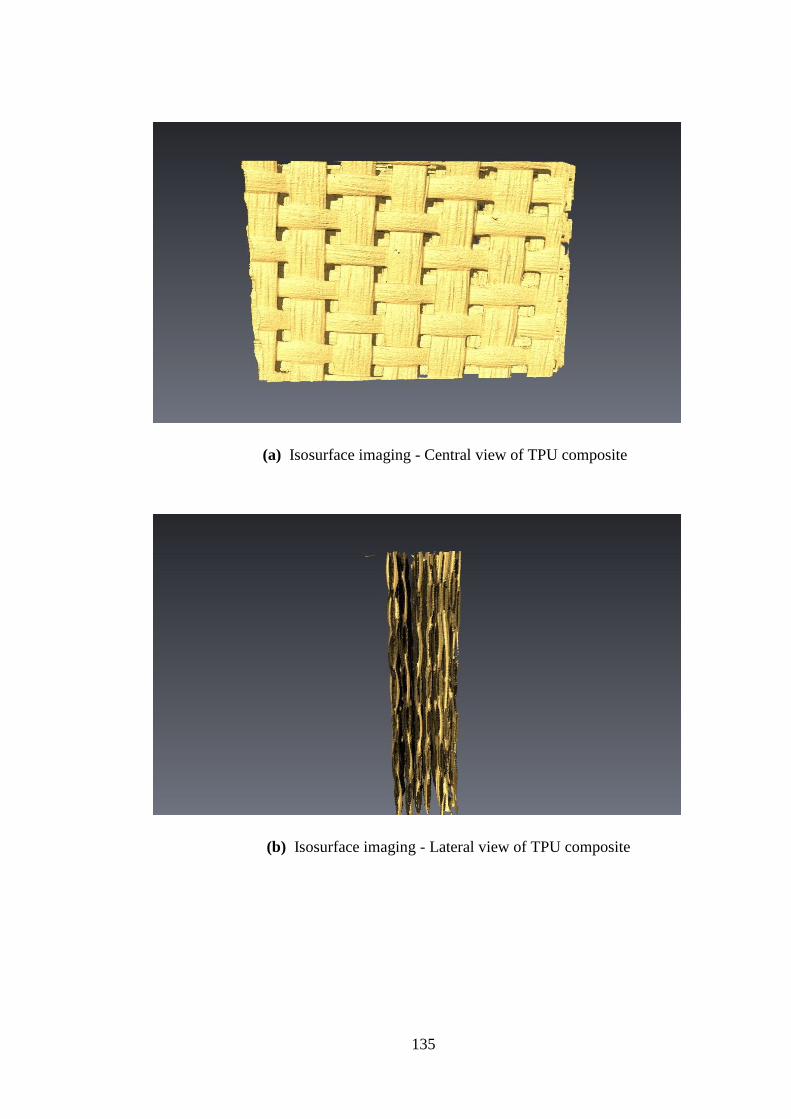
135
(a) Isosurface imaging - Central view of TPU composite
(b) Isosurface imaging - Lateral view of TPU composite

136
(c) Orthoslice imaging of TPU composite
Figure 4.2 (a), (b) and (c) The internal architecture of the glass-TPU composite
Figure 4.2 (a) and (b) show that the glass fibre mats were properly aligned in the
composite material. The isosurface imaging of the computer tomography was able to
reveal the arrangement of the fibre mats in the composite material. The lateral view
showed that the composite was made of 8 layered glass fibre mats. Figure 4.2 (c)
shows the make-up of the entire composite material. It was clear to see that 8 glass
fibre mats were embedded in a TPU matrix.
4.3 OPTICAL MICROSCOPY
It was also important to elucidate the interfacial properties of the TPU composite in
order to determine the mechanical properties of the composite.
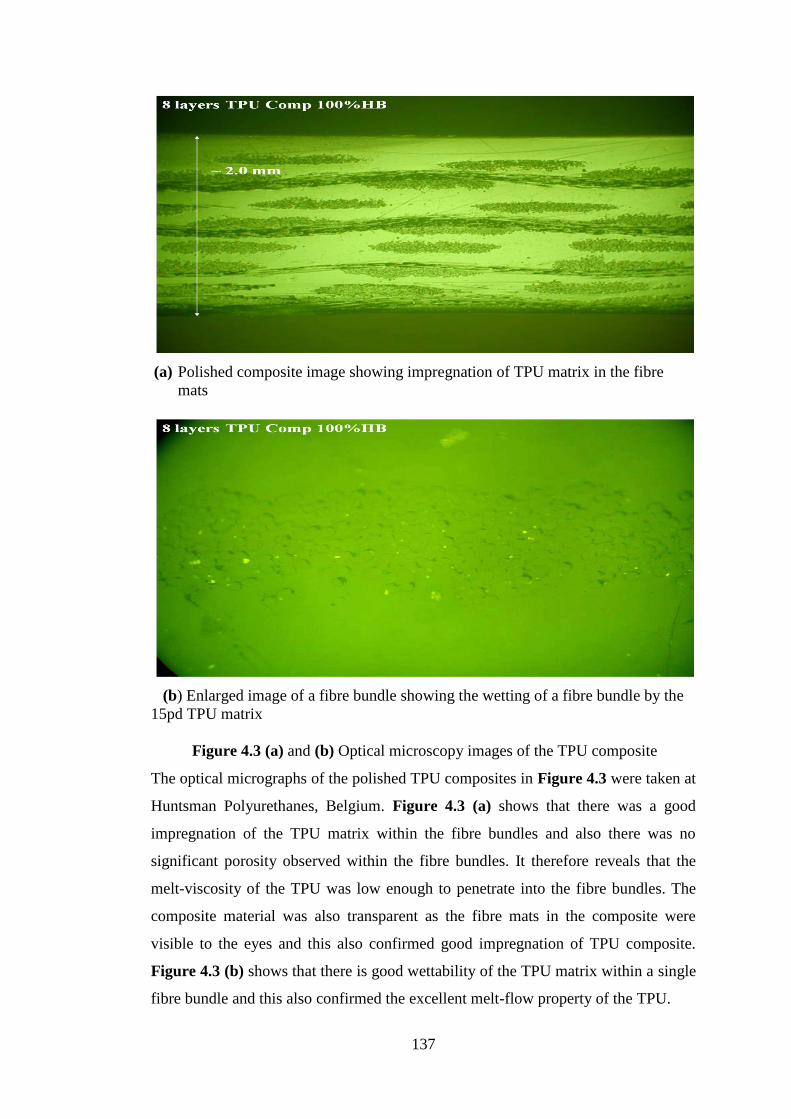
137
(a) Polished composite image showing impregnation of TPU matrix in the fibre
mats
(b) Enlarged image of a fibre bundle showing the wetting of a fibre bundle by the
15pd TPU matrix
Figure 4.3 (a) and (b) Optical microscopy images of the TPU composite
The optical micrographs of the polished TPU composites in Figure 4.3 were taken at
Huntsman Polyurethanes, Belgium. Figure 4.3 (a) shows that there was a good
impregnation of the TPU matrix within the fibre bundles and also there was no
significant porosity observed within the fibre bundles. It therefore reveals that the
melt-viscosity of the TPU was low enough to penetrate into the fibre bundles. The
composite material was also transparent as the fibre mats in the composite were
visible to the eyes and this also confirmed good impregnation of TPU composite.
Figure 4.3 (b) shows that there is good wettability of the TPU matrix within a single
fibre bundle and this also confirmed the excellent melt-flow property of the TPU.
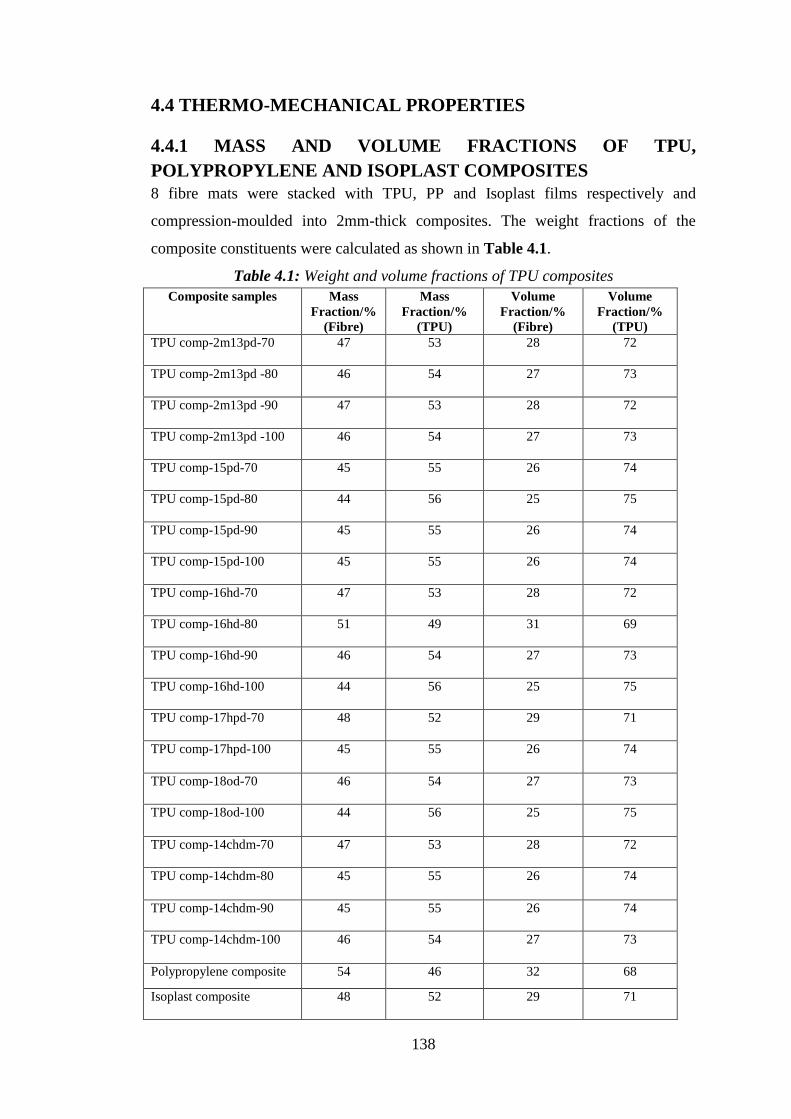
138
4.4 THERMO-MECHANICAL PROPERTIES
4.4.1 MASS AND VOLUME FRACTIONS OF TPU,
POLYPROPYLENE AND ISOPLAST COMPOSITES
8 fibre mats were stacked with TPU, PP and Isoplast films respectively and
compression-moulded into 2mm-thick composites. The weight fractions of the
composite constituents were calculated as shown in Table 4.1.
Table 4.1: Weight and volume fractions of TPU composites
Composite samples Mass
Fraction/%
(Fibre)
Mass
Fraction/%
(TPU)
Volume
Fraction/%
(Fibre)
Volume
Fraction/%
(TPU)
TPU comp-2m13pd-70 47
53
28 72
TPU comp-2m13pd -80
46
54
27 73
TPU comp-2m13pd -90
47
53
28 72
TPU comp-2m13pd -100
46
54
27 73
TPU comp-15pd-70
45
55
26 74
TPU comp-15pd-80
44
56
25 75
TPU comp-15pd-90
45
55
26 74
TPU comp-15pd-100
45
55
26 74
TPU comp-16hd-70
47
53
28 72
TPU comp-16hd-80
51
49
31 69
TPU comp-16hd-90
46
54
27 73
TPU comp-16hd-100
44
56
25 75
TPU comp-17hpd-70
48
52
29 71
TPU comp-17hpd-100
45
55
26 74
TPU comp-18od-70
46
54
27 73
TPU comp-18od-100
44
56
25 75
TPU comp-14chdm-70 47
53
28 72
TPU comp-14chdm-80
45
55
26 74
TPU comp-14chdm-90
45
55
26 74
TPU comp-14chdm-100
46
54
27 73
Polypropylene composite 54 46 32 68
Isoplast composite
48
52
29 71

139
The TPU composites processed in this research were manufactured by first
measuring the weights of the glass fibres. The weights of the composites were later
measured and therefore the weights of the polymers were deducted. Having
knowledge of the weights of the fibre and matrix, the weight fractions of the TPU
composite constituents were then determined. It is therefore important to also
determine the volume fractions of the TPU composite constituents so as to be able to
calculate the composite properties. Having established the weight fractions of TPU
composite constituents, the volume fractions of TPU composite constituents were
derived from the equation below:
(Equation 4.1)
where Vf = volume fraction of fibre
Wf = weight fraction of fibre
ρf = density of fibre = 2.6g/cm3
ρm = density of matrix (TPU & Isoplast = 1.130g/cm3; PP = 0.9g/cm
3)
4.4.2 DMTA OF UNANNEALED AND ANNEALED TPU
COMPOSITES
The TPU composites were cut with a band saw into sizes suitable for DMTA testing.
Annealing of the TPU composites was done at 80°C for 168 hours. The annealing
temperature chosen (80°C) is higher than the TgHS of the TPUs reported in this
research work. The reasons for the choice of annealing temperature is to avoid the
overlapping of TgHS with the annealing endotherm, TA (which occurs at 20 - 30°C
above the annealing temperature) and to optimize the ordering of the HS during
annealing58-60, 185
. Three samples of each TPU composite of different chain extender
series were tested. 70%, 80%, 90% and 100%HS TPU composites will be discussed
in this section.

140
4.4.2.1 2M13PD TPU COMPOSITES
-100 0 100 200
1
10
100
1000
10000
TPU comp(2m13pd-70)
TPU comp(2m13pd-80)
TPU comp(2m13pd-90)
TPU comp (2m13pd-100)
Sto
ra
ge
M
od
ulu
s (M
Pa
)
Temperature (ºC)
-100 0 100
0.0
0.2
0.4
0.6
0.8
1.0
TPU comp (2m13pd-70)
TPU comp (2m13pd-80)
TPU comp (2m13pd-90)
TPU comp (2m13pd-100)
Ta
n D
elta
Temperature (ºC)
I. Unannealed TPU composites
-100 -50 0 50 100 150 200
1
10
100
1000
10000
Ann. TPU comp (2m13pd-70)
Ann. TPU comp (2m13pd-80)
Ann. TPU comp (2m13pd-90)
Ann. TPU comp (2m13pd-100)
Sto
ra
ge
M
od
ulu
s (M
Pa
)
Temperature (ºC)
-100 -50 0 50 100 150
0.0
0.2
0.4
0.6
0.8
1.0
Ann. TPU comp (2m13pd-70)
Ann. TPU comp (2m13pd-80)
Ann. TPU comp (2m13pd-90)
Ann. TPU comp (2m13pd-100)
Ta
n D
elta
Temperature (ºC)
II. Annealed TPU composites
Figure 4.4 (a) Storage modulus (b) tan delta of (I) unannealed 2m13pd TPU
composites (II) annealed 2m13pd TPU composites
(a) (b)
TgHP / TgHS
TgSP
(b)
(a)

141
70 80 90 100
0
5000
10000
15000
20000
25000
Sto
ra
ge
M
od
ulu
s (M
Pa
)
Hard Segment (%)
E' at -100º C
E' at 25º C
E' at 100º C
TPU Composites
(2m13pd)
70 80 90 100
0
5000
10000
15000
20000
25000
Annealed TPU Composites
(2m13pd)
Sto
ra
ge
M
od
ulu
s (M
Pa
)
Hard Segment (%)
E' at -100º C
E' at 25º C
E' at 100º C
Figure 4.5 Storage moduli bar graph of (a) unannealed and (b) annealed 2m13pd
TPU composites
In Figure 4.4 – I (a), the storage moduli of all the TPU composites are seen to be
similar at low temperatures (-100°C). This could be attributed to the fact the 2m13pd
TPU samples attained a phase-mixed morphology during the moulding process
especially for the 70%, 80% and 90%HS concentrations58-60
. As the temperature
increased, the storage moduli of the composites were seen to decrease abruptly
between 0°C to 70°C. The characteristic drop in the storage moduli of the TPU
composites can be observed to have happened in the region after the occurrence of
TgMP. This observation correlates with the 1st DSC heating cycle observed (TgMP for
DMTA = 11±0.2; TgMP for DSC = 11±0.2) for the moulded 70%HS 2m13pd TPU as
shown previously in Figure 3.11 (a). Furthermore, pronounced peaks were observed
(especially for the 70% and 80%) at higher temperature and these peaks were
characteristic of phase separation which occurred after the TgMP. No phase separation
peak was observed for the 100%HS TPU composite. The occurrence of phase
separation also correlates with the 1st heating DSC exothermic peak transitions seen
for the moulded 70%HS 2m13pd TPU in Figure 3.11 (a). The storage moduli of the
composites were low at 100°C due to the low crystallinity of 2m13pd TPUs. Figure
4.4 – I (b) shows the tan delta curves of the composites. The main relaxation peaks
(b)
(a)

142
observed between 0°C to 100°C were attributed to the Tgs (TgMP for the 70%, 80%
and 90%HS and TgHS for the 100%HS) and the phase separation transitions of the
2m13pd TPU composites.
Figure 4.4 – II (a) shows that the storage moduli of the TPU composites were
increased after annealing. Pronounced improvement in the storage moduli of
annealed composites is seen at high temperature (100°C). During the annealing
process, the HS of the TPU become ordered thereby increasing the crystallinity,
which consequently led to the increase in mechanical properties118-119, 210
. Upon
annealing, the low temperature disordered segmental arrangements were erased due
to improved crystallization as the amorphous HS have been orderly arranged. The
improvement in the storage moduli as a result of annealing can be seen in Figure
4.5. Annealing also improved the phase-separated morphology of the 2m13pd TPU
composites as the TgSP and TgHP / TgHS were clearly seen on the tan delta curves of
the annealed 2m13pd TPU composites in Figure 4.4 – II (b). The peaks observed
for the unannealed TPU composites were erased as a result of annealing. The TgSP
was clearly seen at about -11±0.9°C for the 70%HS only whereas TgHS was clearly
seen at about 69±0.5°C for the 100% HS. Also, TgHP was also seen for the 70%, 80%
and 90%HS. Improvement in the crystallinity of the annealed TPU composites is
evidenced by the 1st DSC heating cycle of the annealed moulded 70% and 100%HS
2m13pd TPUs shown in Figures 3.12 (a) and (b). The Tgs of the TPU were more
noticeable in the DMTA technique than the DSC technique and this is because the
DMTA technique is more sensitive to the relaxation transitions occurring in the TPU
samples than the DSC technique.

143
4.4.2.2 15PD TPU COMPOSITES
-100 -50 0 50 100 150 200
1
10
100
1000
10000
TPU comp (15pd-70)
TPU comp (15pd-80)
TPU comp (15pd-90)
TPU comp (15pd-100)
Sto
ra
ge
M
od
ulu
s (M
Pa
)
Temperature (ºC)
-100 -50 0 50 100 150
0.0
0.2
0.4
0.6 TPU comp (15pd-70)
TPU comp (15pd-80)
TPU comp (15pd-90)
TPU comp (15pd-100)
Ta
n D
elta
Temperature (ºC)
I. Unannealed TPU composites
-100 -50 0 50 100 150 200
1
10
100
1000
10000
Ann. TPU comp (15pd-70)
Ann. TPU comp (15pd-80)
Ann. TPU comp (15pd-90)
Ann. TPU comp (15pd-100)
Sto
ra
ge
M
od
ulu
s (M
Pa
)
Temperature (ºC)
-100 -50 0 50 100 150
0.0
0.2
0.4
0.6 Ann. TPU comp (15pd-70)
Ann. TPU comp (15pd-80)
Ann. TPU comp (15pd-90)
Ann. TPU comp (15pd-100)
Ta
n D
elta
Temperature (ºC)
II. Annealed TPU composites
Figure 4.6 (a) Storage modulus (b) tan delta of (I) unannealed 15pd TPU
composites (II) annealed 15pd TPU composites
TgSP
(a) (b)
TgSP
TgHP / TgHS
(b)
(a)

144
70 80 90 100
0
2000
4000
6000
8000
10000
12000
14000
TPU Composites
(15pd)
Sto
ra
ge
M
od
ulu
s (M
Pa
)
Hard Segment (%)
E' at -100º C
E' at 25º C
E' at 100º C
70 80 90 100
0
2000
4000
6000
8000
10000
12000
14000
Annealed TPU Composites
(15pd)
Sto
ra
ge
M
od
ulu
s (M
Pa
)
Hard Segment (%)
E' at -100º C
E' at 25º C
E' at 100º C
Figure 4.7 Storage moduli bar graph of (a) unannealed and (b) annealed 15pd TPU
composites
In Figure 4.6 – I (a), it is observed that the storage moduli of the 70% and 80%HS
begin to decrease earlier than those of the 90% and 100%HS. The observation can be
attributed to the occurrence of the TgSP at -24±0.7°C. This also showed that the 15pd
TPU samples are phase separated and semi-crystalline because they exhibit both Tg
and melting transitions. The properties of TPU composites are influenced by the
morphological changes of the TPU212-214
. There were predominant transitions at
47°C observed for 90% and 100% and these transitions were attributed to the TgHP
and TgHS respectively. After the TgHP / TgHS, peaks were observed which were
attributed to cold-crystallization. Figure 4.6 – I (b) showed that TgSP was clearly
observed for 70%HS. 90% and 100%HS TPU composites were characterized by
prominent relaxation peaks attributed to the occurrence of TgHP / TgHS and cold
crystallization peaks. It was observed that the relaxation peak shifted to higher
temperatures with increase in HS concentration. It was also observed that the
magnitude of tan delta peaks also increased with increasing HS concentration. This
therefore relates to the composition of the TPU constituents (amount of NCO/OH) as
well as the HS transition temperatures103, 111
.
(b) (a)

145
The storage moduli of the TPU composites were increased after annealing especially
at 100°C and this is evidenced by the disappearance of cold crystallization as shown
in Figure 4.6 – II (a). The difference in the storage moduli of unannealed and
annealed TPU composites can be seen in Figure 4.7. Greater phase separation was
also achieved upon annealing as TgSP was prominently observed for only the 70%HS
in Figure 4.6 – II (b). The TgSP values of the 70%HS for both unannealed and
annealed 15pd TPU composites were -24±0.7°C and -20±0.2°C respectively. The
decrease in the TgSP value for the annealed 70%HS 15pd TPU composite was
attributed to the increased phase separation of the HS from the SS whereas the
increase in the TgSP value for unannealed 70%HS 15pd TPU composite can be
attributed either to the presence of HS in the SB phase or the mobility restriction
caused by the HS on which the SS were anchored215
. The TgHP was seen for the 70%,
80% and 90%HS TPU composites whereas TgHS was seen for the 100%HS.

146
4.4.2.3 16HD TPU COMPOSITES
-100 -50 0 50 100 150
100
1000
10000
TPU comp (16hd-70)
TPU comp (16hd-80)
TPU comp (16hd-90)
TPU comp (16hd-100)
Sto
ra
ge
M
od
ulu
s (M
Pa
)
Temperature (ºC)
-100 -50 0 50 100 150
0.00
0.05
0.10
0.15
0.20
0.25
0.30
0.35
TPU comp (16hd-70)
TPU comp (16hd-80)
TPU comp (16hd-90)
TPU comp (16hd-100)
Ta
n D
elta
Temperature (ºC)
I. Unannealed TPU composites
-100 -50 0 50 100 150
100
1000
10000
Ann. TPU comp (16hd-70)
Ann. TPU comp (16hd-80)
Ann. TPU comp (16hd-90)
Ann. TPU comp (16hd-100)
Sto
ra
ge
M
od
ulu
s (M
Pa
)
Temperature (ºC)
-100 -50 0 50 100 150
0.00
0.05
0.10
0.15
0.20
0.25
0.30
0.35
Ann. TPU comp (16hd-70)
Ann. TPU comp (16hd-80)
Ann. TPU comp (16hd-90)
Ann. TPU comp (16hd-100)
Ta
n D
elta
Temperature (ºC)
II. Annealed TPU composites
Figure 4.8 (a) Storage modulus (b) tan delta of (I) unannealed 16hd TPU
composites (II) annealed 16hd TPU composites
(b) (a)
TgSP
TgHP / TgHS
(b)
(a)
TgSP

147
70 80 90 100
0
2000
4000
6000
8000
10000
12000
14000
TPU Composites
(16hd)
Sto
ra
ge
M
od
ulu
s (M
Pa
)
Hard Segment (%)
E' at -100º C
E' at 25º C
E' at 100º C
70 80 90 100
0
2000
4000
6000
8000
10000
12000
14000
Annealed TPU Composites
(16hd)
Sto
ra
ge
M
od
ulu
s (M
Pa
)
Hard Segment (%)
E' at -100º C
E' at 25º C
E' at 100º C
Figure 4.9 Storage moduli bar graph of (a) unannealed and (b) annealed 16hd TPU
composites
In Figure 4.8 – I (a), the phase transitions of the unannealed 16hd TPU composites
were seen to be similar to those of the unannealed 15pd TPU composites discussed
in Figure 4.6 – I (a). The storage moduli of the 70% and 80%HS TPU composites
first began to decrease due to the occurrence of TgSP. These set of samples are phase-
separated and semi-crystalline. TgHP / TgHS and cold crystallization peaks were
observed for the 90% and 100% HS TPU composites. For the 90% and 100%HS
TPU composites pronounced melting-recrystallization-melting peaks are observed
(i.e. double melting peaks and a recrystallization peak) immediately after the cold
crystallization peaks. As discussed earlier, studies have revealed the occurrence of
multiple endothermic transitions in TPUs which are as a result of the presence of
polymorphic structures and this is the case with the 16hd TPUs116, 118, 121, 125, 206-209
.
The DMTA observations are similar to those discussed in the 1st heating DSC
transitions of the moulded 70% and 100%HS 16hd TPUs in Figures 3.11 (a) and
(b). Figure 4.8 – I (b) showed that TgSP was clearly observed for the 70% HS
whereas the 90% and 100% HS TPU composites were characterized by prominent
relaxation peaks attributed to the occurrence of TgHP / TgHS and cold crystallization
peaks.
(b)
(a)

148
In Figure 4.8 – II (a), annealing was seen to increase the storage moduli of the 16hd
TPU composites especially at 100°C. The cold-crystallization peaks were erased by
annealing. However, at temperatures above 150°C the melting-recrystallization-
melting peaks were still observed. These peaks were not erased during annealing
primarily because of the annealing temperature (80°C) used, which is too low to
erase the melting-recrystallization-melting transitions which occurred at higher
temperatures. Like the annealed 15pd TPU composites, TgSP and TgHP / TgHS were
clearly observed for annealed 16hd TPU composites as shown in Figure 4.8 – II (b).
The observation therefore confirmed that greater phase separation was achieved
during the annealing process. Figure 4.9 reveals the improvement in the thermo-
mechanical properties of the TPU composites due to annealing.

149
4.4.2.4 17HPD TPU COMPOSITES
-100 -50 0 50 100 150 200
10
100
1000
10000
TPU comp (17hpd-70)
TPU comp (17hpd-100)
Sto
ra
ge
M
od
ulu
s (M
Pa
)
Temperature (ºC)
-50 0 50 100 150
0.00
0.05
0.10
0.15
0.20
TPU comp (17hpd-70)
TPU comp (17hpd-100)
Ta
n D
elta
Temperature (ºC)
I. Unannealed TPU composites
-100 -50 0 50 100 150 200
10
100
1000
10000
Ann. TPU comp (17hpd-70 )
Ann. TPU comp (17hpd-100)
Sto
ra
ge
M
od
ulu
s (M
Pa
)
Temperature (ºC)
-50 0 50 100 150
0.00
0.05
0.10
0.15
0.20
Ann. TPU comp (17hpd-70)
Ann. TPU comp (17hpd-100)
Ta
n D
elta
Temperature (ºC)
II. Annealed TPU composites
Figure 4.10 (a) Storage modulus (b) tan delta of (I) unannealed 17hpd TPU
composites (II) annealed 17hpd TPU composites
(a)
(b)
TgSP
TgHP / TgHS
(b)
(a)
TgSP
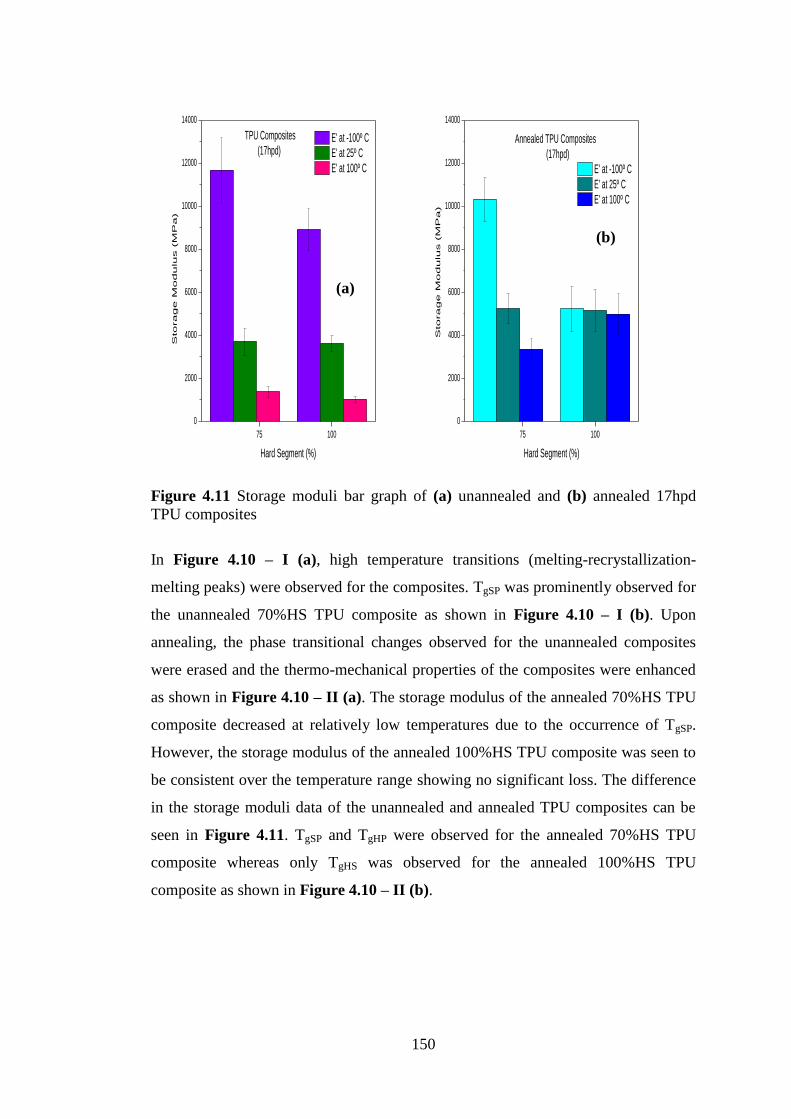
150
75 100
0
2000
4000
6000
8000
10000
12000
14000
TPU Composites
(17hpd)
Sto
ra
ge
M
od
ulu
s (M
Pa
)
Hard Segment (%)
E' at -100º C
E' at 25º C
E' at 100º C
75 100
0
2000
4000
6000
8000
10000
12000
14000
Annealed TPU Composites
(17hpd)
Sto
ra
ge
M
od
ulu
s (M
Pa
)
Hard Segment (%)
E' at -100º C
E' at 25º C
E' at 100º C
Figure 4.11 Storage moduli bar graph of (a) unannealed and (b) annealed 17hpd
TPU composites
In Figure 4.10 – I (a), high temperature transitions (melting-recrystallization-
melting peaks) were observed for the composites. TgSP was prominently observed for
the unannealed 70%HS TPU composite as shown in Figure 4.10 – I (b). Upon
annealing, the phase transitional changes observed for the unannealed composites
were erased and the thermo-mechanical properties of the composites were enhanced
as shown in Figure 4.10 – II (a). The storage modulus of the annealed 70%HS TPU
composite decreased at relatively low temperatures due to the occurrence of TgSP.
However, the storage modulus of the annealed 100%HS TPU composite was seen to
be consistent over the temperature range showing no significant loss. The difference
in the storage moduli data of the unannealed and annealed TPU composites can be
seen in Figure 4.11. TgSP and TgHP were observed for the annealed 70%HS TPU
composite whereas only TgHS was observed for the annealed 100%HS TPU
composite as shown in Figure 4.10 – II (b).
(a)
(b)

151
4.4.2.5 18OD TPU COMPOSITES
-100 -50 0 50 100 150 200
100
1000
10000
TPU comp (18od-70)
TPU comp (18od-100)
Sto
ra
ge
M
od
ulu
s (M
Pa
)
Temperature (ºC)
-100 -50 0 50 100 150
0.00
0.02
0.04
0.06
0.08
0.10
0.12
TPU comp (18od-70)
TPU comp (18od-100)
Ta
n D
elta
Temperature (ºC)
I. Unannealed TPU composites
-100 -50 0 50 100 150 200
100
1000
10000
Ann. TPU comp (18od-70 )
Ann. TPU comp (18od-100)
Sto
ra
ge
M
od
ulu
s (M
Pa
)
Temperature (ºC)
-100 -50 0 50 100 150
0.00
0.02
0.04
0.06
0.08
0.10
0.12
Ann. TPU comp (18od-70)
Ann. TPU comp (18od-100)
Ta
n D
elta
Temperature (ºC)
II. Annealed TPU composites
Figure 4.12 (a) Storage modulus (b) tan delta of (I) unannealed 18od TPU
composites (II) annealed 18od TPU composites
(b) (a)
(b)
TgSP
TgHP / TgHS
(a)
TgSP
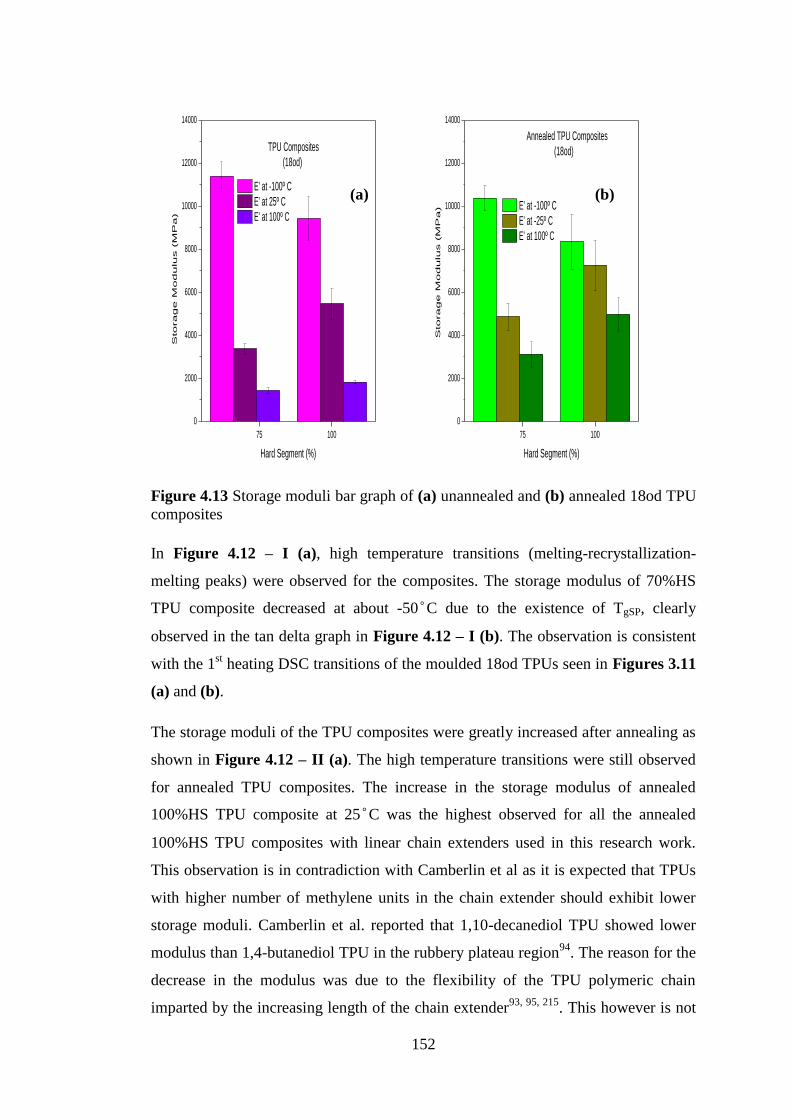
152
75 100
0
2000
4000
6000
8000
10000
12000
14000
TPU Composites
(18od)S
to
ra
ge
M
od
ulu
s (M
Pa
)
Hard Segment (%)
E' at -100º C
E' at 25º C
E' at 100º C
75 100
0
2000
4000
6000
8000
10000
12000
14000
Annealed TPU Composites
(18od)
Sto
ra
ge
M
od
ulu
s (M
Pa
)
Hard Segment (%)
E' at -100º C
E' at -25º C
E' at 100º C
Figure 4.13 Storage moduli bar graph of (a) unannealed and (b) annealed 18od TPU
composites
In Figure 4.12 – I (a), high temperature transitions (melting-recrystallization-
melting peaks) were observed for the composites. The storage modulus of 70%HS
TPU composite decreased at about -50°C due to the existence of TgSP, clearly
observed in the tan delta graph in Figure 4.12 – I (b). The observation is consistent
with the 1st heating DSC transitions of the moulded 18od TPUs seen in Figures 3.11
(a) and (b).
The storage moduli of the TPU composites were greatly increased after annealing as
shown in Figure 4.12 – II (a). The high temperature transitions were still observed
for annealed TPU composites. The increase in the storage modulus of annealed
100%HS TPU composite at 25°C was the highest observed for all the annealed
100%HS TPU composites with linear chain extenders used in this research work.
This observation is in contradiction with Camberlin et al as it is expected that TPUs
with higher number of methylene units in the chain extender should exhibit lower
storage moduli. Camberlin et al. reported that 1,10-decanediol TPU showed lower
modulus than 1,4-butanediol TPU in the rubbery plateau region94
. The reason for the
decrease in the modulus was due to the flexibility of the TPU polymeric chain
imparted by the increasing length of the chain extender93, 95, 215
. This however is not
(b) (a)

153
the case in our work. The reason for this observation is that Camberlin et al used
about 30%HS for their studies whereas in this research work, higher %HS
concentrations (70% to 100%) were used. TgSP and TgHP were observed for the
annealed 70%HS TPU composite whereas only TgHS was observed for the annealed
100%HS TPU composite as shown in Figure 4.12 – II (b). The difference in the
storage moduli of the unannealed and annealed TPU composites can be seen in
Figure 4.13.

154
4.4.2.6 14CHDM TPU COMPOSITES
-100 -50 0 50 100 150 200
1
10
100
1000
10000
TPU comp (14chdm-70)
TPU comp (14chdm-80)
TPU comp (14chdm-90)
TPU comp (14chdm-100)
Sto
ra
ge
M
od
ulu
s (M
Pa
)
Temperature (ºC)
-100 -50 0 50 100 150
0.0
0.2
0.4
0.6
0.8
1.0
1.2
1.4
1.6
TPU comp (14chdm-70)
TPU comp (14chdm-80)
TPU comp (14chdm-90)
TPU comp (14chdm-100)
Ta
n D
elta
Temperature (ºC)
I. Unannealed TPU composites
-100 -50 0 50 100 150 200
1
10
100
1000
10000
Ann. TPU comp (14chdm-70)
Ann. TPU comp (14chdm-80)
Ann. TPU comp (14chdm-90)
Ann. TPU comp (14chdm-100)
Sto
ra
ge
M
od
ulu
s (M
Pa
)
Temperature (ºC)
-100 -50 0 50 100 150
0.0
0.2
0.4
0.6
0.8
1.0
1.2
1.4
1.6
Ann. TPU comp (14chdm-70)
Ann. TPU comp (14chdm-80)
Ann. TPU comp (14chdm-90)
Ann. TPU comp (14chdm-100)
Ta
n D
elta
Temperature (ºC)
II. Annealed TPU composites
Figure 4.14 (a) Storage modulus (b) tan delta of (I) unannealed 14chdm TPU
composites (II) annealed 14chdm TPU composites
(a) (b)
TgHP / TgHS
TgSP
(b)
(a)
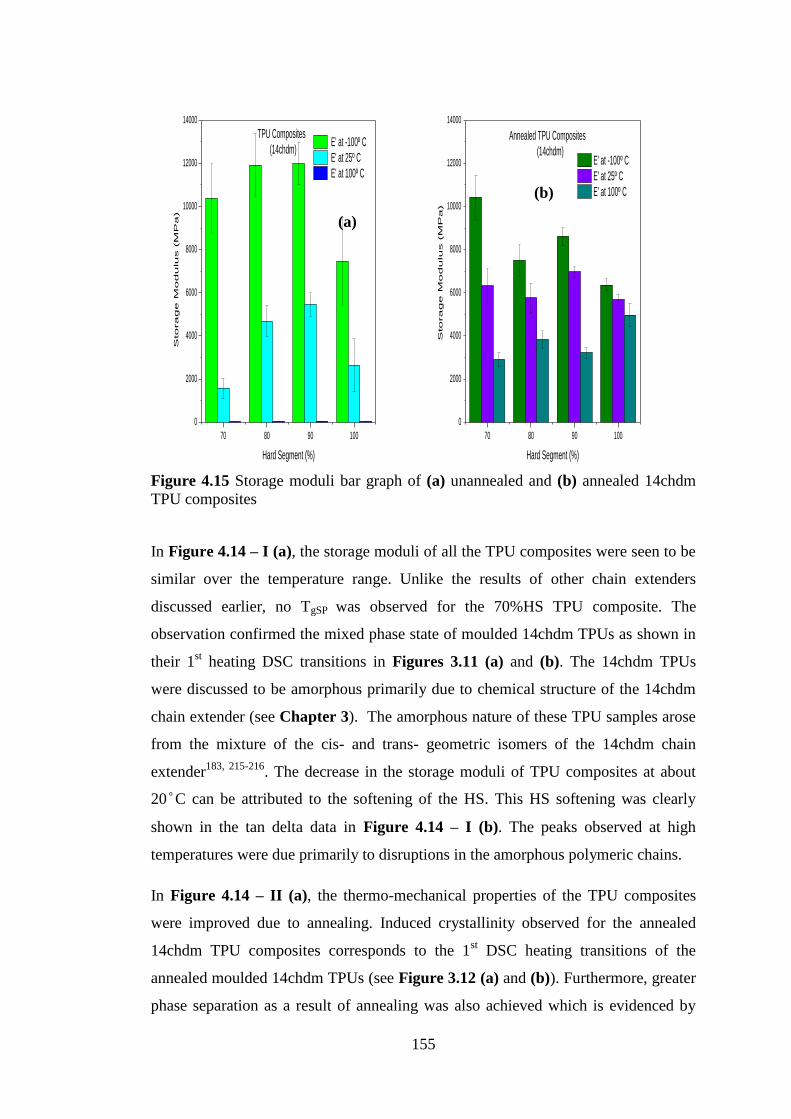
155
70 80 90 100
0
2000
4000
6000
8000
10000
12000
14000
TPU Composites
(14chdm)
Sto
ra
ge
M
od
ulu
s (M
Pa
)
Hard Segment (%)
E' at -100º C
E' at 25º C
E' at 100º C
70 80 90 100
0
2000
4000
6000
8000
10000
12000
14000
Annealed TPU Composites
(14chdm)
Sto
ra
ge
M
od
ulu
s (M
Pa
)
Hard Segment (%)
E' at -100º C
E' at 25º C
E' at 100º C
Figure 4.15 Storage moduli bar graph of (a) unannealed and (b) annealed 14chdm
TPU composites
In Figure 4.14 – I (a), the storage moduli of all the TPU composites were seen to be
similar over the temperature range. Unlike the results of other chain extenders
discussed earlier, no TgSP was observed for the 70%HS TPU composite. The
observation confirmed the mixed phase state of moulded 14chdm TPUs as shown in
their 1st heating DSC transitions in Figures 3.11 (a) and (b). The 14chdm TPUs
were discussed to be amorphous primarily due to chemical structure of the 14chdm
chain extender (see Chapter 3). The amorphous nature of these TPU samples arose
from the mixture of the cis- and trans- geometric isomers of the 14chdm chain
extender183, 215-216
. The decrease in the storage moduli of TPU composites at about
20°C can be attributed to the softening of the HS. This HS softening was clearly
shown in the tan delta data in Figure 4.14 – I (b). The peaks observed at high
temperatures were due primarily to disruptions in the amorphous polymeric chains.
In Figure 4.14 – II (a), the thermo-mechanical properties of the TPU composites
were improved due to annealing. Induced crystallinity observed for the annealed
14chdm TPU composites corresponds to the 1st DSC heating transitions of the
annealed moulded 14chdm TPUs (see Figure 3.12 (a) and (b)). Furthermore, greater
phase separation as a result of annealing was also achieved which is evidenced by
(b)
(a)
156
the occurrence of TgSP at 11±0.6°C for the annealed 70%HS TPU composite. The
annealed 80% and 100%HS TPU composites showed higher storage moduli at high
temperatures (above 100°C). TgSP and TgHS were observed for the annealed 70% and
100%HS TPU composites, respectively, whereas TgHP was observed for the annealed
70%, 80% and 90%HS TPU composites, respectively, as shown in Figure 4.14 – II
(b). The storage moduli of the unannealed and annealed 14chdm TPU composites
can be seen in Figure 4.15.

157
4.4.3 TPU COMPOSITES vs POLYPROPYLENE and ISOPLAST
COMPOSITES
4.4.3.1 70%HS TPU COMPOSITES vs POLYPROPYLENE vs
ISOPLAST
-100 -50 0 50 100 150
1
10
100
1000
10000
Sto
rag
e M
od
ulu
s (M
Pa
)
Temperature (ºC)
TPU comp (2m13pd-70)
TPU comp (15pd-70)
TPU comp (16hd-70)
TPU comp (17hpd-70)
TPU comp (18od-70)
TPU comp (14chdm-70)
PP composite
Isoplast composite
-100 -50 0 50 100 150
1
10
100
1000
10000
Sto
rag
e M
od
ulu
s (M
Pa
)
Temperature (ºC)
Ann. TPU comp (2m13pd-70)
Ann. TPU comp (15pd-70)
Ann. TPU comp (16hd-70)
Ann. TPU comp (17hpd-70)
Ann. TPU comp (18od-70)
Ann. TPU comp (14chdm-70)
Ann. PP comp
Ann. Isoplast comp
Figure 4.16 Storage moduli of (a) unannealed composites (b) annealed composites
of 70% HS TPU composites having different chain extenders vs PP and Isoplast
composite
(a)
(b)

158
Table 4.2: Storage moduli data of unannealed and annealed 70% TPU vs
Polypropylene vs Isoplast composites
Unannealed / Annealed E’ at -100° C /
MPa
E’ at 25° C /
MPa
E’ at 100° C /
MPa
TPU comp-2m13pd-70 11333±704 /
10979±1690
4085±1076 /
6678±920
453±84 /
3865±470
TPU comp-15pd-70 12395±1892 /
12040±588
5190±732 /
5520±306
1666±185 /
3019±140
TPU comp-16hd-70 10615±666 /
10534±2021
3354±106 /
4962±789
1175±147 /
2861±426
TPU comp-17hpd-70 12353±1529 /
11445±1026
4255±630 /
6008±700
1601±248 /
3896±489
TPU comp-18od-70 11828±711 /
10891±586
3555±239 /
5459±618
1575±131 /
3688±612
TPU comp-14chdm-70 12122±1628 /
11582±1020
2103±459 /
7225±789
20±3 /
3217±339
PP composite 12264±484 /
12957±175
7899±342 /
8998±87
4929±312 /
5836±141
Isoplast composite 8249±315 /
6785±262
6857±203 /
5823±303
974±71 /
2955±206
Commercially available polypropylene (PP) and Isoplast (I) were used as
thermoplastic benchmarks for our designed TPU materials. The moulding
temperatures used in processing PP (200ºC) and I composites (240ºC) were different
from that of the TPU composites (180ºC). The granules were first flattened in the
compression press at temperatures (180ºC and 200ºC respectively) below their
melting temperatures. For PP and I composites, moulds were preheated to 200ºC and
240ºC respectively. Like the TPU composites, the PP and I composites were also
annealed at 80°C for 168 hours. The thermo-mechanical properties (storage moduli)
of 70% HS TPU composites with different chain extenders were compared with PP
and I composites.
In Figure 4.16 (a), the modulus of the unannealed PP composite at 25°C were seen
to be slightly higher than the unannealed TPU and I composites; however, at 100°C,
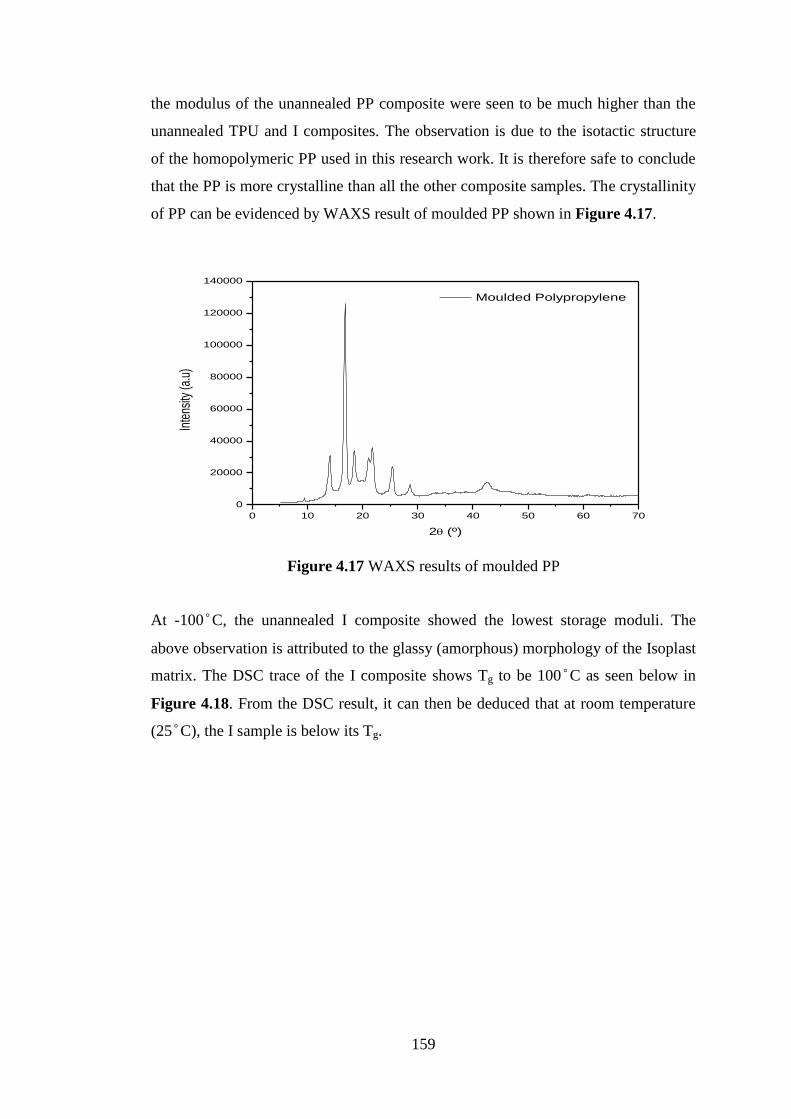
159
the modulus of the unannealed PP composite were seen to be much higher than the
unannealed TPU and I composites. The observation is due to the isotactic structure
of the homopolymeric PP used in this research work. It is therefore safe to conclude
that the PP is more crystalline than all the other composite samples. The crystallinity
of PP can be evidenced by WAXS result of moulded PP shown in Figure 4.17.
0 10 20 30 40 50 60 70
0
20000
40000
60000
80000
100000
120000
140000
Inte
nsity
(a.u
)
2(º)
Moulded Polypropylene
Figure 4.17 WAXS results of moulded PP
At -100°C, the unannealed I composite showed the lowest storage moduli. The
above observation is attributed to the glassy (amorphous) morphology of the Isoplast
matrix. The DSC trace of the I composite shows Tg to be 100°C as seen below in
Figure 4.18. From the DSC result, it can then be deduced that at room temperature
(25°C), the I sample is below its Tg.

160
0 50 100 150 200
-0.8
-0.6
-0.4
1st Heating Cycle
Hea
t Flo
w (W
/g)
Temperature (ºC)
Isoplast composite
Figure 4.18 1st heating DSC result of Isoplast composite
Figure 4.16 (b) shows the storage modulus of the annealed PP composite is slightly
higher than the storage moduli of the annealed TPU and I composites in all
temperatures. This is due to the higher crystallinity level of the PP sample whereas
for the annealed 70%HS TPU composites, only 70% can form a crystalline phase.
Table 4.2 shows the data of the storage moduli of the annealed and unannealed TPU,
PP and I composites. It can also be observed that the moduli of the TPU composites
can compete with those of the PP and I composites.
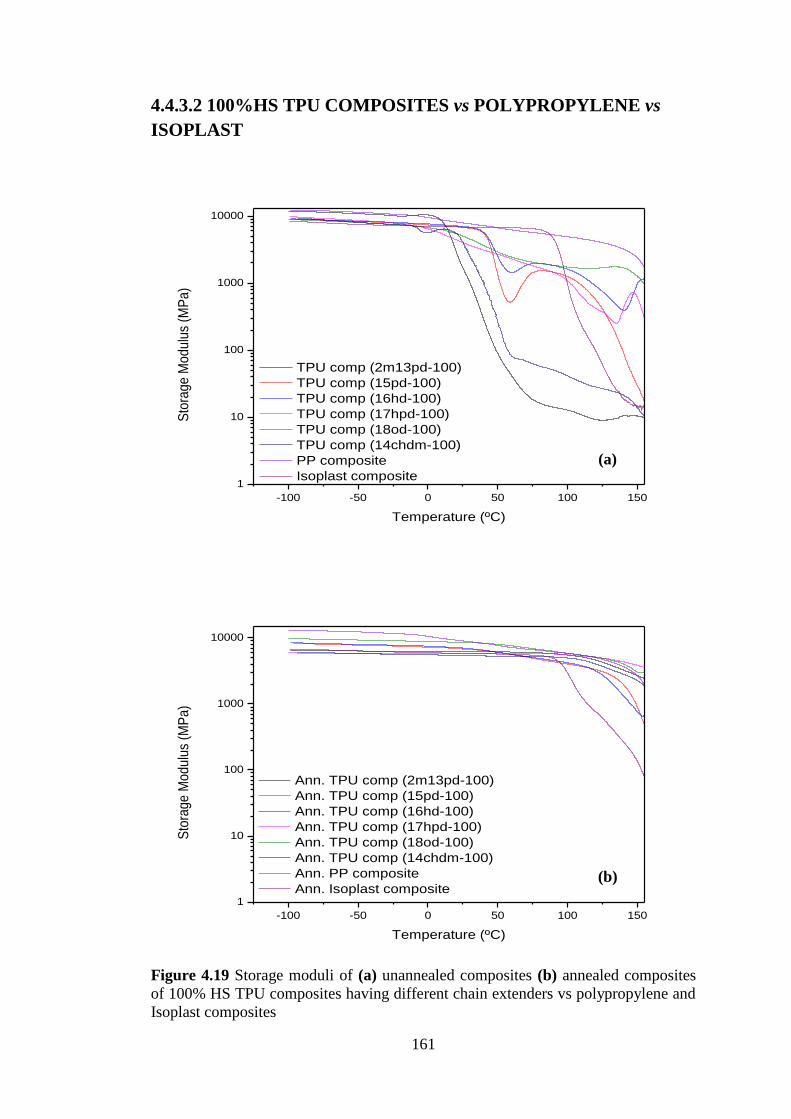
161
4.4.3.2 100%HS TPU COMPOSITES vs POLYPROPYLENE vs
ISOPLAST
-100 -50 0 50 100 150
1
10
100
1000
10000
Sto
rag
e M
od
ulu
s (M
Pa
)
Temperature (ºC)
TPU comp (2m13pd-100)
TPU comp (15pd-100)
TPU comp (16hd-100)
TPU comp (17hpd-100)
TPU comp (18od-100)
TPU comp (14chdm-100)
PP composite
Isoplast composite
-100 -50 0 50 100 150
1
10
100
1000
10000
Sto
rag
e M
od
ulu
s (M
Pa
)
Temperature (ºC)
Ann. TPU comp (2m13pd-100)
Ann. TPU comp (15pd-100)
Ann. TPU comp (16hd-100)
Ann. TPU comp (17hpd-100)
Ann. TPU comp (18od-100)
Ann. TPU comp (14chdm-100)
Ann. PP composite
Ann. Isoplast composite
Figure 4.19 Storage moduli of (a) unannealed composites (b) annealed composites
of 100% HS TPU composites having different chain extenders vs polypropylene and
Isoplast composites
(a)
(b)

162
Table 4.3: Storage moduli data of unannealed and annealed 100% TPU vs Polypropylene
and Isoplast composites
Unannealed / Annealed E’ at -100° C /
MPa
E’ at 25° C /
MPa
E’ at 100° C /
MPa
TPU comp-2m13pd-100
11778±6433 /
6427±1565
1676±456 /
6226±1469
13±68 /
5502±1279
TPU comp-15pd-100
8965±933 /
8175±314
6763±854 /
6801±120
1250±80 /
4017±242
TPU comp-16hd-100
9170±1827 /
8396±1477
7009±1537 /
7015±1157
1606±271 /
4202±521
TPU comp-17hpd-100
9774±966 /
5916±1040
4010±386 /
5764±987
1082±125 /
5557±929
TPU comp-18od-100
8794±1016 /
9757±1278
5040±736 /
8520±1152
1738±73 /
5852±770
TPU comp-14chdm-100
9172±2052 /
6067±282
4041±1226 /
5415±264
41±9 /
4967±548
Polypropylene composite
12264±484 /
12957±175
7899±342 /
8998±87
4929±312 /
5836±141
Isoplast composite
8249±315 /
6785±262
6857±203 /
5823±303
974±71 /
2955±206
In Figure 4.19 (a), the modulus of the unannealed PP composite at 25°C were seen
to be slightly higher than the unannealed TPU and I composites; however, at 100°C,
the modulus of the unannealed PP composite were seen to be much higher than the
unannealed TPU and I composites. In Figure 4.19 (b), the storage modulus of the
annealed 18od-100%HS TPU composite is almost similar with the annealed PP
composite. The reason for the observation is that for the annealed 100%HS TPU
composites, all 100% of the TPU polymer contributes to its overall crystallinity and
consequently much improved mechanical properties. From the Table 4.3, the storage
moduli of the annealed TPU composites compare well with those of annealed PP and
I composites.
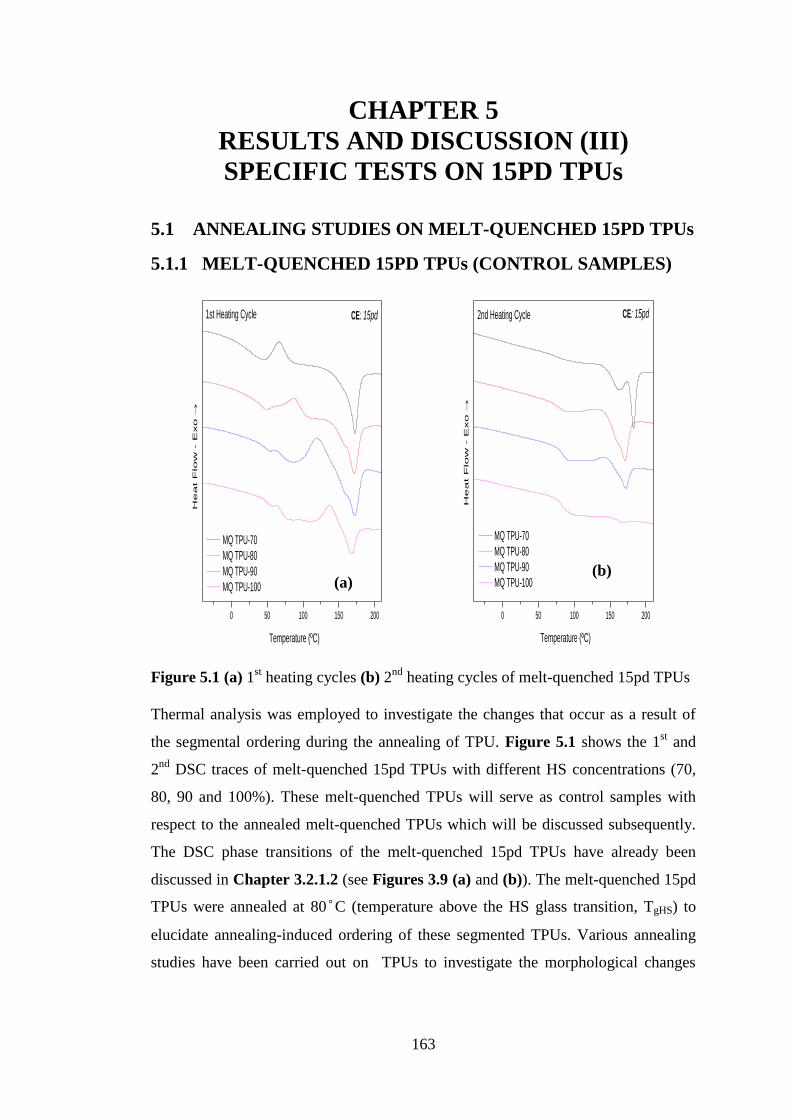
163
CHAPTER 5
RESULTS AND DISCUSSION (III)
SPECIFIC TESTS ON 15PD TPUs
5.1 ANNEALING STUDIES ON MELT-QUENCHED 15PD TPUs
5.1.1 MELT-QUENCHED 15PD TPUs (CONTROL SAMPLES)
0 50 100 150 200
He
at F
low
- E
xo
MQ TPU-70
MQ TPU-80
MQ TPU-90
MQ TPU-100
Temperature (ºC)
CE: 15pd1st Heating Cycle
0 50 100 150 200
He
at F
low
- E
xo
MQ TPU-70
MQ TPU-80
MQ TPU-90
MQ TPU-100
Temperature (ºC)
2nd Heating Cycle CE: 15pd
Figure 5.1 (a) 1st heating cycles (b) 2
nd heating cycles of melt-quenched 15pd TPUs
Thermal analysis was employed to investigate the changes that occur as a result of
the segmental ordering during the annealing of TPU. Figure 5.1 shows the 1st and
2nd
DSC traces of melt-quenched 15pd TPUs with different HS concentrations (70,
80, 90 and 100%). These melt-quenched TPUs will serve as control samples with
respect to the annealed melt-quenched TPUs which will be discussed subsequently.
The DSC phase transitions of the melt-quenched 15pd TPUs have already been
discussed in Chapter 3.2.1.2 (see Figures 3.9 (a) and (b)). The melt-quenched 15pd
TPUs were annealed at 80°C (temperature above the HS glass transition, TgHS) to
elucidate annealing-induced ordering of these segmented TPUs. Various annealing
studies have been carried out on TPUs to investigate the morphological changes
(b) (a)

164
occurring within the segmental chains; and consequently the phase transitions of the
TPUs are altered as well33, 35-36, 39-40, 58-59, 63, 116, 118-121, 125-127, 208-209, 215, 217-220
.
DSC studies of annealed TPUs have reported on the existence of annealing
endotherms which are relative to the annealing temperatures employed. The
annealing endotherms are reported to result from the discontinuity of ordered
segments. Between the Tgs of the amorphous segments and the melting transitions of
the crystalline segments, there is a succession of ordered segmental morphologies.
Dissociation of these ordered segments requires a certain amount of energy and
therefore an endothermic transition is noticed. These endothermic transitions exist at
temperatures below the crystalline melting temperature, because the energies needed
for their dissociation are lower due to a lower degree of ordering than the crystalline
phases116, 118-119
.
When a sample is subjected to a particular temperature, order which disorders
beneath the annealing temperature will disappear and those segmental chains
affected will exist in a liquid-like state. If during annealing the liquid-like segments
are to return back to a solid state structure, there must be a reorganization of the
segments to an order which will be unalterable at the annealing temperature. More
liquid-like segments may be added to the more stable and ordered segments which
act as nuclei in a process similar to that of recrystallization. It is also suggested that
more stable segments may grow out of amorphous phases and thereby increasing the
number of the ordered chains. The annealing endothermic transition therefore
denotes the degree of order of the structures produced during the annealing process.
Higher annealing temperatures therefore lead to annealing endotherms with larger
melting peak areas as more structure is disorganized and reorganized with a higher
degree of crystal perfection116, 118-119
.

165
5.1.2 ISOTHERMAL ANNEALING STUDIES
0 50 100 150 200
He
at F
low
- E
xo
Ann. MQ TPU-100 (8hrs)
Ann. MQ TPU-100 (24hrs)
Ann. MQ TPU-100 (72hrs)
Ann. MQ TPU-100 (168hrs)
Temperature (ºC)
1st Heating Cycle
a) Annealed melt-quenched 15pd-100 TPUs at different annealing times
0 50 100 150 200
He
at F
low
- E
xo
Ann. MQ TPU-90 (8hrs)
Ann. MQ TPU-90 (24hrs)
Ann. MQ TPU-90 (72hrs)
Ann. MQ TPU-90 (168hrs)
Temperature (ºC)
1st Heating Cycle CE: 15pd
b) Annealed melt-quenched 15pd-90 TPUs at different annealing times
(a)
(b)

166
0 50 100 150 200
He
at F
low
- E
xo
Ann. MQ TPU-80 (8hrs)
Ann. MQ TPU-80 (24hrs)
Ann. MQ TPU-80 (72hrs)
Ann. MQ TPU-80 (168hrs)
Temperature (ºC)
1st Heating Cycle CE: 15pd
c) Annealed melt-quenched 15pd-80 TPUs at different annealing times
0 50 100 150 200
He
at F
low
- E
xo
Ann. MQ TPU-70 (8hrs)
Ann. MQ TPU-70 (24hrs)
Ann. MQ TPU-70 (72hrs)
Ann. MQ TPU-70 (168hrs)
Temperature (ºC)
1st Heating Cycle CE: 15pd
d) Annealed melt-quenched 15pd-70 TPUs at different annealing times
Figure 5.2 1st heating DSC cycles of (a) 100%HS (b) 90%HS (c) 80%HS and (d)
70%HS melt-quenched 15pd TPUs annealed at different annealing times (8, 24, 72
and 168 hours)
Figure 5.2 (a) shows the 1st heating DSC phase transitions of the melt-quenched
TPU-100%HS samples annealed at different annealing times. In the 1st heating DSC
(c)
(d)
167
cycle, annealing endotherms (TA) were observed for the melt-quenched TPU
100%HS samples. The temperatures of the annealing endotherms were seen to
increase with increase in annealing time. The annealing endotherms of the melt-
quenched TPU-100%HS at 8, 24, 72 and 168hrs were 137±0.05°C, 140±0.5°C,
151±0.9°C and 147±0.9°C respectively. It is somewhat interesting to see that the
annealing endotherm (TA) was observed for the 100%HS TPU. This therefore means
that the annealing-induced ordering is not dependent on the presence of the SS
phase. This also suggests that the ordering effected by annealing is an intraphase
occurrence rather than interphase between the HS and SS domains. It is therefore
safe to say that HS ordering can take place without the SS rubbery phase acting as a
plasticizer to enhance chain mobility118
. Since there are no SS in the 100%HS TPUs,
only melting temperatures of the HS (TM) are observed. The TM values of annealed
melt-quenched TPU-100%HS at 8, 24 and 168hrs were 164±0.2°C, 170±0.3°C and
174±0.02°C. No TM was recorded for the annealed melt-quenched TPU-100%HS at
72 hrs because the TA and TM coincide with each other. It is therefore difficult to
accurately resolve the TM for annealed melt-quenched TPU-100%HS at 72 hrs.
Figure 5.2 (b) shows the phase transitions of the melt-quenched TPU 90%HS
samples annealed at different annealing times. Like the 100%HS samples, the
temperatures of the annealing endotherms were seen to increase with increase in
annealing times. The annealing endotherms of the annealed melt-quenched TPU-
90%HS at 8, 24, 72 and 168hrs were 140±0.9°C, 142±0.5°C, 145±0.8°C and
148±0.01°C respectively. Since the 90%HS melt-quenched TPU sample contains
10% SS, it is therefore safe to deduce that the high-temperature endotherm is a
merger of TMMT and TM. On close observation, the TM appears as a shoulder on the
TMMT peak. However, due to the proximity of these two transitions, it is difficult to
resolve them apart. The temperatures of the microphase mixing transitions (TMMT)
were also observed to decrease with increasing HS concentration and this is due
primarily to the lesser proportion of SS with increasing HS content. For a 168-hour
annealing time, it can be observed that the temperatures of the annealing endotherms
increased primarily due to longer annealing time. This therefore implies that more
crystallisable HS were involved in the melting process. However, the TMMT
enthalpies were seen to decrease with increasing annealing times.

168
Figure 5.2 (c) shows the phase transitions of the melt-quenched TPU-80%HS
samples annealed at different annealing times. In the 1st heating DSC cycle,
annealing endotherms (TA) were observed for the annealed melt-quenched TPU-
80%HS samples. The annealing endotherms were seen to increase with increase in
annealing times. The annealing endotherms of the melt-quenched TPU-80%HS at 8,
24, 72 and 168hrs were 135±0.8°C, 139±0.3°C, 140±0.8°C and 146±0.7°C
respectively. The TA enthalpies of the annealed melt-quenched TPU-80%HS samples
are seen to be higher than those of the annealed melt-quenched TPU-70%HS
samples. The reason for this observation is the fact that more amorphous HS were
disrupted and reorganized in ordered structures as the HS concentration increases.
This therefore confirms that the annealed melt-quenched TPU-80%HS samples are
more crystalline than the annealed melt-quenched TPU-70%HS samples. The TMMT
values of the annealed melt-quenched TPU-80 at 8, 24, 72 and 168hrs were
172±0.02°C, 175±0.2°C, 174±0.4°C and 172±0.3°C.
Figure 5.2 (d) shows the DSC phase transitions of the melt-quenched TPU-70%HS
samples annealed at different annealing times. In the 1st heating DSC cycle,
annealing endotherms (TA) were observed for the annealed melt-quenched TPU-
70%HS samples. The annealing endotherms were seen to increase with increase in
annealing times. The annealing endotherms of the annealed melt-quenched TPU-
70%HS at 8, 24, 72 and 168hrs were 138±0.3°C, 140±0.5°C, 143±0.4°C and
146±0.5°C respectively. These annealing endotherms were in close proximity with
the microphase mixing transitions; TMMT (that is, melting of SS and crystalline HS
observed at higher temperatures). The annealing endotherms were also seen to be
observed at about 50-60°C above the annealing temperature (80°C). This observation
corresponds to those of Bogart et al118
. For the 8-hour annealing time, the annealing
endotherms were not prominently marked. As the annealing time increased, the size
of the annealing endotherms increased. The TA enthalpies of the melt-quenched
TPU-70%HS samples at 8, 24, 72 and 168hrs were 2.17J/g, 1.26J/g, 2.97J/g and
3.86J/g respectively. However, the TMMT values were seen to be consistent for the
annealed melt-quenched TPU-70%HS samples at different annealing times. The
TMMT values of the annealed melt-quenched TPU-70%HS at 8, 24, 72 and 168hrs are
175±0.6°C, 173±0.1°C, 174±0.4°C and 173±0.5°C. The TMMT enthalpies were seen
to decrease with increasing annealing times. Due to the increased crystallinity

169
induced by the annealing process, no Tg was observed for all the annealed melt-
quenched TPUs in the 1st heating DSC cycle. This is because the samples are
crystalline due to annealing and therefore amorphous regions that give rise to Tgs are
reduced.
It can be observed that annealing temperatures and times do not have any major
influence on the TM values as has been noticed from all the previous results. The
reason is that the crystallites of the HS have a well defined temperature at which they
melt. Therefore, while annealing is capable of changing the shape or the size of the
melting peak, it will not change its melting temperature116
. From the above results, it
is evident that annealing affects the thermodynamic and morphological properties of
TPUs. Although only one annealing temperature (80°C) was employed in this
research work, it has been observed that different annealing temperatures affect the
thermodynamic properties of TPUs as shown by several authors39, 59, 116, 118, 120
.
Table 5.1 shows the data for DSC phase transitions of the annealed melt-quenched
15pd TPU series at different annealing times.
Figure 5.3 shows a comparative graph of 70%, 80%, 90% and 100%HS annealed
melt-quenched TPUs after 8 hours of annealing with respect to TA and TMMT/TM.
70 80 90 100
135
140
145
150
155
160
165
170
175
DS
C tr
ansi
tions
afte
r 8h
r-an
neal
ing
at 8
0C
(C
)
Hard segment concentration (%)
TA
TMMT
/TM
Figure 5.3 TMMT/TM and TA vs HS concentration of 70%, 80%, 90% and 100%HS
annealed melt-quenched TPUs annealed for 8hrs

170
From Figure 5.3, we can observe that TMMT/TM decreases with increase in HS
concentration. The reason for the decrease is related directly to the decrease in the
amount of the SS in the TPUs (with 70%HS having the highest amount of SS
(30%)). This trend in the decrease of TMMT/TM is similar to that observed in the DSC
transitions for the cast, melt-quenched, slow-cooled, moulded and annealed moulded
15pd TPUs as discussed in Chapter 3.
Furthermore, TA values were observed to remain fairly constant with increase in HS
concentration. This therefore suggests that at the same annealing time, the annealing
effect on all the TPU samples (70%, 80%, 90% and 100%HS annealed melt-
quenched TPUs) is similar.
The melting enthalpy values (ΔH) of TMMT/TM and TA were seen to follow the same
trend with the above observations. ΔHtotal of TMMT/TM of the annealed melt-quenched
TPUs decreased with increase with HS concentration whereas the values of ΔHtotal of
TA remained fairly the same. This can be seen in Figure 5.4.
70 80 90 100
0
5
10
15
20
25
DS
C tr
ansi
tions
afte
r 8h
r-an
neal
ing
at 8
0C
(J/
g)
Hard segment concentration (%)
Htotal
of TA
Htotal
of TMMT
/TM
Figure 5.4 ΔHtotal of TMMT/TM and ΔHtotal of TA vs hard segment concentration of
70%, 80%, 90% and 100%HS annealed melt-quenched TPUs annealed for 8hrs
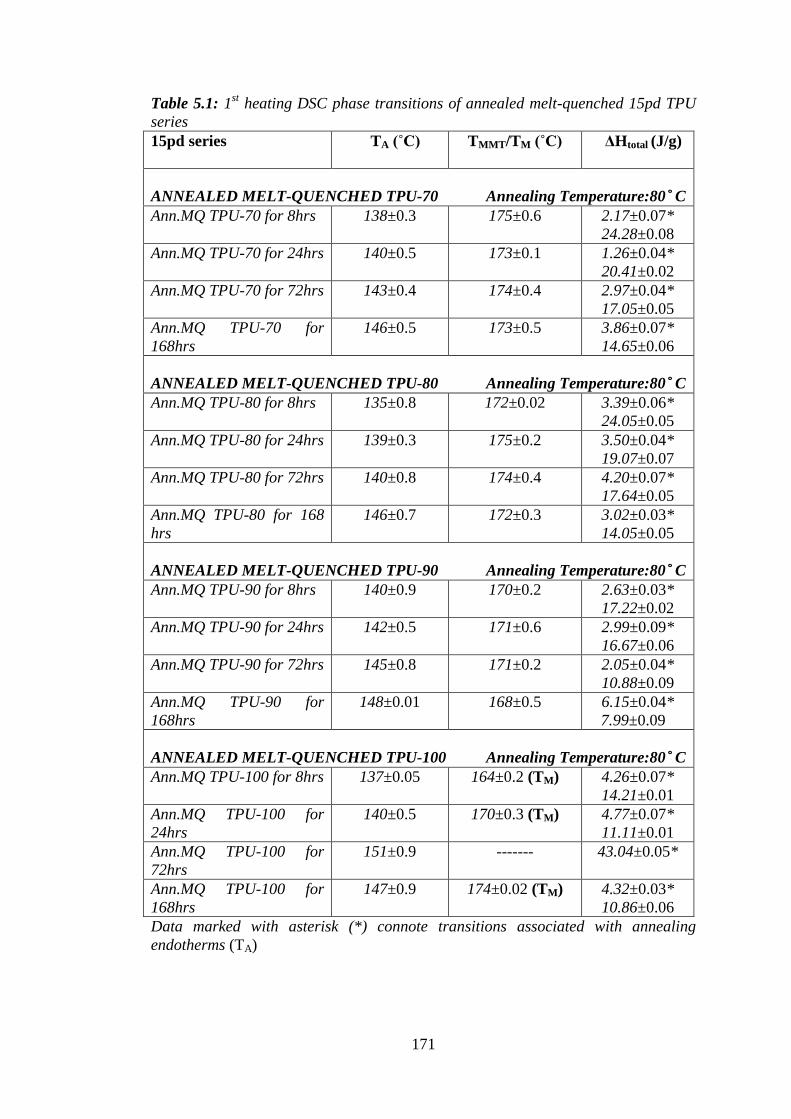
171
Table 5.1: 1st heating DSC phase transitions of annealed melt-quenched 15pd TPU
series
15pd series TA (˚C)
TMMT/TM (˚C)
ΔHtotal (J/g)
ANNEALED MELT-QUENCHED TPU-70 Annealing Temperature:80°C
Ann.MQ TPU-70 for 8hrs 138±0.3
175±0.6 2.17±0.07*
24.28±0.08
Ann.MQ TPU-70 for 24hrs 140±0.5
173±0.1 1.26±0.04*
20.41±0.02
Ann.MQ TPU-70 for 72hrs 143±0.4
174±0.4 2.97±0.04*
17.05±0.05
Ann.MQ TPU-70 for
168hrs
146±0.5 173±0.5 3.86±0.07*
14.65±0.06
ANNEALED MELT-QUENCHED TPU-80 Annealing Temperature:80°C
Ann.MQ TPU-80 for 8hrs 135±0.8
172±0.02 3.39±0.06*
24.05±0.05
Ann.MQ TPU-80 for 24hrs 139±0.3
175±0.2 3.50±0.04*
19.07±0.07
Ann.MQ TPU-80 for 72hrs 140±0.8 174±0.4 4.20±0.07*
17.64±0.05
Ann.MQ TPU-80 for 168
hrs
146±0.7
172±0.3 3.02±0.03*
14.05±0.05
ANNEALED MELT-QUENCHED TPU-90 Annealing Temperature:80°C
Ann.MQ TPU-90 for 8hrs 140±0.9
170±0.2 2.63±0.03*
17.22±0.02
Ann.MQ TPU-90 for 24hrs 142±0.5
171±0.6 2.99±0.09*
16.67±0.06
Ann.MQ TPU-90 for 72hrs 145±0.8
171±0.2 2.05±0.04*
10.88±0.09
Ann.MQ TPU-90 for
168hrs
148±0.01
168±0.5 6.15±0.04*
7.99±0.09
ANNEALED MELT-QUENCHED TPU-100 Annealing Temperature:80°C
Ann.MQ TPU-100 for 8hrs 137±0.05
164±0.2 (TM) 4.26±0.07*
14.21±0.01
Ann.MQ TPU-100 for
24hrs
140±0.5
170±0.3 (TM) 4.77±0.07*
11.11±0.01
Ann.MQ TPU-100 for
72hrs
151±0.9 ------- 43.04±0.05*
Ann.MQ TPU-100 for
168hrs
147±0.9 174±0.02 (TM) 4.32±0.03*
10.86±0.06
Data marked with asterisk (*) connote transitions associated with annealing
endotherms (TA)

172
5.2 TENSILE PROPERTIES OF 15PD COMPOSITES vs
POLYPROPYLENE vs ISOPLAST COMPOSITES
5.2.1 UNANNEALED AND ANNEALED COMPOSITES
0.0 0.5 1.0 1.5 2.0 2.5 3.0 3.5
0
50
100
150
200
250
300
Te
nsi
le S
tre
ss (
MP
a)
Strain (%)
TPU comp (15pd-70)
TPU comp (15pd-80)
TPU comp (15pd-90)
TPU comp (15pd-100)
PP composite
Isoplast composite
Figure 5.5 Tensile properties of unannealed 15pd TPU composites vs polypropylene
and Isoplast composites
Table 5.2: Data of the tensile properties of unannealed 15pd TPU composites vs
polypropylene and Isoplast composites
Unannealed
composite
samples
15pd-70
15pd-80
15pd-90
15pd-
100
PP Isoplast
Young’s
Modulus (GPa)
8±0.1 10±0.9 9±0.4 11±0.5 10±0.2 9±0.6
Ultimate Tensile
Strength (MPa)
257±0.8 242±0.7 281±0.7 271±0.1 274±0.7 265±0.3
Elongation (%) 3±0.2 2±0.4 3±0.03 2±0.5 2±0.7 3±0.1
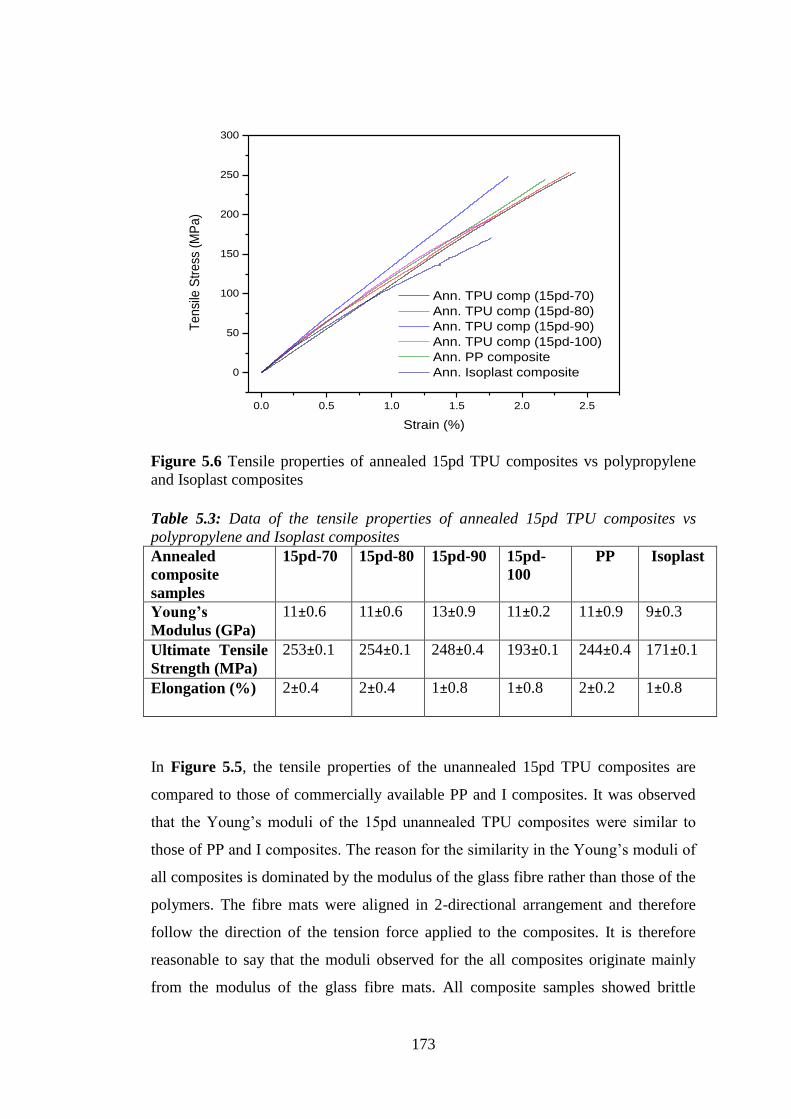
173
0.0 0.5 1.0 1.5 2.0 2.5
0
50
100
150
200
250
300
Te
nsi
le S
tre
ss (
MP
a)
Strain (%)
Ann. TPU comp (15pd-70)
Ann. TPU comp (15pd-80)
Ann. TPU comp (15pd-90)
Ann. TPU comp (15pd-100)
Ann. PP composite
Ann. Isoplast composite
Figure 5.6 Tensile properties of annealed 15pd TPU composites vs polypropylene
and Isoplast composites
Table 5.3: Data of the tensile properties of annealed 15pd TPU composites vs
polypropylene and Isoplast composites
Annealed
composite
samples
15pd-70 15pd-80 15pd-90 15pd-
100
PP Isoplast
Young’s
Modulus (GPa)
11±0.6 11±0.6 13±0.9 11±0.2 11±0.9 9±0.3
Ultimate Tensile
Strength (MPa)
253±0.1 254±0.1 248±0.4 193±0.1 244±0.4 171±0.1
Elongation (%) 2±0.4 2±0.4 1±0.8 1±0.8 2±0.2 1±0.8
In Figure 5.5, the tensile properties of the unannealed 15pd TPU composites are
compared to those of commercially available PP and I composites. It was observed
that the Young’s moduli of the 15pd unannealed TPU composites were similar to
those of PP and I composites. The reason for the similarity in the Young’s moduli of
all composites is dominated by the modulus of the glass fibre rather than those of the
polymers. The fibre mats were aligned in 2-directional arrangement and therefore
follow the direction of the tension force applied to the composites. It is therefore
reasonable to say that the moduli observed for the all composites originate mainly
from the modulus of the glass fibre mats. All composite samples showed brittle

174
properties upon fracture, and therefore there is no plastic deformation which also
means that there is little or no yield. As a result of the brittle properties of the
composites, the ultimate tensile strengths (UTS) of all the composites are equal to
the fracture strengths (FS) of the composites as shown in Table 5.2. The 90% and
100%HS unannealed TPU composites were seen to have high UTS values of
281±0.7 and 271±0.1 MPa respectively. The aforementioned values compare
favourably with the UTS of the PP composite (274±0.7 MPa). The reason for the
high values observed for the 90% and 100%HS unannealed TPU composites could
be attributed mainly to the degree of HS concentration. It is therefore reasonable to
conclude that the increase in the UTS of the TPU composites is dependent on the
increase of the HS content. The increase in the amount of SS incorporated in the
TPU system therefore decreases the UTS of the TPU material and this is confirmed
by the UTS values of the 70% and 80%HS unannealed TPU composites which were
257±0.8 and 242±0.7 MPa respectively. The elongation (%) values of all the
unannealed TPU composites under tension were similar. The tensile strengths of the
glass fibre reinforced TPU composites were reported to increase with increasing
volume fractions of the glass fibre221-222
. In our case, the volume fractions of the
TPU composites are similar and that supports the reason there is similarity in the
Young’s moduli of the unannealed TPU composites as shown in Table 5.2. In
addition, the reason for the similarity in the elongation (%) values is likely to be due
to the load being applied mainly to the fibre mats rather than the polymer matrix.
In Figure 5.6, the tensile properties of the annealed TPU composites are slightly
improved due to annealing. The Young’s moduli of the annealed TPU composites
for 70%, 80% 90% and 100%HS are 11±0.6, 11±0.6, 13±0.9 and 11±0.2 GPa
respectively as shown in Table 5.3.
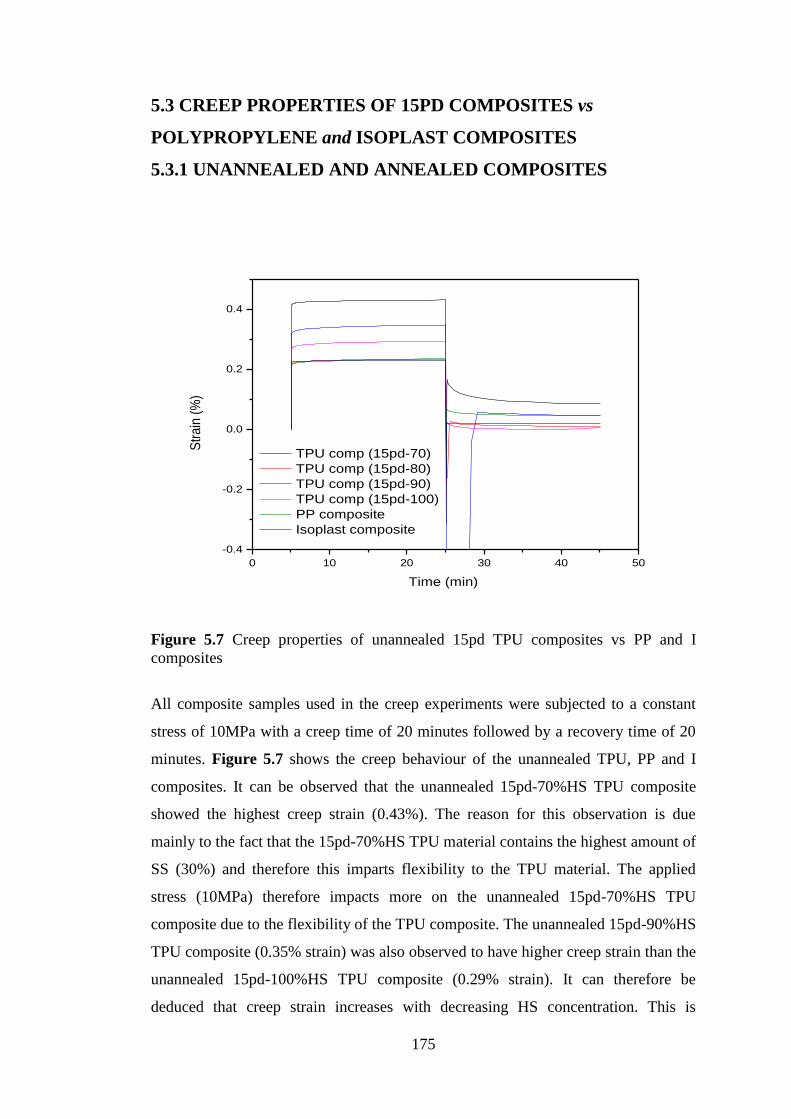
175
5.3 CREEP PROPERTIES OF 15PD COMPOSITES vs
POLYPROPYLENE and ISOPLAST COMPOSITES
5.3.1 UNANNEALED AND ANNEALED COMPOSITES
0 10 20 30 40 50
-0.4
-0.2
0.0
0.2
0.4
Str
ain
(%
)
Time (min)
TPU comp (15pd-70)
TPU comp (15pd-80)
TPU comp (15pd-90)
TPU comp (15pd-100)
PP composite
Isoplast composite
Figure 5.7 Creep properties of unannealed 15pd TPU composites vs PP and I
composites
All composite samples used in the creep experiments were subjected to a constant
stress of 10MPa with a creep time of 20 minutes followed by a recovery time of 20
minutes. Figure 5.7 shows the creep behaviour of the unannealed TPU, PP and I
composites. It can be observed that the unannealed 15pd-70%HS TPU composite
showed the highest creep strain (0.43%). The reason for this observation is due
mainly to the fact that the 15pd-70%HS TPU material contains the highest amount of
SS (30%) and therefore this imparts flexibility to the TPU material. The applied
stress (10MPa) therefore impacts more on the unannealed 15pd-70%HS TPU
composite due to the flexibility of the TPU composite. The unannealed 15pd-90%HS
TPU composite (0.35% strain) was also observed to have higher creep strain than the
unannealed 15pd-100%HS TPU composite (0.29% strain). It can therefore be
deduced that creep strain increases with decreasing HS concentration. This is

176
because the increase in HS concentration leads to increased stiffness of the TPU
materials which are more resistant to the applied stress. Contrary to the above
deduction is the decreased creep strain of the unannealed 15pd-80%HS TPU
composite. The reason of this observation could be traceable to the volume fraction
of the fibre mats present in the TPU composite sample. The unannealed 15pd-
80%HS TPU composite had similar creep strain as PP and I composites. The PP and
I composites showed that lowest creep strains, due to the PP and I composites having
higher fibre volume fractions than the TPU composites.
It can be observed that the unannealed 15pd-70%HS TPU composite has the highest
unrecovered % strain (0.09%) upon creep recovery whereas the unannealed 15pd-
100%HS TPU composite was seen to exhibit the lowest unrecovered % strain
(0.003%) upon creep recovery. The reason for the observation for the unannealed
15pd-70 TPU composite is due to the amount of SS present in the TPU material. The
SS used in this research work acts as a plasticizer and therefore viscoplasticity
(permanent deformation after creep) is likely to set in during the creep recovery
process. The SS is responsible for the extensibility properties of TPU; in other
words, a stretched TPU material can undergo plasticity due to the presence of the SS.
On the other hand, the HS exhibit elastic properties in the TPU material and that
explains the occurrence of the lowest unrecovered % strain observed for the
100%HS TPU composite. The creep modulus; E(t) and creep compliance; J(t) of the
unannealed composites can be ascertained for the creep results.
Creep modulus; E(t) is the ratio of applied stress to the time-dependent strain in
viscoelastic materials
(Equation 5.1)
where σ0 = applied stress
ε(t) = time-dependent strain
Creep compliance; J(t) is the ratio of time-dependent strain to applied stress in
viscoelastic materials. It is inverse/reciprocal of creep modulus. It can also be
defined as the susceptibility of a material to deform.

177
(Equation 5.2)
Following the formulae outlined, the E(t) and J(t) values of all the unannealed
composites can be calculated. The creep properties of the unannealed composites are
shown in Table 5.4.
Table 5.4: Creep properties of the unannealed composites
Unannealed
composites
15pd-
70
15pd-
80
15pd-
90
15pd-
100
PP I
Creep strain (%) 0.43±
0.01
0.24±
0.01
0.35±
0.02
0.30±
0.02
0.24±
0.02
0.23±
0.01
Unrecovered strain
(%)
0.09±
0.08
0.01±
0.01
0.05±
0.01
0.005±
0.001
0.05±
0.02
0.02±
0.01
Creep Modulus
(MPa)
2326±
53
4167±
167
2857±
154
3333±
208
4167±
321
4348±
181
Creep Compliance
(MPa-1
) x 106
430±
10
240±
10
350±
20
300±
20
240±
20
230±
10
The creep moduli and creep compliance data measured for all the unannealed
composites were seen to correspond with their respective creep strain (%) values as
discussed earlier.
0 10 20 30 40 50
-0.5
0.0
0.5
Str
ain
(%
)
Time (min)
Ann. TPU comp (15pd-70)
Ann. TPU comp (15pd-80)
Ann. TPU comp (15pd-90)
Ann. TPU comp (15pd-100)
Ann. PP composite
Ann. Isoplast composite
Figure 5.8 Creep properties of annealed 15pd TPU composites vs PP and I
composites

178
All composites were annealed in an oven at 80°C for 168 hours after which they
were tested to ascertain changes in their creep behaviour arising from annealing.
From Figure 5.8, it can be observed that creep strain (%) decreased steadily with
increasing HS concentration for the annealed TPU composites; with the annealed
15pd-70%HS TPU composite having the highest creep strain (0.43%). The reason
for the observation is mainly due to increased crystallinities of the TPUs as a result
of the annealing process. The HS are the only crystallisable part of the TPUs used in
this research work, it is therefore safe to say that after the annealing process, the
annealed 15pd-100%HS TPU composite is more crystalline than other TPUs with
varying HS concentrations and hence, it is the most creep resistant of all annealed
TPU composites. The creep strain (%) values of all the annealed composites were
seen to be reduced when compared to those of the unannealed composites earlier
discussed. On the other hand, the unrecovered strain (%) values of the annealed
composites were seen to be higher than those of the unannealed composites. The
reason is that annealing hardens the composite materials and therefore after an
applied stress is removed from the annealed composites, partial or no strain recovery
takes place. The creep moduli of the annealed TPU composites were also seen to
increase with increasing HS content. The observed creep moduli of the annealed
90% and 100%HS TPU composites were seen to be higher than the creep modulus
of the annealed PP composite. The annealed I composite was seen to exhibit the
highest creep modulus and the lowest unrecovered strain (%) than all the annealed
composites. The reason for this was due to the glassy nature of the Isoplast material,
therefore annealing of the material increases its resistance to deform/creep. The
creep properties of the annealed composites are shown in Table 5.5.
Table 5.5: Creep properties of the annealed composites
Annealed composites 15pd-
70
15pd-
80
15pd-
90
15pd-
100
PP I
Creep strain (%) 0.42±
0.02
0.28±
0.01
0.25±
0.01
0.19±
0.01
0.26±
0.02
0.17±
0.02
Unrecovered strain
(%)
0.10±
0.07
0.03±
0.03
0.03±
0.01
0.03±
0.02
0.05±
0.01
0.01±
0.01
Creep Modulus
(MPa)
2381±
108
3571±
123
4000±
154
5263±
263
3846±
275
5882±
619
Creep Compliance
(MPa-1
) x 106
420±
20
280±
10
250±
10
190±
10
260±
20
170±
20
179
From the tensile results discussed, all composites were brittle on breaking. The
tensile properties of the 8 fibre mat layered 15pd TPU composites compared
favourably with the tensile properties of the PP and I composites. However, the
tensile properties of all the composites were more influenced by the fibre
reinforcement. Annealing was seen to slightly improve the Young’s moduli of all the
composites. The elongation of the annealed composites was also seen to be lower
than those of the unannealed composites. Decrease in elongation was as a result of
increased crystallinity of the composites through annealing.
The creep strain values of the unannealed composites were seen to be slightly higher
than those of the annealed composites. This can be explained by stating that the
stress applied (10MPa) had more effect on the unannealed composites than the
annealed. Furthermore, annealing improved the creep moduli of the composites. The
creep properties of the 15pd TPU composites compared well with those of the PP
and I composites.
180
CHAPTER 6
CONCLUSIONS AND FUTURE WORK
6.1 CONCLUSIONS
The presence of mixed phase was found for the melt-quenched, slow-cooled and
moulded 70%HS 2m13pd TPUs as revealed in the DSC results. The mixed phase
morphology was marked by a broad glass transition (TgMP). The thermo-dynamic
observations and results found for 2m13pd TPUs correspond to the previous studies
carried out by Saiani et al58-60
. Cast 14chdm TPUs were amorphous which was
attributed to the mixture of cis- and trans- geometric isomers present in the 1,4-
cyclohexanedimethanol chain extender. 12ed and 14bd TPUs displayed the highest
melting transitions (about 220°C) and melting enthalpies (ΔHTot) due to their high
crystallinity levels. TgHP was seen for the 70%HS TPUs whereas TgHS was seen for
the 100%HS TPUs. TMMT was seen for the 70%HS TPUs whereas TM was seen for
the 100%HS TPUs. The TMMT values of the cast TPUs chain-extended with 15pd,
16hd, 17hpd and 18od show that the even-numbered chain-extended TPUs have
higher melting transitions than the odd-numbered chain extended TPUs. The
characteristic zig-zag plot of the TMMT values of 70% and 100%HS cast TPUs chain-
extended with 15pd, 16hd, 17hpd and 18od agree with the findings of Fernandez et
al95
. These findings were linked to the odd-even effect of odd-numbered and even-
numbered diols (chain extenders). The multiple endothermic transitions were found
for the melt-quenched and slow-cooled 16hd, 17hpd and 18od TPUs and this
confirmed the existence of polymorphic structures in the polymer chains. Annealing
improved the thermal properties of all the 70%HS and 100%HS TPU samples. TA
was seen for all the annealed melt-quenched 15pd TPUs. TA values of the different
HS concentrations were found to increase with increase in annealing times.
Furthermore, TA values were seen to remain constant with increase in HS
concentration and this therefore implies that at the same annealing time, the
annealing effect on all the annealed melt-quenched 15pd TPUs (70%, 80%, 90% and
100%HS) is similar.
Phase separation was seen for all the cast 70% and 100%HS TPUs as revealed in the
SAXS results. The SAXS peaks seen for the 70%HS TPUs come from the HS-SS

181
phase whereas the SAXS peaks seen for the 100%HS TPUs come from the
crystalline HS and the non-crystalline HS.
Crystalline peaks were seen on the amorphous halos of the linear chain-extended cast
70% and 100%HS TPUs as revealed by WAXS results. These peaks correspond to
the crystallinity of HS as proposed by Blackwell et al97-98, 125, 193-197
. It was shown
that annealing the moulded TPU samples at 80°C for 168 hours induced the
formation of type-II crystals and the results are consistent with the findings of Briber
and Thomas211
. The cast linear chain extender based TPUs showed better
crystallinities than the non-linear/branched and cyclic chain extender based TPUs.
This is due to the linearity of the chain extenders as polymer chains are easily packed
together and consequently, the polymer chains crystallize easily.
All TPU composites displayed storage moduli above 2 GPa at 25°C as revealed by
the DMTA results. Upon annealing, the storage moduli of the TPU composites were
further improved with values above 4 GPa. TgSP was seen for all the annealed
70%HS TPU composites, TgHP were seen for the annealed 70%, 80% and 90%HS
TPU composites whereas only TgHS was seen for all the annealed 100%HS TPU
composites. These aforementioned Tgs were seen more easily in the DMTA
technique than the DSC technique because of the higher sensitivity of DMTA
technique to the relaxation transitions occurring in the TPU samples. The storage
moduli of the unannealed and annealed TPU composites were found to compare well
with those of unannealed and annealed PP and I composites. Tensile results showed
that the Young’s moduli of the unannealed and annealed 15pd TPU composites were
similar to those of PP and I composites. The creep properties of the 15pd TPU
composites compared well with those of the PP and I composites.

182
6.2 FUTURE WORK
This research focused on only one type of soft segment (EO-PPO-EO) and one type
of di-isocyanate (4,4-MDI) in relation to different types of chain extenders. The
different types of chain extenders investigated in this research work can be further
studied with different polyol and isocyanate unit.
For the chemistry of the TPUs to be further investigated, polytetrahydrofuran
(PTHF) can be used as soft segment. Studies have shown that PTHF polyol promote
phase separation and therefore better mechanical properties of TPUs can be
achieved. Aromatic chain extenders such as hydroquinone bis(2-hydroxyethyl) ether
can be employed to enhance the mechanical properties of the TPUs.
For the TPU composites, the glass fibre mat used in this research work is silane-
sized. Further investigations on the TPU composites would be to use fibre mats that
are sized with NH- compounds and also glass fibres that are coated with an amino-
silane which are common. This could improve the mechanical properties of the TPU
composites as stronger interfacial bonding is likely to take place between the fibre
and the TPU matrix.
Particulate reinforcements were not investigated in this research work. These could
be a good alternative to the glass fibre mats. Commonly used nano-scaled particles
such as graphene, graphite, carbon nantubes, multi-walled carbon nanotubes
(MWCNT) and nanoclays can be used as reinforcements for the TPU composites.
Recent studies have shown that these particles exhibit good mechanical, conductive
and electrical properties.
Compression moulding has been the only processing technique employed in this
research work. It would be interesting to employ injection moulding as well as resin
infusion in the manufacture of the TPU composites.
Further mechanical tests can be carried out on the TPU composites such as izod
impact strength test and charpy impact test so as to elucidate the toughness of the
composites.
The annealing temperature used throughout this research was 80˚C. Annealing
temperature can be increased in order to further elucidate the effect of annealing on

183
the thermodynamic, structural, thermo-mechanical and mechanical properties of
TPUs and TPU composites. Studies have shown that increase in annealing
temperature leads to increase in phase separation occurring in the TPUs and
consequently the mechanical properties of the TPUs.

184
REFERENCES
1. Kishi, H., et al., Damping properties of thermoplastic-elastomer interleaved
carbon fiber-reinforced epoxy composites. Composites Science and
Technology, 2004. 64(16): p. 2517-2523.
2. Papanicolaou, G.C., et al., Viscoelastic Characterization of a Glass - epoxy
Composite. Materiale Plastice, 2008. 45(3): p. 221-227.
3. Selzer, R. and K. Friedrich, Mechanical properties and failure behaviour of
carbon fibre-reinforced polymer composites under the influence of moisture.
Composites Part a-Applied Science and Manufacturing, 1997. 28(6): p. 595-
604.
4. Circiumaru, A., et al., Carbon Fiber Based Filled Epoxy Composites. Annals
of Daaam for 2008 & Proceedings of the 19th International Daaam
Symposium, 2008: p. 265-266.
5. da Silva, A.L.N., et al., Mechanical properties of polymer composites based
on commercial epoxy vinyl ester resin and glass fiber. Polymer Testing,
2001. 20(8): p. 895-899.
6. Dutra, R.C.L., et al., Hybrid composites based on polypropylene and carbon
fiber and epoxy matrix. Polymer, 2000. 41(10): p. 3841-3849.
7. Fournier, P., et al., Flexural Fatigue Behavior of Unidirectional Glass-Fiber
Reinforced Epoxy-Resin Based Composites. First International Conference on
Deformation and Fracture of Composites, 1991: p. 65-70.
8. Gassan, J. and T. Dietz, Fatigue behavior of cross-ply glass-fiber composites
based on epoxy resins of different toughnesses. Composites Science and
Technology, 2001. 61(1): p. 157-163.
9. Ghosh, P., N.R. Bose, and R.K. Basak, Thermal and morphological
characteristics of some FRP composites based on different fiber
reinforcements and epoxy resin as the matrix material. Journal of Polymer
Materials, 2001. 18(2): p. 179-186.
10. Ghosh, P., et al., Dynamic mechanical analysis of FRP composites based on
different fiber reinforcements and epoxy resin as the matrix material. Journal
of Applied Polymer Science, 1997. 64(12): p. 2467-2472.
11. Kubomura, K. and N. Tsuji, Compression Nonlinearity of Pitch-Based High
Modulus Carbon-Fiber Reinforced Epoxy Composites and Structural
185
Responses. 36th International Sampe Symposium and Exhibition, Book 1 and
2, 1991. 36: p. 1664-1674.
12. Patel, H.S. and S.J. Patel, Glass Fiber-reinforced Composites based on
Epoxy Resin-Maleated Shellac Interacting System. Journal of Reinforced
Plastics and Composites, 2010. 29(8): p. 1267-1272.
13. Vanveelen, A. and J.E. Stamhuis, Fracture-Behavior of Unidirectionally
Glass-Fiber Reinforced Composites Based on Toughened Epoxy-Resin
Systems. First International Conference on Deformation and Fracture of
Composites, 1991: p. 13-18.
14. Watanabe, O., et al., Fracture-Behavior of Pitch-Based Carbon-Fiber
Composites with Toughened Epoxy-Resin Systems. Tomorrows Materials :
Today, Book 1 and 2, 1989. 34: p. 737-746.
15. Stamhuis, J.E., Mechanical-Properties and Morphology of Polypropylene
Composites .3. Short Glass-Fiber Reinforced Elastomer Modified
Polypropylene. Polymer Composites, 1988. 9(4): p. 280-284.
16. Thomason, J.L. and M.A. Vlug, Influence of fibre length and concentration
on the properties of glass fibre-reinforced polypropylene .4. Impact
properties. Composites Part a-Applied Science and Manufacturing, 1997.
28(3): p. 277-288.
17. Segard, E., et al., Damage analysis and the fibre-matrix effect in
polypropylene reinforced by short glass fibres above glass transition
temperature. Composite Structures, 2003. 60(1): p. 67-72.
18. Ericson, M. and L. Berglund, Deformation and Fracture of Glass-Mat-
Reinforced Polypropylene. Composites Science and Technology, 1992.
43(3): p. 269-281.
19. Santulli, C., et al., Impact properties of compression moulded commingled E-
glass-polypropylene composites. Plastics Rubber and Composites, 2002.
31(6): p. 270-277.
20. Hufenbach, W., et al., Polypropylene/glass fibre 3D-textile reinforced
composites for automotive applications. Materials & Design, 2011. 32(3): p.
1468-1476.
21. Dasappa, P., et al., Tensile Creep of a Long-Fibre Glass Mat Thermoplastic
(GMT) Composite. II. Viscoelastic-Viscoplastic Constitutive Modeling.
Polymer Composites, 2009. 30(9): p. 1204-1211.

186
22. Dasappa, P., et al., Tensile Creep of a Long-Fiber Glass Mat Thermoplastic
Composite. I. Short-Term Tests. Polymer Composites, 2009. 30(8): p. 1146-
1157.
23. Zhuang, R.C., T. Burghardt, and E. Mader, Study on interfacial adhesion
strength of single glass fibre/polypropylene model composites by altering the
nature of the surface of sized glass fibres. Composites Science and
Technology, 2010. 70(10): p. 1523-1529.
24. Peijs, T., et al., Thermoplastic composites based on flax fibres and
polypropylene: Influence of fibre length and fibre volume fraction on
mechanical properties. Macromolecular Symposia, 1998. 127: p. 193-203.
25. Ramos, M.A. and F.A. Belmontes, Polypropylene Low-Density Polyethylene
Blend Matrices and Short Glass-Fiber Based Composites .3. Morphology
and Fiber Orientation. Polymer Composites, 1991. 12(1): p. 7-12.
26. Vas, L.M. and P. Bakonyi, Creep failure strain estimation of glass
fibre/polypropylene composites based on short-term tests and Weibull
characterisation. Journal of Reinforced Plastics and Composites, 2013.
32(1): p. 34-41.
27. Wang, Y.T., Q.Z. Dong, and X. Liu, Mode 1 interlaminar fracture behaviour
of continuous glass fibre/polypropylene composites based on commingled
yarn. Polymers & Polymer Composites, 2007. 15(3): p. 229-239.
28. Wang, Y.T., et al., An acoustic emission study on the fracture behavior of
continuous glass fiber/polypropylene composites based on commingled yarn.
Polymer Composites, 2008. 29(7): p. 728-735.
29. Zelenetskii, A.N., et al., Fiber-matrix interaction in composites based on
polypropylene and glass and basalt fibers. Vysokomolekulyarnye
Soedineniya Seriya a & Seriya B, 1997. 39(10): p. 1659-1665.
30. SanchezAdsuar, M.S. and J.M. MartinMartinez, Influence of the length of the
chain extender on the properties of thermoplastic polyurethanes. Journal of
Adhesion Science and Technology, 1997. 11(8): p. 1077-1087.
31. Koberstein, J.T., I. Gancarz, and T.C. Clarke, The Effects of Morphological
Transitions on Hydrogen-Bonding in Polyurethanes - Preliminary-Results of
Simultaneous Dsc-Ftir Experiments. Journal of Polymer Science Part B-
Polymer Physics, 1986. 24(11): p. 2487-2498.

187
32. Sanchez-Adsuar, M.S. and J.M. Martin-Martinez, Characterization of
thermoplastic polyurethanes prepared using different macroglycols. Journal
of Adhesion, 1998. 68(1-2): p. 143-161.
33. Martin, D.J., et al., Effect of soft-segment CH2/O ratio on morphology and
properties of a series of polyurethane elastomers. Journal of Applied
Polymer Science, 1996. 60(4): p. 557-571.
34. Lunardon, G., Y. Sumida, and O. Vogl, Effects of Molecular-Weight and
Molecular-Weight Distribution of Polyester Based Soft Segments on the
Physical-Properties of Linear Polyurethane Elastomers. Angewandte
Makromolekulare Chemie, 1980. 87(Jul): p. 1-33.
35. Zdrahala, R.J., et al., Polyether Based Thermoplastic Polyurethanes Effect of
the Soft Segment Molecular-Weight. Journal of Elastomers and Plastics,
1980. 12(4): p. 225-244.
36. Kim, H.D., et al., Preparation and properties of segmented thermoplastic
polyurethane elastomers with two different soft segments. Journal of Applied
Polymer Science, 1999. 73(3): p. 345-352.
37. Lee, D.K., et al., Preparation and properties of transparent thermoplastic
segmented polyurethanes derived from different polyols. Polymer
Engineering and Science, 2007. 47(5): p. 695-701.
38. Speckhard, T.A., et al., Properties of Polyisobutylene Polyurethane Block
Copolymers .2. Macroglycols Produced by the Inifer Technique. Polymer,
1985. 26(1): p. 55-69.
39. Martin, D.J., et al., The effect of average soft segment length on morphology
and properties of a series of polyurethane elastomers .2. SAXS-DSC
annealing study. Journal of Applied Polymer Science, 1997. 64(4): p. 803-
817.
40. Martin, D.J., et al., The effect of average soft segment length on morphology
and properties of a series of polyurethane elastomers .1. Characterization of
the series. Journal of Applied Polymer Science, 1996. 62(9): p. 1377-1386.
41. Eceiza, A., et al., Structure-property relationships of thermoplastic
polyurethane elastomers based on polycarbonate diols. Journal of Applied
Polymer Science, 2008. 108(5): p. 3092-3103.
42. Eceiza, A., et al., Thermoplastic polyurethane elastomers based on
polycarbonate diols with different soft segment molecular weight and

188
chemical structure: Mechanical and thermal properties. Polymer
Engineering and Science, 2008. 48(2): p. 297-306.
43. Seefried, C.G., J.V. Koleske, and F.E. Critchfield, Thermoplastic Urethane
Elastomers .1. Effects of Soft-Segment Variations. Journal of Applied
Polymer Science, 1975. 19(9): p. 2493-2502.
44. Kojio, K., et al., Control of Mechanical Properties of Thermoplastic
Polyurethane Elastomers by Restriction of Crystallization of Soft Segment.
Materials, 2010. 3(12): p. 5097-5110.
45. Kim, S.G. and D.S. Lee, Effect of polymerization procedure on thermal and
mechanical properties of polyether based thermoplastic polyurethanes.
Macromolecular Research, 2002. 10(6): p. 365-368.
46. Korley, L.T.J., et al., Effect of the degree of soft and hard segment ordering
on the morphology and mechanical behavior of semicrystalline segmented
polyurethanes. Polymer, 2006. 47(9): p. 3073-3082.
47. Chu, B., et al., Microphase Separation Kinetics in Segmented Polyurethanes
- Effects of Soft Segment Length and Structure. Macromolecules, 1992.
25(21): p. 5724-5729.
48. Ertem, S.P., et al., Effect of soft segment molecular weight on tensile
properties of poly(propylene oxide) based polyurethaneureas. Polymer,
2012. 53(21): p. 4614-4622.
49. Mormann, W. and C.X. Zhang, Ternary phase separation in polyurethane
elastomers with immiscible soft segments. Macromolecular Symposia, 2003.
198: p. 271-281.
50. Holden, G., et al., eds. Thermoplastic Elastomers. 2nd ed. 1996,
Hanser/Gardner: Munich.
51. Phillips, L.N. and D.B.V. Parker, Polyurethanes; Chemistry, Technology and
Properties, ed. J.R.A. Pearson and P.D. Ritchie. 1964, London: Iliffe Books
Limited England.
52. Woods, G., The ICI Polyurethanes Book. 2nd ed. 1990, Chichester: ICI
Polyurethanes, John Wiley and Sons UK.
53. Young, R.J. and P.A. Lovell, Introduction to Polymers. 2nd ed. 1981,
London: Chapman and Hall UK.
54. Nina, M.K.L., A.W. Kimberly, and L.C. Stuart, Polyurethanes in Biomedical
Applications. 2000, Florida: CRC press USA.

189
55. Bayer, A., Bayer-Polyurethanes. 1979, Leverkusen Bayer AG Germany.
56. Chen, P.H., et al., Synthesis and properties of transparent thermoplastic
segmented polyurethanes. Advances in Polymer Technology, 2007. 26(1): p.
33-40.
57. Chen, T.K., T.S. Shieh, and J.Y. Chui, Studies on the first DSC endotherm of
polyurethane hard segment based on 4,4 '-diphenylmethane diisocyanate and
1,4-butanediol. Macromolecules, 1998. 31(4): p. 1312-1320.
58. Saiani, A., et al., Origin of multiple melting endotherms in a high hard block
content polyurethane. 1. Thermodynamic investigation. Macromolecules,
2001. 34(26): p. 9059-9068.
59. Saiani, A., et al., Origin of multiple melting endotherms in a high hard block
content polyurethane: Effect of annealing temperature. Macromolecules,
2007. 40(20): p. 7252-7262.
60. Saiani, A., et al., Origin of multiple melting endotherms in a high hard block
content polyurethane. 2. Structural investigation. Macromolecules, 2004.
37(4): p. 1411-1421.
61. Zhang, H.B., et al., Synthesis and characterization of polyurethane
elastomers. Journal of Elastomers and Plastics, 2008. 40(2): p. 161-177.
62. Allison, C. and J. Peacock, Polymer Chemistry: Properties and Applications.
2006, Munich: Hanser Germany.
63. Wilkes, G.L. and J.A. Emerson, Time-Dependence of Small-Angle X-Ray
Measurements on Segmented Polyurethanes Following Thermal-Treatment.
Journal of Applied Physics, 1976. 47(10): p. 4261-4264.
64. Blackwell, J. and C.D. Lee, Hard-Segment Domain Sizes in Mdi Diol
Polyurethane Elastomers. Journal of Polymer Science Part B-Polymer
Physics, 1983. 21(10): p. 2169-2180.
65. Mailhot, B., et al., Mechanical and friction properties of thermoplastic
polyurethanes determined by scanning force microscopy. Journal of Applied
Physics, 2001. 89(10): p. 5712-5719.
66. Vilensky, V.A. and Y.S. Lipatov, A Criterion for Microphase Separation in
Segmented Polyurethane and Polyurethane Ureas. Polymer, 1994. 35(14): p.
3069-3074.

190
67. Eisenbach, C.D., et al., Chain Architecture and Molecular Self-Organization
of Polyurethanes - Perspectives for Thermoplastic Elastomers. Angewandte
Makromolekulare Chemie, 1992. 202: p. 221-241.
68. Smith, C.P., J.W. Reisch, and J.M. Oconnor, Thermoplastic Polyurethane
Elastomers Made from High-Molecular-Weight Poly-L(R) Polyols. Journal of
Elastomers and Plastics, 1992. 24(4): p. 306-322.
69. Rueda-Larraz, L., et al., Synthesis and microstructure-mechanical property
relationships of segmented polyurethanes based on a PCL-PTHF-PCL block
copolymer as soft segment. European Polymer Journal, 2009. 45(7): p. 2096-
2109.
70. Cuve, L., J.P. Pascault, and G. Boiteux, Synthesis and Properties of
Polyurethanes Based on Polyolefin .2. Semicrystalline Segmented
Polyurethanes Prepared under Heterogeneous or Homogeneous Synthesis
Conditions. Polymer, 1992. 33(18): p. 3957-3967.
71. Lan, P.N., et al., Synthesis and characterization of segmented polyurethanes
based on amphiphilic polyether diols. Biomaterials, 1996. 17(23): p. 2273-
2280.
72. Cheremisinoff, N.P. and P.N. Cheremisinoff, Fiberglass Reinforced Plastics.
1995, New Jersey: Noyes Publications USA.
73. Hull, D., An Introduction to Composite Materials. 1981, Cambridge:
Cambridge University Press Great Britain.
74. Hull, D. and T.W. Clyne, An Introduction to Composite Materials. 2nd ed.
1996, Cambridge: Press Syndicate Great Britain.
75. Mallick, P.K., Fibre-Reinforced Composites; Materials, Manufacturing and
Design. 2nd, Revised and Expanded ed. 1993, Florida: CRC USA.
76. Chapman, C.B., Fibres. 1974, London: Butterworth and Co Limited.
77. Biron, M., Thermoplastics and Thermoplastic Composites, Technical
Information for Plastic Users. 2007: Elsevier Limited China.
78. Braun, D., Simple Methods for Identification of Plastics. 3rd ed. 1996,
Munich: Hanser Germany.
79. Billmeyer, F.W.J., Textbook of Polymer Science. 3rd ed. 1984, Singapore:
John Wiley and Sons Singapore.
80. Crawford, R.J., Plastics Engineering. 3rd ed. 1998, Oxford: Butterworth-
Heinemann Great Britain.

191
81. Brostow, W. and R.D. Corneliussen, eds. Failure of Plastics. 1986, Hanser
USA: New York.
82. Harris, B., ENGINEERING COMPOSITE MATERIALS. 1999, London: The
Institute of Materials. 194.
83. Hu, C.B., R.S. Ward, and N.S. Schneider, A New Criterion of Phase-
Separation - the Effect of Diamine Chain Extenders on the Properties of
Polyurethaneureas. Journal of Applied Polymer Science, 1982. 27(6): p.
2167-2177.
84. Lin, I.S. and S.J. Gromelski, Polyether Based Polyurethanes - a Study of Diol
Curatives. Journal of Cellular Plastics, 1983. 19(5): p. 307-307.
85. Lin, I.S. and S.J. Gromelski, Polyether Based Polyurethanes - a Study of Diol
Curatives. Journal of Elastomers and Plastics, 1984. 16(4): p. 265-280.
86. Minoura, Y., et al., Crosslinking and Mechanical Property of Liquid Rubber
.2. Curative Effect of Aromatic Diols. Journal of Applied Polymer Science,
1978. 22(11): p. 3101-3110.
87. Minoura, Y., et al., Crosslinking and Mechanical Property of Liquid Rubber
.1. Curative Effect of Aliphatic Diols. Journal of Applied Polymer Science,
1978. 22(7): p. 1817-1844.
88. Zdrahala, R.J., et al., Polyether Based Polyurethane Thermoplastic - Effect of
the Hard Segment Content. Journal of Elastomers and Plastics, 1980. 12(3):
p. 184-194.
89. Zdrahala, R.J., et al., Polyether-Based Thermoplastic Polyurethanes .1. Effect
of the Hard-Segment Content. Journal of Applied Polymer Science, 1979.
24(9): p. 2041-2050.
90. Seefried, C.G., et al., Thermoplastic Urethane Elastomers .4. Effects of
Cycloaliphatic Chain Extender on Dynamic Mechanical-Properties. Polymer
Engineering and Science, 1975. 15(9): p. 646-650.
91. Kojio, K., et al., Structure-Mechanical Property Relationships for
Poly(carbonate urethane) Elastomers with Novel Soft Segments.
Macromolecules, 2009. 42(21): p. 8322-8327.
92. Wang, C.S. and D.J. Kenney, Effect of Hard Segments on Morphology and
Properties of Thermoplastic Polyurethanes. Journal of Elastomers and
Plastics, 1995. 27(2): p. 182-199.

192
93. Pandya, M.V., D.D. Deshpande, and D.G. Hundiwale, Thermal-Behavior of
Cast Polyurethane Elastomers. Journal of Applied Polymer Science, 1988.
35(7): p. 1803-1815.
94. Camberlin, Y., et al., Model Hard Segments from Diphenyl Methane
Diisocyanate and Different Chain Extenders, and Corresponding Linear
Block Polyurethanes. Journal of Polymer Science Part a-Polymer Chemistry,
1982. 20(6): p. 1445-1456.
95. Fernandez, C.E., et al., Crystallization Studies on Linear Aliphatic n-
Polyurethanes. Journal of Polymer Science Part B-Polymer Physics, 2009.
47(14): p. 1368-1380.
96. Van Gorp, J.J., J.W. Desalvo, and R. Miller, Susterra® Propanediol –
Renewability, Sustainability, and Differentiating Performance in Urethane
Applications.
97. Blackwell, J., M.R. Nagarajan, and T.B. Hoitink, Structure of Polyurethane
Elastomers - X-Ray-Diffraction and Conformational-Analysis of Mdi-
Propandiol and Mdi-Ethylene Glycol Hard Segments. Polymer, 1981. 22(11):
p. 1534-1539.
98. Blackwell, J. and K.H. Gardner, Structure of the Hard Segments in
Polyurethane Elastomers. Polymer, 1979. 20(1): p. 13-17.
99. Born, L., et al., The Physical Crosslinking of Polyurethane Elastomers
Studied by X-Ray-Investigation of Model Urethanes. Colloid and Polymer
Science, 1982. 260(9): p. 819-828.
100. Thalladi, V.R., M. Nusse, and R. Boese, The melting point alternation in
alpha,omega-alkanedicarboxylic acids. Journal of the American Chemical
Society, 2000. 122(38): p. 9227-9236.
101. Neffgen, S., et al., Synthesis and thermal properties of [n]-polyurethanes.
Macromolecular Chemistry and Physics, 2000. 201(16): p. 2108-2114.
102. Versteegen, R.M., R.P. Sijbesma, and E.W. Meijer, [n]-Polyurethanes:
Synthesis and characterization. Angewandte Chemie-International Edition,
1999. 38(19): p. 2917-2919.
103. Brunette, C.M., et al., Thermal and Mechanical-Properties of Linear
Segmented Polyurethanes with Butadiene Soft Segments. Polymer
Engineering and Science, 1981. 21(11): p. 668-674.

193
104. Oprea, S., Effect of Composition and Hard-segment Content on Thermo-
mechanical Properties of Cross-linked Polyurethane Copolymers. High
Performance Polymers, 2009. 21(3): p. 353-370.
105. Pukanszky, B., et al., Effect of Interactions, Molecular and Phase Structure
on the Properties of Polyurethane Elastomers. Colloids for Nano- and
Biotechnology, 2008. 135: p. 218-224.
106. Seefried, C.G., J.V. Koleske, and F.E. Critchfield, Thermoplastic Urethane
Elastomers .3. Effects of Variations in Isocyanate Structure. Journal of
Applied Polymer Science, 1975. 19(12): p. 3185-3191.
107. Frontini, P.M., M. Rink, and A. Pavan, Development of Polyurethane
Engineering Thermoplastics .1. Preparation and Structure. Journal of
Applied Polymer Science, 1993. 48(11): p. 2003-2022.
108. Koberstein, J.T., A.F. Galambos, and L.M. Leung, Compression-Molded
Polyurethane Block Copolymers .1. Microdomain Morphology and
Thermomechanical Properties. Macromolecules, 1992. 25(23): p. 6195-6204.
109. Koberstein, J.T. and L.M. Leung, Compression-Molded Polyurethane Block
Copolymers .2. Evaluation of Microphase Compositions. Macromolecules,
1992. 25(23): p. 6205-6213.
110. Koberstein, J.T. and R.S. Stein, Small-Angle X-Ray-Scattering Studies of
Microdomain Structure in Segmented Polyurethane Elastomers. Journal of
Polymer Science Part B-Polymer Physics, 1983. 21(8): p. 1439-1472.
111. Bagdi, K., et al., Thermal analysis of the structure of segmented polyurethane
elastomers. Journal of Thermal Analysis and Calorimetry, 2009. 98(3): p.
825-832.
112. Elidrissi, A., O. Krim, and S. Ousslimane, Effect of sequence concentrations
on segmented polyurethanes properties. Pigment & Resin Technology, 2008.
37(2): p. 73-79.
113. Nakamae, K., et al., Microphase separation and surface properties of
segmented polyurethane - Effect of hard segment content. International
Journal of Adhesion and Adhesives, 1996. 16(4): p. 233-239.
114. Goyert, W. and H. Hespe, TPU - Eigenschaften und Anwendungen.
Kunststoffe, 1978. 68(12): p. 819-825.
115. Frick, A. and A. Rochman, Characterization of TPU-elastomers by thermal
analysis (DSC). Polymer Testing, 2004. 23(4): p. 413-417.

194
116. Hesketh, T.R., J.W.C. Vanbogart, and S.L. Cooper, Differential Scanning
Calorimetry Analysis of Morphological-Changes in Segmented Elastomers.
Polymer Engineering and Science, 1980. 20(3): p. 190-197.
117. Frontini, P.M., M. Rink, and A. Pavan, Development of Polyurethane
Engineering Thermoplastics .2. Structure and Properties. Journal of Applied
Polymer Science, 1993. 48(11): p. 2023-2032.
118. Vanbogart, J.W.C., D.A. Bluemke, and S.L. Cooper, Annealing-Induced
Morphological-Changes in Segmented Elastomers. Polymer, 1981. 22(10): p.
1428-1438.
119. Leung, L.M. and J.T. Koberstein, Dsc Annealing Study of Microphase
Separation and Multiple Endothermic Behavior in Polyether-Based
Polyurethane Block Copolymers. Macromolecules, 1986. 19(3): p. 706-713.
120. Bajsic, E.G., et al., DSC study of morphological changes in segmented
polyurethane elastomers. Journal of Elastomers and Plastics, 2000. 32(2): p.
162-182.
121. Ng, H.N., et al., Effect of Segment Size and Polydispersity on Properties of
Polyurethane Block Polymers. Polymer, 1973. 14(6): p. 255-261.
122. Yoon, P.J. and C.D. Han, Effect of thermal history on the rheological
behavior of thermoplastic polyurethanes. Macromolecules, 2000. 33(6): p.
2171-2183.
123. Yamasaki, S., et al., Effects of aggregation structure on rheological
properties of thermoplastic polyurethanes. Polymer, 2007. 48(16): p. 4793-
4803.
124. Nichetti, D., S. Cossar, and N. Grizzuti, Effects of molecular weight and
chemical structure on phase transition of thermoplastic polyurethanes.
Journal of Rheology, 2005. 49(6): p. 1361-1376.
125. Blackwell, J. and C.D. Lee, Hard-Segment Polymorphism in Mdi Diol-Based
Polyurethane Elastomers. Journal of Polymer Science Part B-Polymer
Physics, 1984. 22(4): p. 759-772.
126. Laity, P.R., et al., Morphological changes in thermoplastic polyurethanes
during heating. Journal of Applied Polymer Science, 2006. 100(1): p. 779-
790.

195
127. Koberstein, J.T. and T.P. Russell, Simultaneous Saxs-Dsc Study of Multiple
Endothermic Behavior in Polyether-Based Polyurethane Block Copolymers.
Macromolecules, 1986. 19(3): p. 714-720.
128. Jancar, J., Structure-property relationships in thermoplastic matrices.
Mineral Fillers in Thermoplastics I, 1999. 139: p. 1-65.
129. Mateen, A. and S.A. Siddiqi, Impact Properties of Polyurethane and Glass-
Fibers Reinforced Composites. Journal of Materials Science, 1989. 24(12): p.
4516-4524.
130. Suresha, B., Friction and Dry Slide Wear of Short Glass Fiber Reinforced
Thermoplastic Polyurethane Composites. Journal of Reinforced Plastics and
Composites, 2010. 29(7): p. 1055-1061.
131. Wilberforce, S. and S. Hashemi, Effect of fibre concentration, strain rate and
weldline on mechanical properties of injection-moulded short glass fibre
reinforced thermoplastic polyurethane. 2009(44): p. 1333–1343.
132. Chen, C.H. and C.C.M. Ma, Pultruded Fiber Reinforced Polyurethane
Composites .2. Effect of Processing Parameters on Mechanical and Thermal-
Properties. Composites Science and Technology, 1992. 45(4): p. 345-352.
133. Chen, C.H. and C.C.M. Ma, Pultruded Fiber Reinforced Polyurethane
Composites .1. Process Feasibility and Morphology. Composites Science and
Technology, 1992. 45(4): p. 335-344.
134. Correa, R.A., R.C.R. Nunes, and W.Z. Franco, Short fiber reinforced
thermoplastic polyurethane elastomer composites. Polymer Composites,
1998. 19(2): p. 152-155.
135. Correa, R.A., R.C.R. Nunes, and V.L. Lourenco, Investigation of the
degradation of thermoplastic polyurethane reinforced with short fibres.
Polymer Degradation and Stability, 1996. 52(3): p. 245-251.
136. Akbarian, M., S. Hassanzadeh, and M. Moghri, Short Twaron aramid fiber
reinforced thermoplastic polyurethane. Polymers for Advanced
Technologies, 2008. 19(12): p. 1894-1900.
137. Mothe, C.G., C.R. de Araujo, and S.H. Wang, Thermal and mechanical
characteristics of polyurethane/curaua fiber composites. Journal of Thermal
Analysis and Calorimetry, 2009. 95(1): p. 181-185.
196
138. Kutty, S.K.N. and G.B. Nando, Short Kevlar Fiber Thermoplastic
Polyurethane Composite. Journal of Applied Polymer Science, 1991. 43(10):
p. 1913-1923.
139. Kutty, S.K.N. and G.B. Nando, Stress-Relaxation Behavior of Short Kevlar
Fiber-Reinforced Thermoplastic Polyurethane. Journal of Applied Polymer
Science, 1991. 42(7): p. 1835-1844.
140. Kutty, S.K.N. and G.B. Nando, Mechanical-Properties of Short Polyethylene
Terephthalate Fiber-Thermoplastic Polyurethane Composite. International
Journal of Polymeric Materials, 1993. 19(1-2): p. 63-74.
141. Kutty, S.K.N. and G.B. Nando, Studies on the Effect of an External Flaw on
the Tensile-Strength of Short Kevlar Fiber Thermoplastic Polyurethane
Composites. Journal of Applied Polymer Science, 1992. 46(3): p. 471-481.
142. Kutty, S.K.N., T.K. Chaki, and G.B. Nando, Thermal-Degradation of Short
Kevlar Fiber Thermoplastic Polyurethane Composite. Polymer Degradation
and Stability, 1992. 38(3): p. 187-192.
143. Vajrasthira, C., T. Amornsakcha, and S. Bualek-Limcharoen, Fiber–Matrix
Interactions in Aramid-Short-Fiber-Reinforced Thermoplastic Polyurethane
Composites. Journal of Applied Polymer Science, 2003. 87: p. 1059–1067.
144. Sanchez-Adsuar, M.S., et al., Influence of the nature and the content of
carbon fiber on properties of thermoplastic polyurethane-carbon fiber
composites. Journal of Applied Polymer Science, 2003. 90(10): p. 2676-
2683.
145. Bakare, I.O., et al., Mechanical and thermal properties of sisal fiber-
reinforced rubber seed oil-based polyurethane composites. Materials &
Design, 2010. 31(9): p. 4274-4280.
146. Borda, J., et al., Novel polyurethane elastomer continuous carbon fiber
composites: Preparation and characterization. Journal of Applied Polymer
Science, 2007. 103(1): p. 287-292.
147. Chakar, A., T.M. Lam, and J.P. Pascault, Analysis of the Structure of
Polyurethane Matrix in Fiber-Composites. Polymer Bulletin, 1984. 12(1): p.
15-22.
148. Chen, C.H. and C.C.M. Ma, Pultruded Fiber Reinforced Blocked
Polyurethane (Pu) Composites .2. Processing Variables and Dynamic

197
Mechanical-Properties. Journal of Applied Polymer Science, 1992. 46(6): p.
949-957.
149. Chen, C.H. and C.C.M. Ma, Pultruded Fiber Reinforced Blocked
Polyurethane (Pu) Composites .1. Processability and Mechanical-Properties.
Journal of Applied Polymer Science, 1992. 46(6): p. 937-947.
150. Chen, C.H. and C.C.M. Ma, Pultruded Fiber-Reinforced Blocked
Polyurethane Composites - Static and Dynamic-Mechanical Properties.
Antec 93 : Be in That Number, Vols 1-3, 1993. 39: p. 1993-1998.
151. Chen, C.H. and C.C.M. Ma, Pultruded Fiber-Reinforced Polyurethane
Composites .3. Static Mechanical, Thermal, and Dynamic-Mechanical
Properties. Composites Science and Technology, 1994. 52(3): p. 427-432.
152. Kim, D.S. and C.W. Macosko, Reaction injection molding process of glass
fiber reinforced polyurethane composites. Polymer Engineering and Science,
2000. 40(10): p. 2205-2216.
153. Ma, C.C.M. and C.H. Chen, Fiber Reinforced Polyurethane (Pu) Composites
.1. Process Feasibility and Morphology. Materials Working for You in the
21st Century, 1992. 37: p. 1062-1074.
154. Shonaike, G.O. and T. Matsuo, The dependence of shear coupling
deformation on impregnation condition of glass fiber reinforced
thermoplastic polyurethane composites. Journal of Reinforced Plastics and
Composites, 1997. 16(15): p. 1371-1382.
155. Zhao, G., T.M. Wang, and Q.H. Wang, Surface Modification of Carbon
Fiber and Its Effects on the Mechanical and Tribological Properties of the
Polyurethane Composites. Polymer Composites, 2011. 32(11): p. 1726-1733.
156. Campell, D., R.A. Pethrick, and J.R. White, Polymer Characterization:
Physical Techniques. 2nd ed. 2000, Cheltenham: Stanley Thornes Limited
UK.
157. Hunt, B.J. and M.I. James, eds. Polymer Characterisation. 1993, Blackie
Academic and Professional, an imprint of Chapman and Hall UK: London.
158. Bikales, N.M., ed. Characterization of Polymers. 1971, John Wiley & Sons
Canada: Toronto.
159. Daniels, T., Thermal Analysis. 1973, London: Kogan Page Limited Great
Britain.
198
160. Bower, D.I., Introduction to Polymer Physics. 2002, Cambridge: Press
Syndicate UK.
161. Hay, J.N., The Physical Aging of Amorphous and Crystalline Polymers. Pure
and Applied Chemistry, 1995. 67(11): p. 1855-1858.
162. Nichetti, D. and N. Grizzuti, Determination of the phase transition behavior
of thermoplastic polyurethanes from coupled rheology/DSC measurements.
Polymer Engineering and Science, 2004. 44(8): p. 1514-1521.
163. Cullity, B.D. and S.R. Stock, Elements of X-Ray Diffraction. 3rd ed. 2001,
New Jersey: Prentice Hall USA.
164. Duckett, S. and B. Gilbert, Foundations of Spectroscopy. 2000, New York:
Oxford University Press USA.
165. Surhone, L.M., M.T. Timpledon, and S.F. Marseken, eds. Small-Angle X-Ray
Scattering. 2010, VDM Publishing House Limited Mauritius: Beau Bassin.
166. Keattch, C.J. and D. Dollimore, An Introduction to Thermogravimetry. 2nd
ed. 1969, London: Heyden and Sons Limited UK.
167. Robert, C., X-Ray Computed Tomography in Biomedical Engineering. 2011,
London: Springer-Verlag London Limited UK.
168. Barnes, H.A., A Handbook of Elementary Rheology. 2000, Aberystwyth: The
University of Wales Institute of Non-Newtonian Fluid Mechanics,
Department of Mathematics Wales.
169. Walters, K., Rheometry. 1975, London: Chapman and Hall Great Britain.
170. Haponiuk, J.T., Dynamic-Mechanical Thermal-Analysis of Polyamide
6/Thermoplastic Polyurethane Blends. Journal of Thermal Analysis, 1995.
43(1): p. 91-101.
171. Morton-Jones, D.H., Polymer Processing. 1989, London: Chapman and Hall
Great Britain.
172. Zhang, S.Y. and X.Y. Xiang, Creep Characterization of a Fiber Reinforced
Plastic Material. Journal of Reinforced Plastics and Composites, 1992.
11(10): p. 1187-1194.
173. Dyer, E. and R.E. Read, New Catalysts for Conversion of Isocyanates to
Carbodiimides. Journal of Organic Chemistry, 1961. 26(11): p. 4677-&.
174. Grassie, N. and M. Zulfiqar, Thermal-Degradation of Polyurethane from 1,4-
Butanediol and Methylene Bis(4-Phenyl Isocyanate). Journal of Polymer
Science Part a-Polymer Chemistry, 1978. 16(7): p. 1563-1574.

199
175. Sebenik, U. and M. Krajnc, Seeded sernibatch emulsion copolymerization of
methyl methacrylate and butyl acrylate using polyurethane dispersion: effect
of soft segment length on kinetics. Colloids and Surfaces a-Physicochemical
and Engineering Aspects, 2004. 233(1-3): p. 51-62.
176. Napier, D.H.W., T. W, Toxic Products from the Combustion and Pyrolysis of
Polyurethane Foams. Br. Polym. J, 1972. 4: p. 45-52.
177. Chattopadhyay, D.K. and D.C. Webster, Thermal stability and flame
retardancy of polyurethanes. Progress in Polymer Science, 2009. 34(10): p.
1068-1133.
178. Miller, J.A., T.A. Speckhard, and S.L. Cooper, Monte-Carlo Simulation
Study of the Polymerization of Polyurethane Block Copolymers .2. Modeling
of Premature Phase-Separation during Reaction Using the 2-Phase Ideal
Reaction Model. Macromolecules, 1986. 19(6): p. 1568-1574.
179. Rogulska, M., A. Kultys, and S. Pikus, Studies on thermoplastic
polyurethanes based on new diphenylethane-derivative diols. III. The effect
of molecular weight and structure of soft segment on some properties of
segmented polyurethanes. Journal of Applied Polymer Science, 2008. 110(3):
p. 1677-1689.
180. Shieh, Y.T., et al., Thermal degradation of MDI-based segmented
polyurethanes. Journal of Polymer Science Part a-Polymer Chemistry, 1999.
37(22): p. 4126-4134.
181. Jabrane, S., J.M. Letoffe, and P. Claudy, Study of the thermal behaviour of
1,3-propanediol and its aqueous solutions. Thermochimica Acta, 1998.
311(1-2): p. 121-127.
182. Lewis, C.L. and J.E. Spruiell, Crystallization of 2-methyl-1,3-propanediol
substituted poly(ethylene terephthalate). I. Thermal behavior and isothermal
crystallization. Journal of Applied Polymer Science, 2006. 100(4): p. 2592-
2603.
183. Lyman, D.J., Polyurethanes .2. Effect of Cis-Trans Isomerism on Properties
of Polyurethanes. Journal of Polymer Science, 1961. 55(162): p. 507-&.
184. Chau, K.W. and P.H. Geil, Domain Morphology in Polyurethanes. Polymer,
1985. 26(4): p. 490-500.
185. Aharoni, S.M., In n-Nylons: Their Synthesis, Structures and Properties.
Wiley: Chichester, 1997.

200
186. Atkins, E.D.T., M.J. Hill, and K. Veluraja, Structural and Morphological
Investigations of Nylon-8 Chain-Folded Lamellar Crystals. Polymer, 1995.
36(1): p. 35-42.
187. Bunn, C.W. and E.V. Garner, The Crystal Structures of 2 Polyamides
(Nylons). Proceedings of the Royal Society of London Series a-Mathematical
and Physical Sciences, 1947. 189(1016): p. 39-&.
188. Cojazzi, G., et al., A New Crystalline Modification of Nylon-10. European
Polymer Journal, 1985. 21(3): p. 309-315.
189. Jones, N.A., et al., Discovery in nylon-8 chain-folded lamellar crystals of
new structure - lambda-structure - with progressive intersheet shear along
the chain axis. Journal of Polymer Science Part B-Polymer Physics, 2000.
38(24): p. 3302-3308.
190. Munozguerra, S., et al., Structural Studies of Odd-Nylon Crystals Grown
from Solution. Journal of Materials Science, 1992. 27(1): p. 89-97.
191. Prieto, A., J.M. Montserrat, and S. Munozguerra, Structure of Nylon-7
Solution Grown Crystals. Journal of Materials Science, 1990. 25(4): p. 2091-
2094.
192. Wunderlich, B., In Macromolecular Physics. Academic Press: New York,
1973. Vol. 1.
193. Blackwell, J. and M.R. Nagarajan, Conformational-Analysis of Poly(Mdi-
Butandiol) Hard Segment in Polyurethane Elastomers. Polymer, 1981. 22(2):
p. 202-208.
194. Blackwell, J., M.R. Nagarajan, and T.B. Hoitink, Structure of Polyurethane
Elastomers - Effect of Chain Extender Length on the Structure of Mdi Diol
Hard Segments. Polymer, 1982. 23(7): p. 950-956.
195. Blackwell, J., M.R. Nagarajan, and T.D. Hoitink, The Structure of the Hard
Segments in Polyurethane Elastomers. Abstracts of Papers of the American
Chemical Society, 1980. 180(Aug): p. 16-Macr.
196. Blackwell, J., J.R. Quay, and C.D. Lee, X-Ray-Analysis of the Structure of
Polyurethane Elastomers. Abstracts of Papers of the American Chemical
Society, 1985. 190(Sep): p. 119-POY.
197. Blackwell, J. and M. Ross, X-Ray Studies of the Structure of Polyurethane
Hard Segments. Journal of Polymer Science Part C-Polymer Letters, 1979.
17(7): p. 447-451.

201
198. Pergal, M.V., et al., Influence of the content of hard segments on the
properties of novel urethane-siloxane copolymers based on a poly(epsilon-
caprolactone)-b-poly(dimethylsiloxane)-b-poly(epsilon-caprolactone)
triblock copolymer. Journal of the Serbian Chemical Society, 2011. 76(12):
p. 1703-1723.
199. Pergal, M.V., et al., Structural, thermal and surface characterization of
thermoplastic polyurethanes based on poly(dimethylsiloxane). Journal of the
Serbian Chemical Society, 2014. 79(7): p. 843-+.
200. Born, L., et al., On the Structure of Polyurethane Hard Segments Based on
Mdi and Butanediol-1,4 - X-Ray-Diffraction Analysis of Oriented Elastomers
and of Single-Crystals of a Model-Compound. Journal of Polymer Science
Part B-Polymer Physics, 1984. 22(2): p. 163-173.
201. Briber, R.M. and E.L. Thomas, Investigation of 2 Crystal Forms in Mdi Bdo-
Based Polyurethanes. Journal of Macromolecular Science-Physics, 1983.
B22(4): p. 509-528.
202. Chang, A.L., et al., Morphological-Study of the Structure Developed during
the Polymerization of a Series of Segmented Polyurethanes. Polymer, 1982.
23(7): p. 1060-1068.
203. Schneider, N.S., et al., Structural Studies of Crystalline Mdi-Based
Polyurethanes. Journal of Macromolecular Science-Physics, 1975. B 11(4):
p. 527-552.
204. Vanbogart, J.W.C., P.E. Gibson, and S.L. Cooper, Structure-Property
Relationships in Polycaprolactone-Polyurethanes. Journal of Polymer
Science Part B-Polymer Physics, 1983. 21(1): p. 65-95.
205. Forcier, P.G. and J. Blackwell, The Structure of Bis(4-Hydroxybutyl)4,4'-
Methylenebis(Phenylcarbamate) - a Model-Compound for Diol-Linked Mdi
Units in Polyurethane Elastomers. Acta Crystallographica Section B-
Structural Science, 1981. 37(Jan): p. 286-289.
206. Heikens, D., A. Meijers, and P.H. Vonreth, Difference in Mechanical
Properties of Fibres of Linear Polyesterurethanes Prepared with Different
Diamines. Polymer, 1968. 9(1): p. 15-&.
207. Morbitze.L and H. Hespe, Correlations between Chemical Structure, Stress-
Induced Crystallization, and Deformation Behavior of Polyurethane
Elastomers. Journal of Applied Polymer Science, 1972. 16(10): p. 2697-&.

202
208. Samuels, S.L. and G.L. Wilkes, Comments on Multiple Endothermic
Behavior Observed in Segmented Urethane Systems. Journal of Polymer
Science Part B-Polymer Physics, 1973. 11(4): p. 807-811.
209. Seymour, R.W. and S.L. Cooper, Dsc Studies of Polyurethane Block
Polymers. Journal of Polymer Science Part B-Polymer Letters, 1971. 9(9): p.
689-&.
210. Trai, R.S., Effect of Annealing on a Thermoplastic Segmented Polyurethane.
Polymers at Frontiers of Science and Technology, 2008.
211. Briber, R.M. and E.L. Thomas, The Structure of Mdi/Bdo-Based
Polyurethanes - Diffraction Studies on Model Compounds and Oriented
Thin-Films. Journal of Polymer Science Part B-Polymer Physics, 1985.
23(9): p. 1915-1932.
212. Chang, M.C.O., D.A. Thomas, and L.H. Sperling, Group Contribution
Analysis of the Damping Behavior of Homopolymers, Statistical Copolymers,
and Interpenetrating Polymer Networks Based on Acrylic, Vinyl, and
Styrenic Mers. Journal of Polymer Science Part B-Polymer Physics, 1988.
26(8): p. 1627-1640.
213. Kloss, J., et al., Poly(ester urethane)s with polycaprolactone soft segments: A
morphological study. Journal of Polymer Science Part a-Polymer Chemistry,
2002. 40(23): p. 4117-4130.
214. Sultan, W. and J.P. Busnel, Kinetic study of polyurethanes formation by
using differential scanning calorimetry. Journal of Thermal Analysis and
Calorimetry, 2006. 83(2): p. 355-359.
215. Bae, J.Y., et al., Effect of the structure of chain extenders on the dynamic
mechanical behaviour of polyurethane. Journal of Materials Science, 1999.
34(11): p. 2523-2527.
216. Gunatillake, P.A., et al., Synthesis and characterization of a series of
poly(alkylene carbonate) macrodiols and the effect of their structure on the
properties of polyurethanes. Journal of Applied Polymer Science, 1998.
69(8): p. 1621-1633.
217. Miller, J.A., et al., Properties of Polyether Polyurethane Block Copolymers -
Effects of Hard Segment Length Distribution. Macromolecules, 1985. 18(1):
p. 32-44.
203
218. Seymour, R.W. and S.L. Cooper, Thermal-Analysis of Polyurethane Block
Polymers. Macromolecules, 1973. 6(1): p. 48-53.
219. Wilkes, G.L., et al., Time-Dependence of Thermal and Mechanical-
Properties of Segmented Urethanes Following Thermal Treatment. Journal of
Polymer Science Part C-Polymer Letters, 1975. 13(6): p. 321-327.
220. Wilkes, G.L. and R. Wildnauer, Kinetic-Behavior of Thermal and
Mechanical-Properties of Segmented Urethanes. Journal of Applied Physics,
1975. 46(10): p. 4148-4152.
221. Lee, N.J. and J.S. Jang, The effect of fibre content on the mechanical
properties of glass fibre mat polypropylene composites. Composites Part a-
Applied Science and Manufacturing, 1999. 30(6): p. 815-822.
222. Rejab, M.R.M., et al., An Investigation into the Effects of Fibre Volume
Fraction on GFRP Plate. 2008.
Copyright © 2022 FDOKUMEN