
Longitudinal live animal micro-CT allows for quantitative analysis of tumor-induced bone destruction
11
Longitudinal live animal micro-CT allows for quantitative analysis of tumor-induced bone destruction Lindsay C. Johnson a,b,1 , Rachelle W. Johnson c,d,1 , Steve A. Munoz c,e , Gregory R. Mundy c,d,e , Todd E. Peterson b,f , Julie A. Sterling c,d, ⁎ a Department of Biomedical Engineering, Vanderbilt University, Nashville, TN, USA b Institute of Imaging Science, Vanderbilt University, Nashville, TN, USA c Center for Bone Biology, Vanderbilt University, Nashville, TN, USA d Department of Cancer Biology, Vanderbilt University Medical Center, Nashville, TN, USA e Division of Clinical Pharmacology, Department of Medicine, Vanderbilt University Medical Center, Nashville, TN, USA f Department of Radiology and Radiological Sciences, Vanderbilt University Medical Center, Nashville, TN, USA abstract article info Available online 1 June 2010 Edited by: T. Jack Martin Keywords: Micro-CT Faxitron Radiography Imaging Osteolysis Bone destruction The majority of breast cancer and prostate cancer patients with metastatic disease will go on to develop bone metastases, which contribute largely to the patient's morbidity and mortality. Numerous small animal models of cancer metastasis to bone have been developed to study tumor-induced bone destruction, but the advancement of imaging modalities utilized for these models has lagged significantly behind clinical imaging. Therefore, there is a significant need for improvements to live small animal imaging, particularly when obtaining high-resolution images for longitudinal quantitative analyses. Recently, live animal micro- computed tomography (μCT) has gained popularity due to its ability to obtain high-resolution 3-dimensional images. However, the utility of μCT in bone metastasis models has been limited to end-point analyses due to off-target radiation effects on tumor cells. We hypothesized that live animal in vivo μCT can be utilized to perform reproducible and quantitative longitudinal analyses of bone volume in tumor-bearing mice, particularly in a drug treatment model of breast cancer metastasis to bone. To test this hypothesis, we utilized the MDA-MB-231 osteolytic breast cancer model in which the tumor cells are inoculated directly into the tibia of athymic nude mice and imaged mice weekly by Faxitron (radiography), Imtek μCT (in vivo), and Maestro (GFP-imaging). Ex vivo μCT and histology were performed at end point for validation. After establishing a high-resolution scanning protocol for the Imtek CT, we determined whether clear, measurable differences in bone volume were detectable in mice undergoing bisphosphonate drug treatments. We found that in vivo μCT could be used to obtain quantifiable and longitudinal images of the progression of bone destruction over time without altering tumor cell growth. In addition, we found that we could detect lesions as early as week 1 and that this approach could be used to monitor the effect of drug treatment on bone. Taken together, these data indicate that in vivo μCT is an effective and reproducible method for longitudinal monitoring of tumor-associated bone destruction in mouse models of tumor-induced bone disease. © 2010 Elsevier Inc. All rights reserved. Introduction Nearly 70% of breast cancer and 90% of prostate cancer patients with metastatic disease will develop bone metastases [1]. To investigate breast and prostate tumor effects on bone, several small animal models have been developed that are capable of producing pathogenesis strikingly similar to the clinical condition in both tumor burden and bone disease [2–6]. While these animal models accurately reflect the bone disease portion of the clinical disease, small animal imaging has lagged significantly behind clinical imaging. This has hindered preclinical rodent models in which drug treatments typically commence upon visual evidence of bone disease and is particularly limiting due to the difficulty of detecting tumors in animal bone as early as can be detected in human patients. In addition, the lack of precise small animal imaging has limited quantitative longitudinal analyses of animals in drug treatment studies. Therefore, significant improvements to small animal imaging modalities are needed. Bone 48 (2011) 141–151 Abbreviations: μCT, micro-computed tomography; MRI, magnetic resonance imaging; fpVCT, flat-panel detector-based volume computed tomography; GFP, green fluorescent protein; PBS, phosphate-buffered saline; HU, Hounsfield unit; PET, positron emission tomography; SPECT, single photon emission computed tomography; RFU, relative fluorescent units; EDTA, ethylenediaminetetraacetic acid; BV/TV, bone volume/tissue volume. ⁎ Corresponding author. Vanderbilt Center for Bone Biology, 2215B Garland Avenue, 1235 MRBIV, Nashville, TN 37232, USA. Fax: +1 615 343 2611. E-mail address: [email protected] (J.A. Sterling). 1 These authors contributed equally to this work. 8756-3282/$ – see front matter © 2010 Elsevier Inc. All rights reserved. doi:10.1016/j.bone.2010.05.033 Contents lists available at ScienceDirect Bone journal homepage: www.elsevier.com/locate/bone
-
Upload
vanderbilthealth -
Category
Documents
-
view
0 -
download
0
Transcript of Longitudinal live animal micro-CT allows for quantitative analysis of tumor-induced bone destruction
Bone 48 (2011) 141–151
Contents lists available at ScienceDirect
Bone
j ourna l homepage: www.e lsev ie r.com/ locate /bone
Longitudinal live animal micro-CT allows for quantitative analysis of tumor-inducedbone destruction
Lindsay C. Johnson a,b,1, Rachelle W. Johnson c,d,1, Steve A. Munoz c,e, Gregory R. Mundy c,d,e,Todd E. Peterson b,f, Julie A. Sterling c,d,⁎a Department of Biomedical Engineering, Vanderbilt University, Nashville, TN, USAb Institute of Imaging Science, Vanderbilt University, Nashville, TN, USAc Center for Bone Biology, Vanderbilt University, Nashville, TN, USAd Department of Cancer Biology, Vanderbilt University Medical Center, Nashville, TN, USAe Division of Clinical Pharmacology, Department of Medicine, Vanderbilt University Medical Center, Nashville, TN, USAf Department of Radiology and Radiological Sciences, Vanderbilt University Medical Center, Nashville, TN, USA
Abbreviations: μCT, micro-computed tomography; MRfpVCT, flat-panel detector-based volume computed tomoprotein; PBS, phosphate-buffered saline; HU, Hounsfieltomography; SPECT, single photon emission computefluorescent units; EDTA, ethylenediaminetetraacetic acivolume.⁎ Corresponding author. Vanderbilt Center for Bone B
1235 MRBIV, Nashville, TN 37232, USA. Fax: +1 615 34E-mail address: [email protected] (J.A. St
1 These authors contributed equally to this work.
8756-3282/$ – see front matter © 2010 Elsevier Inc. Aldoi:10.1016/j.bone.2010.05.033
a b s t r a c t
a r t i c l e i n f oAvailable online 1 June 2010
Edited by: T. Jack Martin
Keywords:Micro-CTFaxitronRadiographyImagingOsteolysisBone destruction
The majority of breast cancer and prostate cancer patients with metastatic disease will go on to develop bonemetastases, which contribute largely to the patient's morbidity and mortality. Numerous small animalmodels of cancer metastasis to bone have been developed to study tumor-induced bone destruction, but theadvancement of imaging modalities utilized for these models has lagged significantly behind clinicalimaging. Therefore, there is a significant need for improvements to live small animal imaging, particularlywhen obtaining high-resolution images for longitudinal quantitative analyses. Recently, live animal micro-computed tomography (μCT) has gained popularity due to its ability to obtain high-resolution 3-dimensionalimages. However, the utility of μCT in bone metastasis models has been limited to end-point analyses due tooff-target radiation effects on tumor cells. We hypothesized that live animal in vivo μCT can be utilized toperform reproducible and quantitative longitudinal analyses of bone volume in tumor-bearing mice,particularly in a drug treatment model of breast cancer metastasis to bone. To test this hypothesis, weutilized the MDA-MB-231 osteolytic breast cancer model in which the tumor cells are inoculated directlyinto the tibia of athymic nude mice and imaged mice weekly by Faxitron (radiography), Imtek μCT (in vivo),and Maestro (GFP-imaging). Ex vivo μCT and histology were performed at end point for validation. Afterestablishing a high-resolution scanning protocol for the Imtek CT, we determined whether clear, measurabledifferences in bone volume were detectable in mice undergoing bisphosphonate drug treatments. We foundthat in vivo μCT could be used to obtain quantifiable and longitudinal images of the progression of bonedestruction over time without altering tumor cell growth. In addition, we found that we could detect lesionsas early as week 1 and that this approach could be used to monitor the effect of drug treatment on bone.Taken together, these data indicate that in vivo μCT is an effective and reproducible method for longitudinalmonitoring of tumor-associated bone destruction in mouse models of tumor-induced bone disease.
I, magnetic resonance imaging;graphy; GFP, green fluorescentd unit; PET, positron emissiond tomography; RFU, relatived; BV/TV, bone volume/tissue
iology, 2215B Garland Avenue,3 2611.erling).
l rights reserved.
© 2010 Elsevier Inc. All rights reserved.
Introduction
Nearly 70% of breast cancer and 90% of prostate cancer patientswith metastatic disease will develop bone metastases [1]. To
investigate breast and prostate tumor effects on bone, several smallanimal models have been developed that are capable of producingpathogenesis strikingly similar to the clinical condition in both tumorburden and bone disease [2–6]. While these animal models accuratelyreflect the bone disease portion of the clinical disease, small animalimaging has lagged significantly behind clinical imaging. This hashindered preclinical rodent models in which drug treatmentstypically commence upon visual evidence of bone disease and isparticularly limiting due to the difficulty of detecting tumors in animalbone as early as can be detected in human patients. In addition, thelack of precise small animal imaging has limited quantitativelongitudinal analyses of animals in drug treatment studies. Therefore,significant improvements to small animal imaging modalities areneeded.
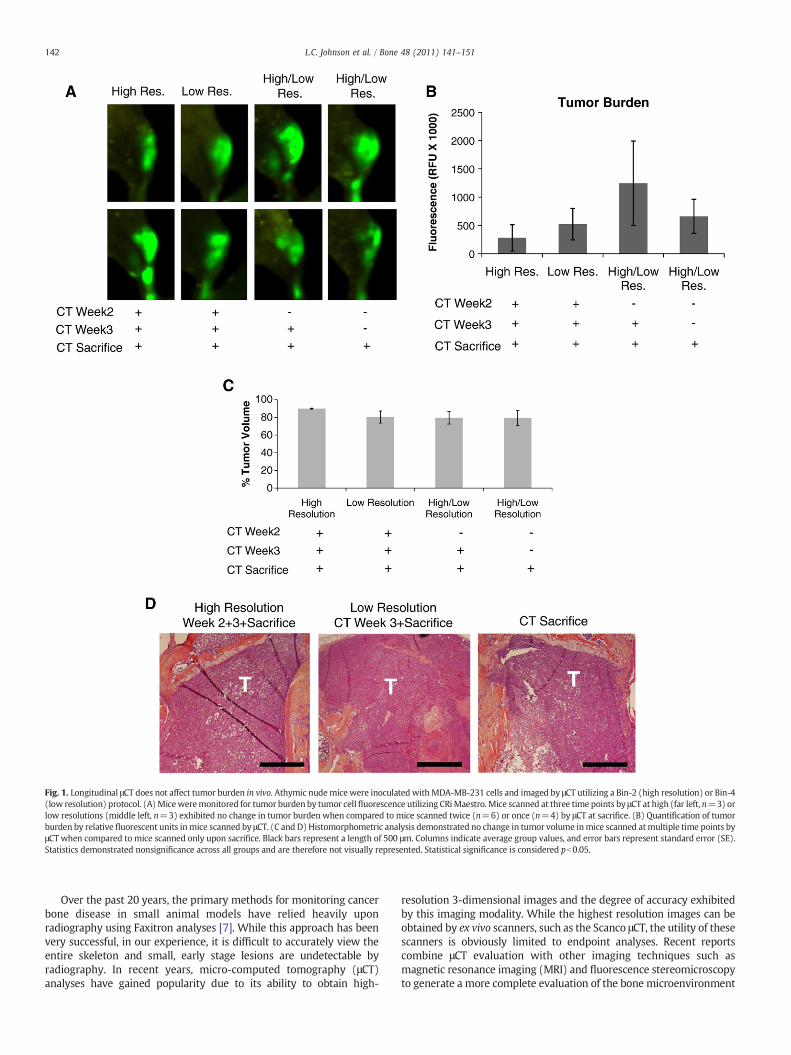
Fig. 1. Longitudinal μCT does not affect tumor burden in vivo. Athymic nudemicewere inoculated withMDA-MB-231 cells and imaged by μCT utilizing a Bin-2 (high resolution) or Bin-4(low resolution) protocol. (A)Miceweremonitored for tumor burden by tumor cellfluorescence utilizing CRiMaestro.Mice scanned at three time points by μCT at high (far left, n=3) orlow resolutions (middle left, n=3) exhibited no change in tumor burden when compared to mice scanned twice (n=6) or once (n=4) by μCT at sacrifice. (B) Quantification of tumorburden by relative fluorescent units inmice scanned by μCT. (C and D) Histomorphometric analysis demonstrated no change in tumor volume inmice scanned atmultiple time points byμCT when compared to mice scanned only upon sacrifice. Black bars represent a length of 500 μm. Columns indicate average group values, and error bars represent standard error (SE).Statistics demonstrated nonsignificance across all groups and are therefore not visually represented. Statistical significance is considered pb0.05.
142 L.C. Johnson et al. / Bone 48 (2011) 141–151
Over the past 20 years, the primary methods for monitoring cancerbone disease in small animal models have relied heavily uponradiography using Faxitron analyses [7]. While this approach has beenvery successful, in our experience, it is difficult to accurately view theentire skeleton and small, early stage lesions are undetectable byradiography. In recent years, micro-computed tomography (μCT)analyses have gained popularity due to its ability to obtain high-
resolution 3-dimensional images and the degree of accuracy exhibitedby this imaging modality. While the highest resolution images can beobtained by ex vivo scanners, such as the Scanco μCT, the utility of thesescanners is obviously limited to endpoint analyses. Recent reportscombine μCT evaluation with other imaging techniques such asmagnetic resonance imaging (MRI) and fluorescence stereomicroscopyto generate a more complete evaluation of the bone microenvironment

143L.C. Johnson et al. / Bone 48 (2011) 141–151
in metastatic cancer [8], but the limitation of end-point analysespersists. Our group has previously used live animal μCT successfully forimagingbone, but found that high resolution scans killed the tumor cells
(unpublished data), limiting its utility to end point analyses. In addition,it was recently reported that certain doses of CT radiation may enhancemetastasis to specific sites in bone [9].
Missbach-Guentner et al. [10] addressed several of these issuesutilizing a 3-dimensional flat-panel detector-based volume computedtomography (fpVCT); however, the detector in use is fairly uncom-mon, and the majority of quantification performed was primarily 2-dimensional measurements. Quantitative analysis of 3-dimensionalbone volume was only reported in one mouse, lacking statisticalsignificance, and the method used for quantification was unclear.
In this study, we set out to determine if live animal μCT can beutilized to perform reproducible and quantitative longitudinal analysesof bone volume in tumor bearing mice, particularly in a drug treatmentmodel of breast cancer metastasis to bone. To do this, we utilized theMDA-MB-231 osteolytic breast cancer model in which the tumor cellsare inoculated directly into the tibia of athymic nude mice and imagedmice weekly by Faxitron (radiography), Imtek μCT (in vivo), andMaestro (GFP-imaging). Scanco μCT (ex vivo) and histology wereperformed at end point for validation. After establishing a high-resolution scanning protocol for the Imtek CT, we determined whetherclear, measurable differences in bone volume were detectable in miceundergoing bisphosphonate drug treatments. Bisphosphonates areclinically utilized in breast and prostate cancer metastasis to bone topalliate tumor-associated bone pain and prevent the recurrence ofskeletal related events by binding to the surface of bone and inducingosteoclast apoptosis [11].We found that in vivoμCTcanbeused to obtainquantifiable and longitudinal images of the progression of bonedestruction over time without altering tumor cell growth. In addition,we found that we could detect lesions as early as week 1 and that thisapproach could beused tomonitor the effect of drug treatment on bone.
Methods
Single-group longitudinal study
Preliminary studies were first performed on 16 mice to determinethe effect of weekly irradiation on this cell line. Micewere broken downinto four groups, and two different μCT protocols were performed usingthe Imtek MicroCAT II, one high-resolution (Bin-2), and one lower-resolution (Bin-4),with imagingbeingperformed1 (n=4), 2 (n=6), or3 time(s) (n=3 Bin-2, n=3 Bin-4) during the 4-week study, with thegroup scannedone time receiving theCT scanonly at sacrifice. The Bin-2protocol used 80 kV(p), 500 μA with 900 msec per projection and 600projections over 360° for a total scan time of approximately 20 minutes,while the Bin-4 protocol was acquired with 80 kV(p), 500 μA with600 msec per projection and 300 projections over 360° for a total scantime of approximately 10 minutes. All images were reconstructed to512×512×512 voxels, with Bin-2 having 0.1×0.1×0.05 mm3 voxelsize and Bin-4 having 0.159×0.159×0.062 mm3 voxel size. Theradiation doses from Bin 2 and Bin 4 were estimated to be 148.3 mGyand 49.4 mGy, respectively. Both protocols were reconstructedwith the
Fig. 2. Longitudinal in vivo μCT demonstrates bone loss over time in individual mice. (A)Overlay of registered isosurface volume images from three individual time points oflongitudinal in vivo μCT scans of control hind limb. (B–D) Weekly isosurface volumerenderings of weeks 2, 3, and 4 (sacrifice) of the control hind limb of the same mouseusing high-resolution μCT. (E) Overlay of registered isosurface volume images fromthree individual time points of longitudinal in vivo μCT scans of tumor-bearing hindlimb. (F–H)Weekly isosurface volume renderings of weeks 2, 3, and 4 (sacrifice) of thetumor-bearing hind limb of the same mouse using high-resolution μCT. All renderingthresholds were set to 1000 HU. (I) Histomorphometric analyses indicate no significantdifference in percent of bone volume/tissue volume, regardless of the number of μCTscans. Columns indicate average group values, and error bars represent standard error(SE). Statistics demonstrated nonsignificance across all groups and are therefore notvisually represented.
144 L.C. Johnson et al. / Bone 48 (2011) 141–151
same cone beam-filtered back projection algorithm with a Hammingfilter.
Two-group longitudinal study
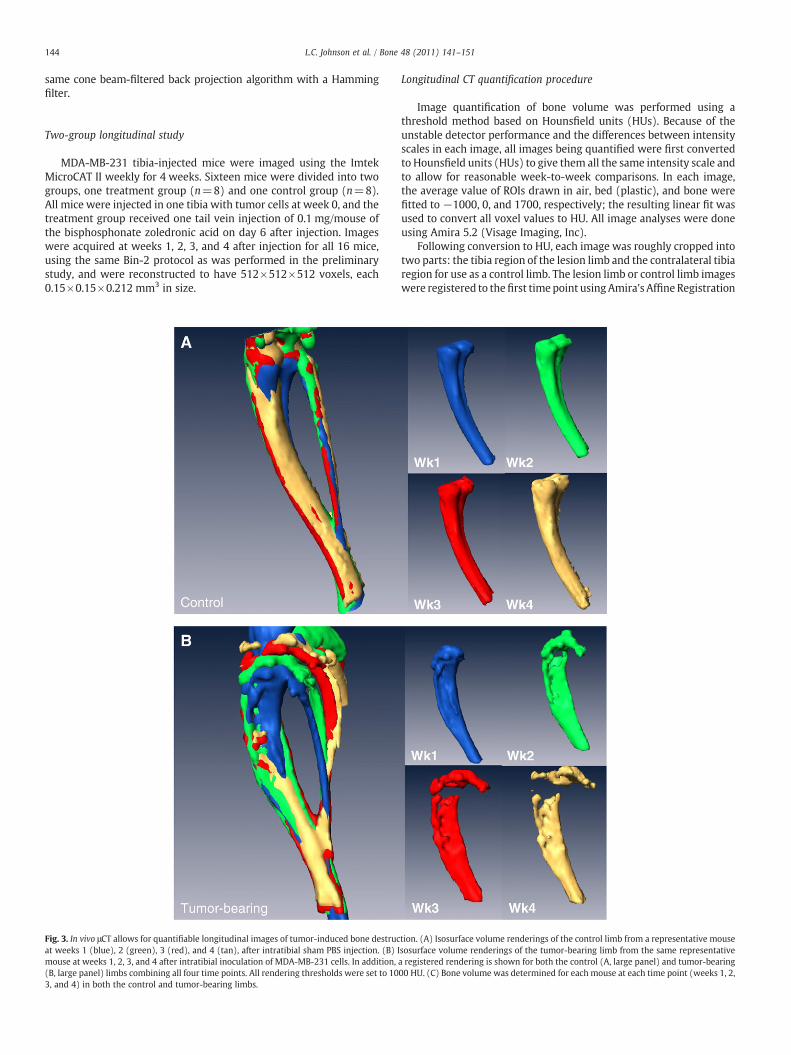
MDA-MB-231 tibia-injected mice were imaged using the ImtekMicroCAT II weekly for 4 weeks. Sixteen mice were divided into twogroups, one treatment group (n=8) and one control group (n=8).All mice were injected in one tibia with tumor cells at week 0, and thetreatment group received one tail vein injection of 0.1 mg/mouse ofthe bisphosphonate zoledronic acid on day 6 after injection. Imageswere acquired at weeks 1, 2, 3, and 4 after injection for all 16 mice,using the same Bin-2 protocol as was performed in the preliminarystudy, and were reconstructed to have 512×512×512 voxels, each0.15×0.15×0.212 mm3 in size.
Fig. 3. In vivo μCT allows for quantifiable longitudinal images of tumor-induced bone destrucat weeks 1 (blue), 2 (green), 3 (red), and 4 (tan), after intratibial sham PBS injection. (B) Imouse at weeks 1, 2, 3, and 4 after intratibial inoculation of MDA-MB-231 cells. In addition,(B, large panel) limbs combining all four time points. All rendering thresholds were set to 103, and 4) in both the control and tumor-bearing limbs.
Longitudinal CT quantification procedure
Image quantification of bone volume was performed using athreshold method based on Hounsfield units (HUs). Because of theunstable detector performance and the differences between intensityscales in each image, all images being quantified were first convertedto Hounsfield units (HUs) to give them all the same intensity scale andto allow for reasonable week-to-week comparisons. In each image,the average value of ROIs drawn in air, bed (plastic), and bone werefitted to −1000, 0, and 1700, respectively; the resulting linear fit wasused to convert all voxel values to HU. All image analyses were doneusing Amira 5.2 (Visage Imaging, Inc).
Following conversion to HU, each image was roughly cropped intotwo parts: the tibia region of the lesion limb and the contralateral tibiaregion for use as a control limb. The lesion limb or control limb imageswere registered to thefirst timepoint usingAmira's Affine Registration
tion. (A) Isosurface volume renderings of the control limb from a representative mousesosurface volume renderings of the tumor-bearing limb from the same representativea registered rendering is shown for both the control (A, large panel) and tumor-bearing00 HU. (C) Bone volume was determined for each mouse at each time point (weeks 1, 2,

Fig. 3 (continued).
145L.C. Johnson et al. / Bone 48 (2011) 141–151
function using the correlation metric with a quasi newton optimizerstep. Each limb was then carefully cropped to extend from just belowthepatella, but above the growthplate, to the pointwhere the tibia andfibula join, with the fibula being removed as well. It was determinedthat a threshold of 1000 HU was most sensitive to changes in bonevolume (data not shown) and subsequently applied to each image. Thenumber of voxels that were above the threshold were then summedand converted to a volume measure of the tibia.
Tumor cell intratibial inoculation and histological processing
Confluent MDA-MB-231 human breast cancer cells were trypsi-nized, washed, and resuspended in PBS for injection into the right tibiaof anesthetized 4-week-old female athymic nude mice (HarlanSprague Dawley, Inc.) at 2.5×10⁵ cells per mouse. Contralateralintratibial injections of PBS were used as an internal control for eachmouse. Animalswere euthanized fourweeks after injection. Hind limbspecimens (tibia and femora) were removed during autopsy and fixedin 10% neutral-buffered formalin (Fisher Scientific) for 48 hours atroom temperature. Bone specimens were decalcified in 10% EDTA for2 weeks and embedded in paraffin. Bone sections were stained withhematoxylin, eosin, orange G, and phloxine. Histomorphometry wasused to analyze tumor burden in the tibia and femurs usingMetamorph software (Molecular Devices, Inc.). Specifically, usingthe drawing tool in Metamorph, the region between the corticesdirectly below the growth plate was selected and calculated by thesoftware as the total area in squared centimeters. The tumor, asdetermined by H+E staining, was selected using the same approach.Tumor burden was calculated as a percentage of tumor area over totaltissue area . Multiple levels of bone sections were stained and imaged,and all statistical analyses were quantified at the same histomorpho-metric level. All statistical analyses were performed using InStatversion 3.03 software (GraphPad Software Inc.).
Radiographs of mice
Animals were anesthetized deeply and laid down in a proneposition on the platform of the Faxitron LX-60. Images were acquiredat 35 kV(p) for 8 seconds. Lesion area and lesion number weredetermined using quantitative image analysis software (Metamorph;Molecular Devices).
Fluorescent imaging (Maestro)
GFP tagged tumor cell growth was measured and quantified usingthe CRi Maestro system. Mice were anesthetized using isoflurane andthen placed in the Maestro imaging equipment. After the image wasobtained, it was spectrally unmixed to remove the backgroundfluorescence. Images were quantified using region of interest (ROI)analysis software that is supplied with the Maestro system.
Ex vivo μCT analysis
Tibias were analyzed using the Scanco μCT 40. Specifically, 100slices from the proximal tibia were scanned at 12-μm resolution.Images were analyzed using the Scanco Medical Imaging software todetermine the VOX–bone volume.
Statistical analyses
For statistical analysis of the two-group longitudinal μCT data, wefitted a linear mixed model to the data and included random subjecteffect to account for the correlation of the longitudinal measurementsfrom the same subject. Slope analysis for each group was performedand compared to zero. To adjust for multiple comparisons, we used0.05/8=0.006 as the cutoff point for p values being statisticallysignificant. The slope of the tibia volume as a function of time in theuntreated control limb group was found to be significantly less than

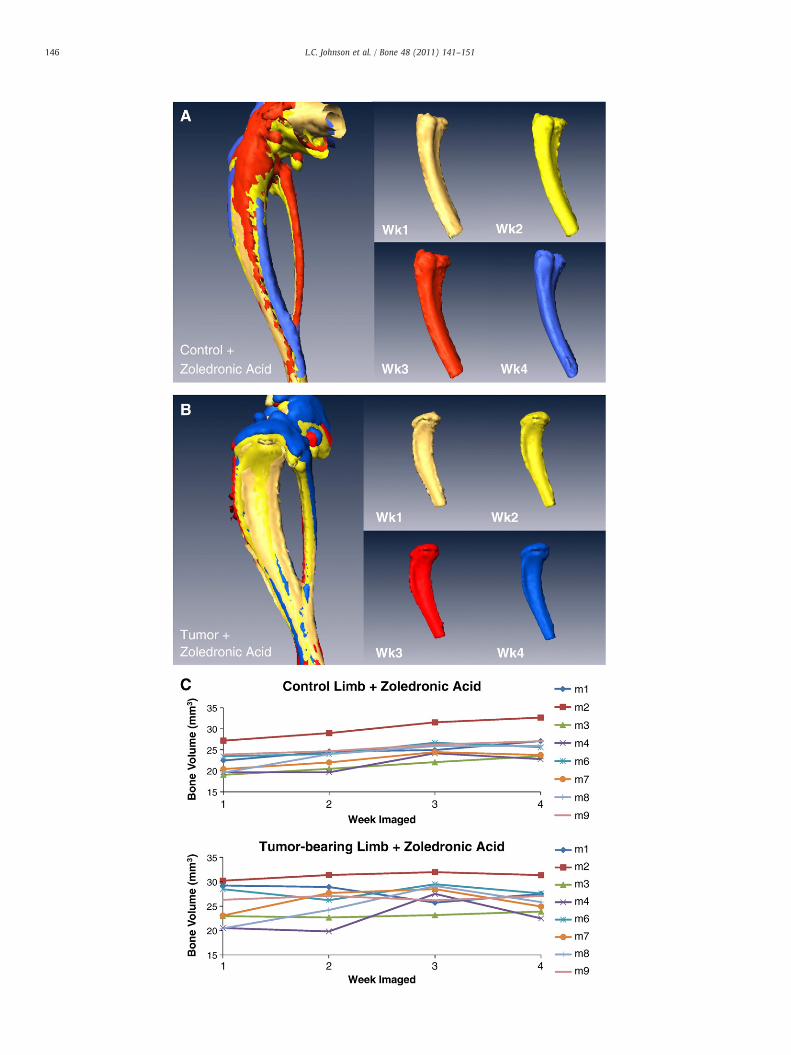
Fig. 4. In vivo μCT monitors changes in bone volume when mice are treated withzoledronic acid. (A) Isosurface volume renderings of the zoledronic acid treatmentgroup at weeks 1 (tan), 2 (yellow), 3 (red), and 4 (blue), after intratibial sham PBSinjection. (B) Isosurface volume renderings of the zoledronic acid treatment group atweeks 1, 2, 3, and 4 after intratibial inoculation of MDA-MB-231 cells. In addition, aregistered rendering is shown for both the control (A, large panel) and tumor-bearing(B, large panel) limbs at weeks 1, 2, 3, and 4. All rendering thresholds were set to1000 HU. (C) Bone volumewas determined for eachmouse at each time point (weeks 1,2, 3, and 4) in both the control and tumor-bearing limbs, as well as (D) the mean groupvolume and standard deviation over time for both the tumor-bearing and control limbof the zoledronic acid and control groups.
147L.C. Johnson et al. / Bone 48 (2011) 141–151
zero (pb0.0001), while the slope of the treated control limb wasfound to be significantly greater (pb0.0001). The statistical differ-ences between the slopes of groups were determined. The treated anduntreated lesion limb slopes were significantly different (pb0.0001),along with the untreated lesion limb and untreated control limb(pb0.0001). There was no statistical difference between the slopes ofthe treated and untreated control limb slopes (p=0.0132) orbetween the treated lesion limb and treated control limb slopes(p=0.0443). Also, for the untreated group, it was determined thatweek 3 andweek 4 volumes had significantmean differences betweenthe lesion and control limbs, with p=0.0031 and pb0.0001,respectively.
Results
Longitudinal μCT does not alter tumor growth
To determine if μCT protocols could be developed that would allowfor longitudinal CT analyses of bone, we inoculated athymic nudemice with the osteolytic breast cancer cell line MDA-MB-231. Wechose to use an intratibial model for this study, since there is lessvariability in this model than the intracardiac model, which allowedus tomore easily validate the technology. After tumor cell inoculation,we utilized two different imaging protocols, both with similarradiation doses to those previously reported [9,10], but at differentresolutions. Animals were either imaged three times (weeks 2, 3, andat sacrifice), twice (week 3 and at sacrifice), or once (only at sacrifice).
We found by fluorescence imaging of the GFP tumor cells (Maestro)that while there was a slight reduction in the relative fluorescent units(RFUs), there were no significant changes in the overall RFUs betweenthe groups (Figs. 1A and B), suggesting no effect on the tumor cellgrowth. This observation was verified by histology, which showed nochanges in tumor volume (Figs. 1C and D).
Longitudinal μCT illustrates bone loss over time
Weekly μCTs acquired during the course of the experiment wereregistered and over-laid into a single image so that we could visuallysee the loss in bone over time in tumor-bearing mice versus controls(Figs. 2A and E). Individual scans were rendered at each week and canbe visualized in Figs. 2B–D and F–H. The representative imageillustrates the loss in bone during the 3 weeks of image analysis,clearly showing a gradual loss of bone over time. Importantly, wewere able to generate high-resolution images and data such as thesefor each mouse. In addition, we quantified the changes in percent ofbone volume/tissue volume (BV/TV) histologically to validate the μCTdata (Fig. 2I). By histology, we found that there were clear differencesbetween the tumor leg and the control leg.
In vivo μCT renders quantifiable longitudinal images of tumor-inducedbone destruction
These data illustrate that longitudinal μCT is a valid option forimaging tumor-induced bone disease over time, which we previouslythought was not possible in animal models. However, the most usefulapplication for this imaging tool is in drug treatment models in whichinvestigators need to detect lesions at early stages to determine thebest time points for drug treatment. Therefore, we wanted to findmethods to quantify the in vivo μCT data similar to quantification usedin the ex vivo μCT system and histology. To do this, we treated micewith zoledronic acid 1 week after tumor cell inoculation, when smallosteolytic lesions were visible. We chose this model since it is wellestablished to reduce bone destruction in animal models and humanpatients [11] and would therefore provide clear differences in bonevolume for quantification.
Initially, we examined the nontreated groups in this study andcompared the control versus the tumor leg. Similar to the previousstudy, we cropped and then registered the weekly acquired images(Figs. 3A and B). We drew ROIs covering regions of empty space, bed(plastic), and bone and generated a calibration curve, which was usedto convert each image's intensity values to HU. Using this approach,we found that we could accurately measure the volume of bonedestruction over time. These results are displayed per mouse inFig. 3C. In addition, the quantification results were able to statisticallydistinguish at a group level between the control limb and the lesionlimb groups (pb0.0001).
In vivo μCT can be utilized to track changes in a drug treatment model
As described above, we treatedmice with zoledronic acid starting atweek 1 (when lesions were detectable) and imaged the mice weekly.With this approach, we found that we could determine bone volumesfor the treatment and control limbs in all mice, as well as quantifychanges between the treated versus untreated groups by in vivo μCT(Figs. 4A–D). Figs. 4A and B demonstrate the ability to register weeklyscans at end point and determine average bone volume for treatmentgroups, as graphedpermouse andbygroups in Figs. 4C andD. Therewasno statistical significance (p=0.0443) between themean bone volumeof zoledronic acid-treated tumor and nontumor limbs, but there was asignificant difference between the treated and untreated lesion limbs(pb0.0001). Interestingly, with this approach, we could also see astatistical increase in themeanbonevolumeof thenontumor limbwhentreated with zoledronic acid (pb0.0001).
148 L.C. Johnson et al. / Bone 48 (2011) 141–151
Conventional imaging methods demonstrate comparable bone volume toin vivo μCT
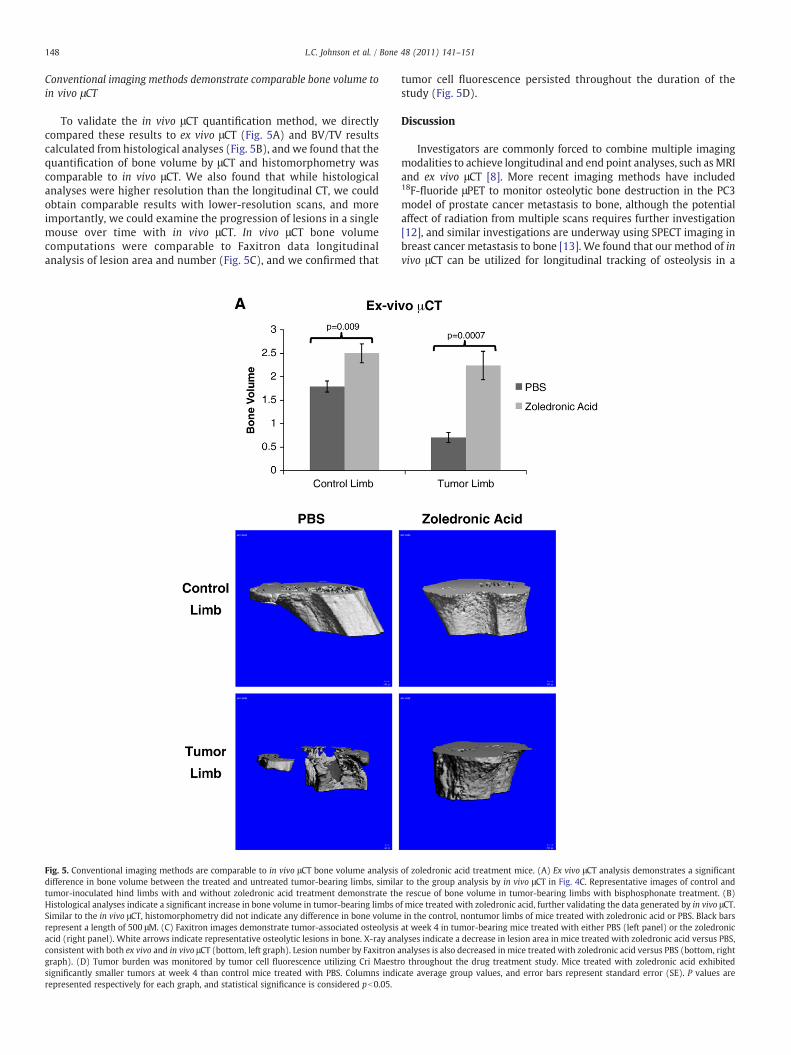
To validate the in vivo μCT quantification method, we directlycompared these results to ex vivo μCT (Fig. 5A) and BV/TV resultscalculated from histological analyses (Fig. 5B), and we found that thequantification of bone volume by μCT and histomorphometry wascomparable to in vivo μCT. We also found that while histologicalanalyses were higher resolution than the longitudinal CT, we couldobtain comparable results with lower-resolution scans, and moreimportantly, we could examine the progression of lesions in a singlemouse over time with in vivo μCT. In vivo μCT bone volumecomputations were comparable to Faxitron data longitudinalanalysis of lesion area and number (Fig. 5C), and we confirmed that
Fig. 5. Conventional imaging methods are comparable to in vivo μCT bone volume analysisdifference in bone volume between the treated and untreated tumor-bearing limbs, similatumor-inoculated hind limbs with and without zoledronic acid treatment demonstrate thHistological analyses indicate a significant increase in bone volume in tumor-bearing limbs oSimilar to the in vivo μCT, histomorphometry did not indicate any difference in bone volumerepresent a length of 500 μM. (C) Faxitron images demonstrate tumor-associated osteolysisacid (right panel). White arrows indicate representative osteolytic lesions in bone. X-ray anaconsistent with both ex vivo and in vivo μCT (bottom, left graph). Lesion number by Faxitron agraph). (D) Tumor burden was monitored by tumor cell fluorescence utilizing Cri Maestrsignificantly smaller tumors at week 4 than control mice treated with PBS. Columns indirepresented respectively for each graph, and statistical significance is considered pb0.05.
tumor cell fluorescence persisted throughout the duration of thestudy (Fig. 5D).
Discussion
Investigators are commonly forced to combine multiple imagingmodalities to achieve longitudinal and end point analyses, such asMRIand ex vivo μCT [8]. More recent imaging methods have included18F-fluoride μPET to monitor osteolytic bone destruction in the PC3model of prostate cancer metastasis to bone, although the potentialaffect of radiation from multiple scans requires further investigation[12], and similar investigations are underway using SPECT imaging inbreast cancer metastasis to bone [13]. We found that our method of invivo μCT can be utilized for longitudinal tracking of osteolysis in a
of zoledronic acid treatment mice. (A) Ex vivo μCT analysis demonstrates a significantr to the group analysis by in vivo μCT in Fig. 4C. Representative images of control ande rescue of bone volume in tumor-bearing limbs with bisphosphonate treatment. (B)f mice treated with zoledronic acid, further validating the data generated by in vivo μCT.in the control, nontumor limbs of mice treated with zoledronic acid or PBS. Black barsat week 4 in tumor-bearing mice treated with either PBS (left panel) or the zoledroniclyses indicate a decrease in lesion area in mice treated with zoledronic acid versus PBS,nalyses is also decreased in mice treated with zoledronic acid versus PBS (bottom, righto throughout the drug treatment study. Mice treated with zoledronic acid exhibitedcate average group values, and error bars represent standard error (SE). P values are
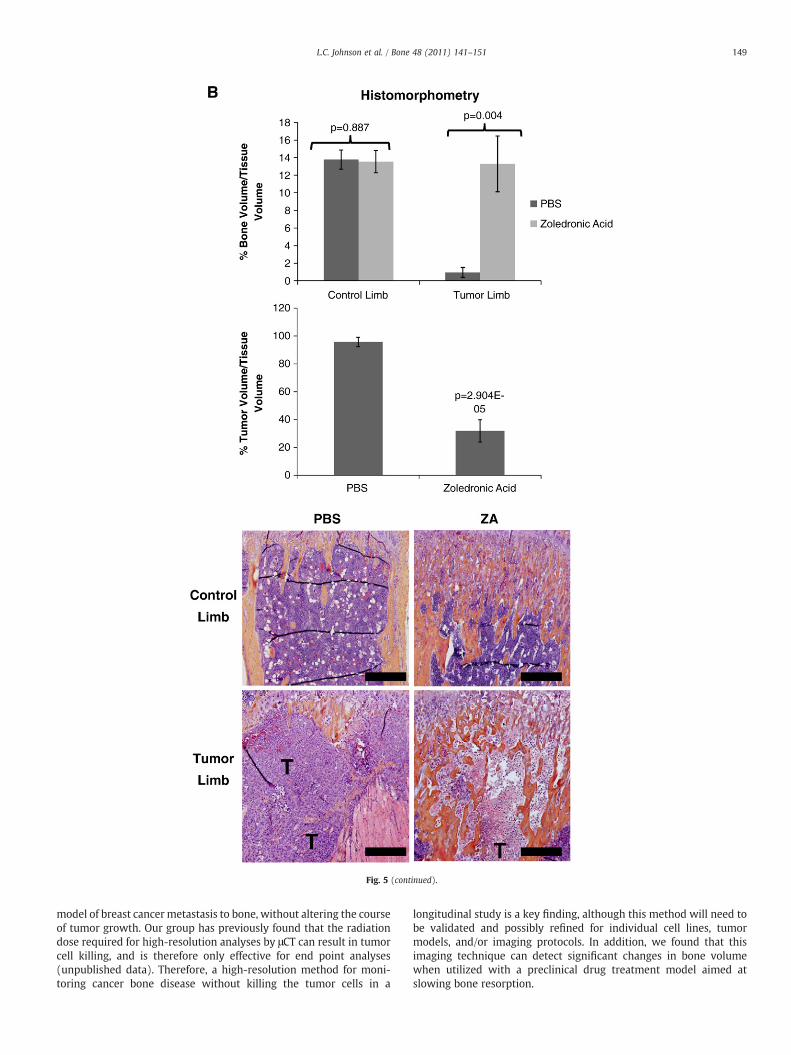
Fig. 5 (continued).
149L.C. Johnson et al. / Bone 48 (2011) 141–151
model of breast cancer metastasis to bone, without altering the courseof tumor growth. Our group has previously found that the radiationdose required for high-resolution analyses by μCT can result in tumorcell killing, and is therefore only effective for end point analyses(unpublished data). Therefore, a high-resolution method for moni-toring cancer bone disease without killing the tumor cells in a
longitudinal study is a key finding, although this method will need tobe validated and possibly refined for individual cell lines, tumormodels, and/or imaging protocols. In addition, we found that thisimaging technique can detect significant changes in bone volumewhen utilized with a preclinical drug treatment model aimed atslowing bone resorption.
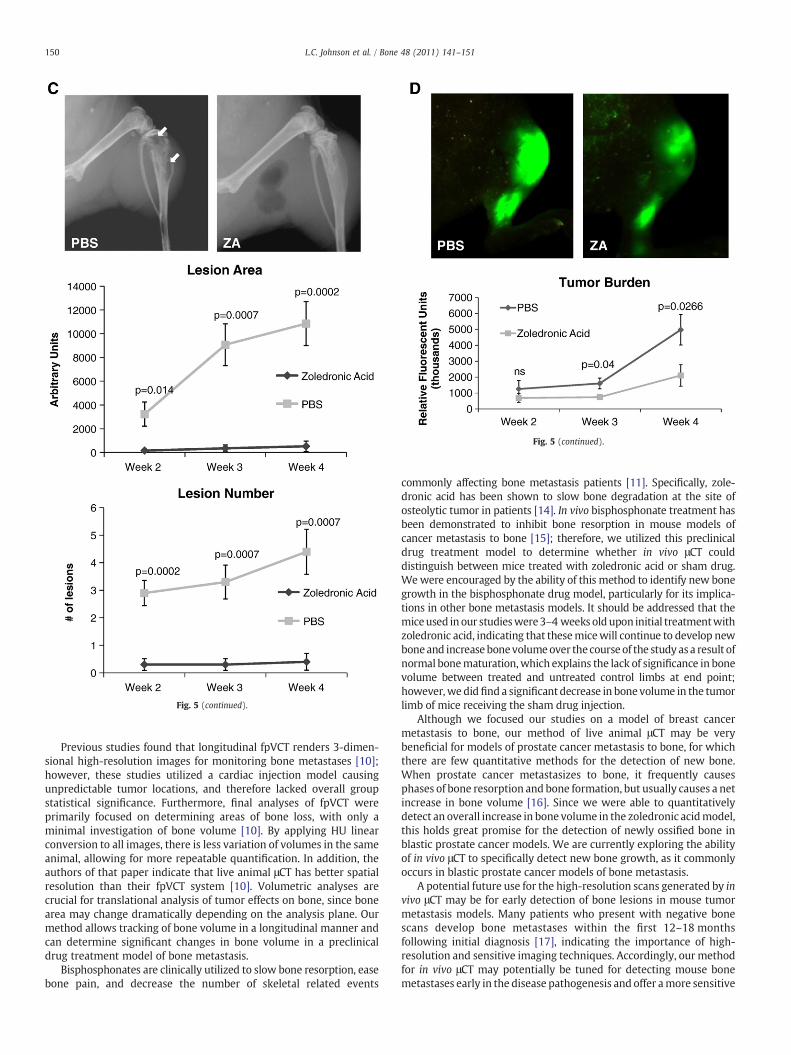
Fig. 5 (continued).
Fig. 5 (continued).
150 L.C. Johnson et al. / Bone 48 (2011) 141–151
Previous studies found that longitudinal fpVCT renders 3-dimen-sional high-resolution images for monitoring bone metastases [10];however, these studies utilized a cardiac injection model causingunpredictable tumor locations, and therefore lacked overall groupstatistical significance. Furthermore, final analyses of fpVCT wereprimarily focused on determining areas of bone loss, with only aminimal investigation of bone volume [10]. By applying HU linearconversion to all images, there is less variation of volumes in the sameanimal, allowing for more repeatable quantification. In addition, theauthors of that paper indicate that live animal μCT has better spatialresolution than their fpVCT system [10]. Volumetric analyses arecrucial for translational analysis of tumor effects on bone, since bonearea may change dramatically depending on the analysis plane. Ourmethod allows tracking of bone volume in a longitudinal manner andcan determine significant changes in bone volume in a preclinicaldrug treatment model of bone metastasis.
Bisphosphonates are clinically utilized to slow bone resorption, easebone pain, and decrease the number of skeletal related events
commonly affecting bone metastasis patients [11]. Specifically, zole-dronic acid has been shown to slow bone degradation at the site ofosteolytic tumor in patients [14]. In vivo bisphosphonate treatment hasbeen demonstrated to inhibit bone resorption in mouse models ofcancer metastasis to bone [15]; therefore, we utilized this preclinicaldrug treatment model to determine whether in vivo μCT coulddistinguish between mice treated with zoledronic acid or sham drug.Wewere encouraged by the ability of this method to identify new bonegrowth in the bisphosphonate drug model, particularly for its implica-tions in other bone metastasis models. It should be addressed that themiceused in our studieswere3–4 weeks oldupon initial treatmentwithzoledronic acid, indicating that thesemicewill continue to develop newboneand increase bonevolumeover the course of the study asa result ofnormal bonematuration,which explains the lack of significance in bonevolume between treated and untreated control limbs at end point;however,we didfind a significant decrease in bone volume in the tumorlimb of mice receiving the sham drug injection.
Although we focused our studies on a model of breast cancermetastasis to bone, our method of live animal μCT may be verybeneficial for models of prostate cancer metastasis to bone, for whichthere are few quantitative methods for the detection of new bone.When prostate cancer metastasizes to bone, it frequently causesphases of bone resorption and bone formation, but usually causes a netincrease in bone volume [16]. Since we were able to quantitativelydetect an overall increase in bone volume in the zoledronic acidmodel,this holds great promise for the detection of newly ossified bone inblastic prostate cancer models. We are currently exploring the abilityof in vivo μCT to specifically detect new bone growth, as it commonlyoccurs in blastic prostate cancer models of bone metastasis.
A potential future use for the high-resolution scans generated by invivo μCT may be for early detection of bone lesions in mouse tumormetastasis models. Many patients who present with negative bonescans develop bone metastases within the first 12–18 monthsfollowing initial diagnosis [17], indicating the importance of high-resolution and sensitive imaging techniques. Accordingly, our methodfor in vivo μCT may potentially be tuned for detecting mouse bonemetastases early in the disease pathogenesis and offer amore sensitive
151L.C. Johnson et al. / Bone 48 (2011) 141–151
mechanism of detecting tumor-associated bone destruction thanradiography. This is supported by the ability of our live animal μCTsystem to visually detect bone lesions at week 1 following tumor cellinoculation and statistically differentiate lesions at week 3 moreeffectively than radiography.
In a model of breast cancer metastasis to bone, we found that invivo μCT is a useful method for quantifying 3-dimensional longitudinalosteolysis without killing tumor cells and is comparable to conven-tional methods of bone analysis such as ex vivo μCT, Faxitron analysis,and histomorphometry. In addition, we found that this method of invivo μCT is reproducible and can detect significant changes in bonevolume in a preclinical drug treatment model, suggesting its potentialutility in blastic models of prostate cancer metastasis to bone. Takentogether, these data indicate that in vivo μCT is an effective andreproducible method for longitudinal monitoring of tumor-associatedbone destruction in mouse models of tumor-induced bone disease.
Acknowledgments
The authors wish to thank Ms. Alyssa Merkel for her technicalexpertise, Mr. Josh Johnson for histological processing and sectioning,and the following NIH funding sources: PO1CA040035 (GRM),U54CA126595 (GRM), and 5T32CA009592-23 (LMM).
References
[1] Coleman RE. Metastatic bone disease: clinical features, pathophysiology andtreatment strategies. Cancer Treat Rev 2001;27(3):165–76.
[2] Yoneda T, Michigami T, Yi B, Williams PJ, Niewolna M, Hiraga T. Use ofbisphosphonates for the treatment of bone metastasis in experimental animalmodels. Cancer Treat Rev 1999;25(5):293–9.
[3] Yin JJ, Selander K, Chirgwin JM, Dallas M, Grubbs BG, Wieser R, et al. TGF-βsignaling blockade inhibits PTHrP secretion by breast cancer cells and bonemetastases development. J Clin Invest 1999;103:197–206.
[4] Gallwitz WE, Guise TA, Mundy GR. Guanosine nucleotides inhibit differentsyndromes of PTHrP excess caused by human cancers in vivo. J Clin Invest2002;110:1559–72.
[5] Fisher JL, Schmitt JF, Howard ML, Mackie PS, Choong PF, Risbridger GP. An in vivomodel of prostate carcinoma growth and invasion in bone. Cell Tissue Res2002;307(3):337–45.
[6] Rosol TJ, Tannehill-Gregg SH, LeRoy BE, Mandl S, Contag CH. Animal models ofbone metastasis. Cancer 2003;97(Suppl 3):748–57.
[7] Rajarubendra N, Bolton D, Lawrentschuk N. Diagnosis of bone metastases inurological malignancies—an update. Urology Mar 24 2010 Electronic publicationahead of print.
[8] Bussard KM, Mastro AM. Ex-vivo analysis of the bone microenvironment in bonemetastatic breast cancer. J Mammary Gland Biol Neoplasia 2009;14(4):387–95.
[9] Cowey S, Szafran AA, Kappes J, Zinn KR, Siegal GP, Desmond RA, et al. Breast cancermetastasis to bone: evaluation of bioluminescent imaging and microSPECT/CT fordetecting bone metastasis in immunodeficient mice. Clin Exp Metastasis 2007;24:389–401.
[10] Missbach-Guentner J, Dullin C, Zientkowska M, Domeyer-MissbachM, Kimmina S,Obenauery S, et al. Flat-panel detector-based volume computed tomography: anovel 3D imaging technique to monitor osteolytic bone lesions in a mouse tumormetastasis model. Neoplasia 2007;9(9):755–65.
[11] Costa L, Major PP. Effect of bisphosphonates on pain and quality of life in patientswith bone metastases. Nat Clin Pract Oncol 2009;6(3):163–74.
[12] Virk MS, Petrigliano FA, Liu NQ, Chatziioannou AF, Stout D, Kang CO, et al.Influence of simultaneous targeting of the bone morphogenetic protein pathwayand RANK/RANKL axis in osteolytic prostate cancer lesion in bone. Bone Jan2009;44(1):160–7.
[13] Ben-Haim S, Israel O. Breast cancer: role of SPECT and PET in imaging bonemetastases. Semin Nucl Med Nov 2009;39(6):408–15.
[14] Polascik TJ. Bisphosphonates in oncology: evidence for the prevention of skeletalevents in patients with bone metastases. Drug Des Dev Ther 2009;3:27–40.
[15] Labrinidis A, Hay S, Liapis V, Ponomarev V, Findlay DM, Evdokiou A. Zoledronicacid inhibits both the osteolytic and osteoblastic components of osteosarcomalesions in a mouse model. Clin Cancer Res 2009;15(10):3451–61.
[16] Guise TA, Mundy GR. Cancer and bone. Endocr Rev 1998;19(1):18–54.[17] McNeil BJ. Rationale for the use of bone scans in selected metastatic and primary
bone tumors. Semin Nucl Med 1978;8(4):336–45.