Hot flashes in postmenopausal women treated for breast carcinoma
Bone 48 (2011) 611–621
Contents lists available at ScienceDirect
Bone
j ourna l homepage: www.e lsev ie r.com/ locate /bone
Longitudinal evaluation of the effects of alendronate on MRI bone microarchitecturein postmenopausal osteopenic women
Jenny Folkesson a,⁎, Janet Goldenstein a, Julio Carballido-Gamio a, Galateia Kazakia a, Andrew J. Burghardt a,Ana Rodriguez a, Roland Krug a, Anne E. de Papp b, Thomas M. Link a, Sharmila Majumdar a
a Musculoskeletal Quantitative Imaging Research Group (MQIR), Department of Radiology and Biomedical Imaging, University of California, San Francisco, CA, USAb Merck & Co., Whitehouse Station, NJ, USA
⁎ Corresponding author.E-mail address: [email protected] (J. Folkess
8756-3282/$ – see front matter. Published by Elsevierdoi:10.1016/j.bone.2010.10.179
a b s t r a c t
a r t i c l e i n f oArticle history:Received 22 May 2010Revised 28 October 2010Accepted 28 October 2010Available online 5 November 2010
Edited by: Harry Genant
Keywords:Magnetic resonance imagingBone microarchitectureAlendronateOsteoporosisFuzzy clusteringDXAHR-pQCT
We evaluated longitudinal effects of alendronate on MRI-based trabecular bone structure parameters derivedfrom dual thresholding and fuzzy clustering (BE-FCM) trabecular bone segmentation. Treatment effects wereobserved in the distal tibia after 24 months. The BE-FCM method increased correlations to HR-pQCT-basedparameters.Introduction: High-resolution magnetic resonance imaging (MRI) allows for non-invasive bone microarchi-tecture analysis. The goal of this study was to examine the potential of MRI-based trabecular bone structureparameters to monitor effects of alendronate in humans in vivo, and to compare the results to HR-pQCT andDXA measurements.Materials and methods: Postmenopausal osteopenic women were divided into alendronate treatment andcontrol groups, and imaged at baseline, 12 months, and 24 months (n=52 at baseline) using 3 T MRI, HR-pQCT, and DXA. Image acquisition sites included distal tibia (MRI and HR-pQCT), distal radius (MRI, DXA, andHR-pQCT), and the proximal femur (MRI and DXA). Two different regions of interest were evaluated. Onecontained the trabecular bone region within the entire MRI acquisition, and the second contained a subregionmatched to the region contained in the HR-pQCT acquisition. The trabecular bone was segmented using twodifferent methods; dual thresholding and BE-FCM. Trabecular bone structure parameters included bonevolume fraction (BV/TV), number (Tb.N), spacing (Tb.Sp), and thickness (Tb.Th), along with seven geodesictopological analysis (GTA) parameters. Longitudinal changes and correlations to HR-pQCT and DXAmeasurements were evaluated.Results: Apparent Tb.N and four GTA parameters showed treatment effects (pb0.05) in the distal tibia after24 months in the entire MRI region using BE-FCM, as well as Tb.N using dual thresholding. No treatmenteffects after 24 months were observed in the HR-pQCT or in MRI analysis for the HR-pQCT-matched regions.Apparent BV/TV and Tb.N from BE-FCM had significantly higher correlations to HR-pQCT values compared tothose derived from thresholding.Conclusions: This study demonstrates the influence of computational methods and region of interestdefinitions on measurements of trabecular bone structure, and the feasibility of MRI-based quantification oflongitudinal changes in bone microarchitecture due to bisphosphonate therapy. The results suggest thatthere may be a need to reevaluate the current standard HR-pQCT region definition for increased treatmentsensitivity.
on).
Inc.
Published by Elsevier Inc.
Introduction
Osteoporosis is a skeletal disease characterized by low bone massand deteriorated bone microarchitecture. It is associated withincreased susceptibility to fracture and decreased bone strength [1].Bisphosphonates are widely used in osteoporosis treatment due totheir antiresorptive effects on bone. Alendronate is an extensively
studied bisphosphonate which has been shown to increase bonemineral density (BMD) longitudinally [2–4], and to reduce fractureincidence [5]. While a vast majority of such studies measured BMDusing dual-energy x-ray absorptiometry (DXA), there have beenstudies evaluating longitudinal effects of alendronate on postmeno-pausal osteoporosis using computed tomography [5], and highresolution peripheral quantitative computed tomography (HR-pQCT)[6,7].
In magnetic resonance imaging (MRI) of trabecular bone [8], bonemarrow yields high signal intensity. Trabeculae are found adjacent tothe marrow at locations with a lower signal intensity (Fig. 3). The
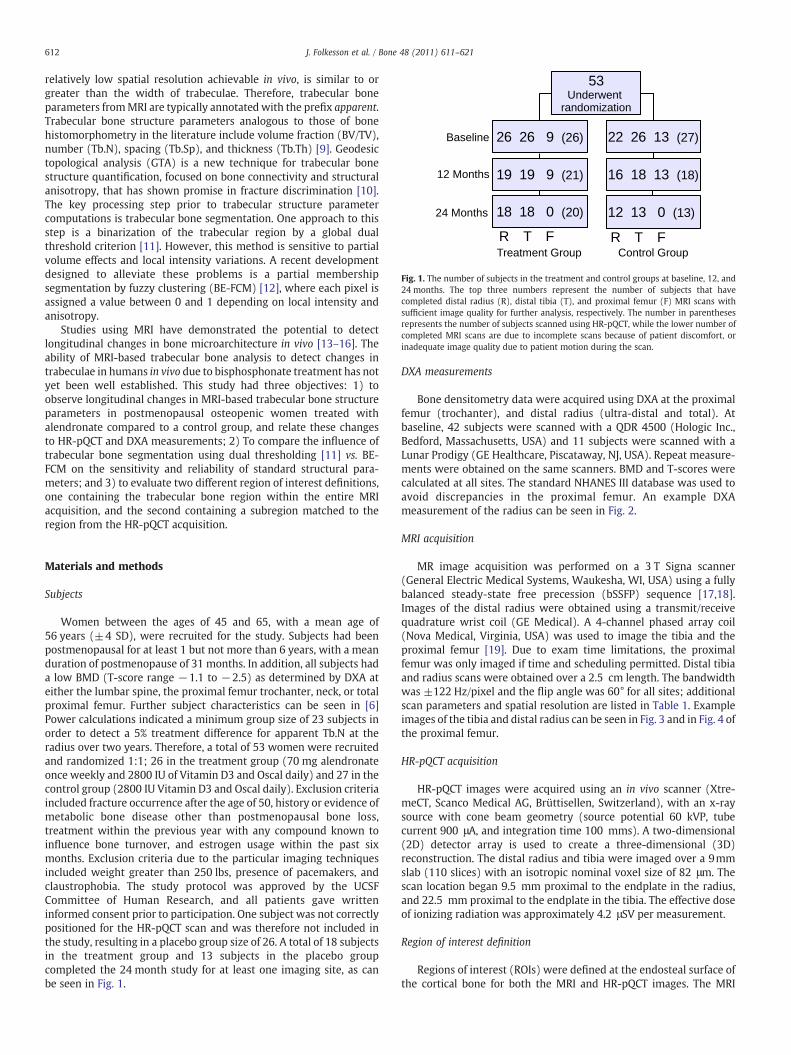
Fig. 1. The number of subjects in the treatment and control groups at baseline, 12, and24 months. The top three numbers represent the number of subjects that havecompleted distal radius (R), distal tibia (T), and proximal femur (F) MRI scans withsufficient image quality for further analysis, respectively. The number in parenthesesrepresents the number of subjects scanned using HR-pQCT, while the lower number ofcompleted MRI scans are due to incomplete scans because of patient discomfort, orinadequate image quality due to patient motion during the scan.
612 J. Folkesson et al. / Bone 48 (2011) 611–621
relatively low spatial resolution achievable in vivo, is similar to orgreater than the width of trabeculae. Therefore, trabecular boneparameters fromMRI are typically annotated with the prefix apparent.Trabecular bone structure parameters analogous to those of bonehistomorphometry in the literature include volume fraction (BV/TV),number (Tb.N), spacing (Tb.Sp), and thickness (Tb.Th) [9]. Geodesictopological analysis (GTA) is a new technique for trabecular bonestructure quantification, focused on bone connectivity and structuralanisotropy, that has shown promise in fracture discrimination [10].The key processing step prior to trabecular structure parametercomputations is trabecular bone segmentation. One approach to thisstep is a binarization of the trabecular region by a global dualthreshold criterion [11]. However, this method is sensitive to partialvolume effects and local intensity variations. A recent developmentdesigned to alleviate these problems is a partial membershipsegmentation by fuzzy clustering (BE-FCM) [12], where each pixel isassigned a value between 0 and 1 depending on local intensity andanisotropy.
Studies using MRI have demonstrated the potential to detectlongitudinal changes in bone microarchitecture in vivo [13–16]. Theability of MRI-based trabecular bone analysis to detect changes intrabeculae in humans in vivo due to bisphosphonate treatment has notyet been well established. This study had three objectives: 1) toobserve longitudinal changes in MRI-based trabecular bone structureparameters in postmenopausal osteopenic women treated withalendronate compared to a control group, and relate these changesto HR-pQCT and DXA measurements; 2) To compare the influence oftrabecular bone segmentation using dual thresholding [11] vs. BE-FCM on the sensitivity and reliability of standard structural para-meters; and 3) to evaluate two different region of interest definitions,one containing the trabecular bone region within the entire MRIacquisition, and the second containing a subregion matched to theregion from the HR-pQCT acquisition.
Materials and methods
Subjects
Women between the ages of 45 and 65, with a mean age of56 years (±4 SD), were recruited for the study. Subjects had beenpostmenopausal for at least 1 but not more than 6 years, with a meanduration of postmenopause of 31 months. In addition, all subjects hada low BMD (T-score range −1.1 to −2.5) as determined by DXA ateither the lumbar spine, the proximal femur trochanter, neck, or totalproximal femur. Further subject characteristics can be seen in [6]Power calculations indicated a minimum group size of 23 subjects inorder to detect a 5% treatment difference for apparent Tb.N at theradius over two years. Therefore, a total of 53 women were recruitedand randomized 1:1; 26 in the treatment group (70 mg alendronateonce weekly and 2800 IU of Vitamin D3 and Oscal daily) and 27 in thecontrol group (2800 IU Vitamin D3 and Oscal daily). Exclusion criteriaincluded fracture occurrence after the age of 50, history or evidence ofmetabolic bone disease other than postmenopausal bone loss,treatment within the previous year with any compound known toinfluence bone turnover, and estrogen usage within the past sixmonths. Exclusion criteria due to the particular imaging techniquesincluded weight greater than 250 lbs, presence of pacemakers, andclaustrophobia. The study protocol was approved by the UCSFCommittee of Human Research, and all patients gave writteninformed consent prior to participation. One subject was not correctlypositioned for the HR-pQCT scan and was therefore not included inthe study, resulting in a placebo group size of 26. A total of 18 subjectsin the treatment group and 13 subjects in the placebo groupcompleted the 24 month study for at least one imaging site, as canbe seen in Fig. 1.
DXA measurements
Bone densitometry data were acquired using DXA at the proximalfemur (trochanter), and distal radius (ultra-distal and total). Atbaseline, 42 subjects were scanned with a QDR 4500 (Hologic Inc.,Bedford, Massachusetts, USA) and 11 subjects were scanned with aLunar Prodigy (GE Healthcare, Piscataway, NJ, USA). Repeat measure-ments were obtained on the same scanners. BMD and T-scores werecalculated at all sites. The standard NHANES III database was used toavoid discrepancies in the proximal femur. An example DXAmeasurement of the radius can be seen in Fig. 2.
MRI acquisition
MR image acquisition was performed on a 3 T Signa scanner(General Electric Medical Systems, Waukesha, WI, USA) using a fullybalanced steady-state free precession (bSSFP) sequence [17,18].Images of the distal radius were obtained using a transmit/receivequadrature wrist coil (GE Medical). A 4-channel phased array coil(Nova Medical, Virginia, USA) was used to image the tibia and theproximal femur [19]. Due to exam time limitations, the proximalfemur was only imaged if time and scheduling permitted. Distal tibiaand radius scans were obtained over a 2.5 cm length. The bandwidthwas ±122 Hz/pixel and the flip angle was 60° for all sites; additionalscan parameters and spatial resolution are listed in Table 1. Exampleimages of the tibia and distal radius can be seen in Fig. 3 and in Fig. 4 ofthe proximal femur.
HR-pQCT acquisition
HR-pQCT images were acquired using an in vivo scanner (Xtre-meCT, Scanco Medical AG, Brüttisellen, Switzerland), with an x-raysource with cone beam geometry (source potential 60 kVP, tubecurrent 900 μA, and integration time 100 mms). A two-dimensional(2D) detector array is used to create a three-dimensional (3D)reconstruction. The distal radius and tibia were imaged over a 9mmslab (110 slices) with an isotropic nominal voxel size of 82 μm. Thescan location began 9.5 mm proximal to the endplate in the radius,and 22.5 mm proximal to the endplate in the tibia. The effective doseof ionizing radiation was approximately 4.2 μSV per measurement.
Region of interest definition
Regions of interest (ROIs) were defined at the endosteal surface ofthe cortical bone for both the MRI and HR-pQCT images. The MRI

Fig. 2. To the left: an example DXA image of the radius with ultra-distal (UD) and total (largest rectangle) regions marked. To the right: the MRI view of the same radius with the MRIscan ROI (red) and the HR-pQCT-matched ROI (blue).
613J. Folkesson et al. / Bone 48 (2011) 611–621
scans of the distal tibia and radius were analyzed using two differentROI definitions. One ROI contained the trabecular bone region withinthe entire MRI acquisition. For a better comparison betweenmodalities the second ROI contained the trabecular bone regionwithin theMRI acquisitionwhichmatched the region contained in theHR-pQCT acquisition (see Fig. 2).
To determine the common region analyzed in the HR-pQCT imageswithin the three time points, a standard evaluation protocol providedby the HR-pQCTmanufacturer was applied. This evaluation protocol isbased on a 2D cross sectional area matching method. After a commonregion for the HR-pQCT images between time points was determined,the common region between the HR-pQCT images and the MR imageswas found using a 3D rigid registration technique [20]. At each timepoint HR-pQCT images were registered to corresponding MR imagesusing a registration software package (Rview) based on a normalizedmutual information measure [21]. The result of the 3D rigidregistration, three Euler angles and a translation vector, was thenapplied to the HR-pQCT ROI to determine the proximal and distalslices off the MR analysis region for comparison to HR-pQCT results.This technique avoided errors associated with the interpolation of theoriginal images while ensuring that the analysis regions for all threetime points in both the HR-pQCT and MR images contained the samestart and end anatomical locations.
MRI analysis
Trabecular bone segmentationROIs were manually outlined within the bone cortex in the slices
defined as described in the Region of interest definition section for thetibia and distal radius. In the proximal femur, an ROI was manuallyoutlined in the tenmost central slices of the scans including trabecularbone contained between the epiphyseal line and the cortex of thegreater trochanter. The trabecular bone within the defined ROIs wassegmented using two different methods: binarization by a global dualthreshold criterion [11], and partial membership segmentation bybone enhancement fuzzy C-means clustering (BE-FCM) [12]. The dualthresholding method requires a user to define regions consisting of
Table 1Scan parameters and spatial resolution for the MRI acquisitions of the distal radius,distal tibia, and proximal femur.
TR/TE (ms) Scan time (min) Resolution (μm3)
Radius 14.4–15.2/3.3–3.9 10 156×156×500Tibia 16.8–17.8/6.5 15 156×156×500Femur 11.7/4.6 10 234×234×1000
cortical bone. A threshold is then determined to binarize the imagebased on cortical bone intensity and marrow intensity (defined asintensity histogram peak position plus half peak width) [22]. BE-FCMproduces a partial membership segmentation fully automatically, inwhich, based on the local intensity and anisotropy, each voxel isassigned a value between 0 and 1 depending on the amount of bone itis estimated to contain. Examples of a binarization and a partialmembership segmentation can be seen in Fig. 4.
Structural parametersApparent trabecular bone volume fraction (BV/TV) was calculated
by voxel counting. Apparent trabecular number (Tb.N) was deter-mined using standard two-dimensional (2D) histomorphometricmethods, specifically the mean intercept length (MIL) techniquebased on the plate model [9]. Apparent trabecular thickness (Tb.Th)and spacing (Tb.Sp) were derived from these primary measures usingplate model assumptions. These are referred to as standard structureparameters.
In addition, trabecular bone parameters obtained from geodesictopological analysis (GTA) were computed on binary trabecular boneimages [10]. The BE-FCM trabecular bone segmentations werebinarized by assigning all pixels with a bone membership N0.5 totrabecular bone, since this signifies that a majority of the pixel areawas occupied by bone signal. The junctions of the binary images werefound using skeletonization, and bone pixels were each assigned totheir nearest junction in terms of geodesic distance. The GTAparameters use trabecular junctions to quantify scale, topology, andanisotropy, as specified below.
• Volume of junction (Tb.VJ) corresponds to the bone volume ajunction is supporting.
• Convex hull of junction (Tb.CHJ) corresponds to the spaceencompassed by a junction and its set of bone voxels.
• Junction spacing (Tb.JSp) is related to the minimum geodesicdistance between junctions.
• Distance to junction (Tb.DJ) is the maximum geodesic distancebetween a junction and its bone voxels.
• Junction eccentricity (Tb.JE) measures the eccentricity of the bonevoxels belonging to a junction.
• Junction orientation (Tb.JO) measures the anisotropy of the bonevoxels belonging to a junction.
• Interjunction orientation (Tb.IJO) is a global measure of anisotropyof the closest connected junctions.
Compared to the standard trabecular bone structure parameters,GTA is focused on the bone connectivity and structural anisotropy.
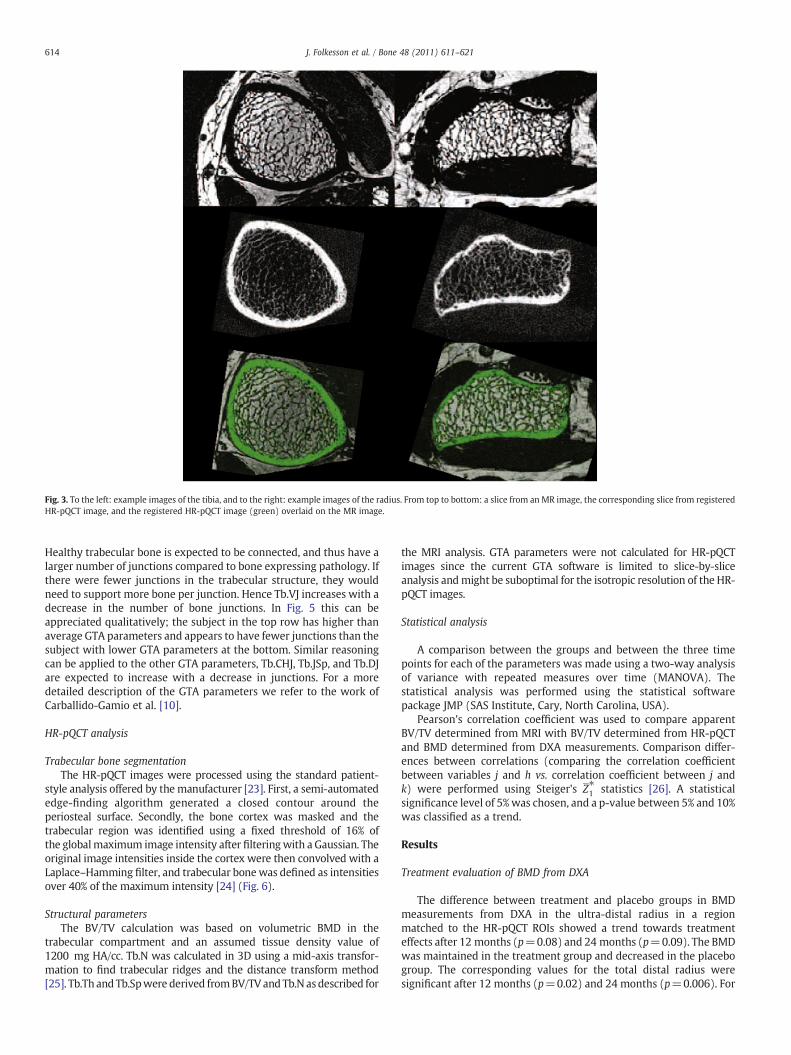
Fig. 3. To the left: example images of the tibia, and to the right: example images of the radius. From top to bottom: a slice from an MR image, the corresponding slice from registeredHR-pQCT image, and the registered HR-pQCT image (green) overlaid on the MR image.
614 J. Folkesson et al. / Bone 48 (2011) 611–621
Healthy trabecular bone is expected to be connected, and thus have alarger number of junctions compared to bone expressing pathology. Ifthere were fewer junctions in the trabecular structure, they wouldneed to support more bone per junction. Hence Tb.VJ increases with adecrease in the number of bone junctions. In Fig. 5 this can beappreciated qualitatively; the subject in the top row has higher thanaverage GTA parameters and appears to have fewer junctions than thesubject with lower GTA parameters at the bottom. Similar reasoningcan be applied to the other GTA parameters, Tb.CHJ, Tb.JSp, and Tb.DJare expected to increase with a decrease in junctions. For a moredetailed description of the GTA parameters we refer to the work ofCarballido-Gamio et al. [10].
HR-pQCT analysis
Trabecular bone segmentationThe HR-pQCT images were processed using the standard patient-
style analysis offered by the manufacturer [23]. First, a semi-automatededge-finding algorithm generated a closed contour around theperiosteal surface. Secondly, the bone cortex was masked and thetrabecular region was identified using a fixed threshold of 16% ofthe globalmaximum image intensity after filteringwith a Gaussian. Theoriginal image intensities inside the cortex were then convolved with aLaplace–Hamming filter, and trabecular bonewas defined as intensitiesover 40% of the maximum intensity [24] (Fig. 6).
Structural parametersThe BV/TV calculation was based on volumetric BMD in the
trabecular compartment and an assumed tissue density value of1200 mg HA/cc. Tb.N was calculated in 3D using a mid-axis transfor-mation to find trabecular ridges and the distance transform method[25]. Tb.Th and Tb.Spwere derived fromBV/TV and Tb.N as described for
the MRI analysis. GTA parameters were not calculated for HR-pQCTimages since the current GTA software is limited to slice-by-sliceanalysis andmight be suboptimal for the isotropic resolution of the HR-pQCT images.
Statistical analysis
A comparison between the groups and between the three timepoints for each of the parameters was made using a two-way analysisof variance with repeated measures over time (MANOVA). Thestatistical analysis was performed using the statistical softwarepackage JMP (SAS Institute, Cary, North Carolina, USA).
Pearson's correlation coefficient was used to compare apparentBV/TV determined from MRI with BV/TV determined from HR-pQCTand BMD determined from DXA measurements. Comparison differ-ences between correlations (comparing the correlation coefficientbetween variables j and h vs. correlation coefficient between j andk) were performed using Steiger's Z⁎1 statistics [26]. A statisticalsignificance level of 5%was chosen, and a p-value between 5% and 10%was classified as a trend.
Results
Treatment evaluation of BMD from DXA
The difference between treatment and placebo groups in BMDmeasurements from DXA in the ultra-distal radius in a regionmatched to the HR-pQCT ROIs showed a trend towards treatmenteffects after 12 months (p=0.08) and 24 months (p=0.09). The BMDwas maintained in the treatment group and decreased in the placebogroup. The corresponding values for the total distal radius weresignificant after 12 months (p=0.02) and 24 months (p=0.006). For
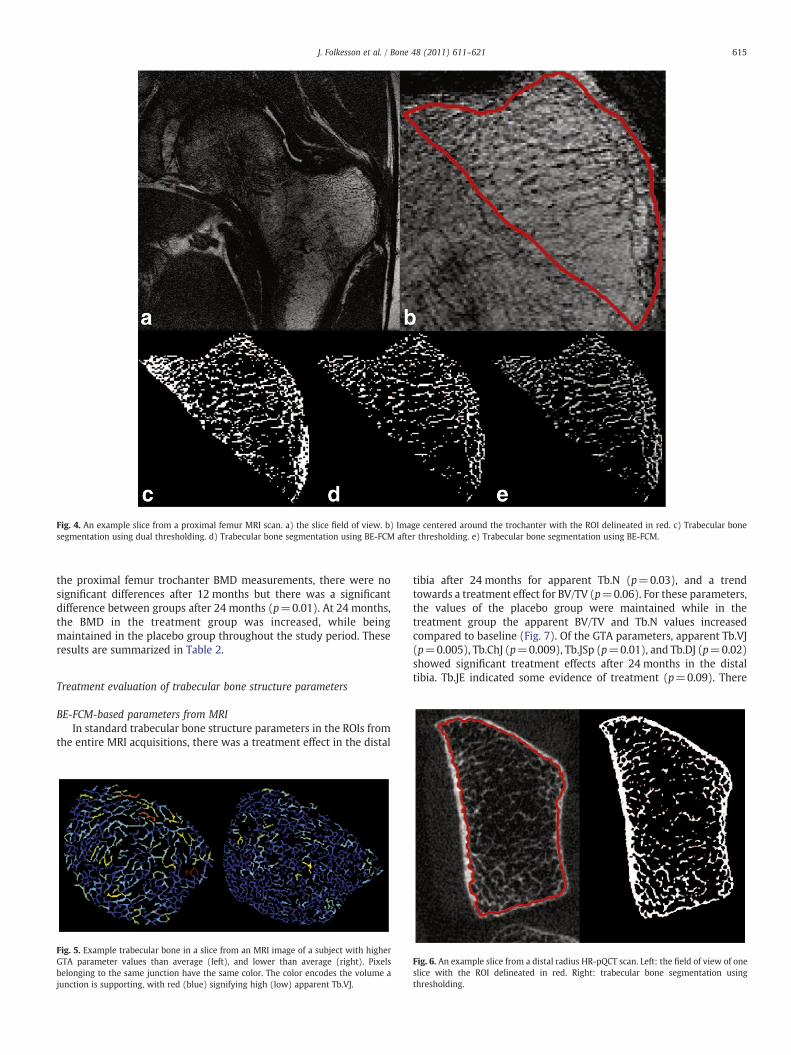
Fig. 4. An example slice from a proximal femur MRI scan. a) the slice field of view. b) Image centered around the trochanter with the ROI delineated in red. c) Trabecular bonesegmentation using dual thresholding. d) Trabecular bone segmentation using BE-FCM after thresholding. e) Trabecular bone segmentation using BE-FCM.
615J. Folkesson et al. / Bone 48 (2011) 611–621
the proximal femur trochanter BMD measurements, there were nosignificant differences after 12 months but there was a significantdifference between groups after 24 months (p=0.01). At 24 months,the BMD in the treatment group was increased, while beingmaintained in the placebo group throughout the study period. Theseresults are summarized in Table 2.
Treatment evaluation of trabecular bone structure parameters
BE-FCM-based parameters from MRIIn standard trabecular bone structure parameters in the ROIs from
the entire MRI acquisitions, there was a treatment effect in the distal
Fig. 5. Example trabecular bone in a slice from an MRI image of a subject with higherGTA parameter values than average (left), and lower than average (right). Pixelsbelonging to the same junction have the same color. The color encodes the volume ajunction is supporting, with red (blue) signifying high (low) apparent Tb.VJ.
tibia after 24 months for apparent Tb.N (p=0.03), and a trendtowards a treatment effect for BV/TV (p=0.06). For these parameters,the values of the placebo group were maintained while in thetreatment group the apparent BV/TV and Tb.N values increasedcompared to baseline (Fig. 7). Of the GTA parameters, apparent Tb.VJ(p=0.005), Tb.ChJ (p=0.009), Tb.JSp (p=0.01), and Tb.DJ (p=0.02)showed significant treatment effects after 24 months in the distaltibia. Tb.JE indicated some evidence of treatment (p=0.09). There
Fig. 6. An example slice from a distal radius HR-pQCT scan. Left: the field of view of oneslice with the ROI delineated in red. Right: trabecular bone segmentation usingthresholding.
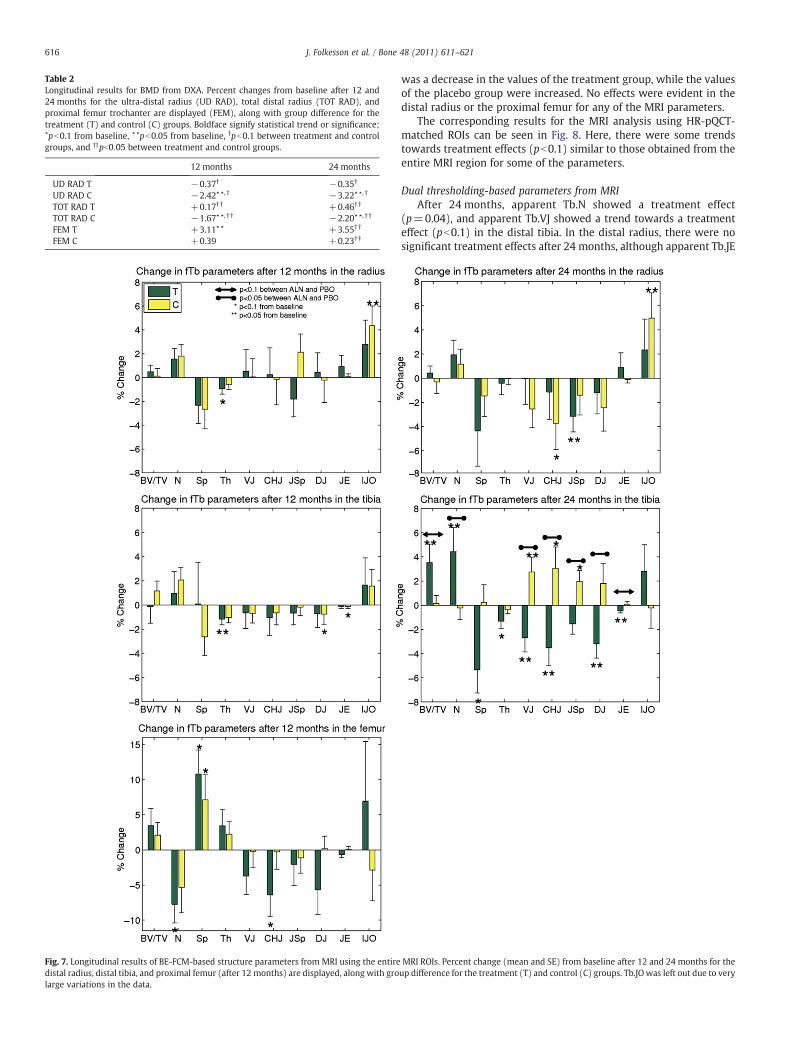
Table 2Longitudinal results for BMD from DXA. Percent changes from baseline after 12 and24 months for the ultra-distal radius (UD RAD), total distal radius (TOT RAD), andproximal femur trochanter are displayed (FEM), along with group difference for thetreatment (T) and control (C) groups. Boldface signify statistical trend or significance;⋆pb0.1 from baseline, ⋆⋆pb0.05 from baseline, †pb0.1 between treatment and controlgroups, and ††pb0:05 between treatment and control groups.
12 months 24 months
UD RAD T −0.37† −0.35†
UD RAD C −2.42⋆⋆, † −3.22⋆⋆, †
TOT RAD T +0.17† † +0.46† †
TOT RAD C −1.67⋆⋆, † † −2.20⋆⋆, † †
FEM T +3.11⋆⋆ +3.55† †
FEM C +0.39 +0.23† †
Fig. 7. Longitudinal results of BE-FCM-based structure parameters from MRI using the entiredistal radius, distal tibia, and proximal femur (after 12 months) are displayed, along with grolarge variations in the data.
616 J. Folkesson et al. / Bone 48 (2011) 611–621
was a decrease in the values of the treatment group, while the valuesof the placebo group were increased. No effects were evident in thedistal radius or the proximal femur for any of the MRI parameters.
The corresponding results for the MRI analysis using HR-pQCT-matched ROIs can be seen in Fig. 8. Here, there were some trendstowards treatment effects (pb0.1) similar to those obtained from theentire MRI region for some of the parameters.
Dual thresholding-based parameters from MRIAfter 24 months, apparent Tb.N showed a treatment effect
(p=0.04), and apparent Tb.VJ showed a trend towards a treatmenteffect (pb0.1) in the distal tibia. In the distal radius, there were nosignificant treatment effects after 24 months, although apparent Tb.JE
MRI ROIs. Percent change (mean and SE) from baseline after 12 and 24 months for theup difference for the treatment (T) and control (C) groups. Tb.JO was left out due to very
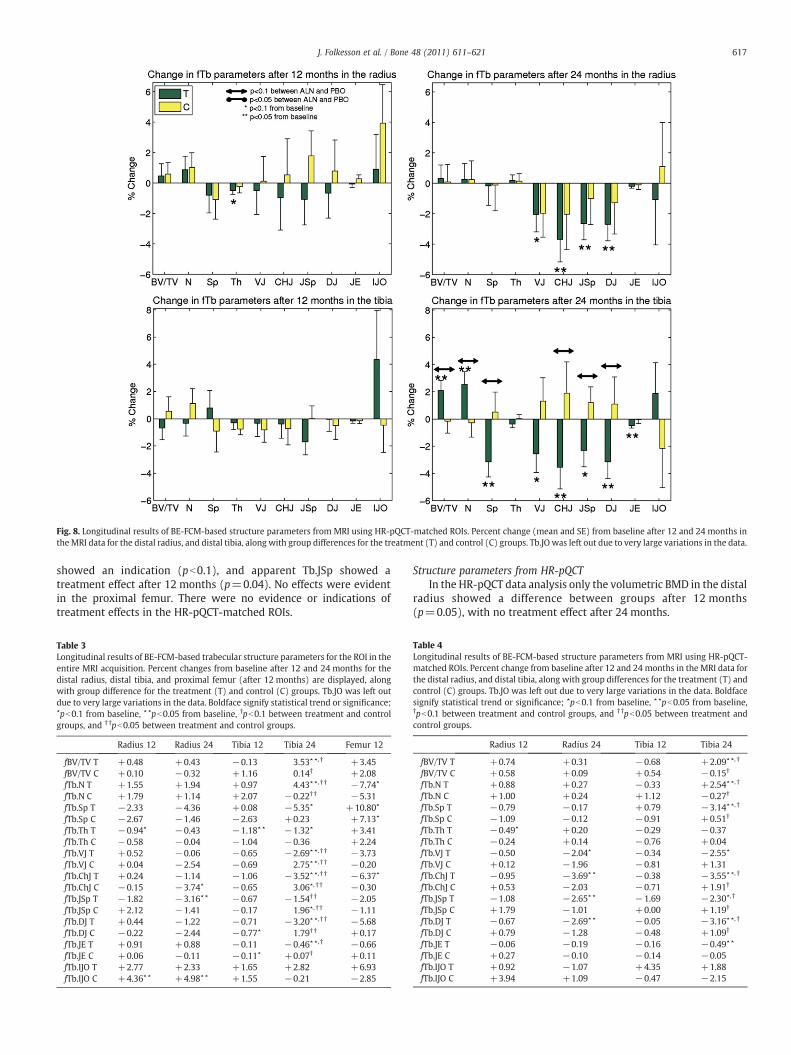
Fig. 8. Longitudinal results of BE-FCM-based structure parameters from MRI using HR-pQCT-matched ROIs. Percent change (mean and SE) from baseline after 12 and 24 months inthe MRI data for the distal radius, and distal tibia, along with group differences for the treatment (T) and control (C) groups. Tb.JO was left out due to very large variations in the data.
617J. Folkesson et al. / Bone 48 (2011) 611–621
showed an indication (pb0.1), and apparent Tb.JSp showed atreatment effect after 12 months (p=0.04). No effects were evidentin the proximal femur. There were no evidence or indications oftreatment effects in the HR-pQCT-matched ROIs.
Table 3Longitudinal results of BE-FCM-based trabecular structure parameters for the ROI in theentire MRI acquisition. Percent changes from baseline after 12 and 24 months for thedistal radius, distal tibia, and proximal femur (after 12 months) are displayed, alongwith group difference for the treatment (T) and control (C) groups. Tb.JO was left outdue to very large variations in the data. Boldface signify statistical trend or significance;⋆pb0.1 from baseline, ⋆⋆pb0.05 from baseline, †pb0.1 between treatment and controlgroups, and † †pb0.05 between treatment and control groups.
Radius 12 Radius 24 Tibia 12 Tibia 24 Femur 12
fBV/TV T +0.48 +0.43 −0.13 3.53⋆ ⋆, † +3.45fBV/TV C +0.10 −0.32 +1.16 0.14† +2.08fTb.N T +1.55 +1.94 +0.97 4.43⋆ ⋆, † † −7.74⋆
fTb.N C +1.79 +1.14 +2.07 −0.22† † −5.31fTb.Sp T −2.33 −4.36 +0.08 −5.35⋆ +10.80⋆
fTb.Sp C −2.67 −1.46 −2.63 +0.23 +7.13⋆
fTb.Th T −0.94⋆ −0.43 −1.18⋆⋆ −1.32⋆ +3.41fTb.Th C −0.58 −0.04 −1.04 −0.36 +2.24fTb.VJ T +0.52 −0.06 −0.65 −2.69⋆ ⋆, † † −3.73fTb.VJ C +0.04 −2.54 −0.69 2.75⋆ ⋆, † † −0.20fTb.ChJ T +0.24 −1.14 −1.06 −3.52⋆ ⋆, † † −6.37⋆
fTb.ChJ C −0.15 −3.74⋆ −0.65 3.06⋆, † † −0.30fTb.JSp T −1.82 −3.16⋆⋆ −0.67 −1.54† † −2.05fTb.JSp C +2.12 −1.41 −0.17 1.96⋆, † † −1.11fTb.DJ T +0.44 −1.22 −0.71 −3.20⋆ ⋆, † † −5.68fTb.DJ C −0.22 −2.44 −0.77⋆ 1.79† † +0.17fTb.JE T +0.91 +0.88 −0.11 −0.46⋆ ⋆, † −0.66fTb.JE C +0.06 −0.11 −0.11⋆ +0.07† +0.11fTb.IJO T +2.77 +2.33 +1.65 +2.82 +6.93fTb.IJO C +4.36⋆⋆ +4.98⋆⋆ +1.55 −0.21 −2.85
Structure parameters from HR-pQCTIn the HR-pQCT data analysis only the volumetric BMD in the distal
radius showed a difference between groups after 12 months(p=0.05), with no treatment effect after 24 months.
Table 4Longitudinal results of BE-FCM-based structure parameters from MRI using HR-pQCT-matched ROIs. Percent change from baseline after 12 and 24 months in the MRI data forthe distal radius, and distal tibia, along with group differences for the treatment (T) andcontrol (C) groups. Tb.JO was left out due to very large variations in the data. Boldfacesignify statistical trend or significance; ⋆pb0.1 from baseline, ⋆⋆pb0.05 from baseline,†pb0.1 between treatment and control groups, and † †pb0.05 between treatment andcontrol groups.
Radius 12 Radius 24 Tibia 12 Tibia 24
fBV/TV T +0.74 +0.31 −0.68 +2.09⋆⋆, †
fBV/TV C +0.58 +0.09 +0.54 −0.15†
fTb.N T +0.88 +0.27 −0.33 +2.54⋆⋆, †
fTb.N C +1.00 +0.24 +1.12 −0.27†
fTb.Sp T −0.79 −0.17 +0.79 −3.14⋆⋆, †
fTb.Sp C −1.09 −0.12 −0.91 +0.51†
fTb.Th T −0.49⋆ +0.20 −0.29 −0.37fTb.Th C −0.24 +0.14 −0.76 +0.04fTb.VJ T −0.50 −2.04⋆ −0.34 −2.55⋆
fTb.VJ C +0.12 −1.96 −0.81 +1.31fTb.ChJ T −0.95 −3.69⋆ ⋆ −0.38 −3.55⋆⋆, †
fTb.ChJ C +0.53 −2.03 −0.71 +1.91†
fTb.JSp T −1.08 −2.65⋆ ⋆ −1.69 −2.30⋆, †
fTb.JSp C +1.79 −1.01 +0.00 +1.19†
fTb.DJ T −0.67 −2.69⋆ ⋆ −0.05 −3.16⋆⋆, †
fTb.DJ C +0.79 −1.28 −0.48 +1.09†
fTb.JE T −0.06 −0.19 −0.16 −0.49⋆⋆
fTb.JE C +0.27 −0.10 −0.14 −0.05fTb.IJO T +0.92 −1.07 +4.35 +1.88fTb.IJO C +3.94 +1.09 −0.47 −2.15

Table 5Correlations between structure parameters from MR and HR-pQCT. Correlationcoefficients (R) are listed. Correlations of structure parameters obtained using dualthresholding (prefixed t) and fuzzy clustering (prefixed f) trabecular bone segmenta-tion are listed. Stars signify differences between correlations using Steiger's statistic;⁎pb0.05, ⁎⁎pb0.001, and ⁎⁎⁎pb0.0001.
Tibia (R) Radius (R)
tBV/TV 0.61 0.39fBV/TV 0.83⁎⁎⁎ 0.75⁎⁎⁎
tTb.N 0.68 0.73fTb.N 0.79⁎ 0.83⁎⁎
tTb.Sp 0.77 0.67fTb.Sp 0.78 0.88⁎⁎⁎
618 J. Folkesson et al. / Bone 48 (2011) 611–621
Comparison of MRI structure parameters and DXA measurements
A comparison between apparent BV/TV from the proximal femurtrochanter and the DXA measurements of BMD at the same siterevealed a correlation which was not significant when using dualthresholding segmentation for all measurements throughout thestudy period (R=0.12, pb0.4). Using BE-FCM, the correlation to DXAmeasurements was somewhat improved (R=0.32, p=0.04). Thecorrelation was also improved for the distal radius; from (R=0.22,p=0.02) using thresholding to (R=0.28, p=0.003) using BE-FCM. Theimprovements were not significant using Steiger's statistic (Tables 3and 4).
tTb.Th 0.43 0.32fTb.Th 0.53 0.15⁎
Comparison of MRI-based and HR-pQCT-based structure parameters
Correlations between trabecular bone structural parameters fromHR-pQCT and MRI computed using both dual thresholding and BE-FCM trabecular bone segmentation and data from all three time pointscan be seen in Fig. 9 and Table 5. All apparent structural parametersfrom MRI are highly correlated to HR-pQCT structural parameters,with the exception of apparent BV/TV from thresholding and theapparent Tb.Th estimates for which correlations are less significant.
Fig. 9. Correlations between structure parameters fromMR and HR-pQCT computed using dustatistically significant (pb0.0001).
Discussion
Study summary
In this study, we evaluated longitudinal effects of alendronate ontrabecular bone structure parameters from MRI scans of the distalradius, distal tibia, and proximal femur. Significant treatment effectswere found in the distal tibia for apparent Tb.N, Tb.VJ, Tb.ChJ, Tb.JSp,
al thresholding (t) and BE-FCM (f) trabecular bone segmentation. All correlations were
619J. Folkesson et al. / Bone 48 (2011) 611–621
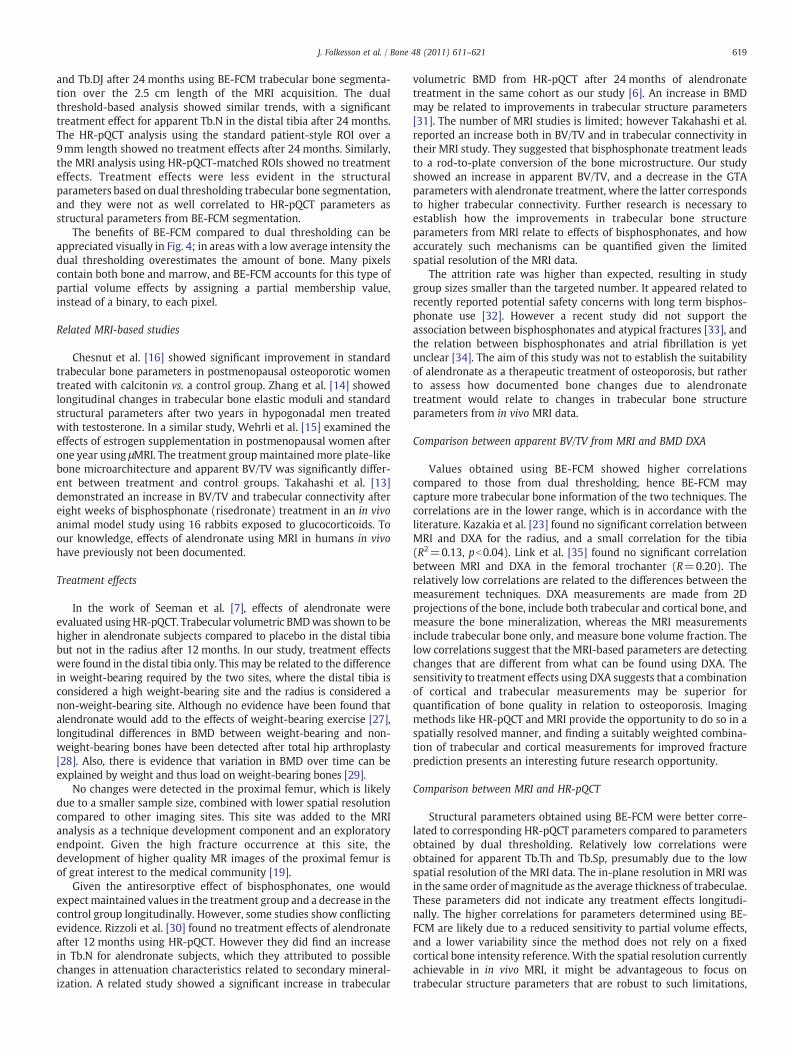
and Tb.DJ after 24 months using BE-FCM trabecular bone segmenta-tion over the 2.5 cm length of the MRI acquisition. The dualthreshold-based analysis showed similar trends, with a significanttreatment effect for apparent Tb.N in the distal tibia after 24 months.The HR-pQCT analysis using the standard patient-style ROI over a9mm length showed no treatment effects after 24 months. Similarly,the MRI analysis using HR-pQCT-matched ROIs showed no treatmenteffects. Treatment effects were less evident in the structuralparameters based on dual thresholding trabecular bone segmentation,and they were not as well correlated to HR-pQCT parameters asstructural parameters from BE-FCM segmentation.
The benefits of BE-FCM compared to dual thresholding can beappreciated visually in Fig. 4; in areas with a low average intensity thedual thresholding overestimates the amount of bone. Many pixelscontain both bone and marrow, and BE-FCM accounts for this type ofpartial volume effects by assigning a partial membership value,instead of a binary, to each pixel.
Related MRI-based studies
Chesnut et al. [16] showed significant improvement in standardtrabecular bone parameters in postmenopausal osteoporotic womentreated with calcitonin vs. a control group. Zhang et al. [14] showedlongitudinal changes in trabecular bone elastic moduli and standardstructural parameters after two years in hypogonadal men treatedwith testosterone. In a similar study, Wehrli et al. [15] examined theeffects of estrogen supplementation in postmenopausal women afterone year using μMRI. The treatment groupmaintainedmore plate-likebone microarchitecture and apparent BV/TV was significantly differ-ent between treatment and control groups. Takahashi et al. [13]demonstrated an increase in BV/TV and trabecular connectivity aftereight weeks of bisphosphonate (risedronate) treatment in an in vivoanimal model study using 16 rabbits exposed to glucocorticoids. Toour knowledge, effects of alendronate using MRI in humans in vivohave previously not been documented.
Treatment effects
In the work of Seeman et al. [7], effects of alendronate wereevaluated using HR-pQCT. Trabecular volumetric BMDwas shown to behigher in alendronate subjects compared to placebo in the distal tibiabut not in the radius after 12 months. In our study, treatment effectswere found in the distal tibia only. This may be related to the differencein weight-bearing required by the two sites, where the distal tibia isconsidered a high weight-bearing site and the radius is considered anon-weight-bearing site. Although no evidence have been found thatalendronate would add to the effects of weight-bearing exercise [27],longitudinal differences in BMD between weight-bearing and non-weight-bearing bones have been detected after total hip arthroplasty[28]. Also, there is evidence that variation in BMD over time can beexplained by weight and thus load on weight-bearing bones [29].
No changes were detected in the proximal femur, which is likelydue to a smaller sample size, combined with lower spatial resolutioncompared to other imaging sites. This site was added to the MRIanalysis as a technique development component and an exploratoryendpoint. Given the high fracture occurrence at this site, thedevelopment of higher quality MR images of the proximal femur isof great interest to the medical community [19].
Given the antiresorptive effect of bisphosphonates, one wouldexpectmaintained values in the treatment group and a decrease in thecontrol group longitudinally. However, some studies show conflictingevidence. Rizzoli et al. [30] found no treatment effects of alendronateafter 12 months using HR-pQCT. However they did find an increasein Tb.N for alendronate subjects, which they attributed to possiblechanges in attenuation characteristics related to secondary mineral-ization. A related study showed a significant increase in trabecular
volumetric BMD from HR-pQCT after 24 months of alendronatetreatment in the same cohort as our study [6]. An increase in BMDmay be related to improvements in trabecular structure parameters[31]. The number of MRI studies is limited; however Takahashi et al.reported an increase both in BV/TV and in trabecular connectivity intheir MRI study. They suggested that bisphosphonate treatment leadsto a rod-to-plate conversion of the bone microstructure. Our studyshowed an increase in apparent BV/TV, and a decrease in the GTAparameters with alendronate treatment, where the latter correspondsto higher trabecular connectivity. Further research is necessary toestablish how the improvements in trabecular bone structureparameters from MRI relate to effects of bisphosphonates, and howaccurately such mechanisms can be quantified given the limitedspatial resolution of the MRI data.
The attrition rate was higher than expected, resulting in studygroup sizes smaller than the targeted number. It appeared related torecently reported potential safety concerns with long term bisphos-phonate use [32]. However a recent study did not support theassociation between bisphosphonates and atypical fractures [33], andthe relation between bisphosphonates and atrial fibrillation is yetunclear [34]. The aim of this study was not to establish the suitabilityof alendronate as a therapeutic treatment of osteoporosis, but ratherto assess how documented bone changes due to alendronatetreatment would relate to changes in trabecular bone structureparameters from in vivo MRI data.
Comparison between apparent BV/TV from MRI and BMD DXA
Values obtained using BE-FCM showed higher correlationscompared to those from dual thresholding, hence BE-FCM maycapture more trabecular bone information of the two techniques. Thecorrelations are in the lower range, which is in accordance with theliterature. Kazakia et al. [23] found no significant correlation betweenMRI and DXA for the radius, and a small correlation for the tibia(R2=0.13, pb0.04). Link et al. [35] found no significant correlationbetween MRI and DXA in the femoral trochanter (R=0.20). Therelatively low correlations are related to the differences between themeasurement techniques. DXA measurements are made from 2Dprojections of the bone, include both trabecular and cortical bone, andmeasure the bone mineralization, whereas the MRI measurementsinclude trabecular bone only, and measure bone volume fraction. Thelow correlations suggest that the MRI-based parameters are detectingchanges that are different from what can be found using DXA. Thesensitivity to treatment effects using DXA suggests that a combinationof cortical and trabecular measurements may be superior forquantification of bone quality in relation to osteoporosis. Imagingmethods like HR-pQCT and MRI provide the opportunity to do so in aspatially resolved manner, and finding a suitably weighted combina-tion of trabecular and cortical measurements for improved fractureprediction presents an interesting future research opportunity.
Comparison between MRI and HR-pQCT
Structural parameters obtained using BE-FCM were better corre-lated to corresponding HR-pQCT parameters compared to parametersobtained by dual thresholding. Relatively low correlations wereobtained for apparent Tb.Th and Tb.Sp, presumably due to the lowspatial resolution of the MRI data. The in-plane resolution in MRI wasin the same order of magnitude as the average thickness of trabeculae.These parameters did not indicate any treatment effects longitudi-nally. The higher correlations for parameters determined using BE-FCM are likely due to a reduced sensitivity to partial volume effects,and a lower variability since the method does not rely on a fixedcortical bone intensity reference. With the spatial resolution currentlyachievable in in vivo MRI, it might be advantageous to focus ontrabecular structure parameters that are robust to such limitations,

620 J. Folkesson et al. / Bone 48 (2011) 611–621
such as fuzzy or probabilistic techniques. Saha and Wehrli [36]employed a fuzzy technique for trabecular bone analysis bydeveloping a fuzzy distance transform for measurements of trabecularbone thickness. The method could provide more reliable thicknessmeasurements in MRI data with limited spatial resolution. Thetechnique is not to be confused with BE-FCM, which provides afuzzy segmentation of the trabecular bone. However both approachesdemonstrate how fuzzy techniques can alleviate partial volumeeffects introduced by the limited spatial resolution.
The two different imaging modalities introduce widely differentartifacts into the images, making neither the MRI nor the HR-pQCTdata in this study eligible as a gold standard [23]. However the HR-pQCT images with their higher resolution and less complex bonesegmentation due to the better discrimination between bone andsurrounding tissues can provide some standard of reference for theMRI postprocessing. The comparison was made using the HR-pQCT-matched ROI definition which, in agreement with the HR-pQCTanalysis, showed no treatment effects.
MRI-based trabecular bone structure parameters showed signifi-cant treatment effects using the entire MRI acquisition ROIs, but notfor the HR-pQCT-matched ROIs. There were no treatment effects after24 months in the HR-pQCT trabecular parameters, and for the BMDfrom DXA there were significant treatment effects in the total radiusbut not in the ultra-distal radius, where the latter is more closelycorresponding to the HR-pQCT ROI. These results suggest that either alarger ROI than the current patient-style HR-pQCT scan prescriptionmay be necessary for detecting significant changes in bone micro-architecture, or that the location of the standard patient-style HR-pQCT region may not be optimal for detecting longitudinal changes.Rizzoli et al. used an ROI with a length of 9 mm at a distance of22.5 mm proximally to the distal joint limit, where they found nosignificant treatment effects with alendronate. In order to evaluate theimportance of ROI definition, we revisited the longitudinal analysis ofapparent Tb.N using BE-FCM, which showed a significant difference(pb0.05) between treatment and placebo groups after 24 months forthe entire MRI ROI but not for the HR-pQCT-matched ROI. Analyzingthe entire MRI ROI except for the slices in the HR-pQCT-matched ROI(approximately a length of 1.8mm of the tibia), Tb.N showed a similardifference between groups (pb0.05) compared to the entire MRI ROI.We also divided the MRI ROIs into slabs with the average HR-pQCT-matched ROI thickness (7.5mm), centered at 33mm, 30.5mm, 27mm(current standard), and24.5mmproximal to the endplate. The resultinganalysis showed a significant difference between groups only for theslab centered 30.5mm proximal to the endplate. This preliminaryanalysis suggests that the standard HR-pQCT ROI definition may besufficient in length, but may benefit from a reevaluation in order todetermine a more sensitive region. This region is possibly locatedfurther from the endplate in the proximal direction compared to thecurrent standard patient-style protocol.
Conclusions
In conclusion, this study demonstrates the feasibility of detectinglongitudinal response to alendronate treatment in osteopenic womenin vivo, using MRI-based trabecular bone structure parameters.Analysis methods that account for partial volume effects can improvethe sensitivity to changes in bone microarchitecture from MRI, andgeodesic topological analysis may be able to provide measurablechanges in trabecular connectivity. A further improvement of imagequality of the MRI and HR-pQCT techniques is desirable as the limitedspatial resolution and relative high noise in these images may at leastpartly explain the failure to detect longitudinal changes of bonestructure in the forearm. Although further studies with larger cohortsare necessary, these results suggest that these methods may in thefuture contribute to new insights into effects of osteoporosis andrelated therapies without the use of ionizing radiation.
Acknowledgments
The authors would like to thank David Newitt, Benedict Hyun,Thelma Munoz, Jingyi Yu, Nicole Cheng, Melissa Guan, and AyakoSuzuki for contributions in subject recruitment, image acquisition,and database management. This work was supported by grants fromMerck & Co., Inc., and NIH RO1 AG17762.
References
[1] Kanis JA, BlackD, Cooper C,Dargent P,Dawson-Hughes B, de Laet C,Delmas P, EismanJ, Johnell O, Jonsson B, Melton L, Oden A, Papapoulos S, Pols H, Rizzoli R, Silman A,Tenenhouse A. A new approach to the development of assessment guidelines forosteoporosis (on behalf of the Internatrional Osteoporosis Foundation and theNational Osteoporosis Foundation, USA). Osteoporos Int 2002;13:527–36.
[2] Bone HG, Hosking D, Devogelaer J-P, Tucci JR, Emkey RD, Tonino RP, Rodriguez-Portales JA, Downs RW, Gupta J, Santora AC, Liberman UA. Ten years' experiencewith alendronate for osteoporosis in postmenopausal women. N Engl J Med2003;350(12):1189–99.
[3] Liberman UA, Weiss SR, Broll J, Minne HW, Quan H, Bell NH, Rodriguez-Portales J,Downs R, Dequeker J, Favus M, Seeman E, Recker RR, Capizzi T, Santora AC,Lombardi A, Shah R, Hirsch LJ, Karpf DB. Effect of oral alendronate on bone mineraldensity and the incidence of fractures in postmenopausal osteoporosis. N Engl JMed 1995;333(22):1437–43.
[4] Orwoll E, Ettinger M, Weiss S, Miller P, Kendler D, Graham J, Adami S, Weber K,Lorenc R, Pietschmann P, Vandormael K, Lombardi A. Alendronate for thetreatment of osteoporosis in men. N Engl J Med 2000;343:604–10.
[5] Black DM, an dD SRC, Karpf B, Cauley JA, Thompson DE, Nevitt MC, Bauer DC,Genant HK, Haskell WL, an RM, Ott SM, Torner JC, Quandt SA, Reiss TF, Ensrud KE.Randomised trial of effect of alendronate on risk of fracture in women withexisting vertebral fractures. Lancet 1996;348(9041):1535–41.
[6] Burghardt AJ, Kazakia GJ, Sode M, de Papp AE, Link TM, Majumdar S. Alongitudinal HR-pQCT study of alendronate treament in postmenopausalwomen with low bone density: relations among density, cortical and trabecularmicroarchitecture, biomechanics, and bone turnover. J Bone Miner Res 2010;25(12):2558–71.
[7] Seeman E, Delmas PD, Hanley DA, Sellmeyer D, Cheung AM, Shane E, Kearns A,Thomas T, Boyd SK, Boutroy S, Bogado C, Majumdar S, Fan M, Libanati C, ZanchettaJ. Microarchitectural deterioration of cortical and trabecular bone: differing effectsof denosumab and alendronate. J Bone Miner Res 2010;25(8):1886–94.
[8] Wehrli FW. Structural and functional assessment of trabecular and cortical boneby micro magnetic resonance imaging. J Magn Reson Imaging 2007;25:390–409.
[9] Parfitt A, Drezner M, Glorieux F, Kanis J, Malluche H, Meunier P, Ott S, Recker R.Bone histomorphometry: standardization of nomenclature, symbols, and units. JBone Miner Res 1987;2(6):595–610.
[10] Carballido-Gamio J, Krug R, Huber MB, Hyun B, Eckstein F, Majumdar S, Link T.Geodesic topological analysis of trabecular bone microarchitecture from high-spatial resolution magnetic resonance images. Magn Reson Med 2009;61:448–56.
[11] Majumdar S, Genant HK, Grampp S, Newitt DC, Truong V-H, Lin JC, Mathur A.Correlation of trabecular bone structure with age, bone mineral density, andosteoporotic status: in vivo studies in the distal radius using high resolutionmagnetic resonance imaging. J Bone Miner Res 1997;12(1):111–8.
[12] Folkesson J, Carballido-Gamio J, Eckstein F, Link T, Majumdar S. Local boneenhancement fuzzy clustering for segmentation of MR trabecular bone images.Med Phys 2010;37(1):295–302.
[13] Takahashi M, Saha PK, Wehrli FW. Skeletal effects of short-term exposure todexamethasone and response to risedronate treatment studied in vivo in rabbitsby magnetic resonance micro-imaging and spectroscopy. J Bone Miner Metab2006;24:467–75.
[14] Zhang XH, Liu XS, Vasilic B, Wehrli FW, Benito M, Rajapakse CS, Snyder PJ, Guo XE.In vivo μMRI-based finite element and morphological analyses of tibial trabecularbone in eugonadal and hypogonadal men before and after testosterone treatment.J Bone Miner Res 2008;23(9):1426–34.
[15] Wehrli FW, Ladinsky GA, Jones C, Benito M, Magland J, Vasilic B, Popescu AM,Zemel B, Cucchiara AJ, Wright AC, Song HK, Saha PK, Peachey H, Snyder PJ. In vivomagnetic resonance detects rapid remodeling changes in the topology of thetrabecular bone network after menopause and the protective effect of estradiol. JBone Miner Res 2008;23(9):1426–34.
[16] Chesnut CH, Majumdar S, Newitt DC, Shields A, Pelt JV, Laschansky E, Azria M,Kriegman A, Eriksen MOEF, Mindeholm L. Effects of salmon calcitonin ontrabecular microarchitecture as determined by magnetic resonance imaging:results from the quest study. J Bone Miner Res 2005;20(9):1548–61.
[17] Bangerter N, Hargreaves B, Vasanawala S, Pauly J, Gold G, Nishimura D. Analysis ofmultiple-acquisition SSFP. Magn Reson Med 2004;51(5):1038–47.
[18] Banerjee S, Han E, Krug R, Newitt D, Majumdar S. Application of refocused steady-statefree-precession methods at 1.5 and 3 T to in vivo high-resolution MRI of trabecularbone, simulations and experiments. Magn Reson Imaging 2005;21(6):818–25.
[19] Krug R, Banerjee S, Han ET, Newitt DC, Link TM, Majumdar S. Feasibility of in vivostructural analysis of high-resolution magnetic resonance images of the proximalfemur. Osteoporos Int 2005;16:1307–14.
[20] Goldenstein J, Kazakia G, Majumdar S. In-vivo evaluation of the presence of bonemarrow in cortical porosity in postmenopausal osteopenic women. Ann BiomedEng 2010;38(2):235–46.
621J. Folkesson et al. / Bone 48 (2011) 611–621
[21] Studholme C, Hill D, Hawkes D. An overlap invariant entropy measure of 3Dmedical image alignment. Pattern Recognit 1999;32:71–86.
[22] Newitt DC, van Rietbergen B, Majumdar S. Processing and analysis of in vivo high-resolution MR images of trabecular bone for longitudinal studies: reproducibilityof structural measures and micro-finite element analysis derived mechanicalproperties. Osteoporos Int 2002;13:278–87.
[23] Kazakia G, Hyun B, Burghardt A, Newitt D, de Papp A, Link T, Majumdar S. In vivodetermination of bone structure in postmenopausal women: a comparison of HR-pQCT and high-field MR imaging. J Bone Miner Res 2008;23(4):463–74.
[24] Laib A, Ruegsegger P. Comparison of structure extraction methods for in vivotrabecular bone measurements. Comput Med Imaging Graph 1999;23(2):69–74.
[25] Hildebrand T, Ruegsegger P. A new method for the model-independentassessment of thickness in three-dimensional images. J Microsc 1997;185:67–75.
[26] Steiger JH. Tests for comparing elements of a correlation matrix. Psychol Bull1980;87(2):245–51.
[27] Uusi-Rasi K, Kannus P, Cheng S, Sievanen H, Pasanen M, Heinonen A, Nenonen A,Halleeen J, Fuerst T, Genant H, Vuori I. Effect of alendronate and exercise on boneand physical performance of postmenopausal women: a randomized controlledtrial. Bone 2003;33(1):132–43.
[28] Hirano Y, Hagino H, Nakamura K, Katagiri H, Okano T, Kishimoto H, Morimoto K,Teshima R, Yamamoto K. Longitudinal change in periprosthetic, peripheral, andaxial bone mineral density after total hip arthroplasty. Mod Rheumatol 2001;11(3):217–21.
[29] Felson DT, Zhang Y, Hannan MT, Anderson JJ. Effects of weight and body massindex on bone mineral density in men and women: the Framingham study. J BoneMiner Res 1993;8(5):567–73.
[30] Rizzoli R, Laroche M, Krieg M-A, Frieling I, Thomas T, Delmas P, Felsenberg D.Strontium ranelate and alendronate have differing effects on distal tibia bonemicrostructure in women with osteoporosis. Rheumatol Int 2010;30:1341–8.
[31] Chen P, Miller PD, Recker R, Resch H, Rana A, Pavo I, Sipos AA. Increases in BMDcorrelate with improvements in bone microarchitecture with teriparatide treatmentin postmenopausalwomenwithosteoporosis. J BoneMiner Res 2007;22(8):1173–80.
[32] Watts NB, Diab DL. Long-term use of bisphosphonates in osteoporosis. J ClinEndocrinol Metab 2010;95(4):1555–65.
[33] D. M. Black, H. K. Genant, L. Palermo, R. Eastell, C. Bucci-Rechtweg, J. Cauley, P. C.Leung, S. Boonen, A. Santora, A. dePapp, D. C. Bauer, Bisphosphonates and fractures ofthe subtrochanteric or diaphyseal femur, The New England Journal of Medicine.
[34] Cummings SR, Schwartz AV, Black DM. Alendronate and atrial fibrillation. N Engl JMed 2007;356(18):1895–6.
[35] Link TM, Vieth V, Langenberg R, Meier N, Lotter A, Newitt D, Majumdar S. Structureanalysis of high resolution magnetic resonance imaging of the proximal femur: invitro correlation with biomechanical strength and BMD. Calcif Tissue Int 2003;72:156–65.
[36] Saha PK, Wehrli FW. Measurement of trabecular bone thickness in the limitedresolution regime of in vivo MRI by fuzzy distance transform. IEEE Trans MedImaging 2004;23(1):53–62.
Copyright © 2022 FDOKUMEN