Long-Term Water Quality Trends in the Lake Okeechobee Watershed, Florida
34
Lake Okeechobee Watershed Long-Term Water Quality Trends and BMPs Project 1 LAKE OKEECHOBEE WATERSHED LONG-TERM WATER QUALITY TRENDS PROJECT Long-term Water Quality Trends in the Lake Okeechobee Watershed, Florida Joyce Zhang 1,* , Patricia Burke 1 , Nenad Iricanin 1 , Steven Hill 1 , Susan Gray 1 , and Richard Budell 2 1 South Florida Water Management District, West Palm Beach, Florida 2 Florida Department of Agriculture and Consumer Services, Tallahassee, Florida *Corresponding author, Phone: 561-682-6341, Fax: 561-640-6815, Email: [email protected] Abstract A Seasonal Kendall Tau test was used to determine statistical significance of mean monthly total phosphorus (TP) and total nitrogen (TN) concentration trends during the time period of 1991 to 2007, by station and basin at 35 long-term water quality monitoring stations located within the northern Lake Okeechobee watershed. One drainage basin (S-154) had a significant decreasing trend for mean monthly TP concentrations during the analysis period. A significant increase in TN concentrations was detected for four basins during this same time period. The S-154 basin which had the significant decreasing trend for TP also had the highest percentage of implemented Best Management Practices (BMPs) and the most rigorous types of nutrient control projects. These findings emphasize the need for continued implementation of intensive P management strategies. The increasing trend in TN for this watershed signals the need for added focus on reductions of TN in future nutrient source control projects and BMPs. Keywords: Phosphorus; Nitrogen; Nutrient management; BMPs; Land use; Trend analysis
Transcript of Long-Term Water Quality Trends in the Lake Okeechobee Watershed, Florida

Lake Okeechobee Watershed Long-Term Water Quality Trends and BMPs Project
1
LAKE OKEECHOBEE WATERSHED LONG-TERM WATER
QUALITY TRENDS PROJECT
Long-term Water Quality Trends in the Lake Okeechobee Watershed, Florida
Joyce Zhang
1,*, Patricia Burke
1, Nenad Iricanin
1, Steven Hill
1, Susan Gray
1, and Richard Budell
2
1 South Florida Water Management District, West Palm Beach, Florida
2 Florida Department of Agriculture and Consumer Services, Tallahassee, Florida
*Corresponding author, Phone: 561-682-6341, Fax: 561-640-6815, Email: [email protected]
Abstract
A Seasonal Kendall Tau test was used to determine statistical significance of mean
monthly total phosphorus (TP) and total nitrogen (TN) concentration trends during the time
period of 1991 to 2007, by station and basin at 35 long-term water quality monitoring stations
located within the northern Lake Okeechobee watershed. One drainage basin (S-154) had a
significant decreasing trend for mean monthly TP concentrations during the analysis period. A
significant increase in TN concentrations was detected for four basins during this same time
period. The S-154 basin which had the significant decreasing trend for TP also had the highest
percentage of implemented Best Management Practices (BMPs) and the most rigorous types of
nutrient control projects. These findings emphasize the need for continued implementation of
intensive P management strategies. The increasing trend in TN for this watershed signals the
need for added focus on reductions of TN in future nutrient source control projects and BMPs.
Keywords: Phosphorus; Nitrogen; Nutrient management; BMPs; Land use; Trend analysis

Lake Okeechobee Watershed Long-Term Water Quality Trends and BMPs Project
2
1. Introduction
Lake Okeechobee, the largest freshwater lake in the southeastern United States, is located
in south central Florida. The watershed of Lake Okeechobee encompasses an area of
approximately 14,000 km2. Over the past 30 years, the lake has experienced accelerated
eutrophication due to excessive nutrient loads from agricultural and urban activities that
dominate land use in the watershed (Boggess et al., 1995; Flaig and Havens, 1995; Hiscock et
al., 2003). Phosphorus (P) is of particular concern in this watershed because it has been identified
as the key element that contributes to the eutrophication of the lake (Davis and Marshall, 1975;
Federico et al., 1981). Total P (TP) loads were 558 metric tons (t) per year (yr) averaged over the
water years 2004 to 2008 (May 2004 to April 2008), which is about three times higher than the
Total Maximum Daily Load (TMDL) of 140 t/yr considered necessary to achieve the in-lake TP
target of 40 parts per billion (ppb) by 2015 (FDEP, 2001).
Despite a long history of regulatory and voluntary incentive-based programs to control P
inputs into Lake Okeechobee, no substantial reduction in loading to the lake occurred during the
1990s. Internal loadings due to wind-driven resuspension of P rich muck within the lake also
have contributed to the declining health of the lake (James et al., 2008). In 2000, the Florida
legislature passed the Lake Okeechobee Protection Act (LOPA) [Section 373.4595, Florida
Statutes], mandating that the lake TMDL of 140 t/yr be met by 2015 and that the coordinating
agencies work together to implement an aggressive program to address the issue of excessive TP
loading. In 2007, the Florida legislature amended LOPA to include the protection of the
Caloosahatchee and St. Lucie River watersheds and estuaries. Section 373.4595, Florida Statues
is now known as the Northern Everglades and Estuaries Protection Program (NEEPP), which

Lake Okeechobee Watershed Long-Term Water Quality Trends and BMPs Project
3
promotes a comprehensive, interconnected watershed approach to protecting these water bodies.
The South Florida Water Management District (SFWMD or the District), Florida
Department of Environmental Protection (FDEP), Florida Department of Agriculture and
Consumer Services (FDACS), and the U.S. Army Corps of Engineers (USACE) have worked
cooperatively to undertake an array of state and federal projects in the watershed to reduce TP
loading (SFWMD et al., 2007; SFWMD et al., 2008). Watershed projects, along with on-site
agricultural and urban Best Management Practices (BMPs), have begun to be implemented to
reduce P transport from uplands and capture runoff during high rainfall periods. Examples of the
most commonly implemented types of BMP’s in the Lake Okeechobee watershed include the
fencing of cattle to exclude them from waterways and wetland areas, improvements to on-site
storm water management systems and the installation of on-site retention facilities.
In 2000, the District also initiated the Dairy Best Available Technology (BATs) program
in an effort to implement the most advanced source control technologies available to reduce TP
discharge from dairy operations. The most effective technology is the edge-of-farm stormwater
treatment, which calls for the reuse of all runoff if possible and the chemical treatment (e.g.
Alum flocculation) of any runoff that must be discharged. Total P reduction rates for this
technology ranges from 66 to 100% based on data collected from 2004 to 2008 (SWET, 2008b).
A comprehensive research and assessment program for water quality in the watershed is
conducted by the SFWMD, in cooperation with FDEP and FDACS, to evaluate the effectiveness
of specific agricultural BMPs and other water management alternatives in reducing P loads
(Zhang et al., 2009). The SFWMD has monitored the inflows to Lake Okeechobee at the
District-operated control structures and maintained an extensive water quality monitoring
network in the Lake Okeechobee watershed since 1972 (Figure 1). These data were used to
Lake Okeechobee Watershed Long-Term Water Quality Trends and BMPs Project
4
evaluate the effectiveness of BMPs and TP reduction projects that have been implemented so far.
The level of actual implementation of BMPs is calculated based on when funding is provided to
individual land owners. It is important to note that actual BMP construction projects may not be
completed until one year after funding was received and thus the total effect of the
implementation of the BMPs may be delayed.
Water quality data for 1977 through 2001 were summarized by Medri et al. (2003). Two
periods were considered in that study: The pre-BMP period from 1977 to 1990, and the post-
BMP transition period from 1991 to 2001. The study used data collected from 24 tributary
stations located in the four drainage basins: S-191, S-154, S-65D, and S-65E (Figure 1). These
four basins are named as priority basins due to their higher contribution of P loads to Lake
Okeechobee (SFWMD, 1997). Results showed that there was a general decline in P loads and
concentrations discharged to Lake Okeechobee, but the trend was not continued for the S-191, S-
65D, and S-65E basins for the post-BMP transition period from 1991 to 2001 (Medri et al.,
2003). The nutrient control projects implemented prior to 1991 were primarily focused on the
dairies in the watershed and the initial reductions in P were seen immediately due to the closing
of several of these large scale operations in the watershed, mostly in the S-154 basin. The lack
of a trend in three of the priority basins from 1991 to 2001 could be due to the fact that the BMPs
implemented had not yet had time to take effect on the downstream water quality and also to the
minimum level of BMPs actually implemented during that time.
The study presented in this article expands on previous work by including additional data
from 2002 to 2007, as well as data from 51 tributary stations within the lake’s northern
hydrologic basins (Figure 1) that have been monitored since 1991. Statistical summaries were
also developed for the period of 2002 to 2007 when BMP measures were intensified and more

Lake Okeechobee Watershed Long-Term Water Quality Trends and BMPs Project
5
resources were provided for nutrient control projects within the watershed under LOPA. Though
water quality restoration strategies have primarily focused on the reduction of P in the watershed,
the availability of a long-term data set for nitrogen (N) gave us the opportunity to see the trends
occurring for another nutrient of concern. The study objectives were to determine baseline
conditions and long-term water quality trends for TP and total N (TN) concentrations, and to
assess the relationships between these trends and the current land use, the level of BMP
implementation, and the presence of P source control projects within each basin’s hydrologic
boundary. This study used BMP implementation percentages that were based on basin acreage
totals where construction of cost share BMPs was complete, or a plan for operational BMP
changes had been implemented. These analyses were used to determine the impact of various
projects implemented thus far in reducing nutrient loads to Lake Okeechobee.
2. Materials and Methods
2.1 Water Quality Monitoring
The District’s current monitoring network is configured to function on three spatial
levels: 1) basin monitoring for flow, TP, TN, and other parameters at control structures
discharging directly to Lake Okeechobee (loading stations); 2) sub-basin or tributary monitoring
at 35 stations for both TP and TN concentrations in key locations that contribute
disproportionately large P loads within the northern Lake Okeechobee drainage basins (ambient
monitoring stations); and 3) farm-level monitoring at 16 dairy stations for TP concentrations
(Figure 1).

Lake Okeechobee Watershed Long-Term Water Quality Trends and BMPs Project
6
The basin level monitoring stations have calculated loads that can be linked to the water
quality conditions summarized for this study at the individual tributary locations. The tributary
monitoring network is a long-term, ambient monitoring network in the Lake Okeechobee
watershed. The network consists of 27 sampling locations within the four priority basins and
eight sampling stations along the Kissimmee River within basins S-65A and S-65BC (Figure 1).
Due to cost constraints and the logistics of installing reliable flow instrumentation, the tributary
monitoring network only provides nutrient concentrations (as well as other chemical
concentration data), and does not enable the calculation of nutrient loads at the tributary level.
The sampling protocol for the 27 tributary stations is to collect bi-weekly grab samples
regardless of flow conditions and the Kissimmee River stations are sampled monthly. Data
collection at the 16 stations located at outfalls from the dairy operations began in the mid-1980s
in response to the implementation of the FDEP Dairy Rule. These land-use related monitoring
data remain a critical tool in providing information to identify the most effective strategies for
reducing P discharges from these operations.
2.2 Basin Characteristics
Land use in the northern part of the Lake Okeechobee watershed is primarily agricultural
(46%) and mostly improved pasture. Basins S-65A and S-65BC are located immediately south of
Lake Kissimmee with a drainage area of 41,825 hectares (ha) and 72,894 ha, respectively (Zhang
et al., 2009). Four monitoring stations are located along the Kissimmee River in basin S-65A,
and four stations are located along the river in basin S-65BC (Figure 1).
The drainage basins S-154, S-191, S-65D, and S-65E, make up the four priority basins in

Lake Okeechobee Watershed Long-Term Water Quality Trends and BMPs Project
7
the Lake Okeechobee watershed. Basin S-154 has a drainage area of 12,796 ha. The primary
land use in this basin is agriculture, including improved and unimproved beef pastures; several
dairy farms in the basin have ceased operation or being converted to residential land use. The S-
154 basin has four tributary monitoring stations and one dairy station. Due to its size and the
numbers of monitoring stations, basin S-191 is further divided into two sub-basins: Taylor Creek
(S-191TC) and Nubbin Slough (S-191NS). The S-191TC and S-191NS sub-basins have drainage
areas of 27,276 ha and 21,592 ha, respectively. The land use distribution is similar to the S-154
basin, but the majority of the dairy farms in these two sub-basins remain in operation. Sub-basin
S-191TC contains eight tributary stations and four dairy stations, while sub-basin S-191NS has
six tributary stations and six dairy stations. The S-65E basin covers an area of 11,799 ha with
major land uses including beef pasture, citrus grove, row crop, and dairy. The S-65E basin has
four tributary monitoring stations and two dairy stations. The S-65D basin is the northernmost of
the four priority basins in the Lake Okeechobee watershed and covers an area of approximately
47,210 ha. Improved pasture is the primary land use in this basin, followed by citrus groves, row
crops, and dairy. The S-65D basin contains five tributary monitoring stations and three dairy
stations.
Upland soils in the drainage basin are predominantly poorly-drained, sandy Spodosols.
Approximately 80% of the TP in the basin is stored in soils in both stable and unstable forms
(Reddy et al. 1996; Hiscock et al., 2003). This type of soil has little P retention capacity in the
surface A and E horizons, but it has high retention capacity in the spodic horizon. Vertical
movement of phosphorus through the soil profile would allow P to be retained by the spodic
horizon. However, P may be lost via subsurface drainage before it reaches the spodic horizon.

Lake Okeechobee Watershed Long-Term Water Quality Trends and BMPs Project
8
2.3 Statistical Analyses
Two study periods were defined: 1) the baseline period from 1991 to 2001; and 2) the
period of LOPA-mandated BMP implementation from 2002 to 2007. Summary statistics
included the number of samples, means, medians, minima, maxima, and standard deviations for
each station. Monthly mean concentrations were used for all other statistical analyses. Notched
box-and-whisker plots summarize selected statistical properties of the data sets for each study
period and were used to test for statistical significance between data sets at roughly a 95 percent
confidence interval and to detect changes in constituent concentration variability over time
(McGill et al., 1978). These plots consist of the median, the lower quartile (25th
percentile), the
upper quartile (75th
percentile), the smallest and the largest values in the distribution of each set
of data. The narrowest point of the notch represents the median of the data.
A comparison of TP and TN concentrations measured during the baseline period (1991 to
2001) and the LOPA BMP implementation period (2002 to 2007) was performed using the
Mann-Whitney test (a non-parametric equivalent of the 2-sample t-test) to determine if
statistically significant differences existed between the two periods. A significance level (α) of
0.05 was used to identify statistical significance. Non-parametric tests perform analyses based
on the ranks of the data, and are therefore not influenced by outliers or skewed data that may
have been present within the 2002 to 2007 data period (due to the occurrence of four hurricanes
impacting the study area during this period).
The Seasonal Kendall Tau test was used to verify the statistical significance of the trends
in the time series of TP and TN concentrations from 1991 to 2007. The Seasonal Kendall Tau is
a non-parametric test frequently used to detect trends for water quality time series data. It is a

Lake Okeechobee Watershed Long-Term Water Quality Trends and BMPs Project
9
rank-order statistic that can be applied to time series data exhibiting seasonal cycles, missing and
censored data, and indications of non-normality (Yu and Zou, 1993).
When data are collected over time, significant autocorrelation may exist between data
values. The Seasonal Kendall Tau provides an adjusted p-value for data that exhibit a significant
level of dependence (Reckhow et al., 1992). For the purpose of determining statistical
significance, an alpha (α) level of 0.05 was selected. Results of the Seasonal Kendall Tau test
indicate if a statistically significant increase or decrease in concentrations is present at both the
station and basin levels.
3. Results and Discussion
3.1 Summary Statistics
Summary statistics of the TP and TN data collected from the 27 tributary monitoring
stations within the four priority basins and eight stations along the Kissimmee River within
basins S-65A and S-65BC are presented in Tables 1 and 2, respectively. Among the eight
stations along the Kissimmee River, six stations exhibited higher median TP concentrations and
three stations had higher median TN concentrations during the LOPA implementation period
when compared to the baseline conditions (Tables 1 and 2). There is no quantitative data to
determine the exact amount of flow that upland basin areas contribute to these locations.
Although there has been minimal BMP implementation within these basins, this should not be
considered a definitive reason for these nutrient increases over this time period.
Among the 27 tributary stations located in the four priority basins (S-65D, S-65E, S-154,

Lake Okeechobee Watershed Long-Term Water Quality Trends and BMPs Project
10
and S-191), 15 stations had lower median TP concentrations and five (5) stations exhibited lower
median TN concentrations during the post LOPA period (Tables 1 and 2). When examining the
data at the basin monitoring stations, all the monitoring stations in basins S-65D and S-154
exhibited significant differences in median TP concentrations for the two monitoring periods.
Significantly lower median TP concentrations (p < 0.05) were observed in basin S-154 for the
post LOPA period (Table 1). Median concentrations in this basin for the post LOPA period were
between 50% to 60% lower than the baseline period. Conversely, basin S-65D exhibited
significantly higher median TP concentrations (p < 0.05) for the post LOPA period at the four
out of fives monitoring stations. Station KREA 04 was the only station in this basin that had
significantly lower median concentrations (p < 0.015) for the post LOPA period (Table 1).
Overall, ten stations in the priority basins exhibited statistically higher median TP concentrations
during the post LOPA period, while eight stations exhibited statistically lower median TP
concentrations for the baseline period (Table 1). A graphical comparison of TP concentrations at
each basin for the two monitoring periods is provided in Figure 2 (top graph). From this plot it is
very evident that a distinct decrease in TP concentrations is observed for basin S-154 during the
post LOPA period. The tributary stations in the S-154 basin are located downstream of areas
with relatively high levels of BMP implementation (Table 3). In addition, this basin has
experienced a decrease in the overall intensity of upland use for agriculture. The S-154 basin also
had two Dairy Best Available Technology (BAT) projects implemented, a large operating ranch
cooperating in a cow/calf BMP project, and two dairy closings between 1989 through 1992
under the Dairy Remediation Program. In 2000, the District initiated the dairy BAT projects to
implement advanced source control technologies to reduce TP discharge from dairy operations.
The most effective technology is the edge-of-farm stormwater treatment, which calls for the

Lake Okeechobee Watershed Long-Term Water Quality Trends and BMPs Project
11
reuse of runoff if possible and the chemical treatment of any runoff that must be discharged.
The northern tributary basins of Lake Okeechobee generally had lower median TN
concentrations for the baseline period than for the LOPA period (Figure 2, bottom graph).
Twenty-one of the 27 stations located in the priority basins exhibited higher median TN
concentrations for the post LOPA period (Table 2). Of these 21 stations, statistically significant
increases in TN were observed at 13 stations. Only station TCNS 217 exhibited a statistically
significant higher TN concentration during the baseline period (Table 2). Increases in TN at the
tributary stations may be the result of large stores of bioavailable N that have accumulated in
soils and sediments. This anthropogenic accumulation of N is due mainly to the intense
spreading of biosolids in the four priority basins before rigorous restrictions were put in place
under LOPA (http://www.dep.state.fl.us/southeast/water/Residuals). The data reported by FDEP
showed over 50,000 t of biosolids (as dry weight) were applied to these basins from 1991 to
2000. A moratorium on residual spreading took effect at the beginning of 2001 and since that
time, marked decreases in the application of this form of imported nutrients have been reported
by FDEP (Table 4). A total of 23,600 t of biosolids residuals (translated to 613 t of N and 183 t
of P) were applied within the watershed over the period of 2001 to 2007 (Table 4). This amount
indicated a 33% reduction in the rate of residuals applied in the watershed on a yearly basis, as
compared to the 1991-2000 period.
3.2 Trend Analyses with Data Collected at the Tributary Stations
Among the eight stations along the Kissimmee River within Basins S-65A and S-65BC,
five stations displayed a significant increasing trend in TP concentration (Table 5). A significant

Lake Okeechobee Watershed Long-Term Water Quality Trends and BMPs Project
12
trend was not found for TN concentrations at these stations. Additional information relating to
basin runoff and lateral flow is needed to determine if these significant trends are mainly the
result of contributions from the Upper Kissimmee Basin and to determine to what degree, if any,
changes in the water quality characteristics of the upland basin areas are contributing to these
findings.
Total P concentrations at four stations in basin S-65D exhibited a significant increasing
trend during the study period (1991 to 2007), with no stations showing a significant decreasing
trend (Table 5). Station KREA 01 exhibited the highest Sen slope (0.011) for TP. The Sen slope
indicates the change in annual concentration for a constituent, and the higher the slope, the more
likely the station will continue to follow its current direction within the upcoming years. Stations
with high positive or negative slopes can be targeted for in-depth investigations to help evaluate
success stories, or identify areas where more intense nutrient control measures need to be
implemented. Median TP concentrations at KREA 01 during the implementation period were
twice as high as those during the baseline period (Table 1). Although BMP planning activities
have taken place in the drainage basin, this tributary station is located directly downstream of an
intense row crop operation that also receives biosolids residuals. Changes in land use may have
also influenced two of the other stations with significantly increasing trends in TP. Stations
KREA 22 and KREA 23 are directly downstream of a large area of land previously classified as
agricultural and natural areas that was cleared for development in the late 1990’s.
Station KREA 17A in the S-65E basin exhibited significant increasing trends for
concentrations of TP and TN. This station also had the highest Sen slope for TP and TN (Table
5). Although BMPs and source control projects have been implemented in this basin (Table 3),
the drainage area for this particular station received high levels of residuals and poultry litter

Lake Okeechobee Watershed Long-Term Water Quality Trends and BMPs Project
13
spreading as late as 2002 (Medri et al., 2003). Although permitted biosolids spreading is no
longer occurring in the station’s drainage area, the effectiveness of the BMPs initiated in this
basin may be offset by the legacy of these earlier nutrient loadings.
No significant trends were found for TN in the S-154 basin. Concentrations for TP at
three of the four stations within this basin exhibited a significant decreasing trend from 1991 to
2007 (Table 5). Median TP concentrations at all three of these stations were reduced by half
during the BMP implementation period (Table 1). TP concentrations at the most downstream
station, KREA 30A, had a Sen slope of -0.041 mg/L per year (Table 5). This may be a reflection
of the S-154 basin having the largest BMP implementation rate (63%) (Table 3), large acre
changes in land use (from intensive usage to pasture and low density residential), and the
completion of four P source control projects that include two dairy BATs.
In the Taylor Creek sub-basin of S-191, TP and TN increased significantly during the
study period at station TCNS 207 and TN also increased at stations TCNS 201 and 213 (Table 5)
even though the overall BMP implementation rate was 53% (Table 3) in the sub-basin. There is
a large dairy operation located within station TCNS 213’s drainage boundary that is not part of
the dairy BATs program and currently implements only the basic BMPs, without water reuse or
chemical treatment. If funding allows, the most successful solution to addressing dairy runoff
within this basin would be to implement the highly effective Dairy BAT mentioned above.
In the Nubbin Slough sub-basin of S-191, TP concentrations at stations TCNS 222 and
TCNS 249 showed a significantly decreasing trend, while two other stations exhibited a
significant increasing trend for TP (TCNS 230 and TCNS 233). Station TCNS 233 is located
downstream of a historic residual and poultry litter spreading station (Medri et al., 2003). As
mentioned earlier, although these practices are no longer occurring, the legacy of these residuals

Lake Okeechobee Watershed Long-Term Water Quality Trends and BMPs Project
14
may still be playing a role in surface runoff upstream of this station. The TCNS 249 station is
directly downstream of two completed Dairy BAT projects. The presence of a significant
decreasing trend in TP conversely occurring with a significant increasing trend in TN at station
TCNS 222, cannot be explained by the land use or the overall implementation rates within the
drainage boundary. Land uses within the boundary of TCNS 222 include beef pasture, urban, and
dairy. The station is downstream of a Dairy BAT, and maintains the overall pattern of a
significant decreasing trend in TP, which is typically observed at stations downstream of these
projects. The increasing trend in TN provides a further indication of unknown changes in the role
nitrogen is playing in watershed agricultural operations, and the degree to which unknown levels
of legacy N may be contributing to measured concentrations.
A recent study of legacy P in the watershed concluded that there is an abundance of
mobile legacy P present, which can maintain elevated P levels going to Lake Okeechobee for
many years (SWET, 2008a). This conclusion was derived based on previous research conducted
by the University of Florida and others (Graetz and Nair, 1995; Reddy et al., 1996; Steinman et
al., 1999; Hiscock et al., 2003). Therefore, the reduction (through abatement practices) of new
sources of P and its mobility to the lake will be an effective means of addressing P loads to the
lake. These P reduction measures must address legacy P sources in uplands, wetlands, and
streams, in order to encompass the full range of watershed features where transport of P to the
lake occurs (SWET, 2008a).
3.3 Trend Analyses with Data Collected at the Dairy Stations
Total P concentrations averaged over the LOPA period were generally lower than those

Lake Okeechobee Watershed Long-Term Water Quality Trends and BMPs Project
15
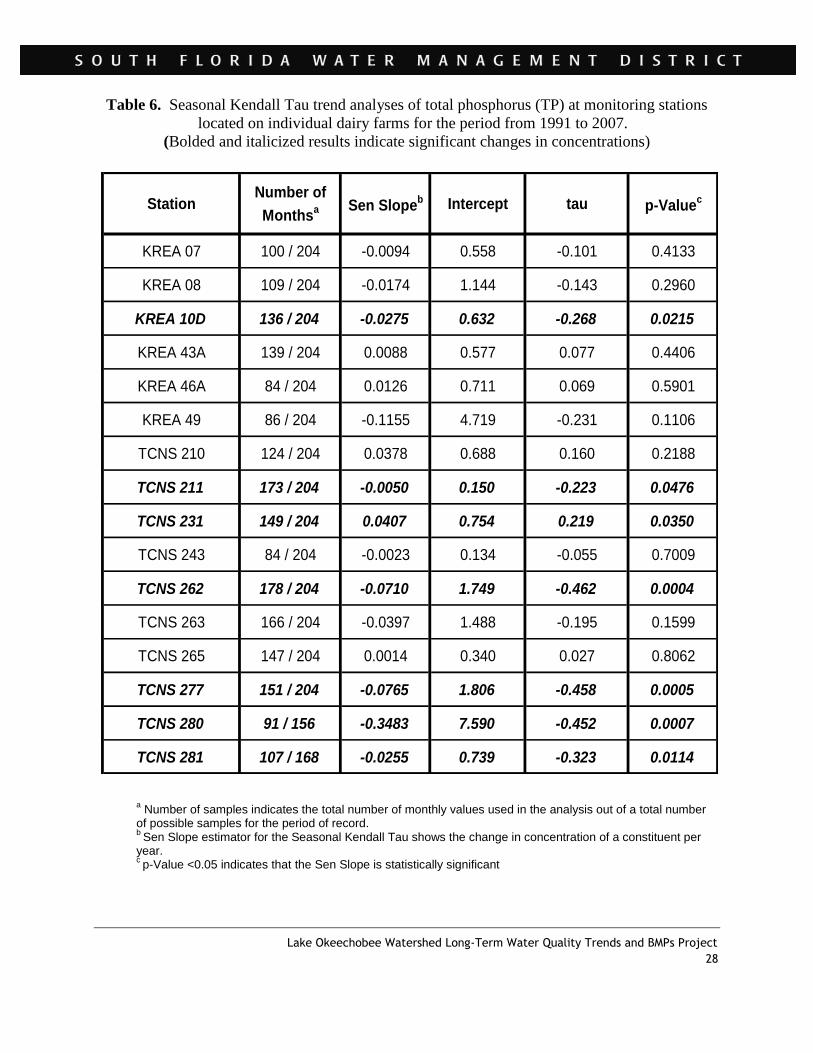
from the baseline period for the 16 dairy stations (Figure 3). TP concentrations for six dairy
stations were significantly decreased (Table 6). These observations may be attributed to the
intensive BMP implementations at these particular dairy stations, as well as the high initial
concentrations that were greatly reduced over a short period of time to get to the levels currently
present (Figure 4). There has also been a general decrease in the intensity of operations and a
marked decrease in the amount of P that is being used at dairy operations (Hiscock et al., 2003).
The cumulative effects of the Dairy Rule, Dairy BAT, and other P control measures and
practices illustrate the possible reductions in P when more intense control measures are
employed.
3.4 Comparison of Nutrient Data Collected at Structures with Data Collected in Basins
Based on the Seasonal Kendall Tau analysis of data at the basin level, the S-154 basin
exhibited a statistically significant decreasing trend and the stations along the Kissimmee River
in the S65A basin showed a significant increasing trend in TP concentrations (Figure 4). Four
basins displayed a significant increasing trend for TN concentrations (Figure 5). Flow data were
not collected at the tributary monitoring stations, so annual flow-weighted mean concentrations
of TP and TN from structures S-191, S-154, and S-65 through S-65E were calculated for
comparison with median TP and TN concentrations in the corresponding basins to ensure
consistency in terms of water quality trends. Flow-weighted TP concentration at structure S-154
displayed a significant decreasing trend during the study period (Table 7). This is consistent with
the basin result for concentrations at the S-154 tributary stations (Figure 4). Flow -weighted TP
concentrations at structures S-65, S-65A and S-65C had significant increasing trends for TP and

Lake Okeechobee Watershed Long-Term Water Quality Trends and BMPs Project
16
TN. This is coherent with the TP concentration findings for the eight stations along the
Kissimmee in basins S-65A and S-65BC. The significant increasing trend for TN at structure S-
65C is however, not reflected in the TN trends found at the four stations along the Kissimmee in
Basin S-65BC. While not statistically significant, the TN concentrations all had negative slopes
for these stations (Table 5).
The average annual TP load to the lake from all sources, excluding the 35 t/yr from
atmospheric deposition, was 511 t/yr averaged from 1991 to 2005 (Zhang et al., 2009). Basin
S-154, with a drainage area of one percent, contributed about five percent of the TP load to the
lake. Basin S-191, with a drainage area of 3.5 percent, contributed about 17 percent of the TP
load to the lake. Basins S-65A through S-65E, with a drainage area of 12 percent, contributed
about 15 percent of TP load to the lake. The flow-weighted TP concentrations are 0.760, 0.644
and 0.167 mg/L for basins S-154, S-191, S-65A through E, respectively, which are much higher
than the tributary TMDL of 0.113 mg/L (113 ppb) specified by the U.S. Environmental
Protection Agency in the 2008 TMDL evaluation
(http://www.epa.gov/region4/water/tmdl/florida/). The percentage of load contributions per
drainage area shows that basin S-191 remains a high source of TP loading to the lake. Basin
S-154 has shown significant decreasing trends in TP and contributes a low percentage of loads to
the lake. However, relative to its very small drainage area and very high flow-weighted
concentrations, S-154 still needs to be viewed as a basin of concern and to be targeted for future
nutrient source control projects and BMPs.
4. Summary and Discussion

Lake Okeechobee Watershed Long-Term Water Quality Trends and BMPs Project
17
A comprehensive array of state and federal projects has been initiated within the
watershed to reduce P loading to Lake Okeechobee. These source control projects, along with
on-site BMPs, have been implemented to reduce P transport from uplands, and to capture water
runoff during periods of high rainfall. Ongoing research and monitoring in the watershed are
helping to guide the design of TP load reduction projects that will improve water quality and
attenuate flows.
An ongoing assessment of water quality trends in the watershed is necessary to evaluate
progress toward achieving the Lake Okeechobee TMDL goal of 140 mt of P per year by 2015.
A total of 51 monitoring stations were studied: 35 long-term, ambient monitoring stations that
included 27 stations in the four priority basins and eight along the Kissimmee River within
basins S-65A and S-65BC; and 16 stations located at the outfalls of the dairy operations. Only
TP data were collected at the 16 dairy stations. The baseline data and trend analysis for TP and
TN concentrations were summarized at the basin-level using the data collected at the 35 long-
term, ambient monitoring stations. Data collected in basin S-154 displayed a significant
decreasing trend in terms of mean monthly TP concentrations from 1991 to 2007. Stations along
the Kissimmee River within the S-65A basin exhibited a significant increasing trend for TP
concentrations. Significant increases in TN were also observed for the S-65D, S-65E, S-154, and
S-191TC basins during the 1991 to 2007 period. Among the 27 long-term, ambient monitoring
stations located in the four priority basins, five stations had a significant decreasing trend, while
eight stations showed a significant increasing trend in terms of mean monthly TP concentrations.
Although BMPs have been initiated to a certain degree, there is still a large percentage of the
watershed that needs dedicated resources in order to realize the full level of BMP
implementation needed for nutrient reductions. The high levels of legacy P in the soils play a

Lake Okeechobee Watershed Long-Term Water Quality Trends and BMPs Project
18
role in the delayed response of the watershed to show TP concentration reductions. The distance
from the BMP implementation area to the actual tributary monitoring station, as well as nearby
land use practices such as residual spreading are also factors in the trends displayed at the
sampling stations. Among the 16 dairy stations, 11 stations displayed a decrease in TP
concentrations and six of these stations had statistically significant decreasing trends. The
implementation of dairy best available technologies, former dairy remediation, wetland
restoration, and other P control projects have contributed to the reduction in the concentrations
realized at these dairy stations.
Based on data collected at the basin structure outlets, discharges from S-154 displayed a
significant decreasing trend in terms of flow-weighted mean TP concentrations from 1991 to
2007. However, flow-weighted TP and TN concentrations have shown a significant increase at
structures S-65, S-65A and S-65C. These findings indicate the need for additional information
to better understand the relationship between upland basin contributions and water quality
transport and fate within the Kissimmee River itself. Increased attention to hydrologic
conditions for these basins and the establishment of long term water quality monitoring within
the upland tributaries would serve this goal. The continued import of biosolids (municipal
residuals) and a lower level of overall BMP implementation efforts (due to budget constraints)
during the study period may have had an influence on the tributary water quality observed in
these two northern basins. Under the NEEPP, additional P control strategies have been identified,
not only for these four priority basins, but also for all the other basins in the Lake Okeechobee
watershed. A combination of BMPs and public works projects are being initiated to achieve
further reductions in nutrient loads from the watershed. In summary, more aggressive nutrient
control measures still need to be implemented in all the surrounding basins that discharge to the

Lake Okeechobee Watershed Long-Term Water Quality Trends and BMPs Project
19
lake in order to reach the lake’s TMDL goal of 140 t of P per year.
5. Relevance to Everglades Restoration and Future Directions
An integral part of the NEEPP is monitoring water quality, flow, and other physical
parameters. Both the long-term tributary monitoring network and the dairy stations will continue
to play a role in providing critical information necessary to document the effectiveness of BMPs
and other P control projects in reducing nutrient loads to Lake Okeechobee.
The documented results of this study are also relevant to the future objectives of the
NEEPP because they confirm the need for advanced TP reduction technologies at the watershed
scale to reduce P loads and concentrations as part of the restoration effort. The results of this
study also revealed a clear trend of increasing TN concentrations within the watershed. Since the
NEEPP now allows for programmatic approaches for the entire Northern Everglades watershed,
it is critical to begin implementing control projects that focus on reducing overall nutrient loads,
with an added focus on ways to abate TN levels in the watershed. This is timely for the
protection of the lake, and especially for the downstream receiving estuarine waters on both
coasts. The N inputs from Lake Okeechobee represent a significant portion of nitrogen entering
the St. Lucie estuary. Since the estuary system is N limited (Phlips, 2008), the impacts of
increasing N loads to the lake from the northern watersheds would have negative effects in the
future on the more easily impacted ecosystem.
The decreases in nutrient loads in the Lake Okeechobee watershed are critical to
improving conditions in the lake, and will also reduce nutrient loads to downstream systems
(estuaries and the Everglades). We are seeing some signs that the various projects implemented
in the watershed are having an effect, but we are still far from achieving the required load

Lake Okeechobee Watershed Long-Term Water Quality Trends and BMPs Project
20
reductions. While it has been imperative to concentrate a large portion of the restoration efforts
on the four priority basins, it is also important to begin increasing attention on the other
contributing basins through assessments of historical data and continued research studies. This
will ensure a system-wide comprehensive approach to the restoration efforts being carried out for
Lake Okeechobee and the Everglades ecosystem. Future research and assessment efforts should
concentrate on gaining a more thorough understanding of the effectiveness of specific BMPs on
specific land use types in order to determine which measures result in the most effective
abatement of legacy P in the watershed. Farm-level research projects need to be continued in
order to obtain necessary data for statistically-relevant assessments. More detailed correlations
between water quality trends at specific tributary stations with land use changes, types of nutrient
control projects and specific BMP measures implemented within an individual station drainage
boundary would also provide a much needed management tool. Stations that exhibited high Sen
slopes in this study would be initial, logical areas where detailed characteristics should be
investigated. A clearer understanding of the current imports and exports of fertilizer in the
watershed, as well as quantifiable information for biosolids residual imports, would provide
much needed data for evaluating the success of nutrient reduction efforts.
Acknowledgment
The authors thank David Unsell, Paul McCormick, Tom James, Steffany Gornak,
Temperince Morgan, Christopher King, Cheol Mo, Brad Jones, and the three anonymous
reviewers for their valuable comments and suggestions on an early version of this paper.
Appreciation also goes to Denise Watts, Greg Kennedy, John Folks, and Jim Laing for the

Lake Okeechobee Watershed Long-Term Water Quality Trends and BMPs Project
21
information regarding biosolids applications.
References
Boggess, C.F., E.G. Flaig, and R.C. Fluck, 1995. P budget-basin relationships for Lake
Okeechobee tributary basins. Ecological Engineering, 5: 143-162.
Davis, F. E. and M.M. Marshall, 1975. Chemical and biological investigations of Lake
Okeechobee January 1973-June 1974. Technical publication 75-1, South Florida Water
Management District, West Palm Beach, Florida.
FDEP. 2001. Total Maximum Daily Load for Total Phosphorus Lake Okeechobee, Florida.
Florida Department of Environmental Protection, Tallahassee, FL. 47 pp.
Federico, A., K. Dickson, C. Kratzer, and F. Davis, 1981. Lake Okeechobee water quality studies
and eutrophication assessment. Technical publication 81-2, South Florida Water
Management District, West Palm Beach, Florida.
Flaig, E. G. & Havens, K. E., 1995: Historical trends in the Lake Okeechobee ecosystem I. Land
use and nutrient loading. Archiv für Hydrobiologie. Suppl 107: 1-24.
Graetz, D.A. and V.D. Nair, 1995. Fate of phosphorus in Florida Spodosols contaminated with
cattle manure. Ecological Engineering, 5: 163-181.
James, R. T., Chimney, M. J., Sharfstein, B., Engstrom, D. R., Schottler, S. P., East, T. and Jin,
K.-R., 2008: Hurricane effects on a shallow lake ecosystem, Lake Okeechobee, Florida
(USA). Fundamental and Applied Limnology, 172: 273-287.
Hiscock, J.G., C.S. Thourot, and J. Zhang. 2003. Phosphorus budget – land use relationships for
the northern Lake Okeechobee watershed, Florida. Journal of Ecological Engineering 21(1):
63-74.
McGill, R., J.W. Tukey, and W.A. Larsen. 1978. Variations of box plots. The American
Statistician, 32(1):12-16.
Medri, A., G. Ritter, N. Iricanin, and S. Hill, 2003. Baseline condition in selected tributaries in
Lake Okeechobee watershed. Letter report to South Florida Water Management District,
West Palm Beach, FL.
Phlips, Edward. 2008. Nutrient limitation and community composition in the St. Lucie Estuary.
Final Report to South Florida Water Management District, West Palm Beach, FL.
Reckhow, K.H., Kim Kepford, and William Warren-Hicks, 1992. Methods for the analysis of
lake water quality trends. School of the Environment, Duke University, Durham, NC.

Lake Okeechobee Watershed Long-Term Water Quality Trends and BMPs Project
22
Reddy, K.R., E.G. Flaig, and D.A. Graetz. 1996. Phosphorus Storage Capacity of Uplands,
Wetlands, and Streams of the Lake Okeechobee Watershed, Florida. Agriculture, Ecosystems
and Environment, 59: 203-216.
SFWMD, 1997. Surface water improvement and management plan update for Lake Okeechobee.
South Florida Water Management District, West Palm Beach, FL.
SFWMD, FDEP, and FDACS, 2007. Lake Okeechobee Protection Program - Lake Okeechobee
Protection Plan Evaluation Report. South Florida Water Management District, West Palm
Beach, FL.
SFWMD, FDEP and FDACS, 2008. Lake Okeechobee Watershed Construction Project Phase II
Technical Plan. South Florida Water Management District, West Palm Beach, FL.
SWET, 2008a. Task 3 Report on Legacy Phosphorus Abatement Plan for project titled
“Technical Assistance in Review and Analysis of Existing Data for Evaluation of Legacy
Phosphorus in the Lake Okeechobee Watershed”, South Florida Water Management District,
West Palm Beach, FL.
SWET, 2008b. Task 4.1 Final Report on Dairy Best Available Technologies in the Okeechobee
Basin, South Florida Water Management District, West Palm Beach, FL.
Steinman, A.D., K.E. Havens, N.G. Aumen, R.T. James, K-R. Jin, J. Zhang, and B. Rosen, 1999.
Phosphorus in Lake Okeechobee: sources, sinks, and strategies. In: Phosphorus
Biogeochemistry of Subtropical Ecosystems: Florida as a Case Example. Reddy, K. R.,
O’Conner, G. A., and Schelske, C. L. (Editors). CRC/Lewis Publisher, New York, pp.527-
544.
Yu, Y.S. and S. Zou, 1993. Research trends of principal components to trends of water-quality
constituents. Water Resources Bulletin, 29(5):797-806.
Zhang, J., R. T. James, and P. McCormick, 2009. Chapter 10: Lake Okeechobee Protection
Program – State of the Lake and Watershed. In: 2009 South Florida Environmental Report –
Volume I, South Florida Water Management District, West Palm Beach, FL.

Lake Okeechobee Watershed Long-Term Water Quality Trends and BMPs Project
23
Figure Captions
Figure 1. Location of ambient water quality sampling stations where total phosphorus (TP) and
total nitrogen (TN) were collected in the tributary basins that drain into Lake
Okeechobee (triangles), sampling stations where TP data were collected at dairy
outfalls (dots), and the loading stations at the inflow structures (squares).
Figure 2. Box and whisker plot of total phosphorus (top) and total nitrogen (bottom)
concentrations for the periods 1991 – 2001 and 2002 – 2007.
Figure 3. Box and whisker plot of total phosphorus concentrations for the periods 1991 – 2001
and 2002 – 2007 for monitoring stations located at individual dairy farms.
Figure 4. Seasonal Kendall trends and 12-month moving average plots of mean monthly total
phosphorus concentrations for the period 1991 – 2007.
Figure 5. Seasonal Kendall Tau trends and 12-month moving average plots of mean monthly
total nitrogen concentrations for the period 1991 – 2007.

Lake Okeechobee Watershed Long-Term Water Quality Trends and BMPs Project
24
Table 1. Summary of total phosphorus data (in mg/L) collected during the baseline period
1991 through 2001 and BMP implementation period 2002 through 2007 in the Lake Okeechobee
watershed. Bolded and italicized rows indicate a statistically significant difference for the two
sampling periods at α = 0.05.
KREA 79 68 0.050 0.032 0.017 0.043 0.228 69 0.078 0.030 0.031 0.072 0.172 <0.001
KREA 91 53 0.054 0.030 0.018 0.043 0.139 58 0.059 0.021 0.026 0.054 0.106 0.048
KREA 92 63 0.066 0.034 0.026 0.057 0.206 70 0.062 0.022 0.023 0.060 0.112 0.950
KREA 97 52 0.073 0.031 0.025 0.069 0.185 50 0.126 0.059 0.040 0.118 0.283 <0.001
KREA 93 59 0.077 0.039 0.018 0.071 0.213 67 0.085 0.041 0.043 0.074 0.272 0.180
KREA 94 54 0.108 0.099 0.029 0.085 0.641 68 0.085 0.041 0.046 0.074 0.273 0.271
KREA 95 63 0.078 0.057 0.015 0.061 0.309 67 0.065 0.035 0.025 0.057 0.272 0.341
KREA 98 41 0.066 0.040 0.017 0.060 0.176 66 0.083 0.042 0.032 0.071 0.242 0.025
KREA 01 223 0.158 0.174 0.004 0.103 1.259 93 0.313 0.294 0.042 0.206 1.522 <0.001
KREA 04 141 0.191 0.175 0.030 0.138 1.191 77 0.136 0.068 0.039 0.123 0.320 0.049
KREA 06A 228 0.237 0.138 0.050 0.208 0.970 78 0.286 0.158 0.057 0.253 0.758 0.015
KREA 22 114 0.069 0.113 0.010 0.041 1.032 80 0.068 0.060 0.025 0.054 0.447 0.005
KREA 23 90 0.044 0.048 0.007 0.027 0.320 71 0.121 0.168 0.019 0.055 0.928 <0.001
KREA 14 123 0.537 0.328 0.096 0.487 1.946 54 0.407 0.268 0.058 0.347 1.210 0.005
KREA 17A 182 0.242 0.211 0.026 0.167 1.155 88 0.398 0.248 0.086 0.334 1.388 <0.001
KREA 19 392 0.581 0.760 0.035 0.219 4.005 118 0.537 0.495 0.038 0.395 2.050 0.197
KREA 41A 263 0.549 0.632 0.054 0.332 6.547 64 0.452 0.512 0.034 0.212 2.360 0.089
KREA 20 90 2.266 1.126 0.050 2.114 6.550 20 1.059 0.571 0.184 1.120 2.423 <0.001
KREA 25 85 1.337 0.881 0.185 1.010 4.145 29 0.663 0.419 0.160 0.615 1.652 <0.001
KREA 28 335 1.395 0.728 0.367 1.257 4.940 84 0.899 0.528 0.250 0.748 2.510 <0.001
KREA 30A 203 1.114 0.596 0.129 0.967 3.869 25 0.618 0.268 0.167 0.518 1.140 <0.001
TCNS 201 179 0.462 0.232 0.009 0.388 1.378 64 0.482 0.258 0.142 0.455 1.370 0.734
TCNS 204 206 0.922 0.549 0.108 0.702 2.779 73 0.768 0.381 0.352 0.617 2.000 0.114
TCNS 207 368 0.677 0.759 0.081 0.438 5.834 116 0.897 0.448 0.199 0.790 2.258 <0.001
TCNS 209 354 0.532 0.483 0.040 0.381 3.422 89 0.449 0.330 0.043 0.371 1.610 0.179
TCNS 212 95 0.161 0.153 0.030 0.116 1.213 38 0.238 0.174 0.028 0.189 0.664 0.017
TCNS 213 359 0.486 0.296 0.039 0.417 1.725 123 0.421 0.225 0.085 0.350 1.237 0.100
TCNS 214 366 0.242 0.115 0.054 0.218 1.034 141 0.270 0.112 0.081 0.246 0.591 0.005
TCNS 217 362 0.380 0.302 0.030 0.296 1.893 132 0.349 0.287 0.023 0.261 1.520 0.372
TCNS 220 181 0.615 0.289 0.236 0.543 1.788 66 0.620 0.450 0.249 0.482 2.860 0.116
TCNS 222 341 0.579 0.230 0.079 0.537 1.458 84 0.507 0.222 0.222 0.446 1.580 <0.001
TCNS 228 313 0.512 0.274 0.091 0.444 2.183 88 0.502 0.260 0.138 0.401 1.160 0.644
TCNS 230 310 0.407 0.251 0.080 0.341 1.861 67 0.614 0.268 0.196 0.591 1.440 <0.001
TCNS 233 360 0.390 0.260 0.069 0.298 1.758 101 0.646 0.391 0.176 0.556 2.237 <0.001
TCNS 249 174 0.457 0.396 0.045 0.315 2.379 30 0.230 0.167 0.063 0.175 0.739 0.002
S-65D
S-65E
S-154
S-191TC
S-191NS
S-65A
S-65BC
Mann-
Whitney
p-value
No
of
Samples
BasinMinimum Median Maximum
Station
Summary Statistics for the Period from 1991 to 2001 Summary Statistics for the Period from 2002 to 2007
Median MaximumMeanStandard
DeviationMinimum
No
of
Samples
MeanStandard
Deviation

Lake Okeechobee Watershed Long-Term Water Quality Trends and BMPs Project
25
Table 2. Summary of total nitrogen data (in mg/L) collected during the baseline period
1991 through 2001 and BMP implementation period 2002 through 2007 in the Lake Okeechobee
watershed. Bolded and italicized rows indicate a statistically significant difference for the two
sampling periods at α = 0.05.
KREA 79 65 1.259 0.414 0.580 1.140 2.290 67 1.288 0.406 0.790 1.220 2.850 0.642
KREA 91 50 1.395 0.495 0.250 1.310 2.860 57 1.398 0.355 0.820 1.320 2.880 0.820
KREA 92 59 1.114 0.281 0.510 1.080 1.790 68 1.099 0.123 0.920 1.085 1.520 0.944
KREA 97 50 1.281 0.325 0.550 1.275 2.000 49 1.341 0.285 0.960 1.250 2.580 0.554
KREA 93 55 1.442 0.465 0.710 1.300 2.820 65 1.266 0.276 0.880 1.190 2.110 0.027
KREA 94 48 1.417 0.463 0.820 1.250 2.950 66 1.257 0.286 0.870 1.180 2.140 0.068
KREA 95 59 1.291 0.358 0.770 1.210 2.340 66 1.128 0.214 0.680 1.085 1.790 0.014
KREA 98 41 1.373 0.387 0.740 1.330 2.340 64 1.292 0.279 1.010 1.210 2.380 0.246
KREA 01 162 1.436 0.564 0.250 1.305 5.400 85 1.617 0.429 0.880 1.570 2.870 <0.001
KREA 04 72 1.358 0.401 0.520 1.370 2.690 75 1.498 0.382 0.910 1.480 3.150 0.018
KREA 06A 33 1.355 0.383 0.250 1.300 2.280 46 1.529 0.671 0.860 1.390 4.890 0.684
KREA 22 104 1.443 1.035 0.510 1.245 8.980 73 1.428 0.357 0.590 1.360 2.810 0.008
KREA 23 80 1.322 0.352 0.640 1.265 2.370 63 1.459 0.542 0.950 1.290 4.080 0.230
KREA 14 --NA-- --NA-- --NA-- --NA-- --NA-- --NA-- 34 2.116 0.645 1.140 1.940 4.200 --NA--
KREA 17A 112 1.413 0.381 0.250 1.350 2.970 86 1.782 0.432 0.850 1.710 3.140 <0.001
KREA 19 40 2.112 0.719 0.850 2.115 3.380 84 2.145 0.856 0.910 2.020 4.070 0.814
KREA 41A 29 2.319 1.430 0.690 1.850 8.890 37 2.785 0.910 0.900 2.710 4.760 0.004
KREA 20 55 2.625 0.971 1.160 2.440 6.010 18 2.976 1.489 0.620 2.920 7.060 0.234
KREA 25 77 2.292 0.683 0.600 2.160 4.180 28 2.214 0.521 1.120 2.280 3.300 0.925
KREA 28 326 2.158 0.565 0.250 2.120 4.210 160 2.251 0.769 1.260 2.170 6.510 0.613
KREA 30A 201 1.973 0.493 0.620 1.900 4.480 25 1.874 0.293 1.270 1.910 2.470 0.577
TCNS 201 113 1.492 0.571 0.520 1.480 4.290 57 1.609 0.599 0.650 1.630 2.830 0.185
TCNS 204 25 2.574 1.197 1.500 2.330 6.740 45 3.659 0.755 2.200 3.520 5.790 <0.001
TCNS 207 324 2.013 2.644 0.250 1.450 27.860 112 3.077 2.375 0.750 2.410 22.920 <0.001
TCNS 209 335 1.613 1.680 0.250 1.360 17.560 89 1.773 0.609 0.660 1.730 3.300 <0.001
TCNS 212 19 1.821 0.536 0.810 1.760 2.730 24 1.642 0.554 0.990 1.570 2.690 0.231
TCNS 213 323 1.689 0.909 0.250 1.520 9.270 124 2.014 0.657 0.800 1.925 3.960 <0.001
TCNS 214 359 1.250 0.601 0.250 1.200 3.740 138 1.210 0.617 0.330 1.035 2.890 0.407
TCNS 217 345 2.319 5.743 0.250 1.580 89.620 126 1.277 0.593 0.430 1.090 3.900 <0.001
TCNS 220 31 2.694 1.105 1.630 2.410 5.740 49 3.160 1.546 1.750 2.850 10.830 0.015
TCNS 222 337 1.912 0.736 0.250 1.800 9.680 82 2.047 0.529 0.950 1.980 4.340 0.003
TCNS 228 306 2.299 0.915 0.250 2.200 9.030 87 2.313 0.935 0.980 2.230 6.370 0.839
TCNS 230 304 1.786 0.527 0.250 1.705 4.600 65 2.045 0.508 1.090 1.970 3.950 <0.001
TCNS 233 354 1.758 0.547 0.250 1.675 4.320 100 2.324 1.793 1.060 1.965 16.130 <0.001
TCNS 249 32 1.102 0.643 0.250 1.160 2.960 14 1.261 0.679 0.570 1.030 3.250 0.519
S-65D
S-65E
S-154
S-191TC
S-191NS
S-65A
S-65BC
Mann-
Whitney
p-value
BasinMinimum Median Maximum
Station
Summary Statistics for the Period from 1991 to 2001 Summary Statistics for the Period from 2002 to 2007
Median Maximum
No
of
Samples
MeanStandard
Deviation
No
of
Samples
MeanStandard
DeviationMinimum

Lake Okeechobee Watershed Long-Term Water Quality Trends and BMPs Project
26
Basin
Total Basin
Area
(ha)
BMPs Being
Implemented
(ha)
% of BMPs
Being
Implemented
TP Significant
Trend
TN Significant
Trend
S-65A 41,825 - 0% Increase No
S-65BC 72,894 7,080 10% No No
S-65D 47,207 20,707 44% No Increase
S-65E 11,799 4,226 36% No Increase
S-154 12,796 8,095 63% Decrease Increase
S-191TC 27,276 14,545 53% No Increase
S-191NS 21,592 8,688 40% No No
Total 235,389 63,342 27%
N P N P N P N P N P N P N P N P
S-65BC 8.6 1.8 84.0 21.9 49.9 8.6 16.0 0.5 158.5 32.8
S-65D 182.9 60.1 0.0 0.0 0.0 0.0 2.4 1.0 1.0 0.2 186.2 61.2
S-191 3.9 3.0 3.9 2.1 96.7 28.5 56.6 14.4 103.3 37.4 0.0 0.0 3.5 3.4 267.9 88.8
612.7 182.9
Totals2001 2002 2003 2004
Total Nutrient Loads (mt)
2005 2006 2007Basin
Table 3. Percent of Best Management Practice (BMP) implementation and significant
trends in total phosphorus (TP) and total nitrogen (TN) concentrations from 1991 to 2007.
Table 4. Total nutrient loading from residual applications for basins within the Lake
Okeechobee watershed (in metric tons)
Source: FDEP, 2001 to 2007 RAS Reports (http://www.dep.state.fl.us/southeast/water/Residuals).

Lake Okeechobee Watershed Long-Term Water Quality Trends and BMPs Project
27
Number of
Samplesa
Sen
Slopeb Intercept tau p-Value
cNumber of
Samplesa
Sen
Slopeb Intercept tau p-Value
c
KREA 79 129 / 204 0.0035 0.029 0.448 0.001 124 / 204 0.0067 1.133 0.066 0.468
KREA 91 110 / 144 0.0018 0.040 0.240 0.005 106 / 144 0.0217 1.190 0.151 0.300
KREA 92 131 / 144 0.0007 0.054 0.054 0.711 124 / 144 -0.0053 1.122 -0.108 0.250
KREA 97 100 / 144 0.0054 0.050 0.355 0.038 97 / 144 0.0050 1.240 0.046 0.604
KREA 93 120 / 144 0.0038 0.049 0.340 0.023 114 / 144 -0.0025 1.235 -0.016 0.876
KREA 94 117 / 144 0.0010 0.069 0.101 0.176 109 / 144 -0.0073 1.234 -0.058 0.505
KREA 95 124 / 144 0.0013 0.050 0.106 0.343 119 / 144 -0.0100 1.200 -0.089 0.497
KREA 98 101 / 132 0.0051 0.043 0.394 0.028 99 / 132 -0.0029 1.246 -0.019 0.886
KREA 01 168 / 204 0.0112 0.040 0.343 0.007 138 / 204 0.0333 1.102 0.299 <0.0001
KREA 04 120 / 192 -0.0016 0.167 -0.081 0.273 86 / 192 0.0167 1.287 0.134 0.344
KREA 06A 158 / 204 0.0060 0.176 0.196 0.001 37 / 204 0.0374 1.042 0.286 0.322
KREA 22 138 / 204 0.0016 0.033 0.215 0.001 125 / 204 0.0200 1.130 0.212 0.036
KREA 23 118 / 204 0.0050 0.004 0.475 0.004 106 / 204 0.0100 1.215 0.144 0.070
KREA 14 100 / 168 -0.0048 0.470 -0.047 0.587 24 / 168 0.2200 0.395 0.444 0.111
KREA 17A 137 / 204 0.0172 0.081 0.387 0.004 106 / 204 0.0557 1.076 0.553 0.001
KREA 19 131 / 204 0.0011 0.265 0.015 0.842 25 / 204 -0.0650 2.642 -0.333 0.367
KREA 41A 162 / 204 -0.0068 0.384 -0.100 0.347 34 / 204 -0.0038 2.633 -0.027 1.000
KREA 20 74 / 204 -0.0738 2.295 -0.403 0.019 47 / 204 0.0288 2.266 0.079 0.715
KREA 25 66 / 192 -0.0623 1.313 -0.464 0.022 63 / 192 0.0141 2.037 0.109 0.501
KREA 28 109 / 192 -0.0466 1.458 -0.265 0.052 104 / 192 0.0041 2.042 0.037 0.751
KREA 30A 109 / 204 -0.0415 1.237 -0.315 0.024 106 / 204 0.0042 1.854 0.033 0.741
TCNS 201 136 / 204 0.0019 0.393 0.045 0.513 103 / 204 0.0276 1.225 0.264 0.001
TCNS 204 153 / 204 -0.0028 0.697 -0.028 0.789 38 / 204 0.0959 2.580 0.227 0.240
TCNS 207 195 / 204 0.0323 0.375 0.293 0.025 178 / 204 0.0827 1.117 0.389 0.003
TCNS 209 182 / 204 -0.0111 0.505 -0.127 0.189 177 / 204 0.0274 1.287 0.173 0.137
TCNS 212 91 / 204 0.0052 0.085 0.140 0.294 26 / 204 -0.0457 2.049 -0.250 0.391
TCNS 213 197 / 204 -0.0073 0.469 -0.118 0.151 186 / 204 0.0338 1.423 0.222 0.016
TCNS 214 202 / 204 0.0028 0.209 0.118 0.095 201 / 204 -0.0045 1.319 -0.030 0.755
TCNS 217 197 / 204 -0.0062 0.354 -0.118 0.170 192 / 204 -0.0325 1.691 -0.185 0.051
TCNS 220 160 / 204 -0.0024 0.554 -0.032 0.602 40 / 204 0.0247 2.640 0.094 0.612
TCNS 222 178 / 204 -0.0080 0.577 -0.199 0.004 176 / 204 0.0250 1.668 0.184 0.001
TCNS 228 175 / 204 -0.0046 0.510 -0.063 0.402 173 / 204 -0.0085 2.342 -0.070 0.223
TCNS 230 158 / 204 0.0154 0.284 0.239 0.023 156 / 204 0.0060 1.774 0.055 0.523
TCNS 233 186 / 204 0.0115 0.281 0.225 0.020 185 / 204 0.0167 1.658 0.164 0.100
TCNS 249 136 / 204 -0.0119 0.398 -0.197 0.008 20 / 204 0.0442 0.789 0.400 0.289
Basin Station
Total Phosphorus Total Nitrogen
S-154
S-191TC
S-191NS
S-65A
S-65BC
S-65D
S-65E
Table 5. Seasonal Kendall Tau trend analyses of total phosphorus (TP) and total nitrogen (TN)
for the period from 1991 to 2007.
(Bolded and italicized results indicate significant changes in concentrations)
a Number of samples indicates the total number of monthly values used in the analysis out of a total number
of possible samples for the period of record. b
Sen Slope estimator for the Seasonal Kendall Tau shows the change in concentration of a constituent per year. c p-Value <0.05 indicates that the Sen Slope is statistically significant.
Lake Okeechobee Watershed Long-Term Water Quality Trends and BMPs Project
28
StationNumber of
Monthsa Sen Slope
b Intercept tau p-Valuec
KREA 07 100 / 204 -0.0094 0.558 -0.101 0.4133
KREA 08 109 / 204 -0.0174 1.144 -0.143 0.2960
KREA 10D 136 / 204 -0.0275 0.632 -0.268 0.0215
KREA 43A 139 / 204 0.0088 0.577 0.077 0.4406
KREA 46A 84 / 204 0.0126 0.711 0.069 0.5901
KREA 49 86 / 204 -0.1155 4.719 -0.231 0.1106
TCNS 210 124 / 204 0.0378 0.688 0.160 0.2188
TCNS 211 173 / 204 -0.0050 0.150 -0.223 0.0476
TCNS 231 149 / 204 0.0407 0.754 0.219 0.0350
TCNS 243 84 / 204 -0.0023 0.134 -0.055 0.7009
TCNS 262 178 / 204 -0.0710 1.749 -0.462 0.0004
TCNS 263 166 / 204 -0.0397 1.488 -0.195 0.1599
TCNS 265 147 / 204 0.0014 0.340 0.027 0.8062
TCNS 277 151 / 204 -0.0765 1.806 -0.458 0.0005
TCNS 280 91 / 156 -0.3483 7.590 -0.452 0.0007
TCNS 281 107 / 168 -0.0255 0.739 -0.323 0.0114
Table 6. Seasonal Kendall Tau trend analyses of total phosphorus (TP) at monitoring stations
located on individual dairy farms for the period from 1991 to 2007.
(Bolded and italicized results indicate significant changes in concentrations)
a Number of samples indicates the total number of monthly values used in the analysis out of a total number
of possible samples for the period of record. b
Sen Slope estimator for the Seasonal Kendall Tau shows the change in concentration of a constituent per year. c p-Value <0.05 indicates that the Sen Slope is statistically significant

Lake Okeechobee Watershed Long-Term Water Quality Trends and BMPs Project
29
Table 7. Seasonal Kendall Tau trend analyses of phosphorus and nitrogen flow-weighted mean
concentrations at structures discharging to Lake Okeechobee
for the period from 1991 to 2007.
(Bolded and italicized results indicate significant changes in concentrations)
a Number of samples indicates the total number of monthly values used in the analysis out of a total
number of possible samples for the period of record. b Sen Slope estimator for the Seasonal Kendall Tau shows the change in concentration of a
constituent per year. c p- Value <0.05 indicates that the Sen Slope is statistically significant.
S65 S65A S65C S65D S65E S154 S191
Total Phosphorus
Number of Monthsa 159 / 204 191 / 204 196 / 204 194 / 204 193 / 204 121 / 204 176 / 204
Tau 0.393 0.317 0.363 0.199 0.008 -0.328 -0.079
Sen Slopeb 0.003 0.002 0.002 0.001 0.000 -0.028 -0.003
Intercept 0.037 0.041 0.041 0.051 0.083 0.792 0.507
p-Valuec 0.010 0.013 0.006 0.031 0.944 0.005 0.300
Total Nitrogen
Number of Monthsa 159 / 204 191 / 204 196 / 204 194 / 204 193 / 204 121 / 204 176 / 204
Tau 0.303 0.289 0.216 0.114 0.051 -0.065 0.143
Sen Slopeb 0.019 0.018 0.012 0.006 0.003 -0.005 0.012
Intercept 1.07 1.04 1.01 1.06 1.11 1.94 1.65
p-Valuec 0.018 0.005 0.048 0.175 0.488 0.610 0.181
Data SummariesStructures

Lake Okeechobee Watershed Long-Term Water Quality Trends and BMPs Project
30
Figure 1. Location of ambient water quality sampling stations where total phosphorus (TP) and
total nitrogen (TN) were collected in the tributary basins that drain into Lake Okeechobee
(triangles), sampling stations where TP data were collected at dairy outfalls (dots), and the
loading stations at the inflow structures (squares).

Lake Okeechobee Watershed Long-Term Water Quality Trends and BMPs Project
31
Figure 2. Box and whisker plot of total phosphorus (top) and total nitrogen (bottom)
concentrations for the periods 1991 – 2001 and 2002 – 2007.

Lake Okeechobee Watershed Long-Term Water Quality Trends and BMPs Project
32
KREA 07
KREA 08
KREA 10D
KREA 43A
KREA 46A
KREA 49
TCNS 210
TCNS 211
TCNS 231
TCNS 243
TCNS 262
TCNS 263
TCNS 265
TCNS 277
TCNS 280
TCNS 281
Monitoring Station
0.001
0.010
0.100
1.000
10.000
Tota
l P
hosp
horu
s (
mg
/L)
Figure 3. Box and whisker plot of total phosphorus concentrations for the periods 1991 – 2001
and 2002 – 2007 for monitoring stations located at individual dairy farms.

Lake Okeechobee Watershed Long-Term Water Quality Trends and BMPs Project
33
Figure 4. Seasonal Kendall trends and 12-month moving average plots of mean
monthly total phosphorus concentrations for the period 1991 – 2007.
1991
1993
1995
1997
1999
2001
2003
2005
2007
Mean T
ota
l P
hosphoru
s (
mg/L
)
0.0
0.5
1.0
1.5
1991
1993
1995
1997
1999
2001
2003
2005
2007
0.0
0.1
0.2
0.3
0.4
0.5
Monthly Mean
12-Month Moving Average
Trend Line
1991
1993
1995
1997
1999
2001
2003
2005
2007
0.0
0.1
0.2
0.3
0.4
0.5
1991
1993
1995
1997
1999
2001
2003
2005
2007
0.0
0.5
1.0
1.5
2.0
2.5
1991
1993
1995
1997
1999
2001
2003
2005
2007
0.0
0.5
1.0
1.5
2.0
1991
1993
1995
1997
1999
2001
2003
2005
2007
0.0
0.5
1.0
1.5
2.0
2.5
1991
1993
1995
1997
1999
2001
2003
2005
2007
0.0
1.0
2.0
3.0
4.0
S-65A S-65BC
S-65D S-65E
S-191NS
S-191TCS-154
SS = 0.003; intercept = 0.033
= 0.454; p = 0.0004
SS = 0.002; intercept = 0.057
= 0.202; p = 0.129
SS = 0.003; Intercept = 0.119
= 0.146; p = 0.222
SS = -0.001; Intercept = 0.030
= -0.017; p = 0.813
SS = -0.001; Intercept = 0.457
= -0.032; p = 0.661
SS = -0.046; Intercept = 1.469
= -0.319; p = 0.018
SS = -0.003; Intercept = 0.485
= -0.048; p = 0.597
Significant increase
Significant decrease
Sen Slope (SS) shows the change in concentration per year
is theTau statisticp or p-value indicates if the Sen Slope is statistically significant (p < 0.05)

Lake Okeechobee Watershed Long-Term Water Quality Trends and BMPs Project
34
Figure 5. Seasonal Kendall Tau trends and 12-month moving average plots of
mean monthly total nitrogen concentrations for the period 1991 – 2007.
1991
1993
1995
1997
1999
2001
2003
2005
2007
Mean T
ota
l N
itro
gen (
mg/L
)
0.0
1.0
2.0
3.0
4.0
5.0
1991
1993
1995
1997
1999
2001
2003
2005
2007
0.0
1.0
2.0
3.0
Monthly Mean
12-Month Moving Average
Trend Line
1991
1993
1995
1997
1999
2001
2003
2005
2007
0.0
1.0
2.0
3.0
1991
1993
1995
1997
1999
2001
2003
2005
2007
0.0
1.0
2.0
3.0
4.0
5.0
6.0
1991
1993
1995
1997
1999
2001
2003
2005
2007
0.0
2.0
4.0
6.0
8.0
1991
1993
1995
1997
1999
2001
2003
2005
2007
0.0
2.0
4.0
6.0
8.0
16.0
18.0
1991
1993
1995
1997
1999
2001
2003
2005
2007
0.0
2.0
4.0
6.0
8.0
S-65A S-65BC
S-65D S-65E
S-191NS
S-191TCS-154
Significant increase
SS = 0.006; Intercept = 1.175
= 0.082; p = 0.222
SS = -0.004; Intercept = 1.232
= -0.022; p = 0.840
SS = 0.030; Intercept = 1.095
= 0.296; p = 0.014
SS = 0.060; Intercept = 0.461
= 1.130; p = 0.004
SS = 0.012; Intercept = 1.915
= 0.088; p = 0.254
SS = 0.018; Intercept = 1.922
= 0.162; p = 0.018
SS = 0.188; Intercept = 1.481
= 0.088; p = 0.015
Significant increase
Significant increase Significant increase
Sen Slope (SS) shows the change inconcentration per year
is theTau statisticp or p-value indicates if the Sen Slope is statistically significant (p < 0.05)