Long-Term Study of Peripheral Feed/Peripheral Discharge Secondary Clarifiers
23
Long-Term Study of Peripheral Feed/Peripheral Discharge Secondary Clarifiers. By Alex Ekster and Cristina Pena San Jose/Santa Clara Water Pollution Control Plant (WPCP) ABSTRACT Long term study of peripheral feed, peripheral output clarifer was performed at the San Jose/Santa Clara Water Pollution Control Plant. The effect of eleven operational parameters on clarifier performance was analyzed. Results indicated that effluent TSS depends only on two parameters: overflow rate and temperature. An increase of overflow rate deteriorates effluent TSS due to an increase in the number of large heavy particles in the effluent probably caused by short-circuiting. A decrease of temperature increases effluent TSS due to a decrease of settling velocity, and an increase in fraction of non-settleable particles. The best prediction of clarifier failure can be achieved using overflow rate as an individual indicator with a prediction success of 33%. The use several operational parameters increases rate of prediction success up to 70%. KEY WORDS: Clarifier, TSS, testing, overflow rate. INTRODUCTION Secondary clarifier performance has a critical impact on effluent total suspended solids (TSS) and turbidity, and, as a result, has a major impact on the performance of the entire treatment plant. The purpose of these clarification studies was to optimize the performance of secondary (BNR) activated sludge clarifiers. Objectives The principal objectives of the parallel clarification studies were to:
-
Upload
independent -
Category
Documents
-
view
2 -
download
0
Transcript of Long-Term Study of Peripheral Feed/Peripheral Discharge Secondary Clarifiers

Long-Term Study of Peripheral Feed/Peripheral Discharge Secondary Clarifiers. By Alex Ekster and Cristina Pena
San Jose/Santa Clara Water Pollution Control Plant (WPCP)
ABSTRACT
Long term study of peripheral feed, peripheral output clarifer was performed at the San
Jose/Santa Clara Water Pollution Control Plant. The effect of eleven operational parameters on
clarifier performance was analyzed. Results indicated that effluent TSS depends only on two
parameters: overflow rate and temperature. An increase of overflow rate deteriorates effluent
TSS due to an increase in the number of large heavy particles in the effluent probably caused by
short-circuiting. A decrease of temperature increases effluent TSS due to a decrease of settling
velocity, and an increase in fraction of non-settleable particles. The best prediction of clarifier
failure can be achieved using overflow rate as an individual indicator with a prediction success
of 33%. The use several operational parameters increases rate of prediction success up to 70%.
KEY WORDS: Clarifier, TSS, testing, overflow rate.
INTRODUCTION
Secondary clarifier performance has a critical impact on effluent total suspended solids (TSS)
and turbidity, and, as a result, has a major impact on the performance of the entire treatment
plant. The purpose of these clarification studies was to optimize the performance of secondary
(BNR) activated sludge clarifiers.
Objectives
The principal objectives of the parallel clarification studies were to:

Determine conditions at which a clarifier fails.
Determine conditions at which clarifier effluent has minimum total suspended solids
concentration.
Determine conditions at which clarifier effluent turbidity does not exceed 5 NTU.
Clarifier performance was studied from 01/22/96 to 6/9/97. It consisted of long-term testing and
short-term stress experiments. The purpose of the long-term testing program was to investigate
the performance of the clarifier at various flows, different sludge settling characteristics, and
different temperatures.
The purpose of short term testing was to study the performance of the clarifier at various flows
with constant sludge settling characteristics and constant temperature.
METHODS AND MATERIALS
The design of the clarifier used in this study, the variables examined, the physical measurements,
the sampling and analysis protocols, and the database developed for this study are described
briefly in the following discussion.
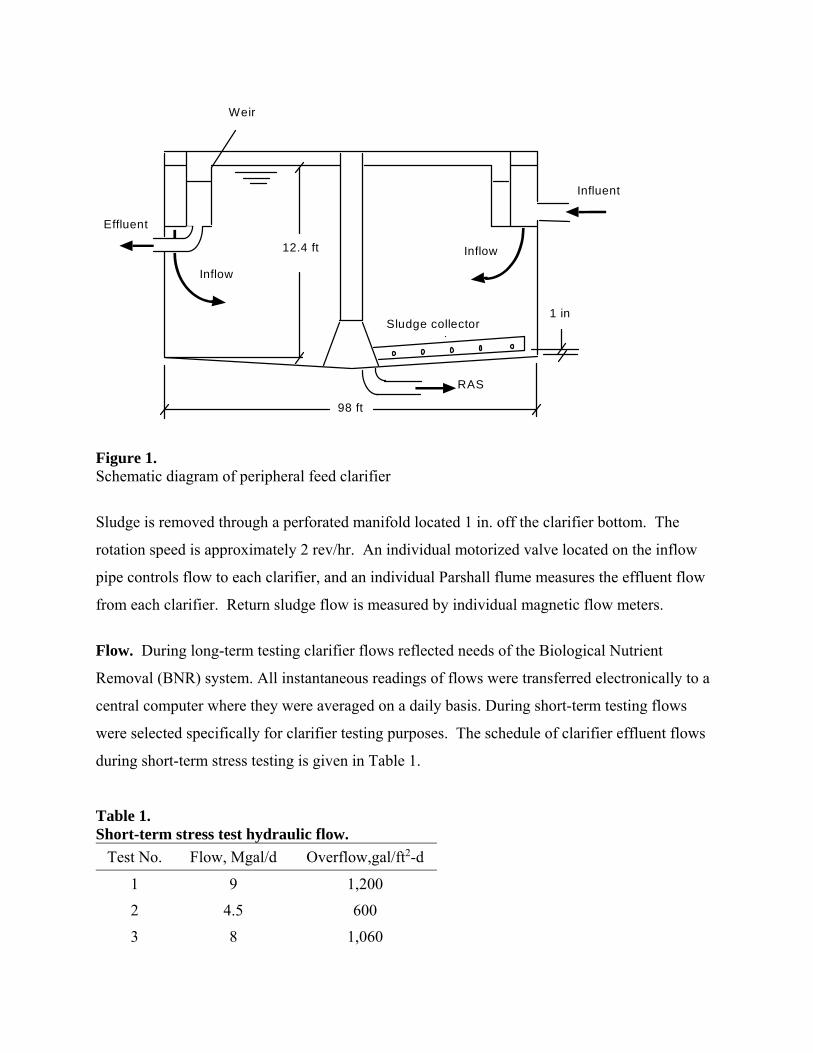
Clarifier design. The clarifier used in this study is peripheral feed, peripheral discharge type
with a 98-ft diameter and 12-ft side water depth (see Figure 1).
Inflow
Inflow
Sludge collector
Influent
Effluent
Weir
98 ft
12.4 ft
1 in
RAS
Figure 1. Schematic diagram of peripheral feed clarifier
Sludge is removed through a perforated manifold located 1 in. off the clarifier bottom. The
rotation speed is approximately 2 rev/hr. An individual motorized valve located on the inflow
pipe controls flow to each clarifier, and an individual Parshall flume measures the effluent flow
from each clarifier. Return sludge flow is measured by individual magnetic flow meters.
Flow. During long-term testing clarifier flows reflected needs of the Biological Nutrient
Removal (BNR) system. All instantaneous readings of flows were transferred electronically to a
central computer where they were averaged on a daily basis. During short-term testing flows
were selected specifically for clarifier testing purposes. The schedule of clarifier effluent flows
during short-term stress testing is given in Table 1.
Table 1. Short-term stress test hydraulic flow.
Test No. Flow, Mgal/d Overflow,gal/ft2-d
1 9 1,200
2 4.5 600
3 8 1,060

4 4 530
5 7 930
6 3.5 465
Clarifier testing for each flow rate during short-term testing was started 24 hours after the flow
rate was changed.
Sampling and analytical procedures. Water temperature was measured continuously and was
averaged on a daily basis. In addition, once a month, a depth temperature profile was measured
using a thermopair. Mixed liquor samples were collected and analyzed for MLSS and SVI twice
a day and the results were averaged on a daily basis. MLSS concentration was measured initially
(until 3/96) using gravimetric analysis (Standard Methods, Sections 2540D AWWA, 1992) and
then by a suspended solids meter (Royce INC. Model 7011). SVI was measured using the sludge
volume index method (Standard Methods, Section 2710D, AWWA, 1992). Clarifier effluent
samples were collected using 24-hour composite samplers (ISCO Model 2910). The 24-hour
composite effluent samples were collected at midnight and analyzed for total suspended solids
(TSS). In addition several “ultimate” TSS tests were performed during the course of the study.
In this test, effluent was settled in a jar for 30 minutes and the supernatant was sampled and
analyzed for TSS. The purpose of this test was to determine flocculation ability of the activated
sludge.
The aforementioned sampling and analytical procedures were used during both long-term and
short-term testing. During short-term testing, ultimate effluent TSS was determined, and particle

sizes of effluent solids were measured. Turbidity was measured using Cole-Palmer turbidity
meter model 8391-50. A Met One particle counter (model WGS-267) was used to determine the
distribution of effluent particles during short-term experiments. The manufacturer calibrated the
particle counter every 12 months using standardized polystyrene latex spheres. Particles in grab
samples were counted within one hour of collection. To reduce the possibility of contamination,
the particle counter was cleaned thoroughly with deionized water before and after testing each
sample. Sample flow through the particle counter was kept at manufacturer’s suggested flow
rate of 100 ml/min and was verified before testing each sample. During analysis, particles were
kept in suspension by employing a gentle swirling motion in the sample container. Each sample
was counted in 5 replicates. If the difference between replicate counts was more than 10%, the
sample was re-analyzed. The volume of the particles was determined by assuming that
individual particles were spherical in shape. The volume distribution of particles was calculated
by multiplying the total number of particles found in a size range by the spherical volume of that
particular range size. The size ranges were chosen according to manufacturer’s calibration. A
dye tracer test was performed on the secondary clarifier in order to determine the hydraulic
residence time using a fluorometer with continuous flow (Turner Design Model 10-AU).
Rodamine WT fluorescent dye was injected at the clarifier influent channel and the concentration
was monitored at the clarifier effluent channel as a function of time.
Independent variables. To examine clarifier operation during long-term testing, a database of
all of the parameters that could potentially affect performance of the clarifiers was compiled.
The list of parameters is given in Table 2.

Table 2 List of parameters that can potentially affect performance of the clarifier.
Parameter
Variable
Effect on clarification was discussed in following
reference
Effluent Flow Q Daigger, 1995
Settled Volume Index SVI Daigger, 1995
Mixed Liquor Suspended Solids concentration
MLSS Daigger, 1995
Solids load including recycle flow L Tekippe, Bender 1983
Solids load without recycle flow L1 Tekippe, Bender 1983
Sludge recycle ratio R Tekippe, Bender 1983
Temperature T Wilson, 1996
Q/Qo1 Q/Qo Daigger, 1995
Settling volume2 SV Voutchkov, 1992
Air flow F Parker et al,1972
1 Qo = VoA, where Vo is the initial settling velocity calculated according to
Daigger(1995), and A is the clarifier surface area. 2 SV = SVI x MLSS/1000
Results of long-term testing comprised 494 data sets (one set for each day of testing). After the
database was assembled, outliers were identified for the following parameters: effluent total
suspended solids (TSS) and MLSS. The following method was used for identifying outliers. The
average absolute difference, (|Bav|), between corresponding consecutive 24 hr composites was
calculated for the entire database. The potential outliers were identified based on the following
criteria:
1) IBi|>|Bav|
2) |Bi+1 |>|Bav|
3) Bi and Bi+1have different signs
where Bi is the difference between two consecutive samples.

The operating conditions, on the day when a potential outlier was identified, were compared with
conditions on the previous three days and the following three days. If effluent flow, return
sludge rate, and the sludge wasting rates did not change by more than ten percent on the day
when a potential MLSS outlier was identified, the MLSS and SVI values were considered as
errors and were removed from the data base. Similarly, TSS outliers were eliminated from the
database if, in addition to Q, R and waste rates, MLSS, SVI, and F did not change by more than
ten percent. It was recognized that some of the TSS outliers could be real values associated with
conditions such as the presence of foam, algae, or floating sludge. However, the presence of
these values in the data base would be misleading in developing true relationship between TSS
and independent variables listed in Table 2. Less than 5 percent of TSS and MLSS data were
removed from the database.
Next, the database was divided into two parts based on effluent TSS values: below and above 30
mg/L. Values below 30 mg/L represent performance of unfailed clarifier. The 30 mg/L
threshold was chosen, based on the analysis of the Voutchkov’s (1992) data produced in similar
studies. Occurrences when effluent TSS exceeded 30 mg/L were considered to be the result of
clarifier failure, and were analyzed separately.
Using the statistical computer software JMP, a correlation between TSS and Q, Q/Qo, SVI,
MLTSS, F , T, L, L1 was developed from the database containing effluent TSS values less than
30 mg/L. Before performing the statistical analysis the relationships between the function and
each individual independent variable were examined by plotting the TSS versus each
independent variable. The purpose of this examination was to determine whether the

relationship is homogenous. Except for SVI, the relationship was homogeneous for all
parameters. The SVI-TSS relationship was homogeneous only within 50 to 150 mL/g SVI
range(see Figure 2), and only this range of SVI was used in statistical analysis.
0
2
4
6
8
10
12
14
<50 50-100 100-150 >150
Med
ian
efflu
ent
TS
S, m
g/L
SVI, mL/g
Figure 2. Effluent TSS versus SVI.
After dividing the database, a multivariable linear regression analysis was used to develop the
relationship between TSS and the independent variables. The objective of this analysis was to
select the regression model which best satisfied the following two criteria: minimizing the
number of independent variables and maximizing the predictive power of the mode. Each
variable was examined to determine its contribution toward explaining TSS variability. Stepwise
regression analysis described elsewhere (Chapman, 1983) was used for this purpose. Realizing
that the TSS may be affected by other variables than those mentioned in Table 2, and that some
of these variables such as foam, floating sludge, floc structure, etc. may introduce autocorrelation

properties into statistical relationships, prior day effluent suspended solids concentration was
used as an independent variable.
Clarifier failure was assumed whenever effluent TSS exceeded 30 mg/L. Independent variables
such as Q, L1, Q/Qo were considered separately as predictors of clarifier failure. Minimum
values of each independent variable at which TSS >30 mg/L were considered to be critical
values. After critical values were established, percent failures were calculated by comparing the
total number of days that the independent variable exceeded critical value with the total number
of days when TSS >30mg/L. Higher percent of failure indicates better predictor.
RESULTS
Long term testing
Clarifier operational parameters are given in Table 3.
Table 3. Range of change for various operations parameters used to evaluate the performance of the clarifiers.
Parameter Q, gpd/ft2
SVI, mL/g
MLSS, mg/L
L, lb/ft2 L1, lb/ft2 R, % T, oF Q/Qo F, ft3/gal
SV, mL/L
TSS, mg/L
Minimum 260 50 2000 11 5.5 22 65 0.23 1.2 170 3
Maximum 1200 150 4390 54 36 108 79 1.34 4.9 890 102
Average 710 115 2940 26 17 50 72 0.58 1.6 360 10
Median 720 106 3020 27 17 50 71 0.51 1.6 310 8
10 percentile 520 76 2480 18 12 36 67 0.32 1.4 210 5
90 percentile 860 138 3800 34 24 67 77 0.98 1.8 590 14
The only three parameters that affected suspended solids concentration were temperature
(student coefficient t = -13.03), overflow rate (student t = 13.29), and settling volume (student t =

3.23). The regression coefficient without autocorrelation was 0.64, with autocorrelation the
regression coefficient was 0.8. The contribution of each variable to the improvement of the
correlation coefficient ( R) is reported in Table 4.
Table 4. Contribution of each statistically significant variable to the improvement of the correlation coefficient( R).
Parameter Cumulative R
Q 0.31
T 0.61
SV 0.64
All other parameters listed in Table 2 did not have a statistically significant effect on the TSS.
There was also no change in temperature with clarifier depth either in winter or in summer.
There were a total of 5 days when effluent suspended solids exceeded 30 mg/L. The critical
values of the independent variables were Q = 8.3 Mgal/d (1,100 gal/ft2d), L = 37 lb/ft2, and
Q/Qo = 0.73. The flow could be used as a failure predictor 33 percent of the time, load (L) 6
percent of the time, and Q/Qo 5 percent of the time.
During long-term testing several ultimate TSS tests were performed. The data showed that
ultimate TSS observed in the beginning of the mixed liquor channel, the end of the mixed liquor
channel and in the clarifier effluent were the same.
There were forty-five incidents when instantaneous effluent turbidity exceeded 5.0 NTU. Less
than ten percent of these cases were associated with high overflow rate. The critical overflow

rate for these cases was 980 gal/ft2d. All other incidents when the effluent turbidity exceeded
5.0 NTU were associated with Nocardia foaming and the presence of pin flocs.
Short term testing
The results from the short-term testing program are given in Table 5.
Table 5.
Operational parameters during short-term testing.
Test # Q,
gpd/ft2 SVI, mL/g
MLSS, mg/L
L1, lb/ft2
L, lb/ft2 R,% T, oF Q/Qo
SV, mL/L
TSS, mg/L
TSS1,
mg/L
1 1,200 100 2,600 24 31 30 71 0.77 260 17 -
2 600 87 2,500 13 21 56 71 0.44 220 12 3
3 1,060 91 2,500 23 30 30 71 0.7 220 25 5
4 530 95 2,400 10 17 65 72 0.45 240 4 3
5 930 98 2,400 18 25 40 72 0.56 240 9 3
6 465 84 2,500 10 17 70 72 0.3 250 9 2
TSS1 - after settling in a jar for 30 min (ultimate TSS)
Because the short-term stress test was conducted over a three-week period, settling
characteristics and temperature remained constant throughout the test.
Particle counting. The distributions of particles for two flow rates (465 gpd/ft2 and 1,200
gpd/ft2) are depicted on Figure 3. For both flow rates the majority of particles were less than 15
μm in diameter. Particle distributions for Tests 2 through 5 (not shown) followed the same
distribution trend.

1
10
100
1000
104
0 20 40 60 80 100
465 gpd/ft21200 gpd/ft2
Num
ber
of P
artic
les
Particle Size, um
Figure 3. Distribution of particles in the clarifier effluent at high and low overflow rates.
DISCUSSION
Long term testing
The results obtained in this study are examined in the following discussion, with respect to
correlation and the effect of the individual variables.
Correlation coefficient. The correlations described in the results section only explain 41% of
effluent variability without autocorrelation and 64% with autocorrelation. The average error of
the predicted value was 1.7 mg/L, which is less than the expected laboratory error of 1.8 mg/L as
determined by Tuntoolavest et. al. (1983) of an average value of 10 mg/L. Therefore, it can be

concluded that the significant part of TSS variation is caused by the inaccuracy of the
gravimetric analytical method.
Effect of individual independent variables. The effect of overflow rate on effluent suspended
solids is well known. Less expected was the strong relationship between temperature and
effluent quality. One explanation for the strong relationship could be attributed to the change of
particle settling velocity with the temperature as calculated by Bhargava and Rajagopal (1992).
Analyzing Bhargava and Rajagopal data within the temperature range observed in our study, it
was found that individual particle settling velocity increases by 1.5% with each oF increase.
Based on this finding, the overflow rate was multiplied by the correction factor expressed by
Equation 1:
Correction factor = [1-0.015(T - 68oF)] (1)
where T is temperature, oF
The coefficient of regression between TSS and corrected overflow rate was 0.48. Although the
coefficient of regression for the corrected overflow rate value (0.48) was better than the
coefficient of regression for the non-corrected overflow rate value (0.3), it was still below the
coefficient of regression existing for the relationship in which both temperature and overflow
rate are considered as shown in Table 6.

Table 6. Relationship with Effluent Total Suspended Solids
Relationship with TSS Corrected factor Coefficient of Regression
Non-corrected overflow rate - 0.3
Corrected overflow rate 1.5%(oF) 0.48
Corrected overflow rate 4.3%(oF) 0.61
Temperature and overflow rate - 0.61
Based on the results of the above analysis it can be concluded that an increase of individual
particle settling velocity alone cannot explain the strong correlation between temperature and
effluent suspended solids. Winter storms and Nocardia foaming observed in winter and
springtime coincided with the period of low temperature. During this time, the range of ultimate
TSS increased from 2-3 mg/L(summer) to 5-6 mg/L. We postulate that the strong correlation
between effluent TSS and temperature presented in Table 6 is caused not only by a decrease of
settling velocity at lower temperature, but also with the increase of non-settleable TSS in the
winter. The best correlation between TSS and corrected overflow rate was found when the
correction factor was equal to 4.3 percent for each oF. The correlation coefficient was equal to
0.61. The effect of the temperature corrected overflow rate on the median effluent suspended
solids is shown on Figure 4. As shown in Figure 4, the median value of TSS is not affected until
overflow rate reaches 650 gal/ft2d. The average TSS, as shown in Figure 5, starts to increase at
lower overflow rate. This difference in behavior between the median and average TSS indicates
that incidents of temporary increase of TSS are less frequent at overflow rates below 550
gal/ft2d.

0
2
4
6
8
10
12
14
450-550 551-650 651-750 751-850 851-950
Eff
luen
t TS
S, m
g/L
Overflow rate, gal/ft2-d
Figure 4
Effect of overflow rate normalized for 68oF on median clarifier effluent TSS
0
2
4
6
8
10
12
14
450-550 551-650 651-750 751-850 851-950
Eff
luen
t TS
S, m
g/L
Overflow rate, gal/ft2-d
Figure 5
Effect of overflow rate normalized for 68oF on average clarifier effluent TSS.
The effect of settling volume on effluent quality, although statistically significant, is less
pronounced than the effect of overflow rate. These results are consistent with Voutchkov’s
(1992) results developed under conditions comparable to this study.
The absence of any relationship between other parameters listed in Table 2 and effluent
suspended solids may indicate that the effect of these parameters on effluent quality is site
specific, and needs to be analyzed for each activated sludge system. Literature presents varying
opinions regarding the relative magnitude of the effect of these parameters on TSS. For instance
Tuntoolavest et. al. (1983) and Pfalnz (1969) reported a strong relationship between TSS and
MLSS. Chapman (1983) found that a relationship existed, but the correlation was not very
strong, but his findings were contrary to the findings of Agnew (1972) and Villiers (1967).
Similarly, Tuntoolavest et al. (1983) and Parker et. al.(1972) found strong effect of air flow on
TSS, whereas Chapman (1983) observed none. Similar contradictions can be found regarding
other parameters listed in Table 2. Parker presented the data that indicated overflow rate in a
well design clarifier doesn’t affect effluent TSS, whereas Wilson has an opposite opinion (Parker
and Wilson, 1998). The reason we observed strong effect of overflow rate on the effluent TSS in
this study is probably due to short-circuiting in the clarifier. A dye study showed (see Figure 6)
that dye was first observed in the effluent in less than 20 minutes after initial dye injection into
mixed liquor and reached the maximum concentration in 1 hour 12 minutes. The theoretical
residence time was 2.25 hours. This data clearly indicates the presence of short-circuiting, which
is usually intensified with an increase of overflow-rate. Zhou and Vitasovic(1995) predicted
short-circuiting based on 2-D modeling of the peripheral feed-peripheral outtake clarifiers and
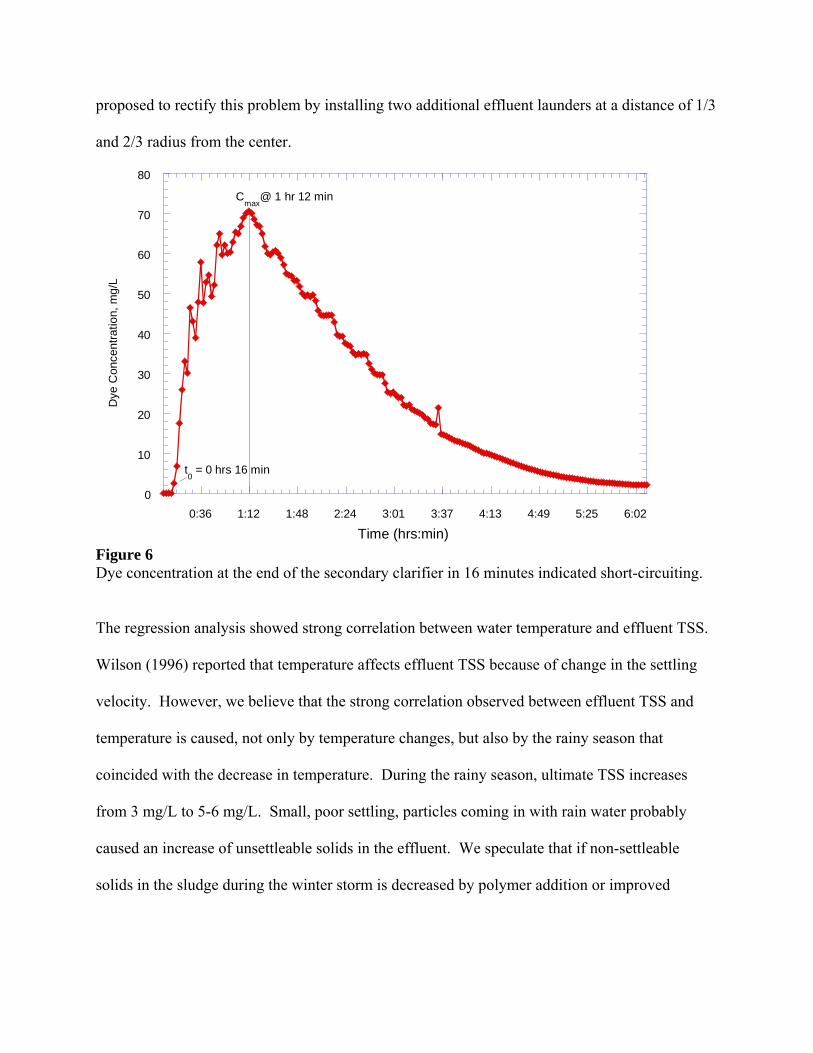
proposed to rectify this problem by installing two additional effluent launders at a distance of 1/3
and 2/3 radius from the center.
0
10
20
30
40
50
60
70
80
0:36 1:12 1:48 2:24 3:01 3:37 4:13 4:49 5:25 6:02
Dye
Con
cent
ratio
n, m
g/L
Time (hrs:min)
t0 = 0 hrs 16 min
Cmax
@ 1 hr 12 min
Figure 6 Dye concentration at the end of the secondary clarifier in 16 minutes indicated short-circuiting.
The regression analysis showed strong correlation between water temperature and effluent TSS.
Wilson (1996) reported that temperature affects effluent TSS because of change in the settling
velocity. However, we believe that the strong correlation observed between effluent TSS and
temperature is caused, not only by temperature changes, but also by the rainy season that
coincided with the decrease in temperature. During the rainy season, ultimate TSS increases
from 3 mg/L to 5-6 mg/L. Small, poor settling, particles coming in with rain water probably
caused an increase of unsettleable solids in the effluent. We speculate that if non-settleable
solids in the sludge during the winter storm is decreased by polymer addition or improved

flocculation, for example, the correlation between effluent TSS and temperature will not be as
strong.
Interestingly enough, no changes were observed in ultimate TSS from the aerator and clarifier
effluent. This indicates that there is no break-up of floc, neither in the mixed liquor channel nor
in the clarifier. At the same time, there is no additional flocculation observed in the clarifier,
which is probably due to the absence of a flocculation chamber in the clarifier. The fact that the
number of small particles (<10 μm) in the effluent is not affected by the flow, serves as another
indication that clarification process in this type of clarifier does not change fraction of non-
settleable solids.
When comparing the results presented in this report with the results reported in the literature, the
following points need to be taken into account.
The database in this study is much larger than databases used in most clarifier studies
reported in literature.
This study was conducted in an industrial setting; the majority of other studies were
conducted in research settings, with much smaller and shallower clarifiers.
The clarifier feed in this study was peripheral, in most studies reported in literature the
clarifiers were of the center feed type.
The average effluent suspended solids concentration in this study was considerably lower
than in other studies.
The airflow rate in this study varied considerably less than in other studies.

Taken together, all of these factors may explain the differences in the results.
Clarifier failure. Clarifier failure was best predicted using overflow rate as a predictive
parameter. However, use of the overflow rate as a predictor was successful only 33 percent of
the time. The overflow rate was corrected according to the following formula Qx[1-0.043 (T -
68)]. The critical corrected overflow rate value was found to be 1,100 gal/ft2d. When the
corrected overflow rate was used as a predictor the prediction success increased up to 50 percent.
In all cases, when the temperature corrected overflow rate exceeded a critical value, the TSS
exceeded 15 mg/L, which corresponds to the upper 10 percent of the observed TSS values.
When two indicators (temperature corrected overflow rate and Q/Qo) were used, the prediction
increased up to 70 percent. In all cases when the temperature corrected overflow rate exceeded
critical value (1100 gal/ft2d) and Q/Qo exceeded critical value (0.72), the effluent suspended
solids exceeded 22 mg/L, which corresponds to the upper 2.5 percent of the observed TSS
values. When Q/Qo was normalized for the temperature, the failure predictability did not
improve. The fact that a correlation could not be established between clarifier failure and
clarifier loading could probably be explained by short circuiting; an increase of solids in the
clarifier effluent happened before the clarifier was overloaded with solids.
Short-Term Testing
An increase of clarifier overflow rate generally did not affect the number of particles with
diameters below 10 μm, but increased the number of particles with diameters greater than 10 μm.
The effect of the overflow rate became more pronounced as the particle diameter became larger
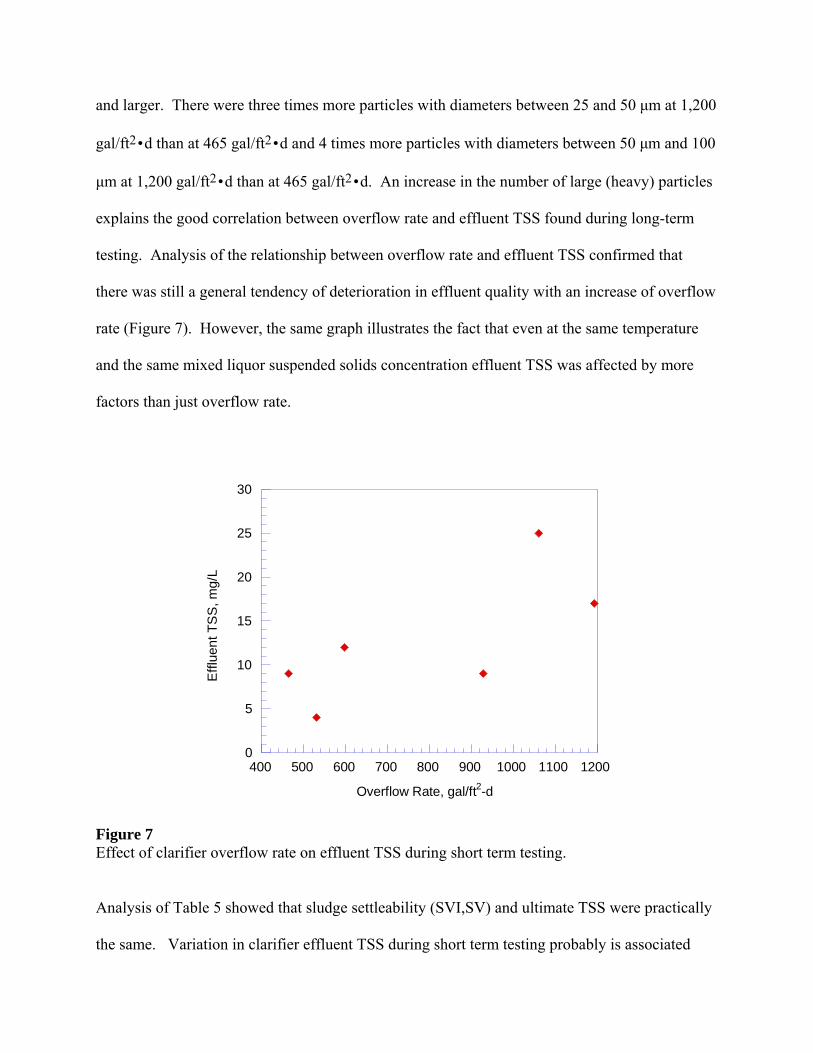
and larger. There were three times more particles with diameters between 25 and 50 μm at 1,200
gal/ft2•d than at 465 gal/ft2•d and 4 times more particles with diameters between 50 μm and 100
μm at 1,200 gal/ft2•d than at 465 gal/ft2•d. An increase in the number of large (heavy) particles
explains the good correlation between overflow rate and effluent TSS found during long-term
testing. Analysis of the relationship between overflow rate and effluent TSS confirmed that
there was still a general tendency of deterioration in effluent quality with an increase of overflow
rate (Figure 7). However, the same graph illustrates the fact that even at the same temperature
and the same mixed liquor suspended solids concentration effluent TSS was affected by more
factors than just overflow rate.
0
5
10
15
20
25
30
400 500 600 700 800 900 1000 1100 1200
Eff
luen
t TS
S, m
g/L
Overflow Rate, gal/ft2-d
Figure 7 Effect of clarifier overflow rate on effluent TSS during short term testing.
Analysis of Table 5 showed that sludge settleability (SVI,SV) and ultimate TSS were practically
the same. Variation in clarifier effluent TSS during short term testing probably is associated

with more factors that are depicted in Table 5. Inaccuracy of gravimetric method of TSS
analysis is one of such factor. Short-circuiting, wind, and other factors affecting hydraulic
performance of the clarifier feasibly are contributing to the variability of effluent TSS. Inability
to consider all parameters that may affect clarifier effluent TSS generally reduces efficiency of
short-term testing, because some of the results may be incidental and do not reflect long-term
clarifier performance. Combination of short-term stress testing and long-term testing provides
better opportunity for evaluation of clarifier performance.
Conclusion
The overflow rate (Student t = 13.29) and water temperature (student t =-13.03) had
significant statistical correlation with effluent suspended solids. The settling volume
(Student t = 3.23) had considerably less effect on TSS, although still statistically significant.
All other parameters listed in Table 2 did not have a statistically significant effect on TSS.
Ultimate TSS did not change through mixed liquor channel and clarifier. This indicates that
no floc breakup nor flocculation occurs in these process units. At the same time a
considerable increase in ultimate and effluent TSS was observed during the rainy season.
The fact that rainy season coincided with the low temperature may explain the reason why
statistical analysis showed higher than expected effect of temperature on effluent TSS.
The lowest TSS value was achieved when overflow rate was below 550 gal/ft2d. An
increase of overflow rate deteriorates effluent TSS due to an increase in the number of large
heavy particles in the effluent probably caused by short-circuiting.
The best prediction of clarifier failure can be achieved using overflow rate as an individual
indicator with a prediction success of 33%. If overflow rate was normalized for temperature
using Equation 1 and used with another indicator Q/Qo, the prediction success rate increases
to 70%. The critical values for the overflow rate and Q/Qo are 1100 gal/ft2d and 0.72,
respectively.
At overflow rate below 1000 gal/ ft2d, incidents of instantaneous turbidity readings
exceeding 5 NTU will be reduced. However, the most important preventive measures
against turbidity increase are foaming control and the prevention of pin floc formation.
REFERENCES
1. Agnew, R. W. (1972) “A Mathematical Model of a Final Clarifier for the Activated Sludge Process.” EPA Report No 17090 FJW 02/72.
2. AWWA. (1992) Standard Methods for the Examination of Water and Wastewater, APHA, AWWA, WEF.
3. Bhargava, D. S. and K. Rajagopal (1992) "An Integrated Expression for Settling Velocity of Particles in Water." Wat.Res. Vol.26, No.7, pp1005-1008
4. Chapman. D. (1983) “The Influence of Process Variables on Secondary Clarification,” Journal Water Pollution Control Federation, Vol. 55, No.12. pp 1425-1433.
5. Daigger, G. (1995) “Development of Refined Clarifier Operating Diagrams Using an Updated Settling Characteristics Database,” Water Environment Research , Vol. 67, No. 1, pp 95-100.
6. Parker D. S. et .al., (1971) “Physical Conditioning of Activated Sludge Floc." Journal Water Pollution Control Federation, Vol. 43, pp. 1817.
7. Parker, D. S. et. al., (1972). “Floc Breakup in Turbulent Flocculation Processes." J.Sanit. Eng. Div., Proc. Am. Soc. Civ. Eng. SA1, 78.
8. Parker,D.S. and Wilson, T.E. (1998) “The Great Secondary Clarifier Debate: I. Surface Overflow Rate is Not an Appropriate Design Criterion For Dimensioning Secondary Clarifiers.” Wat.Env.Fed. Proceedings of the Water Environment Federation 71st Annual Conference & Exposition.
9. Pflanz, P. (1969) "Performance of Secondary Sedimentation Basins." Proc 4th Int. Wtr. Pollut Res. Conf., Pergamon Press Ltd., 569.
10. Tekippe, R. and J.H. Bender (1987) "Activated Sludge Clarifiers: Design Requirements and Research Priorities," Journal Water Pollution control Federation, Vol. 59, No. 10, pp. 865-870.

11. Tuntoolsvest, M., E. Miller, and C. P. Grady (1983) "Factors Affecting the Clarification Performance of Activated Sludge Final Settlers," Journal Water Pollution Control Federation,, Vol 55, No.3, pp. 234-247.
12. Villiers, R. V. (1967) "Removal of Organic Carbon from Domestic Wastewaters." M.S. Thesis, Univ. of Cincinnati, Cincinnati Ohio.
13. Voutchkov, N. S. (1992) "Relationship for Clarification Efficiency of Circular Secondary Clarifiers." Water science and Technology, Vol. 26, No. 9-11, pp 2539-2542.
14. Wilson, T. E. (1996) "A New Approach to Interpreting Settling Data." Proc. Wat. Env. Fed. 69th Annual Conference & Exposition, Vol. 1, pp491-497.1996.
15. Zhou and Vitasovic. Memorandum on Clarifier Modeling. August 17,1995.