Long-term scenarios for black and organic carbon emissions
11
Rao S, Riahi K, Kupiainen K, Klimont Z (2005). Long-term scenarios for black and organic carbon emissions . Environmental Sciences, 2(2-3):205-216 (June-September) [2005]. DOI: 10.1080/15693430500397228. Long-Term Scenarios for Black and Organic Carbon Emissions Shilpa Rao, Keywan Riahi, Kaarle Kupiainen, Zbigniew Klimont International Institute of Applied Systems Analysis, Laxenburg, Austria Keywords: Black and Organic Carbon emissions, long-term scenarios, climate stabilization, co- benefits ABSTRACT: This paper presents estimates of fossil-fuel and biomass related black and organic carbon aerosols for two IPCC SRES families-A2 and B1. The analysis uses the latest available inventory data for these pollutants and examines their development within the context of chang- ing worlds and varying assumptions on long-term technological change. We also examine the implications of long-term climate stabilization scenarios for these pollutants and potential syner- gies between overall CO 2 reductions and the corresponding reductions in carbonaceous particles. The analysis is carried out using a bottom-up modeling framework and focuses on the contribu- tions from various sector-specific activities to emissions and future reductions. The results show that there are significant co-benefits that result from local air pollution policies targeting aerosols and long-term mitigation measures aimed at reducing CO 2 emissions, especially in the transpor- tation and residential sectors. The assumptions on technological change and associated reduc- tions in emission factors in these sectors are shown to largely drive the long-term trends in black and organic carbon aerosols. 1 INTRODUCTION Carbonaceous particles are composed of numerous organic compounds (OC) and black or elemen- tal carbon (BC), and are found in high concentrations especially in the submicron size range (e.g. Gray & Cass 1998). BC and OC are mainly formed by incomplete combustion of fossil fuels and biomass as well as from gaseous precursors through nucleation and condensation processes (Penner et al., 1993). Black carbon and organic carbon particles have been linked with adverse health effects. Mar et al. (2000) observed a significant association with cardiovascular mortality and elemental carbon parti- cles. In addition, various climatic effects have been attributed to BC & OC particles. The "direct ef- fect" refers to the light scattering and absorption of solar radiation by aerosols. Carbon aerosols (particularly OC) scatter light back to space thus acting to reduce the warming caused by GHGs. In contrast, BC has recently received much attention because of its properties in absorbing solar radia- tion and it is suspected to be a significant factor in warming the climate (Hansen et al., 2000; Ja- cobson, 2001). The net climatic effect of reducing the emissions of BC and OC is ambiguous until at least the relative amounts of BC and OC are known (Bond et al., 2004). Climatologists are now
Transcript of Long-term scenarios for black and organic carbon emissions
Rao S, Riahi K, Kupiainen K, Klimont Z (2005). Long-term scenarios for black and organic carbon emissions. Environmental Sciences, 2(2-3):205-216 (June-September) [2005]. DOI: 10.1080/15693430500397228.
Long-Term Scenarios for Black and Organic Carbon Emissions
Shilpa Rao, Keywan Riahi, Kaarle Kupiainen, Zbigniew Klimont International Institute of Applied Systems Analysis, Laxenburg, Austria
Keywords: Black and Organic Carbon emissions, long-term scenarios, climate stabilization, co-benefits
ABSTRACT: This paper presents estimates of fossil-fuel and biomass related black and organic carbon aerosols for two IPCC SRES families-A2 and B1. The analysis uses the latest available inventory data for these pollutants and examines their development within the context of chang-ing worlds and varying assumptions on long-term technological change. We also examine the implications of long-term climate stabilization scenarios for these pollutants and potential syner-gies between overall CO2 reductions and the corresponding reductions in carbonaceous particles. The analysis is carried out using a bottom-up modeling framework and focuses on the contribu-tions from various sector-specific activities to emissions and future reductions. The results show that there are significant co-benefits that result from local air pollution policies targeting aerosols and long-term mitigation measures aimed at reducing CO2 emissions, especially in the transpor-tation and residential sectors. The assumptions on technological change and associated reduc-tions in emission factors in these sectors are shown to largely drive the long-term trends in black and organic carbon aerosols.
1 INTRODUCTION
Carbonaceous particles are composed of numerous organic compounds (OC) and black or elemen-tal carbon (BC), and are found in high concentrations especially in the submicron size range (e.g. Gray & Cass 1998). BC and OC are mainly formed by incomplete combustion of fossil fuels and biomass as well as from gaseous precursors through nucleation and condensation processes (Penner et al., 1993).
Black carbon and organic carbon particles have been linked with adverse health effects. Mar et al. (2000) observed a significant association with cardiovascular mortality and elemental carbon parti-cles. In addition, various climatic effects have been attributed to BC & OC particles. The "direct ef-fect" refers to the light scattering and absorption of solar radiation by aerosols. Carbon aerosols (particularly OC) scatter light back to space thus acting to reduce the warming caused by GHGs. In contrast, BC has recently received much attention because of its properties in absorbing solar radia-tion and it is suspected to be a significant factor in warming the climate (Hansen et al., 2000; Ja-cobson, 2001). The net climatic effect of reducing the emissions of BC and OC is ambiguous until at least the relative amounts of BC and OC are known (Bond et al., 2004). Climatologists are now

Rao S, Riahi K, Kupiainen K, Klimont Z (2005). Long-term scenarios for black and organic carbon emissions. Environmental Sciences, 2(2-3):205-216 (June-September) [2005]. DOI: 10.1080/15693430500397228.
working towards better understanding and quantification of these effects in order to estimate their net impact on global climate change.
The main anthropogenic sources of BC and OC emissions include fossil-fuel combustion, biomass and agriculture waste burning. Natural sources like forest fires and savannah burning are other ma-jor contributors. Use of traditional fuels and poor combustion technologies, especially in develop-ing countries results in significant BC and OC emissions. For example, the combustion of solid biofuels-such as wood, agricultural waste, and dried animal manure in cooking stoves-is the largest source of BC emissions in India (Venkataraman et al., 2005). The lack of standardized methods for measurement of these particles and poor information on penetration of specific combustion techniques (e.g., amount and type of fuel burned in stoves, boil-ers, etc.) have been the main cause of the unavailability of reliable data for these emissions and the subsequent simplified representations in climate models. In the past, the IPCC Third Assessment Report presented long-term projections of BC and OC that were developed by scaling present-day emission estimates using projections of CO emissions (IPCC, 2001). Recently, a handful of global emission inventories of BC and OC have become available (e.g., Penner et al., 1993; Cooke & Wil-son, 1996; Cooke et al., 1999, Bond et al., 2004; ). Most climate models use the inventories as they are distributed, while some account for economic growth by applying the published emission fac-tors to other fuel-use data (e.g. Chung and Seinfeld, 2002; Liousse et al., 1996). This has opened up a need for identifying consistent and comprehensive long-term trajectories of BC and OC emis-sions that fully account for the transitions in the energy system, technological change and the im-pacts of both short and long-term policies. This in turn will be of use to climate modelers who can explore the climatic impacts of these emissions and their contribution to global warming. In addi-tion, long-term climate policies that target greenhouse gases like CO2 and short-term air pollution policies for particulate matter (PM), NOX, CO and NMVOC (non-methane volatile organic com-pounds) may have ancillary benefits for BC and OC emissions. Streets et al (2004) presented a first model-based forecast of BC and OC emissions using the fuel use projections and assumptions on technological change in the IPCC scenarios exogenously to cal-culate the resulting emissions from both contained combustion from fossil fuels and biomass as well as natural sources until 2050. While this approach accounts for fuel-transitions and techno-logical change embodied in the scenarios, it does not account for potential synergies that may exist between GHGs, local pollutants and aerosol emissions. Our analysis uses existing inventory data and develops initial estimates for BC and OC emissions for this century for two IPCC SRES sce-narios- A2 and B1 (IPCC 2000). We use a bottom-up modeling framework and are able to examine the dynamic effects of various interactions like fuel-shifts, rate of technological progress and envi-ronmental constraints on these emissions. We also account for current and proposed legislation tar-geting other air pollutants. In addition, we develop long-term climate mitigation scenarios and ex-amine the potential co-benefits that may exist for BC and OC emissions under climate constraints. 2. SCENARIOS We use two scenarios A2 and B1 as baselines to provide qualitative storylines for the basis of this analysis. These scenarios are based on a range of assumptions on driving forces like demographic and economic development as well as other influencing forces like, institutional frameworks and technological change and describe alternate futures that may evolve leading to different global greenhouse gas (GHG) emissions (IPCC 2000). The storylines of these scenarios can be very briefly described as follows:
• A2: a differentiated world with increasing population; and fragmented economic growth and slow technological change.
• B1: a convergent world with emphasis on global solutions to economic, social and envi-ronmental sustainability
2
Rao S, Riahi K, Kupiainen K, Klimont Z (2005). Long-term scenarios for black and organic carbon emissions. Environmental Sciences, 2(2-3):205-216 (June-September) [2005]. DOI: 10.1080/15693430500397228.
We choose these two very divergent worlds to emphasize the range of possible future trajectories for BC and OC emissions. In order to examine the potential for reduction of these emissions in the long run, we further impose a radiative forcing constraint of 4.5 W/m2 for both scenarios. This is a multigas constraint imposed on all GHG emissions and does not assume any additional policies di-rected at BC and OC emissions (only short-term policies for other pollutants like PM, NOX and CO). Table 1 shows some of the important characteristics of the two scenarios. While these scenar-ios are representative of the original IPCC quantification, assumptions on GDP and population have been updated, to reflect recent new information (Gruebler et al., 2005). A comprehensive summary of main emissions drivers (GDP and population), primary energy development, as well as emissions of all gases is given in the appendix to this paper. Due to space limitations the data ap-pendix can be found at http://www.iiasa.ac.at/Research/GGI/publications/Raoetal2005/
Table 1: Main Scenario assumptions 2000 A2 (2100) B1 (2100) Population (billion) 6 12 7 GDP (trillion US2000$ - mer) 33 250 400 Energy productivity growth slow rapid Energy demand 190 EJ 1000 EJ 550 EJ
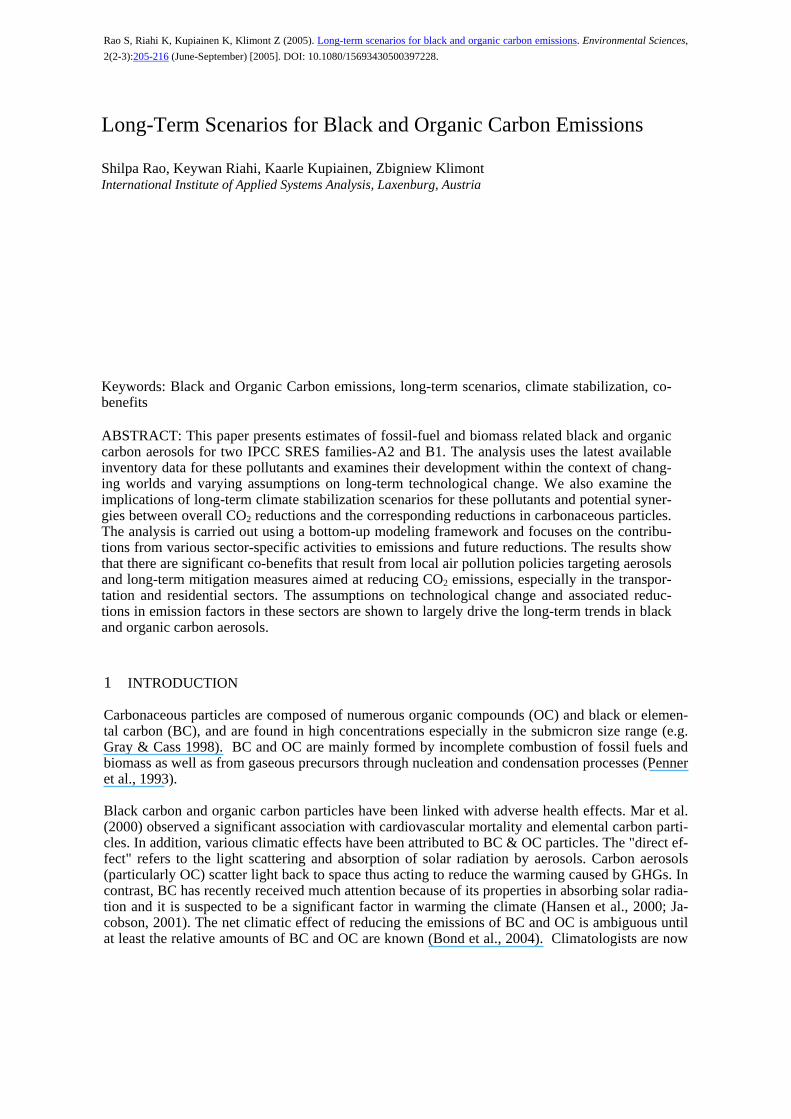
3. DATA AND METHODOLOGY This study mainly uses MESSAGE, (Messner and Strubegger, 1995) for the long-term emissions pathways until 2000-2100. MESSAGE is a bottom-up systems engineering model based on a least cost optimization framework. The model maps the entire energy system with all its interdependen-cies from resource extraction, imports and exports, conversion, transport and distribution to end-use services. It is a long-term global model (11 regions) with a time horizon of a century (1990-2100). It includes all six Kyoto gases (CO2, CH4, N2O, SF6, CF4 and HFCs) as well as local pollut-ants like SOX and NOX (Rao and Riahi, 2005). The base set of BC and OC emission factors was derived from Bond et al. (2004); global inventory for BC and OC emissions from fossil fuel and biofuel combustion. In view of the large uncertain-ties prevailing in the estimates, the inventory provides ranges of emissions with estimates of ‘best-guess’ values. We adopt these best-guess estimates to develop aggregated sector and region spe-cific emission coefficients for the year 2000 in MESSAGE (for simplification we used data from Bond et al 2004 as a base). This involved aggregation of activity (e.g., various fuels) and technol-ogy (e.g., type of combustion technique, penetration of control technology) into MESSAGE fuels and sectors as well as regional aggregation, where needed. We include fossil fuel and biomass combustion in residential, industrial, transportation and electricity sectors. Natural sources like for-est fires, savannah burning etc. are not included in this analysis. The resulting BC and OC emis-sions are shown in Figure 2. The residential sector is a dominant source of both pollutants. Ineffi-cient cooking stoves and widespread use of biomass in rural households, especially in developing countries, is the main contributor to these emissions. Diesel engines used in the transportation sec-tor are the next largest contributor; especially important for BC emissions. The resulting BC and OC emissions are shown in Figure 1.
Fig 1: Sources of BC and OC emissions in 2000 (data based on Bond et al. 2004)
Power
1%Industry22%
Residential47%
Transport30%
Residential70%
Transport15%
Industry14%
Power1%
3
Rao S, Riahi K, Kupiainen K, Klimont Z (2005). Long-term scenarios for black and organic carbon emissions. Environmental Sciences, 2(2-3):205-216 (June-September) [2005]. DOI: 10.1080/15693430500397228.
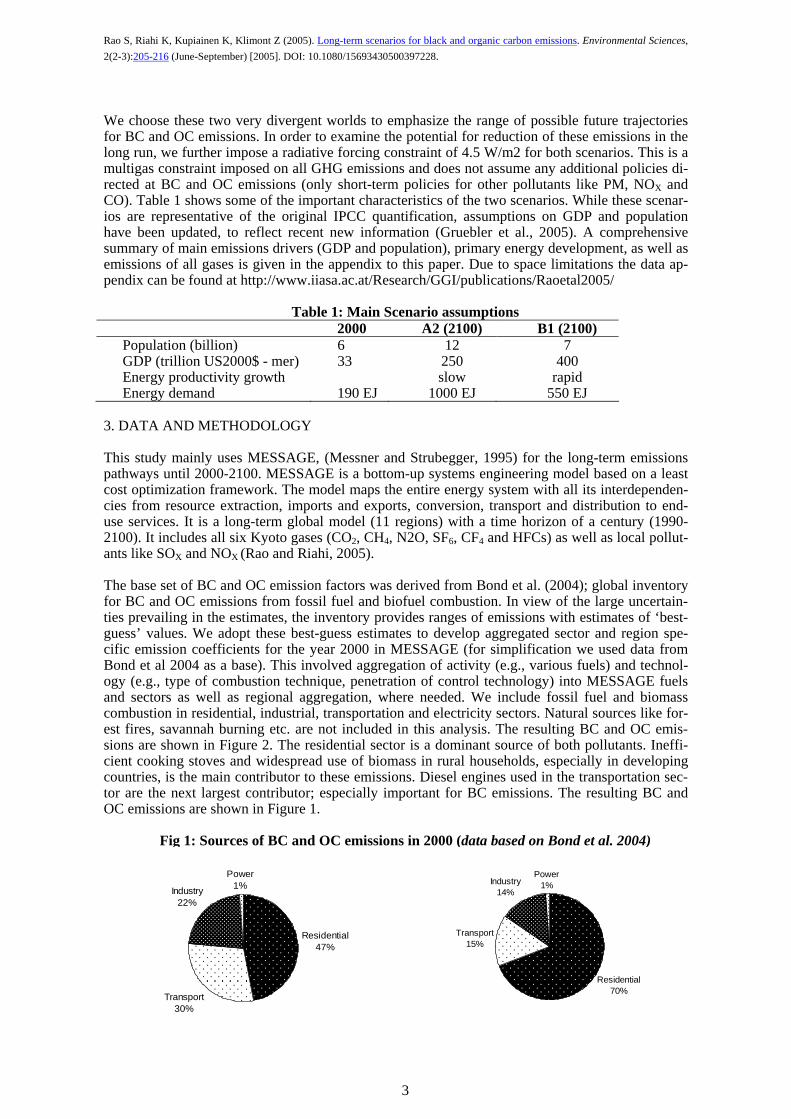
In order to project the short-term trends (2000-2030) in MESSAGE emission coefficients, data from the RAINS model (Klimont et al., 2002; Kupiainen & Klimont, 2004) was used (similar ag-gregation as used earlier to develop the 2000 emission coefficients was performed). The RAINS model (http://www.iiasa.ac.at/rains) combines national perspectives on sectoral economic devel-opment with emission factors that describe the technical features of the emission sources, consider-ing their change over time resulting from country- and sector-specific emission control legislation. Development of future emission factors involved assumptions about the future penetration of con-trol technologies for specific sector categories in given regions. Such assumptions were developed from the published reviews of current legislation (e.g., CONCAWE, 2001), legislation acts avail-able from the European Community website, national information collected during the consultation process within the CAFE1 program as well as development of the RAINS-Asia model (IIASA, 2001). It is important to note that none of these short-term policies specifically target BC or OC emissions. The dispersed and complex nature of these emissions makes formulation of specific mitigation technologies for BC and OC emissions a very difficult task. So instead, general emis-sions standards (usually aimed at other pollutants like PM, CO and NOX) were used to capture pos-sible short-term trends in BC and OC.
Fig 2: Example of BC emission coefficient development for oil-based transportation
0.00
0.40
0.80
1.20
1.60
2.00
2000 2010 2020 2030 2040 2050 2060 2070 2080 2090 2100
kg/K
Wyr
North America
Western Europe
Eastern Europe
South Asia
Central Asia
Latin America
Africa
Middle East
Legislations Convergence based on GDP/capita
0.00
0.40
0.80
1.20
1.60
2.00
2000 2010 2020 2030 2040 2050 2060 2070 2080 2090 2100
kg/K
Wyr
North America
Western Europe
Eastern Europe
South Asia
Central Asia
Latin America
Africa
Middle East
Legislations Convergence based on GDP/capita
In the long term (2030-2100), emission factors are expected to improve as technology improve-ments occur. There are various assumptions on drivers that one can use as proxies for the nature, timing and diffusion of such future technology improvements. Some examples include ecological-controls; ‘pollutant burden’ control scenarios etc. (see Grübler, 1999 for detailed discussion). For our analysis, we assume that the factors decline based on GDP/capita of the different regions in the various IPCC SRES scenarios. This is based on the ‘environmental Kuznets curve’ hypothesis, which states that while pollution levels initially rise they eventually decline as incomes increase. While specific historical data for BC and OC emissions is not available, we use the Smith (2005) detailed analysis of the relationship between future income levels and sulfur dioxide (SO2) emis-sion levels as a basis for our assumptions. We argue that as incomes increase in the future (espe-cially in developing countries), there will be transitions to cleaner fuels, greater attention to local air quality and adoption of technologies with better environmental performance. While this ap-proach does not fully capture specific combustion technology improvements that are especially im-portant for BC and OC emissions in the long run, it serves to approximate such shifts through im-plicit assumptions on technological change. Figure 2 shows an example of the emission factor development path for oil-based transportation for the different regions in the A2 scenario.
1 Clean Air For Europe program
4
Rao S, Riahi K, Kupiainen K, Klimont Z (2005). Long-term scenarios for black and organic carbon emissions. Environmental Sciences, 2(2-3):205-216 (June-September) [2005]. DOI: 10.1080/15693430500397228.
4. RESULTS
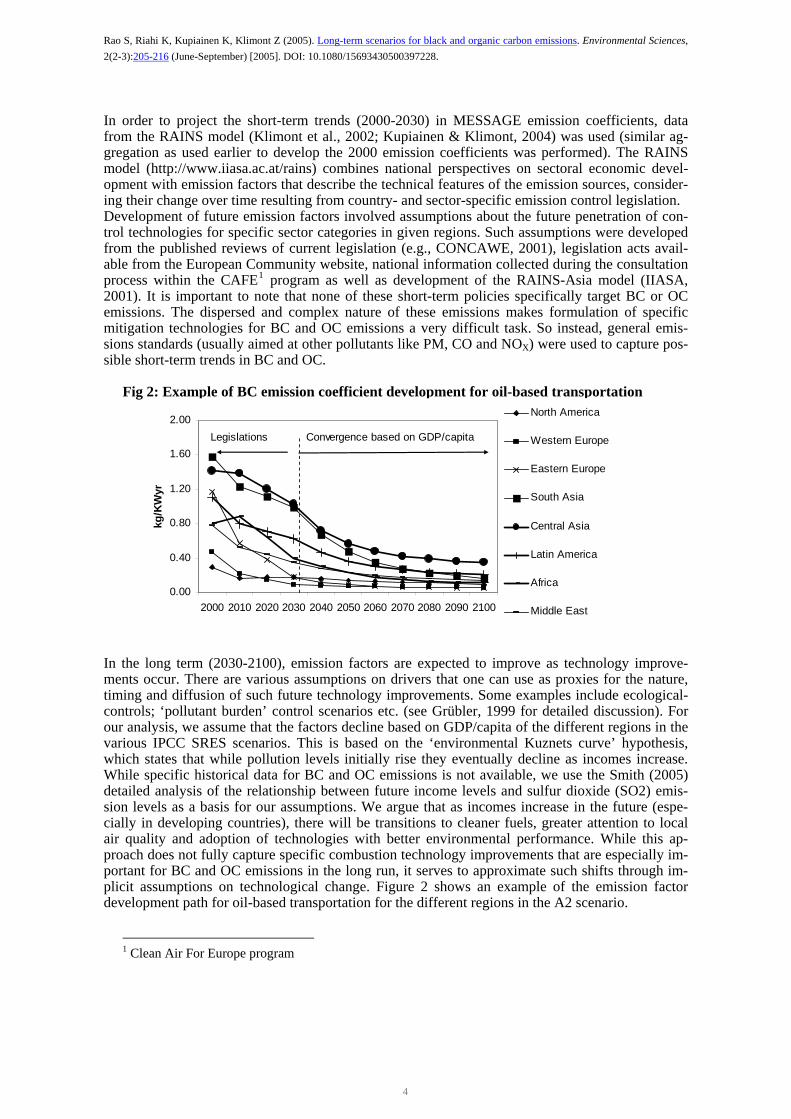
The discussed scenarios differ greatly with respect to energy demand (Table 1) and hence also the resulting fuel mix and fossil and biomass related CO2 emissions (Figure 3). While biomass and natural gas continue to play an important role in both scenarios, synthetic fuels like methanol and ethanol as well as hydrogen (H2) become important in the second half of the century, especially in the B1. In the A2 scenario, coal continues to dominate the energy mix leading to CO2 emissions of 33 gigatons of carbon (GtC) in 2100; almost a six-fold increase compared to 2000. In contrast, the low energy demand B2 scenario has a large share of renewables and hydrogen, leading to a low carbon future of around 3.5 GtC.
Fig 3: World Primary Energy and Carbon Emissions (2000-2100) Primary Energy (GWyr) CO2 Emissions (MtC)
A2
0
10000
20000
30000
0
5000
10000
15000
20000
25000
30000
2000
2010
2020
2030
2040
2050
2060
2070
2080
2090
2100
MtC
B1A2
0
5000
10000
15000
20000
25000
30000
2000
2010
2020
2030
2040
2050
2060
2070
2080
2090
2100
MtC
B1A2
40yr 000
50000
60000
70000
1990 2000 2010 2020 2030 2040 2050 2060 2070 2080 2090
GW
Coal Oil Gas Nuclear RenEl (incl. H2, on-site) Biomass
B1
0
5000
10000
15000
20000
25000
30000
35000
1990 2000 2010 2020 2030 2040 2050 2060 2070 2080 2090
GW
yr
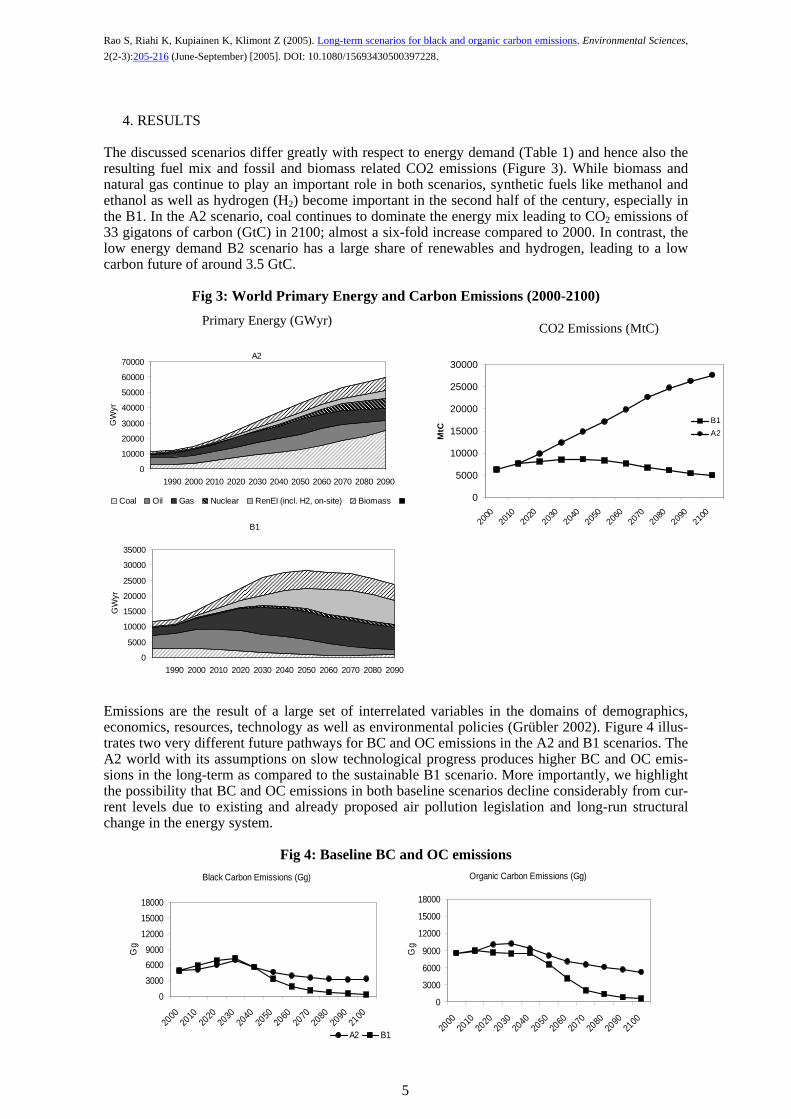
Emissions are the result of a large set of interrelated variables in the domains of demographics, economics, resources, technology as well as environmental policies (Grübler 2002). Figure 4 illus-trates two very different future pathways for BC and OC emissions in the A2 and B1 scenarios. The A2 world with its assumptions on slow technological progress produces higher BC and OC emis-sions in the long-term as compared to the sustainable B1 scenario. More importantly, we highlight the possibility that BC and OC emissions in both baseline scenarios decline considerably from cur-rent levels due to existing and already proposed air pollution legislation and long-run structural change in the energy system.
Fig 4: Baseline BC and OC emissions Black Carbon Emissions (Gg)
60009000
12000
1500018000
Gg
0
3000
2000
2010
2020
2030
2040
2050
2060
2070
2080
2090
2100
B1
Organic Carbon Emissions (Gg)
9000
12000
15000
18000
Gg
0
3000
6000
2000
2010
2020
2030
2040
2050
2060
2070
2080
2090
2100
A2
5
Rao S, Riahi K, Kupiainen K, Klimont Z (2005). Long-term scenarios for black and organic carbon emissions. Environmental Sciences, 2(2-3):205-216 (June-September) [2005]. DOI: 10.1080/15693430500397228.
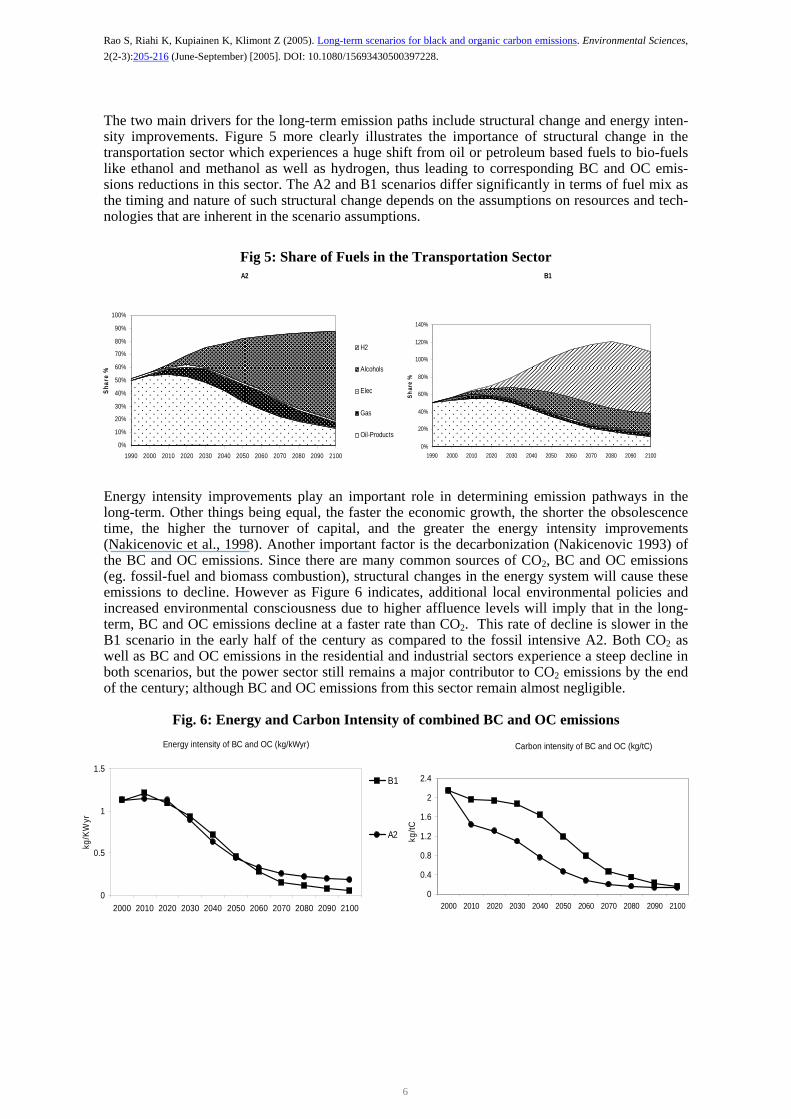
The two main drivers for the long-term emission paths include structural change and energy inten-sity improvements. Figure 5 more clearly illustrates the importance of structural change in the transportation sector which experiences a huge shift from oil or petroleum based fuels to bio-fuels like ethanol and methanol as well as hydrogen, thus leading to corresponding BC and OC emis-sions reductions in this sector. The A2 and B1 scenarios differ significantly in terms of fuel mix as the timing and nature of such structural change depends on the assumptions on resources and tech-nologies that are inherent in the scenario assumptions.
Fig 5: Share of Fuels in the Transportation Sector
A2
0%
10%
20%
30%
40%
50%
60%
70%
80%
90%
100%
1990 2000 2010 2020 2030 2040 2050 2060 2070 2080 2090 2100
B1
0%
20%
40%
60%
80%
100%
120%
140%
1990 2000 2010 2020 2030 2040 2050 2060 2070 2080 2090 2100
Shar
e %
H2
Alcohols
Energy intensity improvements play an important role in determining emission pathways in the long-term. Other things being equal, the faster the economic growth, the shorter the obsolescence time, the higher the turnover of capital, and the greater the energy intensity improvements (Nakicenovic et al., 1998). Another important factor is the decarbonization (Nakicenovic 1993) of the BC and OC emissions. Since there are many common sources of CO2, BC and OC emissions (eg. fossil-fuel and biomass combustion), structural changes in the energy system will cause these emissions to decline. However as Figure 6 indicates, additional local environmental policies and increased environmental consciousness due to higher affluence levels will imply that in the long-term, BC and OC emissions decline at a faster rate than CO2. This rate of decline is slower in the B1 scenario in the early half of the century as compared to the fossil intensive A2. Both CO2 as well as BC and OC emissions in the residential and industrial sectors experience a steep decline in both scenarios, but the power sector still remains a major contributor to CO2 emissions by the end of the century; although BC and OC emissions from this sector remain almost negligible.
Fig. 6: Energy and Carbon Intensity of combined BC and OC emissions
Shar
e %
Elec
Gas
Oil-Products
Energy intensity of BC and OC (kg/kWyr)
0
0.5
1
1.5
2000 2010 2020 2030 2040 2050 2060 2070 2080 2090 2100
kg/K
Wyr
B1
A2
Carbon intensity of BC and OC (kg/tC)
0
0.4
0.8
1.2
1.6
2
2.4
2000 2010 2020 2030 2040 2050 2060 2070 2080 2090 2100
kg/tC
6
Rao S, Riahi K, Kupiainen K, Klimont Z (2005). Long-term scenarios for black and organic carbon emissions. Environmental Sciences, 2(2-3):205-216 (June-September) [2005]. DOI: 10.1080/15693430500397228.
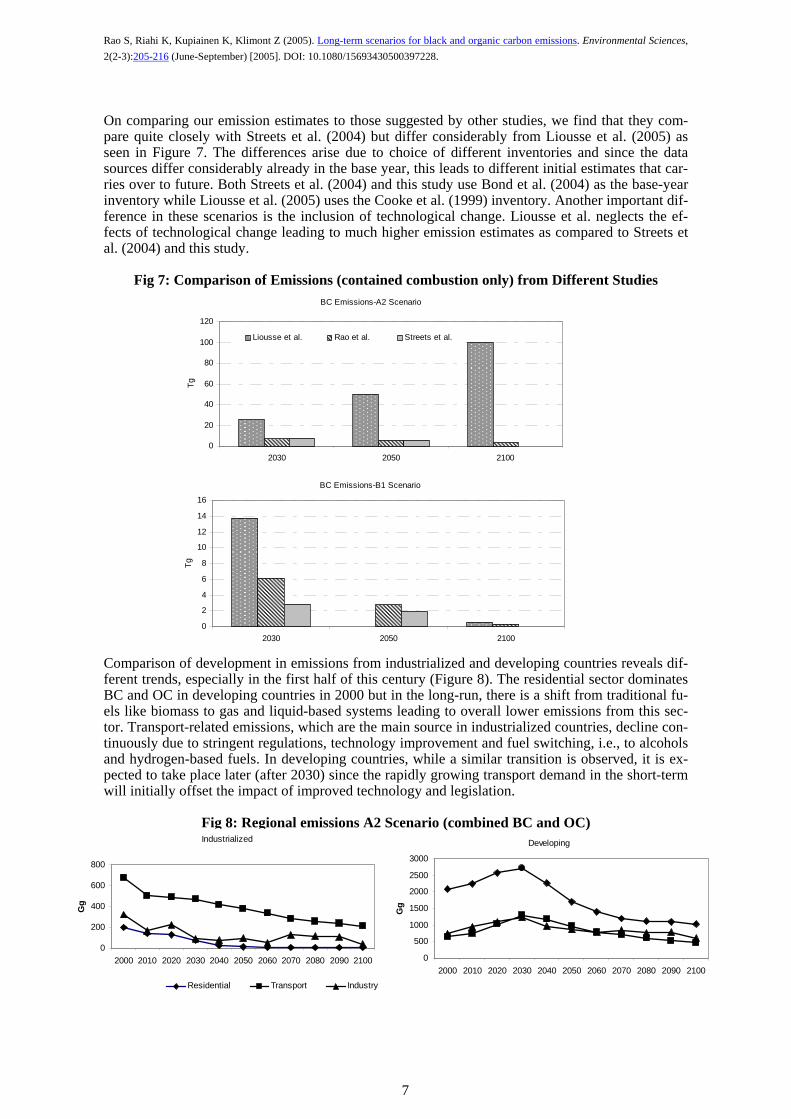
On comparing our emission estimates to those suggested by other studies, we find that they com-pare quite closely with Streets et al. (2004) but differ considerably from Liousse et al. (2005) as seen in Figure 7. The differences arise due to choice of different inventories and since the data sources differ considerably already in the base year, this leads to different initial estimates that car-ries over to future. Both Streets et al. (2004) and this study use Bond et al. (2004) as the base-year inventory while Liousse et al. (2005) uses the Cooke et al. (1999) inventory. Another important dif-ference in these scenarios is the inclusion of technological change. Liousse et al. neglects the ef-fects of technological change leading to much higher emission estimates as compared to Streets et al. (2004) and this study.
Fig 7: Comparison of Emissions (contained combustion only) from Different Studies
BC Emissions-A2 Scenario
0
20
40
60
80
100
120
2030 2050 2100
Tg
Liousse et al. Rao et al. Streets et al.
BC Emissions-B1 Scenario
0
2
4
6
8
10
12
14
16
2030 2050 2100
Tg
Comparison of development in emissions from industrialized and developing countries reveals dif-ferent trends, especially in the first half of this century (Figure 8). The residential sector dominates BC and OC in developing countries in 2000 but in the long-run, there is a shift from traditional fu-els like biomass to gas and liquid-based systems leading to overall lower emissions from this sec-tor. Transport-related emissions, which are the main source in industrialized countries, decline con-tinuously due to stringent regulations, technology improvement and fuel switching, i.e., to alcohols and hydrogen-based fuels. In developing countries, while a similar transition is observed, it is ex-pected to take place later (after 2030) since the rapidly growing transport demand in the short-term will initially offset the impact of improved technology and legislation.
Fig 8: Regional emissions A2 Scenario (combined BC and OC)
Industrialized
0
200
400
600
800
2000 2010 2020 2030 2040 2050 2060 2070 2080 2090 2100
Gg
Industry
Developing
0
500
1000
1500
2000
2500
3000
Gg
2000 2010 2020 2030 2040 2050 2060 2070 2080 2090 2100
Residential Transport
7
Rao S, Riahi K, Kupiainen K, Klimont Z (2005). Long-term scenarios for black and organic carbon emissions. Environmental Sciences, 2(2-3):205-216 (June-September) [2005]. DOI: 10.1080/15693430500397228.
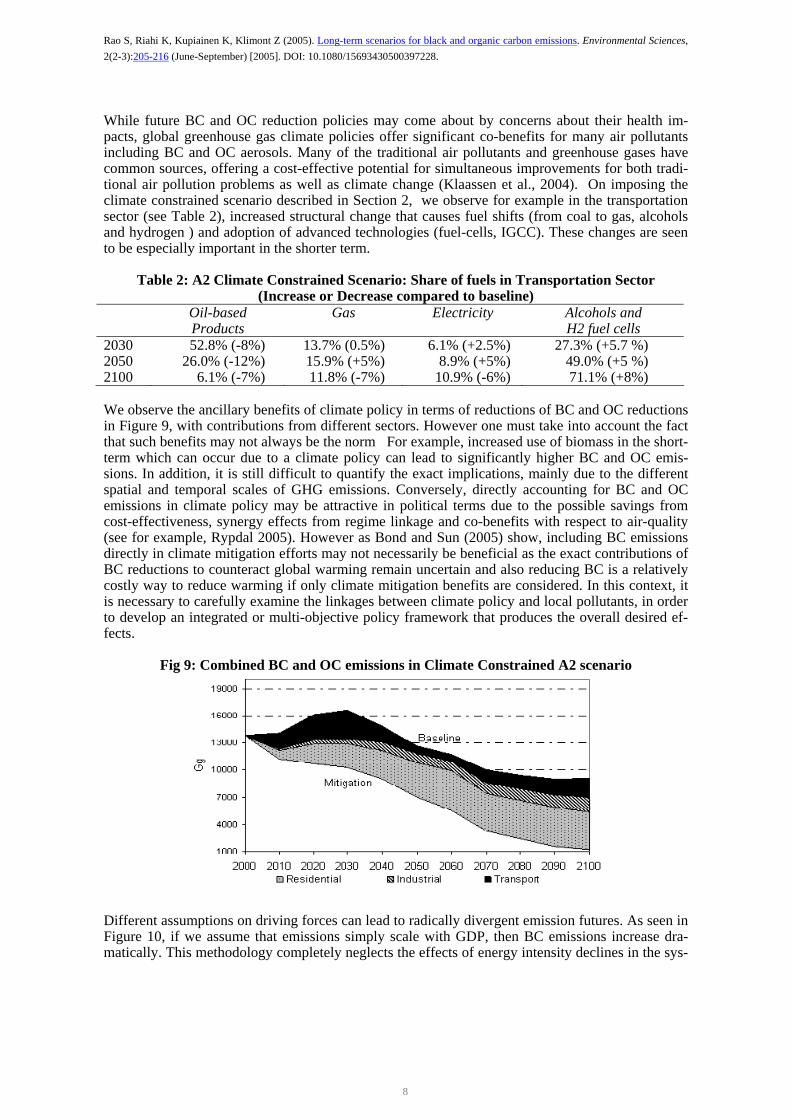
While future BC and OC reduction policies may come about by concerns about their health im-pacts, global greenhouse gas climate policies offer significant co-benefits for many air pollutants including BC and OC aerosols. Many of the traditional air pollutants and greenhouse gases have common sources, offering a cost-effective potential for simultaneous improvements for both tradi-tional air pollution problems as well as climate change (Klaassen et al., 2004). On imposing the climate constrained scenario described in Section 2, we observe for example in the transportation sector (see Table 2), increased structural change that causes fuel shifts (from coal to gas, alcohols and hydrogen ) and adoption of advanced technologies (fuel-cells, IGCC). These changes are seen to be especially important in the shorter term.
Table 2: A2 Climate Constrained Scenario: Share of fuels in Transportation Sector (Increase or Decrease compared to baseline)
Oil-based Products
Gas Electricity Alcohols and H2 fuel cells
2030 52.8% (-8%) 13.7% (0.5%) 6.1% (+2.5%) 27.3% (+5.7 %) 2050 26.0% (-12%) 15.9% (+5%) 8.9% (+5%) 49.0% (+5 %) 2100 6.1% (-7%) 11.8% (-7%) 10.9% (-6%) 71.1% (+8%) We observe the ancillary benefits of climate policy in terms of reductions of BC and OC reductions in Figure 9, with contributions from different sectors. However one must take into account the fact that such benefits may not always be the norm For example, increased use of biomass in the short-term which can occur due to a climate policy can lead to significantly higher BC and OC emis-sions. In addition, it is still difficult to quantify the exact implications, mainly due to the different spatial and temporal scales of GHG emissions. Conversely, directly accounting for BC and OC emissions in climate policy may be attractive in political terms due to the possible savings from cost-effectiveness, synergy effects from regime linkage and co-benefits with respect to air-quality (see for example, Rypdal 2005). However as Bond and Sun (2005) show, including BC emissions directly in climate mitigation efforts may not necessarily be beneficial as the exact contributions of BC reductions to counteract global warming remain uncertain and also reducing BC is a relatively costly way to reduce warming if only climate mitigation benefits are considered. In this context, it is necessary to carefully examine the linkages between climate policy and local pollutants, in order to develop an integrated or multi-objective policy framework that produces the overall desired ef-fects.
Fig 9: Combined BC and OC emissions in Climate Constrained A2 scenario
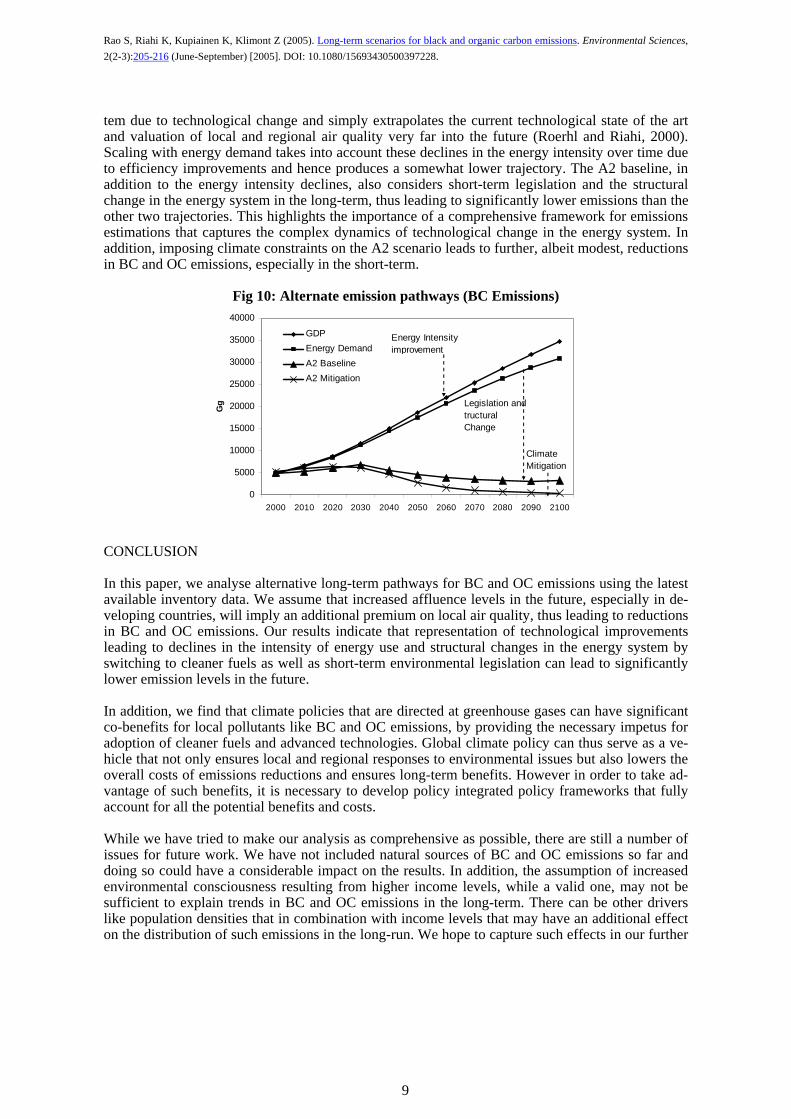
Different assumptions on driving forces can lead to radically divergent emission futures. As seen in Figure 10, if we assume that emissions simply scale with GDP, then BC emissions increase dra-matically. This methodology completely neglects the effects of energy intensity declines in the sys-
8
Rao S, Riahi K, Kupiainen K, Klimont Z (2005). Long-term scenarios for black and organic carbon emissions. Environmental Sciences, 2(2-3):205-216 (June-September) [2005]. DOI: 10.1080/15693430500397228.
tem due to technological change and simply extrapolates the current technological state of the art and valuation of local and regional air quality very far into the future (Roerhl and Riahi, 2000). Scaling with energy demand takes into account these declines in the energy intensity over time due to efficiency improvements and hence produces a somewhat lower trajectory. The A2 baseline, in addition to the energy intensity declines, also considers short-term legislation and the structural change in the energy system in the long-term, thus leading to significantly lower emissions than the other two trajectories. This highlights the importance of a comprehensive framework for emissions estimations that captures the complex dynamics of technological change in the energy system. In addition, imposing climate constraints on the A2 scenario leads to further, albeit modest, reductions in BC and OC emissions, especially in the short-term.
Fig 10: Alternate emission pathways (BC Emissions)
0
5000
10000
15000
20000
25000
30000
35000
40000
2000 2010 2020 2030 2040 2050 2060 2070 2080 2090 2100
Gg
GDPEnergy DemandA2 BaselineA2 Mitigation
Legislation and tructural Change
Energy Intensity improvement
Climate Mitigation
0
5000
10000
15000
20000
25000
30000
35000
40000
2000 2010 2020 2030 2040 2050 2060 2070 2080 2090 2100
Gg
GDPEnergy DemandA2 BaselineA2 Mitigation
Legislation and tructural Change
Energy Intensity improvement
Climate Mitigation
CONCLUSION In this paper, we analyse alternative long-term pathways for BC and OC emissions using the latest available inventory data. We assume that increased affluence levels in the future, especially in de-veloping countries, will imply an additional premium on local air quality, thus leading to reductions in BC and OC emissions. Our results indicate that representation of technological improvements leading to declines in the intensity of energy use and structural changes in the energy system by switching to cleaner fuels as well as short-term environmental legislation can lead to significantly lower emission levels in the future. In addition, we find that climate policies that are directed at greenhouse gases can have significant co-benefits for local pollutants like BC and OC emissions, by providing the necessary impetus for adoption of cleaner fuels and advanced technologies. Global climate policy can thus serve as a ve-hicle that not only ensures local and regional responses to environmental issues but also lowers the overall costs of emissions reductions and ensures long-term benefits. However in order to take ad-vantage of such benefits, it is necessary to develop policy integrated policy frameworks that fully account for all the potential benefits and costs. While we have tried to make our analysis as comprehensive as possible, there are still a number of issues for future work. We have not included natural sources of BC and OC emissions so far and doing so could have a considerable impact on the results. In addition, the assumption of increased environmental consciousness resulting from higher income levels, while a valid one, may not be sufficient to explain trends in BC and OC emissions in the long-term. There can be other drivers like population densities that in combination with income levels that may have an additional effect on the distribution of such emissions in the long-run. We hope to capture such effects in our further
9
Rao S, Riahi K, Kupiainen K, Klimont Z (2005). Long-term scenarios for black and organic carbon emissions. Environmental Sciences, 2(2-3):205-216 (June-September) [2005]. DOI: 10.1080/15693430500397228.
work. In addition, more spatial downscaling is necessary in order to make our results applicable to a more localized scale of analysis. Lastly, while significant progress has been made in developing inventories of BC and OC emis-sions, there are still large uncertainties in the data due to lack of standardized approaches to meas-urement. While this may have some implications for the magnitudes and spatial and temporal pro-files of our emission pathways, more importantly this may contribute to the lack of action on part of policy makers in reducing these emissions. Hence resolving these uncertainties is vitally impor-tant. Also, the exact climatic effects of BC and OC aerosols remain unclear and a complete under-standing of this issue by climate scientists will significantly enhance the relevance and applicability of our results. ACKNOWLEDGEMENT This work came about as part of the Greenhouse Gas Initiative (GGI), an inter-project research ac-tivity at IIASA. The authors gratefully acknowledge the support and encouragement received. REFERENCES
Bond, T.C., Streets, D.G., Yarber, K.F., Nelson, S.M., Woo, J-H & Klimont, Z., 2004, A Technology-based Global Inventory of Black and Organic Carbon Emissions from Combustion. Journal of Geophysical Research 109, D14203, doi:10.1029/2003JD003697.
Bond, T.C., Sun, H., 2005, Can Reducing Black Carbon Emissions Counteract Global Warming?, Envi-ronmental Science and Technology, 39, 5921-5926
Chung, S.H., Seinfeld, J.H., 2002, Global Distribution and Climate Forcing of Carbonaceous Aerosols, J. Geophys. Res., 107 (D19), 4407, doi:10.1029/2001JD001397.
CONCAWE, 2001. Motor Vehicle Emission Regulations and Fuel Specifications - Part 2: Detailed Information and Historic Review (1996-2000). Report no. 2/01, Brussels.
Cooke, W.F. & Wilson, J.J.N., 1996, A Global Black Carbon Aerosol Model. Journal of Geophysical Re-search, Vol. 101(D14), 19 395-19 409.
Cooke, W.F., Liousse, C., Cachier, H. & Feichter, J. 1999. Construction of a 1° x 1° Fossil Fuel Emission Data Set for Carbonaceous Aerosol and Implementation and Radiative Impact in the ECHAM4 Model. Jour-nal of Geophysical Research 104(D18), 22137-22162.
Gray, H.A., Cass, G.R., 1998, Source contributions to atmospheric fine carbon particle concentrations. Atmospheric Environment, 32, 3805–3825.
Grübler A, Chirkov, V, Goujon, A, Kolp, P, O’Neill, B, Prommer, I, Riahi, K, Scherbov, S. 2005. Re-gional, National, and Spatially Explicit Scenarios of Demographic and Economic Change based on SRES. Interim Report IR-05-001, International Institute of Applied Systems Analysis, Laxenburg, Austria.
Grübler, A., 2002, Trends in Global Emissions: Carbon, Sulfur and Nitrogen, Encyclopedia of Global Environmental Change, I. Douglas (ed), Volume 3, pp. 35-53, 2002, John Wiley & Sons Ltd, Chichester, UK.
Grübler, A., 1999, A Review of Global and Regional Sulfur Emission Scenarios, Mitigation and Adapta-tion Strategies for Global Change 3(2–4) 383–418, Kluwer Academic Publishers, Dordrecht, the Netherlands. (ISSN 1381–2386).
Hansen, J., Sato, M., Ruedy, R., Lacis, A. & Oinas, V., 2000, Global Warming in the Twenty first Cen-tury: An Alternative Scenario. Proceedings of the National Academy of Sciences USA 97(18), 9875-9880.
IPCC, 2000: Special Report on Emissions Scenarios, A Special Report of Working Group III of the Inter-governmental Panel on Climate Change, Nakicenovic et al., Cambridge University Press, Cambridge, UK.
IPCC, 2001, Climate Change 2001: Climate Change 2001: The Scientific Basis - Contribution of Work-ing Group I to the Third Assessment Report of IPCC, Cambridge University Press, UK [ISBN: 0521014956] pp 944.
Jacobson, M.Z., 2001, Strong Radiative Heating Due to the Mixing State of Black Carbon in Atmospheric Aerosols, Nature 409, 695-697.
Klaassen, G., Amann, M., Berglund, C. et al., 2004, The Extension of the RAINS Model to Greenhouse Gases, IIASA Interim Report, IR-04-015, Laxenburg, Austria
10
Rao S, Riahi K, Kupiainen K, Klimont Z (2005). Long-term scenarios for black and organic carbon emissions. Environmental Sciences, 2(2-3):205-216 (June-September) [2005]. DOI: 10.1080/15693430500397228.
Klimont, Z, Cofala, J., Bertok, I., Amann, M., Heyes, C., Gyarfas, F., 2002, Modelling Particulate Emis-sions in Europe A Framework to Estimate Reduction Potential and Control Costs. IIASA Interim Report IR-02-076, Laxenburg, Austria.
Kupiainen, K., Klimont, Z., 2004, Primary Emissions of Submicron and Carbonaceous Particiles in Europe and the Potential for their Control. International Institute for Applied Systems Analysis (IIASA) In-terim Report, IR-04-079, Laxenburg, Austria.
Liousse, C., J. E. Penner, C. Chuang, J. J. Walton, H. Eddleman, and H. Cachier (1996), A global three-dimensional model study of carbonaceous aerosols, J. Geophys. Res., 101, 19,411 –19,432.
Liousse C., Guillaume B., Junker C., Michel C., Grégoire J.M. and Cachier H.Mar, T.F., Norris, G.A., 2005,‘Recent developments for carbonaceous aerosol inventories of the 1950-2100 Period’, Presentation at Workshop on Global Air Pollution Trends till 2030, January 27-28, 2005, IIASA, Laxenburg, Austria Mar, T.F., Norris, G.A., Koenig, J.Q., Larson, T.V., 2000, Associations Between Air Pollution and Mor-tality in Phoenix, 1995-1997. Environmental Health Perspectives 108(4), 347-353.
Messner, S., Strubegger, M., 1995, Model-based decision support in energy planning, WP-95-119, Inter-national Institute for Applied Systems Analysis, Laxenburg, Austria.
Nakicenovic, N., 1993, Long-term Strategies for Mitigating Global Warming, Energy, 8, 401-609 Nakicenovic, N., Grubler, A., McDonald A., 1998, Global Energy Perspectives, Cambridge University
Press ISBN 0-521-64569-7 Penner, J.E., Eddleman, H., Novakov, T., 1993, Towards the Development of a Global Inventory for
Black Carbon Emissions. Atmospheric Environment 27A(8), 1277-1295. Rao, S., Riahi, K., 2005: The role of non-CO2 greenhouse gases in climate change mitigation: Long-term
scenarios for the 21st century. Energy (forthcoming) Roerhl, R.A., Riahi, R. 2000, Technology Dynamics and Greenhouse Gas Emissions Mitigation: A Cost
Assessment, Technological Forecasting and Social Change 63,231-261 Rypdal, K, Terje B, Fuglestvedta J.S., Aunan K.,, Torvangera A., Stordal F., Pacyna J.M.,and Nygaard L,
2005, Tropospheric ozone and aerosols in climate agreements: scientific and political challenges. Environ-mental Science and Policy, 8 (1): pp. 29-43.
Smith, S., 2005, Income and Pollutant Emissions in the ObjECTS MiniCAM Model, The Journal of Envi-ronment & Development, Vol. 14, No. 1, 175-196 (2005)
Streets, D.G., Bond, T.C., Lee, T., Jang, C., 2004, On the future of carbonaceous aerosol emissions, Jour-nal of Geophysical Research, Vol. 109, D24212, doi:10.1029/2004JD004902
Venkataraman, C., Habib, G., Figuren-Fernandez, A., Miguel, A.H., Friedlander, S.K., 2005. Residential Biofuels in South Asia: Carbonaceous Aerosol Emissions and Climate Impacts. Science, 307 (March 4), 1454-1456.
11