Characteristics of fulvic acids generated in communes waste ...
Long-Term Fertilization Modifies the Structures of SoilFulvic Acids and Their Binding Capability with AlJun Wu1, Minjie Wu2,3, Chunping Li1, Guanghui Yu1,2,3*
1 Key Laboratory of Soil Environment and Pollution Remediation, Institute of Soil Science, Chinese Academy of Sciences, Nanjing, Jiangsu, PR China, 2 State Key
Laboratory of Soil Sustainable Agriculture, Institute of Soil Science, Chinese Academy of Sciences, Nanjing, Jiangsu, PR China, 3 National Engineering Research Center for
Organic-based Fertilizers, College of Resources and Environmental Sciences, Nanjing Agricultural University, Nanjing, PR China
Abstract
The binding characteristics of organic ligands and minerals in fulvic acids (FAs) with Al are essential for understanding soil Csequestration, remain poorly understood. In this study, Fourier transform infrared (FTIR) spectroscopy combined with two-dimensional correlation spectroscopy (2DCOS) analysis was applied for the first time to explore the binding of Al withorganic ligands and minerals in soil FAs. For these analyses, two contrasting treatments were selected from a long-term (i.e.,22-year) fertilization experiment: chemical (NPK) fertilization and swine manure (SM) fertilization. The results showed thatthe long-term application of organic and inorganic fertilizers to soils had little effect on the compositions of the fluorescentsubstances and organic ligands in the soil FAs. However, long-term SM fertilization increased the weathered Al and Siconcentrations in the soil FAs compared with long-term chemical fertilization. Furthermore, organic ligands in the soil FAswere mainly bound with Al in the NPK treatment, whereas both organic ligands and minerals (Al-O-Si, Si-O) were boundwith Al under the M fertilization conditions. Both transmission electron microscopy (TEM) images and X-ray diffractionspectra demonstrated that amorphous and short-range-ordered nanominerals were abundant in the soil FAs from the SMplot in contrast to the soil FAs from the NPK plot. This result illustrates the role nanominerals play in the preservation of soilFAs by during long-term organic fertilization. In summary, the combination of FTIR and 2D correlation spectroscopy is apromising approach for the characterization of the binding capability between soil FAs and Al, and a better understandingFA-Al binding capability will greatly contribute to global C cycling.
Citation: Wu J, Wu M, Li C, Yu G (2014) Long-Term Fertilization Modifies the Structures of Soil Fulvic Acids and Their Binding Capability with Al. PLoS ONE 9(8):e105567. doi:10.1371/journal.pone.0105567
Editor: Dafeng Hui, Tennessee State University, United States of America
Received April 19, 2014; Accepted July 21, 2014; Published August 19, 2014
Copyright: � 2014 Wu et al. This is an open-access article distributed under the terms of the Creative Commons Attribution License, which permits unrestricteduse, distribution, and reproduction in any medium, provided the original author and source are credited.
Data Availability: The authors confirm that all data underlying the findings are fully available without restriction. All relevant data are within the paper and itsSupporting Information files.
Funding: This work was funded by the National Natural Science Foundation of China (41371248, 41301241), the National Basic Research Program of China(2011CB100503), the Natural Science Foundation of Jiangsu Province of China (BK20131321, BK2013171), and the Qing Lan Project. The funders had no role instudy design, data collection and analysis, decision to publish, or preparation of the manuscript.
Competing Interests: The authors have declared that no competing interests exist.
* Email: [email protected]
Introduction
Humic substances (HSs), the dominant component of soil
organic matter (SOM), are formed by the decomposition of plant,
animal, and microbial materials. They are complex, heteroge-
neous, organic compounds that possess different structures and
solubilities and a wide range of molecular weights [1–3]. HSs are
sequestered in the soil systems and contribute to increases in soil
fertility and reductions in greenhouse gas emissions following
complexation with metals. HSs are categorized into the following
three groups on the basis of their solubility: humic acids (HAs),
fulvic acids (FAs), and humins. Among these groups, FAs have the
lowest -molecular -weight, with molecular weights ranging from
approximately 500 to 2000 Da, and they contain the highest
oxygen content in their complex humic groups [4]. Additionally,
FAs are the most mobile components among these three groups.
Large specific surface areas and strong structural binding sites
make FAs potentially important as carrying agents with regard to
the binding and bioavailability of metals [5,6]. Recently, studies
have demonstrated that nanominerals are abundant in soil FAs,
which affect the nanominerals’ binding behavior with metals [7,8].
However, the binding behavior between nanominerals in soil FAs
and metals remains unclear.
Fourier transform infrared (FTIR) spectroscopy is a commonly
used technique that can distinguish between the principal organic
ligands and minerals that are found in soil FAs, such as
carbohydrates, lignin, cellulose, lipids, proteins, and compounds
containing Al-O bonds, through the vibration characteristics of
their structural chemical bonds [8,9]. By determining the FTIR
spectra of FAs after a series of metal titrations, it is possible to
explore the complexes between the organic ligands in FAs and
metals. However, individual FTIR spectral features often overlap
[8,10], complicating investigations of binding between the organic
ligands in FAs and metals. Recently, two-dimensional correlation
spectroscopy (2DCOS) analysis, which can solve the overlapping
peaks problem by distributing the spectral intensity trends within a
data set over a second dimension [9–11], has been applied to
characterize the binding of different organic ligands with metals
[8,12]. It is expected that FTIR spectroscopy combined with
2DCOS analysis can facilitate investigations of the binding of
organic ligands in soil FAs with Al at the molecular level.
PLOS ONE | www.plosone.org 1 August 2014 | Volume 9 | Issue 8 | e105567
Fertilization practices have been shown to affect the levels and
the quality of SOM within cropping systems [8,13–15]. However,
little is known about the binding of organic ligands and minerals in
soil FAs with Al. By understanding the binding between organic
ligands in soil FAs and Al, the stability and bioavailability of SOM
under different fertilization conditions can be better understood.
The objectives of this study were 1) to investigate the binding of
organic ligands in soil FAs with Al and 2) to explore the
mechanism by which SOM is sequestered under different
fertilization practices. For these purposes, the following two
contrasting treatments were selected from a long-term (i.e., 22-
year) fertilization experiment: chemical (NPK) fertilization and
swine manure (SM) fertilization.
Materials and Methods
Site and soil sample collectionSoils were collected from two contrasting treatments, NPK and
SM, at a long-term fertilization experiment station. The long-term
fertilization experiment was initiated in September 1990 in fields
that were double cropped with wheat and corn at an experiment
station of the Chinese Academy of Agricultural Sciences, Qiyang
(26u459 N, 111u529 E, 120 m altitude), Hunan Province, Southern
China. No specific field permits were required for this study. The
land accessed is not privately owned or protected. No protected
species were sampled. The red soil was classified as Ferralic
Cambisol. Concentration of allophane in soils from NPK and SM
treatments in 2012 was 0.2560.05 mg/kg and 1.8060.13 mg/kg,
respectively. A detailed description of the long-term fertilization
experiment site can be found elsewhere [8,16]. In brief, the
experimental area receives 1,255 mm of annual precipitation,
approximately 70–80% of which occurs from April to October.
Mean annual temperature, annual evaporation, annual frost-free
days, and sunshine hours are 18uC, 1,470 mm, 300 d, and
1,610 h, respectively. Prior to the experiment, the field had been
under an annual wheat-corn rotation for 3 yrs to give soil uniform
fertility. The chemical fertilizers used were urea for N,
superphosphate for P, and potassium chloride (KCl) for K. The
total N applied in the NPK and SM treatments per year is 300 kg/
ha.
Soil samples at depths of 0–20 cm were collected in October
2012 using a 5-cm internal diameter auger. Each sample was a
composite of ten random cores that were collected from two
replicate plots. The fresh soil was mixed thoroughly, air-dried,
roots removed, and then sieved through a 2.0-mm sieve for further
analysis.
Extraction and purification of fulvic acids (FAs)The FA fraction was extracted from the surface soil (0–20 cm)
samples following the International Humic Substance Society
(IHSS) procedure [17]. The sample was equilibrated to a pH value
between 1 and 2 with 1 M HCl at room temperature. The solution
volume was adjusted with 0.1 M HCl to provide a final
concentration ratio of 10 mL liquid per g dry sample. The
suspension was shaken for 1 h, and the supernatant was separated
from the residue by low speed centrifugation (i.e., 2000 g). The
residues were then neutralized with 1 M NaOH. A 0.1 M solution
of NaOH was then added to the residues under nitrogen gas using
an extractant to sample ratio of 10:1. The suspension was
extracted under nitrogen gas with intermittent shaking for a
minimum of 4 h. After centrifugation, the supernatant solution
was collected and acidified to pH 1.0 with 6 M HCl and was
allowed to settle for 12 h before centrifuging again [17]. The FA
fraction was concentrated and purified by flowing the FAs through
an XAD-8 adsorption resin column (AMBERLITE), and the 0.1
M NaOH eluate was passed through a H+-saturated cation
exchange resin column (CER, Dowex MAC-3, Sigma) (Hiradate,
2006). The purified FA samples were stored at 4uC until further
analysis.
Fluorescence excitation-emission matrix (EEM)determination
The fluorescence EEMs were measured on a Varian Eclipse
fluorescence spectrophotometer in scan mode. Scanning emission
(Em) spectra from 250 to 600 nm were obtained in 2 nm
increments by varying the excitation (Ex) wavelength from 200
to 500 nm in 10 nm increments [18]. The spectra were recorded
at a scan rate of 1200 nm/min using excitation and emission slit
band widths of 5 nm. Several preprocessing steps were used to
minimize the influence of scatter lines and other attributes of the
EEM landscape. The EEM of a control Milli-Q water was
subtracted from each sample, and other Rayleigh and Raman
scatters were removed by the protocol of Bahram et al. [19]. After
that, the EEMs were normalized by dividing the spectra by the
corresponding DOC concentrations.
Al titration testAliquots of 25 mL of the diluted solution of FAs were titrated
into 40 mL brown, sealed vials containing 0.01 mol/L AlCl3 using
an automatic syringe. The Al concentrations in the final solutions
ranged from 0 to 70 mmol/L. No more than 25 mL of the metal
titrant was added during titration to maintain constant pH before
and after titration. All titrated solutions were shaken for 24 h at
25uC to ensure complexation equilibrium [20–22]. Finally, after
freeze-drying the solutions, they were analyzed by FTIR
spectroscopy.
FTIR spectroscopy determination and analysis oftwo-dimensional correlation spectroscopy
The samples were prepared as a mixture of 1 mg of freeze-dried
FA or of the FA-Al complex and 100 mg of potassium bromide
(KBr, IR grade), and this mixture was then ground and
homogenized [9,10]. A subsample was then compressed twice in
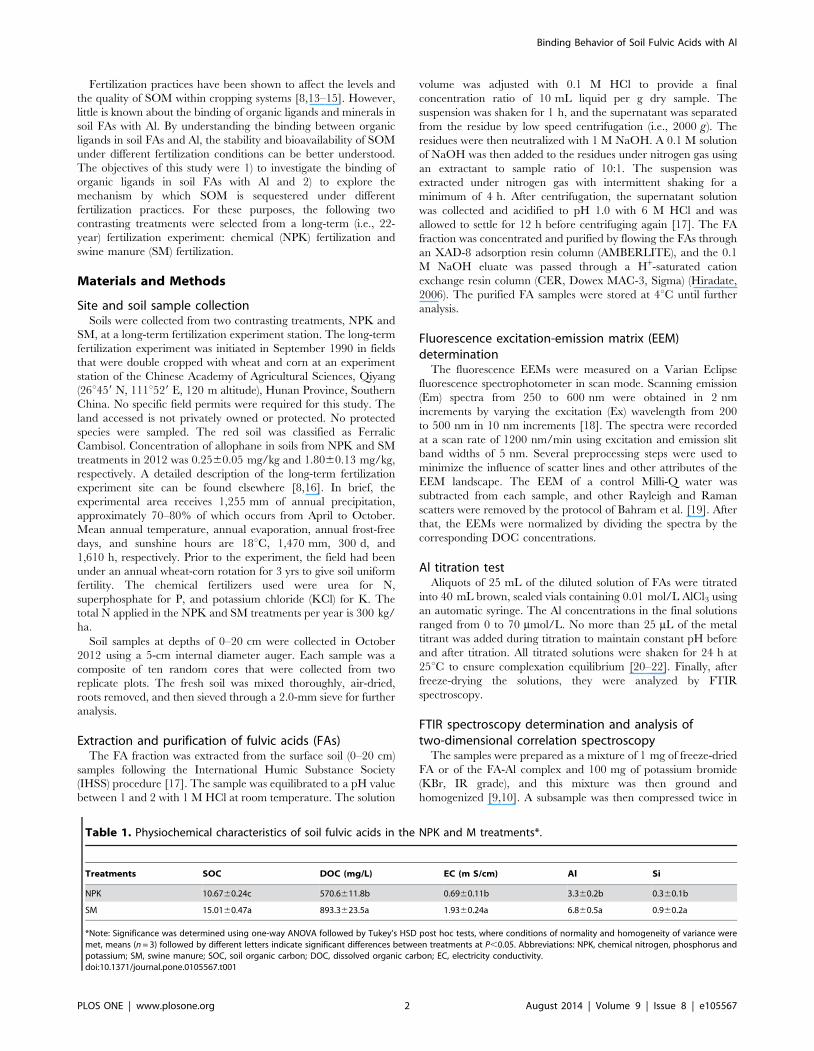
Table 1. Physiochemical characteristics of soil fulvic acids in the NPK and M treatments*.
Treatments SOC DOC (mg/L) EC (m S/cm) Al Si
NPK 10.6760.24c 570.6611.8b 0.6960.11b 3.360.2b 0.360.1b
SM 15.0160.47a 893.3623.5a 1.9360.24a 6.860.5a 0.960.2a
*Note: Significance was determined using one-way ANOVA followed by Tukey’s HSD post hoc tests, where conditions of normality and homogeneity of variance weremet, means (n = 3) followed by different letters indicate significant differences between treatments at P,0.05. Abbreviations: NPK, chemical nitrogen, phosphorus andpotassium; SM, swine manure; SOC, soil organic carbon; DOC, dissolved organic carbon; EC, electricity conductivity.doi:10.1371/journal.pone.0105567.t001
Binding Behavior of Soil Fulvic Acids with Al
PLOS ONE | www.plosone.org 2 August 2014 | Volume 9 | Issue 8 | e105567
Binding Behavior of Soil Fulvic Acids with Al
PLOS ONE | www.plosone.org 3 August 2014 | Volume 9 | Issue 8 | e105567
a hydraulic press at 20,000 psi between two clean, polished iron
anvils to form a KBr window. The FTIR spectra were obtained by
collecting 200 scans with a Nicolet 370 FTIR spectrometer.
The 2DCOS spectra were produced according to the method of
Noda and Ozaki [11]. In this study, the Al concentration was
applied as an external perturbation, and a set of concentration-
dependent FTIR spectra was obtained. For example, in an
analytical spectrum where I(x, t), the variable x is the index
variable representing the FTIR spectra induced by the perturba-
tion variable t. The x was used instead of the general notation in
conventional 2D correlation equations based on the spectral index
v. The analytical spectrum I(x, t) at m evenly spaced points in t(between T min and T max) can be represented as
Ij(x)~I(x,tj), j~1,2,:::,m: ð1Þ
A set of dynamic spectra is given by
~II(x,t)~I(x,tj){�II(x) ð2Þ
where �I( x) denotes the reference spectrum, which is typically
the average spectrum that is expressed as
�I( x) ~1
m
Xm
j~ 1I( x, tj) . The synchronous correlation
intensity can be directly calculated from the following dynamic
spectra:
1(x1,x2)~1
m{1
Xm
j~1~II j(x1)~IIj(x2) ð3Þ
The intensity of a synchronous correlation spectrum
(1 ( x1, x2) ) represents the simultaneous changes in two spectral
intensities measured at x1 and x2 during the interval between Tmin
and Tmax.
Prior to 2DCOS analysis, the FTIR spectra were normalized by
summing the absorbance from 4000-400 cm21 and multiplying by
1000. Subsequently, the normalized FTIR spectra were analyzed
using principal component analysis (PCA) to reduce the level of
noise [23]. Finally, 2DCOS was conducted using 2D shige
software (Kwansei-Gakuin University, Japan).
In this study, we focused on the FTIR regions from 3600 cm21
to 3100 cm21, 1800 cm21 to 900 cm21, and 900 cm21 to
400 cm21 because they contain the major excitation bands of
OH bonds, amides, carboxylic acids, esters, carbohydrates, Al-O
and Si-O, and aliphatic C-H stretching [24,25].
Chemical analysisThe carbon (C) contents in the soil were analyzed using a
Perkin-Elmer 2400 CHN elemental analyzer. The filtered
(0.45 mm PTFE filter) extract was measured for DOC using a
TOC/TN analyzer (multi N/C 3000, Analytik Jena AG,
Germany). The pH was determined in 1:2.5 (w/v) soil:water
extracts using a pH electrode. Electrical conductivity (EC) was
determined using a conductivity meter (LF91, German). The Al
and Si concentrations in the soil FA extracts were measured using
ICP-AES (Optima 7000, PerkinElmer, USA). Mineralogical
identification was performed using X-ray powder diffraction
(Nanjing Normal University). The diffraction patterns were
recorded from 3 to 60u 2-theta using Ni-filtered Cu K-alpha
radiation at a rate of 300 s per step on a PANalytical X-pert Pro
diffractometer using an X-celerator position-sensitive detector.
Statistical analysisThe data (means 6 SD, n = 3) were assessed via one-way
analysis of variance (ANOVA) using SPSS software version 18.0
for Windows (SPSS, Chicago, IL). Significance was determined
using one-way ANOVA followed by Tukey’s HSD post hoc tests,
where conditions of normality and homogeneity of variance were
met, and means followed by different letters indicated significant
differences between treatments at P,0.05.
Results and Discussion
Characterization of soil FAs in long-term fertilizationtreatments
As one of the main components of SOC, the soil FAs in the SM
plot after 22 years of fertilization treatment contained a higher
DOC concentration and EC than the FAs in the NPK plot (p,
0.01, Table 1), which was consistent with the results that also
showed that the SOC concentrations in the SM plot were
significantly (p,0.01) greater (,5465%) than those in the NPK
plot (Table 1). Therefore, consistent with previous publications,
organic fertilization could markedly increase SOC content and soil
fertility [26,27]. Moreover, organic fertilization significantly
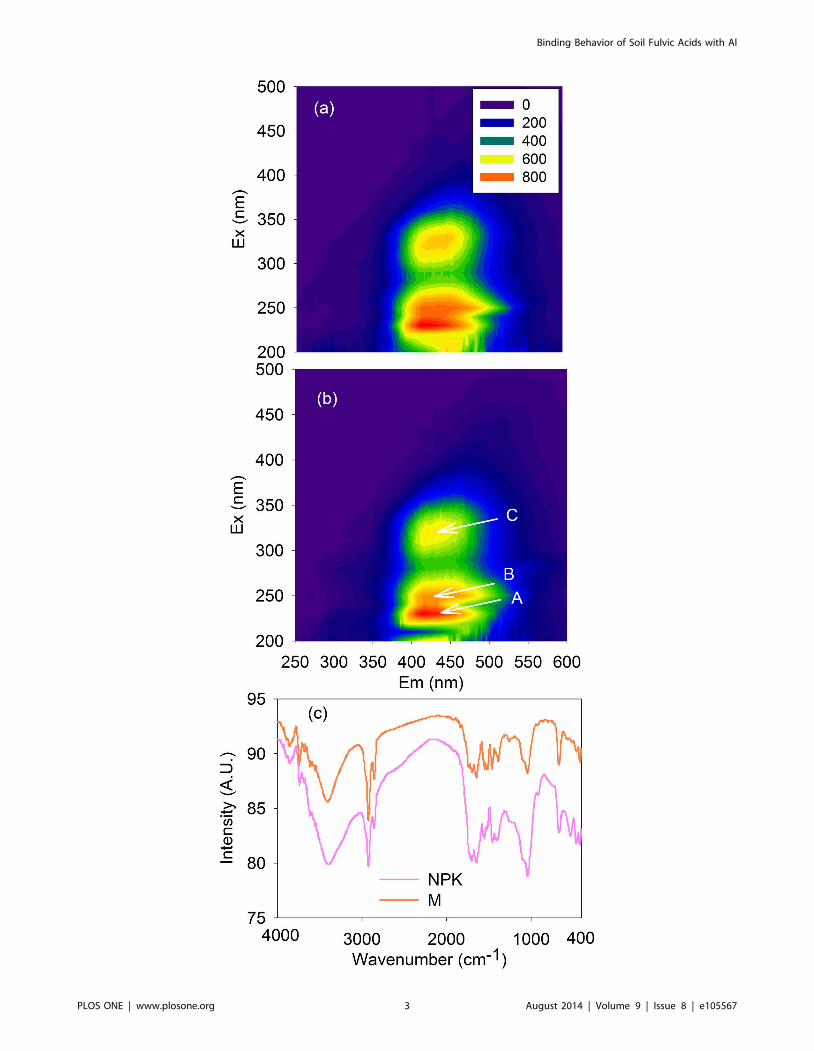
Figure 1. Fluorescence excitation-emission matrix (EEM) spectra of soil fulvic acids from the NPK (a) and SM (b) plots and FTIRspectra of the fulvic acids (c) during a long-term (i.e., 22-year) fertilization experiment. Note that peaks A, B and C were located at Ex/Emof 230/410, 250/410, and 330/410, respectively. NPK, chemical nitrogen, phosphorus and potassium; SM, swine manure.doi:10.1371/journal.pone.0105567.g001
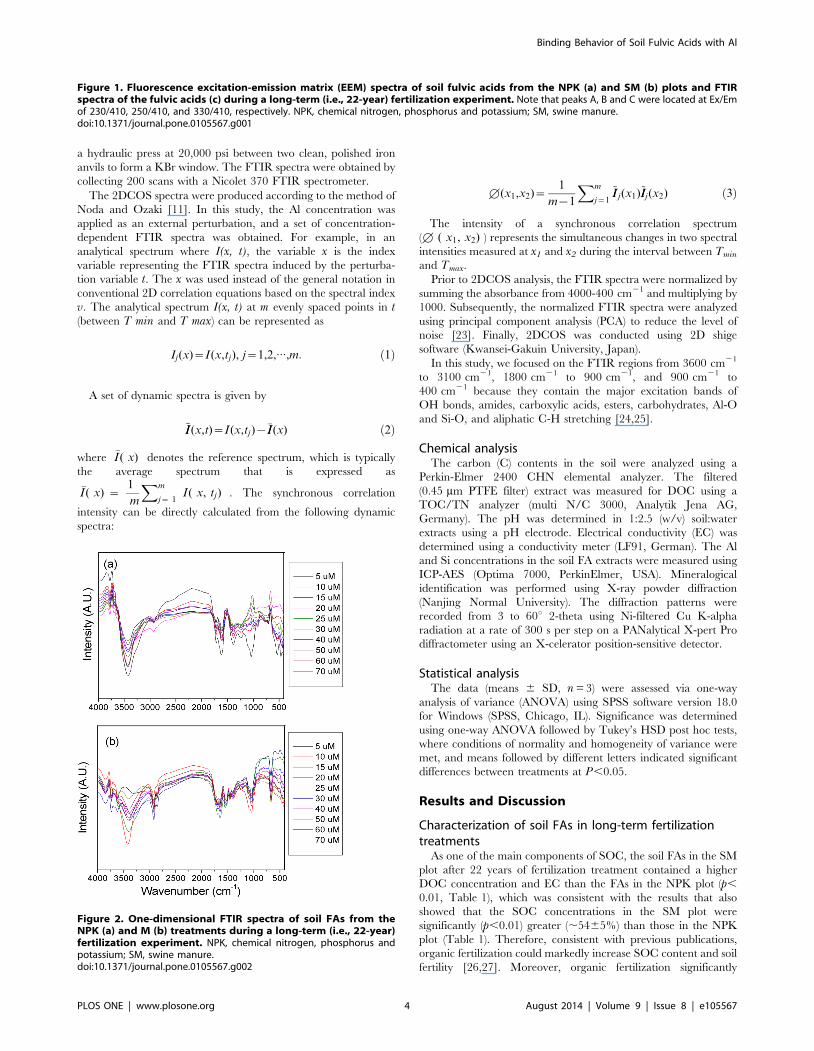
Figure 2. One-dimensional FTIR spectra of soil FAs from theNPK (a) and M (b) treatments during a long-term (i.e., 22-year)fertilization experiment. NPK, chemical nitrogen, phosphorus andpotassium; SM, swine manure.doi:10.1371/journal.pone.0105567.g002
Binding Behavior of Soil Fulvic Acids with Al
PLOS ONE | www.plosone.org 4 August 2014 | Volume 9 | Issue 8 | e105567
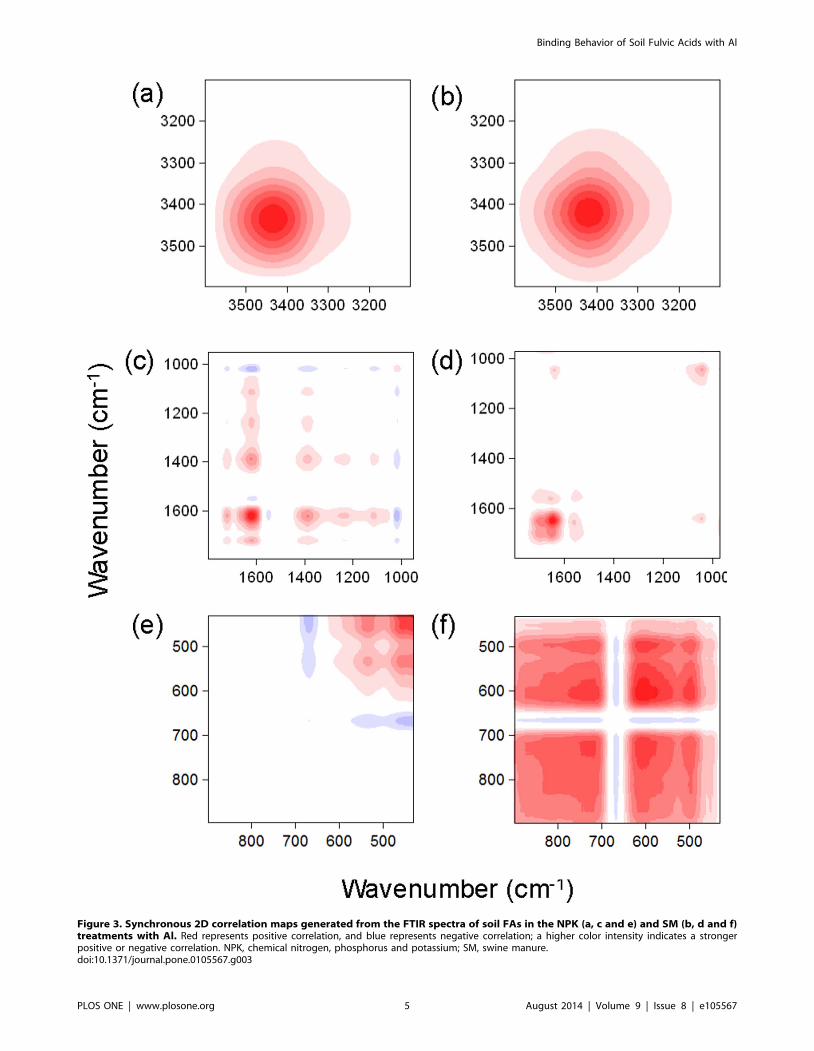
Figure 3. Synchronous 2D correlation maps generated from the FTIR spectra of soil FAs in the NPK (a, c and e) and SM (b, d and f)treatments with Al. Red represents positive correlation, and blue represents negative correlation; a higher color intensity indicates a strongerpositive or negative correlation. NPK, chemical nitrogen, phosphorus and potassium; SM, swine manure.doi:10.1371/journal.pone.0105567.g003
Binding Behavior of Soil Fulvic Acids with Al
PLOS ONE | www.plosone.org 5 August 2014 | Volume 9 | Issue 8 | e105567
increased (p,0.01) the concentration of weathered Al and Si and
incorporated them into the soil FAs.
Fluorescence EEM spectra demonstrated that three fluores-
cence peaks, i.e., peaks A, B, and C, which were located at Ex/Em
of 230/420, 250/420, and 330/420, respectively, were present in
the soil FAs from both the NPK and SM plots (Figures 1-a and 1-
b) and were attributed to fulvic-like (i.e., peaks A and B) and
humic-like (i.e., peak C) substances, respectively [8,18,28].
Although the fulvic-like (i.e., peaks A and B) substances were
dominant, a considerable fraction of humic-like (i.e., peak C)
substances was also present in the extracted soil FAs, suggesting
that the soil FAs extracted by the operationally defined method
actually include both FAs and HAs as indicated by fluorescence
spectroscopy.
The organic ligands of the soil FAs from the NPK and SM plots
were quite similar in the FTIR functional region (i.e., 4000-
1000 cm21), including OH from polysaccharides (3400 cm21),
CH2 from lipids (2920 cm21), C = O stretching of the amide
groups in proteins (1650 cm21), C-N stretching and N-H bending
vibrations of the amide groups in proteins (1540 cm21), and Si-O
(1020 cm21) and Al-O-Si bands (610 cm21 and 720 cm21) in
allophanes. However, the lignads were distinctly different in the
fingerprint region (1000-400 cm21) (Figure 1-c). In the fingerprint
region, peaks at 720 cm21 and 610 cm21 were only present in the
SM plot, both of them belonging to the Al–O–Si band in Al
nanominerals [29,30]. Different from the fluorescence EEM
spectra, which report information only about fluorescence
substances (i.e., protein- and humic-like substances), FTIR
spectroscopy provides information about non-fluorescent sub-
stances (e.g., polysaccharides and lipids) and nanominerals (e.g.,
allophane) present in the soil FAs.
In summary, the long-term application of different fertilizers
onto soils had little effect on the composition of fluorescent
substances and organic ligands. The results were similar to those of
a study by Randall et al. [31], in which mineral fertilizer and
manure differed little in their effects on the chemical composition
of SOM. Similar FTIR band characteristics were also previously
reported between soil HAs in soils that were fertilized with manure
and inorganic N fertilizer and an unfertilized control [32]. The
minor effect of fertilization on the structures of the soil FAs may
have been because the chemical composition of SOM is
determined primarily by the interaction between the organisms
responsible for decomposition and the mineral soil matrix rather
than by the nature of the substrate input [31].
Binding of organic ligands and nanominerals with Al insoil FAs
A better understanding of the binding of organic ligands and
minerals to cations is essential to the stability of the SOC.
Following the addition of Al, the major IR peaks appeared
deformed in the one-dimensional FTIR spectra (Figure 2). The
peaks were significantly overlapped, and no further information
could be extracted. Therefore, two-dimensional correlation
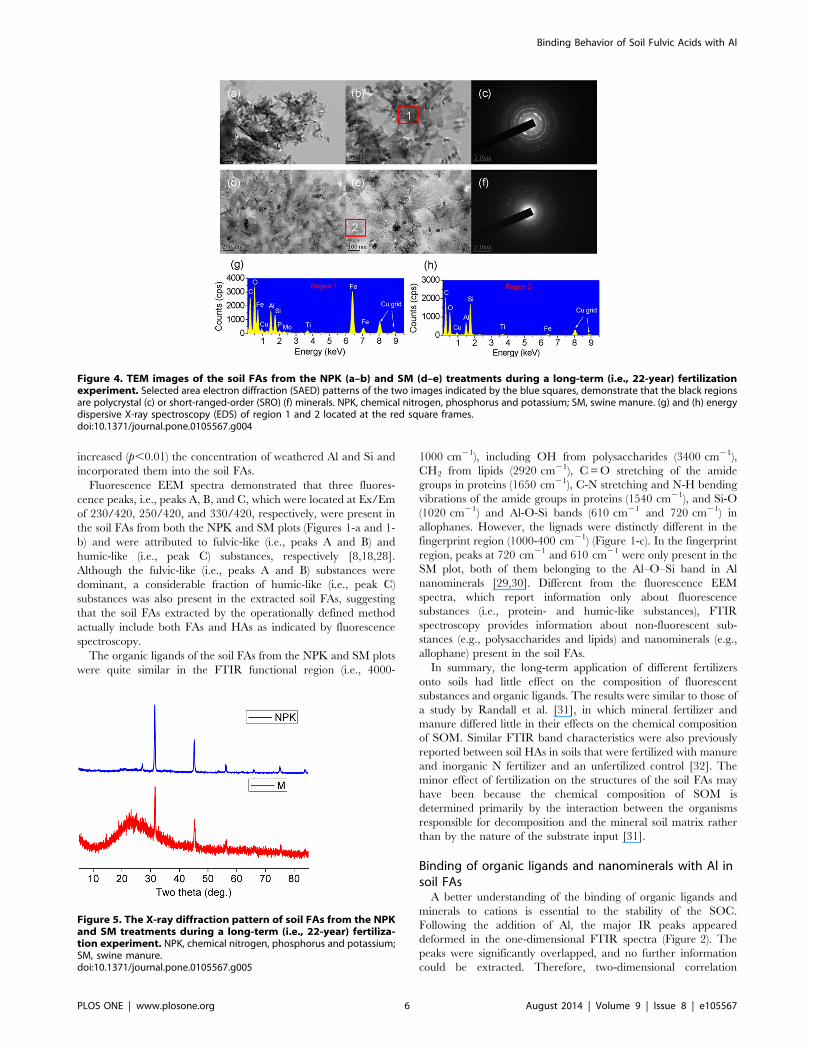
Figure 4. TEM images of the soil FAs from the NPK (a–b) and SM (d–e) treatments during a long-term (i.e., 22-year) fertilizationexperiment. Selected area electron diffraction (SAED) patterns of the two images indicated by the blue squares, demonstrate that the black regionsare polycrystal (c) or short-ranged-order (SRO) (f) minerals. NPK, chemical nitrogen, phosphorus and potassium; SM, swine manure. (g) and (h) energydispersive X-ray spectroscopy (EDS) of region 1 and 2 located at the red square frames.doi:10.1371/journal.pone.0105567.g004
Figure 5. The X-ray diffraction pattern of soil FAs from the NPKand SM treatments during a long-term (i.e., 22-year) fertiliza-tion experiment. NPK, chemical nitrogen, phosphorus and potassium;SM, swine manure.doi:10.1371/journal.pone.0105567.g005
Binding Behavior of Soil Fulvic Acids with Al
PLOS ONE | www.plosone.org 6 August 2014 | Volume 9 | Issue 8 | e105567
spectroscopy analysis was applied in this study to further analyze
the binding of the organic ligands and minerals in the soil FAs to
Al.
Synchronous 2DCOS spectra of samples from the two plots are
shown in Figure 3. In the 3600-3100 cm21 region, only one auto-
peak located at 3420 cm21 (OH stretching in polysaccharides) was
observed in both soil FAs from the two plots. In the 1800-
900 cm21 region, four and three major auto-peaks were present in
the samples from the NPK and SM plots, respectively. The
changes in band intensity decreased in the following orders: for the
NPK plot, C = O stretching of amide I (1630 cm21) . CH
deformations in aliphatic groups (1380 cm21) .. C = O stretch-
ing of COOH (1720 cm21) <Si-O asymmetric stretching
(1020 cm21); for the SM plot, C = O stretching of amide I
(1650 cm21) . Si-O asymmetric stretching (1020 cm21) ..
C = N stretching of amide II (1540 cm21). In the fingerprint
region (900-400 cm21), two and three auto-peaks were present in
the NPK and SM plots, respectively. The band intensities
decreased in the following orders: for the NPK plot, Si-O bending
vibrations (430 cm21) . Al-O-Si deformation (540 cm21); for the
SM plot, coupled Al-O and Si-O (out-of-plane) (610 cm21) . Si-
O stretching (720 cm21) . Al-O-Si deformation (510 cm21).
Seven positive cross-peaks at W(1630, 1380), W(1630, 1220),
W(1630, 1080), W(1720, 1630), W(1720, 1380), W(1380, 1220), and
W(1380, 1080) were present in the NPK fertilization, indicating
that the C = O stretching of amide I, the CH deformations in the
aliphatic groups, and the OH deformation of COOH were co-
binding to Al. Moreover, four negative cross-peaks at W(1630,
1540), W(1630, 1010), W(1380, 1010), and W(1080, 1010) were also
identified in the NPK fertilization, suggesting that the C = O
stretching was negatively correlated with N–H deformations in the
plane of amide II and that the Si-O stretching of the nanominerals
was negatively correlated with C = O stretching, OH deformation
of COOH, and CH deformations. In contrast, only two positive
cross-peaks at W(1650, 1540) and W(1650 1020) were present in the
SM fertilization, revealing that the C = O stretching of the amide
groups were co-bound to Al, with N-H deformations of amide II
and Si-O stretching of the nanominerals. In the fingerprint region,
the presence of positive cross-peaks at W(540, 430) in the NPK plot
and both W(720, 610) and W(720, 510) in the SM plot indicated
that Si-O and Al-O-Si were co-bound to Al.
Although the long-term application of different fertilizers to soils
had little effect with regard to organic ligands, this study showed,
for the first time, that the different fertilization treatments had a
marked effect on the binding of FAs with Al. First, more organic
ligands in the 1800-900 cm21 region were bound to Al in the
NPK plot than in SM (Figures 3-b and 3-d). In contrast, except for
the binding of organic ligands in the soil FAs with Al, the Si-O
content (i.e., 1020, 720, and 610 cm21) in minerals in the SM plot
played a more important role in the binding to Al than in the NPK
plot. This result was consistent with the finding of Yu et al. [8], in
which a large amount of silicates was present in an NPK plus
manure (NPKM) plot when compared to an NPK plot, suggesting
that Al was bound to a silicate network in the SM plot. In addition
to the binding of Al to the H-bond network (i.e., 3400 cm21)
(Figures 3-a and 3-b), it is reasonable to surmise that a large
amount of allophone [Al2O3(SiO2)1–2(H2O)2–4] and/or imogolite
[(OH)3Al2O3SiOH] was formed in the soil FAs in the M plot in
contrast to the NPK plot.
Morphology, diffraction pattern, and X-ray diffractionspectra of soil FAs
To confirm whether nanominerals were formed in the soil FAs
in the SM and the NPK plots, TEM images and XRD spectra
were used to observe the morphology and mineralogy of the
nanominerals. A large amount of nanominerals was present in the
TEM images of the soil FAs from both NPK (Figures 4-a and 4-b)
and SM plots (Figures 4-d and 4-e). The electron diffraction
patterns indicated that, although the soil FAs from both NPK and
SM plots had a determinate crystalline and amorphous pattern,
the obtained nanominerals were more crystalline under NPK
conditions (Figure 4-c) than under SM conditions (Figure 4-f).
Furthermore, the XRD spectra of the soil FAs corroborated that
crystalline minerals were dominant under NPK fertilization
conditions, while amorphous minerals were predominant under
SM fertilization conditions (Figure 5).
Collectively, the TEM images and XRD spectra showed that
nanominerals, i.e., allophone [Al2O3(SiO2)1–2(H2O)2–4] and/or
imogolite [(OH)3Al2O3SiOH], were found abundantly in the soil
FAs from the SM plot rather than from the NPK plot. In
combination with the results of the 2DCOS spectra, the TEM
images and XRD spectra showed that the nanominerals in soil
FAs may play an important role in the binding of metals, which
should benefit both soil remediation and soil C sequestration.
Implications to soil organic carbon sequestrationThe results from the 2D FTIR correlation spectroscopy, TEM
images and XRD spectra point to the formation of soil
nanominerals in the SM rather than in the NPK treatments.
The formation of soil nanominerals (i.e., allophone and imogolite)
could greatly benefit the preservation of SOC [33]. Torn et al.
[34] previously demonstrated that soil nanominerals controlled
SOC storage and turnover. Under favorable conditions, the
turnover of SOC in allophonic soils could persist in tephra beds for
at least 250,000 years [7]. Globally, approximately 190–332
million tons of C can be sequestered by silicate minerals annually
[35]. As one of the main components of SOC, the abundance of
nanominerals in the soil FAs from the SM plot would definitely
contribute to the stability of the SOC. The knowledge of the
binding of organics and metals improves our understanding of the
sequestration process of SOC and provides valuable information
with regard to fertilization techniques and scientific research.
Conclusions
In this study, FTIR spectroscopy combined with 2DCOS
analysis has been developed to investigate the binding capability
between soil FA and mineral elements.
The results show that the organic ligands in the soil FAs were
mainly bound to Al in the NPK treatment, whereas both organic
ligands and minerals (Al–O–Si, Si–O) were bound to Al in the SM
treatment. The abundance of amorphous and short-range-ordered
(SRO) nanominerals in the soil FAs of the SM plot, rather than the
NPK plot, illustrated the preservation role of the soil FAs by
nanominerals during long-term organic fertilization. In summary,
the combination of FTIR and 2D correlation spectroscopy is a
promising approach for the characterization of the binding
capability between soil FA and mineral elements. A better
understanding of this binding capability will benefit the under-
standing of soil C sequestration and greatly contribute to global C
cycling.
Acknowledgments
This work was funded by the National Natural Science Foundation of
China (41371248, 41301241), the National Basic Research Program of
China (2011CB100503), the Natural Science Foundation of Jiangsu
Province of China (BK20131321, BK2013171), and the Qing Lan Project.
Binding Behavior of Soil Fulvic Acids with Al
PLOS ONE | www.plosone.org 7 August 2014 | Volume 9 | Issue 8 | e105567
Author Contributions
Conceived and designed the experiments: GY. Performed the experiments:
MW JW CL. Analyzed the data: GY JW MW. Contributed reagents/
materials/analysis tools: GY JW MW. Contributed to the writing of the
manuscript: GY MW JW CL.
References
1. Lead JR, Balnois E, Hosse M, Menghetti R, Wilkinson KJ (1999) Character-
ization of Norwegian natural organic matter: size, diffusion coefficients andelectrophoretic mobilities. Environment International 25: 245–258.
2. Maurice PA, Namjesnik-Dejanovic K (1999) Aggregate structures of sorbedhumic substances observed in aqueous solution. Environmental Science and
Technology 33: 1538–1541.
3. Sutton R, Sposito G (2005) Molecular structure in soil humic substances: thenew view. Environmental Science and Technology 39: 9009–9015.
4. Gaffney JS, Marley NA, Clark SB (1996) Humic and Fulvic Acids and theOrganic Colloidal Materials in the Environment, Humic and Fulvic Acids:
Isolation, Structure and Environmental Role. In: Gaffney JS, Marley NA, Clark
SB (Eds.), American Chemical Society, Washington, DC, 2–16.5. Dwane GC, Tipping E (1998) Testing a humic speciation model by titration of
copper amended natural waters. Environment International 24: 609–616.6. Tipping E (2002) Cation Binding by Humic Substances. Cambridge University
Press., Cambridge.7. Parfitt RL (2009) Allophane and imogolite: role in soil biogeochemical processes.
Clay Minerals 44: 135–155.
8. Yu GH, Wu MJ, Wei GR, Luo YH, Ran W, et al. (2010) Binding of organicligands with Al(III) in dissolved organic matter from soil: implications for soil
organic carbon storage. Environmental Science and Technology 46: 6102–6109.9. Wang LP, Shen QR, Yu GH, Ran W, Xu YC (2012) Fate of biopolymers during
rapeseed meal and wheat bran composting as studied by two-dimensional
correlation spectroscopy in combination with multiple fluorescence labelingtechniques. Bioresource Technology 105: 88–94.
10. Yu GH, Tang Z, Xu YC, Shen QR (2011) Multiple fluorescence labeling andtwo dimensional FTIR-13C NMR heterospectral correlation spectroscopy to
characterize extracellular polymeric substances in biofilms produced during
composting. Environmental Science and Technology 45: 9224–9231.11. Noda I, Ozaki Y, Eds. (2004) Two-Dimensional Correlation Spectroscopy-
Applications in Vibrational and Optical Spectroscopy. John Wiley & Sons.,England.
12. Xu HC, Yu GH, Jiang HL (2013) Investigation on extracellular polymericsubstances from mucilaginous cyanobacterial blooms in eutrophic freshwater
lakes. Chemosphere 93: 75–81.
13. Paustian K, Parton WJ, Persson J (1992) Modeling soil organic matter inorganic-amended and nitrogen-fertilized long-term plots. Soil Science Society of
America Journal 56: 476–488.14. Varvel GE (1994) Rotation and nitrogen fertilizer effects on changes in soil
carbon and nitrogen. Agronomy Journal 86: 319–325.
15. Campbell CA, Biederbeck VO, McConkey BG, Curtin D, Zentner RP (1999)Soil quality effect of tillage and fallow frequency. Soil organic matter quality as
influenced by tillage and fallow frequency in a silt loam in southwesternSaskatchewan. Soil Biology & Biochemistry 31: 1–7.
16. Zhang HM, Wang BR, Xu MG, Fan TL (2009) Crop yield and soil responses tolong-term fertilization on a red soil in southern China. Pedosphere 19: 199–207.
17. Swift RS (1996) Methods of Soil Analysis: Part 3. Chemical Methods. Soil
Science Society of America Book Series 5, 1018–1020.18. Yu GH, Luo YH, Wu MJ, Tang Z, Liu DY, et al. (2010) PARAFAC modeling of
fluorescence excitation–emission spectra for rapid assessment of compostmaturity. Bioresource Technology 101: 8244–8251.
19. Bahram M, Bro R, Stedmon C, Afkhami A (2007) Handling of Rayleigh and
Raman scatter for PARAFAC modeling of fluorescence data using interpolation.
Journal of Chemometrics 20: 99–105.
20. Wu J, Zhang H, He PJ, Shao LM (2011) Insight into the heavy metal binding
potential of dissolved organic matter in MSW leachate using EEM quenching
combined with PARAFAC analysis. Water Research 45: 1711–1719.
21. Wu J, Zhang H, Shao LM, He PJ (2012) Fluorescent characteristics and metal
binding properties of individual molecular weight fractions in municipal solid
waste leachate. Environmental Pollution 162: 63–71.
22. Wen YL, Li H, Xiao J, Wang C, Shen QR, et al. (2014) Insights into
complexation of dissolved organic matter and Al(III) and nanominerals
formation in soils under contrasting fertilizations using two-dimensional
correlation spectroscopy and high resolution- transmission electron microscopy
techniques. Chemosphere 111: 441–449.
23. Abdulla HA, Minor EC, Dias RF, Hatcher PG (2010) Changes in the compound
classes of dissolved organic matter along an estuarine transect: A study using
FTIR and 13C NMR. Geochim Cosmochim Acta 74: 3815–3838.
24. Hinterstoisser B, Salmen L (2000) Application of dynamic 2D-FTIR to cellulose.
Vibrational Spectroscopy 22: 111–118.
25. Hiradate S, Yonezawa T, Takesako H (2006) Isolation and purification of
hydrophilic fulvic acids by precipitation. Geoderma 132: 196–205.
26. Gattinger A, Muller A, Haeni M, Skinner C, Fliessbach A, et al. (2012)
Enhanced top soil carbon stocks under organic farming. Proc Natl Acad Sci
USA 109: 18226–18231.
27. Maillard E, Angers DA (2014) Animal manure application and soil organic
carbon stocks: a meta-analysis. Global Change Biology 20: 666–679.
28. Chen W, Westerhoff P, Leenheer JA, Booksh K (2003) Fluorescence excitation–
emission matrix regional integration to quantify spectra for dissolved organic
matter. Environmental Science and Technology 37: 5701–5710.
29. Madejova J, Komadel P (2001) Baseline studies of the clay minerals society
source clays: infrared methods. Clays and Clay Minerals 49: 410–432.
30. Liu C, Huang PM (2002) Role of hydroxy-aluminosilicate ions (proto- imogolite
sol) in the formation of humic substances. Organic Geochemistry 33: 295–305.
31. Randall EW, Mahieu N, Powlson DS, Christensen BT (1995) Fertilization effects
on organic matter in physically fractionated soils as studied by 13C NMR: results
from two long-term field experiments. European Journal of Soil Science 46:
557–565.
32. Mao JD, Olk DC, Fang XW (2008) Influence of animal manure application on
the chemical structures of soil organic matter as investigated by advanced solid-
state NMR and FT-IR spectroscopy. Geoderma 146: 353–362.
33. Aiken GR, Hsu-Kim H, Ryan JN (2011) Influence of dissolved organic matter
on the environmental fate of metals, nanoparticles, and colloids. Environmental
Science and Technology 45: 3196–3201.
34. Torn MS, Trumbore SE, Chadwich OA, Vitousek PM, Hendricks DM (1997)
Mineral control of soil organic carbon storage and turnover. Nature 389: 170–
173.
35. Renforth P, Washbourne CL, Taylder J, Manning DAC (2011) Silicate
production and availability for mineral carbonation. Environmental Science
and Technology 45: 2035–2041.
Binding Behavior of Soil Fulvic Acids with Al
PLOS ONE | www.plosone.org 8 August 2014 | Volume 9 | Issue 8 | e105567
Copyright © 2022 FDOKUMEN