Environmental and Agronomic Implications of Water Table and Nitrogen Fertilization Management
10
Environmental and Agronomic Implications of Water Table and Nitrogen Fertilization Management Abdirashid A. Elmi, Chandra Madramootoo, Mohamud Egeh, Aiguo Liu, and Chantal Hamel* ABSTRACT ing the USEPA and Canadian health standards limit of 10 mg NO 3 –N L 1 for drinking water (Health Canada, Nitrate (NO 3 ) pollution of surface and subsurface waters has be- 1996; Randall et al., 1997; Thompson et al., 2000; Weil come a major problem in agricultural ecosystems. Field trials were conducted from 1996 to 1998 at St-Emmanuel, Quebec, Canada, to et al., 1990). In the province of Quebec, Canada, Madra- investigate the combined effects of water table management (WTM) mootoo et al. (1992) documented levels of NO 3 as high and nitrogen (N) fertilization on soil NO 3 level, denitrification rate, as 40 mg NO 3 –N L 1 in subsurface drain flow from a and corn (Zea mays L.) grain yield. Treatments consisted of a combi- sandy loam field cropped to potato (Solanum tuberosum nation of two water table treatments: free drainage (FD) with open L.). Increasing public concern about deteriorating water drains at a 1.0-m depth from the soil surface and subirrigation (SI) quality has prompted a growing interest for the develop- with a design water table of 0.6 m below the soil surface, and two N ment of various preventive and remedial management fertilizer (ammonium nitrate) rates: 120 kg N ha 1 (N 120 ) and 200 kg strategies. N ha 1 (N 200 ). Compared with FD, SI reduced NO 3 –N concentrations Water table management (WTM) including controlled in the soil profile by 37% in spring 1997 and 2% in spring 1998; and drainage–subirrigation (SI) is one promising technique by 45% in fall 1997 and 19% in fall 1998 (1 mg NO 3 –N L 1 equals approximately 4.43 mg NO 3 L 1 ). The higher rate of N fertilization to help reduce NO 3 ground water pollution. Raising resulted in greater levels of NO 3 –N in the soil solution. Denitrification the water table by subirrigation increases soil saturation rates were higher in SI than in FD plots, but were unaffected by N and restricts O 2 diffusion in soil pores, thus creating rate. The N 200 rate produced higher yields than N 120 in 1996 and 1997, reducing conditions that promote NO 3 losses by denitri- but not 1998. Corn yields in SI plots were 7% higher than FD plots in fication. Drury et al. (1997) reported that a SI system 1996 and 3% higher in 1997, but 25% lower in 1998 because the SI reduced NO 3 concentration in tile drainage water by system was unable to drain the unusually heavy June rains, resulting in 25% compared with a free drainage (FD) system. Simi- waterlogging. These findings suggest that SI can be used as an econom- larly, Jacinthe et al. (1999) estimated a 40% reduction ical means of reducing NO 3 pollution without compromising crop in soil NO 3 due to denitrification in SI plots compared yields during normal growing seasons. with FD plots. Enhanced denitrification reduces NO 3 in the soil–water solution and, hence, the risk of NO 3 leaching to ground water. However, a possible conse- N itrate (NO 3 ) pollution of both surface and ground quence of this practice is increased nitrous oxide (N 2 O) water has become a widely recognized risk in in- emission to the atmosphere. Nitrous oxide emissions tensively managed agricultural ecosystems. Agricultural are of serious concern as they contribute to greenhouse activities are considered to be among the most signifi- effects (Smith, 1990) and participate in the depletion of cant sources of NO 3 contamination. Intensive use of the ozone layer (Mooney et al., 1987). Fortunately, N 2 O nitrogen fertilizer to aid food production may lead to is not the only end product of denitrification as it may increased NO 3 levels in surface water bodies, promoting further be reduced to N 2 , which is harmlessly carried eutrophication of surface waters by stimulating algae into the atmosphere. We are currently conducting field growth (Yeomans et al., 1992). Furthermore, NO 3 leach- trials to elucidate effects of water table depth on the ing represents a potential source for the degradation of N 2 O to N 2 ratio. ground water quality (Prunty and Montgomery, 1991). Water table management may also benefit crop yield. Human consumption of water containing high NO 3 con- The water table elevated by SI provides abundant mois- centrations has been linked to cases of methemoglobin- ture and helps satisfy plant evapotranspiration require- emia, also known as blue baby syndrome, which in ex- ments. Optimum water table depth (WTD) is a function treme cases can result in the death of infants of 4 to of crop and soil type. Kalita and Kanwar (1993) have 6 mo (Comly, 1945; Gelberg et al., 1999), and can cause shown that the highest yield of corn grown on sandy other health disorders (Prasad and Power, 1995). loam soils was obtained with a WTD of 0.6 to 0.9 m, Prevention is preferable to the restoration of polluted and the lowest with a WTD of 0.2 to 0.3 m. Similarly, aquifers. Nonetheless, in some situations it is already too Tan et al. (1996) reported optimal corn yield at a WTD late for prevention, and costly treatments may become of 0.6 m, but a 15% yield reduction at a WTD of 0.3 m. inevitable before water is fit for human consumption or These findings agree with those of Wesseling (1974), recreational purposes. In many regions of the United who found that a too-shallow WTD reduces oxygen sup- States, wells have exhibited NO 3 concentrations exceed- ply to roots, reduces nutrient uptake and crop growth, and restricts rooting volume. A.A. Elmi, A. Liu, and C. Hamel, Dep. of Natural Resource Science, The integration of water table management into a N and C. Madramootoo and M. Egeh, Dep. of Agric. Biosyst. Engi- neering, Macdonald Campus of McGill University, 21 111 Lakeshore fertilization strategy could further mitigate environmen- Rd. Ste-Anne-de-Bellevue, QC, Canada H9X 3V9. Received 28 Sept. 2001. *Corresponding author ([email protected]). Abbreviations: FD, free drainage; SI, subirrigation; WTD, water table depth; WTM, water table management. Published in J. Environ. Qual. 31:1858–1867 (2002). 1858
Transcript of Environmental and Agronomic Implications of Water Table and Nitrogen Fertilization Management

Environmental and Agronomic Implications of Water Table and NitrogenFertilization Management
Abdirashid A. Elmi, Chandra Madramootoo, Mohamud Egeh, Aiguo Liu, and Chantal Hamel*
ABSTRACT ing the USEPA and Canadian health standards limit of10 mg NO�
3 –N L�1 for drinking water (Health Canada,Nitrate (NO�3 ) pollution of surface and subsurface waters has be-
1996; Randall et al., 1997; Thompson et al., 2000; Weilcome a major problem in agricultural ecosystems. Field trials wereconducted from 1996 to 1998 at St-Emmanuel, Quebec, Canada, to et al., 1990). In the province of Quebec, Canada, Madra-investigate the combined effects of water table management (WTM) mootoo et al. (1992) documented levels of NO�
3 as highand nitrogen (N) fertilization on soil NO�
3 level, denitrification rate, as 40 mg NO�3 –N L�1 in subsurface drain flow from a
and corn (Zea mays L.) grain yield. Treatments consisted of a combi- sandy loam field cropped to potato (Solanum tuberosumnation of two water table treatments: free drainage (FD) with open L.). Increasing public concern about deteriorating waterdrains at a 1.0-m depth from the soil surface and subirrigation (SI) quality has prompted a growing interest for the develop-with a design water table of 0.6 m below the soil surface, and two N
ment of various preventive and remedial managementfertilizer (ammonium nitrate) rates: 120 kg N ha�1 (N120) and 200 kgstrategies.N ha�1 (N200). Compared with FD, SI reduced NO�
3 –N concentrationsWater table management (WTM) including controlledin the soil profile by 37% in spring 1997 and 2% in spring 1998; and
drainage–subirrigation (SI) is one promising techniqueby 45% in fall 1997 and 19% in fall 1998 (1 mg NO�3 –N L�1 equals
approximately 4.43 mg NO�3 L�1). The higher rate of N fertilization to help reduce NO�
3 ground water pollution. Raisingresulted in greater levels of NO�
3 –N in the soil solution. Denitrification the water table by subirrigation increases soil saturationrates were higher in SI than in FD plots, but were unaffected by N and restricts O2 diffusion in soil pores, thus creatingrate. The N200 rate produced higher yields than N120 in 1996 and 1997, reducing conditions that promote NO�
3 losses by denitri-but not 1998. Corn yields in SI plots were 7% higher than FD plots in fication. Drury et al. (1997) reported that a SI system1996 and 3% higher in 1997, but 25% lower in 1998 because the SI reduced NO�
3 concentration in tile drainage water bysystem was unable to drain the unusually heavy June rains, resulting in
25% compared with a free drainage (FD) system. Simi-waterlogging. These findings suggest that SI can be used as an econom-larly, Jacinthe et al. (1999) estimated a 40% reductionical means of reducing NO�
3 pollution without compromising cropin soil NO�
3 due to denitrification in SI plots comparedyields during normal growing seasons.with FD plots. Enhanced denitrification reduces NO�
3
in the soil–water solution and, hence, the risk of NO�3
leaching to ground water. However, a possible conse-Nitrate (NO�3 ) pollution of both surface and ground
quence of this practice is increased nitrous oxide (N2O)water has become a widely recognized risk in in-emission to the atmosphere. Nitrous oxide emissionstensively managed agricultural ecosystems. Agriculturalare of serious concern as they contribute to greenhouseactivities are considered to be among the most signifi-effects (Smith, 1990) and participate in the depletion ofcant sources of NO�
3 contamination. Intensive use ofthe ozone layer (Mooney et al., 1987). Fortunately, N2Onitrogen fertilizer to aid food production may lead tois not the only end product of denitrification as it mayincreased NO�
3 levels in surface water bodies, promotingfurther be reduced to N2, which is harmlessly carriedeutrophication of surface waters by stimulating algaeinto the atmosphere. We are currently conducting fieldgrowth (Yeomans et al., 1992). Furthermore, NO�
3 leach-trials to elucidate effects of water table depth on theing represents a potential source for the degradation ofN2O to N2 ratio.ground water quality (Prunty and Montgomery, 1991).
Water table management may also benefit crop yield.Human consumption of water containing high NO�3 con-
The water table elevated by SI provides abundant mois-centrations has been linked to cases of methemoglobin-ture and helps satisfy plant evapotranspiration require-emia, also known as blue baby syndrome, which in ex-ments. Optimum water table depth (WTD) is a functiontreme cases can result in the death of infants of 4 toof crop and soil type. Kalita and Kanwar (1993) have6 mo (Comly, 1945; Gelberg et al., 1999), and can causeshown that the highest yield of corn grown on sandyother health disorders (Prasad and Power, 1995).loam soils was obtained with a WTD of 0.6 to 0.9 m,Prevention is preferable to the restoration of pollutedand the lowest with a WTD of 0.2 to 0.3 m. Similarly,aquifers. Nonetheless, in some situations it is already tooTan et al. (1996) reported optimal corn yield at a WTDlate for prevention, and costly treatments may becomeof 0.6 m, but a 15% yield reduction at a WTD of 0.3 m.inevitable before water is fit for human consumption orThese findings agree with those of Wesseling (1974),recreational purposes. In many regions of the Unitedwho found that a too-shallow WTD reduces oxygen sup-States, wells have exhibited NO�
3 concentrations exceed-ply to roots, reduces nutrient uptake and crop growth,and restricts rooting volume.A.A. Elmi, A. Liu, and C. Hamel, Dep. of Natural Resource Science,
The integration of water table management into a Nand C. Madramootoo and M. Egeh, Dep. of Agric. Biosyst. Engi-neering, Macdonald Campus of McGill University, 21 111 Lakeshore fertilization strategy could further mitigate environmen-Rd. Ste-Anne-de-Bellevue, QC, Canada H9X 3V9. Received 28 Sept.2001. *Corresponding author ([email protected]).
Abbreviations: FD, free drainage; SI, subirrigation; WTD, water tabledepth; WTM, water table management.Published in J. Environ. Qual. 31:1858–1867 (2002).
1858
ELMI ET AL.: WATER TABLE AND N FERTILIZATION MANAGEMENT 1859
tal plots were under a conventional tillage system (i.e., mold-tal degradation while optimizing crop yield. Knowledgeboard-plowed to 0.20 m in fall and disked in spring, the com-of interactions between WTM and N fertilization is re-mon practice in the region).quired to development best management practices. The
objectives of this study were to (i) assess water table man-agement effectiveness in removing NO�
3 –N from the Experimental Designsoil–water system, (ii) investigate the combined effects Schematic representation of the field layout is depicted inof water table depth and N fertilization rate on denitrifi- Fig. 1. Briefly, treatments consisted of a factorial combinationcation rate, and (iii) elucidate the effects of SI and N of two water table management treatments (FD with openrates on corn yield. drains 1 m in depth from the soil surface and SI with a design
water table 0.6 m below the soil surface) and two fertilizer rates(120 kg N ha�1 [N120] and 200 kg N ha�1 [N200]). DiammoniumMATERIALS AND METHODSphosphate (18–46–0) was banded at planting to provide ap-
Field Management proximately 24 kg N ha�1 and 130 kg P2O5 ha�1. One monthlater, to reach the desired levels of N fertilization, 97 and 178 kgThe 4.2-ha research site was a privately owned field locatedN ha�1 were surface-applied as ammonium nitrate (34–0–0)at St-Emmanuel near Coteau-du-Lac, Quebec (74�11�15″ N,for the N120 and N200 treatments, respectively. This second appli-45�2�10″ W). The soil was of sedimentary origin. It was a Sou-cation occurred on 18 June 1996, 20 June 1997, and 8 June 1998.langes fine sandy loam (fine silty, mixed, non-acid Frigid
A factorial arrangement of treatments with water tableHumaquept, Gleysol, according to the FAO classification sys-management as main plot and N fertilization as subplot weretem). The site was under pasture before 1991 and under con-laid out in a split plot design. There were three blocks, 120 mtinuous corn production thereafter. Surface topography waswide and 75 m long, each consisting of eight plots, 15 m widegenerally flat with an average slope of less than 0.5%. A clayand 75 m long. Blocks were separated by a 30-m-wide strip oflayer at about a 0.5-m depth impeded natural drainage. Theundrained land. To minimize seepage and chemical flow be-field was planted with corn (Pioneer [Des Moines, IA] Hybridtween plots, a plastic barrier of double thickness, 6-mil (0.6 mm)3905) at a density of 75 000 plants ha�1 with 0.75- and 0.15-mpolyethylene sheeting was installed to a depth of 1.5 m be-inter- and intra-row spacings, on 17 May 1996, 23 May 1997,tween plots (Tait et al., 1995). However, this did not suffi-and 8 May 1998. Potassium (muriate of potash, 0–0–60 N–P–K)ciently limit lateral flow from subirrigation treatment plots towas broadcast at a rate of 90 kg K2O ha�1 roughly one weekadjacent free drainage plots, resulting in below-design waterbefore planting. In addition, the farmer applied manure (cattletable depth on subirrigation plots, and higher drain flows onslurry) to the field in spring 1998 at a rate of 20 Mg ha�1 (wetfree drainage plots (Kaluli, 1996). Consequently, for this study,weight). To control weeds, 1.5 kg a.i. ha�1 atrazine [6-chloro-plots adjacent to subirrigation treatment plots were placedN ethyl-N (1-methylethyl)-1,3,5-traizine-2,4-diamine], 0.32 kgunder subirrigation and those adjacent to free drainage plotsa.i. ha�1 dicamba (3,6-dichloro-2methoxybenzoic acid), 0.32under free drainage, resulting in four of the eight plot drainskg a.i. ha�1 bromoxynil (3,5-dibromo4-4hydroxybenzonitrile),per block being dedicated to the four treatment combinations,and 1.92 kg a.i. ha�1 metolachlor [2-chloro-N-(2-ethyl-6-methyl-and the remaining four plot drains per block serving as buffersphenyl)-N-(2-methoxy-1-methylethyl) acetamide] were ap-(Fig. 1). Each plot with a water table control at 0.6 m had twoplied to the field on 23 May 1996, 25 June 1997, and 13 Maybuffer plots on either side with the water table control also1998. All field operations other than seeding, fertilizer treat-set at 0.6 m. All buffer plots received 120 kg N ha�1 (Fig. 1).ment, and herbicide applications were performed by the
farmer as part of his normal production practices. Experimen- In the middle of each plot, 75-mm-diameter subsurface drain
Fig. 1. Schematic representation of the experimental layout and treatment arrangements.

1860 J. ENVIRON. QUAL., VOL. 31, NOVEMBER–DECEMBER 2002
pipes were installed, at a 1.0-m depth, with a slope of 0.3%. with Ar and CH4 (95:5) as a carrier gas, with oven and detectortemperatures adjusted at 70 and 400�C, respectively. Soil mois-Subirrigation was imposed only after all field operations were
completed and maintained until crop maturity in late Septem- ture was determined by oven-drying soil cores at 105�C for48 h and was used to compute bulk density and water-filledber. The SI treatment was imposed immediately after planting
in 1998. Well water with no detectable nitrate was continuously pore space (WFPS).Nitrate N concentration in the soil profile was assessed bypumped into the field to balance crop use and evaporative
losses. Due to deep seepage it was difficult to maintain water collecting three sets of soil samples per plot with augers on29 Apr. (preplanting) and 18 Oct. 1997 (postharvest) andtables at the desired depth. Following heavy rainfall events,
pumping was stopped and excess water was drained to a 0.6-m 4 May (preplanting) and 18 Oct. 1998 (postharvest) at threewater table depth. Water depth fluctuations in all plots were depth increments (0–0.25, 0.25–0.50, and 0.50–0.75 m). Sam-monitored throughout the growing season. Three observation ples were also taken at the 0- to 0.2-m depth for NO�
3 –Nwells (pipes) wrapped with geotextile sleeves (Zodiac, Lon- analysis in conjunction with denitrification measurements. Alldon, ON) were installed diagonally across each of the treat- soil samples for nitrate analysis were stored at 4�C for 1 toment and buffer plots to a depth of approximately 1.5 m. A 3 wk. The samples were then thoroughly mixed and moistgraduated rod with a water sensor was used to measure water subsamples of 10 g were shaken with 100 mL of 1 M KCl fortable levels. Rainfall and air temperature data were obtained 60 min. The soil suspension was filtered through Whatmanfrom an Environment Canada weather station situated 500 m (Maidstone, UK) #5 filter papers. The filtrates were frozenfrom the experimental site. Soil temperature was recorded at before NO�
3 –N analysis with a colorimetric autoanalyzer (La-the same sampling date as for denitrification with a water- chat [Milwaukee, WI] Quickchem).resistant probe thermometer (Hanna Instruments [Woon- Corn grain yield was determined by hand-harvesting indi-socket, RI] HI9024/HI9025) inserted to 0.20 m below the vidual ears from a subplot consisting of a 2.5-m stretch of thesoil surface. three middle rows of each plot. Grain yield was reported on
a dry-weight basis. The field was moldboard-plowed to a depthof 0.20 m in the first week of November, incorporating allSampling Strategies and Analysiscorn stover (leaves plus stalks) into the soil.
For total denitrification measurements, soil samples (0- to Analysis of variance (AVOVA) was performed separately0.15-m depth) were collected weekly from late May to July and on individual sampling dates. Unless otherwise stated, thebiweekly from August to October during the 1998 growing differences between treatments were declared to be significantseason, and approximately biweekly during the 1996 and 1997 at the 0.05 probability level. All statistical analysis were con-growing seasons. In 1996, sampling started in mid-July after ducted with the general linear model (GLM) procedure ofthe drainage system was switched to SI mode. On each sam- the Statistical Analysis System (SAS Institute, 1996).pling date, aluminum cylinders (50 mm in diameter � 150 mmlong) were used to collect undisturbed soil cores. On eachoccasion, soil cores were taken on different non-wheel-tracked RESULTS AND DISCUSSIONinter rows. The cylinders were perforated along the sides (hori-
Climatic Datazontally and vertically) at 50-mm intervals to enhance acety-lene gas diffusion. Sample cylinders were placed in 2-L plastic Total seasonal (May–October) rainfall in 1996 wasjars fitted with rubber stoppers for gas sampling. To represent
8.6% greater than the 30-yr normal (Table 1). However,field conditions, samples were incubated outdoors overnight.the month of August was exceptionally dry, at 43% ofBefore incubation, 100 mL of the headspace in the jars wasnormal, whereas July and September were both veryremoved and replaced with 100 mL of acetylene (C2H2) to
give a 5% (v/v) concentration. Acetylene was supplied to wet, with 41 and 55% above-normal precipitation, re-inhibit the enzymatic reduction of N2O to N2 and nitrification, spectively. These wetter months increased the likeli-so that accumulated N2O � N2 from denitrification could be hood of NO�
3 –N leaching with the percolation water.measured as N2O (Yoshinari et al., 1977). The 1997 growing season was drier, with precipitation
Total N2O production was determined following the proce- at 90% of normal, whereas in 1998 growing season pre-dure of Mackenzie et al. (1997). Briefly, jar headspace gas cipitation was 29% above normal (Table 1). About 44%was thoroughly mixed by inserting a syringe and pumping
of the growing season precipitation in 1998 occurredseveral times before gas sampling. About 4 mL of headspacein June. This overwhelmed the subirrigation system’sgas were removed from the jars and injected into a Hewlett-ability to drain excess soil water, resulting in poor cropPackard (Palo Alto, CA) 5870 Series II gas chromatograph
(GC) equipped with a 63Ni electron capture detector (ECD) growth and yield. June 1998 was the wettest in 70 yr
Table 1. Monthly precipitation and air temperature (1996, 1997, and 1998) compared with long-term (1961–1991) normal at Coteau-du-Lac, Quebec.
Air temperature Precipitation
Month 1996 1997 1998 1961–1991 1996 1997 1998 1961–1991
�C mmMay 11.7 10.3 16.5 12.4 103.8 64.8 69.6 76.3June 18.6 19.3 18.4 17.3 81.8 98.0 230.0 90.1July 19.5 19.5 20.0 20.2 133.9 97.0 128.4 94.6August 19.5 17.8 19.6 18.9 40.8 86.3 101.0 93.9September 15.7 14.0 15.1 14.1 140.6 81.4 89.4 90.6October 7.8 7.0 9.0 7.7 66.0 41.4 53.6 76.7Mean 15.5 14.7 16.4 15.1 – – – –Total – – – – 566.9 468.9 671.6 522.2

ELMI ET AL.: WATER TABLE AND N FERTILIZATION MANAGEMENT 1861
and the second wettest on record (National Oceanic and fication and, therefore, reduced potential leaching ofAtmospheric Administration, 1998). Air temperatures NO�
3 –N. Denitrification with depth has been recognizedwere 0.4 and 1.3�C higher than normal in 1996 and as an important mechanism for reducing NO�
3 loading1998, respectively, but were 0.4�C below normal in 1997 in the saturated zone (Lind and Eiland, 1989).(Table 1); 1998 was the warmest year since 1879 (Na- Measured NO�
3 –N levels in the soil profile weretional Oceanic and Atmospheric Administration, 1998). higher in fall 1997 (Fig. 2b) than in fall 1998 (Fig. 2d),Soil temperatures (0- to 0.2-m depth), measured in con- perhaps because relatively dry and cool conditions injunction with soil sampling for denitrification, followed 1997 (Table 1) repressed denitrification. High levels ofthe same pattern as air temperature and were unaffected residual soil NO�
3 –N after harvest increase the risk ofby either water table depth or N fertilization treatments movement to surface water bodies via subsurface drains(data not presented). or to ground water. In spring, when evapotranspiration
is low and precipitation and snow melt exceed the waterEffects of Water Table Management holding capacity of the soil, residual NO�
3 –N can leachon Residual Nitrate Nitrogen in the Soil Profile beyond the crop root zone with percolating water. Patni
et al. (1998) estimated that approximately 70% ofSoil NO�3 –N concentrations in the soil profile were
NO�3 –N leaching occurs from fall to spring (Octobergenerally significantly lower under SI for nearly all sam-
through April). Keeney and DeLuca (1993) found thatpling dates and depths (Fig. 2). Exceptions were fallNO�
3 –N concentrations in the Des Moines River in1997 at the deepest sampling depth (0.5–0.75 m, Fig. 2b),Iowa, USA, were above 10 mg L�1 for about 14 d perspring 1998 (Fig. 2c), and fall 1998 at the uppermostyear, mainly in the spring. It was, however, interesting todepth (0–0.25 m, Fig. 2d) when there was no significantnote that in the spring 1997, even though the SI systemdifference between the two water table treatments. Inwas not operational at the time of sampling, a significantgeneral, NO�
3 –N concentrations in the soil solution de-reduction of NO�
3 –N in the soil was observed (Fig. 2a).creased with depth under both SI and FD treatments.Averaged across all depths, seasonal reductions in soilHowever, the decrease was sharper under the SI treat-NO�
3 –N due to SI were 37% for spring 1997, 2% forment, illustrating that SI affects NO�3 –N concentrations
spring 1998, 45% for fall 1997, and 19% for fall 1998.deeper in the soil profile and, hence, may improve groundFurther reductions could be achieved if controlled drain-water quality. The SI system might have created suf-
ficiently anaerobic conditions that promoted denitri- age was operational during early spring or late fall, when
Fig. 2. Nitrate nitrogen concentrations in the soil profile under free drainage (FD) and subirrigation (SI) practices in (a ) spring 1997, (b ) fall1997, (c ) spring 1998, and (d ) fall 1998. Vertical bars represent standard error of the mean (n � 9).

1862 J. ENVIRON. QUAL., VOL. 31, NOVEMBER–DECEMBER 2002
drainage is not needed to optimize crop production. If may be due to the mineralization of manure applied bythe farmer in the spring of 1998. Liang et al. (1995)temperatures were warm enough in early spring, signifi-
cantly enhanced denitrification and reduced NO�3 –N suggested that a major portion of the manure applied
in the spring was mineralized during the subsequentbuild up in the soil–water system could be feasible if SIdid not interfere with tillage operations. summer.
Water table management consists of two main alter-In the uppermost soil layer (0–0.2 m), where the ef-fect of water table (controlled at approximately 0.6 m natives: controlled drainage (CD) and subirrigation (SI).
Under CD, water is prevented from exiting the soil pro-below the soil surface) was expected to be minimal, asubstantial reduction of NO�
3 –N was achieved under the file by means of plugging or raising the drainage outlet.Subirrigation is similar to the CD system, except thatSI treatment (Fig. 3). For example, although soil NO�
3 –Nvalues in 1996 were low, most of the sampling dates supplemental water is pumped into the drainage system
to maintain the water table at a desired level. Our find-showed significantly (P � 0.08 to 0.1) greater soilNO�
3 –N under FD than SI (Fig. 3a). In 1997, while all ings illustrate that maintenance of a shallow water tabledepth can reduce NO�
3 accumulation in the soil andsampling dates but the first (11 July sampling date)tended to show a greater soil NO�
3 –N concentration limit potential pollution of ground water. Reductionsin soil NO�
3 levels of 30 to 60% have been reported forunder FD than SI, the difference was statistically signifi-cant only on 3 September. In 1998, NO�
3 –N levels tended controlled drainage–subirrigation. Fogiel and Belcher(1991) found that controlled drainage–subirrigation re-to be greater under FD than under SI, except on 23 July
and 25 August, when NO�3 –N measured was identical duced NO�
3 loading through drainage by 25 to 59% overa 2-yr period compared with conventional drainage. Ja-under the two treatments (Fig. 3c). Statistical signifi-
cance of the differences was obscured by the high vari- cinthe et al. (1999) reported 24 to 43% reductions inNO�
3 leaching with WTM techniques. Further reductionability in the data. Overall, SI management reducedsurface (0–0.0.2 m) soil NO�
3 –N concentrations by 42% may also be possible by carefully managing fertilizationrates and timing to match crop uptake.in 1996, 16% in 1997, and 28% in 1998, compared with
FD. The much greater NO�3 –N levels in 1998 (Fig. 3c)
than 1996 (Fig. 3a) and 1997 (Fig. 3b) cropping seasons Effects of Nitrogen Rate on Nitrate Nitrogenin the Soil Profile
The NO�3 –N concentrations in the soil profile under
120 kg N ha�1 (N120) and 200 kg N ha�1 (N200) treatmentsdid not differ significantly (Fig. 4), except in spring 1998at the surface (0–0.25 m) and intermediate (0.25–0.5 m)soil depths when NO�
3 –N levels under N200 exceededthat under N120 (Fig. 4c). However, the clear trend forgreater soil NO�
3 –N concentrations under N200 indicatesthat, in the long term, even moderately high rates of Napplication may lead to accumulation of NO�
3 –N in thesoil and, consequently, NO�
3 leaching into ground water.Surface soil NO�
3 –N concentrations (0.20 m) tendedto be higher under N200 than under N120 across all seasonsbut differences were generally nonsignificant (Fig. 5).This suggests that limiting N fertilization may not be asufficient strategy to overcome the problem of NO�
3
loading in the soil–water system. Sainju et al. (1998)reported that even with no fertilization, significant con-centrations of residual NO�
3 –N accumulated below theroot zone because of continued mineralization from soiland crop residues.
Effects of Water Table Depthand Nitrogen Rate on Denitrification
Since there was no significant interaction between anyof the treatment factors (Tables 2, 3, and 4), main effectswere examined independently. With the exception of afew sampling dates when WTD had dropped signifi-cantly below 0.6 m due to drought, denitrification rateswere always higher under SI than under FD (Tables 2,3, and 4). Water table level fluctuated throughout the
Fig. 3. Soil surface (0–0.2 m) NO�3 –N concentration under free drain- cropping seasons, responding primarily to rainfall events.age (FD) and subirrigation (SI) practices in (a ) 1996, (b ) 1997,
Overall, average WTDs in SI plots were deeper in theand (c ) 1998. Vertical bars represent standard error of the mean(n � 3). drier season of 1997 (approximately 0.80 m) than wetter

ELMI ET AL.: WATER TABLE AND N FERTILIZATION MANAGEMENT 1863
Fig. 4. Nitrate nitrogen concentrations in the soil profile under 120 kg N ha�1 (N120) and 200 kg N ha�1 (N200) (a ) spring 1997, (b ) fall 1997, (c )spring 1998, and (d ) fall 1998. Vertical bars represent standard error of the mean (n � 9).
seasons of 1996 (approximately 0.70 m) and 1998 (ap- nure. Manure application not only enhances the N sup-ply, but also provides a source of carbon to the denitrify-proximately 0.65 m). Higher denitrification losses were
probably associated with the higher soil water content ing community. Since denitrification measurements in1996 started in mid-July, it is possible that the denitrifi-in SI plots compared with FD plots (Fig. 6), which de-
creased aeration and created conditions conducive to cation peak was missed and, therefore, caution shouldbe used when comparing seasons.denitrification. Total denitrification in the 1997 season
was very low. The drier conditions in 1997 (Table 1) The decrease in soil NO�3 –N concentration associated
with SI was due to enhanced denitrification. This hasled to a sharp drop in water table depth; 0.80 m fromthe soil surface based on seasonal average. Under such created a concern that benefits from reducing NO�
3 –Nby WTM techniques may be offset by an increase inconditions, denitrification may be limited, leading to an
accumulation of NO�3 –N in the soil profile after harvest. atmospheric N2O pollutant, resulting in a partial trade-
off between the two environmental concerns. However,This is consistent with the high levels of residual soilNO�
3 –N measured in the fall of 1997 (Fig. 2 and 3). The Kliewer and Gilliam (1995) concluded that water tabledepth had no effect on the percentage of N2O emitted1997 growing season was also cooler than normal (Ta-
ble 1). Bergstrom and Beauchamp (1993), Sommerfield to the atmosphere via denitrification. They found thatN2O emission accounted for only about 2% of the totalet al. (1993), Maag and Vinther (1999), and Fan et al.
(1997) have shown that biological N2O production is amount of N denitrified. Weier et al. (1993) noted thatan increase in water-filled pore space led to a strongenhanced at higher temperatures, especially after N fer-
tilization, and lower temperatures can result in a reduc- decrease in N2O to N2 ratio. Results from our experi-mental plots showed that FD produced more N2O thantion in the denitrification rate.
Averaged across all treatments, denitrification rate SI (Elmi et al., 2001). These findings appear to suggestthat the ecological effect of N2O produced during theduring the 1998 season was about 25 times greater than
1996 and 29 times greater than 1997 (Tables 2–4), and denitrification process may not be as serious as waspreviously thought. To confirm this conclusively underonly small amounts of NO�
3 –N were left in the soilprofile after harvest. The large increase in denitrification natural conditions, field trials are needed to quantify
the proportion of N2O to N2 ratio evolution.may be due to application of manure in spring 1998.Beauchamp et al. (1996) showed that total denitrifica- Although it has been widely reported (MacKenzie et
al., 1997; Henault et al., 1998; Ellis et al., 1998) that thetion losses were significantly greater with liquid cattlemanure than either mineral N or solid beef-cattle ma- application rate of nitrogenous fertilizers has a signifi-

1864 J. ENVIRON. QUAL., VOL. 31, NOVEMBER–DECEMBER 2002
Effects of Water Table Depthand Nitrogen Fertilization Rate on Corn YieldAcceptance of a new technology by farmers largely
depends on its effect on crop yield. Corn yields were7% higher under SI than FD in 1996 and 3% higher in1997 (Table 5). These differences were nonsignificant.Skaggs et al. (1999) suggested that raising the watertable generally increased evapotranspiration and, hence,yield. Tan et al. (1996) made similar observations andconcluded that lower corn grain yields on a sandy loamsoil with a water table depth of 0.8 m compared with0.6 m were due to reduced stomatal conductance andtranspiration rates caused by water stress. Doty (1980)found that the best water table depth for corn in sandsor sandy loams was 0.76 to 0.89 m.
In contrast, yields under SI were lower than underFD in 1998. Unusually heavy June rains (Table 1) over-whelmed the drainage system in the SI plots, leading tooccasional ponding of water on the field. When pondingoccurred, the subirrigation system had to be manuallyshut off for about 24 to 36 h to allow drainage of excesswater. Corn roots, particularly when they are young,are sensitive to even short periods of restricted aeration(Evans et al., 1996). Corn stalks were visibly shorter(approximately 0.5 m) under SI plots than FD plots,and yield was reduced by 25%. This observation sug-gests that precise management of the water table isrequired with SI, particularly during rainy periods, andFig. 5. Soil surface (0–0.2 m) NO�
3 –N concentrations under 120 kg Nha�1 (N120) and 200 kg N ha�1 (N200) rates in (a ) 1996, (b ) 1997, that the long-term production benefits of subirrigationand (c ) 1998 growing seasons. Vertical bars represent standard depend on the system’s drainage capacity. For con-error of the mean (n � 3). trolled drainage–subirrigation systems to be successful,
water table depth must be high enough to permit capil-cant influence on denitrification losses, we were unable lary rise into the root zone and low enough to ensureto confirm this conclusion as differences between N120 adequate soil aeration.and N200 treatments were seldom significant over all grow- Subirrigation is expected to be more beneficial thaning seasons (Tables 2, 3, and 4). One plausible explana- conventional drainage during drier crop seasons as ittion may be that soil mineral N content in both treat- supplements rainfall to meet crop evapotranspirationments was too high and denitrification was not limited demand. Cooper et al. (1999) recorded a significant yield
increase from a SI treatment in 1991, a very dry year,in either one.
Table 2. Denitrification rates as influenced by water table depth and N fertilization rate in 1996.
Denitrification rate
Sampling date
Treatments 15 July 6 August 22 August 4 September 22 September 5 October
g N ha�1 d�1
FD† 185 32 27 6 14 5SI‡ 225 113 22 31 26 15N120§ 124 63 16 21 27 10N200¶ 285 82 33 15 13 11Mean 204 72 25 18 20 10
Summary of analysis of varianceWTM# NS†† ** NS * NS *N rate * NS NS ** NS NSWTM � N rate NS NS NS NS NS NS
* Significant at the 0.05 probability level.** Significant at the 0.01 probability level.† Free drainage.‡ Subirrigation.§ 120 kg N ha�1.¶ 200 kg N ha�1.# Water table management.†† Not significant.
ELMI ET AL.: WATER TABLE AND N FERTILIZATION MANAGEMENT 1865
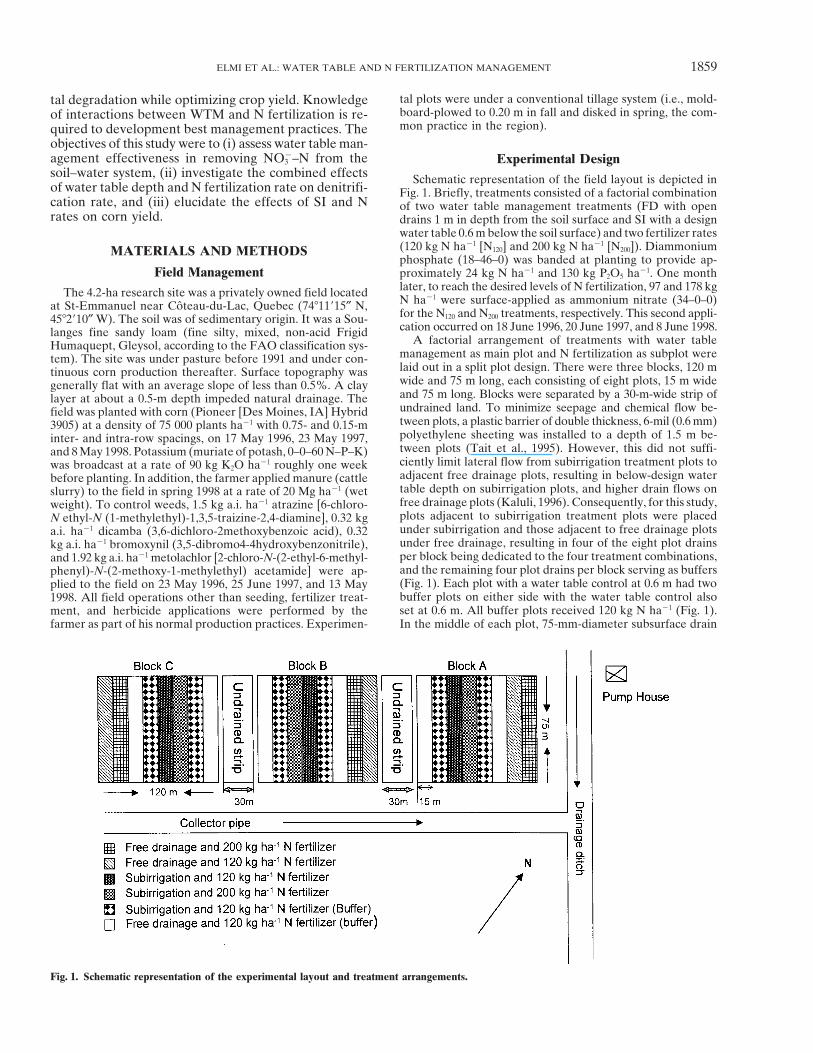
Table 3. Denitrification rates as influenced by water table management and N fertilization rate in 1997.
Denitrification rate
Sampling date
Treatment 28 May 11 June 26 June 11 July 23 July 6 August 18 August 3 September 17 September 3 October
g N ha�1 d�1
FD† 24 143 87 36 7 7 1 5 8 5SI‡ 480 195 151 38 14 7 9 12 20 11N120§ 37 150 143 35 12 9 7 11 18 10N200¶ 25 64 140 40 9 5 3 6 11 6Mean 33 138 130 37 10 7 5 8 14 8
Summary of analysis of variance
WTM# NS†† NS * NS * NS ** ** ** *N rate NS * NS NS NS NS NS NS NS NSWTM � N rate NA‡‡ NA NA NS NS NS NS NS NS NS
* Significant at the 0.05 probability level.** Significant at the 0.01 probability level.† Free drainage.‡ Subirrigation.§ 120 kg N ha�1.¶ 200 kg N ha�1.# Water table management.†† Not significant.‡‡ Not applicable.
whereas the more favorable growing conditions of 1992 Similar yields were obtained with SI and FD in 1996resulted in conventional drainage yields not differing and 1997. Yield reduction (25%) under SI in 1998 wasfrom those obtained under SI. These results suggest that attributed to the insufficient capacity of the controlledin favorable growing years there is no significant yield drainage–subirrigation system used to drain unusuallyadvantage for SI systems. abundant rainfall. This, however, should not adversely
Corn yield was not affected by N rate in 1998. This affect farmer’s acceptance of SI, as this situation couldis an indication that 120 kg N ha�1 was sufficient to have been averted with more rigorous management suchmaximize crop yield with WTM and favorable climatic as automating the system. Averaged across all soilconditions. The higher rates of N application (200 kg N depths, reduction in total soil NO�
3 –N under SI was 37%ha�1) produced significantly higher yields than the lower in the spring of 1997, 2% in the spring of 1998, 45% in(120 kg N ha�1) rate in 1996 and 1997, but not without the fall of 1997, and 19% in the fall of 1998. The adoptionpotential environmental cost, as NO�
3 –N in the soil– of WTM practices may provide an economical meanswater system was increased. to offer water quality benefits by enhancing NO�
3 re-moval from the soil–water system through denitrifica-
SUMMARY AND CONCLUSIONS tion. Concentrations of soil NO�3 were greater in plots
receiving a high rate of N fertilizer. Denitrification wasIntegrating water table management and N inputhigher in SI plots than FD plots, but it was seldomstrategies can minimize the risk of NO�
3 contaminationof water resources without compromising crop yields. significantly influenced by N application rate.
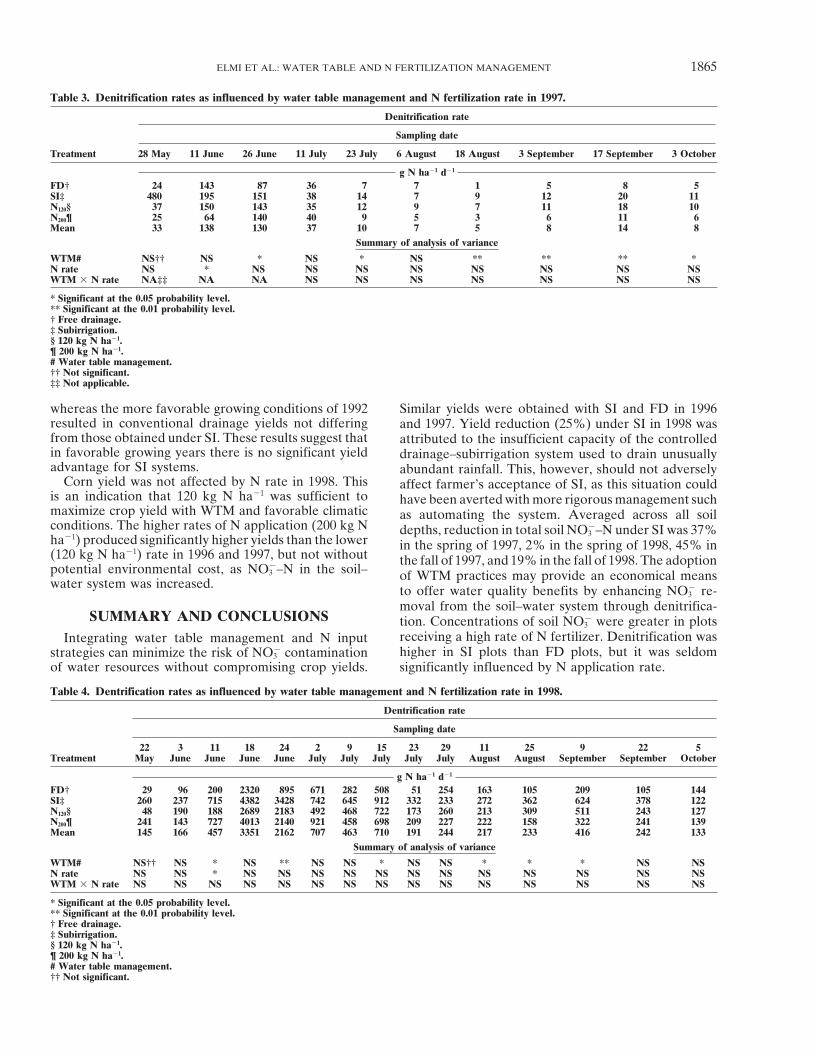
Table 4. Dentrification rates as influenced by water table management and N fertilization rate in 1998.
Dentrification rate
Sampling date
22 3 11 18 24 2 9 15 23 29 11 25 9 22 5Treatment May June June June June July July July July July August August September September October
g N ha�1 d�1
FD† 29 96 200 2320 895 671 282 508 51 254 163 105 209 105 144SI‡ 260 237 715 4382 3428 742 645 912 332 233 272 362 624 378 122N120§ 48 190 188 2689 2183 492 468 722 173 260 213 309 511 243 127N200¶ 241 143 727 4013 2140 921 458 698 209 227 222 158 322 241 139Mean 145 166 457 3351 2162 707 463 710 191 244 217 233 416 242 133
Summary of analysis of variance
WTM# NS†† NS * NS ** NS NS * NS NS * * * NS NSN rate NS NS * NS NS NS NS NS NS NS NS NS NS NS NSWTM � N rate NS NS NS NS NS NS NS NS NS NS NS NS NS NS NS
* Significant at the 0.05 probability level.** Significant at the 0.01 probability level.† Free drainage.‡ Subirrigation.§ 120 kg N ha�1.¶ 200 kg N ha�1.# Water table management.†† Not significant.

1866 J. ENVIRON. QUAL., VOL. 31, NOVEMBER–DECEMBER 2002
define the effects of water table depth on the ratio ofN2O to N2 evolved through denitrification.
ACKNOWLEDGMENTS
The authors wish to thank Mr. Guy Vincent, the owner ofthe experimental site, for his collaboration, Dr. Georges Dodds(post-doctoral fellow, Dep. of Agricultural and BiosystemsEngineering, McGill University) for his critical reading of themanuscript, and three anonymous reviewers whose commentshelped improve the focus of the paper. This research wassupported by a Natural Sciences and Engineering ResearchCouncil of Canada (NSERC) grant.
REFERENCESBeauchamp, E.G., D.W. Bergstrom, and D.L. Burton. 1996. Denitrifi-
cation and nitrous oxide in soil fallowed or under alfalfa or grass.Commun. Soil. Sci. Plant Anal. 27:87–99.
Bergstrom, D.W., and E.G. Beauchamp. 1993. Relationships betweendenitrification rate and determinant soil properties under barley.Can. J. Soil Sci. 73:567–578.
Comly, H.H. 1945. Cyanosis in infants caused by nitrates in well water.JAMA 29:112.
Cooper, R.L., N.R. Fausey, and J.W. Johnson. 1999. Yield responseof corn to a subirrigation/drainage management system in northernOhio. J. Prod. Agric. 12:74–77.
Doty, C.W. 1980. Crop water supplied by controlled and reversibledrainage. Trans. ASAE 23:1122–1126.
Drury, C.F., C.S. Tan, J.D. Gaynor, T.O. Oloyo, I.J. Van Vesenbeeck,and D.J. McKenny. 1997. Optimizing corn production and reducingnitrate losses with water table control–subirrigation. Soil Sci. Soc.Am. J. 61:889–895.
Ellis, S., S. Yamulki, E. Dixon, R. Harrison, and S.C. Jarvis. 1998.Denitrification and N2O emissions from a UK pasture soil followingthe early spring application of cattle slurry and mineral fertiliser.Plant Soil 202:15–25.
Elmi, A.A., C. Madramootoo, and C. Hamel. 2001. Water table man-agement as an emerging technology for bioremediation of NO�
3 –NFig. 6. Water-filled pore space (WFPS) as influenced by water tablecontaminated soils. Paper 10-112. CSAE/SCGR-NABEC, Guelph,management treatments in (a ) 1996, (b ) 1997, and (c ) 1998. Verti-ON, Canada.cal bars represent standard error of the mean (n � 3).
Evans, R., W. Skaggs, and R. Sneed. 1996. Economics of controlleddrainage and subirrigation systems. AG-397. North Carolina Coop.Our results suggest that denitrification can be an im-Ext. Serv., Raleigh.
portant mechanism to remove NO�3 from the soil–water Fan, M.X., A.F. MacKenzie, M. Abbott, and F. Cadrin. 1997. Denitrifi-
system and, therefore, control migration and entry of cation estimates in monoculture and rotation corn as influencedby tillage and nitrogen fertilizer. Can. J. Soil Sci. 77:389–396.NO�
3 into surface and ground water resources. It should,Fogiel, A.C., and H.W. Belcher. 1991. Water quality impacts of waterhowever, be pointed out that the greater denitrification
table management systems. ASAE Paper 91-2596. Am. Soc. Agric.rate under SI may lead to an increase in N2O production. Eng., St. Joseph, MI.Whether NO�
3 removal by denitrification is actually ben- Gelberg, K.H., L. Church, G. Casey, M. London, and D.S. Roerig.1999. Nitrate levels in drinking water in rural New York State.eficial to the environment without a major tradeoff de-Environ. Res. Sect. A 80:34–40.pends on which denitrification gases are produced. If a
Health Canada. 1996. Guidelines for Canadian drinking water quality.major portion of the gases produced is N2O, adoption6th ed. Canada Communications, Ottawa, ON.
of WTM techniques could increase atmospheric N2O Henault, C., X. Davis, J.L. Lucas, and J.C. German. 1998. Influenceloading. Since N2O is detrimental to the environment, of different agricultural practices (type of crop, form of N fertilizer)
on soil nitrous oxide emissions. Biol. Fertil. Soils 27:299–306.further research under field conditions is required toJacinthe, P.A., W.A. Dick, and L.C. Brown. 1999. Bioremediation of
nitrate-contaminated shallow soils using water table managementTable 5. Effect of water table management and nitrogen fertiliza-techniques: Nitrate removal efficiency. Trans. ASAE 42:1251–1259.tion rate on corn yield.†
Kalita, P.K., and R.S. Kanwar. 1993. Effect of water table managementWater table treatment Nitrogen fertilization treatment practices on the transport of nitrate-N to shallow groundwater.
Trans. ASAE 36:413–421.Year Free drainage Subirrigation 120 kg N ha�1 200 kg N ha�1
Kaluli, W.J. 1996. Water table management and cropping systems forMg ha�1 intensive corn production. Ph.D. thesis. McGill Univ., Dep. Agric.
1996 7.7 (0.5) 8.3 (0.5) 7.1 (0.45)b 8.7 (0.13)a Biosyst. Eng., Montreal, QC.1997 8.7 (0.6) 9.0 (0.5) 8.1 (0.5)b 9.7 (0.2)a Keeney, D.R., and T.H. DeLuca. 1993. Des Moines river nitrate in1998 8.7 (0.3)a 6.7 (0.42)b 7.8 (0.5) 7.5 (0.7) relation to watershed agricultural practices: 1945 versus 1980s.
J. Environ. Qual. 22:267–272.† Values with different letters in the same row and within water table orKliewer, B.A., and J.W. Gilliam. 1995. Water management effectsnitrogen treatments are statistically significantly different at (P � 0.05)
on denitrification and nitrous oxide evolution. Soil Sci. Soc. Am.based on Fisher’s F test. Values between parentheses are standard errorsof the mean (n � 3). J. 59:1694–1701.

ELMI ET AL.: WATER TABLE AND N FERTILIZATION MANAGEMENT 1867
Liang, B.C., E.G. Gregorich, and M. Schnitzer. 1995. Mineral nitrogen Sainju, U.M., B.P. Singh, and W.F. Whitehead. 1998. Crop root distri-bution and its effects on soil nitrogen cycling. Agron. J. 90:511–518.accumulation in soils as affected by water-soluble organic carbon
SAS Institute. 1996. SAS user’s guide. SAS Inst., Cary, NC.extracted from composted diary manure. Commun. Soil Sci. PlantSkaggs, R.W., W.R. Reynolds, and G.M. Chescheir. 1999. Effects ofAnal. 26:2711–2723.
subsurface drain depth on nitrogen losses from drained lands.Lind, A.M., and F. Eiland. 1989. Microbiological characterization andASAE Paper 99-2086. Am. Soc. Agric. Eng., St. Joseph, MI.nitrate reduction in subsurface soil. Biol. Fertil. Soils 8:197–203.
Smith, K.A. 1990. Greenhouse gas fluxes between land surface andMaag, M., and F.P. Vinther. 1999. Effects of temperature and water atmosphere. Prog. Phys. Geogr. 14:349–372.on gaseous emissions from soil treated with animal slurry. Soil Sci. Sommerfield, R.A., A.R. Mosier, and R.C. Musselman. 1993. CO2,Soc. Am. J. 63:858–865. CH4, and N2O flux through a Wyoming snowpack and implications
MacKenzie, A.F., M.X. Fan, and F. Cardin. 1997. Nitrous oxide emis- for global budgets. Nature 361:140–142.sions as affected by tillage, corn–soybean–alfalfa rotations and Tait, R., C.A. Madramootoo, and P. Enright. 1995. An instrumented,nitrogen fertilization. Can. J. Soil Sci. 77:145–152. field scale research facility for drainage and water quality studies.
Comput. Electron. Agric. 12:131–145.Madramootoo, C.A., K.A. Wayo, and P. Enright. 1992. Nutrient lossesTan, C.S., C.F. Drury, J.D. Gaynor, I. van Wesenbeeck, and M. Soul-through tile drains from potato fields. Appl. Eng. Agric. 8:639–646.
tani. 1996. Effect of water table management and nitrogen supplyMooney, H.A., P.M. Vitousek, and P.A. Matson. 1987. Exchangeon yield, plant growth, and water use of corn in undisturbed soilof materials between terrestrial ecosystems and the atmosphere.columns. Can. J. Plant Sci. 76:229–235.Science 238:926–932.
Thompson, T.L., T.A. Doerge, and R.E. Godin. 2000. Nitrogen andNational Oceanic and Atmospheric Administration. 1998. Climate water interactions in subsurface drip-irrigated cauliflower: II. Agro-research. Monthly reports. Available online at http://lwf.ncdc.noaa. nomic, economic, and environmental outcomes. Soil Sci. Soc. Am.gov/oa/reports/weather-events.html (verified 8 July 2002). NOAA, J. 64:412–418.Washington, DC. Weier, K.L., J.W. Doran, J.F. Power, and D.T. Walters. 1993. Denitrifi-
Patni, N.K., L. Masse, and P.Y. Jui. 1998. Groundwater quality under cation and the dinitrogen/nitrous oxide ratio as affected by soilconventional and no-tillage: I. Nitrate, electrical conductivity, and water, available carbon, and nitrate. Soil Sci. Soc. Am. J. 57:66–72.
Weil, R.R., R.A. Weismiler, and R.S. Turner. 1990. Nitrate contamina-pH. J. Environ. Qual. 27:869–877.tion of groundwater under irrigated Coastal Plain soils. J. Environ.Prasad, R., and J.F. Power. 1995. Nitrification inhibitors for agricul-Qual. 19:441–448.ture, health, and environment. Adv. Agron. 54:233–281.
Wesseling, J. 1974. Crop growth in wet soils. p. 7–37. In J. Van Schilf-Prunty, L., and B.R. Montgomery. 1991. Lysimeter study of nitrogengaard (ed.) Drainage for agriculture. ASA, Madison, WI.fertilizer and irrigation rates on quality of recharge water and corn Yeomans, J.C., J.M. Bremner, and G.W. McCarty. 1992. Denitrifica-
yield. J. Environ. Qual. 20:373–380. tion capacity and denitrification potential of subsurface soils. Com-Randall, G.W., D.R. Huggins, M.P. Russelle, D.J. Fuchs, W.W. Nel- mun. Soil Sci. Plant Anal. 23:919–927.
son, and J.L. Anderson. 1997. Nitrate losses through subsurface Yoshinari, T., R. Haynes, and R. Knowles. 1977. Acetylene inhibitiontile drainage in conservation reserve program, alfalfa, and row crop of nitrous oxide reduction and measurement of denitrification and
nitrogen fixation in soil. Soil Biol. Biochem. 9:177–183.systems. J. Environ. Qual. 26:1240–1247.