Long-term effects and economic consequences of treatments ...
465
Systematic review of the long-term effects and economic consequences of treatments for obesity and implications for health improvement A Avenell, J Broom, TJ Brown, A Poobalan, L Aucott, SC Stearns, WCS Smith, RT Jung, MK Campbell and AM Grant Health Technology Assessment 2004; Vol. 8: No. 21 HTA Health Technology Assessment NHS R&D HTA Programme May 2004
-
Upload
khangminh22 -
Category
Documents
-
view
0 -
download
0
Transcript of Long-term effects and economic consequences of treatments ...

Systematic review of the long-termeffects and economic consequences oftreatments for obesity andimplications for health improvement
A Avenell, J Broom, TJ Brown, A Poobalan, L Aucott, SC Stearns, WCS Smith, RT Jung, MK Campbell and AM Grant
Health Technology Assessment 2004; Vol. 8: No. 21
HTAHealth Technology AssessmentNHS R&D HTA Programme
May 2004
Copyright notice
© Queen's Printer and Controller of HMSO 2004 HTA reports may be freely reproduced for the purposes of private research and study and may be included in professional journals provided that suitable acknowledgement is made and the reproduction is not associated with any form of advertising Violations should be reported to [email protected] Applications for commercial reproduction should be addressed to HMSO, The Copyright Unit, St Clements House, 2–16 Colegate, Norwich NR3 1BQ

How to obtain copies of this and other HTA Programme reports.An electronic version of this publication, in Adobe Acrobat format, is available for downloading free ofcharge for personal use from the HTA website (http://www.hta.ac.uk). A fully searchable CD-ROM isalso available (see below).
Printed copies of HTA monographs cost £20 each (post and packing free in the UK) to both public andprivate sector purchasers from our Despatch Agents.
Non-UK purchasers will have to pay a small fee for post and packing. For European countries the cost is£2 per monograph and for the rest of the world £3 per monograph.
You can order HTA monographs from our Despatch Agents:
– fax (with credit card or official purchase order) – post (with credit card or official purchase order or cheque)– phone during office hours (credit card only).
Additionally the HTA website allows you either to pay securely by credit card or to print out yourorder and then post or fax it.
Contact details are as follows:HTA Despatch Email: [email protected]/o Direct Mail Works Ltd Tel: 02392 492 0004 Oakwood Business Centre Fax: 02392 478 555Downley, HAVANT PO9 2NP, UK Fax from outside the UK: +44 2392 478 555
NHS libraries can subscribe free of charge. Public libraries can subscribe at a very reduced cost of £100 for each volume (normally comprising 30–40 titles). The commercial subscription rate is £300 per volume. Please see our website for details. Subscriptions can only be purchased for the current orforthcoming volume.
Payment methods
Paying by chequeIf you pay by cheque, the cheque must be in pounds sterling, made payable to Direct Mail Works Ltdand drawn on a bank with a UK address.
Paying by credit cardThe following cards are accepted by phone, fax, post or via the website ordering pages: Delta, Eurocard,Mastercard, Solo, Switch and Visa. We advise against sending credit card details in a plain email.
Paying by official purchase orderYou can post or fax these, but they must be from public bodies (i.e. NHS or universities) within the UK.We cannot at present accept purchase orders from commercial companies or from outside the UK.
How do I get a copy of HTA on CD?
Please use the form on the HTA website (www.hta.ac.uk/htacd.htm). Or contact Direct Mail Works (seecontact details above) by email, post, fax or phone. HTA on CD is currently free of charge worldwide.
The website also provides information about the HTA Programme and lists the membership of the variouscommittees.
HTA

Systematic review of the long-termeffects and economic consequences oftreatments for obesity and implications for health improvement
A Avenell,1 J Broom,2* TJ Brown,1† A Poobalan,3
L Aucott,3 SC Stearns,4‡ WCS Smith,3 RT Jung,5
MK Campbell1 and AM Grant1
1 Health Services Research Unit, University of Aberdeen, UK2 Department of Clinical Biochemistry, Grampian University Hospitals NHS
Trust, Aberdeen and The Robert Gordon University School of LifeSciences, Aberdeen, UK
3 Department of Public Health, University of Aberdeen, UK4 Health Economics Research Unit, University of Aberdeen, UK5 Diabetes Centre, Tayside University Hospitals NHS Trust, Ninewells
Hospital, Dundee, UK† Present address: Health Economics Research at Manchester,
University of Manchester, Manchester, UK‡ Present address: Department of Health Policy and Administration,
University of North Carolina at Chapel Hill, North Carolina, USA
* Corresponding author
Declared competing interests of authors: Professor Jung served on the advisoryboards for orlistat (Roche Products Ltd) and sibutramine (Abbott, formerly Knoll) untilMay 2001. Professor Broom and Dr Avenell have received research funding from RocheProducts Ltd in the past and Professor Broom continues to receive funding from Roche.Professor Broom sits on the Roche Metabolic Advisory Board.
Published May 2004
This report should be referenced as follows:
Avenell A, Broom J, Brown TJ, Poobalan A, Aucott L, Stearns SC, et al. Systematic reviewof the long-term effects and economic consequences of treatments for obesity andimplications for health improvement. Health Technol Assess 2004;8(21).
Health Technology Assessment is indexed in Index Medicus/MEDLINE and Excerpta Medica/EMBASE.
NHS R&D HTA Programme
The research findings from the NHS R&D Health Technology Assessment (HTA) Programme directlyinfluence key decision-making bodies such as the National Institute for Clinical Excellence (NICE)
and the National Screening Committee (NSC) who rely on HTA outputs to help raise standards of care.HTA findings also help to improve the quality of the service in the NHS indirectly in that they form a keycomponent of the ‘National Knowledge Service’ that is being developed to improve the evidence ofclinical practice throughout the NHS.
The HTA Programme was set up in 1993. Its role is to ensure that high-quality research information onthe costs, effectiveness and broader impact of health technologies is produced in the most efficient wayfor those who use, manage and provide care in the NHS. ‘Health technologies’ are broadly defined toinclude all interventions used to promote health, prevent and treat disease, and improve rehabilitationand long-term care, rather than settings of care.
The HTA programme commissions research only on topics where it has identified key gaps in theevidence needed by the NHS. Suggestions for topics are actively sought from people working in theNHS, the public, consumer groups and professional bodies such as Royal Colleges and NHS Trusts.
Research suggestions are carefully considered by panels of independent experts (including consumers)whose advice results in a ranked list of recommended research priorities. The HTA Programme thencommissions the research team best suited to undertake the work, in the manner most appropriate to findthe relevant answers. Some projects may take only months, others need several years to answer theresearch questions adequately. They may involve synthesising existing evidence or designing a trial toproduce new evidence where none currently exists.
Additionally, through its Technology Assessment Report (TAR) call-off contract, the HTA Programme isable to commission bespoke reports, principally for NICE, but also for other policy customers, such as aNational Clinical Director. TARs bring together evidence on key aspects of the use of specifictechnologies and usually have to be completed within a limited time period.
The research reported in this monograph was commissioned by the HTA Programme as project number99/02/02. As funder, by devising a commissioning brief, the HTA Programme specified the researchquestion and study design. The authors have been wholly responsible for all data collection, analysis andinterpretation and for writing up their work. The HTA editors and publisher have tried to ensure theaccuracy of the authors’ report and would like to thank the referees for their constructive comments onthe draft document. However, they do not accept liability for damages or losses arising from materialpublished in this report.
The views expressed in this publication are those of the authors and not necessarily those of the HTAProgramme or the Department of Health.
HTA Programme Director: Professor Tom WalleySeries Editors: Professor John Gabbay, Dr Chris Hyde, Dr Ruairidh Milne,
Dr Rob Riemsma and Dr Ken Stein Managing Editors: Sally Bailey and Caroline Ciupek
ISSN 1366-5278
© Queen’s Printer and Controller of HMSO 2004
This monograph may be freely reproduced for the purposes of private research and study and may be included in professional journals providedthat suitable acknowledgement is made and the reproduction is not associated with any form of advertising.
Applications for commercial reproduction should be addressed to NCCHTA, Mailpoint 728, Boldrewood, University of Southampton, Southampton, SO16 7PX, UK.
Published by Gray Publishing, Tunbridge Wells, Kent, on behalf of NCCHTA.Printed on acid-free paper in the UK by St Edmundsbury Press Ltd, Bury St Edmunds, Suffolk.
Criteria for inclusion in the HTA monograph seriesReports are published in the HTA monograph series if (1) they have resulted from work commissionedfor the HTA Programme, and (2) they are of a sufficiently high scientific quality as assessed by the refereesand editors.
Reviews in Health Technology Assessment are termed ‘systematic’ when the account of the search,appraisal and synthesis methods (to minimise biases and random errors) would, in theory, permit thereplication of the review by others.
G

Objectives: To undertake a systematic review of thelong-term effects of obesity treatments on bodyweight, risk factors for disease, and disease.Methods: The study encompassed three systematicreviews that examined different aspects of obesitytreatments. (1) A systematic review of obesitytreatments in adults where the methods of theCochrane Collaboration were applied and randomisedcontrolled trials (RCTs) with a follow-up of at least 1 year were evaluated. (2) A systematic epidemiologicalreview, where studies were sought on long-termeffects of weight loss on morbidity and/or mortality,and examined through epidemiological modelling. (3) A systematic economic review that sought reportswith both costs and outcomes of treatment, includingrecent reports that assessed the cost-effectiveness ofpharmaceutical and surgical interventions. A Markovmodel was also adopted to examine the cost-effectiveness of a low-fat diet and exercise interventionin adults with obesity and impaired glucose tolerance. Results: The addition of the drugs orlistat orsibutramine was associated with weight loss andgenerally improved risk factors, apart from diastolicblood pressure for sibutramine. Metformin wasassociated with decreased mortality after 10 years in
obese people with type 2 diabetes. Low-fat diets wereassociated with continuing weight loss for 3 years andimprovements in risk factors, as well as prevention oftype 2 diabetes and improved control of hypertension.Insufficient evidence was available to demonstrate thebenefits of low calorie or very low calorie diets. Theaddition of an exercise or behaviour programme to dietwas associated with improved weight loss and riskfactors for at least 1 year. Studies combining low-fatdiets, exercise and behaviour therapy suggestedimproved hypertension and cardiovascular disease.Family therapy was associated with improved weightloss for 2 years compared to individual therapy. Therewas insufficient evidence to conclude that individualtherapy was more beneficial than group therapy.Weight lost more quickly (within 1 year), from theepidemiology review, may be more beneficial withrespect to the risk of mortality. The effects ofintentional weight loss need further investigation.Weight loss from surgical and non-surgical interventions for people suffering from obesity wasassociated with decreased risk of development ofdiabetes, and a reduction in low-density lipoproteincholesterol, total cholesterol and blood pressure, in the long term. Targeting high-risk individuals with
Health Technology Assessment 2004; Vol. 8: No. 21
iii
© Queen’s Printer and Controller of HMSO 2004. All rights reserved.
Abstract
Systematic review of the long-term effects and economicconsequences of treatments for obesity and implications forhealth improvement
A Avenell,1 J Broom,2* TJ Brown,1† A Poobalan,3 L Aucott,3 SC Stearns,4‡
WCS Smith,3 RT Jung,5 MK Campbell1 and AM Grant1
1 Health Services Research Unit, University of Aberdeen, UK2 Department of Clinical Biochemistry, Grampian University Hospitals NHS Trust, Aberdeen and
The Robert Gordon University School of Life Sciences, Aberdeen, UK3 Department of Public Health, University of Aberdeen, UK4 Health Economics Research Unit, University of Aberdeen, UK5 Diabetes Centre, Tayside University Hospitals NHS Trust, Ninewells Hospital, Dundee, UK† Present address: Health Economics Research at Manchester, University of Manchester, Manchester, UK‡ Present address: Department of Health Policy and Administration, University of North Carolina at Chapel Hill,
North Carolina, USA* Corresponding author

drugs or surgery was likely to result in a cost peradditional life-year or quality-adjusted life-year (QALY)of no more than £13,000. There was also suggestiveevidence of cost saving from treatment of people withtype 2 diabetes with metformin. Targeting surgery onpeople with severe obesity and impaired glucosetolerance was likely to be more cost-effective at £2329per additional life-year. Economic modelling over 6 years for diet and exercise for people with impairedglucose tolerance was associated with a high initial costper additional QALY, but by the sixth year the cost perQALY was £13,389. Results did not include cost savingsfrom diseases other than diabetes, and therefore maybe conservative. Conclusions: The drugs orlistat and sibutramineappear beneficial for the treatment of adults withobesity, and metformin for obese patients with type 2diabetes. Exercise and/or behaviour therapy appear to
improve weight loss when added to diet. Low-fat dietswith exercise, or with exercise and behaviour therapyare associated with the prevention of type 2 diabetesand hypertension. Long-term weight loss inepidemiological studies was associated with reducedrisk of type 2 diabetes, and may be beneficial forcardiovascular disease. Low-fat diets and exerciseinterventions in individuals at risk of obesity-relatedillness are of comparable cost to drug treatments.Long-term pragmatic RCTs of obesity treatments inpopulations with obesity-related illness or at high riskof developing such illness are needed (to include anevaluation of risk factors, morbidity, quality of life andeconomic evaluations). Drug trials that include dietaryadvice, plus exercise and/or behaviour therapy are alsoneeded. Research exploring effective types of exercise,diet or behaviour and also interventions to preventobesity in adults is required.
Abstract
iv

Health Technology Assessment 2004; Vol. 8: No. 21
v
List of abbreviations .................................. vii
Executive summary .................................... ix
1 Introduction ............................................... 1Prevalence .................................................. 1Who is at risk of obesity? ........................... 1Aetiology .................................................... 1Obesity co-morbidities ............................... 2Costs of obesity ........................................... 3Strategies for obesity .................................. 3Aims of this report ..................................... 4
2 Systematic review of RCTs ........................ 5Introduction ............................................... 5Methods ...................................................... 5Results ........................................................ 10Drug treatment ......................................... 11Dietary treatment ..................................... 47Multicomponent interventions ................. 65Family or group treatment ....................... 83Adding exercise and/or behaviour therapy....................................................... 93Further comparisons ................................. 113
Discussion ................................................... 118Addendum .................................................. 126
3 Epidemiological review and modelling .................................................... 127Introduction ............................................... 127Criteria for considering studies in this review .......................................................... 127Systematic literature search ........................ 128Methods of review ...................................... 128Results of systematic literature search ....... 129Results of the review ................................... 131Mortality ................................................... 132Diabetes mellitus ...................................... 133Lipids......................................................... 134Hypertension............................................. 136Other outcomes ......................................... 137
Discussion of the epidemiology results ......................................................... 139Addendum .................................................. 141
4 Systematic review of economic evaluations ................................................. 143Methods ...................................................... 143Results ........................................................ 144Summary .................................................... 150
5 An economic model of the cost-effectiveness of lifestyle treatments for obesity ............. 155Overview ..................................................... 155Description of the intervention and published effectiveness ............................... 155A Markov model to estimate cost-effectiveness ................................................ 156Results ........................................................ 159Discussion ................................................... 161
6 Conclusions ................................................ 163Implications for practice ............................ 163Recommendations for research .................. 164
Acknowledgements .................................... 167
References .................................................. 169
Appendix 1 Protocol for systematic review of RCTs ....................................................... 183
Appendix 2 Search strategies .................... 187
Appendix 3 Reviews searched for RCTs .... 191
Appendix 4 Trial eligibility form .............. 193
Appendix 5 Quality assessment form ............................................................ 195
Appendix 6 Data extraction form ............. 199
Appendix 7 References to included studies ......................................................... 207
Appendix 8 Tables of included studies ..... 217
Appendix 9 Characteristics of ongoing and recently completed RCTs not included in this review ............................... 303
Appendix 10 References to excluded RCTs ........................................................... 309
Appendix 11 Table of quality assessment ofincluded RCTs ............................................ 319
Appendix 12 Summary table of weight lossresults ......................................................... 321
Appendix 13 Statistical methods for estimation of standard deviation of change in weight ..................................................... 325
Contents

Contents
Appendix 14 Statistical methods for estimation of standard deviation of change in risk factors .............................................. 327
Appendix 15 Protocol for a systematic review of observational epidemiologicalevidence ...................................................... 329
Appendix 16 Search strategies .................. 331
Appendix 17 Data extraction and qualityassessment form ......................................... 333
Appendix 18 Excluded studies .................. 339
Appendix 19 Characteristics of prospectivestudies included in the review, and recentpapers and studies to update the epidemiology review for long-term health outcomes .................................................... 349
Appendix 19a Characteristics of prospectivestudies included in the review .................... 349
Appendix 19b Characteristics of recent papers and studies to update the epidemiology review for long-term healthoutcomes .................................................... 353
Appendix 20 Studies and subgroups withmortality results .......................................... 357
Appendix 21 Diabetes mellitus studies withbasic results ................................................ 371
Appendix 21a Diabetes mellitus ratios ..... 371
Appendix 21b Weight differences comparedwith glucose differences in type 2 diabetesmellitus patients ......................................... 377
Appendix 22 Lipid results ......................... 381
Appendix 22a Lipid paired t-test results ......................................................... 381
Appendix 22b Weight differences comparedwith lipid differences .................................. 385
Appendix 23 Hypertension results ........... 393
Appendix 23a Weight differences comparedwith blood pressure differences for diastolicand systolic blood pressure ........................ 393
Appendix 23b Weight differences comparedwith diastolic blood pressure differences ... 395
Appendix 23c Weight differences compared with systolic blood pressuredifferences .................................................. 401
Appendix 23d Other results relating tohypertension: all surgical ........................... 407
Appendix 24 Changes in weight andpsychological measures after a cycle of weightloss and regain ........................................... 409
Appendix 25 Sleep apnoea results ............ 411
Appendix 26 Methods of estimating measures of spread ..................................... 413
Appendix 27 Quality assessment .............. 415
Appendix 27a Quality assessment scores .......................................................... 415
Appendix 27b Quality assessment summaries .................................................. 417
Appendix 28 Definition of weight cycling ......................................................... 419
Appendix 29 Search strategies for thesystematic review of economic evaluations .................................................. 421
Appendix 30 Data extraction table foreconomic evaluations: orlistat .................... 423
Appendix 31 Data extraction table foreconomic evaluations: sibutramine ............ 425
Appendix 32 Data extraction table foreconomic evaluations: metformin .............. 427
Appendix 33 Data extraction table foreconomic evaluations: surgery ................... 429
Appendix 34 Data extraction table foreconomic evaluations: lifestyle interventions .............................................. 433
Appendix 35 Quality assessment table foreconomic evaluations: pharmacologicalinterventions .............................................. 439
Appendix 36 Quality assessment table foreconomic evaluations: surgical intervention for obese or morbidly obese patients ........ 441
Appendix 37 Quality assessment table foreconomic evaluations: lifestyle interventions .............................................. 443
Appendix 38 DATA 4.0 tree for base-caseMarkov model ............................................ 445
Health Technology Assessment reportspublished to date ....................................... 447
Health Technology Assessment Programme ................................................ 455vi

Health Technology Assessment 2004; Vol. 8: No. 21
vii
© Queen’s Printer and Controller of HMSO 2004. All rights reserved.
AHI apnoea–hypopnoea index
AHT arterial hypertension
AI apnoea index
AMED Allied and ComplementaryMedicine Database
ANOVA analysis of variance
ASSIA Applied Social Science Index andAbstracts
BAROS Bariatric Analysis and ReportingOutcome System
BCDD balanced calorie deficit diet
BIGPRO Biguanides in the Prevention ofthe Risk of Obesity
BMI body mass index
BP blood pressure
BPD biliopancreatic diversion
BT behaviour therapy
CHD coronary heart disease
CHO carbohydrate
CI confidence interval
CODE 2 Cost of Diabetes in Europe –Type 2
CONSORT Consolidated Standards ofReporting Trials
CRD Centre for Reviews andDissemination
CVD cardiovascular disease
DARE Database of Abstracts of Reviewsof Effectiveness
DBP diastolic blood pressure
DISH Dietary Intervention Study ofHypertension
DM diabetes mellitus
ECG electrocardiogram
EWL excess weight loss
Ex exercise
F female
FDPS Finnish Diabetes Prevention Study
GIT Groninger Intelligence Test
HbA1c glycosylated haemoglobin
HDL high-density lipoprotein
HMIC Health Management InformationConsortium
HOT Hypertension Optimal Treatment
HPT Hypertension Prevention Trial
HR hazard ratio
HRT hormone replacement therapy
HT hypertension
IBW ideal body weight
ICD intensive conventional diet
ICER incremental cost-effectiveness ratio
IGT impaired glucose tolerance
IHQL Index of Health Related Qualityof Life
IQR interquartile range
ITT intention to treat
LCD low-calorie diet
LDL low-density lipoprotein
LOCF last observation carried forward
M male
MAOI monoamine oxidase inhibitor
MI myocardial infarction
NA not applicable
NASH non-alcoholic steatohepatitis
NCEP National Cholesterol EducationProgram
continued
List of abbreviations

List of abbreviations
viii
List of abbreviations continued
NDNS National Diet and NutritionSurvey
NGT normal glucose tolerance
NHANES National Health and NutritionExamination Survey
NICE National Institute for ClinicalExcellence
NIDDM non-insulin-dependent diabetesmellitus
NPV Dutch Personality Inventory
NVM Dutch Shortened MinnesotaMultiphasic Personality Inventory
ODES Oslo Diet and Exercise Study
OGTT oral glucose tolerance test
OR odds ratio
PSMF protein-sparing modified fast
QALY quality-adjusted life-year
QoL quality of life
RCT randomised controlled trial
RR relative risk
Rx treatment
SA sleep apnoea
SAS sleep apnoea syndrome
SBP systolic blood pressure
SD standard deviation
SE standard error
SEM standard error of the mean
SF-36 Short Form 36
SIG Scale for Interpersonal Behaviour
SOS Swedish Obesity Subjects
SSRI selective serotonin reuptakeinhibitor
STORM Sibutramine Trial of ObesityReduction and Maintenance
Sx surgery
TAIM Trial of AntihypertensiveInterventions and Management
TG triglyceride
TOHP Trials of Hypertension Prevention
TONE Trial of Non-pharmacologicInterventions in the Elderly
UKNRR UK National Research Register
UKPDS United Kingdom ProspectiveDiabetes Study
VBG vertical banded gastroplasty
VLCD very low-calorie diet
WHO World Health Organization
WMD weighted mean difference
1 kcal = 4.18 kJ 1 kJ = 0.239 kcal
1 kg = 2.21 lb 1 lb = 0.454 kg
All abbreviations that have been used in this report are listed here unless the abbreviation is well known (e.g. NHS), or it has been used only once, or it is a non-standard abbreviation used only in figures/tables/appendices in which case the abbreviation is defined in the figure legend or at the end of the table.

Health Technology Assessment 2004; Vol. 8: No. 21
ix
© Queen’s Printer and Controller of HMSO 2004. All rights reserved.
BackgroundObesity is increasing in adults in the UK. In 19806% of men and 8% of women in England wereobese, by 2000 these figures were 21% for both menand women. Obesity is associated with increasedrisk of cardiovascular disease (CVD), type 2 diabetesmellitus, hypertension, cancer and osteoarthritis. In1998 the UK National Audit Office estimated thatobesity cost the NHS in England £480 million.
This is a systematic review of the long-term effects of obesity treatments, not only on bodyweight, but also on risk factors for disease, andmost importantly health.
Objectives1. To review systematically obesity treatments in
adults to identify therapies that impact byachieving weight reduction, risk factormodification or improved clinical outcomes.
2. Based on a systematic review ofepidemiological data, to model the impact ofmoderate weight reduction on reducing theburden of obesity-associated disease.
3. To review systematically health economicevaluations of obesity treatments and assesscosts to the NHS of these treatments.
4. To integrate the findings from the aboveobjectives.
MethodsFor the systematic review of obesity treatments inadults, the methods of the Cochrane Collaborationwere adopted, in which randomised controlledtrials (RCTs) with a follow-up of at least 1 yearwere evaluated.
For the systematic epidemiological review, studieswere sought on long-term (at least 2 years, or 5 years for surgery) effects of weight loss onmorbidity and/or mortality, and examined throughepidemiological modelling.
The systematic economic review sought reportswith both costs and outcomes of treatment. Recent
reports assess the cost-effectiveness ofpharmaceutical and surgical interventions. A Markov model was adopted to examine the cost-effectiveness of a low-fat diet and exerciseintervention in adults with obesity and impairedglucose tolerance.
Conclusions are presented by integrating theabove three components.
ResultsLimitations in the evidence available for thereviews, particularly inadequate sample size andreporting, lack of long-term follow-up and fewquality of life data, mean that most results shouldbe interpreted with caution.
First, regarding the addition of drugs to the diet,orlistat was associated with a weight change of–3.26 kg [95% confidence interval (CI) –4.15 to–2.37 kg] after 2 years, and beneficial changes inrisk factors. Sibutramine was associated with aweight change of –3.40 kg (95% CI –4.45 to–2.35 kg) after 18 months for people on a weightmaintenance diet and beneficial changes in riskfactors apart from diastolic blood pressure.Metformin was associated with decreased mortalityand myocardial infarction-related mortality in theUK Prospective Diabetes Study after 10 years.
Low-fat diets (which included 600 kcal/day deficitdiets) were associated with the prevention of type2 diabetes, and improved control of hypertension.These diets were associated with a weight loss after12 months of –5.31 kg (95% CI –5.86 to –4.77 kg)and improvements in risk factors, with weight losscontinuing for 3 years. Insufficient evidence wasavailable to assess putative benefits of low-calorieor very low-calorie diets.
Studies combining low-fat diets and exercise, withor without behaviour therapy, suggested improvedcontrol of hypertension and type 2 diabetes. Theaddition of an exercise programme to diet wasassociated with improved weight loss and riskfactors for at least 1 year. The addition of abehaviour therapy programme to diet was alsoassociated with improved weight loss for at least
Executive summary

Executive summary
x
1 year. It was unclear whether both exercise andbehaviour therapy together further enhanced theeffect of diet. Family therapy was associated withimproved weight loss for up to 2 years comparedwith individual therapy. However, there wasinsufficient evidence to conclude that individualtherapy was more beneficial than group therapy.
Second, women with obesity-related illnesses, whohad intentional weight loss, irrespective of theamount of weight lost, had an associated reducedrisk of death, CVD death, cancer and diabetes-related death. Weight loss appeared morebeneficial if achieved within 1 year. Men withgeneral illness who lost weight intentionallyappeared to have a reduced risk of diabetes-related death, but there was no demonstrableeffect on CVD mortality, and cancer mortalityappeared increased.
Long-term weight loss was associated with reducedrisk of developing type 2 diabetes and improvedglucose tolerance in men and women, especiallyafter surgery for obesity.
A weight loss of 10 kg was associated with a fall intotal cholesterol of 0.25 mmol/l and a fall indiastolic blood pressure of 3.6 mmHg. A weightloss of 10% was associated with a fall in systolicblood pressure of 6.1 mmHg.
Third, targeting high-risk individuals with drugsor surgery was likely to result in a cost peradditional life-year or quality-adjusted life-year(QALY) of no more than £13,000. There was alsosuggestive evidence of cost-saving from treatmentof people with type 2 diabetes with metformin.Targeting surgery at people with severe obesityand impaired glucose tolerance was likely to bemore cost-effective, at £2329 per additional life-year.
Economic modelling of diet and exercise over 6years for people with impaired glucose tolerancewas associated with a high initial cost peradditional QALY, but by the sixth year the cost perQALY was £13,389. Results were sensitive to thequality of life weights, for which there were verylimited data. Results did not include cost savingsfrom diseases other than diabetes, and thereforemay be conservative.
The cost of diet and exercise together appearcomparable to treatments, for example drugs, inobese individuals with risk factors, such asimpaired glucose tolerance.
ConclusionsImplications for healthcareOrlistat, sibutramine and metformin appearbeneficial for the treatment of adults with obesity.Exercise and/or behaviour therapy appear toimprove weight loss when added to diet. Low-fatdiets with exercise, with or without behaviourtherapy, are associated with the prevention of type 2 diabetes and hypertension.
Long-term weight loss in epidemiological studieswas also associated with reduced risk of developingdiabetes, and may be beneficial for cardiovasculardisease.
Low-fat diet and exercise interventions inindividuals at risk of obesity-related illness, such asdiabetes, are of comparable cost to drugtreatments.
Recommendations for research� RCTs and epidemiological studies are needed
in high-risk populations, particularly peoplewith co-morbidities, cardiovascular risk factorsor body mass index > 40 kg/m2.
� RCTs are needed in primary care in high-riskgroups.
� Drug trials should include lifestyleinterventions, in addition to dietary advice.
� Exercise or behaviour therapy alone for obesitymanagement should be reviewed.
� Further exploration of treatments for obesityshould examine which type of exercise orbehaviour therapy is best.
� A systematic review of treatments to preventobesity should be undertaken.
� Research is needed to provide a clearerunderstanding of the incremental cost-effectiveness of different treatments forsubgroups of high-risk individuals.
� Future RCTs should be adequately powered andadhere to the CONSORT statement forreporting. Guidelines are also required for theconduct and reporting of epidemiologicalstudies.
� Research and funding bodies should becommitted to structured long-term follow-upstrategies so that the long-term effects of short-term interventions can be assessed accurately.

PrevalenceObesity, defined as a body mass index [BMI =weight in kilograms/(height in metres)2] of 30 kg/m2
or more, is a chronic, progressive, relapsing disease,1
the prevalence of which is increasing exponentiallyand has reached epidemic proportions.2 It posesthe most significant public health problem facingthe UK in the twenty-first century. In 1980 theprevalence of obesity in England was 6% in menand 8% in women, by 1998 this had risen to 17%in men and 21% in women.3 In 2000 21% of menand 21% of women in England were classified asobese.3 The problem, however, is not onlyconfined to the UK but is a pandemic affectingboth developed and developing countries.1 Similartrends are seen for the classification of overweight(BMI � 25 to < 30 kg/m2), with the most recentsurvey indicating that 45% of men and 34% ofwomen were overweight.3 Thus, 66% of men and55% of women in England are either overweightor obese. Predicted trends in obesity amongst menand women in England extrapolated to 2010indicate that 26% of men and 28% of women willbe clinically obese, imposing a huge burden onhealthcare.2 Within Europe the InternationalObesity Taskforce estimates that the prevalence ofobesity increased between 10% and 40% from thelate 1980s to the late 1990s, although during thesame period the prevalence in England doubled.1
This indicates a shift in position from being at thelower end of the range for obesity in Europe inthe 1980s to the top of the range currently.
Who is at risk of obesity?Sectors of the population are at considerablyhigher risk of developing obesity, with aconcomitant increase in the incidence andprevalence of obesity-related co-morbidities.4
Those individuals considered to be at high risk ofdeveloping obesity include:
� children, for genetic and/or environmentalreasons, from families where at least one parentis obese5–7
� individuals of Asian origin,8 where thedefinition of obesity may need to be altered forthat specific population1
� people who stop smoking9
� people from lower social classes (defined ashead of household social class): 14% of womenin social class I are obese compared with 28% insocial class V10
� older people: increasing age is associated withincreasing prevalence of obesity up to the age of64 years, then a decline in the prevalencebegins.3
In addition, there appear to be certain time-pointsin life when the risks of developing obesityincrease: in men in their late thirties, in womenentering long-term partnerships, duringpregnancy, at the menopause and on retirement.
AetiologyMajor genetic, environmental and socio-cultural(or behavioural) factors play roles in thedevelopment of obesity.1 Abdominal obesity ismore common in men and in women with higherandrogen levels, for example in the polycysticovarian syndrome. This suggests that abdominalfat deposition may have a hormonal basis.
Adoption studies11–13 have demonstrated that theweight of children is related to their naturalparents. Genes also appear to play a role in thedistribution of body fat. Single gene defectsidentified with the obese phenotype are relativelyfew but increasing with time. The most commondefect is that of the melanocortin-4 receptor,contributing to about 5% of obesity.14 Overall thegenetic influence has been estimated to contribute25–40% to the aetiology of obesity.13
Many genetic polymorphisms have beenassociated with the propensity to gain excessweight. The mechanism by which genes causeobesity is not known despite searches foralterations in metabolic rate and altered energysubstrate metabolism.
However, genetic factors do not impingedramatically on the increasing prevalence ofdisease. Most human obesity results from the sumof effects of the environment on several differentsusceptibility genes causing excess adiposity.15
Health Technology Assessment 2004; Vol. 8: No. 21
1
© Queen’s Printer and Controller of HMSO 2004. All rights reserved.
Chapter 1
Introduction

Clearly, with the rapid evolution of the obesephenotype there has not been time to alter thegene pool. Consequently, changes in theenvironment and lifestyle since the 1970s haveplayed the dominant role in provoking the currentepidemic of obesity. Although there is anappreciable genetic predisposition to obesity, thedisease does not occur without an alteration in theindividual’s energy balance, that is, inappropriatefood intake and/or change in the physical activitylevel. Both of these are affected by themacroenvironment (e.g. food availability insupermarkets and safety to walk or play) and themicroenvironment (i.e. the home).
Changes in eating behaviour over the years havecertainly affected the prevalence of obesity.Evidence suggests that the percentage of fat in thediet has been increasing with time and that thispredisposes to increased deposition of fat.16 Thus,population approaches to dealing with the obesityproblem have centred on reducing fat intake inassociation with increased activity.
Levels of activity within the population have alsoreduced dramatically since the 1980s, with amarked increase in sedentary habits, such aswatching television and playing computer games.Thus, both the reduction in activity and increasein sedentary pursuits are associated with decreasedenergy expenditure and provide a majorcontribution to obesity in the population. Diet andlifestyle changes have thus provided the cornerstonefor obesity treatment over the years.17–19
Obesity co-morbiditiesObesity is the primary aetiological factor in anumber of disease processes. A BMI greater than30 kg/m2 is associated with an increase in all-causemortality.20 It is not just the amount of fat in thebody, but also its distribution that determines therisks of diseases associated with obesity. Abdominalor visceral fat (android obesity) is the typeparticularly associated with impaired glucosetolerance or type 2 diabetes, hypertension anddyslipidaemia, which contribute markedly to therisk of cardiovascular disease (CVD) and thehealth costs of obesity. Impaired glucose toleranceand diabetes are associated with higher plasmaglucose and glycosylated haemoglobin (a long-term measure of plasma glucose control, HbA1c).
High levels of total cholesterol, low-densitylipoprotein (LDL) cholesterol and triglycerides(TGs) increase the risk of CVD, as do higher levels
of systolic and diastolic blood pressure (SBP andDBP). Conversely, low levels of high-densitylipoprotein (HDL) cholesterol increase the risk ofCVD, such that it may be beneficial to increase thelevels of HDL. In general, the greater the degreeof obesity, the greater the associated risk factors.
Obesity-associated diseases can be classified intofive major areas:
� chronic disease� CVD/stroke� cancer� metabolic/endocrine disease� psychosocial disease.
Chronic diseases include osteoarthritis (primarilyof knees and hips), chronic back pain, obstructivelung disease, sleep apnoea and cholelithiasis.
Data from the Framingham Heart Study21 clearlydemonstrate a positive correlation between obesityand the incidence of CVD. Obesity is implicated inthe causation of
� coronary heart disease (CHD)� congestive cardiac failure� cerebrovascular disease (haemorrhagic and non-
haemorrhagic).
A direct relationship between obesity andcerebrovascular disease is not clear but is morelikely to be implicated through effects on bloodpressure and metabolic parameters, such asplasma lipids.
Several cancers are more prevalent in obeseindividuals than the non-obese. These can beclassified into hormone dependent and hormoneindependent. Associated metabolic changes,specifically in sex hormone production, in peoplewith obesity, may be the underlying aetiologicalfactors in the development of cancer in the breast,ovary, uterus and prostate.1 There is also anincreased risk of development of hormone-independent tumours in obesity, such as colorectalcancer.1
Perhaps the most common obesity-related co-morbidity, and that which is likely to cause thegreatest health burden, is type 2 (non-insulin-dependent) diabetes mellitus (NIDDM). Around70% of type 2 diabetes appears to be related tohaving a BMI > 25 kg/m2.1 With increasing weight,the risk of developing type 2 diabetes increasesexponentially.22 Obesity is a triggering factor inabnormal glucose metabolism resulting in an
Introduction
2

insulin-resistant state. This is also associated withabnormalities in lipid metabolism.
Obesity is thus a primary aetiological factor in thedevelopment of the disease burden affecting theUK population, but few resources are allocated toits prevention or treatment. Resources areprimarily allocated to the treatment of theassociated co-morbidities with major costs tosociety.
Costs of obesityThe recent National Audit Office Report2
highlighted the direct and indirect costs of theobesity burden in the UK relative to treatmentcosts of the co-morbidity burden. This report wasunable to evaluate the costs of obesity-related backpain and several other conditions and thereforethe true costs may exceed the estimates. Obesityaccounted for 18 million lost working days due toassociated illness and 30,000 deaths in 1998 forEngland. The direct cost of treatment of obesityand associated co-morbidities was conservativelyestimated at £480 million (1.5% of the total NHSexpenditure in England). Indirect costs due to lostearnings were estimated for England in 1998 at£2150 million.
Strategies for obesityWith the increasing prevalence of obesity it is thusessential to assess and develop suitable treatmentstrategies that will result in long-term weightreduction and maintenance of weight loss. It is,therefore, of paramount importance to evaluatethose treatments, either singly or in combination,that are likely to produce the best results.Treatments to evaluate include all aspects of dietand lifestyle alteration, with or withoutpharmacotherapy, and in some cases surgery.
Orlistat (Xenical®‚ manufactured by Roche) andsibutramine (Reductil® and Meridia®‚manufactured by Abbott) are two drugs whichcurrently have product licences in the UK for thetreatment of obesity. Both have been reviewed forand evaluated by the National Institute forClinical Excellence (NICE).23–26 Other drugs thatare sometimes used to aid weight loss aremetformin (Glucophage®‚ Lipha; Glucamet®‚Opus), acarbose (Glucobay®‚ Bayer), and theselective serotonin reuptake inhibitors (SSRIs)fluoxetine (Prozac®‚ Dista; Felicium®‚ Opus) andsertraline (Lustral®‚ Pfizer).
Orlistat inhibits all gastrointestinal lipases, whichare needed to absorb dietary fat. By reducing fatabsorption caloric intake is decreased, and it isessential to follow a low-fat diet if thegastrointestinal side-effects of fat malabsorptionare to be avoided. Present UK guidelines23
recommend that orlistat is prescribed only after aweight loss of 2.5 kg over the preceding month, inpeople with a BMI ≥ 28 kg/m2 with significant co-morbidities (e.g. type 2 diabetes, high bloodpressure and/or high total cholesterol) or BMI≥ 30 kg/m2 with no associated co-morbidities. It isrecommended that orlistat only be continued ifweight loss is over 5% in the first 3 months, and10% in the first 6 months. Treatment is not usuallycontinued beyond 1 year and never beyond 2 years.23
Sibutramine is a reuptake inhibitor ofnoradrenaline, serotonin and to a lesser extentdopamine in the brain. It reduces food intake byproducing a feeling of satiety. Present UKguidelines24 recommend use only for people witha BMI ≥ 27 kg/m2 with significant co-morbidities,or ≥ 30 kg/m2 without associated co-morbidities.Sibutramine is associated with an increase in bloodpressure in some people, thus regular review ofblood pressure is recommended. It is advised24
that treatment continuation requires a 2 kg weightloss in the first 4 weeks and a 5% weight loss fromthe start of treatment in the first 3 months.Sibutramine treatment is not recommendedbeyond 12 months.
Acarbose inhibits the digestion of starch andsucrose in the gut and is used to improve bloodglucose control in people with diabetes.
Metformin decreases the release of glucose intothe circulation and increases glucose uptake intothe tissues, thus also improving blood glucosecontrol in people with diabetes. Metformin isbeing used increasingly to decrease resistance tothe action of insulin in people who are obese andhave polycystic ovary syndrome.
The SSRIs, which are primarily used to treatdepression, inhibit the uptake of serotonin by thebrain and are known to also inhibit appetite.
Surgery for people with obesity (BMI ≥ 40 kg/m2,or BMI ≥ 35 kg/m2 with significant co-morbidities)has recently been reviewed for, and evaluated by,NICE.27,28 When compared with conventionaltreatment, surgery was associated with greaterweight loss (23–37 kg at 2 years), which wasmaintained at 8 years, and improved quality of life
Health Technology Assessment 2004; Vol. 8: No. 21
3
© Queen’s Printer and Controller of HMSO 2004. All rights reserved.

and co-morbid conditions. Gastric bypass wasassociated with more weight loss, and/orimprovements in co-morbidities andcomplications, than gastroplasty or jejunoilealbypass.
Previous systematic reviews of randomisedcontrolled trials (RCTs) of obesity treatments inadults include those undertaken by the NHSCentre for Reviews and Dissemination (CRD) inYork, UK,29 and for the United States NationalInstitutes of Health.19 There is a need to updatethese reviews, in view of the rapidly increasingnumber of RCTs.
RCTs of interventions for the treatment of adultobesity have generally been short-term, onlyreporting changes in weight and cardiovascularrisk factors. There is a need to evaluate longerterm epidemiological evidence to see how changesin weight and risk factors could translate intochanges in morbidity and mortality.
The projected impact of weight loss on obesity-associated disease can be modelled and the overallimpact on resource utilisation for treatmentstrategies can then be evaluated.
Aims of this reportThe aims of this report are thus four-fold:
1. To carry out a systematic review of obesitytreatments in adults to identify those therapiesthat will impact by achieving weight reduction,risk factor modification or improved clinicaloutcomes (reported in Chapter 2).
2. Based on epidemiological data, and systematicreview of such data, to model the impact ofmoderate weight reduction on reducing theburden of obesity-associated disease (reportedin Chapter 3).
3. To review systematically health economicevaluations of obesity treatments and to assessthe impact of treatments on the costs to theNHS by the application of modellingtechniques in specific disease areas (reported inChapters 4 and 5).
4. To integrate the findings from the aboveobjectives (reported in Chapter 6).
Introduction
4

IntroductionThe methods of the systematic review of RCTswere based on those used by the CochraneCollaboration.30 For the synthesis andpresentation of the data on clinical effectiveness,the format of the Cochrane Collaboration waschosen. The principal reason for this decision wasthat the reviews were based on RCTs, andcustomised software (Review Manager version4.2.2) was available for the preparation andanalysis of systematic reviews, which incorporatedstatistical programmes for meta-analysis, whenappropriate.
MethodsDevelopment of protocolA review protocol (for full details please seeAppendix 1) was formulated using the structurerecommended by the Cochrane Collaboration.30
The protocol explicitly described:
� the objectives of the review� the types of studies, participants and
interventions required of studies for inclusion� the outcome measures of importance� the search strategy to be used for identification
of trials� the methods of quality assessment� the methods of data abstraction and qualitative
and quantitative synthesis of results.
Study inclusion criteriaThis systematic review was limited to assessingRCTs. It is widely acknowledged that the RCT isthe ‘gold standard’ design for the evaluation ofhealthcare interventions as it ensures that thepotential for bias in results is minimised.Subsequent to the development of the protocol, itwas necessary to provide additional clarification oninclusion criteria. RCTs were only included if a fullstudy report, published or unpublished, could beobtained. Information published as abstracts onlywas not included.
AdultsIncluded RCTs had to have a mean or median agefor all groups of 18 years or over.
BMI cut-offAs a result of the recommendations by NICE (seeNICE website)23,24 for cut-offs in BMI forprescribing drugs for the treatment of obesity inadults, the review was limited to RCTs with a meanor median BMI of 28 kg/m2 or over for all groupscombined. Where heights were not provided, BMIwas estimated using the following imputed values:
� for US populations 1.768 m for males and1.636 m for females, based on National Healthand Nutrition Examination Survey (NHANES)III data31
� for other populations 1.745 m for males and1.617 m for females, based on the UK NationalDiet and Nutrition Survey (NDNS).32
Assumed heights were still used in the calculationof BMI, even if the percentage of overweightparticipants was given.
DurationIncluded RCTs had to have a mean or medianduration of 52 weeks or over for all groups. Thelength of the RCT was counted fromrandomisation. The period included the period ofactive intervention, however long, and period offollow-up. Where results were presented from thestart of a non-randomised run-in period, changesin outcomes were calculated by working outdifferences from the time of randomisation.
Types of interventionsInterventions took the form of drugs, diets,exercise, behaviour therapy, surgery andcomplementary therapies specifically aimed toreduce weight or prevent weight gain. Prespecifieddiet categories were:
� healthy eating advice� 600 kcal/day deficit or low-fat diet� low-calorie diet (LCD): 1000 – 1600 kcal/day� very low-calorie diet (VLCD): <1000 kcal/day� protein-sparing modified fast (PSMF), where
the carbohydrate content was ≤ 40 g/day,irrespective of calorie content. This categoryalso included the low-carbohydrate Optifast andModifast slimming products
� low-carbohydrate, high-monounsaturated fatdiet
Health Technology Assessment 2004; Vol. 8: No. 21
5
© Queen’s Printer and Controller of HMSO 2004. All rights reserved.
Chapter 2
Systematic review of RCTs

� salt restriction (where compared with weightloss).
Information provided on diets was ofteninsufficient to distinguish clearly among thecategories given above. Although healthy eatingadvice and the 600 kcal/day deficit or low-fat dietwere specified in the protocol as separatecategories, no distinction could be made betweenthese groups and thus they were combined underthe heading 600 kcal/day deficit or low-fat diet.Where the calorie content of a diet as a result offat or calorie restriction was not clearly stated, orcould not be estimated, it was placed in thecategory 600 kcal/day deficit or low-fat diet. If anintervention included two or more diets, e.g.VLCD followed by an LCD, the most stringentcalorie restriction was used to classify the diet,irrespective of the time for which it was given.
Multifaceted interventions, incorporating clearefforts at smoking cessation or salt reduction inaddition to weight loss for reduction ofcardiovascular risk, were not included. This wasbecause smoking cessation or salt reduction mayalso cause changes in weight and risk factors, andhence the effect of the weight loss interventionalone could not be identified.
For exercise or behaviour therapy interventions,study investigators had to give a detaileddescription of the components of the intervention(and details of the theories and components in thecase of behaviour therapy). If, for example, thestudy only reported that participants were asked toincrease their level of exercise with no furtherdetails, this was not categorised as an exerciseintervention.
In some cases participants entered the randomisedphase of the study after a non-randomised weightloss phase. If the weight loss phase beforerandomisation was over 3 months, the randomisedphase was called ‘weight maintenance’, rather than‘weight reduction’. For drug trials the second yearof two year studies was also examined separatelyas a period of weight maintenance.
Types of outcomesWeight loss, or prevention of weight gain had tobe explicitly stated as a main outcome of the study.The protocol prespecified that weight change andchanges in waist circumference would beexamined, however defined. Eventually a decisionwas made to examine weight change in kilogramsonly, because this was provided by more studiesthan any other measure. Waist circumference was
not examined owing to the time constraints of thereview. In many cases the percentage changes inweight could not be calculated, as no startingweight was given.
Search strategy for the identificationof studies for inclusion in thesystematic reviewThe systematic search for studies of effectivenesswas limited to finding RCTs. A broad searchstrategy was adopted to identify as many RCTs aspossible relevant to the management of adultpatients with a BMI ≥ 28 kg/m2. This allowed theestablishment of a register of RCTs relevant to themanagement of obesity, which can be used infuture systematic reviews in this area (includingCochrane Reviews).
Systematic electronic bibliographic databasesearchingThirteen electronic databases were searchedsystematically:
� MEDLINE (National Library of Medicine, USA:the electronic version of Index Medicus) usingthe search software Ovid
� EMBASE (Elsevier Science Publishers, TheNetherlands: the electronic version of ExcerptaMedica) using the search software Ovid
� BIOSIS (Biological Abstracts, USA: theelectronic version of Biological Abstracts) usingthe search software BASIS
� CAB Nutrition Abstracts and Reviews(Commonwealth Agricultural BureauInternational Publishing, UK) using the searchsoftware Ovid
� The Cochrane Controlled Trials Register(Cochrane Collaboration, UK: Update Software,2001; Issue 1, CD-ROM version)
� PsycINFO (American Psychological Association,USA) using the search software SilverPlatter
� Science Citation Index (ISI Web of Science,Thomson Scientific, USA), accessed viahttp://wos.mimas.ac.uk
� British Library Inside, accessed viahttp://www.bl.uk.inside
� CINAHL (CINAHL Information Systems, USA:Cumulative Index of the Nursing and AlliedHealth Literature) using the search softwareOvid
� HealthSTAR (Health Services, Technology,Administration and Research, National Libraryof Medicine; and American HospitalAssociation, Chicago, USA) using the searchsoftware Ovid
� AMED (Allied and Complementary MedicineDatabase produced by the Health Care
Systematic review of RCTs
6

Information Service of the British Library)using the search software Ovid
� SPORTDiscus (Sport Information ResourceCentre, Canada) using the search software Ovid
� UK National Research Register (ongoing andrecently completed research projects funded by,or of interest to the UK NHS), accessed viahttp://update-software.com/National/
For full details of the search strategies, includingthe periods searched, see Appendix 2.
Handsearching of specific journalsNutrition journals, particularly in the field ofobesity, were handsearched to locate RCTs,particularly those mentioned in conferenceabstracts and supplements. Handsearching wasundertaken by one researcher.
The following journals were handsearched(including all supplements):
� International Journal of Obesity (Volume 1, part 1,1977 to Volume 24, part 12, 2000)
� Obesity Research (Volume 1, part 1, 1993 toVolume 9, part 2, 2001)
� Obesity Surgery (Volume 1, part 1, 1991 toVolume 11, part 2, 2001)
� American Journal of Clinical Nutrition (Volume 18,part 5–6, 1966 to Volume 72, part 6, 2000)
� Proceedings of the Nutrition Society (Volume 19,part 1, 1960 to Volume 59, part 4, 2000)
� Journal of Human Nutrition and Dietetics (Volume1, part 1, 1988 to Volume 14, part 1, 2001)
� Journal of the American Dietetic Association(Volume 77, part 1, 1980 to Volume 90, part 12,1990).
Electronic searching for references finished at theend of April 2001. However, the following journalswere handsearched from January 2001 to the endof June 2001, to locate references that might nothave been indexed by the above databases:
� American Journal of Clinical Nutrition� Annals of Internal Medicine� Archives of Internal Medicine� British Medical Journal� International Journal of Obesity� Journal of Consulting and Clinical Psychology� Journal of Human Nutrition and Dietetics� Journal of the American Medical Association� Lancet� New England Journal of Medicine� Obesity Research� Obesity Surgery� Proceedings of the Nutrition Society.
Other methods of ascertainment of RCTsReference lists of selected articlesThe reference lists of other reviews (both narrativeand systematic) and identified RCTs were checkedfor possible RCTs. For a list of the reviews thatwere checked see Appendix 3.
Abstracts and UK National Research Register(UKNRR)Authors of abstracts, including those in theUKNRR, which appeared to report eligible RCTswere contacted in order to obtain full reports,published or unpublished, for this review.
Triallists and biomedical companiesKnown triallists in the field were contacted forfurther details of their trials, as well aspharmaceutical companies if the triallists wereunable to provide information. Roche ProductsLtd provided further details for three studies.33–38
Other experts in the fieldOwing to the tight timescale of the report, triallistswere not contacted for details of any otherrelevant RCTs.
Identification of possible RCTsAll possible RCTs were electronically imported ormanually entered into the reference managingsoftware package, Reference Manager (version 9.0,Research Information Systems, Carlsbad, CA,USA). Subject keywords, notes and sources of thearticles were added.
Register of possible RCTsAll electronically derived abstracts and study titleswere assessed for inclusion by one researcher usinga standard form (see Appendix 4). In cases ofuncertainty a second researcher also assessedabstracts and study titles. Those studies identifiedas relevant or possibly relevant were then obtainedas full reports.
Change in scope of the reviewThe time constraints placed on the report, thevery large number of RCTs identified and theconcurrent HTA review of surgery for obesityundertaken for NICE27 meant not all of theinterventions specified in the original protocolcould be examined. This review did not examinecomparisons between low-fat and low-calorie diets,where the intention was to provide a comparisonof two types of reducing diet with the same calorievalue, as this is the subject of a Cochrane review,which found no evidence to suggest that fat-restricted diets were better than calorie-restricteddiets in achieving weight loss.39 The review did
Health Technology Assessment 2004; Vol. 8: No. 21
7
© Queen’s Printer and Controller of HMSO 2004. All rights reserved.

not compare two kinds of diet from the samecategory, for example a VLCD supplied from thediet compared with a VLCD from diet and liquidsupplements, and did not examine comparisonsbetween low-sodium and weight-loss diets.
Reports of RCTs of obesity surgery were passed toresearchers undertaking the HTA review of obesitysurgery for NICE.27 The present authors did notduplicate this review, but refer to it in this report.Complementary medicines were not reviewed.Exercise and/or behaviour therapies wereexamined only where they were provided inconjunction with dietary advice, that is, examiningthe added effect of behaviour therapy and/orexercise over and above diet. Thus, no comparisonwas made of dietary advice alone with exercisealone for weight management. There wasinsufficient time to subcategorise exercise andbehaviour interventions to examine how the typeof exercise or behaviour therapy influencedoutcomes.
The number of drugs examined in this review wasreduced from that in the original protocol. Thedrugs examined were orlistat, sibutramine,metformin, acarbose and SSRIs (e.g. fluoxetine).The authors chose to re-examine orlistat andsibutramine, despite the HTA reviews forNICE,25,26 because new studies were availablesubsequent to these reviews and because furtherdata analysis was undertaken beyond the scope ofthese reviews.
Quality assessment of studiesFull copies of studies were assessed by oneresearcher for methodological quality using astandard form (see Appendix 5). A secondresearcher checked the quality assessment scoring.The assessors were not blinded to author,institution or journal. Any differences of opinionwere resolved by discussion, with reference to athird researcher if no agreement could be reached.Where studies were reported as ‘double-blind’ itwas assumed that both participants and healthcareproviders were blinded, unless otherwise stated. Itwas also assumed that weight was always measuredby the healthcare provider, unless otherwise stated.
Data abstractionA data abstraction form was generated for thereview before the actual abstraction of the datafrom each paper (see Appendix 6; see Appendix 7for a list of studies). Only comparisons andoutcomes that had been identified a priori in theprotocol were included. For each study, the data
were abstracted by a single researcher, and thenchecked by a second researcher, before beingentered into Review Manager. Any differences of opinion were resolved by discussion, withreference to a third researcher if no agreementcould be reached. A second researcher alsochecked data entry into Review Manager. Where only graphical data were available, images were scanned onto computer and analysed.
Data analysisWhere results from studies could be quantitativelycombined, a statistical meta-analysis of the datawas undertaken to determine the typical effect size of the intervention. For continuous data a weighted mean difference (WMD) was calculated(weighted by the inverse of the variance). Fordichotomous data a ‘typical’ odds ratio (OR) wasderived. Analyses for both dichotomous data, suchas mortality, and continuous data adopted a fixedeffects approach.
All comparisons were framed in terms ofunfavourable events, rather than freedom fromadverse symptoms. An OR of less than 1 wouldfavour the experimental treatment, and an ORgreater than 1 would favour the control treatment.Ninety-five per cent confidence intervals (CIs)were derived for all comparisons. Meta-analysisgraphs have been presented where possible. Anannotated example of such a graph is shown inFigure 1.
Meta-analyses of risk factors demonstrate whethertreatment or control is favoured. For somecontinuous outcomes a higher value indicated abetter outcome; for example, a higher HDL isbetter. Labelling of the horizontal axis has beenchanged in such cases.
Evidence of heterogeneity across studies wasexplored using the chi-squared test forheterogeneity; if evidence of significant heterogeneity was identified, potential sources of heterogeneity were sought. If data could not becombined quantitatively they were assessedqualitatively.
Results from cluster randomised trials arereported separately from other RCTs. In the caseof cross-over studies, results are presented for datafrom the first period only if this lasted for at least52 weeks.
In some studies several analyses of weight lossdata were undertaken. The analysis with the
Systematic review of RCTs
8

Health Technology Assessm
ent2004; Vol. 8: No. 21
9
© Q
ueen’s Printer and Controller of H
MSO
2004. All rights reserved.
Indicatessubgroupanalysis
Line of no effect
Estimates that lie to theleft of the ‘line of no effect’indicate that the result favours the experimental treatment
The horizontal linesare the 95% confidenceintervals around theestimate
‘Diamond’ indicates pooledestimate. Because it does not crossthe ‘line of no effect’ the estimate isstatistically significant (theresult is compatible with an effect)
Comparison:Outcome:
Orlistat 360 mg/day vs placebo at 12 monthsWeight change
Study n
01 Weight reduction Broom, 2001a Davidson, 1999 Finer, 2000 Hauptman, 2000 Hollander, 1998 Lindgarde, 2000 Rossner, 2000 Sjostrom, 1998Subtotal (95% CI)Test for heterogeneity Chi2 = 15.08, df = 7, p = 0.035Test for overall efect z = 12.53, p < 0.00001
259657110210156190241343
2166
Mean (SD)
–5.80 (8.50)–8.76 (9.48)–3.29 (6.85)–5.40 (7.44)–3.84 (5.00)–4.20 (7.03)–8.13 (8.22)–8.10 (8.21)
n
263223108212151186236340
1719
Mean (SD)WMD
(95% CI fixed)
–2.30 (6.40)–5.81 (10.01)–1.31 (6.29)–1.41 (6.31)–1.43 (5.10)–2.90 (6.74)–5.23 (7.40)–3.90 (7.02)
Weight(%)
8.76.54.88.4
11.47.57.4
11.165.8
WMD(95% CI fixed)
–3.50 (–4.79 to –2.21)–2.95 (–4.45 to –1.45)–1.98 (–3.73 to –0.23)–3.99 (–5.31 to –2.67)–2.41 (–3.54 to –1.28)–1.30 (–2.69 to 0.09)–2.90 (–4.30 to –1.50)–4.20 (–5.35 to –3.05)–3.01 (–3.48 to –2.54)
02 Weight maintenance Davidson, 1999 Hauptman, 2000 Hill, 1999 Rossner, 2000Subtotal (95% CI)Test for heterogeneity Chi2 = 13.45, df = 3, p = 0.0038Test for overall effect z = 2.54, p = 0.01
153210113241717
3.20 (5.57)2.92 (6.74)2.62 (6.66)2.15 (6.52)
138212121236707
5.63 (4.93)2.49 (6.62)4.40 (7.16)2.17 (6.53)
10.09.04.6
10.634.2
–2.43 (–3.64 to –1.22) 0.43 (–0.84 to 1.70)–1.78 (–3.55 to –0.01)–0.02 (–1.19 to 1.15)–0.85 (–1.50 to –0.19)
Subtotal (95% CI)Test for heterogeneity Chi2 = 56.31, df = 1, p < 0.00001Test for overall effect z = 11.65, p < 0.00001
2883 2426 100.0 –2.27 (–2.65 to –1.89)
–10 –5 5 100Favours controlFavours treatment
Treatment Control
FIGURE 1 How to interpret a meta-analysis plot

largest number of participants was always used;this was an intention-to-treat (ITT) analysis, ifavailable. In some cases the results presentedincluded the last recorded weight of people whodropped out, carried forward to the end of thetrial [last observation carried forward (LOCF)].Notes on data handling are provided in the Tableof included studies (Appendix 8).
In studies where there were multiple comparisonsagainst the same control group the control groupwas split for dichotomous data. However, the samecontrol group was used on more than oneoccasion, where indicated, in a meta-analysis ofcontinuous data.
Purported serious adverse events in the RCTs were scarce and are generally not presented in themeta-analysis plots, but are reported in the text ofthe results.
Handling of missing dataTo utilise fully data for meta-analysis that requiredthe mean and standard deviation (SD) of thechange between two time-points, severalassumptions were made. Where weight or riskfactors were presented as actual values rather thanchanges, differences were calculated by subtractionof the end-point value from the value at time ofrandomisation. Changes expressed as mediansand interquartile ranges (IQRs) were assumed tobe mean changes and 50% CIs. In the case ofmissing SDs for changes in weight and risk factors,assumptions were made (irrespective of whetherthe changes were negative or positive). A linearregression was made of the SD of the meanchange in weight on the absolute mean change forweight, for the studies which provided these data,and used to impute values for missing SDs (seeAppendix 13):
� SD of weight change in kg = 5.915 + (0.283 × mean change in weight, whethernegative or positive).
Similar linear regressions were attempted for riskfactors. However, clear relationships were notfound, so the means of reported SDs were used to impute values for missing SDs (see Appendix 14):
� SD for change in SBP = 12.7 mmHg� SD for change in DBP = 8.3 mmHg � SD for change in cholesterol = 1.08 mmol/l� SD for change in LDL cholesterol = 0.74 mmol/l� SD for change in HDL cholesterol = 0.29 mmol/l� SD for change in triglycerides = 0.96 mmol/l.
In the case of fasting plasma glucose and HbA1c,two levels of SDs were used, to allow for thegreater variability of such measures evident fromthe studies.
� If the initial fasting plasma glucose was< 7 mmol/l, the SD for change in fasting plasmaglucose was 1.35 mmol/l.
� If the initial fasting plasma glucose was≥ 7 mmol/l, the SD for change in fasting plasmaglucose was 3.77 mmol/l.
� If the initial HbA1c was < 7%, the SD for changein HbA1c was 0.71%.
� If the initial HbA1c was ≥ 7%, the SD for changein HbA1c was 2.58%.
Where continuous data were provided with onefigure after the decimal point, Review Managerinputs a zero in the second place after the decimalpoint as a default mechanism. This implies adegree of precision that was not provided in thedata.
ReportingThe review is reported in a modified form of the standard format of the CochraneCollaboration.
ResultsResults of literature searchThe flow chart (Figure 2) indicates the filteringprocess for RCTs:
The CRD report from York29 was searched initiallyand provided 23 out of 84 primary reports ofRCTs included in this review. This representedonly 23 out of the 99 studies covered by the Yorkreview. This was due to the different focus of thereview here, which did not include RCTs ofdexfenfluramine, surgical treatments, behaviourand exercise treatments (unless as an adjunct todiet), or studies in children.
Of the electronic databases, the MEDLINE searchstrategy was designed and executed first. Table 1displays the databases in the order that they weresearched. The last column indicates how manyadditional RCTs were identified as each databasewas searched, for example, the five EMBASE RCTswere not found on MEDLINE. Forty out of 84primary reports of RCTs included in the reviewwere initially located in MEDLINE. Thirty-two ofthe RCTs included in the review were found byhandsearching (23 from the York review and sevenfrom other sources).
Systematic review of RCTs
10

The remaining 12 primary reports of RCTs werefound (in descending order of numbers found) in EMBASE, the Cochrane Controlled TrialsRegister, CAB Nutrition Abstracts and Reviews,HealthSTAR and PsycINFO.
Seven other databases did not provide anyadditional primary reports of RCTs included inthe review. These databases were BIOSIS,CINAHL, AMED, SPORTDiscus, the UK NationalResearch Register, British Library Inside and theScience Citation Index.
Excluded RCTs are detailed in Appendix 10.
Effects of orlistat 360 mg/day and dietversus placebo and diet Description of studiesNine RCTs provided change in weight at 12 months or longer.33–38,40–56 Eight of theseinterventions aimed to produce weight reductionin the first year.33–38,40–47,50–56 Three of these eightstudies aimed to produce weight maintenance inthe second year.37,38,41,42,45–47 One study aimed to
produce weight maintenance during a 1-yearintervention following a 6-month run-in weightreduction phase.48,49 The meta-analyses for thesedata are therefore split into weight reduction andweight maintenance subgroups where the secondyears of the 2-year studies are categorised asweight maintenance. The overall changes for 2-year studies are also presented in meta-analyses.
One study recruited people with type 2diabetes33,34 and two studies recruited people athigh cardiac risk.35,36,40,50,51 Data were providedfor blood pressure, lipids, fasting plasma glucoseand HbA1c at 12 months and all except for HbA1c
at 24 months. All the studies reported using ITTanalysis, but it was unclear whether this wascarried out as participants were excluded afterrandomisation for protocol violations. Reportedmean BMI ranged from 32.6 kg/m2 48,49 to37.1 kg/m2.35,36,40
All the studies included a single-blind pretreatmentrun-in phase, which ranged from 2 weeks35,36,40,50,51
to 5 weeks33,34 for the weight reduction studies
Health Technology Assessment 2004; Vol. 8: No. 21
11
© Queen’s Printer and Controller of HMSO 2004. All rights reserved.
Potentially relevant publicationsidentified and screened for retrieval:32,725
Number of reports of possible RCTs:2163
Papers excluded on the basis of titlesand abstract (generally due to lack ofsuitability of study design, type ofintervention or population): 30,562
Reports of RCTs: 1442
Papers excluded as not RCT, or notrequired intervention or population:721
Reports of RCTs included (many RCTshad multiple publications): 214
Reports excluded: 1228, of which 230 (see Appendix 10) had requiredintervention but were excluded forone reason only from the followinglist: duration too short, BMI not≥ 28 kg/m2, abstract only available,weight reduction advice notrandomised, report unobtainable,no usable data. Remaining 998 excluded for two or more reasonsfrom the above listFinal number of RCTs included in
review: 84
FIGURE 2 Flow diagram for locating RCTs for systematic review

and 6 months for the 1-year weight maintenancestudy.48,49 All the studies included dietary advicefor all participants, and the study by Hauptmanand colleagues45–47 included an exerciseprescription for all participants.
There was the possibility of unblinding of bothparticipants and healthcare providers owing to thegastrointestinal adverse events associated withorlistat, such as oily stools. With the exception ofthe study by Lindgarde and colleagues,50,51 dropoutrates in the control groups (24–42%) were alwayshigher than in the intervention groups (15–36%).
Review resultsThe added effect of orlistat 360 mg/day on weightreduction produced an overall WMD weightchange at 12 months of –3.01 kg (95% CI –3.48 to–2.54 kg) (Figure 3). The added effect of orlistat360 mg/day on weight maintenance produced anoverall WMD weight change after 12 months of–0.85 kg (95% CI –1.50 to –0.19 kg) with evidenceof heterogeneity in these four studies (Figure 3).There is no readily apparent cause for thisheterogeneity. In three of these four studies energyintake was increased over this period,41,42,45–49 butthis appears unrelated to the weight change.
All the risk factors for the 1-year weight reductionphase showed beneficial changes, except for HDL
cholesterol, which showed a small decrease, andTGs (Figures 4–11). There was evidence ofheterogeneity for HbA1c, fasting plasma glucoseand triglycerides for this 12-month weightreduction phase. This may have related to theinclusion of people with diabetes in twostudies.33,34,50,51 After 12 months of orlistat inpeople with diabetes a change in HbA1c of –0.27%(95% CI –0.38 to –0.15%) compared with thecontrol group was observed, and –0.11% (95% CI–0.20 to –0.02%) for non-diabetics compared with controls. Similarly, for fasting glucose theobserved change was –0.58 mmol/l (95% CI –0.80to –0.36 mmol/l) for diabetics compared with controls and –0.16 mmol/l (95% CI –0.27 to–0.05 mmol/l) for non-diabetics. However, for TGs observed changes were less markedbetween diabetics compared with controls (–0.05 mmol/l, 95% CI –0.19 to 0.09 mmol/l) and non-diabetics (0.05 mmol/l, 95% CI –0.03 to 0.14 mmol/l). For the 12-month weightmaintenance phase there were no added benefitson risk factors.
Two weight reduction studies produced an overallWMD weight change at 24 months of –3.26 kg(95% CI –4.15 to –2.37 kg) (Figure 12).37,38,45–47 By24 months the beneficial effects of orlistat on riskfactors were still seen, with the exception oftriglycerides and SBP (Figures 13–19).
Systematic review of RCTs
12
TABLE 1 Results of literature search
Source Total no. of reports No. of reports of Source of primary report identified possible RCTs of RCTs included in review
HandsearchCRD Report York 23
DatabasesMEDLINE 6,163 1,078 40EMBASE 10,588 380 5CAB Nutrition Abstracts and Reviews 2,664 48 2BIOSIS 2,695 58 0HealthSTAR 47 3 1CINAHL 1,557 48 0AMED 59 5 0SPORTDiscus 415 24 0UK National Research Register 452 38 0Cochrane Controlled Trials Register 4,340 226 3British Library Inside 251 21 0Science Citation Index 548 39 0PsycINFO 2,946 195 1
Other handsearchingSources other than CRD Report York 7
Triallists 2
Totals 32,725 2,163 84
Sources of RCTs are listed in order of searching, together with the number of additional RCTs found in that source.

Health Technology Assessment 2004; Vol. 8: No. 21
13
© Queen’s Printer and Controller of HMSO 2004. All rights reserved.
Comparison: 01 Orlistat 360 mg/day + diet vs placebo + diet at 12 months Outcome: 01 Weight change (kg)
Study Treatment Control WMD (fixed) Weight WMD (fixed)or sub-category n Mean (SD) n Mean (SD)
01 Weight reductionBroom, 2001a 259 –5.80 (8.50) 263 –2.30 (6.40) 8.72 –3.50 (–4.79 to –2.21) Davidson, 1999 657 –8.76 (9.48) 223 –5.81 (10.01) 6.47 –2.95 (–4.45 to –1.45) Finer, 2000 110 –3.29 (6.85) 108 –1.31 (6.29) 4.78 –1.98 (–3.73 to –0.23) Hauptman, 2000 210 –5.40 (7.44) 212 –1.41 (6.31) 8.40 –3.99 (–5.31 to –2.67) Hollander, 1998 156 –3.84 (5.00) 151 –1.43 (5.10) 11.40 –2.41 (–3.54 to –1.28) Lindgarde, 2000 190 –4.20 (7.03) 186 –2.90 (6.74) 7.52 –1.30 (–2.69 to 0.09) Rossner, 2000 241 –8.13 (8.22) 236 –5.23 (7.40) 7.40 –2.90 (–4.30 to –1.50) Sjostrom, 1998 343 –8.10 (8.21) 340 –3.90 (7.02) 11.10 –4.20 (–5.35 to –3.05)
Subtotal (95% CI) 2166 1719 65.78 –3.01 (–3.48 to –2.54)Test for heterogeneity: Chi2 = 15.08, df = 7 (p = 0.04), I2 = 53.6%Test for overall effect: z = 12.53 (p < 0.00001)
02 Weight maintenanceDavidson, 1999 153 3.20 (5.57) 138 5.63 (4.93) 10.00 –2.43 (–3.64 to –1.22) Hauptman, 2000 210 2.92 (6.74) 212 2.49 (6.62) 8.96 0.43 (–0.84 to 1.70) Hill, 1999 113 2.62 (6.66) 121 4.40 (7.16) 4.64 –1.78 (–3.55 to –0.01) Rossner, 2000 241 2.15 (6.52) 236 2.17 (6.53) 10.62 –0.02 (–1.19 to 1.15)
Subtotal (95% CI) 717 707 34.22 –0.85 (–1.50 to –0.19)Test for heterogeneity: Chi2 = 13.45, df = 3 (p = 0.004), I2 = 77.7%Test for overall effect: z = 2.54 (p = 0.01)
Total (95% CI) 2883 2426 100.00 –2.27 (–2.65 to –1.89)Test for heterogeneity: Chi2 = 56.31, df = 11 (p < 0.00001), I2 = 80.5%Test for overall effect: z = 11.65 (p < 0.00001)
–10 –5 0 5 10
Favours treatment Favours control
(95% CI) (%) (95% CI)
FIGURE 3
Comparison: 01 Orlistat 360 mg/day + diet vs placebo + diet at 12 months Outcome: 02 Change in total cholesterol (mmol/l)
01 Weight reductionBroom 2001a 259 –0.12 (1.08) 263 0.16 (1.08) 10.66 –0.28 (–0.47 to –0.09) Finer 2000 110 –0.05 (0.76) 108 0.30 (0.68) 10.00 –0.35 (–0.54 to –0.16) Hauptman 2000 210 –0.04 (1.08) 212 0.30 (1.08) 8.62 –0.34 (–0.55 to –0.13) Hollander 1998 156 –0.05 (0.60) 151 0.41 (0.70) 17.16 –0.46 (–0.61 to –0.31) Lindgarde 2000 190 0.03 (1.08) 186 0.26 (1.08) 7.68 –0.23 (–0.45 to –0.01) Rossner 2000 241 –0.35 (1.08) 236 –0.05 (1.08) 9.74 –0.30 (–0.49 to –0.11) Sjostrom 1998 343 –0.08 (1.08) 340 0.23 (1.08) 13.95 –0.31 (–0.47 to –0.15)
Subtotal (95% CI) 1509 1496 77.80 –0.34 (–0.41 to –0.27)Test for heterogeneity: Chi2 = 4.27, df = 6 (p = 0.64), I2 = 0%Test for overall effect: z = 9.67 (p < 0.00001)
02 Weight maintenanceHauptman 2000 210 0.29 (1.08) 212 0.14 (1.08) 8.62 0.15 (–0.06 to 0.36) Hill 1999 87 0.08 (1.08) 102 0.17 (1.08) 3.84 –0.09 (–0.40 to 0.22) Rossner 2000 241 0.38 (1.08) 236 0.36 (1.08) 9.74 0.02 (–0.17 to 0.21)
Subtotal (95% CI) 538 22.20 0.05 (–0.08 to 0.18)Test for heterogeneity: Chi2 = 1.78, df = 2 (p = 0.41), I2 = 0%Test for overall effect: z = 0.79 (p = 0.43)
Total (95% CI) 2047 100.00 –0.25 (–0.31 to –0.19)Test for heterogeneity: Chi2 = 33.59, df = 9 (p = 0.0001), I2 = 73.2%Test for overall effect: z = 8.16 (p < 0.00001)
–1 –0.5 0 0.5 1
Favours treatment Favours control
Study Treatment Control WMD (fixed) Weight WMD (fixed)or sub-category n Mean (SD) n Mean (SD) (95% CI) (%) (95% CI)
550
2046
FIGURE 4

Systematic review of RCTs
14
Comparison: 01 Orlistat 360 mg/day + diet vs placebo + diet at 12 months Outcome: 03 Change in LDL cholesterol (mmol/l)
01 Weight reductionBroom 2001a 259 –0.30 (0.74) 263 –0.02 (0.74) 11.94 –0.28 (–0.41 to –0.15) Finer 2000 110 –0.11 (0.63) 108 0.21 (0.53) 8.07 –0.32 (–0.47 to –0.17) Hauptman 2000 210 –0.12 (0.74) 212 0.25 (0.74) 9.65 –0.37 (–0.51 to –0.23) Hollander 1998 156 –0.12 (0.50) 151 0.22 (0.70) 10.34 –0.34 (–0.48 to –0.20) Lindgarde 2000 190 –0.22 (0.74) 186 0.07 (0.74) 8.60 –0.29 (–0.44 to –0.14) Rossner 2000 241 –0.33 (0.74) 236 –0.06 (0.74) 10.91 –0.27 (–0.40 to –0.14) Sjostrom 1998 343 –0.09 (0.74) 340 0.13 (0.74) 15.62 –0.22 (–0.33 to –0.11)
Subtotal (95% CI) 1509 1496 75.14 –0.29 (–0.34 to –0.24)Test for heterogeneity: Chi2 = 3.53, df = 6 (p = 0.74), I2 = 0%Test for overall effect: z = 11.28 (p < 0.00001)
02 Weight maintenanceHauptman 2000 210 0.18 (0.74) 212 0.11 (0.74) 9.65 0.07 (–0.07 to 0.21) Hill 1999 87 –0.05 (0.74) 102 0.12 (0.74) 4.30 –0.17 (–0.38 to 0.04) Rossner 2000 241 0.37 (0.74) 236 0.34 (0.74) 10.91 0.03 (–0.10 to 0.16)
Subtotal (95% CI) 538 550 24.86 0.01 (–0.08 to 0.10)Test for heterogeneity: Chi2 = 3.56, df = 2 (p = 0.17), I2 = 43.8%Test for overall effect: z = 0.24 (p = 0.81)
Total (95% CI) 2047 2046 100.00 –0.22 (–0.26 to –0.17)Test for heterogeneity: Chi2 = 41.16, df = 9 (p < 0.00001), I2 = 78.1%Test for overall effect: z = 9.66 (p < 0.00001)
–0.5 –0.25 0 0.25 0.5
Favours treatment Favours control
Study Treatment Control WMD (fixed) Weight WMD (fixed)or sub–category n Mean (SD) n Mean (SD) (95% CI) (%) (95% CI)
FIGURE 5
Comparison: 01 Orlistat 360 mg/day + diet vs placebo + diet at 12 months Outcome: 04 Change in HDL cholesterol (mmol/l)
01 Weight reductionFiner 2000 110 0.15 (0.23) 108 0.16 (0.21) 9.29 –0.01 (–0.07 to 0.05) Hauptman 2000 210 0.06 (0.29) 212 0.11 (0.29) 10.36 –0.05 (–0.11 to 0.01) Hollander 1998 156 0.06 (0.20) 151 0.06 (0.20) 15.85 0.00 (–0.04 to 0.04) Lindgarde 2000 190 0.03 (0.29) 186 0.08 (0.29) 9.23 –0.05 (–0.11 to 0.01) Rossner 2000 241 0.08 (0.29) 236 0.15 (0.29) 11.71 –0.07 (–0.12 to –0.02) Sjostrom 1998 343 0.10 (0.29) 340 0.10 (0.29) 16.78 0.00 (–0.04 to 0.04)
Subtotal (95% CI) 1250 1233 73.23 –0.03 (–0.05 to –0.01)Test for heterogeneity: Chi2 = 7.07, df = 5 (p = 0.22), I2 = 29.3%Test for overall effect: z = 2.43 (p = 0.01)
02 Weight maintenanceHauptman 2000 210 0.01 (0.29) 212 –0.02 (0.29) 10.36 0.03 (–0.03 to 0.09) Hill 1999 89 –0.04 (0.29) 103 0.00 (0.29) 4.69 –0.04 (–0.12 to 0.04) Rossner 2000 241 0.04 (0.29) 236 0.01 (0.29) 11.71 0.03 (–0.02 to 0.08)
Subtotal (95% CI) 540 551 26.77 0.02 (–0.02 to 0.05)Test for heterogeneity: Chi2 = 2.29, df = 2 (p = 0.32), I2 = 12.8%Test for overall effect: z = 1.01 (p = 0.31)
Total (95% CI) 1790 1784 100.00 –0.01 (–0.03 to 0.00)Test for heterogeneity: Chi2 = 13.87, df = 8 (p = 0.09), I2 = 42.3%Test for overall effect: z = 1.56 (p = 0.12)
–0.5 –0.25 0 0.25 0.5
Favours control Favours treatment
Study Treatment Control WMD (fixed) Weight WMD (fixed)or sub-category n Mean (SD) n Mean (SD) (95% CI) (%) (95% CI)
FIGURE 6
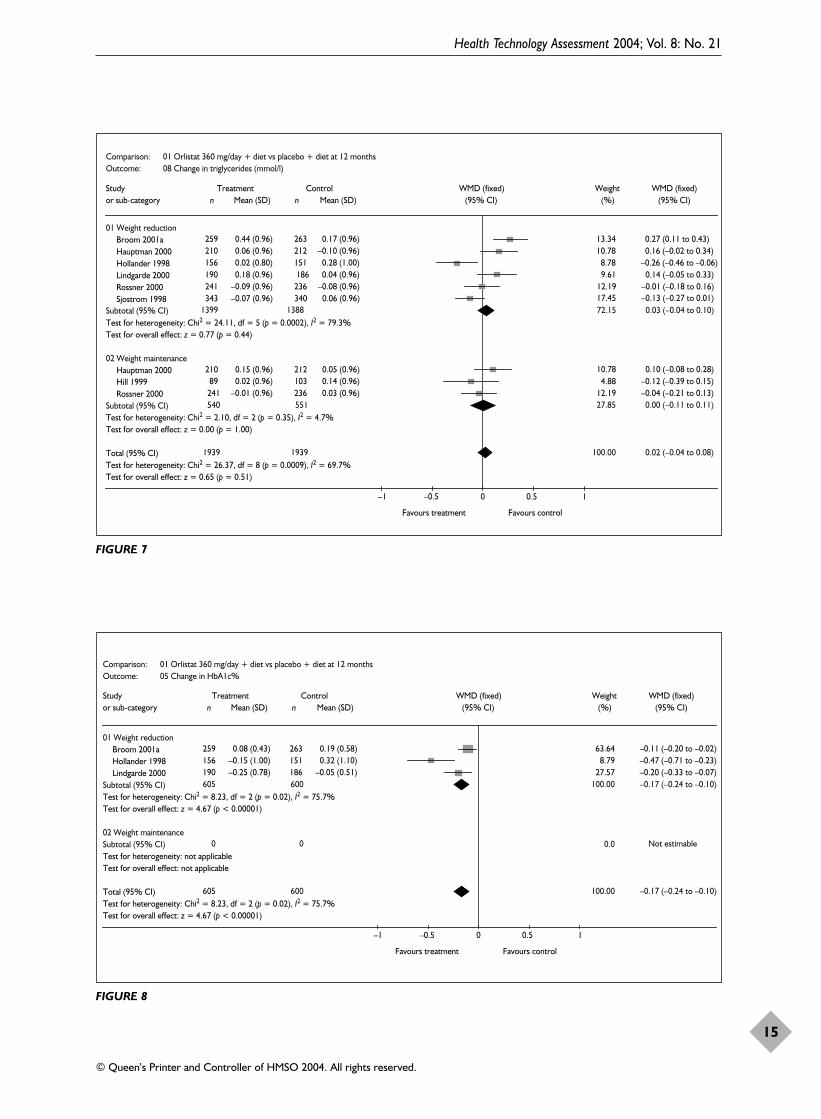
Health Technology Assessment 2004; Vol. 8: No. 21
15
© Queen’s Printer and Controller of HMSO 2004. All rights reserved.
Comparison: 01 Orlistat 360 mg/day + diet vs placebo + diet at 12 months Outcome: 08 Change in triglycerides (mmol/l)
01 Weight reductionBroom 2001a 259 0.44 (0.96) 263 0.17 (0.96) 13.34 0.27 (0.11 to 0.43) Hauptman 2000 210 0.06 (0.96) 212 –0.10 (0.96) 10.78 0.16 (–0.02 to 0.34) Hollander 1998 156 0.02 (0.80) 151 0.28 (1.00) 8.78 –0.26 (–0.46 to –0.06) Lindgarde 2000 190 0.18 (0.96) 186 0.04 (0.96) 9.61 0.14 (–0.05 to 0.33) Rossner 2000 241 –0.09 (0.96) 236 –0.08 (0.96) 12.19 –0.01 (–0.18 to 0.16) Sjostrom 1998 343 –0.07 (0.96) 340 0.06 (0.96) 17.45 –0.13 (–0.27 to 0.01)
Subtotal (95% CI) 1399 1388 72.15 0.03 (–0.04 to 0.10)Test for heterogeneity: Chi2 = 24.11, df = 5 (p = 0.0002), I2 = 79.3%Test for overall effect: z = 0.77 (p = 0.44)
02 Weight maintenanceHauptman 2000 210 0.15 (0.96) 212 0.05 (0.96) 10.78 0.10 (–0.08 to 0.28) Hill 1999 89 0.02 (0.96) 103 0.14 (0.96) 4.88 –0.12 (–0.39 to 0.15) Rossner 2000 241 –0.01 (0.96) 236 0.03 (0.96) 12.19 –0.04 (–0.21 to 0.13)
Subtotal (95% CI) 540 551 27.85 0.00 (–0.11 to 0.11)Test for heterogeneity: Chi2 = 2.10, df = 2 (p = 0.35), I2 = 4.7%Test for overall effect: z = 0.00 (p = 1.00)
Total (95% CI) 1939 1939 100.00 0.02 (–0.04 to 0.08)Test for heterogeneity: Chi2 = 26.37, df = 8 (p = 0.0009), I2 = 69.7%Test for overall effect: z = 0.65 (p = 0.51)
–1 –0.5 0 0.5 1
Favours treatment Favours control
Study Treatment Control WMD (fixed) Weight WMD (fixed)or sub-category n Mean (SD) n Mean (SD) (95% CI) (%) (95% CI)
FIGURE 7
Comparison: 01 Orlistat 360 mg/day + diet vs placebo + diet at 12 months Outcome: 05 Change in HbA1c%
01 Weight reductionBroom 2001a 259 0.08 (0.43) 263 0.19 (0.58) 63.64 –0.11 (–0.20 to –0.02) Hollander 1998 156 –0.15 (1.00) 151 0.32 (1.10) 8.79 –0.47 (–0.71 to –0.23) Lindgarde 2000 190 –0.25 (0.78) 186 –0.05 (0.51) 27.57 –0.20 (–0.33 to –0.07)
Subtotal (95% CI) 605 600 100.00 –0.17 (–0.24 to –0.10)Test for heterogeneity: Chi2 = 8.23, df = 2 (p = 0.02), I2 = 75.7%Test for overall effect: z = 4.67 (p < 0.00001)
02 Weight maintenanceSubtotal (95% CI) 0 0 Not estimableTest for heterogeneity: not applicableTest for overall effect: not applicable
Total (95% CI) 605 600 100.00 –0.17 (–0.24 to –0.10)Test for heterogeneity: Chi2 = 8.23, df = 2 (p = 0.02), I2 = 75.7%Test for overall effect: z = 4.67 (p < 0.00001)
–1 –0.5 0 0.5 1
Favours treatment Favours control
Study Treatment Control WMD (fixed) Weight WMD (fixed)or sub-category n Mean (SD) n Mean (SD) (95% CI) (%) (95% CI)
0.0
FIGURE 8

Systematic review of RCTs
16
Comparison: 01 Orlistat 360 mg/day + diet vs placebo + diet at 12 months Outcome: 07 Change in fasting plasma glucose (mmol/l)
01 Weight reductionBroom 2001a 259 –0.19 (1.26) 263 0.06 (1.02) 19.16 –0.25 (–0.45 to –0.05) Hauptman 2000 210 0.03 (1.35) 212 0.11 (1.35) 11.19 –0.08 (–0.34 to 0.18) Hollander 1998 156 0.04 (1.60) 151 0.70 (1.80) 5.10 –0.66 (–1.04 to –0.28) Lindgarde 2000 190 –0.46 (1.35) 186 0.08 (1.35) 9.97 –0.54 (–0.81 to –0.27) Rossner 2000 241 0.01 (1.35) 236 0.10 (1.35) 12.64 –0.09 (–0.33 to 0.15) Sjostrom 1998 343 –0.21 (1.35) 340 –0.06 (1.35) 18.11 –0.15 (–0.35 to 0.05)
Subtotal (95% CI) 1399 1388 76.17 –0.24 (–0.34 to –0.14)Test for heterogeneity: Chi2 = 13.02, df = 5 (p = 0.02), I2 = 61.6%Test for overall effect: z = 4.77 (p < 0.00001)
02 Weight maintenanceHauptman 2000 210 0.13 (1.35) 212 0.13 (1.35) 11.19 0.00 (–0.26 to 0.26) Rossner 2000 241 0.03 (1.35) 236 –0.12 (1.35) 12.64 0.15 (–0.09 to 0.39)
Subtotal (95% CI) 451 448 23.83 0.08 (–0.10 to 0.26)Test for heterogeneity: Chi2 = 0.69, df = 1 (p = 0.41), l2 = 0%Test for overall effect: z = 0.88 (p = 0.38)
Total (95% CI) 1850 1836 100.00 –0.16 (–0.25, –0.08)Test for heterogeneity: Chi2 = 23.31, df = 7 (p = 0.002), I2 = 70.0%Test for overall effect: z = 3.73 (p = 0.0002)
–1 –0.5 0 0.5 1
Favours treatment Favours control
Study Treatment Control WMD (fixed) Weight WMD (fixed)or sub-category n Mean (SD) n Mean (SD) (95% CI) (%) (95% CI)
FIGURE 9
Comparison: 01 Orlistat 360 mg/day + diet vs placebo + diet at 12 months Outcome: 09 Change in DBP mmHg
01 Weight reductionBroom 2001a 259 –5.50 (8.30) 263 –3.10 (8.30) 12.03 –2.40 (–3.82 to –0.98) Davidson 1999 657 –1.00 (8.30) 223 1.30 (8.30) 15.35 –2.30 (–3.56 to –1.04) Hauptman 2000 210 –1.00 (8.30) 212 2.00 (8.30) 9.72 –3.00 (–4.58 to –1.42) Hollander 1998 156 –1.01 (8.00) 151 0.23 (8.90) 6.79 –1.24 (–3.14 to 0.66) Lindgarde 2000 190 –0.90 (8.30) 186 –1.30 (8.30) 8.66 0.40 (–1.28 to 2.08) Rossner 2000 241 –0.90 (8.30) 236 –1.30 (8.30) 10.99 0.40 (–1.09 to 1.89) Sjostrom 1998 343 –2.10 (8.30) 340 0.20 (8.30) 15.74 –2.30 (–3.54 to –1.06)
Subtotal (95% CI) 2056 1611 79.28 –1.64 (–2.20 to –1.09)Test for heterogeneity: Chi2 = 19.11, df = 6 (p = 0.004), I2 = 68.6%Test for overall effect: z = 5.80 (p < 0.00001)
02 Weight maintenanceHauptman 2000 210 2.00 (8.30) 212 2.00 (8.30) 9.72 0.00 (–1.58 to 1.58) Rossner 2000 241 1.30 (8.30) 236 1.30 (8.30) 10.99 0.00 (–1.49 to 1.49)
Subtotal (95% CI) 451 448 20.72 0.00 (–1.09 to 1.09)Test for heterogeneity: Chi2 = 0.00, df = 1 (p = 1.00), I2 = 0%Test for overall effect: z = 0.00 (p = 1.00)
Total (95% CI) 2507 2059 100.00 –1.30 (–1.79 to –0.81)Test for heterogeneity: Chi2 = 26.08, df = 8 (p = 0.001), I2 = 69.3%Test for overall effect: z = 5.16 (p < 0.00001)
–4 –2 0 2 4
Favours treatment Favours control
Study Treatment Control WMD (fixed) Weight WMD (fixed)or sub-category n Mean (SD) n Mean (SD) (95% CI) (%) (95% CI)
FIGURE 10

One death occurred in the orlistat arm of thestudy by Broom and colleagues35,36,40 from cancer and one death in the orlistat arm of the study by Hauptman and colleagues45–47 fromacute myocardial infarction (MI). One death from brainstem infarction occurred in the orlistat arm of the study by Lindgarde andcolleagues.50,51
Davidson and colleagues41,42 reported four casesof breast cancer in year 1, three of these cases inparticipants treated with orlistat and one case in aparticipant treated with placebo (one in each grouphad evidence of breast cancer on mammogramsbefore study entry). Rossner and colleagues37,38
reported one participant with cholelithiasis.Rossner also reported one participant with breastcancer in the placebo group and three participantswith breast cancer in the 120-mg orlistat group (ofwhom two had mammogram evidence of cancerbefore recruitment). Sjostrom and colleagues52–56
reported one participant with gastrointestinalcancer in the placebo/placebo group during the 2 years of the study. (See Figures 20 and 21 forcancer data.)
All the orlistat studies reported gastrointestinaladverse events, such as oily stools and faecal
incontinence, to be more common in the orlistatgroups than in the placebo groups.
In two studies vitamin supplementation wasroutinely given to all participants.41,42,48,49 Wherereported, vitamin supplementation per protocolwas always required more commonly in the orlistat groups than in the placebogroups.33,34,37,38,41–47,52–56
Hollander and colleagues33,34 reported that theaverage dose of oral sulfonylureas decreased morein the orlistat than in the placebo group (–23%versus –9%, respectively, p = 0.0019).
Effects of orlistat 360 mg/day for 52 weeks and diet versus placebo for24 weeks and diet then orlistat 360 mg/day for 28 weeks and dietDescription of studyOne RCT assessed the effects of 52 weeks oforlistat 360 mg/day compared with 24 weeks ofplacebo followed by 28 weeks of orlistat360 mg/day in an obese population withhyperlipidaemia.57 Throughout the study allparticipants were advised regarding a 600 kcal/daydeficit diet. Thirty per cent of participants in the52-weeks orlistat group and 20% of participants in
Health Technology Assessment 2004; Vol. 8: No. 21
17
© Queen’s Printer and Controller of HMSO 2004. All rights reserved.
Comparison: 01 Orlistat 360 mg/day + diet vs placebo + diet at 12 months Outcome: 10 Change in SBP (mmHg)
Study Treatment Control WMD (fixed) Weight WMD (fixed)or sub-category n nMean (SD) Mean (SD)
01 Weight reductionBroom, 2001a 259 –6.00 (12.70) 263 –2.30 (12.70) 12.10 –3.70 (–5.88 to –1.52) Davidson, 1999 657 –0.80 (12.70) 223 1.00 (12.70) 15.43 –1.80 (–3.73 to 0.13) Hauptman, 2000 210 2.00 (12.70) 212 3.00 (12.70) 9.78 –1.00 (–3.42 to 1.42) Hollander, 1998 156 0.21 (12.80) 151 4.15 (14.20) 6.27 –3.94 (–6.97 to –0.91) Lindgarde, 2000 190 –0.50 (12.70) 186 –0.90 (12.70) 8.71 0.40 (–2.17 to 2.97) Rossner, 2000 241 –2.70 (12.70) 236 –1.90 (12.70) 11.05 –0.80 (–3.08 to 1.48) Sjostrom, 1998 343 –2.00 (12.70) 340 1.00 (12.70) 15.83 –3.00 (–4.90 to –1.10)
Subtotal (95% CI) 2056 1611 79.17 –2.02 (–2.87 to –1.17)Test for heterogeneity: Chi2 = 10.09, df = 6 (p = 0.12), I2 = 40.5%Test for overall effect: z = 4.65 (p < 0.00001)
02 Weight maintenanceHauptman, 2000 210 2.00 (12.70) 212 2.00 (12.70) 9.78 0.00 (–2.42 to 2.42) Rossner, 2000 241 2.10 (12.70) 236 3.10 (12.70) 11.05 –1.00 (–3.28 to 1.28)
Subtotal (95% CI) 451 448 20.83 –0.53 (–2.19 to 1.13)Test for heterogeneity: Chi2 = 0.35, df = 1 (p = 0.56), I2 = 0%Test for overall effect: z = 0.63 (p = 0.53)
Total (95% CI) 2507 2059 100.00 –1.71 (–2.47 to –0.95)Test for heterogeneity: Chi2 = 12.88, df = 8 (p = 0.12), I2 = 37.9%Test for overall effect: z = 4.42 (p < 0.00001)
–10 –5 0 5 10
Favours treatment Favours control
(95% CI) (%) (95% CI)
FIGURE 11

Systematic review of RCTs
18
Comparison: 02 Orlistat 360 mg/day + diet vs placebo + diet at 24 months Outcome: 01 Weight change (kg)
Study Treatment Control WMD (fixed) Weight WMD (fixed)or sub-category n Mean (SD) n Mean (SD)
01 Weight reductionHauptman, 2000 210 –2.48 (6.62) 212 1.08 (6.22) 52.66 –3.56 (–4.79 to –2.33) Rossner, 2000 241 –5.98 (7.61) 236 –3.06 (6.78) 47.34 –2.92 (–4.21 to –1.63)
Subtotal (95% CI) 451 448 100.00 –3.26 (–4.15 to –2.37)
–3.26 (–4.15 to –2.37)
Test for heterogeneity: Chi2 = 0.50, df = 1 (p = 0.48), I2 = 0%Test for overall effect: z = 7.18 (p < 0.00001)
Total (95% CI) 451 448 100.00Test for heterogeneity: Chi2 = 0.50, df = 1 (p = 0.48), I2 = 0%Test for overall effect: z = 7.18 (p < 0.00001)
–10 –5 0 5 10
Favours treatment Favours control
(95% CI) (%) (95% CI)
FIGURE 12
Comparison: 02 Orlistat 360 mg/day + diet vs placebo + diet at 24 months Outcome: 04 Change in total cholesterol (mmol/l)
01 Weight reductionDavidson 1999 106 0.11 (1.08) 89 0.21 (1.08) 17.71 –0.10 (–0.40 to 0.20) Hauptman 2000 210 0.25 (1.08) 212 0.44 (1.08) 38.63 –0.19 (–0.40 to 0.02) Rossner 2000 241 0.03 (1.08) 236 0.31 (1.08) 43.66 –0.28 (–0.47 to –0.09)
Subtotal (95% CI) 557 537 100.00 –0.21 (–0.34 to –0.09)Test for heterogeneity: Chi2 = 1.04, df = 2 (p = 0.60), l2 = 0%Test for overall effect: z = 3.26 (p = 0.001)
Total (95% CI) 557 537 100.00 –0.21 (–0.34 to –0.09)Test for heterogeneity: Chi2 = 1.04, df = 2 (p = 0.60), l2 = 0%Test for overall effect: z = 3.26 (p = 0.001)
–1 –0.5 0 0.5 1
Favours treatment Favours control
Study Treatment Control WMD (fixed) Weight WMD (fixed)or sub-category n Mean (SD) n Mean (SD) (95% CI) (%) (95% CI)
FIGURE 13
Comparison: 02 Orlistat 360 mg/day + diet vs placebo + diet at 24 months Outcome: 05 Change in LDL cholesterol (mmol/l)
01 Weight reductionDavidson 1999 104 0.05 (0.74) 88 0.04 (0.74) 17.50 0.01 (–0.20 to 0.22) Hauptman 2000 210 0.06 (0.74) 212 0.36 (0.74) 38.73 –0.30 (–0.44 to –0.16) Rossner 2000 241 0.04 (0.74) 236 0.28 (0.74) 43.77 –0.24 (–0.37 to –0.11)
Subtotal (95% CI) 555 536 100.00 –0.22 (–0.31 to –0.13)Test for heterogeneity: Chi2 = 5.92, df = 2 (p = 0.05), I2 = 66.2%Test for overall effect: z = 4.90 (p < 0.00001)
Total (95% CI) 555 536 100.00 –0.22 (–0.31 to –0.13)Test for heterogeneity: Chi2 = 5.92, df = 2 (p = 0.05), I2 = 66.2%Test for overall effect: z = 4.90 (p < 0.00001)
–0.5 –0.25 0 0.25 0.5
Favours treatment Favours control
Study Treatment Control WMD (fixed) Weight WMD (fixed)or sub-category n Mean (SD) n Mean (SD) (95% CI) (%) (95% CI)
FIGURE 14

Health Technology Assessment 2004; Vol. 8: No. 21
19
© Queen’s Printer and Controller of HMSO 2004. All rights reserved.
Comparison: 02 Orlistat 360 mg/day + diet vs placebo + diet at 24 months Outcome: 06 Change in HDL cholesterol (mmol/l)
01 Weight reductionDavidson 1999 106 0.11 (0.29) 89 0.15 (0.29) 17.71 –0.04 (–0.12 to 0.04) Hauptman 2000 210 0.07 (0.29) 212 0.09 (0.29) 38.63 –0.02 (–0.08 to 0.04) Rossner 2000 241 0.12 (0.29) 236 0.16 (0.29) 43.66 –0.04 (–0.09 to 0.01)
Subtotal (95% CI) 557 537 100.00 –0.03 (–0.07 to 0.00)Test for heterogeneity: Chi2 = 0.31, df = 2 (p = 0.86), l2 = 0%Test for overall effect: z = 1.84 (p = 0.07)
Total (95% CI) 557 537 100.00 –0.03 (–0.07 to 0.00)Test for heterogeneity: Chi2 = 0.31, df = 2 (p = 0.86), l2 = 0%Test for overall effect: z = 1.84 (p = 0.07)
–0.5 –0.25 0 0.25 0.5
Favours control Favours treatment
Study Treatment Control WMD (fixed) Weight WMD (fixed)or sub-category n Mean (SD) n Mean (SD) (95% CI) (%) (95% CI)
FIGURE 15
Comparison: 02 Orlistat 360 mg/day + diet vs placebo + diet at 24 months Outcome: 07 Change in triglycerides (mmol/l)
01 Weight reductionDavidson 1999 106 –0.07 (0.96) 89 0.15 (0.96) 17.71 –0.22 (–0.49 to 0.05) Hauptman 2000 210 0.21 (0.96) 212 –0.05 (0.96) 38.63 0.26 (0.08 to 0.44) Rossner 2000 241 –0.10 (0.96) 236 –0.05 (0.96) 43.66 –0.05 (–0.22 to 0.12)
Subtotal (95% CI) 557 537 100.00 0.04 (–0.07 to 0.15)Test for heterogeneity: Chi2 = 10.14, df = 2 (p = 0.006), I2 = 80.3%Test for overall effect: z = 0.68 (p = 0.50)
Total (95% CI) 557 537 100.00 0.04 (–0.07 to 0.15)Test for heterogeneity: Chi2 = 10.14, df = 2 (p = 0.006), I2 = 80.3%Test for overall effect: z = 0.68 (p = 0.50)
–1 –0.5 0 0.5 1
Favours treatment Favours control
Study Treatment Control WMD (fixed) Weight WMD (fixed)or sub-category n Mean (SD) n Mean (SD) (95% CI) (%) (95% CI)
FIGURE 16
Comparison: 02 Orlistat 360 mg/day + diet vs placebo + diet at 24 months Outcome: 08 Change in fasting plasma glucose (mmol/l)
01 Weight reductionDavidson 1999 106 0.06 (0.31) 89 0.26 (0.38) 76.23 –0.20 (–0.30 to –0.10) Hauptman 2000 210 0.16 (1.35) 212 0.24 (1.35) 11.16 –0.08 (–0.34 to 0.18) Rossner 2000 241 0.04 (1.35) 236 –0.02 (1.35) 12.61 0.06 (–0.18 to 0.30)
Subtotal (95% CI) 557 537 100.00 –0.15 (–0.24 to –0.07)Test for heterogeneity: Chi2 = 4.15, df = 2 (p = 0.13), I2 = 51.8%Test for overall effect: z = 3.50 (p = 0.0005)
Total (95% CI) 557 537 100.00 –0.15 (–0.24 to –0.07)Test for heterogeneity: Chi2 = 4.15, df = 2 (p = 0.13), I2 = 51.8%Test for overall effect: z = 3.50 (p = 0.0005)
–1 –0.5 0 0.5 1
Favours treatment Favours control
Study Treatment Control WMD (fixed) Weight WMD (fixed)or sub-category n Mean (SD) n Mean (SD) (95% CI) (%) (95% CI)
FIGURE 17

Systematic review of RCTs
20
Comparison: 02 Orlistat 360 mg/day + diet vs placebo + diet at 24 months Outcome: 03 Change in DBP mmHg
01 Weight reductionHauptman 2000 210 1.00 (8.30) 212 4.00 (8.30) 46.94 –3.00 (–4.58 to –1.42) Rossner 2000 241 0.40 (8.30) 236 0.00 (8.30) 53.06 0.40 (–1.09 to 1.89)
Subtotal (95% CI) 451 448 100.00 –1.20 (–2.28 to –0.11)Test for heterogeneity: Chi2 = 9.39, df = 1 (p = 0.002), I2 = 89.4%Test for overall effect: z = 2.16 (p = 0.03)
Total (95% CI) 451 448 100.00 –1.20 (–2.28 to –0.11)Test for heterogeneity: Chi2 = 9.39, df = 1 (p = 0.002), I2 = 89.4%Test for overall effect: z = 2.16 (p = 0.03)
–4 –2 0 2 4
Favours treatment Favours control
Study Treatment Control WMD (fixed) Weight WMD (fixed)or sub-category n Mean (SD) n Mean (SD) (95% CI) (%) (95% CI)
FIGURE 18
Comparison: 02 Orlistat 360 mg/day + diet vs placebo + diet at 24 months Outcome: 02 Change in SBP (mmHg)
Study Treatment Control WMD (fixed) Weight WMD (fixed)or sub-category n nMean (SD) Mean (SD)
01 Weight reductionHauptman, 2000 210 4.00 (12.70) 212 5.00 (12.70) 46.94 –1.00 (–3.42 to 1.42) Rossner, 2000 241 –0.60 (12.70) 236 1.20 (12.70) 53.06 –1.80 (–4.08 to 0.48)
Subtotal (95% CI) 451 448 100.00 –1.42 (–3.08 to 0.24)Test for heterogeneity: Chi2 = 0.22, df = 1 (p = 0.64), I2 = 0%Test for overall effect: z = 1.68 (p = 0.09)
Total (95% CI) 451 448 100.00 –1.42 (–3.08 to 0.24)Test for heterogeneity: Chi2 = 0.22, df = 1 (p = 0.64), I2 = 0%Test for overall effect: z = 1.68 (p = 0.09)
–10 –5 0 5 10
Favours treatment Favours control
(95% CI) (%) (95% CI)
FIGURE 19
Comparison: 04 Orlistat 360 mg vs placebo Outcome: 04 All cancers
Broom 2001a 1/265 13.11 3.02 (0.12 to 74.54) Davidson 1999 2/668 19.70 1.68 (0.08 to 35.21) Rossner 2000 1/244 26.36 1.00 (0.06 to 16.01) Sjostrom 1998 0/135 40.83 0.31 (0.01 to 7.65)
Total (95% CI) 4/1312 100.00 1.12 (0.28 to 4.49)Total events: 4 (Treatment), 2 (Control)Test for heterogeneity: Chi2 = 1.06, df = 3 (p = 0.79), l2 = 0%Test for overall effect: z = 0.16 (p = 0.88)
0.01 0.1 1 10 100
Favours treatment Favours control
Study Treatment Control OR (fixed) Weight OR (fixed)or sub-category (n/N) (n/N) (95% CI) (%) (95% CI)
0/2660/2241/2431/126
2/859
FIGURE 20

the 28-weeks orlistat group were type 2 diabetics.Data were provided on change in weight, totalcholesterol, LDL cholesterol and fasting plasmaglucose at 12 months.
Change in weight and risk factors was assessedusing an LOCF basis, with five participants in totalexcluded (either did not receive study medicationor did not return for follow-up visit). Dropoutrates were 52% for the orlistat group at 52 weeksand 39% for the placebo/orlistat group. Meanoverall BMI at baseline was 37 kg/m2. Allparticipants received an identical number ofappointments.
Review resultsAt 12 months 52 weeks of orlistat 360 mg/day wasassociated with a WMD weight change of –0.69 kg(95% CI –2.85 to 1.47 kg) compared with theplacebo/orlistat group (Figure 22). Compared withthe placebo/orlistat group, the orlistat group hadchanges at 12 months in total cholesterol of–0.29 mmol/l (95% CI –0.65 to 0.07 mmol/l) (Figure23), LDL cholesterol of –0.51 mmol/l (95% CI–0.76 to –0.26 mmol/l) (Figure 24) and fastingplasma glucose –0.30 mmol/l (95% CI –0.75 to0.15 mmol/l) (Figure 25). However, all these resultsare from only one study.
During the double-blind phase of 24 weeks 86.6%of participants on orlistat and 42.3% ofparticipants on placebo experiencedgastrointestinal side-effects. One participantrequired a cholecystectomy in the placebo/orlistatgroup and one participant developed a stroke inthe 52-weeks orlistat 360 mg/day group.
Effects of sibutramine and diet versusplacebo and dietDescription of studiesFour RCTs provided change in weight at 12 months or longer.58–70 One of these studiesaimed to assess the ability of sibutramine tomaintain weight loss over 18 months following a6-month weight reduction phase.64–70 Threeweight reduction studies provided change inweight at 12 months.58–63 Apfelbaum andcolleagues58 also evaluated weight change at 15 months (3 months after treatment cessation).The Sibutramine Trial in Obesity Reduction andMaintenance (STORM)64–70 study assessed weightchange at 18 months.
Data were provided for lipids, blood pressure,fasting plasma glucose and HbA1c at 12 monthsand at 18 months, with the exception of bloodpressure. One study64–70 clearly reported assessingchange in weight using an ITT approach.
The studies used a variety of diets. The study byApfelbaum and colleagues58 provided dietarycounselling to reduce total calorie intake by20–30%. McMahon and colleagues59,60 gave briefgeneral dietary counselling for weight reduction atthe initial run-in visit only. Smith and colleagues61–63
advised a low-fat diet and the STORM trial64–70
advised a 600 kcal/day deficit diet.
McMahon59,60 and Smith61–63 included single-blindplacebo run-in periods, which ranged from 2 to 10 weeks’ duration. The study by Apfelbaum andcolleagues58 included a 4-week pretreatment phaseof VLCD with entry to randomisation dependent
Health Technology Assessment 2004; Vol. 8: No. 21
21
© Queen’s Printer and Controller of HMSO 2004. All rights reserved.
Comparison: 04 Orlistat 360 mg vs placebo Outcome: 06 Breast cancer
Davidson 1999 2/668 0/224 42.76 1.68 (0.08 to 35.21) Rossner 2000 1/244 1/243 57.24 1.00 (0.06 to 16.01)
Total (95% CI) 3/912 1/467 100.00 1.29 (0.17 to 9.61)Total events: 3 (Treatment), 1 (Control)Test for heterogeneity: Chi2 = 0.06, df = 1 (p = 0.80), I2 = 0%Test for overall effect: z = 0.25 (p = 0.80)
0.01 0.1 1 10 100
Favours treatment Favours control
Study Treatment Control OR (fixed) Weight OR (fixed)or sub-category (n/N) (n/N) (95% CI) (%) (95% CI)
FIGURE 21
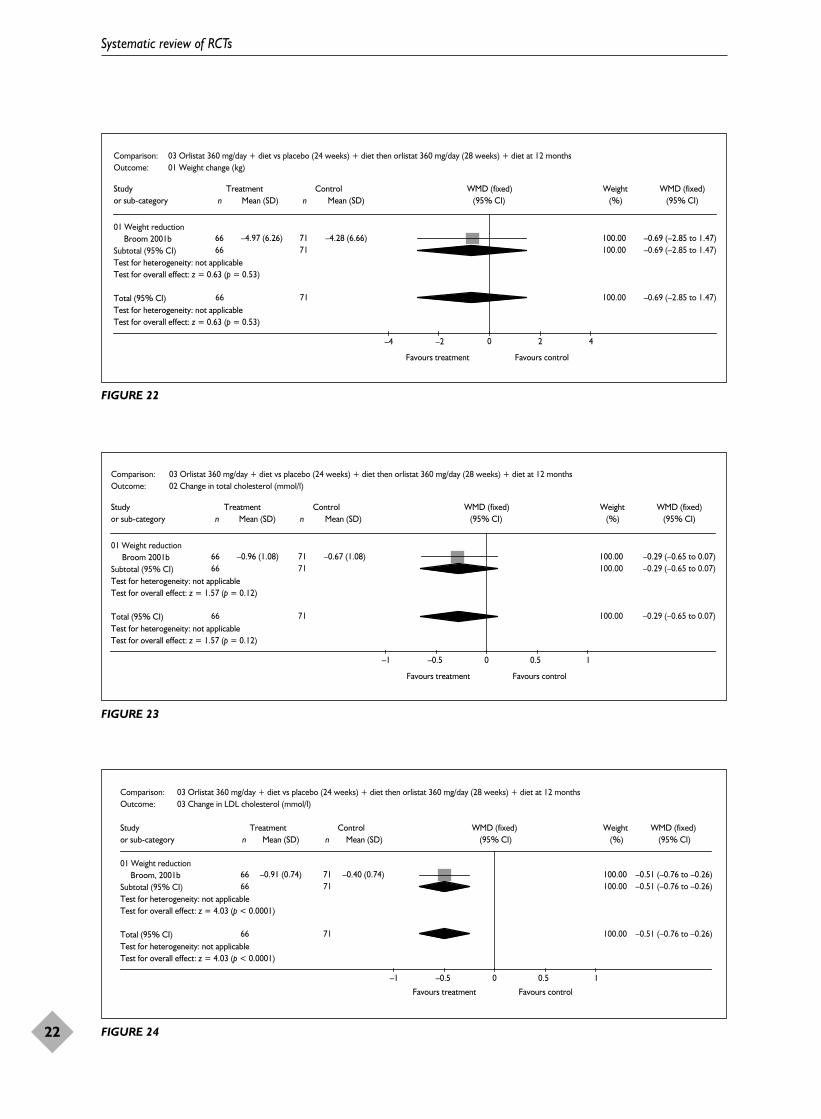
Systematic review of RCTs
22
Comparison: 03 Orlistat 360 mg/day + diet vs placebo (24 weeks) + diet then orlistat 360 mg/day (28 weeks) + diet at 12 months Outcome: 01 Weight change (kg)
01 Weight reductionBroom 2001b 66 –4.97 (6.26) 71 –4.28 (6.66) 100.00 –0.69 (–2.85 to 1.47)
Subtotal (95% CI) 66 71 100.00 –0.69 (–2.85 to 1.47)Test for heterogeneity: not applicableTest for overall effect: z = 0.63 (p = 0.53)
Total (95% CI) 66 71 100.00 –0.69 (–2.85 to 1.47)Test for heterogeneity: not applicableTest for overall effect: z = 0.63 (p = 0.53)
–4 –2 0 2 4
Favours treatment Favours control
Study Treatment Control WMD (fixed) Weight WMD (fixed)or sub-category n Mean (SD) n Mean (SD) (95% CI) (%) (95% CI)
FIGURE 22
Comparison: 03 Orlistat 360 mg/day + diet vs placebo (24 weeks) + diet then orlistat 360 mg/day (28 weeks) + diet at 12 months Outcome: 02 Change in total cholesterol (mmol/l)
01 Weight reductionBroom 2001b 66 –0.96 (1.08) 71 –0.67 (1.08) 100.00 –0.29 (–0.65 to 0.07)
Subtotal (95% CI) 66 71 100.00 –0.29 (–0.65 to 0.07)Test for heterogeneity: not applicableTest for overall effect: z = 1.57 (p = 0.12)
Total (95% CI) 66 71 100.00 –0.29 (–0.65 to 0.07)Test for heterogeneity: not applicableTest for overall effect: z = 1.57 (p = 0.12)
–1 –0.5 0 0.5 1
Favours treatment Favours control
Study Treatment Control WMD (fixed) Weight WMD (fixed)or sub-category n Mean (SD) n Mean (SD) (95% CI) (%) (95% CI)
FIGURE 23
Comparison: 03 Orlistat 360 mg/day + diet vs placebo (24 weeks) + diet then orlistat 360 mg/day (28 weeks) + diet at 12 months Outcome: 03 Change in LDL cholesterol (mmol/l)
Study Treatment Control WMD (fixed) Weight WMD (fixed)or sub-category n nMean (SD) Mean (SD) (95% CI) (%) (95% CI)
01 Weight reductionBroom, 2001b 66 –0.91 (0.74) 71 –0.40 (0.74) 100.00 –0.51 (–0.76 to –0.26)
Subtotal (95% CI) 66 71 100.00 –0.51 (–0.76 to –0.26)Test for heterogeneity: not applicableTest for overall effect: z = 4.03 (p < 0.0001)
Total (95% CI) 66 71 100.00 –0.51 (–0.76 to –0.26)Test for heterogeneity: not applicableTest for overall effect: z = 4.03 (p < 0.0001)
Favours treatment Favours control
–1 –0.5 0 0.5 1
FIGURE 24

upon a weight loss of 6 kg or more during thisphase. STORM64–70 included a 6-month openpretreatment phase of 10 mg sibutramine dailyplus 600 kcal/day deficit diet plus advice onbehaviour modification and advice to walk 30 minutes extra per day.
McMahon59,60 recruited people with hypertensionand the studies by Smith61–63 and STORM64–70
included people with hypertension if stabilised onmedication. Reported mean BMI ranged from32.4 kg/m2 61–63 to 36.6 kg/m2.64–70
Dropout rates at 12 months ranged from 27%58 to59%.64–70 In three of the studies dropout rateswere lower in the placebo group.58–60,64–70
Review resultsSibutramine and diet compared with diet in thethree weight reduction studies was associated withan overall WMD weight change at 12 months of–4.12 kg (95% CI –4.97 to –3.26 kg) (Figure26).58–63 The weight reduction study by Apfelbaumand colleagues58 was associated with a weightchange at 15 months of –3.70 kg (95% CI –5.71 to–1.69 kg) (Figure 27). The STORM64–70 weightmaintenance study was associated with a weightchange at 18 months of –3.40 kg (95% CI –4.45 to–2.35 kg) (Figure 28).
At 12 months sibutramine in the weight reduction studies showed beneficial effects onHDL cholesterol and triglycerides, as did thesibutramine group in the STORM64–70 weightmaintenance study (Figures 29–34). At 18 months in the STORM study HDL andtriglycerides were still significantly improved(Figures 35–40).
At 12 months, SBP showed a WMD change of1.16 mmHg (95% CI –0.60 to 2.93 mmHg) in twoweight reduction studies (Figure 41).59–63 Diastolicblood pressure showed a WMD change of2.04 mmHg (95% CI 0.89 to 3.20 mmHg) (Figure 42). Results for the sibutramine study forpeople with hypertension are shown in Table 2.
One person required a cholecystectomy in thesibutramine group of the study by Apfelbaum andcolleagues.58 One person was also withdrawn fromthe placebo group in this study because of thedevelopment of hypertension. Adverse events didnot appear to differ between the treatment armsfor this study, with the exception of constipation,which was more common with sibutramine (OR 4.14, 95% CI 1.31 to 13.10), although theconfidence interval was wide.
In the study by Smith and colleagues61–63 oneparticipant withdrew from the 10-mg sibutraminegroup owing to four drop attacks within 2 weeks ofthe start (history of epilepsy) and one participantwithdrew from the 15-mg sibutramine groupowing to palpitations due to frequent ventricularectopic beats. Dry mouth was also significantlymore frequent in both sibutramine groups than in participants on placebo (OR 11.42, 95%CI 2.72 to 47.87).
In the study by McMahon59,60 dry mouth andconstipation were also the adverse events reportedas being significantly more frequent in the groupon sibutramine (p < 0.05). Eight out of 150participants discontinued sibutramine as a resultof hypertension, compared with one out of 74participants on placebo (OR 4.11, 95% CI 0.50 to33.52).
Health Technology Assessment 2004; Vol. 8: No. 21
23
© Queen’s Printer and Controller of HMSO 2004. All rights reserved.
Comparison: 03 Orlistat 360 mg/day + diet vs placebo (24 weeks) + diet then orlistat 360 mg/day (28 weeks) + diet at 12 months Outcome: 04 Change in plasma glucose (mmol/l)
Study Treatment Control WMD (fixed) Weight WMD (fixed)or sub-category n nMean (SD) Mean (SD) (95% CI) (%) (95% CI)
01 Weight reductionBroom, 2001b 66 –0.40 (1.35) 71 –0.10 (1.35) 100.00 –0.30 (–0.75 to 0.15)
Subtotal (95% CI) 66 71 100.00 –0.30 (–0.75 to 0.15)Test for heterogeneity: not applicableTest for overall effect: z = 1.30 (p = 0.19)
Total (95% CI) 66 71 100.00 –0.30 (–0.75 to 0.15)Test for heterogeneity: not applicableTest for overall effect: z = 1.30 (p = 0.19)
Favours treatment Favours control
–1 –0.5 0 0.5 1
FIGURE 25
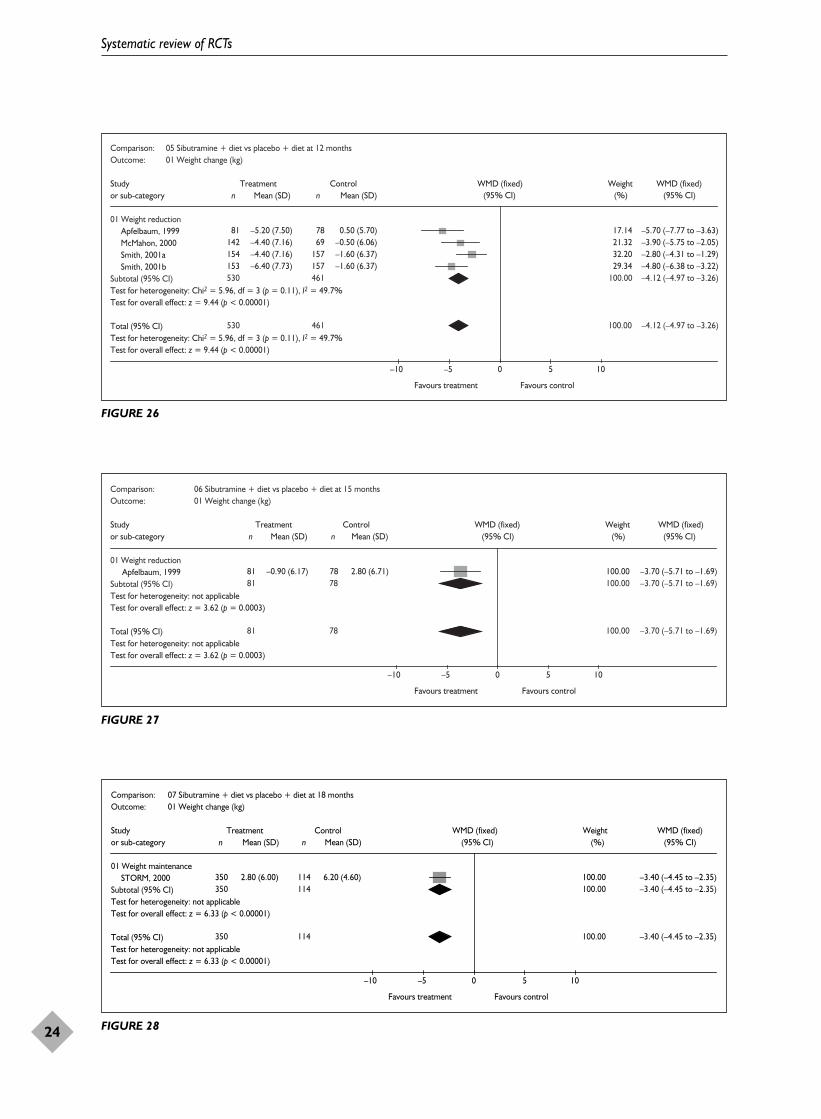
Systematic review of RCTs
24
Comparison: 05 Sibutramine + diet vs placebo + diet at 12 months Outcome: 01 Weight change (kg)
Study Treatment Control WMD (fixed) Weight WMD (fixed)or sub-category n nMean (SD) Mean (SD)
01 Weight reductionApfelbaum, 1999 81 –5.20 (7.50) 78 0.50 (5.70) 17.14 –5.70 (–7.77 to –3.63) McMahon, 2000 142 –4.40 (7.16) 69 –0.50 (6.06) 21.32 –3.90 (–5.75 to –2.05) Smith, 2001a 154 –4.40 (7.16) 157 –1.60 (6.37) 32.20 –2.80 (–4.31 to –1.29) Smith, 2001b 153 –6.40 (7.73) 157 –1.60 (6.37) 29.34 –4.80 (–6.38 to –3.22)
Subtotal (95% CI) 530 461 100.00 –4.12 (–4.97 to –3.26)Test for heterogeneity: Chi2 = 5.96, df = 3 (p = 0.11), I2 = 49.7%Test for overall effect: z = 9.44 (p < 0.00001)
Total (95% CI) 530 461 100.00 –4.12 (–4.97 to –3.26)Test for heterogeneity: Chi2 = 5.96, df = 3 (p = 0.11), I2 = 49.7%Test for overall effect: z = 9.44 (p < 0.00001)
–10 –5 0 5 10
Favours treatment Favours control
(95% CI) (%) (95% CI)
FIGURE 26
Comparison: 06 Sibutramine + diet vs placebo + diet at 15 monthsOutcome: 01 Weight change (kg)
Study Treatment Control WMD (fixed) Weight WMD (fixed)or sub-category n nMean (SD) Mean (SD)
01 Weight reductionApfelbaum, 1999 81 –0.90 (6.17) 78 2.80 (6.71) 100.00 –3.70 (–5.71 to –1.69)
Subtotal (95% CI) 81 78 100.00 –3.70 (–5.71 to –1.69)Test for heterogeneity: not applicableTest for overall effect: z = 3.62 (p = 0.0003)
Total (95% CI) 81 78 100.00 –3.70 (–5.71 to –1.69)Test for heterogeneity: not applicableTest for overall effect: z = 3.62 (p = 0.0003)
–10 –5 0 5 10
Favours treatment Favours control
(95% CI) (%) (95% CI)
FIGURE 27
Comparison: 07 Sibutramine + diet vs placebo + diet at 18 months Outcome: 01 Weight change (kg)
Study Treatment Control WMD (fixed) Weight WMD (fixed)or sub-category n nMean (SD) Mean (SD)
01 Weight maintenanceSTORM, 2000 350 2.80 (6.00) 114 6.20 (4.60) 100.00 –3.40 (–4.45 to –2.35)
Subtotal (95% CI) 350 114 100.00 –3.40 (–4.45 to –2.35)Test for heterogeneity: not applicableTest for overall effect: z = 6.33 (p < 0.00001)
Total (95% CI) 350 114 100.00 –3.40 (–4.45 to –2.35)Test for heterogeneity: not applicableTest for overall effect: z = 6.33 (p < 0.00001)
–10 –5 0 5 10
Favours treatment Favours control
(95% CI) (%) (95% CI)
FIGURE 28

The STORM study64–70 found dry mouth,constipation, increased blood pressure, insomniaand nausea to be more than twice as frequent in thesibutramine participants. One participant in each ofthe sibutramine and placebo groups was withdrawnas a result of hypertension. Of the participants withhypertension taking sibutramine, two needed anincrease in therapy and two a decrease.
Effects of SSRIs and diet versusplacebo and dietDescription of studiesFive RCTs provided change in weight at 12months.71–79 Four of these interventions aimed toproduce weight reduction71–77 and one studyaimed to produce weight maintenance after a 26-week pretreatment phase.78,79 The meta-analyses
Health Technology Assessment 2004; Vol. 8: No. 21
25
© Queen’s Printer and Controller of HMSO 2004. All rights reserved.
Comparison: 05 Sibutramine + diet vs placebo + diet at 12 months Outcome: 07 Change in total cholesterol (mmol/l)
Study Treatment Control WMD (fixed) Weight WMD (fixed)or sub-category n nMean (SD) Mean (SD) (95% CI) (%) (95% CI)
01 Weight reductionMcMahon, 2000 133 –0.03 (1.08) 59 –0.07 (1.08) 18.69 0.04 (–0.29 to 0.37) Smith, 2001a 122 0.08 (1.08) 114 0.08 (1.08) 26.96 0.00 (–0.28 to 0.28) Smith, 2001b 123 0.09 (1.08) 114 0.08 (1.08) 27.06 0.01 (–0.27 to 0.29)
Subtotal (95% CI) 378 287 72.71 0.01 (–0.15 to 0.18)Test for heterogeneity: Chi2 = 0.03, df = 2 (p = 0.98), I2 = 0%Test for overall effect: z = 0.16 (p = 0.87)
02 Weight maintenanceSTORM, 2000 265 0.12 (1.08) 77 0.26 (1.08) 27.29 –0.14 (–0.41 to 0.13)
Subtotal (95% CI) 265 77 27.29 –0.14 (–0.41 to 0.13)Test for heterogeneity: not applicableTest for overall effect: z = 1.00 (p = 0.32)
Total (95% CI) 643 364 100.00 –0.03 (–0.17 to 0.12)Test for heterogeneity: Chi2 = 0.92, df = 3 (p = 0.82), I2 = 0%Test for overall effect: z = 0.38 (p = 0.70)
Favours treatment Favours control –0.5 –0.25 0 0.25 0.5
FIGURE 29
Comparison: 05 Sibutramine + diet vs placebo + diet at 12 months Outcome: 02 Change in LDL cholesterol (mmol/l)
Study Treatment Control WMD (fixed) Weight WMD (fixed)or sub-category n nMean (SD) (95% CI) (%) (95% CI)
01 Weight reductionApfelbaum, 1999 81 0.41 (0.65) 78 0.57 (0.62) 35.09 –0.16 (–0.36 to 0.04) McMahon, 2000 131 –0.09 (0.74) 58 –0.11 (0.74) 26.13 0.02 (–0.21 to 0.25)
Subtotal (95% CI) 212 136 61.22 –0.08 (–0.23 to 0.07)Test for heterogeneity: Chi2 = 1.36, df = 1 (p = 0.24), I2 = 26.6%Test for overall effect: z = 1.09 (p = 0.28)
02 Weight maintenanceSTORM, 2000 265 –0.11 (0.74) 77 0.04 (0.74) 38.78 –0.15 (–0.34 to 0.04)
Subtotal (95% CI) 265 77 38.78 –0.15 (–0.34 to 0.04)Test for heterogeneity: not applicableTest for overall effect: z = 1.57 (p = 0.12)
Total (95% CI) 477 213 100.00 –0.11 (–0.23 to 0.01)Test for heterogeneity: Chi2 = 1.66, df = 2 (p = 0.44), I2 = 0%Test for overall effect: z = 1.83 (p = 0.07)
Favours treatment Favours control
–0.5 –0.25 0 0.25 0.5
Mean (SD)
FIGURE 30

Systematic review of RCTs
26
Comparison: 05 Sibutramine + diet vs placebo + diet at 12 months Outcome: 03 Change in HDL cholesterol (mmol/l)
Study Treatment Control WMD (fixed) Weight WMD (fixed)or sub-category n nMean (SD) Mean (SD) (95% CI) (%) (95% CI)
01 Weight reductionApfelbaum, 1999 81 0.34 (0.23) 78 0.23 (0.21) 40.71 0.11 (0.04 to 0.18) McMahon, 2000 133 0.14 (0.29) 59 0.06 (0.29) 24.10 0.08 (–0.01 to 0.17)
Subtotal (95% CI) 214 137 64.81 0.10 (0.04 to 0.15)Test for heterogeneity: Chi2 = 0.27, df = 1 (p = 0.60), I2 = 0%Test for overall effect: z = 3.57 (p = 0.0004)
02 Weight maintenanceSTORM, 2000 265 0.22 (0.29) 77 0.09 (0.29) 35.19 0.13 (0.06 to 0.20)
Subtotal (95% CI) 265 77 35.19 0.13 (0.06 to 0.20)Test for heterogeneity: not applicableTest for overall effect: z = 3.46 (p = 0.0005)
Total (95% CI) 479 214 100.00 0.11 (0.07 to 0.15)Test for heterogeneity: Chi2 = 0.72, df = 2 (p = 0.70), I2 = 0%Test for overall effect: z = 4.93 (p < 0.00001)
Favours control Favours treatment 0.5–0.5 –0.25 0 0.25
FIGURE 31
Comparison: 05 Sibutramine + diet vs placebo + diet at 12 months Outcome: 04 change in triglycerides mmol/L
Study Treatment Control WMD (fixed) Weight WMD (fixed)or sub-category n Mean (SD) n Mean (SD) (95% CI) (%) (95% CI)
01 weight reductionApfelbaum, 1999 81 –0.05 (0.42) 78 0.11 (0.54) 41.61 –0.16 (–0.31 to –0.01) McMahon, 2000 133 –0.19 (0.96) 59 –0.01 (0.96) 10.92 –0.18 (–0.47 to 0.11) Smith, 2001a 122 –0.26 (0.96) 114 –0.21 (0.96) 15.74 –0.05 (–0.30 to 0.20) Smith, 2001b 123 –0.44 (0.96) 114 –0.21 (0.96) 15.80 –0.23 (–0.47 to 0.01)
Subtotal (95% CI) 459 365 84.06 –0.16 (–0.26 to –0.05)Test for heterogeneity: Chi2 = 1.10, df = 3 (p = 0.78), I2 = 0%Test for overall effect: z = 2.87 (p = 0.004)
02 weight maintenanceSTORM, 2000 265 –0.01 (0.96) 77 0.25 (0.96) 15.94 –0.26 (–0.50 to –0.02)
Subtotal (95% CI) 265 77 15.94 –0.26 (–0.50 to –0.02)Test for heterogeneity: not applicableTest for overall effect: z = 2.09 (p = 0.04)
Total (95% CI) 724 442 100.00 –0.17 (–0.27 to –0.07)Test for heterogeneity: Chi2 = 1.70, df = 4 (p = 0.79), I2 = 0%Test for overall effect: z = 3.46 (p = 0.0005)
–1 –0.5 0 0.5 1
Favours treatment Favours control
FIGURE 32

Health Technology Assessment 2004; Vol. 8: No. 21
27
© Queen’s Printer and Controller of HMSO 2004. All rights reserved.
Comparison: 05 Sibutramine + diet vs placebo + diet at 12 monthsOutcome: 09 Change in HbA1c%
Study Treatment Control WMD (fixed) Weight WMD (fixed)or sub-category n Mean (SD) n Mean (SD) (95% CI) (%) (95% CI)
01 Weight maintenanceSTORM, 2000 265 0.16 (0.71) 77 0.23 (0.71) 100.00 –0.07 (–0.25 to 0.11)
Subtotal (95% CI) 265 77 100.00 –0.07 (–0.25 to 0.11)Test for heterogeneity: not applicableTest for overall effect: z = 0.76 (p = 0.45)
Total (95% CI) 265 77 100.00 –0.07 (–0.25 to 0.11)Test for heterogeneity: not applicableTest for overall effect: z = 0.76 (p = 0.45)
Favours treatment Favours control
–1 –0.5 0 0.5 1
FIGURE 33
Comparison: 07 Sibutramine + diet vs placebo + diet at 18 months Outcome: 02 Change in total cholesterol (mmol/l)
Study Treatment Control WMD (fixed) Weight WMD (fixed)or sub-category n nMean (SD) Mean (SD)
01 Weight maintenanceSTORM, 2000 222 0.15 (1.08) 62 0.34 (1.08) 100.00 –0.19 (–0.49 to 0.11)
Subtotal (95% CI) 222 62 100.00 –0.19 (–0.49 to 0.11)Test for heterogeneity: not applicableTest for overall effect: z = 1.22 (p = 0.22)
Total (95% CI) 222 62 100.00 –0.19 (–0.49 to 0.11) Test for heterogeneity: not applicableTest for overall effect: z = 1.22 (p = 0.22)
Favours treatment Favours control
(95% CI) (%) (95% CI)
–0.5 –0.25 0 0.25 0.5
FIGURE 35
Comparison: 05 Sibutramine + diet vs placebo + diet at 12 months Outcome: 08 Change in fasting plasma glucose (mmol/l)
Study Treatment Control WMD (fixed) Weight WMD (fixed)or sub-category n nMean (SD) Mean (SD)
01 Weight reductionMcMahon, 2000 133 0.23 (1.35) 59 0.31 (1.35) 18.69 –0.08 (–0.49 to 0.33) Smith, 2001a 122 –0.21 (1.35) 114 –0.16 (1.35) 26.96 –0.05 (–0.39 to 0.29) Smith, 2001b 123 –0.19 (1.35) 114 –0.16 (1.35) 27.06 –0.03 (–0.37 to 0.31)
Subtotal (95% CI) 378 287 72.71 –0.05 (–0.26 to 0.16)Test for heterogeneity: Chi2 = 0.03, df = 2 (p = 0.98), I2 = 0%Test for overall effect: z = 0.47 (p = 0.64)
02 Weight maintenanceSTORM, 2000 265 0.13 (1.35) 77 0.14 (1.35) 27.29 –0.01 (–0.35 to 0.33)
Subtotal (95% CI) 265 77 27.29 –0.01 (–0.35 to 0.33)Test for heterogeneity: not applicableTest for overall effect: z = 0.06 (p = 0.95)
Total (95% CI) 643 364 100.00 –0.04 (–0.22 to 0.14)Test for heterogeneity: Chi2 = 0.07, df = 3 (p = 1.00), I2 = 0%Test for overall effect: z = 0.43 (p = 0.67)
Favours treatment Favours control
(95% CI) (%) (95% CI)
–1 –0.5 0 0.5 1
FIGURE 34

Systematic review of RCTs
28
Comparison: 07 Sibutramine + diet vs placebo + diet at 18 monthsOutcome: 03 Change in LDL cholesterol (mmol/l)
Study Treatment Control WMD (fixed) Weight WMD (fixed)or sub-category n nMean (SD) Mean (SD)
01 Weight maintenanceSTORM, 2000 222 –0.06 (0.74) 62 0.10 (0.74) 100.00 –0.16 (–0.37 to 0.05)
Subtotal (95% CI) 222 62 100.00 –0.16 (–0.37 to 0.05)Test for heterogeneity: not applicableTest for overall effect: z = 1.51 (p = 0.13)
Total (95% CI) 222 62 100.00 –0.16 (–0.37 to 0.05)Test for heterogeneity: not applicableTest for overall effect: z = 1.51 (p = 0.13)
Favours treatment Favours control
(95% CI) (%) (95% CI)
–0.5 –0.25 0 0.25 0.5
FIGURE 36
Comparison: 07 Sibutramine + diet vs placebo + diet at 18 months Outcome: 04 Change in HDL cholesterol (mmol/l)
Study Treatment Control WMD (fixed) Weight WMD (fixed)or sub-category n nMean (SD) Mean (SD)
01 Weight maintenanceSTORM, 2000 222 0.24 (0.29) 62 0.11 (0.29) 100.00 0.13 (0.05 to 0.21)
Subtotal (95% CI) 222 62 100.00 0.13 (0.05 to 0.21)Test for heterogeneity: not applicableTest for overall effect: z = 3.12 (p = 0.002)
Total (95% CI) 222 62 100.00 0.13 (0.05 to 0.21)Test for heterogeneity: not applicableTest for overall effect: z = 3.12 (p = 0.002)
Favours control Favours treatment
(95% CI) (%) (95% CI)
–0.5 –0.25 0 0.25 0.5
FIGURE 37
Comparison: 07 Sibutramine + diet vs placebo + diet at 18 monthsOutcome: 05 Change in triglycerides (mmol/l)
Study Treatment Control WMD (fixed) Weight WMD (fixed)or sub-category n nMean (SD) Mean (SD)
01 Weight maintenanceSTORM, 2000 222 –0.05 (0.96) 62 0.28 (0.96) 100.00 –0.33 (–0.60 to –0.06)
Subtotal (95% CI) 222 62 100.00 –0.33 (–0.60 to –0.06)Test for heterogeneity: not applicableTest for overall effect: z = 2.39 (p = 0.02)
Total (95% CI) 222 62 100.00 –0.33 (–0.60 to –0.06)Test for heterogeneity: not applicableTest for overall effect: z = 2.39 (p = 0.02)
Favours treatment Favours control
(95% CI) (%) (95% CI)
–1 –0.5 0 0.5 1
FIGURE 38

Health Technology Assessment 2004; Vol. 8: No. 21
29
© Queen’s Printer and Controller of HMSO 2004. All rights reserved.
Comparison: 07 Sibutramine + diet vs placebo + diet at 18 months Outcome: 06 Change in HbA1c%
Study Treatment Control WMD (fixed) Weight WMD (fixed)or sub-category n nMean (SD) Mean (SD)
01 Weight maintenanceSTORM, 2000 222 0.00 (0.71) 62 0.16 (0.71) 100.00 –0.16 (–0.36 to 0.04)
Subtotal (95% CI) 222 62 100.00 –0.16 (–0.36 to 0.04)Test for heterogeneity: not applicableTest for overall effect: z = 1.57 (p = 0.12)
Total (95% CI) 222 62 100.00 –0.16 (–0.36 to 0.04)Test for heterogeneity: not applicableTest for overall effect: z = 1.57 (p = 0.12)
Favours treatment Favours control
(95% CI) (%) (95% CI)
–1 –0.5 0 0.5 1
FIGURE 39
Comparison: 07 Sibutramine + diet vs placebo + diet at 18 monthsOutcome: 07 Change in fasting plasma glucose (mmol/l)
Study Treatment Control WMD (fixed) Weight WMD (fixed)or sub-category n nMean (SD) Mean (SD)
01 Weight maintenanceSTORM, 2000 222 0.14 (1.35) 62 0.26 (1.35) 100.00 –0.12 (–0.50 to 0.26)
Subtotal (95% CI) 222 62 100.00 –0.12 (–0.50 to 0.26)Test for heterogeneity: not applicableTest for overall effect: z = 0.62 (p = 0.54)
Total (95% CI) 222 62 100.00 –0.12 (–0.50 to 0.26)Test for heterogeneity: not applicableTest for overall effect: z = 0.62 (p = 0.54)
Favours treatment Favours control
(95% CI) (%) (95% CI)
–1 –0.5 0 0.5 1
FIGURE 40
Comparison: 05 Sibutramine + diet vs placebo + diet at 12 monthsOutcome: 05 Change in SBP (mmHg)
Study Treatment Control WMD (fixed) Weight WMD (fixed)or sub-category n nMean (SD) Mean (SD)
01 Weight reductionMcMahon, 2000 142 2.70 (12.70) 69 1.50 (12.70) 23.37 1.20 (–2.45 to 4.85)Smith, 2001a 154 1.00 (12.70) 153 –0.50 (12.70) 38.63 1.50 (–1.34 to 4.34)Smith, 2001b 149 0.30 (12.70) 153 –0.50 (12.70) 38.00 0.80 (–2.06 to 3.66)
Subtotal (95% CI) 445 375 100.00 1.16 (–0.60 to 2.93)Test for heterogeneity: Chi2 = 0.12, df = 2 (p = 0.94), I2 = 0%Test for overall effect: z = 1.29 (p = 0.20)
02 Weight maintenanceSubtotal (95% CI) 0 0 Not estimableTest for heterogeneity: not applicableTest for overall effect: not applicable
Total (95% CI) 445 375 100.00 1.16 (–0.60 to 2.93)Test for heterogeneity: Chi2 = 0.12, df = 2 (p = 0.94), I2 = 0%Test for overall effect: z = 1.29 (p = 0.20)
–10 –5 0 5 10
Favours treatment Favours control
(95% CI) (%) (95% CI)
FIGURE 41

for these data are therefore divided into weightreduction and weight maintenance subgroups. Thestudy by Bitsch and Skrumsager71 did not reportthe numbers of participants assessed in eachgroup for change in weight at 1 year. The resultsfor this study are therefore discussed separately.
Two studies reported using an ITT analysis.71,78,79
The numbers of participants allocated to eachgroup in the studies varied from 1077 to 230.73–76
Dropout rates were reported of 50% or greater ineach arm of two studies.73–76,78,79 The overalldropout rate for the study by Bitsch andSkrumsager71 was 53% at 1 year. One studyexamined people with type 2 diabetes77 and onestudy examined people with either type 2 diabetesor impaired glucose tolerance.72 See results inTable 3 for people with type 2 diabetes. Reportedmean BMI ranged from 29.2 kg/m2 78,79 to39.5 kg/m2.72 The study by Bitsch andSkrumsager71 did not report body weight or BMIat baseline but recruited participants at 20% orabove ideal body weight (IBW). The study byWadden and colleagues78,79 recruited females only.
All participants in each group in each of thestudies received equal numbers of contact visits.These were similar across studies, ranging fromten to 16 visits, except for the study by Waddenand colleagues78,79 where participants were seen29 times during 12 months. All participants ineach arm of the studies received identical
treatment, except for receiving either SSRI orplacebo. The content of the non-drug interventionsvaried across the studies. Bitsch and Skrumsager71
advised participants to consume an LCD, whereasBreum and colleagues72 advised participants tofollow an LCD and provided behaviour therapy.Goldstein and colleagues73–76 advised a diet aimedto produce weight loss of 0.45 kg per week withbehaviour therapy (which varied between trialsites). Participants in the study by O’Kane andcolleagues77 were advised to continue their usualdiet and exercise patterns. Participants in thestudy by Wadden and colleagues78,79 were requiredto have lost at least 10% of their initial weightduring a 26-week pretreatment phase of VLCDsplus behaviour therapy. The VLCDs were 420, 660or 800 kcal/day. Participants were then randomisedto sertraline up to 200 mg/day or placebo andgiven advice on a 1500–1800 kcal/day diet withbehaviour therapy and exercise. The study byBitsch and Skrumsager71 randomised participantsto up to 600 mg femoxetine daily or placebo andthe three other studies used 60 mg fluoxetine dailyor placebo.72–77
Review resultsSSRIs had no apparent added effect on weight lossor maintenance or any of the reported risk factors(Figures 43–50). At 12 months the added effect ofSSRIs on weight reduction was associated with anoverall WMD weight change of –0.33 kg (95% CI–1.49 to 0.82 kg). This was primarily influenced bythe study of Goldstein and colleagues.73–76
Systematic review of RCTs
30
Comparison: 05 Sibutramine + diet vs placebo + diet at 12 monthsOutcome: 06 Change in DBP (mmHg)
Study Treatment Control WMD (fixed) Weight WMD (fixed)or sub-category n nMean (SD) Mean (SD)
01 Weight reductionMcMahon, 2000 142 2.00 (8.30) 69 –1.30 (8.30) 23.37 3.30 (0.91 to 5.69)Smith, 2001a 154 1.60 (8.30) 153 –0.90 (8.30) 38.63 2.50 (0.64 to 4.36)Smith, 2001b 149 –0.10 (8.30) 153 –0.90 (8.30) 38.00 0.80 (–1.07 to 2.67)
Subtotal (95% CI) 445 375 100.00 2.04 (0.89 to 3.20)Test for heterogeneity: Chi2 = 2.99, df = 2 (p = 0.22), I2 = 33.1%Test for overall effect: z = 3.47 (p = 0.0005)
02 Weight maintenanceSubtotal (95% CI) 0 0 Not estimableTest for heterogeneity: not applicableTest for overall effect: not applicable
Total (95% CI) 445 375 100.00 2.04 (0.89 to 3.20)Test for heterogeneity: Chi2 = 2.99, df = 2 (p = 0.22), I2 = 33.1%Test for overall effect: z = 3.47 (p = 0.0005)
–10 –5 0 5 10
Favours treatment Favours control
(95% CI) (%) (95% CI)
FIGURE 42

Health Technology Assessm
ent2004; Vol. 8: No. 21
31
© Q
ueen’s Printer and Controller of H
MSO
2004. All rights reserved.
TABLE 2 Effects of sibutramine and diet versus diet on weight and risk factors in weight reduction studies in people with hypertension
Weight Total HDL LDL TGs SBP DBP Fasting (kg) cholesterol cholesterol cholesterol (mmol/l) (mmHg) (mmHg) plasma
(mmol/l) (mmol/l) (mmol/l) glucose(mmol/l)
12 months –3.90 0.04 0.08 0.02 –0.18 1.20 3.30 –0.08
WMD (95% CI) (–5.75 to –2.05) (–0.29 to 0.37) (–0.01 to 0.17) (–0.21 to 0.25) (–0.47 to 0.11) (–2.45 to 4.85) (0.91 to 5.69) (–0.49 to 0.33)
No. of studies n = 1 n = 1 n = 1 n = 1 n = 1 n = 1 n = 1 n = 1
TABLE 3 Effects of SSRI and diet versus placebo and diet in people with type 2 diabetes
Weight Total HDL TGs SBP DBP Fasting HbA1c%(kg) cholesterol cholesterol (mmol/l) (mmHg) (mmHg) plasma
(mmol/l) (mmol/l) glucose(mmol/l)
12 months –3.27 0.50 –0.08 –0.08 5.60 –0.30 –1.13 –0.84
WMD (95% CI) (–8.83 to 2.29) (–0.17 to 1.17) (–0.29 to 0.13) (–0.67 to 0.50) (–3.65 to 14.85) (–6.35 to 5.75) (–2.68 to 0.43) (–2.46 to 0.77)
No. of studies n = 2 n = 2 n = 1 n = 2 n = 1 n = 1 n = 2 n = 2

The study by Bitsch and Skrumsager71 assessedweight at 12 months in 37 participants andreported a median change in weight of –6.6 kg forthe femoxetine group and –8.8 kg for the placebogroup.
O’Kane and colleagues77 reported one seriousadverse event of colonic malignancy in the placebogroup. Wadden and colleagues78,79 reported nodifference in depression scores betweenparticipants on sertraline and placebo; otherstudies did not report on mood. Goldstein andcolleagues,73–76 Wadden and colleagues78,79 andBitsch and Skrumsager71 reported significantly
more adverse events in the SSRI groups, whichwere expected side-effects of the drugs.
Effects of metformin and diet versusplacebo and dietDescription of studiesThree RCTs provided change in weight at 12 months or longer.80–93 Two studies providedchange in weight at 12 months84–93 and one ofthese studies also provided change in weight at 2 years.84 One of these studies was a subgroup ofthe UK Prospective Diabetes Study (UKPDS),which investigated the management of peoplewith newly diagnosed type 2 diabetes, in which
Systematic review of RCTs
32
Comparison: 10 SSRI + diet vs placebo + diet at 12 monthsOutcome: 01 Weight change (kg)
Study Treatment Control WMD (fixed) Weight WMD (fixed)or sub-category n nMean (SD) Mean (SD)
01 Weight reductionBreum, 1995 15 –10.10 (10.00) 14 –9.40 (11.55) 2.08 –0.70 (–8.59 to 7.19)Goldstein, 1994 230 –1.40 (7.10) 228 –1.20 (5.70) 93.29 –0.20 (–1.38 to 0.98)O’Kane, 1994 7 –4.30 (7.79) 9 1.50 (8.11) 2.11 –5.80 (–13.63 to 2.03)
Subtotal (95% CI) 252 251 97.48 –0.33 (–1.49 to 0.82)Test for heterogeneity: Chi2 = 1.93, df = 2 (p = 0.38), I2 = 0%Test for overall effect: z = 0.56 (p = 0.57)
02 Weight maintenanceWadden, 1995 13 17.70 (10.60) 17 11.80 (9.00) 2.52 5.90 (–1.28 to 13.08)
Subtotal (95% CI) 13 17 2.52 5.90 (–1.28 to 13.08)Test for heterogeneity: not applicableTest for overall effect: z = 1.61 (p = 0.11)
Total (95% CI) 265 268 100.00 –0.18 (–1.31 to 0.96)Test for heterogeneity: Chi2 = 4.75, df = 3 (p = 0.19), I2 = 36.9%Test for overall effect: z = 0.30 (p = 0.76)
–10 –5 0 5 10
Favours treatment Favours control
(95% CI) (%) (95% CI)
FIGURE 43
Comparison: 10 SSRI + diet vs placebo + diet at 12 monthsOutcome: 05 Change in total cholesterol (mmol/l)
Study Treatment Control WMD (fixed) Weight WMD (fixed)or sub-category n nMean (SD) Mean (SD)
01 Weight reductionBreum, 1995 15 0.10 (1.08) 14 –0.40 (1.08) 72.24 0.50 (–0.29 to 1.29)O’Kane, 1994 7 0.40 (1.14) 9 –0.10 (1.45) 27.76 0.50 (–0.77 to 1.77)
Subtotal (95% CI) 22 23 100.00 0.50 (–0.17 to 1.17)Test for heterogeneity: Chi2 = 0.00, df = 1 (p = 1.00), I2 = 0%Test for overall effect: z = 1.47 (p = 0.14)
Total (95% CI) 22 23 100.00 0.50 (–0.17 to 1.17)Test for heterogeneity: Chi2 = 0.00, df = 1 (p = 1.00), I2 = 0%Test for overall effect: z = 1.47 (p = 0.14)
Favours treatment Favours control
–4 –2 0 2 4
(95% CI) (%) (95% CI)
FIGURE 44

Health Technology Assessment 2004; Vol. 8: No. 21
33
© Queen’s Printer and Controller of HMSO 2004. All rights reserved.
Comparison: 10 SSRI + diet vs placebo + diet at 12 monthsOutcome: 08 Change in HDL cholesterol (mmol/l)
Study Treatment Control WMD (fixed) Weight WMD (fixed)or sub-category n nMean (SD) Mean (SD)
01 Weight reductionBreum, 1995 15 0.05 (0.29) 14 0.13 (0.29) 100.00 –0.08 (–0.29 to 0.13)
Subtotal (95% CI) 15 14 100.00 –0.08 (–0.29 to 0.13)Test for heterogeneity: not applicableTest for overall effect: z = 0.74 (p = 0.46)
Total (95% CI) 15 14 100.00 –0.08 (–0.29 to 0.13)Test for heterogeneity: not applicableTest for overall effect: z = 0.74 (p = 0.46)
Favours control Favours treatment
–0.5 –0.25 0 0.25 0.5
(95% CI) (%) (95% CI)
FIGURE 45
Comparison: 10 SSRI + diet vs placebo + diet at 12 months Outcome: 06 Change in triglycerides (mmol/l)
Study Treatment Control WMD (fixed) Weight WMD (fixed)or sub-category n nMean (SD) Mean (SD)
01 Weight reductionBreum, 1995 15 –0.30 (0.96) 14 –0.40 (0.96) 69.26 0.10 (–0.60 to 0.80)O’Kane, 1994 7 –0.27 (0.53) 9 0.23 (1.49) 30.74 –0.50 (–1.55 to 0.55)
Subtotal (95% CI) 22 23 100.00 –0.08 (–0.67 to 0.50)Test for heterogeneity: Chi2 = 0.87, df = 1 (p = 0.35), I2 = 0%Test for overall effect: z = 0.28 (p = 0.78)
Total (95% CI) 22 23 100.00 –0.08 (–0.67 to 0.50)Test for heterogeneity: Chi2 = 0.87, df = 1 (p = 0.35), I2 = 0%Test for overall effect: z = 0.28 (p = 0.78)
Favours treatment Favours control
(95% CI) (%) (95% CI)
–4 –2 0 2 4
FIGURE 46
Comparison: 10 SSRI + diet vs placebo + diet at 12 months Outcome: 07 Change in HbA1c%
Study Treatment Control WMD (fixed) Weight WMD (fixed)or sub-category n nMean (SD) Mean (SD)
01 Weight reductionBreum, 1995 15 –1.30 (2.58) 14 –0.80 (2.58) 73.50 –0.50 (–2.38 to 1.38)O'Kane, 1994 7 –0.80 (2.49) 9 1.00 (3.87) 26.50 –1.80 (–4.93 to 1.33)
Subtotal (95% CI) 22 23 100.00 –0.84 (–2.46 to 0.77)Test for heterogeneity: Chi2 = 0.49, df = 1 (p = 0.49), z2 = 0%Test for overall effect: z = 1.03 (p = 0.30)
Total (95% CI) 2 23 100.00 –0.84 (–2.46 to 0.77)Test for heterogeneity: Chi2 = 0.49, df = 1 (p = 0.49), I2 = 0%Test for overall effect: z = 1.03 (p = 0.30)
Favours treatment Favours control
(95% CI) (%) (95% CI)
–4 –2 0 2 4
FIGURE 47

Systematic review of RCTs
34
Comparison: 10 SSRI + diet vs placebo + diet at 12 monthsOutcome: 02 Change in fasting plasma glucose (mmol/l)
Study Treatment Control WMD (fixed) Weight WMD (fixed)or sub-category n nMean (SD) Mean (SD)
01 Weight reductionBreum, 1995 15 –2.10 (3.60) 14 –0.80 (1.20) 65.31 –1.30 (–3.23 to 0.63)O’Kane, 1994 7 –0.30 (2.49) 9 0.50 (2.90) 34.69 –0.80 (–3.44 to 1.84)
Subtotal (95% CI) 22 23 100.00 –1.13 (–2.68 to 0.43)Test for heterogeneity: Chi2 = 0.09, df = 1 (p = 0.76), I2 = 0%Test for overall effect: z = 1.42 (p = 0.16)
Total (95% CI) 22 23 100.00 –1.13 (–2.68 to 0.43)Test for heterogeneity: Chi2 = 0.09, df = 1 (p = 0.76), I2 = 0%Test for overall effect: z = 1.42 (p = 0.16)
Favours treatment Favours control
(95% CI) (%) (95% CI)
–4 –2 0 2 4
FIGURE 48
Comparison: 10 SSRI + diet vs placebo + diet at 12 monthsOutcome: 04 Change in DBP (mmHg)
Study Treatment Control WMD (fixed) Weight WMD (fixed)or sub-category n nMean (SD) Mean (SD)
01 Weight reductionBreum, 1995 15 –6.70 (8.30) 14 –6.40 (8.30) 100.00 –0.30 (–6.35 to 5.75)
Subtotal (95% CI) 15 14 100.00 –0.30 (–6.35 to 5.75)Test for heterogeneity: not applicableTest for overall effect: z = 0.10 (p = 0.92)
Total (95% CI) 15 14 100.00 –0.30 (–6.35 to 5.75)Test for heterogeneity: not applicableTest for overall effect: z = 0.10 (p = 0.92)
–10 –5 0 5 10
Favours treatment Favours control
(95% CI) (%) (95% CI)
FIGURE 49
Comparison: 10 SSRI + diet vs placebo + diet at 12 monthsOutcome: 03 Change in SBP (mmHg)
Study Treatment Control WMD (fixed) Weight WMD (fixed)or sub-category n nMean (SD) Mean (SD)
01 Weight reductionBreum, 1995 15 –1.50 (12.70) 14 –7.10 (12.70) 100.00 5.60 (–3.65 to 14.85)
Subtotal (95% CI) 15 14 100.00 5.60 (–3.65 to 14.85)Test for heterogeneity: not applicableTest for overall effect: z = 1.19 (p = 0.24)
Total (95% CI) 15 14 100.00 5.60 (–3.65 to 14.85)Test for heterogeneity: not applicableTest for overall effect: z = 1.19 (p = 0.24)
–10 –5 0 5 10
Favours treatment Favours control
(95% CI) (%) (95% CI)
FIGURE 50

411 participants were randomised to receivedietary treatment and 343 metformin in addition.The UKPDS85–93 provided change in weight atmedian follow-up periods of 5, 10 and 15 years.Data were provided for lipids, blood pressure,fasting plasma glucose and HbA1c at 12 monthsand for total cholesterol, triglycerides, bloodpressure and HbA1c at 24 months. The UKPDS85–93
provided data for fasting plasma glucose andHbA1c at median follow-up periods of 5, 10 and 15 years.
The Biguanides and the Prevention of the Risk ofObesity (BIGPRO 1)80–83 study recruited peoplewith a high waist-to-hip ratio and the studies byTeupe and Bergis84 and UKPDS85–93 recruitedpeople with type 2 diabetes. One study assessedparticipants using an ITT approach.80–83 It wasunclear whether an ITT approach had been used in the UKPDS.85–93 The UKPDS included a 3-month dietary run-in period beforerandomisation. Dropouts in the study by Teupeand Bergis84 were 46% at 2 years, and 29% inBIGPRO 1.80–83 Data were only available for 5% ofthe control group and 6% of the metformin groupat the median follow-up period of 15 years inUKPDS.85–93
The second year of the study by Teupe andBergis84 was categorised as a weight maintenancephase. Reported mean BMI in studies rangedfrom 30.5 kg/m2 84 to 33.3 kg/m2.80–83 All
participants in each study received an equalnumber of appointments and participants in theactive treatment groups received a maximum of1700 mg metformin daily.
Review resultsMetformin for weight reduction was associatedwith a WMD effect on weight at 12 months of–1.09 kg (95% CI –2.29 to 0.11 kg) and at 24 months of –0.50 kg (95% CI –4.02 to 3.02 kg)(Figures 51 and 52, 12.01). At a median of 5 yearsmetformin was associated with a WMD weightchange of –0.12 kg (95% CI –1.13 to 0.89 kg), at10 years of –0.37 kg (95% CI –1.67 to 0.93 kg) andat 15 years of –2.71 kg (95% CI –6.98 to 1.56 kg)(Figures 53–55). The longer term data were onlyavailable for the UKPDS study.
Metformin had a beneficial effect on totalcholesterol at 12 and 24 months (Figures 56–61)and on fasting plasma glucose at 12 months(Figure 62). At a median of 5 years metformin wasassociated with a WMD in fasting plasma glucoseof –1.30 mmol/l (95% CI –1.91 to –0.69 mmol/l), 10 years of –0.34 mmol/l (95% CI –1.10 to0.42 mmol/l) and 15 years of –1.51 mmol/l (95% CI –3.76 to 0.74 mmol/l) (Figures 63–65). TheUKPDS85–93 was associated with a WMD in HbA1c
at a median of 5 years of –1.08% (95% CI –1.50 to–0.66%), 10 years of –0.46% (95% CI –0.98 to0.06%) and 15 years of –2.31% (95% CI –3.85 to–0.77%) (Figures 66–70).
Health Technology Assessment 2004; Vol. 8: No. 21
35
© Queen’s Printer and Controller of HMSO 2004. All rights reserved.
Comparison: 11 Metformin + diet vs placebo + diet at 12 monthsOutcome: 01 Weight change (kg)
Study Treatment Control WMD (fixed) Weight WMD (fixed)or sub-category n nMean (SD) Mean (SD)
01 Weight reductionBIGPRO 1, 1996 164 –2.00 (6.20) 160 –0.80 (5.50) 79.32 –1.20 (–2.48 to 0.08)Teupe, 1991 25 –3.20 (6.82) 29 –3.00 (6.76) 9.78 –0.20 (–3.83 to 3.43)
Subtotal (95% CI) 189 189 89.10 –1.09 (–2.29 to 0.11)Test for heterogeneity: Chi2 = 0.26, df = 1 (p = 0.61), I2 = 0%Test for overall effect: z = 1.78 (p = 0.08)
02 Weight maintenanceTeupe, 1991 25 0.60 (6.65) 29 0.90 (6.17) 10.90 –0.30 (–3.74 to 3.14)
Subtotal (95% CI) 25 29 10.90 –0.30 (–3.74 to 3.14)Test for heterogeneity: not applicableTest for overall effect: z = 0.17 (p = 0.86)
Total (95% CI) 214 218 100.00 –1.00 (–2.14 to 0.13)Test for heterogeneity: Chi2 = 0.44, df = 2 (p = 0.80), I2 = 0%Test for overall effect: z = 1.73 (p = 0.08)
–10 –5 0 5 10
Favours treatment Favours control
(95% CI) (%) (95% CI)
FIGURE 51

Systematic review of RCTs
36
Comparison: 12 Metformin + diet vs placebo + diet at 24 monthsOutcome: 01 Weight change (kg)
Study Treatment Control WMD (fixed) Weight WMD (fixed)or sub-category n nMean (SD) Mean (SD)
01 Weight reductionTeupe, 1991 25 –2.60 (6.65) 29 –2.10 (6.51) 100.00 –0.50 (–4.02 to 3.02)
Subtotal (95% CI) 25 29 100.00 –0.50 (–4.02 to 3.02)Test for heterogeneity: not applicableTest for overall effect: z = 0.28 (p = 0.78)
Total (95% CI) 25 29 100.00 –0.50 (–4.02 to 3.02)Test for heterogeneity: not applicableTest for overall effect: z = 0.28 (p = 0.78)
–10 –5 0 5 10
Favours treatment Favours control
(95% CI) (%) (95% CI)
FIGURE 52
Comparison: 13 Metformin + diet vs no treatment + diet at median follow-up of 5 yearsOutcome: 01 Weight change (kg)
Study Treatment Control WMD (fixed) Weight WMD (fixed)or sub-category n nMean (SD) Mean (SD)
UKPDS, 1998 279 1.19 (6.25) 309 1.31 (6.29) 100.00 –0.12 (–1.13 to 0.89)
Total (95% CI) 279 309 100.00 –0.12 (–1.13 to 0.89)Test for heterogeneity: not applicableTest for overall effect: z = 0.23 (p = 0.82)
–10 –5 0 5 10
Favours treatment Favours control
(95% CI) (%) (95% CI)
FIGURE 53
Comparison: 14 Metformin + diet vs no treatment + diet at median follow-up of 10 years Outcome: 01 Change in weight (kg)
Study Treatment Control WMD (fixed) Weight WMD (fixed)or sub-category n nMean (SD) Mean (SD)
UKPDS, 1998 181 1.68 (6.39) 200 2.05 (6.50) 100.00 –0.37 (–1.67 to 0.93)
Total (95% CI) 181 200 100.00 –0.37 (–1.67 to 0.93)Test for heterogeneity: not applicableTest for overall effect: z = 0.56 (p = 0.58)
–10 –5 0 5 10
Favours treatment Favours control
(95% CI) (%) (95% CI)
FIGURE 54

Health Technology Assessment 2004; Vol. 8: No. 21
37
© Queen’s Printer and Controller of HMSO 2004. All rights reserved.
Comparison: 15 Metformin + diet vs no treatment + diet at median 15 years Outcome: 01 Change in weight (kg)
Study Treatment Control WMD (fixed) Weight WMD (fixed)or sub-category n Mean (SD) n Mean (SD)
UKPDS, 1998 21 2.99 (6.76) 22 5.70 (7.53) 100.00 –2.71 (–6.98 to 1.56)
Total (95% CI) 21 22 100.00 –2.71 (–6.98 to 1.56)Test for heterogeneity: not applicableTest for overall effect: z = 1.24 (p = 0.21)
–10 –5 0 5 10
Favours treatment Favours control
(95% CI) (%) (95% CI)
FIGURE 55
Comparison: 11 Metformin + diet vs placebo + diet at 12 months Outcome: 03 Change in total cholesterol (mmol/l)
Study Treatment Control WMD (fixed) Weight WMD (fixed)or sub-category n n Mean (SD)Mean (SD)
01 Weight reductionBIGPRO 1, 1996 164 0.05 (0.74) 160 0.21 (0.70) 93.14 –0.16 (–0.32 to 0.00)Teupe, 1991 25 0.47 (1.08) 29 0.80 (1.08) 6.86 –0.33 (–0.91 to 0.25)
Subtotal (95% CI) 189 189 100.00 –0.17 (–0.32 to –0.02)Test for heterogeneity: Chi2 = 0.31, df = 1 (p = 0.58), I2 = 0%Test for overall effect: z = 2.22 (p = 0.03)
Total (95% CI) 189 189 100.00 –0.17 (–0.32 to –0.02)Test for heterogeneity: Chi2 = 0.31, df = 1 (p = 0.58), I2 = 0%Test for overall effect: z = 2.22 (p = 0.03)
Favours treatment Favours control
(95% CI) (%) (95% CI)
–4 –2 0 2 4
FIGURE 56
Comparison: 12 Metformin + diet vs placebo + diet at 24 months Outcome: 03 Change in total cholesterol (mmol/l)
Study Treatment Control WMD (fixed) Weight WMD (fixed)or sub-category n nMean (SD) Mean (SD)
01 Weight reductionTeupe, 1991 25 0.47 (1.08) 29 1.19 (1.08) 100.00 –0.72 (–1.30 to –0.14)
Subtotal (95% CI) 25 29 100.00 –0.72 (–1.30 to –0.14)Test for heterogeneity: not applicableTest for overall effect: z = 2.44 (p = 0.01)
Total (95% CI) 25 29 100.00 –0.72 (–1.30 to –0.14)Test for heterogeneity: not applicableTest for overall effect: z = 2.44 (p = 0.01)
Favours treatment Favours control
(95% CI) (%) (95% CI)
–4 –2 0 2 4
FIGURE 57

Systematic review of RCTs
38
Comparison: 11 Metformin + diet vs placebo + diet at 12 monthsOutcome: 04 Change in LDL cholesterol (mmol/l)
Study Treatment Control WMD (fixed) Weight WMD (fixed)or sub-category n nMean (SD) Mean (SD)
01 Weight reductionBIGPRO 1, 1996 164 –0.02 (0.65) 160 0.10 (0.59) 100.00 –0.12 (–0.26 to 0.02)
Subtotal (95% CI) 164 160 100.00 –0.12 (–0.26 to 0.02)Test for heterogeneity: not applicableTest for overall effect: z = 1.74 (p = 0.08)
Total (95% CI) 164 160 100.00 –0.12 (–0.26 to 0.02)Test for heterogeneity: not applicableTest for overall effect: z = 1.74 (p = 0.08)
Favours treatment Favours control
(95% CI) (%) (95% CI)
–0.5 –0.25 0 0.25 0.5
FIGURE 58
Comparison: 11 Metformin + diet vs placebo + diet at 12 months Outcome: 05 Change in HDL cholesterol (mmol/l)
Study Treatment Control WMD (fixed) Weight WMD (fixed)or sub-category n nMean (SD) Mean (SD)
01 Weight reductionBIGPRO 1, 1996 164 0.05 (0.34) 160 0.10 (0.31) 100.00 –0.05 (–0.12 to 0.02)
Subtotal (95% CI) 164 160 100.00 –0.05 (–0.12 to 0.02)Test for heterogeneity: not applicableTest for overall effect: z = 1.38 (p = 0.17)
Total (95% CI) 164 160 100.00 –0.05 (–0.12 to 0.02)Test for heterogeneity: not applicableTest for overall effect: z = 1.38 (p = 0.17)
Favours control Favours treatment
(95% CI) (%) (95% CI)
–0.5 –0.25 0 0.25 0.5
FIGURE 59
Comparison: 11 Metformin + diet vs placebo + diet at 12 months Outcome: 06 Change in triglycerides (mmol/l)
Study Treatment Control WMD (fixed) Weight WMD (fixed)or sub-category n nMean (SD) Mean (SD)
01 Weight reductionBIGPRO 1, 1996 164 0.10 (0.65) 160 –0.02 (0.73) 92.08 0.12 (–0.03 to 0.27)Teupe, 1991 25 0.11 (0.96) 29 0.33 (0.96) 7.92 –0.22 (–0.73 to 0.29)
Subtotal (95% CI) 189 189 100.00 0.09 (–0.05 to 0.24)Test for heterogeneity: Chi2 = 1.55, df = 1 (p = 0.21), I2 = 35.5%Test for overall effect: z = 1.26 (p = 0.21)
Total (95% CI) 189 189 100.00 0.09 (–0.05 to 0.24)Test for heterogeneity: Chi2 = 1.55, df = 1 (p = 0.21), I2 = 35.5%Test for overall effect: z = 1.26 (p = 0.21)
Favours treatment Favours control
(95% CI) (%) (95% CI)
–1 –0.5 0 0.5 1
FIGURE 60

Health Technology Assessment 2004; Vol. 8: No. 21
39
© Queen’s Printer and Controller of HMSO 2004. All rights reserved.
Comparison: 12 Metformin + diet vs placebo + diet at 24 monthsOutcome: 06 Change in triglycerides (mmol/l)
Study Treatment Control WMD (fixed) Weight WMD (fixed)or sub-category n nMean (SD) Mean (SD)
01 Weight reductionTeupe, 1991 25 0.40 (0.96) 29 0.58 (0.96) 100.00 –0.18 (–0.69 to 0.33)
Subtotal (95% CI) 25 29 100.00 –0.18 (–0.69 to 0.33)Test for heterogeneity: not applicableTest for overall effect: z = 0.69 (p = 0.49)
Total (95% CI) 25 29 100.00 –0.18 (–0.69 to 0.33)Test for heterogeneity: not applicableTest for overall effect: z = 0.69 (p = 0.49)
Favours treatment Favours control
(95% CI) (%) (95% CI)
–1 –0.5 0 0.5 1
FIGURE 61
Comparison: 11 Metformin + diet vs placebo + diet at 12 monthsOutcome: 11 Change in fasting plasma glucose (mmol/l)
Study Treatment Control WMD (fixed) Weight WMD (fixed)or sub-category n nMean (SD) Mean (SD)
01 Weight reductionBIGPRO 1, 1996 164 0.20 (0.99) 160 0.40 (0.84) 100.00 –0.20 (–0.40 to 0.00)
Subtotal (95% CI) 164 160 100.00 –0.20 (–0.40 to 0.00)Test for heterogeneity: not applicableTest for overall effect: z = 1.96 (p = 0.05)
Total (95% CI) 164 160 100.00 –0.20 (–0.40 to 0.00)Test for heterogeneity: not applicableTest for overall effect: z = 1.96 (p = 0.05)
Favours treatment Favours control
(95% CI) (%) (95% CI)
–4 –2 0 2 4
FIGURE 62
Comparison: 13 Metformin + diet vs no treatment + diet at median follow-up of 5 years Outcome: 02 Change in fasting plasma glucose (mmol/l)
Study Treatment Control WMD (fixed) Weight WMD (fixed)or sub-category n nMean (SD) Mean (SD)
UKPDS, 1998 279 0.15 (3.77) 309 1.45 (3.77) 100.00 –1.30 (–1.91 to –0.69)
Total (95% CI) 279 309 100.00 –1.30 (–1.91 to –0.69)Test for heterogeneity: not applicableTest for overall effect: z = 4.18 (p < 0.0001)
Favours treatment Favours control
(95% CI) (%) (95% CI)
–4 –2 0 2 4
FIGURE 63

Systematic review of RCTs
40
Comparison: 14 Metformin + diet vs no treatment + diet at median follow-up of 10 years Outcome: 02 Change in fasting plasma glucose (mmol/)
Study Treatment Control WMD (fixed) Weight WMD (fixed)or sub-category n nMean (SD) Mean (SD)
UKPDS, 1998 181 1.79 (3.77) 200 2.13 (3.77) 100.00 –0.34 (–1.10 to 0.42)
Total (95% CI) 181 200 100.00 –0.34 (–1.10 to 0.42)Test for heterogeneity: not applicableTest for overall effect: z = 0.88 (p = 0.38)
Favours treatment Favours control
(95% CI) (%) (95% CI)
–4 –2 0 2 4
FIGURE 64
Comparison: 15 Metformin + diet vs no treatment + diet at median 15 years Outcome: 02 Change in fasting plasma glucose (mmol/l)
Study Treatment Control WMD (fixed) Weight WMD (fixed)or sub-category n nMean (SD) Mean (SD)
UKPDS, 1998 21 1.57 (3.77) 22 3.08 (3.77) 100.00 –1.51 (–3.76 to 0.74)
Total (95% CI) 21 22 100.00 –1.51 (–3.76 to 0.74)Test for heterogeneity: not applicableTest for overall effect: z = 1.31 (p = 0.19)
Favours treatment Favours control
(95% CI) (%) (95% CI)
–4 –2 0 2 4
FIGURE 65
Comparison: 11 Metformin + diet vs placebo + diet at 12 months Outcome: 02 Change in HbA1c%
Study Treatment Control WMD (fixed) Weight WMD (fixed)or sub-category n nMean (SD) Mean (SD)
01 Weight reductionTeupe, 1991 25 –1.10 (2.58) 29 –0.60 (2.58) 100.00 –0.50 (–1.88 to 0.88)
Subtotal (95% CI) 25 29 100.00 –0.50 (–1.88 to 0.88)Test for heterogeneity: not applicableTest for overall effect: z = 0.71 (p = 0.48)
Total (95% CI) 25 29 100.00 –0.50 (–1.88 to 0.88)Test for heterogeneity: not applicableTest for overall effect: z = 0.71 (p = 0.48)
Favours treatment Favours control
(95% CI) (%) (95% CI)
–4 –2 0 2 4
FIGURE 66

Health Technology Assessment 2004; Vol. 8: No. 21
41
© Queen’s Printer and Controller of HMSO 2004. All rights reserved.
Comparison: 12 Metformin + diet vs placebo + diet at 24 months Outcome: 02 Change in HbA1c%
Study Treatment Control WMD (fixed) Weight WMD (fixed)or sub-category n nMean (SD) Mean (SD)
01 Weight reductionTeupe, 1991 25 –0.90 (2.58) 29 –0.70 (2.58) 100.00 –0.20 (–1.58 to 1.18)
Subtotal (95% CI) 25 29 100.00 –0.20 (–1.58 to 1.18)Test for heterogeneity: not applicableTest for overall effect: z = 0.28 (p = 0.78)
Total (95% CI) 25 29 100.00 –0.20 (–1.58 to 1.18)Test for heterogeneity: not applicableTest for overall effect: z = 0.28 (p = 0.78)
Favours treatment Favours control
(95% CI) (%) (95% CI)
–4 –2 0 2 4
FIGURE 67
Comparison: 13 Metformin + diet vs no treatment + diet at median follow-up of 5 years Outcome: 03 Change in HbA1c%
Study Treatment Control WMD (fixed) Weight WMD (fixed)or sub-category n nMean (SD) Mean (SD)
UKPDS, 1998 279 –0.23 (2.58) 309 0.85 (2.58) 100.00 –1.08 (–1.50 to –0.66)
Total (95% CI) 279 309 100.00 –1.08 (–1.50 to –0.66)Test for heterogeneity: not applicableTest for overall effect: z = 5.07 (p < 0.00001)
Favours treatment Favours control
(95% CI) (%) (95% CI)
–4 –2 0 2 4
FIGURE 68
Comparison: 14 Metformin + diet vs no treatment + diet at median follow-up of 10 years Outcome: 03 Change in HbA1c%
Study Treatment Control WMD (fixed) Weight WMD (fixed)or sub-category n nMean (SD) Mean (SD)
UKPDS, 1998 181 0.99 (2.58) 200 1.45 (2.58) 100.00 –0.46 (–0.98 to 0.06)
Total (95% CI) 181 200 100.00 –0.46 (–0.98 to 0.06)Test for heterogeneity: not applicableTest for overall effect: z = 1.74 (p = 0.08)
Favours treatment Favours control
(95% CI) (%) (95% CI)
–4 –2 0 2 4
FIGURE 69

At 12 months the control arms were associatedwith greater reduction in SBP and DBP than the metformin arms and at 24 months this was statistically significant (Figures 71–74). TheWMD effect on SBP at 24 months was10.00 mmHg(95% CI 3.21 to 16.79 mmHg) and on DBP at 24 months was 5.00 mmHg (95% CI 0.56 to 9.44 mmHg). It should be noted these data at 24 months were derived from one study with small numbers of participants84 and that the confidence intervalsare wide.
Results for risk factor and weight changes forstudies with diabetic participants only are shownin Table 4.
One death and no new cases of diabetes werereported in the metformin group of the BIGPRO1 study80–83 and five new cases of diabetesoccurred in the placebo group (OR for developingdiabetes 0.09, 95% CI 0.00 to 1.64) (Figures 75 and76). Teupe and Bergis84 reported one MI in thetreatment group at 1 year (Figure 77). Diarrhoeawas more commonly reported for participants onmetformin in BIGPRO 180–83 and the study byTeupe and Bergis.84
The UKPDS85–93 reported outcomes of totalmortality, and deaths from MI, stroke and all-cause cancers at a median period of 10 years(Figures 78–81). For all-cause mortality the OR was0.62 (95% CI 0.42 to 0.91) in favour of metformin,
Systematic review of RCTs
42
Comparison: 15 Metformin + diet vs no treatment + diet at median 15 years Outcome: 03 Change in HbA1c%
Study Treatment Control WMD (fixed) Weight WMD (fixed)or sub-category n Mean (SD) n Mean (SD)
UKPDS, 1998 21 0.30 (2.58) 22 2.61 (2.58) 100.00 –2.31 (–3.85 to –0.77)
Total (95% CI) 21 22 100.00 –2.31 (–3.85 to –0.77)Test for heterogeneity: not applicableTest for overall effect: z = 2.93 (p = 0.003)
Favours treatment Favours control
(95% CI) (%) (95% CI)
–4 –2 0 2 4
FIGURE 70
Comparison: 11 Metformin + diet vs placebo + diet at 12 monthsOutcome: 08 Change in DBP (mmHg)
Study Treatment Control WMD (fixed) Weight WMD (fixed)or sub-category n nMean (SD) Mean (SD)
01 Weight reductionBIGPRO 1, 1996 164 –0.89 (10.05) 160 –1.50 (11.88) 63.14 0.61 (–1.79 to 3.01)Teupe, 1991 25 0.00 (8.30) 29 –2.00 (8.30) 18.43 2.00 (–2.44 to 6.44)
Subtotal (95% CI) 189 189 81.57 0.92 (–1.19 to 3.03)Test for heterogeneity: Chi2 = 0.29, df = 1 (p = 0.59), I2 = 0%Test for overall effect: z = 0.86 (p = 0.39)
02 Weight maintenanceTeupe, 1991 25 –3.00 (8.30) 29 –6.00 (8.30) 18.43 3.00 (–1.44 to 7.44)
Subtotal (95% CI) 25 29 18.43 3.00 (–1.44 to 7.44)Test for heterogeneity: not applicableTest for overall effect: z = 1.32 (p = 0.19)
Total (95% CI) 214 218 100.00 1.31 (–0.60 to 3.21)Test for heterogeneity: Chi2 = 0.98, df = 2 (p = 0.61), I2 = 0%Test for overall effect: z = 1.34 (p = 0.18)
–10 –5 0 5 10
Favours treatment Favours control
(95% CI) (%) (95% CI)
FIGURE 71

Health Technology Assessment 2004; Vol. 8: No. 21
43
© Queen’s Printer and Controller of HMSO 2004. All rights reserved.
Comparison: 12 Metformin + diet vs placebo + diet at 24 months Outcome: 08 Change in DBP (mmHg)
Study Treatment Control WMD (fixed) Weight WMD (fixed)or sub-category n nMean (SD) Mean (SD)
01 Weight reductionTeupe, 1991 25 –3.00 (8.30) 29 –8.00 (8.30) 100.00 5.00 (0.56 to 9.44)
Subtotal (95% CI) 25 29 100.00 5.00 (0.56 to 9.44)Test for heterogeneity: not applicableTest for overall effect: z = 2.21 (p = 0.03)
Total (95% CI) 25 29 100.00 5.00 (0.56 to 9.44)Test for heterogeneity: not applicableTest for overall effect: z = 2.21 (p = 0.03)
–10 –5 0 5 10
Favours treatment Favours control
(95% CI) (%) (95% CI)
FIGURE 72
Comparison: 11 Metformin + diet vs placebo + diet at 12 monthsOutcome: 07 Change in SBP (mmHg)
Study Treatment Control WMD (fixed) Weight WMD (fixed)or sub-category n Mean (SD) n Mean (SD)
01 Weight reductionBIGPRO 1, 1996 164 –0.88 (15.60) 160 –1.88 (14.95) 67.59 1.00 (–2.33 to 4.33)Teupe, 1991 25 –3.00 (12.70) 29 –10.00 (12.70) 16.21 7.00 (0.21 to 13.79)
Subtotal (95% CI) 189 189 83.79 2.16 (–0.83 to 5.15)Test for heterogeneity: Chi2 = 2.42, df = 1 (p = 0.12), I2 = 58.6%Test for overall effect: z = 1.42 (p = 0.16)
02 Weight maintenanceTeupe, 1991 25 –7.00 (12.70) 29 –10.00 (12.70) 16.21 3.00 (–3.79 to 9.79)
Subtotal (95% CI) 25 29 16.21 3.00 (–3.79 to 9.79)Test for heterogeneity: not applicableTest for overall effect: z = 0.87 (p = 0.39)
Total (95% CI) 214 218 100.00 2.30 (–0.44 to 5.03)Test for heterogeneity: Chi2 = 2.47, df = 2 (p = 0.29), I2 = 18.9%Test for overall effect: z = 1.65 (p = 0.10)
–10 –5 0 5 10
Favours treatment Favours control
(95% CI) (%) (95% CI)
FIGURE 73
Comparison: 12 Metformin + diet vs placebo + diet at 24 monthsOutcome: 07 Change in SBP (mmHg)
Study Treatment Control WMD (fixed) Weight WMD (fixed)or sub-category n nMean (SD) Mean (SD)
01 Weight reductionTeupe, 1991 25 –10.00 (12.70) 29 –20.00 (12.70) 100.00 10.00 (3.21 to 16.79)
Subtotal (95% CI) 25 29 100.00 10.00 (3.21 to 16.79)Test for heterogeneity: not applicableTest for overall effect: z = 2.89 (p = 0.004)
Total (95% CI) 25 29 100.00 10.00 (3.21 to 16.79)Test for heterogeneity: not applicableTest for overall effect: z = 2.89 (p = 0.004)
–10 –5 0 5 10
Favours treatment Favours control
(95% CI) (%) (95% CI)
FIGURE 74

Systematic review of RCTs
44
TABLE 4 Effects of metformin and diet versus no treatment and diet on weight and risk factors in people with type 2 diabetes
Weight Total TGs SBP DBP Fasting plasma HbA1c%(kg) cholesterol (mmol/l) (mmHg) (mmHg) glucose
(mmol/l) (mmol/l)
12 months –0.20 –0.33 –0.22 7.00 2.00 –0.50WMD (95% CI) (–3.83 to 3.43) (–0.91 to 0.25) (–0.73 to 0.29) (0.21 to 13.79) (–2.44 to 6.44) (–1.88 to 0.88)No. of studies n = 1 n = 1 n = 1 n = 1 n = 1 n = 1
24 months –0.50 –0.72 –0.18 10.00 5.00 –0.20WMD (95% CI) (–4.02 to 3.02) (–1.30 to –0.14) (–0.69 to 0.33) (3.21 to 16.79) (0.56 to 9.44) (–1.58 to 1.18)No. of studies n = 1 n = 1 n = 1 n = 1 n = 1 n = 1
60 months –0.12 –1.30 –1.08WMD (95% CI) (–1.13 to 0.89) (–1.91 to –0.69) (–1.50 to –0.66)No. of studies n = 1 n = 1 n = 1
120 months –0.37 –0.34 –0.46WMD (95% CI) (–1.67 to 0.93) (–1.10 to 0.42) (–0.98 to 0.06)No. of studies n = 1 n = 1 n = 1
180 months –2.71 –1.51 –2.31WMD (95% CI) (–6.98 to 1.56) (–3.76 to 0.74) (–3.85 to –0.77)No. of studies n = 1 n = 1 n = 1

Health Technology Assessment 2004; Vol. 8: No. 21
45
© Queen’s Printer and Controller of HMSO 2004. All rights reserved.
Comparison: 11 Metformin + diet vs placebo + diet at 12 months Outcome: 09 All-cause mortality
Study Treatment Control OR (fixed) Weight OR (fixed)or sub-category (n/N) (n/N)
BIGPRO 1, 1996 1/227 0/230 100.00 3.05 (0.12 to 75.34)
Total (95% CI) 227 230 100.00 3.05 (0.12 to 75.34)Total events: 1 (Treatment), 0 (Control)Test for heterogeneity: not applicableTest for overall effect: z = 0.68 (p = 0.50)
Favours treatment Favours control
(95% CI) (%) (95% CI)
0.01 0.1 1 10 100
FIGURE 75
Comparison: 11 Metformin + diet vs placebo + diet at 12 monthsOutcome: 10 Diabetes mellitus
Study Treatment Control OR (fixed) Weight OR (fixed)or sub-category
BIGPRO 1, 1996 0/227 5/230 100.00 0.09 (0.00 to 1.64)
Total (95% CI) 227 230 100.00 0.09 (0.00 to 1.64)Total events: 0 (Treatment), 5 (Control)Test for heterogeneity: not applicableTest for overall effect: z = 1.63 (p = 0.10)
Favours treatment Favours control
(n/N) (n/N) (95% CI) (%) (95% CI)
0.01 0.1 1 10 100
FIGURE 76
Comparison: 12 Metformin + diet vs placebo + diet at 24 monthsOutcome: 09 Coronary heart disease events
Study Treatment Control OR (fixed) Weight OR (fixed)or sub-category
Teupe, 1991 1/50 0/50 100.00 3.06 (0.12 to 76.95)
Total (95% CI) 50 50 100.00 3.06 (0.12 to 76.95)Total events: 1 (Treatment), 0 (Control)Test for heterogeneity: not applicableTest for overall effect: z = 0.68 (p = 0.50)
Favours treatment Favours control
(n/N) (n/N) (95% CI) (%) (95% CI)
0.01 0.1 1 10 100
FIGURE 77

Systematic review of RCTs
46
Comparison: 16 Metformin + diet vs no treatment + diet in UKPDS, median follow-up 10 yearsOutcome: 01 All-cause mortality
Study Treatment Control OR (fixed) Weight OR (fixed)or sub-category
UKPDS, 1998 50/342 89/411 100.00 0.62 (0.42 to 0.91)
Total (95% CI) 342 411 100.00 0.62 (0.42 to 0.91)Total events: 50 (Treatment), 89 (Control)Test for heterogeneity: not applicableTest for overall effect: z = 2.46 (p = 0.01)
Favours treatment Favours control
(n/N) (n/N) (95% CI) (%) (95% CI)
0.2 0.5 1 2 5
FIGURE 78
Comparison: 16 Metformin + diet vs no treatment + diet in UKPDS, median follow-up 10 years Outcome: 02 Coronary heart disease mortality
Study Treatment Control OR (fixed) Weight OR (fixed)or sub-category
UKPDS, 1998 16/342 36/411 100.00 0.51 (0.28 to 0.94)
Total (95% CI) 342 411 100.00 0.51 (0.28 to 0.94)Total events: 16 (Treatment), 36 (Control)Test for heterogeneity: not applicableTest for overall effect: z = 2.17 (p = 0.03)
Favours treatment Favours control
(n/N) (n/N) (95% CI) (%) (95% CI)
0.2 0.5 1 2 5
FIGURE 79
Comparison: 16 Metformin + diet vs no treatment + diet in UKPDS, median follow-up 10 yearsOutcome: 03 Cerebrovascular mortality
Study Treatment Control OR (fixed) Weight OR (fixed)or sub-category
UKPDS, 1998 6/342 9/411 100.00 0.80 (0.28 to 2.26)
Total (95% CI) 342 411 100.00 0.80 (0.28 to 2.26)Total events: 6 (Treatment), 9 (Control)Test for heterogeneity: not applicableTest for overall effect: z = 0.42 (p = 0.67)
Favours treatment Favours control
(n/N) (n/N) (95% CI) (%) (95% CI)
0.2 0.5 1 2 5
FIGURE 80

for MI mortality the OR was 0.51 (95% CI 0.28 to0.94). For cerebrovascular mortality the OR was0.80 (95% CI 0.28 to 2.26) and for all-cause cancermortality it was 0.73 (95% CI 0.36 to 1.49).
Effects of acarbose and diet versusplacebo and diet in an obesepopulation with type 2 diabetesDescription of studyOne RCT provided change in weight, HbA1c andfasting plasma glucose at 12 months94–98 foracarbose up to 600 mg/day versus placebo. Thestudy was conducted in an obese population withtype 2 diabetes. Mean body weight was 84.5 kg inthe acarbose group and 81.1 kg in the placebogroup. All participants received the same numberof contact visits. Data for the risk factors, but notweight, were presented as a mean of 6, 9 and 12 months and for subgroups only of participantsreceiving either diet alone, metformin,sulfonylurea or insulin treatment for diabetes.
Review resultsOver 12 months acarbose was associated with aWMD weight change of –0.79 kg (95% CI –1.53 to–0.05 kg) (Figure 82). Over 12 months acarbosewas associated with a WMD change in HbA1c of–0.76% (95% CI –1.05 to –0.47%) and in fastingplasma glucose of –1.36 mmol/l (95% CI –1.96 to–0.75 mmol/l) (Figures 83 and 84). The authorsreported that lipids did not change in participantswho received acarbose, but the data were notprovided.
Acarbose led to significant decreases in the dosesof metformin, sulfonylurea and insulin prescribed.Acarbose was more frequently associated withgastrointestinal adverse effects, classified as mild.Four participants on insulin (one receivingacarbose and three receiving insulin) requiredcorrection of severe hypoglycaemia.
Effects of 600 kcal/day deficit or low-fat diet versus controlDescription of studiesTwelve RCTs, where individuals were individuallyrandomised, provided change in weight at 12 months or longer.99–145 One cluster RCT, withrandomisation according to treating physician,provided change in weight at 12 months.146
Two studies provided change in weight at 18 months,107,130–135 three studies at 24 months,107,128–135 one study at 30 months,107
two studies at 36 months108–114,128,129 and onestudy at 60 months.128,129
Only two studies assessed participants using anITT approach.108–114,122–126 The study bySwinburn128,129 included one worksite, where all six participants were assigned to the activetreatment.
Data were provided for lipids, blood pressure,HbA1c and fasting plasma glucose at 12 months,for fasting plasma glucose at 24, 36 and 60 months,128,129 and for blood pressure at 36 months.108–114
Five studies recruited people withhypertension.99–103,107,127,130–135,146 One studyrecruited people with ‘high normal’ bloodpressure,108–114 one study recruited people withglucose intolerance, which included some peoplewith diabetes,128,129 and one study recruitedpeople with type 2 diabetes.127 Hankey andcolleagues105,106 evaluated the diet in people afterMI, who all received 12 exercise sessions. Botharms of the Trial of Antihypertensive Interventionsand Management (TAIM) study130–135 receivedplacebo antihypertensive medication.
Three studies recruited men only.104,122–126,136–141
Reported mean BMI ranged from 27.9 kg/m2 142–145
Health Technology Assessment 2004; Vol. 8: No. 21
47
© Queen’s Printer and Controller of HMSO 2004. All rights reserved.
Comparison: 16 Metformin + diet vs no treatment + diet in UKPDS, median follow-up 10 years Outcome: 04 All-cause cancer mortality
Study Treatment Control OR (fixed) Weight OR (fixed)or sub-category
UKPDS, 1998 13/342 21/411 100.00 0.73 (0.36 to 1.49)
Total (95% CI) 342 411 100.00 0.73 (0.36 to 1.49)Total events: 13 (Treatment), 21 (Control)Test for heterogeneity: not applicableTest for overall effect: z = 0.86 (p = 0.39)
Favours treatment Favours control
(n/N) (n/N) (95% CI) (%) (95% CI)
0.2 0.5 1 2 5
FIGURE 81
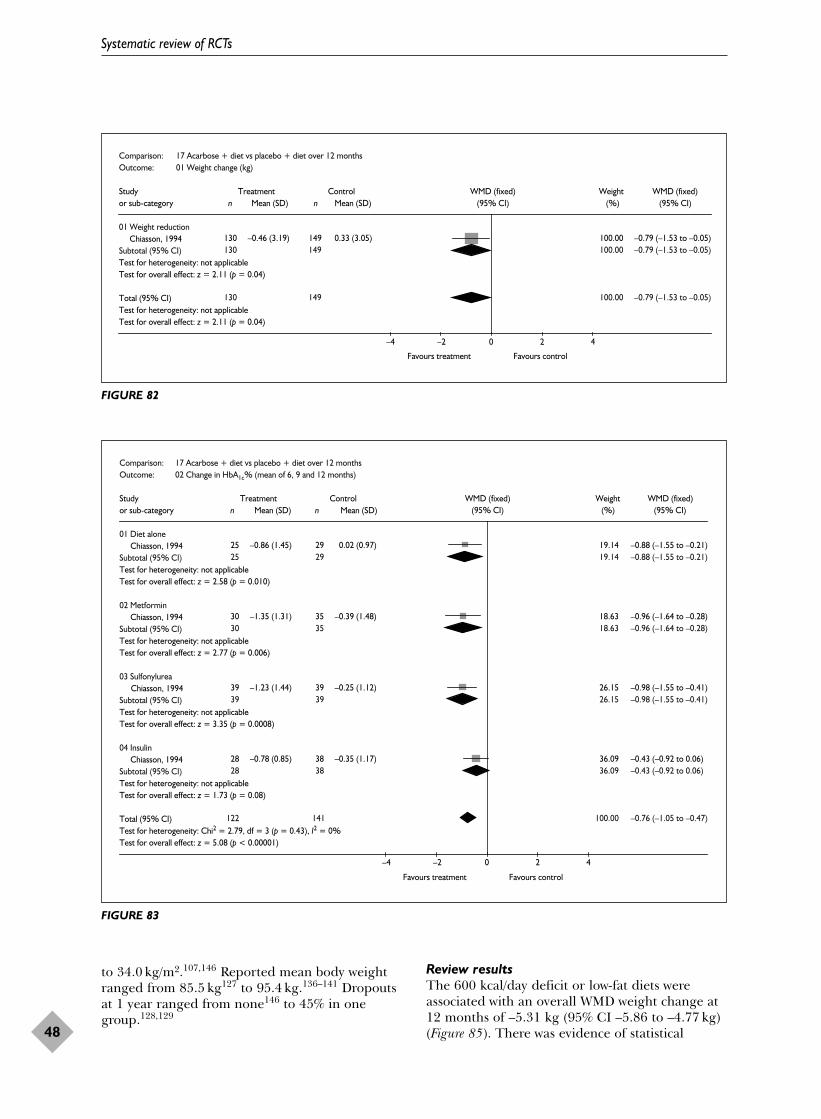
to 34.0 kg/m2.107,146 Reported mean body weightranged from 85.5 kg127 to 95.4 kg.136–141 Dropoutsat 1 year ranged from none146 to 45% in onegroup.128,129
Review resultsThe 600 kcal/day deficit or low-fat diets wereassociated with an overall WMD weight change at12 months of –5.31 kg (95% CI –5.86 to –4.77 kg)(Figure 85). There was evidence of statistical
Systematic review of RCTs
48
Comparison: 17 Acarbose + diet vs placebo + diet over 12 monthsOutcome: 01 Weight change (kg)
Study Treatment Control WMD (fixed) Weight WMD (fixed)or sub-category n nMean (SD) Mean (SD)
01 Weight reductionChiasson, 1994 130 –0.46 (3.19) 149 0.33 (3.05) 100.00 –0.79 (–1.53 to –0.05)
Subtotal (95% CI) 130 149 100.00 –0.79 (–1.53 to –0.05)Test for heterogeneity: not applicableTest for overall effect: z = 2.11 (p = 0.04)
Total (95% CI) 130 149 100.00 –0.79 (–1.53 to –0.05)Test for heterogeneity: not applicableTest for overall effect: z = 2.11 (p = 0.04)
Favours treatment Favours control
(95% CI) (%) (95% CI)
–4 –2 0 2 4
FIGURE 82
Comparison: 17 Acarbose + diet vs placebo + diet over 12 monthsOutcome: 02 Change in HbA1c% (mean of 6, 9 and 12 months)
Study Treatment Control WMD (fixed) Weight WMD (fixed)or sub-category n nMean (SD) Mean (SD)
01 Diet aloneChiasson, 1994 25 –0.86 (1.45) 29 0.02 (0.97) 19.14 –0.88 (–1.55 to –0.21)
Subtotal (95% CI) 25 29 19.14 –0.88 (–1.55 to –0.21)Test for heterogeneity: not applicableTest for overall effect: z = 2.58 (p = 0.010)
02 MetforminChiasson, 1994 30 –1.35 (1.31) 35 –0.39 (1.48) 18.63 –0.96 (–1.64 to –0.28)
Subtotal (95% CI) 30 35 18.63 –0.96 (–1.64 to –0.28)Test for heterogeneity: not applicableTest for overall effect: z = 2.77 (p = 0.006)
03 SulfonylureaChiasson, 1994 39 –1.23 (1.44) 39 –0.25 (1.12) 26.15 –0.98 (–1.55 to –0.41)
Subtotal (95% CI) 39 39 26.15 –0.98 (–1.55 to –0.41)Test for heterogeneity: not applicableTest for overall effect: z = 3.35 (p = 0.0008)
04 InsulinChiasson, 1994 28 –0.78 (0.85) 38 –0.35 (1.17) 36.09 –0.43 (–0.92 to 0.06)
Subtotal (95% CI) 28 38 36.09 –0.43 (–0.92 to 0.06)Test for heterogeneity: not applicableTest for overall effect: z = 1.73 (p = 0.08)
Total (95% CI) 122 141 100.00 –0.76 (–1.05 to –0.47)Test for heterogeneity: Chi2 = 2.79, df = 3 (p = 0.43), I2 = 0%Test for overall effect: z = 5.08 (p < 0.00001)
Favours treatment Favours control
(95% CI) (%) (95% CI)
–4 –2 0 2 4
FIGURE 83

Health Technology Assessment 2004; Vol. 8: No. 21
49
© Queen’s Printer and Controller of HMSO 2004. All rights reserved.
Comparison: 17 Acarbose + diet vs placebo + diet over 12 months Outcome: 03 Change in fasting plasma glucose (mmol/l)
Study Treatment Control WMD (fixed) Weight WMD (fixed)or sub-category n nMean (SD) Mean (SD)
01 Diet aloneChiasson, 1994 25 –0.70 (2.00) 29 1.40 (2.15) 29.87 –2.10 (–3.21 to –0.99)
Subtotal (95% CI) 25 29 29.87 –2.10 (–3.21 to –0.99)Test for heterogeneity: not applicableTest for overall effect: z = 3.72 (p = 0.0002)
02 MetforminChiasson, 1994 30 –1.50 (2.74) 35 0.00 (4.14) 12.89 –1.50 (–3.19 to 0.19)
Subtotal (95% CI) 30 35 12.89 –1.50 (–3.19 to 0.19)Test for heterogeneity: not applicableTest for overall effect: z = 1.74 (p = 0.08)
03 SulfonylureaChiasson, 1994 39 0.20 (1.87) 39 1.60 (2.50) 38.17 –1.40 (–2.38 to –0.42)
Subtotal (95% CI) 39 39 38.17 –1.40 (–2.38 to –0.42)Test for heterogeneity: not applicableTest for overall effect: z = 2.80 (p = 0.005)
04 InsulinChiasson, 1994 28 0.10 (2.65) 38 0.10 (3.08) 19.06 0.00 (–1.39 to 1.39)
Subtotal (95% CI) 28 38 19.06 0.00 (–1.39 to 1.39)Test for heterogeneity: not applicableTest for overall effect: z = 0.00 (p = 1.00)
Total (95% CI) 122 141 100.00 –1.36 (–1.96 to –0.75)Test for heterogeneity: Chi2 = 5.44, df = 3 (p = 0.14), I2 = 44.9%Test for overall effect: z = 4.39 (p < 0.0001)
Favours treatment Favours control
–4 –2 0 2 4
(95% CI) (%) (95% CI)
FIGURE 84
Comparison: 18 600 kcal/day deficit or low fat vs control at 12 monthsOutcome: 01 Weight change (kg)
Study Treatment Control WMD (fixed) Weight WMD (fixed)or sub-category n nMean (SD) Mean (SD)
01 01DISH, 1985 67 –4.00 (5.00) 77 –0.46 (3.60) 14.10 –3.54 (–4.98 to –2.10)Frey-Hewitt, 1990 36 –6.68 (3.94) 41 0.38 (3.66) 10.07 –7.06 (–8.77 to –5.35)Hankey, 2002 25 –0.60 (5.30) 25 2.40 (5.00) 3.60 –3.00 (–5.86 to –0.14)HOT, 1999 51 –1.70 (6.40) 51 –1.30 (6.28) 4.84 –0.40 (–2.86 to 2.06)ODES, 1995 52 –4.00 (5.05) 43 1.10 (2.62) 11.75 –5.10 (–6.68 to –3.52)Pritchard, 1997 18 –6.40 (3.30) 19 0.30 (2.40) 8.41 –6.70 (–8.57 to –4.83)Pritchard, 1999a 88 –5.10 (7.36) 90 0.60 (6.08) 7.44 –5.70 (–7.69 to –3.71)Pritchard, 1999b 92 –6.20 (7.67) 90 0.60 (6.08) 7.27 –6.80 (–8.81 to –4.79)Swinburn, 2001 66 –3.32 (5.52) 70 0.59 (12.16) 2.97 –3.91 (–7.05 to –0.77)TAIM, 1992 57 –3.70 (6.79) 61 –0.50 (3.12) 7.88 –3.20 (–5.13 to –1.27)Wood, 1988 42 –7.20 (3.70) 42 0.60 (3.70) 11.71 –7.80 (–9.38 to –6.22)Wood, 1991a 31 –4.10 (5.50) 39 1.30 (5.20) 4.57 –5.40 (–7.93 to –2.87)Wood, 1991b 40 –5.10 (5.80) 40 1.70 (4.80) 5.39 –6.80 (–9.13 to –4.47)
Subtotal (95% CI) 665 688 100.00 –5.31 (–5.86 to –4.77)Test for heterogeneity: Chi2 = 48.53, df = 12 (p < 0.00001), I2 = 75.3%Test for overall effect: z = 19.23 (p < 0.00001)
Total (95% CI) 665 688 100.00 –5.31 (–5.86 to –4.77)Test for heterogeneity: Chi2 = 48.53, df = 12 (p < 0.00001), I2 = 75.3%Test for overall effect: z = 19.23 (p < 0.00001)
–10 –5 0 5 10
Favours treatment Favours control
(95% CI) (%) (95% CI)
FIGURE 85

heterogeneity, although the direction of effect wasconsistent across all studies. When 12-monthweight changes from studies with imputed valueswere compared with studies with no assumedvalues, the weight changes were –4.52 kg (95% CI–5.67 to –3.36 kg) compared with –5.55 kg (95%CI –6.17 to –4.94 kg). When 12-month weight lossfrom RCTs with participants with cardiovascularrisk factors was compared with RCTs withparticipants with no reported risk factors, a clearer difference between studies emerged (–4.19 kg, 95% CI –4.90 to –3.48 kg; comparedwith –6.98 kg, 95% CI –7.83 to –6.12 kg,respectively).
At 18 months weight change was –1.15 kg (95% CI –2.76 to 0.45 kg), 24 months –2.35 kg (–3.56 to–1.15 kg), 30 months 0.70 kg (95% CI –1.78 to3.18 kg), 36 months –3.55 kg (95% CI –4.54 to
–2.55 kg) and at 60 months –0.20 kg (95% CI–2.03 to 1.63 kg) (Figures 86–90). After 12 monthsonly a maximum of three studies provided datatowards any one comparison.
At 12 months DBP and SBP, lipids and fastingplasma glucose were all significantly improvedcompared with the control group (Figures 91–102).However, the limited data after 12 months nolonger show statistically significant risk factorchanges. Results for changes in risk factors forpeople with hypertension and diabetes arepresented in Tables 5 and 6.
In the cluster RCT146 the weight change at 12 months was –0.88 kg (SD 4.0 kg) for the dietgroup and 1.3 kg (SD 3.0 kg) for the controlgroup, which was not found to be a statisticallysignificant difference.
Systematic review of RCTs
50
Comparison: 19 600 kcal/day deficit or low fat vs control at 18 monthsOutcome: 01 Weight change (kg)
Study Treatment Control WMD (fixed) Weight WMD (fixed)or sub-category n nMean (SD) Mean (SD)
01 01HOT, 1999 51 –1.80 (6.42) 51 –1.40 (6.31) 42.19 –0.40 (–2.87 to 2.07)TAIM, 1992 57 –2.70 (7.55) 61 –1.00 (3.12) 57.81 –1.70 (–3.81 to 0.41)
Subtotal (95% CI) 108 112 100.00 –1.15 (–2.76 to 0.45)Test for heterogeneity: Chi2 = 0.61, df = 1 (p = 0.43), I2 = 0%Test for overall effect: z = 1.41 (p = 0.16)
Total (95% CI) 108 112 100.00 –1.15 (–2.76 to 0.45)Test for heterogeneity: Chi2 = 0.61, df = 1 (p = 0.43), I2 = 0%Test for overall effect: z = 1.41 (p = 0.16)
–10 –5 0 5 10
Favours treatment Favours control
(95% CI) (%) (95% CI)
FIGURE 86
Comparison: 20 600 kcal/day deficit or low fat vs control at 24 monthsOutcome: 01 Weight change (kg)
Study Treatment Control WMD (fixed) Weight WMD (fixed)or sub-category n nMean (SD) Mean (SD)
01 01HOT, 1999 51 –1.70 (6.40) 51 –1.90 (6.45) 23.43 0.20 (–2.29 to 2.69)Swinburn, 2001 47 –3.15 (5.35) 57 1.06 (3.47) 46.24 –4.21 (–5.99 to –2.43)TAIM, 1992 57 –1.90 (7.55) 61 –0.40 (3.91) 30.33 –1.50 (–3.69 to 0.69)
Subtotal (95% CI) 155 169 100.00 –2.35 (–3.56 to –1.15)Test for heterogeneity: Chi2 = 8.81, df = 2 (p = 0.01), I2 = 77.3%Test for overall effect: z = 3.82 (p = 0.0001)
Total (95% CI) 155 169 100.00 –2.35 (–3.56 to –1.15)Test for heterogeneity: Chi2 = 8.81, df = 2 (p = 0.01), I2 = 77.3%Test for overall effect: z = 3.82 (p = 0.0001)
–10 –5 0 5 10
Favours treatment Favours control
(95% CI) (%) (95% CI)
FIGURE 87

Health Technology Assessment 2004; Vol. 8: No. 21
51
© Queen’s Printer and Controller of HMSO 2004. All rights reserved.
Comparison: 21 600 kcal/day deficit or low fat vs control at 30 monthsOutcome: 01 Weight change (kg)
Study Treatment Control WMD (fixed) Weight WMD (fixed)or sub-category n nMean (SD) Mean (SD)
01 01HOT, 1999 51 –1.30 (6.28) 51 –2.00 (6.48) 100.00 0.70 (–1.78 to 3.18)
Subtotal (95% CI) 51 51 100.00 0.70 (–1.78 to 3.18)Test for heterogeneity: not applicableTest for overall effect: z = 0.55 (p = 0.58)
Total (95% CI) 51 51 100.00 0.70 (–1.78 to 3.18)Test for heterogeneity: not applicableTest for overall effect: z = 0.55 (p = 0.58)
–10 –5 0 5 10
Favours treatment Favours control
(95% CI) (%) (95% CI)
FIGURE 88
Comparison: 22 600 kcal/day deficit or low fat vs control at 36 monthsOutcome: 01 Weight change (kg)
Study Treatment Control WMD (fixed) Weight WMD (fixed)or sub-category n nMean (SD) Mean (SD)
01 01HPT, 1990 117 –1.63 (4.43) 113 1.86 (4.36) 76.57 –3.49 (–4.63 to –2.35)Swinburn, 2001 48 –1.60 (5.40) 51 2.13 (5.00) 23.43 –3.73 (–5.78 to –1.68)
Subtotal (95% CI) 165 164 100.00 –3.55 (–4.54 to –2.55)Test for heterogeneity: Chi2 = 0.04, df = 1 (p = 0.84), I2 = 0%Test for overall effect: z = 6.99 (p < 0.00001)
Total (95% CI) 165 164 100.00 –3.55 (–4.54 to –2.55)Test for heterogeneity: Chi2 = 0.04, df = 1 (p = 0.84), I2 = 0%Test for overall effect: z = 6.99 (p < 0.00001)
–10 –5 0 5 10
Favours treatment Favours control
(95% CI) (%) (95% CI)
FIGURE 89
Comparison: 23 600 kcal/day deficit or low fat vs control at 60 monthsOutcome: 01 Weight change (kg)
Study Treatment Control WMD (fixed) Weight WMD (fixed)or sub-category n nMean (SD) Mean (SD)
01 01Swinburn, 2001 51 1.06 (4.57) 52 1.26 (4.90) 100.00 –0.20 (–2.03 to 1.63)
Subtotal (95% CI) 51 52 100.00 –0.20 (–2.03 to 1.63)Test for heterogeneity: not applicableTest for overall effect: z = 0.21 (p = 0.83)
Total (95% CI) 51 52 100.00 –0.20 (–2.03 to 1.63)Test for heterogeneity: not applicableTest for overall effect: z = 0.21 (p = 0.83)
–10 –5 0 5 10
Favours treatment Favours control
(95% CI) (%) (95% CI)
FIGURE 90
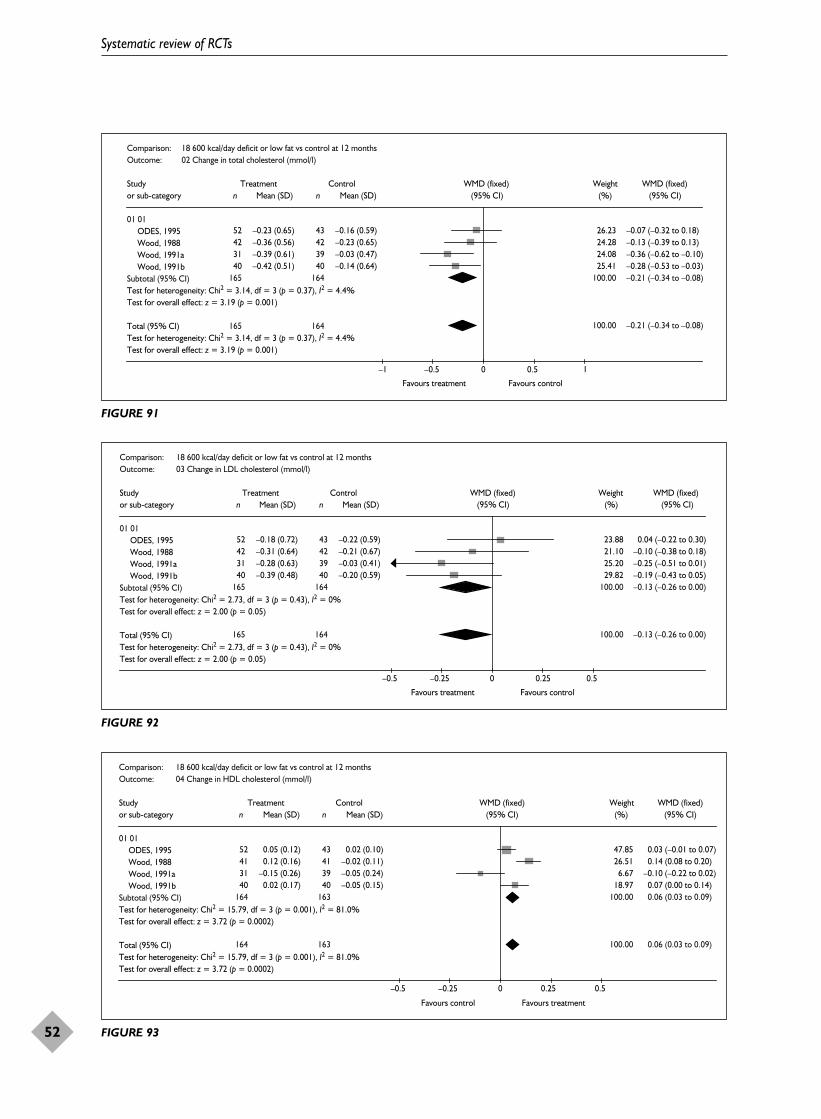
Systematic review of RCTs
52
Comparison: 18 600 kcal/day deficit or low fat vs control at 12 monthsOutcome: 02 Change in total cholesterol (mmol/l)
Study Treatment Control WMD (fixed) Weight WMD (fixed)or sub-category n nMean (SD) Mean (SD)
01 01ODES, 1995 52 –0.23 (0.65) 43 –0.16 (0.59) 26.23 –0.07 (–0.32 to 0.18)Wood, 1988 42 –0.36 (0.56) 42 –0.23 (0.65) 24.28 –0.13 (–0.39 to 0.13)Wood, 1991a 31 –0.39 (0.61) 39 –0.03 (0.47) 24.08 –0.36 (–0.62 to –0.10)Wood, 1991b 40 –0.42 (0.51) 40 –0.14 (0.64) 25.41 –0.28 (–0.53 to –0.03)
Subtotal (95% CI) 165 164
165 164
100.00 –0.21 (–0.34 to –0.08)Test for heterogeneity: Chi2 = 3.14, df = 3 (p = 0.37), I2 = 4.4%Test for overall effect: z = 3.19 (p = 0.001)
Total (95% CI) 100.00 –0.21 (–0.34 to –0.08)Test for heterogeneity: Chi2 = 3.14, df = 3 (p = 0.37), I2 = 4.4%Test for overall effect: z = 3.19 (p = 0.001)
Favours treatment Favours control
(95% CI) (%) (95% CI)
–1 –0.5 0 0.5 1
FIGURE 91
Comparison: 18 600 kcal/day deficit or low fat vs control at 12 months Outcome: 03 Change in LDL cholesterol (mmol/l)
Study Treatment Control WMD (fixed) Weight WMD (fixed)or sub-category n nMean (SD) Mean (SD)
01 01ODES, 1995 52 –0.18 (0.72) 43 –0.22 (0.59) 23.88 0.04 (–0.22 to 0.30)Wood, 1988 42 –0.31 (0.64) 42 –0.21 (0.67) 21.10 –0.10 (–0.38 to 0.18)Wood, 1991a 31 –0.28 (0.63) 39 –0.03 (0.41) 25.20 –0.25 (–0.51 to 0.01)Wood, 1991b 40 –0.39 (0.48) 40 –0.20 (0.59) 29.82 –0.19 (–0.43 to 0.05)
Subtotal (95% CI) 165 164 100.00 –0.13 (–0.26 to 0.00)Test for heterogeneity: Chi2 = 2.73, df = 3 (p = 0.43), I2 = 0%Test for overall effect: z = 2.00 (p = 0.05)
Total (95% CI) 165 164 100.00 –0.13 (–0.26 to 0.00)Test for heterogeneity: Chi2 = 2.73, df = 3 (p = 0.43), I2 = 0%Test for overall effect: z = 2.00 (p = 0.05)
Favours treatment Favours control
(95% CI) (%) (95% CI)
–0.5 –0.25 0 0.25 0.5
FIGURE 92
Comparison: 18 600 kcal/day deficit or low fat vs control at 12 monthsOutcome: 04 Change in HDL cholesterol (mmol/l)
Study Treatment Control WMD (fixed) Weight WMD (fixed)or sub-category n nMean (SD) Mean (SD)
01 01ODES, 1995 52 0.05 (0.12) 43 0.02 (0.10) 47.85 0.03 (–0.01 to 0.07)Wood, 1988 41 0.12 (0.16) 41 –0.02 (0.11) 26.51 0.14 (0.08 to 0.20)Wood, 1991a 31 –0.15 (0.26) 39 –0.05 (0.24) 6.67 –0.10 (–0.22 to 0.02)Wood, 1991b 40 0.02 (0.17) 40 –0.05 (0.15) 18.97 0.07 (0.00 to 0.14)
Subtotal (95% CI) 164 163 100.00 0.06 (0.03 to 0.09)Test for heterogeneity: Chi2 = 15.79, df = 3 (p = 0.001), I2 = 81.0%Test for overall effect: z = 3.72 (p = 0.0002)
Total (95% CI) 164 163 100.00 0.06 (0.03 to 0.09)Test for heterogeneity: Chi2 = 15.79, df = 3 (p = 0.001), I2 = 81.0%Test for overall effect: z = 3.72 (p = 0.0002)
Favours control Favours treatment
(95% CI) (%) (95% CI)
–0.5 –0.25 0 0.25 0.5
FIGURE 93

Health Technology Assessment 2004; Vol. 8: No. 21
53
© Queen’s Printer and Controller of HMSO 2004. All rights reserved.
Comparison: 18 600 kcal/day deficit or low fat vs control at 12 months Outcome: 05 Change in triglycerides (mmol/l)
Study Treatment Control WMD (fixed) Weight WMD (fixed)or sub-category n nMean (SD) Mean (SD)
01 01ODES, 1995 52 –0.23 (1.01) 43 0.17 (0.92) 10.04 –0.40 (–0.79 to 0.01)Wood, 1988 42 –0.27 (0.72) 42 0.08 (0.60) 18.86 –0.35 (–0.63 to –0.07)Wood, 1991a 31 0.09 (0.36) 39 0.13 (0.37) 51.30 –0.04 (–0.21 to 0.13)Wood, 1991b 40 –0.12 (0.59) 40 0.18 (0.67) 19.80 –0.30 (–0.58 to –0.02)
Subtotal (95% CI) 165 164 100.00 –0.19 (–0.31 to –0.06)Test for heterogeneity: Chi2 = 5.88, df = 3 (p = 0.12), I2 = 48.9%Test for overall effect: z = 2.96 (p = 0.003)
Total (95% CI) 165 164 100.00 –0.19 (–0.31 to –0.06)Test for heterogeneity: Chi2 = 5.88, df = 3 (p = 0.12), I2 = 48.9%Test for overall effect: z = 2.96 (p = 0.003)
Favours treatment Favours control
–1 –0.5 0 0.5 1
(95% CI) (%) (95% CI)
FIGURE 94
Comparison: 18 600 kcal/day deficit or low fat vs control at 12 monthsOutcome: 07 Change in DBP (mmHg)
Study Treatment Control WMD (fixed) Weight WMD (fixed)or sub-category n nMean (SD) Mean (SD)
01 01ODES, 1995 52 –3.40 (7.21) 43 –0.70 (8.52) 19.56 –2.70 (–5.91 to 0.51)Wood, 1988 38 –5.60 (7.30) 35 –2.60 (8.10) 16.04 –3.00 (–6.55 to 0.55)Wood, 1991a 31 –2.20 (5.10) 39 0.90 (5.30) 33.72 –3.10 (–5.55 to –0.65)Wood, 1991b 40 –2.40 (6.60) 40 2.10 (5.00) 30.68 –4.50 (–7.07 to –1.93)
Subtotal (95% CI) 161 157 100.00 –3.44 (–4.86 to –2.01)Test for heterogeneity: Chi2 = 0.99, df = 3 (p = 0.80), I2 = 0%Test for overall effect: z = 4.74 (p < 0.00001)
Total (95% CI) 161 157 100.00 –3.44 (–4.86 to –2.01)Test for heterogeneity: Chi2 = 0.99, df = 3 (p = 0.80), I2 = 0%Test for overall effect: z = 4.74 (p < 0.00001)
–10 –5 0 5 10
Favours treatment Favours control
(95% CI) (%) (95% CI)
FIGURE 95
Comparison: 22 600 kcal/day deficit or low fat vs control at 36 monthsOutcome: 03 Change in DBP (mmHg)
Study Treatment Control WMD (fixed) Weight WMD (fixed)or sub-category n nMean (SD) Mean (SD)
01 01HPT, 1990 117 –4.20 (8.65) 115 –2.40 (8.58) 100.00 –1.80 (–4.02 to 0.42)
Subtotal (95% CI) 117 115 100.00 –1.80 (–4.02 to 0.42)Test for heterogeneity: not applicableTest for overall effect: z = 1.59 (p = 0.11)
Total (95% CI) 117 115 100.00 –1.80 (–4.02 to 0.42)Test for heterogeneity: not applicableTest for overall effect: z = 1.59 (p = 0.11)
–10 –5 0 5 10
Favours treatment Favours control
(95% CI) (%) (95% CI)
FIGURE 96

Systematic review of RCTs
54
Comparison: 18 600 kcal/day deficit or low fat vs control at 12 monthsOutcome: 06 Change in SBP (mmHg)
Study Treatment Control WMD (fixed) Weight WMD (fixed)or sub-category n nMean (SD) Mean (SD)
01 01ODES, 1995 52 –6.40 (10.10) 43 –0.50 (11.15) 16.44 –5.90 (–10.22 to –1.58)Wood, 1988 38 –5.70 (7.90) 35 –4.10 (8.00) 22.99 –1.60 (–5.25 to 2.05)Wood, 1991a 31 –4.10 (6.00) 39 –0.20 (6.60) 35.02 –3.90 (–6.86 to –0.94)Wood, 1991b 40 –4.10 (8.10) 40 0.10 (7.70) 25.55 –4.20 (–7.66 to –0.74)
Subtotal (95% CI) 161 157 100.00 –3.78 (–5.53 to –2.03)Test for heterogeneity: Chi2 = 2.36, df = 3 (p = 0.50), I2 = 0%Test for overall effect: z = 4.23 (p < 0.0001)
Total (95% CI) 161 157 100.00 –3.78 (–5.53 to –2.03)Test for heterogeneity: Chi2 = 2.36, df = 3 (p = 0.50), I2 = 0%Test for overall effect: z = 4.23 (p < 0.0001)
–10 –5 0 5 10
Favours treatment Favours control
(95% CI) (%) (95% CI)
FIGURE 97
Comparison: 22 600 kcal/day deficit or low fat vs control at 36 monthsOutcome: 02 Change in SBP (mmHg)
Study Treatment Control WMD (fixed) Weight WMD (fixed)or sub-category n nMean (SD) Mean (SD)
01 01HPT, 1990 117 –5.00 (9.73) 115 –2.69 (9.65) 100.00 –2.31 (–4.80 to 0.18)
Subtotal (95% CI) 117 115 100.00 –2.31 (–4.80 to 0.18)Test for heterogeneity: not applicableTest for overall effect: z = 1.82 (p = 0.07)
Total (95% CI) 117 115 100.00 –2.31 (–4.80 to 0.18)Test for heterogeneity: not applicableTest for overall effect: z = 1.82 (p = 0.07)
–10 –5 0 5 10
Favours treatment Favours control
(95% CI) (%) (95% CI)
FIGURE 98
Comparison: 18 600 kcal/day deficit or low fat vs control at 12 months Outcome: 08 Change in fasting plasma glucose (mmol/l)
Study Treatment Control WMD (fixed) Weight WMD (fixed)or sub-category n nMean (SD) Mean (SD)
01 01ODES, 1995 52 –0.21 (0.50) 43 0.07 (0.46) 81.40 –0.28 (–0.47 to –0.09)Swinburn, 2001 66 0.08 (1.30) 70 0.17 (1.09) 18.60 –0.09 (–0.49 to 0.31)
Subtotal (95% CI) 118 113 100.00 –0.24 (–0.42 to –0.07)Test for heterogeneity: Chi2 = 0.69, df = 1 (p = 0.41), I2 = 0%Test for overall effect: z = 2.75 (p = 0.006)
Total (95% CI) 118 113 100.00 –0.24 (–0.42 to –0.07)Test for heterogeneity: Chi2 = 0.69, df = 1 (p = 0.41), I2 = 0%Test for overall effect: z = 2.75 (p = 0.006)
Favours treatment Favours control
(95% CI) (%) (95% CI)
–1 –0.5 0 0.5 1
FIGURE 99

Health Technology Assessment 2004; Vol. 8: No. 21
55
© Queen’s Printer and Controller of HMSO 2004. All rights reserved.
Comparison: 20 600 kcal/day deficit or low fat vs control at 24 monthsOutcome: 02 Change in fasting plasma glucose (mmol/l)
Study Treatment Control WMD (fixed) Weight WMD (fixed)or sub-category n nMean (SD) Mean (SD)
01 01Swinburn, 2001 47 –0.17 (1.78) 57 0.05 (1.81) 100.00 –0.22 (–0.91 to 0.47)
Subtotal (95% CI) 47 57 100.00 –0.22 (–0.91 to 0.47)Test for heterogeneity: not applicableTest for overall effect: z = 0.62 (p = 0.53)
Total (95% CI) 47 57 100.00 –0.22 (–0.91 to 0.47)Test for heterogeneity: not applicableTest for overall effect: z = 0.62 (p = 0.53)
Favours treatment Favours control
(95% CI) (%) (95% CI)
–1 –0.5 0 0.5 1
FIGURE 100
Comparison: 22 600 kcal/day deficit or low fat vs control at 36 monthsOutcome: 04 Change in fasting plasma glucose (mmol/l)
Study Treatment Control WMD (fixed) Weight WMD (fixed)or sub-category n nMean (SD) Mean (SD)
01 01Swinburn, 2001 48 –0.04 (1.25) 51 0.09 (1.57) 100.00 –0.13 (–0.69 to 0.43)
Subtotal (95% CI) 48 51 100.00 –0.13 (–0.69 to 0.43)Test for heterogeneity: not applicableTest for overall effect: z = 0.46 (p = 0.65)
Total (95% CI) 48 51 100.00 –0.13 (–0.69 to 0.43)Test for heterogeneity: not applicableTest for overall effect: z = 0.46 (p = 0.65)
Favours treatment Favours control
(95% CI) (%) (95% CI)
–1 –0.5 0 0.5 1
FIGURE 101
Comparison: 23 600 kcal/day deficit or low fat vs control at 60 monthsOutcome: 02 Change in fasting plasma glucose (mmol/l)
Study Treatment Control WMD (fixed) Weight WMD (fixed)or sub-category n nMean (SD) Mean (SD)
01 01Swinburn, 2001 51 0.02 (1.29) 52 0.29 (2.16) 100.00 –0.27 (–0.96 to 0.42)
Subtotal (95% CI) 51 52 100.00 –0.27 (–0.96 to 0.42)Test for heterogeneity: not applicableTest for overall effect: z = 0.77 (p = 0.44)
Total (95% CI) 51 52 100.00 –0.27 (–0.96 to 0.42)Test for heterogeneity: not applicableTest for overall effect: z = 0.77 (p = 0.44)
Favours treatment Favours control
(95% CI) (%) (95% CI)
–1 –0.5 0 0.5 1
FIGURE 102

The two studies that were associated with the least mean difference in weight change also hadpopulations with the largest mean BMI of34.0 kg/m2.107,146
One death occurred in the control arm of theHypertension Prevention Trial (HPT) study108–114
and two deaths in the intervention arm of theTAIM Phase I study.130–135 Two deaths in theintervention group and one in the control groupoccurred in the study by Hankey andcolleagues,105,106 three deaths in the HypertensionOptimal Treatment (HOT) study107 and fourdeaths in the first year of the study by Swinburnand colleagues (group allocation not known).128,129
One diagnosis of cancer occurred in year 2 of thestudy by Wood and colleagues,136–141 and twocancers and one cardiac event in the Oslo Diet andExercise Study (ODES) (allocation unknown).115–121
Swinburn and colleagues128,129 found that 47% ofparticipants developed diabetes or impairedglucose tolerance, compared with 67% in thecontrol group. After 1 year the investigators forthe Dietary Intervention Study of Hypertension(DISH)99–103 reported that 59.5% of participantsallocated to diet remained off medications,compared with 35.3% of controls (reported
p = 0.0015). The investigators for the HOTstudy107 also reported that people in the dietintervention arm required fewer medicationsbetween 1 year and 30 months, a difference thatwas consistently statistically significant. In theHPT108–114 9% of intervention and control groupsrequired drug treatment for hypertension duringthe 3 years of the study.
One study reported no effect of diet counsellingby doctor and dietitian or dietitian alone onsubsequent use of medication.127 The same studyreported that the cost of an extra kilogram weightloss was Aus$9.76 for the doctor/dietitian groupand Aus$7.30 for the dietitian group.
Effects of low-calorie diet versuscontrolDescription of studyOne RCT provided change in weight at 12 months, 24 months and 36 months for an LCDversus control.147 This was a feasibility study toexamine the effect of an LCD as an adjunct totreatment for postmenopausal breast cancer. Datawere not provided for any changes in risk factors.
The study took place in three hospitals in TheNetherlands and two hospitals caring for cancer
Systematic review of RCTs
56
TABLE 5 Effects of 600 kcal/day deficit or low-fat diet versus control on weight and risk factors in obese populations withhypertension
12 months 18 months 24 months 30 months 36 months
Weight (kg) –4.07 –1.15 –0.76 0.70 –3.49WMD (95% CI) (–4.91 to –3.23) (–2.76 to 0.45) (–2.41 to 0.89) (–1.78 to 3.18) (–4.63 to –2.35)No. of studies n = 4 n = 2 n = 2 n = 1 n = 1
SBP –2.31WMD (95% CI) (–4.80 to 0.18)No. of studies n = 1
DBP –1.80WMD (95% CI) (–4.02 to 0.42)No. of studies n = 1
TABLE 6 Effects of 600 kcal/day deficit or low-fat diet versus control on weight and risk factors in obese populations with type 2diabetes
12 months 24 months 36 months 60 months
Weight (kg) –5.85 –4.21 –3.73 –0.20WMD (95% CI) (7.14 to –4.56) (–5.99 to –2.43) (–5.78 to –1.68) (–2.03 to 1.63)No. of studies n = 2 n = 1 n = 1 n = 1
Fasting plasma glucose (mmol/l) –0.09 –0.22 –0.13 –0.27WMD (95% CI) (–0.49 to 0.31) (–0.91 to 0.47) (–0.69 to 0.43) (–0.96 to 0.42)No. of studies n = 1 n = 1 n = 1 n = 1

patients in Poland. The trial lasted for 1 year inPoland and 3 years in The Netherlands. MeanBMI ranged from 29.3 kg/m2 in participants fromThe Netherlands, who received active treatment,to 32.2 kg/m2 in control participants in Poland.
The study participants were obese postmenopausalwomen who had undergone primary treatment forbreast cancer with no signs of distant metastases.Weight data were provided separately for countries.
Review resultsCompared with the control group, the LCD wasassociated with a WMD weight change at 12 months of –6.25 kg (95% CI –9.05 to –3.45 kg),at 24 months of –7.00 kg (95% CI –10.99 to–3.01 kg) and at 36 months of –6.10 kg (95% CI–10.71 to –1.49 kg) (Figures 103–105). However,the study was small, reflected in the wideconfidence intervals.
Three breast cancers occurred in the interventiongroup and one in the control group. Three peopledied from breast cancer in the intervention groupand five people in the control group. There weretwo deaths from other causes in each of the twogroups.
Effects of very low-calorie diet versuscontrol in an obese population withasthmaDescription of studyOne RCT provided change in weight at 12 monthsin an obese population with asthma.148 The study,with 38 participants, used an ITT analysis andthere were no dropouts at 12 months. Data werenot provided for any risk factor changes, but wereprovided for outcomes related to asthma. TheVLCD group had an initial 14-week weightreduction programme that included 8 weeks of420 kcal/day. Two participants in the VLCD groupfound the meal replacements (Nutrilett)intolerable and followed a low-energy diet instead.
Mean baseline BMI was 35.8 kg/m2 in the VLCDgroup and 36.7 kg/m2 in the control group. Allparticipants received a 2–3-week pretreatmentphase for tests to fulfil inclusion criteria and 2 weeks of baseline measurements. All participantshad the same number of visits and all receivededucation about asthma and allergy.
Review resultsAt 12 months VLCD compared with control wasassociated with a WMD weight change of–13.40 kg (95% CI –18.43 to –8.37 kg) (Figure106). After 1 year the difference in forced
expiratory volume in 1 second between VLCD andcontrol groups was 7.6% (95% CI 1.5 to 13.8%),forced vital capacity 7.6% (95% CI 3.5 to 11.8%)and peak expiratory flow 6.2% (95% CI –1.4 to13.7%). The small size of the study, 38 participants,is reflected in the wide confidence intervals.
During the year of follow-up 18 out of 19participants in the control group and 16 out of 19participants in the VLCD group had at least oneexacerbation of asthma. The median number ofexacerbations was 1 (range 0–7) in the controlgroup and 1 (range 0–4) in the VLCD group(reported p = 0.001). Overall reduction in rescuemedication was 0.5 doses in the VLCD group andzero doses in the control group. Thirteen out of19 participants in the control group needed acourse of oral steroids during the year and ten outof 19 participants in the VLCD group.
Effects of low-calorie diet versus600 kcal/day deficit or low-fat dietDescription of studyOne study assessed the effects of an LCD comparedwith a low-fat diet in women at 12 months.149
Change in weight was assessed in participants whoprovided complete data. Numbers of participantsallocated to each group were not reported.Dropout rate was 39% overall at 12 months. Meanbody weight at baseline was 80 kg. Activetreatment was for 26 weeks and participants ineach group had the same number ofappointments. All participants received identicalbehaviour therapy and exercise and only differedwith regard to dietary advice.
Review resultsAt 12 months an LCD compared with a low-fatdiet was associated with a WMD weight change of1.63 kg (95% CI –1.26 to 4.52 kg) (Figure 107).
Effects of very low-calorie diet versus600 kcal/day deficit or low-fat diet in apopulation with type 2 diabetesDescription of studyOne RCT comparing a VLCD to a low-fat dietprovided change in weight at 24 months in apopulation with type 2 diabetes.150 The study had only 16 participants and no dropouts at 24 months.
Overall mean initial BMI was 32 kg/m2. Allparticipants received a 6-week pretreatment phasewhere they were advised to consume an ad libitumdiet and from month 4 to month 24 receivedindividually tailored diets to provide a dailyenergy balance of zero.
Health Technology Assessment 2004; Vol. 8: No. 21
57
© Queen’s Printer and Controller of HMSO 2004. All rights reserved.

Systematic review of RCTs
58
Comparison: 26 LCD vs control at 36 monthsOutcome: 01 Weight change (kg)
Study Treatment Control WMD (fixed) Weight WMD (fixed)or sub-category n nMean (SD) Mean (SD)
01 01de Waard, 1993a 18 –5.00 (7.30) 15 1.10 (6.20) 100.00 –6.10 (–10.71 to –1.49)
Subtotal (95% CI) 18 15 100.00 –6.10 (–10.71 to –1.49)Test for heterogeneity: not applicableTest for overall effect: z = 2.60 (p = 0.009)
Total (95% CI) 18 15 100.00 –6.10 (–10.71 to –1.49)Test for heterogeneity: not applicableTest for overall effect: z = 2.60 (p = 0.009)
–10 –5 0 5 10
Favours treatment Favours control
(95% CI) (%) (95% CI)
FIGURE 105
Comparison: 24 LCD vs control at 12 monthsOutcome: 01 Weight change (kg)
Study Treatment Control WMD (fixed) Weight WMD (fixed)or sub-category n nMean (SD) Mean (SD)
01 01de Waard, 1993a 28 –5.50 (7.50) 24 1.50 (6.30) 55.78 –7.00 (–10.75 to –3.25)de Waard, 1993b 27 –5.90 (7.60) 15 –0.60 (6.10) 44.22 –5.30 (–9.51 to –1.09)
Subtotal (95% CI) 55 39 100.00 –6.25 (–9.05 to –3.45)Test for heterogeneity: Chi2 = 0.35, df = 1 (p = 0.55), I2 = 0%Test for overall effect: z = 4.37 (p < 0.0001)
Total (95% CI) 55 39 100.00 –6.25 (–9.05 to –3.45)Test for heterogeneity: Chi2 = 0.35, df = 1 (p = 0.55), I2 = 0%Test for overall effect: z = 4.37 (p < 0.0001)
–10 –5 0 5 10
Favours treatment Favours control
(95% CI) (%) (95% CI)
FIGURE 103
Comparison: 25 LCD vs control at 24 monthsOutcome: 01 Weight change (kg)
Study Treatment Control WMD (fixed) Weight WMD (fixed)or sub-category n nMean (SD) Mean (SD)
01 01de Waard, 1993a 25 –5.00 (7.30) 21 2.00 (6.50) 100.00 –7.00 (–10.99 to –3.01)
Subtotal (95% CI) 25 21 100.00 –7.00 (–10.99 to –3.01)Test for heterogeneity: not applicableTest for overall effect: z = 3.44 (p = 0.0006)
Total (95% CI) 25 21 100.00 –7.00 (–10.99 to –3.01)Test for heterogeneity: not applicableTest for overall effect: z = 3.44 (p = 0.0006)
–10 –5 0 5 10
Favours treatment Favours control
(95% CI) (%) (95% CI)
FIGURE 104

There were clear differences between groups atbaseline. Eight of the ten participants in theVLCD group and two of the six participants in thelow-fat group were treated for their diabetes bydiet only before the trial commenced. There werealso marked differences between the groups atbaseline for HbA1c: VLCD group mean 6.3% (SD 1.2%), low-fat group mean 8.5% (SD 0.9%)(reported p = 3 × 10⁻⁵). For this reason onlychanges in weight outcome data were evaluated in this review.
Active treatment was for 3 months fromrandomisation: one group received a low-fat dietand the other a 300 kcal/day meal replacementdiet (Cambridge diet).
Review resultsAt 24 months the VLCD compared with low-fatdiet produced a WMD weight change of –4.70 kg(95% CI –11.79 to 2.39 kg) (Figure 108). However,given the small size of the trial and the imbalancesat baseline, the results should be interpreted withcaution.
Effects of very low-calorie diet versuslow-calorie diet Description of studiesThree RCTs provided change in weight at 12 months or longer,151,152 with one providingdata at 18 months.153 One study reported using anITT analysis.152 This was unclear in another of thestudies.153
Health Technology Assessment 2004; Vol. 8: No. 21
59
© Queen’s Printer and Controller of HMSO 2004. All rights reserved.
Comparison: 27 VLCD vs control at 12 monthsOutcome: 01 Weight change (kg)
Study Treatment Control WMD (fixed) Weight WMD (fixed)or sub-category n nMean (SD) Mean (SD)
01 01Stenius-Aarniala, 2000 19 –11.10 (9.06) 19 2.30 (6.57) 100.00 –13.40 (–18.43 to –8.37)
Subtotal (95% CI) 19 19 100.00 –13.40 (–18.43 to –8.37)Test for heterogeneity: not applicableTest for overall effect: z = 5.22 (p < 0.00001)
Total (95% CI) 19 19 100.00 –13.40 (–18.43 to –8.37)Test for heterogeneity: not applicableTest for overall effect: z = 5.22 (p < 0.00001)
–10 –5 0 5 10
Favours treatment Favours control
(95% CI) (%) (95% CI)
FIGURE 106
Comparison: 28 LCD vs 600 kcal/day deficit or low fat at 12 monthsOutcome: 01 Weight change (kg)
Study Treatment Control WMD (fixed) Weight WMD (fixed)or sub-category n nMean (SD) Mean (SD)
01 01Shah, 1996 36 –0.82 (6.15) 39 –2.45 (6.61) 100.00 1.63 (–1.26 to 4.52)
Subtotal (95% CI) 36 39 100.00 1.63 (–1.26 to 4.52)Test for heterogeneity: not applicableTest for overall effect: z = 1.11 (p = 0.27)
Total (95% CI) 36 39 100.00 1.63 (–1.26 to 4.52)Test for heterogeneity: not applicableTest for overall effect: z = 1.11 (p = 0.27)
–10 –5 0 5 10
Favours treatment Favours control
(95% CI) (%) (95% CI)
FIGURE 107
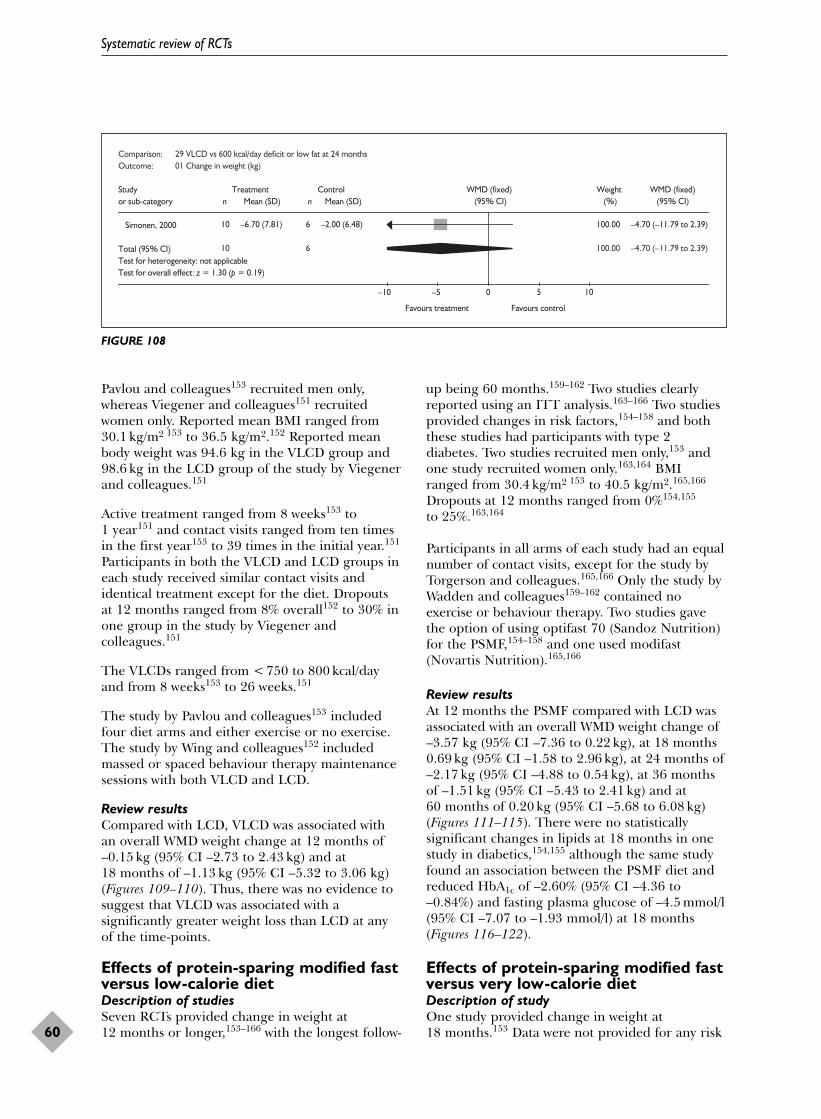
Pavlou and colleagues153 recruited men only,whereas Viegener and colleagues151 recruitedwomen only. Reported mean BMI ranged from30.1 kg/m2 153 to 36.5 kg/m2.152 Reported meanbody weight was 94.6 kg in the VLCD group and98.6 kg in the LCD group of the study by Viegenerand colleagues.151
Active treatment ranged from 8 weeks153 to 1 year151 and contact visits ranged from ten timesin the first year153 to 39 times in the initial year.151
Participants in both the VLCD and LCD groups ineach study received similar contact visits andidentical treatment except for the diet. Dropoutsat 12 months ranged from 8% overall152 to 30% inone group in the study by Viegener andcolleagues.151
The VLCDs ranged from < 750 to 800 kcal/dayand from 8 weeks153 to 26 weeks.151
The study by Pavlou and colleagues153 includedfour diet arms and either exercise or no exercise.The study by Wing and colleagues152 includedmassed or spaced behaviour therapy maintenancesessions with both VLCD and LCD.
Review resultsCompared with LCD, VLCD was associated withan overall WMD weight change at 12 months of–0.15 kg (95% CI –2.73 to 2.43 kg) and at 18 months of –1.13 kg (95% CI –5.32 to 3.06 kg)(Figures 109–110). Thus, there was no evidence tosuggest that VLCD was associated with asignificantly greater weight loss than LCD at anyof the time-points.
Effects of protein-sparing modified fastversus low-calorie dietDescription of studiesSeven RCTs provided change in weight at 12 months or longer,153–166 with the longest follow-
up being 60 months.159–162 Two studies clearlyreported using an ITT analysis.163–166 Two studiesprovided changes in risk factors,154–158 and boththese studies had participants with type 2 diabetes. Two studies recruited men only,153 andone study recruited women only.163,164 BMIranged from 30.4 kg/m2 153 to 40.5 kg/m2.165,166
Dropouts at 12 months ranged from 0%154,155
to 25%.163,164
Participants in all arms of each study had an equalnumber of contact visits, except for the study byTorgerson and colleagues.165,166 Only the study byWadden and colleagues159–162 contained noexercise or behaviour therapy. Two studies gavethe option of using optifast 70 (Sandoz Nutrition)for the PSMF,154–158 and one used modifast(Novartis Nutrition).165,166
Review resultsAt 12 months the PSMF compared with LCD wasassociated with an overall WMD weight change of–3.57 kg (95% CI –7.36 to 0.22 kg), at 18 months0.69 kg (95% CI –1.58 to 2.96 kg), at 24 months of–2.17 kg (95% CI –4.88 to 0.54 kg), at 36 monthsof –1.51 kg (95% CI –5.43 to 2.41 kg) and at 60 months of 0.20 kg (95% CI –5.68 to 6.08 kg)(Figures 111–115). There were no statisticallysignificant changes in lipids at 18 months in onestudy in diabetics,154,155 although the same studyfound an association between the PSMF diet andreduced HbA1c of –2.60% (95% CI –4.36 to–0.84%) and fasting plasma glucose of –4.5 mmol/l(95% CI –7.07 to –1.93 mmol/l) at 18 months(Figures 116–122).
Effects of protein-sparing modified fastversus very low-calorie dietDescription of studyOne study provided change in weight at 18 months.153 Data were not provided for any risk
Systematic review of RCTs
60
Comparison: 29 VLCD vs 600 kcal/day deficit or low fat at 24 monthsOutcome: 01 Change in weight (kg)
Study Treatment Control WMD (fixed) Weight WMD (fixed)or sub-category n nMean (SD) Mean (SD)
Simonen, 2000 10 –6.70 (7.81) 6 –2.00 (6.48) 100.00 –4.70 (–11.79 to 2.39)
Total (95% CI) 10 6 100.00 –4.70 (–11.79 to 2.39)Test for heterogeneity: not applicableTest for overall effect: z = 1.30 (p = 0.19)
–10 –5 0 5 10
Favours treatment Favours control
(95% CI) (%) (95% CI)
FIGURE 108

Health Technology Assessment 2004; Vol. 8: No. 21
61
© Queen’s Printer and Controller of HMSO 2004. All rights reserved.
Comparison: 30 VLCD vs LCD at 12 months Outcome: 01 Weight change (kg)
Study Treatment Control WMD (fixed) Weight WMD (fixed)or sub-category n nMean (SD) Mean (SD)
01 01Viegener, 1990 30 –8.97 (6.72) 30 –8.95 (7.26) 53.09 –0.02 (–3.56 to 3.52)Wing, 1984a 11 –1.95 (6.47) 12 0.38 (6.02) 25.37 –2.33 (–7.45 to 2.79)Wing, 1984b 12 –0.58 (6.08) 9 –2.69 (6.68) 21.54 2.11 (–3.45 to 7.67)
Subtotal (95% CI) 53 51 100.00 –0.15 (–2.73 to 2.43)Test for heterogeneity: Chi2 = 1.34, df = 2 (p = 0.51), I2 = 0%Test for overall effect: z = 0.11 (p = 0.91)
Total (95% CI) 53 51 100.00 –0.15 (–2.73 to 2.43)Test for heterogeneity: Chi2 = 1.34, df = 2 (p = 0.51), I2 = 0%Test for overall effect: z = 0.11 (p = 0.91)
–10 –5 0 5 10
Favours treatment Favours control
(95% CI) (%) (95% CI)
FIGURE 109
Comparison: 31 VLCD vs LCD at 18 monthsOutcome: 01 Weight change (kg)
Study Treatment Control WMD (fixed) Weight WMD (fixed)or sub-category n nMean (SD) Mean (SD)
01 01Pavlou, 1989 1ga 18 –12.40 (9.42) 10 –9.19 (8.52) 37.56 –3.21 (–10.05 to 3.63)Pavlou, 1989 1hb 16 –3.45 (6.89) 11 –3.57 (6.93) 62.44 0.12 (–5.19 to 5.43)
Subtotal (95% CI) 34 21 100.00 –1.13 (–5.32 to 3.06)Test for heterogeneity: Chi2 = 0.57, df = 1 (p = 0.45), I2 = 0%Test for overall effect: z = 0.53 (p = 0.60)
Total (95% CI) 34 21 100.00 –1.13 (–5.32 to 3.06)Test for heterogeneity: Chi2 = 0.57, df = 1 (p = 0.45), I2 = 0%Test for overall effect: z = 0.53 (p = 0.60)
–10 –5 0 5 10
Favours treatment Favours control
(95% CI) (%) (95% CI)
FIGURE 110
Comparison: 32 PSMF vs LCD at 12 monthsOutcome: 01 Weight change (kg)
Study Treatment Control WMD (fixed) Weight WMD (fixed)or sub-category n nMean (SD) Mean (SD)
Wadden, 1989 25 –10.60 (8.00) 22 –6.60 (8.91) 60.61 –4.00 (–8.87 to 0.87)Wadden, 1994 23 –17.33 (9.86) 17 –14.43 (9.46) 39.39 –2.90 (–8.94 to 3.14)
Total (95% CI) 48 39 100.00 –3.57 (–7.36 to 0.22)Test for heterogeneity: Chi2 = 0.08, df = 1 (p = 0.78), I2 = 0%Test for overall effect: z = 1.84 (p = 0.07)
–10 –5 0 5 10
Favours treatment Favours control
(95% CI) (%) (95% CI)
FIGURE 111
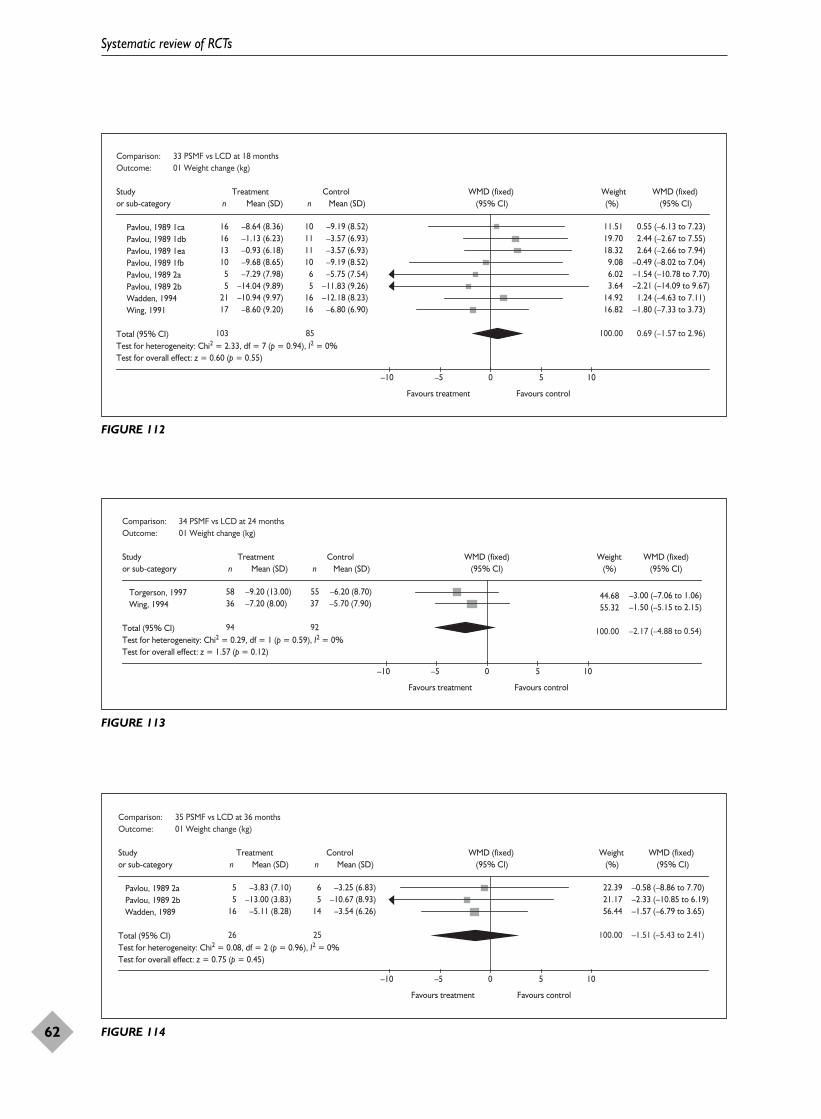
Systematic review of RCTs
62
Comparison: 33 PSMF vs LCD at 18 monthsOutcome: 01 Weight change (kg)
Study Treatment Control WMD (fixed) Weight WMD (fixed)or sub-category n nMean (SD) Mean (SD)
Pavlou, 1989 1ca 16 –8.64 (8.36) 10 –9.19 (8.52) 11.51 0.55 (–6.13 to 7.23)Pavlou, 1989 1db 16 –1.13 (6.23) 11 –3.57 (6.93) 19.70 2.44 (–2.67 to 7.55)Pavlou, 1989 1ea 13 –0.93 (6.18) 11 –3.57 (6.93) 18.32 2.64 (–2.66 to 7.94)Pavlou, 1989 1fb 10 –9.68 (8.65) 10 –9.19 (8.52) 9.08 –0.49 (–8.02 to 7.04)Pavlou, 1989 2a 5 –7.29 (7.98) 6 –5.75 (7.54) 6.02 –1.54 (–10.78 to 7.70)Pavlou, 1989 2b 5 –14.04 (9.89) 5 –11.83 (9.26) 3.64 –2.21 (–14.09 to 9.67)Wadden, 1994 21 –10.94 (9.97) 16 –12.18 (8.23) 14.92 1.24 (–4.63 to 7.11)Wing, 1991 17 –8.60 (9.20) 16 –6.80 (6.90) 16.82 –1.80 (–7.33 to 3.73)
Total (95% CI) 103 85 100.00 0.69 (–1.57 to 2.96)Test for heterogeneity: Chi2 = 2.33, df = 7 (p = 0.94), I2 = 0%Test for overall effect: z = 0.60 (p = 0.55)
–10 –5 0 5 10
Favours treatment Favours control
(95% CI) (%) (95% CI)
FIGURE 112
Comparison: 34 PSMF vs LCD at 24 monthsOutcome: 01 Weight change (kg)
Study Treatment Control WMD (fixed) Weight WMD (fixed)or sub-category n nMean (SD)
Torgerson, 1997 58 –9.20 (13.00) 55 –6.20 (8.70) 44.68 –3.00 (–7.06 to 1.06)Wing, 1994 36 –7.20 (8.00) 37 –5.70 (7.90) 55.32 –1.50 (–5.15 to 2.15)
Total (95% CI) 94 92 100.00 –2.17 (–4.88 to 0.54)Test for heterogeneity: Chi2 = 0.29, df = 1 (p = 0.59), I2 = 0%Test for overall effect: z = 1.57 (p = 0.12)
–10 –5 0 5 10
Favours treatment Favours control
Mean (SD) (95% CI) (%) (95% CI)
FIGURE 113
Comparison: 35 PSMF vs LCD at 36 months Outcome: 01 Weight change (kg)
Study Treatment Control WMD (fixed) Weight WMD (fixed)or sub-category n nMean (SD) Mean (SD)
Pavlou, 1989 2a 5 –3.83 (7.10) 6 –3.25 (6.83) 22.39 –0.58 (–8.86 to 7.70)Pavlou, 1989 2b 5 –13.00 (3.83) 5 –10.67 (8.93) 21.17 –2.33 (–10.85 to 6.19)Wadden, 1989 16 –5.11 (8.28) 14 –3.54 (6.26) 56.44 –1.57 (–6.79 to 3.65)
Total (95% CI) 26 25 100.00 –1.51 (–5.43 to 2.41)Test for heterogeneity: Chi2 = 0.08, df = 2 (p = 0.96), I2 = 0%Test for overall effect: z = 0.75 (p = 0.45)
–10 –5 0 5 10
Favours treatment Favours control
(95% CI) (%) (95% CI)
FIGURE 114

Health Technology Assessment 2004; Vol. 8: No. 21
63
© Queen’s Printer and Controller of HMSO 2004. All rights reserved.
Comparison: 36 PSMF vs LCD at 60 monthsOutcome: 01 Weight change (kg)
Study Treatment Control WMD (fixed) Weight WMD (fixed)or sub-category n nMean (SD) Mean (SD)
Wadden, 1989 22 2.90 (11.26) 15 2.70 (6.97) 100.00 0.20 (–5.68 to 6.08)
Total (95% CI) 22 15 100.00 0.20 (–5.68 to 6.08)Test for heterogeneity: not applicableTest for overall effect: z = 0.07 (p = 0.95)
–10 –5 0 5 10
Favours treatment Favours control
(95% CI) (%) (95% CI)
FIGURE 115
Comparison: 33 PSMF vs LCD at 18 months Outcome: 02 Change in total cholesterol (mmol/l)
Study Treatment Control WMD (fixed) Weight WMD (fixed)or sub-category n nMean (SD) Mean (SD)
Wing, 1991 17 0.29 (1.08) 16 0.31 (1.08) 100.00 –0.02 (–0.76 to 0.72)
Total (95% CI) 17 16 100.00 –0.02 (–0.76 to 0.72)Test for heterogeneity: not applicableTest for overall effect: z = 0.05 (p = 0.96)
Favours treatment Favours control
(95% CI) (%) (95% CI)
–1 –0.5 0 0.5 1
FIGURE 116
Comparison: 33 PSMF vs LCD at 18 months Outcome: 03 change in HDL cholesterol mmol/L
Study Treatment Control WMD (fixed) Weight WMD (fixed)or sub-category n Mean (SD) n Mean (SD) (95% CI) (%) (95% CI)
Wing, 1991 17 0.22 (0.29) 16 0.13 (0.29) 100.00 0.09 (–0.11 to 0.29)
Total (95% CI) 17 16 100.00 0.09 (–0.11 to 0.29)Test for heterogeneity: not applicableTest for overall effect: z = 0.89 (p = 0.37)
–0.5 –0.25 0 0.25 0.5
Favours control Favours treatment
FIGURE 117
Comparison: 33 PSMF vs LCD at 18 months Outcome: 04 Change in triglycerides (mmol/l)
Study Treatment Control WMD (fixed) Weight WMD (fixed)or sub-category n nMean (SD) Mean (SD)
Wing, 1991 17 –0.13 (0.96) 16 –0.29 (0.96) 100.00 0.16 (–0.50 to 0.82)
Total (95% CI) 17 16 100.00 0.16 (–0.50 to 0.82)Test for heterogeneity: not applicableTest for overall effect: z = 0.48 (p = 0.63)
Favours treatment Favours control
(95% CI) (%) (95% CI)
–1 –0.5 0 0.5 1
FIGURE 118

Systematic review of RCTs
64
Comparison: 33 PSMF vs LCD at 18 monthsOutcome: 05 Change in HbA1c%
Study Treatment Control WMD (fixed) Weight WMD (fixed)or sub-category n nMean (SD) Mean (SD)
Wing, 1991 17 –1.20 (2.58) 16 1.40 (2.58) 100.00 –2.60 (–4.36 to –0.84)
Total (95% CI) 17 16 100.00 –2.60 (–4.36 to –0.84)Test for heterogeneity: not applicableTest for overall effect: z = 2.89 (p = 0.004)
–10 –5 0 5 10
Favours treatment Favours control
(95% CI) (%) (95% CI)
FIGURE 119
Comparison: 34 PSMF vs LCD at 24 monthsOutcome: 03 Change in HbA1c%
Study Treatment Control WMD (fixed) Weight WMD (fixed)or sub-category n nMean (SD) Mean (SD)
Wing, 1994 36 0.07 (2.22) 37 0.24 (2.40) 100.00 –0.17 (–1.23 to 0.89)
Total (95% CI) 36 37 100.00 –0.17 (–1.23 to 0.89)Test for heterogeneity: not applicableTest for overall effect: z = 0.31 (p = 0.75)
–10 –5 0 5 10
Favours treatment Favours control
(95% CI) (%) (95% CI)
FIGURE 120
Comparison: 33 PSMF vs LCD at 18 monthsOutcome: 06 Change in fasting plasma glucose (mmol/l)
Study Treatment Control WMD (fixed) Weight WMD (fixed)or sub-category n nMean (SD) Mean (SD)
Wing, 1991 17 –3.80 (3.77) 16 0.70 (3.77) 100.00 –4.50 (–7.07 to –1.93)
Total (95% CI) 17 16 100.00 –4.50 (–7.07 to –1.93)Test for heterogeneity: not applicableTest for overall effect: z = 3.43 (p = 0.0006)
–10 –5 0 5 10
Favours treatment Favours control
(95% CI) (%) (95% CI)
FIGURE 121
Comparison: 34 PSMF vs LCD at 24 monthsOutcome: 02 Change in fasting plasma glucose (mmol/l)
Study Treatment Control WMD (fixed) Weight WMD (fixed)or sub-category n nMean (SD) Mean (SD)
Wing, 1994 36 –1.22 (4.56) 37 0.39 (4.67) 100.00 –1.61 (–3.73 to 0.51)
Total (95% CI) 36 37 100.00 –1.61 (–3.73 to 0.51)Test for heterogeneity: not applicableTest for overall effect: z = 1.49 (p = 0.14)
–10 –5 0 5 10
Favours treatment Favours control
(95% CI) (%) (95% CI)
FIGURE 122

factor changes. It was unclear whether an ITTanalysis had been used. The study recruited 160 men and had an overall dropout of 31% at 18 months. All participants received an equalnumber of contacts and received behaviourtherapy as part of the intervention. The studycompared two PSMF diets to a VLCD,incorporated in a factorial design with exercise.
Review resultsAt 18 months PSMF compared with VLCD wasassociated with a WMD weight change of 2.73 kg(95% CI 0.07 to 5.39 kg) (Figure 123). Again,however, the number of participants contributingto this comparison was small.
Effects of diet and exercise versuscontrol(See Appendix 12; meta-analyses 38.01–08,39.01–02.)
Description of studiesThree studies provided change in weight at 12 months115–121,142–145,167–171 and one of thesealso provided change in weight at 24 months.167–171
Data were provided for changes in lipids, bloodpressure and fasting plasma glucose at 12 months,and for fasting plasma glucose at 24 months.
None of the studies reported using an ITTanalysis. All studies demonstrated some statisticallysignificant differences for risk factors, but notweight or BMI, between groups at baseline. Onestudy initially used less strict recruitmentcriteria.167–171 One study recruited participantswith impaired glucose tolerance.167–171
Reported mean BMI ranged from 27.9 kg/m2
for females in the study by Wood andcolleagues142–145 to 31.3 kg/m2.167–171 Outcomedata were presented by gender in the study byWood and colleagues.142–145
All studies used a 600 kcal/day deficit or low-fatdiet. In the Finnish Diabetes Prevention Study(FDPS)167–171 22 participants had VLCD in year 1and 25 in year 2 of 3–8 weeks’ duration due to noweight loss in the first 6–12 months. The FDPSalso invited the person in the participant’s familyresponsible for preparing meals to attend sessionsif this person was not the participant.
The exercise prescription was similar for twostudies,115–121,142–145 with up to three supervisedexercise sessions of 45–60 minutes weekly. In theFDPS167–171 the endurance programme differedbetween study centres, with supervised circuit typetraining twice weekly where possible. Participantsin this study were also advised to perform 30 minutes of daily moderate exercise.
Review resultsDiet plus exercise versus no treatment wasassociated with an overall WMD weight change at12 months of –4.78 kg (95% CI –5.41 to –4.16 kg)(Figure 124). Weight loss at 24 months was stillevident, with diet plus exercise associated with aWMD weight change of –2.70 kg (95% CI –3.60 to–1.80 kg) (Figure 125).
Diet plus exercise compared with controlsdemonstrated a statistically significant effect onlipids, blood pressure and fasting plasma glucoseat 12 months, and fasting plasma glucose at 24 months (Figures 126–133).
Health Technology Assessment 2004; Vol. 8: No. 21
65
© Queen’s Printer and Controller of HMSO 2004. All rights reserved.
Comparison: 68 PSMF v VLCD at 18 monthsOutcome: 01 Weight change (kg)
Study Treatment Control WMD (fixed) Weight WMD (fixed)or sub-category n nMean (SD) Mean (SD)
Pavlou, 1989 1ce 16 –1.13 (6.23) 16 –3.45 (6.89) 34.16 2.32 (–2.23 to 6.87)Pavlou, 1989 1ca 16 –8.64 (8.36) 18 –12.40 (9.42) 19.81 3.76 (–2.22 to 9.74)Pavlou, 1989 1cg 13 –0.93 (6.18) 16 –3.45 (6.89) 31.19 2.52 (–2.24 to 7.28)Pavlou, 1989 1db 10 –9.68 (8.65) 18 –12.40 (9.42) 14.84 2.72 (–4.19 to 9.63)
Total (95% CI) 55 68 100.00 2.73 (0.07 to 5.39)Test for heterogeneity: Chi2 = 0.15, df = 3 (p = 0.98), I2 = 0%Test for overall effect: z = 2.01 (p = 0.04)
–10 –5 0 5 10
Favours treatment Favours control
(95% CI) (%) (95% CI)
FIGURE 123

Systematic review of RCTs
66
Comparison: 37 Diet + exercise vs control at 12 monthsOutcome: 01 Weight change (kg)
Study Treatment Control WMD (fixed) Weight WMD (fixed)or sub-category n nMean (SD) Mean (SD)
01 600 kcal/day deficit or low fatFDPS, 2001 256 –4.20 (5.10) 250 –0.80 (3.70) 65.51 –3.40 (–4.18 to –2.62)ODES, 1995 65 –5.60 (4.84) 43 1.10 (2.62) 19.70 –6.70 (–8.11 to –5.29)Wood, 1991a 42 –5.10 (5.30) 39 1.30 (5.20) 7.52 –6.40 (–8.69 to –4.11)Wood, 1991b 39 –8.70 (5.70) 40 1.70 (4.80) 7.27 –10.40 (–12.73 to –8.07)
Subtotal (95% CI) 402 372 100.00 –4.78 (–5.41 to –4.16)Test for heterogeneity: Chi2 = 43.61, df = 3 (p < 0.00001), I2 = 93.1%Test for overall effect: z = 14.95 (p < 0.00001)
Total (95% CI) 402 372 100.00 –4.78 (–5.41 to –4.16)Test for heterogeneity: Chi2 = 43.61, df = 3 (p < 0.00001), I2 = 93.1%Test for overall effect: z = 14.95 (p < 0.00001)
–10 –5 0 5 10
Favours treatment Favours control
(95% CI) (%) (95% CI)
FIGURE 124
Comparison: 38 Diet + exercise vs control at 24 monthsOutcome: 04 Change in weight (kg)
Study Treatment Control WMD (fixed) Weight WMD (fixed)or sub-category n nMean (SD) Mean (SD)
01 600 kcal/day deficit or low fatFDPS, 2001 244 –3.50 (5.50) 226 –0.80 (4.40) 100.00 –2.70 (–3.60 to –1.80)
Subtotal (95% CI) 244 226 100.00 –2.70 (–3.60 to –1.80)Test for heterogeneity: not applicableTest for overall effect: z = 5.90 (p < 0.00001)
Total (95% CI) 244 226 100.00 –2.70 (–3.60 to –1.80)Test for heterogeneity: not applicableTest for overall effect: z = 5.90 (p < 0.00001)
–10 –5 0 5 10
Favours treatment Favours control
(95% CI) (%) (95% CI)
FIGURE 125
Comparison: 37 Diet + exercise vs control at 12 monthsOutcome: 02 Change in total cholesterol (mmol/l)
Study Treatment Control WMD (fixed) Weight WMD (fixed)or sub-category n nMean (SD) Mean (SD)
01 600 kcal/day deficit or low fatFDPS, 2001 256 –0.13 (0.73) 250 –0.10 (0.73) 58.89 –0.03 (–0.16 to 0.10)ODES, 1995 65 –0.48 (0.89) 43 –0.16 (0.59) 12.23 –0.32 (–0.60 to –0.04)Wood, 1991a 42 –0.28 (0.52) 39 –0.03 (0.47) 20.50 –0.25 (–0.47 to –0.03)Wood, 1991b 39 –0.38 (0.87) 40 –0.14 (0.64) 8.37 –0.24 (–0.58 to 0.10)
Subtotal (95% CI) 402 372 100.00 –0.13 (–0.23 to –0.03)Test for heterogeneity: Chi2 = 5.75, df = 3 (p = 0.12), I2 = 47.8%Test for overall effect: z = 2.57 (p = 0.01)
Total (95% CI) 402 372 100.00 –0.13 (–0.23 to –0.03)Test for heterogeneity: Chi2 = 5.75, df = 3 (p = 0.12), I2 = 47.8%Test for overall effect: z = 2.57 (p = 0.01)
Favours treatment Favours control
(95% CI) (%) (95% CI)
–1 –0.5 0 0.5 1
FIGURE 126

Health Technology Assessment 2004; Vol. 8: No. 21
67
© Queen’s Printer and Controller of HMSO 2004. All rights reserved.
Comparison: 37 Diet + exercise vs control at 12 monthsOutcome: 08 Change in LDL cholesterol (mmol/l)
Study Treatment Control WMD (fixed) Weight WMD (fixed)or sub-category n nMean (SD) Mean (SD)
01 600 kcal/day deficit or low fatODES, 1995 65 –0.39 (0.89) 43 –0.22 (0.59) 24.97 –0.17 (–0.45 to 0.11)Wood, 1991a 42 –0.29 (0.46) 39 –0.03 (0.41) 54.18 –0.26 (–0.45 to –0.07)Wood, 1991b 39 –0.27 (0.78) 40 –0.20 (0.59) 20.84 –0.07 (–0.38 to 0.24)
Subtotal (95% CI) 146 122 100.00 –0.20 (–0.34 to –0.06)Test for heterogeneity: Chi2 = 1.12, df = 2 (p = 0.57), I2 = 0%Test for overall effect: z = 2.78 (p = 0.005)
Total (95% CI) 146 122 100.00 –0.20 (–0.34 to –0.06)Test for heterogeneity: Chi2 = 1.12, df = 2 (p = 0.57), I2 = 0%Test for overall effect: z = 2.78 (p = 0.005)
Favours treatment Favours control
(95% CI) (%) (95% CI)
–0.5 –0.25 0 0.25 0.5
FIGURE 127
Comparison: 37 Diet + exercise vs control at 12 months Outcome: 03 Change in HDL cholesterol (mmol/l)
Study Treatment Control WMD (fixed) Weight WMD (fixed)or sub-category n nMean (SD) Mean (SD)
01 600 kcal/day deficit or low fatFDPS, 2001 256 0.05 (0.18) 250 0.03 (0.16) 60.18 0.02 (–0.01 to 0.05)ODES, 1995 65 0.13 (0.15) 43 0.02 (0.10) 23.81 0.11 (0.06 to 0.16)Wood, 1991a 42 0.02 (0.18) 39 –0.05 (0.24) 6.13 0.07 (–0.02 to 0.16)Wood, 1991b 39 0.14 (0.18) 40 –0.05 (0.15) 9.89 0.19 (0.12 to 0.26)
Subtotal (95% CI) 402 372 100.00 0.06 (0.04 to 0.08)Test for heterogeneity: Chi2 = 23.47, df = 3 (p < 0.0001), I2 = 87.2%Test for overall effect: z = 5.22 (p < 0.00001)
Total (95% CI) 402 372 100.00 0.06 (0.04 to 0.08)Test for heterogeneity: Chi2 = 23.47, df = 3 (p < 0.0001), I2 = 87.2%Test for overall effect: z = 5.22 (p < 0.00001)
Favours control Favours treatment
(95% CI) (%) (95% CI)
–0.5 –0.25 0 0.25 0.5
FIGURE 128
Comparison: 37 Diet + exercise vs control at 12 months Outcome: 04 change in triglycerides mmol/L
Study Treatment Control WMD (fixed) Weight WMD (fixed)or sub-category n Mean (SD) n Mean (SD) (95% CI) (%) (95% CI)
01 600 kcal/day deficit or low fatWood, 1991a 42 –0.02 (0.26) 39 0.13 (0.37) 32.52 –0.15 (–0.29 to –0.01) Wood, 1991b 39 –0.48 (0.75) 40 0.18 (0.67) 6.49 –0.66 (–0.97 to –0.35) ODES, 1995 65 –0.58 (0.97) 43 0.17 (0.92) 4.87 –0.75 (–1.11 to –0.39) FDPS, 2001 256 –0.20 (0.56) 250 –0.01 (0.66) 56.11 –0.19 (–0.30 to –0.08)
Subtotal (95% CI) 402 372 100.00 –0.23 (–0.31 to –0.15)Test for heterogeneity: Chi2 = 16.90, df = 3 (p = 0.0007), I2 = 82.2%Test for overall effect: z = 5.75 (p < 0.00001)
Total (95% CI) 402 372 100.00 –0.23 (–0.31 to –0.15)Test for heterogeneity: Chi2 = 16.90, df = 3 (p = 0.0007), I2 = 82.2%Test for overall effect: z = 5.75 (p < 0.00001)
–1 –0.5 0 0.5 1
Favours treatment Favours control
FIGURE 129

Systematic review of RCTs
68
Comparison: 37 Diet + exercise vs control at 12 months Outcome: 07 Change in fasting plasma glucose (mmol/l)
Study Treatment Control WMD (fixed) Weight WMD (fixed)or sub-category n n Mean (SD)Mean (SD)
01 600 kcal/day deficit or low fatFDPS, 2001 256 –0.22 (0.67) 250 0.06 (0.67) 75.97 –0.28 (–0.40 to –0.16)ODES, 1995 65 –0.26 (0.64) 43 0.07 (0.46) 24.03 –0.33 (–0.54 to –0.12)
Subtotal (95% CI) 321 293 100.00 –0.29 (–0.39 to –0.19)Test for heterogeneity: Chi2 = 0.17, df = 1 (p = 0.68), I2 = 0%Test for overall effect: z = 5.62 (p < 0.00001)
Total (95% CI) 321 293 100.00 –0.29 (–0.39 to –0.19)Test for heterogeneity: Chi2 = 0.17, df = 1 (p = 0.68), I2 = 0%Test for overall effect: z = 5.62 (p < 0.00001)
Favours treatment Favours control
(95% CI) (%) (95% CI)
–1 –0.5 0 0.5 1
FIGURE 130
Comparison: 38 Diet + exercise vs control at 24 months Outcome: 05 Change in fasting plasma glucose (mmol/l)
Study Treatment Control WMD (fixed) Weight WMD (fixed)or sub-category n nMean (SD) Mean (SD)
01 600 kcal/day deficit or low fatFDPS, 2001 226 –0.10 (0.70) 243 0.20 (0.80) 100.00 –0.30 (–0.44 to –0.16)
Subtotal (95% CI) 226 243 100.00 –0.30 (–0.44 to –0.16)Test for heterogeneity: not applicableTest for overall effect: z = 4.33 (p < 0.0001)
Total (95% CI) 226 243 100.00 –0.30 (–0.44 to –0.16)Test for heterogeneity: not applicableTest for overall effect: z = 4.33 (p < 0.0001)
Favours treatment Favours control
(95% CI) (%) (95% CI)
–1 –0.5 0 0.5 1
FIGURE 131
Comparison: 37 Diet + exercise vs control at 12 months Outcome: 06 Change in DBP (mmHg)
Study Treatment Control WMD (fixed) Weight WMD (fixed)or sub-category n nMean (SD) Mean (SD)
01 600 kcal/day deficit or low fatFDPS, 2001 256 –5.00 (9.00) 250 –3.00 (9.00) 44.11 –2.00 (–3.57 to –0.43)ODES, 1995 65 –5.20 (7.26) 43 –0.70 (8.52) 11.30 –4.50 (–7.60 to –1.40)Wood, 1991a 42 –2.00 (4.10) 39 0.90 (5.30) 25.21 –2.90 (–4.97 to –0.83)Wood, 1991b 39 –4.90 (5.70) 40 2.10 (5.00) 19.37 –7.00 (–9.37 to –4.63)
Subtotal (95% CI) 402 372 100.00 –3.48 (–4.52 to –2.44)Test for heterogeneity: Chi2 = 12.63, df = 3 (p = 0.005), I2 = 76.3%Test for overall effect: z = 6.54 (p < 0.00001)
Total (95% CI) 402 372 100.00 –3.48 (–4.52 to –2.44)Test for heterogeneity: Chi2 = 12.63, df = 3 (p = 0.005), I2 = 76.3%Test for overall effect: z = 6.54 (p < 0.00001)
–10 –5 0 5 10
Favours treatment Favours control
(95% CI) (%) (95% CI)
FIGURE 132

In the FDPS167–171 the cumulative incidence ofdiabetes for both men and women was 58% lowerin the intervention group than in the controlgroup, hazard ratio 0.4 (95% CI 0.3 to 0.7). TheFDPS reported one death and two people withbreast cancer in the active treatment group, andone participant developed cancer of the largeintestine in the control group. Two cases of cancerand one cardiac event were reported in theODES,115–121 but the treatment status was notstated.
Effects of diet and behaviour therapyversus controlDescription of studiesThree RCTs provided change in weight at 12 months172–177 and one of these studies alsoprovided weight change at 24 months.176,177 Datawere provided for lipids, blood pressure andfasting plasma glucose at 12 months and, inaddition, HbA1c at 24 months. One cluster RCT178
also reported change in weight and HbA1c at 18 months for the diet and behaviour therapygroup but not for the control.
One study used an ITT approach176,177 and it wasunclear whether this was the case for the otherthree studies.172–175,178 Two of the studies wereperformed by the same authors at theRehabilitation Research Centre of the SocialInsurance Institution in Turku, Finland.172–175 Onestudy recruited people with one or two biologicalparents with type 2 diabetes.176,177 The clusterRCT by Kaplan and colleagues, where groups wererandomised,178 recruited people with type 2diabetes.
Reported mean was BMI 34 kg/m2 in twostudies172–175 and 36 kg/m2 in the study by Wingand colleagues.176,177 Participants in the controlgroups of these three studies received minimaltreatment. Contact visits for participants in the dietplus behaviour therapy groups were much morefrequent in the study by Wing and colleagues,176,177
where participants were contacted 40 times in theinitial year compared with 13 times in the study byKarvetti and colleagues.175
Two studies used an LCD throughout172–175 andone study used a VLCD for the initial 8 weeks,which was adjusted to provide an LCD by week16.176,177 The cluster RCT by Kaplan andcolleagues178 evaluated an LCD and behaviourtherapy.
Review resultsThe meta-analysis of diet and behaviour therapycompared with no treatment showed a WMDweight change at 12 months of –7.21 kg (95% CI –8.68 to –5.75 kg) and at 24 months of–1.80 kg (95% CI –4.77 to 1.17 kg) (Figures 134and 135).
At 12 months diet and behaviour therapydemonstrated beneficial effects on HDLcholesterol, with a weighted mean difference of0.11 mmol/l (95% CI 0.06 to 0.17 mmol/l),triglycerides –0.58 mmol/l (95% CI –0.98 to–0.17 mmol/l), SBP –3.39 mmHg (95% CI –5.91 to –0.86 mmHg) and DBP –3.37 mmHg (95% CI –5.16 to –1.58 mmHg) (Figures 136–150). At 24 months the study by Wing andcolleagues176,177 showed significant beneficial
Health Technology Assessment 2004; Vol. 8: No. 21
69
© Queen’s Printer and Controller of HMSO 2004. All rights reserved.
Comparison: 37 Diet + exercise vs control at 12 monthsOutcome: 05 Change in SBP (mmHg)
Study Treatment Control WMD (fixed) Weight WMD (fixed)or sub-category n n Mean (SD)Mean (SD)
01 600 kcal/day deficit or low fatFDPS, 2001 256 –5.00 (14.00) 250 –1.00 (15.00) 38.80 –4.00 (–6.53 to –1.47)ODES, 1995 65 –5.90 (8.87) 43 –0.50 (11.15) 15.76 –5.40 (–9.37 to –1.43)Wood, 1991a 42 –3.60 (7.70) 39 –0.20 (6.60) 25.56 –3.40 (–6.52 to –0.28)Wood, 1991b 39 –5.40 (8.30) 40 0.10 (7.70) 19.89 –5.50 (–9.03 to –1.97)
Subtotal (95% CI) 402 372 100.00 –4.37 (–5.94 to –2.79)Test for heterogeneity: Chi2 = 1.11, df = 3 (p = 0.78), I2 = 0%Test for overall effect: z = 5.43 (p < 0.00001)
Total (95% CI) 402 372 100.00 –4.37 (–5.94 to –2.79)Test for heterogeneity: Chi2 = 1.11, df = 3 (p = 0.78), I2 = 0%Test for overall effect: z = 5.43 (p < 0.00001)
–10 –5 0 5 10
Favours treatment Favours control
(95% CI) (%) (95% CI)
FIGURE 133

effects on total cholesterol only, WMD–0.30 mmol/l (95% CI –0.58 to –0.02 mmol/l), but the number of participants in this study wassmall.
In the cluster RCT by Kaplan and colleagues,178
mean body weight in the groups ranged from 83.9 to 92.2 kg. All participants received an equalnumber of contacts and an active initial treatmentperiod of 10 weeks. LCD plus behaviour therapywas associated with a mean weight change at 18 months of –1.68 kg, but weight change was notreported for the control group. At 18 months the
diet and behaviour group was associated with a mean change in HbA1c of –0.46% compared with 0.36% in the control group. Quality of well-being was also assessed, and was increased by0.03 units in the diet and behaviour group anddecreased by 0.04 units in the control group at 18 months.
No deaths or serious adverse events were reportedin any of the studies. Wing and colleagues176,177
reported that the risk of developing diabetes was7% in the control group and 30.3% in the diet andbehaviour therapy group.
Systematic review of RCTs
70
Comparison: 39 Diet + behaviour therapy vs control at 12 monthsOutcome: 01 Weight change (kg)
Study Treatment Control WMD (fixed) Weight WMD (fixed)or sub-category n nMean (SD) Mean (SD)
01 LCDHakala, 1989 37 –10.40 (8.86) 42 1.60 (6.37) 18.16 –12.00 (–15.44 to –8.56)Karvetti, 1992 93 –6.00 (7.61) 96 0.60 (6.08) 55.65 –6.60 (–8.57 to –4.63)
Subtotal (95% CI) 130 138 73.81 –7.93 (–9.64 to –6.22)Test for heterogeneity: Chi2 = 7.12, df = 1 (p = 0.008), I2 = 86.0%Test for overall effect: z = 9.10 (p < 0.00001)
02 VLCDWing, 1998 33 –5.50 (6.90) 29 –0.30 (4.50) 26.19 –5.20 (–8.07 to 2.33)
Subtotal (95% CI) 33 29 26.19 –5.20 (–8.07 to –2.33)Test for heterogeneity: not applicableTest for overall effect: z = 3.55 (p = 0.0004)
Total (95% CI) 163 167 100.00 –7.21 (–8.68 to –5.75)Test for heterogeneity: Chi2 = 9.69, df = 2 (p = 0.008), I2 = 79.4%Test for overall effect: z = 9.63 (p < 0.00001)
–10 –5 0 5 10
Favours treatment Favours control
(95% CI) (%) (95% CI)
FIGURE 134
Comparison: 40 Diet + behaviour therapy vs control at 24 monthsOutcome: 01 Weight change (kg)
Study Treatment Control WMD (fixed) Weight WMD (fixed)or sub-category n nMean (SD) Mean (SD)
01 VLCDWing, 1998 35 –2.10 (7.60) 31 –0.30 (4.50) 100.00 –1.80 (–4.77 to 1.17)
Subtotal (95% CI) 35 31 100.00 –1.80 (–4.77 to 1.17)Test for heterogeneity: not applicableTest for overall effect: z = 1.19 (p = 0.24)
Total (95% CI) 35 31 100.00 –1.80 (–4.77 to 1.17)Test for heterogeneity: not applicableTest for overall effect: z = 1.19 (p = 0.24)
–10 –5 0 5 10
Favours treatment Favours control
(95% CI) (%) (95% CI)
FIGURE 135

Health Technology Assessment 2004; Vol. 8: No. 21
71
© Queen’s Printer and Controller of HMSO 2004. All rights reserved.
Comparison: 39 Diet + behaviour therapy vs control at 12 monthsOutcome: 02 Change in total cholesterol (mmol/l)
Study Treatment Control WMD (fixed) Weight WMD (fixed)or sub-category n nMean (SD) Mean (SD)
01 LCDHakala, 1989 37 –0.37 (1.08) 42 –0.12 (1.08) 19.52 –0.25 (–0.73 to 0.23)Karvetti, 1992a 71 0.20 (1.08) 76 0.30 (1.08) 36.43 –0.10 (–0.45 to 0.25)Karvetti, 1992b 22 0.20 (1.08) 20 0.20 (1.08) 10.40 0.00 (–0.65 to 0.65)
Subtotal (95% CI) 130 138 66.35 –0.13 (–0.39 to 0.13)Test for heterogeneity: Chi2 = 0.42, df = 2 (p = 0.81), I2 = 0%Test for overall effect: z = 0.97 (p = 0.33)
02 VLCDWing 1998 33 0.26 (0.76) 29 0.39 (0.70) 33.65 –0.13 (–0.49 to 0.23)
Subtotal (95% CI) 33 29 33.65 –0.13 (–0.49 to 0.23)Test for heterogeneity: not applicableTest for overall effect: z = 0.70 (p = 0.48)
Total (95% CI) 163 167 100.00 –0.13 (–0.34 to 0.08)Test for heterogeneity: Chi2 = 0.42, df = 3 (p = 0.94), I2 = 0%Test for overall effect: z = 1.20 (p = 0.23)
Favours treatment Favours control
(95% CI) (%) (95% CI)
–1 –0.5 0 0.5 1
FIGURE 136
Comparison: 40 Diet + behaviour therapy vs control at 24 months Outcome: 02 Change in total cholesterol (mmol/l)
Study Treatment Control WMD (fixed) Weight WMD (fixed)or sub-category n nMean (SD) Mean (SD)
01 VLCDWing, 1998 35 –0.12 (0.61) 31 0.18 (0.53) 100.00 –0.30 (–0.58 to –0.02)
Subtotal (95% CI) 35 31 100.00 –0.30 (–0.58 to –0.02)Test for heterogeneity: not applicableTest for overall effect: z = 2.14 (p = 0.03)
Total (95% CI) 35 31 100.00 –0.30 (–0.58 to –0.02)Test for heterogeneity: not applicableTest for overall effect: z = 2.14 (p = 0.03)
Favours treatment Favours control
(95% CI) (%) (95% CI)
–1 –0.5 0 0.5 1
FIGURE 137
Comparison: 39 Diet + behaviour therapy vs control at 12 months Outcome: 07 Change in LDL cholesterol (mmol/l)
Study Treatment Control WMD (fixed) Weight WMD (fixed)or sub-category n nMean (SD) Mean (SD)
01 VLCDWing, 1998 33 0.12 (0.73) 29 0.24 (0.66) 100.00 –0.12 (–0.47 to 0.23)
Subtotal (95% CI) 33 29 100.00 –0.12 (–0.47 to 0.23)Test for heterogeneity: not applicableTest for overall effect: z = 0.68 (p = 0.50)
Total (95% CI) 33 29 100.00 –0.12 (–0.47 to 0.23)Test for heterogeneity: not applicableTest for overall effect: z = 0.68 (p = 0.50)
Favours treatment Favours control
(95% CI) (%) (95% CI)
–1 –0.5 0 0.5 1
FIGURE 138

Systematic review of RCTs
72
Comparison: 40 Diet + behaviour therapy vs control at 24 monthsOutcome: 03 Change in LDL cholesterol (mmol/l)
Study Treatment Control WMD (fixed) Weight WMD (fixed)or sub-category n nMean (SD) Mean (SD)
01 VLCDWing, 1998 35 –0.16 (0.63) 312 0.03 (0.46) 100.00 –0.19 (–0.40 to 0.02)
Subtotal (95% CI) 35 312 100.00 –0.19 (–0.40 to 0.02)Test for heterogeneity: not applicableTest for overall effect: z = 1.73 (p = 0.08)
Total (95% CI) 35 312 100.00 –0.19 (–0.40 to 0.02)Test for heterogeneity: not applicableTest for overall effect: z = 1.73 (p = 0.08)
Favours treatment Favours control
(95% CI) (%) (95% CI)
–1 –0.5 0 0.5 1
FIGURE 139
Comparison: 39 Diet + behaviour therapy vs control at 12 months Outcome: 03 Change in HDL cholesterol (mmol/l)
Study Treatment Control WMD (fixed) Weight WMD (fixed)or sub-category n nMean (SD) Mean (SD)
01 LCDHakala, 1989 37 0.17 (0.29) 42 –0.07 (0.29) 16.73 0.24 (0.11 to 0.37)Karvetti, 1992a 71 0.18 (0.29) 76 0.04 (0.29) 31.22 0.14 (0.05 to 0.23)Karvetti, 1992b 22 0.25 (0.29) 20 0.02 (0.29) 8.91 0.23 (0.05 to 0.41)
Subtotal (95% CI) 130 138 56.87 0.18 (0.11 to 0.25)Test for heterogeneity: Chi2 = 1.84, df = 2 (p = 0.40), I2 = 0%Test for overall effect: z = 5.17 (p < 0.00001)
02 VLCDWing, 1998 33 0.10 (0.16) 29 0.08 (0.16) 43.13 0.02 (–0.06 to 0.10)
Subtotal (95% CI) 33 29 43.13 0.02 (–0.06 to 0.10)Test for heterogeneity: not applicableTest for overall effect: z = 0.49 (p = 0.62)
Total (95% CI) 163 167 100.00 0.11 (0.06 to 0.17)Test for heterogeneity: Chi2 = 11.01, df = 3 (p = 0.01), I2 = 72.8%Test for overall effect: z = 4.22 (p < 0.0001)
Favours control Favours treatment
(95% CI) (%) (95% CI)
–0.5 –0.25 0 0.25 0.5
FIGURE 140
Comparison: 40 Diet + behaviour therapy vs control at 24 months Outcome: 04 Change in HDL cholesterol (mmol/l)
Study Treatment Control WMD (fixed) Weight WMD (fixed)or sub-category n nMean (SD) Mean (SD)
01 VLCDWing, 1998 35 0.02 (0.20) 31 0.04 (0.24) 100.00 –0.02 (–0.13 to 0.09)
Subtotal (95% CI) 35 31 100.00 –0.02 (–0.13 to 0.09)Test for heterogeneity: not applicableTest for overall effect: z = 0.37 (p = 0.72)
Total (95% CI) 35 31 100.00 –0.02 (–0.13 to 0.09)Test for heterogeneity: not applicableTest for overall effect: z = 0.37 (p = 0.72)
Favours control Favours treatment
(95% CI) (%) (95% CI)
–0.5 –0.25 0 0.25 0.5
FIGURE 141

Health Technology Assessment 2004; Vol. 8: No. 21
73
© Queen’s Printer and Controller of HMSO 2004. All rights reserved.
Comparison: 39 Diet + behaviour therapy vs control at 12 months Outcome: 04 Change in tryglycerides (mmol/l)
Study Treatment Control WMD (fixed) Weight WMD (fixed)or sub-category n nMean (SD) Mean (SD)
01 LCDHakala, 1989 37 –0.47 (0.96) 42 0.18 (0.96) 91.18 –0.65 (–1.07 to –0.23)
Subtotal (95% CI) 37 42 91.18 –0.65 (–1.07 to –0.23)Test for heterogeneity: not applicableTest for overall effect: z = 3.00 (p = 0.003)
02 VLCDWing, 1998 33 0.55 (3.77) 29 0.40 (1.25) 8.82 0.15 (–1.21 to 1.51)
Subtotal (95% CI) 33 29 8.82 0.15 (–1.21 to 1.51)Test for heterogeneity: not applicableTest for overall effect: z = 0.22 (p = 0.83)
Total (95% CI) 70 71 100.00 –0.58 (–0.98 to –0.17)Test for heterogeneity: Chi2 = 1.20, df = 1 (p = 0.27), I2 = 17.0%Test for overall effect: z = 2.80 (p = 0.005)
Favours treatment Favours control
(95% CI) (%) (95% CI)
–4 –2 0 2 4
FIGURE 142
Comparison: 40 Diet + behaviour therapy vs control at 24 months Outcome: 05 Change in triglycerides (mmol/l)
Study Treatment Control WMD (fixed) Weight WMD (fixed)or sub-category n n Mean (SD)Mean (SD)
01 VLCDWing, 1998 35 0.19 (2.42) 31 0.52 (1.14) 100.00 –0.33 (–1.23 to 0.57)
Subtotal (95% CI) 35 31 100.00 –0.33 (–1.23 to 0.57)Test for heterogeneity: not applicableTest for overall effect: z = 0.72 (p = 0.47)
Total (95% CI) 35 31 100.00 –0.33 (–1.23 to 0.57)Test for heterogeneity: not applicableTest for overall effect: z = 0.72 (p = 0.47)
Favours treatment Favours control
(95% CI) (%) (95% CI)
–4 –2 0 2 4
FIGURE 143
Comparison: 40 Diet + behaviour therapy vs control at 24 months Outcome: 08 Change in HbA1c%
Study Treatment Control WMD (fixed) Weight WMD (fixed)or sub-category n nMean (SD) Mean (SD)
01 VLCDWing, 1998 35 –0.10 (0.50) 31 –0.10 (0.30) 100.00 0.00 (–0.20 to 0.20)
Subtotal (95% CI) 35 31 100.00 0.00 (–0.20 to 0.20)Test for heterogeneity: not applicableTest for overall effect: z = 0.00 (p = 1.00)
Total (95% CI) 35 31 100.00 0.00 (–0.20 to 0.20)Test for heterogeneity: not applicableTest for overall effect: z = 0.00 (p = 1.00)
Favours treatment Favours control
(95% CI) (%) (95% CI)
–1 –0.5 0 0.5 1
FIGURE 144

Systematic review of RCTs
74
Comparison: 39 Diet + behaviour therapy vs control at 12 months Outcome: 08 Change in fasting plasma glucose (mmol/l)
Study Treatment Control WMD (fixed) Weight WMD (fixed)or sub-category n nMean (SD) Mean (SD)
01 VLCDWing, 1998 33 0.20 (0.80) 29 0.00 (0.60) 100.00 0.20 (–0.15 to 0.55)
Subtotal (95% CI) 33 29 100.00 0.20 (–0.15 to 0.55)Test for heterogeneity: not applicableTest for overall effect: z = 1.12 (p = 0.3)
Total (95% CI) 33 29 100.00 0.20 (–0.15 to 0.55)Test for heterogeneity: not applicableTest for overall effect: z = 1.12 (p = 0.3)
Favours treatment Favours control
(95% CI) (%) (95% CI)
–1 –0.5 0 0.5 1
FIGURE 145
Comparison: 40 Diet + behaviour therapy vs control at 24 months Outcome: 09 Change in fasting plasma glucose (mmol/l)
Study Treatment Control WMD (fixed) Weight WMD (fixed)or sub-category n nMean (SD) Mean (SD)
01 VLCDWing, 1998 35 0.30 (1.00) 31 0.20 (0.40) 100.00 0.10 (–0.26 to 0.46)
Subtotal (95% CI) 35 31 100.00 0.10 (–0.26 to 0.46)Test for heterogeneity: not applicableTest for overall effect: z = 0.54 (p = 0.59)
Total (95% CI) 35 31 100.00 0.10 (–0.26 to 0.46)Test for heterogeneity: not applicableTest for overall effect: z = 0.54 (p = 0.59)
Favours treatment Favours control
–1 –0.5 0 0.5 1
(95% CI) (%) (95% CI)
FIGURE 146
Comparison: 39 Diet + behaviour therapy vs control at 12 monthsOutcome: 06 Change in DBP (mmHg)
Study Treatment Control WMD (fixed) Weight WMD (fixed)or sub-category n nMean (SD) Mean (SD)
01 LCDHakala, 1989 37 –4.70 (8.30) 42 1.60 (8.30) 23.90 –6.30 (–9.97 to –2.63)Karvetti, 1992a 69 –6.00 (8.30) 76 –3.00 (8.30) 43.94 –3.00 (–5.71 to –0.29)Karvetti, 1992b 22 –7.00 (8.30) 20 –5.00 (8.30) 12.73 –2.00 (–7.03 to 3.03)
Subtotal (95% CI) 128 138 80.57 –3.82 (–5.82 to –1.82)Test for heterogeneity: Chi2 = 2.61, df = 2 (p = 0.27), I2 = 23.5%Test for overall effect: z = 3.75 (p = 0.0002)
02 VLCDWing, 1998 33 3.40 (8.10) 29 4.90 (8.20) 19.43 –1.50 (–5.57 to 2.57)
Subtotal (95% CI) 33 29 19.43 –1.50 (–5.57 to 2.57)Test for heterogeneity: not applicableTest for overall effect: z = 0.72 (p = 0.47)
Total (95% CI) 161 167 100.00 –3.37 (–5.16 to –1.58)Test for heterogeneity: Chi2 = 3.62, df = 3 (p = 0.31), I2 = 17.1%Test for overall effect: z = 3.68 (p = 0.0002)
–10 –5 0 5 10
Favours treatment Favours control
(95% CI) (%) (95% CI)
FIGURE 147

Health Technology Assessment 2004; Vol. 8: No. 21
75
© Queen’s Printer and Controller of HMSO 2004. All rights reserved.
Comparison: 40 Diet + behaviour therapy vs control at 24 months Outcome: 07 Change in DBP (mmHg)
Study Treatment Control WMD (fixed) Weight WMD (fixed)or sub-category n nMean (SD) Mean (SD)
01 VLCDWing, 1998 35 3.00 (7.80) 31 2.00 (8.00) 100.00 1.00 (–2.82 to 4.82)
Subtotal (95% CI) 35 31 100.00 1.00 (–2.82 to 4.82)Test for heterogeneity: not applicableTest for overall effect: z = 0.51 (p = 0.61)
Total (95% CI) 35 31 100.00 1.00 (–2.82 to 4.82)Test for heterogeneity: not applicableTest for overall effect: z = 0.51 (p = 0.61)
–10 –5 0 5 10
Favours treatment Favours control
(95% CI) (%) (95% CI)
FIGURE 148
Comparison: 39 Diet + behaviour therapy vs control at 12 monthsOutcome: 05 Change in SBP (mmHg)
Study Treatment Control WMD (fixed) Weight WMD (fixed)or sub-category n n Mean (SD)Mean (SD)
01 LCDHakala, 1989 37 –6.30 (12.70) 42 0.20 (12.70) 20.29 –6.50 (–12.11 to –0.89)Karvetti, 1992a 69 –6.00 (12.70) 76 0.00 (12.70) 37.31 –6.00 (10.14 to –1.86)Karvetti, 1992b 22 0.00 (12.70) 20 –1.00 (12.70) 10.81 1.00 (–6.69 to 8.69)
Subtotal (95% CI) 128 138 68.40 –5.04 (–8.10 to –1.99)Test for heterogeneity: Chi2 = 2.84, df = 2 (p = 0.24), I2 = 29.5%Test for overall effect: z = 3.23 (p = 0.001)
02 VLCDWing, 1998 33 1.30 (8.30) 29 1.10 (9.60) 31.60 0.20 (–4.30 to 4.70]
Subtotal (95% CI) 33 29 31.60 0.20 (–4.30 to 4.70)Test for heterogeneity: not applicableTest for overall effect: z = 0.09 (p = 0.93)
Total (95% CI) 161 167 100.00 –3.39 (–5.91 to –0.86)Test for heterogeneity: Chi2 = 6.41, df = 3 (p = 0.09), I2 = 53.2%Test for overall effect: z = 2.63 (p = 0.009)
–10 –5 0 5 10
Favours treatment Favours control
(95% CI) (%) (95% CI)
FIGURE 149
(95% CI) (%) (95% CI)
Comparison: 40 Diet + behaviour therapy vs control at 24 monthsOutcome: 06 Change in SBP (mmHg)
Study Treatment Control WMD (fixed) Weight WMD (fixed)or sub-category n n Mean (SD)Mean (SD)
01 VLCDWing, 1998 35 –0.80 (9.40) 31 –1.50 (12.00) 100.00 0.70 (–4.55 to 5.95)
Subtotal (95% CI) 35 31 100.00 0.70 (–4.55 to 5.95)Test for heterogeneity: not applicableTest for overall effect: z = 0.26 (p = 0.79)
Total (95% CI) 35 31 100.00 0.70 (–4.55 to 5.95)Test for heterogeneity: not applicableTest for overall effect: z = 0.26 (p = 0.79)
–10 –5 0 5 10
Favours treatment Favours control
FIGURE 150

Effects of surgery and diet andbehaviour therapy versus surgeryDescription of studyOne RCT compared the effect of behaviourtherapy and dietary information with minimalintervention after bariatric surgery.179 Change inweight at 12 and 24 months was provided, but nodata were provided for risk factors.
It was unclear whether an ITT analysis had beenused. Dropouts were 47% overall at 2 years. MeanBMI was 48.9 kg/m2 in the group receiving dietand behaviour therapy postsurgery and 47.6 kg/m2
in the minimal treatment group post-surgery.Participants were randomly assigned to treatmentgroups preoperatively and both groups werecontacted the same number of times.
Review resultsAt 12 months diet and behaviour therapycompared with the minimal intervention wasassociated with a WMD weight change of –10.03 kg
(95% CI –22.29 to 2.23 kg) and at 24 months of–10.56 kg (95% CI –23.17 to 2.05 kg). Thenumber of participants in the study was small(Figures 151 and 152).
Effects of diet and behaviour therapyand exercise versus controlDescription of studiesTwelve RCTs provided change in weight at 12 months or longer.176–178,180–224 Of these 12 studies, ten provided change in weight at 12 months.176,177,180–196,204–224 Five studies providedchange in weight at 18 months,178,182–186,197–224
four studies at 24 months,176,177,187–193,204–224 twostudies at 30 months182–186,210–224 and one study at36 months.204–209
Data were provided for lipids, blood pressure,fasting plasma glucose and HbA1c at 12 and 24 months. Data on blood pressure were alsoprovided at 18 and 36 months. One cluster RCTprovided change in HbA1c at 18 months.178
Systematic review of RCTs
76
Comparison: 41 Surgery + diet + behaviour therapy vs surgery at 12 monthsOutcome: 01 Weight change (kg)
Study Treatment Control WMD (fixed) Weight WMD (fixed)or sub-category n nMean (SD) Mean (SD)
01 600 kcal/day deficit or low fatTucker, 1991 17 –46.64 (19.11) 15 –36.61 (16.28) 100.00 –10.03 (–22.29 to 2.23)
Subtotal (95% CI) 17 15 100.00 –10.03 (–22.29 to 2.23)Test for heterogeneity: not applicableTest for overall effect: z = 1.60 (p = 0.11)
Total (95% CI) 17 15 100.00 –10.03 (–22.29 to 2.23)Test for heterogeneity: not applicableTest for overall effect: z = 1.60 (p = 0.11)
Favours treatment Favours control
–100 –50 0 50 100
(95% CI) (%) (95% CI)
FIGURE 151
Comparison: 42 Surgery + diet + behaviour therapy vs surgery at 24 months Outcome: 01 Weight change (kg)
Study Treatment Control WMD (fixed) Weight WMD (fixed)or sub-category n nMean (SD) Mean (SD)
01 600 kcal/day deficit or low fatTucker, 1991 17 –48.68 (19.69) 15 –38.12 (16.70) 100.00 –10.56 (23.17 to 2.05)
Subtotal (95% CI) 17 15 100.00 –10.56 (23.17 to 2.05)Test for heterogeneity: not applicableTest for overall effect: z = 1.64 (p = 0.10)
Total (95% CI) 17 15 100.00 –10.56 (–23.17 to 2.05)Test for heterogeneity: not applicableTest for overall effect: z = 1.64 (p = 0.10)
Favours treatment Favours control
(95% CI) (%) (95% CI)
–100 –50 0 50 100
FIGURE 152

Two studies evaluated a population withhypertension181,210–224 and two studies evaluatedpeople with high–normal blood pressure.197–209
Two studies recruited people with type 2diabetes,178,187–193 and another study recruitedpeople with one or two biological parents with type 2 diabetes.176,177 One study recruitedpeople with abnormal oral glucose tolerancetests.194
Eleven of the studies recruited both genders, and one study recruited women only.180 One study recruited married Mexican–Americanwomen with at least one preschool-aged child180
and one study recruited Pima Indians fromArizona.195
Two studies assessed participants using an ITTapproach.176,177,196 It was unclear whether thisapproach had been used in another sixstudies.178,181–193,197–209
In two studies baseline weight appeared to differbetween groups.181,196 A high dropout rate at 12 months of 49% overall was reported in thestudy by Cousins and colleagues.180 Reportedmean BMI ranged from 30.2 kg/m2 194 to36.5 kg/m2 195 and reported mean body weightranged from 80 kg181 to 93.6 kg.204–209
The duration of active treatment was 10 weeks forone study,178 12 months for five studies180,181,187–195
and ranged from 18 months to 36 months for fivestudies.176,177,182–186,197–224
The control arms in most of the studies receivedconsiderably less contact compared with the activetreatment, except in the studies by Laitinen andcolleagues187–193 and Kaplan and colleagues.178
All control groups received minimal treatment,except for the study by Narayan and colleagues195
where the control group received 12 monthlygroup meetings to discuss Pima culture andactively contribute to newsletters, and Kaplan andcolleagues gave ten weekly informationpresentations on diabetes.178 Active treatmentranged from seven visits in 12 months187–193 to 53visits in 12 months.195 The study by Lindahl andcolleagues194 included one initial month’s fullboard in a wellness centre with a follow-up stay at12 months for the active treatment group. Thenumber of participants in each study varied from15 participants in one group196 to 596 in anothergroup.204–209
Seven studies used a 600 kcal/day deficit or low-fatdiet,187–224 four studies used an LCD178,180–186 and
one study used a VLCD for the initial 8 weeksthen an LCD.176,177
Review resultsDiet, behaviour therapy and exercise comparedwith control from 11 studies was associated with anoverall WMD weight change at 12 months of–4.00 kg (95% CI –4.47 to –3.54 kg) (Figure 153).There was evidence of statistical heterogeneity,such that the results should be particularly treatedwith caution. The VLCD was associated withgreater weight loss than the 600 kcal/day deficit orlow-fat diets, but data were only derived from oneVLCD study. Only one study was associated with aweight gain in the active treatment group.195 Diet,behaviour therapy and exercise in four trials wasassociated with an overall WMD weight change at18 months of –3.40 kg (95% CI –3.84 to –2.97 kg)and at 24 months of –3.00 kg (95% CI –3.59 to–2.40 kg) (Figures 154 and 155).
Diet, behaviour therapy and exercise wasassociated with a WMD weight change at 30months of –4.68 kg (95% CI –6.08 to –3.28 kg, twotrials) and at 36 months of –2.00 kg (95% CI –2.66to –1.34 kg, one trial) (Figures 156 and 157).
At 12 months and at 18 months diet, behaviourtherapy and exercise was associated with asignificant beneficial effect on DBP and SBP(Figures 158–165). Changes in blood pressure wereno longer statistically significant at 24 months, butwere significant for SBP at 36 months and ofborderline significance for DBP at 36 months.Triglycerides were also significantly decreased at12 and 24 months, and HDL cholesterolsignificantly increased at 12 months (Figures166–177).
Results for risk factors in people with hypertensionor type 2 diabetes are presented in Tables 7 and 8.
In the cluster RCT by Kaplan and colleagues,178
the authors reported that at 18 monthsparticipants’ weight was “essentially constant” inthe LCD, behaviour therapy and exercise group.Change in weight was not reported for the controlgroup at 18 months. At 18 months the diet,behaviour therapy and exercise group wasassociated with a mean change in HbA1c of –1.48% compared with 0.36% in the control group. The authors reported that for 100participants receiving the diet, exercise andbehaviour therapy programme 4.7 well-years wouldbe produced, compared with the control (0.047well-years for each participant, where 0 = death and 1 = optimal function).178
Health Technology Assessment 2004; Vol. 8: No. 21
77
© Queen’s Printer and Controller of HMSO 2004. All rights reserved.

Systematic review of RCTs
78
Comparison: 43 Diet + behaviour therapy + exercise vs control at 12 months Outcome: 01 Weight change (kg)
Study Treatment Control WMD (fixed) Weight WMD (fixed)or sub–category n nMean (SD) Mean (SD)
01 600 kcal/day deficit or low fatLaitinen, 1993 40 –1.80 (3.39) 46 1.00 (3.36) 10.50 –2.80 (–4.23 to –1.37) Lindahl, 1999 93 –5.40 (4.44) 93 –0.50 (2.75) 19.07 –4.90 (–5.96 to –3.84) Narayan, 1998 45 2.50 (6.62) 45 0.80 (6.14) 3.09 1.70 (–0.94 to 4.34) Ost, 1976 11 –4.60 (6.20) 11 –2.40 (5.30) 0.92 –2.20 (–7.02 to 2.62) TOHP II, 1997 545 –3.33 (6.86) 551 0.53 (6.06) 36.56 –3.86 (–4.63 to –3.09) TONE, 1998 133 –5.36 (4.56) 125 –0.48 (3.24) 23.28 –4.88 (–5.84 to –3.92)
Subtotal (95% CI) 867 871 93.42 –4.01 (–4.49 to –3.53)Test for heterogeneity: Chi2 = 27.28, df = 5 (p < 0.0001), I2 = 81.7%Test for overall effect: z = 16.38 (p < 0.00001)
02 LCDCousins, 1992 32 –2.10 (6.51) 27 –0.70 (6.11) 2.07 –1.40 (–4.62 to 1.82) Jalkanen, 1991 24 –4.00 (7.05) 25 0.00 (5.92) 1.61 –4.00 (–7.65 to –0.35) Jeffery, 1993 24 –5.87 (7.58) 27 –1.51 (6.34) 1.44 –4.36 (–8.22 to –0.50)
Subtotal (95% CI) 80 79 5.12 –3.05 (–5.10 to –1.00)Test for heterogeneity: Chi2 = 1.71, df = 2 (p = 0.43), I2 = 0%Test for overall effect: z = 2.92 (p = 0.004)
03 VLCDWing, 1998 30 –7.40 (9.70) 29 –0.30 (4.50) 1.46 –7.10 (–10.94 to –3.26)
Subtotal (95% CI) 30 29 1.46 –7.10 (–10.94 to –3.26)Test for heterogeneity: not applicableTest for overall effect: z = 3.63 (p = 0.0003)
Total (95% CI) 977 979 100.00 –4.00 (–4.47 to –3.54)Test for heterogeneity: Chi2 = 32.32, df = 9 (p = 0.0002), I2 = 72.2%Test for overall effect: z = 16.93 (p < 0.00001)
–10 –5 0 5 10
Favours treatment Favours control
(95% CI) (%) (95% CI)
FIGURE 153
Comparison: 44 Diet + behaviour therapy + exercise vs control at 18 months Outcome: 01 Weight change (kg)
Study Treatment Control WMD (fixed) Weight WMD (fixed)or sub-category n nMean (SD) Mean (SD)
01 600 kcal/day deficit or low fatTOHP I, 1992 293 –3.83 (6.12) 235 0.07 (4.01) 25.49 –3.90 (–4.77 to –3.03)TOHP II, 1997 545 –2.00 (5.80) 551 0.70 (4.20) 53.38 –2.70 (–3.30 to –2.10)
TONE, 1998 131 –4.77 (4.52) 122 –0.21 (3.44) 19.78 –4.56 (–5.55 to –3.57)Subtotal (95% CI) 969 908 98.65 –3.38 (–3.82 to –2.94)Test for heterogeneity: Chi2 = 11.81, df = 2 (p = 0.003), I2 = 83.1%Test for overall effect: z = 15.02 (p < 0.00001)
02 LCDJeffery, 1993 24 –5.55 (7.49) 27 –0.62 (6.09) 1.35 –4.93 (–8.71 to –1.15)
Subtotal (95% CI) 24 27 1.35 –4.93 (–8.71 to –1.15)Test for heterogeneity: not applicableTest for overall effect: z = 2.56 (p = 0.01)
Total (95% CI) 993 935 100.00 –3.40 (–3.84 to –2.97)Test for heterogeneity: Chi2 = 12.45, df = 3 (p = 0.006), I2 = 75.9%Test for overall effect: z = 15.22 (p < 0.00001)
–10 –5 0 5 10
Favours treatment Favours control
(95% CI) (%) (95% CI)
FIGURE 154

In the study by Wing and colleagues,176,177 two outof 40 control participants and five out of 40participants assigned diet, exercise and behaviourtherapy developed type 2 diabetes mellitus at 2 years.
Two participants with MI were reported in theactive treatment group and four in the controlgroup (which includes non-obese participants) ofthe Trial of Non-pharmacological Interventions inthe Elderly (TONE) study.210–224 Two participants
Health Technology Assessment 2004; Vol. 8: No. 21
79
© Queen’s Printer and Controller of HMSO 2004. All rights reserved.
Comparison: 45 Diet + behaviour therapy + exercise vs control at 24 monthsOutcome: 01 Weight change (kg)
Study Treatment Control WMD (fixed) Weight WMD (fixed)or sub-category n nMean (SD) Mean (SD)
01 600 kcal/day deficit or low fatLaitinen, 1993a 18 –5.10 (7.36) 18 –2.90 (6.74) 1.68 –2.20 (–6.81 to 2.41)Laitinen, 1993b 20 –6.30 (7.70) 26 –2.60 (6.65) 1.99 –3.70 (–7.93 to 0.53)TOHP II, 1997 545 –1.22 (6.26) 551 1.17 (6.25) 64.99 –2.39 (–3.13 to –1.65) TONE, 1998 104 –4.58 (4.55) 95 –0.09 (3.53) 28.10 –4.49 (–5.62 to –3.36)
Subtotal (95% CI) 687 690 96.75 –3.02 (–3.63 to –2.42)Test for heterogeneity: Chi2 = 9.54, df = 3 (p = 0.02), I2 = 68.6%Test for overall effect: z = 9.76 (p < 0.00001)
02 VLCDWing, 1998 32 –2.50 (8.40) 31 –0.30 (4.50) 3.25 –2.20 (–5.51 to 1.11)
Subtotal (95% CI) 32 31 3.25 –2.20 (–5.51 to 1.11)Test for heterogeneity: not applicableTest for overall effect: z = 1.30 (p = 0.19)
Total (95% CI) 719 721 100.00 –3.00 (–3.59 to –2.40)Test for heterogeneity: Chi2 = 9.77, df = 4 (p = 0.04), I2 = 59.1%Test for overall effect: z = 9.84 (p < 0.00001)
–10 –5 0 5 10
Favours treatment Favours control
(95% CI) (%) (95% CI)
FIGURE 155
Comparison: 46 Diet + behaviour therapy + exercise vs control at 30 monthsOutcome: 01 Weight change (kg)
Study Treatment Control WMD (fixed) Weight WMD (fixed)or sub-category n nMean (SD) Mean (SD)
01 600 kcal/day deficit or low fatTONE, 1998 60 –4.99 (4.11) 53 –0.05 (4.17) 84.18 –4.94 (–6.47 to –3.41)
Subtotal (95% CI) 60 53 84.18 –4.94 (–6.47 to –3.41)Test for heterogeneity: not applicableTest for overall effect: z = 6.33 (p < 0.00001)
02 LCDJeffery, 1993 24 –3.05 (6.78) 27 0.25 (5.99) 15.82 –3.30 (–6.83 to 0.23)
Subtotal (95% CI) 24 27 15.82 –3.30 (–6.83 to 0.23)Test for heterogeneity: not applicableTest for overall effect: z = 1.83 (p = 0.07)
Total (95% CI) 84 80 100.00 –4.68 (–6.08 to –3.28)Test for heterogeneity: Chi2 = 0.70, df = 1 (p = 0.40), I2 = 0%Test for overall effect: z = 6.53 (p < 0.00001)
–10 –5 0 5 10
Favours treatment Favours control
(95% CI) (%) (95% CI)
FIGURE 156

with cerebrovascular accident were also reportedin the control group (which includes non-obeseparticipants), and none in the intervention group. In the TONE study the hazard ratio for the primary end-point (recurrence ofhypertension or cardiovascular events) was 0.65
(95% CI 0.50 to 0.85%) for those randomised toweight loss alone compared with controls. Oneparticipant with breast cancer and one withpancreatic cancer were reported, but it was unclear which groups these people came from.
Systematic review of RCTs
80
Comparison: 47 Diet + behaviour therapy + exercise vs control at 36 monthsOutcome: 01 Weight change (kg)
Study Treatment Control WMD (fixed) Weight WMD (fixed)or sub-category n nMean (SD) Mean (SD)
01 600 kcal/day deficit or low fatTOHP II, 1997 547 –0.20 (5.90) 554 1.80 (5.30) 100.00 –2.00 (–2.66 to –1.34)
Subtotal (95% CI) 547 554 100.00 –2.00 (–2.66 to –1.34)Test for heterogeneity: not applicableTest for overall effect: z = 5.91 (p < 0.00001)
Total (95% CI) 547 554 100.00 –2.00 (–2.66 to –1.34)Test for heterogeneity: not applicableTest for overall effect: z = 5.91 (p < 0.00001)
–10 –5 0 5 10
Favours treatment Favours control
(95% CI) (%) (95% CI)
FIGURE 157
Comparison: 43 Diet + behaviour therapy + exercise vs control at 12 monthsOutcome: 03 Change in DBP (mmHg)
Study Treatment Control WMD (fixed) Weight WMD (fixed)or sub-category n nMean (SD) Mean (SD)
01 600 kcal/day deficit or low fatLaitinen, 1993 40 –4.00 (6.78) 46 –1.00 (5.85) 13.04 –3.00 (–5.70 to –0.30) Lindahl, 1999 93 –3.20 (7.41) 93 –0.80 (7.41) 20.90 –2.40 (–4.53 to –0.27) Narayan, 1998 45 1.10 (8.30) 45 –1.00 (8.30) 8.06 2.10 (–1.33 to 5.53) TOHP I, 1992 287 –5.40 (8.47) 237 –3.10 (7.70) 49.35 –2.30 (–3.69 to –0.91)
Subtotal (95% CI) 465 421 91.35 –2.03 (–3.05 to –1.02)Test for heterogeneity: Chi2 = 6.33, df = 3 (p = 0.10), I2 = 52.6%Test for overall effect: z = 3.91 (p < 0.0001)
02 LCDJalkanen, 1991 24 –11.00 (8.30) 25 –11.00 (8.30) 4.39 0.00 (–4.65 to 4.65)
Subtotal (95% CI) 24 25 4.39 0.00 (–4.65 to 4.65)Test for heterogeneity: not applicableTest for overall effect: z = 0.00 (p = 1.00)
03 VLCDWing, 1998 30 –1.00 (10.20) 29 4.90 (8.20) 4.27 –5.90 (–10.61 to –1.19)
Subtotal (95% CI) 30 29 4.27 –5.90 (–10.61 to –1.19)Test for heterogeneity: not applicableTest for overall effect: z = 2.45 (p = 0.01)
Total (95% CI) 519 475 100.00 –2.11 (–3.08 to –1.14)Test for heterogeneity: Chi2 = 9.62, df = 5 (p = 0.09), I2 = 48.0%Test for overall effect: z = 4.25 (p < 0.0001)
–10 –5 0 5 10
Favours treatment Favours control
(95% CI) (%) (95% CI)
FIGURE 158

Health Technology Assessment 2004; Vol. 8: No. 21
81
© Queen’s Printer and Controller of HMSO 2004. All rights reserved.
Comparison: 44 Diet + behaviour therapy + exercise vs control at 18 monthsOutcome: 03 Change in DBP (mmHg)
Study Treatment Control WMD (fixed) Weight WMD (fixed)or sub-category n nMean (SD) Mean (SD)
01 600 kcal/day deficit or low fatTOHP I, 1992 308 –6.16 (5.88) 256 –3.91 (6.12) 34.12 –2.25 (–3.25 to –1.25) TOHP II, 1997 533 –4.50 (6.10) 525 –3.20 (5.80) 65.88 –1.30 (–2.02 to –0.58)
Subtotal (95% CI) 841 781 100.00 –1.62 (–2.21 to –1.04)Test for heterogeneity: Chi2 = 2.30, df = 1 (p = 0.13), I2 = 56.5%Test for overall effect: z = 5.47 (p < 0.00001)
Total (95% CI) 841 781 100.00 –1.62 (–2.21 to –1.04)Test for heterogeneity: Chi2 = 2.30, df = 1 (p = 0.13), I2 = 56.5%Test for overall effect: z = 5.47 (p < 0.00001)
–10 –5 0 5 10
Favours treatment Favours control
(95% CI) (%) (95% CI)
FIGURE 159
Comparison: 45 Diet + behaviour therapy + exercise vs control at 24 months Outcome: 07 Change in DBP (mmHg)
Study Treatment Control WMD (fixed) Weight WMD (fixed)or sub-category n nMean (SD) Mean (SD)
01 VLCDWing, 1998 32 –0.20 (10.50) 31 2.00 (8.00) 100.00 –2.20 (–6.80 to 2.40)
Subtotal (95% CI) 32 31 100.00 –2.20 (–6.80 to 2.40)Test for heterogeneity: not applicableTest for overall effect: z = 0.94 (p = 0.35)
Total (95% CI) 32 31 100.00 –2.20 (–6.80 to 2.40)Test for heterogeneity: not applicableTest for overall effect: z = 0.94 (p = 0.35)
–10 –5 0 5 10
Favours treatment Favours control
(95% CI) (%) (95% CI)
FIGURE 160
Comparison: 47 Diet + behaviour therapy + exercise vs control at 36 monthsOutcome: 03 Change in DBP (mmHg)
Study Treatment Control WMD (fixed) Weight WMD (fixed)or sub-category n nMean (SD) Mean (SD)
01 600 kcal/day deficit or low fatTOHP II, 1997 527 –3.20 (6.50) 514 –2.40 (7.00) 100.00 –0.80 (–1.62 to 0.02)
Subtotal (95% CI) 527 514 100.00 –0.80 (–1.62 to 0.02)Test for heterogeneity: not applicableTest for overall effect: z = 1.91 (p = 0.06)
Total (95% CI) 527 514 100.00 –0.80 (–1.62 to 0.02)Test for heterogeneity: not applicableTest for overall effect: z = 1.91 (p = 0.06)
–10 –5 0 5 10
Favours treatment Favours control
(95% CI) (%) (95% CI)
FIGURE 161

One death was reported in the intervention groupand none in the control group of Trials ofHypertension Prevention (TOHP) I.197–203 Therelative risk for developing hypertension for theintervention group was 0.66 (95% CI 0.46 to 0.94%).
In TOHP II204–209 five people randomised to weightloss died (three cardiovascular disease deaths) andtwo people in the usual care group died. Therelative risk of developing hypertension for theweight loss group was 0.87 (p = 0.06) at 48 months.
Systematic review of RCTs
82
Comparison: 43 Diet + behaviour therapy + exercise vs control at 12 monthsOutcome: 02 Change in SBP (mmHg)
Study Treatment Control WMD (fixed) Weight WMD (fixed)or sub-category n nMean (SD) Mean (SD)
01 600 kcal/day deficit or low fatLaitinen, 1993 40 –3.00 (9.50) 46 1.00 (8.77) 6.41 –4.00 (–7.88 to –0.12) Lindahl, 1999 93 –4.90 (14.81) 93 1.30 (10.79) 6.98 –6.20 (–9.92 to –2.48) Narayan, 1998 45 6.00 (12.70) 45 4.10 (12.70) 3.51 1.90 (–3.35 to 7.15) TOHP I, 1992 287 –5.80 (6.78) 237 –3.80 (6.16) 78.64 –2.00 (–3.11 to –0.89)
Subtotal (95% CI) 465 421 95.54 –2.30 (–3.30 to –1.29)Test for heterogeneity: Chi2 = 7.69, df = 3 (p = 0.05), I2 = 61.0%Test for overall effect: z = 4.47 (p < 0.00001)
02 LCDJalkanen, 1991 24 –8.00 (12.70) 25 –15.00 (12.70) 1.91 7.00 (–0.11 to 14.11)
Subtotal (95% CI) 24 25 1.91 7.00 (–0.11 to 14.11)Test for heterogeneity: not applicableTest for overall effect: z = 1.93 (p = 0.05)
03 VLCDWing, 1998 30 –2.90 (14.20) 29 1.10 (9.60) 2.54 –4.00 (–10.17 to 2.17)
Subtotal (95% CI) 30 29 2.54 –4.00 (–10.17 to 2.17)Test for heterogeneity: not applicableTest for overall effect: z = 1.27 (p = 0.20)
Total (95% CI) 519 475 100.00 –2.16 (–3.15 to –1.18)Test for heterogeneity: Chi2 = 14.47, df = 5 (p = 0.01), I2 = 65.5%Test for overall effect: z = 4.31 (p < 0.0001)
–10 –5 0 5 10
Favours treatment Favours control
(95% CI) (%) (95% CI)
FIGURE 162
Comparison: 44 Diet + behaviour therapy + exercise vs control at 18 months Outcome: 02 Change in SBP (mmHg)
Study Treatment Control WMD (fixed) Weight WMD (fixed)or sub-category n nMean (SD) Mean (SD)
01 600 kcal/day deficit or low fatTOHP I, 1992 308 –5.35 (7.19) 256 –2.45 (7.37) 35.64 –2.90 (–4.11 to –1.69) TOHP II, 1997 533 –3.60 (7.90) 525 –1.80 (7.00) 64.36 –1.80 (–2.70 to –0.90)
Subtotal (95% CI) 841 781 100.00 –2.19 (–2.91 to –1.47)Test for heterogeneity: Chi2 = 2.05, df = 1 (p = 0.15), I2 = 51.2%Test for overall effect: z = 5.96 (p < 0.00001)
Total (95% CI) 841 781 100.00 –2.19 (–2.91 to –1.47)Test for heterogeneity: Chi2 = 2.05. df = 1 (p = 0.15), I2 = 51.2%Test for overall effect: z = 5.96 (p < 0.00001)
–10 –5 0 5 10
Favours treatment Favours control
(95% CI) (%) (95% CI)
FIGURE 163

Effects of family versus individualtreatmentDescription of studiesSeven RCTs assessed the effects of family versusindividual treatment and provided change inweight at 12 months or longer.180,225–231 Fourstudies provided change in weight at 12 months,180,225–228 two at 18 months,230,231 oneat 24 months,226,227 one at 43 months229 and oneat 48 months.226,227 Only the study by Wing andcolleagues230 provided data on risk factor changes (HbA1c and fasting plasma glucose at 18 months).
Three studies assessed change in weight using anITT approach226,227,229,231 and in one other studythis was possibly done.230 The treatment receivedby all participants in each study was similar exceptfor the mode of delivery, which was either family
based or individually based. The treatmentreceived across studies varied. Four studies usedLCD, behaviour therapy and exerciseinterventions for all participants.180,226,227,230,231
The study by Pearce and colleagues228 used anLCD and behaviour therapy, and only advisedparticipants to increase physical activity if weightwas not lost. Rosenthal and colleagues229 used a‘slim chance in a fat world’ weight loss programmeand behaviour therapy and Black and Lantz225
used behavioural contracts that focused onchanging eating and exercise habits.
Three studies recruited married women, with thefamily intervention arm consisting ofspouses.225,228,229 One study recruited marriedMexican–American women with at least onepreschool-aged child, with the family interventionarm consisting of spouses and separate classes for
Health Technology Assessment 2004; Vol. 8: No. 21
83
© Queen’s Printer and Controller of HMSO 2004. All rights reserved.
Comparison: 45 Diet + behaviour therapy + exercise vs control at 24 months Outcome: 06 Change in SBP (mmHg)
Study Treatment Control WMD (fixed) Weight WMD (fixed)or sub-category n n Mean (SD)Mean (SD)
01 VLCDWing, 1998 32 – 4.80 (15.00) 31 –1.50 (12.00) 100.00 –3.30 (–10.00 to 3.40)
Subtotal (95% CI) 32 31 100.00 –3.30 (–10.00 to 3.40)Test for heterogeneity: not applicableTest for overall effect: z = 0.97 (p = 0.33)
Total (95% CI) 32 31 100.00 –3.30 (–10.00 to 3.40)Test for heterogeneity: not applicableTest for overall effect: z = 0.97 (p = 0.33)
–10 –5 0 5 10
Favours treatment Favours control
(95% CI) (%) (95% CI)
FIGURE 164
Comparison: 47 Diet + behaviour therapy + exercise vs control at 36 monthsOutcome: 02 Change in SBP (mmHg)
Study Treatment Control WMD (fixed) Weight WMD (fixed)or sub-category n nMean (SD) Mean (SD)
01 600 kcal/day deficit or low fatTOHP II, 1997 527 –0.80 (8.70) 514 0.60 (8.50) 100.00 –1.40 (–2.44 to –0.36)
Subtotal (95% CI) 527 514 100.00 –1.40 (–2.44 to –0.36)Test for heterogeneity: not applicableTest for overall effect: z = 2.63 (p = 0.009)
Total (95% CI) 527 514 100.00 –1.40 (–2.44 to –0.36)Test for heterogeneity: not applicableTest for overall effect: z = 2.63 (p = 0.009)
–10 –5 0 5 10
Favours treatment Favours control
(95% CI) (%) (95% CI)
FIGURE 165

Systematic review of RCTs
84
Comparison: 43 Diet + behaviour therapy + exercise vs control at 12 months Outcome: 04 Change in total cholesterol (mmol/l)
Study Treatment Control WMD (fixed) Weight WMD (fixed)or sub-category n nMean (SD) Mean (SD)
01 600 kcal/day deficit or low fatLaitinen, 1993 40 –0.10 (0.54) 46 0.10 (0.88) 18.00 –0.20 (–0.50 to 0.10) Lindahl, 1999 93 –0.21 (0.70) 93 –0.06 (0.49) 55.31 –0.15 (–0.32 to 0.02) Narayan, 1998 45 0.20 (1.08) 45 0.10 (1.08) 8.38 0.10 (–0.35 to 0.55)
Subtotal (95% CI) 178 184 81.69 –0.14 (–0.28 to 0.01)Test for heterogeneity: Chi2 = 1.2, df = 2 (p = 0.53), I2 = 0%Test for overall effect: z = 1.86 (p = 0.06)
02 LCDJalkanen, 1991 22 –0.20 (1.08) 22 0.20 (1.08) 4.10 –0.40 (–1.04 to 0.24)
Subtotal (95% CI) 22 22 4.10 –0.40 (–1.04 to 0.24)Test for heterogeneity: not applicableTest for overall effect: z = 1.23 (p = 0.22)
03 VLCDWing, 1998 30 0.32 (0.64) 29 0.39 (0.70) 14.21 –0.07 (–0.41 to 0.27)
Subtotal (95% CI) 30 29 14.21 –0.07 (–0.41 to 0.27)Test for heterogeneity: not applicableTest for overall effect: z = 0.40 (p = 0.69)
Total (95% CI) 230 235 100.00 –0.14 (–0.27 to –0.01)Test for heterogeneity: Chi2 = 2.07, df = 4 (p = 0.72), I2 = 0%Test for overall effect: z = 2.08 (p = 0.04)
Favours treatment Favours control
(95% CI) (%) (95% CI)
–1 –0.5 0 0.5 1
FIGURE 166
Comparison: 45 Diet + behaviour therapy + exercise vs control at 24 monthsOutcome: 02 Change in total cholesterol (mmol/l)
Study Treatment Control WMD (fixed) Weight WMD (fixed)or sub-category n n Mean (SD)Mean (SD)
01 600 kcal/day deficit or low fatLaitinen, 1993 38 0.30 (1.08) 44 0.20 (1.08) 28.76 0.10 (–0.37 to 0.57)
Subtotal (95% CI) 38 44 28.76 0.10 (–0.37 to 0.57)Test for heterogeneity: not applicableTest for overall effect: z = 0.42 (p = 0.68)
02 VLCD Wing, 1998 32 0.09 (0.67) 31 0.18 (0.53) 71.24 –0.09 (–0.39 to 0.21)
Subtotal (95% CI) 32 31 71.24 –0.09 (–0.39 to 0.21)Test for heterogeneity: not applicableTest for overall effect: z = 0.59 (p = 0.55)
Total (95% CI) 70 75 100.00 –0.04 (–0.29 to 0.22)Test for heterogeneity: Chi2 = 0.45, df = 1 (p = 0.50), I2 = 0%Test for overall effect: z = 0.28 (p = 0.78)
Favours treatment Favours control
(95% CI) (%) (95% CI)
–1 –0.5 0 0.5 1
FIGURE 167

their children.180 Murphy and colleagues226,227
recruited married couples with either genderreceiving treatment, with or without spouses, andone- or two-party contingency contracts. Wing andcolleagues230 also recruited people of eithergender with type 2 diabetes with their overweightspouses. Wing and colleagues231 recruited eithergender with or without four friends or four teammembers.
The period of active treatment ranged from 10 weeks225–228 to 12 months.180 Two studiescombined data from treatment arms. Rosenthaland colleagues229 combined full husbandinvolvement and partial husband involvement
and compared mean change in weight withparticipants receiving individual treatment. Wingand colleagues231 combined data fromparticipants recruited alone and participantsrecruited with friends (but relationships were notacknowledged in the treatment) compared withcombined data from participants assigned to ateam of four members and participants recruitedwith four friends. Dropout rates at 1 year rangedfrom 8%228 to 49%.180 Dropout rates were 66% at2 years and 74% at 4 years.226,227
Reported mean BMI ranged from 27.6 kg/m2 229 to36.6 kg/m2,230 and reported mean weight was77.3 kg225 and 87.4 kg.228
Health Technology Assessment 2004; Vol. 8: No. 21
85
© Queen’s Printer and Controller of HMSO 2004. All rights reserved.
Comparison: 43 Diet + behaviour therapy + exercise vs control at 12 monthsOutcome: 09 Change in LDL cholesterol (mmol/l)
Study Treatment Control WMD (fixed) Weight WMD (fixed)or sub-category n nMean (SD) Mean (SD)
01 VLCDWing, 1998 30 0.14 (0.54) 29 0.24 (0.66) 100.00 –0.10 (–0.41 to 0.21)
Subtotal (95% CI) 30 29 100.00 –0.10 (–0.41 to 0.21)Test for heterogeneity: not applicableTest for overall effect: z = 0.64 (p = 0.52)
Total (95% CI) 30 29 100.00 –0.10 (–0.41 to 0.21)Test for heterogeneity: not applicableTest for overall effect: z = 0.64 (p = 0.52)
Favours treatment Favours control
(95% CI) (%) (95% CI)
–1 –0.5 0 0.5 1
FIGURE 168
Comparison: 45 Diet + behaviour therapy + exercise vs control at 24 monthsOutcome: 05 Change in LDL cholesterol (mmol/l)
Study Treatment Control WMD (fixed) Weight WMD (fixed)or sub-category n nMean (SD) Mean (SD)
01 VLCDWing, 1998 32 0.12 (0.52) 31 0.03 (0.46) 100.00 0.09 (–0.15 to 0.33)
Subtotal (95% CI) 32 31 100.00 0.09 (–0.15 to 0.33)Test for heterogeneity: not applicableTest for overall effect: z = 0.73 (p = 0.47)
Total (95% CI) 32 31 100.00 0.09 (–0.15 to 0.33)Test for heterogeneity: not applicableTest for overall effect: z = 0.73 (p = 0.47)
Favours treatment Favours control
–1 –0.5 0 0.5 1
(95% CI) (%) (95% CI)
FIGURE 169

Systematic review of RCTs
86
Comparison: 43 Diet + behaviour therapy + exercise vs control at 12 months Outcome: 07 Change in HDL cholesterol (mmol/l)
Study Treatment Control WMD (fixed) Weight WMD (fixed)or sub-category n nMean (SD) Mean (SD)
01 600 kcal/day deficit or low fatLaitinen, 1993 40 0.12 (0.16) 46 0.05 (0.16) 58.95 0.07 (0.00 to 0.14)
Subtotal (95% CI) 40 46 58.95 0.07 (0.00 to 0.14)Test for heterogeneity: not applicableTest for overall effect: z = 2.02 (p = 0.04)
02 LCDJalkanen, 1991 22 0.10 (0.29) 22 0.00 (0.29) 9.23 0.10 (–0.07 to 0.27)
Subtotal (95% CI) 22 22 9.23 0.10 (–0.07 to 0.27)Test for heterogeneity: not applicableTest for overall effect: z = 1.14 (p = 0.25)
03 VLCD Wing, 1998 30 0.12 (0.20) 29 0.08 (0.16) 31.83 0.04 (–0.05 to 0.13)
Subtotal (95% CI) 30 29 31.83 0.04 (–0.05 to 0.13)Test for heterogeneity: not applicableTest for overall effect: z = 0.85 (p = 0.40)
Total (95% CI) 92 97 100.00 0.06 (0.01 to 0.12)Test for heterogeneity: Chi2 = 0.46, df = 2 (p = 0.80), I2 = 0%Test for overall effect: z = 2.38 (p = 0.02)
Favours control Favours treatment
(95% CI) (%) (95% CI)
–0.5 –0.25 0 0.25 0.5
FIGURE 170
Comparison: 45 Diet + behaviour therapy + exercise vs control at 24 monthsOutcome: 03 Change in HDL cholesterol (mmol/l)
Study Treatment Control WMD (fixed) Weight WMD (fixed)or sub-category n nMean (SD) Mean (SD)
01 600 kcal/day deficit or low fatLaitinen, 1993 38 0.10 (0.29) 44 0.02 (0.29) 43.97 0.08 (–0.05 to 0.21)
Subtotal (95% CI) 38 44 43.97 0.08 (–0.05 to 0.21)Test for heterogeneity: not applicableTest for overall effect: z = 1.25 (p = 0.21)
02 VLCDWing, 1998 32 0.02 (0.21) 31 0.04 (0.24) 56.03 –0.02 (–0.13 to 0.09)
Subtotal (95% CI) 32 31 56.03 –0.02 (–0.13 to 0.09)Test for heterogeneity: not applicableTest for overall effect: z = 0.35 (p = 0.73)
Total (95% CI) 70 75 100.00 0.02 (–0.06 to 0.11)Test for heterogeneity: Chi2 = 1.36, df = 1 (p = 0.24), I2 = 26.4%Test for overall effect: z = 0.56 (p = 0.57)
Favours control Favours treatment
(95% CI) (%) (95% CI)
–0.5 –0.25 0 0.25 0.5
FIGURE 171

Health Technology Assessment 2004; Vol. 8: No. 21
87
© Queen’s Printer and Controller of HMSO 2004. All rights reserved.
Comparison: 43 Diet + behaviour therapy + exercise vs control at 12 monthsOutcome: 05 Change in triglycerides (mmol/l)
Study Treatment Control WMD (fixed) Weight WMD (fixed)or sub-category n nMean (SD) Mean (SD)
01 600 kcal/day deficit or low fatLaitinen, 1993 40 –0.50 (1.03) 46 0.10 (0.86) 13.34 –0.60 (–1.00 to –0.20) Lindahl, 1999 93 –0.16 (0.59) 93 –0.09 (0.59) 75.94 –0.07 (–0.24 to 0.10)
Subtotal (95% CI) 133 139 89.28 –0.15 (–0.31 to 0.01)Test for heterogeneity: Chi2 = 5.61, df = 1 (p = 0.02), I2 = 82.2%Test for overall effect: z = 1.87 (p = 0.06)
02 LCDJalkanen, 1991 22 –0.50 (0.96) 22 0.00 (0.96) 6.79 –0.50 (–1.07 to 0.07)
Subtotal (95% CI) 22 22 6.79 –0.50 (–1.07 to 0.07)Test for heterogeneity: not applicableTest for overall effect: z = 1.73 (p = 0.08)
03 VLCDWing, 1998 30 0.33 (1.65) 29 0.40 (1.25) 3.93 –0.07 (–0.82 to 0.68)
Subtotal (95% CI) 30 29 3.93 –0.07 (–0.82 to 0.68)Test for heterogeneity: not applicableTest for overall effect: z = 0.18 (p = 0.85)
Total (95% CI) 185 190 100.00 –0.17 (–0.32 to –0.02)Test for heterogeneity: Chi2 = 7.05, df = 3 (p = 0.07), I2 = 57.4%Test for overall effect: z = 2.25 (p = 0.02)
Favours treatment Favours control
(95% CI) (%) (95% CI)
–4 –2 0 2 4
FIGURE 172
Comparison: 45 Diet + behaviour therapy + exercise vs control at 24 monthsOutcome: 04 Change in triglycerides (mmol/l)
Study Treatment Control WMD (fixed) Weight WMD (fixed)or sub-category n nMean (SD) Mean (SD)
01 600 kcal/day deficit or low fatLaitinen, 1993 38 –0.16 (0.96) 44 –0.01 (0.96) 68.26 –0.15 (–0.57 to 0.27)
Subtotal (95% CI) 38 44 68.26 –0.15 (–0.57 to 0.27)Test for heterogeneity: not applicableTest for overall effect: z = 0.71 (p = 0.48)
02 VLCDWing, 1998 32 –0.28 (1.33) 31 0.52 (1.14) 31.74 –0.80 (–1.41 to –0.19)
Subtotal (95% CI) 32 31 31.74 –0.80 (–1.41 to –0.19)Test for heterogeneity: not applicableTest for overall effect: z = 2.57 (p = 0.01)
Total (95% CI) 70 75 100.00 –0.36 (–0.70 to –0.01)Test for heterogeneity: Chi2 = 2.97, df = 1 (p = 0.08), I2 = 66.3%Test for overall effect: z = 2.03 (p = 0.04)
Favours treatment Favours control
(95% CI) (%) (95% CI)
–4 –2 0 2 4
FIGURE 173

Review resultsThe family-based intervention from four studieswas associated with an overall WMD weightchange at 12 months of –2.96 kg (95% CI –5.31 to–0.60 kg) (Figure 178). At 18 months two family-based intervention studies were associated with anoverall WMD weight change of –1.08 kg (95% CI –3.04 to 0.87 kg) (Figure 179). At 24 monthsone family-based study was associated with an overall WMD weight change of –5.61 kg (95% CI –10.98 to –0.24 kg) (Figure 180). At 43months one family-based study was associated with an overall WMD weight change of –0.75 kg(95% CI –6.95 to 5.45 kg) and at 48 months –
1.55 kg (95% CI –7.88 to 4.78 kg) (Figures 181 and182); however after 18 months the number ofparticipants contributing to this comparison wasvery small.
At 18 months Wing and colleagues230 were unableto demonstrate any difference between family andindividual approaches for weight change, HbA1c
or fasting plasma glucose (Table 9), in a study with a small number of participants (Figures 183and 184).
There were no reported deaths or serious adverseevents in any of the included studies.
Systematic review of RCTs
88
Comparison: 43 Diet + behaviour therapy + exercise vs control at 12 monthsOutcome: 08 Change in HbA1c%
Study Treatment Control WMD (fixed) Weight WMD (fixed)or sub-category n nMean (SD) Mean (SD)
01 600 kcal/day deficit or low fatLaitinen, 1993 40 –0.60 (1.49) 46 –0.30 (1.61) 100.00 –0.30 (–0.96 to 0.36)
Subtotal (95% CI) 40 46 100.00 –0.30 (–0.96 to 0.36)Test for heterogeneity: not applicableTest for overall effect: z = 0.90 (p = 0.37)
Total (95% CI) 40 46 100.00 –0.30 (–0.96 to 0.36)Test for heterogeneity: not applicableTest for overall effect: z = 0.90 (p = 0.37)
Favours treatment Favours control
(95% CI) (%) (95% CI)
–1 –0.5 0 0.5 1
FIGURE 174
Comparison: 45 Diet + behaviour therapy + exercise vs control at 24 months Outcome: 08 Change in HbA1c%
Study Treatment Control WMD (fixed) Weight WMD (fixed)or sub-category n nMean (SD) Mean (SD)
01 VLCDWing, 1998 32 0.04 (1.08) 31 –0.10 (0.30) 100.00 0.14 (–0.25 to 0.53)
Subtotal (95% CI) 32 31 100.00 0.14 (–0.25 to 0.53)Test for heterogeneity: not applicableTest for overall effect: z = 0.71 (p = 0.48)
Total (95% CI) 32 31 100.00 0.14 (–0.25 to 0.53)Test for heterogeneity: not applicableTest for overall effect: z = 0.71 (p = 0.48)
Favours treatment Favours control
(95% CI) (%) (95% CI)
–1 –0.5 0 0.5 1
FIGURE 175

Effects of group versus individualtreatment Description of studiesFour RCTs assessed the effects of group versusindividual treatment and provided change inweight at 12 months or longer.232–235 Threestudies provided change in weight at 12 months.232,234,235 One study provided change inweight at 18 months,233 and one at both 24 and
60 months.232 No data were provided for changesin risk factors.
One of the four studies assessed change in weightusing an ITT approach.232 Straw and colleagues235
rerandomised participants at week 11 to one oftwo maintenance conditions. Dropout rates rangedfrom 64% overall at 69 weeks in the study byJones233 to zero at 1 year in the group treatment
Health Technology Assessment 2004; Vol. 8: No. 21
89
© Queen’s Printer and Controller of HMSO 2004. All rights reserved.
Comparison: 43 Diet + behaviour therapy + exercise vs control at 12 monthsOutcome: 06 Change in fasting plasma glucose (mmol/l)
Study Treatment Control WMD (fixed) Weight WMD (fixed)or sub-category n nMean (SD) Mean (SD)
01 600 kcal/day deficit or low fatLaitinen, 1993 40 –0.40 (1.49) 46 0.00 (2.34) 4.81 –0.40 (–1.22 to 0.42) Lindahl, 1999 93 –0.50 (0.68) 93 –0.31(1.14) 44.33 –0.19 (–0.46 to 0.08) Narayan, 1998 45 0.10 (1.35) 45 0.10 (1.35) 10.37 0.00 (–0.56 to 0.56)
Subtotal (95% CI) 178 184 59.52 –0.17 (–0.41 to 0.06)Test for heterogeneity: Chi2= 0.68, df = 2 (p = 0.71), I2 = 0%Test for overall effect: z = 1.46 (p = 0.14)
02 VLCDWing, 1998 30 0.00 (0.50) 29 0.00 (0.60) 40.48 0.00 (–0.28 to 0.28)
Subtotal (95% CI) 30 29 40.48 0.00 (–0.28 to 0.28)Test for heterogeneity: not applicableTest for overall effect: z = 0.00 (p = 1.00)
Total (95% CI) 208 213 100.00 –0.10 (–0.28 to 0.08)Test for heterogeneity: Chi2 = 1.55, df = 3 (p = 0.67), I2 = 0%Test for overall effect: z = 1.13 (p = 0.26)
Favours treatment Favours control
(95% CI) (%) (95% CI)
–1 –0.5 0 0.5 1
FIGURE 176
Comparison: 45 Diet + behaviour therapy + exercise vs control at 24 months Outcome: 09 Change in fasting plasma glucose (mmol/l)
Study Treatment Control WMD (fixed) Weight WMD (fixed)or sub-category n nMean (SD) Mean (SD)
01 VLCDWing, 1998 32 0.50 (1.30) 31 0.20 (0.40) 100.00 0.30 (–0.17 to 0.77)
Subtotal (95% CI) 32 31 100.00 0.30 (–0.17 to 0.77)Test for heterogeneity: not applicableTest for overall effect: z = 1.25 (p = 0.21)
Total (95% CI) 32 31 100.00 0.30 (–0.17 to 0.77)Test for heterogeneity: not applicableTest for overall effect: z = 1.25 (p = 0.21)
Favours treatment Favours control
–1 –0.5 0 0.5 1
(95% CI) (%) (95% CI)
FIGURE 177

Systematic review of RCTs
90
TABLE 7 Effects of diet, behaviour therapy and exercise versus control on weight and risk factors in populations with hypertension
Weight Total HDL TGs SBP DBP(kg) cholesterol cholesterol (mmol/l) (mmHg) (mmHg)
(mmol/l) (mmol/l)
12 months –4.82 –0.40 0.10 –0.50 7.00 0.00WMD (95% CI) (–5.75 to –3.89) (–1.04 to 0.24) (–0.07 to 0.27) (–1.07 to 0.07) (–0.11 to 14.11) (–4.65 to 4.65)No. of studies n = 2 n = 1 n = 1 n = 1 n = 1 n = 1
18 months –4.56WMD (95% CI) (–5.55 to –3.57)No. of studies n = 1
24 months –4.49WMD (95% CI) (–5.62 to –3.36)No. of studies n = 1
30 months –4.94WMD (95% CI) (–6.47 to –3.41)No. of studies n = 1
TABLE 8 Effects of diet, behaviour therapy and exercise versus control on weight and risk factors in populations with type 2 diabetes
Weight Total HDL TGs SBP DBP Fasting HbA1c%(kg) cholesterol cholesterol (mmol/l) (mmHg) (mmHg) plasma
(mmol/l) (mmol/l) glucose (mmol/l)
12 months –2.80 –0.20 0.07 –0.60 –4.00 –3.00 –0.40 –0.30WMD (95% CI) (–4.23 to –1.37) (–0.50 to 0.10) (0.00 to 0.14) (–1.00 to –0.20) (–7.88 to –0.12) (–5.70 to –0.30) (–1.22 to 0.42) (–0.96 to 0.36)No. of studies n = 1 n = 1 n = 1 n = 1 n = 1 n = 1 n = 1 n = 1
24 months –3.01 0.10 0.08 –0.15WMD (95% CI) (–6.13 to 0.10) (–0.37 to 0.57) (–0.05 to 0.21) (–0.57 to 0.27)No. of studies n = 1 n = 1 n = 1 n = 1

Health Technology Assessment 2004; Vol. 8: No. 21
91
© Queen’s Printer and Controller of HMSO 2004. All rights reserved.
Comparison: 48 Family vs individual at 12 monthsOutcome: 01 Weight change (kg)
Study Treatment Control WMD (fixed) Weight WMD (fixed)or sub-category n n Mean (SD)Mean (SD)
01 01Black, 1984 11 –7.03 (7.90) 11 –7.44 (8.02) 12.57 0.41 (–6.24 to 7.06) Cousins, 1992 27 –3.80 (6.99) 32 –2.10 (6.51) 46.20 –1.70 (–5.17 to 1.77) Murphy, 1982a 4 –5.44 (7.45) 4 –3.18 (6.81) 5.68 –2.26 (–12.15 to 7.63) Murphy, 1982b 8 –8.75 (8.39) 6 –3.49 (6.90) 8.65 –5.26 (–13.28 to 2.76) Pearce, 1981 12 –8.25 (5.38) 12 –2.16 (5.97) 26.90 –6.09 (–10.64 to –1.54)
Subtotal (95% CI) 62 65 100.00 –2.96 (–5.31 to –0.60)Test for heterogeneity: Chi2 = 3.65, df = 4 (p = 0.46), I2 = 0%Test for overall effect: z = 2.46 (p = 0.01)
Total (95% CI) 62 65 100.00 –2.96 (–5.31 to –0.60)Test for heterogeneity: Chi2 = 3.65, df = 4 (p = 0.46), I2 = 0%Test for overall effect: z = 2.46 (p = 0.01)
–10 –5 0 5 10
Favours treatment Favours control
(95% CI) (%) (95% CI)
FIGURE 178
Comparison: 49 Family vs individual at 18 monthsOutcome: 01 Weight change (kg)
Study Treatment Control WMD (fixed) Weight WMD (fixed)or sub-category n nMean (SD) Mean (SD)
Wing, 1991b 20 –3.18 (5.31) 23 –5.26 (10.39) 16.30 2.08 (–2.76 to 6.92) Wing, 1999 80 –4.70 (7.25) 86 –3.00 (6.76) 83.70 –1.70 (–3.84 to 0.44)
Total (95% CI) 100 109 100.00 –1.08 (–3.04 to 0.87)Test for heterogeneity: Chi2 = 1.96, df = 1 (p = 0.16), I2 = 49.0%Test for overall effect: z = 1.09 (p = 0.28)
–10 –5 0 5 10
Favours treatment Favours control
(95% CI) (%) (95% CI)
FIGURE 179
Comparison: 50 Family vs individual at 24 months Outcome: 01 Weight change (kg)
Study Treatment Control WMD (fixed) Weight WMD (fixed)or sub-category n nMean (SD) Mean (SD)
01 01Murphy, 1982a 5 –3.56 (6.92) 7 –2.58 (6.65) 47.18 –0.98 (–8.79 to 6.83) Murphy, 1982b 8 –7.21 (7.96) 7 2.54 (6.63) 52.82 –9.75 (–17.14 to –2.36)
Subtotal (95% CI) 13 14 100.00 –5.61 (–10.98 to –0.24)Test for heterogeneity: Chi2 = 2.56, df = 1 (p = 0.11), I2 = 60.9%Test for overall effect: z = 2.05 (p = 0.04)
Total (95% CI) 13 14 100.00 –5.61 (–10.98 to –0.24)Test for heterogeneity: Chi2 = 2.56, df = 1 (p = 0.11), I2 = 60.9%Test for overall effect: z = 2.05 (p = 0.04)
–10 –5 0 5 10
Favours treatment Favours control
(95% CI) (%) (95% CI)
FIGURE 180

by Hakala and colleagues.232 The treatmentreceived by all participants in three of the studieswas similar except for group or individualadministration.233–235 The participants receivinggroup counselling in the study by Hakala andcolleagues232 received an additional initial 2-week
inpatient stay of intensive LCD, behaviour therapyand exercise plus more frequent follow-up visitsand additional individual contacts.
The treatment varied across the four studies fromgroup versus individually administered LCD233,234
Systematic review of RCTs
92
Comparison: 51 Family vs individual at 43 monthsOutcome: 01 Weight change (kg)
Study Treatment Control WMD (fixed) Weight WMD (fixed)or sub-category n n Mean (SD)Mean (SD)
01 01Rosenthal, 1980 11 –4.37 (7.15) 9 –3.62 (6.94) 100.00 –0.75 (–6.95 to 5.45)
Subtotal (95% CI) 11 9 100.00 –0.75 (–6.95 to 5.45)Test for heterogeneity: not applicableTest for overall effect: z = 0.24 (p = 0.81)
Total (95% CI) 11 9 100.00 –0.75 (–6.95 to 5.45)Test for heterogeneity: not applicableTest for overall effect: z = 0.24 (p = 0.81)
–10 –5 0 5 10
Favours treatment Favours control
(95% CI) (%) (95% CI)
FIGURE 181
Comparison: 52 Family vs individual at 48 monthsOutcome: 01 Weight change (kg)
Study Treatment Control WMD (fixed) Weight WMD (fixed)or sub-category n nMean (SD) Mean (SD)
01 01Murphy, 1982a 5 0.73 (6.12) 4 –4.20 (7.10) 51.91 4.93 (–3.86 to 13.72) Murphy, 1982b 6 –2.87 (6.73) 4 5.67 (7.52) 48.09 –8.54 (–17.67 to 0.59)
Subtotal (95% CI) 11 8 100.00 –1.55 (–7.88 to 4.78)Test for heterogeneity: Chi2 = 4.34, df = 1 (p = 0.04), I2 = 77.0%Test for overall effect: z = 0.48 (p = 0.63)
Total (95% CI) 11 8 100.00 –1.55 (–7.88 to 4.78)Test for heterogeneity: Chi2 = 4.34 to df = 1 (p = 0.04), I2 = 77.0%Test for overall effect: z = 0.48 (p = 0.63)
–10 –5 0 5 10
Favours treatment Favours control
(95% CI) (%) (95% CI)
FIGURE 182
TABLE 9 Effects of family versus individual treatment on weight and risk factors in people with type 2 diabetes
Weight (kg) HbA1c% Fasting plasma glucose (mmol/l)
18 months 2.08 0.60 1.39
WMD (95% CI) (–2.76 to 6.92) (–0.78 to 1.98) (–1.04 to 3.82)
No. of studies n = 1 n = 1 n = 1

to group versus individually administered LCDplus behaviour therapy plus exercise.232 The studyby Straw and Terre235 assessed group versusindividual treatment followed by a maintenanceperiod of weight checking from week 11 to month12 and group versus individual treatment followedby individual problem solving.
Three of the four studies recruited womenonly.233–235 Reported mean BMI ranged from33.5 kg/m2 234 to 43 kg/m2.232 The study by Strawand Terre235 did not report BMI, and reportedmean body weight was 85.2 to 86.6 kg.
Review resultsCompared with individual treatment the groupadministered intervention for three studies wasassociated with an overall WMD weight change at12 months of 1.59 kg (95% CI –1.81 to 5.00 kg)(Figure 185).
At 18 months group treatment compared withindividual treatment was associated with a WMDweight change of 0.74 kg (95% CI –4.21 to
5.69 kg), based on one study (Figure 186).233
At 24 and 60 months the study by Hakala andcolleagues232 produced less weight loss in a group setting than in an individual setting: WMDweight change 8.10 kg (95% CI 2.19 to 14.01 kg)at 24 months and 4.40 kg (95% CI –3.51 to12.31 kg) at 60 months (Figures 187 and 188). Theconfidence intervals are wide, reflecting the smallnumber of participants contributing to thesecomparisons.
Two participants who were seriously ill with cancerdropped out during the maintenance phase of thestudy by Straw and Terre,235 but their group statuswas unclear.
Effects of diet and exercise versus diet Description of studiesFive studies assessed the added effects of exerciseto diet and provided change in weight at 12 months or longer.115–121,142–145,153,236 One ofthese five studies was a pilot consisting of only 24 participants;153 this was a pilot for anotherstudy included in this comparison.153 One of these
Health Technology Assessment 2004; Vol. 8: No. 21
93
© Queen’s Printer and Controller of HMSO 2004. All rights reserved.
Comparison: 49 Family vs individual at 18 months Outcome: 02 Change in HbA1c%
Study Treatment Control WMD (fixed) Weight WMD (fixed)or sub-category n nMean (SD) Mean (SD)
Wing, 1991b 20 –0.10 (1.90) 23 –0.70 (2.70) 100.00 0.60 (–0.78 to 1.98)
Total (95% CI) 20 23 100.00 0.60 (–0.78 to 1.98)Test for heterogeneity: not applicableTest for overall effect: z = 0.85 (p = 0.39)
Favours treatment Favours control
(95% CI) (%) (95% CI)
–4 –2 0 2 4
FIGURE 183
Comparison: 49 Family vs individual at 18 months Outcome: 03 Change in fasting plasma glucose (mmol/l)
Study Treatment Control WMD (fixed) Weight WMD (fixed)or sub-category n n Mean (SD)Mean (SD)
Wing, 1991b 20 –0.61 (3.37) 23 –2.00 (4.72) 100.00 1.39 (–1.04 to 3.82)
Total (95% CI) 20 23 100.00 1.39 (–1.04 to 3.82)Test for heterogeneity: not applicableTest for overall effect: z = 1.12 (p = 0.26)
Favours treatment Favours control
(95% CI) (%) (95% CI)
–4 –2 0 2 4
FIGURE 184

Systematic review of RCTs
94
Comparison: 53 Group vs individual at 12 months Outcome: 01 Weight change (kg)
Study Treatment Control WMD (fixed) Weight WMD (fixed)or sub–category n nMean (SD) Mean (SD)
01 01Hakala, 1993 30 –14.80 (8.90) 28 –17.00 (10.30) 46.94 2.20 (–2.77 to 7.17) Long, 1983 7 –0.90 (6.20) 7 –8.10 (8.20) 19.99 7.20 (–0.42 to 14.82) Straw, 1983a 6 –3.98 (7.04) 6 1.69 (6.39) 20.03 –5.67 (–13.28 to 1.94) Straw, 1983b 5 –4.99 (7.33) 5 –6.94 (7.88) 13.03 1.95 (–7.48 to 11.38)
Subtotal (95% CI) 48 46 100.00 1.59 (–1.81 to 5.00)Test for heterogeneity: Chi2 = 5.65, df = 3 (p = 0.13), I2 = 46.9%Test for overall effect: z = 0.92 (p = 0.36)
Total (95% CI) 48 46 100.00 1.59 (–1.81 to 5.00)Test for heterogeneity: Chi2 = 5.65, df = 3 (p = 0.13), I2 = 46.9%Test for overall effect: z = 0.92 (p = 0.36)
–10 –5 0 5 10
Favours treatment Favours control
(95% CI) (%) (95% CI)
FIGURE 185
Comparison: 54 Group vs individual at 18 months Outcome: 01 Weight change (kg)
Study Treatment Control WMD (fixed) Weight WMD (fixed)or sub–category n nMean (SD) Mean (SD)
01 01Jones, 1986 8 –2.33 (5.06) 9 –3.07 (5.34) 100.00 0.74 (–4.21 to 5.69)
Subtotal (95% CI) 8 9 100.00 0.74 (–4.21 to 5.69)Test for heterogeneity: not applicableTest for overall effect: z = 0.29 (p = 0.77)
Total (95% CI) 8 9 100.00 0.74 (–4.21 to 5.69)Test for heterogeneity: not applicableTest for overall effect: z = 0.29 (p = 0.77)
–10 –5 0 5 10
Favours treatment Favours control
(95% CI) (%) (95% CI)
FIGURE 186
Comparison: 55 Group vs individual at 24 monthsOutcome: 01 Weight change (kg)
Study Treatment Control WMD (fixed) Weight WMD (fixed)or sub-category n nMean (SD) Mean (SD)
Hakala, 1993 30 –4.20 (9.70) 28 –12.30 (12.90) 100.00 8.10 (2.19 to 14.01)
Total (95% CI) 30 28 100.00 8.10 (2.19 to 14.01)Test for heterogeneity: not applicableTest for overall effect: z = 2.69 (p = 0.007)
–10 –5 0 5 10
Favours treatment Favours control
(95% CI) (%) (95% CI)
FIGURE 187

five studies was a cluster RCT which providedchange in weight at 12 months.236
The ODES115–121 involved a male population witha cardiovascular disease risk profile. Results in thestudy by Wood and colleagues142–145 werepresented separately for men and women.
Two studies provided change in weight at 12 months,115–121,142–145 two studies providedchange in weight at 18 months153 and one studyprovided change in weight at 36 months.153 Datawere provided for all lipids, blood pressure andfasting plasma glucose at 12 months and for bloodpressure at 18 months.
Two studies possibly assessed change in weightusing an ITT approach, but this was unclear.153
Dropout rates at 12 months ranged from 5% inthe ODES115–121 to 18% in the study by Phenix.236
The amount and duration of exercise received byparticipants varied across studies. In theODES115–121 the diet and exercise group receivedsupervised endurance workouts which progressedto 1-hour sessions, three times per week at60–80% maximum heart rate for 12 months. Inthe study by Wood and colleagues142–145 the dietand exercise arm received aerobic exercise whichprogressed to 45 minutes, three times per week at60–80% maximum heart rate for 12 months. Inthe pilot study by Pavlou and colleagues153 thediet and exercise groups received supervisedexercise for 90 minutes three times per week at85% maximum heart rate for the initial 12 weeksonly. In the main trial by Pavlou and colleagues153
the diet plus exercise groups received supervisedexercise for 90 minutes three times per week at85% maximum heart rate for the initial 8 weeksonly.
The diets also varied between studies: two studiesused a 600 kcal/day deficit or low-fatdiet.115–121,142–145 The pilot study by Pavlou andcolleagues153 used an LCD and a PSMF and themain trial by Pavlou and colleagues153 used anLCD, PSMF, 420 kcal/day diet (assumed PSMF) ora 800 kcal/day VLCD.
Reported mean BMI ranged from 27.9 kg/m2 forwomen only in the study by Wood andcolleagues142–145 to 34.8 kg/m2 in the main studyby Pavlou and colleagues.153
Review resultsDiet and exercise compared with diet alone for two studies was associated with an overallWMD weight change at 12 months of –1.95 kg (95% CI –3.22 to –0.68 kg) (Figure189).115–121,142–145 At 18 months diet and exercisecompared with diet in the two studies by Pavlou and colleagues153 was associated with anoverall WMD weight change of –7.63 kg (95% CI –10.33 to –4.92 kg) (Figure 190). At 36months diet and exercise compared with diet inthe pilot study by Pavlou and colleagues153 wasassociated with an overall WMD weight change of–8.22 kg (95% CI –15.27 to –1.16 kg) (Figure 191).The confidence intervals for these comparisonsare wide, reflecting the small number ofparticipants.
Two studies demonstrated beneficial effects ofadding exercise to diet at 12 months for HDLcholesterol (WMD 0.1 mmol/l, 95% CI 0.06 to0.14 mmol/l) and triglycerides (WMD –0.18 mmol/l,95% CI –0.31 to –0.06 mmol/l) (Figures192–196).115–121,142–145 One study foundstatistically significant falls in DBP and SBP after 18 months,153 but these were not seen inother studies at 12 months (Figures 197–200). The
Health Technology Assessment 2004; Vol. 8: No. 21
95
© Queen’s Printer and Controller of HMSO 2004. All rights reserved.
Comparison: 56 Group vs individual at 60 months Outcome: 01 Weight change (kg)
Study Treatment Control WMD (fixed) Weight WMD (fixed)or sub-category n nMean (SD) Mean (SD)
Hakala, 1993 28 –2.40 (12.00) 25 –6.80 (16.70) 100.00 4.40 (–3.51 to 12.31)
Total (95% CI) 28 25 100.00 4.40 (–3.51 to 12.31)Test for heterogeneity: not applicableTest for overall effect: z = 1.09 (p = 0.28)
–10 –5 0 5 10
Favours treatment Favours control
(95% CI) (%) (95% CI)
FIGURE 188

results from the ODES115–121 with maleparticipants at risk of cardiovascular disease areshown in Table 10.
The cluster RCT236 recruited women only. Mean body weight ranged from 76 kg in one ofthe eight arms to 86 kg in another arm. Results
were analysed using an ITT approach. Activetreatment was 8 weeks for all participants ofgroups used in analysis for this review. The added effect of exercise to an LCD was associatedwith a weight loss at 12 months of –5.32 kgcompared with –4.82 kg in the diet-only group.
Systematic review of RCTs
96
Comparison: 57 Diet + exercise vs diet at 12 months Outcome: 01 Weight change (kg)
Study Treatment Control WMD (fixed) Weight WMD (fixed)or sub–category n n Mean (SD)Mean (SD)
01 600 kcal/day deficit or low fatODES, 1995 65 –5.60 (4.84) 52 –4.00 (5.05) 49.37 –1.60 (–3.41 to 0.21) Wood, 1991a 42 –5.10 (5.30) 31 –4.10 (5.50) 25.54 –1.00 (–3.51 to 1.51) Wood, 1991b 39 –8.70 (5.70) 40 –5.10 (5.80) 25.09 –3.60 (–6.14 to –1.06)
Subtotal (95% CI) 146 123 100.00 –1.95 (–3.22 to –0.68)Test for heterogeneity: Chi2 = 2.32, df = 2 (p = 0.31), I2 = 13.8%Test for overall effect: z = 3.01 (p = 0.003)
Total (95% CI) 146 123 100.00 –1.95 (–3.22 to –0.68)Test for heterogeneity: Chi2 = 2.32, df = 2 (p = 0.31), I2 = 13.8%Test for overall effect: z = 3.01 (p = 0.003)
–10 –5 0 5 10
Favours treatment Favours control
(95% CI) (%) (95% CI)
FIGURE 189
Comparison: 58 Diet + exercise vs diet at 18 months Outcome: 01 Weight change (kg)
Study Treatment Control WMD (fixed) Weight WMD (fixed)or sub-category n n Mean (SD)Mean (SD)
01 LCDPavlou, 1989 1ca 10 –9.19 (8.52) 11 –3.57 (6.93) 16.41 –5.62 (–12.30 to 1.06) Pavlou, 1989 2 5 –11.83 (9.26) 6 –5.75 (7.54) 7.16 –6.08 (–16.19 to 4.03)
Subtotal (95% CI) 15 17 23.57 –5.76 (–11.34 to –0.18)Test for heterogeneity: Chi2 = 0.01, df = 1 (p = 0.94), I2 = 0%Test for overall effect: z = 2.02 (p = 0.04)
02 PSMFPavlou, 1989 1cg 16 –8.64 (8.36) 16 –1.13 (6.23) 28.07 –7.51 (–12.62 to –2.40) Pavlou, 1989 1df 10 –9.68 (8.65) 13 –0.93 (6.18) 18.30 –8.75 (–15.08 to –2.42) Pavlou, 1989 2 5 –14.04 (9.89) 5 –7.29 (7.98) 5.90 –6.75 (–17.89 to 4.39)
Subtotal (95% CI) 31 34 52.28 –7.86 (–11.60 to –4.11)Test for heterogeneity: Chi2 = 0.13, df = 2 (p = 0.94), I2 = 0%Test for overall effect: z = 4.11 (p < 0.0001)
03 VLCDPavlou, 1989 1ea 18 –12.40 (9.42) 16 –3.45 (6.89) 24.15 –8.95 (–14.46 to –3.44)
Subtotal (95% CI) 18 16 24.15 –8.95 (–14.46 to –3.44)Test for heterogeneity: not applicableTest for overall effect: z = 3.18 (p = 0.001)
Total (95% CI) 64 67 100.00 –7.63 (–10.33 to –4.92)Test for heterogeneity: Chi2 = 0.80, df = 5 (p = 0.98), I2 = 0%Test for overall effect: z = 5.52 (p < 0.00001)
–10 –5 0 5 10
Favours treatment Favours control
(95% CI) (%) (95% CI)
FIGURE 190

Health Technology Assessment 2004; Vol. 8: No. 21
97
© Queen’s Printer and Controller of HMSO 2004. All rights reserved.
Comparison: 59 Diet + exercise vs diet at 36 monthsOutcome: 01 Weight change (kg)
Study Treatment Control WMD (fixed) Weight WMD (fixed)or sub-category n n Mean (SD)Mean (SD)
01 LCDPavlou, 1989 2 5 –10.67 (8.93) 6 –3.25 (6.83) 54.55 –7.42 (–16.97 to 2.13)
Subtotal (95% CI) 5 6 54.55 –7.42 (–16.97 to 2.13)Test for heterogeneity: not applicableTest for overall effect: z = 1.52 (p = 0.13)
02 PSMFPavlou, 1989 2 5 –13.00 (9.59) 5 –3.83 (7.10) 45.45 –9.17 (–19.63 to 1.29)
Subtotal (95% CI) 5 5 45.45 –9.17 (–19.63 to 1.29)Test for heterogeneity: not applicableTest for overall effect: z = 1.72 (p = 0.09)
Total (95% CI) 10 11 100.00 –8.22 (–15.27 to –1.16)Test for heterogeneity: Chi2 = 0.06, df = 1 (p = 0.81), I2 = 0%Test for overall effect: z = 2.28 (p = 0.02)
–10 –5 0 5 10
Favours treatment Favours control
(95% CI) (%) (95% CI)
FIGURE 191
Comparison: 57 Diet + exercise vs diet at 12 monthsOutcome: 02 Change in total cholesterol (mmol/l)
Study Treatment Control WMD (fixed) Weight WMD (fixed)or sub-category n n Mean (SD)Mean (SD)
01 600 kcal/day deficit or low fatODES, 1995 65 –0.48 (0.89) 52 –0.23 (0.65) 34.66 –0.25 (–0.53 to 0.03) Wood, 1991a 42 –0.28 (0.52) 31 –0.39 (0.61) 38.17 0.11 (–0.16 to 0.38) Wood, 1991b 39 –0.38 (0.87) 40 –0.42 (0.51) 27.17 0.04 (–0.28 to 0.36)
Subtotal (95% CI) 146 123 100.00 –0.03 (–0.20 to 0.13)Test for heterogeneity: Chi2 = 3.63, df = 2 (p = 0.16), I2 = 44.9%Test for overall effect: z = 0.40 (p = 0.69)
Total (95% CI) 146 123 100.00 –0.03 (–0.20 to 0.13)Test for heterogeneity: Chi2 = 3.63, df = 2 (p = 0.16), I2 = 44.9%Test for overall effect: z = 0.40 (p = 0.69)
Favours treatment Favours control
–1 –0.5 0 0.5 1
(95% CI) (%) (95% CI)
FIGURE 192
Comparison: 57 Diet + exercise vs diet at 12 monthsOutcome: 03 Change in LDL cholesterol (mmol/l)
Study Treatment Control WMD (fixed) Weight WMD (fixed)or sub-category n nMean (SD) Mean (SD)
01 600 kcal/day deficit or low fatODES, 1995 65 –0.39 (0.89) 52 –0.18 (0.72) 30.50 –0.21 (–0.50 to 0.08) Wood, 1991a 42 –0.29 (0.46) 31 –0.28 (0.63) 37.87 –0.01 (–0.27 to 0.25) Wood, 1991b 39 –0.27 (0.78) 40 –0.39 (0.48) 31.63 0.12 (–0.17 to 0.41)
Subtotal (95% CI) 146 123 100.00 –0.03 (–0.19 to 0.13)Test for heterogeneity: Chi2 = 2.54, df = 2 (p = 0.28), I2 = 21.2%Test for overall effect: z = 0.36 (p = 0.72)
Total (95% CI) 146 123 100.00 –0.03 (–0.19 to 0.13)Test for heterogeneity: Chi2 = 2.54, df = 2 (p = 0.28), I2 = 21.2%Test for overall effect: z = 0.36 (p = 0.72)
Favours treatment Favours control
(95% CI) (%) (95% CI)
–1 –0.5 0 0.5 1
FIGURE 193
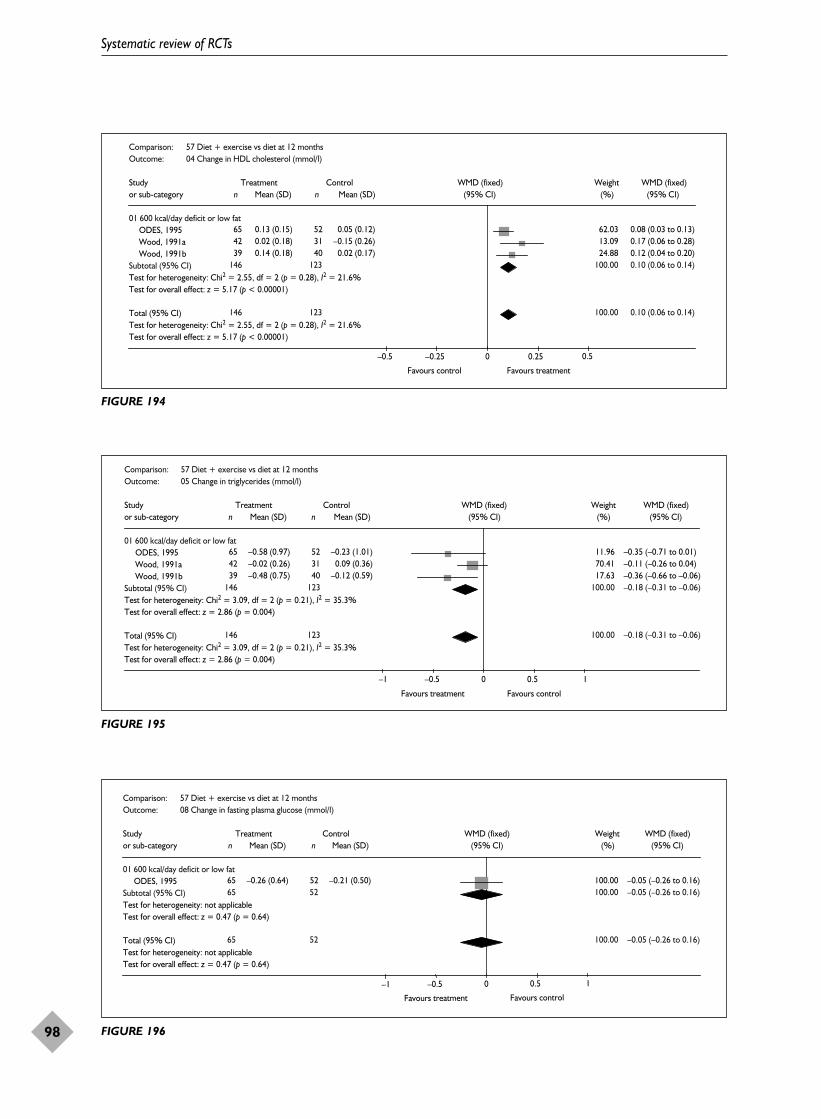
Systematic review of RCTs
98
Comparison: 57 Diet + exercise vs diet at 12 monthsOutcome: 04 Change in HDL cholesterol (mmol/l)
Study Treatment Control WMD (fixed) Weight WMD (fixed)or sub-category n nMean (SD) Mean (SD)
01 600 kcal/day deficit or low fatODES, 1995 65 0.13 (0.15) 52 0.05 (0.12) 62.03 0.08 (0.03 to 0.13) Wood, 1991a 42 0.02 (0.18) 31 –0.15 (0.26) 13.09 0.17 (0.06 to 0.28) Wood, 1991b 39 0.14 (0.18) 40 0.02 (0.17) 24.88 0.12 (0.04 to 0.20)
Subtotal (95% CI) 146 123 100.00 0.10 (0.06 to 0.14)Test for heterogeneity: Chi2 = 2.55, df = 2 (p = 0.28), I2 = 21.6%Test for overall effect: z = 5.17 (p < 0.00001)
Total (95% CI) 146 123 100.00 0.10 (0.06 to 0.14)Test for heterogeneity: Chi2 = 2.55, df = 2 (p = 0.28), I2 = 21.6%Test for overall effect: z = 5.17 (p < 0.00001)
Favours control Favours treatment
(95% CI) (%) (95% CI)
–0.5 –0.25 0 0.25 0.5
FIGURE 194
Comparison: 57 Diet + exercise vs diet at 12 monthsOutcome: 05 Change in triglycerides (mmol/l)
Study Treatment Control WMD (fixed) Weight WMD (fixed)or sub-category n nMean (SD) Mean (SD)
01 600 kcal/day deficit or low fatODES, 1995 65 –0.58 (0.97) 52 –0.23 (1.01) 11.96 –0.35 (–0.71 to 0.01) Wood, 1991a 42 –0.02 (0.26) 31 0.09 (0.36) 70.41 –0.11 (–0.26 to 0.04) Wood, 1991b 39 –0.48 (0.75) 40 –0.12 (0.59) 17.63 –0.36 (–0.66 to –0.06)
Subtotal (95% CI) 146 123 100.00 –0.18 (–0.31 to –0.06)Test for heterogeneity: Chi2 = 3.09, df = 2 (p = 0.21), I2 = 35.3%Test for overall effect: z = 2.86 (p = 0.004)
Total (95% CI) 146 123 100.00 –0.18 (–0.31 to –0.06)Test for heterogeneity: Chi2 = 3.09, df = 2 (p = 0.21), I2 = 35.3%Test for overall effect: z = 2.86 (p = 0.004)
Favours treatment Favours control
(95% CI) (%) (95% CI)
–1 –0.5 0 0.5 1
FIGURE 195
Comparison: 57 Diet + exercise vs diet at 12 months Outcome: 08 Change in fasting plasma glucose (mmol/l)
Study Treatment Control WMD (fixed) Weight WMD (fixed)or sub-category n nMean (SD) Mean (SD)
01 600 kcal/day deficit or low fatODES, 1995 65 –0.26 (0.64) 52 –0.21 (0.50) 100.00 –0.05 (–0.26 to 0.16)
Subtotal (95% CI) 65 52 100.00 –0.05 (–0.26 to 0.16)Test for heterogeneity: not applicableTest for overall effect: z = 0.47 (p = 0.64)
Total (95% CI) 65 52 100.00 –0.05 (–0.26 to 0.16)Test for heterogeneity: not applicableTest for overall effect: z = 0.47 (p = 0.64)
Favours treatment Favours control
(95% CI) (%) (95% CI)
–1 –0.5 0 0.5 1
FIGURE 196

Health Technology Assessment 2004; Vol. 8: No. 21
99
© Queen’s Printer and Controller of HMSO 2004. All rights reserved.
Comparison: 57 Diet + exercise vs diet at 12 months Outcome: 07 Change in DBP (mmHg)
Study Treatment Control WMD (fixed) Weight WMD (fixed)or sub-category n nMean (SD) Mean (SD)
01 600 kcal/day deficit or low fatODES, 1995 65 –5.20 (7.26) 52 –3.40 (7.21) 29.39 –1.80 (–4.44 to 0.84) Wood, 1991a 42 –2.00 (4.10) 31 –2.20 (5.10) 42.93 0.20 (–1.98 to 2.38) Wood, 1991b 39 –4.90 (5.70) 40 –2.40 (6.60) 27.68 –2.50 (–5.22 to 0.22)
Subtotal (95% CI) 146 123 100.00 –1.14 (–2.56 to 0.29)Test for heterogeneity: Chi2 = 2.65, df = 2 (p = 0.27), I2 = 24.6%Test for overall effect: z = 1.56 (p = 0.12)
Total (95% CI) 146 123 100.00 –1.14 (–2.56 to 0.29)Test for heterogeneity: Chi2 = 2.65, df = 2 (p = 0.27), I2 = 24.6%Test for overall effect: z = 1.56 (p = 0.12)
–10 –5 0 5 10
Favours treatment Favours control
(95% CI) (%) (95% CI)
FIGURE 197
Comparison: 58 Diet + exercise vs diet at 18 months Outcome: 03 Change in DBP (mmHg)
Study Treatment Control WMD (fixed) Weight WMD (fixed)or sub-category n n Mean (SD)Mean (SD)
01 Mixed dietsPavlou, 1989 1 54 –10.40 (8.30) 56 1.70 (8.30) 100.00 –12.10 (–15.20 to –9.00)
Subtotal (95% CI) 54 56 100.00 –12.10 (–15.20 to –9.00)Test for heterogeneity: not applicableTest for overall effect: z = 7.64 (p < 0.00001)
Total (95% CI) 54 56 100.00 –12.10 (–15.20 to –9.00)Test for heterogeneity: not applicableTest for overall effect: z = 7.64 (p < 0.00001)
–10 –5 0 5 10
Favours treatment Favours control
(95% CI) (%) (95% CI)
FIGURE 198
Comparison: 57 Diet + exercise vs diet at 12 months Outcome: 06 Change in SBP (mmHg)
Study Treatment Control WMD (fixed) Weight WMD (fixed)or sub-category n nMean (SD) Mean (SD)
01 600 kcal/day deficit or low fatODES, 1995 65 –5.90 (8.87) 52 –6.40 (10.10) 31.61 0.50 (–2.99 to 3.99)Wood, 1991a 42 –3.60 (7.70) 31 –4.10 (6.00) 38.97 0.50 (–2.64 to 3.64)Wood, 1991b 39 –5.40 (8.30) 40 –4.10 (8.10) 29.43 –1.30 (–4.92 to 2.32)
Subtotal (95% CI) 146 123 100.00 –0.03 (–1.99 to 1.93)Test for heterogeneity: Chi2 = 0.67, df = 2 (p = 0.71), I2 = 0%Test for overall effect: z = 0.03 (p = 0.98)
Total (95% CI) 146 123 100.00 –0.03 (–1.99 to 1.93)Test for heterogeneity: Chi2 = 0.67, df = 2 (p = 0.71), I2 = 0%Test for overall effect: z = 0.03 (p = 0.98)
–10 –5 0 5 10
Favours treatment Favours control
(95% CI) (%) (95% CI)
FIGURE 199

Two cases of cancer and one cardiac event werereported in the ODES,115–121 but the treatmentallocation was not stated.
Effects of diet and behaviour therapyversus diet Description of studiesFour RCTs assessed the added effects of behaviour therapy to diet and provided change inweight at 12 months or longer.159–162,233,234,236
Three studies provided change in weight at 12 months,159–162,234,236 one at 18 months,233
and one at 36 and 60 months.159–162 No data were provided for risk factors at any time-point.
Only one study used an ITT approach.236
Numbers of participants allocated to treatmentand therefore dropout rates were unclear in onestudy.159–162 Jones and colleagues233 reported adropout rate at 69 weeks of 64% overall.
Three studies used an LCD and behaviour therapyversus LCD alone.233,234,236 One of these studiesevaluated these comparisons both in a groupsetting and on an individual basis.233 Wadden andcolleagues159–162 used a PSMF of 400–500 kcal/dayduring months 2 and 3, with and withoutbehaviour therapy. In this study participants in thePSMF and behaviour therapy group had anadditional 9 weeks of initial active treatment andwere then followed up at more frequent intervalsthan the PSMF-only group. Active treatmentphases ranged from 8 to 17 weeks. Three of thefour studies recruited women only.233,234,236
Reported mean BMI ranged from 33.5 kg/m2 234 to39.4 kg/m2.159–162
Review resultsThe additional effect of behaviour therapy on diet was associated with an overall WMD weightchange at 12 months of –7.67 kg (95% CI –11.97to –3.36 kg), at 18 months of –4.18 kg (95% CI–8.32 to –0.04 kg), at 36 months of –2.91 kg (95%CI –8.60 to 2.78 kg) and at 60 months of 1.90 kg(95% CI –3.75 to 7.55 kg) (Figures 201–204). Thus,there was significant added effect of behaviourtherapy on weight change at 12 and 18 months,but not at 36 or 60 months. The number ofparticipants contributing to the comparisonsdecreased over time and so the sustained effect ofbehaviour therapy cannot really be assessed.
In the cluster RCT by Phenix,236 where meetingtime was the unit of randomisation, mean bodyweight in the groups ranged from 76 to 86 kg.Phenix evaluated the added effects to diet of twoforms of behaviour therapy, which were overtbehaviour therapy and cognitive behaviourtherapy. The added effect of overt behaviourtherapy to an LCD was associated with a weightchange at 12 months of –3.26 kg compared with–4.82 kg in the diet-only group. The added effectof cognitive behaviour therapy to an LCD wasassociated with a weight change at 12 months of–6.68 kg compared with –4.82 kg in the diet-onlygroup.
No deaths or serious adverse events were reportedin any of the included studies.
Systematic review of RCTs
100
Comparison: 58 Diet + exercise vs diet at 18 months Outcome: 02 Change in SBP (mmHg)
Study Treatment Control WMD (fixed) Weight WMD (fixed)or sub-category n nMean (SD) Mean (SD)
01 Mixed dietsPavlou, 1989 1 54 –7.70 (12.70) 56 1.20 (12.70) 100.00 –8.90 (–13.65 to –4.15)
Subtotal (95% CI) 54 56 100.00 –8.90 (–13.65 to –4.15)Test for heterogeneity: not applicableTest for overall effect: z = 3.67 (p = 0.0002)
Total (95% CI) 54 56 100.00 –8.90 (–13.65 to –4.15)Test for heterogeneity: not applicableTest for overall effect: z = 3.67 (p = 0.0002)
–10 –5 0 5 10
Favours treatment Favours control
(95% CI) (%) (95% CI)
FIGURE 200

Health Technology Assessm
ent2004; Vol. 8: No. 21
101
© Q
ueen’s Printer and Controller of H
MSO
2004. All rights reserved.
TABLE 10 Effects of diet and exercise versus diet on weight and risk factors in men at risk of cardiovascular disease
Weight Total HDL LDL TGs SBP DBP Fasting (kg) cholesterol cholesterol cholesterol (mmol/l) (mmHg) (mmHg) plasma
(mmol/l) (mmol/l) (mmol/l) glucose (mmol/l)
12 months –1.60 –0.25 0.08 –0.21 –0.35 0.50 –1.80 –0.05
WMD (95% CI) (–3.41 to 0.21) (–0.53 to 0.03) (0.03 to 0.13) (–0.50 to 0.08) (–0.71 to 0.01) (–2.99 to 3.99) (–4.44 to 0.84) (–0.26 to 0.16)
No. of studies n = 1 n = 1 n = 1 n = 1 n = 1 n = 1 n = 1 n = 1

Systematic review of RCTs
102
Comparison: 60 Diet + behaviour therapy vs diet + at 12 monthsOutcome: 01 Weight change (kg)
Study Treatment Control WMD (fixed) Weight WMD (fixed)or sub-category n nMean (SD) Mean (SD)
01 LCDLong, 1983 9 –7.70 (8.10) 7 –0.90 (6.20) 37.72 –6.80 (–13.81 to 0.21)
Subtotal (95% CI) 9 7 37.72 –6.80 (–13.81 to 0.21)Test for heterogeneity: not applicableTest for overall effect: z = 1.90 (p = 0.06)
02 PSMFWadden, 1989 19 –12.89 (8.91) 15 –4.70 (7.31) 62.28 –8.19 (–13.64 to –2.74)
Subtotal (95% CI) 19 15 62.28 –8.19 (–13.64 to –2.74)Test for heterogeneity: not applicableTest for overall effect: z = 2.94 (p = 0.003)
Total (95% CI) 28 22 100.00 –7.67 (–11.97 to –3.36)Test for heterogeneity: Chi2 = 0.09, df = 1 (p = 0.76), I2 = 0%Test for overall effect: z = 3.49 (p = 0.0005)
–10 –5 0 5 10
Favours treatment Favours control
(95% CI) (%) (95% CI)
FIGURE 201
Comparison: 61 Diet + behaviour therapy vs diet at 18 months Outcome: 01 Weight change (kg)
Study Treatment Control WMD (fixed) Weight WMD (fixed)or sub-category n nMean (SD) Mean (SD)
01 LCDJones, 1986c 7 –7.79 (5.21) 8 –2.33 (5.06) 63.11 –5.46 (–10.67 to –0.25) Jones, 1986d 7 –5.06 (7.91) 9 –3.07 (5.34) 36.89 –1.99 (–8.81 to 4.83)
Subtotal (95% CI) 14 17 100.00 –4.18 (–8.32 to –0.04)Test for heterogeneity: Chi2 = 0.63, df = 1 (p = 0.43), I2 = 0%Test for overall effect: z = 1.98 (p = 0.05)
Total (95% CI) 14 17 100.00 –4.18 (–8.32 to –0.04)Test for heterogeneity: Chi2 = 0.63. df = 1 (p = 0.43), I2 = 0%Test for overall effect: z = 1.98 (p = 0.05)
–10 –5 0 5 10
Favours treatment Favours control
(95% CI) (%) (95% CI)
FIGURE 202
Comparison: 62 Diet + behaviour therapy vs diet at 36 monthsOutcome: 01 Weight change (kg)
Study Treatment Control WMD (fixed) Weight WMD (fixed)or sub-category n nMean (SD) Mean (SD)
01 PSMFWadden, 1989 19 –5.11 (8.28) 15 –2.20 (8.50) 100.00 –2.91 (–8.60 to 2.78)
Subtotal (95% CI) 19 15 100.00 –2.91 (–8.60 to 2.78)Test for heterogeneity: not applicableTest for overall effect: z = 1.00 (p = 0.32)
Total (95% CI) 19 15 100.00 –2.91 (–8.60 to 2.78)Test for heterogeneity: not applicableTest for overall effect: z = 1.00 (p = 0.32)
–10 –5 0 5 10
Favours treatment Favours control
(95% CI) (%) (95% CI)
FIGURE 203

Effects of diet and behaviour therapyand exercise versus diet and behaviourtherapy Description of studiesSeven RCTs assessed the added effect of exerciseto diet and behaviour therapy and providedchange in weight at 12 months orlonger.176–178,236–245 Two of these were clusterRCTs.178,236 One cluster RCT provided change inHbA1c at 18 months.178 Data were available forlipids, blood pressure, fasting plasma glucose andHbA1c at 12 and 24 months.
Three studies assessed data using an ITTapproach.176,177,236,239 Wing and colleagues carried out three of the studies, which recruitedobese type 2 diabetics245 or obese people with atleast one biological parent with type 2diabetes.176,177 The cluster RCT by Kaplan andcolleagues178 also recruited people with type 2diabetes.
Three studies recruited women only.236,239–244
Reported mean group BMI ranged from38.2 kg/m2 245 to 35.7 kg/m2.176,177 Reported meangroup body weight ranged from 80.4 kg236 to106.9 kg.245
In five of the eight studies participants receivedequal contact visits.178,236–238,245 In the other threestudies the exercise component accounted for theextra contact visits.176,177,239–244
Three studies used a VLCD initially before usingan LCD,176,177,239–244 three studies used a600 kcal/day deficit or low-fat diet178,237,238,245 andPhenix236 used a LCD.
The study by Wing and colleagues245 used aplacebo exercise for participants in the diet andbehaviour therapy group. Wadden andcolleagues240–244 compared three kinds of exercisegroup with no exercise, using step, strength andaerobic exercise.
The number of participants in treatment armsranged from 11236 to 43.237,238 Overall dropouts at 2 years ranged from 40% to 52%.237–244
Review resultsThe added effect of exercise to diet and behaviourtherapy was associated with a WMD weight changeat 12 months of –3.02 kg (95% CI –4.94 to–1.11 kg) and –2.16 kg (95% CI –4.20 to –0.12 kg)at 24 months (Figures 205 and 206). Few studiespresented changes for risk factors, with the onlystatistically significant result for the added effectof exercise being for LDL cholesterol at 24 months(WMD change 0.28 mmol/l, 95% CI 0 to0.56 mmol/l) (Figures 207–222).
In the cluster RCT by Phenix236 exercise, diet andcognitive behaviour therapy was associated with amean weight change at 12 months of –1.13 kgcompared with –6.68 kg in the diet and cognitivebehaviour group. Exercise, diet and overtbehaviour therapy was associated with a meanweight change at 12 months of –5.19 kg comparedwith –3.26 kg in the diet and overt behaviourtherapy group.
In the cluster RCT by Kaplan and colleagues178
the authors report that “weight was essentiallyconstant” at 18 months in participants in the LCDand behaviour therapy plus exercise group. At
Health Technology Assessment 2004; Vol. 8: No. 21
103
© Queen’s Printer and Controller of HMSO 2004. All rights reserved.
Comparison: 69 Diet + behaviour therapy vs diet at 60 monthsOutcome: 01 Weight change (kg)
Study Treatment Control WMD (fixed) Weight WMD (fixed)or sub-category n n Mean (SD)Mean (SD)
01 PSMFWadden, 1989 22 2.90 (11.26) 18 1.00 (6.79) 100.00 1.90 (–3.75 to 7.55)
Subtotal (95% CI) 22 18 100.00 1.90 (–3.75 to 7.55)Test for heterogeneity: not applicableTest for overall effect: z = 0.66 (p = 0.51)
Total (95% CI) 22 18 100.00 1.90 (–3.75 to 7.55)Test for heterogeneity: not applicableTest for overall effect: z = 0.66 (p = 0.51)
–10 –5 0 5 10
Favours treatment Favours control
(95% CI) (%) (95% CI)
FIGURE 204

18 months the diet and behaviour therapy groupwas associated with a mean weight loss of –1.68 kg.At 18 months the added effect of exercise to dietand behaviour therapy was associated with adecrease in HbA1c of –1.48% compared with
–0.46% in the diet and behaviour therapy group.The added effect of exercise was associated with0.06 units of improvement in well-being at 18 months compared with 0.03 units for the dietand behaviour therapy group.
Systematic review of RCTs
104
Comparison: 63 Diet + behaviour therapy + exercise vs diet + behaviour therapy at 12 months Outcome: 01 Weight change (kg)
Study Treatment Control WMD (fixed) Weight WMD (fixed)or sub-category n nMean (SD) Mean (SD)
01 600 kcal/day deficit or low fatForeyt, 1993 27 –8.13 (8.24) 29 –6.32 (7.70) 20.94 –1.81 (–5.99 to 2.37) Wing, 1988a 8 –7.80 (3.70) 11 –4.00 (1.90) 46.81 –3.80 (–6.60 to –1.00) Wing, 1988b 13 –7.90 (8.15) 15 –3.80 (6.99) 11.41 –4.10 (–9.77 to 1.57)
Subtotal (95% CI) 48 55 79.15 –3.32 (–5.47 to –1.16)Test for heterogeneity: Chi2 = 0.69, df = 2 (p = 0.71), I2 = 0%Test for overall effect: z = 3.02 (p = 0.003)
02 VLCDWing, 1998 30 –7.40 (9.70) 33 –5.50 (6.90) 20.85 –1.90 (–6.09 to 2.29)
Subtotal (95% CI) 30 33 20.85 –1.90 (–6.09 to 2.29)Test for heterogeneity: not applicableTest for overall effect: z = 0.89 (p = 0.37)
Total (95% CI) 78 88 100.00 –3.02 (–4.94 to –1.11)Test for heterogeneity: Chi2 = 1.03, df = 3 (p = 0.79), I2 = 0%Test for overall effect: z = 3.09 (p = 0.002)
–10 –5 0 5 10
Favours treatment Favours control
(95% CI) (%) (95% CI)
FIGURE 205
Comparison: 64 Diet + behaviour therapy + exercise vs diet + behaviour therapy at 24 months Outcome: 01 Weight change (kg)
Study Treatment Control WMD (fixed) Weight WMD (fixed)or sub-category n nMean (SD) Mean (SD)
01 600 kcal/day deficit or low fatForeyt, 1993 21 –2.20 (6.70) 15 0.90 (7.70) 17.79 –3.10 (–7.94 to 1.74)
Subtotal (95% CI) 21 15 17.79 –3.10 (–7.94 to 1.74)Test for heterogeneity: not applicableTest for overall effect: z = 1.26 (p = 0.21)
02 VLCDSikand, 1988 7 –9.10 (9.20) 8 –0.80 (7.40) 5.72 –8.30 (–16.83 to 0.23) Wadden, 1998a 21 –8.50 (8.20) 21 –6.90 (6.30) 21.28 –1.60 (–6.02 to 2.82) Wadden, 1998b 18 –10.10 (10.00) 21 –6.90 (6.30) 14.55 –3.20 (–8.55 to 2.15) Wadden, 1998c 17 –8.60 (10.70) 21 –6.90 (6.30) 12.56 –1.70 (–7.46 to 4.06) Wing, 1998 32 –2.50 (8.40) 35 –2.10 (7.60) 28.10 –0.40 (–4.25 to 3.45)
Subtotal (95% CI) 95 106 82.21 –1.95 (–4.20 to 0.30)Test for heterogeneity: Chi2 = 2.99, df = 4 (p = 0.56), I2 = 0%Test for overall effect: z = 1.70 (p = 0.09)
Total (95% CI) 116 121 100.00 –2.16 (–4.20 to –0.12)Test for heterogeneity: Chi2 = 3.17, df = 5 (p = 0.67), I2 = 0%Test for overall effect: z = 2.07 (p = 0.04)
–10 –5 0 5 10
Favours treatment Favours control
(95% CI) (%) (95% CI)
FIGURE 206

Health Technology Assessment 2004; Vol. 8: No. 21
105
© Queen’s Printer and Controller of HMSO 2004. All rights reserved.
Comparison: 63 Diet + behaviour therapy + exercise vs diet + behaviour therapy at 12 months Outcome: 02 Change in total cholesterol (mmol/l)
Study Treatment Control WMD (fixed) Weight WMD (fixed)or sub-category n nMean (SD) Mean (SD)
01 600 kcal/day deficit or low fatWing, 1988b 13 0.42 (1.08) 15 0.42 (1.08) 15.68 0.00 (–0.80 to 0.80)
Subtotal (95% CI) 13 15 15.68 0.00 (–0.80 to 0.80)Test for heterogeneity: not applicableTest for overall effect: z = 0.00 (p = 1.00)
02 VLCDWing, 1998 30 0.32 (0.64) 33 0.26 (0.76) 84.32 0.06 (–0.29 to 0.41)
Subtotal (95% CI) 30 33 84.32 0.06 (–0.29 to 0.41)Test for heterogeneity: not applicableTest for overall effect: z = 0.34 (p = 0.73)
Total (95% CI) 43 48 100.00 0.05 (–0.27 to 0.37)Test for heterogeneity: Chi2 = 0.02, df = 1 (p = 0.89), I2 = 0%Test for overall effect: z = 0.31 (p = 0.75)
Favours treatment Favours control
–1 –0.5 0 0.5 1
(95% CI) (%) (95% CI)
FIGURE 207
Comparison: 64 Diet + behaviour therapy + exercise vs diet + behaviour therapy at 24 months Outcome: 02 Change in total cholesterol (mmol/l)
Study Treatment Control WMD (fixed) Weight WMD (fixed)or sub-category n nMean (SD) Mean (SD)
01 VLCDWing, 1998 32 0.09 (0.67) 35 –0.12 (0.61) 100.00 0.21 (–0.10 to 0.52)
Subtotal (95% CI) 32 35 100.00 0.21 (–0.10 to 0.52)Test for heterogeneity: not applicableTest for overall effect: z = 1.34 (p = 0.18)
Total (95% CI) 32 35 100.00 0.21 (–0.10 to 0.52)Test for heterogeneity: not applicableTest for overall effect: z = 1.34 (p = 0.18)
Favours treatment Favours control
–1 –0.5 0 0.5 1
(95% CI) (%) (95% CI)
FIGURE 208
Comparison: 63 Diet + behaviour therapy + exercise vs diet + behaviour therapy at 12 months Outcome: 03 Change in LDL cholesterol (mmol/l)
Study Treatment Control WMD (fixed) Weight WMD (fixed)or sub-category n nMean (SD) Mean (SD)
01 VLCDWing, 1998 30 0.14 (0.54) 33 0.12 (0.73) 100.00 0.02 (–0.30 to 0.34)
Subtotal (95% CI) 30 33 100.00 0.02 (–0.30 to 0.34)Test for heterogeneity: not applicableTest for overall effect: z = 0.12 (p = 0.90)
Total (95% CI) 30 33 100.00 0.02 (–0.30 to 0.34)Test for heterogeneity: not applicableTest for overall effect: z = 0.12 (p = 0.90)
Favours treatment Favours control
–1 –0.5 0 0.5 1
(95% CI) (%) (95% CI)
FIGURE 209

Systematic review of RCTs
106
Comparison: 64 Diet + behaviour therapy + exercise vs diet + behaviour therapy at 24 months Outcome: 03 Change in LDL cholesterol (mmol/l)
Study Treatment Control WMD (fixed) Weight WMD (fixed)or sub-category n nMean (SD) Mean (SD)
01 VLCDWing, 1998 32 0.12 (0.52) 35 –0.16 (0.63) 100.00 0.28 (0.00 to 0.56)
Subtotal (95% CI) 32 35 100.00 0.28 (0.00 to 0.56)Test for heterogeneity: not applicableTest for overall effect: z = 1.99 (p = 0.05)
Total (95% CI) 32 35 100.00 0.28 (0.00 to 0.56)Test for heterogeneity: not applicableTest for overall effect: z = 1.99 (p = 0.05)
Favours treatment Favours control
–1 –0.5 0 0.5 1
(95% CI) (%) (95% CI)
FIGURE 210
Comparison: 63 Diet + behaviour therapy + exercise vs diet + behaviour therapy at 12 monthsOutcome: 04 Change in HDL cholesterol (mmol/l)
Study Treatment Control WMD (fixed) Weight WMD (fixed)or sub-category n nMean (SD) Mean (SD)
01 600 kcal/day deficit or low fatWing, 1988b 13 0.06 (0.29) 15 0.10 (0.29) 14.87 –0.04 (–0.26 to 0.18)
Subtotal (95% CI) 13 15 14.87 –0.04 (–0.26 to 0.18)Test for heterogeneity: not applicableTest for overall effect: z = 0.36 (p = 0.72)
02 VLCDWing, 1998 30 0.12 (0.20) 33 0.10 (0.16) 85.13 0.02 (–0.07 to 0.11)
Subtotal (95% CI) 30 33 85.13 0.02 (–0.07 to 0.11)Test for heterogeneity: not applicableTest for overall effect: z = 0.44 (p = 0.66)
Total (95% CI) 43 48 100.00 0.01 (–0.07 to 0.09)Test for heterogeneity: Chi2 = 0.25, df = 1 (p = 0.61), I2 = 0%Test for overall effect: z = 0.26 (p = 0.79)
Favours control Favours treatment
–0.5 –0.25 0 0.25 0.5
(95% CI) (%) (95% CI)
FIGURE 211
Comparison: 64 Diet + behaviour therapy + exercise vs diet + behaviour therapy at 24 months Outcome: 04 Change in HDL cholesterol (mmol/l)
Study Treatment Control WMD (fixed) Weight WMD (fixed)or sub-category n nMean (SD) Mean (SD)
01 VLCDWing, 1998 32 0.02 (0.21) 35 0.02 (0.20) 100.00 0.00 (–0.10 to 0.10)
Subtotal (95% CI) 32 35 100.00 0.00 (–0.10 to 0.10)Test for heterogeneity: not applicableTest for overall effect: z = 0.00 (p = 1.00)
Total (95% CI) 32 35 100.00 0.00 (–0.10 to 0.10)Test for heterogeneity: not applicableTest for overall effect: z = 0.00 (p = 1.00)
Favours control Favours treatment
–0.5 –0.25 0 0.25 0.5
(95% CI) (%) (95% CI)
FIGURE 212

Health Technology Assessment 2004; Vol. 8: No. 21
107
© Queen’s Printer and Controller of HMSO 2004. All rights reserved.
Comparison: 63 Diet + behaviour therapy + exercise vs diet + behaviour therapy at 12 months Outcome: 05 Change in triglycerides (mmol/l)
Study Treatment Control WMD (fixed) Weight WMD (fixed)or sub-category n nMean (SD) Mean (SD)
01 600 kcal/day deficit or low fatWing, 1988b 13 –0.64 (0.96) 15 0.03 (0.96) 79.76 –0.67 (–1.38 to 0.04)
Subtotal (95% CI) 13 15 79.76 –0.67 (–1.38 to 0.04)Test for heterogeneity: not applicableTest for overall effect: z = 1.84 (p = 0.07)
02 VLCDWing, 1998 30 0.33 (1.65) 33 0.55 (3.77) 20.24 –0.22 (–1.64 to 1.20)
Subtotal (95% CI) 30 33 20.24 –0.22 (–1.64 to 1.20)Test for heterogeneity: not applicableTest for overall effect: z = 0.30 (p = 0.76)
Total (95% CI) 43 48 100.00 –0.58 (–1.22 to 0.06)Test for heterogeneity: Chi2 = 0.31, df = 1 (p = 0.58), I2 = 0%Test for overall effect: z = 1.78 (p = 0.07)
Favours treatment Favours control
–4 –2 0 2 4
(95% CI) (%) (95% CI)
FIGURE 213
Comparison: 64 Diet + behaviour therapy + exercise vs diet + behaviour therapy at 24 months Outcome: 05 Change in triglycerides (mmol/l)
Study Treatment Control WMD (fixed) Weight WMD (fixed)or sub-category n nMean (SD) Mean (SD)
01 VLCDWing, 1998 32 –0.28 (1.33) 35 0.19 (2.42) 100.00 –0.47 (–1.39 to 0.45)
Subtotal (95% CI) 32 35 100.00 –0.47 (–1.39 to 0.45)Test for heterogeneity: not applicableTest for overall effect: z = 1.00 (p = 0.32)
Total (95% CI) 32 35 100.00 –0.47 (–1.39 to 0.45)Test for heterogeneity: not applicableTest for overall effect: z = 1.00 (p = 0.32)
Favours treatment Favours control
–4 –2 0 2 4
(95% CI) (%) (95% CI)
FIGURE 214
Comparison: 63 Diet + behaviour therapy + exercise vs diet + behaviour therapy at 12 months Outcome: 09 Change in HbA1c%
Study Treatment Control WMD (fixed) Weight WMD (fixed)or sub-category n Mean (SD) Mean (SD)n
01 600 kcal/day deficit or low fatWing, 1988b 13 –1.40 (2.58) 15 –0.80 (2.58) 100.00 –0.60 (–2.52 to 1.32)
Subtotal (95% CI) 13 15 100.00 –0.60 (–2.52 to 1.32)Test for heterogeneity: not applicableTest for overall effect: z = 0.61 (p = 0.54)
Total (95% CI) 13 15 100.00 –0.60 (–2.52 to 1.32)Test for heterogeneity: not applicableTest for overall effect: z = 0.61 (p = 0.54)
Favours treatment Favours control
–4 –2 0 2 4
(95% CI) (%) (95% CI)
FIGURE 215

Systematic review of RCTs
108
Comparison: 64 Diet + behaviour therapy + exercise vs diet + behaviour therapy at 24 months Outcome: 08 Change in HbA1c%
Study Treatment Control WMD (fixed) Weight WMD (fixed)or sub-category n nMean (SD) Mean (SD)
01 VLCDWing, 1998 32 0.04 (1.08) 35 –0.10 (0.50) 100.00 0.14 (–0.27 to 0.55)
Subtotal (95% CI) 32 35 100.00 0.14 (–0.27 to 0.55)Test for heterogeneity: not applicableTest for overall effect: z = 0.67 (p = 0.50)
Total (95% CI) 32 35 100.00 0.14 (–0.27 to 0.55)Test for heterogeneity: not applicableTest for overall effect: z = 0.67 (p = 0.50)
Favours treatment Favours control
–4 –2 0 2 4
(95% CI) (%) (95% CI)
FIGURE 216
Comparison: 63 Diet + behaviour therapy + exercise vs diet + behaviour therapy at 12 months Outcome: 08 Change in fasting plasma glucose (mmol/l)
Study Treatment Control WMD (fixed) Weight WMD (fixed)or sub-category n nMean (SD) Mean (SD)
01 600 kcal/day deficit or low fatWing, 1988b 13 –1.70 (3.77) 15 –0.80 (3.77) 1.34 –0.90 (–3.70 to 1.90)
Subtotal (95% CI) 13 15 1.34 –0.90 (–3.70 to 1.90)Test for heterogeneity: not applicableTest for overall effect: z = 0.63 (p = 0.53)
02 VLCDWing, 1998 30 0.00 (0.50) 33 0.20 (0.80) 98.66 –0.20 (–0.53 to 0.13)
Subtotal (95% CI) 30 33 98.66 –0.20 (–0.53 to 0.13)Test for heterogeneity: not applicableTest for overall effect: z = 1.20 (p = 0.23)
Total (95% CI) 43 48 100.00 –0.21 (–0.53 to 0.11)Test for heterogeneity: Chi2 = 0.24, df = 1 (p = 0.63), I2 = 0%Test for overall effect: z = 1.27 (p = 0.21)
Favours treatment Favours control –4 –2 0 2 4
(95% CI) (%) (95% CI)
FIGURE 217
Comparison: 64 Diet + behaviour therapy + exercise vs diet + behaviour therapy at 24 months Outcome: 09 Change in fasting plasma glucose (mmol/l)
Study Treatment Control WMD (fixed) Weight WMD (fixed)or sub-category n nMean (SD) Mean (SD)
01 VLCDWing, 1998 32 0.50 (1.30) 35 0.30 (1.00) 100.00 0.20 (–0.36 to 0.76)
Subtotal (95% CI) 32 35 100.00 0.20 (–0.36 to 0.76)Test for heterogeneity: not applicableTest for overall effect: z = 0.70 (p = 0.48)
Total (95% CI) 32 35 100.00 0.20 (–0.36 to 0.76)Test for heterogeneity: not applicableTest for overall effect: z = 0.70 (p = 0.48)
Favours treatment Favours control
–4 –2 0 2 4
(95% CI) (%) (95% CI)
FIGURE 218
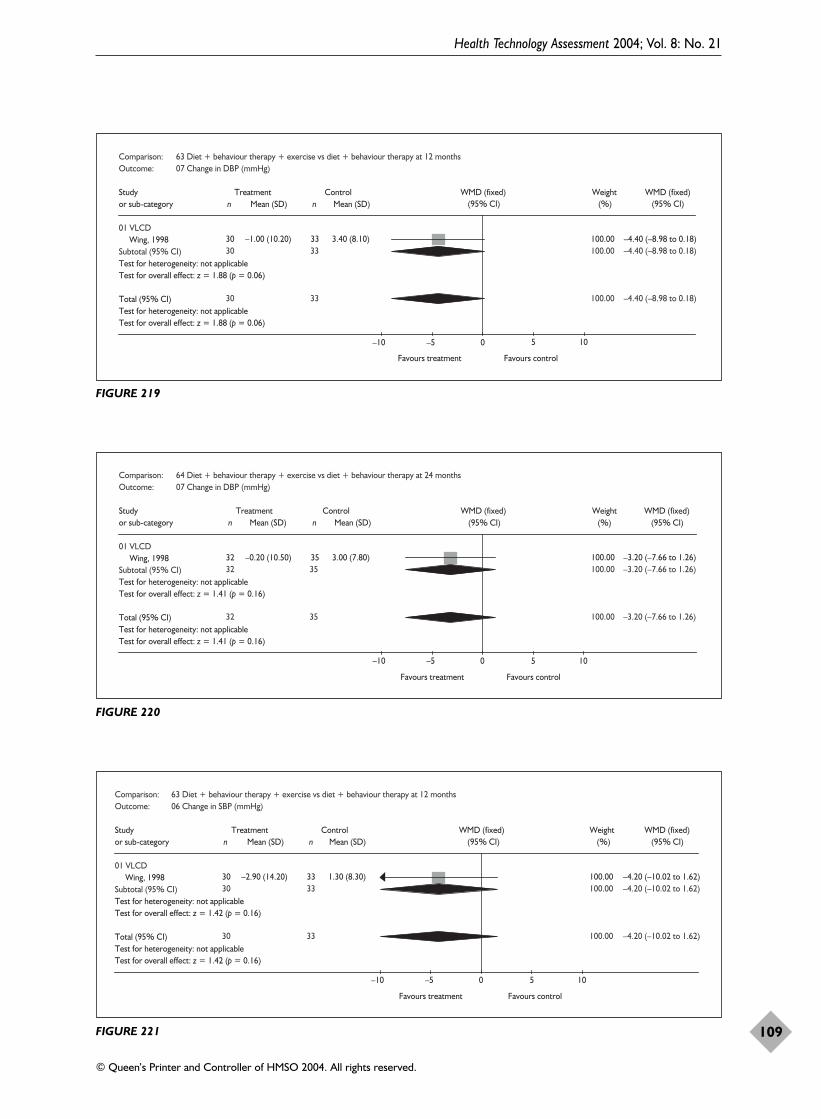
Health Technology Assessment 2004; Vol. 8: No. 21
109
© Queen’s Printer and Controller of HMSO 2004. All rights reserved.
Comparison: 63 Diet + behaviour therapy + exercise vs diet + behaviour therapy at 12 months Outcome: 07 Change in DBP (mmHg)
Study Treatment Control WMD (fixed) Weight WMD (fixed)or sub-category n nMean (SD) Mean (SD)
01 VLCDWing, 1998 30 –1.00 (10.20) 33 3.40 (8.10) 100.00 –4.40 (–8.98 to 0.18)
Subtotal (95% CI) 30 33 100.00 –4.40 (–8.98 to 0.18)Test for heterogeneity: not applicableTest for overall effect: z = 1.88 (p = 0.06)
Total (95% CI) 30 33 100.00 –4.40 (–8.98 to 0.18)Test for heterogeneity: not applicableTest for overall effect: z = 1.88 (p = 0.06)
–10 –5 0 5 10
Favours treatment Favours control
(95% CI) (%) (95% CI)
FIGURE 219
Comparison: 64 Diet + behaviour therapy + exercise vs diet + behaviour therapy at 24 months Outcome: 07 Change in DBP (mmHg)
Study Treatment Control WMD (fixed) Weight WMD (fixed)or sub-category n n Mean (SD)Mean (SD)
01 VLCDWing, 1998 32 –0.20 (10.50) 35 3.00 (7.80) 100.00 –3.20 (–7.66 to 1.26)
Subtotal (95% CI) 32 35 100.00 –3.20 (–7.66 to 1.26)Test for heterogeneity: not applicableTest for overall effect: z = 1.41 (p = 0.16)
Total (95% CI) 32 35 100.00 –3.20 (–7.66 to 1.26)Test for heterogeneity: not applicableTest for overall effect: z = 1.41 (p = 0.16)
–10 –5 0 5 10
Favours treatment Favours control
(95% CI) (%) (95% CI)
FIGURE 220
Comparison: 63 Diet + behaviour therapy + exercise vs diet + behaviour therapy at 12 months Outcome: 06 Change in SBP (mmHg)
Study Treatment Control WMD (fixed) Weight WMD (fixed)or sub-category n n Mean (SD)Mean (SD)
01 VLCDWing, 1998 30 –2.90 (14.20) 33 1.30 (8.30) 100.00 –4.20 (–10.02 to 1.62)
Subtotal (95% CI) 30 33 100.00 –4.20 (–10.02 to 1.62)Test for heterogeneity: not applicableTest for overall effect: z = 1.42 (p = 0.16)
Total (95% CI) 30 33 100.00 –4.20 (–10.02 to 1.62)Test for heterogeneity: not applicableTest for overall effect: z = 1.42 (p = 0.16)
–10 –5 0 5 10
Favours treatment Favours control
(95% CI) (%) (95% CI)
FIGURE 221
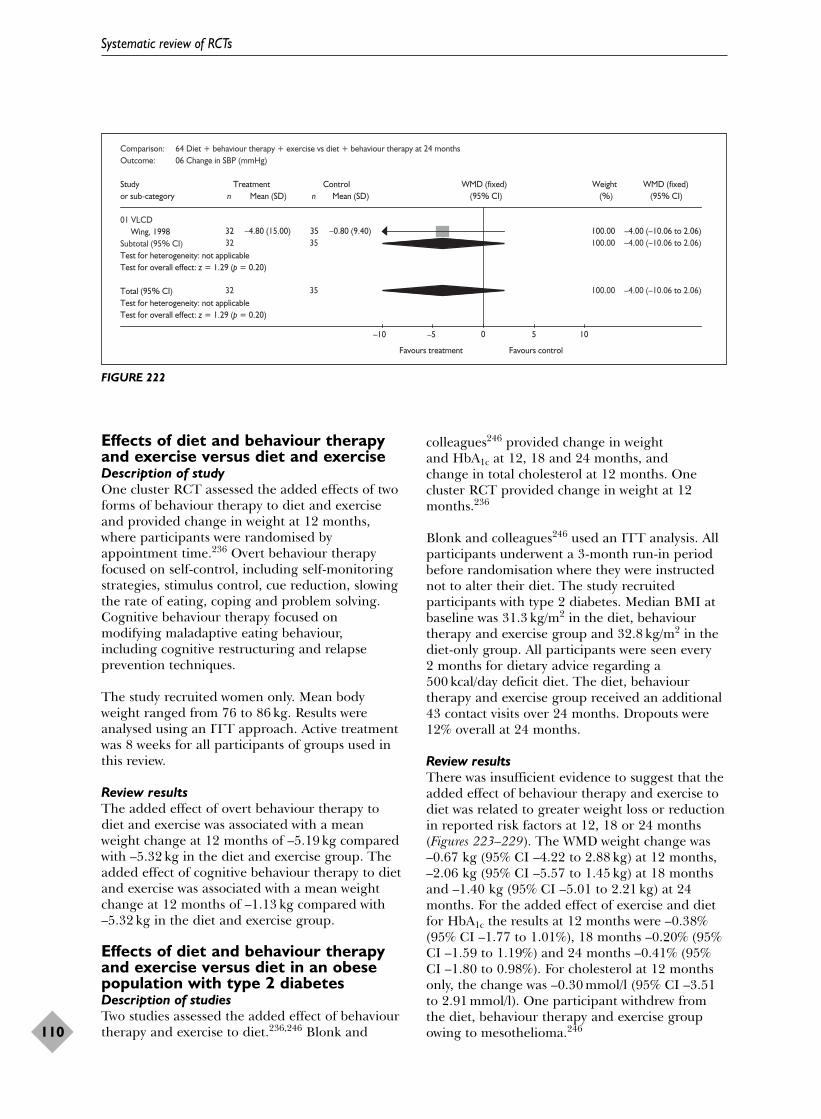
Effects of diet and behaviour therapyand exercise versus diet and exerciseDescription of studyOne cluster RCT assessed the added effects of twoforms of behaviour therapy to diet and exerciseand provided change in weight at 12 months,where participants were randomised byappointment time.236 Overt behaviour therapyfocused on self-control, including self-monitoringstrategies, stimulus control, cue reduction, slowingthe rate of eating, coping and problem solving.Cognitive behaviour therapy focused on modifying maladaptive eating behaviour,including cognitive restructuring and relapseprevention techniques.
The study recruited women only. Mean bodyweight ranged from 76 to 86 kg. Results wereanalysed using an ITT approach. Active treatmentwas 8 weeks for all participants of groups used inthis review.
Review resultsThe added effect of overt behaviour therapy todiet and exercise was associated with a meanweight change at 12 months of –5.19 kg comparedwith –5.32 kg in the diet and exercise group. Theadded effect of cognitive behaviour therapy to dietand exercise was associated with a mean weightchange at 12 months of –1.13 kg compared with–5.32 kg in the diet and exercise group.
Effects of diet and behaviour therapyand exercise versus diet in an obesepopulation with type 2 diabetesDescription of studiesTwo studies assessed the added effect of behaviourtherapy and exercise to diet.236,246 Blonk and
colleagues246 provided change in weight and HbA1c at 12, 18 and 24 months, and change in total cholesterol at 12 months. Onecluster RCT provided change in weight at 12months.236
Blonk and colleagues246 used an ITT analysis. Allparticipants underwent a 3-month run-in periodbefore randomisation where they were instructednot to alter their diet. The study recruitedparticipants with type 2 diabetes. Median BMI atbaseline was 31.3 kg/m2 in the diet, behaviourtherapy and exercise group and 32.8 kg/m2 in thediet-only group. All participants were seen every 2 months for dietary advice regarding a500 kcal/day deficit diet. The diet, behaviourtherapy and exercise group received an additional43 contact visits over 24 months. Dropouts were12% overall at 24 months.
Review resultsThere was insufficient evidence to suggest that theadded effect of behaviour therapy and exercise todiet was related to greater weight loss or reductionin reported risk factors at 12, 18 or 24 months(Figures 223–229). The WMD weight change was–0.67 kg (95% CI –4.22 to 2.88 kg) at 12 months,–2.06 kg (95% CI –5.57 to 1.45 kg) at 18 monthsand –1.40 kg (95% CI –5.01 to 2.21 kg) at 24months. For the added effect of exercise and dietfor HbA1c the results at 12 months were –0.38%(95% CI –1.77 to 1.01%), 18 months –0.20% (95%CI –1.59 to 1.19%) and 24 months –0.41% (95%CI –1.80 to 0.98%). For cholesterol at 12 monthsonly, the change was –0.30 mmol/l (95% CI –3.51to 2.91 mmol/l). One participant withdrew fromthe diet, behaviour therapy and exercise groupowing to mesothelioma.246
Systematic review of RCTs
110
Comparison: 64 Diet + behaviour therapy + exercise vs diet + behaviour therapy at 24 months Outcome: 06 Change in SBP (mmHg)
Study Treatment Control WMD (fixed) Weight WMD (fixed)or sub-category n nMean (SD) Mean (SD)
01 VLCDWing, 1998 32 –4.80 (15.00) 35 –0.80 (9.40) 100.00 –4.00 (–10.06 to 2.06)
Subtotal (95% CI) 32 35 100.00 –4.00 (–10.06 to 2.06)Test for heterogeneity: not applicableTest for overall effect: z = 1.29 (p = 0.20)
Total (95% CI) 32 35 100.00 –4.00 (–10.06 to 2.06)Test for heterogeneity: not applicableTest for overall effect: z = 1.29 (p = 0.20)
–10 –5 0 5 10
Favours treatment Favours control
(95% CI) (%) (95% CI)
FIGURE 222

Health Technology Assessment 2004; Vol. 8: No. 21
111
© Queen’s Printer and Controller of HMSO 2004. All rights reserved.
Comparison: 65 Diet + behaviour therapy + exercise vs diet at 12 months Outcome: 02 Weight change (kg)
Study Treatment Control WMD (fixed) Weight WMD (fixed)or sub-category n nMean (SD) Mean (SD)
01 600 kcal/day deficit or low fatBlonk, 1994 27 –2.74 (6.69) 26 –2.07 (6.50) 100.00 –0.67 (–4.22 to 2.88)
Subtotal (95% CI) 27 26 100.00 –0.67 (–4.22 to 2.88)Test for heterogeneity: not applicableTest for overall effect: z = 0.37 (p = 0.71)
Total (95% CI) 27 26 100.00 –0.67 (–4.22 to 2.88)Test for heterogeneity: not applicableTest for overall effect: z = 0.37 (p = 0.71)
–10 –5 0 5 10
Favours treatment Favours control
(95% CI) (%) (95% CI)
FIGURE 223
Comparison: 66 Diet + behaviour therapy + exercise vs diet at 18 months Outcome: 01 Weight change (kg)
Study Treatment Control WMD (fixed) Weight WMD (fixed)or sub-category n nMean (SD) Mean (SD)
01 600 kcal/day deficit or low fatBlonk, 1994 27 –3.14 (6.80) 26 –1.08 (6.22) 100.00 –2.06 (–5.57 to 1.45)
Subtotal (95% CI) 27 26 100.00 –2.06 (–5.57 to 1.45)Test for heterogeneity: not applicableTest for overall effect: z = 1.15 (p = 0.25)
Total (95% CI) 27 26 100.00 –2.06 (–5.57 to 1.45)Test for heterogeneity: not applicableTest for overall effect: z = 1.15 (p = 0.25)
–10 –5 0 5 10
Favours treatment Favours control
(95% CI) (%) (95% CI)
FIGURE 224
Comparison: 67 Diet + behaviour therapy + exercise vs diet at 24 monthsOutcome: 01 Weight change (kg)
Study Treatment Control WMD (fixed) Weight WMD (fixed)or sub-category n nMean (SD) Mean (SD)
02 600 kcal/day deficit or low fatBlonk, 1994 27 –3.50 (6.91) 26 –2.10 (6.51) 100.00 –1.40 (–5.01 to 2.21)
Subtotal (95% CI) 27 26 100.00 –1.40 (–5.01 to 2.21)Test for heterogeneity: not applicableTest for overall effect: z = 0.76 (p = 0.45)
Total (95% CI) 27 26 100.00 –1.40 (–5.01 to 2.21)Test for heterogeneity: not applicableTest for overall effect: z = 0.76 (p = 0.45)
–10 –5 0 5 10
Favours treatment Favours control
(95% CI) (%) (95% CI)
FIGURE 225

Systematic review of RCTs
112
Comparison: 65 Diet + behaviour therapy + exercise vs diet at 12 monthsOutcome: 01 Change in total cholesterol (mmol/l)
Study Treatment Control WMD (fixed) Weight WMD (fixed)or sub-category n nMean (SD) Mean (SD)
01 600 kcal/day deficit or low fatBlonk, 1994 27 –0.20 (5.97) 26 0.10 (5.94) 100.00 –0.30 (–3.51 to 2.91)
Subtotal (95% CI) 27 26 100.00 –0.30 (–3.51 to 2.91)Test for heterogeneity: not applicableTest for overall effect: z = 0.18 (p = 0.85)
Total (95% CI) 27 26 100.00 –0.30 (–3.51 to 2.91)Test for heterogeneity: not applicableTest for overall effect: z = 0.18 (p = 0.85)
Favours treatment Favours control
(95% CI) (%) (95% CI)
–4 –2 0 2 4
FIGURE 226
Comparison: 65 Diet + behaviour therapy + exercise vs diet at 12 months Outcome: 03 Change in HbA1c%
Study Treatment Control WMD (fixed) Weight WMD (fixed)or sub-category n n Mean (SD)Mean (SD)
01 600 kcal/day deficit or low fatBlonk, 1994 27 –0.39 (2.58) 26 –0.01 (2.58) 100.00 –0.38 (–1.77 to 1.01)
Subtotal (95% CI) 27 26 100.00 –0.38 (–1.77 to 1.01)Test for heterogeneity: not applicableTest for overall effect: z = 0.54 (p = 0.59)
Total (95% CI) 27 26 100.00 –0.38 (–1.77 to 1.01)Test for heterogeneity: not applicableTest for overall effect: z = 0.54 (p = 0.59)
Favours treatment Favours control
(95% CI) (%) (95% CI)
–4 –2 0 2 4
FIGURE 227
Comparison: 66 Diet + behaviour therapy + exercise vs diet at 18 monthsOutcome: 02 Change in HbA1c%
Study Treatment Control WMD (fixed) Weight WMD (fixed)or sub-category n nMean (SD) Mean (SD)
01 600 kcal/day deficit or low fatBlonk, 1994 27 –0.30 (2.58) 26 –0.10 (2.58) 100.00 –0.20 (–1.59 to 1.19)
Subtotal (95% CI) 27 26 100.00 –0.20 (–1.59 to 1.19)Test for heterogeneity: not applicableTest for overall effect: z = 0.28 (p = 0.78)
Total (95% CI) 27 26 100.00 –0.20 (–1.59 to 1.19)Test for heterogeneity: not applicableTest for overall effect: z = 0.28 (p = 0.78)
–10 –5 0 5 10
Favours treatment Favours control
(95% CI) (%) (95% CI)
FIGURE 228
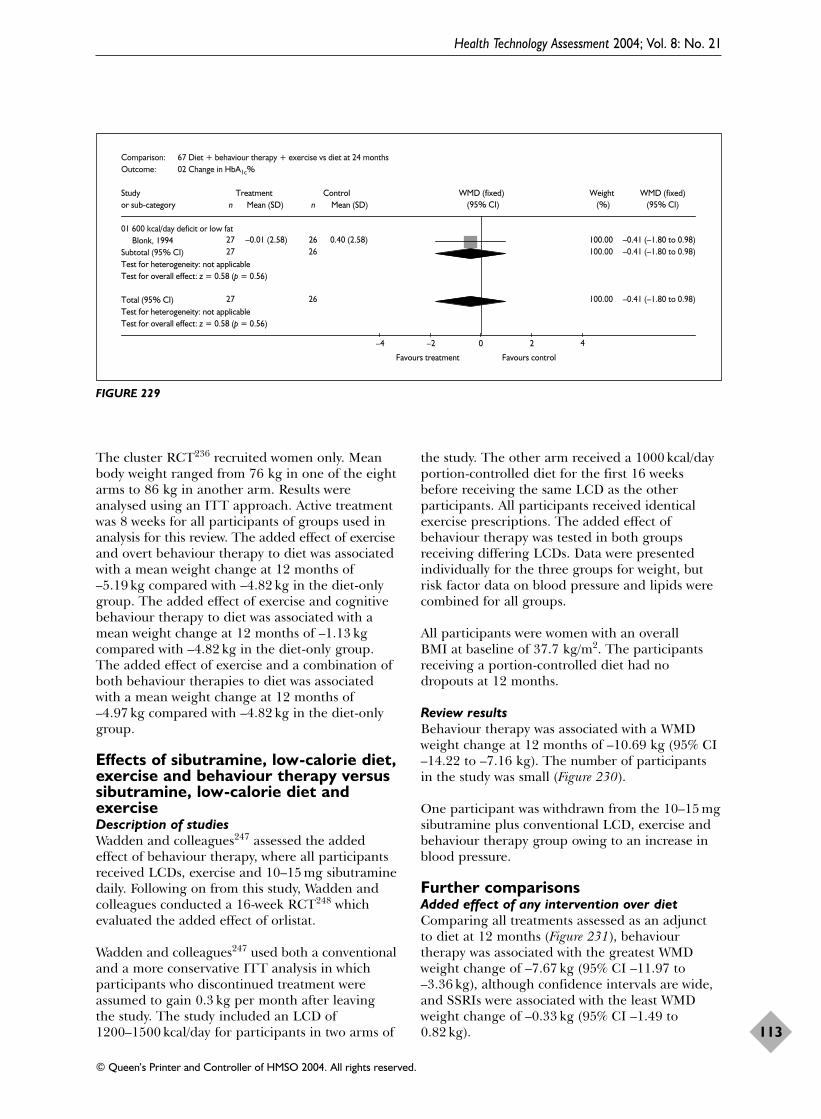
The cluster RCT236 recruited women only. Meanbody weight ranged from 76 kg in one of the eightarms to 86 kg in another arm. Results wereanalysed using an ITT approach. Active treatmentwas 8 weeks for all participants of groups used inanalysis for this review. The added effect of exerciseand overt behaviour therapy to diet was associatedwith a mean weight change at 12 months of–5.19 kg compared with –4.82 kg in the diet-onlygroup. The added effect of exercise and cognitivebehaviour therapy to diet was associated with amean weight change at 12 months of –1.13 kgcompared with –4.82 kg in the diet-only group.The added effect of exercise and a combination ofboth behaviour therapies to diet was associatedwith a mean weight change at 12 months of–4.97 kg compared with –4.82 kg in the diet-onlygroup.
Effects of sibutramine, low-calorie diet,exercise and behaviour therapy versussibutramine, low-calorie diet andexerciseDescription of studiesWadden and colleagues247 assessed the addedeffect of behaviour therapy, where all participantsreceived LCDs, exercise and 10–15 mg sibutraminedaily. Following on from this study, Wadden andcolleagues conducted a 16-week RCT248 whichevaluated the added effect of orlistat.
Wadden and colleagues247 used both a conventionaland a more conservative ITT analysis in whichparticipants who discontinued treatment wereassumed to gain 0.3 kg per month after leavingthe study. The study included an LCD of1200–1500 kcal/day for participants in two arms of
the study. The other arm received a 1000 kcal/dayportion-controlled diet for the first 16 weeksbefore receiving the same LCD as the otherparticipants. All participants received identicalexercise prescriptions. The added effect ofbehaviour therapy was tested in both groupsreceiving differing LCDs. Data were presentedindividually for the three groups for weight, butrisk factor data on blood pressure and lipids werecombined for all groups.
All participants were women with an overall BMI at baseline of 37.7 kg/m2. The participantsreceiving a portion-controlled diet had nodropouts at 12 months.
Review resultsBehaviour therapy was associated with a WMDweight change at 12 months of –10.69 kg (95% CI–14.22 to –7.16 kg). The number of participantsin the study was small (Figure 230).
One participant was withdrawn from the 10–15 mgsibutramine plus conventional LCD, exercise andbehaviour therapy group owing to an increase inblood pressure.
Further comparisonsAdded effect of any intervention over dietComparing all treatments assessed as an adjunctto diet at 12 months (Figure 231), behaviourtherapy was associated with the greatest WMDweight change of –7.67 kg (95% CI –11.97 to–3.36 kg), although confidence intervals are wide,and SSRIs were associated with the least WMDweight change of –0.33 kg (95% CI –1.49 to0.82 kg).
Health Technology Assessment 2004; Vol. 8: No. 21
113
© Queen’s Printer and Controller of HMSO 2004. All rights reserved.
Comparison: 67 Diet + behaviour therapy + exercise vs diet at 24 months Outcome: 02 Change in HbA1c%
Study Treatment Control WMD (fixed) Weight WMD (fixed)or sub-category n nMean (SD) Mean (SD)
01 600 kcal/day deficit or low fatBlonk, 1994 27 –0.01 (2.58) 26 0.40 (2.58) 100.00 –0.41 (–1.80 to 0.98)
Subtotal (95% CI) 27 26 100.00 –0.41 (–1.80 to 0.98)Test for heterogeneity: not applicableTest for overall effect: z = 0.58 (p = 0.56)
Total (95% CI) 27 26 100.00 –0.41 (–1.80 to 0.98)Test for heterogeneity: not applicableTest for overall effect: z = 0.58 (p = 0.56)
Favours treatment Favours control
–4 –2 0 2 4
(95% CI) (%) (95% CI)
FIGURE 229
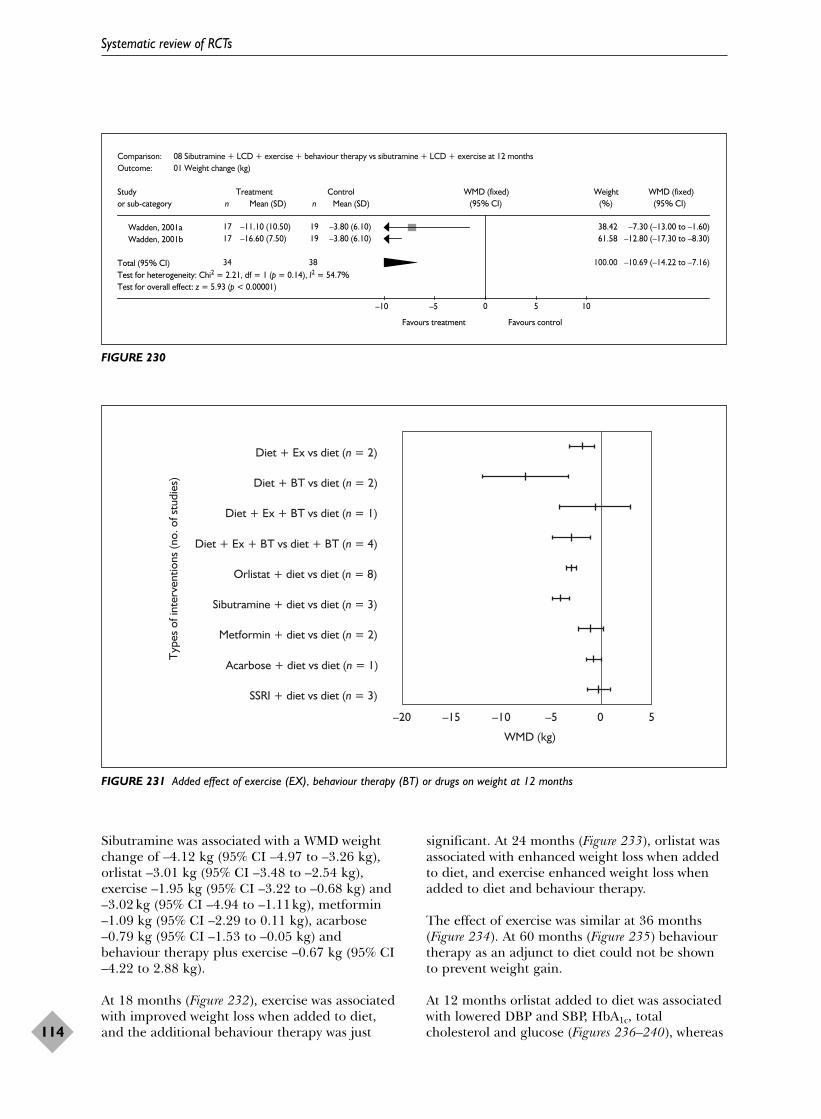
Sibutramine was associated with a WMD weightchange of –4.12 kg (95% CI –4.97 to –3.26 kg),orlistat –3.01 kg (95% CI –3.48 to –2.54 kg),exercise –1.95 kg (95% CI –3.22 to –0.68 kg) and–3.02 kg (95% CI –4.94 to –1.11kg), metformin–1.09 kg (95% CI –2.29 to 0.11 kg), acarbose–0.79 kg (95% CI –1.53 to –0.05 kg) andbehaviour therapy plus exercise –0.67 kg (95% CI–4.22 to 2.88 kg).
At 18 months (Figure 232), exercise was associatedwith improved weight loss when added to diet,and the additional behaviour therapy was just
significant. At 24 months (Figure 233), orlistat wasassociated with enhanced weight loss when addedto diet, and exercise enhanced weight loss whenadded to diet and behaviour therapy.
The effect of exercise was similar at 36 months(Figure 234). At 60 months (Figure 235) behaviourtherapy as an adjunct to diet could not be shownto prevent weight gain.
At 12 months orlistat added to diet was associatedwith lowered DBP and SBP, HbA1c, totalcholesterol and glucose (Figures 236–240), whereas
Systematic review of RCTs
114
Comparison: 08 Sibutramine + LCD + exercise + behaviour therapy vs sibutramine + LCD + exercise at 12 months Outcome: 01 Weight change (kg)
Study Treatment Control WMD (fixed) Weight WMD (fixed)or sub-category n n Mean (SD)Mean (SD)
Wadden, 2001a 17 –11.10 (10.50) 19 –3.80 (6.10) 38.42 –7.30 (–13.00 to –1.60)Wadden, 2001b 17 –16.60 (7.50) 19 –3.80 (6.10) 61.58 –12.80 (–17.30 to –8.30)
Total (95% CI) 34 38 100.00 –10.69 (–14.22 to –7.16)Test for heterogeneity: Chi2 = 2.21, df = 1 (p = 0.14), I2 = 54.7%Test for overall effect: z = 5.93 (p < 0.00001)
–10 –5 0 5 10
Favours treatment Favours control
(95% CI) (%) (95% CI)
FIGURE 230
Diet + Ex vs diet (n = 2)
Diet + BT vs diet (n = 2)
Diet + Ex + BT vs diet (n = 1)
Diet + Ex + BT vs diet + BT (n = 4)
Orlistat + diet vs diet (n = 8)
Sibutramine + diet vs diet (n = 3)
Metformin + diet vs diet (n = 2)
Acarbose + diet vs diet (n = 1)
SSRI + diet vs diet (n = 3)
Typ
es o
f int
erve
ntio
ns (n
o. o
f stu
dies
)
0 5–5–10–15–20
WMD (kg)
FIGURE 231 Added effect of exercise (EX), behaviour therapy (BT) or drugs on weight at 12 months

Health Technology Assessment 2004; Vol. 8: No. 21
115
© Queen’s Printer and Controller of HMSO 2004. All rights reserved.
Diet + Ex vs diet (n = 2)
Diet + BT vs diet (n = 1)
Diet + Ex + BT vs diet (n = 1)Typ
es o
f int
erve
ntio
ns (n
o. o
f stu
dies
)
0 5–5–10–15–20
WMD (kg)
FIGURE 232 Added effect of exercise and/or behaviour therapy on weight at 18 months
Diet + Ex + BT vs diet (n = 1)
Diet + Ex + BT vs diet + BT (n = 4)
Orlistat + diet vs diet (n = 2)
Metformin + diet vs diet (n = 1)
Typ
es o
f int
erve
ntio
ns (n
o. o
f stu
dies
)
0 5–5–10–15–20
WMD (kg)
FIGURE 233 Added effect of exercise and/or behaviour therapy, or drugs on weight at 24 months

sibutramine increased DBP (Figure 236). At 12 months acarbose added to diet was associatedwith lowered HbA1c and glucose (Figures 238and 240).
Only one study246 assessed the added effect ofbehaviour therapy and exercise to diet and wasunable to demonstrate any significant effect
on weight (Figures 231 and 233) or any risk factor at 12 months (Figures 238 and 239) and 24 months.
The addition of exercise to diet and behaviourtherapy was associated with significantly increasedweight loss at 12 and 24 months (Figures 231and 233).
Systematic review of RCTs
116
Diet + Ex vs diet (n = 1)
Diet + BT vs diet (n = 1)
Typ
es o
f int
erve
ntio
ns (n
o. o
f stu
dies
)
0 5–5–10–15–20
WMD (kg)
FIGURE 234 Added effect of exercise or behaviour therapy to diet alone on weight at 36 months
Diet + BT vs diet (n = 1)
Typ
es o
f int
erve
ntio
ns (n
o. o
f stu
dies
)
05 10–5–10–15–20
WMD (kg)
FIGURE 235 Added effect of behaviour therapy to diet alone on weight at 60 months

Comparisons of treatments versus controlFew studies compared LCD or VLCD with control,but there was a trend for these diets to producemore weight loss at 1 year than the 600 kcal/daydeficit or low-fat diet (Figures 241 and 242). OneVLCD study was associated with the greatest WMDweight change at 12 months of –13.40 kg (95% CI–18.43 to –8.37 kg). At 24 and 36 months there
was some suggestion that LCDs were moreeffective than 600 kcal/day deficit diets (Figures 243and 244).
Diet and exercise, diet and behaviour therapy, anddiet, behaviour therapy and exercise were allassociated with significantly greater weight lossthan control at 12 months (Figure 241).
Health Technology Assessment 2004; Vol. 8: No. 21
117
© Queen’s Printer and Controller of HMSO 2004. All rights reserved.
Diet + Ex + vs diet (n = 2)
Diet + Ex + BT vs diet + BT (n = 1)
Orlistat + diet vs diet (n = 7)
Sibutramine + diet vs diet (n = 2)
Metformin + diet vs diet (n = 2)
SSRI + diet vs diet (n = 1)
Typ
es o
f int
erve
ntio
ns (n
o. o
f stu
dies
)
05 10–5–10
WMD (mmHg)
FIGURE 236 Added effect of exercise, behaviour therapy or drugs on DBP at 12 months
Diet + Ex + vs diet (n = 2)
Diet + Ex + BT vs diet + BT (n = 1)
Orlistat + diet vs diet (n = 7)
Sibutramine + diet vs diet (n = 2)
Metformin + diet vs diet (n = 2)
SSRI + diet vs diet (n = 1)Typ
es o
f int
erve
ntio
ns (n
o. o
f stu
dies
)
05 10 15–5–10–15
WMD (mmHg)
FIGURE 237 Added effect of exercise, behaviour therapy or drugs on SBP at 12 months
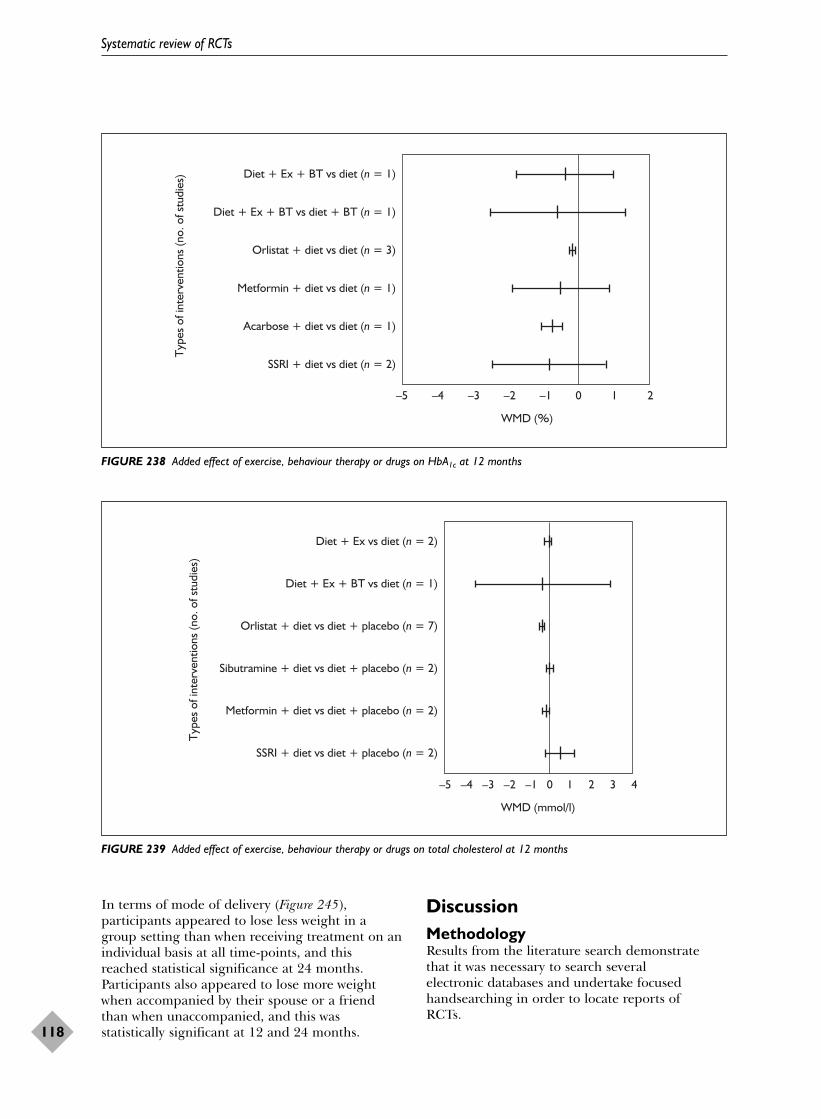
In terms of mode of delivery (Figure 245),participants appeared to lose less weight in agroup setting than when receiving treatment on anindividual basis at all time-points, and thisreached statistical significance at 24 months.Participants also appeared to lose more weightwhen accompanied by their spouse or a friendthan when unaccompanied, and this wasstatistically significant at 12 and 24 months.
DiscussionMethodologyResults from the literature search demonstrate that it was necessary to search several electronic databases and undertake focused handsearching in order to locate reports of RCTs.
Systematic review of RCTs
118
Diet + Ex + BT vs diet (n = 1)T
ypes
of i
nter
vent
ions
(no.
of s
tudi
es)
–5 –4 –3 –2 –1 0 1 2
WMD (%)
Diet + Ex + BT vs diet + BT (n = 1)
Orlistat + diet vs diet (n = 3)
Metformin + diet vs diet (n = 1)
Acarbose + diet vs diet (n = 1)
SSRI + diet vs diet (n = 2)
FIGURE 238 Added effect of exercise, behaviour therapy or drugs on HbA1c at 12 months
Diet + Ex vs diet (n = 2)
Typ
es o
f int
erve
ntio
ns (n
o. o
f stu
dies
)
–5 –4 –3 –2 –1 0 1 2 3 4
WMD (mmol/l)
Diet + Ex + BT vs diet (n = 1)
Orlistat + diet vs diet + placebo (n = 7)
Sibutramine + diet vs diet + placebo (n = 2)
Metformin + diet vs diet + placebo (n = 2)
SSRI + diet vs diet + placebo (n = 2)
FIGURE 239 Added effect of exercise, behaviour therapy or drugs on total cholesterol at 12 months

In assessing reports, of included RCTs, difficultieswere encountered. Some reports failed to providea detailed description of the interventions, suchthat it was difficult to classify the diets, ordetermine whether exercise or behaviour therapywas given. Few trials clearly reported methods ofrandomisation. All the drug trials were reported asdouble blind, but did not clearly indicate who was
blinded. It was assumed this meant the participantand healthcare provider were blinded.
Some trials used a pretreatment phase andanalysed outcomes from the start of this phase,rather than the start of randomisation. As a resultsome weight changes from randomisation had tobe estimated. Standard deviations often needed to
Health Technology Assessment 2004; Vol. 8: No. 21
119
© Queen’s Printer and Controller of HMSO 2004. All rights reserved.
Diet + Ex vs diet (n = 1)T
ypes
of i
nter
vent
ions
(no.
of s
tudi
es)
–5 –4 –3 –2 –1 0 1 2
WMD (mmol/l)
Orlistat + diet vs diet + placebo (n = 6)
Sibutramine + diet vs diet + placebo (n = 2)
Metformin + diet vs diet + placebo (n = 1)
Acarbose + diet vs diet + placebo (n = 1)
SSRI + diet vs diet + placebo (n = 2)
FIGURE 240 Added effect of exercise, behaviour therapy or drugs on fasting plasma glucose at 12 months
600 kcal (n = 11)
Typ
es o
f int
erve
ntio
ns (n
o. o
f stu
dies
)
–20 –15 –10 –5 0 5
WMD (kg)
600 kcal + Ex (n = 3)
600 kcal + Ex + BT (n = 6)
LCD (n = 1)
LCD + BT (n = 2)
LCD + Ex + BT (n = 3)
VLCD (n = 1)
VLCD + BT (n = 1)
VLCD + Ex + BT (n = 1)
FIGURE 241 Interventions versus no intervention on 12-month weight

be imputed for weight and risk factor outcomes, asdata were not provided in the papers. The impactof these estimates on the results is unclear.Sensitivity analyses could be used to assesswhether any of these assumptions affected theresults. Often participants in different arms oftrials did not receive equal numbers of contacts. Itcould be argued that contact time rather than thespecific elements of the intervention affectedparticipants’ weight and consequently risk factoroutcomes.
Most non-drug studies failed to assess risk factoroutcomes and to provide follow-up for longer than12 months. With the exception of the drug studiesand studies recruiting people with diabetes andhypertension, the sample sizes of the studies weretoo small to detect meaningful differences. A prioripower calculations to estimate sample sizes arerecommended for future RCTs. The fact that fewstatistically significant changes for risk factors couldbe demonstrated may well reflect the low statisticalpower of such studies, rather than a lack of effect.
Systematic review of RCTs
120
WMD (kg)
600 kcal (n = 2)T
ypes
of i
nter
vent
ions
(no.
of s
tudi
es)
–20 –15 –10 –5 0 5
600 kcal + Ex + BT (n = 3)
LCD + Ex + BT (n = 1)
FIGURE 242 Interventions versus no intervention on 18-month weight
WMD (kg)
600 kcal (n = 3)
Typ
es o
f int
erve
ntio
ns (n
o. o
f stu
dies
)
–20 –15 –10 –5 0 5
600 kcal + Ex (n = 1)
600 kcal + Ex + BT (n = 3)
LCD (n = 1)
VLCD + BT (n = 1)
VLCD + Ex + BT (n = 1)
FIGURE 243 Interventions versus no intervention on 24-month weight

Appendix 11 summarises the quality assessment ofthe included RCTs, from which it is clear that ITTanalysis was rarely performed. Future studies couldalso be improved by vigorous chasing up ofdropouts. The method of including dropouts infinal analyses by using an LOCF approach carriesan inherent danger of overestimating group
weight loss. Most people will regain weight afterdropping out. It might be better to presume thatdropouts return to baseline weight or regainweight at a certain rate that matches the naturalhistory of obesity from time of dropout to the trialend-point.
Health Technology Assessment 2004; Vol. 8: No. 21
121
© Queen’s Printer and Controller of HMSO 2004. All rights reserved.
WMD (kg)
600 kcal (n = 2)T
ypes
of i
nter
vent
ions
(no.
of s
tudi
es)
–20 –15 –10 –5 0 5
600 kcal + Ex + BT (n = 1)
LCD (n = 1)
FIGURE 244 Interventions versus no intervention on 36-month weight
Group vs Indiv at 12 m (n = 3)
Mod
es o
f int
erve
ntio
ns b
y tim
e (n
o. o
f stu
dies
)
–15 –10 –5 0 5 10 15
WMD (kg)
Group vs Indiv at 18 m (n = 1)
Group vs Indiv at 24 m (n = 1)
Group vs Indiv at 60 m (n = 1)
Family vs Indiv at 12 m (n = 4)
Family vs Indiv at 18 m (n = 2)
Family vs Indiv at 24 m (n = 1)
Family vs Indiv at 43 m (n = 1)
Family vs Indiv at 48 m (n = 1)
FIGURE 245 Effect of mode of delivery on weight over time. Indiv, individual; m, months

Few reports gave clinical outcomes, quality of lifedata or economic outcomes. If the value ofinterventions other than weight loss or risk factordata is to be assessed, for example psychologicaleffects or costs to society, it is vital that futureRCTs assess such outcomes.
The studies often recruited from very selectpopulation groups. More studies are required inolder and more obese populations (BMI> 40 kg/m2), populations outside North America,primary care rather than specialist obesity clinics, and groups at risk of developingcomplications from obesity, or already possessingco-morbidities.
Systematic reviewA summary table of weight loss results is presentedin Appendix 12. In general, few studies reportedoutcomes past 1 year, and many of the RCTs hadsmall numbers of participants and thus had lowstatistical power. Weight change data were in somecases skewed, with a few people losing a lot ofweight. In such cases the assumptions behind theWMD analysis may not hold.
Drug interventionsOrlistat and sibutramineOrlistat and sibutramine were associated withsimilar weight changes at 12 months, –3.01 kg(95% CI –3.48 to –2.54 kg) for orlistat and –4.12kg (95% CI –4.97 to –3.26 kg) for sibutramine.These weight changes were little changed at latertime-points, –3.26 kg (95% CI –4.15 to –2.37 kg)at 24 months for orlistat and –3.40 kg (95% CI–4.45 to –2.35 kg) at 18 months for sibutramine.However, the data for sibutramine at 12 monthsrepresent weight loss studies and at 18 monthsweight maintenance in the STORM study.64–70
These weight changes appear small, but arecomparable to those in other trials wherebeneficial clinical outcomes occurred, for exampleprevention of diabetes in the FDPS167–171 andreduction in the need for hypertensive medicationin the DISH study.99–103 However, similar weightlosses are not necessarily associated with the samechange in risk factors.
Orlistat and sibutramine appear to have differenteffects on lipids and blood pressure. Weightreduction with sibutramine was associated with asignificant beneficial effect on HDL cholesteroland triglycerides at 12 months of 0.10 mmol/l(95% CI 0.04 to 0.15 mmol/l) for HDL cholesteroland –0.16 mmol/l (95% CI –0.26 to –0.05 mmol/l)for triglycerides, but not on any other risk factors.However, in the orlistat weight reduction studies,
triglycerides were the only risk factor that orlistatdid not appear to affect. Orlistat for weightreduction was associated with decreased totalcholesterol at 12 months (–0.34 mmol/l, 95% CI –0.41 to –0.27 mmol/l), decreased LDLcholesterol at 12 months (–0.29 mmol/l, 95% CI –0.34 to –0.24 mmol/l), and decreased HDLcholesterol at 12 months (–0.03 mmol/l, 95% CI–0.05 to –0.01 mmol/l).
In the sibutramine weight reduction studies, anincrease in blood pressure at 12 months wasobserved of 1.16 mmHg (95% CI –0.60 to2.93 mmHg) for SBP and of 2.04 mmHg (95% CI 0.89 to 3.20 mmHg) for DBP. In the weightreduction studies of orlistat, however, a fall in bothSBP (–2.02 mmHg, 95% CI –2.87 to –1.17 mmHg)and DBP (–1.64 mmHg, 95% CI –2.20 to–1.09 mmHg) was observed.
The apparent beneficial effect of sibutramine onweight and risk factors needs to be balancedagainst the potential increase in blood pressure.Whether this reduces possible long-term benefitson cardiovascular disease remains unclear frompresent evidence.
Only one RCT assessed weight change 3 monthsafter sibutramine was stopped, and reportedweight regain amongst the active treatmentparticipants at nearly twice the rate of the placebo group.58 Future drug studies need toassess weight and risk factor change after cessationof the drug.
Present UK NICE guidelines23 recommend thatorlistat is prescribed only after a weight loss fromdieting of 2.5 kg over the preceding month, inpeople with a BMI ≥ 28 kg/m2 with risk factors orBMI ≥ 30 kg/m2 without risk factors. It isrecommended that orlistat only be continued ifweight loss is over 5% in the first 3 months oftreatment, and 10% in the first 6 months.Treatment is not usually continued beyond 1 yearand never beyond 2 years. Similarly, forsibutramine, the NICE guidelines24 recommenduse for people with a BMI ≥ 27 kg/m2 with riskfactors, or ≥ 30 kg/m2 without risk factors. It isadvised that treatment continuation requires a 2-kg weight loss in the first 4 weeks and a 5%weight loss from the start of treatment in the first3 months. Sibutramine treatment is notrecommended beyond 12 months. None of theorlistat or sibutramine trials adhered to theserecommendations, which would reduce theproportion of overweight and obese eligible forlong-term drug treatment. Those selected for
Systematic review of RCTs
122

long-term drug treatment might be moreresponsive to drug treatment.
MetforminMetformin was relatively ineffective as therapy forweight reduction, at 12 months –1.09 kg (95% CI –2.29 to 0.11 kg) and at 24 months (–0.50 kg,95% CI –4.02 to 3.02 kg). The UKPDS85–93
showed that metformin was associated with lessweight gain over 15 years than diet alone,although the WMD was not significant. However,metformin was associated with significantlydecreased all-cause mortality and MI-relatedmortality at 10 years in the UKPDS.85–93
Metformin was associated with a significantbeneficial effect over diet for total cholesterol at12 months (–0.17 mmol/l, 95% CI –0.32 to –0.02 mmol/l) and 24 months (–0.72 mmol/l, 95%CI –1.30 to –0.14 mmol/l), although the 12-monthdata are based on one small study.84 Metforminwas associated with improved glycaemic control.Fasting plasma glucose decreased at 12 months(–0.20 mmol/l, 95% CI –0.40 to 0 mmol/l) and 5 years (–1.30 mmol/l, 95% CI –1.91 to–0.69 mmol/l), and HbA1c was improved at 5 years(–1.08%, 95% CI –1.50 to –0.66%) and 15 years(–2.31%, 95% CI –3.85 to –0.77%). Metforminshowed a trend towards increased SBP and DBP at12 and 24 months.
SSRIs and acarboseAt 12 months there was insufficient evidence tosuggest SSRIs for weight reduction (–0.33 kg, 95%CI –1.49 to 0.82 kg) or for risk factor reduction.The one acarbose study was associated with asignificant beneficial effect on glycaemic control,with an observed decrease in HbA1c (–0.76%, 95%CI –1.05 to –0.47%) and fasting plasma glucose(–1.36 mmol/l, 95% CI –1.96 to –0.75 mmol/l) intype 2 diabetics over 12 months.94–98 Acarbose hadlimited effect on weight reduction over 12 months(–0.79 kg, 95% CI –1.53 to –0.05 kg).
Drug studies overallThere were no studies which assessed the addedeffect of drug treatment to a combination of diet,exercise and behaviour therapy. Guidelinesrecommend the use of orlistat and sibutramineonly as an adjunct to diet, exercise and behaviourtherapy.18
One study247 assessed the added effect ofbehaviour therapy to sibutramine, diet andexercise. Weight change at 12 months of –10.69 kg(95% CI –14.22 to –7.16 kg) was observed. Thisresult is in line with the effect of adding behaviour
therapy to diet in the non-drug trials. Future trialsshould investigate adding lifestyle interventions todrug treatment.
The majority of drug studies used a low-fat or600 kcal/day deficit diet for all participants. Theplacebo arms of the drug studies were associatedwith less weight loss than the active treatmentarms of studies using a low-fat or 600 kcal/daydeficit diet. This might suggest that participants indrug studies do not adhere to the diet aseffectively, relying on the action of the drug orplacebo. This could enhance the effect of theactive drug treatment in such trials.
Dietary interventionsOf all the diets VLCDs were associated with themost weight change at 12 months (–13.40 kg, 95%CI –18.43 to –8.37 kg) compared with notreatment; however, this is based on one smallstudy by Stenius-Aarniala and colleagues.148 Thesame trial observed some beneficial effects oncontrol of asthma. There were no longer term datacomparing VLCDs with no treatment past 12months. No risk factor changes were available forVLCDs compared with no treatment. Studiesdirectly comparing VLCDs with LCDs or 600kcal/day deficit or low-fat diets were small andunable to demonstrate statistically significantdifferences in weight, although there was a trendfor the VLCDs to produce more weight loss.
There was a trend for LCDs to produce moreweight loss than low-fat or 600 kcal/day deficitdiets at 12, 24 and 36 months, based on studiesthat compared these diets with no treatment.However, in the only trial that directly comparedthese two diets the trend was in the oppositedirection.149 No risk factor data were available toallow comparisons between LCDs and low-fat or600 kcal deficit diets. Difficulties in classification ofsome diets may account for some of thesefindings.
There was no evidence to suggest that PSMF dietswere to be preferred to LCDs or VLCDs for weightloss, although one study suggested improvedglycaemic control in type 2 diabetes.154,155
A low-fat or 600 kcal/day deficit diet was associatedwith significant weight changes at 12 months(–5.31 kg, 95% CI –5.86 to –4.77 kg), 24 months(–2.35 kg, 95% CI –3.56 to –1.15 kg) and 36 months (–3.55 kg, 95% CI –4.54 to –2.55 kg).There was an associated improvement in bloodpressure, lipids and fasting plasma glucose withthis diet at 12 months. Very limited data on risk
Health Technology Assessment 2004; Vol. 8: No. 21
123
© Queen’s Printer and Controller of HMSO 2004. All rights reserved.

factors after 12 months were available, with atrend for blood pressure to be decreased by thesediets at 36 months. Data from DISH,99–103
HOT,107 HPT108–114 and Swinburn andcolleagues128,129 suggest that this diet can preventthe development of diabetes, improve bloodpressure control and reduce antihypertensivemedication for up to 3 years.
The low-fat or 600 kcal/day deficit diet categorycontained the greatest number of RCTs (12) in anyone comparison, and is the diet most commonlyadvised in the NHS.
Diet; diet and exercise; diet and behaviourtherapy; diet, exercise and behaviour therapyversus controlWeight loss was greater in all comparisons at 12 months than at 24 months, except for LCDwhere weight loss was little changed between 12and 24 months. Based on comparisons ofinterventions versus control for weight, there wasno clear evidence to confirm the benefit of addingexercise and/or behaviour therapy to diet forweight loss. However, because the studyinterventions differed so much it is not possible todraw conclusions about the added effect ofexercise and/or behaviour therapy to diet forweight loss. The RCTs where the added effects ofexercise and/or behaviour therapy were directlyevaluated are discussed below.
No clear pattern emerged for risk factors whencomparing these differences between interventionsversus control treatment. However, the FDPS167–171
suggested that diet and exercise can prevent thedevelopment of diabetes in people with impairedglucose tolerance (IGT).
The TONE,210–224 TOHP I and II studies197–209
examined the effect of diet, exercise andbehaviour therapy. The TONE study210–224 wasassociated with a 35% reduction in hypertensionor cardiovascular events. Both TOHP I197–203 andTOHP II204–209 were associated with significantreductions in the numbers of people developinghypertension.
Exercise and behaviour therapy as adjuncts todietThe addition of a planned programme of exerciseto diet was associated with an additional weightchange of –1.95 kg (95% CI –3.22 to –0.68 kg) at 12 months. Only the very small studies byPavlou153 examined exercise as an adjunct to dietafter 12 months. These found a continuing weightchange of –7.63 kg (95% CI –10.33 to –4.92 kg) at
18 months and –8.22 kg (95% CI –15.27 to–1.16 kg) at 36 months. At 12 months there was anassociated improvement in HDL cholesterol(+0.10 mmol/l, 95% CI 0.06 to 0.14 mmol/l) andtriglycerides (–0.18 mmol/l, 95% CI –0.31 to–0.06 mmol/l). Other risk factors were notsignificantly changed by the addition of exercise at12 months, although the small study by Pavlouand colleagues153 suggested lowered SBP and DBPat 18 months.
The addition of an exercise programme to dietand behaviour therapy was also associated withenhanced weight change (–3.02 kg, 95% CI –4.94to –1.11 kg) at 12 months and at 24 months(–2.16 kg, 95% CI –4.20 to –0.12 kg). There wereno statistically significant associated changes inrisk factors for this comparison.
The addition of behaviour therapy to diet wasassociated with greater weight change at 12 months (–7.67 kg, 95% CI –11.97 to –3.36 kg)than adding exercise (–1.95 kg, 95% CI –3.22 to–0.68 kg); however, the number of participants inthe studies with added behaviour therapy was verysmall. The added effect of behaviour therapy wasstill just significant at 18 months (–4.18 kg, 95%CI –8.32 to –0.04 kg), but not at 36 or 60 months.
Two studies236,246 examined the added effect ofexercise and behaviour therapy to diet, and wereunable to demonstrate any significant changes inweight or risk factors at 12 or 18 months.
These data suggest that a prescribed exerciseregimen or behaviour therapy makes an importantcontribution to weight loss, and is important inlong-term weight maintenance. There is lessevidence to determine whether both behaviourtherapy and exercise should be added to diet, formodification of weight or risk factors. However,results from the TONE,210–224 TOHP I and IIstudies197–209 suggest benefits to clinical outcomesfrom diet, exercise and behaviour therapy. Tosome extent there are overlaps between exerciseand behaviour therapy, in that both may increasecounselling time and therapist contact, andbehaviour therapy may seek to improve physicalactivity.
Modes of deliveryFamily therapy was associated with more weightchange than individual treatment at 12 months(–2.96 kg, 95% CI –5.31 to –0.60 kg) and 24 months (–5.61 kg, 95% CI –10.98 to –0.24 kg).However, there was insufficient evidence to suggestthat individual therapy was more effective in
Systematic review of RCTs
124

producing weight loss compared with grouptherapy, although the observed direction of effectwas towards individual therapy. This hasimportant cost implications for service delivery.
Overall discussionIn general, drug trials provided the clearestpointers to the management of obesity in adults,because they had sufficient statistical power todetect outcomes, unlike non-drug studies. Orlistatwas associated with slightly less weight loss, buthad a more beneficial effect on risk factors thansibutramine. Metformin, however, was the onlydrug that had a study designed to evaluatemortality and showed an association with beneficialeffects on mortality.
There were very few data on risk factor changesfor diets, other than for the low-fat or 600 kcal/day deficit diet, despite some suggestionthat VLCDs and LCDs were associated with moreweight loss. The low-fat or 600 kcal/day deficit diet was associated with benefits on weight, riskfactors and clinical outcomes, such as theprevention of diabetes and improvement inhypertension, and effects appeared to persist forup to 3 years.
Exercise or behaviour therapy added to diet wasassociated with greater weight loss, especially inthe long term. The FDPS167–171 provided evidencethat diet and exercise together could prevent type 2 diabetes. There was no comparable evidenceavailable for the effect of a diet and behaviourtherapy without exercise on diabetes. Most of theexercise programmes provided in the studies herewere supervised. Activities included walking,jogging and cycling, and were usually tailored toproduce 60–80% of the maximum heart rate, withtypical sessions being 20–90 minutes three times aweek. Behaviour therapy varied between trials, butoften included self-monitoring, slowing the rate ofeating, reducing eating cues, responding to socialpressures, preplanning and relapse preventiontechniques. Trained psychologists were often usedto deliver these techniques.
Exercise programmes and behaviour therapy arenot well established for the management of obesityin the NHS. Consideration needs to be given tohow the interventions used in the trials describedhere could be implemented in the UK, given thatthe trials were mostly undertaken in the USA orScandinavia. Exercise and behaviour therapy arenot necessarily mutually exclusive, although thevery limited current evidence would suggestexercise as the first approach.
The effect of exercise and behaviour therapyadded to diet on weight and risk factors was lessclear; the TONE,210–224 TOHP I and IIstudies197–209 found an association with improvedclinical outcomes from behaviour therapy andexercise added to a low-fat or 600 kcal/day deficitdiet.
The weight changes produced by RCTs of drug orlifestyle interventions are less than those found inthe review of surgical interventions,27 wherebetween 23 and 37 kg more weight was lost 2 years after surgery compared with conventionaltreatment. However, the participants in surgicalstudies averaged around 120 kg, whereasparticipants in the trials examined here averagedaround 80–100 kg in weight, with BMIs rarelyabove 40 kg/m2.
Despite the smaller weight losses with the drug or lifestyle interventions, there was evidence ofclinical benefit, in terms of diabetes andhypertension.
Future RCTs should have adequate statisticalpower to determine long-term outcomes, whichshould include not only weight, but also riskfactors, morbidity and mortality, quality of life andeconomic outcomes. The methodological qualityof such trials should be improved and the resultsshould be reported according to the guidelines ofthe CONSORT statement.249
More studies are needed in high-risk populations,whether defined by BMI (> 40 kg/m2), ethnic group, older age, risk factors or co-morbidities.
Drug trials should include lifestyle interventions,such as behaviour therapy and exercise, inaddition to diets as standard management. As theprescription of drugs for the management ofobesity may be limited by time, drug trials shouldfollow up participants after cessation of the drugtrial.
As this review was limited to adults with a BMI≥ 28 kg/m2, it did not assess the interventionsexamined in this systematic review for people withlower BMIs, that is, for the prevention of obesity.The authors strongly recommend that such areview be undertaken, which should includecommunity interventions that have been excludedby the BMI cut-off. There was also insufficienttime in this review to examine the effects ofexercise or behaviour therapy alone, which shouldbe undertaken.
Health Technology Assessment 2004; Vol. 8: No. 21
125
© Queen’s Printer and Controller of HMSO 2004. All rights reserved.

Further questions that should be asked includewhat type of exercise or behaviour therapy is best,what frequency of contact is best, what type of dietin the long term is appropriate and what is therole for booster sessions.
AddendumSince this systematic review of RCTs was completedmany more eligible trials have been published.Major ongoing and recently reported trials arelisted in Appendix 9.
The XENDOS trial evaluated the use of xenical(orlistat) compared with placebo in the preventionof type 2 diabetes in people with obesity, with orwithout impaired glucose tolerance.250 The trialreported a relative risk reduction for type 2diabetes of 37.3%251 with the use of orlistat. As aconsequence of this trial the product licence fororlistat has recently been revised to allowprescription for more than 2 years. NICEguidelines for orlistat are unchanged.23 Otherorlistat trials252,253 have found the use of orlistat inpeople with type 2 diabetes was associated withimproved diabetic control, reduced cardiovascularrisk factors and reduced use of medications fortype 2 diabetes, including insulin, compared withplacebo.
A further trial of 20 mg sibutramine comparedwith placebo has examined effectiveness in people
with obesity and hypertension well controlled byangiotensin-converting enzyme inhibitors with orwithout thiazide diuretic therapy.254 Participantstreated with sibutramine lost 4.5 kg over 52 weeks,compared with 0.4 kg in the placebo group.Hypertension remained well controlled in bothgroups, but after 52 weeks the differences betweenplacebo and sibutramine groups for both meanSBP and DBP were approximately 3 mmHg, infavour of the placebo group.
The Diabetes Prevention Program255–257 compared3234 people with elevated fasting and postglucoseload plasma glucose to metformin and usual care;placebo and usual care; or low-fat diet, exerciseand behaviour therapy. After an average follow-up period of 2.8 years, the lifestyleintervention was associated with a reduction in the incidence of type 2 diabetes by 58% (95% CI48 to 66%) and metformin by 31% (95% CI 17 to43%) compared with placebo. The lifestyleintervention was significantly more effective thanmetformin.
In the Stop-NIDDM trial,258 the use of acarbose100 mg three times daily compared with placebowas evaluated in people with obesity and impairedglucose tolerance over a mean follow-up period of3.3 years. The reported difference in body weightwas 0.77 kg (95% CI 0.01 to 1.54 kg) in favour ofacarbose. The relative hazard of developingdiabetes was reduced by acarbose (0.75, 95% CI0.63 to 0.90).
Systematic review of RCTs
126

IntroductionObesity is now being recognised as a chronicdisease and described as an escalating epidemic bythe World Health Organization (WHO).1 Evidencesuggests that a weight loss of 10% is oftenassociated with marked clinical improvement inco-morbidities.259 A review by Pi-Sunyer260 lookedat studies that lasted for more than a year anddemonstrated that even modest weight loss has abeneficial impact on the risk factors and diseasestates associated with obesity. However, there is alack of evidence from long-term investigations onthe effects of weight loss.
For the long-term epidemiological evidence, asystematic review to identify the effects of reduced BMI on long-term health outcomes wasconducted and associated statistical modellingconducted.
Protocol developmentA protocol was formulated for the epidemiologicalsystematic review (Appendix 15). The protocoldescribes the objectives, the inclusion andexclusion criteria for considering studies for thereview, including type of studies, the type ofparticipants, the type of outcome measured, thesearch strategy for the identification of studies andthe methods of the review.
Criteria for considering studies inthis reviewTypes of studiesStudies were eligible for inclusion if they wereprospective or cohort studies on people with BMIof 28 kg/m2 or more. A cut-off BMI of 28 waschosen to include those borderline overweightpeople about to become obese. Initially, studieswith a long-term follow-up of 5 years were to beincluded in the review. However, studies having atleast 5 years of follow-up were only found forsurgical interventions. Hence, non-surgical studieswith a minimum follow-up of 2 years were alsoincluded in this review. To allow weight change tobe estimated, only studies that had at least twomeasurements of body fat (e.g. weight, BMI orwaist–hip ratio) were included in the review. The
studies were also required to have at least one ofthe specified outcomes (e.g. mortality from allcauses). There were no language restrictions inconsidering studies for inclusion. The originalprotocol specified that studies with a follow-up of80% would be included in the review. During thereview process it became apparent that, althoughstudies reported follow-up periods over a longtime, the number of people who were followed upat the end of the study was often very small.Consequently, studies with lower percentages offollow-up were included in the review.
Studies on children and people with bulimia wereexcluded. Population-based studies with smallsubgroups of people with obesity were alsoexcluded owing to very small sample sizes.
Although not one of the primary objectives,studies on weight cycling were also included tomeasure the effect of weight cycling on theoutcome measures.
Types of participantsAll participants from the age of 18 to 70 yearswere included. The upper age limit of 70 yearswas judged to be appropriate owing to thepotential confounding effect of old age on BMIand subsequently on the health risks associatedwith obesity.
The results of this review will be applied to the UKpopulation. Consequently, studies were restrictedmainly to those using Caucasian populations.However, studies with African–Americans,Japanese Americans and British Asians were alsoconsidered, recognising that these ethnicminorities were likely to have adopted the cultureand dietary habits of Caucasian people and inturn may have similar risks of obesity-relatedillness.
Types of outcome measuresThe health consequences of obesity vary frompremature death to co-morbidities, withconsiderable impact on the quality of life withsocial and economic implications. A briefliterature search was undertaken and opinions ofclinical experts were obtained before the outcomemeasures of the review were finalised.
Health Technology Assessment 2004; Vol. 8: No. 21
127
© Queen’s Printer and Controller of HMSO 2004. All rights reserved.
Chapter 3
Epidemiological review and modelling

Based on the prevalence of the conditions in thegeneral population and the relative risk ofdeveloping these conditions in people with obesity,the outcome measures sought are listed in theprotocol (Appendix 15), for example, mortalityfrom all causes, morbidity and CHD.
Systematic literature searchSystematic electronic bibliographicdatabase searchingThe electronic databases MEDLINE, EMBASE,CINAHL and HealthSTAR were searched. Thesearch terms were identified by investigating theMeSH terms (indexing system used in eachdatabase) as well as text word searching (searchingwords in the titles and the abstracts). The searchstrategy adopted for each of the four databases isincluded in Appendix 16. Search terms foreconomic modelling were included in theMEDLINE search. Because of time constraints thesearch terms were restricted to those forepidemiological modelling only in other databases.
Other methods used to identifyprospective studiesReference lists of all the included studies andreview articles were checked to identify any otherrelevant studies. Authors of identified studies wereapproached for further details if required,especially for details of people with obesity withingeneral population samples.
Methods of reviewManagement of potentially eligiblestudiesAll potentially eligible studies were entered intoreference managing software package ReferenceManager 9 with a unique reference identifier.One-hundred abstracts and study titles were readindependently by two researchers. Subsequentconsultation gave a check for consistency.Thereafter, the remaining abstracts were splitbetween the two researchers. However, regularconsultation between the researchers meantcontinual clarification regarding inclusion queries.During the course of the epidemiological searchany articles relevant for the economic modellingwere sent to the economist for evaluation andinclusion.
Quality assessment of the studiesFull articles of all the studies that met the selection criteria were obtained and assessed for
methodological quality. Initially, assessments werecarried out independently by two researchers.After a high level of consistency had been attained,assessment was undertaken by one researcher andcrossed over for checking. Any doubts about theinclusion of a study were resolved by discussion.
Data extraction and storageA data extraction form was designed and pilotedon 13 studies. This was double-checked andchanges were made where necessary. The finalversion of the data extraction form may be foundin Appendix 17.
The data from the eligible studies were enteredonto a Microsoft Access database to accommodateboth quantitative and qualitative information. Thestudies were grouped according to the outcomesspecified in the protocol.
Epidemiology statistical methodsThe aim for this review was to investigate howweight differences related to differences in healthoutcomes in the long term. Where results fromstudies could be quantitatively combined,statistical meta-analysis was undertaken todetermine the effect of weight loss over a numberof studies. In these cases the results were initiallytested for evidence of heterogeneity before thestudies could be combined.
Homogeneity/heterogeneityOne of the basic assumptions for combining fixedeffects models is whether it is reasonable toassume that all the studies to be combined areestimating a single underlying populationparameter. To assess this, one of the most commontests for heterogeneity has been used for this partof our review. This method is as introduced inChapter 8 of the HTA review on “Systematicreviews of trials and other studies” by Sutton andcolleagues.261
The process tests the hypothesis:
Ho: �1 = �2 = … = �k
where �I are the underlying true treatment effectsof the corresponding ith studies; versus thealternative that at least one of the effect sizes �Idiffers from the remainder.
To do this one needs to calculate
(∑k
iwiTi)
2
Q = ∑k
iwiTi
2 – ————∑iwi
Epidemiological review and modelling
128
where k is the number of studies being combined,Ti is the treatment effect estimate in the ith studyand wi is the weight of that study, usually theinverse of the sampling variance.
The test statistic Q is approximately distributed asa chi-squared distribution with k–1 degrees offreedom. Consequently, if the value of Q exceedsthe upper critical value of the chi-squareddistribution with k–1 degrees of freedom then theobserved variance in the study effect sizes issignificantly greater than the other studies and Hoof homogeneity would be rejected in favour of thealternative hypothesis.
Methods of estimating measures of spreadMany of the studies selected in this reviewreported their results as means with standarddeviations or standard errors. The analysisrequired the weight differences and each outcomedifference (for RCTs this implies comparisons tobaselines rather than the traditional comparisonto control groups). However, several papers didnot provide mean differences per se, only givingthe means of each variable at each time-point withsome measure of spread about those means. Thestraight differences of these means acted asestimates of the mean differences, albeit crudelysince the sample sizes were not always the same atthe beginning and end of the studies. In thesecases a measure of spread also needed to beestimated.
Methods of estimating standard deviations weredeveloped for each variable by investigating therelationship between observed means ofdifferences and associated standard deviations.Work based on the RCTs section in this review bycolleagues (Appendices 13 and 14) has shownfairly simple relationships. These relationshipswere re-examined for longer term studies and aregiven in Appendix 26.
Statistical modellingIn some instances it was possible to model theeffects of weight loss on certain health outcomes.
Correlation and linear regression, to predictweight differences from each of the outcomedifferences, were considered. Weighted linearregression and simple linear regression werecompared. However, many of the comparisonswere simple and sometimes were only descriptive,given the very different types of measures and trialdesigns.
Results of systematic literaturesearchThe total number of possible relevant studiesidentified by the systematic search ofepidemiology literature is given in Table 11.
Included and excluded eligible studiesIn total, 7567 abstracts and titles were read and288 possibly useful studies were identified. Fullpapers of the identified articles were obtained andcritically appraised. Many full papers proved notto fulfil the eligibility criteria for inclusion in thereview (e.g. no actual weight loss was recorded orthe follow-up time was too short). After criticalappraisal 39 potentially eligible prospectivestudies were identified.
These studies were not always conducted onpeople with obesity only, but sometimes were forgeneral and community populations with asubgroup of people with obesity. For eight suchstudies these subgroup results were not presentedseparately as required for this review. The authorsof these eight studies were contacted requestinginformation specifically on the subgroup of peoplewith obesity. Two authors provided the relevantinformation in time, but the other six subgroupstudies were reluctantly excluded from the review.
Out of the 33 remaining studies that were eligiblefor the review, five studies were not analysed owingto the information in their result sections beingincomplete for the present purposes. Althoughassociated authors were contacted the informationremained incomplete at the time of writing and so
Health Technology Assessment 2004; Vol. 8: No. 21
129
© Queen’s Printer and Controller of HMSO 2004. All rights reserved.
TABLE 11 Total number of possible prospective studies identified by the literature search
Source/database Years searched No. of abstracts
MEDLINE 1966 to May 2001 6038EMBASE 1980 to May 2001 1054HealthSTAR (excluding MEDLINE) 1975 to December 2000 15CINAHL 1982 to April 2001 460
Total 7567

these studies were excluded from the review. The11 excluded studies (six with a subgroup of peoplewith obesity, five with inadequate information) arelisted in Appendix 18. Although the remit for thereview was prospective cohort studies, a fewcontrolled trials were identified as having long-term results for the specified outcomes. Thesetrials were included in the review provided therewas weight loss for the specific groups from thetrial. The controlled trials included bothrandomised and non-randomised trials.Consequently, three non-randomised trials and six
randomised trials were included. This gave a finaltotal of 37 studies included in this review. Theepidemiology review selection process issummarised in Figure 246 as a flow diagram.
Description of eligible studiesThere were no studies identified on the outcomessuch as cholelithiasis, arthritis, cancers, asthma,non-alcoholic steatohepatitis (NASH), urinaryincontinence and bone fractures. For stroke, onlyone study was identified, which could not beanalysed because of a lack of necessary information
Epidemiological review and modelling
130
Potentially relevant publications identified and screened for retrieval: 7567
Papers retrieved for more detailed evaluation: 288
Papers excluded on the basis of titles and abstract (generally due to lack of suitability of study design or population): 7279
Excluded studies: 11Reasons: Could not get additional information from authors 6Could not be analysed due to lack of necessary information 5
Papers that could be included in the review: 39
Papers included after contacting authors for additional information: 28
Excluded studies: 249Reasons:General population with no obese subgroup 54Short-term follow-up 50Not prospective study 83No weight loss recorded 20No specified outcomes 40Very small sample of obese subgroup 2
Final number of studies included in the review: 37
Included studies: 9 (3 non-RCTs and 6 RCTs)Reason:Long-term results of specific outcomes
FIGURE 246 Flow diagram of the epidemiology systematic review

in the published paper. The initial protocol wasdesigned to perform statistical modelling for theeffect of weight loss on long-term healthoutcomes. However, many of the studies did notpresent the information in a form that allowed forsuch modelling. For some outcomes there waseven difficulty in comparing the data becausedifferent methods and measurements were used inindividual studies.
In the prospective cohort studies, the studypopulations were often broken into groups (e.g.men/women, intentional/unintentional weight loss,and amount of weight lost and time to loseweight). The results of this review are presentedsimilarly using their groupings. For the analysis ofthe trials, comparison was made to the baselinerather than to any control group. This approach isvery different to most Cochrane type reviewsconducted on RCTs, since in this part of thereview the focus was on weight loss per se and itslong-term effect on various health outcomes, andnot on how the weight loss was achieved.
Several studies measured more than one outcome.Here the outcomes are treated independently;consequently, studies may be included more thanonce. Table 12 summarises the number of studiesfor each outcome as specified in the protocol.
Diabetes mellitus, hypertension and lipids had thelargest number of studies. For the rest of theoutcomes, very few studies were identified thathad long enough follow-ups. The characteristics ofthe 37 studies that were included in the review aresummarised in Appendix 19a, along with detailsof the outcomes reported for each of the studies.
Methodological quality of studiesOut of the 37 studies that had some aspects thatcould be analysed, 25 studies had for the presentpurposes complete results and could besatisfactorily analysed. Of the other 12 studies,two262,263 had small follow-up proportions of about
30–40%. In addition, eight studies163,264–270 hadno sample size for the subgroup of people withobesity clearly stated, although in most casesconfidence intervals of the outcome indices weregiven so that the precision could be gauged. Twostudies271,272 had problems in their reporting. Forexample, the follow-up time reported was wide (3 months to 7 years) and no specificmeasurements were reported. In general, thequality of reporting was poor, and althoughauthors were contacted, few responded with thenecessary information in time for the analysis.
Although the average follow-up time of somestudies made them eligible for the review, thenumber of patients who were followed up at theend was low. Many studies did not report thenumber of patients followed up (or percentagefollow-up) at the end of the study (Appendix 19a),nor did they provide details of the loss to follow-up. The omission of the standard deviations andbasic information about the studied samples, forinstance the setting of the study or thedemographic details, was very common.
Some studies273–275 either had self-reported weightloss by questionnaire or this was undertakenretrospectively, or both. This study design in itselfcan be a source of selection bias and recall bias. Insome long-term follow-up studies there was notenough information about the status of weight orBMI in the period between the baseline and thefinal follow-up. Therefore, whether weight loss wasmaintained, cycled or regained could not bedetermined.
Appendix 27a shows the results of the qualityassessment form (at the end of the data extractionform given in Appendix 17) for all the studies thatwere included in this review. As can be seen fromAppendix 27b the highest quality scores are forthe RCTs or similar studies (Table 40).
There seems to be a time factor whereby the mostrecent studies had higher scores. Table 41 inAppendix 27b indicates that most of the studiesdid not adequately justify their sample sizes ordescribe the losses to follow-up. There was alsosome doubt as to whether some of the studiesallowed for the passage of time.
Results of the reviewResults of the review were analysed according tothe predetermined outcomes to assess the long-term effect of weight loss on various health
Health Technology Assessment 2004; Vol. 8: No. 21
131
© Queen’s Printer and Controller of HMSO 2004. All rights reserved.
TABLE 12 Summary of the number of studies for each outcome
Outcome No. of studies analysed
Sleep apnoea 3Mortality 5Diabetes mellitus 15Coronary heart disease 1Lipids 13Psychological well-being 2Co-morbidity (multiple) 1Hypertension 14

conditions. The studies varied tremendously withrespect to size, from some being population basedwith approximately 50,000 participants to specifictrials that only considered tens of people. Thepopulation-based studies, although large in theirown right, did not always have many peoplesuffering from obesity.
MortalityFive studies examined mortality with varioussubgroups and causes of mortality.267,273–276 Therepresentation was fair, with the largest grouphaving about 3000 people and the smallest grouphaving over 300. All-cause mortality, CVD-relatedmortality, cancer-related mortality, diabetesmellitus (DM)-related mortality and mortality dueto obesity-related cancers were represented. Thedata were also analysed by gender; amount ofweight lost [less than or more than 9kg (20 lb)];time in which the weight was lost; and whetherweight loss was intentional, unintentional orunknown.
Three out of these five studies were undertaken byWilliamson and colleagues273–275 and assessedweight loss by a retrospective questionnaire. Thismethodology could have had a bias in the initialparticipant selection and also recall. The study byRumpel and colleagues276 did not have anyspecific target population and whether the weightloss was intentional or unintentional is unclear. Tocalculate relative risk, in most cases the subgroupswere compared with similar obese groups with noweight loss. However, one study by Rumpel andcolleagues276 used a referent group comprisingpeople within the ‘normal’ weight range who wereweight stable over the period of the trial.
The mortality results were all recorded as relativerisks (RR) with 95% confidence intervals. Wherepossible the results from the different studies werecombined using meta-analysis providedhomogeneity could be assumed (as detailed in theEpidemiology statistical methods section, p. 128).To assess this the test statistic Q is calculated. Thisrequires the estimates for each study of the relativerisks and their associated standard errors. Thelatter are calculable from the 95% confidenceinterval given with each relative risk result. Thestandard error of the natural logarithm of oddsratios was calculated from knowledge of theconfidence interval and the sample sizes of thestudies.261 This method was adapted for calculatingthe standard errors of natural logarithms of therelative risks. Hence, in the equation detailing Qin the epidemiology statistical section, the Tivalues are the corresponding mean values of the
natural log of the relative risk for the ith studywith the weights being the inverse squared of thecalculated associated standard errors.
All-cause mortalityAll five studies in this review that had mortalityresults examined all-cause mortality. A subgroup ofwomen with obesity who had intentional weightloss with some obesity-related illness demonstratedon average a significant reduction of 20% in therisk of death regardless of the amount of weightlost (Appendix 20, Figure 251). For men andwomen who had obesity, DM and intentionalweight loss the reductions in mortality were betterstill (RR 0.75, 95% CI 0.67 to 0.84). Otherwise,however, the relative risk confidence intervals werewide and spread about 1, indicating non-significance. Considered altogether, the subgroupsin the different studies did not display evidence ofhomogeneity (Q 59.10, p = 0.001); thus, the studieswere not combined. When analysed by gender, theeffect of intentional weight loss on mortality wassignificantly more beneficial in women (on average20% better) than in men. The variability amongstudies in the male subgroup was not significant,so a combined estimate was calculated (combinedresult, RR 1.06, 95% CI 1.02 to 1.11) (Appendix 20, Figure 252a, b). Unintentionalweight loss appeared to be associated withincreased risk of death (combined results, RR 1.07,95% CI 1.01 to 1.14) (Appendix 20, Figure 253b),although the lower limit of the CI is close to 1.This could be due to unintentional weight lossbeing associated with undiagnosed illness orhidden pathology. There was a significantreduction in mortality rates in people with obesitywho also had either an obesity-related illness or ageneral illness, if the weight was lost intentionallywithin a year (combined result, RR 0.93, 95% CI0.88 to 0.98) (Appendix 20, Figure 254a). Thesesubgroups in Appendix 20, Figure 254a (e.g.men/women, intentional/unintentional weight loss,more than or less than 9 kg lost) are of borderlineheterogeneity, but the combined result is quotedfor a generalised impression. For those with noobesity-related illness, the risk of mortalityappeared to increase if the weight was lost over aprolonged period. The relative risk of the worstcase, for prolonged time of weight loss, was 1.40(95% CI 1.02 to 1.93) (Appendix 20, Figure 254b).This could be attributed to people with obesitymanifesting obesity-related illness or goingthrough psychological stress losing weight overprolonged periods. Men, in particular those whotook longer periods to lose weight, irrespective ofamounts of weight lost, had an associatedincreased risk of mortality from all causes (RR 1.48,
Epidemiological review and modelling
132

95% CI 1.22 to 1.80) (Appendix 20, Figure 254b).The quantity of weight lost could not be shown tohave any effect on mortality.
Mortality due to obesity-related illnessOnly one study274 examined mortality due toobesity-related illness, which was for women only.For women who admitted to an obesity-relatedillness, intentional weight loss of any amount wasassociated with decreased risk of obesity-relatedillness mortality (Appendix 20, Figure 255). Ifpatients did not admit to an obesity-related illness,there was an increase in obesity-related cancermortality if they lost less than 9 kg. This may havebeen due to hidden pathology, such as cancer, orperhaps these people did not lose enough weight.The study did not give any definition of obesity-related illness, but it was presumed to be mainlyhormone related.
Cancer-related mortalityCancer-related mortality was examined in twostudies, one for men and one for women, both byWilliamson and colleagues using the samepopulation database. Women suffering withobesity, but no other apparent illness, whounintentionally lost weight or lost only smallamounts of weight, had a slightly increased risk(Appendix 20, Figure 256) of mortality due tocancer. In contrast, women with obesity andobesity-related illness, regardless of the amount ofweight lost, saw a decreased risk of cancermortality which was significant if weight was lostintentionally (RR 0.63, 95% CI 0.43 to 0.93)(Appendix 20, Figure 257a). However, in men withobesity, intentional and unintentional weight losswas associated with a marginal increase in cancermortality (RR 1.19, 95% CI 1.06 to 1.33)(Appendix 20, Figure 257b). Weight lost within ayear may reduce mortality risk from cancer,particularly in women. For men, weight loss takingmore than a year may be harmful (Appendix 20,Figure 258a, b).
CVD-related mortalityFour studies273–276 examined CVD-relatedmortality. Again, three studies were undertaken byWilliamson and colleagues273–275 and indicatedsimilar results. The other study276 is notablydifferent. The reference group people were withinthe normal weight range; hence, regardless ofweight change in people with obesity, their riskswill be larger than those in the normal weightgroup.
For people with obesity and diabetes, intentionalweight loss demonstrated a decreased risk of CVD
mortality of 28% (RR 0.72, 95% CI 0.63 to 0.82)(Appendix 20, Figure 259). When women and menwere considered separately there was no significanteffect of weight loss on CVD mortality (Appendix 20, Figure 260a, b). However, when thetime of the weight loss was considered, differencesbecame apparent. There was a decreased risk ifweight was lost in under a year (RR 0.92, 95% CI0.86 to 0.98) (Appendix 20, Figure 261a) and anincreased risk of CVD mortality if the weight waslost over a longer period than a year (RR 1.16,95% CI 1.07 to 1.25) (Appendix 20, Figure 261b).
Diabetes mellitus-related mortalityTwo studies, again by Williamson and colleagues,examined DM-related mortality.273,274 The studiesindicate differences between the identifiedsubgroups (Appendix 20, Figure 262).
Women with obesity and obesity-related illness,whose weight loss was intentional, irrespective ofthe amount of weight lost, had a significantdecrease in the risk of DM-related mortality ofabout 30% (confidence intervals range from 10%to 60%). Similarly, for men with obesity and somegeneral illness, an intentional weight loss wasassociated with a decreased risk of DM-relatedmortality of about 30% (confidence intervals rangefrom 5% to 50%) (Appendix 20, Figure 262). Allsubgroups showed a significant decrease in DM-related mortality if weight was lost in less than ayear (RR 0.57, 95% CI 0.47 to 0.68) (Appendix 20,Figure 263a). There was some benefit even whenthe weight was lost over more than a year (RR0.78, 95% CI 0.64 to 0.96) (Appendix 20, Figure 263b).
Summary of mortality resultsWomen with obesity-related illnesses, who hadintentional weight loss, irrespective of the amountof weight lost, had a reduced risk of mortality dueto all causes, CVD-, cancer- and DM-relatedmortality. There was a significant benefit if weightwas lost quickly, within a year. Men with generalillness, who lost weight intentionally, had areduced risk of DM-related mortality of about30%. However, weight loss had no apparent effecton CVD-related mortality for men and wasassociated with an increased risk of mortality dueto cancer.
Diabetes mellitusFifteen studies examined DM. Based on the agegroup that was included in this review, it has beenassumed that the DM relates specifically to type 2diabetes mellitus. Some studies had initially about500 participants, while others were very small
Health Technology Assessment 2004; Vol. 8: No. 21
133
© Queen’s Printer and Controller of HMSO 2004. All rights reserved.

(e.g. n = 19). The larger ones tended to have higherdropout rates. Three studies were non-randomisedtrials,277–279 five were RCTs37,41,45,168,176 and sevenwere prospective cohort studies.266,268,269,271,272,280,281
Six studies examined surgical interventions, six had non-surgical interventions (orlistat, or diet and exercise) and three had no interventionsat all.
Similar analysis was conducted by six of thestudies which assessed the risk of developing DM.They reported their outcomes as odds ratios,relative risks or hazard ratios and for this reviewwere considered together.168,176,268,269,278,280 Theseresults showed that people with obesity who hadsome intervention for obesity had a significantlydecreased risk of developing DM (Appendix 21a).Surgical interventions appeared to have a greaterimpact on DM than non-surgical interventions.People who initially lost weight and then regainedtheir weight may have an increased risk ofdeveloping DM. Their associated relative risk at1.30 was raised, but confidence intervals were wide(95% CI 0.70 to 2.40).
Seven studies examined glucose differences withweight differences. One study by Hess and Hess271
had to be considered with caution. This studyreported a drop in glucose of 8.25 mmol/l. Thishigh fall in glucose might suggest that it does notrefer to the fasting plasma glucose level (Appendix 21b).
Initially, when all the studies were included thereseemed to be a strong linear relationship betweenweight loss and the difference in glucose levels.However, this was highly sensitive to the resultfrom the paper by Hess and Hess271 (Appendix 21b,Graph a). Removing this study left a very weak,non-significant relationship with one otheroutlier281 (Appendix 21b, Graph b). By consideringonly the smaller glucose differences (Appendix 21b,Graph c) the fasting plasma glucose levels do seemto be lowered by weight loss in a linear fashion.The model is given in Appendix 21b, Regression.The larger weight losses that were excluded forthis analysis have larger glucose reductions thanwould be predicted by this model, suggesting anon-linear relationship with extrapolation.Predictions from this model could grosslyunderestimate glucose drops when weight lossesare large, that is, the model is conservative.
Two studies reported only the improvement in DMstatus.272,266 All the people who showedimprovement in glucose status or DM control wereeither diabetic or people with IGT. This
improvement in DM status, while not being one ofthe outcomes of this review, was indicated byseveral other studies.
A study by Watts and colleagues281 from the USAreported that a group of people with DM sufferingfrom obesity, some of whom lost weight by dietintervention, had no corresponding changes inglucose levels, whereas others who also had similarweight losses did have reduced glucose levels.They suggested that losing weight with diet shouldbegin to improve DM status within 2–3 months. If there is no improvement by a ‘diet only’intervention during this period, then additionaldrug treatment might be necessary to control thediabetes.
Summary of diabetes resultsSome interventions for obesity, particularlysurgery, seemed to reduce the risk of developingDM and improved DM status, if people hadimpaired glucose tolerance or diabetes. Peoplewith obesity who lose and regain weight may havean increased risk of developing DM.
LipidsThere were 13 studies that examined lipids. Theywere all relatively small studies with subgroupsnever higher than n = 323 and as low as n = 7.One study282 examined weight cycling, with a non-surgical intervention.
There were three non-surgical prospective cohortstudies,283–285 four non-surgical RCTs41,45,84,176
and five prospective studies with a surgicalintervention.271,272,277,286,287
Non-surgical weight cyclers (Appendix 22a,Table 31)Definitions of weight cycling groups used in thisstudy are given in Appendix 28. People who lost areasonable amount of weight and maintained thisloss (including partial cyclers) had increases inHDL (albeit non-significant owing to the smallsubgroup sizes). In comparison, people who weresmall or large cyclers, those who did not loseweight and the weight gainers had either littlechange in HDL levels or a detrimental drop.Cholesterol differences were mixed with non-significant changes.
Non-surgical prospective studies (Appendix 22a,Table 32)These observational studies indicated significantweight losses associated with significant cholesterolimprovement. However, significant reduction inHDL cholesterol was also observed.
Epidemiological review and modelling
134

Non-surgical RCTs (Appendix 22a, Table 33)The long-term RCTs demonstrated significantweight losses with drug interventions. Therelationship between weight loss and cholesterollevels seemed mixed. The study with the greatestweight loss (weight loss of 7.6 kg with orlistat anddiet) had a statistically significant reduction incholesterol, whereas another study with a weightloss of 5.1 kg (diet only) was associated with anincrease in cholesterol.
Surgical interventions (Appendix 22a, Table 34)All of these were prospective studies. Overallweight loss was significantly associated withreduced cholesterol and often increased HDLlevels. One study only reported the overallimprovement in hypertriglyceridaemia andhypercholesterolaemia. This study could not beanalysed other than as a percentage improvementin the condition.
Regression analysis of changes in lipids withweight lossesAll the appropriate studies were consideredtogether, to determine whether changes in weight were related to changes in lipidmeasurements. Scatter graphs showing therelationship between weight changes and lipidchanges are given in Figure 247 (also in Appendix 22b i–iv as part of the whole analysis).As can been seen, LDL cholesterol has thestrongest positive relationship (bivariatecorrelation r = 0.903, Appendix 22b iii), followed by total cholesterol (bivariate correlation r = 0.856, Appendix 22b i).
Total cholesterol is examined here as the mostinformative measure. Regression results arepresented in Appendix 22b i, along with graphsand plots that aid assessment of other linearregression assumptions (the residuals should be
Health Technology Assessment 2004; Vol. 8: No. 21
135
© Queen’s Printer and Controller of HMSO 2004. All rights reserved.
20100–10–20–30–40–50–60
0.5
0.0
–0.5
–1.0
–1.5
–2.0
–2.520100–10–20–30–40–50–60
1.0
0.0
–0.5
–1.0
–1.5
0.5
(a) Weight difference (b) Weight difference
Cho
lest
erol
diff
eren
ce
Trig
lyce
rides
diff
eren
ce
20100–10–20–30–40–50–60
–1.0
–0.5
0.0
0.5
–1.5–50 –40 –30 –20 –10 0 10 20
–0.3
–0.2
–0.1
0.0
0.1
0.2
0.3
(c) Weight difference (d) Weight difference
LDL
diffe
renc
e
HD
L di
ffere
nce
FIGURE 247 Mean differences of weight in kg versus (a) cholesterol, (b) triglycerides, (c) LDL and (d) HDL (all mmol/l)

normal and independent). The resulting linear regression model gives the predictionequation:
Total cholesterol diff. = 0.07009 + 0.03210 (Weight diff.)
For instance, on average, 10 kg weight lossindicates a 0.25 mmol/l drop in total cholesterol.
Similar results are presented in Appendix 22b ii–ivfor average differences of triglycerides, LDL andHDL cholesterol. Weight loss compared withdifferences in HDL, although slightly positive, wasweak and non-significant.
Appendix 26 shows that for lipid outcomesstandard errors were reasonably constant, rangingfrom 0.03 to 0.60 (Appendix 22a). In contrast, theprecision of the mean weight differences waslinear with mean weight differences and hereranged between 0.2 and 5.0. To account for thisand the fact that the observations are mean valuesof studies of varying sizes, weighted least squaresregression analysis was conducted. However, as theresults were similar only the simple linearregression analysis results are reported and shouldonly be used as a gauge rather than a preciseestimate.
Summary of lipid resultsThe assessment of the studies individually and thefinal model above indicate that weight loss forpeople with obesity may lead to lowering of theircholesterol levels. It seems to be the amount ofweight lost that is important.
HypertensionFourteen studies examined hypertension. Elevenof the studies had actual values for DBP and SBP.The remaining three studies266,272,288 were moredescriptive and only reported improvements inthe condition or decreased medication. As for the results for lipids, the study sizes were fairlysmall, although varied. The largest subgroup had n = 323 people in it and the smallest had n = 7.
Blood pressureThose studies that reported measurements for DBP and SBP were considered first. One study examined weight cycling with a non-surgical intervention,282 two studies were non-surgical prospective cohort studies,283,285
four were non-surgical RCTs37,45,84,176 and fourstudies examined surgicalinterventions.262,263,277,278
Non-surgical weight cyclers (Appendix 23a, Part i)Only the partial weight cyclers had significantweight loss and significant reduction in both DBPand SBP. The large successes (i.e. sustained weightloss) had significant weight loss but a non-significant drop in both DBP and SBP. The samplesize for this group was only 14. Those classed as‘small successes’ had weight loss of 5.9 kg, but withonly seven people in the group this was notsignificant.
Non-surgical prospective study (Appendix 23a,Part ii) Significant weight losses were related to significantreductions in DBP and SBP.
Non-surgical RCTs (Appendix 23a, Part iii) In general, weight losses were related to DBP and SBP reductions (mostly statisticallysignificant), although one study did notdemonstrate this.45
Surgical intervention (Appendix 23a, Part iv) Large weight losses were associated with DBP andSBP reductions, except for two studies.263,278
Sjostrom and colleagues278 showed that in spite ofa good weight loss (20.1 kg) there was astatistically significant increase in SBP. The studyby Carson and colleagues263 showed that peoplewho had obesity and hypertension with an averageweight loss of 40.5 kg had a non-statisticallysignificant reduction in DBP. They gave no resultsfor SBP.
Regression modelStepwise multiple linear regression was used toinvestigate appropriate studies that had weightchanges with (1) DBP difference and (2) percentageDBP difference. The models were developedselecting from independent variables initial weight,weight difference or %weight difference, and follow-uptime. Weighted least squares analysis was alsoconducted with similar results, and thus is notreported.
Two subgroups with extreme weight loss, bothfrom the study by Carson and colleagues,263 withsurgical patients, had initial weights of >130 kgand weight losses of >40 kg. Unfortunately, thesetwo data points significantly influenced thelinearity of the relationship between weightdifference and diastolic blood pressure difference, as canbe seen from the correlation results in Appendix23b. Consequently, the stepwise multiple linearregression was conducted excluding these atypicalobservations. Although many terms were allowed,
Epidemiological review and modelling
136

all the models selected one term (weight differenceor %weight difference), implying simple linearregression models.
The models were developed to include a constantterm and then constrained to go through theorigin; that is, zero weight change = zero bloodpressure change. This was carried out mainlybecause many of the estimates for the constantterms were not seen to be significant and alsobecause such models suggested that no weightchange means no blood pressure change, which isa reasonable assumption in this case.
The best fit for DBP difference was withpercentage weight difference alone (r = 0.698,Appendix 23b). However, actual weight differencehas almost as good a fit and is easier to interpret(r = 0.675, Appendix 23b i). This implies that 10-kg loss will give a 3.7-mmHg drop in DBP.When forced to go through the origin (Appendix 23b ii), this is amended such that 10-kgweight loss is expected to give a 3.6-mmHg dropin DBP.
A similar process was conducted for SBP. In thiscase, excluding the extreme weight loss studies byCarson and colleagues263 did not particularlyimprove the linearity between SBP changes andweight loss. In fact, SBP differences were onlyslightly significantly related to percentage weightdifferences (Appendix 23c i and ii). The best fitwas again SBP compared with percentage weightdifference (10% weight loss leads to a 6.1-mmHgdrop in SBP). However, the fit is very weak (adjusted R2 = 0.144) (Appendix 23c iii) .
Descriptive studies on hypertensionFive studies (Appendix 23d) demonstrated otherresults related to hypertension. These were mostlydescriptive but indicated improvement in thecondition of hypertension with weight loss.
Summary of hypertension resultsInterpretation of the individual studies and theregression model indicated that blood pressurereductions may result after weight loss. Morespecifically, a 10-kg weight loss may result in a 3.6-mmHg drop in DBP, but this may notextrapolate to the studies with larger weight losses.Indications are that such weight losses would havesmaller DBP reductions in the long term than thismodel would predict. The model for SBP withweight loss per se was not significant, although adrop is indicated. Comparing percentage weightloss with SBP showed that a 6.1-mmHg dropmight be expected with a 10% weight loss.
Co-morbiditiesTwo studies identified investigated weight loss andimprovements in co-morbidities (including DM,hypertension and sleep apnoea) both after surgeryfor obesity.265,289 Neither study was of sufficientquality to be statistically manipulated, nor wasadditional information available for either study.Consequently, the following review was based ondescriptive interpretation of the studies.
Study by Wittgrove and Clark289
People with obesity had laparoscopic Roux-en-Ygastric surgery from 1993 to 1999. The studydescribed 500 people who all had a BMI of greaterthan 35 kg/m2. They participated in a multistageeducational and information programmepreoperatively to improve compliance. They werefollowed up prospectively from 3 to 60 months byphysical examination and telephone evaluation.The number of co-morbidities in the 500 peoplewas 1752 preoperatively. The authors claim that80% of the people lost 50% or more of their excessbody weight, which persisted up to 60 monthspostoperatively. The total number of co-morbiditieswas reduced overall by 96%, to 71 after surgery.Persisting postoperative co-morbidities tended tobe markedly reduced in severity. However, thetime at which these results were measured post-operatively was not clearly defined. It is uncertainwhether the 96% reduction in co-morbiditiesoccurred immediately after the surgery or at theend of the 60-month follow-up period, or for howmany people this occurred. There was no measureof variability in weight before and after surgery.
Study by Holt and colleagues265
Fifty people (12 men and 38 women) with a meanweight of 131 kg (range 74–216 kg) had verticalbanded gastroplasty between 1981 and 1985, withages ranging from 12 to 54 years. Many of themhad complications as a result of obesity. At 2 yearsthe excess weight loss was 60% overall. Althoughthe length of follow-up was mentioned as beingbetween 2 and 5 years, the actual number ofpeople followed up at 5 years (the criterion forthis review of surgical interventions) was uncertain.The authors claimed that at some stage of thestudy after surgery 72% of people reported thattheir medical conditions due to obesity wereimproved and quality of life was described formany as “more like normal people”.
Summary of co-morbiditiesBoth of these studies indicate an improvement inobesity-related co-morbidities with weight loss.However, any exact relationship is unclear fromthe information available in either of the papers.
Health Technology Assessment 2004; Vol. 8: No. 21
137
© Queen’s Printer and Controller of HMSO 2004. All rights reserved.

Psychological well-beingTwo studies were identified that looked at theeffects of weight loss on psychological well-beingin people with obesity.163,270 One study had a non-surgical intervention163 and the other had asurgical intervention.270
Study by Foster and colleagues163
In this study 55 people with a mean BMI of39.1 kg/m2 and mean age of 41 years participated. The participants underwent 18 months of treatment of VLCD, a deficit dietand relapse prevention programme. Maximumweight loss of an average of 21.1 kg occurred 6 months after treatment. However, at the end ofthe follow-up (57.5 ± 10.1 months) (mean ± SD)they averaged 3.6 ± 10.9 kg above baseline weight and the majority of the patientsexperienced at least two cycles of weight loss andregain. In spite of a slight weight gain overall their psychological measures seemed to besignificantly improved by the programme(Appendix 24, Table 35). The only factor thatimproved with the initial weight loss and returned to similar levels to those before theprogramme was restraint.
Study by van Gemert and colleagues270
Sixty-two people who suffered from morbid obesityparticipated in the study. The demographics ofthe sample (mean ± SD) show that the meanoverall BMI was 47.8 ± 7 kg/m2 and the mean agewas 33.1 ± 9.4 years. All the participantsunderwent either a gastric bypass or verticalbanded gastroplasty. Three psychometric testsScale of Interpersonal Behaviour (SIG) the DutchShortened Minnesota Multiphasic PersonalityInventory (NVM) and the Dutch PersonalityInventory (NPV)] were undertaken before surgeryand the mean follow-up of the patients was 85.9 ± 48.1 months. The psychometric tests wererepeated at the end of the follow-up. Surgicaltreatment resulted in a reduction of the meanoverall BMI to 32.0 ± 7.1 kg/m2. Before surgerythese people were negative and introvertedcompared with the normal population and thissignificantly improved after surgery (Appendix 24,Tables 36–38).
Summary of psychological well-beingThe two studies shown here used differentprogrammes for weight loss and differentmeasures of psychological well-being, which makescombining their results difficult. However, bothstudies show that weight loss improved thepsychological status of people who suffer fromobesity.
Sleep apnoeaThree studies relating to sleep apnoea wereidentified.264,290,291 One study, by Peppard andcolleagues,290 had no intervention and involvedpeople only some of whom were obese. Specificinformation regarding people with obesity wasseparated out and forwarded by the authors onrequest. The other two studies, by Charuzi andcolleagues264 and Sugerman and colleagues,291
involved people with obesity who had undergonesurgical interventions.
Study by Peppard and colleagues290
This study included 268 people who had obesity.However, only 36 people had significant weightloss (10% or more) during the 4 years of follow-up.The results of this small group showed a slight butnon-significant reduction in sleep apnoea eventsper hour (Appendix 25).
Study by Charuzi and colleagues264
This study presented full results (weight losses andsleep apnoea differences) for only six out of 51people after 7 years of follow-up. These peoplehad some reduction in both weight and apnoeicepisodes per hour (Appendix 25).
Study by Sugerman and colleagues291
This study involved 126 people who had eitherobesity hypoventilation syndrome and/or sleepapnoea syndrome. These people had an averageBMI of 56 kg/m2. About half of the people werefollowed up for between approximately 3 and 7years. The average percentage weight loss was26–31%. The results showed that 76% of peoplewith obesity hypoventilation syndrome and 66%with sleep apnoea syndrome before surgerybecame asymptomatic at the end of the follow-up(Appendix 25).
Summary of sleep apnoeaAltogether, these studies indicated that weight losswas associated with an improvement in sleepapnoea and related syndromes. However, given thesmall numbers of people followed up by Peppardand colleagues290 and Charuzi and colleagues,264
it was only the paper by Sugerman andcolleagues291 that gives any quantifiable results.
Weight cyclingWeight cycling is defined as intra-individualvariability in body weight about a time-dependentregression slope.292 It is also called ‘yo-yo’ dieting,weight fluctuation and weight variability. The highprevalence of obesity in affluent societies coupledwith the lean aesthetic ideal has resulted inincreased rates of dieting. Many individuals
Epidemiological review and modelling
138

engage in repeated attempts to lose weight and itis often assumed that weight reduction isbeneficial to health. However, recent studies haveraised concerns over the harmful effects of weightcycling on health.
During the search for epidemiological evidence,several studies were found that investigated theeffects of weight cycling. However, only two studiesinvestigated the evidence of effects of weightcycling on health outcomes for people withobesity. These papers are detailed in Table 13.
Study by Foster and colleagues163
This study gave results for a non-surgicalintervention for obesity. The authors wereinterested in the effects of weight loss patterns onpsychological well-being. The tables in this studyquote results as mean ± SD. The participants sawa maximum weight loss of 21.1 ± 8.4 kg after 6 months. At the end of the follow-up period(approximately 60 months), however, 33% werewithin 5 kg of their baseline weight, 80% weremore than 5 kg above baseline and only 17% weremore than 5 kg below baseline. Most participantshad at least two cycles of weight loss/regain andadmitted that they dieted only when theyexceeded their baseline weight. In spite of overallweight gain, the authors concluded that weightcycling did not affect mood, binge eating, restraint,disinhibition or hunger.
Study by Wing and colleagues282
This was a prospective cohort study with a non-surgical intervention. Their definitions of weightcycling groups are presented in Appendix 28.These results have been considered previously inthe context of weight loss rather than the currentfocus of weight cycling.
CholesterolThere was no significant difference between weightcyclers, gainers and losers.
HDL cholesterolParticipants who lost more than 9 kg at the end ofthe follow-up had a significant increase in HDL.
This included the group who were classed aspartial cyclers.
Blood pressureBoth DBP and SBP for partial cyclers were seen tobe significantly decreased. Those people whomaintained their weight with similar overallweight loss did not have significant reductions inblood pressure.
Summary of weight cyclingThe two studies that examined weight cycling inpeople with obesity suggested psychologicallydetrimental effects due to weight cycling and,provided weight is lost, partial cycling may aidphysiological improvements.
Discussion of the epidemiologyresultsWhile some short-term health outcomes are betterdetermined immediately after weight loss, forexample fertility, polycystic ovary syndrome(PCOS) and urinary incontinence, the focus of thisreview was on the long-term health outcomes. Thiswas defined as looking at the effects after 5 yearsinitially, but given the lack of studies except forsurgical interventions this was reduced to includestudies with follow-up for 2 years or more.
Mortality was reported by five studies suitable forthis review, of which three were by the same groupof authors (Williamson and colleagues) using thesame cohort study. As an outcome, mortality isrelatively easy to track from registers of births anddeaths, with the follow-up of people in the studiesoften being high (approximately 90%). Therelatively long period of follow-up (8–20 years)achieved by these studies may be accounted for bythe use of such registers. The approach of thestudies by Williamson and colleagues to establishweight loss was to issue a questionnaireretrospectively asking about weight changes overthe previous 3 years. This in itself may introducerecall bias. In addition, weight change patternsafter this questionnaire up to death were unknown
Health Technology Assessment 2004; Vol. 8: No. 21
139
© Queen’s Printer and Controller of HMSO 2004. All rights reserved.
TABLE 13 Studies on weight cycling for people with obesity
Authors (year) Country Outcome Sample size Follow-up time Weight measure
Foster et al. (1996)163 USA Psychological 55 patients 57.5 ± 10.1 BMI = 39.1 ± 6.4well-being months (weight 105.8 ± 16.6 kg)
Wing et al. (1995)282 USA Lipids and blood 148 at follow-up 30 months Approx. 134% of IBWpressure

and may have had an even bigger impact on theirtype of mortality.
Mortality was the most consistently recordedoutcome, using relative risks, with all but one ofthe studies using a group of weight-stable peoplesuffering from obesity as the reference group.Although age was always adjusted for, the relativerisks in each study (even those by Williamson)were otherwise adjusted differently.
With these limitations in mind the studiesindicated that intentional weight loss seemed toreduce significantly all types of mortality forwomen if they had an obesity-related illness. Thesame could not be said of men, where weight losseither appeared to have no effect (CVD) orseemed to increase the risk of mortality (cancer).Both men and women had reduced risk ofdiabetes-related mortality after some weight loss.
The gender divide, with the exception of diabetes,could be a result of women being more frequentvisitors to healthcare. Men tend not to seekmedical attention, particularly between the ages of20 and 45 years.293 Consequently, hiddenpathology may go undiagnosed in men moreeasily than for women, particularly for the cancers,which often are initially asymptomatic. Thedecrease in diabetes-related mortality in mencould be a direct result of attending their doctorsfor their obvious diabetes symptoms.
The time taken to lose weight was also seen as afactor. A prolonged period usually increased therisk of mortality. This could be due to thepsychological stress of the actual process of losingweight, or to the fact that the obesity-relatedproblems were being allowed to manifest over alonger period, or both.
For diabetes mellitus, 15 studies included peoplesuffering from obesity, who had had weight loss atsome stage. The results were presented in severaldifferent ways. Studies reported risk of developingdiabetes after weight loss as odds ratios, relativerisks or hazard ratios. These were mostly adjustedfor age and gender. Other variables were alsoadjusted, although not consistently. Other studiesgave actual measurements of plasma glucose(usually stated as being fasting glucose) before andafter weight loss, or had an associated glucosedifference measure.
Weight loss for those suffering from obesityseemed to reduce the risk of developing diabetesfor both men and women, more so if there had
been some intervention for the obesity. This isparticularly so for surgical interventions probablyrelated to larger amounts of weight loss, whichwere more easily maintained. Where there wasweight loss and then regain there was someevidence that the risk of developing diabetesincreased. For those with either diabetes orimpaired glucose tolerance their diabetic statuswas often seen to improve after weight loss. Therelationship between glucose levels and weightdifferences, although positive, is not reliablydefinable from the evidence reviewed. A modelwas developed to predict the glucose levels afterweight loss, but excluded extreme glucosedifferences. This indicated a drop of 0.04 mmol/lin glucose levels for every 10 kg loss in weight.However, with only seven observations therobustness of this model is in doubt and would inany case underestimate the levels for those whowere able to lose large amounts of weight bywhatever means.
A similar number of studies (13 altogether) wasidentified presenting lipid measures. Of interesthere were differences in levels of cholesterol, LDLand HDL cholesterol after weight loss for thosewho were initially suffering from obesity. Themeasurements were fairly consistent between thestudies despite there being a mixture of RCTs,prospective cohort studies, with surgicalintervention, non-surgical intervention or nointervention at all.
Considered altogether, the studies showed that therelationship between weight loss and LDLcholesterol difference was positive and linear(bivariate correlation r = 0.903). The correlationwith cholesterol difference was similar (r = 0.851).A model was developed suggesting that a loss of10 kg would give an expected drop in cholesterolof 0.25 mmol/l. This would roughly equate to a fallin cholesterol of about 5%, half that previouslyquoted.17,294 The current review has tried to relatelong-term weight loss with long-term healthoutcomes (at least 5 years for surgicalinterventions and a minimum of 2 years for theother studies), whereas guidelines do not specifythe follow-up times.17
The review identified 14 studies where weight lossand the relationship with hypertension in the longterm were reported for people with obesity. Again,the studies were fairly similar in their measurementsbut lacked sufficient evidence for those with largerweight losses. Excluding these extreme weightchanges indicated that a 10-kg weight loss mightresult in an expected 3.6-mmHg drop in DBP. The
Epidemiological review and modelling
140

model for SBP with weight loss per se was notsignificant, although a drop was indicated.Comparison of SBP change with percentageweight loss showed a weak association, suggestingan expected drop of 6.1 mmHg in SBP for a 10%weight loss.
These results, like those for the lipids, differ fromthose in current guidelines.17 These state that a10-kg loss in weight will give a drop of at least10 mmHg in both DBP and SBP. The currentreview has not shown a lowering in blood pressureof that order for long-term weight loss. It has beensuggested that a levelling off of blood pressurereduction could be happening where, despite thelarge amounts of weight loss sometimes seen aftersurgical interventions for obesity, the bloodpressure levels do not drop any further. Anotherpossible reason given was that the longer follow-uptimes for the surgical studies could be influencingthe final blood pressure and although not seen tobe significant here, may allow for the gradualcreeping back up of blood pressure despite anoverall large weight loss.278 All that can beconcluded from this review is that the large weightlosses experienced by the people with obesity whowere surgically treated did not result in bloodpressure drops proportional to those treated bynon-surgical means.
The two studies of co-morbidities after surgicalinterventions for weight loss did not providesufficient quantitative information. However,descriptively they indicated an improvement forvarious co-morbid conditions when weight loss wasachieved.
Similarly, there were two papers for psychologicalwell-being as a measure of health. Althoughdifferent measures were used both studies indicatedthat weight loss improved the psychological statusof people with obesity.
The studies that were identified for sleep apnoeadid not provide adequate information formodelling; however, they implied that weight lossimproved episodes of sleep apnoea in people withobesity.
Only one study examined the relationship betweenstroke and obesity. This study measured weightchange, but only reported the relative risksassociated with weight gain compared with peoplewith stable weight.
This review found little evidence of the effects ofweight cycling on people with obesity. The two
papers that were found indicated no harmfulpsychological or physiological effects from weightcycling.
An important methodological limitation arisingfrom this review was the varied definitions of theoutcomes and weight measurements. For example,the papers presented weight measurement as actualweight, BMI, percentage excess weight and/orwaist–hip ratio. Even the definition of obesityvaried. In addition, the measurement of healthoutcomes was not always explicit and/or did notalways use the same indices. Statistical adjustmentsvaried in all the papers. This was particularlynoticeable for the mortality papers citing relativerisks, where even the same authorship useddifferent adjustments. Differences between gender,age, smoking status and possibly initial BMIcategory would seem to be worthwhile adjustments.Making too many adjustments has the effect ofmaking the resulting model too data specific.
The studies recorded weight with outcomemeasures at the start of the study and then againat some stage at follow-up. However, somemeasured actual values whereas others measuredthe differences, the latter being the idealrequirement for this review. Differences withappropriate measures of variation (standarddeviation or standard error of differences)required estimation for some studies. Thisproblem highlights another difficulty. It is easierto take group summary results than rigorously tofollow individuals to ensure paired differences,particularly for longer term studies wheredropouts are often an issue. Researchers need totrack individuals to obtain paired measurements,which may also reduce loss to follow-up.
This review was based on long-term follow-upstudies where it was assumed that the outcomemeasurements were taken at the end of the studyperiod. However, many studies did not specify thetime when the outcomes were measured in relationto the follow-up period.
Research and funding bodies should be committedto structured long-term follow-up strategies so thatthe long-term effects of short-term interventionscan be assessed accurately.
AddendumAn additional literature search was carried out onMEDLINE from 2001 to April 2003, to update thefindings of this review. Using the same inclusion
Health Technology Assessment 2004; Vol. 8: No. 21
141
© Queen’s Printer and Controller of HMSO 2004. All rights reserved.

and exclusion criteria, abstracts of studies werescreened for any relevant studies. These includedtrials and prospective studies, provided the resultswere for outcomes in the long term. Studies thatdid not mention the follow-up time in the abstractor had wide follow-up times were not pursued onthis occasion. Many of the studies complement thefindings of this epidemiology review with respectto the association of weight loss and healthoutcomes in the long term (see Appendix 19b).
A study on sleep apnoea syndrome showed thatimprovement in sleep apnoea was highlycorrelated with weight loss,295 although thenumber of participants with weight loss was small.A paper by Sanchez-Cabezudo and colleagues296
indicated that, despite complications, surgicalmethods of weight reduction often improvedpreoperative illnesses and hence quality of life.
Three papers based on the same RCT, looking atfood substitutes, reported benefits for lipid levelsat least 2 years after weight loss,297–299 as didresults from another RCT,300 and a non-randomisedtrial after 5 years.301 A surgical paper by Arribasand colleagues302 also reiterated this relationshipfor larger weight losses.
Improvements in plasma glucose and otherdiabetes-related outcomes, as a result of weightloss, were reinforced by ongoing results from
Ditschuneit and colleagues,297,299 and the ongoingSwedish Obesity Study (SOS).303 The long-termbenefits of weight loss from surgery were reflectedin a reduction of medication for diabetes.302
The SOS has also shown that weight loss results inreductions in the incidence of and medication forCVD.303,304 Two other RCTs208,297,299 and two non-randomised studies301,302 indicated that weightloss was associated with lowering of hypertensionand/or blood pressure in the long term.
A study by Gregg and Williamson and others,305
independent of the data used in this review byWilliamson and colleagues, reiterated theimportance of establishing the intentionality ofweight loss, with regard to mortality rates inoverweight and obese people. The advantage ofweight loss with respect to mortality, even forthose suffering from obesity, has been debated inthe recent literature,13,306 with intentionalityplaying an important role in the arguments.
To avoid weight gain and to ensure compliance, ahigh degree of close follow-up was advocated in arecent surgical study by Wolf and colleagues307
with respect to long-term surgical complications.This message extends to the understanding of theeffects of weight loss in the long term on healthoutcomes, particularly since such studies oftensuffer from poor follow-up.
Epidemiological review and modelling
142
MethodsSearch strategiesStudies that reported both costs and outcomes oftreatments for obesity were sought from threesources:
� identification of studies as part of the literaturesearches conducted for the effectivenessportions of this report
� a search on the NHS Economic EvaluationDatabase (with the final search conducted inearly March 2002)
� a search on each of the following bibliographicdatabases: MEDLINE (1966–2002), EMBASE(1980–2002), PsycINFO (1967–2001), Scienceand Social Science Citation Indexes (1981–2002),CINAHL (1982–2001), Applied Social ScienceIndex and Abstracts (ASSIA) (1987–2002) andHealth Management Information Consortium(HMIC) Database (to 2002/01). Search strategiesfor identification of economic evaluation studieswere formulated using a combination ofcontrolled vocabulary terms, where available,and free text terms (see Appendix 29). Thesestrategies were subsequently combined withthose designed for identification of effectivenessstudies in each database. The final search wasconducted early in March 2002.
Inclusion and exclusion criteriaTo be included, studies had to compare treatmentsfor obesity in terms of both health service costsand effectiveness or had to be a systematic reviewthat covered such studies. Studies reported inlanguages other than English were not included inthe review. A single economist assessed allabstracts for relevance. Full papers were obtainedand formally assessed for all studies that appearedpotentially relevant.
Data extractionFollowing the HTA reviews by O’Meara andcolleagues,25,26 the following data were extractedfor each included study and are provided inAppendices 30–34 (by type of intervention):
� study identification information– author and year– the intervention studied
– the type of economic evaluation– the country of origin and currency reported
� the intervention study design and mainoutcomes– fuller description of treatment– numbers receiving or randomised to each
intervention– outcomes studied
� sources of data– efficacy data– prevalence, mortality and morbidity (if
measured)– cost data– quality of life (if measured)
� methods and study perspective� results
– costs – benefits– incremental cost-effectiveness/utility ratio
(ICER)� sensitivity analyses� additional comments.
Quality assessmentA single economist assessed included studies againstthe following ten criteria, which were also used inthe HTA reviews by O’Meara and colleagues:25,26
� well-defined question� comprehensive description of alternatives� effectiveness established� relevant costs and consequences identified� costs and consequences measured accurately� costs and consequences valued credibly� costs and consequences adjusted for differential
timing� incremental analysis of costs and consequences� allowance made for uncertainty in estimates of
costs and consequences� results and discussion included all issues of
concern to users.
Appendices 35–37 contain the results of the qualityassessment for all economic evaluation studies inwhich modelling was performed (i.e. not systematicreviews of existing economic evaluations).
Data synthesisData from any included studies were summarisedand critiqued by a single economist to identify
Health Technology Assessment 2004; Vol. 8: No. 21
143
© Queen’s Printer and Controller of HMSO 2004. All rights reserved.
Chapter 4
Systematic review of economic evaluations

common results, variations and weakness betweenthe studies. No formal attempt was made tosynthesise quantitatively the data from theidentified studies, although the summary to thissection provides a rough comparison of resultsfrom the selected studies. These data were theninterpreted alongside the results of the systematicreview of effectiveness so that conclusions could bedrawn on the relative efficiency of varioustreatments for obesity.
ResultsIn total, 16 reports of studies eligible for inclusionwere identified from the review of the literature.Table 14 classifies the studies according to type ofstudy and type of intervention. The searchidentified four systematic reviews of economicevaluations, six cost–utility analyses, eight cost-effectiveness analyses, and one cost-minimisationanalysis. With respect to type of intervention, thesearch identified seven studies pertaining topharmacological interventions (orlistat, sibutramineand metformin), seven pertaining to surgery andfour pertaining to lifestyle interventions (diet,exercise and behaviour therapy).
One non-systematic review of the literature,written by Hughes and McGuire320 is worth notingbecause it provides a useful overview discussion ofeconomic analysis of obesity as well as concisedefinitions of the different types of economicevaluation. These authors note that at the time oftheir study (1997), most of the voluminouspublished literature pertaining to the economicsof obesity consisted of cost of illness or burden ofillness studies. While such work, which hasincreased since 1997, is important inunderstanding the economic magnitude of theproblems of obesity and the vast amount ofresources engaged in treating the disease andassociated problems, Hughes and McGuire onlyidentified two economic evaluations. Of these two,only one314 was deemed to be a sufficientlyrigorous economic evaluation to be included inthis systematic review. It is not surprising,therefore, that most of the studies identified inTable 14 are from the period following 1997.
It is also worth noting some studies that were notincluded in Table 14, as several are particularlyrelevant for understanding the costs ofinterventions or implications of weight loss forcertain types of costs. Some economic evaluations
Systematic review of economic evaluations
144
TABLE 14 Economic evaluations of treatments for obesity by type of intervention
Type of intervention
Type of study Orlistat Sibutramine Metformin Surgery Lifestyle (diet,exercise,behaviourtherapy)
Systematic reviews of O’Meara, 200125; O’Meara, 200226 Clegg, 200227
economic evaluations Foxcroft, 1999308
Cost–utility analysis Foxcroft, 2000308,309 BASF Pharma/Knoll, Clegg, 200227 Kaplan, 1987, 2000 (unpublished) Nguyen, 2001310 1988178,311a;
Salkeld, 1997312a
Cost-effectiveness Lamotte, 2002313 Clarke, 200187 Martin, 1995314; Johannesson, analysis Sjostrom, 1995315a; 1992318;
Segal, 1998316a; Segal, 1998316a
van Gemert, 1999317a
Cost-minimisation Chua, 1995319
analysis
Studies are identified by first author and year of publication. O’Meara (2001)25 indicated that Foxcroft and Ludders308 was the only economic evaluation of orlistat published up to June2000.O’Meara (2002)26 indicated that no economic evaluations of sibutramine were published up to 2000 and that an unpublishedcompany submission from BASF Pharma/Knoll was the only cost–utility model available at the time of their systematicreview.a NHS Centre for Research and Dissemination (University of York) structured abstract available.
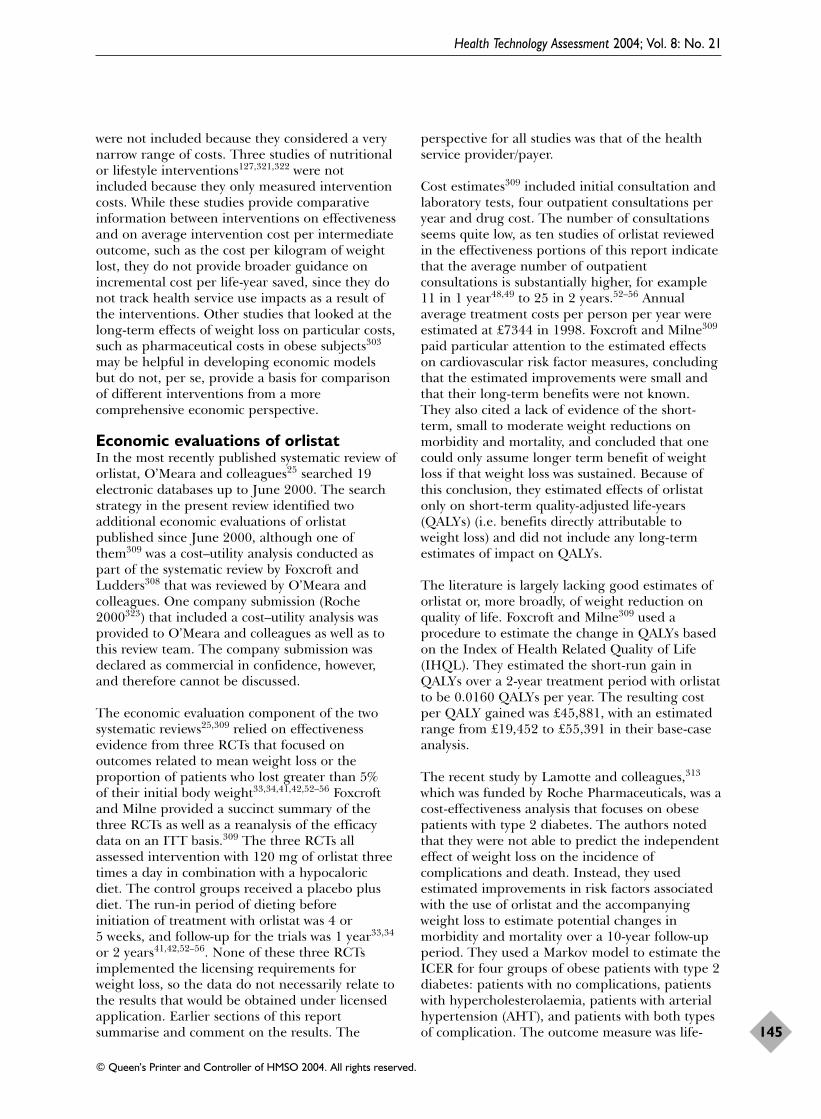
were not included because they considered a verynarrow range of costs. Three studies of nutritionalor lifestyle interventions127,321,322 were notincluded because they only measured interventioncosts. While these studies provide comparativeinformation between interventions on effectivenessand on average intervention cost per intermediateoutcome, such as the cost per kilogram of weightlost, they do not provide broader guidance onincremental cost per life-year saved, since they donot track health service use impacts as a result ofthe interventions. Other studies that looked at thelong-term effects of weight loss on particular costs,such as pharmaceutical costs in obese subjects303
may be helpful in developing economic modelsbut do not, per se, provide a basis for comparisonof different interventions from a morecomprehensive economic perspective.
Economic evaluations of orlistatIn the most recently published systematic review oforlistat, O’Meara and colleagues25 searched 19electronic databases up to June 2000. The searchstrategy in the present review identified twoadditional economic evaluations of orlistatpublished since June 2000, although one ofthem309 was a cost–utility analysis conducted aspart of the systematic review by Foxcroft andLudders308 that was reviewed by O’Meara andcolleagues. One company submission (Roche2000323) that included a cost–utility analysis wasprovided to O’Meara and colleagues as well as tothis review team. The company submission wasdeclared as commercial in confidence, however,and therefore cannot be discussed.
The economic evaluation component of the twosystematic reviews25,309 relied on effectivenessevidence from three RCTs that focused onoutcomes related to mean weight loss or theproportion of patients who lost greater than 5% of their initial body weight33,34,41,42,52–56 Foxcroftand Milne provided a succinct summary of thethree RCTs as well as a reanalysis of the efficacydata on an ITT basis.309 The three RCTs allassessed intervention with 120 mg of orlistat threetimes a day in combination with a hypocaloricdiet. The control groups received a placebo plusdiet. The run-in period of dieting before initiation of treatment with orlistat was 4 or 5 weeks, and follow-up for the trials was 1 year33,34
or 2 years41,42,52–56. None of these three RCTsimplemented the licensing requirements forweight loss, so the data do not necessarily relate tothe results that would be obtained under licensedapplication. Earlier sections of this reportsummarise and comment on the results. The
perspective for all studies was that of the healthservice provider/payer.
Cost estimates309 included initial consultation andlaboratory tests, four outpatient consultations peryear and drug cost. The number of consultationsseems quite low, as ten studies of orlistat reviewedin the effectiveness portions of this report indicatethat the average number of outpatientconsultations is substantially higher, for example11 in 1 year48,49 to 25 in 2 years.52–56 Annualaverage treatment costs per person per year wereestimated at £7344 in 1998. Foxcroft and Milne309
paid particular attention to the estimated effectson cardiovascular risk factor measures, concludingthat the estimated improvements were small andthat their long-term benefits were not known.They also cited a lack of evidence of the short-term, small to moderate weight reductions onmorbidity and mortality, and concluded that onecould only assume longer term benefit of weightloss if that weight loss was sustained. Because ofthis conclusion, they estimated effects of orlistatonly on short-term quality-adjusted life-years(QALYs) (i.e. benefits directly attributable toweight loss) and did not include any long-termestimates of impact on QALYs.
The literature is largely lacking good estimates oforlistat or, more broadly, of weight reduction onquality of life. Foxcroft and Milne309 used aprocedure to estimate the change in QALYs basedon the Index of Health Related Quality of Life(IHQL). They estimated the short-run gain inQALYs over a 2-year treatment period with orlistatto be 0.0160 QALYs per year. The resulting costper QALY gained was £45,881, with an estimatedrange from £19,452 to £55,391 in their base-caseanalysis.
The recent study by Lamotte and colleagues,313
which was funded by Roche Pharmaceuticals, was acost-effectiveness analysis that focuses on obesepatients with type 2 diabetes. The authors notedthat they were not able to predict the independenteffect of weight loss on the incidence ofcomplications and death. Instead, they usedestimated improvements in risk factors associatedwith the use of orlistat and the accompanyingweight loss to estimate potential changes inmorbidity and mortality over a 10-year follow-upperiod. They used a Markov model to estimate theICER for four groups of obese patients with type 2diabetes: patients with no complications, patientswith hypercholesterolaemia, patients with arterialhypertension (AHT), and patients with both typesof complication. The outcome measure was life-
Health Technology Assessment 2004; Vol. 8: No. 21
145
© Queen’s Printer and Controller of HMSO 2004. All rights reserved.

years gained from using orlistat over diet plus aplacebo. They assume that weight was fullyregained in 5 years after termination of the 2-yearorlistat treatment period. Cost-effectivenessestimates were in year 2000 Euros.
Not surprisingly, the cost-effectiveness of orlistatin the diabetic population was better than in thegeneral population, and was also better for thepatients with complications. For diabetic patientswithout complications, the cost per life-yeargained was €19,968. For persons with bothhypercholesterolaemia and AHT, the cost per life-year gained was €3462. Lamotte and colleagues313
performed several sensitivity analyses, includingan assumption that all weight was regained within2.5 years instead of 5 years. The cost per life-yeargained for patients without any complications andwith both types of complication, respectively, onlyincreased to €26,527 and €4565. Since their modelseemed to assume that the benefits from the riskfactors accrue in all years until the weight isregained, the shorter period provides someassurance that the cost per life-year gained inobese patients with other diseases may still beaffordable to society.
Economic evaluations of sibutramineA systematic HTA review conducted by O’Mearaand colleagues26 identified no published economicevaluations of sibutramine and provided a critiqueof one cost–utility model submitted by apharmaceutical company (BASF Pharma/Knoll2000, company submission). As no furthereconomic evaluations were identified by thecurrent search, their review of the companysubmission remains the sole assessment of theeconomic implications of sibutramine. The keypoints from their review are summarised below.
The company submission model (BASFPharma/Knoll 2000, company submission)incorporated three specific effects of sibutramine-induced weight loss: the effect on CHD risk, theeffect on the incidence of diabetes and the directeffect on quality of life. The model assumed thatall weight was regained by 5 years following thetrial. The individual estimates of cost per QALYfor each of the three components were £32,000 forthe CHD reduction, £58,260 for the diabetesincidence reduction and £14,700 for the directweight loss. The combined cost per QALY gainedfrom the three influences was estimated at £7860.O’Meara and colleagues expressed concern thatthe utility values used in the study were notsufficiently justified and in particular may haverepresented an inappropriately high gain in QALY
per kilogram of weight loss. Their overall estimateof the cost per QALY for sibutramine versus aplacebo was £10,500. They noted that a sensitivityanalysis using lower utility gain values resulted ina cost per QALY of £38,674 (ostensibly for thecombined effect of all three components, althoughthis point was not clear).
Economic evaluations of metforminObesity may not only increase the risk of type 2diabetes (as considered, for example, in thecost–utility model of sibutramine discussed above)but also increase the risk of diabetes-related eventsfor obese patients with type 2 diabetes. Therefore,the cost-effectiveness of metformin in bloodglucose control versus conventional diet therapy isrelevant for the economic evaluation of treatmentsfor obesity. As part of the UKPDS, Clarke andcolleagues87 conducted an economic evaluation ofthe cost-effectiveness of metformin in obese type 2diabetic patients. They used a fairly wide definitionof obesity by studying patients who were morethan 120% of their ideal weight, which translatedroughly into people with a BMI in excess of 25.6 kg/m2, although the mean BMI amongpeople who actually enrolled in the study was31.7 kg/m2. A total of 342 patients receivedintensive blood-glucose control with metformin,while a control group of 411 patients receivedconventional treatment consisting primarily of dietin addition to standard treatment for diabetes.Median follow-up was 10.7 years for the economicevaluation. The economic evaluation focused onlife-years gained as an outcome measure due tothe lack of data on estimates of QALYs for peoplewith diabetes. Costs and outcomes were bothdiscounted at 3 and 6%. Metformin was estimatedto result, on average, in cost savings of £258 perperson (6% discount rate) with a gain in life-yearsof 0.6 per person (3% discount rate). Thereduction in costs was not statistically significant.An acceptability curve approach to account foruncertainty in the data resulted in an estimate(using a 6% discount rate for both costs andoutcomes) of a 71% chance that metformin is costsaving, and a 95% chance that the cost per life-year gained was less than £1600.
Economic evaluations of surgeryIn conducting a systematic review of surgery forpeople with morbid obesity, Clegg and colleagues27
identified and reviewed four economicevaluations314,315,317,319 which are each describedbriefly below. Two of the four studies identifiedfocused on the obese population rather than themorbidly obese population, which was defined aspeople with a BMI of 40 kg/m2 or greater. Their
Systematic review of economic evaluations
146

review also included an extensive list of coststudies that were deemed not to be economicevaluations as well as their own economic modelof the cost–utility of surgical treatment formorbidly obese patients. The present systematicreview identified two additional economicevaluations of surgery; one was a study by Segaland colleagues316 of a range of interventions toassess the cost-effectiveness of primary preventionof NIDDM (type 2 diabetes) that included ananalysis of surgery for morbidly obese individuals,and the second was a study by Nguyen andcolleagues310 of laparoscopic versus open gastricbypass surgery in morbidly obese people.Appendix 33 provides key data extraction for eachstudy, and Appendix 36 provides a summary ofquality assessment. The only study discussed inthis section that used data for the UK was thecost–utility model constructed by Clegg andcolleagues,27 so the external validity of the othersix studies may be limited for the UK, especiallywith respect to costs.
Martin and colleagues314 compared Roux-en-Ygastric bypass surgery with a VLCD in the obesepopulation. They focused on an outcome ofweight (pounds) lost and reported average cost-effectiveness ratios (dollars per pound lost) ratherthan ICERs. The authors reported that after 7 years all non-surgical patients regained theweight lost and concluded that surgical treatmentappears to be more cost-effective at producing andmaintaining weight loss. Yet the study suffers froma number of weaknesses, including the followingpoints: costs for medical and surgical complicationswere not included; cost of follow-up was notincluded; patient selection may have occurredbecause the patient profile differed between thetwo groups; and approximately 50% of patientswere lost from each group by the fifth year offollow-up.
van Gemert and colleagues317 compared verticalbanded gastroplasty with no treatment formorbidly obese patients using a cost-of-illnessprevalence-based model, where the data for the‘no treatment’ came from the obese population.Direct health service costs including the costs ofcomplications and revisions were included,although the costs of co-morbidities attributable tomorbid obesity were not included. The authorsincluded the costs of productivity losses and foundthat vertical banded gastroplasty resulted in totalcost reductions and improvements in quality oflife, resulting in a situation of dominance ofsurgery over non-treatment. It is notable, however,that the direct costs of surgery were US$5865
while the productivity gain was estimated atUS$2765 per year, so the finding of dominance isnot surprising.
Chua and Mendiola319 compared laparoscopicvertical banded gastroplasty with open gastricbypass surgery and with open Roux-en-Y gastricbypass in the obese population. This was a verypreliminary study, however, in that it focused onthe costs of the three different surgical approachesand did not include any long-term follow-up. Thestudy did determine from a cost-minimisationviewpoint that the laparoscopic surgery was theleast cost of the three techniques, as the cost of thelonger operating time was more than offset byshort hospital lengths of stay following surgery.Lacking follow-up data on weight loss andcomplications, however, the study offers noinsights into broader cost-effectiveness orcost–utility implications of the three surgeries.
The fourth economic evaluation of surgeryidentified in the systematic review27 was conductedby Sjostrom and colleagues.315 The authorscompared three types of surgery (gastric banding,vertical banded gastroplasty and open gastricbypass) with conventional treatment (which wasnot clearly described) over a 2-year follow-upperiod. The authors noted improvements inhealth-related quality of life over 2 years insurgery patients, but not in the control patients.Additional benefits noted for the surgery patientsincluded reductions in cardiovascular risk factors,a lower rate of incidence of new diabetes cases, ahigher rate of cure of hypertension, and a lowerrate of sick leave during the second year of follow-up. ICERs and cost–utility ratios were notcalculated, and the authors instead noted that 10-year follow-up data should be pursued todetermine the economic implications includingthe effect of improvements in disease risk status.As noted earlier, however, data from Sjostrom andcolleagues278 indicate that there is no evidence ofa long-term effect on the incidence of hypertension.
Based on their systematic review results, Clegg andcolleagues27 conducted an economic evaluation offour different treatments: Roux-en-Y gastricbypass, vertical banded gastroplasty, adjustablegastric banding and non-surgical management.For the gastric bypass, they assumed that 36% oforiginal weight was lost in the first year and thatthe weight loss was maintained over time. Forvertical banded gastroplasty, they assumed thatpatients lost 25% of their weight in the first yearbut regained 2% of their original weight in eachsubsequent year, based on their review of
Health Technology Assessment 2004; Vol. 8: No. 21
147
© Queen’s Printer and Controller of HMSO 2004. All rights reserved.

effectiveness data. For the adjustable gastricbanding, they assumed an initial weight loss of20% of original weight, but that weight losscontinued beyond year 1 up to a loss of 33% oforiginal weight by year 5. They assumed no weightloss for non-surgical patients, which may not berealistic. For their base case, they assumed thatpatients weighed 135 kg or had a BMI ofapproximately 45 kg/m2 at the start of the analysis.
Based on a review of the health-related quality-of-life literature as well as their own work using theIHQL, they hypothesised potential differences inquality of life under best and worst case scenarios.They included gains from avoiding diabetes intheir estimates based on an assumption of 10%prevalence of diabetes among the morbidly obese,but did not include gains from reducedhypertension because of lack of evidence that theeffects on hypertension are long lasting ratherthan transient.278 They also did not assume anychange in life expectancy for their base case,although based on evidence from the UKPDS theyassumed a gain of 0.29–0.6 life-years per patientfor their best case scenario.
They developed estimates of the costs of surgery,including complications and postdischarge care,by combining estimates of resource use with unitcost measures. They ran their model for ahypothetical cohort of 100 patients for 20 yearsfollowing surgery. Weight loss ceased after 5 yearsand the impact of reduction in diabetes incidenceended after 8 years. They discounted costs at 6%and QALYs at 0%, 1.5% and 6%.
Relative to usual care, the model of Clegg andcolleagues27 resulted in higher QALYs and highercosts for all three types of surgery. The mainsource of averted costs in their model was costsassociated with avoided diabetes. The cost peradditional QALY from surgery rather thanconventional treatment was £10,237 for verticalbanded gastroplasty, £8527 for adjustable gastricbanding and £6289 for Roux-en-Y gastric bypass.Adjustable gastric banding had the highest costsand a negligible improvement in QALYs relativeto gastric bypass. The cost per additional QALYfrom gastric bypass rather than vertical bandedgastroplasty was £742. These estimates are basedon a number of assumptions, and thereforesensitivity analyses were conducted on a range offactors pertaining to procedure costs and effects.The results from these analyses indicated thatsurgery was a cost-effective alternative to non-surgical management, although the estimate of thecost per additional QALY varied. In considering
their results, the authors noted that NICEguidance places the cost per additional QALY of orlistat23 at £46,000 and the cost per additional QALY of sibutramine in the range of£15,000–30,000.24 Subject to a number of caveats(including the fact that the estimates for orlistatand sibutramine are not for the morbidly obesesubgroup of patients), the benefits from surgicaltreatment of morbid obesity may be worth thecost.
Clegg and colleagues27 highlighted the potentialadvantages in utility gains and cost per additionalQALY for gastric bypass versus other surgery orconventional treatment. Segal and colleagues317
similarly found that gastric surgery resulted inincreased life-years, including diabetes-free life-years, which presumably have a higher quality oflife than non-diabetes-free life-years, and that thecost per life-year gained in 1997 Australian dollarswas Aus$4,600. Segal and colleagues modelled thecost-effectiveness of a range of interventionsincluding several lifestyle approaches with thespecific goal of assessing primary prevention oftype 2 diabetes (which is apparently why the studywas not identified in the systematic review ofsurgery for morbid obesity27). The full descriptionof this study is deferred until the next section.
Given the evidence in favour of the cost-effectiveness of gastric surgery, a recent study byNguyen and colleagues310 reports on an RCT oflaparoscopic versus open gastric bypass thatassessed the implications of these two approachesfor outcomes, quality of life and costs. The studyrandomly assigned 155 morbidly obese people tothe two treatments and followed them for 1 yearafter surgery. A range of clinical outcomes,including complications during and after surgeryas well as quality of life at 1, 3, 6, and 12 monthsfollowing surgery, were measured. The studyconsidered direct hospital costs and alsoapparently measured indirect costs related to timelost from work. The study did not, however,appear to include follow-up treatment costs duringthe year after surgery, and there is virtually noinformation provided about how the indirect costswere measured.
Nguyen and colleagues310 found that laparoscopicsurgery had higher operating costs but shorterhospital stays. There was no statistically significantdifference in direct hospital cost, indirect costs ortotal costs between the two procedures.Complication rates were also not statisticallydifferent, although quality of life was higher atvarious interim points during the year following
Systematic review of economic evaluations
148

surgery for laparoscopic patients relative to opengastric bypass patients. It is notable thatlaparoscopic gastric bypass resulted in fewerintensive care unit stays, shorter hospital stays,faster recoveries and an earlier return to workthan did open surgery. No effort was made todetermine the implication of these differences onQALYs, and the measured quality of lifedifferences did disappear by the end of the year.However, these gains may be valuable to patients,and the lack of significant differences in costs maymean that laparoscopic surgery is cost-effectiverelative to open gastric bypass.
Economic evaluation of lifestyleinterventionsThe literature search did not identify anysystematic reviews of economic evaluations oflifestyle interventions of diet, exercise orbehaviour therapy. While the pharmacological andsurgical interventions for obesity have beenaccompanied in a few cases by explicit economicevaluation, the trials related to lifestyleinterventions have either rarely included aneconomic evaluation or not focused exclusively onobese people or on the problems of obesity. Thesearch used a broad perspective by includingeconomic evaluations of interventions that werenot necessarily targeted exclusively at obesepeople, but instead may have been directed atpeople for whom obesity is often a seriouscomplication or subsequent disease, or both. Thethree studies identified addressed problems ofobesity among two groups of people: onestudy178,311 targeted people with type 2 diabetes,and two studies312,316 targeted overweightindividuals living in the community who inparticular might be identified as at risk ofsequelae of obesity (e.g. type 2 diabetes, CVD)through general practice.
The earliest economic evaluation of lifestyleinterventions identified in this review was byKaplan and colleagues.178,311 This study analysedthe effect of four interventions (diet and behaviourtherapy, exercise and behaviour therapy, diet andexercise and behaviour therapy, and a controlgroup receiving general diabetes education only)in a single-centre RCT of 76 obese non-insulin-dependent diabetics. Participants were followedfor a total of 18 months. Key outcome measuresincluded HbA1c and quality of well-being.
Cost measures focused on intervention treatmentcosts, although possible effects on medication usewere also assessed and found not to occur. All weightlost with any of the interventions was regained by
the end of the 18-month follow-up period. Thecombined diet/exercise/behaviour therapy grouphad a marginally significant improvement inHbA1c levels, and the diet/behaviour therapy andcombined diet/exercise/behaviour therapy groupshad significant modest improvements in quality oflife.
The diet/exercise/behaviour therapy group had anestimated annual improvement in quality of life of0.092, resulting in a cost per additional well yearof life of US$10,870 in 1986. Because generalhealth service use costs were not tracked, thisestimate may be an overestimate of the actual costper additional well year of life since such costsmight have been greatest for the control group.However, the small sample size and short follow-up period limit the study findings.
Because obesity significantly increases the risk ofonset of type 2 diabetes, it is possible thatinterventions targeted towards obese people mayreduce the incidence of type 2 diabetes. Segal andcolleagues316 used a Markov model approach overa 25-year postintervention period to assess thecost-effectiveness of six different treatments forobesity: (1) intensive diet and behavioural therapyfor the seriously obese, (2) intensive diet andbehavioural therapy for women with previousgestational diabetes mellitus, (3) surgery for theseriously obese with BMI >40 kg/m2 or excessweight of 45 kg, (4) group behavioural therapy foroverweight men, (5) advice from a GP, and (6) a media campaign with community support.Possible states within the model were normalglucose tolerance (NGT), IGT, and type 2 diabetes.Costs were in 1997 Australian dollars.Assumptions were made about the baseline healthstatus, transition rates and the effectiveness of theinterventions. The authors found that surgery forthe severely obese saved the greatest number oflife-years, but also had the highest ICER ofAus$4,600 for persons with IGT and Aus$12,300in a more general population with 10% IGT and90% NGT. The individual diet and behaviouraltherapy approaches as well as GP advice resulted incosts per additional year of life of roughlyAus$1000–2600, depending on the initial riskstatus of participants. The group behaviouraltherapy and media campaigns were cost saving, aswas the intensive diet and behavioural therapy inhigh-risk seriously obese people. The mediaprogramme, however, was assumed to besuccessful in only 1% of the population, and netbenefit amounts from the interventions that werecost saving were not reported. Therefore, thereturn from other interventions that were found to
Health Technology Assessment 2004; Vol. 8: No. 21
149
© Queen’s Printer and Controller of HMSO 2004. All rights reserved.

be cost saving, such as intensive diet andbehavioural therapy among severely obese peoplewith IGT, may be greater than the net benefit fromthe media campaign.
The calculations by Segal and colleagues rested ona number of assumptions, and in many ways theanalysis is largely hypothetical. The effectivenessapparently was assumed to extend over the fullfollow-up period, and the percentage of peopleassumed to have a successful intervention wasquite high (e.g. 33% for intensive diet andbehavioural therapy). In contrast, even the longesttrials of dietary interventions only followparticipants for up to 5 years, and since manyintervention group members regain a lot of theweight during the 5-year follow-up period, theeffectiveness may be overstated by Segal andcolleagues. Yet, the analysis was also conservativein a number of ways. The analysis only offsetprogramme costs with the expected reduction indirect diabetes treatment costs and did notincorporate any other reductions in costs due toreduced medication or reduced incidence of CVD.In total, the basic framework for the analysis wasuseful, and further refinement and estimation ofthe model may be helpful.
Obesity also increases the risk of CVD, so thatinterventions targeted towards obese people mayhave benefits in terms of prevention of the diseaseand associated costs. Johannesson and Fagerberg318
used data from a trial of diet versus drugtreatment for hypertension (with atenolol as thefirst drug of choice) in a sample of obese men inSweden. The analysis used a computer simulationbased in part on risk equations for stroke andCHD from the Framingham Heart Study and alsoused a willingness to pay approach in acost–benefit analysis. The sample was small andthe findings are somewhat equivocal. Fivesimulations were conducted under differentassumptions about the effect of risk factor changeson the risk of CHD. Drug treatment was costsaving relative to diet in three out of the fivedifferent simulations, but in the simulation whereall three risk factors reduced the risk of disease,diet was estimated to result in an additional yearof life for 46,000 Swedish crowns (year 1991). Themain contribution of the study may be toemphasise that a range of contributions may occurfrom behavioural interventions and that in somecases or under some assumptions the effects maybe better than drug treatment.
In a more extensive study, Salkeld and colleagues312
conducted a cost–utility analysis using data from a
trial of two lifestyle interventions administeredwithin a general practice setting (a video, and avideo plus written self-help materials) versusroutine care. The study targeted people with oneor more modifiable CVD risk factors, includingBMI > 25 kg/m2, as well as other factors such assmoking, and it is important to note that theintervention materials focused on three factors:smoking cessation, healthy eating and physicalactivity. Therefore, the results of the study arepotentially affected by confounding from both theother risk factors and components of theintervention targeted towards those risk factors.The presence of obesity was high among the studypopulation, with a mean BMI of 30 kg/m2.
The authors used a model based on risk equationsfor CHD and stroke from the Framingham HeartStudy. The video was found not to increase theoutcomes of life-years or QALYs in the general at-risk population identified in the study, and thevideo plus self-help did not increase the outcomesin a more narrowly identified high-risk population(with very high blood pressure or totalcholesterol). The estimated cost per life-year savedor cost per additional QALY was extremely high inthe general at-risk population for the video plusself-help, at Aus$152,128 and more than Aus$11million per additional QALY for males andfemales, respectively. The best results obtainedwere in a sensitivity analysis that assumed thathigh-risk individuals who changed behaviourmaintained the change over 2 years, whichresulted in a cost per additional QALY ofAus$4,342. The main lessons from the study maybe that the cost-effectiveness of lifestyleinterventions is often going to be relatively poorunless the interventions are targeted towardspeople at high risk of developing disease andunless the behaviour is maintained over time.
SummaryIn total, a number of fairly recent studies haveattempted to assess the cost per life-year saved orcost per additional QALY from a range oftreatments for obesity. Table 15 provides a veryrough conversion of the results from selectedrecent studies to current (2001) UK poundssterling. Such conversions and comparisons ofcost-effectiveness results from different studies aresubject to a number of qualifications. It is possibleto document certain differences between studies(e.g. specific target population and length of timeused in follow-up). However, translating ICERresults from one country’s currency to another
Systematic review of economic evaluations
150

Health Technology Assessm
ent2004; Vol. 8: No. 21
151
© Q
ueen’s Printer and Controller of H
MSO
2004. All rights reserved.
TABLE 15 Comparison of selected base-case cost-effectiveness estimation/modelling results (studies published after 1996)
Target (modelled) Intervention Comparator Source Years Original Outcome Cost per Cost per Cost per population (first author, modelled currency measure additional additional additional
year of or followed and year of unit of unit of unit of publication) cost data outcome in outcome in outcome in
original currency original year £ year 2001 £a
Obese people with type 2 diabetesNo complications Orlistat Diet Lamotte, 2002313 10 years Euros 2000 Life-years €19,968 £12,522 £12,760
(unspecified) modelled
Hypercholesterolaemia Orlistat Diet Lamotte, 2002313 10 years Euros 2000 Life-years €7,407 £4,645 £4,733(unspecified) modelled
AHT Orlistat Diet Lamotte, 2002313 10 years Euros 2000 Life-years €7,388 £4,633 £4,721(unspecified) modelled
Hypercholesterolaemia Orlistat Diet Lamotte, 2002313 10 years Euros 2000 Life-years €3,462 £2,171 £2,212and AHT (unspecified) modelled
Morbidly obese BMI ≥ 45 kg/m2 Vertical banded No weight Clegg, 200227 20 years UK pounds QALYs £10,237 £10,237 £10,432
gastroplasty loss modelled 2000
BMI ≥ 45 kg/m2 Adjustable No weight Clegg, 200227 20 years UK pounds QALYs £8,527 £8,527 £8,689gastric banding loss modelled 2000
BMI ≥ 45 kg/m2 Roux-en-Y No weight Clegg, 200227 20 years UK pounds QALYs £6,289 £6,289 £6,408gastric bypass loss modelled 2000
BMI ≥ 45 kg/m2 or Gastric bypass No Segal, 1998316 25 years Australian Life-years Aus$12,300 £5,527 £6,27745 kg excess, 10% surgery intervention modelled dollarsIGT, 90% NGT 1997
BMI ≥ 45 kg/m2 or Gastric bypass No Segal, 1998316 25 years Australian Life-years Aus$4,600 £2,067 £2,32945 kg excess with surgery intervention modelled dollarsIGT 1997
Seriously obese people100% IGT VLCD and No Segal, 1998316 25 years Australian Life-years Cost saving NA Cost saving
individual intervention modelled dollars (VLCD and (VLCD and therapy 1997 therapy dominates) therapy
dominates)
continued

Systematic review of econom
ic evaluations
152
TABLE 15 Comparison of selected base-case cost-effectiveness estimation/modelling results (studies published after 1996) (cont’d)
Target (modelled) Intervention Comparator Source Years Original Outcome Cost per Cost per Cost per population (first author, modelled currency measure additional additional additional
year of or followed and year of unit of unit of unit of publication) cost data outcome in outcome in outcome in
original currency original year £ year 2001 £a
10% IGT, 90% NGT VLCD and No Segal, 1998316 25 years Australian Life-years Aus$2,600 £1,168 £1,316individual intervention modelled dollarstherapy 1997
Type 2 diabetics>120% of IBW or > Metformin Diet Clarke, 200187 Median UK pounds Life-years Cost saving NA Cost saving
approximately follow-up 1997 (metformin (metformin 25.6 kg/m2 BMI 10.7 years dominates) dominates)
People in general practice at very high risk of CVDDBP >95 mmHg or Educational No Salkeld, 1997312 Lifetime Australian QALYs Aus$29,574 £14,066 £17,386
total cholesterol video intervention dollars> 6.5 mmol/l (usual care) 1994
(mean BMI > 30 kg/m2)
a The conversion is done by first converting to UK pounds in the original year of the data using midyear intrabank conversion rates from www.itools.com and then inflating asappropriate using the following pay and price index rates for hospital and community health services from www.ukc.ac.uk/pssru:324 1997/98, 1.7; 1998/99, 4.0; 1999/00, 4.5;2000/01, 1.9.
NA, not applicable.

assumes that important factors, such as underlyingcharacteristics of the study population that may berelated to study effectiveness and patterns ofhealth service use, are the same across the twocountries. The conversion also assumes thatpatterns of health service treatment have notchanged over time, although the problems fromthis assumption are reduced by limiting theassessment to fairly recent studies.
While remembering these caveats, the comparisonsin Table 15 are potentially helpful and interesting.First, the combination of the costly implications ofobesity for development of CVD and type 2diabetes means that interventions targeted towardshigh-risk obese individuals (e.g. those withdiabetes or IGT, those with hypertension or highrisk for CVD, or those who are morbidly obese)are likely to result in costs per additional life-yearor QALY of no more than £13,000 in most cases.The only entry in Table 15 with a higher ICER wasfor the intervention in a general practice settingmodelled by Salkeld and colleagues.312 This returnon investment of healthcare resources is at least asgood as many other disease treatments, and islower than the cost-effectiveness estimatesconsidered by NICE in existing decisions onrecommendations for use of some of thetreatments (see NICE website23,24). Furthermore,as is clear from the table as well as commonknowledge, the greater the targeting towardshigher risk individuals, the lower the cost peradditional unit of outcome. Finally, one studyprovided reasonably rigorous evidence of cost-saving from treatment with metformin.87
The estimated (year 2001) cost-effectiveness ofgastric bypass surgery in the morbidly obesepopulation was extremely similar for two studies:£6408 per QALY and £6277 per life-year. Threepoints are relevant. First, the two estimates are fordifferent outcome measures but implyapproximately a value of 0.87 QALYs for morbidlyobese people (if one equates the two estimates).This value may very well be within the plausiblevalues of quality of life for morbidly obese people.Second, targeting of surgery to morbidly obesepeople with IGT would be even more cost-effectiveat £2329 per additional year of life. Third, since
both Clegg and colleagues27 and Segal andcolleagues316 modelled open Roux-en-Y gastricbypass surgery, the cost-effectiveness may bemodestly improved based on the evidence ofgreater benefit at the same cost for laparascopicversus open gastric bypass surgery.310 This lattergain, however, is likely to be considerably smallerthan the reduction in cost per additional life-yearfrom targeting surgery to people with IGT.
Finally, it is important to remember thatcomponents of the individual studies may affectthe results. In particular, the estimates of costs andeffects are both subject to varying degrees ofuncertainty, and the estimates in Table 15 areundoubtedly accompanied by confidence intervalsthat are potentially quite large. A further examplepertains to the fact that the drug trials of orlistatand sibutramine (and, to a lesser extent, surgery)tended to have very high dropout rates. Some ofthese analytical models used effectivenessestimates based on data for completers (asdiscussed in detail in the effectiveness sections ofthis report), so that results may understate actualcost per additional unit of outcome (e.g. lifesaved).
Some of the studies used conservative assumptionsto avoid overestimating the cost-effectiveness. Forexample, Clegg and colleagues27 did not includegains from reduced hypertension because of lackof evidence that the effects on hypertension arelong lasting rather than transient.278 This approachmay be reasonable, yet other researchers185,208 citeevidence that even when people regain weightafter initial loss, there is a period of reduced riskof hypertension that may confer at least someshort-term benefits. Therefore, it may bereasonable to use the Framingham logistic riskequations to estimate benefits in reduced strokeand CHD from weight loss and improvements inblood pressure and cholesterol, as done in somestudies,312,318 but given the evidence of weightregain it is likely to be best to incorporate suchreductions in short-term rather than long-termestimates. In total, however, the evidence in Table 15 is indicative of benefits from a range oftreatments for obesity for which society may bewilling to pay.
Health Technology Assessment 2004; Vol. 8: No. 21
153
© Queen’s Printer and Controller of HMSO 2004. All rights reserved.


Health Technology Assessment 2004; Vol. 8: No. 21
155
© Queen’s Printer and Controller of HMSO 2004. All rights reserved.
OverviewAs discussed in the systematic review of economicevaluations, several recent analyses show thatintervention in high-risk individuals may result inimprovements in life-years or QALYs for arelatively modest increase in healthcare costs. Inthe case of metformin for diabetics, treatment mayeven result in cost savings. Yet caution is needed inapplying these results to policy. Most of the studiesuse follow-up data from a very short period,particularly the studies of pharmaceuticalinterventions, and the effects of relatively short-term or fluctuating changes in weight or clinicalindicators such as blood pressure and cholesterolare simply not known. Furthermore, one study oflifestyle interventions in general practice312 showedthat the cost-effectiveness of such interventions isoften going to be relatively poor unless theinterventions are targeted towards persons at highrisk of developing subsequent or worsened diseaseand unless the behaviour is maintained over time.Therefore, the desire to treat obesity, especially ina preventive manner, should be balanced with anunderstanding that it is the sequelae of obesitythat result in evidence-based justification forintervention rather than obesity per se.
This chapter extends these considerations byproviding a simple economic model of theeffectiveness of lifestyle interventions inpreventing the onset of diabetes among peoplewith IGT.
The focus is on the onset of diabetes for severalreasons. First, diabetes is widely recognised as amajor cause of health service use. The Cost ofDiabetes in Europe – Type 2 (CODE 2) study325
estimates that the total current annual NHS costof type 2 diabetes is £1.8 billion or 4.1% of totalNHS expenditure. Second, although the NationalAudit Office indicated that hypertension accountsfor the most cases of disease attributable to obesityin England, type 2 diabetes has the highestproportion of cases of the disease attributable toobesity (at 47% compared with 35% forhypertension) and the annual cost per case ofdiabetes is almost three times as high as the
estimated annual cost per case of hypertension(£467 versus £170 in 1998).2 Third, the prevalenceof diabetes is projected to increase owing to trendsof increasing obesity (although increasing obesitywill also increase rates of other diseases or riskfactors such as blood pressure).
The focus is also on lifestyle interventions forseveral reasons. First, GPs are often in a positionto offer guidance on treatments to obese peoplewho have not yet developed diabetes, CVD orother diseases for which the risk is increased byobesity. Although general recommendations onlosing weight and increasing exercise should beroutine for any overweight or sedentaryindividual, effective programmes for lifestylechanges in diet, exercise and behaviour can beboth intensive and expensive. Therefore, anawareness of the cost-effectiveness of suchprogrammes among people identified as high risk(according, for example, to glucose tolerance orblood pressure) can provide important guidancefor appropriate targeting of such interventions toindividuals. Furthermore, results from theeffectiveness review described earlier showed thatone long-term study of lifestyle interventions167–171
had significant benefit regarding effects on theonset of diabetes. Since economic evaluations havenot yet been published from this study, the use ofmodelling techniques can provide insight into thepotential cost-effectiveness of the interventions.
Description of the interventionand published effectivenessTuomilehto and colleagues167–171 (referred to asthe FDPS in the effectiveness review) estimated theeffect of a lifestyle intervention consisting of a low-fat diet and exercise on the onset of diabetesamong 522 middle-aged overweight Finnishpeople with IGT. Study enrolment occurredbetween 1993 and 1998. The intervention groupwas given detailed dietary recommendations (tolimit the total intake of fat to less than 30% ofenergy consumed and of saturated fat to less than10%, and to increase fibre to at least 15 g/1000 kcal,as well as advice about specific food types) and
Chapter 5
An economic model of the cost-effectiveness of lifestyle treatments for obesity

asked to undertake moderate exercise for at least30 minutes per day. Intervention group membershad seven sessions with a dietitian during the firstyear and quarterly meetings thereafter. Supervisedexercise sessions were also offered; during the firstyear the rate of participation varied from 50 to85% at different centres. Control subjects receivedoral and written information about diet andexercise at a baseline visit.
The results from the randomised trial werereviewed in an earlier section of this report, butthe finding of most importance for the model isthat the risk of diabetes was significantly reducedby 58% in the intervention group. Furthermore,the reduction in the incidence of diabetes wasdirectly linked to changes in lifestyle. Table 16provides the estimated rates of prevalence ofdiabetes in the two groups as well as 95%confidence intervals by the number of years sincebaseline. Only a very small number of subjects wasboth followed and still at risk of developingdiabetes for the full 6-year follow-up periodpresented, so the estimated difference inprevalence was not statistically significant in thefifth and sixth years of follow-up. Additionalanalyses showed that the reduction in the onset ofdiabetes was significantly greater among people ineither the treatment or control group who weresuccessful in achieving dietary and exercise goalsthan among people who did not achieve suchgoals. The intervention group lost significantlymore weight than the control group during boththe first and second years following baseline,although there was some weight regain during theintervention group in the second year of the study.There was also some improvement in other riskfactors during the first year of follow-up, but datafor subsequent years were not reported, so it is notknown how well reductions in these other riskfactors were sustained over the follow-up period.
A Markov model to estimatecost-effectivenessA Markov model is composed of a set of definedstates of health between which a patient can moveover successive periods. Transition probabilitiesare used to allow a patient to move within andbetween these states of health. A patient can be inonly one state of health at any time and can makeonly one transition per cycle. The cycle is adiscrete period spent in each state of health beforetransition to a successive state of health. A relevantperiod is chosen for the length of the cycle andthe cycles then link together to create a Markovchain. Length and quality of life may vary acrossthe different states, and the total cost isdetermined by the occurrence or recurrence ofdifferent states and the length of time in variousstates.
Although the effectiveness of the interventionmight differ in the UK from the results in Finlandbecause of a range of social or cultural factors,estimation using the effectiveness results incombination with estimates of UK costs provides auseful benchmark. Figure 248 depicts thesimplified Markov model used to estimate thecost-effectiveness of a lifestyle intervention similarto the one studied by Tuomilehto and colleagues.The model enables estimation of a typicalpatient’s costs and outcomes for the lifestyletreatment versus no intervention (beyondprovision of standard information) over a definedperiod. The Markov model includes a number ofconsiderations, as described below.
� For both the intervention and control treatmentgroups, the Markov model embodies fourdifferent states: a state of impaired glucosetolerance; a state of onset of type 2 diabetes, astate of continuing type 2 diabetes; and death.
An economic model of the cost-effectiveness of lifestyle treatments for obesity
156
TABLE 16 Approximate cumulative prevalence rates of diabetes by treatment group in study by Tuomilehto and colleagues168
Years since Total subjects Intervention Controlbaseline still at risk of
diabetes Estimated prevalence 95% CI Estimated prevalence 95% CIrate rate
1 507 2 0.5 to 3.5 6 3 to 92 471 6 3 to 9 14 10 to 193 374 9 4 to 13 21 15 to 274 167 11 6 to 15 23 17 to 295 53 20 8 to 32 34 21 to 476 27 20 8 to 32 43 25 to 55
Source: Estimated from Figure 2 in the original publication.168

(Figure 248 combines the states of onset andcontinuing diabetes for simplicity.)
� The length of each period in the model is 1 year.
� All people start the model with IGT. They mayleave to the state of onset of diabetes or todeath according to specified transitionprobabilities.
� Revision from the state of diabetes (onset orcontinuing) to IGT is allowed, but is assumed tohave a very small likelihood (1%) based on datafrom Segal and colleagues.316
� For simplicity, the possibility of exit from IGT ordiabetes to a state of NGT is not incorporatedinto the model. Such a transition is possible andwas incorporated into the model by Segal andcolleagues.316 Therefore, the current modelprovides a conservative estimate of the cost-effectiveness.
� Death is the only absorbing state in the model(i.e. the only state from which people cannotexit). The probability of death is based on aperson's age, gender and diabetes status. Theprobability of death increases with age and withthe onset of diabetes.
� The lifestyle intervention does not have thestates of complications that would accompany adrug or surgical intervention. Complicationsfrom any other treatments for diseases areassumed to be reflected in the expected costsassociated with being in each state.
Although weight loss is not explicitly incorporatedinto the model, weight loss has the potentialadditional benefit of reducing the risk of co-morbidities (and associated undesirable associatedeffects such as reduction in quality of life,increased use of healthcare resources andincreased risk of death). Implications of impacts
on other diseases besides diabetes are consideredin sensitivity analyses.
DATA 4.0 software (TREEAGE Software), was usedto estimate the Markov models using cohortanalysis (rather than Monte Carlo simulation).The remainder of this section discusses thetransition probabilities, outcome estimates (e.g.quality of life within a state) and costs that wereused in the estimation of the model.
Transition probabilitiesThe two key probabilities for the model are ratesof onset of type 2 diabetes and mortality rates.Transition rates from the IGT state to diabetes forup to 6 years of follow-up were constructed fromTable 16. As stated above, the assumed rate ofreturn to the state of IGT from diabetes wasconservative at 1% per annum.
UK mortality rates by age group, gender and causeof death were obtained for 1997 from WHO.326
More recent death rates are available from UKsources, but the WHO data enabled an adjustmentin the death rate according to evidence thatmortality rates from CVD are significantly higherfor people with diabetes than for people withoutdiabetes. Lee and colleagues327 used meta-analysismethods to show that the relative risk of coronarydeath from diabetes was 2.58 (95% CI 2.05 to 3.26)for women and 1.85 (1.47 to 2.33) for men. Theserelative risk rates were used to adjust the mortalityrates separately for persons with diabetes.
Outcomes dataThe Markov model used a quality of lifeadjustment figure to weight the length of timespent in each state of health. The summation oftime spent in each health state provided QALYs.
Health Technology Assessment 2004; Vol. 8: No. 21
157
© Queen’s Printer and Controller of HMSO 2004. All rights reserved.
IGT
Diabetes Death
FIGURE 248 Simplified Markov model states for lifestyle treatments for people with IGT

The literature pertaining to quality of life forobese people and to changes in quality of life fromweight loss itself has expanded rapidly as a resultof interest in the topic. Kolotkin and colleagues328
provided a review literature from MEDLINE since1990 on the relationship between quality of lifeand obesity. One major limitation, particularly forthe problem at hand, is that it is difficult toseparate reductions in health-related quality of lifedue to obesity itself from reductions due to otherdiseases that have a high prevalence among obesepeople.329
For this simple model, the most importantdistinction in qualify of life has to do withdifferences due to diabetes. The preference score(on a scale of 0 to 1) for diabetics of 0.90 wasobtained from the Cost Utility Analysis database of Harvard University atwww.hsph.harvard.edu/organizations/hcra/cuadatabase/intro.html/ This rate was slightlyhigher than the rate available for people withdiabetes and congestive heart failure (0.87) andthe rate for insulin-dependent diabetes mellitus(0.838). Unfortunately, this database does notinclude an estimate of quality of life for obesenon-diabetic people. Clegg and colleagues27
indicated that they could not find any estimates ofhealth-related quality of life that are directlyapplicable to estimating QALYs for obese people,but they cite work indicating that under a “bestcase scenario” an obese person might have aquality of life of 0.94, and that an obese personlosing 10% or more of their weight might have anincrease in the score to 0.99. A rate of 0.96 (in themiddle of this range) was arbitrarily selected forthe base-case analysis for people in the IGT state,and sensitivity analyses are used to assess theimplications of different QALY weights. Asspecified in UK guidelines for conducting healthtechnology assessment,330 QALYs were discountedusing a rate of 1.5% per annum.
CostsEstimates of three types of costs were required:lifestyle intervention costs, health service costs forpeople with diabetes and health service costs forpeople with IGT. Since Tuomilehto and colleaguesdescribed their intervention clearly, theintervention costs are relatively easy to estimate.Based on unit costs of healthcare calculated forthe UK for 2001,324 the dietitian cost per visit wasestimated at £32. The same cost was assumed forthe person leading the exercise classes, although itwas assumed that these were group sessions with20 people, that only 60% of the group attendedtwo sessions per week during the first year and
that only 30% attended during the subsequentyears. The total estimated costs were £324 perperson in the first year and £178 per person persubsequent year.
Lacking any data on specific health service use bystudy participants (intervention or control), it isnecessary to use very rough estimates of directhealthcare costs. The CODE 2 study325 estimatedthat the total direct healthcare costs for someonewith diabetes averaged £1505. Using this averagefor each year of the model could be problematic ifhealthcare costs are relatively low at onset andincrease over time. An analysis of the pattern ofdiabetes costs over time among persons withdiabetes in a managed care setting in the USAshowed, however, that among diabetics costs weresubstantially higher in the first year of treatmentfor diabetes than they were during the subsequent9 years of treatment.331 Higher first year costsseem likely given that people may be hospitalisedat the onset of their diagnosis of diabetes and willrequire substantial education to learn how to carefor themselves. Therefore, defining onset as thefirst year of treatment (although the disease mayhave been developing over several years beforethis), the costs for the year of onset of diabeteswere set at one and a half times the rate of £1505(which was used as the rate for all subsequentyears of continuing diabetes treatment). Theseannual costs are higher than those indicated inother studies,2,87 but the estimates from thoseother studies may be affected by such other factorsas study inclusion criteria, estimation methodologyor recent changes in technology.
Obtaining estimates of healthcare costs for peoplewith IGT was much more difficult. A differentstudy in a managed care setting indicated thathealthcare expenditures per person with diabeteswere 2.4 times more than were expenditures for agroup of control subjects matched by age andgender.332 While this ratio may not represent thespecific ratio for people with IGT relative to thosewith diabetes and may also reflect differences intreatment patterns between the USA and the UK,the fact that matching was used means that somedifferences (aside from diabetes status) arecontrolled. Therefore, the costs for people in theIGT state were calculated at £1505 divided by 2.4,or roughly £627 per year.
Three other points about costs are relevant. First,substantial evidence indicates that healthcare costsincrease dramatically during the last year of life.Therefore, a multiple of three times the annualcosts of treatment for persons with diabetes was
An economic model of the cost-effectiveness of lifestyle treatments for obesity
158

added to costs for people who died. Second,screening costs for IGT were not includedseparately, although they should be reflected inthe estimated costs for diabetics and people withIGT. Third, the dropout rates in the Finnish studywere only 7% at 2 years, compared with dropoutrates between 40 and 48% in some of the trials oforlistat or sibutramine. Therefore, the internalvalidity of the estimates may be much higher fromthe Finnish study than from some of the otherintervention studies reviewed in this report.
All costs are presented in 2001 UK poundssterling. As specified in UK guidelines forconducting health technology assessment,330 costswere discounted using a rate of 6% per annum.The perspective used in the analysis was that ofthe healthcare purchaser. Indirect costsattributable to obesity (e.g. costs of absence fromwork and of premature death) were not included.For readers interested in the potentially hugeindirect costs of obesity, a report by the UKNational Audit Office provides estimates.2
ResultsBase case resultsThe tree representing the Markov model for thebase-case analysis is provided in Appendix 38. Thebase-case estimates are presented in Table 17 for a6-year follow-up period, which was the length offollow-up available in the study published byTuomilehto and colleagues. The base-case
estimates are presented for a cohort of individualsstarting at the age of 55 years (the mean age atentry into the study) with the same genderdistribution from the study (33% male). TheICER, or cost per additional QALY, was £13,389 at6 years following baseline.
Incremental costs between the intervention andtreatment groups initially increase with length offollow-up, but at a decreasing rate. Theincremental cost reaches a maximum in year 5following baseline and then starts to decline,because the differential (greater) accumulation ofpeople with diabetes and associated costs in thecontrol group is more than offsetting thecontinuing lifestyle intervention costs. In contrast,the increment in QALYs increases during eachyear of follow-up because the rate of onset ofdiabetes is lower for people in the treatmentgroup, although the absolute magnitude of theestimated increase in QALYs per person at 6 yearsfollowing baseline is modest at 0.036. The initiallyhigh incremental cost per additional QALY of£113,905 occurs because of the initial investmentin lifestyle change therapies in the interventiongroup, but the initial expenditures aresubsequently offset by reduced disease treatmentcosts for the intervention group.
Sensitivity analysis: precision ofestimates of transitions to diabetesTable 16 showed that the confidence intervalsaround the transition rates become quite largebeyond the fourth year of the intervention owing
Health Technology Assessment 2004; Vol. 8: No. 21
159
© Queen’s Printer and Controller of HMSO 2004. All rights reserved.
TABLE 17 Base-case results for a lifestyle (diet and exercise) intervention
Years since Strategy Cost per Incremental QALYs Incremental ICER (Cost per baseline person cost per per person QALYs additional
person per person QALY)
1 No intervention £1,019 0.937Diet & exercise £1,287 £268 0.939 0.002 £113,905
2 No intervention £1,779 1.849Diet & exercise £2,121 £342 1.856 0.007 £50,440
3 No intervention £2,559 2.739Diet & exercise £2,949 £390 2.752 0.013 £29,903
4 No intervention £3,313 3.608Diet & exercise £3,769 £456 3.627 0.019 £23,732
5 No intervention £4,165 4.452Diet & exercise £4,665 £500 4.478 0.026 £19,049
6 No intervention £5,023 5.273Diet & exercise £5,508 £485 5.309 0.036 £13,389

to the small number of people that were followedfor that duration and were still at risk of diabetes.Formal sensitivity analysis could be used tocharacterise the uncertainty in these estimates;however, results from another study published veryrecently corroborate these estimates.255–257 In thisstudy, 3234 non-diabetic people with IGT wererandomly assigned to a lifestyle intervention(similar in focus to the one studied by Tuomilehtoand colleagues167–171 but with more initialintervention, including behaviour therapy and lessreinforcement in subsequent years), metformin ora placebo. The mean follow-up was 2.8 years, but1510 subjects were followed for 3 years and someparticipants were followed for 4 years. The resultsindicated that the lifestyle intervention reducedthe incidence of diabetes by 58% overall duringthe follow-up period (while metformin onlyreduced the incidence by 31%) compared with theplacebo. These very similar results from a muchlarger study mean that the findings by Tuomilehtomay be very robust (both over time and acrosscultures). Therefore, the future analyses possibleonce longer follow-up data are available may bemore relevant than detailed assessments of theimplications for uncertainty in the estimates of thefifth and sixth years of data.
For assessment purposes, the ICER was calculatedunder two extreme value situations: (1) a pessimisticapproach assuming the upper bound of the 95%confidence interval for the intervention group andthe lower bound for the control group to the endof the fourth year of follow-up; and (2) anoptimistic approach assuming the converse (thelower bound for the intervention group and theupper bound for the control group). Thepessimistic analysis resulted in a cost of £310,593per QALY gained for the lifestyle interventionversus control at the fourth year of follow-up. Theoptimistic analysis resulted in a cost of £253 perQALY gained at the fourth year of follow-up.
Sensitivity analysis: cost ofinterventionThe cost of the intervention was purposefully doneusing high rather than low estimates of cost. Forexample, the sessions with the dietitian were allassumed to require a full visit (ostensibly an hour).In reality, however, sessions after the first fewmeetings might take on average only half an hour.The analysis was rerun assuming that theintervention costs were two-thirds of the valuesused in the base case (£324 for the first year and£178 for subsequent years). This analysis resultedin a cost per additional QALY of £4027 at 6 yearsafter baseline (or less than one-third of the
incremental cost per QALY for the base-caseanalysis).
Sensitivity analysis: length of follow-upSince the follow-up time in the study byTuomilehto and colleagues was limited to 6 years,any estimation of the cost-effectiveness beyond 6 years is based entirely upon assumptions and istherefore very speculative. Furthermore, the factthat weight is often regained within 5 yearsfollowing many of the lifestyle (as well as drug)trials reviewed earlier means that a high degree ofcaution should be applied in extending the results.
Given these caveats, Figure 249 depicts the ICERover 15 years following intervention under therelatively conservative assumption that after 6 years both the intervention and control groupshave the same annual rate of onset of diabetes.The rate used is the average rate per year for the6 years of follow-up for the control group(approximately 7.2% per year), even though theintervention group is assumed to continue to meetwith a dietitian four times a year. Under thisassumption, the incremental cost per additionalQALY continues to decline from £13,398 in year 6to £5,825 in year 15. The rate of decline in theincremental cost per QALY tapers off considerably,however, by year 15.
If intervention group members continue to have alower rate of onset of diabetes, then the curve inFigure 249 would decline rapidly after year 6 andconceivably the intervention could dominate (i.e.have lower total costs and greater total effects thanthe control group) at some point. Yet such anoutcome is only speculative, and it is alsoconceivable that the intervention may have onlydelayed rather than permanently avoided theonset of diabetes, in which case the incrementalcost per QALY could conceivably increase at somepoint (although a more modest decline is the mostlikely scenario).
Sensitivity analysis: quality of lifeOther parameters in the model that were subjectto a great deal of uncertainty were the quality oflife weights for diabetic and non-diabetic obesepeople. The model was re-estimated using a lowervalue for people with diabetes (a decrease of 0.03to 0.87, which is the rate cited earlier for peoplewith diabetes and CVD) and a higher value forthose without diabetes (an increase of 0.03 to 0.99,which was considered earlier as a possible upperbound for people who are obese but not sufferingfrom other severe diseases). The incremental costper QALY at 6 years after baseline was £6933, or
An economic model of the cost-effectiveness of lifestyle treatments for obesity
160

almost half of the incremental cost per QALY fromthe base-case analysis. The magnitude of thechange in the incremental cost per QALYillustrates the substantial effect that very modestchanges in the value used for quality of life canhave on the estimated cost-effectiveness.
DiscussionIdeally, the model estimated in this report wouldnot only have addressed impacts on the onset ofdiabetes, but also have considered the impact ofthe lifestyle intervention on hypertension,hypercholesterolaemia and subsequent CVD. Themain challenge in incorporating theseconsiderations in economic evaluations oftreatment for obesity is that it is very difficult toestimate what long-term effects may accrue fromshort-term weight loss or reduction in risk factors,especially since such factors often deterioratefollowing initial improvements. In particular, itmay be best not to include gains from reducedhypertension, because of lack of evidence that theeffects on hypertension are long lasting ratherthan transient,278 and therefore benefits mayaccrue only to a self-selected group of participantswho are more likely to participate in long-termlifestyle modification.208
The estimates provided from this economic modelwere conservative in a number of ways. The focus
has been on the implications of lifestyleintervention for the onset of diabetes, but muchoverlap exists between the medical conditionsassociated with obesity. People with diabetes oftenhave increased lipids and blood pressure, andreductions in lipids and blood pressure will notonly decrease CVD, but also have additionalbenefits regarding diabetes. In total, therefore, thebenefits in terms of reduced costs and improvedquality of life have probably been underestimatedin the model presented here, in which case theresults provide an upper bound on the cost-effectiveness of lifestyle interventions.
The modelling results may also be put intoperspective by comparison with the summary ofsystematic review results in Table 15. The estimated base-case 6-year incremental cost perQALY of £13,389 is only slightly higher than most of the lifetime ICERs estimates in Table 15(some of which are for life-years saved rather thanadditional QALYs). Subsequent declines in theincremental cost per QALY for a longer modelling horizon beyond 6 years mean that theattractiveness of lifestyle interventions mayincrease relative to other interventions.Considerations that reinforce this point includethe implications of high dropout rates in some ofthe studies and the fact that the modellingpresented here excludes benefits from reductionsin CVD that probably accompany the observedbenefits in reduced onset of diabetes.
Health Technology Assessment 2004; Vol. 8: No. 21
161
© Queen’s Printer and Controller of HMSO 2004. All rights reserved.
£0
£20,000
£40,000
£60,000
£80,000
£100,000
£120,000
1 2 3 4 5 6 7 8 9 10 11 12 13 14 15
Years since baseline
Incr
emen
tal c
ost p
er a
dditi
onal
QA
LY
YearsICER
FIGURE 249 Sensitivity analysis of extending modelling time

The key contribution of the recent studies oflifestyle interventions167–171,255–257 and theeconomic modelling results is that lifestyleinterventions should clearly be among the set oftreatment options considered for obese individualswith certain high-risk factors. However, furtherinvestigations will be important regarding twoother important issues. First, no single treatmentoption is likely to be best for all individuals. Forexample, surgery may be the only effective andcost-effective solution for certain types of morbidlyobese individuals. Therefore, a broaderunderstanding of the incremental cost-effectiveness of different treatments for different
subgroups of high-risk individuals is ultimatelydesirable. Second, the fact that certain treatmentsare cost-effective for high-risk individuals does notanswer the question of the cost-effectiveness of thesame interventions for lower risk obeseindividuals, whose treatment benefits may also beworth the cost. Resolution of that question willrequire, however, a better understanding of: (1)the implications of relatively short-term weightloss and improvement in risk factors (includingcycling in such measures) for long-term healthoutcomes; and (2) the implications of both short-term and long-term weight change for quality oflife.
An economic model of the cost-effectiveness of lifestyle treatments for obesity
162

Implications for practiceIn general, drug trials provided the clearestpointers for the management of obesity in adults,mainly because they were larger and as such hadgreater statistical power to detect outcomes, unlikenon-drug studies. Results of trials of orlistat showedslightly less weight loss, but a more beneficialeffect on risk factors than sibutramine. Metformin,however, was the only drug evaluated over morethan 2 years that was able to examine effects onmortality. Metformin was the only drug that wasassociated with beneficial effects on mortality inobese diabetics.
There were very few data on risk factor changes fordiets, particularly beyond 12 months, other than forthe 600 kcal/day deficit or low-fat diet, despite somesuggestion that VLCDs and LCDs may providegreater weight loss. The 600 kcal/day deficit or low-fat diet highlighted clear benefits on weight, riskfactors and clinical outcomes, such as the preventionof diabetes and improvement in hypertension, andeffects appeared to persist for up to 3 years.
Exercise or behaviour therapy added to diet wasassociated with increased weight loss, includingafter 12 months. The FDPS167–171 providedevidence that diet and exercise together couldprevent type 2 diabetes. There was no comparableevidence available for the effect of a diet andbehaviour therapy without exercise on diabetes.Exercise programmes and behaviour therapy arenot well established for the management of obesityin the NHS at all levels of care. Considerationneeds to be given to how the interventions used inthe trials described here could be implemented inthe UK, given that the trials were mostly undertakenin the USA or Scandinavia. Exercise and behaviourtherapy are not necessarily mutually exclusive,although the very limited current evidence wouldsuggest exercise as the first approach.
Although the effect of exercise and behaviourtherapy added to diet on weight and risk factorswas less clear, the TONE,210–224 TOHP I and IIstudies197–209 demonstrated benefit on clinicaloutcomes, such as hypertension, from behaviourtherapy and exercise added to a 600 kcal/daydeficit or low-fat diet.
The epidemiological review analysed specificoutcomes to assess the long-term effect of weightloss on mortality and co-morbidities associatedwith obesity. Intentional weight loss appeared toreduce significantly all types of mortality forwomen if they had obesity-related illness.However, the same was not found for men, wheresurprisingly, weight loss did not appear to beassociated with a reduction in mortality due toCVD, and an increased risk of mortality due tocancer was observed. The primary exception wasfor diabetes-related deaths, for which weight losswas associated with a reduction in mortality inboth men and women. The reason for this genderdivide is unclear, but may be related to the fewervisits to a doctor by men. The striking differencein men with diabetes is the decrease in diabetes-related mortality, which may be due to attendanceat their doctor for diabetes therapy.
Weight lost more quickly (i.e. within a year) in anepidemiological framework may be beneficial withrespect to risk of mortality. The amount of weightloss investigated (more than or less than 9 kg)does not seem to have an additional effect onmortality, indicating that it is likely to be theweight loss itself that may be beneficial.
The epidemiological review also found that weight loss from surgical interventions in theobese was associated with a decrease in the risk of developing diabetes, more so than with non-surgical therapies. However, there was anindication that those who initially lost weight and then regained their weight may have anincreased risk of developing diabetes. Althoughweight losses were generally associated with drops in glucose levels (that is, there was a positive relationship) this was not reliable enough to define in an equation useful forprediction.
There was also a relationship between weight loss and reduction in LDL and total cholesterol.Modelling estimated that a loss of 10 kg may lead to a reduction in total cholesterol of0.25 mmol/l, which equates to a fall of 5% incholesterol (which is half that previously quoted in guidelines).17 This appears to be a long-termbenefit.
Health Technology Assessment 2004; Vol. 8: No. 21
163
© Queen’s Printer and Controller of HMSO 2004. All rights reserved.
Chapter 6
Conclusions

Significant weight losses were also associated withreductions in blood pressure. The regressionmodel estimated that a 10 kg loss was associatedwith a 3.6 mmHg reduction in DBP. The bestfitting regression model for SBP related not toabsolute weight loss but to percentage weight lost,such that a 10% loss was predicted to result in 6.1 mmHg reduction in SBP. Once again, this islower than that previously quoted in guidelines,17
where 10 kg loss was linked with a 10 mmHg fallin both DBP and SBP. The current reviewsuggested that in surgical studies with large weightlosses there was a levelling off of benefit after acertain weight loss. The longer follow-up (e.g. 8 years) in surgical studies could indicate agradual creeping upwards of the blood pressure,in contrast to that seen for glycaemic controlwhich maintains a benefit.
Sleep apnoea also appeared to be improved withweight loss, especially in people after obesitysurgery. It is regrettable that there is very littlehard evidence regarding the importance of weightloss to the risk of stroke, which remains undefined.
Psychological well-being as a measure of healthwould appear to improve with weight loss in thosewith obesity, with less negativism and introversionafter weight loss.
With the costly implications of obesity for thedevelopment of diseases such as type 2 diabetesand CVD, the systematic review of economicevaluations suggested that targeting high-riskindividuals was likely to result in a cost peradditional life-year or QALY of no more than£13,000. This return on the use of healthcareresources is comparable to many other diseasetreatments.23,24 There is also suggestive evidenceof cost-saving from treatment of people with type 2 diabetes with metformin.87 Targeting ofsurgery to morbidly obese people with impairedglucose tolerance is likely to be very cost-effectiveat £2329 per additional life-year.
Economic modelling of diet and exercise treatmentover 6 years for people with IGT demonstratedhigh initial cost per additional QALY, but by year 4 the cost per QALY was £29,903 and by year 6 the cost per QALY was £13,389. The latterfigure is comparable to the figure derived fromthe economic systematic review given above. Asensitivity analysis adopting a pessimistic approachgave a cost per QALY of £310,593 for year 4,while an optimistic analysis gave a figure of £253per QALY for year 4. Assuming lower costs for theintervention produced a cost per additional QALY
of £4027 at year 6, and assuming a greater impacton quality of life produced a cost of £6933 at year 6. However, these costs assume onlyreductions from the treatment of diabetes, and donot include potential savings from other diseases,such as hypertension. As such, estimated costsavings are likely to be conservative.
Lifestyle interventions, such as diet and exercise,appear to be comparable to other treatmentoptions, such as drug treatment, in obeseindividuals with risk factors such as IGT.
Recommendations for researchResearch on obesity� More RCTs and epidemiological studies are
needed in high-risk populations, particularlypeople with co-morbidities, cardiovascular riskfactors or BMI > 40 kg/m2. Research should alsoexamine the influence of age, ethnic group andgender on outcomes.
� More studies are need in primary care in high-risk groups.
� Drug trials should include lifestyle interventions,such as behaviour therapy and exercise, inaddition to dietary advice as standardmanagement. As the prescription of drugs forthe management of obesity may be limited bytime, drug trials should follow up participantsafter they stop taking the drug.
� There was insufficient time in this review toexamine the effects of exercise or behaviourtherapy alone, which should also be reviewedfor the treatment of obesity.
� Further exploration of the treatments forobesity is required to answer: what type ofexercise or behaviour therapy is best, whatfrequency of contact is best, what type of diet inthe long term is most beneficial, and what is therole for booster sessions? More research isneeded to examine how high dropout rates instudies can be explained, reduced andaccounted for in the analysis.
� As the review of RCTs was limited to adults witha BMI ≥ 28 kg/m2, it has not assessed theinterventions examined in this systematic reviewfor people with lower BMIs, that is, for theprevention of obesity. The authors stronglyrecommend that such a review be undertaken,which would include community interventionsthat have been excluded by this BMI cut-off orby the fact that they were not RCTs.
� A clearer understanding of the incrementalcost-effectiveness of different treatments forsubgroups of high-risk individuals, e.g. surgery
Conclusions
164

Health Technology Assessment 2004; Vol. 8: No. 21
165
© Queen’s Printer and Controller of HMSO 2004. All rights reserved.
for people with morbid obesity, is desirable.The cost-effectiveness of interventions for lowerrisk obese individuals should also be examined.To answer this question the implications ofrelatively short-term changes in weight and riskfactors (including cycling in such measures) forlong-term health outcomes and quality of lifeneed to be determined.
Methodological research� Future RCTs should have adequate statistical
power to determine long-term outcomes, whichshould include not only weight, but also riskfactors, morbidity and mortality, quality of lifeand economic outcomes.
� The methodological quality of trials should beimproved and the results should be reportedaccording to the guidelines of the CONSORTstatement.249 Greater efforts should be made tofollow up participants in the RCTs. Sensitivityanalyses should be undertaken to examinewhether the assumptions used for this report to
estimate missing parameters influenced theresults. Triallists should report standarddeviations or standard errors to allow datavariability to be assessed and, where possible, asdifferences between two time-points.
� For future epidemiological studies, methodsand definitions need to be more clearly agreedand defined. Long-term prospective studies alsorequire adequate statistical power and consistentadjustments. The follow-up strategies withrespect to time and the numbers of people wereextremely varied and would benefit from astandard format. The CONSORT statement249
could also be used as a starting point forguidelines for these long-term prospectivestudies. Within such guidelines there should beprovision for long-term follow-up.
� Research and funding bodies should becommitted to structured long-term follow-upstrategies so that the long-term effects of short-term interventions can be assessed accurately.


Health Technology Assessment 2004; Vol. 8: No. 21
167
© Queen’s Printer and Controller of HMSO 2004. All rights reserved.
We are grateful to the NHS R&D HTAprogramme for support. The Health Services
Research Unit and Health Economics ResearchUnit are funded by the Chief Scientist Office ofthe Scottish Executive Health Department;however, the views expressed are those of theauthors. Dr Avenell was an MRC Health ServicesResearch Training Fellow. We are also grateful forthe help of the late Professor Mo Malek of thePharmacoeconomics Research Unit, University ofSt Andrews, who was involved in the initial settingup of this project.
Systematic review of RCTsWe would like to thank the following for providinginformation for RCTs included in our review:Marion Blonk, Iain Broom, Helena Gyllig, Paula Hakala, Catherine Hankey, Alan Howard,Susan Klaua, Wilma Leslie, Jaana Lindstrom,Marsha Marcus, Venkat Narayan, Janet Pritchard,Paul Whelton, Rena Wing, Tom Wolever, andLinda Kiernan and Sanjaykumar Patel of Roche Products Ltd.
We are also grateful to the following people fortheir assistance in producing this review: JohnBaxter, Andy Clegg, Janice Cruden, CynthiaFraser, Mike Lean, Magnus McGee, KathleenMcKinnon, Karen McLeod, Anne Milne, AliciaNixon, Sue O’Meara, Anne Powell, Craig Ramsay,Clare Robertson, Neil Scott, Doreen Skinner,Audrey Stephen, Carolyn Summerbell, Luke Vale,Anne Walker, Sheila Wallace and Norman Waugh.
EpidemiologyWe wish to especially thank the following peoplewho went to a lot of trouble to supplement theinformation for the review analysis: Paul Peppard,
M Kunesova, Michael Sjostrom, David Sjostrom,Douglas S Hess, Helaine Resnick and Earl Ford.The following people were also contacted withrespect to the review and thus we would wish tothank them for their responses: G Wannamethee,Lynn Moore, David B Allison, Kathryn Rexrodeand J Manson.
Some papers required translation. These were onlyconsidered because of the help given at theUniversity of Aberdeen by Morag Awramenko,Frank Thies, Neil Scott, Edwin van Teijlingen andJenny Greener.
Lastly, we wish to acknowledge Ian Douglas andJulie Bruce for their help and support.
Health economicsWe would like to thank Moira Napper for her helpwith the literature search.
Contribution of the authorsProfessor Iain Broom, Professor Adrian Grant,Professor Roland Jung, Professor Cairns Smithand Dr Alison Avenell (Clinical Research Fellow)initiated the project; Professors Broom and Jung chaired the project group. Dr Alison Avenell and Ms Tamara Brown conducted the systematic review of RCTs. Dr Lorna Aucott(Medical Statistician) and Dr Amudha Poobalan (Research Fellow) conducted the reviewof epidemiological studies and undertookepidemiological modelling. Dr Sally Stearns(Senior Research Fellow) reviewed the healtheconomic literature and provided the economicmodel. Dr Marion Campbell (Reader) providedmethodological advice. All authors helped to draftthe final report.
Acknowledgements


1. WHO. Obesity: preventing and managing the globalepidemic. Report of a WHO consultation on obesity.Geneva: World Health Organization; 1998.
2. Tackling obesity in England. Report by theController and Auditor General. London:National Audit Office; 2001.
3. Health survey for England 2000. Department ofHealth. URL: http://www.doh.gov.uk/stats/tables/trendtab06.xls. Accessed 15 September 2003.
4. Prentice AM, Jebb SA. Obesity in Britain: gluttonyor sloth? BMJ 1995;311:437–9.
5. Guillaume M, Lapidas L, Beckers F, Lambert A,Bjorntrop P. Familial trends of obesity through thethree generations: the Belgian–Luxembourg childstudy. Int J Obes 1995;19(Suppl 3):S5–9.
6. Grio R, Porpiglia M. Obesity: internal medicine,obstetric and gynaecological problems related tooverweight. Panminerva Med 1994;36:138–41.
7. Parsons T, Power C, Logan S, Summerbell C.Childhood predictions of adult obesity: asystematic review. Int J Obes 1999;23(Suppl):S1–107.
8. NHS Centre for Reviews and Dissemination.Ethnicity and health: reviews of literature and guidancefor purchasers in the areas of cardiovascular disease,mental health and haemoglobinopathies. York:University of York; 1996.
9. Flegal KM, Troiano RP, Pamuk E, Kuczmarski RJ,Campbell G. The influence of smoking cessationon the prevalence of overweight in the UnitedStates. N Engl J Med 1995;333:1165–70.
10. Health survey for England 1998. Department ofHealth. URL: http://www.archive.official-documents.co.uk/document/doh/survey98/hse-03.htm#3.5
11. Stunkard AJ, Sorensen TI, Hanis C, Teasdale TW,Chakraborty R, Schull WJ, et al. An adoption studyof human obesity. N Engl J Med 1986;314:193–8.
12. Stunkard AJ, Sorensen TI, Schulsinger F. Use ofthe Danish adoption register for the study ofobesity and thinness. In Kety S, editor. The geneticsof neurological and psychiatric disorders. New York:Raven Press; 1983. pp. 115–20.
13. Thorkild I, Sorenson A, Stunkard AJ. Overview ofthe adoption studies. In: Bouchard C, editor. Thegenetics of obesity. Boca Raton, FL: CRC Press;1994. pp. 42–61.
14. Yeo GR, Farooqui IA, Aminian S, Halsall DJ,Stanhope RG, O’Rahilly S. Frameshift mutation in
MC4R associated with dominantly inheritedobesity. Nat Genet 1998;20:111–12.
15. Bouchard C. Genetics of obesity: overview andresearch directions. In Bouchard C, editor. Thegenetics of obesity. Boca Raton, FL: CRC Press;1994. pp. 223–33.
16. Lissner L, Heitmann BL. Dietary fat and obesity:evidence from epidemiology. Eur J Clin Nutr 1995;49:79–90.
17. Scottish Intercollegiate Guidelines Network. Obesityin Scotland. Integrating Prevention with WeightManagement. A National Clinical Guidelinerecommended for use in Scotland. SIGN PublicationNo. 8. Edinburgh: SIGN; 1996.
18. Royal College of Physicians. Clinical management ofoverweight and obese patients. With particular referenceto the use of drugs. London: Royal College ofPhysicians of London; 1998.
19. National Heart, Lung and Blood Institute andNational Institutes of Health Obesity EducationInitiative Expert Panel. Clinical guidelines on theidentification, evaluation and treatment of overweightand obesity in adults: the evidence report. NIHPublication No. 98-4083. Bethesda, MD: NationalInstitutes of Health; 1998.
20. Garrow JS, editor. Obesity and related diseases.London: Churchill Livingstone; 1988.
21. Sempos CT, Durazo-Arvizu R, McGee DL, Cooper RS, Prewitt TE. The influence of cigarettesmoking on the association between body weightand mortality. The Framingham Heart Studyrevisited. Ann Epidemiol 1998;8:289–300.
22. Colditz GA, Willett WC, Rotnetzky A, Manson JE.Weight gain as a risk factor for clinical diabetesmellitus in women. Ann Intern Med 1995;122:481–6.
23. National Institute for Clinical Excellence.Technology appraisal of obesity – orlistat (no. 22).URL: http://www.nice.org.uk/cat.asp?c=15712.Accessed 15 September 2003.
24. National Institute for Clinical Excellence.Technology appraisal of obesity – sibutramine (no.31). URL: htp://www.nice.org.uk/cat.asp?c=23003.Accessed 15 September 2003.
25. O’Meara S, Riemsma R, Shirran L, Mather L, ter Riet G. A rapid and systematic review of theclinical effectiveness and cost-effectiveness oforlistat in the management of obesity. HealthTechnol Assess 2001;5(18).
Health Technology Assessment 2004; Vol. 8: No. 21
169
© Queen’s Printer and Controller of HMSO 2004. All rights reserved.
References

26. O’Meara S, Riemsma R, Shirran L, Mather L, ter Riet G. The clinical effectiveness and cost-effectiveness of sibutramine in the management ofobesity: a technology assessment. Health TechnolAssess 2002;6(6).
27. Clegg AJ, Colquitt J, Sidhu MK, Royle P, Loveman E, Walker A. The clinical effectivenessand cost-effectiveness of surgery for people withmorbid obesity: a systematic review and economicevaluation. Health Technol Assess 2002;6(12).
28. National Institute for Clinical Excellence.Technology appraisal of obesity (morbid) – surgery (no 46). URL: http://www.nice.org.uk/cat.asp?c=34789. Accessed 15 September 2003.
29. NHS Centre for Reviews and Dissemination. A systematic review of the interventions for theprevention and treatment of obesity, and themaintenance of weight loss. NHS CRD Report No. 10. York: University of York; 1997.
30. Clarke M, Oxman AD, editors. CochraneReviewers’ Handbook 4.15 [updated April 2002].In The Cochrane Library (Issue 2). Oxford: UpdateSoftware; 2002. Updated quarterly.
31. National Health and Nutrition ExaminationSurvey. URL: http://www.cdc.gov/nchs/nhanes.htm.Accessed 1 June 2001.
32. Wiseman M, Gregory J, Foster K, Tyler H. The dietary and nutritional survey of British adults.London: Office of Population Censuses andSurveys, Social Survey Division, HMSO; 1990.
33. Hollander PA, Elbein SC, Hirsch IB, Kelley D,McGill J, Taylor T, et al. Role of orlistat in thetreatment of obese patients with type 2 diabetes. A 1-year randomized double-blind study. DiabetesCare 1998;21:1288–94.
34. Kelley D. A one-year study of weight loss andglycaemic control in type II diabetics followingorlistat (Xenical™) treatment. Obes Res 1997;5(Suppl 1):21S.
35. Broom I, on behalf of the UK MultimorbiditiesStudy Group. Randomised trial of the effect oforlistat on body weight and CVD risk profile inoverweight and obese patients with co-morbidities.Int J Obes 2001;25(Suppl 2):S106.
36. Wilding J, on behalf of the UK MultimorbidityStudy Group. Early response to orlistat treatmentpredicts long-term success in overweight andobese patients with co-morbidities. Int J Obes2001;25(Suppl 2):S108.
37. Rossner S, Sjostrom L, Noack R, Meinders AE,Noseda G. Weight loss, weight maintenance, andimproved cardiovascular risk factors after 2 yearstreatment with orlistat for obesity. European OrlistatObesity Study Group. Obes Res 2000;8:49–61.
38. Toornvliet AC, Pijl H, Frolich M, Westendorp RGJ,Meinders AE. Insulin and leptin concentrations in
obese humans during long-term weight loss. Neth JMed 1997;51:96–102.
39. Pirozzo S, Summerbell C, Cameron C, Glasziou P.Advice on low-fat diets for reducing obesity(Cochrane Review). In The Cochrane Library(Issue 4). Oxford: Update Software; 2002.
40. Broom I, Wilding J, Stott P, Myers N, UKMultimorbidity Study Group. Randomised trial ofthe effect of orlistat on body weight andcardiovascular disease risk profile in obesepatients: UK Multimorbidity Study. Int J Clin Pract2002;56:494–9.
41. Davidson MH, Hauptman J, DiGirolamo M, Foreyt JP, Halsted CH, Heber D, et al. Weightcontrol and risk factor reduction in obese subjectstreated for 2 years with orlistat: a randomizedcontrolled trial [published erratum appears inJAMA 1999;281:1174]. JAMA 1999;281:235–42.
42. Foreyt JP. A 2-year multicenter study of the effectsof orlistat (Xenical) on weight loss and disease riskfactors. Obes Res 1997;5(Suppl 1):53S.
43. Finer N, James WPT, Kopelman PG, Lean MEJ,Williams G. One-year treatment of obesity: arandomized, double-blind, placebo-controlled,multicentre study of orlistat, a gastrointestinallipase inhibitor. Int J Obes 2000;24:306–13.
44. James WP, Avenell A, Broom J, Whitehead J. A one-year trial to assess the value of orlistat inthe management of obesity. Int J Obes Relat MetabDisord 1997;21:S24–30.
45. Hauptman J, Lucas C, Boldrin MN, Collins H,Segal KR. Orlistat in the long-term treatment ofobesity in primary care settings. Arch Fam Med2000;9:160–7.
46. Farrell J. Long-term management of obesity inprimary care: the role of orlistat (Xenical). Obes Res1997;5(Suppl 1):10S.
47. Hauptman J, Lucas C, Boldrin M, Segal KR.Long-term weight loss with orlistat: impact ofselection algorithm on outcomes. Obes Res 1999;7(Suppl 1):50S.
48. Hill JO, Hauptman J, Anderson JW, Fujioka K,O’Neil PM, Smith DK, et al. Orlistat, a lipaseinhibitor, for weight maintenance afterconventional dieting: a 1-y study. Am J Clin Nutr1999;69:1108–16.
49. Anderson JW (on behalf of the Orlistat WeightMaintenance Study Group). Prevention of weightregain after conventional dieting: a 1-year studywith orlistat (Xenical) a new gastrointestinal lipaseinhibitor. Obes Res 1997;5(Suppl 1):2S.
50. Lindgarde F. Orlistat improves coronary heartdisease risk in high-risk obese population: theSwedish Multimorbidity Study. Obes Res 1999;7(Suppl 1):70S.
51. Lindgarde F, on behalf of the Orlistat SwedishMultimorbidity Study Group. The effect of orlistat
References
170

on body weight and coronary heart disease riskprofile in obese patients: the Swedish MultimorbidityStudy. J Intern Med 2000;248:245–54.
52. Sjostrom L, Rissanen A, Andersen T, Boldrin M,Golay A, Koppeschaar HP, et al. Randomisedplacebo-controlled trial of orlistat for weight lossand prevention of weight regain in obese patients.European Multicentre Orlistat Study Group. Lancet1998;352:167–72.
53. Franson K, Rossner S. Fat intake and food choicesduring weight reduction with diet, behaviouralmodification and a lipase inhibitor. J Intern Med2000;247:607–14.
54. Karhunen L, Franssila-Kallunki A, Rissanen P,Valve R, Kolehmainen M, Rissanen A, et al. Effectof orlistat treatment on body composition andresting energy expenditure during a two-yearweight-reduction programme in obese Finns. Int JObes 2000;24:1567–72.
55. Vidgren HM, Agren JJ, Valve RS, Karhunen LJ,Rissanen AM, Uusitupa MI. The effect of orlistaton the fatty acid composition of serum lipidfractions in obese subjects. Clin Pharmacol Ther1999;66:315–22.
56. Rissanen P, Vahtera E, Krusius T, Uusitupa M,Rissanen A. Weight change and bloodcoagulability and fibrinolysis in healthy obesewomen. Int J Obes 2001;25:212–18.
57. Broom I, Hughes E, Dodson P, Reckless J, onbehalf of the Orlistat UK Study Group. The role oforlistat in the treatment of obese patients with mildto moderate hypercholesterolaemia: consequencesfor coronary risk. Br J Cardiol 2002;9(8):460–8.
58. Apfelbaum M, Vague P, Ziegler O, Hanotin C,Thomas F, Leutenegger E. Long-termmaintenance of weight loss after a very-low-caloriediet: a randomized blinded trial of the efficacyand tolerability of sibutramine. Am J Med1999;106:179–84.
59. Fujioka K, McMahon FG, Mendel CM, Rowe E,Mooradian AD. Efficacy and safety of sibutraminein promoting and maintaining weight loss in obeseAfrican–Americans and Caucasians withhypertension controlled by calcium channelblockers. Obes Res 1999;7(Suppl 1):69S.
60. McMahon FG, Fujioka K, Singh BN, Mendel CM,Rowe E, Rolston K, et al. Efficacy and safety ofsibutramine in obese white and African patientswith hypertension. A 1-year, double-blind,placebo-controlled, multicenter trial. Arch InternMed 2000;160:2185–91.
61. Jones SP, Smith IG, Kelly F, Gray JA. Long termweight loss with sibutramine. Int J Obes 1995;19(Suppl 2):41S.
62. Smith IG. Long-term weight loss with sibutramine,a once-daily serotonin and norepinephrinereuptake inhibitor. Obes Res 1997;5(Suppl 1):80S.
63. Smith IG, on behalf of the Sibutramine ClinicalStudy. Randomized placebo-controlled trial oflong-term treatment with sibutramine in mild tomoderate obesity. J Fam Pract 2001;50:505–12.
64. Astrup A. Initial weight loss response tosibutramine predicts 2 yrs outcome in STORM. Int J Obes 2001;25(Suppl 2):S104.
65. Hansen D, Astrup A, Toubro S, Finer N,Kopelman P, Hilsted J, et al. Predictors of weightloss and maintenance during 2 years of treatmentby sibutramine in obesity. Results from theEuropean multi-centre STORM trial. Int J ObesRelat Metab Disord 2001;25:496–501.
66. James P, Astrup A, Finer N, Hilsted J, Kopelman P,Rossner S, et al. Sibutramine trial in obesityreduction and maintenance (STORM). Obes Res1999;7(Suppl 1):50S.
67. Toubro S, Hilsted J, Astrup A, for the STORMStudy Group. Effekt af sibutramin tilvaegttabsvedligeholdelse. En randomiseret kliniskkontrolleret undersogelse [in Danish]. UgeskrLaeger 2001;163:2935–40.
68. James WPT, Astrup A, Finer N, Hilsted J,Kopelman P, Rossner S, et al. Effect of sibutramineon weight maintenance after weight loss: arandomised trial. Lancet 2000;356:2119–25.
69. Mertens I, Wauters M, Peiffer F. A 2 yearcombined weight loss program with a hypocaloricdiet, sibutramine and physical activity increasesantithrombin III levels in obese subjects. Obes Res1999;7:125.
70. James WPT, Astrup A, Finer N, on behalf of theSTORM Group. Drug therapy for management ofobesity. Lancet 2001;357:1287–8.
71. Bitsch M, Skrumsager BK. Femoxetine in thetreatment of obese patients in general practice. Int J Obes 1987;11:183–90.
72. Breum L, Bjerre U, Bak JF, Jacobsen S, Astrup A.Long-term effects of fluoxetine on glycemiccontrol in obese patients with non-insulin-dependent diabetes mellitus or glucoseintolerance: influence on muscle glycogensynthase and insulin receptor kinase activity.Metabolism 1995;44:1570–6.
73. Goldstein DJ, Rampey AH, Enas GG, Potvin JH,Fludzinski LA, Levine LR. Fluoxetine: arandomized clinical trial in the treatment ofobesity. Int J Obes 1993;18:129–35.
74. Marcus MD, Wing RR, Ewing L, Kern E,McDermott M, Gooding W. A double-blind,placebo-controlled trial of fluoxetine plus behaviormodification in the treatment of obese binge-eaters and non-binge-eaters. Am J Psychiatry 1990;147:876–81.
75. Darga LL, Lucas CP, Carroll-Michals L. The effectof fluoxetine, a serotonin-uptake inhibitor, on
Health Technology Assessment 2004; Vol. 8: No. 21
171
© Queen’s Printer and Controller of HMSO 2004. All rights reserved.

weight loss in obese subjects. Am J Clin Nutr 1988;47:764.
76. Darga LL, Carroll-Michals L, Botsford SJ, LucasCP. Fluoxetine’s effect on weight loss in obesesubjects. Am J Clin Nutr 1991;54:321–5.
77. O’Kane M, Wiles PG, Wales JK. Fluoxetine in thetreatment of obese type 2 diabetic patients. DiabetMed 1994;11:105–10.
78. Wadden TA, Bartlett SJ, Foster G. Sertraline andrelapse prevention training following treatment byvery-low-calorie diet: a controlled clinical trial.Obes Res 1995;3:549–57.
79. Foster GD, Wadden TA, Peterson FJ, Letizia KA,Bartlett SJ, Conill AM. A controlled comparison ofthree very-low-calorie diets: effects on weight, bodycomposition, and symptoms. Am J Clin Nutr 1992;55:811–17.
80. Bard JM, Charles MA, Juhan-Vague I, Vague P,Andre P, Safar M, et al. Accumulation oftriglyceride-rich lipoprotein in subjects withabdominal obesity: the Biguanides and thePrevention of the Risk of Obesity (BIGPRO) 1study. Arterioscler Thromb Vasc Biol 2001;21:407–14.
81. Charles MA, Morange P, Eschwege E, Andre P,Vague P, Juhan-Vague I. Effect of weight changeand metformin on fibrinolysis and the vonWillebrand factor in obese nondiabetic subjects:the BIGPRO1 Study. Biguanides and thePrevention of the Risk of Obesity. Diabetes Care1998;21:1967–72.
82. Fontbonne A, Andre P, Eschwege E. BIGPRO(Biguanides and the Prevention of the Risk ofObesity): study design. A randomized trial ofmetformin versus placebo in the correction of themetabolic abnormalities associated with insulinresistance. Diabete Metabolisme 1991;17:249–54.
83. Fontbonne A, Charles MA, Juhan-Vague I, Bard JM, Andre P, Isnard F, et al. The effect ofmetformin on the metabolic abnormalitiesassociated with upper-body fat distribution.BIGPRO Study Group. Diabetes Care 1996;19:920–6.
84. Teupe B, Bergis K. Prospective randomized two-years clinical study comparing additionalmetformin treatment with reducing diet in type 2diabetes. Diabete Metabolisme 1991;17:213–17.
85. United Kingdom Prospective Diabetes Study(UKPDS). 13: Relative efficacy of randomlyallocated diet, sulphonylurea, insulin, ormetformin in patients with newly diagnosed non-insulin dependent diabetes followed for threeyears. BMJ 1995;310:83–8.
86. UK Prospective Diabetes Study (UKPDS) Group.Effect of intensive blood-glucose control withmetformin on complications in overweightpatients with type 2 diabetes (UKPDS 34).
[published erratum appears in Lancet 1998;352:1557]. Lancet 1998;352:854–65.
87. Clarke P, Gray A, Adler A, Stevens R, Raikou M,Cull C, et al. Cost-effectiveness analysis of intensiveblood-glucose control with metformin inoverweight patients with Type II diabetes (UKPDSno. 51). Diabetologia 2001;44:298–304.
88. Turner R, Murchison L, Wright AD, Oakley N,Kohner E, Hayes R, et al. United KingdomProspective Diabetes Study 24: a 6-year,randomized, controlled trial comparingsulfonylurea, insulin, and metformin therapy inpatients with newly diagnosed type 2 diabetes thatcould not be controlled with diet therapy. AnnIntern Med 1998;128:165–75.
89. Turner RC, Mann JI, Iceton G. UK prospectivestudy of therapies of maturity-onset diabetes. I. Effect of diet, sulphonylurea, insulin orbiguanide therapy on fasting plasma glucose andbody weight over one year. Diabetologia 1983;24:404–11.
90. Turner RC, Holman RR, Mathews DR, Oakes SF,Bassett PA, Stratton IM, et al. UK ProspectiveDiabetes Study (UKPDS). VIII. Study design,progress and performance. Diabetologia 1991;34:877–90.
91. Turner RC, Cull CA, Frighi V, Holman RR.Glycemic control with diet, sulfonylurea,metformin, or insulin in patients with type 2diabetes mellitus: progressive requirement formultiple therapies (UKPDS 49). UK ProspectiveDiabetes Study (UKPDS) Group. JAMA 1999;281:2005–12.
92. Wright AD, Cull CA, Holman RR, Turner RC.UKPDS 28: A randomized trial of efficacy of early addition of metformin in sulfonylurea-treated type 2 diabetes. Diabetes Care 1998;21:87–92.
93. UK Prospective Diabetes Study Group UKProspective Diabetes Study 16. Overview of 6years’ therapy of type II diabetes: a progressivedisease. [published erratum appears in Diabetes1996;45:1655]. Diabetes 1995;44:1249–58.
94. Chiasson JL. The efficacy of acarbose in thetreatment of patients with non-insulin-dependentdiabetes mellitus. Ann Intern Med 1994;121:928–35.
95. Rodger NW. Clinical experience with acarbose:results of a Canadian multicentre study. Clin InvestMed 1995;18:318–24.
96. Wolever TM, Chiasson JL, Josse RG, Hunt JA,Palmason C, Rodger NW, et al. Small weight losson long-term acarbose therapy with no change indietary pattern or nutrient intake of individualswith non-insulin-dependent diabetes. Int J Obes1997;21:756–63.
References
172

97. Wolever TMS. One-year acarbose treatment raisesfasting serum acetate in diabetic patients. DiabetMed 1995;12:164–72.
98. Wolever TMS. No relationship betweencarbohydrate intake and effect of acarbose onHbA1c or gastrointestinal symptoms in type 2diabetic subjects consuming 30–60% of energyfrom carbohydrate. Diabetes Care 1998;21:1612–18.
99. Blaufox MD, Langford HG, Oberman A, Hawkins CM, Wassertheil-Smoller SW, Cutter GR.Effect of dietary change on the return ofhypertension after withdrawal of prolongedantihypertensive therapy (DISH). DietaryIntervention Study of Hypertension. J Hypertens1984;2(Suppl 3):S179–81.
100. Ho GY, Blaufox MD, Wassertheil-Smoller S,Oberman A, Langford H. Plasma renin predictssuccess of antihypertensive drug withdrawal. Am JHypertens 1994;7:679–84.
101. Langford HG, Blaufox MD, Oberman A, Hawkins CM, Curb JD, Cutter GR, et al. Dietarytherapy slows the return of hypertension afterstopping prolonged medication. JAMA 1985;253:657–64.
102. Thaler L, Wassertheil-Smoller S, Blaufox MD,Oberman A, Langford HG. Effect of withdrawal ofantihypertensive drug on depressive mood. Am JHypertens 1993;6:1055–62.
103. Wassertheil-Smoller S, Langford HG, Blaufox MD,Oberman A, Hawkins M, Levine B, et al. Effectivedietary intervention in hypertensives: sodiumrestriction and weight reduction. J Am Diet Assoc1985;85:423–30.
104. Frey-Hewitt B, Vranizan KM, Dreon DM, Wood PD.The effect of weight loss by dieting or exercise onresting metabolic rate in overweight men. Int JObes 1990;14:327–34.
105. Hankey CR, Leslie WS, Lean MEJ. An energydeficit approach to weight management duringnutritional counselling post myocardial infarction.Proc Nutr Soc 2001;60:33A.
106. Hankey CR, Leslie WS, Currall JEP, Matthews D,Lean MEJ. Weight change after myocardialinfarction: statistical perspectives for future study. J Hum Nutr Diet 2002;15:439–44.
107. Jones DW, Miller ME, Wofford MR, Anderson DC,Jr, Cameron ME, Willoughby DL, et al. The effectof weight loss intervention on antihypertensivemedication requirements in the HypertensionOptimal Treatment (HOT) study. Am J Hypertens1999;12:1175–80.
108. Shah M, Jeffery RW, Laing B, Savre SG, Natta MV,Strickland D. Hypertension Prevention Trial(HPT): food pattern changes resulting fromintervention on sodium, potassium, and energyintake. J Am Diet Assoc 1990;90:69–76.
109. Canner PL, Borhani NO, Oberman A, Cutler J,Prineas RJ, Langford H, et al. The HypertensionPrevention Trial: assessment of the quality ofblood pressure measurements. Am J Epidemiol1991;134:379–92.
110. Forster JL, Jeffery RW, Van Natta M, Pirie P.Hypertension Prevention Trial. Do 24-h foodrecords capture usual eating behavior in a dietarychange study? Am J Clin Nutr 1990;51:253–7.
111. Hypertension Prevention Trial Research Group.Hypertension Prevention Trial 3 year results.Circulation 1988;78(Suppl 2):568.
112. Hypertension Prevention Trial Research Group.The Hypertension Prevention Trial: three-yeareffects of dietary changes on blood pressure. ArchIntern Med 1990;150:153–62.
113. Jeffery RW, French SA, Schmid TL. Attributionsfor dietary failures: problems reported byparticipants in the Hypertension Prevention Trial.Health Psychol 1990;9:315–29.
114. Schmid TL, Jeffery RW, Onstad L, Corrigan SA.Demographic, knowledge, physiological, andbehavioral variables as predictors of compliancewith dietary treatment goals in hypertension.Addict Behav 1991;16:151–60.
115. Anderssen S. Diet and exercise intervention havefavourable effects on blood pressure in mildhypertensives. The Oslo Diet & Exercise Study(ODES). Blood Press 1995;4:343–9.
116. Anderssen SA, Hjermann I, Urdal P, Torjesen PA,Holme I. Improved carbohydrate metabolism afterphysical training and dietary intervention inindividuals with the ‘atherothrombogenicsyndrome’. Oslo Diet and Exercise Study (ODES).A randomized trial. J Intern Med 1996;240:203–9.
117. Urdal P, Haaland A, Hjermann I, Gjesdal K,Christian C, Sorensen M, et al. The Oslo Diet andExercise Study (ODES): design and objectives.Control Clin Trials 1993;14:229–43.
118. Anderssen SA, Haaland A, Hjermann I, Urdal P,Gjesdal K, Holme I. Oslo Diet and Exercise Study:a one-year randomized intervention trial. Effect onhemostatic variables and other coronary riskfactors. Nutr Metab Cardiovasc Dis 1995;5:189–200.
119. Anderssen SA, Holme I, Urdal P, Hjermann I.Associations between central obesity and indexesof hemostatic, carbohydrate and lipid metabolism.Results of a 1-year intervention from the Oslo Dietand Exercise Study. Scand J Med Sci Sports 1998;8:109–15.
120. Reseland JE, Anderssen SA, Solvoll K, Hjermann I,Urdal P, Holme I, et al. Effect of long-termchanges in diet and exercise on plasma leptinconcentrations. Am J Clin Nutr 2001;73:240–5.
121. Torjesen PA, Hjermann I, Birkeland KI, Holme I,Anderssen SA, Urdal P. Lifestyle changes may
Health Technology Assessment 2004; Vol. 8: No. 21
173
© Queen’s Printer and Controller of HMSO 2004. All rights reserved.

reverse development of the insulin resistancesyndrome – the Oslo Diet and Exercise Study: arandomized trial. Diabetes Care 1997;20:26–31.
122. Pritchard JE. The body composition diet andexercise study: the effect of weight loss on softtissue composition. Thesis. Melbourne: Universityof Melbourne; 1995.
123. Pritchard JE, Nowson CA, Wark JD. Bone lossaccompanying weight loss: a randomisedcontrolled weight loss study using diet andexercise. Proc Nutr Soc Aust 1995;19:57.
124. Pritchard JE, Saul AL, Nowson CA, Wark JD. Body composition following diet-induced and/orexercise-induced weight loss: a randomisedcontrolled study. Int J Obes 1995;19:212.
125. Pritchard JE, Nowson CA, Wark JD. Bone lossaccompanying diet-induced or exercise-inducedweight loss: a randomised controlled study. Int JObes 1996;20:513–20.
126. Pritchard JE, Nowson CA, Wark JD. A worksiteprogram for overweight middle-aged menachieves lesser weight loss with exercise than withdietary change. J Am Diet Assoc 1997;97:37–42.
127. Pritchard DA, Hyndman J, Taba F. Nutritionalcounselling in general practice: a cost effectiveanalysis. J Epidemiol Community Health 1999;53:311–16.
128. Swinburn BA, Woollard GA, Chang EC, Wilson MR.Effects of reduced-fat diets consumed ad libitumon intake of nutrients, particularly antioxidantvitamins. J Am Diet Assoc 1999;99:1400–5.
129. Swinburn BA, Metcalf P, Ley SJ. Long-term (5-year) effects of reduced-fat diet intervention inindividuals with glucose intolerance. Diabetes Care2001;24:619–24.
130. Langford HG, Davis BR, Blaufox D, Oberman A,Wassertheil-Smoller S, Hawkins M, et al. Effect ofdrug and diet treatment of mild hypertension ondiastolic blood pressure. The TAIM ResearchGroup. Hypertension 1991;17:210–17.
131. Wassertheil-Smoller S, Blaufox MD, Oberman A,Davis BR, Swencionis C, Kner MO, et al. Effect ofantihypertensives on sexual function and quality oflife: the TAIM study. Ann Intern Med 1991;114:613–20.
132. Davis BR, Blaufox MD, Hawkins CM, Langford HG, Oberman A, Swencionis C, et al.Trial of antihypertensive interventions andmanagement. Design, methods, and selectedbaseline results. Control Clin Trials 1989;10:11–30.
133. Davis BR, Oberman A, Blaufox MD, Wassertheil-Smoller S, Hawkins CM, Cutler JA, et al. Effect ofantihypertensive therapy on weight loss. The Trialof Antihypertensive Interventions and ManagementResearch Group. Hypertension 1992;19:393–9.
134. Davis BR, Blaufox MD, Oberman A, Wassertheil-Smoller S, Zimbaldi N, Cutler JA, et al. Reductionin long-term antihypertensive medicationrequirements. Effects of weight reduction bydietary intervention in overweight persons withmild hypertension. Arch Intern Med 1993;153:1773–82.
135. Davis BR, Oberman A, Blaufox MD, Wassertheil-Smoller S, Zimbaldi N, Kirchner K, et al. Lack ofeffectiveness of a low-sodium/high-potassium dietin reducing antihypertensive medicationrequirements in overweight persons with mildhypertension. Am J Hypertens 1994;7:926–32.
136. Fortmann SP, Haskell WL, Wood PD. Effects ofweight loss on clinic and ambulatory bloodpressure in normotensive men. Am J Cardiol1988;62:89–93.
137. King AC, Frey-Hewitt B, Dreon DM, Wood PD.Diet vs exercise in weight maintenance. The effectsof minimal intervention strategies on long-termoutcomes in men. Arch Intern Med 1989;149:2741–6.
138. Williams PT, Krauss RM, Vranizan KM, Wood PD.Changes in lipoprotein subfractions during diet-induced and exercise-induced weight loss inmoderately overweight men. Circulation 1990;81:1293–304.
139. Williams PT, Krauss RM, Vranizan KM, Albers JJ,Wood PD. Effects of weight-loss by exercise and bydiet on apolipoproteins A-I and A-II and theparticle-size distribution of high-densitylipoproteins in men. Metabolism 1992;41:441–9.
140. Williams PT, Stefanick ML, Vranizan KM, Wood PD.The effects of weight loss by exercise or by dietingon plasma high-density lipoprotein (HDL) levelsin men with low, intermediate, and normal-to-highHDL at baseline. Metabolism 1994;43:917–24.
141. Wood PD, Stefanick ML, Dreon DM, Frey-Hewitt B,Garay SC, Williams PT, et al. Changes in plasmalipids and lipoproteins in overweight men duringweight loss through dieting as compared withexercise. N Engl J Med 1988;319:1173–9.
142. Williams PT, Krauss RM, Stefanick ML, Vranizan KM, Wood PD. Effects of low-fat diet,calorie restriction, and running on lipoproteinsubfraction concentrations in moderatelyoverweight men. Metabolism 1994;43:655–63.
143. Wood PD, Stefanick ML, Haskell WL. Exerciseoffsets adverse lipoprotein effects of a ‘hearthealthy’ diet for weight loss. Arteriosclerosis 1989;9:773A.
144. Wood PD, Stefanick ML, Williams PT, Haskell WL.The effects on plasma lipoproteins of a prudentweight-reducing diet, with or without exercise, inoverweight men and women. N Engl J Med 1991;325:461–6.
References
174

145. Kiernan M, King AC, Kraemer HC, Stefanick ML,Killen JD. Characteristics of successful andunsuccessful dieters: an application of signaldetection methodology. Ann Behav Med 1998;20:1–6.
146. Cohen MD, D’Amico FJ, Merenstein JH. Weightreduction in obese hypertensive patients. Fam Med1991;23:25–8.
147. de Waard F, Ramlau R, Mulders Y, de Vries T, van Waveren S. A feasibility study on weightreduction in obese postmenopausal breast cancerpatients. Eur J Cancer Prev 1993;2:233–8.
148. Stenius-Aarniala B, Poussa T, Kvarnstrom J,Gronlund EL, Ylikahri M, Mustajoki P. Immediateand long term effects of weight reduction in obesepeople with asthma: randomised controlled study[published erratum appears in BMJ2000;320:984]. BMJ 2000;320:827–32.
149. Shah M, Baxter JE, McGovern PG, Garg A.Nutrient and food intake in obese women on alow-fat or low-calorie diet. Am J Health Promot1996;10:179–82.
150. Simonen P, Gylling H, Howard AN, Miettinen TA.Introducing a new component of the metabolicsyndrome: low cholesterol absorption. Am J ClinNutr 2000;72:82–8.
151. Viegener BJ, Perri MG, Nezu AM, Renjilian DA,McKelvey WF, Schein RL. Effects of anintermittent, low-fat, low-calorie diet in thebehavioral treatment of obesity. Behav Ther 1990;21:499–509.
152. Wing RR, Epstein LH, Marcus MD, Koeske R.Intermittent low-calorie regimen and boostersessions in the treatment of obesity. Behav Res Ther1984;22:445–9.
153. Pavlou KN, Krey S, Steffee WP. Exercise as anadjunct to weight loss and maintenance inmoderately obese subjects. Am J Clin Nutr 1989;49:1115–23.
154. Marcus MD, Wing RR, Guare J, Blair EH, Jawad A.Lifetime prevalence of major depression and itseffect on treatment outcome in obese type IIdiabetic patients. Diabetes Care 1992;15:253–5.
155. Wing RR, Marcus MD, Salata R, Epstein LH,Miaskiewicz S, Blair EH. Effects of a very-low-calorie diet on long-term glycemic control in obesetype 2 diabetic subjects. Arch Intern Med 1991;151:1334–40.
156. Wing RR, Blair E, Marcus M, Epstein LH, Harvey J. Year-long weight loss treatment forobese patients with type II diabetes: doesincluding an intermittent very-low calorie dietimprove outcome? Am J Med 1994;97:354–62.
157. Wing RR, Shiffman S, Drapkin RG, Grilo CM,McDermott M. Moderate versus restrictive diets:implications for relapse. Behav Ther 1995;26:5–24.
158. Wing RR, Anglin K. Effectiveness of a behavioralweight control program for blacks and whites withNIDDM. Diabetes Care 1996;19:409–13.
159. Wadden TA, Stunkard AJ. Controlled trial of verylow calorie diet, behavior therapy, and theircombination in the treatment of obesity. J ConsultClin Psychol 1986;54:482–8.
160. Wadden TA, Stunkard AJ, Day SC, Gould RA,Rubin CJ. Less food, less hunger: reports ofappetite and symptoms in a controlled study of aprotein-sparing modified fast. Int J Obes 1987;11:239–49.
161. Wadden TA, Stunkard AJ, Liebschutz J. Three-yearfollow-up of the treatment of obesity by very lowcalorie diet, behavior therapy, and theircombination. J Consult Clin Psychol 1988;56:925–8.
162. Wadden TA, Sternberg JA, Letizia KA, StunkardAJ, Foster GD. Treatment of obesity by very lowcalorie diet, behavior therapy, and theircombination: a five-year perspective. Int J Obes1989;13(Suppl 2):39–46.
163. Foster GD, Wadden TA, Kendall PC, Stunkard AJ,Vogt RA. Psychological effects of weight loss andregain: a prospective evaluation. J Consult ClinPsychol 1996;64:752–7.
164. Wadden TA, Foster GD, Letizia KA. One-yearbehavioral treatment of obesity: comparison ofmoderate and severe caloric restriction and theeffects of weight maintenance therapy. J ConsultClin Psychol 1994;62:165–71.
165. Torgerson JS, Lissner L, Lindroos AK, Kruijer H,Sjostrom L. VLCD plus dietary and behaviouralsupport versus support alone in the treatment ofsevere obesity. A randomised two-year clinical trial[published errratum appears in Int J Obes 1998;22:382]. Int J Obes 1997;21:987–94.
166. Torgerson JS, Agren L, Sjostrom L. Effects onbody weight of strict or liberal adherence to aninitial period of VLCD treatment. A randomised,one-year clinical trial of obese subjects. Int J Obes1999;23:190.
167. Eriksson J, Lindstrom J, Valle T, Aunola S,Hamalainen H, Ilanne-Parikka P, et al. Preventionof type II diabetes in subjects with impairedglucose tolerance: the Diabetes Prevention Study(DPS) in Finland. Study design and 1-year interimreport on the feasibility of the lifestyle interventionprogramme. Diabetologia 1999;42:793–801.
168. Tuomilehto J, Lindstrom J, Eriksson J. Preventionof type 2 diabetes mellitus by changes in lifestyleamong subjects with impaired glucose tolerance. N Engl J Med 2001;344:1343–50.
169. Uusitupa M, Louheranta A, Lindstrom J, Valle T,Sundvall J, Eriksson J, et al. The Finnish DiabetesPrevention Study. Br J Nutr 2000;83:S137–42.
Health Technology Assessment 2004; Vol. 8: No. 21
175
© Queen’s Printer and Controller of HMSO 2004. All rights reserved.

170. Lindstrom J. Prevention of type 2 diabetes bylifestyle intervention – the Finnish diabetesprevention study. Int J Obes 2001;25(Suppl 2):S21.
171. Uusitupa M. Impact of Pro12Ala polymorphism ofPPAR-� gene on body weight and diabetesincidence in the Finnish Diabetes PreventionStudy. Int J Obes 2001;25(Suppl 2):S2.
172. Hakala P, Karvetti RL. Weight reduction onlactovegetarian and mixed diets. Changes inweight, nutrient intake, skinfold thicknesses andblood pressure. Eur J Clin Nutr 1989;43:421–30.
173. Hakala P. Weight reduction programme based ondietary and behavioural counselling – a 2-yearfollow-up study. Int J Obes 1993;17:49.
174. Marniemi J, Seppanen A, Hakala P. Long-termeffects on lipid metabolism of weight reduction onlactovegetarian and mixed diet. Int J Obes 1990;14:113–25.
175. Karvetti RL, Hakala P. A seven-year follow-up of aweight reduction programme in Finnish primaryhealth care. Eur J Clin Nutr 1992;46:743–52.
176. Wing RR, Venditti E, Jakicic JM, Polley BA, Lang W.Lifestyle intervention in overweight individualswith a family history of diabetes. Diabetes Care1998;21:350–9.
177. Polley BA, Jakicic JM, Venditti EM, Barr S, Wing RR. The effects of health beliefs on weightloss in individuals at high risk for NIDDM.Diabetes Care 1997;20:1533–8.
178. Kaplan RM, Hartwell SL, Wilson DK, Wallace JP.Effects of diet and exercise interventions oncontrol and quality of life in non-insulin-dependent diabetes mellitus. J Gen Intern Med1987;2:220–8.
179. Tucker JA, Samo JA, Rand CS, Woodward ER.Behavioral interventions to promote adaptiveeating behavior and lifestyle changes followingsurgery for obesity: results of a two-yearevaluation. Int J Eat Disord 1991;10:689–98.
180. Cousins JH, Rubovits DS, Dunn JK, Reeves RS,Ramirez AG, Foreyt JP. Family versus individuallyoriented intervention for weight loss in MexicanAmerican women. Public Health Rep 1992;107:549–55.
181. Jalkanen L. The effect of a weight reductionprogram on cardiovascular risk factors amongoverweight hypertensives in primary health care.Scand J Med Sci Sports 1991;19:66–71.
182. Jeffery RW, Wing RR, Thorson C, Burton LR,Raether C, Harvey J, et al. Strengtheningbehavioral interventions for weight loss: arandomized trial of food provision and monetaryincentives. J Consult Clin Psychol 1993;61:1038–45.
183. Jeffery RW, Wing RR. Long-term effects ofinterventions for weight loss using food provision
and monetary incentives. J Consult Clin Psychol1995;63:793–6.
184. Jeffery RW, Wing RR, Mayer RR. Are smallerweight losses or more achievable weight loss goalsbetter in the long term for obese patients? J Consult Clin Psychol 1998;66:641–5.
185. Wing RR, Jeffery RW. Effect of modest weight losson changes in cardiovascular risk factors: are theredifferences between men and women or betweenweight loss and maintenance? Int J Obes 1995;19:67–73.
186. Wing RR. Insulin sensitivity as a predictor ofweight regain. Obes Res 1997;5:24–9.
187. Laitinen J, Uusitupa M, Ahola I, Siitonen O.Metabolic and dietary determinants of serumlipids in obese patients with recently diagnosednon-insulin-dependent diabetes. Ann Med 1994;26:119–24.
188. Laitinen J, Uusitupa M, Ahola I, Laakso M,Siitonen O. Metabolic and dietary variablesassociated with glycaemic control in patients withrecently diagnosed type II diabetes mellitus.Diabetes Nutr Metab 1994;7:77–87.
189. Laitinen JH, Ahola IE, Sarkkinen ES, Winberg RL,Harmaakorpi-Iivonen PA, Uusitupa MI. Impact ofintensified dietary therapy on energy and nutrientintakes and fatty acid composition of serum lipidsin patients with recently diagnosed non-insulin-dependent diabetes mellitus. J Am Diet Assoc 1993;93:276–83.
190. Uusitupa M, Laitinen J, Siitonen O, Vanninen E,Pyorala K. The maintenance of improvedmetabolic control after intensified diet therapy inrecent type 2 diabetes. Diabetes Res Clin Pract1993;19:227–38.
191. Vanninen E, Uusitupa M, Siitonen O, Laitinen J,Lansimies E. Habitual physical activity, aerobiccapacity and metabolic control in patients withnewly-diagnosed type 2 (non-insulin-dependent)diabetes mellitus: effect of 1-year diet and exerciseintervention. Diabetologia 1992;35:340–6.
192. Vanninen E, Uusitupa M, Lansimies E, Siitonen O,Laitinen J. Effect of metabolic control onautonomic function in obese patients with newlydiagnosed type 2 diabetes. Diabet Med 1993;10:66–73.
193. Uusitupa MI. Early lifestyle intervention inpatients with non-insulin-dependent diabetesmellitus and impaired glucose tolerance. Ann Med1996;28:445–9.
194. Lindahl B, Nilsson TK, Jansson JH, Asplund K,Hallmans G. Improved fibrinolysis by intenselifestyle intervention. A randomized trial insubjects with impaired glucose tolerance. J InternMed 1999;246:105–12.
References
176

195. Narayan KM, Hoskin M, Kozak D, Kriska AM,Hanson RL, Pettitt DJ, et al. Randomized clinicaltrial of lifestyle interventions in Pima Indians: apilot study. Diabet Med 1998;15:66–72.
196. Ost LG, Gotestam KG. Behavioral andpharmacological treatments for obesity: anexperimental comparison. Addict Behav 1976;1:331–8.
197. Stevens VJ, Corrigan SA, Obarzanek E, Bernauer E, Cook NR, Hebert P, et al. Weight lossintervention in phase 1 of the Trials ofHypertension Prevention. The TOHPCollaborative Research Group. Arch Intern Med1993;153:849–58.
198. TOHP Collaborative Research Group. Phase Iresults of the Trials of Hypertension PreventionTOHP. Circulation 1990;82(4 Suppl 3):III553.
199. He J, Whelton PK, Appel LJ, Charleston J, Klag MJ. Long-term effects of weight loss anddietary sodium reduction on incidence ofhypertension. Hypertension 2000;35:544–9.
200. Mattfeldt-Beman MK, Corrigan SA, Stevens VJ,Sugars CP, Dalcin AT, Givi MJ, et al. Participants’evaluation of a weight-loss program. J Am DietAssoc 1999;99:66–71.
201. Satterfield S, Cutler JA, Langford HG, Applegate WB, Borhani NO, Brittain E, et al.Trials of Hypertension Prevention. Phase I design.Ann Epidemiol 1991;1:455–71.
202. Trials of Hypertension Prevention CollaborativeResearch Group. The effects of nonpharmacologicinterventions on blood pressure of persons withhigh normal levels. Results of the Trials ofHypertension Prevention, Phase I [publishederratum appears in JAMA 1992;267:2330]. JAMA1992;267:1213–20.
203. Whelton PK, Kumanyika SK, Cook NR, Cutler JA,Borhani NO, Hennekens CH, et al. Efficacy ofnonpharmacologic interventions in adults withhigh-normal blood pressure: results from phase 1of the Trials of Hypertension Prevention. Trials ofHypertension Prevention Collaborative ResearchGroup. Am J Clin Nutr 1997;65(Suppl):660S.
204. Appel LJ, Hebert PR, Cohen JD, Obarzanek E,Yamamoto M, Buring J, et al. Baselinecharacteristics of participants in phase II of theTrials of Hypertension Prevention (TOHP II).Trials of Hypertension Prevention (TOHP)Collaborative Research Group. Ann Epidemiol 1995;5:149–55.
205. Hebert PR, Bolt RJ, Borhani NO, Cook NR,Cohen JD, Cutler JA, et al. Design of a multicentertrial to evaluate long-term life-style intervention inadults with high-normal blood pressure levels.Trials of Hypertension Prevention (phase II).Trials of Hypertension Prevention (TOHP)Collaborative Research Group. Ann Epidemiol 1995;5:130–9.
206. Hollis JF, Satterfield S, Smith F, Fouad M,Allender PS, Borhani N, et al. Recruitment forphase II of the Trials of Hypertension Prevention.Effective strategies and predictors ofrandomization. Trials of Hypertension Prevention(TOHP) Collaborative Research Group. AnnEpidemiol 1995;5:140–8.
207. Lasser VI, Raczynski JM, Stevens VJ, Mattfeldt-Beman MK, Kumanyika S, Evans M, et al. Trials ofHypertension Prevention, phase II. Structure andcontent of the weight loss and dietary sodiumreduction interventions. Trials of HypertensionPrevention (TOHP) Collaborative Research Group.Ann Epidemiol 1995;5:156–64.
208. Stevens VJ, Obarzanek E, Cook NR, Lee IM,Appel LJ, Smith West D, et al. Long-term weightloss and changes in blood pressure: results of theTrials of Hypertension Prevention, Phase II. AnnIntern Med 2001;134:1–11.
209. Trials of Hypertension Prevention CollaborativeResearch Group. Effects of weight loss and sodiumreduction intervention on blood pressure andhypertension incidence in overweight people withhigh–normal blood pressure. The Trials ofHypertension Prevention, Phase II. Arch Intern Med1997;157:657–67.
210. Anderson RT, Hogan P, Rosen R, Shumaker SA.Baseline correlates with quality of life among menand women with medication-controlledhypertension. The Trial of NonpharmacologicInterventions in the Elderly (TONE). J Am GeriatrSoc 1997;45:1080–5.
211. Appel LJ, Espeland M, Whelton PK, Dolecek T,Kumanyika S, Applegate WB, et al. Trial ofNonpharmacologic Interventions in the Elderly(TONE). Design and rationale of a blood pressurecontrol trial. Ann Epidemiol 1995;5:119–29.
212. Appel LJ, Espeland MA, Easter L, Wilson AC,Folmar S, Lacy CR. Effects of reduced sodiumintake on hypertension control in olderindividuals: results from the Trial ofNonpharmacologic Interventions in the Elderly(TONE). Arch Intern Med 2001;161:685–93.
213. Bahnson JL, Whelton PK, Appel LJ, Espeland MA,Wofford JL, Rosen R, et al. Baseline characteristicsof randomized participants in the Trial ofNonpharmacologic Interventions in the Elderly(TONE). Dis Manage Clin Outcomes 1997;1:61–8.
214. Espeland MA, Whelton PK, Kostis JB, Bahnson JL,Ettinger WH, Cutler JA, et al. Predictors andmediators of successful long-term withdrawal fromantihypertensive medications. TONE CooperativeResearch Group. Trial of NonpharmacologicInterventions in the Elderly. Arch Fam Med 1999;8:228–36.
215. Espeland MA, Kumanyika S, Wilson AC, Wilcox S,Chao D, Bahnson J, et al. Lifestyle interventions
Health Technology Assessment 2004; Vol. 8: No. 21
177
© Queen’s Printer and Controller of HMSO 2004. All rights reserved.
influence relative errors in self-reported dietintake of sodium and potassium. Ann Epidemiol2001;11:85–93.
216. Kostis JB, Espeland MA, Appel L, Johnson KC,Pierce J, Wofford JL. Does withdrawal ofantihypertensive medication increase the risk ofcardiovascular events? Trial of NonpharmacologicInterventions in the Elderly (TONE) CooperativeResearch Group. Am J Cardiol 1998;82:1501–8.
217. Kostis JB, Lacy CR, Wilson AC, Cardona C,Cosgrove NM, Shindler DM. Non drug therapy ofhypertension: persistence of effect afterdiscontinuation of intervention. J Am Coll Cardiol1999;33:238A.
218. Kumanyika SK, Brancato J, Brewer A, Carnaghi M,Doroshenko L, Rosen R, et al. Interventions in theTrial of Nonpharmacologic Interventions in theElderly: an effective approach to weight andsodium reduction among older adults. Circulation1996;94(8 Suppl):I690.
219. Self M, Brewer A, Kumanyika S, Doroshenko L,Carnaghi M, Brancato J. Pilot study to enhancestart-up of a multicenter nutrition interventiontrial. J Am Diet Assoc 1998;98:322–5.
220. Whelton PK, Appel LJ, Espeland MA, ApplegateWB, Ettinger WH, Kostis JB, et al. Sodiumreduction and weight loss in the treatment ofhypertension in older persons: a randomizedcontrolled Trial of Nonpharmacologic Interventionsin the Elderly (TONE). TONE CollaborativeResearch Group [published erratum appears inJAMA 1998;279:1954]. JAMA 1998;279:839–46.
221. Wilson A, Kostis J, Philipp C, Appel L, Espeland M,Johnson K, et al. ACE gene (DD) genotype isassociated with response to dietary weight losstherapy of hypertension: effect of race and sex. J Hypertens 2000;18 (Suppl 4):S124.
222. Wilson AC, Kostis JB, Philipp CS, Appel LJ,Espeland M, Folmar S, et al. Blood pressuresensitivity to weight loss in elderly whitehypertensives: association with ACE (DD)genotype. Am J Hypertens 2000;13(4 Part 2):79A.
223. Kostis JB, Wilson AC, Shindler DM, Cosgrove NM,Clifton R. Non-drug therapy for hypertension: doeffects on weight and sodium intake persist afterdiscontinuation of intervention? Am J Med 2000;109:734–6.
224. Chao D, Espeland MA, Farmer D, Register TC,Lenchik L, Applegate WB, et al. Effect of voluntaryweight loss on bone mineral density in older andoverweight women. J Am Geriatr Soc 2000;48:753–9.
225. Black DR, Lantz CE. Spouse involvement and apossible long-term follow-up trap in weight loss.Behav Res Ther 1984;22:557–62.
226. Murphy JK, Williamson DA, Buxton AE, Moody SC,Absher N, Warner M. The long-term effects of
spouse involvement upon weight loss andmaintenance. Behav Ther 1982;13:681–93.
227. Murphy JK, Bruce BK, Williamson DA. A comparison of measured and self-reportedweights in a 4-year follow-up of spouseinvolvement in obesity treatment. Behav Ther1985;16:524–30.
228. Pearce JW, LeBow MD, Orchard J. Role of spouseinvolvement in the behavioral treatment ofoverweight women. J Consult Clin Psychol 1981;49:236–44.
229. Rosenthal B, Allen GJ, Winter C. Husbandinvolvement in the behavioral treatment ofoverweight women: initial effects and long-termfollow-up. Int J Obes 1980;4:165–73.
230. Wing RR, Marcus MD, Epstein LH, Jawad A. A ‘family-based’ approach to the treatment ofobese type II diabetic patients. J Consult ClinPsychol 1991;59:156–62.
231. Wing RR, Jeffery RW. Benefits of recruitingparticipants with friends and increasing socialsupport for weight loss and maintenance. J Consult Clin Psychol 1999;67:132–8.
232. Hakala P, Karvetti RL, Ronnemaa T. Groups vsindividual weight reduction programmes in thetreatment of severe obesity – a five year follow-upstudy. Int J Obes 1993;17:97–102.
233. Jones SE, Owens HM, Bennett GA. Does behaviourtherapy work for dieticians? An experimentalevaluation of the effects of three procedures in aweight reduction clinic. Hum Nutr Appl Nutr 1986;40:272–81.
234. Long CGS. Psychological and dietetic counsellingcombined in the treatment of obesity: a comparative study in a hospital outpatient clinic.Hum Nutr Appl Nutr 1983;37:94–102.
235. Straw MK, Terre L. An evaluation of individualizedbehavioral obesity treatment and maintenancestrategies. Behav Ther 1983;14:255–66.
236. Phenix A. A one year follow-up of a weight lossstudy comparing behavioral techniques, nutritioninformation and exercise. PhD Thesis. Fresno, CA:California School of Professional Psychology; 1990.
237. Foreyt JP, Goodrick GK, Reeves RS, Raynaud AS,Darnell L, Brown AH, et al. Response of free-livingadults to behavioral treatment of obesity: attritionand compliance to exercise. Behav Ther 1993;24:659–69.
238. Skender ML, Goodrick GK, Del Junco DJ, Reeves RS, Darnell L, Gotto AM, et al.Comparison of 2-year weight loss trends inbehavioral treatments of obesity: diet, exercise,and combination interventions. J Am Diet Assoc1996;96:342–6.
References
178

239. Sikand G, Kondo A, Foreyt JP, Jones PH, Gotto AM.Two year follow-up of patients treated with VLCDand exercise training. J Am Diet Assoc 1988;88:487–8.
240. Gladis MM, Wadden TA, Vogt R, Foster G,Kuehnel RH, Bartlett SJ. Behavioral treatment ofobese binge eaters: do they need different care? J Psychosom Res 1998;44:375–84.
241. Wadden TA, Vogt RA, Foster GD, Anderson DA.Exercise and the maintenance of weight loss: 1-year follow-up of a controlled clinical trial. J Consult Clin Psychol 1998;66:429–33.
242. Wadden TA, Anderson DA, Foster GD. Two-yearchanges in lipids and lipoproteins associated withthe maintenance of a 5% to 10% reduction ininitial weight: some findings and some questions.Obes Res 1999;7:170–8.
243. Weinstock RS, Huiliang D, Wadden TA. Diet andexercise in the treatment of obesity. Effects of 3interventions on insulin resistance. Arch Intern Med1998;158:2477–83.
244. Ashutosh K, Methrotra K, Fragale-Jackson J. Effect of sustained weight loss and exercise onaerobic fitness in obese women. J Sports Med PhysFitness 1997;37:252–7.
245. Wing RR, Epstein LH, Paternostro-Bayles M,Kriska A, Nowalk MP, Gooding W. Exercise in abehavioural weight control programme for obesepatients with type 2 (non-insulin-dependent)diabetes. Diabetologia 1988;31:902–9.
246. Blonk MC, Jacobs MAJM, Biesheuvel EHE,Weeda-Mannak WL, Heine RJ. Influences onweight loss in type 2 diabetic patients: little long-term benefit from group behaviour therapy andexercise training. Diabet Med 1994;11:449–57.
247. Wadden TA, Berkowitz RI, Sarwer DB, Prus-Wisniewski R, Steinberg C. Benefits of lifestylemodification in the pharmacologic treatment ofobesity: a randomized trial. Arch Intern Med 2001;161:218–27.
248. Wadden TA, Berkowitz RI, Womble LG, Sarwer DB,Arnold ME, Steinberg CM. Effects of sibutramineplus orlistat in obese women following 1 year oftreatment by sibutramine alone: a placebo-controlled trial. Obes Res 2000;8:431–7.
249. Moher D, Schulz K, Altman D, for the CONSORTGroup. The CONSORT statement: revisedrecommendations for improving the quality ofreports of parallel-group randomised trials. Lancet2001;357:1191–4.
250. Torgerson JS, Arlinger K, Kappi M, Sjostrom L.Principles for enhanced recruitment of subjects ina large clinical trial: the XENDOS studyexperience. Control Clin Trials 2001;22:515–25.
251. Torgerson JS, Hauptman J, Boldrin MN, SjostromL. Xenical in the prevention of diabetes in obese
subjects (XENDOS) study. Diabetes Care2004;27:155–61.
252. Kelley D, Bray GA, Pi-Sunyer FX, Klein S, Hill J,Miles J, et al. Clinical efficacy or orlistat therapy inoverweight and obese patients with insulin-treatedtype 2 diabetes. Diabetes Care 2002;25:1033–41.
253. Miles JM, Leiter L, Hollander P, Wadden T,Anderson JW, Doyle M, et al. Effect of orlistat inoverweight and obese patients with type 2 diabetestreated with metformin. Diabetes Care 2002;25:1123–8.
254. McMahon FG, Weinstein SP, Rowe E, Ernst KR,Johnson F, Fujioka K, Sibutramine inHypertensives Clinical Study Group. Sibutramineis safe and effective for weight loss in obesepatients whose hypertension is well controlled withangiotensin-converting enzyme inhibitors. J HumHypertens 2002;16:5–11.
255. Diabetes Prevention Program Research Group.Reduction in the incidence of type 2 diabetes withlifestyle intervention or metformin. N Eng J Med2002;346:393–403.
256. Diabetes Prevention Program Research Group.The Diabetes Prevention Program. Diabetes Care1999;22:623–34.
257. Diabetes Prevention Program Research Group.The Diabetes Prevention Program. Baselinecharacteristics of the randomized cohort. DiabetesCare 2002;23:1619–29.
258. Chiasson J-L, Josse RG, Gomis R, Hanefeld M,Karasik A, Laakso M, for the STOP-NIDDM TrialResearch Group. Acarbose for prevention of type 2diabetes mellitus: the STOP-NIDDM randomisedtrial. Lancet 2002;359:2072–7.
259. Goldstein DJ. Beneficial health effects of modestweight loss. Int J Obes Relat Metab Disord 1992;16:397–415.
260. Pi-Sunyer FX. A review of long-term studiesevaluating the efficacy of weight loss inameliorating disorders associated with obesity. Clin Ther 1996;18:1006–35.
261. Sutton AJ, Abrams KR, Jones DR, Sheldon TA,Song F. Systematic reviews of trials and otherstudies. Health Technol Assess 1998;2(19):55–67.
262. Kunesova M, Hainer V, Parizkova J, Stich V, Fried M. Long-term treatment of obesity in theobesity unit. Sb Lek 1998;99:279–86.
263. Carson JL, Ruddy ME, Duff AE, Holmes NJ, Cody RP, Brolin RE. The effect of gastric bypasssurgery on hypertension in morbidly obesepatients [published erratum appears in Arch InternMed 1994;154:1770]. Arch Intern Med 1994;154:193–200.
264. Charuzi I, Lavie P, Peiser J, Peled R. Bariatricsurgery in morbidly obese sleep-apnea patients:
Health Technology Assessment 2004; Vol. 8: No. 21
179
© Queen’s Printer and Controller of HMSO 2004. All rights reserved.

short- and long-term follow-up. Am J Clin Nutr1992;55(2 Suppl):596S.
265. Holt JB, Castiglione CL, Trowbridge PE.Immediate and long-term results of verticalbanded gastroplasty for morbid obesity. Conn Med1987;51:638–42.
266. Pories WJ, MacDonald KG, Jr, Flickinger EG,Dohm GL, Sinha MK, Barakat HA, et al. Is type IIdiabetes mellitus (NIDDM) a surgical disease? AnnSurg 1992;215:633–43.
267. Chaturvedi N, Fuller JH. Mortality risk by bodyweight and weight change in people with NIDDM.The WHO Multinational Study of Vascular Diseasein Diabetes. Diabetes Care 1995;18:766–74.
268. Ford ES, Williamson DF, Liu S. Weight change anddiabetes incidence: findings from a nationalcohort of US adults. Am J Epidemiol 1997;146:214–22.
269. Moore LL, Visioni AJ, Wilson PW, D’Agostino RB,Finkle WD, Ellison RC. Can sustained weight lossin overweight individuals reduce the risk ofdiabetes mellitus? Epidemiology 2000;11:269–73.
270. van Gemert WG, Severeijns RM, Greve JW,Groenman N, Soeters PB. Psychologicalfunctioning of morbidly obese patients aftersurgical treatment. Int J Obes Relat Metab Disord1998;22:393–8.
271. Hess DS, Hess DW. Biliopancreatic diversion witha duodenal switch. Obes Surg 1998;8:267–82.
272. O’Leary JP. Overview: jejunoileal bypass in thetreatment of morbid obesity. Am J Clin Nutr 1980;33:389–94.
273. Williamson DF, Pamuk E, Thun M, Flanders D,Byers T, Heath C. Prospective study of intentionalweight loss and mortality in overweight white menaged 40–64 years. Am J Epidemiol 1999;149:491–503.
274. Williamson DF, Pamuk E, Thun M, Flanders D,Byers T, Heath C. Prospective study of intentionalweight loss and mortality in never-smokingoverweight US white women aged 40–64 years[published erratum appears in Am J Epidemiol1995;142:369]. Am J Epidemiol 1995;141:1128–41.
275. Williamson DF, Flanders D, Thompson TJ, Pamuk E, Thun M, Byers T. Intentional weightloss and mortality among overweight individualswith diabetes. Diabetes Care 2000;23:1499–504.
276. Rumpel C, Harris TB, Madans J. Modification ofthe relationship between the Quetelet index andmortality by weight-loss history among olderwomen. Ann Epidemiol 1993;3:343–50.
277. Karason K, Wikstrand J, Sjostrom L, Wendelhag I.Weight loss and progression of earlyatherosclerosis in the carotid artery: a four-yearcontrolled study of obese subjects. Int J Obes RelatMetab Disord 1999;23:948–56.
278. Sjostrom CD, Peltonen M, Wedel H, Sjostrom L.Differentiated long-term effects of intentionalweight loss on diabetes and hypertension.Hypertension 2000;36:20–5.
279. Long SD, O’Brien K, MacDonald KG, Jr, Leggett-Frazier N, Swanson MS, Pories WJ, et al. Weightloss in severely obese subjects prevents theprogression of impaired glucose tolerance to typeII diabetes. A longitudinal interventional study.Diabetes Care 1994;17:372–5.
280. Wannamethee SG, Shaper AG. Weight change andduration of overweight and obesity in theincidence of type 2 diabetes. Diabetes Care1999;22:1266–72.
281. Watts NB, Spanheimer RG, DiGirolamo M,Gebhart SS, Musey VC, Siddiq YK, et al. Predictionof glucose response to weight loss in patients withnon-insulin-dependent diabetes mellitus. ArchIntern Med 1990;150:803–6.
282. Wing RR, Jeffery RW, Hellerstedt WL. A prospective study of effects of weight cycling oncardiovascular risk factors. Arch Intern Med 1995;155:1416–22.
283. Kauffmann R, Bunout D, Hidalgo C, Aicardi V,Rodriguez R, Canas L, et al. A 2-year follow-up ofa program for the control of cardiovascular riskfactors among asymptomatic workers. Rev Med Chil1992;120:822–7.
284. Ewbank PP, Darga LL, Lucas CP. Physical activityas a predictor of weight maintenance in previouslyobese subjects. Obes Res 1995;3:257–63.
285. Sjostrom M, Karlsson AB, Kaati G, Yngve A,Green LW, Bygren LO. A four week residentialprogram for primary health care patients tocontrol obesity and related heart risk factors:effective application of principles of learning andlifestyle change. Eur J Clin Nutr 1999;53(Suppl 2):S72–7.
286. Gleysteen JJ. Results of surgery: long-term effectson hyperlipidemia. Am J Clin Nutr 1992;55(2 Suppl):591–3S.
287. Rossner S, Hallberg D. Long term follow-up ofserum lipoproteins after jejuno-ileal bypass surgeryfor massive obesity. Int J Obes 1980;4:197–202.
288. Foley EF, Benotti PN, Borlase BC, Hollingshead J,Blackburn GL. Impact of gastric restrictive surgeryon hypertension in the morbidly obese. Am J Surg1992;163:294–7.
289. Wittgrove AC, Clark GW. Laparoscopic gastricbypass: a four year prospective study of 230patients followed from 3 to 42 months. Obes Surg1997;7:285–6.
290. Peppard PE, Young T, Palta M, Dempsey J,Skatrud J. Longitudinal study of moderate weightchange and sleep-disordered breathing. JAMA2000;284:3015–21.
References
180

291. Sugerman HJ, Fairman RP, Sood RK, Engle K,Wolfe L, Kellum JM. Long-term effects of gastricsurgery for treating respiratory insufficiency ofobesity. Am J Clin Nutr 1992;55(2 Suppl):597–601S.
292. Lissner L, Andres R, Muller DC, Shimokata H.Body weight variability in men: metabolic rate,health and longevity. Int J Obes 1990;14:373–83.
293. McCormick A, Fleming D, Charlton J, editors.Morbidity Statistics from General Practice, Fourthnational study 1991–92. London: HMSO; 1995. pp. 25–62.
294. Jung RT. Obesity as a disease. Br Med Bull 1997;53:307–21.
295. Fisher D, Pillar G, Malhotra A, Peled N, Lavie P.Long-term follow-up of untreated patients withsleep apnoea syndrome. Respir Med 2002;96:337–43.
296. Sanchez-Cabezudo Diaz-Guerra C, Larrad JA.Analysis of weight loss with the biliopancreaticdiversion of Larrad: absolute failures or relativesuccesses? Obes Surg 2002;12:249–52.
297. Ditschuneit HH, Flechtner-Mors M. Value ofstructured meals for weight management: riskfactors and long-term weight maintenance. ObesRes 2001;9(Suppl 4):284–9S.
298. Ditschuneit HH, Frier HI, Flechtner-Mors M.Lipoprotein responses to weight loss and weightmaintenance in high-risk obese subjects. Eur J ClinNutr 2002;56:264–70.
299. Flechtner-Mors M, Ditschuneit HH, Johnson TD,Suchard MA, Adler G. Metabolic and weight losseffects of long-term dietary intervention in obesepatients: four-year results. Obes Res 2000;8:399–402.
300. Rossner S. [Sibutramine – antidepressive agenttested against obesity] [in Swedish]. Lakartidningen2001;98:1802–3.
301. Paisey RB, Frost J, Harvey P, Paisey A, Bower L,Paisey RM, et al. Five year results of a prospectivevery low calorie diet or conventional weight lossprogramme in type 2 diabetes. J Hum Nutr Diet2002;15:121–7.
302. Arribas DA, Elia GM, Aguilella DV, Martinez DM.Effect of vertical banded gastroplasty onhypertension, diabetes and dyslipidemia. Obes Surg2002;12:319–23.
303. Agren G, Narbro K, Naslund I, Sjostrom L,Peltonen M. Long-term effects of weight loss onpharmaceutical costs in obese subjects. A reportfrom the SOS intervention study. Int J Obes 2002;26:184–92.
304. Torgerson JS, Sjostrom L. The Swedish ObeseSubjects (SOS) study – rationale and results. Int JObes Relat Metab Disord 2001;25(Suppl 1):S2–4.
305. Gregg EW, Gerzoff RB, Thompson TJ, WilliamsonDF. Intentional weight loss and death in
overweight and obese US adults 35 years of ageand older. Ann Intern Med 2003;138:383–9.
306. Yang D, Fontaine KR, Wang C, Allison DB. Weightloss causes increased mortality: cons. Obes Rev2003;4:9–16.
307. Wolf AM, Kortner B, Kuhlmann HW. Results ofbariatric surgery. Int J Obes Relat Metab Disord2001;25(Suppl 1):S113–14.
308. Foxcroft D, Ludders J. Orlistat for the treatment ofobesity. Wessex Institute Development & EvaluationCommittee Report No. 101. Southampton: WessexInstitute for Health Research and Development;1999.
309. Foxcroft DR, Milne R. Orlistat for the treatment ofobesity: rapid review and cost-effectiveness model.Obes Rev 2000;1:121–6.
310. Nguyen NT, Goldman C, Rosenquist CJ, Arango A,Cole CJ, Lee SJ, et al. Laparoscopic versus opengastric bypass: a randomized study of outcomes,quality of life, and costs. Ann Surg 2001;234:279–89.
311. Kaplan RM, Atkins CJ, Wilson DK. The cost–utilityof diet and exercise interventions in non-insulin-dependent diabetes mellitus. Health Promot 1988;2:331–40.
312. Salkeld G, Phongsavan P, Oldenburg B,Johannesson M, Convery P, Graham-Clarke P, et al. The cost-effectiveness of a cardiovascular riskreduction program in general practice. HealthPolicy 1997;41:105–19.
313. Lamotte M, Annemans L, Lefever A, Nechelput M,Masure J. A health economic model to assess thelong-term effects and cost-effectiveness of orlistatin obese type 2 diabetic patients. Diabetes Care2002;25:303–8.
314. Martin LF, Tan T-L, Horn JR, Bixler EO,Kauffman GL, Becker DA, et al. Comparison of thecosts associated with medical and surgicaltreatment of obesity. Surgery 1995;118:599–607.
315. Sjostrom L, Narbro K, Sjostrom D. Costs andbenefits when treating obesity. Int J Obes 1995;19(Suppl):12S.
316. Segal L, Dalton AC, Richardson J. Cost-effectiveness of the primary prevention of non-insulin dependent diabetes mellitus. Health PromotInt 1998;13:197–209.
317. van Gemert WG, Adang EM, Kop M, Vos G, Greve JW, Soeters PB. A prospective cost-effectiveness analysis of vertical bandedgastroplasty for the treatment of morbid obesity.Obes Surg 1999;9:484–91.
318. Johannesson M, Fagerberg B. A health-economiccomparison of diet and drug treatment in obesemen with mild hypertension. J Hypertens 1992;10:1063–70.
Health Technology Assessment 2004; Vol. 8: No. 21
181
© Queen’s Printer and Controller of HMSO 2004. All rights reserved.
References
182
319. Chua TY, Mendiola RM. Laparoscopic verticalbanded gastroplasty: the Milwaukee experience.Obes Surg 1995;5:77–80.
320. Hughes D, McGuire A. A review of the economicanalysis of obesity. Br Med Bull 1997;53:253–63.
321. Sevick MA, Dunn AL, Morrow MS, Marcus BH,Chen GJ, Blair SN. Cost-effectiveness of lifestyleand structured exercise interventions in sedentaryadults. Am J Prev Med 2000;19:1–8.
322. Dahms WT, Molitch ME, Bray GA, Greenway FL,Atkinson RL, Hamilton K. Treatment of obesity:cost–benefit assessment of behavioral therapy,placebo, and two anorectic drugs. Am J Clin Nutr1978;31:774–8.
323. Roche Submission for the National Institute forClinical Excellence. Xenical (orlistat) NICEsubmission. Achieving clinical excellence in thetreatment of obesity. Welwyn Garden City, Herts:Roche. 15 September 2000.
324. Netten A, Rees T, Harrison G. Unit costs of healthand social care 2001. URL: http://www.ukc.ac.uk/pssru/. Accessed 20 March 2002.
325. Williams R, Baxter H, Bottomley J, Bibby J, Burns E, Harvey J, et al. CODE-2 UK: ourcontribution to a European study of the costs oftype 2 diabetes. Pract Diabet Int 2001;18:235–8.
326. WHO Statistical Information System (WHOSIS).Causes of death. URL: http://www3.who.int/whosis/menu.cfm. Accessed 20 March 2002.
327. Lee WL, Cheung AM, Cape D, Zinman B. Impactof diabetes on coronary artery disease in womenand men. Diabetes Care 2000;23:962–9.
328. Kolotkin RL, Meter K, Williams LW. Quality of lifeand obesity. Obes Rev 2001;2:219–29.
329. Doll HA, Petersen SEK, Stewart-Brown SL. Obesity and physical and emotional well-being:associations between body mass index, chronicillness, and the physical and mental componentsof the SF-36 questionnaire. Obes Res 2000;8:160–70.
330. National Institute for Clinical Excellence.Guidelines for the submission of assessments byindustry and sponsors. URL: http://www.nice.org.uk/Docref.asp?d=16183. Accessed 20 March 2002.
331. Nichols GA, Brown JB. The impact ofcardiovascular disease on medical care costs insubjects with and without type 2 diabetes. DiabetesCare 2002;25:482–6.
332. Selby JV, Ray GT, Zhang D, Colby CJ. Excess costsof medical care for patients with diabetes in amanaged care population. Diabetes Care 1997;20:1396–402.
333. Clark CM. The burden of hyperglycemia. DiabetesCare 1998;21(Suppl 3):C32–4.
334. Koskinen P, Manttari M, Manninen V, Huttunen JK,Heinonen OP, Frick MH. Coronary heart disease incidence in NIDDM patients in theHelsinki Heart Study. Diabetes Care 1992;15:820–5.
335. UK Prospective Diabetes Study Group. Tightblood pressure control and risk of macrovascularand microvascular complications in type 2diabetes: UKPDS 38. BMJ 1998;317:703–13.

Objectives� To review systematically treatments for the
prevention and management of obesity inadults
� to examine the effect of interventions comparedwith no intervention
� to examine the effect of adding extrainterventions, such as behaviour therapy, drugsor exercise
� to evaluate treatments from the perspective ofthe UK NHS.
Criteria for considering studiesfor this reviewTypes of studiesInformation will be sought from RCTs of at least 1 year’s duration, where the control group receivesa placebo or no intervention. Comparisonsbetween different interventions will also beexamined. Only interventions that are specificallydesigned to produce weight loss and/or preventweight gain will be examined. Interventions whereweight loss is produced coincidentally as a result ofdietary changes made, for example higher fruitand vegetable consumption to lower bloodpressure, will not be examined. Trials whereweight loss is the desired outcome and/or theintervention, for example to reduce a risk factorfor CHD, will be examined.
Types of participantsInterventions in adults from the age of 18 yearsupwards will be examined. There will be no upperage limit. The following information will berecorded:
� gender of participants� smoking status� age� social class� ethnic group� whether intervention had been specifically
targeted at people with the following conditions– diabetes– hypertension
– hyperlipidaemia– binge eatingaccording to the definitions used by theinvestigators
� BMI [weight in kg/(height in m)2], weight andheight
� waist circumference.
The following will be excluded:
� studies on people with bulimia nervosa� studies on women who are pregnant� studies in which the average BMI is < 28 kg/m2
for all groups combined.
Types of interventionsThe following interventions, lasting for anyperiod, will be examined provided there arefollow-up data provided at least 1 year after theinterventions started:
� drugs, including– pancreatic lipase inhibitor: orlistat (Xenical)*– SSRIs, e.g. fluoxetine (Prozac)*– fibre-containing bulking agents, e.g.
methylcellulose (Celevac), bran (Trifyba),isphagula husk (Fybogel, Konsyl, Isogel,Regulan), sterculia
– cholecystokinin receptor antagonists– centrally active appetite suppressants,
e.g. sibutramine* (Reductil, Meridia),dexfenfluramine, fenfluramine,diethylpropion, phentermine, mazindol,phenylpropanolamine
– leptin*– thyroid hormones– �-glucosidase inhibitor: acarbose
(Glucobay)– biguanides, metformin (Glucophage)*– topiramate (Topomax)– catecholaminergic appetite suppressants,
e.g. H2 receptor antagonists, e.g. cimetidine(Tagamet)
– cholestyramine, diethyl aminoethyl dextran– ephedrine*– caffeine*– atypical �-adrenergic agonists– growth hormone*
Health Technology Assessment 2004; Vol. 8: No. 21
183
© Queen’s Printer and Controller of HMSO 2004. All rights reserved.
Appendix 1
Protocol for systematic review of RCTs

� physical activity – endurance exercise– resistance training
� behavioural interventions– cognitive behavioural therapy– others, e.g. motivational interviewing
� obesity surgery– liposuction– intragastric balloon– jaw-wiring– producing malabsorption e.g. jejunoileal
bypass– gastric restriction only, e.g. vertical stapled
gastroplasty with banded outlet, gastricbanding, Roux-en-Y gastrojejunostomy*
– apronectomy.
*If no data are available from RCTs for thesekey interventions, information will be soughtfrom the following categories of studies (data indescending order of importance):
� quasi-randomised study (at least 1 year offollow-up)
� intervention study with concurrent controlgroup (at least 1 year of follow-up)
� intervention study with historical controlgroup (at least 5 years of follow-up)
� intervention study with no control group (atleast 5 years of follow-up)
� complementary medicine including– hypnosis– acupuncture– herbal remedies– homeopathy– reflexology– aromatherapy– vibration therapy
� diets– healthy eating– 600 kcal/day deficit or low fat – low calorie (1000–1600 kcal/day)– very low calorie (<1000 kcal/day)– protein sparing (≤ 40 g of carbohydrate/day)– low carbohydrate, high monounsaturated
fat– salt restriction (where compared with weight
loss).
Combinations of different therapies, for exampleweight loss versus sodium restriction, will also beexamined.
Types of outcome measuresData on the following outcome measures will beextracted:
� mortality – all cause– CHD– CVD– cancer (all cause), breast cancer, colorectal
cancer� morbidity
– CHD– CVD– diabetes mellitus– cancer (all cause), breast cancer, colorectal
cancer– musculoskeletal (all causes)– psychological (all causes)– days off work– GP consultations
� participant satisfaction and quality of life� economic outcomes� weight loss, however measured at the start and
at each time interval, e.g.– body weight (kg)– weight change (kg)– Percentage weight change:
� ≤ 5% of starting weight� 6–10% of starting weight� 11–20% of starting weight� >20% of starting weight
– BMI (kg/m2)– change in BMI– percentage change in BMI– waist circumference– change in waist circumference– percentage change in waist circumference
� blood lipids (noting whether fasted or not)– total cholesterol– LDL cholesterol– HDL cholesterol– triglycerides
� SBP and DBP� blood glucose control
– HbA1c
– fasting plasma glucose� psychological health ratings
– Nottingham Health Profile– Hospital Anxiety and Depression Score
� number of dropouts at each period� times of follow-up in the study� compliance with treatment� adverse events.
Search strategy for identificationof studiesElectronic database searchingAn electronic database search will be undertakenusing:
Appendix 1
184

� MEDLINE� EMBASE� BIOSIS� Commonwealth Agricultural Bureau Nutrition
Abstracts and Reviews� Cochrane Controlled Trials Register, including
Database of Abstracts of Reviews of Effectiveness(DARE) (CRD database of systematic reviews)
� PsycINFO� Web of Science � UK National Research Register� CINAHL� HealthSTAR� AMED� SPORTDiscus� British Library Inside.
HandsearchingThe following journals, including conferenceabstracts, will be handsearched:
� International Journal of Obesity, Volume 1 1977 toVolume 25 (Suppl 1) 2001
� Obesity Research� Obesity Surgery, Volume 1 (1–4) 1991 to
Volume 7 (1–6) 1997� American Journal of Clinical Nutrition,
Volume 18(5–6) 1966 to Volume 73(2S) 2001� Proceedings of the Nutrition Society, Volume 19
1960 to Volume 59 (Oral CommunicationsBooklet) 2000
� Journal of Human Nutrition and Dietetics, Volume 1 1988 to Volume 14(1) 2001
� Journal of the American Dietetic Association, Volume 77 1980 to Volume 90 1990
Data from abstracts will be used only if the authorsare able to provide full details of the study.
Further searching� The reference lists of previous trials and review
articles will be searched.� Books and reports covering the topic of obesity
will be searched.� Trials will be sought by communicating with
experts in the field and trialists.� Biomedical companies will be contacted for
details of any other relevant RCTs, published orunpublished.
� No language restriction will be applied toeligible reports.
� Searching for references will finish at the end ofApril 2001. However, the following journals willbe handsearched from January to the end ofJune 2001:– International Journal of Obesity– Obesity Research
– Obesity Surgery– American Journal of Clinical Nutrition– Proceedings of the Nutrition Society– Journal of Human Nutrition and Dietetics– Journal of Consulting and Clinical Psychology– Lancet– British Medical Journal– Journal of the American Medical Association– Annals of Internal Medicine– New England Journal of Medicine– Archives of Internal Medicine.
Methods of the reviewIdentification of possible RCTsAll possible RCTs will be entered into ReferenceManager version 9. Subject keywords and sourceof the article will be added.
Register of RCTsA sample of all abstracts and study titles will beindependently read by two researchers to assesssubject relevance. Researchers will discuss allstudies which either researcher has difficulty inassessing. RCTs relevant to the review will beassigned specific keywords on Reference Managerand the full published paper obtained or authorscontacted for the full report.
Quality assessment of studiesFull copies of the first 20 studies will beindependently assessed by two researchers using astandard form for quality assessment. Differencesof opinion will be resolved by discussion.Thereafter, if appropriate, one researcher willassess other studies, and a second reviewer willcheck the data. Quality assessment will include:
� quality of random allocation concealment� ITT analysis� blinding of outcome assessors� treatment and control group comparability� comparability of other care between groups� inclusion and exclusion criteria clearly defined� participant blinding to allocation� description of withdrawals and dropouts� self-reported or objectively measured weight� dropouts, ≤ 50% or not.
Data abstractionData will be abstracted independently by tworesearchers for the first 20 studies and anydifferences will be resolved by discussion.Thereafter, one researcher will assess other studies,if appropriate, and a second reviewer will check
Health Technology Assessment 2004; Vol. 8: No. 21
185
© Queen’s Printer and Controller of HMSO 2004. All rights reserved.

the data. Only comparisons and outcomesidentified a priori in the protocol will be included.Authors will be contacted for further details oftheir studies if required.
Data analysisWhere results from studies can be quantitativelycombined, a statistical meta-analysis of the datawill be undertaken. For dichotomous data an oddsratio will be derived, and for continuous data aWMD will be calculated (weighted by the inverseof the variance). Analyses will use a fixed effectsapproach. Evidence for heterogeneity across
studies will be explored using the chi-squared testfor heterogeneity.
ReportingThe review will be reported in the form used bythe Cochrane Collaboration.
ReferenceDickersin K, Scherer R, Lefebvre C. Identifyingrelevant studies for systematic reviews. BMJ 1994;309:1286–91.
Appendix 1
186

In MEDLINE (1966 to 25 May 2001) and inHealthSTAR (1975 to December 2000), the first
two levels of the standard Cochrane searchstrategy for RCTs were used, based on the strategydescribed by Dickersin (1994), with the followingspecific search terms:
1. obesity/2. obesity in diabetes/ or obesity, morbid3. hyperphagia/ or bulimia/4. obes$.mp.5. weight loss.mp.6. overweight.tw.7. (weight adj1 (maint$ or reduc$)).tw.8. (los$ adj1 weight).tw.9. (diet$ adj5 weight).tw.10. (weight adj1 control).tw.11. or/1-1012. limit 11 to (newborn infant <birth to
1 month>or infant <1 to 23 months> orpreschool child <2 to 5 years>or child <6 to12 years> or adolescence <13 to 18 years>
13. 11 not 12.
ReferenceDickersin K, Scherer R, Lefebvre C. Identifyingrelevant studies for systematic reviews. BMJ 1994;309:1589–92.
In EMBASE (1980 to Week 19 2001) the followingspecific search terms were used:
1. Multicenter Study/2. phase 2 clinical trial/3. phase 3 clinical trial/4. phase 4 clinical trial/5. randomized controlled trial/6. meta analysis/7. crossover procedure/8. double blind procedure/9. single blind procedure/10. randomization/11. placebo/12. drug comparison/13. clinical study/14. or/1-1315. nonhuman/16. (clin$ adj25 trial$).tw.
17. ((singl$ or doubl$ or trebl$ or tripl$) adj25(blind$ or mask$)).tw.
18. placebo$.tw.19. random$.tw.20. control$.tw.21. or/16-2022. 14 or 2123. 22 not 1524. obesity/25. diabetic obesity/26. morbid obesity/27. hyperphagia/28. bulimia/29. obes$.mp.30. weight reduction.mp.31. overweight.tw.32. (weight adj1 (maint$ or reduc$)).tw.33. (los$ adj1 weight).tw.34. (diet adj5 weight).tw.35. (weight adj1 control).tw.36. or/24-3537. 23 and 3638. limit 37 to (infant <to one year> or child
<unspecified age> or preschool child <1 to 6 years> or school child <7 to 12 years> oradolescent <13 to 17 years>)
39. 37 not 38
In the Commonwealth Agricultural BureauNutrition Abstracts and Reviews (1973 toDecember 2000) the following specific searchterms were used:
1. exp man/2. random$.tw.3. trial$.tw.4. placebo$.tw.5. volunteer$.tw.6. ((singl$ or doubl$ or trebl$ or tripl$) adj25
(blind$ or mask$)).mp.7. or/2-68. 1 and 79. obesity.mp.10. overeating.mp.11. overweight.mp.12. overfeeding.mp.13. weight reduction.mp.14. obesity hyperglycaemia syndrome.mp.15. weight losses.mp.16. weight gain.mp.
Health Technology Assessment 2004; Vol. 8: No. 21
187
© Queen’s Printer and Controller of HMSO 2004. All rights reserved.
Appendix 2
Search strategies

17. or/9-1618. 8 and 1719. obes$.tw.20. hyperphagi$.tw.21. bulimi$.tw.22. weight los$.tw.23. (weight and maint$).tw.24. (weight and reduc$).tw.25. (los$ and weight).tw.26. (diet$ and weight).tw.27. (weight and control$).tw.28. or/19-2829. 17 or 2930. 8 and 30
In BIOSIS (1985 to April 2001) the followingspecific search terms were used:
1. random*2. trial*3. placebo*4. 1 or 2 or 35. human (major concept term)6. 4 and 57. obes*8. hyperphagi*9. bulimi*10. weight los*11. overweight12. weight and maint*13. weight and reduc*14. los* and weight15. diet* and weight16. weight and control*17. or/7-1618. 17 and 6
In CINAHL (1982 to March 2001) the followingspecific search terms were used:
1. exp clinical trials/2. clinical trial.pt.3. exp random sample/4. random assignment/5. research.pt.6. (clin$ adj25 trial$).ti, ab.7. ((singl$ or doubl$ or trebl$ or tripl$) adj25
(blind$ or mask$)).ti, ab.8. Placebos/9. Placebo$.tw.10. Random$.tw.11. Volunteer$.tw.12. Or/1-1113. Animal studies/14. 12 not 1315. obesity/16. obesity, morbid/17. hyperphagia/
18. bulimia/19. obes$.tw.20. weight loss.tw.21. overweight.tw.22. (weight adj1 (maint$ or reduc$)).tw.23. (los$ adj1 weight).tw.24. (diet adj5 weight).tw.25. (weight adj1 control).tw.26. or/15-2527. 14 and 2628. limit 27 to (fetus <conception to birth> or
newborn infant <birth to 1 month> or infant<1 to 23 months> or preschool child <2 to 5 years> or child <6 to 12 years> oradolescence <13 to 18 years>)
29. 27 not 28
In AMED (1985 to April 2001) the followingspecific search terms were used:
1. randomized controlled trials/2. random allocation/3. double blind method/4. exp clinical trials/5. (clin$ adj25 trial$).ti,ab.6. ((singl$ or doubl$ or trebl$ or tripl$) adj25
(blind$ or mask$)).ti,ab.7. placebo.sh.8. placebo$.ti,ab.9. random$.ti,ab.10. research design.sh.11. trial$.tw.12. or/1-1113. obesity/14. bulimia/15. obes$.mp.16. weight loss.mp.17. overweight.tw.18. ((weight adj1 (maint$ or reduc$)).tw.19. (los$ adj1 weight).tw.20. (diet$ adj5 weight).tw.21. (weight adj1 control).tw.22. or/13-2123. 12 and 22
In SPORTDiscus (1949 to March 2000) thefollowing specific search terms were used:
1. double blind method/2. prospective study/3. comparative study/4. research design/5. placebo/6. (clin$ adj25 trial$).ti,ab.7. ((singl$ or doubl$ or trebl$ or tripl$) adj25
(blind$ or mask$)).ti,ab.8. placebo$.ti,ab.9. random$.ti,ab.
Appendix 2
188

10. or/1-911. obesity/12. hyperphagia/ or bulimia/13. obes$.mp.14. weight loss.mp.15. overweight.tw.16. (weight adj1 (maint$ or reduc$)).tw.17. (los$ adj1 weight).tw.18. (diet$ adj5 weight).tw.19. (weight adj1 control).tw.20. or/11-1921. 10 and 20
In the UK National Research Register (2001, Issue 1) the following specific search terms wereused:
1. obesity: ME2. obesity-in-diabetes: ME3. hyperphagia: ME4. bulimia: ME5. obes*6. weight-loss: ME7. (weight next loss)8. overweight9. (weight near maint*)10. (weight near reduc*)11. (los* near weight)12. (diet* near weight)13. (weight near control)14. (#1 or #2 or #3 or #4 or #5 or #6 or #7 or14. #8 or #9 or #10 or #11 or #12 or #13 or #14)
In the Cochrane Controlled Trials Register (2001,Issue 1) the following specific search terms wereused:
1. OBESITY: ME2. OBESITY-IN-DIABETES: ME3. OBESITY-MORBID: ME4. HYPERPHAGIA: ME5. BULIMIA: ME6. OBES*7. WEIGHT-LOSS: ME8. (WEIGHT NEXT LOSS)9. OVERWEIGHT10. (WEIGHT NEAR MAINT*)11. (DIET* NEAR WEIGHT)12. (WEIGHT NEAR CONTROL)13. (WEIGHT NEXT REDUC*)14. (LOS* NEXT WEIGHT)15. (#1 OR #2 OR #3 OR #4 OR #5 OR #6 OR
#7 OR #8 OR #9 OR #10 OR #11 OR #12OR #13 OR #14)
16. CHILD* : ME17. (#15 NOT #16)18. NEOPLASMS* : ME19. (#17 NOT #18)
In British Library Inside (April 2001) thefollowing specific search terms were used:
1. (obes$3 or overweight) and ((trial$1 or stud$3)and random$7) not (child$3 or rat$1 or mice or mouse or hamster$1 or porcine ormurine)
In the Science Citation Index (April 2001) thefollowing specific search terms were used:
1. (obes* or overweight) and ((trial* or stud*) andrandom*) not (child* or rat* or mice or mouseor hamster* or porcine or murine)
In PsycINFO (1967 to May 2001) the followingspecific search terms were used:
1. obes*2. hyperphagia*3. binge eating4. bulimi* near non-purging5. weight near1 los*6. weight near1 control7. overweight8. weight near1 (maint* or reduc*)9. diet* near5 weight10. #1 or #2 or #3 or #4 or #5 or #6 or #7 or
#8 or #911. AG = “adolescence”12. 10 and (AG = adolescence)13. AG = “childhood”14. 10 and (AG = childhood)15. AG = “infancy”16. 10 and (AG = infancy)17. AG = “neonatal”18. 10 and (AG = neonatal)19. AG = “pre-school age”20. 10 and (AG = pre-school age)21. AG = “school-age”22. 10 and (AG = school-age)23. #12 or #14 or #16 or #18 or #20 or #2224. 10 not 2325. PO = “animal”26. 24 and (PO = animal)27. 24 not 2628. PO = “human”29. 24 and (PO = human)30. 26 and 2931. 27 or 3032. clin* near25 trial*33. (singl* or doubl* or trebl* or tripl*) near25
(blind* or mask*)34. placebo*35. random*36. control*37. #32 or #33 or #34 or #35 or #3638. 31 and 37
Health Technology Assessment 2004; Vol. 8: No. 21
189
© Queen’s Printer and Controller of HMSO 2004. All rights reserved.


Anderson JW, Konz EC, Frederich RC, Wood CL. Long-term weight-loss maintenance: a meta-analysis ofUS studies. Am J Clin Nutr 2001;74:579–84.
Anon. Popular diets: a scientific review. Obes Res 2001;9(Suppl 1).
Astrup A, Rossner S. Lessons from obesity managementprogrammes: greater initial weight loss improves longterm maintenance. Obes Rev 2000;1:17–19.
Astrup A, Grunwald GK, Melanson EL, Saris WH, HillJO. The role of low-fat diets in body weight control: ameta-analysis of ad libitum dietary intervention studies.Int J Obes 2000;24:1545–52.
Astrup A, Ryan L, Grunwald GK, Storgaard M, Saris W,Melanson E, et al. The role of dietary fat in bodyfatness: evidence from a preliminary meta-analysis of ad libitum low-fat dietary intervention studies. Br J Nutr2000;83(Suppl 1):S25–32.
Ayyad C, Andersen T. Long-term efficacy of dietarytreatment of obesity: a systematic review of studiespublished between 1931 and 1999. Obes Rev 2000;1:113–19.
Blair SN, Brodney S. Effects of physical inactivity andobesity on morbidity and mortality: current evidenceand research issues. Med Sci Sports Exerc 1999;31:S646–67.
Boule NG, Haddad E, Kenny GP, Wells GA, Sigal RJ.Effects of exercise on glycaemic control and body massin type 2 diabetes mellitus. A meta-analysis of controlledclinical trials. JAMA 2001;286:1218–27.
Brown SA, Upchurch S, Anding R, Winter M, RamirezG. Promoting weight loss in type II diabetes. DiabetesCare 1996;19:648.
Douketis JD, Feightner JW, Attia J, Feldman WF, withthe Canadian Task Force on Preventive Health Care.Periodic health examination, 1999 update: 1. Detection,prevention and treatment of obesity. CMAJ 1999;160:513–25.
Ebrahim S, Smith GD. Systematic review of randomisedcontrolled trials of multiple risk factor interventions forpreventing coronary heart disease. BMJ 1997;314:1666–74.
Ebrahim S, Smith GD. Lowering blood pressure: asystematic review of sustained effects of non-pharmacological interventions. J Public Health Med1998;20:441–8.
Fagard RH. Physical activity in the prevention andtreatment of hypertension in the obese. Med Sci SportsExerc 1999;31:S624–30.
Fogelholm M, Kukkonen-Harjula K. Does physicalactivity prevent weight gain? A systematic review. ObesRev 2000;1:95–111.
Foxcroft DR, Milne R. Orlistat for the treatment ofobesity: rapid review and cost-effectiveness model. ObesRev 2000;1:121–6.
Goldstein DJ, Potvin JH. Long-term weight loss: theeffect of pharmacologic agents. Am J Clin Nutr 1994;60:647–57.
Harvey EL, Glenny A-M, Kirk SF, Summerbell CD.Improving health professionals’ management and theorganisation of care for overweight and obese people(Cochrane Review). In The Cochrane Library (Issue 1).2002. Oxford: Update Software; 2002.
Hennrikus DJ, Jeffrey RW. Worksite intervention forweight control: a review of the literature. Am J HealthPromot 1996;10:471–98.
Hermansen K. Diet, blood pressure and hypertension.Br J Nutr 2000;83(Suppl 1):S113–19.
Hooper L, Summerbell CD, Higgins JP, Thompson RL,Clements G, Capps N, et al. Reducing or modifieddietary fat for preventing cardiovascular disease(Cochrane Review). In The Cochrane Library (Issue 1).Oxford: Update Software; 2002.
Johanesen K. Efficacy of metformin in the treatment ofNIDDM. Diabetes Care 1999;22:33–7.
Kelley DE, Goodpaster B. Effects of physical activity oninsulin action and glucose tolerance in obesity. Med SciSports Exerc 1999;31:S619–23.
Kelley GA. Aerobic exercise and resting blood pressureamong women: a meta-analysis. Prev Med1999;28:265–75.
Ketola E, Sipila R, Makela M. Effectiveness of individuallifestyle interventions in reducing cardiovascular diseaseand risk factors. Ann Med 2000;32:239–51.
Kushner RF, Foster GD. Obesity and quality of life.Nutrition 2000;16:947–52.
Little R, Yau L. Intent-to-treat analysis for longitudinalstudies with drop-outs. Biometrics 1996;52:1324–33.
Mertens IL,Van Gaal LF. Overweight, obesity, and bloodpressure: the effects of modest weight reduction. ObesRes 2000;8:270–8.
National Task Force on the Prevention and Treatment ofObesity. Very low-calorie diets. JAMA 1993;270:967–74.
National Task Force on the Prevention and Treatment ofObesity. Long-term pharmacotherapy in themanagement of obesity. JAMA 1996;276:1907–15.
Health Technology Assessment 2004; Vol. 8: No. 21
191
© Queen’s Printer and Controller of HMSO 2004. All rights reserved.
Appendix 3
Reviews searched for RCTs

Nisoli E, Carruba MO. An assessment of the safety andefficacy of sibutramine, an anti-obesity drug with a novelmechanism of action. Obes Rev 2000;1:127–39.
Pirozzo S, Cameron C, Glasziou P, Summerbell C.Advice on low-fat diets for reducing obesity (Protocol fora Cochrane Review). In The Cochrane Library (Issue 1).Oxford: Update Software; 2002.
Poston WS, Haddock CK, Dill PL, Thayer B, Foreyt JP.Lifestyle treatments in randomized clinical trials ofpharmacotherapies for obesity. Obes Res 2001;9:552–63.
Pronk NP, Wing RR. Physical activity and long-termmaintenance of weight loss. Obes Res 1994;2:587–99.
Rissanen A, Fogelholm M. Physical activity in theprevention and treatment of other morbid conditionsand impairments associated with obesity: currentevidence and research issues. Med Sci Sports Exerc 1999;31:S635–45.
Samsa GP, Kolotkin RL, Williams GR, Nguyen MH,Mendel CM. Effect of moderate weight loss on health-related quality of life: an analysis of combined data from4 randomized trials of sibutramine vs placebo. Am JManage Care 2001;7:926–7.
Sayler ME, Goldstein DJ, Roback PJ, Atkinson RL.Evaluating success of weight loss programs, with anapplication to fluoxetine weight reduction clinical trialdata. Int J Obes 1994;18:742–51.
Shneerson J, Wright J. Lifestyle modification forobstructive sleep apnoea (Cochrane Review). In TheCochrane Library (Issue 1). Oxford: Update Software;2002.
Stefanick ML. Physical activity for preventing andtreating obesity-related dyslipoproteinemias. Med SciSports Exerc 1999;31:S609–18.
Summerbell CD, Jones LV, Glasziou P. The long-termeffect of advice on low-fat diets in terms of weight loss:an interim meta-analysis. J Hum Nutr Diet 1998;11:209–17.
Summerbell CD, Ashton V, Anagnostelis B, Roberts AP.Dieting to reduce body weight for controllinghypertension in adults (Cochrane Review). In TheCochrane Library (Issue 1). Oxford: Update Software;2002.
Tang JL, Armitage JM, Lancaster T, Silagy CA, FowlerGH, Neil HA. Systematic review of dietary interventiontrials to lower blood total cholesterol in free-livingsubjects. BMJ 1998;316:1213–20.
Thompson RL, Summerbell CD, Hooper L, Higgins JP,Little PS, Talbot D, et al. Dietary advice given by adietitian versus other health professional or self-helpresources to reduce blood cholesterol (CochraneReview). In The Cochrane Library (Issue 1). Oxford:Update Software; 2002.
Thorogood M. Combining diet with physical activity inthe treatment of obesity. J Hum Nutr Diet 1998;11:239–42.
Wing RR. Physical activity in the treatment of theadulthood overweight and obesity: current evidence andresearch issues. Med Sci Sports Exerc 1999;31:S547–52.
Zavoral JH. Treatment with orlistat reducescardiovascular risk in obese patients. J Hypertens 1998;16:2013–17.
Appendix 3
192

Health Technology Assessment 2004; Vol. 8: No. 21
193
© Queen’s Printer and Controller of HMSO 2004. All rights reserved.
Appendix 4
Trial eligibility form
Trial author and date
Checked by
Refman number
Yes No Unclear, with details
Randomised controlled trial
Data available for one year or more
Average or median starting BMI ≥ 28kg/m2
Average or median age of all groups ≥ 18 years
Designed to reduce weight or prevent weight gain
Control Treatment 1 Treatment 2 Treatment 3 Treatment 4
Surgery
Diet
Exercise
Behavioural
Drugs, specify
Alternative medicineOther
Data available Yes No Unclear, with details
Anthropometry
Risk factors


Health Technology Assessment 2004; Vol. 8: No. 21
195
© Queen’s Printer and Controller of HMSO 2004. All rights reserved.
Appendix 5
Quality assessment form
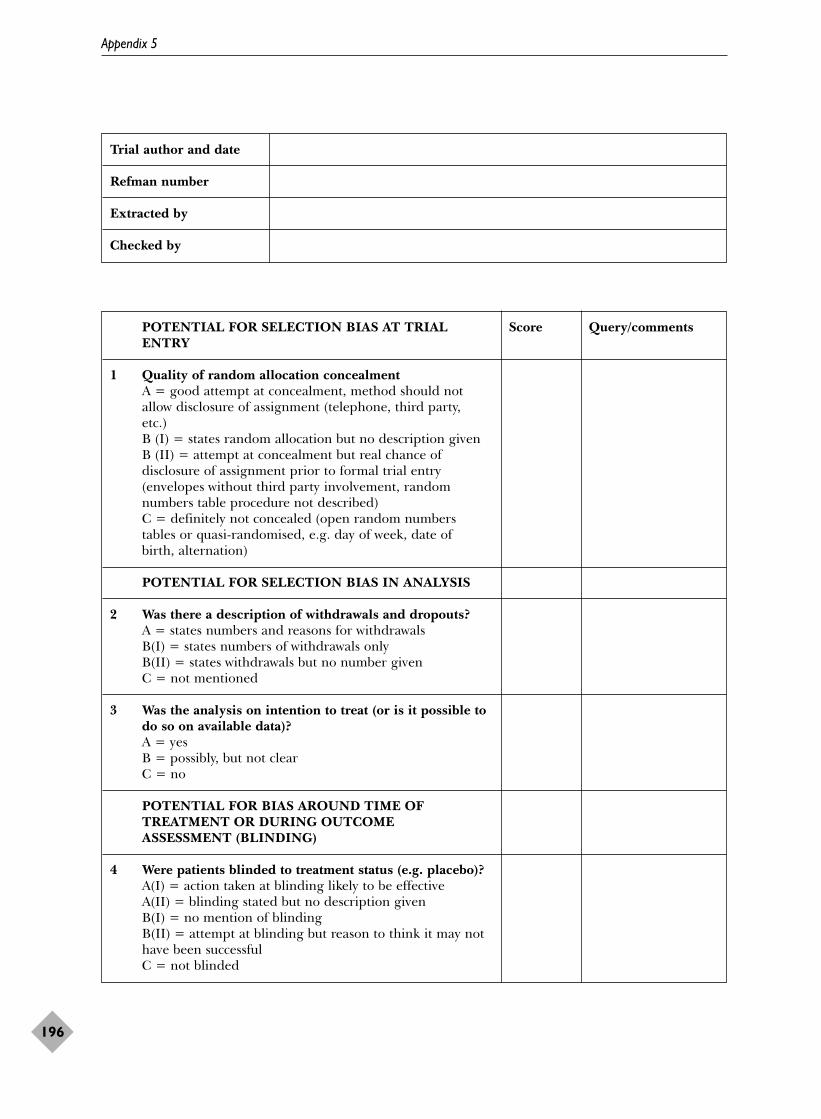
Trial author and date
Refman number
Extracted by
Checked by
Appendix 5
196
POTENTIAL FOR SELECTION BIAS AT TRIAL Score Query/commentsENTRY
1 Quality of random allocation concealmentA = good attempt at concealment, method should notallow disclosure of assignment (telephone, third party,etc.)B (I) = states random allocation but no description givenB (II) = attempt at concealment but real chance ofdisclosure of assignment prior to formal trial entry(envelopes without third party involvement, randomnumbers table procedure not described)C = definitely not concealed (open random numberstables or quasi-randomised, e.g. day of week, date ofbirth, alternation)
POTENTIAL FOR SELECTION BIAS IN ANALYSIS
2 Was there a description of withdrawals and dropouts? A = states numbers and reasons for withdrawals B(I) = states numbers of withdrawals onlyB(II) = states withdrawals but no number givenC = not mentioned
3 Was the analysis on intention to treat (or is it possible todo so on available data)?A = yesB = possibly, but not clearC = no
POTENTIAL FOR BIAS AROUND TIME OF TREATMENT OR DURING OUTCOME ASSESSMENT (BLINDING)
4 Were patients blinded to treatment status (e.g. placebo)?A(I) = action taken at blinding likely to be effectiveA(II) = blinding stated but no description givenB(I) = no mention of blindingB(II) = attempt at blinding but reason to think it may nothave been successfulC = not blinded
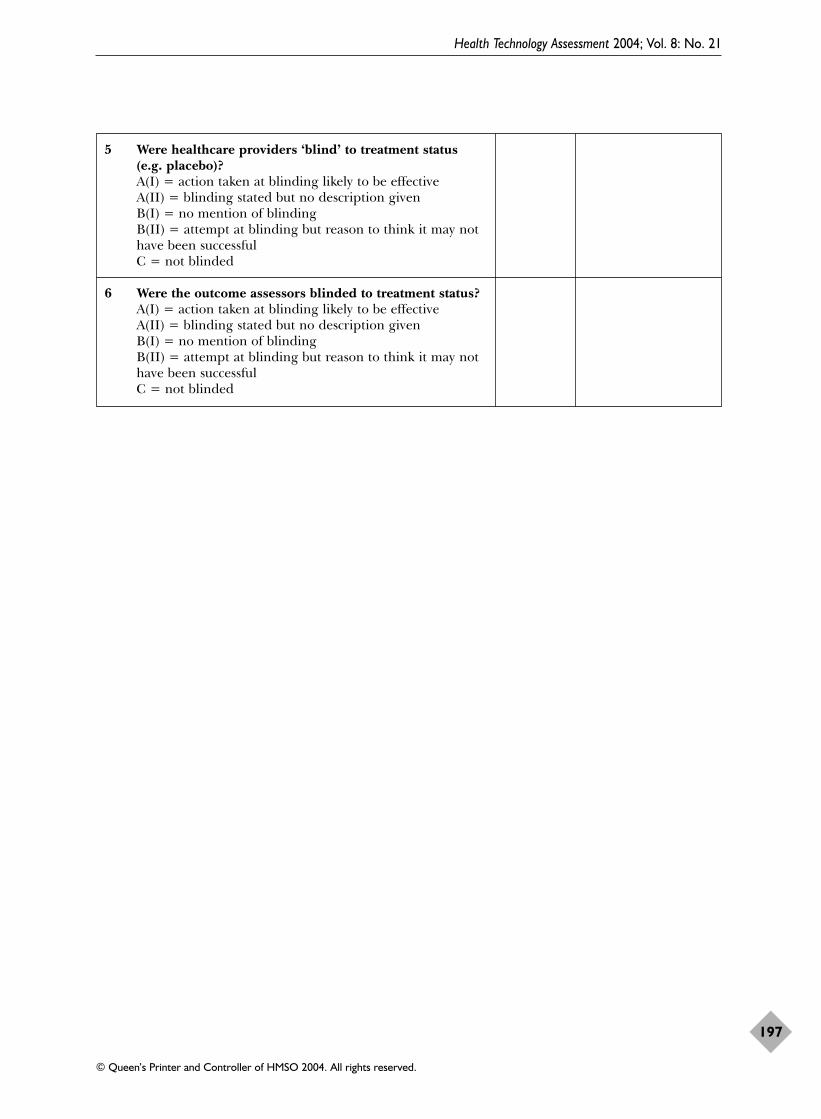
Health Technology Assessment 2004; Vol. 8: No. 21
197
© Queen’s Printer and Controller of HMSO 2004. All rights reserved.
5 Were healthcare providers ‘blind’ to treatment status (e.g. placebo)?A(I) = action taken at blinding likely to be effectiveA(II) = blinding stated but no description givenB(I) = no mention of blindingB(II) = attempt at blinding but reason to think it may nothave been successfulC = not blinded
6 Were the outcome assessors blinded to treatment status?A(I) = action taken at blinding likely to be effectiveA(II) = blinding stated but no description givenB(I) = no mention of blindingB(II) = attempt at blinding but reason to think it may nothave been successfulC = not blinded


Health Technology Assessment 2004; Vol. 8: No. 21
199
© Queen’s Printer and Controller of HMSO 2004. All rights reserved.
Appendix 6
Data extraction form
Trial author and date
Refman number
Extracted by
Checked by
Location
Period of study
Method of recruitment and sampling
Participants’ general description
Targeted particularly at:Diabetic or impaired glucose tolerance Y/NHypertensive Y/NHyperlipidaemia Y/NBinge eating Y/N
Inclusion criteria Exclusion criteria
YES NO DETAILS
Pretreatment phase?
YES NO DETAILS
Subgroup analysis?
YES NO DETAILS
Groups comparable at baseline?
Notes

Appendix 6
200
Details of interventionsStudy ID:
Control group Treatment 1 Treatment 2 Treatment 3 Treatment 4
Description of intervention
Timing of intervention period1. Start2. End3. Duration4. Number of times contacted5. Frequency of contact
Health professional involvement (role, timing)
Type of interventionIndividual/Group/Both
Other details of care

Health Technology Assessm
ent2004; Vol. 8: No. 21
201
© Q
ueen’s Printer and Controller of H
MSO
2004. All rights reserved.
Study population baseline characteristicsStudy ID:
Control Treatment 1 Treatment 2 Treatment 3 Treatment 4 Overall
Sex
Age (range, mean, SD)
Smoking status
Social class
Ethnic group
Weight kg
Height m
BMI (kg/m2)
% Ideal body weight
Waist circumference (give units)

Appendix 6
202
Study population baseline characteristicsStudy ID:
Control Treatment 1 Treatment 2 Treatment 3 Treatment 4 Overall
Total cholesterol (give units)
LDL cholesterol (give units)
HDL cholesterol (give units)
Triglycerides (give units)
Systolic blood pressure (mmHg)
Diastolic blood pressure (mmHg)
HbA1c (%)
Fasting plasma glucose (give units)
Psychological health ratings

Health Technology Assessm
ent2004; Vol. 8: No. 21
203
© Q
ueen’s Printer and Controller of H
MSO
2004. All rights reserved.
Participant flow for weight data onlyStudy ID:
Control Treatment 1 Treatment 2 Treatment 3 Treatment 4 Overall
Number eligible
Number assigned/ selected to each group
Numbers present for weight at time=
Numbers present for weight at time=
Numbers present for weight at time=
Number assessed at end of study, with details
Number completed at end of study
% dropout at end of study
Number dead at end of study
Control Treatment 1 Treatment 2 Treatment 3 Treatment 4
Period of active intervention
Maximum length of trial (includes intervention period)

Appendix 6
204
Outcomes (use a different page for each time of follow-up, starting at one year)Study ID: Timing:
Outcome Statistics Control N = Treatment 1 N = Treatment 2 N = Treatment 3 N = Treatment 4 N =
Deaths
Morbidity
Adverse events
Compliance
Quality of life
Economic

Health Technology Assessm
ent2004; Vol. 8: No. 21
205
© Q
ueen’s Printer and Controller of H
MSO
2004. All rights reserved.
Outcomes (use a different page for each time of follow-up, starting at one year)Study ID: Timing:
Outcome Statistics and Control N = Treatment 1 N = Treatment 2 N = Treatment 3 N = Treatment 4 N =who measured
Weight (kg)
Height (m)
BMI (kg/m2)
% Ideal body weight
Waist circumference (give units)

Appendix 6
206
Outcomes (use a different page for each time of follow-up, starting at one year)Study ID: Timing:
Outcome Statistics Control N = Treatment 1 N = Treatment 2 N = Treatment 3 N = Treatment 4 N =and who measured
Total cholesterol (give units)
LDL cholesterol (give units)
HDL cholesterol (give units)
Triglycerides (give units)
Systolic blood pressure (mmHg)
Diastolic blood pressure (mmHg)
HbA1c (%)
Fasting plasma glucose (give units)
Psychological health ratings

*Indicates primary reference to study.
Apfelbaum, 1999 (published data only)Apfelbaum M, Vague P, Ziegler O, Hanotin C, Thomas F, Leutenegger E. Long-term maintenance ofweight loss after a very-low-calorie diet: a randomizedblinded trial of the efficacy and tolerability ofsibutramine. Am J Med 1999;106:179–84.
BIGPRO 1, 1996 (published data only)*Fontbonne A, Andre P, Eschwege E. BIGPRO(Biguanides and the Prevention of the Risk of Obesity):study design. A randomized trial of metformin versusplacebo in the correction of the metabolic abnormalitiesassociated with insulin resistance. Diabete Metabolisme1991;17:249–54.
Bard JM, Charles MA, Juhan-Vague I, Vague P, Andre P,Safar M, et al. Accumulation of triglyceride-richlipoprotein in subjects with abdominal obesity: thebiguanides and the prevention of the risk of obesity(BIGPRO) 1 study. Arterioscler Thromb Vasc Biol 2001;21:407–14.
Charles MA, Morange P, Eschwege E, Andre P, Vague P,Juhan-Vague I. Effect of weight change and metforminon fibrinolysis and the von Willebrand factor in obesenondiabetic subjects: the BIGPRO1 Study. Biguanidesand the Prevention of the Risk of Obesity. Diabetes Care1998;21:1967–72.
Fontbonne A, Charles MA, Juhan-Vague I, Bard JM,Andre P, Isnard F, et al. The effect of metformin on themetabolic abnormalities associated with upper-body fatdistribution. BIGPRO Study Group. Diabetes Care 1996;19:920–6.
Bitsch, 1987 (published data only)Bitsch M, Skrumsager BK. Femoxetine in the treatmentof obese patients in general practice. Int J Obes 1987;11:183–90.
Black, 1984 (published data only)Black DR, Lantz CE. Spouse involvement and a possiblelong-term follow-up trap in weight loss. Behav Res Ther1984;22:557–62.
Blonk, 1994 (published data only)Blonk MC, Jacobs MAJM, Biesheuvel EHE, Weeda-Mannak WL, Heine RJ. Influence on weight loss in type 2 diabetic patients: little long-term benefit fromgroup behaviour therapy and exercise training. Diabet Med 1994;11:449–57.
Breum, 1995 (published data only)Breum L, Bjerre U, Bak JF, Jacobsen S, Astrup A. Long-term effects of fluoxetine on glycemic control in obesepatients with non-insulin-dependent diabetes mellitus
or glucose intolerance: influence on muscle glycogensynthase and insulin receptor kinase activity. Metabolism1995;44:1570–6.
Broom, 2001a (published and unpublished data)*Broom I, Wilding J, Stott P, Myers N, on behalf of theUK Multimorbidity Study Group. Randomised trial ofthe effect of orlistat on body weight and cardiovasculardisease risk profile in obese patients: UKMultimorbidity Study. Int J Clin Pract 2002;56:494–9.
Broom I. Randomised trial of the effect of orlistat onbody weight and CVD risk profile in overweight andobese patients with co-morbidities. Int J Obes 2001;25(Suppl 1):S106.
Wilding J. Early response to orlistat treatment predictslong-term success in overweight and obese patients withco-morbidities. Int J Obes 2001:25(Suppl 1):S108.
Broom, 2001b (published and unpublished data)Broom I, Hughes E, Dodson P, Reckless J, on behalf ofthe Orlistat UK Study Group. The role of orlistat in thetreatment of obese patients with mild to moderatehypercholesterolaemia: consequences for coronary risk.Br J Cardiol 2001;9:460–8.
Chiasson, 1994 (published data only)*Chiasson JL, Josse RG, Hunt JA, Palmason C, Rodger NW, Ross SA, et al. The efficacy of acarbose inthe treatment of patients with non-insulin-dependentdiabetes mellitus. Ann Intern Med 1994;121:928–35.
Rodger NW, Chiasson J-L, Josse RG, Hunt JA, Palmason C, Ross SA, et al. Clinical experience withacarbose: results of a Canadian multicentre study. Clin J Invest Med 1995;18:318–24.
Wolever TM, Chiasson JL, Josse RG, Hunt JA, Palmason C, Rodger NW, et al. Small weight loss onlong-term acarbose therapy with no change in dietarypattern or nutrient intake of individuals with non-insulin-dependent diabetes. Int J Obes Relat Metab Disord1997;21:756–63.
Wolever TMS, Chiasson J-L, Josse RG, Hunt JA,Palmason C, Rodger NW, et al. No relationship betweencarbohydrate intake and effect of acarbose on HbA1c orgastrointestinal symptoms in type 2 diabetic subjectsconsuming 30–60% of energy from carbohydrate.Diabetes Care 1998;21:1612–18.
Wolever TMS, Radmard R, Chiasson J-L, Hunt JA, Josse RG, Palmason C, et al. One-year acarbosetreatment raises fasting serum acetate in diabeticpatients. Diabet Med 1995;12:164–72.
Health Technology Assessment 2004; Vol. 8: No. 21
207
© Queen’s Printer and Controller of HMSO 2004. All rights reserved.
Appendix 7
References to included studies

Cohen, 1991 (published data only)Cohen MD, D’Amico FJ, Merenstein JH. Weightreduction in obese hypertensive patients. Fam Med1991;23:25–8.
Cousins, 1992 (published data only)Cousins JH, Rubovits DS, Dunn JK, Reeves RS, Ramirez AG, Foreyt JP. Family versus individuallyoriented intervention for weight loss in MexicanAmerican women. Public Health Rep 1992;107:549–55.
Davidson, 1999 (published data only)*Davidson MH, Hauptman J, DiGirolamo M, Foreyt JP,Halsted CH, Heber D, et al. Weight control and riskfactor reduction in obese subjects treated for 2 yearswith orlistat: a randomized controlled trial [publishederratum in JAMA 1999;281:1174]. JAMA 1999;281:235–42.
Foreyt J. A 2-year multicenter study of the effects oforlistat (Xenical) on weight loss and disease risk factors.Obes Res 1997;5:53S.
DISH, 1985 (published data only)*Langford HG, Blaufox MD, Oberman A, Hawkins CM,Curb JD, Cutter GR, et al. Dietary therapy slows thereturn of hypertension after stopping prolongedmedication. JAMA 1985;253:657–64.
Blaufox MD, Langford HG, Oberman A, Hawkins CM,Wassertheil-Smoller SW, Cutter GR. Effect of dietarychange on the return of hypertension after withdrawalof prolonged antihypertensive therapy (DISH). DietaryIntervention Study of Hypertension. J Hypertens 1984;2(Suppl 3):179–81.
Ho GY, Blaufox MD, Wassertheil-Smoller S, Oberman A,Langford H. Plasma renin predicts success ofantihypertensive drug withdrawal. Am J Hypertens 1994;7:679–84.
Thaler L, Wassertheil-Smoller S, Blaufox MD, Oberman A, Langford HG. Effect of withdrawal ofantihypertensive drug on depressive mood. Am JHypertens 1993;6:1055–62.
Wassertheil-Smoller S, Langford HG, Blaufox MD,Oberman A, Hawkins M, Levine B, et al. Effectivedietary intervention in hypertensives: sodium restrictionand weight reduction. J Am Diet Assoc 1985;85:423–30.
FDPS, 2001 (published data only)*Tuomilehto J, Lindström J, Eriksson J, Valle TT,Hämäläinen H, Ilanne-Parikka P, et al. for the FinnishDiabetes Prevention Study Group. Prevention of type 2diabetes mellitus by changes in lifestyle among subjectswith impaired glucose tolerance. N Engl J Med 2001;344:1343–50.
Eriksson J, Lindstrom J, Valle T, Aunola S, HamalainenH, Ilanne-Parikka P, et al. Prevention of type II diabetesin subjects with impaired glucose tolerance: theDiabetes Prevention Study (DPS) in Finland. Studydesign and 1-year interim report on the feasibility of thelifestyle intervention programme. Diabetologia 1999;42:793–801.
Lindstrom J, Tuomilehto J, Louheranta A, Mannelin M,Rastas M, Salminen V, et al. Prevention of type 2diabetes by lifestyle intervention – the Finnish DiabetesPrevention Study. Int J Obes 2001;25(Suppl 2):S21.
Uusitupa M, Louheranta A, Lindstrom J, Valle T,Sundvall J, Eriksson J, et al. The Finnish DiabetesPrevention Study. Br J Nutr 2000;83(Suppl 1): S137–42.
Uusitupa M, Lindi V, Lindström J, Louheranta A,Laakso M, Toumilehto J. Impact of Pro12Alapolymorphism of PPAR-� gene on body weight anddiabetes incidence in the Finnish Diabetes PreventionStudy. Int J Obes 2001;25(Suppl 2):S5.
Finer, 2000 (published data only)*Finer N, James WPT, Kopelman PG, Lean MEJ,Williams G. One-year treatment of obesity: arandomized, double-blind, placebo-controlled,multicentre study of orlistat, a gastrointestinal lipaseinhibitor. Int J Obes 2000;24:306–13.
James WP, Avenell A, Broom J, Whitehead J. A one-yeartrial to assess the value of orlistat in the management ofobesity. Int J Obes 1997;21(Suppl 3):24–30.
Foreyt, 1993 (published data only)*Foreyt JP, Goodrick GK, Reeves RS, Raynaud AS,Darnell L, Brown AH, et al. Response of free-livingadults to behavioral treatment of obesity: attrition andcompliance to exercise. Behav Ther 1993;24:659–69.
Skender ML, Goodrick GK, Del Junco DJ, Reeves RS,Darnell L, Gotto AM, et al. Comparison of 2-year weightloss trends in behavioral treatments of obesity: diet,exercise, and combination interventions. J Am Diet Assoc1996;96:342–6.
Frey-Hewitt, 1990 (published data only)Frey-Hewitt B, Vranizan KM, Dreon DM, Wood PD. Theeffect of weight loss by dieting or exercise on restingmetabolic rate in overweight men. Int J Obes 1990;14:327–34.
Goldstein, 1994 (published data only)*Goldstein DJ, Rampey AH, Enas GG, Potvin JH,Fludzinski LA, Levine LR. Fluoxetine: a randomizedclinical trial in the treatment of obesity. Int J Obes 1994;18:129–35.
Darga LL, Lucas CP, Carrol-Michels L. The effect offluoxetine, a serotonin-uptake inhibitor, on weight lossin obese subjects. Am J Clin Nutr 1988;47:764.
Darga LL, Carroll-Michals L, Botsford SJ, Lucas CP.Fluoxetine’s effect on weight loss in obese subjects. Am JClin Nutr 1991;54:321–5.
Marcus MD, Wing RR, Ewing L, Kern E, McDermott M,Gooding W. A double-blind, placebo-controlled trial offluoxetine plus behavior modification in the treatmentof obese binge-eaters and non-binge-eaters. Am JPsychiatry 1990;147:876–81.
Hakala, 1989 (published data only)*Hakala P, Karvetti RL. Weight reduction onlactovegetarian and mixed diets. Changes in weight,
Appendix 7
208

nutrient intake, skinfold thicknesses and blood pressure.Eur J Clin Nutr 1989;43:421–30.
Hakala P. Weight reduction programme based ondietary and behavioural counselling – a 2-year follow-upstudy. Int J Obes 1993;17:49.
Marniemi J, Seppanen A, Hakala P. Long-term effectson lipid metabolism of weight reduction onlactovegetarian and mixed diet. Int J Obes 1990;14:113–25.
Hakala, 1993 (published data only)Hakala P, Karvetti R-L, Ronnemaa T. Groups vs.individual weight reduction programmes in thetreatment of severe obesity – a five year follow-up study.Int J Obes 1993;17:97–102.
Hankey, 2001 (published and unpublished data)*Hankey CR, Leslie WS, Currall JE, Matthews D, Lean ME. Weight change after myocardial infarction:statistical perspectives for future study. J Hum Nutr Dietet2002;15:439–44.
Hankey CR, Leslie WS, Lean MEJ. An energy deficitapproach to weight management during nutritionalcounselling post myocardial infarction. Proc Nutr Soc2001;60:33A.
Leslie WS, Hankey CR, Currall JE, Matthews D, Lean ME. The impact of a transferable programme ofintensified nutritional counselling in cardiacrehabilitation following myocardial infarction. Proc NutrSoc 2000;59: 69A.
Hauptman, 2000 (published data only)*Hauptman J, Lucas C, Boldrin MN, Collins H, Segal KR. Orlistat in the long-term treatment of obesityin primary care settings. Arch Fam Med 2000;9(2):160–7.
Farrell J. Long-term management of obesity in primarycare: the role of orlistat (Xenical). Obes Res 1997;5(Suppl 1):10S.
Hauptman J, Lucas C, Boldrin M, Segal KR. Long-termweight loss with orlistat: impact of selection algorithmon outcomes. Obes Res 1999;7(Suppl 1):50S.
Hill, 1999 (published data only)*Hill JO, Hauptman J, Anderson JW, Fujioka K, O’Neil PM, Smith DK, et al. Orlistat, a lipase inhibitor,for weight maintenance after conventional dieting: a 1-y study. Am J Clin Nutr 1999;69:1108–16.
Anderson JW, on behalf of the Orlistat WeightMaintenance Study Group. Prevention of weight regainafter conventional dieting: a 1-year study with orlistat(Xenical), a new gastrointestinal lipase inhibitor. ObesRes 1997;5(Suppl 1):S2.
Hollander, 1998 (published and unpublished data)*Hollander PA, Elbein SC, Hirsch IB, Kelley D, McGill J, Taylor T, et al. Role of orlistat in the treatmentof obese patients with type 2 diabetes. A 1-yearrandomized double-blind study. Diabetes Care 1998;21:1288–94.
Kelley D. A one-year study of weight loss and glycaemiccontrol in type II diabetics following orlistat (Xenical™)treatment. Obes Res 1997;5(Suppl 1):21.
HOT, 1999 (published data only)Jones DW, Miller ME, Wofford MR, Anderson DC,Cameron ME, Willoughby DL, et al. The effect of weightloss intervention on antihypertensive medicationrequirements in the Hypertension Optimal Treatment(HOT) study. Am J Hypertens 1999;12:1175–80.
HPT, 1990 (published data only)*Hypertension Prevention Trial Research Group. TheHypertension Prevention Trial: three-year effects ofdietary changes on blood pressure. Arch Intern Med1990;150:153–62.
Canner PL, Borhani NO, Oberman A, Cutler J, Prineas RJ, Langford H, et al. The HypertensionPrevention Trial: assessment of the quality of bloodpressure measurements. Am J Epidemiol 1991;134:379–92.
Forster JL, Jeffery RW, Van Natta M, Pirie P.Hypertension prevention trial: do 24-h food recordscapture usual eating behavior in a dietary change study?Am J Clin Nutr 1990;51:253–7.
Hypertension Prevention Trial Research Group.Hypertension Prevention Trial 3 year results. Circulation1988;78(4 Suppl 2):568.
Jeffery RW, French SA, Schmid TL. Attributions fordietary failures: problems reported by participants inthe Hypertension Prevention Trial. Health Psychol 1990;9(3):315–29.
Schmid TL, Jeffery RW, Onstad L, Corrigan SA.Demographic, knowledge, physiological, and behavioralvariables as predictors of compliance with dietarytreatment goals in hypertension. Addict Behav 1991;16:151–60.
Shah M, Jeffery RW, Laing B, Savre SG, Natta MV,Strickland D. Hypertension Prevention Trial (HPT):food pattern changes resulting from intervention onsodium, potassium, and energy intake. J Am Diet Assoc1990;90:69–76.
Jalkanen, 1991 (published data only)Jalkanen L. The effect of a weight reduction programon cardiovascular risk factors among overweighthypertensives in primary health care. Scand J Soc Med1991;19(1):66–71.
Jeffery, 1993 (published data only)*Jeffery RW, Wing RR, Thorson C, Burton LR, Raether C, Jarvey J, et al. Strengthening behavioralinterventions for weight loss: a randomized trial of foodprovision and monetary incentives. J Consult Clin Psychol1993;61:1038–45.
Jeffery RW, Wing RR. Long-term effects of interventionsfor weight loss using food provision and monetaryincentives. J Consult Clin Psychol 1995;63:793–6.
Health Technology Assessment 2004; Vol. 8: No. 21
209
© Queen’s Printer and Controller of HMSO 2004. All rights reserved.

Jeffery RW, Wing RR, Mayer RR. Are smaller weightlosses or more achievable weight loss goals better in thelong term for obese patients? J Consult Clin Psychol 1998;66:641–5.
Wing RR. Insulin sensitivity as a predictor of weightregain. Obes Res 1997;5:24–9.
Wing RR, Jeffery RW. Effect of modest weight loss onchanges in cardiovascular risk factors: are theredifferences between men and women or between weightloss and maintenance? Int J Obes Relat Metab Disord1995;19:67–73.
Jones, 1986 (published data only)Jones, 1986c (behaviour therapy given to group)Jones, 1986d (behaviour therapy given to individual)Jones SE, Owens HM, Bennett GA. Does behaviourtherapy work for dietitians? An experimental evaluationof the effects of three procedures in a weight reductionclinic. Hum Nutr Appl Nutr 1986;40:272–81.
Kaplan, 1987 (published data only)Kaplan RM, Hartwell SL, Wilson DK, Wallace JP. Effectsof diet and exercise interventions on control and qualityof life in non-insulin-dependent diabetes mellitus. J GenIntern Med 1987;2:220–8.
Karvetti, 1992 (published data only)Karvetti, 1992a (women)Karvetti, 1992b (men)Karvetti R-L, Hakala P. A seven-year follow-up of aweight reduction programme in Finnish primary healthcare. Eur J Clin Nutr 1992;46:743–52.
Laitinen, 1993 (published data only)Laitinen, 1993a (women)Laitinen, 1993b (men)*Laitinen JH, Ahola IE, Sarkkinen ES, Winberg RL,Harmaakorpi-Iivonen PA, Uusitupa MI. Impact ofintensified dietary therapy on energy and nutrientintakes and fatty acid composition of serum lipids inpatients with recently diagnosed non-insulin-dependentdiabetes mellitus. J Am Diet Assoc 1993;93:276–83.
Laitinen J, Uusitupa M, Ahola I, Laakso M, Siitonen O.Metabolic and dietary variables associated withglycaemic control in patients with recently diagnosedtype II diabetes mellitus. Diabetes Nutr Metab 1994;7:77–87.
Laitinen J, Uusitupa M, Ahola I, Siitonen O. Metabolicand dietary determinants of serum lipids in obesepatients with recently diagnosed non-insulin-dependentdiabetes. Ann Med 1994;26:119–24.
Uusitupa MI. Early lifestyle intervention in patients withnon-insulin-dependent diabetes mellitus and impairedglucose tolerance. Ann Med 1996;28:445–9.
Uusitupa M, Laitinen J, Siitonen O, Vanninen E,Pyorala K. The maintenance of improved metaboliccontrol after intensified diet therapy in recent type 2diabetes. Diabetes Res Clin Pract 1993;19:227–38.
Vanninen E, Uusitupa M, Siitonen O, Laitinen J,Lansimies E. Habitual physical activity, aerobic capacity
and metabolic control in patients with newly-diagnosedtype 2 (non-insulin-dependent) diabetes mellitus: effectof 1-year diet and exercise intervention. Diabetologia1992;35(4):340–6.
Vanninen E, Uusitupa M, Lansimies E, Siitonen O,Laitinen J. Effect of metabolic control on autonomicfunction in obese patients with newly diagnosed type 2diabetes. Diabet Med 1993;10:66–73.
Lindahl, 1999 (published data only)Lindahl B, Nilsson TK, Jansson JH, Asplund K,Hallmans G. Improved fibrinolysis by intense lifestyleintervention. A randomized trial in subjects withimpaired glucose tolerance. J Intern Med 1999;246:105–12.
Lindgarde, 2000 (published data only)*Lindgarde F, on behalf of the Orlistat SwedishMultimorbidity Study Group. The effect of orlistat onbody weight and coronary heart disease risk profile inobese patients: the Swedish Multimorbidity Study. J Intern Med 2000;248:245–54.
Lindgarde F. Orlistat improves coronary heart disease inhigh-risk obese population: the Swedish MultimorbidityStudy. Obes Res 1999;7:70.
Long, 1983 (published data only)Long CG, Simpson CM, Allott EA. Psychological anddietetic counselling combined in the treatment ofobesity: a comparative study in a hospital outpatientclinic. Hum Nutr Appl Nutr 1983;37:A94–102.
McMahon, 2000 (published data only)*McMahon FG, Fujioka K, Singh BN, Mendel CM,Rowe E, Rolston K, et al. Efficacy and safety ofsibutramine in obese white and African patients withhypertension. A 1-year, double-blind, placebo-controlled, multicenter trial. Arch Intern Med 2000;160:2185–91.
Fujioka K, McMahon FG, Mendel CM, Rowe E,Mooradian AD. Efficacy and safety of sibutramine inpromoting and maintaining weight loss in obeseAfrican–Americans and caucasians with hypertensioncontrolled by calcium channel blockers. Obes Res 1999;7(Suppl 1):69S.
Murphy, 1982 (published data only)Murphy, 1982a (couple and one-party contracts vsindividual and one-party contracts)Murphy, 1982b (couple and two-party contracts vsindividual and two-party contracts)*Murphy JK, Williamson DA, Buxton AE, Moody SC,Absher N, Warner M. The long-term effects of spouseinvolvement upon weight loss and maintenance. BehavTher 1982;13:681–93.
Murphy JK, Bruce BK, Williamson DA. A comparison ofmeasured and self-reported weights in a 4-year follow-up of spouse involvement in obesity treatment. BehavTher 1985;16:524–30.
Narayan, 1998 (published data only)Narayan KM, Hoskin M, Kozak D, Kriska AM, HansonRL, Pettitt DJ, et al. Randomized clinical trial of lifestyle
Appendix 7
210

interventions in Pima Indians: a pilot study. Diabet Med1998;15:66–72.
ODES, 1995 (published data only)*Anderssen SA, Haaland A, Hjermann I, Urdal P,Gjesdal K, Holme I. Oslo Diet and Exercise Study: aone-year randomized intervention trial. Effect onhemostatic variables and other coronary risk factors.Nutr Metab Cardiovasc Dis 1995;5:189–200.
Anderssen SA, Holme I, Urdal P, Hjermann I. Diet andexercise intervention have favourable effects on bloodpressure in mild hypertensives. The Oslo Diet andExercise Study (ODES). Blood Press 1995;4:343–9.
Anderssen SA, Hjermann I, Urdal P, Torjesen PA,Holme I. Improved carbohydrate metabolism afterphysical training and dietary intervention in individualswith the ‘atherothrombogenic syndrome’. Oslo Diet andExercise Study (ODES). A randomized trial. J Intern Med1996;240:203–9.
Anderssen SA, Holme I, Urdal P, Hjermann I.Associations between central obesity and indexes ofhemostatic, carbohydrate and lipid metabolism. Resultsof a 1-year intervention from the Oslo Diet and ExerciseStudy. Scand J Med Sci Sports 1998;8:109–15.
Reseland JE, Anderssen SA, Solvoll K, Hjermann I,Urdal P, Holme I, et al. Effect of long-term changes indiet and exercise on plasma leptin concentrations. Am JClin Nutr 2001;73:240–5.
Torjesen PA, Hjermann I, Birkeland KI, Holme I,Anderssen SA, Urdal P. Lifestyle changes may reversedevelopment of the insulin resistance syndrome – theOslo Diet and Exercise Study: a randomized trial.Diabetes Care 1997;20:26–31.
Urdal P, Haaland A, Hjermann I, Gjesdal K, Christian C, Sorensen M, et al. The Oslo Diet andExercise Study (ODES): design and objectives. Control Clin Trials 1993;14:229–43.
O’Kane, 1994 (published data only)O’Kane M, Wiles PG, Wales JK. Fluoxetine in thetreatment of obese type 2 diabetic patients. Diabet Med1994;11:105–10.
Ost, 1976 (published data only)Ost LG, Gotestam KG. Behavioral and pharmacologicaltreatments for obesity: an experimental comparison.Addict Behav 1976;1:331–8.
Pavlou, 1989 1 (published data only)Pavlou, 1989 (suffixes a–h denote exercise and four dietcombinations)Pavlou KN, Krey S, Steffee WP. Exercise as an adjunct toweight loss and maintenance in moderately obesesubjects. Am J Clin Nutr 1989;49(Suppl 5):1115–23.
Pavlou, 1989 2 (published data only)Pavlou, 1989 2a (not exercise)Pavlou, 1989 2b (exercise)Pavlou KN, Krey S, Steffee WP. Exercise as an adjunct toweight loss and maintenance in moderately obesesubjects. Am J Clin Nutr 1989;49:1115–23.
Pearce, 1981 (published data only)Pearce JW, LeBow MD, Orchard J. Role of spouseinvolvement in the behavioral treatment of overweightwomen. J Consult Clin Psychol 1981;49:236–44.
Phenix, 1990 (unpublished data only)Phenix A. A one year follow-up of a weight loss studycomparing behavioral techniques, nutrition informationand exercise [PhD thesis]. Fresno, CA: California Schoolof Professional Psychology; 1990.
Pritchard, 1997 (published and unpublished data)*Pritchard JE, Nowson CA, Wark JD. A worksiteprogram for overweight middle-aged men achieveslesser weight loss with exercise than with dietary change.J Am Diet Assoc 1997;97:37–42.
Pritchard JE. The body composition diet and exercisestudy: the effect of weight loss on soft tissue composition[Thesis]. Melbourne: University of Melbourne; 1995.
Pritchard JE, Nowson CA, Wark JD. Bone lossaccompanying weight loss: a randomised controlledweight loss study using diet and exercise. Proc Nutr SocAust 1995;19:57.
Pritchard JE, Saul ALF, Nowson CA, Wark JD. Bodycomposition following diet-induced and/or exercise-induced weight loss: A randomised controlled study. Int J Obes 1995;19:212.
Pritchard JE, Nowson CA, Wark JD. Bone lossaccompanying diet-induced or exercise-induced weightloss: a randomised controlled study. Int J Obes 1996;20:513–20.
Pritchard, 1999 (published data only)Pritchard, 1999a (dietitian vs control)Pritchard, 1999b (doctor and dietitian vs control)Pritchard DA, Hyndman J, Taba F. Nutritionalcounselling in general practice: a cost effective analysis.J Epidemiol Community Health 1999;53:311–16.
Rosenthal, 1980 (published data only)Rosenthal B, Allen GJ, Winter C. Husband involvementin the behavioral treatment of overweight women: initialeffects and long-term follow-up. Int J Obes 1980;4:165–73.
Rossner, 2000 (published and unpublished data)*Rossner S, Sjostrom L, Noack R, Meinders AE, Noseda G. Weight loss, weight maintenance, andimproved cardiovascular risk factors after 2 yearstreatment with orlistat for obesity. European OrlistatObesity Study Group. Obes Res 2000;8:49–61.
Toornvliet AC, Pijl H, Frolich M, Westendorp RGJ,Meinders AE. Insulin and leptin concentrations in obesehumans during long-term weight loss. Neth J Med 1997;51:96–102.
Shah, 1996 (published data only)Shah M, Baxter JE, McGovern PG, Garg A. Nutrientand food intake in obese women on a low-fat or low-calorie diet. Am J Health Promot 1996;10:179–82.
Health Technology Assessment 2004; Vol. 8: No. 21
211
© Queen’s Printer and Controller of HMSO 2004. All rights reserved.

Sikand, 1988 (published data only)Sikand G, Kondo A, Foreyt JP, Jones PH, Gotto AM.Two-year follow-up of patients treated with a very-low-calorie diet and exercise training. J Am Diet Assoc 1988;88:487–8.
Simonen, 2000 (published data only)Simonen P, Gylling H, Howard AN, Miettinen TA.Introducing a new component of the metabolicsyndrome: low cholesterol absorption. Am J Clin Nutr2000;72:82–8.
Sjostrom, 1998 (published data only)*Sjostrom L, Rissanen A, Andersen T, Boldrin M, Golay A, Koppeschaar HP, et al. Randomised placebo-controlled trial of orlistat for weight loss and preventionof weight regain in obese patients. European MulticentreOrlistat Study Group. Lancet 1998;352:167–72.
Franson K, Rossner S. Fat intake and food choices duringweight reduction with diet, behavioural modificationand a lipase inhibitor. J Intern Med 2000;247:607–14.
Karhunen L, Franssila-Kallunki A, Rissanen P, Valve R,Kolehmainen M, Rissanen A, et al. Effect of orlistattreatment on body composition and resting energyexpenditure during a two-year weight-reductionprogramme in obese Finns. Int J Obes 2000;24:1567–72.
Rissanen P, Vahtera E, Krusius T, Uusitupa M, Rissanen A. Weight change and blood coagulability andfibrinolysis in healthy obese women. Int J Obes 2001;25:212-18.
Vidgren HM, Agren JJ, Valve RS, Karhunen LJ,Rissanen AM, Uusitupa MI. The effect of orlistat on thefatty acid composition of serum lipid fractions in obesesubjects. Clin Pharamcol Ther 1999;66:315–22.
Smith, 2001 (published data only)Smith, 2001a (10 mg sibutramine vs placebo)Smith, 2001b (15 mg sibutramine vs placebo)*Smith IG, on behalf of the members of theSibutramine Clinical Study 1047 Team, Goulder MA.Randomized placebo-controlled trial of long-termtreatment with sibutramine in mild to moderate obesity.J Fam Pract 2001;50:505–12.
Jones SP, Smith IG, Kelly F, Gray JA. Long term weightloss with sibutramine. Int J Obes 1995;19:41.
Smith IG. Long-term weight loss with sibutramine, a once-daily serotonin and norepinephrine reuptakeinhibitor. Obes Res 1997;5(Suppl 1):80S.
Stenius-Aarniala, 2000 (published data only)*Stenius-Aarniala B, Poussa T, Kvarnstrom J, Gronlund EL, Ylikahri M, Mustajoki P. Immediate andlong term effects of weight reduction in obese peoplewith asthma: randomised controlled study [publishederratum in BMJ 2000;320:984]. BMJ 2000;320:827–32.
STORM, 2000 (published data only)*James WPT, Astrup A, Finer N, Hilsted J, Kopelman P,Rossner S, et al. Effect of sibutramine on weightmaintenance after weight loss: a randomised trial.Lancet 2000;356:2119–25.
Astrup A, Finer N, Hansen DL, Toubro S, Goulder M,Kopelman P, et al. Initial weight loss response tosibutramine predicts 2 yrs outcome in STORM. Int JObes 2001;25(Suppl 2):S104.
Hansen D, Astrup A, Toubro S, Finer N, Kopelman P,Hilsted J, et al., for the STORM Study Group. Predictorsof weight loss and maintenance during 2 years oftreatment by sibutramine in obesity. Results from theEuropean multi-centre STORM trial. Int J Obes 2001;25:496–501.
James P, Astrup A, Finer N, Hilsted J, Kopelman P,Rossner S, et al. Sibutramine Trial in Obesity Reductionand Maintenance (STORM). Obes Res 1999;7:50.
Mertens I, Wauters M, Peiffer F, Van de Sompel M, Van der Planken B, Corthouts B, et al. A 2 yearcombined weight loss program with a hypocaloric diet,sibutramine and physical activity increases antithrombinIII levels in obese subjects. Obes Res 1999;7:125.
Toubro S, Hansen DL, Hilsted JC, Porsborg PA, Astrup AV, for the STORM Study Group. Effekt afsibutramin til vaegttabsvedligeholdelse. Enrandomiseret klinisk kontrolleret undersogelse. UgeskrLaeger 2001;163:2935–40.
Straw, 1983 (published data only)Straw, 1983a (weigh-in maintenance)Straw, 1983b (individual problem-solving maintenance)Straw MK, Terre L. An evaluation of individualizedbehavioral obesity treatment and maintenancestrategies. Behav Ther 1983;14:255–66.
Swinburn, 2001 (published data only)*Swinburn BA, Metcalf P, Ley SJ. Long-term (5-year)effects of a reduced-fat diet intervention in individualswith glucose intolerance. Diabetes Care 2001;24:619–24.
Swinburn BA, Woollard GA, Chang EC, Wilson MR.Effects of reduced-fat diets consumed ad libitum onintake of nutrients, particularly antioxidant vitamins. J Am Diet Assoc 1999;99:1400–5.
TAIM, 1992 (published data only)*Davis BR, Oberman A, Blaufox MD, Wassertheil-Smoller S, Hawkins CM, Cutler JA, et al. Effect ofantihypertensive therapy on weight loss. The Trial ofAntihypertensive Interventions and ManagementResearch Group. Hypertension 1992;19:393–9.
Davis BR, Blaufox MD, Hawkins CM, Langford HG,Oberman A, Swencionis C, et al. Trial ofAntihypertensive Interventions and Management.Design, methods, and selected baseline results. ControlClin Trials 1989;10:11–30.
Davis BR, Blaufox MD, Oberman A, Wassertheil-Smoller S, Zimbaldi N, Cutler JA, et al. Reduction inlong-term antihypertensive medication requirements.Effects of weight reduction by dietary intervention inoverweight persons with mild hypertension. Arch InternMed 1993;153:1773–82.
Davis BR, Oberman A, Blaufox MD, Wassertheil-Smoller S, Zimbaldi N, Kirchner K, et al. Lack of
Appendix 7
212

effectiveness of a low-sodium/high-potassium diet inreducing antihypertensive medication requirements inoverweight persons with mild hypertension. Am JHypertens 1994;7:926–32.
Langford HG, Davis BR, Blaufox D, Oberman A,Wassertheil-Smoller S, Hawkins M, et al. Effect of drugand diet treatment of mild hypertension on diastolicblood pressure. The TAIM Research Group. Hypertension1991;17:210–17.
Wassertheil-Smoller S, Blaufox MD, Oberman A, Davis BR, Swencionis C, Knerr MO, et al., for the TAIMResearch Group. Effect of antihypertensives in sexualfunction and quality of life: the TAIM study. Ann InternMed 1991;114:613–20.
Teupe, 1991 (published data only)Teupe B, Bergis K. Prospective randomized two-yearsclinical study comparing additional metformintreatment with reducing diet in type 2 diabetes. DiabeteMetabolisme 1991;17:213–17.
TOHP I, 1992 (published data only)*Trials of Hypertension Prevention CollaborativeResearch Group. The effects of nonpharmacologicinterventions on blood pressure of persons with highnormal levels. JAMA 1992;267:1213–20.
He J, Whelton PK, Appel LJ, Charleston J, Klag MJ.Long-term effects of weight loss and dietary sodiumreduction on incidence of hypertension. Hypertension2000;35:544–49.
Mattfeldt-Beman MK, Corrigan SA, Stevens VJ, Sugars CP, Dalcin AT, Givi MJ, et al. Participants’evaluation of a weight-loss program. J Am Diet Assoc1999;99:66–71.
Satterfield S, Cutler JA, Langford HG, Applegate WB,Borhani NO, Brittain E, et al., for the Trials ofHypertension Prevention Collaborative Research Group.Trials of Hypertension Prevention. Phase I design. AnnEpidemiol 1991;1(5):455–71.
Stevens VJ, Corrigan SA, Obarzanek E, Bernauer E,Cook NR, Hebert P, et al. Weight loss intervention inphase 1 of the Trials of Hypertension Prevention. TheTOHP Collaborative Research Group. Arch Intern Med1993;153:849–58.
TOHP collaborative research group. Phase I results ofthe Trials of Hypertension Prevention, TOHP. Circulation1990;82(4 Suppl 3):III-553.
Whelton PK, Kumanyika SK, Cook NR, Cutler JA,Borhani NO, Hennekens CH, et al., for the Trials ofHypertension Prevention Collaborative Group. Efficacyof nonpharmacologic interventions in adults with high-normal blood pressure: results from phase 1 of the trialsof hypertension prevention. Am J Clin Nutr 1997;65(Suppl):652–60S.
TOHP, II 1997 (published data only)*Trials of Hypertension Prevention CollaborativeResearch Group. Effects of weight loss and sodiumreduction intervention on blood pressure and
hypertension incidence in overweight people with high-normal blood pressure. The Trials of HypertensionPrevention, Phase II. Arch Intern Med 1997;157:657–67.
Appel LJ, Hebert PR, Cohen JD, Obarzanek E,Yamamoto M, Buring J, et al. Baseline characteristics ofparticipants in phase II of the Trials of HypertensionPrevention (TOHP II). Trials of HypertensionPrevention (TOHP) Collaborative Research Group. AnnEpidemiol 1995;5:149–55.
Hebert PR, Bolt RJ, Borhani NO, Cook NR, Cohen JD,Cutler JA, et al. Design of a multicenter trial to evaluatelong-term life-style intervention in adults with high-normal blood pressure levels. Trials of HypertensionPrevention (phase II). Trials of Hypertension Prevention(TOHP) Collaborative Research Group. Ann Epidemiol1995;5:130–9.
Hollis JF, Satterfield S, Smith F, Fouad M, Allender PS,Borhani N, et al. Recruitment for phase II of the Trialsof Hypertension Prevention. Effective strategies andpredictors of randomization. Trials of HypertensionPrevention (TOHP) Collaborative Research Group. AnnEpidemiol 1995;5(2):140–8.
Lasser VI, Raczynski JM, Stevens VJ, Mattfeldt-BemanMK, Kumanyika S, Evans M, et al. Trials ofHypertension Prevention, Phase II. Structure andcontent of the weight loss and dietary sodium reductioninterventions. Trials of Hypertension Prevention(TOHP) Collaborative Research Group. Ann Epidemiol1995;5:156–64.
Stevens VJ, Obarzanek E, Cook NR, Lee I-M, Appel LJ,Smith West D, et al. for the Trials of HypertensionPrevention Research Group. Long-term weight loss andchanges in blood pressure: results of the Trials ofHypertension Prevention, Phase II. Ann Intern Med2001;134:1–11.
TONE, 1998 (published data only)*Whelton PK, Appel LJ, Espeland MA, Applegate WB,Ettinger WH, Jr, Kostis JB, et al. Sodium reduction andweight loss in the treatment of hypertension in olderpersons: a randomized controlled trial ofnonpharmacologic interventions in the elderly (TONE).TONE Collaborative Research Group [publishederratum appears in JAMA 1998;279:1954]. JAMA 1998;279:839–46.
Anderson RT, Hogan P, Rosen R, Shumaker SA.Baseline correlates with quality of life among men andwomen with medication-controlled hypertension. TheTrial of Nonpharmacologic Interventions in the Elderly(TONE). J Am Geriatr Soc 1997;45:1080–5.
Appel LJ, Espeland M, Whelton PK, Dolecek T,Kumanyika S, Applegate WB, et al. Trial ofNonpharmacologic Intervention in the Elderly (TONE).Design and rationale of a blood pressure control trial.Ann Epidemiol 1995;5:119–29.
Appel LJ, Espeland MA, Easter L, Wilson AC, Folmar S,Lacy CR. Effects of reduced sodium intake onhypertension control in older individuals: results from
Health Technology Assessment 2004; Vol. 8: No. 21
213
© Queen’s Printer and Controller of HMSO 2004. All rights reserved.

the Trial of Nonpharmacologic Interventions in theElderly (TONE). Arch Intern Med 2001;161:685–93.
Bahnson JL, Whelton PK, Appel LJ, Espeland MA,Wofford JL, Rosen R, et al. Baseline characteristics ofrandomized participants in the Trial ofNonpharmacologic Intervention in the Elderly (TONE).Dis Manage Clin Outcomes 1997;1:61–8.
Chao D, Espeland MA, Farmer D, Register TC, LenchikL, Applegate WB, et al. Effect of voluntary weight losson bone mineral density in older and overweightwomen. J Am Geriatr Soc 2000;48:753–9.
Espeland MA, Whelton PK, Kostis JB, Bahnson JL,Ettinger WH, Cutler JA, et al. Predictors and mediatorsof successful long-term withdrawal from antihypertensivemedications. TONE Cooperative Research Group. Trialof Nonpharmacologic Interventions in the Elderly. ArchFam Med 1999;8:228–36.
Espeland MA, Kumanyika S, Wilson AC, Wilcox S, Chao D, Bahnson J, et al. Lifestyle interventionsinfluence relative errors in self-reported diet intake ofsodium and potassium. Ann Epidemiol 2001;11:85–93.
Kostis JB, Espeland MA, Appel L, Johnson KC, Pierce J,Wofford JL. Does withdrawal of antihypertensivemedication increase the risk of cardiovascular events?Trial of Nonpharmacologic Interventions in the Elderly(TONE) Cooperative Research Group. Am J Cardiol1998;82:1501–8.
Kostis JB, Lacy CR, Wilson AC, Cosgrove NM, Shindler DM. Non drug therapy of hypertension:persistence of effect after discontinuation ofintervention. J Am Coll Cardiol 1999;33(2 Suppl A):238A.
Kostis JB, Wilson AC, Shindler DM, Cosgrove NM,Clifton R. Non-drug therapy for hypertension: doeffects on weight and sodium intake persist afterdiscontinuation of intervention? Am J Med2000;109:734–6.
Kumanyika SK, Brancato J, Brewer A, Carnaghi M,Doroshenko L, Rosen R, et al. Interventions in the trialsof nonpharmacologic intervention in the elderly: aneffective approach to weight and sodium reductionamong older adults. Circulation 1996;94(8 Suppl):I-690.
Self M, Brewer A, Kumanyika S, Doroshenko L,Carnaghi M, Brancato J. Pilot study to enhance start-upof a multicenter nutrition intervention trial. J Am DietAssoc 1998;98:322–5.
Wilson A, Kostis J, Philipp C, Appel L, Espeland M,Johnson K, et al. ACE gene (DD) genotype is associatedwith response to dietary weight loss therapy ofhypertension: effect of race and sex. J Hypertens 2000;18:S124.
Wilson AC, Kostis JB, Philipp CS, Appel LJ, Espeland M, Folmar S, et al. Blood pressure sensitivity toweight loss in elderly white hypertensives: associationwith ACE (DD) genotype. Am J Hypertens 2000;13:79A.
Torgerson, 1997 (published data only)
*Torgerson JS, Lissner L, Lindroos AK, Kruijer H,Sjostrom L. VLCD plus dietary and behavioural support
versus support alone in the treatment of severe obesity.A randomised two-year clinical trial. Int J Obes 1997;21:987–94.
Torgerson JS, Agren L, Sjostrom L. Effects on bodyweight of strict or liberal adherence to an initial periodof VLCD treatment. A randomised, one-year clinicaltrial of obese subjects. Int J Obes 1999;23:190.
Tucker, 1991 (published data only)
Tucker JA, Samo JA, Rand CS, Woodward ER.Behavioral interventions to promote adaptive eatingbehavior and lifestyle changes following surgery forobesity: results of a two-year evaluation. Int J Eat Disord1991;10:689–98.
UKPDS (published data only)
*UK Prospective Diabetes Study (UKPDS) Group. Effectof intensive blood-glucose control with metformin oncomplications in overweight patients with type 2diabetes (UKPDS 34) [published erratum in Lancet1998;352:1557]. Lancet 1998;352:854–65.
Clarke P, Gray A, Adler A, Stevens R, Raikou M, Cull C,et al. Cost-effectiveness analysis of intensive blood-glucose control with metformin in overweight patientswith type II diabetes (UKPDS no. 51). Diabetologia 2001;44:298–304.
Turner RC, Mann JI, Iceton G. UK prospective study oftherapies of maturity-onset diabetes. I. Effect of diet,sulphonylurea, insulin or biguanide therapy on fastingplasma glucose and body weight over one year.Diabetologia 1983;24:404–11.
Turner RC, Holman RR, Mathews DR, Oakes SF,Bassett PA, Stratton IM, et al. UK Prospective DiabetesStudy (UKPDS). VIII. Study design, progress andperformance. Diabetologia 1991;34:877–90.
Turner R, Murchison L, Wright AD, Oakley N, Kohner E, Hayes R, et al. United Kingdom prospectivediabetes study 24: A 6-year, randomized, controlled trialcomparing sulfonylurea, insulin, and metformin therapyin patients with newly diagnosed type 2 diabetes thatcould not be controlled with diet therapy. Ann InternMed 1998;128:165–75.
Turner RC, Cull CA, Frighi V, Holman RR. Glycemiccontrol with diet, sulfonylurea, metformin, or insulin inpatients with type 2 diabetes mellitus: progressiverequirement for multiple therapies (UKPDS 49). UKProspective Diabetes Study (UKPDS) Group. JAMA1999;281:2005–12.
UK Prospective Diabetes Study Group. UK prospectivediabetes study 16. Overview of 6 years’ therapy of typeII diabetes: a progressive disease. [published erratum inDiabetes 1996;45:1655]. Diabetes 1995;44:1249–58.
United Kingdom Prospective Diabetes Study (UKPDS).13: Relative efficacy of randomly allocated diet,sulphonylurea, insulin, or metformin in patients withnewly diagnosed non-insulin dependent diabetesfollowed for three years. BMJ 1995;310:83–8.
Appendix 7
214

Wright AD, Cull CA, Holman RR, Turner RC. UKPDS28: a randomized trial of efficacy of early addition ofmetformin in sulfonylurea-treated type 2 diabetes.Diabetes Care 1998;21:87–92.
Viegener, 1990 (published data only)Viegener BJ, Perri MG, Nezu AM, Renjilian DA,McKelvey WF, Schein RL. Effects of an intermittent, low-fat, low-calorie diet in the behavioral treatment ofobesity. Behav Ther 1990;21:499–509.
Waard, 1993 (published data only)Waard, 1993a (Netherlands cohort)Waard, 1993b (Poland cohort)Waard FD, Ramlau R, Mulders Y, Vries TD, Waveren SV.A feasibility study on weight reduction in obesepostmenopausal breast cancer patients. Eur J CancerPrev 1993;2:233–8.
Wadden, 1989 (published data only)*Wadden TA, Sternberg JA, Letizia KA, Stunkard AJ,Foster GD. Treatment of obesity by very low calorie diet,behavior therapy, and their combination: a five-yearperspective. Int J Obes 1989;13(Suppl 2):39–46.
Wadden TA, Stunkard AJ. Controlled trial of very lowcalorie diet, behavior therapy, and their combination inthe treatment of obesity. J Consult Clin Psychol 1986;54:482–8.
Wadden TA, Stunkard AJ, Day SC, Gould RA, Rubin CJ.Less food, less hunger: reports of appetite andsymptoms in a controlled study of a protein-sparingmodified fast. Int J Obes 1987;11:239–49.
Wadden TA, Stunkard AJ, Liebschutz J. Three-yearfollow-up of the treatment of obesity by very low caloriediet, behavior therapy, and their combination. J ConsultClin Psychol 1988;56:925–8.
Wadden, 1994 (published data only)*Wadden TA, Foster GD, Letizia KA. One-year behavioraltreatment of obesity: comparison of moderate and severecaloric restriction and the effects of weight maintenancetherapy. J Consult Clin Psychol 1994;62:165–71.
Foster GD, Wadden TA, Kendall PC, Stunkard AJ, VogtRA. Psychological effects of weight loss and regain: aprospective evaluation. J Consult Clin Psychol 1996;64:752–7.
Wadden, 1995 (published data only)*Wadden TA, Bartlett SJ, Foster GD, Greenstein RA,Wingate BJ, Stunkard AJ, et al. Sertraline and relapseprevention training following treatment by very-low-calorie diet: a controlled clinical trial. Obes Res 1995;3:549–57.
Foster GD, Wadden TA, Peterson FJ, Leitizia KA, BartlettSJ, Conill AM. A controlled comparison of three very-low-calorie diets: effects on weight, body composition,and symptoms. Am J Clin Nutr 1992;55:811–17.
Wadden, 1998 (published data only)Wadden, 1998a (aerobic exercise)Wadden, 1998b (strength exercise)Wadden, 1998c (aerobic and strength exercise)*Wadden TA, Vogt RA, Foster GD, Anderson DA.Exercise and the maintenance of weight loss: 1-year
follow-up of a controlled clinical trial. J Consult ClinPsychol 1998;66:429–33.
Ashutosh K, Methrotra K, Fragale-Jackson J. Effect ofsustained weight loss and exercise on aerobic fitness inobese women. J Sports Med Phys Fitness 1997;37:252–7.
Gladis MM, Wadeen TA, Vogt R, Foster G, Kuehnel RH,Bartlett SJ. Behavioral treatment of obese binge eaters:do they need different care? J Psychsom Res 1998;44:375–84.
Wadden TA, Anderson DA, Foster GD. Two-yearchanges in lipids and lipoproteins associated withmaintenance of a 5% to 10% reduction in initial weight:some findings and questions. Obes Res 1999;7:170–8.
Weinstock RS, Huiliang D, Wadden TA. Diet andexercise in the treatment of obesity. Effects of 3interventions on insulin resistance. Arch Intern Med1998;158:2477–83.
Wadden, 2001 (published data only)*Wadden TA, Berkowitz RI, Sarwer DB, Prus-Wisniewski R, Steinberg C. Benefits of lifestylemodification in the pharmacologic treatment of obesity:a randomized trial. Arch Intern Med 2001;161:218–27.
Wadden TA, Berkowitz RI, Womble LG, Sarwer DB,Arnold ME, Steinberg CM. Effects of sibutramine plusorlistat in obese women following 1 year of treatment bysibutramine alone: a placebo-controlled trial. Obes Res2000;8:431–7.
Wing, 1984 (published data only)Wing, 1984a (concentrated behavioural boostersessions)Wing, 1984b (spaced behavioural booster sessions)Wing RR, Epstein LH, Marcus MD, Koeske R.Intermittent low-calorie regimen and booster sessions inthe treatment of obesity. Behav Res Ther 1984;22:445–9.
Wing, 1985 (published data only)Wing RR, Epstein LH, Nowalk MP, Koeske R, Hagg S.Behavior change, weight loss, and physiologicalimprovements in type II diabetic patients. J Consult ClinPsychol 1985;53:111–22.
Wing, 1988 (published data only)Wing, 1988a (placebo exercise for control)Wing, 1988b (no exercise for control)Wing RR, Epstein LH, Paternostro-Bayles M, Kriska A,Nowalk MP, Gooding W. Exercise in a behaviouralweight control programme for obese patients with type2 (non-insulin-dependent) diabetes. Diabetologia 1988;31:902–9.
Wing, 1991 (published data only)*Wing RR, Marcus MD, Salata R, Epstein LH,Miaskiewicz S, Blair EH. Effects of a very-low-caloriediet on long-term glycemic control in obese type 2diabetic subjects. Arch Intern Med 1991;151:1334–40.
Marcus MD, Wing RR, Guare J, Blair EH, Jawad A.Lifetime prevalence of major depression and its effecton treatment outcome in obese type II diabetic patients.Diabetes Care 1992;15:253–5.
Health Technology Assessment 2004; Vol. 8: No. 21
215
© Queen’s Printer and Controller of HMSO 2004. All rights reserved.

Wing, 1991b (published data only)Wing RR, Marcus MD, Epstein LH, Jawad A. A ‘family-based’ approach to the treatment of obese type IIdiabetic patients. J Consult Clin Psychol 1991;59:156–62.
Wing, 1994 (published data only)*Wing RR, Blair E, Marcus M, Epstein LH, Harvey J.Year-long weight loss treatment for obese patients withtype II diabetes: does including an intermittent very-lowcalorie diet improve outcome? Am J Med 1994;97:354–62.
Wing RR, Anglin K. Effectiveness of a behavioral weightcontrol program for blacks and whites with NIDDM.Diabetes Care 1996;19:409–13.
Wing RR, Shiffman S, Drapkin RG, Grilo CM,McDermott M. Moderate versus restrictive diets:implications for relapse. Behav Ther 1995;26:5–24.
Wing, 1998 (published data only)*Wing RR, Venditti E, Jakicic JM, Polley BA, Lang W.Lifestyle intervention in overweight individuals with afamily history of diabetes. Diabetes Care 1998;21:350–9.
Polley BA, Jakicic JM, Venditti EM, Barr S, Wing RR.The effects of health beliefs on weight loss in individualsat high risk for NIDDM. Diabetes Care 1997;20:1533–8.
Wing, 1999 (published data only)Wing RR, Jeffery RW. Benefits of recruiting participantswith friends and increasing social support for weightloss and maintenance. J Consult Clin Psychol 1999;67:132–8.
Wood, 1988 (published data only)*Wood PD, Stefanick ML, Dreon DM, Frey-Hewitt B,Garay SC, Williams PT, et al. Changes in plasma lipidsand lipoproteins in overweight men during weight lossthrough dieting as compared with exercise. N Engl JMed 1988;319:1173–9.
Fortmann SP, Haskell WL, Wood PD, Stanford WeightControl Project. Effects of weight loss on clinic andambulatory blood pressure in normotensive men. Am JCardiol 1988;62(1):89–93.
King AC, Frey-Hewitt B, Dreon DM, Wood PD. Diet vsexercise in weight maintenance. The effects of minimalintervention strategies on long-term outcomes in men.Arch Intern Med 1989;149:2741–6.
Williams PT, Krauss RM, Vranizan KM, Wood PD.Changes in lipoprotein subfractions during diet-inducedand exercise-induced weight loss in moderatelyoverweight men. Circulation 1990;81:1293–304.
Williams PT, Krauss RM, Vranizan KM, Albers JJ, Wood PD. Effects of weight-loss by exercise and by dieton apolipoproteins A-I and A-II and the particle-sizedistribution of high-density lipoproteins in men.Metabolism 1992;41:441–9.
Williams PT, Stefanick ML, Vranizan KM, Wood PD.The effects of weight loss by exercise or by dieting onplasma high-density lipoprotein (HDL) levels in menwith low, intermediate, and normal-to-high HDL atbaseline. Metabolism 1994;43:917–24.
Wood, 1991 (published data only) Wood, 1991a (females)Wood, 1991b (males)*Wood PD, Stefanick ML, Williams PT, Haskell WL. Theeffects on plasma lipoproteins of a prudent weight-reducing diet, with or without exercise, in overweightmen and women. N Engl J Med 1991;325:461–6.
Kiernan M, King AC, Kraemer HC, Stefanick ML,Killen JD. Characteristics of successful and unsuccessfuldieters: an application of signal detection methodology.Ann Behav Med 1998;20:1–6.
Williams PT, Krauss RM, Stefanick ML, Vranizan KM,Wood PD. Effects of low-fat diet, calorie restriction, andrunning on lipoprotein subfraction concentrations inmoderately overweight men. Metabolism 1994;43:655–63.
Wood, PD, Stefanick ML, Haskell WL. Exercise offsetsadverse lipoprotein effects of a ‘heart healthy’ diet forweight loss. Arteriosclerosis 1989;9:773A.
Appendix 7
216

Health Technology Assessment 2004; Vol. 8: No. 21
217
© Queen’s Printer and Controller of HMSO 2004. All rights reserved.
Appendix 8
Tables of included studies

Appendix 8
218
TABLE 18 Included orlistat studies
Study ID Methods Participants Interventions Outcomes Notes
Broom, 2001a Randomisation:minimisationalgorithm: primarycriterion was primarydefined cardiovascularrisk factor, secondarycriterion was studycentre, then BMI(28–34.9 or 35–39.9or ≥ 40 kg/m2) andweight loss in 2-weekpretreatment phase (≤ 2 kg vs > 2 kg).Allocationconcealment:a B(I)Assessor blinding: no details givenITT: no
Location: 54 GP surgeries and 12 hospitalclinics in UKPeriod of study: before August 2001Inclusion criteria: men and non-pregnantwomen, 18–80 years, BMI ≥ 28 kg/m2, atleast one of the following: IGT (serumglucose ≥ 8.0 mmol/l, 2 hours after astandard OGTT), hypercholesterolaemia(total serum cholesterol ≥ 5.2 mmol/l or LDLcholesterol ≥ 4.2 mmol/l at screening);hypertension (sitting DBP 90–105 mmHg);compliance 60% or more throughout thestudy Exclusion criteria: lactation, women ofchildbearing potential not using adequatecontraception, MI, coronary artery bypassgraft, percutaneous coronary angioplasty inprior 3 months, gastrointestinal surgery forweight reduction, active gastrointestinaldisorders, e.g. peptic ulcer disease ormalabsorption syndromes, pancreatic disease,history of postsurgical adhesions, excessivealcohol intake or substance abuse,participants who required any drug that mayalter body weight or plasma lipids, e.g.appetite suppressants, lipid-lowering resins,retinoids and fish oil supplements,administration of systemic steroids (otherthan HRT) not permitted, concomitantpharmacotherapy for type 2 diabetes,hypertension or hypercholesterolaemia notpermitted Gender: 409 women, 113 menAge (years): mean (SD) a: 46.7 (11.4), b: 45.3 (11.5) BMI (kg/m2): mean (SD) a: 37.1 (6.4), b: 37.0 (6.2)Baseline comparability: yes
Timing of active intervention: a + b: 12 months, contacted 13 times(baseline then at monthly intervals)Description of intervention: a + b: 2 weeks pretreatment phaseconsisting of single-blind placebo and 600kcal/day deficit (min. 1200 kcal/day), 30%energy intake from fats, food and beverageintake diary; deficit diet continuedpostrandomisation to month 6 then reduceda further 300 kcal/day to week 52 a: 120 mg orlistat 3 times daily with mainmealsb: placebo 3 times daily with main meals Allocated: a: 265, b: 266Completed: a: 186, b: 161 at 12 months% Dropout: a: 30%, b: 40% at 12 monthsAssessed: a: 259, b: 263 at 12 months (‘ITT’)
Length offollow-up: 12 monthsOutcomes:weight data, totalcholesterol, LDLcholesterol, HDLcholesterol, TGs,SBP, DBP, fastingplasma glucose,adverse events,compliance,deaths
SDs for change inrisk factoroutcomes at 12months calculated.SDs for change inHbA1c and meanand SD change infasting plasmaglucose at 12months obtainedfrom Roche reportSponsorship:RochePharmaceuticals
continued
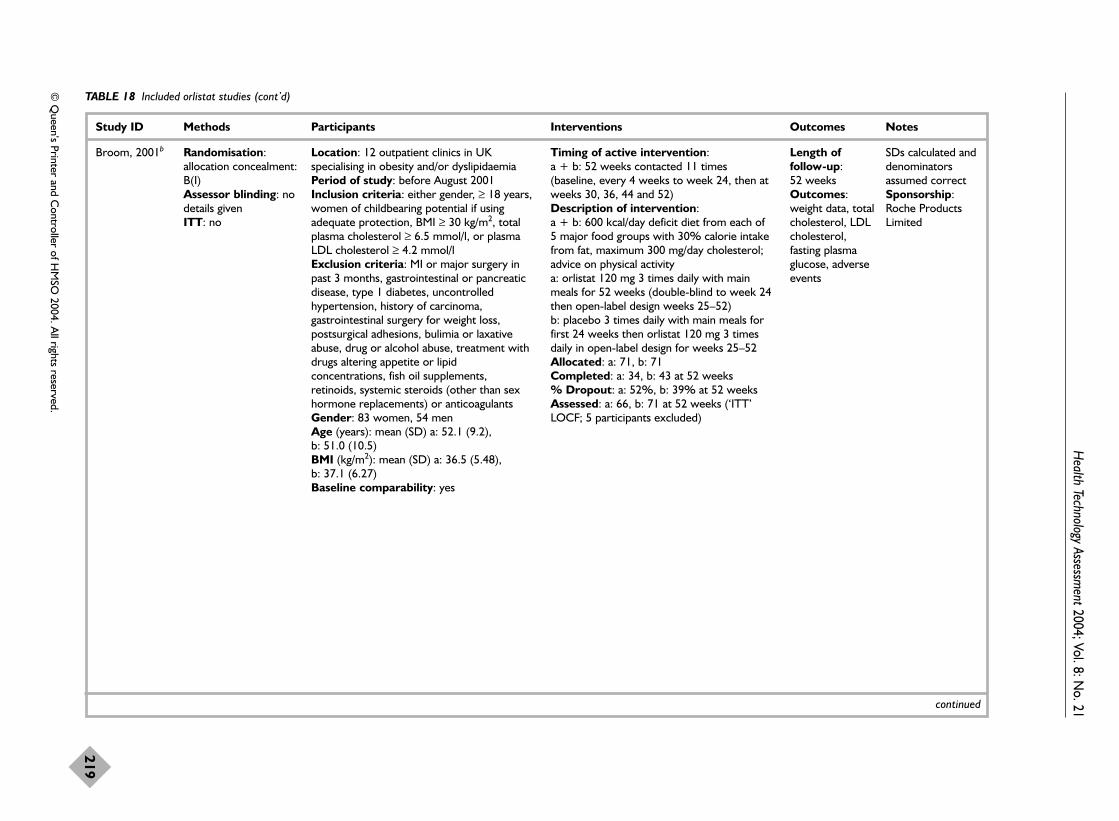
Health Technology Assessm
ent2004; Vol. 8: No. 21
219
© Q
ueen’s Printer and Controller of H
MSO
2004. All rights reserved.
TABLE 18 Included orlistat studies (cont’d)
Study ID Methods Participants Interventions Outcomes Notes
Broom, 2001b Randomisation:allocation concealment:B(I)Assessor blinding: nodetails givenITT: no
Location: 12 outpatient clinics in UKspecialising in obesity and/or dyslipidaemiaPeriod of study: before August 2001Inclusion criteria: either gender, ≥ 18 years,women of childbearing potential if usingadequate protection, BMI ≥ 30 kg/m2, totalplasma cholesterol ≥ 6.5 mmol/l, or plasmaLDL cholesterol ≥ 4.2 mmol/lExclusion criteria: MI or major surgery inpast 3 months, gastrointestinal or pancreaticdisease, type 1 diabetes, uncontrolledhypertension, history of carcinoma,gastrointestinal surgery for weight loss,postsurgical adhesions, bulimia or laxativeabuse, drug or alcohol abuse, treatment withdrugs altering appetite or lipidconcentrations, fish oil supplements,retinoids, systemic steroids (other than sexhormone replacements) or anticoagulantsGender: 83 women, 54 men Age (years): mean (SD) a: 52.1 (9.2), b: 51.0 (10.5) BMI (kg/m2): mean (SD) a: 36.5 (5.48), b: 37.1 (6.27)Baseline comparability: yes
Timing of active intervention: a + b: 52 weeks contacted 11 times(baseline, every 4 weeks to week 24, then atweeks 30, 36, 44 and 52)Description of intervention:a + b: 600 kcal/day deficit diet from each of5 major food groups with 30% calorie intakefrom fat, maximum 300 mg/day cholesterol;advice on physical activitya: orlistat 120 mg 3 times daily with mainmeals for 52 weeks (double-blind to week 24then open-label design weeks 25–52)b: placebo 3 times daily with main meals forfirst 24 weeks then orlistat 120 mg 3 timesdaily in open-label design for weeks 25–52Allocated: a: 71, b: 71 Completed: a: 34, b: 43 at 52 weeks % Dropout: a: 52%, b: 39% at 52 weeksAssessed: a: 66, b: 71 at 52 weeks (‘ITT’LOCF; 5 participants excluded)
Length offollow-up: 52 weeksOutcomes:weight data, totalcholesterol, LDLcholesterol,fasting plasmaglucose, adverseevents
SDs calculated anddenominatorsassumed correctSponsorship:Roche ProductsLimited
continued

Appendix 8
220
TABLE 18 Included orlistat studies (cont’d)
Study ID Methods Participants Interventions Outcomes Notes
Davidson, 1999 Randomisation: 75%orlistat: 25% placebo,stratified (< 2 kg or ≥ 2 kg weight lossduring 4 weeks lead-inbefore randomisation),participants treated withorlistat 120 mg (a) rerandomised at endof year 1. Allocationconcealment: B(I)Assessor blinding: nodetails givenITT: no
Location: 18 US research centresPeriod of study: October 1992–October1995Inclusion criteria: either gender, >18 years,BMI 30–43 kg/m2, adequate contraception inwomen of childbearing potential, all vitaminand mineral preparations were discontinued 8weeks prior to start of study, ≥ 75%treatment compliance by capsule countduring 4-week run-in period, ≥ 70%treatment adherence in year 1 to continue toyear 2 Exclusion criteria: weight loss > 4 kg inprevious 3 months, frequently changedsmoking habits or had stopped smoking inpast 6 months, history or presence ofsubstance abuse, excessive alcohol intake,significant cardiac, renal, hepatic,gastrointestinal, psychiatric or endocrinedisorder; drug-treated type 2 diabetesmellitus, concomitant use of medicationsaltering appetite or lipid levels Gender: 741 women, 139 menAge (years): mean (SEM) a: 43.3 (0.6), b: 44.0 (0.7) BMI (kg/m2): mean (SEM) a: 36.5 (0.9), b: 36.2 (0.1)Baseline comparability: yes
Timing of active intervention: a + b: 24 months, contacted 23 times(baseline, every 2 weeks to week 16, thenevery 4 weeks to week 52, then every 8weeks to week 104)Description of intervention: a + b: 500–800 kcal/day deficit with 30%energy intake from fats in 4-weeks single-blind placebo pretreatment phase, thencontinued for 2 years; if participant still losingweight in last 3 months of year 1 then energyintake increased 200–300 kcal/day; fooddiaries kept by participant and usedperiodically for counselling with dietitian;participant encouraged to increase activity bywalking briskly for 20–30 minutes/weekthroughout 2 years, 4 behaviour modificationsessions on weight loss in year 1 then 4weight maintenance seminars in year 2; once-daily multivitamin containing all fat-solublevitamins (Centrum) given in year 1 only ifserum vitamin values decreased to belowreference range on 2 consecutive visitsa: 120 mg orlistat 3 times daily for year 1 b: placebo 3 times daily for year 1 and year 2a: rerandomised at week 52 to:c: placebo 3 times dailyd: orlistat 120 mg 3 times dailye: orlistat 60 mg 3 times dailyAllocated: a: 668, b: 224Completed: a: 458, b: 133 year 1Assessed: a: 657, b: 223 at 12 months(LOCF but not ITT and for weight and bloodpressure data only) % Dropout: a: 31%, b: 41% at 12 months;b: 57%, c 31%, d: 29%, e: 33% at 24 months
Length offollow-up: 2 yearsOutcomes:weight data, totalcholesterol, LDLcholesterol, HDLcholesterol, TGs,SBP, DBP, fastingplasma glucose,adverse events,compliance,deaths, cancers
2-year results only stated forparticipantsreceivingplacebo/placebo(group b) andorlistat 120 mg 3 timesdaily/orlistat 120 mg 3 timesdaily (groups a andd).Sponsorship:Hoffman-La Roche
continued

Health Technology Assessm
ent2004; Vol. 8: No. 21
221
© Q
ueen’s Printer and Controller of H
MSO
2004. All rights reserved.
TABLE 18 Included orlistat studies (cont’d)
Study ID Methods Participants Interventions Outcomes Notes
Finer, 2000 Randomisation:blinded code numbersrandomised in blocks of4 printed on labels ofdouble-blind medicationand supplied in identicalblister packs. Allocationconcealment: AAssessor blinding: yesITT: no
Location: 5 UK centresPeriod of study: before February 1999Inclusion criteria: either gender, ≥ 18 years,BMI 30–43 kg/m2, women of childbearingpotential if using adequate contraceptiveprecautions, > 75% compliance (returnedtablets) during run-in phase Exclusion criteria: weight loss > 4 kg in 3 months before screening, history of severesystemic disease including diabetes,uncontrolled hypertension, previousgastrointestinal disease, surgery for weightreduction, history of postsurgical adhesions,history or presence of cancer, psychiatric orneurological disorder requiring chronicmedications or liable to prejudice participantcompliance, alcohol or substance abuse,bulimia or laxative abuse, pregnancy,lactation, postmenopausal women,amenorrhoeic <1 year, drugs capable ofinfluencing body weight, resins for lipidlowering, anticoagulants, digoxin or lipid-soluble vitamin supplements within previousmonth Gender: 193 women, 25 menAge (years): mean (SD) a: 41.5 (10.5), b: 41.4 (10.0)BMI (kg/m2): mean (SD) a: 36.8 (3.6), b: 36.8 (3.7)Baseline comparability: yes
Timing of active intervention: a + b: 12 months, contacted 17 times(baseline, before and after 4-week run-in,every 2 weeks until week 12, then everymonth until month 12)Description of intervention: a + b: pretreatment phase of 4-week single-blind run-in, then 600 kcal/day deficit diet(min. 1200 kcal/day), 30% fat, alcohol 150 g/week, aimed to produce initial weightloss of 0.25–0.5 kg/week, reduced by further300 kcal/day at week 24 until week 52 (orreduced to 1000 kcal/day if already at 1200 kcal/day) a: 120 mg orlistat 3 times daily b: placebo 3 times daily Allocated: a: 114 b: 114Completed: a: 73, b: 66 at 12 months% Dropout: a: 36%, b: 42% at 12 monthsAssessed: a: 59, b: 61 at 12 months(completer analysis excluding participantswho violated protocol); a: 110, b: 108 at 12 months (‘ITT’ LOCF, although 10participants excluded)
Length offollow-up: 12 monthsOutcomes:weight data, totalcholesterol, LDLcholesterol, HDLcholesterol,adverse events
SDs for change inweight calculatedSponsorship: FHoffman-La Roche
continued

Appendix 8
222
TABLE 18 Included orlistat studies (cont’d)
Study ID Methods Participants Interventions Outcomes Notes
Hauptman,2000
Randomisation:personalcommunication.Allocation concealment:AAssessor blinding: nodetails givenITT: no
Location: 17 primary care centresin USAPeriod of study: before June 1999Inclusion criteria: either gender,>18 years, BMI 30–44 kg/m2,completed 4-week pretreatmentphase with 75% or morecompliance (by capsule count) Exclusion criteria: pregnancy,lactation, women of childbearingpotential not taking adequatecontraception; weight loss > 4 kglast 3 months, history of significantcardiac, renal, hepatic orgastrointestinal disorders,uncontrolled hypertension or otherclinically significant condition,gastrointestinal surgery for weightreduction, bulimia or laxativeand/or substance abuse, abnormallaboratory measures (values ≥ 10%of reference value for the normalrange and sufficient to requiremedical follow-up by studyphysician), change in smoking habitsin previous 6 months, use of anydrug that may influence bodyweight or food intake in 8 weeksbefore screening Gender: 497 women, 138 menAge (years): mean (SD) a: 42.6(11.68), b: 43.2 (10.14) c: 41.6(10.19)BMI (kg/m2): mean (SD) a: 35.8(4.38), b: 36.0 (2.90), c: 36.1 (4.37)at 4 weeks before randomisationBaseline comparability: yes
Timing of active intervention: a + b: 104 weeks, contacted 21 times (baseline, every2 weeks for first month then every 4 weeks until week52, then every 8 weeks until week 104)Description of intervention: a + b + c: 4-week single-blind placebo pretreatmentphase of 1200 kcal/day diet for participants whoweighed < 90 kg initially or 1500 kcal/day forparticipants who weighed ≥ 90 kg initially; 30% energyintake from fats, 50% CHO, 20% protein, maximum300 mg/day cholesterol, maximum 10 alcoholicdrinks/week; dietary guidance on intake from studyphysician at start of pretreatment only, diet continuedfor first 52 weeks then increased by 300 kcal/day forparticipants still losing weight at end of week 52 or nodietary adjustment for those whose weight was stableuntil week 104; participants viewed videos onbehaviour modification techniques for weight control 4 times in first 52 weeks, weight management and dietpamphlets for weight maintenance given 4 times duringweeks 53–104 based on ‘Live for Life’ programme, allparticipants encouraged to increase physical activity bybrisk walking for 20–30 minutes 3–5 times/week;dietary records kept 10 times during studya: 60 mg orlistat 3 times daily with main meals b: 120 mg orlistat 3 times daily with main mealsc: placebo 3 times daily with main meals Allocated: a: 213, b: 210, c: 212Completed: a: 154, b: 151, c: 122 at 12 months; a: 120, b: 117, c: 91 at 24 months% Dropout: a: 28%, b: 28%, c: 42% at 12 months(% participants who completed 1 year greater in bothorlistat groups than placebo (p = 0.001); a: 44%, b: 44%, c: 57% at 24 monthsAssessed: a: 213, b: 210, c: 212, at 12 months and at24 months (‘ITT’): a: 120, b: 117, c: 91 at 12 monthsand at 24 months (completer analysis)
Length offollow-up: 24 monthsOutcomes:weight data, totalcholesterol, LDLcholesterol, HDLcholesterol, TGs,SBP, DBP, fastingplasma glucose,adverse events,compliance,deaths
Change in weightincluding SDscalculated (changefrom –4 weeks toweek 52 minuschange from –4 weeks to week0), change in riskfactors calculatedfrom actual values,SDs also calculatedSponsorship:none mentioned,first author atHoffman-La Roche
continued

Health Technology Assessm
ent2004; Vol. 8: No. 21
223
© Q
ueen’s Printer and Controller of H
MSO
2004. All rights reserved.
TABLE 18 Included orlistat studies (cont’d)
Study ID Methods Participants Interventions Outcomes Notes
Hill, 1999 Randomisation:stratified (≤ 10%, or> 10% weight loss inpretreatment phase). Allocation concealment:B(I)Assessor blinding: nodetails givenITT: no
Location: 17 US clinical researchcentresPeriod of study: before August1998Inclusion criteria: either gender,≥ 18 years, BMI 28–43 kg/m2, lost8% or more of initial body weightduring 6-month run-in phase Exclusion criteria: ever hadsignificant medical disorders,uncontrolled hypertension,recurrent nephrolithiasis,symptomatic cholelithiasis, activegastrointestinal disorders, type 2diabetes, pancreatic disease, cancer,pregnancy, lactating women, historyor presence of substance abuse,eating disorders, excessive alcoholintake, significantly abnormallaboratory test results, previousgastrointestinal surgery for weightreduction, history of postsurgicaladhesions, any medications knownto influence body weight, appetiteor lipid concentrations taken in 8weeks before screening Gender: 605 women, 115 men Age (years): mean (SEM) a: 46.8(0.8), b: 46.4 (0.7), c: 46.1 (0.7), d: 45.9 (0.7)BMI (kg/m2): mean (SEM) a: 32.6(0.2), b: 32.8 (0.2), c: 32.9 (0.2), d: 32.8 (0.2)Baseline comparability: bodyweight significantly different inorlistat 60 mg 3 times daily (groupc) from all other groups (p < 0.05)accounted for by higher proportionof men to women in group c
Timing of active intervention: a–d: 12 months, contacted 11 times (baseline, every 2 weeks during month 1, then every month to month5, then every 2 months to month 12)Description of intervention: a–d: 6-month pretreatment phase consisting of 1000 kcal/day deficit, 30% energy intake from fat, 50%from CHO, 20% from protein, to produce weight lossof 0.5–1 kg/week; dietary counselling, 4 sessions ofbehavioural modification programme (University ofMinnesota’s Wise Weighs) and encouraged to increaseactivity to brisk walking for 20–30 minutes 5 times/week, standard multivitamin–multimineraltablets once daily (Centrum) from start ofpretreatment to end of study a–d: from randomisation, participants prescribedmaintenance diet where individual energy requirementsreassessed according to body weight at week 22 ofpretreatment phase; increase in energy intakeprescribed to match anticipated metabolicrequirements over 1 year, if participants gained weightthey were encouraged to maintain this higher weight,dietary and behavioural counselling given to all, dietaryrecordsa: 30 mg orlistat 3 times daily b: placebo 3 times daily c: 60 mg orlistat 3 times dailyd: 120 mg orlistat 3 times dailyAllocated: a: 187, b: 188, c: 173, d: 181Completed: a: 140, b: 138, c: 133, d: 126Assessed: a: 119, b: 121, c: 116, d: 113 at 12 months(for weight outcome only)% Dropout: a: 25%, b: 27%, c: 23%, d: 30% at 12 months
Length offollow-up: 12 monthsOutcomes:weight data, totalcholesterol, LDLcholesterol, HDLcholesterol, TGs,adverse events,compliance
All outcomescalculated frominitial values toweek 52 minusinitial values to endof 6-month lead-in(denominatorsdiffer),SDs for weightchange calculatedSponsorship: FHoffman-La Roche
continued

Appendix 8
224
TABLE 18 Included orlistat studies (cont’d)
Study ID Methods Participants Interventions Outcomes Notes
Hollander, 1998 Randomisation:stratified by weight lossand glucose controlduring 5-weekpretreatment: weightloss ≤ 2 kg, glucose5.6–8.9 mmol/l; weightloss ≤ 2 kg, glucose9.0–12.2 mmol/l; weightloss > 2 kg, glucose5.6–8.9 mmol/l; weightloss > 2 kg, glucose9.0–12.2 mmol/l.Allocation concealment:AAssessor blinding: yesITT: possibly as nodenominators stated foroutcomes
Location: 12 diabetic clinic centres in USAPeriod of study: before February 1998Inclusion criteria: either gender, >18 years,BMI 28–40 kg/m2, type 2 diabetes, clinicallystable on glyburide or glypizide for 6 monthsor more; HbA1c 6.5–10% at screening, fastingplasma glucose 5.6–12.2 mmol/l at end of 4thweek of pretreatment, blood levels of fat-soluble vitamins above lower limit of normalreference range, completion and complianceby tablet count of ≥ 70% duringpretreatment Exclusion criteria: pregnancy, lactation,women of childbearing potential not takingadequate contraceptive measures, clinicallyrelevant conditions, e.g. psychiatric disorders,substance abuse, cholecystitis, pancreaticdisease, uncontrolled hypertension, significantcomplications associated with diabetes,weight loss of > 4 kg during past 3 months,history of recurrent nephrolithiasis orsymptomatic cholelithiasis, gastrointestinalsurgery for weight reduction, history ofbulimia or laxative abuse or if they had takenany drug that may influence body weight orplasma lipids in 8 weeks before start of study Gender: 157 women, 164 menAge (years): mean (SD) a: 55.4 (8.8), b: 54.7(9.7)BMI (kg/m2): mean (SD) a: 34.5 (3.2), b: 34.0(3.4)Baseline comparability: yes
Timing of active intervention: 12 months, contacted 14–27 times (baseline,weeks 1 and 2, then every 2–4 weeks) Description of intervention: a + b: 5 weeks pretreatment phase singleblind with mildly hypocaloric diet, then500 kcal/day deficit from baseline to week 52,additional diet counselling and a standardisedcommercially available vitamin supplementgiven if 2 consecutive vitamin measures fellbelow reference rangea: 120 mg orlistat 3 times daily taken withmeals b: placebo 3 times daily taken with meals Allocated: a: 162, b: 159Completed: a: 115, b: 139 at 12 months% Dropout: a: 15%, b: 28% at 12 monthsAssessed: a: 162, b: 159 at 12 months
Length offollow-up: 12 monthsOutcomes:weight data, totalcholesterol, LDLcholesterol, HDLcholesterol, TGs,HbA1c, fastingplasma glucose,adverse events
All mean and SDchange in weightand risk factoroutcomes obtainedfrom Roche reportSponsorship:Hoffman-La Roche
continued
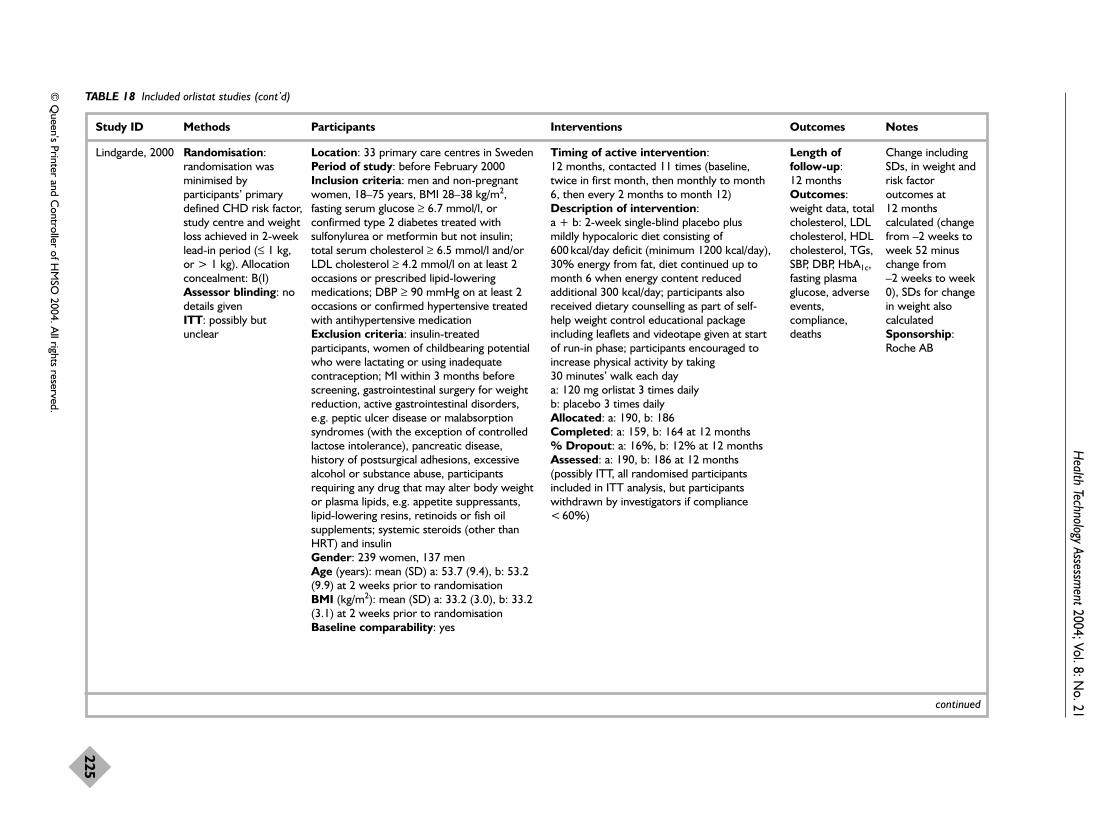
Health Technology Assessm
ent2004; Vol. 8: No. 21
225
© Q
ueen’s Printer and Controller of H
MSO
2004. All rights reserved.
TABLE 18 Included orlistat studies (cont’d)
Study ID Methods Participants Interventions Outcomes Notes
Lindgarde, 2000 Randomisation:randomisation wasminimised byparticipants’ primarydefined CHD risk factor,study centre and weightloss achieved in 2-weeklead-in period (≤ 1 kg,or > 1 kg). Allocationconcealment: B(I)Assessor blinding: nodetails givenITT: possibly butunclear
Location: 33 primary care centres in SwedenPeriod of study: before February 2000Inclusion criteria: men and non-pregnantwomen, 18–75 years, BMI 28–38 kg/m2,fasting serum glucose ≥ 6.7 mmol/l, orconfirmed type 2 diabetes treated withsulfonylurea or metformin but not insulin;total serum cholesterol ≥ 6.5 mmol/l and/orLDL cholesterol ≥ 4.2 mmol/l on at least 2occasions or prescribed lipid-loweringmedications; DBP ≥ 90 mmHg on at least 2occasions or confirmed hypertensive treatedwith antihypertensive medication Exclusion criteria: insulin-treatedparticipants, women of childbearing potentialwho were lactating or using inadequatecontraception; MI within 3 months beforescreening, gastrointestinal surgery for weightreduction, active gastrointestinal disorders,e.g. peptic ulcer disease or malabsorptionsyndromes (with the exception of controlledlactose intolerance), pancreatic disease,history of postsurgical adhesions, excessivealcohol or substance abuse, participantsrequiring any drug that may alter body weightor plasma lipids, e.g. appetite suppressants,lipid-lowering resins, retinoids or fish oilsupplements; systemic steroids (other thanHRT) and insulin Gender: 239 women, 137 menAge (years): mean (SD) a: 53.7 (9.4), b: 53.2(9.9) at 2 weeks prior to randomisationBMI (kg/m2): mean (SD) a: 33.2 (3.0), b: 33.2(3.1) at 2 weeks prior to randomisationBaseline comparability: yes
Timing of active intervention: 12 months, contacted 11 times (baseline,twice in first month, then monthly to month6, then every 2 months to month 12)Description of intervention: a + b: 2-week single-blind placebo plusmildly hypocaloric diet consisting of600 kcal/day deficit (minimum 1200 kcal/day),30% energy from fat, diet continued up tomonth 6 when energy content reducedadditional 300 kcal/day; participants alsoreceived dietary counselling as part of self-help weight control educational packageincluding leaflets and videotape given at startof run-in phase; participants encouraged toincrease physical activity by taking 30 minutes’ walk each day a: 120 mg orlistat 3 times dailyb: placebo 3 times dailyAllocated: a: 190, b: 186Completed: a: 159, b: 164 at 12 months% Dropout: a: 16%, b: 12% at 12 monthsAssessed: a: 190, b: 186 at 12 months(possibly ITT, all randomised participantsincluded in ITT analysis, but participantswithdrawn by investigators if compliance< 60%)
Length offollow-up: 12 monthsOutcomes:weight data, totalcholesterol, LDLcholesterol, HDLcholesterol, TGs,SBP, DBP, HbA1c,fasting plasmaglucose, adverseevents,compliance,deaths
Change includingSDs, in weight andrisk factoroutcomes at 12 monthscalculated (changefrom –2 weeks toweek 52 minuschange from –2 weeks to week0), SDs for changein weight alsocalculatedSponsorship:Roche AB
continued
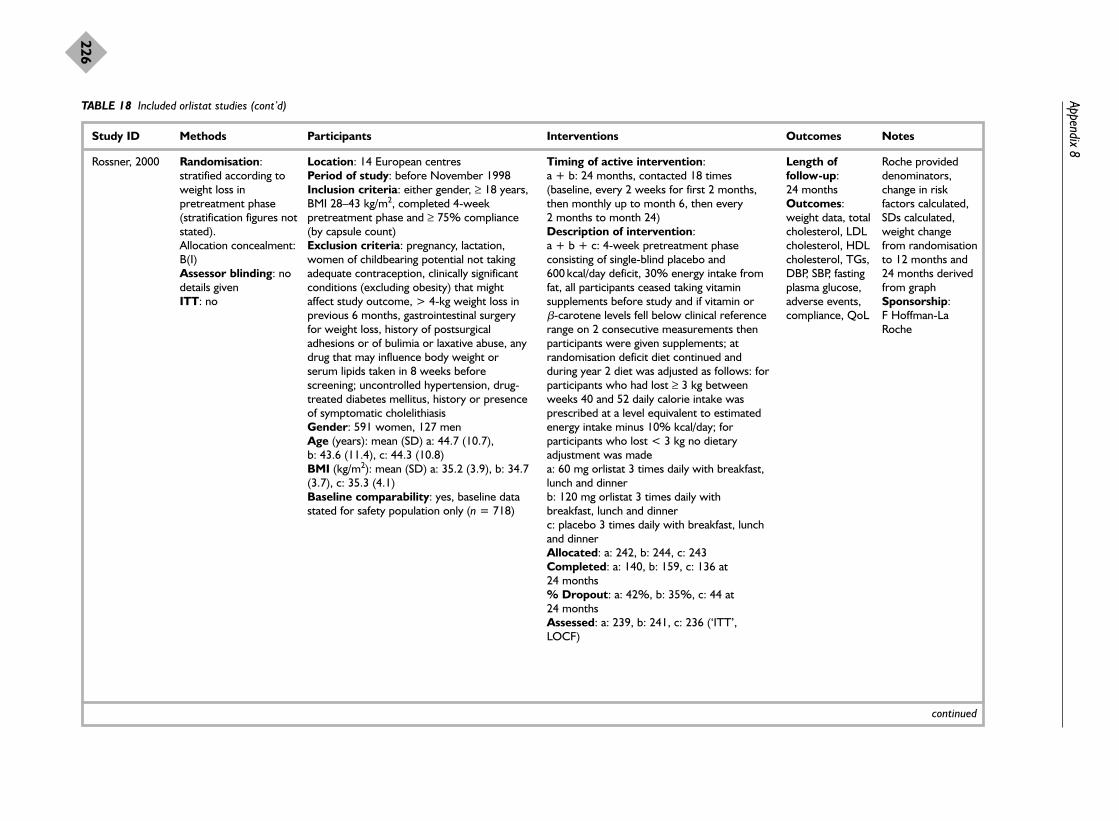
Appendix 8
226
TABLE 18 Included orlistat studies (cont’d)
Study ID Methods Participants Interventions Outcomes Notes
Rossner, 2000 Randomisation:stratified according toweight loss inpretreatment phase(stratification figures notstated). Allocation concealment:B(I)Assessor blinding: nodetails givenITT: no
Location: 14 European centres Period of study: before November 1998Inclusion criteria: either gender, ≥ 18 years,BMI 28–43 kg/m2, completed 4-weekpretreatment phase and ≥ 75% compliance(by capsule count) Exclusion criteria: pregnancy, lactation,women of childbearing potential not takingadequate contraception, clinically significantconditions (excluding obesity) that mightaffect study outcome, > 4-kg weight loss inprevious 6 months, gastrointestinal surgeryfor weight loss, history of postsurgicaladhesions or of bulimia or laxative abuse, anydrug that may influence body weight orserum lipids taken in 8 weeks beforescreening; uncontrolled hypertension, drug-treated diabetes mellitus, history or presenceof symptomatic cholelithiasis Gender: 591 women, 127 menAge (years): mean (SD) a: 44.7 (10.7), b: 43.6 (11.4), c: 44.3 (10.8)BMI (kg/m2): mean (SD) a: 35.2 (3.9), b: 34.7(3.7), c: 35.3 (4.1)Baseline comparability: yes, baseline datastated for safety population only (n = 718)
Timing of active intervention: a + b: 24 months, contacted 18 times(baseline, every 2 weeks for first 2 months,then monthly up to month 6, then every 2 months to month 24)Description of intervention: a + b + c: 4-week pretreatment phaseconsisting of single-blind placebo and600 kcal/day deficit, 30% energy intake fromfat, all participants ceased taking vitaminsupplements before study and if vitamin or �-carotene levels fell below clinical referencerange on 2 consecutive measurements thenparticipants were given supplements; atrandomisation deficit diet continued andduring year 2 diet was adjusted as follows: forparticipants who had lost ≥ 3 kg betweenweeks 40 and 52 daily calorie intake wasprescribed at a level equivalent to estimatedenergy intake minus 10% kcal/day; forparticipants who lost < 3 kg no dietaryadjustment was madea: 60 mg orlistat 3 times daily with breakfast,lunch and dinnerb: 120 mg orlistat 3 times daily withbreakfast, lunch and dinnerc: placebo 3 times daily with breakfast, lunchand dinner Allocated: a: 242, b: 244, c: 243Completed: a: 140, b: 159, c: 136 at 24 months% Dropout: a: 42%, b: 35%, c: 44 at 24 monthsAssessed: a: 239, b: 241, c: 236 (‘ITT’,LOCF)
Length offollow-up: 24 monthsOutcomes:weight data, totalcholesterol, LDLcholesterol, HDLcholesterol, TGs,DBP, SBP, fastingplasma glucose,adverse events,compliance, QoL
Roche provideddenominators,change in riskfactors calculated,SDs calculated,weight changefrom randomisationto 12 months and24 months derivedfrom graphSponsorship: F Hoffman-LaRoche
continued

Health Technology Assessm
ent2004; Vol. 8: No. 21
227
© Q
ueen’s Printer and Controller of H
MSO
2004. All rights reserved.
TABLE 18 Included orlistat studies (cont’d)
Study ID Methods Participants Interventions Outcomes Notes
Sjostrom, 1998 Randomisation:randomisation numbersgenerated by sponsors(Roche) andincorporated intodouble-blind labelling,randomisation done inblocks of 4 to produceequal numbers in bothgroups, stratified byweight loss in 4-weekpretreatment phase.Allocation concealment:A Assessor blinding: nodetails givenITT: no
Location: 15 European centresPeriod of study: before July 1998Inclusion criteria: either gender, ≥ 18 years,BMI 28–47 kg/m2, women of childbearingpotential if using adequate contraception,> 75% compliance during pretreatmentphase at end of year 1 to continue to year 2Exclusion criteria: serious diseases includinguncontrolled hypertension (DBP≥ 105 mmHg) and pharmacologically treateddiabetics, weight loss > 4 kg in 3 monthsbefore screening, surgery for weightreduction, history of postsurgical adhesions,bulimia or laxative abuse, use of any drug thatmay influence body weight or plasma lipids inpast month, drug or alcohol abuseGender: 567 women, 116 men Age (years): mean (range) a: 45.2 (20–76), b: 44.3 (18–77)BMI (kg/m2): mean a: 36.1, b: 36.2Baseline comparability: yes
Timing of active intervention: a + b: 4-week pretreatment phase, 52 weekstreatment, then reassigned for further 52 weeks treatment, contacted 25 times(baseline, every 2 weeks until week 12, thenevery month until month 12, then 8 visits inyear 2)Description of intervention:a + b: 4-week pretreatment consisting ofsingle-blind placebo 3 times daily with mealsand 600 kcal/day deficit with 30% calorieintake from fats; first 24 weeks all participantscontinued 600 kcal/day deficit (min.1200 kcal/day) then until week 52 reduced byadditional 300 kcal/day (min. 1000 kcal/day);diet designed to cause weight loss of0.25–0.5 kg/week and consisted of 30%calorie intake from fats, 50% CHO, 20%protein, 300 mg/day cholesterol, 3 mainmeals and optional snack daily, 150 mg/weekalcohol; year 2 all participants advised onweight maintenance diet and not to return tohypocaloric diet; additional dietary counsellingor vitamin supplements given when necessaryif 2 consecutive measures were below normalrangea: orlistat 120 mg 3 times daily baseline toweek 104 b: placebo 3 times daily baseline to week 104Allocated: a: 345, b: 343 at baseline; a: 135,b: 126 at end week 52 Completed: a: 284, b: 260 at 52 weeks; a: 114, b: 102 at week 104 % Dropout: a: 18%, b: 24% at 52 weeks; a: 16%, b: 19% at week 104Assessed: a: 343, b: 340 at 52 weeks (‘ITT’,LOCF); a: 133, b: 123 at 104 weeks (‘ITT’,LOCF)
Length offollow-up: 2 yearsOutcomes:weight data, totalcholesterol, LDLcholesterol, HDLcholesterol, TGs,SBP, DBP, fastingplasma glucose,adverse events
Mean change inweight and riskfactor datacalculated fromactual values, SDscalculated,assumed meanweight loss in 4week run-in =2.2 kgSponsorship: F Hoffman-LaRoche
a See Appendix 5.OGTT, oral glucose tolerance test; HRT, hormone replacement therapy; CHO, carbohydrate; QoL, quality of life.

Appendix 8
228
TABLE 19 Included sibutramine studies
Study ID Methods Participants Interventions Outcomes Notes
Apfelbaum,1999
Randomisation:allocation concealment:B(I)Assessor blinding: no details givenITT: no
Location: 12 medical centres in France withinterest in obesity/endocrine disordersPeriod of study: before February 1998Inclusion criteria: either gender, 18–55years, BMI > 30 kg/m2, weight loss of ≥ 6 kgduring 4-week VLCD (220–800 kcal/day) run-in phase Exclusion criteria: endocrine-relatedobesity, type 1 diabetes, type 2 diabetesreceiving insulin or fasting glycaemia > 7.8 mmol/l, supine DBP > 100 mmHg,medical illness, ECG or laboratoryabnormalities disqualified at investigators’discretion, unsuccessful VLCD in previous 6months, not more than borderline depressedon Clinical Global Impression ScaleGender: 127 women, 33 menAge (years): mean (SD) a: 36.3 (9.5), b: 39.1(9.1)BMI (kg/m2): mean (SD) a: 35.9 (6.6), b: 35.1(5.8) Baseline comparability: yes
Timing of active intervention: a + b: 12 months, contacted 16 times(baseline, at week 2, month 1, monthly tomonth 12, then at month 13 and month 15)Description of intervention: a + b: 1-week run-in phase for screeningtests then 4 week pretreatment phase ofVLCD (220–800 kcal/day, site specific);dietary counselling to reduce total calorieintake by 20–30% compared with pre-VLCDintake a: 10 mg sibutramine capsule each morning b: placebo capsule each morningAllocated: a: 82, b: 78Completed: a: 60, b: 48 at 12 months% Dropout: a: 39%, b: 27% at 12 monthsAssessed: a: 54, b: 45 at 12 months(completer analysis, 6 participants in group a,3 participants in group b excluded as 12-month assessment performed more than6 days after last dose of trial medication) a: 81, b: 78 at 12 months (‘ITT’, LOCF; 1 participant in group a excluded as did notprovide a postbaseline assessment of bodyweight)
Length offollow-up: 15 monthsOutcomes:weight data, LDLcholesterol, HDLcholesterol, TGs,adverse events,compliance
Sponsorship:none mentioned,reprints fromauthor atLaboratoires Knoll,France
McMahon, 2000 Randomisation: 2:1,no other details given. Allocation concealment:B(I)Assessor blinding: nodetails givenITT: no
Location: 13 sites, USAPeriod of study: before February 2000Inclusion criteria: either gender, ≥ 18 years,BMI 27–40 kg/m2, diagnosis of hypertension≥ 12 months, adequate medical control ofhypertension (mean supine DBP ≤ 95 mmHgduring run-in period; variations in mean DBPmeasured at 3 consecutive run-in visits andvariations in individual measurements duringeach of these qualifying run-in visits had to bewithin 10 mmHg); hypertension to becontrolled using a constant dose of a calcium
Timing of active intervention: a + b: 12 months, contacted 16 times(baseline, every 2 weeks, weeks 0–8, thenevery 4 weeks, weeks 9–52)Description of intervention: a + b: 2–10-week pretreatment phase, briefgeneral dietary counselling for weightreduction at initial run-in visit only a: sibutramine titrated 5–20 mg/day in 5-mgincrements every 2 weeks to week 6, thenmaintained at 20 mg/day weeks 8–52 b: placebo once daily
Length offollow-up: 12 monthsOutcomes:weight data, totalcholesterol, LDLcholesterol, HDLcholesterol, TGs,SBP, DBP, adverseevents, QoL
SDs calculated forchange in weightand risk factors at1 yearSponsorship:KnollPharmaceutical Co.
continued

Health Technology Assessm
ent2004; Vol. 8: No. 21
229
© Q
ueen’s Printer and Controller of H
MSO
2004. All rights reserved.
TABLE 19 Included sibutramine studies (cont’d)
Study ID Methods Participants Interventions Outcomes Notes
channel blocker ≥ 60 days precedingscreening and during run-in period; use of asingle thiazide diuretic in addition wasallowed provided dose stable during sameperiod; concomitant therapy with a singleantilipidaemic agent, diuretic or �-adrenergicreceptor agonist was allowed if dose stable≥ 60 days preceding screening; womenpatients ≥ 2 years postmenopausal, hadundergone surgical sterilisation or were usingadequate contraceptive measures; ≥ 75%compliance (tablet count) during placebo run-in period Exclusion criteria: elevated BP secondary toconcurrent medical condition (other thanobesity); supine pulse rate > 95 beats/minuteat baseline or supine DBP ≥ 95 mmHg at anyrun-in visit, history of significant cardiacdisease, endocrine abnormalities, impairmentof a major organ system, convulsions, severecerebral trauma or stroke, hypersensitivity to≥ 2 classes of drugs, adverse reactions toCNS stimulants, substance abuse < 2 yearsbefore screening, gastric surgery to reduceweight or participation in a formal weight lossprogramme within 3 months beforescreening, previous administration ofsibutramine at any time or use of anotherinvestigation drug within 30 days before thisstudy, concomitant therapy with other weightloss products Gender: 136 women, 88 menAge (years): mean (SD) a: 52.3 (10.0), b: 52.9 (8.7)BMI (kg/m2): mean (SD) a: 34.5 (3.4), b: 34 (4.0)Baseline comparability: yes
Allocated: a: 150, b: 74Completed: a: 79, b: 41Assessed: a: 79, b: 41 at 12 months(completer analysis); a: 142, b: 69 at 12 months (‘ITT’ LOCF)% Dropout: a: 47%, b: 45% at 12 months
continued

Appendix 8
230
TABLE 19 Included sibutramine studies (cont’d)
Study ID Methods Participants Interventions Outcomes Notes
Smith, 2001Smith, 2001a:10 mgsibutramine Smith, 2001b:15 mgsibutramine
Randomisation:computer-generatedrandomisation list.Allocation concealment:B(I)Assessor blinding: nodetails given ITT: no
Location: 12 GP centres in UK Period of study: before 1996Inclusion criteria: either gender, BMI27–40 kg/m2, protocol amended to BMI25–44 kg/m2, 18–65 years, not lost > 3 kg inprevious 3 months, seated pulse rate of ≤ 100beats/minute, seated DBP of ≤ 100 mmHg,hypertensives if stabilised with medication for6 months, ability to follow dietary adviceduring 2-week single-blind run-in periodassessed by 10-cm visual analogue questionscaleExclusion criteria: obesity of endocrineorigin, diabetes mellitus, people takinglaxatives, anorectic agents, diuretics (exceptwhere stabilised for ≥ 6 months), bulkingagents, antidepressants or any othermedication that may alter body weight, morethan borderline depression assessed byClinical Global Impressions questionnaire andBeck Depression InventoryGender: 390 women, 95 men Age (years): 41.8BMI (kg/m2): mean (SD) a: 32.9 (4.1), b: 32.7(3.3), c: 32.4 (3.5) Baseline comparability: yes
Timing of active intervention: a + b + c: 2-week single-blind placebo run-inperiod, 12 months with follow-up to 13months, contacted 15 times (baseline,monthly to month 12, then 1 week post-treatment and 1 month post-treatment)Description of intervention:a + b + c: all participants given standardiseddietary advice including diet sheets andadvised to include 12 oz (340 g) vegetablesand fresh fruit, 6 oz (170 g) bread, cereals,potatoes or rice, 10 oz (250 g) skimmed milkeach day; told to substitute fried foods withlow-calorie foods,a: 10 mg sibutramine once daily in themorningb: 15 mg sibutramine once daily in themorningc: placebo once daily in the morningAllocated: a: 161, b: 161, c: 163 Completed: a: 94, b: 82, c: 80 at 12 months % Dropout: a: 42%, b: 49%, c: 51% at 12 monthsAssessed: a: 154, b: 153, c: 157, at 12 months (for weight data, denominatorsvaried for other outcomes)
Length offollow-up: 13 monthsOutcomes:weight data, totalcholesterol, TGs,SBP, DBP, fastingplasma glucose,adverse events
SDs calculated,weight loss figuresin abstracts do notagree with maintrial report,presumed BPchanges are actualvalues rather thanpercentagesSponsorship:KnollPharmaceuticals
continued

Health Technology Assessm
ent2004; Vol. 8: No. 21
231
© Q
ueen’s Printer and Controller of H
MSO
2004. All rights reserved.
TABLE 19 Included sibutramine studies (cont’d)
Study ID Methods Participants Interventions Outcomes Notes
STORM, 2000 Randomisation: 3:1,computer-generated listmaintained centrally. Allocation concealment:AAssessor blinding: nodetails givenITT: yes for weightoutcome only
Location: 8 European specialist centresPeriod of study: before December 2000Inclusion criteria: either gender, 17–65years, BMI 30–45 kg/m2, lost 5% or moreinitial weight in 6-month open weightreduction phase with < 2 kg weight gainbetween months 4 and 5 or months 5 and 6,women of childbearing potential if usingadequate contraception, hypertensivepatients stabilised on therapy Exclusion criteria: endocrine-relatedobesity, recent weight changes (loss or gain> 4 kg in past 3 months), specified disease,e.g. myxoedema, Cushing’s syndrome,diabetes mellitus, significant neurological orpsychological illness such as epilepsy,schizophrenia or depression, or eatingdisorder such as bulimia, severe somaticdisease, hepatic or renal dysfunction, ahistory of heart failure, ischaemic heartdisease, stroke, transient ischaemic attacks orunstable hypertension (persistent DBP > 95 mmHg or pulse rate > 100beats/minute), those with significantabnormalities on ECG, patients on such drugsas anorectics, oral �-blockers, agonists suchas those used for treating asthma, steroids,thyroid preparations or diuretics for non-hypertensive purposes Gender: 390 women, 77 menAge (years): mean (SD) 40.6 (10.1)BMI (kg/m2): mean (SD) 36.6 (4.1)Baseline comparability: yes
Timing of active intervention: a + b: 18 months, contacted 19 times(baseline then monthly)Description of intervention: a + b: 6-month open pretreatment weightreduction phase consisting of 10 mgsibutramine daily plus 600 kcal/day deficit plus30 minutes’ daily extra walking plus advice onbehaviour modificationa: 10 mg sibutramine dailyb: placebo dailya + b: sibutramine (or placebo) increased to15 mg if > 1 kg weight regain occurred afterpretreatment phase or since last doseincrease providing dose stable for minimumof 2 months, if further weight increases doseincreased to maximum 20 mg daily, dosereduced by 5 mg each time if patient couldnot tolerate higher dose, activity andbehavioural advice, 600 kcal/day deficit(EE=RMRXPAL) consisting of 45–50% CHO,30% fat, 15–20% proteinAllocated: a: 352, b: 115Completed: a: 206, b: 57% Dropout: a: 59%, b: 50%Assessed: a: 222, b: 62 at 12 months forcholesterol, TGs, HbA1c and fasting plasmaglucose; a: 350, b: 114 at 12 months forweight data (ITT, LOCF)
Length offollow-up: 18 monthsOutcomes:weight data, totalcholesterol, LDLcholesterol, HDLcholesterol, TGs,HbA1c, fastingplasma glucose,adverse events,compliance
Mean change inrisk factoroutcomes at 12and 18 monthspostrandomisationcalculated fromactual values attime-points, SDsalso calculatedSponsorship:BASF Pharma partfunded
BP, blood pressure; ECG, electrocardogram; EE=RMRXPAL, energy expenditure = testing metabolic rate × physical activity level.
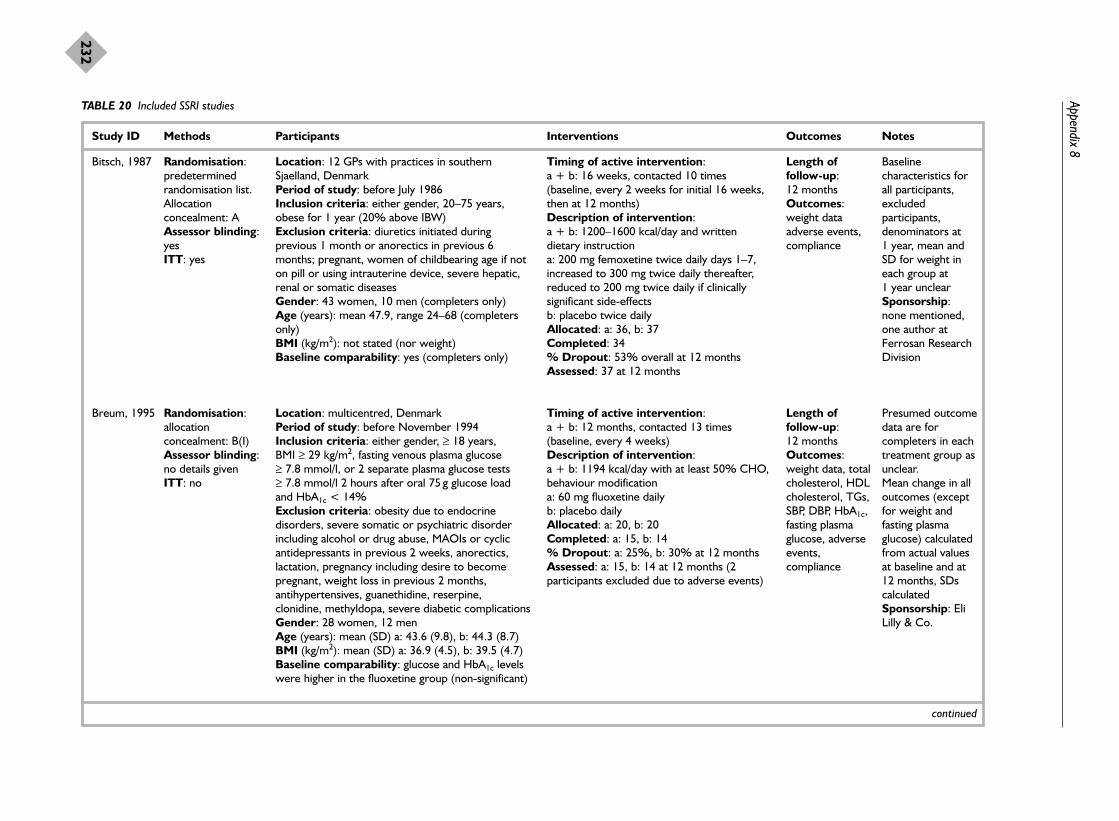
Appendix 8
232
TABLE 20 Included SSRI studies
Study ID Methods Participants Interventions Outcomes Notes
Bitsch, 1987 Randomisation:predeterminedrandomisation list.Allocationconcealment: AAssessor blinding:yes ITT: yes
Location: 12 GPs with practices in southernSjaelland, DenmarkPeriod of study: before July 1986Inclusion criteria: either gender, 20–75 years,obese for 1 year (20% above IBW)Exclusion criteria: diuretics initiated duringprevious 1 month or anorectics in previous 6months; pregnant, women of childbearing age if noton pill or using intrauterine device, severe hepatic,renal or somatic diseasesGender: 43 women, 10 men (completers only)Age (years): mean 47.9, range 24–68 (completersonly)BMI (kg/m2): not stated (nor weight)Baseline comparability: yes (completers only)
Timing of active intervention: a + b: 16 weeks, contacted 10 times(baseline, every 2 weeks for initial 16 weeks,then at 12 months)Description of intervention: a + b: 1200–1600 kcal/day and writtendietary instruction a: 200 mg femoxetine twice daily days 1–7,increased to 300 mg twice daily thereafter,reduced to 200 mg twice daily if clinicallysignificant side-effects b: placebo twice dailyAllocated: a: 36, b: 37Completed: 34 % Dropout: 53% overall at 12 monthsAssessed: 37 at 12 months
Length offollow-up: 12 monthsOutcomes:weight dataadverse events,compliance
Baselinecharacteristics forall participants,excludedparticipants,denominators at 1 year, mean andSD for weight ineach group at 1 year unclearSponsorship:none mentioned,one author atFerrosan ResearchDivision
Breum, 1995 Randomisation:allocationconcealment: B(I)Assessor blinding:no details givenITT: no
Location: multicentred, DenmarkPeriod of study: before November 1994Inclusion criteria: either gender, ≥ 18 years, BMI ≥ 29 kg/m2, fasting venous plasma glucose ≥ 7.8 mmol/l, or 2 separate plasma glucose tests≥ 7.8 mmol/l 2 hours after oral 75 g glucose loadand HbA1c < 14%Exclusion criteria: obesity due to endocrinedisorders, severe somatic or psychiatric disorderincluding alcohol or drug abuse, MAOIs or cyclicantidepressants in previous 2 weeks, anorectics,lactation, pregnancy including desire to becomepregnant, weight loss in previous 2 months,antihypertensives, guanethidine, reserpine,clonidine, methyldopa, severe diabetic complicationsGender: 28 women, 12 menAge (years): mean (SD) a: 43.6 (9.8), b: 44.3 (8.7)BMI (kg/m2): mean (SD) a: 36.9 (4.5), b: 39.5 (4.7)Baseline comparability: glucose and HbA1c levelswere higher in the fluoxetine group (non-significant)
Timing of active intervention: a + b: 12 months, contacted 13 times(baseline, every 4 weeks)Description of intervention: a + b: 1194 kcal/day with at least 50% CHO,behaviour modification a: 60 mg fluoxetine daily b: placebo dailyAllocated: a: 20, b: 20Completed: a: 15, b: 14% Dropout: a: 25%, b: 30% at 12 monthsAssessed: a: 15, b: 14 at 12 months (2participants excluded due to adverse events)
Length offollow-up: 12 monthsOutcomes:weight data, totalcholesterol, HDLcholesterol, TGs,SBP, DBP, HbA1c,fasting plasmaglucose, adverseevents,compliance
Presumed outcomedata are forcompleters in eachtreatment group asunclear.Mean change in alloutcomes (exceptfor weight andfasting plasmaglucose) calculatedfrom actual valuesat baseline and at12 months, SDscalculatedSponsorship: EliLilly & Co.
continued

Health Technology Assessm
ent2004; Vol. 8: No. 21
233
© Q
ueen’s Printer and Controller of H
MSO
2004. All rights reserved.
TABLE 20 Included SSRI studies (cont’d)
Study ID Methods Participants Interventions Outcomes Notes
O’Kane,1994
Randomisation:allocationconcealment: B(I)Assessor blinding:yesITT: no
Location: multicentre, 10 sites in USAPeriod of study: before August 1992Inclusion criteria: either gender, > 18 years, BMI≥ 25 kg/m2, must avoid pregnancyExclusion criteria: pregnancy/lactating, appetitesuppressants within past 2 weeks Gender: 366 women, 92 menAge (years): mean (SD) a: 43 (12), b: 43 (12)BMI (kg/m2): mean (SD) a: 36.2 (6.5), b: 35.8 (6.7)Baseline comparability: yes
Timing of active intervention: a + b: 12 months, contacted 12 times(baseline, biweekly weeks 0–8, monthly weeks9–20, every 2 months weeks 21–52)Description of intervention: a + b: participants given individual diets aimedto produce weight loss of 0.45 kg/week,nutrition, behavioural counselling and walkingprogrammea: 60 mg fluoxetine once daily b: placebo once dailyAllocated: a: 230, b: 228Completed: a: 99, b: 108 at 12 months% Dropout: a: 57%, b: 53% at 12 monthsAssessed: a: 99, b: 108 at 12 months(completers, a: excludes 6 participants whodiscontinued at final visit but had final weightmeasurement, b: includes 1 participant who didnot have weight measurement at final visit)a: 230, b: 228 at 12 months (ITT, LOCF,presumed no participants failed to return for 1postbaseline visit)
Length offollow-up: 12 monthsOutcomes:weight data,adverse events,compliance
Sponsorship: EliLilly and Co.
Goldstein,1994
Randomisation:allocationconcealment: B(I)Assessor blinding:no details givenITT: no
Location: diabetic clinic at Leeds General Infirmary,UKPeriod of study: before July 1993Inclusion criteria: either gender, BMI >30 kg/m2,no significant change in weight in prior 3 months,diagnosed with type 2 diabetes for ≥ 1 year and hadbeen prescribed weight reducing diets as part oftherapy, measurable fasting serum C peptide levels Exclusion criteria: clinicaldepression/antidepressant therapy Gender: 13 women, 6 menAge (years): mean (range) a: 59.6 (51–71), b: 54.9 (23–72)BMI (kg/m2): mean (range) a: 36.8 (30.7–53.0), b: 35.8 (30.1–43.2)Baseline comparability: yes
Timing of active intervention: a + b: 12 months, contacted 14 times(baseline, every 4 weeks)Description of intervention: a + b: prescribed weight reducing dietsa: 60 mg fluoxetine daily b: placebo dailyAllocated: a: 10, b: 10Completed: a: 7, b: 9 at 12 months% Dropout: a: 30%, b: 10% at 12 monthsAssessed: a: 7, b: 9 at 12 months, 1 subjectexcluded from fluoxetine group (a) withinfirst month as did not fulfil entry criteria
Length offollow-up: 12 monthsOutcomes:weight data, totalcholesterol, TGs,HbA1c, fastingplasma glucose,adverse events
Weight and riskfactor outcomespresented asmedian and IQRs,median assumedsimilar to mean andSDs calculatedfrom IQRsSponsorship: LillyIndustries
continued

Appendix 8
234
TABLE 20 Included SSRI studies (cont’d)
Study ID Methods Participants Interventions Outcomes Notes
Wadden,1995
Randomisation:allocationconcealment: B(I)Assessor blinding:no details givenITT: yes
Location: University of Pennsylvania School ofMedicine, Philadelphia, USAPeriod of study: before December 1994Inclusion criteria: women who had completed a26-week VLCD and behaviour therapy programmeand had lost ≥ 10% of initial weight then completeda medical evaluationExclusion criteria: medications affecting weight,appetite or energy expenditure, abnormal renal orhepatic function, severe psychiatric illness Gender: 53 womenAge (years): mean (SD) a: 41.7 (10.9), b: 42.4 (8.6)BMI (kg/m2): mean (SD) a: 29.2 (4.3), b: 30.7 (6.1)Baseline comparability: yes
Timing of active intervention: a + b: 54 weeks, contacted 29 times (baseline,weekly for first 4 weeks, then fortnightly toweek 54)Description of intervention: a + b: 26-week pretreatment phase of VLCDof 420/660/800 kcal/day plus behaviouraltherapy, then 1500–1800 kcal/day diet, ≤ 30%fat, exercise 3–4 times/week for 20–30minutes of walking/aerobic activity, identifyingand coping with high-risk situations, developingsupportive relationships, identifying maximumacceptable weight, learning to reverse smallweight gains a: 50–200 mg daily sertraline titrated in first 3 weeks then maintained to week 54b: placebo dailyAllocated: a: 26, b: 27Completed: a: 13, b: 17 at 12 months% Dropout: a: 50%, b: 63% at 12 monthsAssessed: a: 13, b: 17 at 12 months
Length offollow-up: 54 weeksOutcomes:weight data,adverse events
Sponsorship:Pfizer CentralResearch, NationalInstitute of MentalHealth
MAOI, monoamine oxidase inhibitor.

Health Technology Assessm
ent2004; Vol. 8: No. 21
235
© Q
ueen’s Printer and Controller of H
MSO
2004. All rights reserved.
TABLE 21 Included metformin studies
Study ID Methods Participants Interventions Outcomes Notes
BIGPRO 1,1991
Randomisation:double-blind,confidential balancedrandom lists used toallocate to everyparticipant’s numbermetformin or placebo. Allocation concealment:AAssessor blinding: nodetails givenITT: yes
Location: multicentre, hospital outpatientclinics in university hospitals in FrancePeriod of study: before December 1995Inclusion criteria: either gender, women40–60 years, men 35–60 years with highwaist–hip ratio (women = 0.8, men = 0.95)Exclusion criteria: ischaemic heart disease(or ECG abnormal on admission), diabetes(or diagnosed by WHO criteria on OGTT),serious chronic medical treatment, seriouslife-threatening medical conditions, chronictreatment by drug containing metformin or alipid-lowering drug, psychiatric disorders,impaired renal function (plasma creatinine> 130 �mol/l)Gender: 306 women, 151 menAge (years): median (range) 49 (36–65)BMI (kg/m2): geometric mean (95%tolerance limit) a: 33.3 (24.6–45.1), b: 33.0.(24–45.4)Baseline comparability: (available forcompleters only) 29% family history ofdiabetes in placebo group compared with19% in metformin-treated group
Timing of active intervention: 12 months, contacted 5 times (every 3 months)Description of intervention: a + b: diet and encouragement to takeregular moderate physical activity to reduceinsulin resistancea: 850 mg metformin twice daily b: placebo twice dailyAllocated: a: 227, b: 230Completed: a: 164, b: 160% Dropout: a: 28%, b: 31% at 12 monthsAssessed: a: 164, b: 160 at 12 months
Length offollow-up: 12 monthsOutcomes:weight data, totalcholesterol, LDLcholesterol, HDLcholesterol, TGs,SBP, DBP, fastingplasma glucosedeaths, newdiabetes,morbidity,adverse events,compliance
SDs calculatedfrom CIsSponsorship:LIPHAPharmaceuticalCo., NationalInstitute of Healthand MedicalResearch, NationalHealth Insurancefor Wage Earners
continued

Appendix 8
236
TABLE 21 Included metformin studies (cont’d)
Study ID Methods Participants Interventions Outcomes Notes
Teupe, 1991 Randomisation:allocation concealment:B(I)Assessor blinding: no ITT: no
Location: diabetes clinic, Bad Mergentheim,GermanyPeriod of study: before 1991Inclusion criteria: either gender, type 2diabetes with plasma glucose levels notnormalised (fasting 6.67–10.0 mmol/l, earlypostprandial 10.0–13.9 mmol/l) during 2 weeks’ inpatient care with intensive diettreatment (participants also belonged to anoverweight group receiving behaviouraltherapy at time of randomisation)Exclusion criteria: >70 years, creatinine>1.2 mg/100 ml, liver cirrhosis, ischaemic orwasting disease, acute severe diseases Gender: 60 women, 40 men Age (years): mean (SD) a: 51.5 (10.1), b: 56 (7.6) (at hospital entry, 14 days beforerandomisation)BMI (kg/m2): mean a: 31.57, b: 30.51 (athospital entry, 14 days before randomisation)Baseline comparability: yes
Timing of active intervention: a + b: 2 years, contacted minimum 19 times(baseline, week 6 and week 20, every 3 months until 2 years) Description of intervention:a + b: all participants received 14 days’inpatient hospital treatment consisting of astrong dietary regimen before randomisation;postrandomisation all participants givenindividually adapted written diet plans, dailycalorie reduction of ≥ 300 kcal, 50% intakefrom CHO, 6 meals daily; behavioural groupleader (psychologist) contacted participantsby letter and telephone at weeks 6 and 20;participants received telephone counsellingevery 3 months and asked to submit bloodsample for HbA1c (if > 10% rechecked after4 weeks, if still elevated then participanthospitalised for 5 days to check whetherreason was non-compliance or failure oftherapy); participants hospitalised at 1 yearand at 2 years for 2-day assessmentb: received maximum 1.7 g metformin dailyfrom baseline to 2 years Allocated: a: 50, b: 50 Completed: a: 33, b: 39 at 1 year; a: 25, b: 29 at 2 years% Dropout: a: 50%, b: 42% at 2 years Assessed: a: 29, b: 25 at years 1 and 2 (allparticipants with metabolic failures excludedfrom analyses)
Length offollow-up: 2 yearsOutcomes:weight data, totalcholesterol, TGs,HbA1c, MI,musculoskeletaladverse events,compliance
Change calculatedfrom actual values,SDs calculatedSponsorship:none mentioned
continued

Health Technology Assessm
ent2004; Vol. 8: No. 21
237
© Q
ueen’s Printer and Controller of H
MSO
2004. All rights reserved.
TABLE 21 Included metformin studies (cont’d)
Study ID Methods Participants Interventions Outcomes Notes
UKPDS, 1998 Randomisation:computer-generated,allocations in sealedopaque envelopes,check maintained onnumerical sequence,dates of opening andresults. Allocationconcealment: AAssessor blinding: nodetails givenITT: possibly
Location: multicentre, UK Period of study: 1977 onwardsInclusion criteria: either gender, 25–65years, newly diagnosed diabetes, 3 fastingplasma glucose levels mean value > 6 and< 15 mmol/l, if later mean of 3 consecutive 3-monthly fasting plasma glucose > 6 mmol/lwere randomised too; ≥ 120% above IBW(Metropolitan Life Insurance tables)Exclusion criteria: ketonuria > 3 mmol/l, MI in previous year, current angina or heartfailure, > 1 major vascular episode, serumcreatinine > 175 �mol/l, severe retinopathyrequiring photocoagulation, malignantincrease in BP, uncorrected endocrineabnormality, occupation not allowing insulin,severe concurrent illness requiring extensivesystemic treatment, inadequatecomprehensionGender: 403 women, 350 menAge (years): mean (SD) a: 53 (8), b: 53 (9) BMI (kg/m2): mean (SD) a: 31.6 (4.8), b: 31.8(4.9)Baseline comparability: yes
Timing of active intervention: a + b: median 10.7 years, contacted median44 times (baseline then 3 monthly or morefrequently) Description of intervention:a + b: all participants received adviceregarding prudent diet, 50% CHO, lowsaturated fat, moderate–high fibre, reducedenergy if obese and aiming for IBWa: maximum 1700 mg metformin at breakfast,850 mg at evening meal with aim to getfasting plasma glucose < 15 mmol/l, if fastingplasma glucose > 15 mmol/l the sulfonylureaadded then insulin added if control stillinadequateAllocated: a: 342, b: 411 Completed: a: 279, b: 309 at 5 years; a: 181,b: 200 at 10 years; a: 21, b: 22 at 15 years % Dropout: a: 18%, b: 25% at 5 years; a: 47%, b: 51% at 10 years; a: 94%, b: 95%at 15 yearsAssessed: a: 279, b: 309 at 5 years; a: 181, b: 200 at 10 years; a: 21, b: 22 at 15 years
Length offollow-up: 15 yearsOutcomes: totalmortality, deathsfrom CVD,deaths fromstroke, deathsfrom cancer,adverse events,HbA1c, fastingplasma glucose,weight data
Report of diet andmetformin armsonly of UKPDSMajorsponsorship: UKMedical ResearchCouncil, BritishDiabeticAssociation, UKDepartment ofHealth, NationalEye Institute,National Instituteof Digestive,Diabetes andKidney Disease inNational Institutesof Health, USA,British HeartFoundation, Novo-Nordisk, Bayer,Bristol MyersSquibb, Hoechst,Lilly, Lipha,Farmitalia CarloErba

Appendix 8
238
TABLE 22 Included acarbose studies
Study ID Methods Participants Interventions Outcomes Notes
Chiasson, 1994 Randomisation:allocation concealment:B(I)Assessor blinding: nodetails givenITT: no
Location: 7 hospitals in CanadaPeriod of study: before 1994Inclusion criteria: either gender, ≥ 18 years,BMI <40 (stable for 3 months), NIDDM = 6 months, HbA1c > 7% or > 6.5% (diabeticson diet alone), normal plasma creatinine andliver function tests, hypertensives if bloodpressure well controlled by antihypertensivemedication Exclusion criteria: gastrointestinal diseaseand/or medications likely to alter gut motilityor absorption, lactose intolerance, lipid-lowering agents, glucocorticoids, anydebilitating disease, thiazide diuretics or �-blockers for hypertension Gender: 143 women, 211 menAge (years): mean (SD) 57.4 (9.4)Weight (kg): mean (SEM) a: 84.5 (1.5) n = 130, b: 81.1 (1.3) n = 149Baseline comparability: yes
Timing of active intervention: 12 months, contacted 5 times (every 3 months)Description of intervention: a + b: 6 week pretreatment phase of placeboand weight maintaining dieta: 50 mg acarbose 3 times daily taken withfirst bite of each meal, titrated to 100 mg,then 200 mg 3 times daily during first 6months to achieve target 60-minutespostbreakfast plasma glucose level < 12 mmol/l, dose increased if postprandialplasma glucose > 10 mmol/l b: placebo 3 times dailyAllocated: a: 172, b: 182Completed: a: 125, b: 143% Dropout: a: 27%, b: 23% at 12 monthsAssessed: a: 149, b: 167 at 12 months(participants excluded if dropped out orrequired increase in concomitanthypoglycaemic medication in first 60 days)
Length offollow-up: 12 monthsOutcomes:Weight data,HbA1c, fastingplasma glucose, adverse events
Data for fastingplasma glucose andHbA1c onlypresented forsubgroups: dietalone (BMI28.8 kg/m2),metformin (BMI29.4 kg/m2),sulfonylurea (BMI27.8 kg/m2), insulin(BMI 30.2 kg/m2)Sponsorship:Miles Canada
continued

Health Technology Assessm
ent2004; Vol. 8: No. 21
239
© Q
ueen’s Printer and Controller of H
MSO
2004. All rights reserved.
TABLE 23 Included non-drug studies
Study ID Methods Participants Interventions Outcomes Notes
Black, 1984 Randomisation:allocation concealment:B(I)Assessor blinding: noITT: no
Location: Omaha and Oklahoma, USA Period of study: before November 1983Inclusion criteria: women, married, ≥ 10%overweight, husband signed statement ifrequested to attend, $11 deposit refunded onattendanceExclusion criteria: physiological or medicalproblems that would inhibit weight loss Gender: 36 women Age (years): mean: 35.1 overallWeight (kg): 77.3 overallBaseline comparability: yes
Timing of active intervention: a + b + c: 10 weeks with follow-up to 4 years, contacted 14 times (90-minuteintroductory baseline visit, then 10 weeklyvisits of 30–90 minutes’ duration, then at 1, 3and 4 years post-treatment (218 weeks intotal) Description of intervention:a + b + c: all participants received 90-minuteintroductory meeting and signed contract tocomplete daily food record and record ofnon-routine physical activity for 2 weeks, 4behavioural contracts written during 10weeks focusing on changing eating andexercise habitsa: participants attended alone, counsellornegotiated and co-signed contractsb: husbands attended as passive observersnot encouraged to help their wives,counsellor negotiated and co-signed contractsc: husbands attended and actively participatedin sessions, and contracts specified wayshusband could help their wives, spousenegotiated and co-signed contractsAllocated: a: 12, b: 12, c: 12 Completed: a: 11, b: 10, c: 11 at 62 weeks % Dropout: a: 8%, b: 17%, c: 8% at 62 weeksAssessed: a: 11, b: 10, c: 11 at 62 weeks
Length offollow-up: 4 yearsOutcome:weight data
Sponsorship:none mentioned
continued

Appendix 8
240
TABLE 23 Included non-drug studies (cont’d)
Study ID Methods Participants Interventions Outcomes Notes
Blonk, 1994 Randomisation:stratified by gender, nofurther details.Allocation concealment:B(I)Assessor blinding: noITT: yes
Location: University of Amsterdam, The Netherlands Period of study: before December 1993Inclusion criteria: Either gender, type 2diabetes (WHO), normal haematological,liver, kidney, thyroid function, BMI> 27 kg/m2
Exclusion criteria: history of angina, heartfailure, intermittent claudication, proliferativeretinopathy, subcutaneous insulin injections,diuretics, �-blocking agents, drugs forhyperlipidaemia and any other drugs that mayinfluence CHO metabolism, regular physicalexercise training Gender: 40 women, 20 men Age (years): median (range) a: 59 (42–69) n = 27, b: 58.5 (29–70) n = 26 BMI (kg/m2): median (range) a: 31.3(27.2–44.3) n = 27, b: 32.8 (27.9–45.8) n = 26Baseline comparability: yes
Timing of active intervention: a: 24 months, contacted 56 times (baselinethen 2-monthly dietitian visit, behaviouraltherapy sessions once a week for first 2months, then at 4, 8, 12, 16 and 20 weeks,exercise sessions twice a month duringmonths 3–6 and once a week during months9–12 and 15–18)b: 24 months, contacted 13 times (baselinethen every 2 months)Description of intervention:a + b: all participants underwent 3-monthrun-in before randomisation, seen 3 times formeasurements and twice by dietitian whoassessed 3-day food records, all participantsinstructed not to change their dietary habits;postrandomisation all participants receiveddietary education counselling programmeinvolving visits to the dietitian every 2 months, 500 kcal/day deficit (minimum1000 kcal/day), 50–55% CHO, 15% protein,30% fat (emphasising unsaturated fat), 25 gfibre and < 300 mg cholesterol/day;adherence assessed at each visit by dietaryrecorda: participants additionally receivedbehavioural modification strategies includingself-monitoring, stimulus control, self-reinforcement, cognitive restructuring andrelapse prevention training; participants alsoreceived exercise training of 30 minutes ofbicycle ergometer at 60–80% maximumheart rate and then 30 minutes of varioussports activitiesAllocated: a: 30, b: 30 Completed: a: 27, b: 26 at 24 months % Dropout: a: 10%, b: 13% at 24 monthsAssessed: a: 27, b: 26 at 24 months
Length offollow-up: 24 monthsOutcomes:weight data, totalcholesterol, TGs,SBP, DBP, HbA1c,adverse events
Author confirmedstudy participantswere randomlyallocated totreatment groups;median change inweight at 12, 18and 24 monthsderived fromgraphs assumedsimilar to mean,SDs calculatedSponsorship:Dutch DiabetesResearchFoundation
continued

Health Technology Assessm
ent2004; Vol. 8: No. 21
241
© Q
ueen’s Printer and Controller of H
MSO
2004. All rights reserved.
TABLE 23 Included non-drug studies (cont’d)
Study ID Methods Participants Interventions Outcomes Notes
Cohen, 1991 Randomisation:stratified by residencyyear and randomlyassigned, group status ofparticipant determinedby status of physician,cluster randomised.Allocation concealment:B(I)Assessor blinding: nodetailsITT: possibly
Location: Lawrenceville Family HealthCentre, Pittsburgh, USA Period of study: January 1987–1989Inclusion criteria: either gender, 20–75years, BMI ≥ 27.8 kg/m2 for men and ≥ 27.3 kg/m2 for women, average SBP ≥ 140 mmHg on ≥ 2 readings, or averageDBP > 90 mmHg on ≥ 2 readingsExclusion criteria: not stated Gender: 22 women, 8 men Age (years): mean: a: 59.3, b: 59.7 BMI (kg/m2): mean: a: 34.2, b: 34.0Baseline comparability: yes
Timing of active intervention: a: 12 months, contacted 13 times (baselinethen monthly)b: assessed 3 times (baseline, 6 and 12months)Description of intervention:a: physicians received special instruction andmaterials in weight reduction methods;reviewed diet of participant usingquestionnaire and suggested dietary changes,gave participant diet history sheet,information and advice sheet; advisedparticipants to reduce calorie content of dietand set short-term goals; used methods ofencouragement such as reinforcement, eachmonth reviewed participant’s previous day’sfood intakeb: participants received usual care, physiciansfree to refer patients for dietary advice orprovide advice themselves, but did notreceive any special weight reductioninstructions or materialsAllocated: a: 15, b: 15 Completed: a: 15, b: 15 at 12 months % Dropout: a: 0%, b: 0% at 12 monthsAssessed: a: 15, b: 15 at 12 months
Length offollow-up: 12 monthsOutcomes:weight data,change in numberofantihypertensivemedications
Cluster RCTSponsorship: St MargaretMemorial Hospital
continued

Appendix 8
242
TABLE 23 Included non-drug studies (cont’d)
Study ID Methods Participants Interventions Outcomes Notes
Cousins, 1992 Randomisation: 3 cohorts, 1 each year,stratified by weight, nofurther details.Allocation concealment:B(I)Assessor blinding: noITT: no
Location: Baylor College of Medicine,Houston, USA Period of study: before 1992Inclusion criteria: self-identifiedMexican–American women, 18–45years, 20–100% above IBW, marriedwith at least 1 preschool-aged child Exclusion criteria: hypertension (DBP ≥ 115 mmHg), diabetes (fasting plasmaglucose ≥ 140 mg/dl), chronic illnesswith diet or exercise recommendationsdifferent from those in the studyGender: 168 women Age (years): mean (SD) a: 33.6 (6.4),b: 33.8 (6.1), c: 33.8 (7.0) BMI (kg/m2): mean (SD) a: 31.7 (5.0),b: 30.3 (4.5), c: 31.6 (4.9)Baseline comparability: yes
Timing of active intervention: a + b: 12 months, contacted 37 times (baselinethen weekly group sessions and 6 monthly sessionsfor initial 24 weeks, then 6 monthly sessions up tomonth 12) c: unclear but presume contacted only at baselineand at 12 monthsDescription of intervention:a–c: all participants received ‘Cuidando el Corazon’,a bilingual manual consisting of a low-fat eating planand behaviour modification strategies; aimed at dietof 1200 kcal (women), 30% fat (10% unsaturatedfat), 20% protein, 50% CHO, < 300 mgcholesterol/day, advised regarding moderate sodiumintake, cookbook of recipes for fat-modifiedtraditional Mexican foods, behaviour modificationstrategies such as maintaining weight loss, problemsolving and preventing relapse were described insimple terms and manual translated into Spanisha: individualised instruction by bilingual dietitian onnutrition, feedback on food records and behaviourmodification techniques, group exercise, foodtasting, cooking demonstrations; last 6 monthsgroup leaders focused on preventing or minimisingrelapse and emphasised problem-solving approachto problems of low-fat eating and exercise, whereparticipants could enlist support of the group; taughtusing techniques specifically for adults with limitedliteracy skills b: same sessions as group a except that spousesencouraged to attend sessions (separate classes forchildren); manual modified to include information onpartner support and to encourage family changes ineating and exercise behaviours Allocated: 168 overall Completed: a: 32, b: 27, c: 27% Dropout: 49% overall at 12 monthsAssessed: a: 32, b: 27, c: 27
Length offollow-up: 12 monthsOutcome:weight data
Mean change inweight at 12months calculatedfrom actual values,SDs also calculatedSponsorship:none mentioned
continued
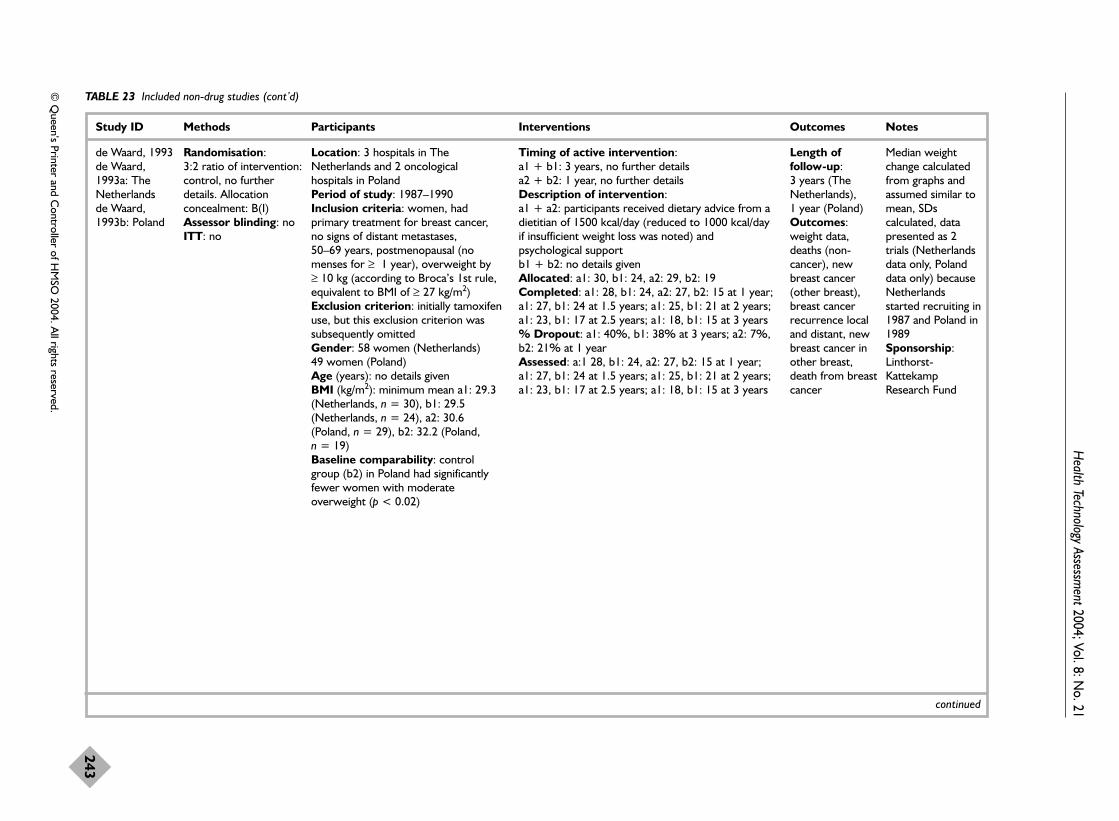
Health Technology Assessm
ent2004; Vol. 8: No. 21
243
© Q
ueen’s Printer and Controller of H
MSO
2004. All rights reserved.
TABLE 23 Included non-drug studies (cont’d)
Study ID Methods Participants Interventions Outcomes Notes
de Waard, 1993de Waard,1993a: TheNetherlands de Waard,1993b: Poland
Randomisation: 3:2 ratio of intervention:control, no furtherdetails. Allocationconcealment: B(I)Assessor blinding: noITT: no
Location: 3 hospitals in TheNetherlands and 2 oncologicalhospitals in Poland Period of study: 1987–1990Inclusion criteria: women, hadprimary treatment for breast cancer,no signs of distant metastases, 50–69 years, postmenopausal (nomenses for ≥ 1 year), overweight by≥ 10 kg (according to Broca’s 1st rule,equivalent to BMI of ≥ 27 kg/m2) Exclusion criterion: initially tamoxifenuse, but this exclusion criterion wassubsequently omitted Gender: 58 women (Netherlands) 49 women (Poland) Age (years): no details givenBMI (kg/m2): minimum mean a1: 29.3(Netherlands, n = 30), b1: 29.5(Netherlands, n = 24), a2: 30.6(Poland, n = 29), b2: 32.2 (Poland, n = 19)Baseline comparability: controlgroup (b2) in Poland had significantlyfewer women with moderateoverweight (p < 0.02)
Timing of active intervention: a1 + b1: 3 years, no further detailsa2 + b2: 1 year, no further details Description of intervention:a1 + a2: participants received dietary advice from adietitian of 1500 kcal/day (reduced to 1000 kcal/dayif insufficient weight loss was noted) andpsychological supportb1 + b2: no details givenAllocated: a1: 30, b1: 24, a2: 29, b2: 19Completed: a1: 28, b1: 24, a2: 27, b2: 15 at 1 year;a1: 27, b1: 24 at 1.5 years; a1: 25, b1: 21 at 2 years;a1: 23, b1: 17 at 2.5 years; a1: 18, b1: 15 at 3 years % Dropout: a1: 40%, b1: 38% at 3 years; a2: 7%,b2: 21% at 1 year Assessed: a:1 28, b1: 24, a2: 27, b2: 15 at 1 year;a1: 27, b1: 24 at 1.5 years; a1: 25, b1: 21 at 2 years;a1: 23, b1: 17 at 2.5 years; a1: 18, b1: 15 at 3 years
Length offollow-up: 3 years (TheNetherlands), 1 year (Poland)Outcomes:weight data,deaths (non-cancer), newbreast cancer(other breast),breast cancerrecurrence localand distant, newbreast cancer inother breast,death from breastcancer
Median weightchange calculatedfrom graphs andassumed similar tomean, SDscalculated, datapresented as 2trials (Netherlandsdata only, Polanddata only) becauseNetherlandsstarted recruiting in1987 and Poland in1989Sponsorship:Linthorst-KattekampResearch Fund
continued

Appendix 8
244
TABLE 23 Included non-drug studies (cont’d)
Study ID Methods Participants Interventions Outcomes Notes
DISH, 1985 Randomisation:stratified by clinicalcentre and obesity andrandomised beforeconsent, unbalancedrandomisation to favourmedication cessationgroups. Allocationconcealment: B(I)Assessor blinding: noITT: possibly
Location: multicentred, USA Period of study: before 1985Inclusion criteria: either gender, no SBP> 180 mmHg in past year, average DBP < 95 mmHg in past year, average of last 2DBP ≤ 90 mmHg and neither > 95 mmHg Exclusion criteria: congestive cardiac failure,ECG evidence of MI, stroke, transientischaemic attacks, creatinine ≥ 2.5 mg/dl onat least 2 occasions, personal problems,compliance with diet difficult, severealcoholism, pregnancy, �-blockers for angina,glucocorticoidsGender: 116 women, 60 men Age (years): mean a: 56.1, b: 57.2 Weight (kg): mean (SD) a: 86.0 (17.3), b: 89.8 (17.8)Baseline comparability: yes
Timing of active intervention: a: 56 weeks, contacted approximately 38times (baseline then every 2 weeks for initial16 weeks, then monthly to week 56, plus 8initial weekly nutritional visits, then monthlyto week 56) b: 56 weeks, contacted 20 times (baselinethen every 2 weeks for initial 16 weeks, thenmonthly to week 56)Description of intervention:a + b: all participants given standardisedstepped withdrawal of antihypertensivemedication during weeks 2–8; medicationrestarted if DBP 95–99 mmHg 3 times in 3 months, 100–104 mmHg twice in a monthor 105 mmHg at any timea: dietary intervention began 1–2 weekspostbaseline, aim for desirable weightaccording to Metropolitan Life Insurancestandards by decreasing calories and keepingelectrolytes constant, little emphasis onexerciseb: participants did not receive any dietaryinterventionAllocated: a: 87, b: 89 Completed: a: 67, b: 77 at 56 weeks % Dropout: a: 23%, b: 13% at 56 weeksAssessed: a: 67, b: 77 at 56 weeks
Length offollow-up: 56 weeksOutcomes:weight data,antihypertensionmedication status
Study also includeda continuemedication controland a no-medication sodiumrestriction group inobese populationSponsorship:National Heart,Lung and BloodInstitute, AyerstLaboratories,Merck Sharp &Dohme, Ciba-Geigy Corp.,BoehringerIngelheim, USVPharmaceuticalCorp., GD Searle& Co.
continued

Health Technology Assessm
ent2004; Vol. 8: No. 21
245
© Q
ueen’s Printer and Controller of H
MSO
2004. All rights reserved.
TABLE 23 Included non-drug studies (cont’d)
Study ID Methods Participants Interventions Outcomes Notes
FDPS, 2001 Randomisation:stratified by centre,gender and mean 2-hour plasma glucoseconcentration (7.8–9.4 mmol/l or9.5–11.0 mmol/l),randomly assigned bystudy physician with useof randomisation list.Allocation concealment:B(I)Assessor blinding:blinding statedITT: no
Location: 5 centres in Finland Period of study: 1993–2000Inclusion criteria: either gender, 40–65 years, BMI > 25 kg/m2, IGT (2-hourplasma glucose 7.8–11.0 mmol/l), OGTT 75 gwith a non-diabetic fasting glucoseconcentration (plasma glucose < 7.8 mmol/l),mean value of 2 OGTTs (less strict criteriaused in 1% or less of total number ofparticipants) Exclusion criteria: previous diagnosis ofdiabetes mellitus (other than gestationaldiabetes mellitus), people involved regularlyin vigorous exercise programme, participantsreceiving treatment to lower plasma glucose(other than routine dietary and healthadvice), chronic disease making 6-yearsurvival improbable, other medicalcharacteristics likely to interfere with studyparticipation, unbalanced clinical conditions,e.g. thyroid and liver diseaseGender: 350 women, 172 men Age (years): mean (SD): 55 (7)BMI (kg/m2): mean (SD) a: 31.3 (4.6), b: 31.0(4.5) Baseline comparability: significantdifference between groups regarding SBP(mmHg, SD): 136 (17) control group (b) vs140 (18) intervention group (a) (p = 0.03)
Timing of active intervention: a: 2–6 years, contacted at baseline, at 1–2 weeks, at 5–6 weeks then at 3, 4 and 6 months and every 3 months thereafter b: 2–6 years, contacted at baseline then atannual intervals Mean duration of follow-up was 3.2 years forall participantsDescription of intervention:a: participants informed at start of risk factorsfor diabetes, 3-day food diary at baselineprovided basis for dietary advice in secondsession, advised to reduce weight to goal ofBMI < 25 kg/m2 but in practice weighttargets were 5–10-kg weight loss; advised toconsume > 50% CHO, < 10% saturated fat,20% mono- and polyunsaturated fat or up to25% if surplus is from monounsaturated fat;< 300 mg/day cholesterol and 1 g protein/kgIBW per day, encouraged to increase fibreintake to 15 g/1000 kcal, encouraged to uselow-fat milk products, low-fat meat products,soft margarine and vegetable oil rich inmonounsaturated fatty acids (primarilyrapeseed oil); energy content re-evaluated ifno weight loss at visits, if no weight loss infirst 6–12 months and BMI > 30 kg/m2 aVLCD was considered (6–12-week durationwith group meetings every 1–2 weeks);dietary advice individually tailored and personresponsible for preparing meals in familyinvited to attend sessions (if not theparticipant), advice tailored to participant’seducational level, participants individuallyguided to increase endurance exercise(programme differed between study centres),also where possible there was a supervisedprogressive individually tailored circuit type
Length offollow-up: 2–6 years (mean3.2 years)Outcomes:weight data, totalcholesterol, HDLcholesterol, TGs,SBP, DBP, fastingplasma glucose,compliance, newdiagnoses ofdiabetes, deaths,cancer
22 participants hadVLCD in year 1and 25 in year 2 of3–8 weeks’duration and500–800 kcal/day;before finalinclusion criteriadecided 4%participantsincluded with 1abnormal OGTTonly, 6% includedbased on highplasma glucose(≥ 6.4 mmol/lfasting or randomsample after a fastof ≥ 4 hours)together with 1high 2-hour plasmaglucoseconcentration;authors contacted,reply receivedregarding numbersof participantsassessed, changesin blood pressureand lipids, caloriecontent of VLCD,causes of death andserious adverseevents includinggroup allocationSponsorship:Finnish Academy,Ministry of
continued

Appendix 8
246
TABLE 23 Included non-drug studies (cont’d)
Study ID Methods Participants Interventions Outcomes Notes
resistance training twice weekly, encouragedto perform 30 minutes of daily moderateexercise, 3-day food diary kept every 3months, 24-hour exercise diary kept every 3months and 12-month physical activity historycompleted on annual visit along with 2-kmwalking testb: at baseline participants advised to adjusttotal energy intake to reduce BMI to below25 kg/m2, also < 30% of energy intake fromfat, reduce alcohol intake and stop smoking,verbal and written dietary advice, verbalgeneral information regarding health benefitsof recreational exercise, additional routineadvice at yearly follow-up where 3-day foodrecord assessed and 2-km walking testperformedAllocated: a: 265, b: 257 Completed: a: 256, b: 250 at 1 year; a: 242,b: 240 at 2 years% Dropout: a: 8%, b: 6% at 2 years Assessed: a: 256, b: 250 at 1 year; a: 242, b: 240 at 2 years (1 participant excluded at 2 years confirmation of diabetes diagnosed atbaseline)
Education, NovoNordiskFoundation, YrjöJahnssonFoundation, FinnishDiabetes ResearchFoundation
continued

Health Technology Assessm
ent2004; Vol. 8: No. 21
247
© Q
ueen’s Printer and Controller of H
MSO
2004. All rights reserved.
TABLE 23 Included non-drug studies (cont’d)
Study ID Methods Participants Interventions Outcomes Notes
Foreyt, 1993 Randomisation:random numbers table,no other details.Allocation concealment:B(II)Assessor blinding: no ITT: no
Location: Houston, USA Period of study: before 1993Inclusion criteria: either gender, 25–45years, ≥ 14 kg overweight (Metropolitan LifeInsurance tables), not taking regular exercise,$100 deposit (refunded in incrementsaccording to number of sessions attended)Exclusion criteria: not stated Gender: 80 women, 85 men Age (years): not stated Weight (kg): mean (SD) a: 93.9 (20.8), b: 97.7 (22.0), c: 97.6 (25.5), d: 99.1 (16.4)Baseline comparability: no details given
Timing of active intervention: a + b + c: 12 months plus follow-up visit at2 years, contacted 24 times (baseline, thenweekly for 12 weeks, then fortnightly toweek 18, then monthly to week 48, then at 2 years) c: waiting list control for 12 weeks onlyDescription of intervention:a + c: Help Your Heart Eating Plan consistingof 30% fat, 50% CHO, 20% protein; energyintake adjusted so weight loss was < 1 kg/week, food diaries kept, contracts toreward behaviour change, stressmanagement, stimulus control and goalsetting based on Learn behavioural eatingprogrammea: advised to maintain sedentary lifestyleb + c: lectures focused on physical andpsychological benefits of exercise, taught awalking programme at an indoor track,graduated exercise with self-monitoringbased on heart rate, breathing and effort to‘vigorous’ but not ‘strenuous’ level; exerciseincreased to goal of 3–5 sessions of 45 minutes/weekb: advised to maintain current eating habitsAllocated: a: 42, b: 43, c: 42 Completed: a: 29, b: 30, c: 27 at 12 months;a: 15, b: 25, c: 21 at 2 years % Dropout: a: 64%, b: 40%, c: 50% at 2 years (only invited completers back at 2 years)Assessed: a: 29, b: 30, c: 27 at 12 months; a: 15, b: 25, c: 21 at 2 years
Length offollow-up: 2 yearsOutcome:weight data
Mean change inweight at 1 yearcalculated fromactual values, SDsalso calculated at 1 yearSponsorship:National Institutesof Health
continued
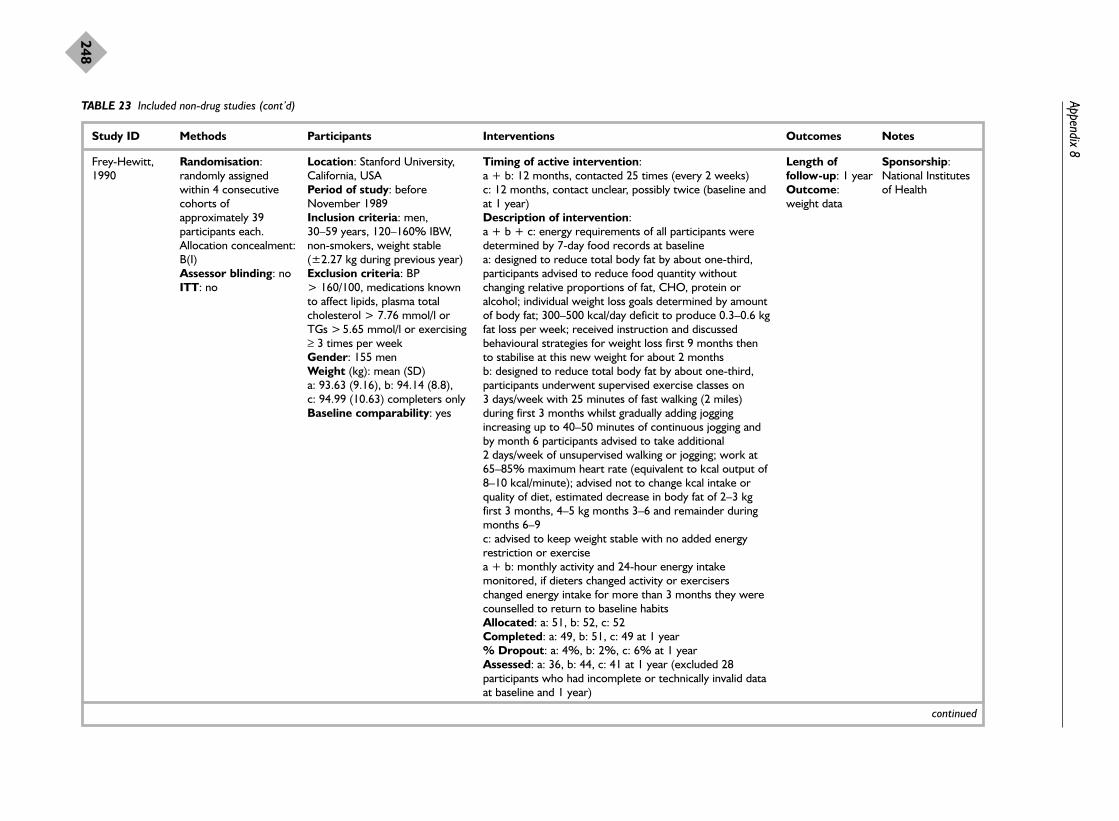
Appendix 8
248
TABLE 23 Included non-drug studies (cont’d)
Study ID Methods Participants Interventions Outcomes Notes
Frey-Hewitt,1990
Randomisation:randomly assignedwithin 4 consecutivecohorts ofapproximately 39participants each. Allocation concealment:B(I)Assessor blinding: no ITT: no
Location: Stanford University,California, USA Period of study: beforeNovember 1989Inclusion criteria: men, 30–59 years, 120–160% IBW,non-smokers, weight stable(±2.27 kg during previous year) Exclusion criteria: BP > 160/100, medications knownto affect lipids, plasma totalcholesterol > 7.76 mmol/l orTGs > 5.65 mmol/l or exercising≥ 3 times per weekGender: 155 men Weight (kg): mean (SD) a: 93.63 (9.16), b: 94.14 (8.8), c: 94.99 (10.63) completers onlyBaseline comparability: yes
Timing of active intervention: a + b: 12 months, contacted 25 times (every 2 weeks)c: 12 months, contact unclear, possibly twice (baseline andat 1 year) Description of intervention:a + b + c: energy requirements of all participants weredetermined by 7-day food records at baselinea: designed to reduce total body fat by about one-third,participants advised to reduce food quantity withoutchanging relative proportions of fat, CHO, protein oralcohol; individual weight loss goals determined by amountof body fat; 300–500 kcal/day deficit to produce 0.3–0.6 kgfat loss per week; received instruction and discussedbehavioural strategies for weight loss first 9 months thento stabilise at this new weight for about 2 months b: designed to reduce total body fat by about one-third,participants underwent supervised exercise classes on 3 days/week with 25 minutes of fast walking (2 miles)during first 3 months whilst gradually adding joggingincreasing up to 40–50 minutes of continuous jogging andby month 6 participants advised to take additional 2 days/week of unsupervised walking or jogging; work at65–85% maximum heart rate (equivalent to kcal output of8–10 kcal/minute); advised not to change kcal intake orquality of diet, estimated decrease in body fat of 2–3 kgfirst 3 months, 4–5 kg months 3–6 and remainder duringmonths 6–9c: advised to keep weight stable with no added energyrestriction or exercisea + b: monthly activity and 24-hour energy intakemonitored, if dieters changed activity or exerciserschanged energy intake for more than 3 months they werecounselled to return to baseline habitsAllocated: a: 51, b: 52, c: 52 Completed: a: 49, b: 51, c: 49 at 1 year % Dropout: a: 4%, b: 2%, c: 6% at 1 year Assessed: a: 36, b: 44, c: 41 at 1 year (excluded 28participants who had incomplete or technically invalid dataat baseline and 1 year)
Length offollow-up: 1 yearOutcome:weight data
Sponsorship:National Institutesof Health
continued

Health Technology Assessm
ent2004; Vol. 8: No. 21
249
© Q
ueen’s Printer and Controller of H
MSO
2004. All rights reserved.
TABLE 23 Included non-drug studies (cont’d)
Study ID Methods Participants Interventions Outcomes Notes
Hakala, 1989 Randomisation:randomly allocatedaccording to gender, ageand percentageoverweight. Allocationconcealment: B(I)Assessor blinding: noITT: yes
Location: RehabilitationResearch Centre of the SocialInsurance Institute, Turku,Finland Period of study: beforeDecember 1988Inclusion criteria: eithergender, 25–50 years, 30–50%overweight (Finnish AdultPopulation 1980) Exclusion criteria: limitingdiseases such as heart disease,essential hypertension, diabetesand other metabolic diseases;medical treatments Gender: 72 women, 28 men(completers only) Age (years): mean (SD) 38 (10)BMI (kg/m2): mean (SD) 34 (4)Baseline comparability: yes
Timing of active intervention: a + b: 10 weeks of intensive treatment, with follow-up to1 year, contacted 16 times (once a week for initial 10weeks then 5 sessions until end of 1 year) c: no treatment, contacted 3 times (baseline, 6 months and12 months)Description of intervention:a + b + c: all participants asked not to change physicalactivity and weekly exercise records completed atbaseline, 6 and 12 monthsa + b: participants received principally dietary counsellingbut also health and psychological counselling, withparticipants divided into 3 groups of 15 in each treatmentgroup; for initial intensive 10 weeks the principles of eachdiet taught by simple advice, food preparation examplesand demonstrations; included 3 lectures by a physician,psychologist and physiologist; food diaries completed, atstart of each group class each participant weighed and dietreviewed individually; participants advised to consume1200 kcal/day, low in fat and sugar, high in fibre andvegetables, and to use vegetable margarine instead ofbutter, 5 sessions after the initial 10 weeks were used formotivating and repeating instructionsa: lactovegetarian diet consisting of 20–25% protein,20–25% fat, 55–60% CHO, all low-fat milk products andhigher in vegetable content than group bb: mixed diet consisting of 25–30% protein, 25–30% fat,45–50% CHO, and moderate in meat, fish and eggsc: participants not given any advice, kept 4-day food diariesat baseline, 6 and 12 monthsAllocated: a: 46, b: 46, c: 44Completed: a: 31, b: 37, c: 42 at 1 year% Dropout: a: 33%, b: 20%, c: 5% at 1 yearAssessed: a: 31, b: 37, c: 42 at 1 year (ITT)
Length offollow-up: 1 year Outcomes:weight data, SBP,DBP (bloodpressureoutcomes forgroups a + bonly), compliance
Author providedlipid outcomesSponsorship:none mentioned
continued

Appendix 8
250
TABLE 23 Included non-drug studies (cont’d)
Study ID Methods Participants Interventions Outcomes Notes
Hakala, 1993 Randomisation:allocation concealment:B(I)Assessor blinding: noITT: yes
Location: RehabilitationResearch Centre of the SocialInsurance Institute, Turku,Finland Period of study: before May1992Inclusion criteria: eithergender, 22–54 years, > 50%overweight (Finnish AdultPopulation 1980), no seriouscardiovascular, metabolic orpsychiatric diseaseExclusion criteria:schizophrenia, hypothyroidism,cardiac failure Gender: 40 women, 20 men Age (years): mean (SD) 41 (8)BMI (kg/m2): mean (SD) 43 (5)Baseline comparability: yes
Timing of active intervention: a: 2 years, contacted 17 times (baseline, once a month inyear 1 and every 4 months in year 2, then at 5 years) b: 2 years, contacted 42 times (initial 2-week inpatient staythen weekly for 6 weeks, every other week for 10 months, then once a month in year 2, then at 5 years) Description of intervention:a + b: vitamin supplements recommended if weight loss> 10 kg in first 3 monthsa: individual counselling group consisting of 20 minutes ofindividual visits with same physician monthly for first 6months, advised on weight reduction with 1200 kcal/daydiet and physical activity, information given systematicallyin small portions, participants received information leaflets,counselling paid attention to personal characteristics,family relationships and working situation; after 6 monthsthe sessions concentrated on follow-up of body weightchanges and health status until end of year 2b: 2 week inpatient intensive group counselling treatmentin groups of 10, consisting of 15 hours of nutritioncounselling, behaviour modification, 15 hours of physicalactivation and training, 12 hours of occupational therapyand 1 hour of individual nutrition counselling; also includeda lecture and examination by a physician; participantsprovided with 1200 kcal/day diet of 4 low-fat, low-sugarmeals/day; nutrition education based on a mixed diet,group sessions after initial 2 weeks consisted of weight,group discussion, advice and motivation; participants alsogiven individual appointments with physician at 4-monthintervalsAllocated: a: 30, b: 30 Completed: a: 28, b: 30 at 1 year and at 2 years; a: 25, b: 28 at 5 years% Dropout: a: 7%, b: 0% at 1 year and at 2 years; a: 17%, b: 7% at 5 yearsAssessed: a: 28, b: 30 at 1 year and at 2 years: a: 25, b: 28at 5 years
Length offollow-up: 5 yearsOutcomes:weight data,compliance
Author providedweight outcomesby group, asreported by genderin each groupSponsorship:none mentioned
continued

Health Technology Assessm
ent2004; Vol. 8: No. 21
251
© Q
ueen’s Printer and Controller of H
MSO
2004. All rights reserved.
TABLE 23 Included non-drug studies (cont’d)
Study ID Methods Participants Interventions Outcomes Notes
Hankey, 2001 Randomisation:allocation concealment:B(I)Assessor blinding: noITT: yes
Location: Glasgow RoyalInfirmary, Glasgow, UK Period of study: beforeDecember 2001Inclusion criteria: eithergender, 35–75 years, survivedacute MI approximately 3 months before the study,participated in cardiacrehabilitation programmes at the2 study hospitals Exclusion criteria: not stated Gender: 10 women, 44 men Age (years): mean (range) a: 57(41–72), b: 57 (40–75) BMI (kg/m2): mean a: 28.6 (2.8),b: 30.4 (3.9)Baseline comparability: BMIappears different betweengroups
Timing of active intervention: a: 12 weeks with follow-up at 52 weeksb: assessed at baseline, 12 weeks and 52 weeksDescription of intervention:a + b: all participants received standard cardiacrehabilitation which included 1 group session of 30–60minutes with a dietitian and 12 practical exercise sessionsof approximately 30 minutes eacha: 4 × 1 hour sessions of individual dietary counsellingduring the initial 12 weeks which included weightmanagement advice, 600 kcal/day deficit and followingScottish dietary targetsAllocated: a: 28, b: 26 Completed: a: 25, b: 25 at 52 weeks % Dropout: a: 11%, b: 4% at 52 weeksAssessed: a: 25, b: 25 at 52 weeks
Length offollow-up: 52 weeksOutcomes:weight data,deaths
Author providedunpublished report,author providedcause of deaths andgroup allocation,details refer tosubgroup of studypopulation withBMI > 25 kg/m2,published reportweight loss differsSponsorship:Chief ScientistOffice of ScottishExecutive
continued
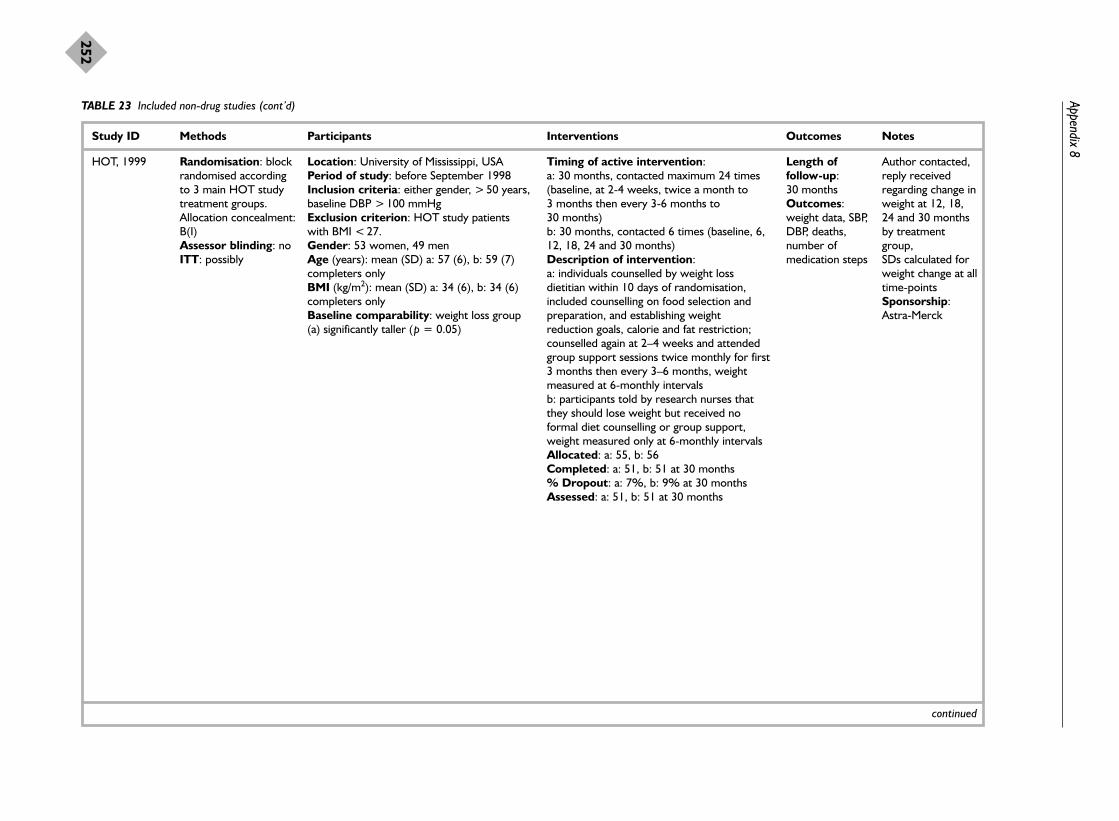
Appendix 8
252
TABLE 23 Included non-drug studies (cont’d)
Study ID Methods Participants Interventions Outcomes Notes
HOT, 1999 Randomisation: blockrandomised accordingto 3 main HOT studytreatment groups.Allocation concealment:B(I)Assessor blinding: noITT: possibly
Location: University of Mississippi, USA Period of study: before September 1998Inclusion criteria: either gender, > 50 years,baseline DBP > 100 mmHg Exclusion criterion: HOT study patientswith BMI < 27.Gender: 53 women, 49 men Age (years): mean (SD) a: 57 (6), b: 59 (7)completers onlyBMI (kg/m2): mean (SD) a: 34 (6), b: 34 (6)completers onlyBaseline comparability: weight loss group(a) significantly taller (p = 0.05)
Timing of active intervention: a: 30 months, contacted maximum 24 times(baseline, at 2-4 weeks, twice a month to 3 months then every 3-6 months to 30 months)b: 30 months, contacted 6 times (baseline, 6,12, 18, 24 and 30 months) Description of intervention:a: individuals counselled by weight lossdietitian within 10 days of randomisation,included counselling on food selection andpreparation, and establishing weightreduction goals, calorie and fat restriction;counselled again at 2–4 weeks and attendedgroup support sessions twice monthly for first3 months then every 3–6 months, weightmeasured at 6-monthly intervalsb: participants told by research nurses thatthey should lose weight but received noformal diet counselling or group support,weight measured only at 6-monthly intervalsAllocated: a: 55, b: 56 Completed: a: 51, b: 51 at 30 months % Dropout: a: 7%, b: 9% at 30 monthsAssessed: a: 51, b: 51 at 30 months
Length offollow-up: 30 monthsOutcomes:weight data, SBP,DBP, deaths,number ofmedication steps
Author contacted,reply receivedregarding change inweight at 12, 18,24 and 30 monthsby treatmentgroup,SDs calculated forweight change at alltime-pointsSponsorship:Astra-Merck
continued

Health Technology Assessm
ent2004; Vol. 8: No. 21
253
© Q
ueen’s Printer and Controller of H
MSO
2004. All rights reserved.
TABLE 23 Included non-drug studies (cont’d)
Study ID Methods Participants Interventions Outcomes Notes
HPT, 1990 Randomisation:stratified by BMI (BMI< 25 kg/m2 men; BMI< 23 kg/m2 women; orBMI 25/23–35 kg/m2
men and women),random allocation in 3distinct time intervals.Allocation concealment:B(I)Assessor blinding: yesITT: yes
Location: Universities of Alabama, California,Mississippi and Minnesota, USA Period of study: 1983–1989Inclusion criteria: either gender, 25–49years, BMI < 35 kg/m2 or < 150% IBW(Metropolitan Life Insurance tables), DBP≥ 76 mmHg or < 99 mmHg at first baselinevisit and DBP ≤ 89 mmHg at second visit(7–30 days later) Exclusion criteria: antihypertensivemedications or medication that may affectsodium metabolism, major chronic disease,CVD, BMI 35 kg/m2 or more, dietaryrequirements incompatible with dietarycounselling regimens, ≥ 21 alcoholicbeverages/week, perceived unable to complywith studyGender: 82 women, 169 men Age (years): mean a: 38.0, b: 39.5 BMI (kg/m2): mean a: 29.0, b: 28.0 Baseline comparability: unequal forgenders, 40.5% women in control group (b)vs 24.8% in intervention group (a)
Timing of active intervention: a: 3 years, contacted approximately 38 times(assessed 3 times at baseline then at clinicvisits other than those of treatment sessions,6 times at 6-monthly intervals, treatmentgroup sessions weekly for initial 10 weeks,every other week for next 4 weeks, thenevery other month to 3 years; participantsalso received periodic individual counsellingsessions) b: 3 years, contacted 10 times (assessed 3times at baseline then at 3, 6, 12, 18, 24, 30and 36 months) Description of intervention:a: calorie restriction dietary counsellingwhere individual goal was for participants toattain IBW and where group goal was toachieve a 5% reduction in mean body weight;participants recommended to include dailyservings of low-fat milk and diary products,choose fish, poultry or lean cuts of red meat,decrease use of fats in cooking and at thetable, decrease use of high-calorie desserts,snacks and beverages, limit use of alcohol anduse more fresh fruit and vegetables; dietarychange counselling related to meal planningand rationing, food purchase, label reading;included didactic presentation anddemonstrations, token incentives, bimonthlynewsletters and telephone calls if participantdid not attend group maintenance sessions,daily food records b: participants received no dietary counselling Allocated: a: 125, b: 126 Completed: a: 117, b: 113 at 3 years % Dropout: a: 6%, b: 10% at 3 years Assessed: a: 117, b: 113 at 3 years (ITT)
Length offollow-up: 3 yearsOutcomes:weight data, SBP,DBP, drugtreatmentrequired forhypertension,compliance,deaths
Sponsorship:National Heart,Lung, and BloodInstitute
continued

Appendix 8
254
TABLE 23 Included non-drug studies (cont’d)
Study ID Methods Participants Interventions Outcomes Notes
Jalkanen, 1991 Randomisation:allocation concealment:B(I)Assessor blinding: no ITT: possibly
Location: North Karelia, Finland Period of study: beforeDecember 1991Inclusion criteria: eithergender, 35–59 years, DBP ≥ 95 mmHg, BMI 27–34 kg/m2,attending hypertension clinic Exclusion criteria: not stated Gender: 19 women, 21 men Age (years): not stated Weight (kg): mean (SD) a: 86 (14), b: 80 (11)Baseline comparability:weight appears differentbetween groups at baseline
Timing of active intervention: a: 12 months, contacted 35 times (baseline then 1.5-hoursession weekly for first 6 months, then every 3 weeks fornext 6 months) b: contacted 5 times (at baseline then every 3 months formeasurements only)Description of intervention:a: 1000–1500 kcal/day diet, education on behaviourmodification and exercise, choice of food, medical aspectsof overweight and CVD risk factors, leaflets on reductionof salt and fat consumption and increase in exercise, 3 exercise sessions with physiotherapist, bicycle tripsorganised and free tickets for local swimming poolb: usual visit with nurse every 3 months, offered activetreatment at end of the study period, received no personalcounselling or advice Allocated: a: 25, b: 25Completed: a: 24, b: 25 at 12 months % Dropout: a: 4%, b: 0% at 12 months Assessed: a: 24, b: 25 at 12 months
Length offollow-up: 12 monthsOutcomes:weight data, totalcholesterol, HDLcholesterol, TGs,SBP, DBP
Mean change inweight and riskfactors at 12months calculatedfrom actual values,SDs also calculated,data show nochange in weight,HDL cholesteroland TGs at 12months in controlgroup bSponsorship:none mentioned
Jeffery, 1993 Randomisation:randomised withincentre and gender.Allocation concealment:B(I)Assessor blinding: noITT: yes
Location: University ofPittsburgh and University ofMinnesota, USAPeriod of study: before July1992Inclusion criteria: eithergender, 25–45 years, 14–32 kgoverweight, non-smokers, < 3 alcoholic drinks/day Exclusion criteria: specialdiets, food allergies, unable toexercise, current seriousdiseases, prescriptionmedications including oralcontraceptives Gender: not statedAge (years): mean a: 37.5,
Timing of active intervention: a + b + c + d: 18 months with follow-up at 30 months,contacted 79 times (baseline then weekly group sessionsto week 20, then monthly with weekly weigh-ins)e: contacted 5 times (baseline, and 6, 12, 18 and 30months)Description of intervention:a + b + c + d: group behavioural counselling includingweigh-in, presentations of information by interventionist,group discussion and a review of progress; participantsassigned to an individualised caloric goal of 1000 or 1500 kcal/day on basis of baseline body weight to produceestimated weight loss of 1 kg/week; participants selected aweight loss goal of 14, 18 or 23 kg, if goal reachedparticipants had caloric goals adjusted upwards to a levelestimated to maintain this body weight; primary dietaryinstruction emphasised importance of remaining below
Length offollow-up: 30 monthsOutcomes:weight data,compliance
Mean weightchange at 12, 18and 30 monthsderived fromgraph, SDscalculatedSponsorship:National Institutesof Health
continued

Health Technology Assessm
ent2004; Vol. 8: No. 21
255
© Q
ueen’s Printer and Controller of H
MSO
2004. All rights reserved.
TABLE 23 Included non-drug studies (cont’d)
Study ID Methods Participants Interventions Outcomes Notes
b: 38.5, c: 38.1, d: 37.6, e: 35.7BMI (kg/m2): mean a: 30.9, b:30.8, c: 31.1, d: 31.1, e: 31.1Baseline comparability: yes
caloric goals, restriction of fat and increased consumptionof complex CHO also stressed; participants initiallyinstructed to walk or cycle amount equivalent to 50 kcal/day for 5 days/week, gradually increased to finalgoal of 1000 kcal/week; daily food records kept for first 20 weeks and for 1 week each month thereafter, whichincluded exercise taken; behavioural techniques includedstimulus control, problem-solving strategies, socialassertion, short-term goal setting and reinforcementtechniques for enhancing motivation, cognitive strategiesfor replacing negative thinking with more positivestatements and constructive self-statements, relapseprevention and social supportb: participants given prepackaged meals for 5 breakfastsand 5 dinners each week for 18 months, meals preparedfor the calorie level specific to each participant (1000 or1500 kcal/day); breakfasts primarily consisted of cereal,milk, juice and fruit; dinners typically consisted of leanmeat, potato or rice and vegetable; for 1 or 2 days perweek a frozen dinner such as Weight Watchers or LeanCuisine was provided; participants also given meal plans,recipes and recommendations for lunchesc: participants received a cash payment each week basedon weight lost in relation to their weight loss goal;maximum payment $25/week if weight loss goal reachedand maintained, minimum $2.50/week if did not gainweight, weight loss of 50% goal reinforced with $12.50d: combination of all treatment groups described earlier;behavioural treatment plus food provision plus financialincentives.Allocated: a: 40, b: 40, c: 41, d: 41, e: 40Completed: 177 at 30 months% Dropout: 13% at 12 months, 15% at 18 months, 24%at 30 months (did not complete all visits) Assessed: a: 26, b: 36, c: 35, d: 34, e: 28 at 18 months(participants who attended all 3 follow-ups at 6, 12 and 18 months)
continued

Appendix 8
256
TABLE 23 Included non-drug studies (cont’d)
Study ID Methods Participants Interventions Outcomes Notes
Jones, 1986Jones, 1986c:behaviourtherapy given togroupJones, 1986d:behaviourtherapy given toindividual
Randomisation:allocation concealment:B(I)Assessor blinding: noITT: no
Location: Rochdale, UKPeriod of study: before 1986Inclusion criteria: women,≥ 18 years, judged suitable bydietitian Exclusion criteria: diabetes,pregnancyGender: 160 women Age (years): mean (SD) 50.3 (13.5) overallBMI (kg/m2): mean (SD) 35.1 (9.2) overallBaseline comparability: notstated
Timing of active intervention: a–h: 17 weeks with follow-up 12 months later (69 weeksin total), contacted 7 times (baseline then week 1, then 4 more sessions at 4-week intervals, then 12 months post-treatment) Description of intervention:a–h: all participants received individualised dietary adviceat first session, recommended 1000 kcal/day below energyrequirements but not less than 1000 kcal/day; (treatmentwas extended beyond 17 weeks if further involvementthought to be warranted)a: 4 group treatment sessions in small groups of 5–7 for 60 minutes eachb: participants seen individually for 10 minutes each sessionc: participants received leaflet at each 4 sessions regardingcue avoidance and food management, seen in groupformatd: participants received leaflet at each 4 sessions regardingcue avoidance and food management, seen individuallye: participants completed daily food diary which wasdiscussed at each of 4 sessions, seen in group formatf: participants completed daily food diary which wasdiscussed at each of 4 sessions, seen individuallyg: participants received same leaflet and completed samedaily food diaries, seen in group formath: participants received same leaflet and completed samedaily food diaries, seen individuallyAllocated: a: 17, b: 21, c: 20, d: 22, e: 19, f: 20, g: 20, h: 21Completed: a: 8, b: 9, c: 7, d: 7, e: 6, f: 6, g: 8, h: 7 at 69 weeks % Dropout: 64% overall at 69 weeksAssessed: a: 8, b: 9, c: 7, d: 7, e: 6, f: 6, g: 8, h: 7 at 69 weeks
Length offollow-up: 69 weeksOutcome:weight data
Only groups a, b, cand d used forcomparisonsSponsorship:none mentioned
continued

Health Technology Assessm
ent2004; Vol. 8: No. 21
257
© Q
ueen’s Printer and Controller of H
MSO
2004. All rights reserved.
TABLE 23 Included non-drug studies (cont’d)
Study ID Methods Participants Interventions Outcomes Notes
Kaplan, 1987 Randomisation:random assignment bygroup, no furtherdetails. Allocationconcealment: B(I)Assessor blinding: nodetails givenITT: possibly
Location: San Diego StateUniversity and University ofCalifornia, USA Period of study: before 1987Inclusion criteria: eithergender, confirmation of type 2diabetes by physician, 12-hourfasting plasma glucose > 3.63 mmol/l, $40 deposit,some of which was contingenton attendance in amountsranging from $1 to $10 Exclusion criteria: heartproblems or other diseases thatmay interfere with fullparticipation in the studyGender: 45 women, 32 men(gender unknown for 1participant who died in anaccident a few days after initialassessment) Age (years): mean (SD) a: 54.87(12.32), b: 53.81 (8.04), c: 56.96(8.95), d: 54.50 (8.83) n = 76 Weight (kg): mean (SD) a:83.87 (16.9), b: 89.21 (21.07), c: 92.05 (20.35), d: 92.16(21.78) n = 76Baseline comparability: yes
Timing of active intervention: a–d: 10 weeks with follow-up at 18 months, contacted 12 times (baseline then for 2-hour sessions weekly for first10 weeks, then at 18 months) Description of intervention:a + b: all participants received the exchange diet of 1200 kcal/day and an exercise prescriptiona: dietician explained exchange diet, consisted of 50%complex CHO, 20% protein and 30% fat; behaviouralmodification treatment programme was based on modernlearning theory and included goal identification, weeklyindividual feedback from eating behaviour diaries, cognitiverestructuring, methods for controlling food consumption,cue identification, identifying positive reinforcement andbrief relaxation strategies as an alternative method ofcoping with stressb: exercise-focused programme including goal setting, self-monitoring and target heart rates obtained from gradedexercise test and set at 60–70% maximum heart rate;exercise dairies were completed weekly and graphed,exercise leaders walked with the participants(recommended exercise for all but 1 participant) andconsisted of 20 minutes’ stretching, 45–60 minutes’walking and 5–10 minutes’ stretching from weeks 3 to 10;participants encouraged to perform these exercise sessionsat least 2 more times weekly and to attend other adultfitness programme sessions; 30 minutes’ exercise-focusedbehavioural group discussion followed the programmedexercise sessions, contracts formed in week 10 regardingmaintenance of exercisec: modified version of diet intervention received by groupa for the first 5 weeks, week 6 focused on exerciseinformation, and weeks 7–10 consisted of the exercise andbehaviour sessions received by group bd: 2-hour weekly presentations for first 10 weeks fromvarious healthcare specialists giving diabetes informationbut no specific information on behavioural changes,information given regarding behavioural therapy, but
Length offollow-up: 18 monthsOutcomes:weight data,HbA1c deaths,QoL, cost utilityanalysis
Sponsorship:National Institutesof Health
continued

Appendix 8
258
TABLE 23 Included non-drug studies (cont’d)
Study ID Methods Participants Interventions Outcomes Notes
participants did not experience any behavioural strategiesAllocated: 78 in totalCompleted: 70 in total at 18 months % Dropout: 10% overall at 18 monthsAssessed: unclear
Karvetti, 1992Karvetti, 1992a:womenKarvetti, 1992b:men
Randomisation:allocation concealment:B(I)Assessor blinding: noITT: possibly
Location: health centres, Turku,Finland Period of study: before March1992Inclusion criteria: eithergender, 17–65 years, BMI≥ 27 kg/m2
Exclusion criteria: diabetes orother disease that wouldprevent compliance withprogramme Gender: 127 women, 116 men Age (years): mean (SD) 48 (11)completersBMI (kg/m2): mean (SD) 34 (5)completersBaseline comparability: yes
Timing of active intervention: a: 6 weeks of intensive treatment, with follow-up to 1year, contacted 13 times (1.5-hour group session once aweek for initial 6 weeks, then 4 times at monthly intervals,then twice every second month to 1 year)b: no treatment, contacted twice (baseline and at 1 year)Description of intervention:a: participants divided into 8 subgroups of 12–18participants led by 7 trained public health nurses whoinstructed and motivated participants regarding weightreduction plan, nutrition education, physical activation,dietary, health and psychological counselling; initial 6-weekintensive course also included 3 separate lectures by aphysician, psychologist and physiologist to supportparticipants in weight reduction; participants advised toconsume 1200 kcal/day, low in fat and sugar, moderate inmilk products, cereals, meat and fish, high in vegetables; 3 meals a day plus snack in afternoon and eveningb: participants not given any instructions, informedselected for weight reduction course after assessment at 1 yearAllocated: a: 126, b: 117 Completed: a: 93, b: 96 at 1 year% Dropout: a: 26%, b: 18% at 1 yearAssessed: a: 93, b: 96 at 1 year
Length offollow-up: 1 year(treatment grouponly follow-up for7 years)Outcomes:weight data, totalcholesterol, HDLcholesterol, SBP,DBP, compliance
Author providedmean and SDchange in all riskfactors bytreatment groupSponsorship:none mentioned
continued

Health Technology Assessm
ent2004; Vol. 8: No. 21
259
© Q
ueen’s Printer and Controller of H
MSO
2004. All rights reserved.
TABLE 23 Included non-drug studies (cont’d)
Study ID Methods Participants Interventions Outcomes Notes
Laitinen, 1993Laitinen, 1993a:womenLaitinen, 1993b:men
Randomisation:allocation concealment:B(I)Assessor blinding: nodetails givenITT: possibly
Location: University Hospital,FinlandPeriod of study: before 1993Inclusion criteria: eithergender, 40–64 years, newlydiagnosed NIDDM (fastingplasma glucose ≥ 6.7 mmol/l inrepeated measurements)Exclusion criteria: not stated Gender: 37 women, 49 men Age (years): mean (SD) a: 50.7(7.7) men n = 21, 53.7 (6.3)women n = 19; b: 54.0 (6.6)men n = 28, 54.4 (6.4) womenn = 18 BMI (kg/m2): not stated bygroupWeight (kg): mean (SD) a: 88.3(14.1), b: 88.8 (14.0)Baseline comparability: yes
Timing of active intervention: a + b: 24 months, contacted 8 times (baseline, then at 2 monthly intervals for 12 months, then at 24 months)Description of intervention:a + b: all participants received basic diabetes educationduring 3 months before randomisationa: individually tailored diabetic diet, energy restricted with≤ 30% from fat (≤ 10% from saturated fatty acids, ≥ 20%from unsaturated fatty acids), ≤ 300 mg cholesterol/day,increased intake of unrefined CHO: food records;recommended exercise 3–4 times/week of 30–60 minuteseach session, of either walking, jogging, swimming, cyclingor skiing; exercise records, behaviour modification topics,e.g. what to do instead of eating and how to manageparties; goals were weight reduction, normoglycaemia,correction of dyslipidaemias and normalisation of elevatedblood pressureb: conventional routine diabetic treatmentAllocated: a: 40, b: 46 Completed: a: 40, b: 46 at 1 year; a: 38, b: 44 at 2 years% Dropout: a: 5%, b: 4% at 2 yearsAssessed: a: 40, b: 46 at 1 year; a: 38, b: 44 at 2 years
Length offollow-up: 2 yearsOutcomes:weight data, totalcholesterol, HDLcholesterol, TGs,SBP, DBP, HbA1c,fasting plasmaglucose, diabetescontrol
Weight only givenby gender at 2years, no dataavailable tocalculate BP changeat 2 years,denominators varybetween reportsSponsorship:Finnish Foundationfor DiabetesResearch, EmilAaltonenFoundation, theKyllikki and UoleviLehikoinenFoundation, NorthSavo Regional Fundof the FinnishCulturalFoundation
continued

Appendix 8
260
TABLE 23 Included non-drug studies (cont’d)
Study ID Methods Participants Interventions Outcomes Notes
Lindahl, 1999 Randomisation:allocation concealment:B(I)Assessor blinding: nodetails given ITT: no
Location: Umea University,Sweden Period of study: beforeDecember 1998 Inclusion criteria: eithergender, BMI > 27 kg/m2,abnormal OGTT Exclusion criteria: alreadytaken part in lifestylemodification programme, toophysically ill to participate Gender: 117 women, 69 men(total number of participantsincluded in analyses n = 186) Age (years): mean (SEM) a: 54.8(0.94), b: 56.2 (0.85) BMI (kg/m2): mean (SEM) a:31.0 (0.33), b: 30.2 (0.33)Baseline comparability: fastingglucose and TGs significantlylower in intervention group a (p = 0.0001, p = 0.04respectively) and interventiongroup b had a higher BMI(p = 0.06)
Timing of active intervention: a: 1 month with 4-day follow-up stay at 12 months (fullboard at a wellness centre for initial month) b: baseline and at 12 months Description of intervention:a: full board for initial month which included 140 hours ofscheduled activities including aerobic exercise of low tomoderate intensity for 2.5 hours daily; diet of 1800 kcal/dayfor men and 1500 kcal/day for women consisting of 20%intake from fat and high in fibre to produce a slow butpersistent weight decline; behavioural modificationstrategies included stress management and relapseprevention; no alcohol was permitted and participants werestrongly encouraged not to smoke; additional learningsession for 4 days at 12 monthsb: health survey and 30–60-minute counselling sessionwhich included oral and written advice on lifestyle changesregarding impaired glucose tolerance and obesity, repeatedat 12 monthsAllocated: a: 100, b: 94 Completed: a: 96, b: 94 at 12 months % Dropout: a: 4%, b: 0% at 12 monthsAssessed: a: 93, b: 93 at 12 months (not ITT)
Length offollow-up: 12 monthsOutcomes:weight data, totalcholesterol, TGs,SBP, DBP, fastingplasma glucose
Sponsorship:Swedish MedicalResearch Council,Swedish Council ofForestry andAgriculturalResearch, SwedishCouncil forPlanning and Co-ordination ofResearch, JointCommittee of theNorthern SwedenHealth CareRegion, the Heartand Chest Fund,Swedish PublicHealth Institute,VästerbottenCounty Council
continued

Health Technology Assessm
ent2004; Vol. 8: No. 21
261
© Q
ueen’s Printer and Controller of H
MSO
2004. All rights reserved.
TABLE 23 Included non-drug studies (cont’d)
Study ID Methods Participants Interventions Outcomes Notes
Long, 1983 Randomisation:allocation concealment:B(I)Assessor blinding: noITT: no
Location: outpatients,Coventry, UK Period of study: before 1983Inclusion criteria: women,18–60 years, BMI > 25 kg/m2
Exclusion criteria: expectantmothers, diabetes, preoperativepatients, began weight loss asinpatients, recent dramaticweight reduction Gender: 36 women Age (years): mean (range) 36.8(18–56) overallBMI (kg/m2): mean (range) 33.5(28.9–49.4) Baseline comparability: yes
Timing of active intervention: a + b + c: 16 weeks with follow-up to 1 year post-treatment, contacted 20 times (baseline then weekly for 16weeks then at 3, 6 and 12 months post-treatment)Description of intervention:a: advised regarding high-fibre diet tailored to give1000–1200 kcal/day, seen individually by dietitian for 45minutes initially then 15 × 15-minute sessions during initial16 weeks, advised on weight reducing diets, nutrition,commercial slimming foods, seasonal topics and weightmaintenanceb: 12 x 1-hour group sessions plus 4 brief 30-minute weigh-in sessions during initial 16 weeks; diet advice same asgroup a and also fostered high expectation of weight lossbased on group supportc: 12 x 90-minute sessions held weekly for first 16 weekswith dietitian and clinical psychologist plus 4 brief weigh-insessions; first 15–20 minutes of each group sessionparticipants given same diet advice as groups a and b;participants discussed application of behavioural strategiesbased on learning principles following each of 12 didacticsessions including self-monitoring, stimulus control, slowingrate of eating, generating social support, exercise, dietaryplanning, preplanning, individual problem solving,assertiveness and cognitive restructuringb + c: only average group weight loss reported to group,not individual weightsa + b + c: all participants received same advice regardingobesity, health, nutrition and weight reduction, toldsuccessful weight loss depended on reducing calorie intakeand/or increasing physical activityAllocated: a: 12, b: 12, c: 12 Completed: a: 7, b: 7, c: 9 at 68 weeks % Dropout: a: 42%, b: 42%, c: 25% at 68 weeksAssessed: a: 7, b: 7, c: 9 at 68 weeks
Length offollow-up: 68 weeksOutcome:weight data
Median weightchange at 12months assumedsimilar to mean andSDs calculatedSponsorship:none mentioned
continued

Appendix 8
262
TABLE 23 Included non-drug studies (cont’d)
Study ID Methods Participants Interventions Outcomes Notes
Murphy, 1982Murphy, 1982a:couple + 1-partycontracts vsindividual + 1-partycontractsMurphy, 1982b:couple + 2-partycontracts vsindividual + 2-partycontracts
Randomisation:couples randomlyassigned, no furtherdetails. Allocationconcealment: B(I)Assessor blinding: noITT: yes
Location: Baton Rougecommunity, USAPeriod of study: before January1982Inclusion criteria: marriedcouples, 20–80% above IBW(USDA 1969), spouse willing toattend all treatment sessions, nocontraindications for restrictingintake or increasing exercise(decided by physician)Exclusion criteria: no details Gender: 50 women, 25 men (n = 75, all participantsattending first session) Age (years): mean a: 35.3, b: 39.7, c: 42.3, d: 47.5, e: 42.0,f: 39.1 (n = 75)BMI (kg/m2): mean a: 31.50, b: 32.03, c: 29.94, d: 30.49, e: 31.97, f: 29.89 (n = 75)Baseline comparability: yes
Timing of active intervention: a + e: 10 weeks with follow-up to 4 years post-treatment,contacted 21 times (baseline then 11 x 1.5-hour sessions infirst 10 weeks, then at 12, 15, 18, 22, 29 and 36 weeks, 1 year, 2 years and 4 years post-treatment)f: 10 weeks, contacted 12 times (baseline then 11 × 1.5-hour sessions in first 10 weeks)Description of intervention:a: received treatment manual which focused on 3 meals perday and occasional snacks to reduce calorie intake(minimum 1000 kcal/day) and increasing calorieexpenditure through walking; participants attended aloneand entered into 4 contingency contracts regarding caloriesand nutrition, eating habits, exercise and problembehaviours; participants self-selected rewards andpunishmentsb: received same manual except for contingency contracts,attended alone, both participant and spouse agreedcontingency contracts and spouse encouraged to participateactively in assisting with compliance and controlling rewards(mutually rewarding and/or punishing)c: received identical manual to group a, attended withspouse, participant alone responsible for contingencycompliance, rewards and punishmentd: received identical manual to group b, both participantand spouse attended sessions and both took part incontingency contractse: attended alone, did not receive manual or enter intocontingency contracts, group support format with therapistacting as facilitator, discussed possible strategies forsuccessful weight lossf: waiting list control for initial 10 weeks only, no treatmentreceived, weight measured at week 1 and week 10Allocated: a: 19, b: 15, c: 14, d: 16, e: 15, f: 18 Completed: a: 4, b: 6, c: 4, d: 8, e: 6 at 1 year; a: 7, b: 7, c: 5, d: 8, e: 6 at 2 years; a: 4, b: 4, c: 5, d: 6, e: 6 at 4 years
Length offollow-up: 4 yearsOutcome: weightdata
SDs calculatedSponsorship:none mentioned
continued

Health Technology Assessm
ent2004; Vol. 8: No. 21
263
© Q
ueen’s Printer and Controller of H
MSO
2004. All rights reserved.
TABLE 23 Included non-drug studies (cont’d)
Study ID Methods Participants Interventions Outcomes Notes
% Dropout: a: 63%, b: 53%, c: 64%, d: 50%, e: 60% at2 years; a: 79%, b: 73%, c: 64%, d: 63%, e: 60% at 4 years Assessed: a: 4, b: 6, c: 4, d: 8, e: 6 at 1 year; a: 7, b: 7, c: 5, d: 8, e: 6 at 2 years; a: 4, b: 4, c: 5, d: 6, e: 6 at 4 years
Narayan, 1998 Randomisation:allocation concealment:B(I)Assessor blinding: noITT: no
Location: Pima Indians ofArizona, USA Period of study: before July1997Inclusion criteria: eithergender, 25–54 years, BMI≥ 27 kg/m2 (men), ≥ 25 kg/m2
(women), normoglycaemia (2-hour-plasma glucose < 7.8 mM)Exclusion criteria: pregnancy or intention to become pregnant,previous diagnosis of diabetes,current self-reported physicalactivity ≥ 20 hours/week,prescribed low-fat diet, anotherhousehold member alreadyrandomised to the study,evidence of ischaemic heartdisease, chronic illness, currentsteroid, thiazide or �-blockertreatment, condition likely tointerfere with informed consentGender: 72 women, 23 men Age (years): median a: 34, b: 33 BMI (kg/m2): median a: 36.5, b: 33.2Baseline comparability: fastingplasma glucose significantlyhigher in group a (p = 0.03)
Timing of active intervention: a: 52 weeks, contacted minimum 53 times (baseline thenweekly group meetings and home visits to week 52)b: 52 weeks, contacted 13 times (baseline then monthly toweek 52)Description of intervention:a: structured activity and nutritional interventionprogramme by an American Diabetes Association-recommended dietitian, decrease fat intake and alcoholintake, increase fibre and increase energy expenditure by700–1000 kcal/week by e.g. walking 10–12 hours/monthand keeping activity log; behavioural techniques includedrole playing, modelling and problem solving, food tastingand grocery store toursb: control group with self-directed learning with Pimaculture appreciation group meetings to discusscurrent/historical lifestyles, local speakers, participantscontributed to newsletters carrying Pima poetry, storiesand folklore; basic printed material regarding healthy eatingand exercise information, detailed interview of 40–120 minutes on health and lifestyleAllocated: a: 48, b: 47 Completed: a: 45, b: 45 at 52 weeks % Dropout: a: 4%, b: 6% at 52 weeksAssessed: a: 45, b: 45 at 52 weeks
Length offollow-up: 52 weeksOutcomes:weight data, totalcholesterol, TGs,SBP, DBP, fastingplasma glucose
Author confirmednumbers assessedin each group at 12 months,medians assumedsimilar to meansand SDs calculatedSponsorship: Community TaskForce, Gila RiverIndian Community
continued
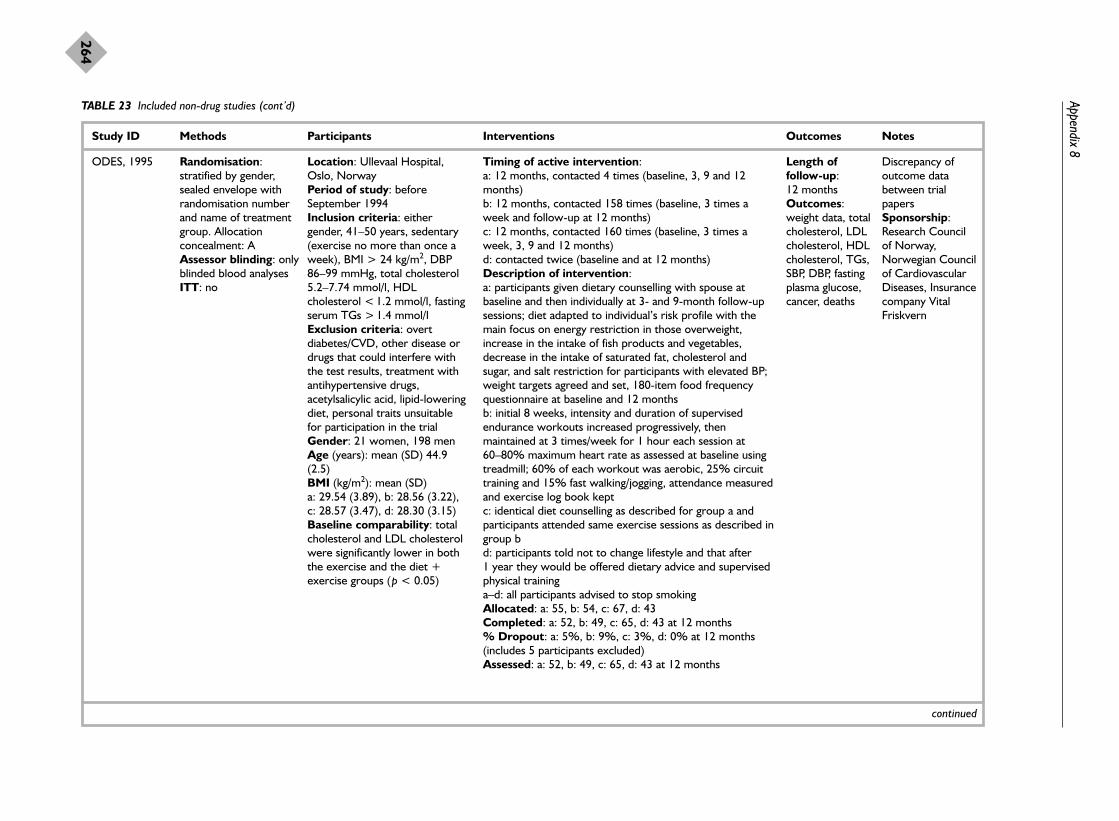
Appendix 8
264
TABLE 23 Included non-drug studies (cont’d)
Study ID Methods Participants Interventions Outcomes Notes
ODES, 1995 Randomisation:stratified by gender,sealed envelope withrandomisation numberand name of treatmentgroup. Allocationconcealment: AAssessor blinding: onlyblinded blood analyses ITT: no
Location: Ullevaal Hospital,Oslo, NorwayPeriod of study: beforeSeptember 1994Inclusion criteria: eithergender, 41–50 years, sedentary(exercise no more than once aweek), BMI > 24 kg/m2, DBP86–99 mmHg, total cholesterol5.2–7.74 mmol/l, HDLcholesterol < 1.2 mmol/l, fastingserum TGs > 1.4 mmol/lExclusion criteria: overtdiabetes/CVD, other disease ordrugs that could interfere withthe test results, treatment withantihypertensive drugs,acetylsalicylic acid, lipid-loweringdiet, personal traits unsuitablefor participation in the trialGender: 21 women, 198 men Age (years): mean (SD) 44.9(2.5)BMI (kg/m2): mean (SD) a: 29.54 (3.89), b: 28.56 (3.22),c: 28.57 (3.47), d: 28.30 (3.15) Baseline comparability: totalcholesterol and LDL cholesterolwere significantly lower in boththe exercise and the diet +exercise groups (p < 0.05)
Timing of active intervention: a: 12 months, contacted 4 times (baseline, 3, 9 and 12months)b: 12 months, contacted 158 times (baseline, 3 times aweek and follow-up at 12 months)c: 12 months, contacted 160 times (baseline, 3 times aweek, 3, 9 and 12 months) d: contacted twice (baseline and at 12 months) Description of intervention:a: participants given dietary counselling with spouse atbaseline and then individually at 3- and 9-month follow-upsessions; diet adapted to individual’s risk profile with themain focus on energy restriction in those overweight,increase in the intake of fish products and vegetables,decrease in the intake of saturated fat, cholesterol andsugar, and salt restriction for participants with elevated BP;weight targets agreed and set, 180-item food frequencyquestionnaire at baseline and 12 monthsb: initial 8 weeks, intensity and duration of supervisedendurance workouts increased progressively, thenmaintained at 3 times/week for 1 hour each session at60–80% maximum heart rate as assessed at baseline usingtreadmill; 60% of each workout was aerobic, 25% circuittraining and 15% fast walking/jogging, attendance measuredand exercise log book keptc: identical diet counselling as described for group a andparticipants attended same exercise sessions as described ingroup bd: participants told not to change lifestyle and that after 1 year they would be offered dietary advice and supervisedphysical traininga–d: all participants advised to stop smoking Allocated: a: 55, b: 54, c: 67, d: 43Completed: a: 52, b: 49, c: 65, d: 43 at 12 months % Dropout: a: 5%, b: 9%, c: 3%, d: 0% at 12 months(includes 5 participants excluded) Assessed: a: 52, b: 49, c: 65, d: 43 at 12 months
Length offollow-up: 12 monthsOutcomes:weight data, totalcholesterol, LDLcholesterol, HDLcholesterol, TGs,SBP, DBP, fastingplasma glucose,cancer, deaths
Discrepancy ofoutcome databetween trialpapersSponsorship:Research Councilof Norway,Norwegian Councilof CardiovascularDiseases, Insurancecompany VitalFriskvern
continued

Health Technology Assessm
ent2004; Vol. 8: No. 21
265
© Q
ueen’s Printer and Controller of H
MSO
2004. All rights reserved.
TABLE 23 Included non-drug studies (cont’d)
Study ID Methods Participants Interventions Outcomes Notes
Ost, 1976 Randomisation:allocation concealment:B(I)Assessor blinding: noITT: yes
Location: University of Uppsala,Sweden Period of study: before January1976Inclusion criteria: eithergender, ≥ 15% overweightExclusion criteria: not statedGender: 38 women, 7 men Age (years): mean 40.9 overall Weight (kg): mean (SD) a: 87.0(12.4), b: 86.6 (9.4), c: 81.5(16.1)Baseline comparability:significant difference at baselinein weight between groups a andc and groups b and c
Timing of active intervention: a: 16 weeks with follow-up at 68 weeks, contacted 22times (baseline then 30 minutes twice a week for 4 weeks,then weekly for 12 weeks, then at 68 weeks)b: 16 weeks with follow-up at 68 weeks, contacted 10times (baseline then 8 sessions in first 16 weeks, then at 68 weeks)c: assessed at baseline, 16 weeks and 68 weeksDescription of intervention:a + b + c: all participants received 45-minute baselinelecture on food and nutritiona: focus of first 4 sessions was behavioural therapyconsisting of situational control of overeating such as cueavoidance; focus of sessions 5–7 was 500 kcal/day deficitdiet with recommended food plan (based on foodexchanges) nearest to this value chosen (1000, 1200, 1500and 1800 kcal food plans), calorie count diary completed;focus of session 8 was to increase calorie expenditure andintroduction of regular physical exercise and a daily exerciserecord, diet and exercise designed to produce 0.7 kg ofweight loss per weekb: fenfluramine maximum 60 mg twice daily, nutrition andexercise advicec: waiting list control condition, participants told that theycould not receive treatment at moment due to largenumber of applicants and would receive treatment at alater dateAllocated: a: 15, b: 15, c: 15 Completed: a: 11, b: 11, c: 11 at 68 weeks % Dropout: a: 27%, b: 27%, c: 27% at 68 weeksAssessed: a: 11, b: 11, c: 11 at 68 weeks (ITT)
Length offollow-up: 68 weeksOutcome:weight data
Only groups a andc used forcomparisonsSponsorship:Swedish Councilfor Social ScienceResearch, Alfred EBenzon
continued

Appendix 8
266
TABLE 23 Included non-drug studies (cont’d)
Study ID Methods Participants Interventions Outcomes Notes
Pavlou, 1989 1Pavlou, 1989 1ca:PSMF + Ex vsLCD + Ex
Pavlou, 1989 1ce:PSMF + Ex vsVLCD (420 kcal) +Ex
Pavlou, 1989 1cg:PSMF+ Ex vsVLCD (800 kcal) +Ex
Pavlou, 1989 1db:PSMF vs LCD
Pavlou, 1989 1df:PSMF vs VLCD (420 kcal)
Pavlou, 1989 1dh:PSMF vs VLCD (800 kcal)
Pavlou, 1989 1ea:VLCD (420 kcal) +Ex vs LCD + Ex
Pavlou, 1989 1fb:VLCD (420 kcal) vsLCD
Pavlou, 1989 1ga:VLCD (800 kcal) +Ex vs LCD + Ex
Randomisation:allocationconcealment: B(I)Assessor blinding:noITT: possibly
Location: Boston University,USAPeriod of study: before 1989Inclusion criteria: men, 26–52years, euthyroid, free from anyphysical, psychological ormetabolic impairment Exclusion criteria: not statedGender: 160 menAge (years): mean (SD) a: 41.5(7.59), b: 42.9 (6.63), c: 45.1(10.0), d: 49.6 (8.4), e: 41.8(10.44), f: 41.8 (7.57), g: 46.1(9.33), h: 44.5 (9.6)(completers)BMI (kg/m2): mean a: 32.54, b: 32.4, c: 32.07, d: 31.5, e: 30.13, f: 34.82, g: 31.89, h: 33.78 (completers) Baseline comparability: yes
Timing of active intervention: a + b: 8 weeks plus 18 months post-treatment follow-up(weekly from baseline to week 8 then at 8 months and 18 months post-treatment) Description of intervention:a–h: all participants attended weekly educational sessions up to week 8 that included behaviour modification, diet andgeneral nutrition and exercise education; all participantsgiven multivitamins, daily food and activity record to week 8,non-caloric liquids including coffee were allowed inunrestricted amounts,a + b: BCDD where 1000 kcal/day selected from usual 4food groups in quantities thought to meet basic requirementsc + d: PSMF ketogenic diet of meat, fish and fowl used asonly dietary source to provide equivalent of 1.2 highbiological-value protein/kg of IBW or 1000 kcal/day, noCHO and all fat ingested came from meat, fish and fowl; 2.8 g potassium chloride dailye + f: DPC-70; assumed PSMF 420 kcal/day diet ofpowdered protein–CHO mix derived from calciumcaseinate, egg albumin and fructose dissolved in water orother non-caloric liquid, fat content zero, fortified withvitamins and minerals to meet US Recommended DailyAllowance, mix 5 packets per day in 850 g of non-caloricliquid and consume no other nutrients; 2.8 g potassiumchloride dailyg + h: DPC-800; assumed VLCD 800 kcal/day diet providedin powdered form to be consumed similarly to DPC-70,provided a complete mixture of nutrients and similarnutritionally to BCDD except for fewer caloriesa + c + e + g: 90-minute supervised exercise programme 3 times/week from baseline to week 8 which consisted of35–60 minutes of aerobic activity, e.g. walk–jog–run(70–85% max. heart rate), callisthenics and relaxationtechniquesb + d + f + h: participants to continue normal daily activityand not to participate in any form of additional supervisedand/or unsupervised physical activity during initial 8 weeks
Length offollow-up: 86 weeksOutcomes:weight data, totalcholesterol, HDLcholesterol, TGs,SBP, DBP
Weight dataderived from graphand SDs calculatedSponsorship: partfunded by SandozNutrition
continued

Health Technology Assessm
ent2004; Vol. 8: No. 21
267
© Q
ueen’s Printer and Controller of H
MSO
2004. All rights reserved.
TABLE 23 Included non-drug studies (cont’d)
Study ID Methods Participants Interventions Outcomes Notes
Pavlou, 1989 1hb:VLCD (800 kcal) vsLCD
Allocated: 160 Completed: a: 10, b: 11, c: 16, d: 16, e: 10, f: 13, g: 18, h: 16 at 18 months post-treatment% Dropout: 31% at 18 months post-treatmentAssessed: a: 10, b: 11, c: 16, d: 16, e: 10, f: 13, g: 18, h: 16at 18 months post-treatment (completers)
Pavlou, 1989 2Pavlou, 1989 2a: no ExPavlou, 1989 2b:Ex
Randomisation:allocationconcealment: B(I)Assessor blinding:noITT: possibly
Location: Boston University Period of study: before 1989Inclusion criteria: men, 26–52 years, euthyroid, freefrom any physical, psychologicalor metabolic impairment Exclusion criteria: not stated Gender: 24 menAge (years): mean (SD) a: 49.2(6.48), b: 44.8 (7.84), c: 46.1(5.14), d: 48.1 (4.65)(completers)BMI (kg/m2): mean a: 31.75, b: 31.92, c: 31.11, d: 30.4(completers)Baseline comparability: yes
Timing of active intervention: a + b: 12 weeks plus 36 months post-treatment follow-up,contacted 16 times (weekly from baseline to week 12, thenat 6, 8 and 18 months post-treatment) Description of intervention:a + b + c + d: all participants attended weekly educationalsessions up to week 12 that included behaviourmodification, diet and general nutrition and exerciseeducation; all participants given multivitamins, daily food andactivity record to week 12, non-caloric liquids includingcoffee were allowed in unrestricted amountsa + b: BCDD where 1000 kcal/day selected from usual 4food groups in quantities thought to meet basicrequirementsc + d: PSMF, ketogenic diet of meat, fish and fowl used asonly dietary source to provide equivalent of 1.2 highbiological-value protein/kg of IBW or 1000 kcal/day, noCHO and all fat ingested came from meat, fish and fowl; 2.8 g potassium chloride dailya + c: 90-minute supervised exercise programme 3times/week from baseline to week 12 which consisted of35–60 minutes of aerobic activity, e.g. walk–jog–run(70–85% max. heart rate), callisthenics and relaxationtechniquesb + d: participants to continue normal daily activity and notto participate in any form of additional supervised and/orunsupervised physical activity during initial 8 weeksAllocated: 24 overallCompleted: a: 5, b: 6, c: 5, d: 5 at 36 months post-treatment% Dropout: 13% at 36 months post-treatmentAssessed: a: 5, b: 6, c: 5, d: 5 at 36 months post-treatment
Length offollow-up: 168 weeksOutcome:weight data
Weight dataderived fromgraph, SDscalculatedSponsorship: partfunded by SandozNutrition
continued

Appendix 8
268
TABLE 23 Included non-drug studies (cont’d)
Study ID Methods Participants Interventions Outcomes Notes
Pearce, 1981 Randomisation:randomly assigned fromstratified blocks.Allocation concealment:B(I)Assessor blinding: nodetails givenITT: no
Location: University ofManitoba, Winnipeg, Canada Period of study: before July1980Inclusion criteria: women,20–60 years, ≥ 9 kg or ≥ 20%overweight (Metropolitan LifeInsurance tables), doctor’spermission, $50 depositrefunded on attendance of 9 outof 10 sessions and 3 follow-upsExclusion criteria: involvementin another weight controlprogramme or psychotherapy,obesity-related morbidity, e.g.diabetes, thyroid problems,colitis, ulcers, taking medicationthat affected water retention,appetite or metabolism,pregnant or planning pregnancy,unwilling to commit for 15months or unwilling to pay $50deposit, husbands unwilling toparticipateGender: 68 women Age (years): mean 39.0 overall Weight (kg): mean 87.43 overallBaseline comparability: notstated
Timing of active intervention: a + b: 12 months, contacted 14 times (baseline then weekly for initial 10 weeks, then at 3, 6 and 12 months) Description of intervention:a + b + c + d: advised to reduce calorie intake topretreatment weight × 7 in pounds (1350 kcal/day),minimum 1000 kcal/day, and advised to increase physicalactivity if weight not losta + b + c: training in behavioural self-control including self-monitoring, imagery techniques, stimulus control andbehaviour management methodsa: cooperative spouse condition, spouses attended andactively helped wives to lose weight, spouses monitoredeach other’s behaviourb: wives alone condition, spouses not involved and wivesattended alone, wife unobtrusively monitored husband’sbehaviourc: non-participating spouse condition, spouse sent letterasking them to detach themselves from wife’s weight losingefforts, wife attended alone and self-monitored andunobtrusively monitored husband’s behaviourd: focus directed at hypothetical and underlying causes ofovereating, no training on behavioural techniques, attentiondiverted from current behaviours to past onese: waiting list control, participants received treatment afterinitial 10 weeks (therefore data not used for subsequentanalyses)Allocated: a: 14, b: 13, c: 14, d: 13, e: 14 Completed: a: 12, b: 12, c: 12, d: 12 at 12 months % Dropout: a: 14%, b: 8%, c: 14%, d: 15% at 12 monthsAssessed: a: 12, b: 12, c: 12, d: 12 at 12 months
Length offollow-up: 12 months Outcome:weight data
Only groups a + bused forcomparisonSponsorship:none mentioned
Phenix, 1991 Randomisation: clusterrandomised, participantschose 1 of 7predetermined classtimes, each class timewas assigned 15
Location: California School ofProfessional Psychology, Fresno,USA Period of study: before 1990Inclusion criteria: women,18–62 years, 115–200% IBW
Timing of active intervention: a–f: 8 weeks and follow-up at 12 months, contacted 10 times (baseline, 2 hours each week for initial 8 weeks,then at 12 months)h: contacted at baseline and at 12 months for the purpose ofthis study (received same treatment as group g after acting
Length offollow-up: 12 monthsOutcome:weight data
Cluster RCTSponsorship:none given
continued

Health Technology Assessm
ent2004; Vol. 8: No. 21
269
© Q
ueen’s Printer and Controller of H
MSO
2004. All rights reserved.
TABLE 23 Included non-drug studies (cont’d)
Study ID Methods Participants Interventions Outcomes Notes
participants in a non-random manner, 7treatment conditionswere randomly assignedto 7 times. Allocationconcealment: B(I)Assessor blinding: no ITT: yes
(Metropolitan Life Insurancetables, 1959), non-refundable$10 materials fee, writtenapproval by own physician, $32deposit with refund contingenton attendance and adherenceExclusion criteria: participationin a weight loss programme,obesity-related health disorders,e.g. diabetes and heart disease;medications that would affectweight loss, pregnancy orplanning pregnancy in next 12monthsGender: 105 women Age (years): not statedWeight (kg): mean (SD) a: 85.16 (17.12), b: 81.12(14.61), c: 76.23 (10.69), d: 85.77 (14.28), e: 76.43 (8.71),f: 84.17 (22.35), g: 79.24(11.54), h: 75.97 (12.54) Baseline comparability: yes
as waiting list control for initial 8 weeks, details of which arenot reported) Description of intervention:a–f: all participants given nutrition education and advisedregarding 1000–1200 kcal/day diet consisting of 65%complex CHO, 20% fat, 15% protein and 100 mgcholesterol (American Heart Association diet)a: weekly food tasting for initial 8 weeks of treatmentb: overt behaviour therapy which focused on self-controlincluding self-monitoring strategies, stimulus control, cuereduction, slowing the rate of eating, coping and problemsolvingc: cognitive behaviour therapy which focused on modifyingmaladaptive eating behaviour, including cognitiverestructuring and relapse prevention techniquesd: given exercise education and home exercise assignmentsconsisting of 20 minutes of aerobic exercise 3 times/weekestimated to use 200–300 kcal per session using gradedintensity and working at 70–80% maximum heart ratee: same exercise as group d plus same overt behaviourtherapy as group bf: same exercise as groups d and e plus same cognitivebehaviour therapy as group cg: same exercise as groups d, e and f plus same overtbehaviour therapy as groups b and e plus same cognitivebehaviour therapy as groups c and fh: received baseline testing and assessment at 12 monthsand told would receive most successful active treatment ofthe trial after the initial 8 weeks; received same treatment atweek 9 as group g (results not reported)Allocated: 105 in total, numbers allocated to each group atbaseline not stateda: 12, b: 12, c: 12, d: 14, e: 10, f: 13, g: 11, h: 11 (total 95)at week 9Completed: a: 11, b: 11, c: 10, d: 13, e: 10, f: 11, g: 10, h: 10 at 12 months % Dropout: 18% at 12 months Assessed: a: 11, b: 11, c: 10, d: 13, e: 10, f: 11, g: 10, h: 10 at 12 months
continued

Appendix 8
270
TABLE 23 Included non-drug studies (cont’d)
Study ID Methods Participants Interventions Outcomes Notes
Pritchard, 1997 Randomisation:random numbers table.Allocation concealment:B(II)Assessor blinding: noITT: yes
Location: University ofMelbourne, Australia Period of study: before 1998Inclusion criteria: men, 35–55years, satisfactory cardiovascularfitness test, BMI 26–35 kg/m2,110–130% above IBW,otherwise healthyExclusion criteria: not statedGender: 66 men Age (years): mean (SD) a: 43.6(6.0), b: 44.9 (6.5), c: 42.3 (4.5)12-month completers only (n = 58)BMI (kg/m2): mean (SD) a: 29.0(2.8), b: 29.2 (2.8), c: 28.6 (2.8)12-month completers only (n = 58)Baseline comparability: yes
Timing of active intervention: a + b: 18 months, contacted 19 times (baseline thenmonthly, participants also encouraged to attend bimonthlymotivational group breakfasts or lunch meetings with guestspeakers or videos relevant to diet, exercise and healthissues)Description of intervention:a: participants advised to adhere to low-fat intake of22–25%/day and 500 kcal/day deficit, to avoid all foods richin fat, discouraged from eating more than 1 sweet/day andmore than 2 alcoholic drinks/day; personalised dietary plandesigned to meet Recommended Daily Intake for use inAustralia, given ‘The Weight Loss Guide’ by the AustralianHeart Foundation, exercise restricted to prestudy level,completion of daily adherence calendar, at 13 monthstreatment b was addedb: participants selected their own unsupervised aerobicexercise regimen of at least 3 sessions of 30 minutes eachweek at 65–75% maximum heart rate; initial heart rateover 33 hours of normal activity which included theselected exercise used to determine personal heart ratetarget zone; 11 participants walked, 2 jogged, 2 alternatedjogging and swimming, 3 attended the gym and 3 rodeexercise bikes, participants exercised 3–7 sessions/week,advised to avoid change in food intake, completion of dailyadherence calendar, at 13 months treatment a was addedc: attended monthly weight monitoring sessions wherecounselled to follow usual food and exercise habits,participants told would be able to enter weight lossprogramme at the end of this study, at 13 monthstreatments a + b were addedAllocated: a: 24, b: 22, c: 20 Completed: a: 18, b: 21, c: 19 at 12 months % Dropout: a: 25%, b: 5%, c: 5% at 12 monthsContinued at month 13: a: 9, b: 14, c: 16Completed: a: 9, b: 14, c: 16Assessed: a: 18, b: 21, c: 19 at 12 months; a: 9, b: 14, c: 16at 18 months
Length offollow-up: 18 monthsOutcome:weight data
Author providedunpublished report,data only used upto 12 months,discrepancy in databetween reportsSponsorship:Victorian HealthPromotionFoundation,William BucklandFoundation,Department ofMedicine,University ofMelbourne
continued

Health Technology Assessm
ent2004; Vol. 8: No. 21
271
© Q
ueen’s Printer and Controller of H
MSO
2004. All rights reserved.
TABLE 23 Included non-drug studies (cont’d)
Study ID Methods Participants Interventions Outcomes Notes
Pritchard, 1999Pritchard,1999a: dietitianvs controlPritchard,1999b: doctor+ dietitian vscontrol
Randomisation:random numbers tablesAllocation concealment:B(II)Assessor blinding: no ITT: yes
Location: University generalpractice, Lockridge, WesternAustralia Period of study: November1992–May 1994Inclusion criteria: eithergender, 25–65 years, patientswith known history of type 2diabetes, hypertension (BP> 140/90 mmHg at screeningplus 2 similar recordings in pastmedical notes) and/oroverweight (BMI > 25 kg/m2) Exclusion criteria: mentalillness, intellectual handicap,terminal illness, acute illness,pregnancy, taking part in otherhealth education programmes Gender: 198 women, 75 men Age (years): 199 of 273participants < 50 years Weight (kg): mean a: 91.7, b: 85.5, c: 89.1Baseline comparability: yes
Timing of active intervention: a + b: 12 months, contacted 7 times (baseline then 6times by dietitian spread evenly over 12 months)c: contacted twice (baseline and 12 months)Description of intervention:a + b: counselling focused on principles of good nutritionand exercise and addressed problem areas in lifestyle anddietary patterns; counselled on food, shopping andcooking, food selection, meal planning and exerciseprogrammes, advised to complete food records and diethistory, advised to reduce total energy intake and toreduce intake from fat to ≤ 30%, CHO ≥ 50% and 20%protein; participants discouraged from smoking and tohave 2 or more alcohol-free days/week with no more than2 alcoholic standard drinks/day for women and 4 for menb: in addition participants were seen by GP at baseline andsaw same GP on 2 other occasions during the 12 monthsfor 5 minutes each time to encourage and monitor theparticipantc: participants received results of initial screeningmeasurements and advised that queries were to bediscussed with doctor at appointment, participantsreceived their usual care by GP but did not receive anycounselling by dietitian, mailed to reattend at 12 monthsAllocated: a: 92, b: 88, c: 90 Completed: a: 65, b: 48, c: 64 at 12 months % Dropout: a: 29%, b: 45%, c: 29% at 12 months (p = 0.022 for group b vs other groups) Assessed: a: 92, b: 88, c: 90 at 12 months
Length offollow-up: 12 monthsOutcomes:weight data,HbA1c (type 2diabetics only),BP (hypertensivesonly), costs
Sponsorship:Western AustralianHealth PromotionFoundation
continued

Appendix 8
272
TABLE 23 Included non-drug studies (cont’d)
Study ID Methods Participants Interventions Outcomes Notes
Rosenthal, 1980 Randomisation:stratified blocks of %overweight and age, noother details. Allocationconcealment: B(I)Assessor blinding: no ITT: yes
Location: University ofConnecticut, USA Period of study: before 1980Inclusion criteria: women,≥ 10% above IBW(Metropolitan Life Insurancetables, 1970), husband and wifeboth willing to attend meetingsevery 2 weeks, willing to complywith demands of the weight lossprogramme, $10 commitmentdeposit (returned at first follow-up visit), signed medical releaseform certifying good health,signed form stating will notparticipate in concurrent obesitytherapyExclusion criteria: not stated Gender: 43 women Age (years): mean 34.5 overall BMI (kg/m2): mean a: 27.56, b: 29.29, c: 28.80 (mean BMI for groups a + b:28.43)Baseline comparability: yes
Timing of active intervention: a + b + c: 30 weeks, contacted 11 times (baseline then 8 × 75-minute group sessions twice monthly, follow-up at6 weeks post-treatment and 3 years post-treatment) Description of intervention:a: husbands attended all 8 sessions with wives, ‘Slimchance in a fat world’ weight loss programme, husbandsassigned readings and informed of behavioural ways inwhich they could help their wives to lose weight; sessions5–8 discussed couples’ specific situationsb: husbands attended first 4 sessions to learn techniquesfor helping their wives to lose weight, then wives attendedalone for following sessions, identical weight lossprogramme to group ac: no husband involvement, identical weight lossprogramme to groups a and bAllocated: unclear Completed: a: 4, b: 7, c: 9 at 3 years post-treatment (186weeks in total) % Dropout: 53% overall at 3 years post-treatmentAssessed: a: 4, b: 7, c: 9 at 3 years post-treatment
Length offollow-up: 186 weeksOutcome:weight data
Data combined formean change inweight at 3 yearspost-treatment forgroups a + b (fullhusbandinvolvement andpartial husbandinvolvement,respectively) as nosignificantdifference inweight loss foundbetween these 2 groups at 30 weeks,SDs calculatedSponsorship:National ScienceFoundation
continued

Health Technology Assessm
ent2004; Vol. 8: No. 21
273
© Q
ueen’s Printer and Controller of H
MSO
2004. All rights reserved.
TABLE 23 Included non-drug studies (cont’d)
Study ID Methods Participants Interventions Outcomes Notes
Shah, 1996 Randomisation:allocation concealment:B(I)Assessor blinding: no ITT: no
Location: University ofMinnesota, USA Period of study: before 1996Inclusion criteria: healthy, non-smoking women, 25–45 years,20–40% above IBW Exclusion criteria: not stated Gender: 122 women Age (years): not stated Weight (kg): mean (SD) a: 79.92 (4.45), b: 79.70 (4.40)Baseline comparability: yes
Timing of active intervention: a + b: 26 weeks plus follow-up visit at 12 months,contacted 18 times (baseline, then 16 times in first 26 weeks, then at 12 months) Description of intervention:a + b: all participants counselled on diet, exercise, menuplanning, eating out, stimulus control, problem solving,social assertion, goal setting, relapse prevention; cookingdemonstrations given, all participants advised to walk for30 minutes on 5 days/week, all participants advised tokeep a daily record of food intake and physical activitya: 1000–1200 kcal/day, fat intake ≤ 30% of total energyintake, ≤ 6 oz (170 g) meat/day (only poultry, fish and leanred meat), limit fats, oils, eggs and high-fat desserts, snacksand dairy produce, and replace with low-fat alternatives,increase complex CHO and limit simple sugarsb: reduce fat intake to 20 g/day, unlimited complex CHO,limit meat, fish and poultry to ≤ 2 oz (57 g)/day, specificfood recommendations otherwise the same as group aAllocated: 122 in totalCompleted: a: 39, b: 36 at 12 months % Dropout: 39% overall at 12 months Assessed: a: 39, b: 36 at 12 months
Length offollow-up: 12 monthsOutcomes:weight data, QoL
Mean change inweight at 12months calculatedfrom actual values,SDs calculatedSponsorship:National Institutesof Health
continued

Appendix 8
274
TABLE 23 Included non-drug studies (cont’d)
Study ID Methods Participants Interventions Outcomes Notes
Sikand, 1988 Randomisation:allocation concealment:B(I)Assessor blinding: no ITT: yes
Location: Baylor College ofMedicine, Houston, USAPeriod of study: before April1988Inclusion criteria: women,21–60 years, obeseExclusion criteria: not statedGender: 30 women Age (years): mean (SD) a: 39.8(9.1), b: 37.8 (8.4) Weight (kg): mean (SD) a: 105.6 (23.6), b: 106.6 (15.2)Baseline comparability: yes
Timing of active intervention: a: 4 months, with telephone follow-up at 2 years, contacted34 times (baseline, twice weekly for initial 4 months, thenat 2 years)b: 4 months, with telephone follow-up at 2 years,contacted 18 times (baseline, weekly for initial 4 months,then at 2 years)Description of intervention:a + b: all participants placed on a VLCD (calorie contentnot given) consisting solely of milk-based protein powderfor initial 4 months, received nutritional counselling, groupsupport and discussion of behaviour modification strategies;all participants invited to an ongoing pay-for-serviceprogramme offered at clinic sponsoring the study afteractive treatment perioda: received structured aerobic exercise programme twiceweekly for first 4 months with additional exerciseencouraged on other daysb: participants neither encouraged to nor discouraged fromexercisingAllocated: a: 15, b: 15 Completed: a: 7, b: 8 at 2 years % Dropout: a: 53%, b: 47% at 2 years Assessed: a: 7, b: 8 at 2 years
Length offollow-up: 2 yearsOutcome:weight data
Sponsorship: RossLaboratories
continued

Health Technology Assessm
ent2004; Vol. 8: No. 21
275
© Q
ueen’s Printer and Controller of H
MSO
2004. All rights reserved.
TABLE 23 Included non-drug studies (cont’d)
Study ID Methods Participants Interventions Outcomes Notes
Simonen, 2000 Randomisation:allocation concealment:B(I)Assessor blinding: noITT: yes
Location: University of Helsinki,Finland Period of study: before August1999Inclusion criteria: men andpostmenopausal women,diagnosis of type 2 diabetes inpast 2 years (fasting plasmaglucose ≥ 7.0 mmol/l) Exclusion criteria: insulintherapy, diabeticmicroangiopathy, hepatic orthyroid disease; unstable anginapectoris or MI; or invasivecoronary artery diseasetreatment in previous year Gender: 3 women, 13 men Age (years): mean (SD) a: 51.1(8.8), b: 54.3 (3.4)BMI (kg/m2): mean a: 31.94, b: 32.32Baseline comparability: fastingplasma glucose and HbA1cdiffered significantly betweengroups (p < 0.05)
Timing of active intervention: a + b: 3 months plus follow-up at 2 years Description of intervention:a + b: 6 week pretreatment phase consisting of ad libitumdiet at home while metabolic tests carried outa: participants’ dose of glibenclamide adjusted so thatplasma glucose < 7.0 mmol/l and biguanides discontinued;low-energy diet where participants advised to consumelow-fat low-cholesterol diet for 3 months a: hypoglycaemia treatment discontinued; very low-energydiet consisting of 3 daily servings of 140 kcal/serving(Cambridge diet), 1 serving = 14.2 g protein, 15 g CHO,2.7 g fat, essential minerals, trace nutrients and vitamins for3 monthsa + b: from month 4 until month 24 diets individuallytailored by dietitian to provide daily energy balance of zeroAllocated: a: 6, b: 10 Completed: a: 6, b: 10 at 24 months % Dropout: a: 0%, b: 0% at 24 months Assessed: a: 6, b: 10 at 24 months
Length offollow-up: 24 monthsOutcomes:weight data, totalcholesterol, LDLcholesterol, HDLcholesterol,fasting plasmaglucose
All 16 participantsanalysed inaggregate, authorreplied, onlyweight dataoutcome used astreatment byhypoglycaemicmedicationsdiffered betweengroupsSponsorship:Helsinki UniversityCentral Hospital,Finnish DiabetesResearchAssociation, TheHowardFoundation
continued

Appendix 8
276
TABLE 23 Included non-drug studies (cont’d)
Study ID Methods Participants Interventions Outcomes Notes
Stenius-Aarniala,2000
Randomisation:shuffling cards with thehelp of someone notinvolved in the study.Allocation concealment:B(I)Assessor blinding: noITT: yes
Location: private outpatientcentre, Helsinki, Finland Period of study: before January2000Inclusion criteria: eithergender, 18–60 years, BMI30–42 kg/m2, diagnosis ofasthma with spontaneous diurnalvariation or a bronchodilatorresponse of ≥ 15%, non-smokeror having stopped smoking for≥ 2 years and before the age of50 Exclusion criteria: pregnancy,history of bulimia or anorexia,unstable angina or arrhythmia,untreated thyroid disease,symptomatic liver or gallbladderdisorder, any other severedisease, insulin treatment,systemic steroid treatment,history of food allergy orintolerance to any component ofthe study’s very low-energy dietpreparation (Nutrilett), e.g.soya, fish, chocolate or lactose,history of adverse reactions topeas, beans or peanuts, poormotivation Gender: 29 women, 9 men Age (years): mean (range) a: 49.7 (34–60), b: 48.3 (23–60) BMI (kg/m2): mean (range) a: 35.8 (31.3–39.4), b: 36.7(32.8–41.8) Baseline comparability: yesfor gender, age and weight
Timing of active intervention: a + b: 12 months, contacted 16 times (12 × 30-minutegroup sessions during initial 14 weeks, then at week 14,month 6 and month 12)Description of intervention:a + b: 2–3 week pretreatment phase consisting of lungfunction tests and laboratory tests to fulfil exclusion andinclusion criteria, then 2 weeks of baseline measurementsa: 14-week weight reduction programme consisting of 12 ×30-minute group sessions and including 8 weeks very low-energy diet (Nutrilett) consisting of 420 kcal/day containingdaily allowances of all essential nutrients; discussed samethemes as controls but at a later date so that each grouphad the same amount of education about asthma andallergy at end of treatmentb: 12 × 30-minute group sessions during initial 14 weekswhere themes chosen by participants were discussed freelyAllocated: a: 19, b: 19 Completed: a: 19, b: 19 at 52 weeks % Dropout: a: 0%, b: 0% at 52 weeksAssessed: a: 19, b: 19 at 52 weeks (ITT)
Length offollow-up: 52 weeksOutcomes:weight data, lungfunction tests,adverse events,QoL
SDs for meanchange in weightcalculatedSponsorship: TheFinnish CulturalAssociation,Association of thePulmonaryDisabled, Wilhelmand ElseStockmannFoundation,Nycomed Pharma
continued

Health Technology Assessm
ent2004; Vol. 8: No. 21
277
© Q
ueen’s Printer and Controller of H
MSO
2004. All rights reserved.
TABLE 23 Included non-drug studies (cont’d)
Study ID Methods Participants Interventions Outcomes Notes
Straw, 1983Straw, 1983a:weigh-inmaintenanceStraw, 1983b:individualproblem-solvingmaintenance
Randomisation:randomised by blockson percentage fat,rerandomised at week11 to one of 2maintenance conditions(blocked withintreatment group onbasis of amount ofweight lost intreatment). Allocationconcealment: B(I)Assessor blinding: no ITT: no
Location: Chicago, USA Period of study: before 1983Inclusion criteria: women,≥ 35% of body weight as fat(skinfold caliper) Exclusion criteria: seriousphysical or emotional problems,problems that required a specialdiet, e.g. diabetes orhypoglycaemia, severely limitedphysical activity, endocrinedisorder, Beck DepressionInventory score ≥ 20, scheduledid not allow randomassignmentGender: 49 women Age (years): mean: 39.33 n = 42 (completers only)Weight (kg): mean (SD) a: 85.16 (13.97), b: 86.73(16.52), c: 85.44 (14.66)Baseline comparability: notstated
Timing of active intervention: a + b + c: 10 weeks, contacted 11 times (baseline then 1hour weekly for 10 weeks)a1 + b1 + c1: 42 weeks, contacted 9 times (monthly fromweek 11 to 12 months)a2 + b2 + c2: 42 weeks, contacted 12 times (30 minutestwice monthly from week 11 for 3 months, then monthlyto 12 months)Description of intervention:a + b: participants required to purchase Ferguson’s book‘Learning to eat’ and to complete all assignments in it; topicsincluded self-monitoring, stimulus control, eating style,problem solving, activity management and social supporta: participants seen in groups of 8–10b: participants seen individuallyc: individually tailored, individually administered behaviouraltreatment based on food diaries, pedometer readings andsupplementary questionnaires if needed, aim for 4 miles(6.4 km)/day walking, targeted 2–3 problem areas firstusing stimulus control, elimination exercises, activitymanagement techniques, relaxation, cognitive therapy,assertiveness training, cognitive ecology, snack and cueelimination techniquesa1 + b1 + c1: weight check each month where receivedencouragementa2 + b2 + c2: individual problem solving whereparticipants determined topic and discussed for 30 minutestwice a month, then monthly to month 12Allocated: a: 18, b: 15, c: 15; at week 11 a: 12, b: 12, c: 14 Completed: a1: 8, b1: 8, c1: 8 at 12 months; a2: 5, b2: 5,c2: 6 (includes 2 in a1 and 2 in b1 who did not wish to bererandomised at week 11 and so received weigh-intreatment only)% Dropout: 18% overall at 12 monthsAssessed: a1: 6, b1: 6, c1: 8 at 12 months; a2: 5, b2: 5, c2: 6 at 12 months
Length offollow-up: 12 months Outcome:weight data
Mean change inweight calculatedfrom change atweek 10 pluschange duringweeks 11–52, SDscalculated, groupc1 and c2 not usedin comparisonsSponsorship:none mentioned
continued

Appendix 8
278
TABLE 23 Included non-drug studies (cont’d)
Study ID Methods Participants Interventions Outcomes Notes
Swinburn, 2001 Randomisation:unmarked envelopesystem, 6 participantsfrom 1 worksite (PacificIslands, all women)were assigned to activetreatment group a.Allocation concealment:CAssessor blinding: noITT: no
Location: University of Auckland,New ZealandPeriod of study: before November1999Inclusion criteria: either gender, ≥ 40 years, IGT (OGTT, 2-hour plasmaglucose 7.8–11.0 mmol/l) or highnormal plasma glucose (OGTT, 2-hourplasma glucose 7.0–7.8 mmol/l)Exclusion criteria: not stated Gender: 35 women, 101 men Age (years): mean (SD) a: 52.5 (6.5),b: 52.0 (6.7) BMI (kg/m2): mean (SD) a: 29.08(4.47), b: 29.17 (4.02)Baseline comparability: yes
Timing of active intervention: a: 1 year with follow-up to 5 years, contacted 116times (baseline, monthly sessions for 1 year, then at2, 3 and 5 years)b: assessed 6 times (baseline, 6 months, 1, 2, 3 and 5 years) Description of intervention:a: reduced-fat ad libitum diet, education andidentification of strategies to reduce fat intake,personal goal setting, self-monitoring through fooddiaries, food label reading b: usual diet, general dietary advice regarding healthyfood choices given at baseline onlyAllocated: 176 in total Completed: a: 66, b: 70 at 1 year; a: 47, b: 57 at 2years; a: 48, b: 51 at 3 years; a: 51, b: 52 at 5 years % Dropout: 24% overall at 5 yearsAssessed: a: 66, b: 70 at 1 year; a: 47, b: 57 at 2 years; a: 48, b: 51 at 3 years; a: 51, b: 52 at 5 years
Length offollow-up: 5 yearsOutcomes:weight data,fasting plasmaglucose, deaths
Sponsorship:Auckland MedicalResearchFoundation,National HeartFoundation of NewZealand, LotteriesMedical Board,Health ResearchCouncil of NewZealand
continued

Health Technology Assessm
ent2004; Vol. 8: No. 21
279
© Q
ueen’s Printer and Controller of H
MSO
2004. All rights reserved.
TABLE 23 Included non-drug studies (cont’d)
Study ID Methods Participants Interventions Outcomes Notes
TAIM, 1992 Randomisation:stratified within clinicalcentre and by race,computer allocated bycoordinating centre.Allocation concealment:AAssessor blinding:blinded to drug statusonly ITT: no
Location: 3 clinical centres in USAPeriod of study: before July 1991Inclusion criteria: either gender,21–65 years, 110–160% IBW, BPuntreated or BP medicationdiscontinued 2 weeks before start ofstudy, 1 member per household,treated DBP ≤ 99 mmHg or untreatedDBP 90–104 mmHg at preliminaryscreening, 90–100 mmHg at first clinicvisit, < 115 mmHg at second visit(prerandomisation)Exclusion criteria: MI during pastyear or history of MI, history or otherevidence of stroke, bronchial asthma,diabetes mellitus requiring insulin;history or other evidence of allergy tothiazides or �-blockers, creatinine ≥ 180 �m/l at baseline, other majordisease, e.g. kidney disease, liverdisease, cancer, pregnancy orlikelihood of pregnancy during study,lifestyle or other conditions likely toaffect complianceGender: 100 women, 100 men Age (years): mean (SD) a: 48.6, b: 46.8 BMI (kg/m2): mean a: 30.45, b: 30.14 Baseline comparability: significantlymore women than men in group a
Timing of active intervention: a: 30 months, contacted minimum 25 times(baseline, 10 group sessions held weekly andmonthly assessment in initial 6 months then every6–12 weeks up to a maximum of 30 months) b: contacted 5 times (baseline, and 6, 12, 18 and 24 months)Description of intervention:b: no change in diet and given placeboa: diet counselling and nutrition education aimed atbehaviour change, related activities (exercise) aimedat weight loss to achieve blood pressure control,given individual goal of calorie intake and weight lossof 10% baseline weight or 4.5 kg (whichevergreater); given placeboa + b: all participants given step-up medication ifnecessary to control blood pressure, administered indouble-blind fashion; if DBP ≥ 99 mmHg or 90–94 mmHg at 2 visits with 3-month interval or95–99 mmHg at 2 visits with 2-week interval then25 mg chlorthalidone or 50 mg atenolol prescribed, ifstill not controlled then open-label therapy used(known antihypertensive medication)Allocated: a: 100, b: 100 Completed: not clear % Dropout: not clear Assessed: a: 57, b: 61 at years 1 and 2 (participantsexcluded from analysis if failed to attend all 6, 12, 18and 24-month assessments)
Length offollow-up: 2.5 yearsminimumOutcomes:weight data,treatmentfailures, deaths
Sponsorship: partfunded by NationalInstitutes of Health,ICI Americas, AHRobins Company
continued

Appendix 8
280
TABLE 23 Included non-drug studies (cont’d)
Study ID Methods Participants Interventions Outcomes Notes
TOHP I, 1992 Randomisation: highweight strata of TOHP I randomised. Allocationconcealment: AAssessor blinding: noITT: possibly
Location: multicentre trial, USA Period of study: before March 1992Inclusion criteria: either gender,30–54 years, high–normal DBP and nottaking antihypertensive drugs for past 2 months, BP based on 3 visits 10–30 days apart with cumulativeaverages of 75–97, 77–94, 80–89 mmHg; BMI 26.1–36.1 kg/m2
for men, 24.3–36.1 kg/m2 for women Exclusion criteria: clinical orlaboratory evidence of cardiovascularor other life-threatening or disablingdiseases, diabetes mellitus, chronicrenal failure, cancer, pregnancy orwishing to become pregnant,psychiatric disorders, unwillingness orinability to comply with intervention ordata collection, cholesterol ≥ 6.7 mmol/lGender: 179 women, 385 men Age (years): mean (SD) a: 43.1 (6.0),b: 42.4 (6.2) Weight (kg): mean (SD) a: 90.2 (13.3),b: 89.3 (13.0)Baseline comparability: higherproportion of men in group a than ingroup b (p = 0.016)
Timing of active intervention: a: 18 months, contacted at baseline then 90-minutesessions weekly for first 14 weeks, then every 2 weeks, then every month to 18 monthsb: assessed 5 times (baseline, and 3, 6, 12 and 18 months)Description of intervention:a: weight reduction intervention focused on reducingcalorie intake, reducing fat, sugar and alcohol intake;shopping, cooking and food selection behaviours;moderate increase in calorie expenditure throughwalking briskly 4–5 times/week for 45 minutes eachsession at 40–55% heart rate reserve; behaviouralself-management through goals, reinforcement, socialsupport, graphing weight, problem solving, relapseprevention and coping strategies; food and exercisediariesb: no treatment receivedAllocated: a: 308, b: 256 Completed: a: 293, b: 235% Dropout: a: 5%, b: 8% at 18 monthsAssessed: a: 547, b: 554 at 36 months (weight dataonly)
Length offollow-up: 18 monthsOutcomes:weight data, SBP,DBP, mortality,development ofhypertension
Sodium reductionand stressmanagementtreatment groupsexcluded fromanalysesSponsorship:National Institutesof Health, MarionLaboratories,Schering-Plough,Warner-Lambert,Albion Laboratories
continued

Health Technology Assessm
ent2004; Vol. 8: No. 21
281
© Q
ueen’s Printer and Controller of H
MSO
2004. All rights reserved.
TABLE 23 Included non-drug studies (cont’d)
Study ID Methods Participants Interventions Outcomes Notes
TOHP II, 1997 Randomisation:stratified by clinic,randomly assigned byphone or sealedrandomisationenvelopes. Allocationconcealment: AAssessor blinding: yesITT: possibly
Location: 9 clinical centres in USA Period of study: December1990–March 1995Inclusion criteria: either gender,30–54 years, 110–165% IBW or BMI26.1–37.4 kg/m2 (men), 24.4–37.4 kg/m2 (women), DBP 83–89 mmHg (average of all 9measurements), SBP <140 mmHg,completion and return of 24-hour andseparate 8-hour urine collection and 3-day food recordExclusion criteria: medicallydiagnosed hypertension, history ofCVD, diabetes mellitus, malignancy inpast 5 years (other than non-melanoma skin cancer), other seriouslife-threatening illness requiringmedical treatment, current use ofprescription medication that affects BPand non-prescription diuretics, serumcreatinine ≥ 1.7 mg/dl in men and≥ 1.5 mg/dl in women or casual serumglucose ≥ 200 mg/dl, >21 alcoholicdrinks/week, current pregnancy orintention of pregnancyGender: 409 women, 782 men Age (years): mean (SD) a: 43.4 (6.1),b: 43.2 (6.1) BMI (kg/m2): not stated by groupWeight (kg): mean (SD) a: 93.4 (14.1),b: 93.6 (13.5)Baseline comparability: yes
Timing of active intervention: a: minimum of 36 months, contacted 3 times atbaseline plus 1 individual visit, then weekly for 14 weeks, every 2 weeks for the next 6 weeks, 3–6 minimodules each year supplemented byparticipant-initiated contact every 2 weeksb: assessed 7 times (baseline then every 6 monthsfor a minimum of 36 months)Description of intervention:a: 4 phases of programme including preintensivephase of 1–4 months’ wait before start of treatmentwhen participants advised to prevent weight gain andcontacted monthly; intensive phase during initial 14 weeks with mean weight loss goal of ≥ 4.5 kg orto achieve IBW during first 6 months then tomaintain weight, reduce calorie intake, count fatintake, increase physical activity to 4–5 times/weekfor 30–45 minutes per session at 40–55% heart ratereserve, supervised exercise in 4 of 14 initial weeklysessions; transitional phase during weeks 15–26 oftreatment with behavioural skills such as individualproblem solving, relapse prevention, cognitivereframing and coping imagery; extended phase fromweek 27 onwards consisted of minimodules includingtopics such as ‘supermarket savvy’, ‘stress and timemanagement’, ‘walking across America’b: no treatment receivedAllocated: a: 595, b: 596 Completed: a: 547, b: 554% Dropout: a: 8%, b: 7% at 36 monthsAssessed: a: 547, b: 554 at 36 months (weight dataonly)
Length offollow-up: 36–48 monthsOutcomes:weight data, SBP,DBP, mortality,development ofhypertension
Numbers in eachgroup assumed for12- and 24-monthdata derived fromgraph, SDscalculatedSponsorship:National Institutesof Health
continued

Appendix 8
282
TABLE 23 Included non-drug studies (cont’d)
Study ID Methods Participants Interventions Outcomes Notes
TONE, 1998 Randomisation: 2 × 2factorial design, 2overweight participantsrandomly assigned forevery 1 non-overweightparticipant; stratified byweight and site.Allocation concealment:B(I)Assessor blinding: yesITT: no
Location: 4 academic health centres, inUSAPeriod of study: August 1992–December1995Inclusion criteria: either gender, stablehealth, 60–80 years, mean SBP < 145 mmHg, mean DBP < 85 mmHg,taking 1 antihypertensive medication,taking 2 antihypertensive medications ifsuccessfully stepped down beforerandomisation; obese strata involvedpeople with BMI ≥ 27.8 kg/m2 for men and≥ 27.3 kg/m2 for women, independent intheir daily living activities, permission ofpersonal physician, ability to alter diet andincrease physical activity Exclusion criteria: cancer in the past 5 years, type 1 diabetes, severehypertension, CVD, peripheral vasculardisease, psychiatric illness, current orrecent (in past 6 months) drug therapy forasthma or chronic obstructive lung disease,corticosteroid therapy for > 1 month,≥ 4.5 kg involuntary and unexplainedweight loss in the past year, serumcreatinine > 2 mg/dl, serum potassium> 5.5 mEq/l, haemoglobin < 11g/dl, plasmaglucose > 260mg/dl, volume of baseline 24-hour urine specimen < 500 ml, > 14alcoholic drinks/week, current or plannedparticipation in another intervention study,another member of household was amember of TONE Gender: 162 women, 132 men Age (years): mean (SD) a: 66 (5), b: 66 (4)BMI (kg/m2) mean (SD): a: 31.0 (2.3), b: 31.3 (2.3) Baseline comparability: yes
Timing of active intervention: a: median 29 months contacted approximately 45 times (baseline then weekly for first 4 months,then fortnightly for the next 3 months, thenmonthly)b: median 29 months contacted approximately 10 times (baseline then quarterly) Description of intervention:a + b: antihypertensive medications withdrawn90 days after first group intervention sessions,drug-specific tapering regimens whereparticipants seen weekly and 3 additionalfortnightly visits to confirm SBP < 150 mmHg andDBP < 90 mmHga: the group goal was ≥ 4.5 kg weight loss in 6months then weight maintenance; individual goalswere 5–10% weight loss (depending on baselineBMI) by calorie deficit and increase in physicalactivity; behavioural therapy based on socialaction theory for lifestyle change, self-monitoringof calorie intake, eating behaviours and pulse rate;management of eating behaviours, relapseprevention; participants received individualfeedback from food intake records and physicalactivity records, calorie counting of foods,practical advice on purchase and preparation ofinexpensive foods available in supermarkets,group practice of safe, low-level exerciseb: advised to maintain usual diet and physicalactivity, speakers led discussion on topicsunrelated to blood pressure, CVD or dietAllocated: a: 147, b: 147 Completed: a: 137, b: unclear at 29 months % Dropout: a: 7%, b: unclear at 29 monthsAssessed: a: 133, b: 125 at 12 months; a: 131, b: 122 at 18 months; a: 104, b: 95 at 24 months;a: 60, b: 53 at 30 months
Length offollow-up: 29 months(median)Outcomes:weight data,adverse events,deaths, cancers,successfulwithdrawal ofantihypertensivemedications, MI,cerebrovascularaccident
Report of 2 arms ofa 4-arm study;author providedmean and SDchange in weight at12, 18, 24 and 30monthspostrandomisationSponsorship:National Institutesof Health
continued
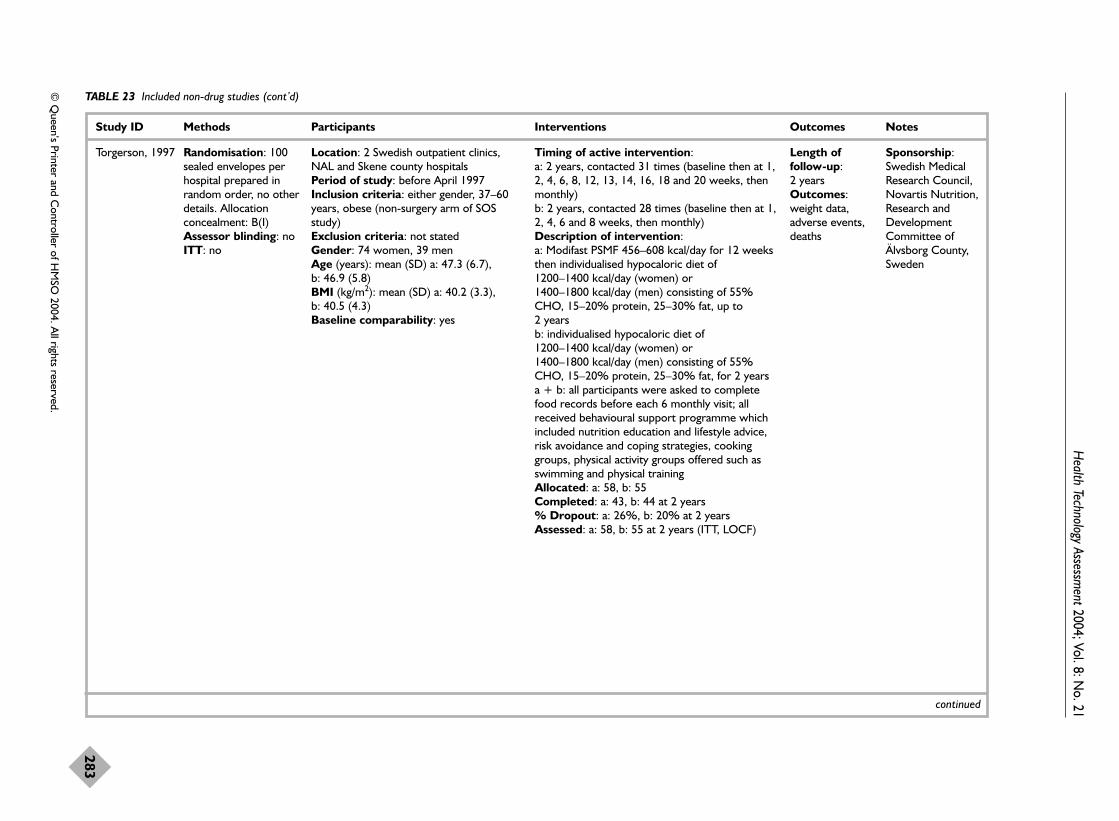
Health Technology Assessm
ent2004; Vol. 8: No. 21
283
© Q
ueen’s Printer and Controller of H
MSO
2004. All rights reserved.
TABLE 23 Included non-drug studies (cont’d)
Study ID Methods Participants Interventions Outcomes Notes
Torgerson, 1997 Randomisation: 100sealed envelopes perhospital prepared inrandom order, no otherdetails. Allocationconcealment: B(I)Assessor blinding: no ITT: no
Location: 2 Swedish outpatient clinics,NAL and Skene county hospitals Period of study: before April 1997Inclusion criteria: either gender, 37–60years, obese (non-surgery arm of SOSstudy) Exclusion criteria: not stated Gender: 74 women, 39 men Age (years): mean (SD) a: 47.3 (6.7), b: 46.9 (5.8) BMI (kg/m2): mean (SD) a: 40.2 (3.3), b: 40.5 (4.3)Baseline comparability: yes
Timing of active intervention: a: 2 years, contacted 31 times (baseline then at 1,2, 4, 6, 8, 12, 13, 14, 16, 18 and 20 weeks, thenmonthly) b: 2 years, contacted 28 times (baseline then at 1,2, 4, 6 and 8 weeks, then monthly) Description of intervention:a: Modifast PSMF 456–608 kcal/day for 12 weeksthen individualised hypocaloric diet of 1200–1400 kcal/day (women) or 1400–1800 kcal/day (men) consisting of 55%CHO, 15–20% protein, 25–30% fat, up to 2 yearsb: individualised hypocaloric diet of 1200–1400 kcal/day (women) or 1400–1800 kcal/day (men) consisting of 55%CHO, 15–20% protein, 25–30% fat, for 2 yearsa + b: all participants were asked to completefood records before each 6 monthly visit; allreceived behavioural support programme whichincluded nutrition education and lifestyle advice,risk avoidance and coping strategies, cookinggroups, physical activity groups offered such asswimming and physical trainingAllocated: a: 58, b: 55 Completed: a: 43, b: 44 at 2 years % Dropout: a: 26%, b: 20% at 2 years Assessed: a: 58, b: 55 at 2 years (ITT, LOCF)
Length offollow-up: 2 yearsOutcomes:weight data,adverse events,deaths
Sponsorship:Swedish MedicalResearch Council,Novartis Nutrition,Research andDevelopmentCommittee ofÄlvsborg County,Sweden
continued

Appendix 8
284
TABLE 23 Included non-drug studies (cont’d)
Study ID Methods Participants Interventions Outcomes Notes
Tucker, 1991 Randomisation:randomly assignedbefore bariatric surgery,no further details.Allocation concealment:B(I)Assessor blinding: nodetails givenITT: possibly
Location: USA Period of study: before July 1990Inclusion criterion: accepted for bariatricsurgeryExclusion criteria: not stated Gender: 21 women, 11 men (completersonly) Age (years): mean 40.18 (n = 32)BMI (kg/m2): mean (SD) a: 48.87 (11.24),b: 47.60 (7.14) n = 32Baseline comparability: yes
Timing of active intervention: a + b: 2 years, contacted 9 times (baseline thenmonthly for first 6 months, then at 12 and at 24 months)Description of intervention:a + b: all participants watched then discussed a13-minute videotape before surgery regardingappropriate 2-oz (60 g) meals, food groups andbehavioural strategies to avoid nausea andvomiting; all participants received medicalassessment monthly for first 6 monthspostsurgery, then at 12 and 24 months; allparticipants also received monthly telephoneinterviews for initial 6 months regarding foodintake, physical activity and psychosocialfunctioning; food diaries completeda: participants received 12 sets of writtenmaterials concerning eating and lifestyle mailed tohomes every 2 weeks for initial 6 months, andreceived individual behavioural consultationsusually corresponding with medical assessmentsmonthly for first 6 months, then at 12 and 24months when had opportunity to discuss contentof written materialsAllocated: 60 overall Completed: a: 17, b: 15 at 2 years % Dropout: 47% overall at 2 yearsAssessed: a: 17, b: 15 at 2 years
Length offollow-up: 2 yearsOutcome:weight data
Weight change at 1and 2 yearscalculated fromactual values, SDscalculatedSponsorship:none mentioned
continued

Health Technology Assessm
ent2004; Vol. 8: No. 21
285
© Q
ueen’s Printer and Controller of H
MSO
2004. All rights reserved.
TABLE 23 Included non-drug studies (cont’d)
Study ID Methods Participants Interventions Outcomes Notes
Viegener, 1990 Randomisation:allocation concealment:B(I)Assessor blinding: no ITT: no
Location: Fairleigh Dickinson Universityand Franklin Delano Roosevelt VA Hospital,New York, USA Period of study: before October 1989Inclusion criteria: women, 21–59 years,25–99% overweight, physician’s approval,$125 deposit (with return based onattendance and completion of food diaries) Exclusion criteria: obesity-relateddisorders Gender: 85 womenAge (years): mean (SD) a: 47.10 (7.49), b: 47.13 (8.86) Weight (kg): mean (SD) a: 94.58 (12.64),b: 98.57 (15.91) Baseline comparability: yes
Timing of active intervention: a + b: 12 months, contacted maximum of 39 times (baseline, weekly 2-hour group andindividual sessions for first 26 weeks, thenopportunity to attend group maintenance sessionstwice monthly for 26 weeks) Description of intervention:a + b: all participants received behaviouraltherapy which included self-monitoring, stimuluscontrol, self-reinforcement, cognitive modificationand problem solving; all participants were advisedto follow a regimen of programmed aerobicexercise with a target goal of 30 minutes/day for6 days/week; all participants required to purchasea nutrition guide book and to complete daily fooddiary and daily exercise diary;a: 800 kcal/day diet for 4 days/week and 1200 kcal/day for 3 days/week consisting of≤ 15% intake from fat on VLCD days and ≤ 25%fat on LCD days; each treatment session includedsignificant focus on nutrition education withsample meals and practical guidance regardinglow-fat and low-calorie foodsb: 1200 kcal/day balanced deficit diet with 55%CHO, 30% fat and 15% proteinAllocated: a: 42, b: 43 Completed: a: 30, b: 30 at 12 months % Dropout: a: 29%, b: 30% at 12 months Assessed: a: 30, b: 30 at 12 months
Length offollow-up: 52 weeksOutcomes:weight data,compliance
Sponsorship: partfunded by VAMedical ResearchService
continued

Appendix 8
286
TABLE 23 Included non-drug studies (cont’d)
Study ID Methods Participants Interventions Outcomes Notes
Wadden, 1989 Randomisation:first of 2 cohortsstratified into 3 blocks based ondegree overweight;no details regardingsecond cohort.Allocationconcealment: B(I)Assessor blinding:no ITT: no
Location: University ofPennsylvania School ofMedicine, USAPeriod of study: January1983–1989Inclusion criteria: Eithergender, ≥ 25 kg above IBW(Metropolitan Life Insurancetables)Exclusion criteria: recentMI or evidence of cardiacabnormalities, history ofcerebrovascular, kidney orliver disease, cancer, type 1diabetes, severe psychiatricillness, pregnancy,contraindications totreatment by VLCD(assessed at screening),participants agreed not toparticipate in additionalweight loss treatment beforefollow-up at 1 year post-treatment Gender: 76 women(completers only, menexcluded from analyses dueto small numbers)Age (years): mean (SEM)42.1 (1.1) womencompleters only (n = 76) BMI (kg/m2): mean (SEM)39.4 (0.8) womencompleters only (n = 76)Baseline comparability: 2cohorts significantly differentregarding age (43.9 and 39.5)
Timing of active intervention: a: 16 weeks, contacted 25 times (90 minutes each week for 16 weeks, then months 1, 2, 3, 6, 9 and 12 post-treatment, 3years and 5 years post-treatment) b + c: 25 weeks, contacted 39 times (90 minutes each week for25 weeks, then 11 post-treatment visits every other week for first2 months, then once a month for next 4 months, then every othermonth for last 6 months, 3 years and 5 years post-treatment) Description of intervention:b: 1000–1200 kcal/day diet of participants’ choosing for 25 weeks,taught traditional behavioural methods of weight control whichincluded recording eating behaviour, controlling stimuli related toeating, slowing rate of consumption, increasing lifestyle activity,nutrition education, modifying self-defeating thoughts andemotions, social support, reinforcing changes in eating andexercise behavioura + c: 1000–1200 kcal/day for month 1, months 2 + 3,
400–500 kcal/day PSMF consisting of 3 servings of lean meat, fishor fowl and to avoid all other food with the exception of non-caloric beverages and bouillon, requested to drink at least 1.5 litres of water/day, daily supplements 3 g each of potassiumand sodium chloride, and 800 mg calcium; month 4 refeeding toconventional foods, first fruit and vegetables, then bread andcereal, then fatsc: in addition months 5 + 6 prescribed 1000–1200 kcal/day diet,extensive training in behaviour therapy throughout (see b);months 4, 5 + 6 addressed weight maintenance and includedrelapse prevention training and strategies for handling weightregain a + b + c: encouraged to increase physical activity by walking andusing the stairs; diet records kept throughout active treatment;paid $10 for each visit and deposited $40 which was refundedafter the 1-year follow-up visit Allocated: unclearCompleted: 68 overall at 12 months post-treatment, 50 overallat 3 years post-treatment and 55 overall at 5 years post-treatment(64–66 months in total) % Dropout: unclearAssessed: 68 overall at 12 months post-treatment, 50 overall at 3 years post-treatment and 55 overall at 5 years post-treatment
Length offollow-up: 64–66 monthsOutcomes:weight data,depressionscores,medication use(not by individualtreatment group)
2 kg added to allself-reportedweights, 3- and 5-year weightoutcomesrecalculated forparticipants whohad additionalweight losstreatment in years1–5 post-treatment, self-reported weight attime of seekingadditional therapywas subtractedfrom pretreatmentweights, significantdifference in wholesample fromuncorrectedchanges (p < 0.002 at 3 years, p < 0.005at 5 years post-treatment)Sponsorship:National Instituteof Mental HealthResearch,MacArthur’sFoundationNetwork onHealth Promotingand DiseasePreventingBehaviors
continued

Health Technology Assessm
ent2004; Vol. 8: No. 21
287
© Q
ueen’s Printer and Controller of H
MSO
2004. All rights reserved.
TABLE 23 Included non-drug studies (cont’d)
Study ID Methods Participants Interventions Outcomes Notes
Wadden, 1994 Randomisation:VLCD groupoverselected toallow for greaterattrition, no furtherdetails. Allocationconcealment: B(I)Assessor blinding:noITT: yes
Location: University ofPennsylvania, USA Period of study: beforeFebruary 1993Inclusion criteria: women,≥ 25 kg overweight, $60deposits ($300 refunded at 6-monthly intervals)Exclusion criteria: MI,cardiac problems,cerebrovascular disease,kidney or liver disease,cancer, type 1 diabetes,bulimia nervosa, psychiatricillnessGender: 49 women Age (years): mean (SD) a: 42.86 (10.12), b: 36.82(8.87)BMI (kg/m2): mean (SD) a: 38.80 (5.39), b: 40.01(5.73)Baseline comparability:yes
Timing of active intervention: a + b: 18 months, contacted 66 times (baseline then 90-minutesmall group sessions weekly for first 52 weeks, then fortnightly forweeks 53–78)Description of intervention:a + b: all participants received behaviour therapy consisting ofkeeping an eating record, stimulus control, modifying cognitions,eliciting social support (materials presented in different order forgroup b for initial 52 weeks); then during weeks 53–78 ‘upkeep’skills such as weight graphing and biography, preparing low-fatmeals, continuing to exercise, relapse prevention, risk avoidanceand reversing small weight gains; all participants received sameexercise programme consisting of 10–20 minutes 3 times perweek at 40–60% maximum heart rate, gradually increased to20–40 minutes 3–5 times per week at 60–70% maximum heartrate by week 52a: 1200 kcal/day balanced deficit diet for first 52 weeks, 15–20%protein, 30% fat and remainder CHO, calorie intake thenadjusted for weeks 53–78 depending on participant’s desiredweight change (minimum 1200 kcal/day)b: week 1 advised regarding 1200 kcal/day, weeks 2–17 420kcal/day liquid formula PSMF (70 g protein, 30 g CHO, 2 g fat)and 2 litres non-caloric fluids daily and avoidance of all otherfoods; week 18 conventional foods gradually reintroduced to 100 kcal/day by week 23, weeks 24–78 1200 kcal/dayAllocated: a: 21, b: 28 Completed: a: 17, b: 23 at 52 weeks; a: 16, b: 21 at 78 weeks % Dropout: a: 24%, b: 25% at 78 weeksAssessed: a: 17, b: 23 at 52 weeks; a: 16, b: 21 at 78 weeks
Length offollow-up: 78 weeksOutcomes:weight data,compliance, QoL
Sponsorship:National Instituteof Mental HealthResearch
continued

Appendix 8
288
TABLE 23 Included non-drug studies (cont’d)
Study ID Methods Participants Interventions Outcomes Notes
Wadden, 1998Wadden, 1998a:aerobic ExWadden, 1998b:strength ExWadden, 1998c:aerobic +strength Ex
Randomisation: 2cohorts and differentcentres, no furtherdetails. Allocationconcealment: B(I)Assessor blinding: noITT: no
Location: Syracuse University andUniversity of Pennsylvania, USA Period of study: before March 1997Inclusion criteria: women, >20 kg aboveIBW (Metropolitan Life Insurance tables)Exclusion criteria: medicalcontraindications, bulimia nervosa, othermajor psychiatric disturbance, medicationknown to affect weightGender: 128 women Age (years): mean (SD) 40.9 (8.6) overall(n = 118 of 128 assigned)BMI (kg/m2): mean (SD) a: 36.3 (5.3)overall (n = 118 of 128 assigned)Baseline comparability: yes
Timing of active intervention: a–d: 48 weeks with follow-up at 1 year post-treatment (100 weeks), contacted 40 times(baseline then weekly for initial 28 weeks, thenfortnightly for next 20 weeks, then at 100 weeks) Description of intervention:a–d: 925 kcal/day/diet for weeks 0–16, then1200–1500 kcal/day to week 48; 90-minute groupcognitive behavioural therapy weekly for 28 weeks then fortnightly for following 20 weeks;a: advised to continue same lifestyle activities andnot to increase exercise from baselineb + c + d: 3 × 1-hour supervised exercisetraining/week for first 28 weeks (non-consecutivedays), then 2 sessions/week during weeks 29–48and 1 home exercise session/weekb: step aerobics estimated to expend 300–400 kcal/sessionc: strength exercise using universal gym of Cybexequipment to expend 150–175 kcal/session,consisted of bench press, latissimus pulldown,chest fly, leg press, leg and arm curls andextensions, sit-ups and back extensionsc: 40% aerobic exercise same as group b and60% strength exercise same as group c,estimated to expend 225–275 kcal/sessionAllocated: not clearCompleted: a: 21, b: 21, c: 18, d: 17 at 100weeks% Dropout: 40% overall at 100 weeksAssessed: a: 21, b: 21, c: 18, d: 17 at 100 weeks
Length offollow-up: 100 weeksOutcome:weight data
Sponsorship:National Instituteof Mental HealthResearch andNational Institutesof Health
continued

Health Technology Assessm
ent2004; Vol. 8: No. 21
289
© Q
ueen’s Printer and Controller of H
MSO
2004. All rights reserved.
TABLE 23 Included non-drug studies (cont’d)
Study ID Methods Participants Interventions Outcomes Notes
Wadden, 2001 Randomisation:allocation concealment:B(I)Assessor blinding: noITT: yes
Location: University of PennsylvaniaSchool of Medicine, USAPeriod of study: before January 2000Inclusion criteria: women, BMI30–45 kg/m2
Exclusion criteria: physicalcontraindications including type 1 and 2diabetes, uncontrolled hypertension(> 140/90 mmHg), history ofcerebrovascular, cardiovascular, kidney orliver disease; use of medication known toaffect body weight (e.g. steroids),pregnancy or lactation, weight loss of 5 kgand/or use of anorectic agents in previous6 months, use of SSRIs, MAOIs or othermedications contraindicated with use ofsibutramine, psychosocial contraindicationsincluding current psychotherapy, bulimianervosa, major depression (> 25 on BeckDepression Inventory), or other psychiatricillness that significantly disrupts dailyfunctioning Gender: no details givenAge (years): mean (SD) 47.2 (9.8)BMI (kg/m2): mean (SD) 37.7 (3.6)Baseline comparability: yes
Timing of active intervention: 12 months, contacted 11 times (at weeks 0, 2, 4,8, 12, 16, 20, 24, 32, 40 and 52) groups b + creceived 20 additional weekly contacts (weeks0–20) Description of intervention: a + b + c: 10 mg sibutramine increased to 15 mgat week 8 if tolerated, $600 deposit, $150returned for completing assessments at 6 and 12months a + b: 1200–1500 kcal/day, 15% energy fromprotein, 30% fat, 55% CHO, encouraged toincrease exercise (mainly walking) to 4–5 sessions/week for 30–40 minutes eachsession, 28-page healthy eating and activity guide‘On your way to fitness’ b + c: additionally given behavioural strategies toachieve goals, daily records of food intake andexercise for first 16 weeks, LEARN programmefor weight control, weekly group lifestylemodification sessions for first 20 weeks whichincluded stimulus control, slowing rate of eating,social support, cognitive restructuring c: additionally given portion-controlled diet, 1000 kcal/day for first 16 weeks [(4 servings/dayof nutritional supplement 160 kcal, 14 g protein,20 g CHO, 3 g fat – OPTIFAST)] combined withevening meal of frozen food entrée, serving offruit and green salad; then weeks 17–20supplements reduced to 1200–1500 kcal/day ofconventional foods from week 20 to week 52Allocated: a: 20, b: 18 c: 17Assessed: a: 19, b: 17, c: 17 at 12 months(conservative ‘ITT’ in which participants whodiscontinued treatment were assumed to gain0.3 kg/month after leaving study)a: 19, b: 17, c: 17 at 12 months (ITT, LOCF)% Dropout: a: 35%, b: 28%, c: 0% at 12 months
Length offollow-up: 12 monthsOutcomes:weight data, totalcholesterol, LDLcholesterol, HDLcholesterol, TGs,SBP, DBP, adverseevents,compliance
All main outcomedata (excludingweight) werecollapsed across 3 groups afteranalyses revealedno significantdifferences amonggroups at end oftreatment inchanges on any ofthese variablesSponsorship:National Institutesof Health, NovartisNutrition Co.,KnollPharmaceuticalCo., AmericanHealth PublishingCo.
continued

Appendix 8
290
TABLE 23 Included non-drug studies (cont’d)
Study ID Methods Participants Interventions Outcomes Notes
Wing, 1984Wing, 1984a:concentratedbehaviouralbooster sessionsWing, 1984b:spacedbehaviouralbooster sessions
Randomisation:rerandomised after 10 weeks to 1 of 2maintenance strategiesfrom within blocksaccording to weight loss(< 4.5 kg, 4.5–9 kg, > 9 kg). Allocation concealment:B(I)Assessor blinding: yesITT: yes
Location: University ofPittsburgh, USA Period of study: beforeSeptember 1983Inclusion criteria: eithergender, 20–65 years, ≥ 20%overweight, $85 deposit, $35non-refundable, $50 refunded atattendanceExclusion criteria: currentlyinvolved in other weight controlprogrammeGender: 42 women, 6 men Age (years): mean (SEM) a:44.79 (1.56), overallBMI (kg/m2): mean 36.45 overallBaseline comparability: notstated
Timing of active intervention:a + b + a1 + b1: 12 months, contacted 18 times (baseline,weekly for first 10 weeks, then at weeks 14, 23, 24, 25, 26,34 and 52)a + b + a2 + b2: 12 months, contacted 18 times (baseline,weekly for first 10 weeks then at weeks 14, 18, 22, 26, 34and 52)Description of intervention:a + b: all participants underwent 10 days of pretreatmentassessment before randomisation, first 4 days involved foodand exercise records, days 5–7 involved individual caloriedeficit (initial weight in pounds × 12 – 1000 kcal) usingSlender breakfast bars and liquid, days 8–10 participantsreturned to conventional foods but maintained sameprescribed calorie deficita + b: postrandomisation for initial 10 weeks participantsreceived 60–90-minute weekly sessions involving individualweigh-in, review, food diaries, presentation of a behaviourallesson (energy balance, strategies for increasing exercise,stimulus control, cognitive restructuring, self-reinforcementand relapse prevention)a: to maintain individually prescribed calorie goal (initialweight in pounds × 12 – 1000 kcal) for 5 days/week and< 750 kcal/day for 2 days/week (chosen by participant) forinitial 10 weeks, could use low-calorie menu or return tousing Slender bars and liquidb: to maintain individually prescribed calorie goal (initialweight in pounds × 12 – 1000 kcal) for 7 days/weeka1 + b1: massed booster session at weeks 14, 23, 24, 25,26 and 34 which included problem-solving techniques,coping strategies, nutrition and exercise topicsa2 + b2: spaced booster sessions, content same as forgroups a1 and b1Allocated: a: 25, b: 23 Completed: a1: 11, b1: 12, a2: 12, b2: 9 at 52 weeks% Dropout: 8% overallAssessed: a1: 11, b1: 12, a2: 12, b2: 9 at 52 weeks
Length offollow-up: 52 weeksOutcome:weight data
Mean change inweight calculatedby subtractingprerandomisationweight loss fromweight change at12 months, SDscalculatedSponsorship: partfunded by NationalInstitute ofArthritis,Metabolism andDigestive Diseases
continued

Health Technology Assessm
ent2004; Vol. 8: No. 21
291
© Q
ueen’s Printer and Controller of H
MSO
2004. All rights reserved.
TABLE 23 Included non-drug studies (cont’d)
Study ID Methods Participants Interventions Outcomes Notes
Wing, 1985 Randomisation:allocation concealment:B(I)Assessor blinding: noITT: yes
Location: University ofPittsburgh, USA Period of study: beforeFebruary 1984Inclusion criteria: eithergender, ≥ 20% above IBW(Metropolitan Life Insurancetables), diabetes treated by dietor oral hypoglycaemics, fastingblood sugar > 140 mg/dl on 2 occasions, or 2-hour value and1 other value > 200 mg/dl, onOGTT, permission from ownphysician, $85 deposit withcontingenciesExclusion criteria: not stated Gender: 33 women, 20 men Age (years): mean 55.1 (7.28)overall BMI (kg/m2): mean (SD): 34.8(5.10) overallBaseline comparability: notstated
Timing of active intervention: a + b: 16 weeks with follow-up at 16 months, contacted19 times (baseline, then weekly for initial 16 weeks, then at10 and 16 months) c: 16 weeks with follow-up at 16 months, contacted 7 times (baseline then monthly for initial 16 weeks, then at10 and 16 months)Description of intervention:a + b + c: all participants given calorie intake goalcalculated as pretreatment weight (in pounds) × 12 – 1000with a minimum calorie intake of 1000 kcal/daya: nutrition education condition: basic information onnutrition, exercise and diabetes, weekly discussion ofnutrition topic but no specific dietary goals; calorie cost ofexercise presented but no group exercise or exercise goals;contingency contracts for attendancec: received same treatment as group a, except met monthlyso participants briefly discussed 4 weekly topics at monthlyvisitsb: behaviour modification strategies to change behavioursuch as changing environment for eating and changingcognitions, and information given on nutrition, exercise anddiabetes; record calories of all food and drink consumed,then monitor sugar intake to < 4 times/week, weekly fibregoal; walking stressed with goal of 100 kcal/weekexpenditure, group exercise at meetings, charts of groupexercise, social support and group competitionAllocated: not clear, 53 in total Completed: 50 overall at 16 months % Dropout: 6% overall at 16 monthsAssessed: 50 overall at 16 months
Length offollow-up: 16 monthsOutcome:weight data
Only used groups aand b forcomparison, nodenominators forchange in weightSponsorship: partfunded by NationalInstitute ofArthritis,Metabolism andDigestive Diseases
continued

Appendix 8
292
TABLE 23 Included non-drug studies (cont’d)
Study ID Methods Participants Interventions Outcomes Notes
Wing, 1988a Randomisation:allocation concealment:B(I)Assessor blinding: yesITT: no
Location: University of Pittsburgh, USA Period of study: before May 1988Inclusion criteria: either gender,30–65 years, type 2 diabetes, > 20%above IBWExclusion criteria: known CHD, onmedication which would affect weightloss and/or measurement of heart rate,orthopaedic problems that would limitwalking, taking insulinGender: 21 women, 4 men Age (years): mean (SD) a: 56.2 (7.5), b: 52.5 (8.9) BMI (kg/m2): mean (SD) a: 38.1 (6.4),b: 37.5 (6.2)Baseline comparability: yes
Timing of active intervention: a + b: 36 weeks with follow-up at 62 weeks,contacted 28 times (baseline then twice a week forfirst 10 weeks, then monthly for next 6 months, thenat 62 weeks) Description of intervention:a + b: all participants received behavioural weightcontrol programme including weigh-in, glucosemeasurement and behavioural modification lecture(slowing down rate of eating, reducing eating signalsin the home, social pressures, preplanning andrelapse prevention techniques); 1600 kcal/day diet with daily calorie goal to produce1 kg week weight loss, reduce fat intake and increasecomplex CHO intake, food diaries; exercise twiceper week as a group and once a week alone, 1 hourper sessiona: moderate exercise based on walking, graduallyincreased until participants were walking 3 miles (4.8 km) within the 1-hour sessionb: low-intensity exercise consisting of lightcalisthenics and flexibility exercises set to music,designed as placebo exerciseAllocated: a: 12, b: 13 Completed: a: 8, b: 11 at 62 weeks % Dropout: a: 33%, b: 15% at 62 weeksAssessed: a: 8, b: 11 at 62 weeks
Length offollow-up: 62 weeksOutcome:weight data
Sponsorship:National Institutesof Health
continued

Health Technology Assessm
ent2004; Vol. 8: No. 21
293
© Q
ueen’s Printer and Controller of H
MSO
2004. All rights reserved.
TABLE 23 Included non-drug studies (cont’d)
Study ID Methods Participants Interventions Outcomes Notes
Wing, 1988b Randomisation:allocation concealment:B(I)Assessor blinding: yesITT: no
Location: University of Pittsburgh, USA Period of study: before May 1988Inclusion criteria: either gender,30–65 years, type 2 diabetes, > 20%above IBWExclusion criteria: known CHD, onmedication that would affect weightloss and/or measurement of heart rate,orthopaedic problems that would limitwalkingGender: 21 women, 9 men Age (years): mean (SD) a: 56.1 (6.4), b: 55.1 (7.2) BMI (kg/m2): mean (SD) a: 38.2 (6.6),b: 37.9 (6.5)Baseline comparability: yes
Timing of active intervention: a + b: 72 weeks, contacted 53 times (baseline then3 times/week for first 10 weeks, then weekly forweeks 11–20, then monthly to 72 weeks)Description of intervention:a + b: all participants received behavioural weightcontrol programme including weigh-in, glucosemeasurement and behavioural modification lecture(slowing down rate of eating, reducing eating signalsin the home, social pressures, preplanning andrelapse prevention techniques); 1600 kcal/day dietwith daily calorie goal to produce 1 kg/week weightloss, reduce fat intake and increase complex CHOintake, food diaries; exercise twice per week as agroup and once a week alone, 1 hour per sessiona: walked 3-mile (4.8 km) route with therapist 3 times/week and instructed to exercise additionallyonce per week on their ownb: instructed not to change baseline level of activity,3 meetings per week were used to providedemonstrations and films of new low-calorie cookingtechniques, portion size estimation and role-play;numerous social group activities to control for socialaspect of exercise condition received by group aAllocated: a: 15, b: 15 Completed: a: 13, b: 15 at 72 weeks % Dropout: a: 13%, b: 0% at 72 weeksAssessed: a: 13, b: 15 at 72 weeks
Length offollow-up: 72 weeksOutcomes:weight data, totalcholesterol, HDLcholesterol, TGs,HbA1c, fastingplasma glucose
Sponsorship:National Institutesof Health
continued

Appendix 8
294
TABLE 23 Included non-drug studies (cont’d)
Study ID Methods Participants Interventions Outcomes Notes
Wing, 1991 Randomisation:allocation concealment:B(I)Assessor blinding: noITT: possibly
Location: University ofPittsburgh School of Medicine,USAPeriod of study: before January1991Inclusion criteria: eithergender, 35–70 years, ≥ 30%above IBW (Metropolitan LifeInsurance tables), type 2 diabetes Exclusion criteria: liver disease,renal disease, heart disease Gender: 26 women, 10 men Age (years): mean (SD) a: 51.9(9.9), b: 50.6 (7.7) (completersonly n = 33)BMI (kg/m2): mean (SD) a: 38.1(5.7), b: 37.34 (4.7) Baseline comparability: yes
Timing of active intervention: a + b: 72 weeks, contacted 25 times (weekly from baselineto week 20, then at weeks 24, 28, 46 and 72) Description of intervention:a + b: all participants given instructions to diet, exerciseand behaviour modification emphasised in particular;advised to increase walking and given weekly exercise goalsstarting at 50 kcal/week (the equivalent of a 0.5-mile (0.8-km) walk for a 67.5-kg person) increased to 1000kcal/week (approximately 10 miles or 16 kmwalking/week); participants self-monitored their calorieintake and exercise daily throughout the programme,stimulus control techniques, including strategies forremoving food cues from the environment, slowing the rateof eating and separating eating from other activities; alsotaught techniques for modifying cognitions, for relapseprevention and for self-reinforcement; all participantsdeposited $150 at the start which was earned back weeklyfor meeting homework goals a: 1000–1500 kcal/day (depending on initial weight) untilweek 72 unless IBW achieved; information regarding caloriecontent of protein, CHO and fat given, and participantsadvised to increase complex CHO and decrease fat intake,food choices unlimited, in line with American DiabeticAssociation recommendationb: month 1 same as group a, then weeks 5–12, given 400 kcal/day PSMF consisting of lean meat, fish, fowl andchoice of Optifast 70 for occasional meals, week 9 otherfoods gradually reintroduced and calories increased so byweek 17 = 1000–1500 kcal/day diet until week 72;participants on insulin started VLCD in hospital whereinsulin was withdrawn or sharply reduced; vitamin andmineral daily supplementsAllocated: a: 19, b: 17 Completed: a: 16, b: 17 at 72 weeks % Dropout: a: 16%, b: 0% at 72 weeks Assessed: a: 16, b: 17 at 72 weeks (completer analyses)
Length offollow-up: 72 weeksOutcomes:weight data, totalcholesterol, HDLcholesterol, TGs,HbA1c, fastingplasma glucose,compliance
Author confirmedmain study andsubstudypublications, meanchange in riskoutcomes at 72 weekscalculated fromactual values, SDsalso calculatedSponsorship:WesternPennsylvaniaAffiliate of theAmerican DiabetesAssociation,National Institutesof Health
continued

Health Technology Assessm
ent2004; Vol. 8: No. 21
295
© Q
ueen’s Printer and Controller of H
MSO
2004. All rights reserved.
TABLE 23 Included non-drug studies (cont’d)
Study ID Methods Participants Interventions Outcomes Notes
Wing, 1991b Randomisation:allocation concealment:B(I)Assessor blinding: noITT: possibly
Location: University ofPittsburgh, USA Period of study: before January1990Inclusion criteria: eithergender, 30–65 years, ≥ 20%above IBW, fasting glucose≥ 140 mg/dl, or ≥ 200 mg/dl 2 hours after oral glucose loadand 1 other value ≥ 200 mg/dl,spouses 30–70 years, ≥ 15%above IBW; $150 deposit percouple Exclusion criteria: not stated Gender: 25 women, 18 men Age (years): mean (SD) a: 53.6(7.7), b: 51.2 (7.3) BMI (kg/m2): mean (SD) a: 35.68(5.76), b: 36.64 (5.77)Baseline comparability: yes
Timing of active intervention: a + b: 72 weeks, contacted 21 times (baseline then weeklyfor first 12 weeks, then at weeks 14, 16, 18, 20, 24, 28, 40and 72) Description of intervention:a + b: all participants received behavioural weight lossprogramme consisting of stimulus control, problem solving,assertion, goal setting and cognitive techniques; participantsadvised to monitor calorie intake to 1200–1500 kcal/daywith a reduction in fat intake and simple CHO and increasein fibre; stepwise goals for walking, with final goal toexpend 100 kcal/week; deposit refunded according toweight loss and attendancea: spouse participated in all aspects of programme and nodistinction made in treatment between participant andspouse, half of therapy sessions focused on social supportand behavioural marital therapy literature, e.g. mutualpositive reinforcementAllocated: a: 24, b: 25 Completed: a: 20, b: 23 at 72 weeks % Dropout: a: 17%, b: 8% at 72 weeksAssessed: a: 20, b: 23 at 72 weeks
Length offollow-up: 72 weeksOutcomes:weight data,HbA1c, fastingplasma glucose
Sponsorship:parted funded byNational Institutesof Health
continued

Appendix 8
296
TABLE 23 Included non-drug studies (cont’d)
Study ID Methods Participants Interventions Outcomes Notes
Wing, 1994 Randomisation:allocation concealment:B(I)Assessor blinding: nodetails givenITT: no
Location: University ofPittsburgh, USAPeriod of study: beforeNovember 1993Inclusion criteria: eithergender, 30–70 years, > 30% or> 18 kg above IBW (based onMetropolitan Life Insurancetables), NIDDM (criteriaaccording to National DiabetesData Group) Exclusion criteria: healthproblems that would interferewith the use of VLCDs Gender: 60 women, 33 men Age (years): mean (SD) 51.8(9.6) BMI (kg/m2): mean (SD) 37.9(6.3) Baseline comparability: yes
Timing of active intervention: a + b: 50 weeks plus follow-up 1 year later (102 weeks intotal), contacted 52 times (weekly in groups ofapproximately 15)Description of intervention:a + b: all participants kept self-monitoring records whichwere reviewed at weekly group meetings, along withdetailed discussion on nutrition which included focusing onreducing fat content and increasing intake of complex CHOand fibre; exercise that emphasised walking or behaviouraltechniques that included stimulus control, goal setting andself-monitoring of intake and exercise, preplanning, relapseprevention and modifying cognitions; included role playingand individual discussion and questions; all participantsencouraged to increase walking to 2 miles (3.2 km)/day on5 days/week; all participants kept 3-day food diaries atbaseline, 6 months and 12 months; all diabetes medicationsdiscontinued at start and algorithm used to determinewhether and when to restart medication; all participantsgiven vitamin/mineral supplements throughout study; allparticipants deposited $150 which was refunded in full forreaching behavioural goals and attending assessments atbaseline, 6 months and 50 weeksa: 1000–1200 kcal/day consisting of < 30% energy intakefrom fat, from baseline to week 50b: PSMF 500 kcal/day either as liquid supplement (Optifast)or lean meat, fish or fowl for weeks 0–12 and weeks24–36; other foods gradually reintroduced over following 4 weeks to consume 1000–1200 kcal/day at weeks 13–23and weeks 37–50 Allocated: a: 41, b: 38 Completed: a: 38, b: 36 at 102 weeks % Dropout: a: 21%, b: 20% at 102 weeksAssessed: a: 37, b:36 at 102 weeks (completer analysis; 1subject in group a excluded from analyses due to gastricbypass operation before follow-up visit)
Length offollow-up: 102 weeksOutcomes:weight data,medication use
Author confirmedstudy and substudyreportsSponsorship:National Institutesof Health
continued

Health Technology Assessm
ent2004; Vol. 8: No. 21
297
© Q
ueen’s Printer and Controller of H
MSO
2004. All rights reserved.
TABLE 23 Included non-drug studies (cont’d)
Study ID Methods Participants Interventions Outcomes Notes
Wing, 1998 Randomisation:allocation concealment:B(I)Assessor blinding: yesITT: yes
Location: University ofPittsburgh, USA Period of study: before July1997Inclusion criteria: eithergender, 40–55 years, non-diabetic (confirmed by OGTT), 1or 2 biological parents with type2 diabetes, 30–100% above IBWExclusion criterion: diabetes Gender: 122 women, 32 men Age (years): mean (SD) a: 45.0(4.7), b: 46.4 (4.5), c: 46.3 (3.8),d: 45.3 (4.9) BMI (kg/m2): mean (SD) a: 36.1(4.1), b: 36.0 (3.7), c: 35.7 (4.1),d: 36.0 (5.4)Baseline comparability: yes
Timing of active intervention: a–c: 2 years, contacted approximately 52 times (baseline,weekly for first 6 months, then every 2 weeks for next 6 months, then 2 × 6-week course during 2nd year)d: contacted at baseline, 6 months, 1 year and 2 yearsDescription of intervention:a: 800–1000 kcal/day weeks 1–8, then adjusted to1200–1500 kcal/day by week 16, food diaries reviewed andfeedback given, meal plans and shopping lists, behaviouralor nutritional topic given at each sessionb: exercise behaviour topic each week, 50–60 minute walkwith therapist at each weekly meeting (second supervisedwalk available each week for weeks 1–10), graduallyincreased exercise to estimated calorie expenditure of 1500 kcal/week [e.g. 3 miles (5 km) brisk walking on 5 days/week], other activities periodically introduced to theparticipants such as aerobics and line dancingc: same diet as group a and same exercise as group b(equivalent to half time for each)d: participants received LEARN behavioural manual withinformation on healthy eating, exercise and behaviouralstrategies; participants encouraged to lose weight andexercise on their own, only participated in the assessmentsAllocated: a: 37, b: 37, c: 40, d: 40 Completed: a: 33, b: 28, c: 30, d: 29, at 1 year; a: 35, b: 31, c: 32, d: 31 at 2 years % Dropout: a: 5%, b: 16%, c: 20%, d: 23% at 2 yearsAssessed: a: 33, b: 28, c: 30, d: 29 at 1 year; a: 35, b: 31, c: 32, d: 31 at 2 years
Length offollow-up: 2 yearsOutcomes:weight data, totalcholesterol, HDLcholesterol, LDLcholesterol, TGs,SBP, DBP, HbA1c,fasting plasmaglucose,development oftype 2 diabetes,compliance
Author confirmedmain study andsubstudy reportsSponsorship:National Institutesof Health,Obesity/NutritionResearch Center,General ClinicalResearch Center
continued

Appendix 8
298
TABLE 23 Included non-drug studies (cont’d)
Study ID Methods Participants Interventions Outcomes Notes
Wing, 1999 Randomisation:allocation concealment:B(I)Assessor blinding: noITT: yes
Location: University ofPittsburgh, USA Period of study: before July1998Inclusion criteria: eithergender, 25–55 years, 6.8–31.8 kgabove IBW, generally good healthExclusion criteria: not stated Gender: 84 women, 82 men Age (years): mean (SD) a: 41.8(9.2), b: 43.5 (7.8), c: 40.6 (8.3),d: 43.8 (8.6)BMI (kg/m2): mean (SD) a: 30.6(3.7), b: 31.8 (3.1), c: 32.1 (3.7),d: 30.3 (4.0)Baseline comparability: yes
Timing of active intervention: a–d: 16 weeks with follow-up at 16 months, contacted 18 times (baseline then weekly for initial 16 weeks, then at16 months)Description of intervention:a–d: all participants advised to eat ≤ 1000 kcal/day with 22 g of fat if weighed <90.7 kg at baseline, or ≤ 1500 kcal/day with 33 g of fat if baseline > 90.7 kg; givengrocery lists and meal plans weekly during initial 16 weeks,exercise prescribed in gradual increments up to 100 kcal/week expenditure [equivalent to walking for 2miles (3.2 km) 5 days/week], food and exercise diariescompleted during 16 weeks, behavioural lessons focused onproblem solving, assertion, stimulus control, developingsocial support, dealing with high-risk situations, cognitionand maintenance strategies,a: recruited alone with no effort to increase communicationin group, $25 deposit refunded for attending each follow-upat months 4 and 10b: participants assigned to a team of 4 members and givensocial support intervention involving intragroup activitiessuch as calling other members of their team to providesupport, group assignments and an intragroup competitionwith team who had largest number of its membersretaining their weight loss in full from months 4–7 andmonths 4–10, jackpot consisted of $25 of each participant’sdepositc: recruited with friends, but relationships among andbetween teams not acknowledged, identical programme togroup ad: recruited with 4 friends who became natural team andreceived same social support as group bAllocated: a: 38, b: 48, c: 40, d: 40 Completed: 90 overall at 16 months % Dropout: 46% overall at 16 months Assessed: a: 38, b: 48, c: 40, d: 40 (ITT, with dropoutsassumed to have returned to baseline weights)
Length offollow-up: 16 monthsOutcome:weight data
Groups a + b andgroups c + dassessed inaggregateSponsorship:National Health,Lung and BloodInstitute
continued

Health Technology Assessm
ent2004; Vol. 8: No. 21
299
© Q
ueen’s Printer and Controller of H
MSO
2004. All rights reserved.
TABLE 23 Included non-drug studies (cont’d)
Study ID Methods Participants Interventions Outcomes Notes
Wood, 1988 Randomisation: 4 cohorts, sealedenvelopes, no furtherdetails, at end of yearparticipants in 2 activetreatment groups wererandomly assignedwithin each condition to2 maintenanceconditions. Allocationconcealment: B(I)Assessor blinding: noin year 1, blinded inyear 2ITT: no
Location: Stanford University,California, USAPeriod of study: beforeDecember 1987Inclusion criteria: men, 30–59 years, 120–160% IBW, noregular exercise for past 3 months, non-smokers, clinicallyhealthy, resting clinic BP< 160/100 mmHg, plasmacholesterol < 8.28 mmol/l,plasma TGs < 5.65 mmol/l,average < 4 alcoholic drinks/day,expected to reside in Stanfordarea for at least 1 year, normalECG during grade treadmill testExclusion criteria: orthopaediclimitations, medications known toaffect BP or plasma lipids Gender: 155 men Age (years): mean (SD) a1: 44.2(8.2), b1: 44.1 (7.8), c: 45.2 (7.2)for 131 participants assessed Weight (kg): mean (SD) a1: 93.0(8.8), b1: 94.1 (8.6), c: 95.4(10.6) for 131 participantsassessedBaseline comparability: yes
Timing of active intervention: a1 + b1: 12 months, no details of frequency of contact c: contacted 3 times during 12 months (baseline then 7 and12 months)a2 + b2: monthly mailings during year 2, telephone contactof 5–10 minutes each during months 13, 14 and 15 and atmonths 18, 21 and 24a3 + b3: contacted twice (at 18 and 24 months)Description of intervention:a1: baseline 7-day diet recall and fat body mass used toprovide individual counselling including behaviouralstrategies, to reduce calorie intake to produce gradualweight loss and to lose one-third of body fat (assumed areduction of 7762 kcal = loss of 1 kg adipose tissue); nochange in nutrient composition, requested to remainsedentary, included weight stabilisation for last 6 weeks b1: received supervised exercise training session topromote increase in calorie expenditure and body fat lossof one-third, consisting of 1 hour 3 times/week, includingcalisthenics, walking, jogging and principally running at60–80% peak heart rate (according to treadmill testresults), advised to increase routine physical activity plus 2more sessions/week unsupervised exercise; activity logskept and advised not to change diet including composition,weight stabilisation last 6 weeksc: participants advised not to make any changes in dietincluding composition, exercise or body weight, offeredweight loss programme of diet and exercise at end of thestudya2 + b2: participants received telephone contact duringmonths 13, 14 and 15 and at months 18, 21 and 24 toanswer any questions relevant to original weight losstreatment; 7-day food recall and physical activity recallquestionnaire completed at end of year 1 and end of year2, monthly mail contact to prevent relapses to unwantedbehaviour, included supportive letter, brief self-scoredassessment of particular problem area specific to originalweight control treatment group and list of coping
Length offollow-up: 2 yearsOutcomes:weight data, totalcholesterol, LDLcholesterol, HDLcholesterol, TGs,SBP, DBP
First year data onlyusedSponsorship:National Heart,Lung and BloodInstitute, NationalInstitutes of Health
continued

Appendix 8
300
TABLE 23 Included non-drug studies (cont’d)
Study ID Methods Participants Interventions Outcomes Notes
suggestions, option of continuing with self-monitoring logs,given written information on the weight control methodparticipants had not received in year 1, encouraged toobtain support from members of original treatment groupa3 + b3: did not receive any mailings or telephone contactduring year 2, assessed at 18 months and 24 monthsAllocated: a1: 51, b1: 52, c: 52 at baseline; a2: 24, a3: 20,b2: 24, b3: 22Completed: a1: 49, b1: 51, c: 49 at 1 year; a2: 20, a3: 16,b2: 21, b3: 15 at 2 years% Dropout: a1: 4%, b1: 2%, c: 6%, at 1 year; a2: 17%,a3: 20%, b2: 13%, b3: 32% at 2 yearsAssessed: a1: 42, b1: 47, c: 42 at 1 year; a2: 20, a3: 16, b2: 21, b3: 15 at 2 years
continued

Health Technology Assessm
ent2004; Vol. 8: No. 21
301
© Q
ueen’s Printer and Controller of H
MSO
2004. All rights reserved.
TABLE 23 Included non-drug studies (cont’d)
Study ID Methods Participants Interventions Outcomes Notes
Wood, 1991Wood, 1991a:womenWood, 1991b:men
Randomisation: 3cohorts, stratified bygender. Allocationconcealment: B(I)Assessor blinding: no ITT: no
Location: Stanford University,California, USAPeriod of study: before 1991Inclusion criteria: eithergender, 25–49 years, 120–150%IBW, BMI 28–34 kg/m2 men,24–30 kg/m2 women, non-smokers, sedentary (exercise lessthan twice per week, < 30 minutes each time), restingBP < 160/95 mmHg, plasmacholesterol < 6.72 mmol/l,plasma TGs < 5.65 mmol/l,average <4 alcoholic drinks/day,generally good health Exclusion criteria: medicationknown to affect BP or lipidmetabolism, pregnancy, lactatingor taking oral contraceptive inpast 6 months or planningpregnancy in subsequent 2 years Gender: 132 women, 132 men Age (years): mean (SD) 39.1(6.4) women, 40.3 (6.3) menBMI (kg/m2): mean (SD) 27.9(2.2) women, 30.7 (2.2) menBaseline comparability:significant difference in DBP inmen in groups a + b vs c(control) (p < 0.001), significantdifference in total cholesterol infemales group a vs control (p ≤ 0.01), group b vs control (p ≤ 0.05), and LDL cholesterolin females group a and group bvs control (p ≤ 0.05)
Timing of active intervention: a: 1 year, contacted 25 times (baseline, weekly for first 3 months, then every other week for 3 months, thenmonthly)b: 1 year, contacted 181 times (baseline, 3 times/week for 1 year plus weekly for first 3 months, then every otherweek for 3 months, then monthly)c: contacted twice, at baseline and at 1 yearDescription of intervention:a: National Cholesterol Education Program (NCEP) step 1diet consisting of 55% CHO, 30% fat (with saturated fat≤ 10%) dietary cholesterol < 300 mg/day, caloriereduction, no change in exerciseb: received identical diet to group a and aerobic exercise(brisk walking or jogging) at 60–80% maximum heart rateinitially for 25 minutes 3 times/week increasing to 45 minutes 3 times/week by month 4, monthly activity logskeptc: instructed to maintain usual diet and exercise patternsAllocated: a: 87, b: 90, c: 87 Completed: 237 overall at 1 year % Dropout: a: 10%, b: 18%, c: 10% at 1 year Assessed: a: 71, b: 81, c: 79 at 1 year
Length offollow-up: 1 yearOutcomes:weight data, totalcholesterol, LDLcholesterol, HDLcholesterol, TGs,SBP, DBP
Outcome datapresented bygenderSponsorship:National Institutesof Health
BCDD, balanced calorie deficit diet.

Health Technology Assessment 2004; Vol. 8: No. 21
303
© Queen’s Printer and Controller of HMSO 2004. All rights reserved.
Appendix 9
Characteristics of ongoing and recently completed RCTs not included in this review

Appendix 9
304
Trial name or Participants Interventions Main outcomes Date Contact information Notestitle
CHARMONTstudyGermany
47 participants,18–65 years, BMI≥ 40 kg/m2, nosignificantdifferencebetween baselinevalues
Diet plus aqua-fitness plusbehaviourtherapy plussibutramine10 mg/day vsgastric banding
BMI, % overweight,BP, HbA1c%, totalcholesterol, LDLcholesterol, HDLcholesterol, plasmaglucose, economiccosts, QoL, post-operativecomplications
Ongoing2000
Dr S Klaua, MedizinischeUniversitäts-Poliklinik,Charité, Humboldt-UniversitätLuisenstrasse 11–13a, D-10117 Berlin, Germany
Preliminary 12-month data available for 15conservatively treated participants and 12 surgicallytreated participants: reduction of overweight 35% vs48% (conservative vs surgical), all parameters ofmetabolism improved significantly in conservative groupexcept BP, which increased by 3 mmHg vs decrease of–32 mmHg in surgical group, HbA1c –24% vs –16%(conservative vs surgical)
DiabetesPreventionProgram(DPP)27 centres inUSA
3234 participants,both genders, ≥ 25 years, BMI≥ 24 kg/m2
(≥ 22 kg/m2 ifAsian), IGT plusfasting plasmaglucose of5.3–6.9 mmol/l(or ≤ 6.9mmol/l if AmericanIndians)
Intensive lifestylemodification vsstandard careplus metformin vsstandard careplus placebo
Development ofdiabetes, defects ininsulin sensitivity andsecretion,development and/orprogression ofvascular diseases andcardiovascular riskfactors, weight
Completed Diabetes Prevention ProgramCoordinating Center, GeorgeWashington University, 6110Executive Boulevard, Suite750, Rockville, MD 20852,[email protected]
Diabetes Prevention Program Group. The DiabetesPrevention Program. Design and methods for a clinicaltrial in the prevention of type 2 diabetes. Diabetes Care1999;22:623–34.Diabetes Prevention Program Group. The DiabetesPrevention Program. Baseline characteristics of therandomized cohort. Diabetes Care 2000;23:1619–29.Diabetes Prevention Program Research Group.Reduction in the incidence of type 2 diabetes withlifestyle intervention or metformin. N Engl J Med 2002;346:393–403.
GaleMetformin toprevent weightgain in type 2diabetic patientsstarting insulin,UK
Participants withtype 2 diabetes,≤ 75 years
Metformin vsplacebo
Weight, waist–hipratio, glycatedhaemoglobin, serumlipids, participantsatisfaction
Ongoing1998
Professor EA Gale,Department of MetabolicMedicine, Southmead Hospital,Southmead Road, Bristol BS105NB, UK
Information obtained from UK National ResearchRegister. URL:http://www.update-software.com/National/
continued

Health Technology Assessm
ent2004; Vol. 8: No. 21
305
© Q
ueen’s Printer and Controller of H
MSO
2004. All rights reserved.
Trial name or Participants Interventions Main outcomes Date Contact information Notestitle
HeshkaSelf-help weightloss vs astructuredcommercialprogramme, 6centres in USA
423 participants,both genders,18–65 years, BMI27–40 kg/m2, notdiabetics
Self-helpprogramme andtwo 20-minutesessions withnutritionist vsWeight Watchersprogramme
Weight, waistcircumference
Ongoing2000
Dr S Heshka, New YorkObesity Research Center, StLuke’s/Roosevelt HospitalCenter, 1090 AmsterdamAvenue, 14C, NY 10025, USA
26-week results in: Heshka S, Greenway F, Anderson JW, Atkinson RL, Hill JO, Phinney SD, et al.Self-help weight loss versus a structured commercialprogram after 26 weeks: a randomized controlledstudy. Am J Med 2000;109:282–7.
KelleyOrlistat inpeople withinsulin-treatedtype 2 diabetes,USA
550 participants,40–65 years, BMI28–43 kg/m2,type 2 diabetes,HBA1c7.5–12.0%,stable dose ofinsulin
Orlistat 120 mgthree times dailyand low-fat dietvs placebo anddiet
Weight, use ofdiabetesmedications,glycaemic control,lipids, BP, adverseevents
Completed Dr DE Kelley, 3459 FifthAvenue, University ofPittsburgh MontefioreHospital, N809 Pittsburgh, PA15213, USA [email protected]
Kelley, Bray GA, Pi-Sunyer FX, Klein S, Hill J, Miles J, et al. Clinical efficacy of orlistat therapy in overweightand obese patients with insulin-treated type 2 diabetes.Diabetes Care 2002;25:1033–41.
KeyserlingDiabetesmanagementprogramme forAfrican–Americanwomen withtype 2 diabetes,7 practices inNorth Carolina,USA
200 African–American womenwith type 2diabetes for ≥ 3 years
Clinic andcommunity NewLeaf Programme(diet, exerciseand behaviourtherapy) vs clinicNew LeafProgramme vscontrol
Weight, glycatedhaemoglobin, serumlipids
Ongoing2000
Dr TC Keyserling, CB# 8140,1700 Airport Road, Universityof North Carolina at ChapelHill, Chapel Hill, NC 27599,[email protected]
Methods in: Keyserling TC, Ammerman AS, Samuel-Hodge CD, Ingram AF, Skelly AH, Elasy TA, et al. Adiabetes management program for African Americanwomen with type 2 diabetes. Diabetes Educ 2000;26:796–804.
Look AHEAD(Action forHealth inDiabetes)Multicentretrial, USA
5000 participants,both genders,45–75 years, BMI≥ 25 kg/m2, type2 diabetes
Intensive diet,exercise andbehaviour therapy,ongoing contactand weight lossmedications vsdiabetes supportand education
Primary outcome:aggregateoccurrence of severecardiovascular eventsover 11.5 years;secondary outcome:vascular events,weight
Ongoing2001
http://show.phs.wfubmc.edu/
continued

Appendix 9
306
Trial name or Participants Interventions Main outcomes Date Contact information Notestitle
McKeigueDevelopmentand validation ofa weight losingdietaryintervention toreduce the riskof diabetes andCHD in SouthAsians, UK
72 South Asiansand Europeans,both genders,35–59 years,central obesity
Individuallytailored low-fat,low-energy dietbased oncomputerassessment vs nointervention
Weight, fatdistribution, insulinresponse to glucoseload
Unclear Dr P McKeigue, Epidemiology,Sciences Department, KeppelStreet, London WC1E 7HT,UK
Information obtained from UK National ResearchRegister.URL:http://www.update-software.com/National/
McMahonSibutramine inpeople withwell-controlledhypertension,USA
220 participants,both genders,≥ 18 years, BMI≥ 27 kg/m2 and< 40 kg/m2, well-controlledhypertension onangiotensin-convertingenzyme inhibitors
Sibutramine20 mg daily andweight reductionadvice vs placeboand same advice
BMI, weight,waist–hip ratio, BP,lipids, adverse events
Completed Dr FG McMahon, ClinicalResearch Center, 147 SouthLiberty Street, New Orleans,LA 70112, [email protected]
McMahon FG, Weinstein SP, Rowqe E, Ernst KR,Johnson F, Fujioka K, et al. Sibutramine is safe andeffective for weight loss in obese patients whosehypertension is well controlled with angiotensin-converting enzyme inhibitors. J Hum Hypertens 2002;16:5–11.
MeneillyAcarbose inelderly patientswith diabetes, 5 centres inNorth America
Older peoplewith diet-controlleddiabetes
Acarbose vsplacebo
Diabetic control,weight
Ongoing2000
DR GS Meneilly, Room S169,Vancouver Hospital and HealthSciences Centre, UBC Site,2211 Wesbrook Mall,Vancouver BC, Canada [email protected]
Subgroup data published as: Meneilly GS, Ryan EA,Radziuk J, Lau DC, Yale J-F, Morais J, et al. Effect ofacarbose on insulin sensitivity in elderly patients withdiabetes. Diabetes Care 2000;23:1162–7.
continued

Health Technology Assessm
ent2004; Vol. 8: No. 21
307
© Q
ueen’s Printer and Controller of H
MSO
2004. All rights reserved.
Trial name or Participants Interventions Main outcomes Date Contact information Notestitle
MilesOrlistat inpeople withtype 2 diabetestreated withmetformin, USA
516 participants,40–65 years, BMI28–43 kg/m2,type 2 diabetes,HBA1c7.5–12.0%,taking metforminwith or withoutsulfonylureas
Orlistat 120 mgthree times dailyand 600 kcal/daydeficit diet vsplacebo and diet
Weight, use ofdiabetesmedications,glycaemic control,lipids, BP, adverseevents
Completed Dr JM Miles, Division ofEndocrinology andMetabolism, Mayo Clinic, 200First St SW, Rochester, MN55905, [email protected]
Miles JM, Leiter L, Hollander P, Wadden T, Anderson JW, Doyle M, et al. Effect of orlistat inoverweight and obese patients treated with metformin.Diabetes Care 2002;25:1123–8.
STOP-NIDDMMulticentre,internationaltrial
1418 participants,both genders,40–70 years, BMI24–40 kg/m2,impaired glucosetolerance (oldWHO criteria)
Acarbose 100 mgthree times dailyvs placebo
Development of type 2 diabetes,cardiovascularevents, BP, lipids,weight
Completed Dr J-L Chiasson, ResearchGroup on Diabetes andMetabolic Regulation, Research Center, CHUM,Campus Hôtel-Dieu, 3830 Rue St Urbain, Montreal,Quebec H2W 1T8, Canada,[email protected]
Design and baseline data in: The STOP-NIDDM trial.An international study on the efficacy of an �-glucosidase inhibitor to prevent type 2 diabetes in apopulation with impaired glucose tolerance: rationale,design, and preliminary screening data. Diabetes Care1998;21:1720–5.Chiasson J-L, Josse RG, Gomis R, Hanefeld, Karasik A,Laakso M, for the STOP-NIDDM Trial Research Group.Acarbose for prevention of type 2 diabetes mellitus: theSTOP-NIDDM randomised trial. Lancet 2002;359:2072–7.
XENDOSMulticentretrial, Sweden
Both genders,30–60 years, BMI≥ 30 kg/m2, non-diabetic, ≥ 10%had IGT
Orlistat 120 mgthree times dailyand 800 kcal/daydeficit diet vs dietand placebo
Development of type 2 diabetes
Completed Professor L Sjöström, SOSSecretariat, Vita Stråket 15,Sahlgrenska UniversityHospital, 413 45 Göteborg,[email protected]
Torgerson JS, Arlinger K, Käppi M, Sjöström L.Principles for enhanced recruitment of subjects in alarge clinical trial: the XENDOS study experience.Control Clin Trials 2001;22:515–25.Study reviewed in: Scheen AJ. Prévention du diabète detype 2 chez le sujet obèse: premiers résultats avecl’orlistat dans l’étude XENDOS. Rev Med Liege 2002;57:617–21.


Abrams DB, Follick MJ. Behavioral weight-lossintervention at the worksite: feasibility and maintenance.J Consult Clin Psychol 1983;51:226–33 (42 weeks).
Adachi Y. The effect of behavioral treatment of obesityand correlates of weight loss in treatment and at 2-yearfollow-up. Jpn J Behav Ther 1989;15:36–55 (BMI not≥ 28 kg/m2).
Adolfsson B, Andersson I, Apelman J, Bengtsson B,Rossner S, Thorne A. Quality of life in obese patientsbefore and after weight loss – behaviour modification +adjustable gastric banding (AGB) vs. AGB. Int J Obes2001;25(Suppl 2):S122 (abstract only).
Agewall S, Fagerberg B, Berglund G, Schmidt C,Wendelhag I, Wikstrand J, et al. Multiple riskintervention trial in high risk hypertensive men:comparison of ultrasound intima-media thickness andclinical outcome during 6 years of follow-up. J InternMed 2001;249:305–14 (BMI not ≥ 28 kg/m2).
Agras WS, Telch CF, Arnow B, Eldredge K, Wilfley DE,Raeburn SD, et al. Weight loss, cognitive-behavioral, anddesipramine treatments in binge eating disorder. Anadditive design. Behav Ther 1994;25:225-38 (48 weeks).
Agras WS, Telch CF, Arnow B, Eldredge K, Detzer MJ,Henderson J, et al. Does interpersonal therapy helppatients with binge eating disorder who fail to respondto cognitive-behavioral therapy? J Consult Clin Psychol1995;63:356–60 (24 weeks).
Agurs-Collins TD, Kumanyika SK, Ten Have TR,Adams-Campbell LL. A randomized controlled trial ofweight reduction and exercise for diabetes managementin older African–American subjects. Diabetes Care 1997;20:1503–11 (6 months).
Allison TG, Squires RW, Johnson BD, Gau GT.Achieving National Cholesterol Education Programgoals for low-density lipoprotein cholesterol in cardiacpatients: importance of diet, exercise, weight control,and drug therapy. Mayo Clin Proc 1999;74:466–73 (BMInot ≥ 28 kg/m2).
Allison TG, Farkouh ME, Smars PA, Evans RW, Squires RW, Gabriel SE, et al. Management of coronaryrisk factors by registered nurses versus usual care inpatients with unstable angina pectoris (a chest painevaluation in the emergency room [CHEER] substudy).Am J Cardiol 2000;86:133–8 (6 months).
Amato S, Colajanni E, Averna MR, Barbagallo CM, Lo Cascio ML, Traina G, et al. Diet and psychologicaltherapy in a group of severely obese patients [in Italian].Minerva Endocrinol 1990;15:219–21 (9 months).
Andersen RE, Wadden TA, Bartlett SJ, Vogt RA,Weinstock RS. Relation of weight loss to changes inserum lipids and lipoproteins in obese women. Am J ClinNutr 1995;62:350–7 (48 weeks).
Andersen RE, Wadden TA, Herzog RJ. Changes in bonemineral content in obese dieting women. Metabolism1997;46:857–61 (24 weeks).
Andersen T, Hyldstrup L, Quaade F. Formula diet in thetreatment of moderate obesity. Int J Obes 1983;7:423–30(36 weeks).
Anderson JV, Mavis BE, Robison JI. A work-site weightmanagement program to reinforce behavior. J OccupMed 1993;35:800–4 (6 months).
Andersson I, Adolfsson B, Apelman J, Bengtsson B,Rossner S, Thorne A. Prospective randomisedcontrolled study with a 3 year follow-up – behaviourmodification + gastric banding (AGB) vs AGB. Int JObes 2001;25(Suppl 2):S27 (abstract only).
Applegate WB, Miller ST, Elam JT, Cushman WC, el Derwi D, Brewer A, et al. Nonpharmacologicintervention to reduce blood pressure in older patientswith mild hypertension. Arch Intern Med 1992;152:1162–6 (6 months).
Aviles-Santa L, Sinding J, Raskin P. Effects of metforminin patients with poorly controlled, insulin-treated type 2diabetes mellitus. A randomized, double-blind, placebo-controlled trial. Ann Intern Med 1999;131:182–8 (24 weeks).
Axsom D, Cooper J. Cognitive dissonance andpsychotherapy: the role of effort justification ininducing weight loss. J Exp Soc Psychol 1985;21:149–60(BMI not ≥ 28 kg/m2).
Bahadori B, Smolle KH, Habersack-Wallner S, Toplak H,Wascher TC. Randomized comparison of the effects of avery low calorie diet (Modifast™) and conventionaldietary treatment on weight loss and risk parameters foratherosclerosis in obese outpatients [in German].Aktuelle Ernahrung Klin Prax 1996;21:93–7 (48 weeks).
Bak AA, Huizer J, Leijten PA, Rila H, Grobbee DE. Diet and pravastatin in moderate hypercholesterolaemia:a randomized trial in 215 middle-aged men free fromcardiovascular disease. J Intern Med 1998;244:371–8(BMI not ≥ 28 kg/m2).
Ball KP, Hanington E, McAllen PM, Pilkington TR,Richards JM, Sharland DE, et al. Low-fat diet inmyocardial infarction: a controlled trial. Lancet 1965;ii:501–4 (BMI not ≥ 28 kg/m2).
Health Technology Assessment 2004; Vol. 8: No. 21
309
© Queen’s Printer and Controller of HMSO 2004. All rights reserved.
Appendix 10
References to excluded RCTs

Basler H-D, Brinkmeier U, Buser K. Psychologicalgroup treatment of essential hypertension in generalpractice. Br J Clin Psychol 1982;21:295–302 (9 months).
Basler H-D, Brinkmeier U, Buser K, Haehn KD,Molders S, Kober R. Psychological group treatment ofobese essential hypertensives by lay therapists in ruralgeneral practice settings. J Psychosom Res 1985;29:383–91 (10 months).
Beckmann SL, Os I, Kjeldsen SE, Eide IK, Westheim AS,Hjermann I, et al. Effect of dietary counselling on bloodpressure and arterial plasma catecholamines in primaryhypertension. Am J Hypertens 1995;8:704–11 (BMI not≥ 28 kg/m2).
Bertram SR, Venter I, Stewart RI. Weight loss in obesewomen – exercise v. dietary education. S Afr Med J1990;78:15–18 (no 12-month weight data by treatmentgroup).
Black DR, Scherba DS, Dale S. Contracting to problemsolve versus contracting to practice behavioral weightloss skills. Behav Ther 1983;14:100–9 (not all participantsrandomised).
Black DR, Coe WC, Friesen JG, Wurzmann AG. Minimalinterventions for weight control: a cost-effectivealternative. Addict Behav 1984;9:279–85 (7 months).
Blacket RB, Leelarthaepin B, McGilchrist CA, Palmer AJ,Woodhill JM. The synergistic effect of weight loss andchanges in dietary lipids on the serum cholesterol ofobese men with hypercholesterolaemia: implications forthe prevention of coronary heart disease. Aust N Z J Med1979;9:521–9 (BMI not ≥ 28 kg/m2).
Blair SN, Shaten J, Brownell K, Collins G, Lissner L.Body weight change, all-cause mortality, and cause-specific mortality in the Multiple Risk FactorIntervention Trial. Ann Intern Med 1993;119:749–57(BMI not ≥ 28 kg/m2).
Blaufox MD, Lee HB, Davis B, Oberman A, Wassertheil-Smoller S, Langford H. Renin predicts diastolic bloodpressure response to nonpharmacologic andpharmacologic therapy. JAMA 1992;267:1221–5 (6 months).
Bloemberg BP, Kromhout D, Goddijn HE, Jansen A,Obermann-de Boer GL. The impact of the Guidelinesfor a Healthy Diet of The Netherlands NutritionCouncil on total and high density lipoproteincholesterol in hypercholesterolemic free-living men. AmJ Epidemiol 1991;134:39–48 (BMI not ≥ 28 kg/m2).
Blumenthal JA, Sherwood A, Gullette EC, Babyak M,Waugh R, Georgiades A, et al. Exercise and weight lossreduce blood pressure in men and women with mildhypertension: effects on cardiovascular, metabolic, andhemodynamic functioning. Arch Intern Med 2000;160:1947–58 (26 weeks).
Bonk S, Hubotter E, Nickel C, Stocksmeier U, Vahey P,Volk I, et al. Myocardial infarct patients with and withoutintensive nutrition consultation over several years –comparison of physiological and social variables [in
German]. Infusionstherapie Klin Ernahrung 1975;2:290–6(BMI not ≥ 28 kg/m2).
Borrie RA, Suedfeld P. Restricted environmentalstimulation therapy in a weight reduction program. J Behav Med 1980;3:147–61 (6 months).
Bowen D, Clifford CK, Coates R, Evans M, Feng Z,Fouad M, et al. The Women’s Health Trial FeasibilityStudy in Minority Populations: design and baselinedescriptions. Ann Epidemiol 1996;6:507–19 (BMI not≥ 28 kg/m2).
Boyd NF, Cousins M, Kriukov V. A randomizedcontrolled trial of dietary fat reduction: the retention ofsubjects and characteristics of drop outs. J Clin Epidemiol1992;45:31–8 (BMI not ≥ 28 kg/m2).
Boyd NF, Greenberg C, Lockwood G, Little L, Martin L,Byng J, et al. Effects at two years of a low-fat, high-carbohydrate diet on radiologic features of the breast:results from a randomized trial. Canadian Diet andBreast Cancer Prevention Study Group. J Natl CancerInst 1997;89:488–96 (BMI not ≥ 28 kg/m2).
Bray GA, Blackburn GL, Ferguson JM, Greenway FL,Jain AK, Mendel CM, et al. Sibutramine produces dose-related weight loss. Obes Res 1999;7:189–98 (30 weeks).
Brightwell DR, Naylor CS. Effects of a combinedbehavioral and pharmacological program on weightloss. Int J Obes 1979;3:141–8 (24 weeks).
Brownell KD, Cohen RY, Stunkard AJ, Felix MR, Cooley NB. Weight loss competitions at the work site:impact on weight, morale and cost-effectiveness. Am JPublic Health 1984;74:1283–5 (6 months).
Burnett KF, Taylor CB, Agras WS. Ambulatorycomputer-assisted therapy for obesity: a new frontier forbehavior therapy. J Consult Clin Psychol 1985;53:698–703(40 weeks).
Buzzard IM, Faucett CL, Jeffrey RW, McBane L,McGovern P, Baxter JS, et al. Monitoring dietary changein a low-fat diet intervention study: advantages of using24-hour dietary recalls vs food records. J Am Diet Assoc1996;96:574–9 (BMI not ≥ 28 kg/m2).
Campbell LV, Barth R, Gosper JK, Jupp JJ, Simons LA,Chisholm DJ. Impact of intensive educational approachto dietary change in NIDDM. Diabetes Care 1990;13:841–7 (6 months).
Caplan GA, Colagiuri R, Lord SR, Colagiuri S. Exercisein older people with type II diabetes maintains bonedensity despite weight loss. Aust J Ageing 1995;14:71–5(BMI not ≥ 28 kg/m2).
Carlsen SM, Folling I, Grill V, Bjerve KS, Schneede J,Refsum H. Metformin increases total serumhomocysteine levels in non-diabetic male patients withcoronary heart disease. Scand J Clin Lab Invest 1997;57:521–7 (40 weeks).
Casebeer LL, Klapow JC, Centor RM, Stafford MA,Renkl LA, Mallinger AP, et al. An intervention toincrease physicians’ use of adherence-enhancing
Appendix 10
310

strategies in managing hypercholesterolemic patients.Acad Med 1999;74:1334–9 (9 months).
Caserta MS, Gillett PA. Older women’s feelings aboutexercise and their adherence to an aerobic regimen overtime. Gerontologist 1998;38:602–9 (no weight data).
Cederholm J. Short-term treatment of glucoseintolerance in middle-aged subjects by diet, exercise andsulfonylurea. Upps J Med Sci 1985;90:229–42 (6 months).
Cella F, Adami GF, Giordano G, Cordera R. Effects ofdietary restriction on serum leptin concentration inobese women. Int J Obes Relat Metab Disord 1999;23:494–7 (6 months).
Chlebowski RT, Blackburn GL, Buzzard IM, Rose DP,Martino S, Khandekar JD, et al. Adherence to a dietaryfat intake reduction program in postmenopausal womenreceiving therapy for early breast cancer. The Women’sIntervention Nutrition Study. J Clin Oncol 1993;11:2072–80 (BMI not ≥ 28 kg/m2).
Christensen JO, Svendsen OL, Hassager C, Christiansen C. Leptin in overweight postmenopausalwomen: no relationship with metabolic syndrome X oreffect of exercise in addition to diet. Int J Obes RelatMetab Disord 1998;22:195–9 (9 months).
Clark AM, Roberts B, Galletly B, Tomlinson L, Norman RJ. Maximizing weight loss in the overweightinfertile patient – a prospective randomized controlledtrial. Hum Reprod 2000;15(Suppl 1):65–6 (abstract only).
Colman E, Katzel LI, Rogus E, Coon P, Muller D,Goldberg AP. Weight loss reduces abdominal fat andimproves insulin action in middle-aged and older menwith impaired glucose tolerance. Metabolism 1995;44:1502–8 (?9 months).
Coniff RF, Shapiro JA, Seaton TB. Long-term efficacyand safety of acarbose in the treatment of obese subjectswith non-insulin-dependent diabetes mellitus. ArchIntern Med 1994;154:2442–8 (36 weeks).
Cordero-MacIntyre ZR, Lohman TG, Rosen J, Peters W,Espana RC, Dickinson B, et al. Weight loss is correlatedwith an improved lipoprotein profile in obesepostmenopausal women. J Am Coll Nutr 2000;19:275–83(9 months).
Cox KL, Puddey IB, Burke V, Beilin LJ, Morton AR,Bettridge HF. Determinants of change in BP duringSWEAT. The Sedentary Women Adherence Trial. ClinExp Pharmacol Physiol 1996;23:567–9 (BMI not≥ 28 kg/m2).
Croft PR, Brigg D, Smith S, Harrison CB, Branthwaite A,Collins MF. How useful is weight reduction in themanagement of hypertension? J R Coll Gen Pract 1986;36:445–8 (6 months).
Cuellar GE, Ruiz AM, Monsalve MC, Berber A. Six-month treatment of obesity with sibutramine 15 mg;a double-blind, placebo-controlled monocenter clinicaltrial in Hispanic population. Obes Res 2000;8:71–82 (6 months).
Dahlkoetter J, Callahan EJ, Linton J. Obesity and theunbalanced energy equation: exercise versus eatinghabit change. J Consult Clin Psychol 1979;47:898–905 (8 months).
de Bont AJ, Baker IA, St Leger AS, Sweetnam PM,Wragg KG, Stephens SM, et al. A randomised controlledtrial of the effect of low fat diet advice on dietaryresponse in insulin independent diabetic women.Diabetologia 1981;21:529–33 (6 months).
D’Eramo GA. A comparison of intensity of educationalintervention on knowledge, attitude, weight andmetabolic control in obese individuals with type II non-insulin dependent diabetes mellitus. Dissert Abstr Int1988;49:43 (no 12-month weight data).
D’Eramo-Melkus GA, Wylie RJ, Hagan JA. Metabolicimpact of education in NIDDM. Diabetes Care 1992;15:864–9 (no 12-month weight data).
DeFronzo RA, Goodman AM. Efficacy of metformin inpatients with non-insulin-dependent diabetes mellitus.The Multicenter Metformin Study Group. N Engl J Med1995;333:541–9 (29 weeks).
Dengel DR, Hagberg JM, Coon PJ, Drinkwater DT,Goldberg AP. Effects of weight loss by diet alone orcombined with aerobic exercise on body composition inolder obese men. Metabolism 1994;43:867–71 (10months).
Dengel DR, Hagberg JM, Coon PJ, Drinkwater DT,Goldberg AP. Comparable effects of diet and exercise onbody composition and lipoproteins in older men. MedSci Sports Exerc 1994;26:1307–15 (10 months).
Dengel DR, Pratley RE, Hagberg JM, Rogus EM,Goldberg AP. Distinct effects of aerobic exercise trainingand weight loss on glucose homeostasis in obesesedentary men. J Appl Physiol 1996;81:318–25 (10months).
Dengel DR, Galecki AT, Hagberg JM, Pratley RE. Theindependent and combined effects of weight loss andaerobic exercise on blood pressure and oral glucosetolerance in older men. Am J Hypertens 1998;11:1405–12(9 months).
Dengel JL, Katzel LI, Goldberg AP. Effect of anAmerican Heart Association diet, with or without weightloss, on lipids in obese middle-aged and older men. Am J Clin Nutr 1995;62:715–21 (9 months).
Dennis KE, Pane KW, Adams BK, Qi BB. The impact ofa shipboard weight control program. Obes Res 1999;7:60–7 (6 months).
Doherty JU, Wadden TA, Zuk L, Letizia KA, Foster GD,Day SC. Long-term evaluation of cardiac function inobese patients treated with a very-low-calorie diet: acontrolled clinical study of patients without underlyingcardiac disease. Am J Clin Nutr 1991;53:854–8 (45 weeks).
Doucet E, Imbeault P, Almeras N, Tremblay A. Physicalactivity and low-fat diet: is it enough to maintain weightstability in the reduced-obese individual following
Health Technology Assessment 2004; Vol. 8: No. 21
311
© Queen’s Printer and Controller of HMSO 2004. All rights reserved.

weight loss by drug therapy and energy restriction?Obes Res 1999;7:323–33 (37 weeks).
Dracup K, Meleis AI, Clark S, Clyburn A, Shields L,Staley M. Group counseling in cardiac rehabilitation:effect on patient compliance. Patient Educ Counsel 1984;6:169–77 (6 months).
Dramaix M, Kornitzer M, De Backer G, Thilly C, KittelF, Graffar M. The Belgian Heart Disease PreventionProject [in French]. Rev Epidemiol Sante Publique 1981;29:289–303 (no weight data).
Dubbert PM, Wilson GT. Goal-setting and spouseinvolvement in the treatment of obesity. Behav Res Ther1984;22:227–42 (no usable data).
Dujovne CA, Zavoral JH, Rowe E, Mendel CM. Effectsof sibutramine on body weight and serum lipids: adouble-blind, randomized, placebo-controlled study in322 overweight and obese patients with dyslipidemia.Am Heart J 2001;142:388–90 (24 weeks).
Dyson PA, Hammersley MS, Morris RJ, Homan RR,Turner RC, on behalf of the fasting HyperglycaemiaStudy Group. The fasting hyperglycaemia study: II.Randomized controlled trial of reinforced healthy-livingadvice in subjects with increased but not diabetic fastingplasma glucose. Metabolism 1997;48(Suppl 1):50–5 (nousable data).
Epstein LH, Wing RR, Koeske R, Valoski A. Effects ofdiet plus exercise on weight change in parents andchildren. J Consult Clin Psychol 1984;52:429–37 (nousable data).
Eriksson KF, Lindgarde F. Prevention of type 2 (non-insulin-dependent) diabetes mellitus by diet andphysical exercise. The 6-year Malmo feasibility study.Diabetologia 1991;34:891–8 (BMI not ≥ 28 kg/m2).
Fanghanel G, Cortinas L, Sanchez-Reyes L, Berber A. A clinical trial of the use of sibutramine for thetreatment of patients suffering essential obesity. Int JObes Relat Metab Disord 2000;24:144–50 (6 months).
Fanghanel G, Cortinas L, Sanchez-Reyes L, Berber A.Second phase of a double-blind study clinical trial onsibutramine for the treatment of patients sufferingessential obesity: six months after treatment crossover.Int J Obes 2001;25:741–7 (6-month cross-over).
Festi D, Colecchia A, Orsini M, Sangermano A, Sottili S,Simoni P, et al. Gallbladder motility and gallstoneformation in obese patients following very low caloriediets. Use it (fat) to lose it (well). Int J Obes 1998;22:592–600 (6 months).
Folsom AR, Qamhieh HT, Wing RR, Jeffery RW, Stinson VL, Kuller LH, et al. Impact of weight loss onplasminogen activator inhibitor (PAI-1), factor VII, andother hemostatic factors in moderately overweightadults. Arterioscler Thromb 1993;13:162–9 (6 months).
Formiguera X, Jodar E, Moreno E. Long termtreatment of obesity with sibutramine. Blood pressureand pulse rate changes during the 6-month weight lossphase. Int J Obes 2001;25(Suppl 2):S24 (abstract only).
Formiguera X, Jodar E, Moreno E. Long termtreatment of obesity with sibutramine. Efficacy duringthe 6-month weight loss phase. Int J Obes 2001;25(Suppl 2):S103 (abstract only).
Foster GD, Wadden TA, Feurer ID, Jennings AS,Stunkard AJ, Crosby LO, et al. Controlled trial of themetabolic effects of a very-low-calorie diet: short- andlong-term effects. Am J Clin Nutr 1990;51:167–72 (24 weeks).
Foster GD, Wadden TA, Peterson FJ, Letizia KA, Bartlett SJ, Conill AM. A controlled comparison of threevery-low-calorie diets: effects on weight, bodycomposition, and symptoms. Am J Clin Nutr 1992;55:811–17 (24 weeks).
Fox AA, Thompson JL, Butterfield GE, Gylfadottir U,Moynihan S, Spiller G. Effects of diet and exercise oncommon cardiovascular disease risk factors inmoderately obese older women. Am J Clin Nutr 1996;63:225–33 (24 weeks).
Fujioka K, Seaton TB, Rowe E, Jelinek CA, Raskin P,Lebovitz HE, et al. Weight loss with sibutramineimproves glycaemic control and other metabolicparameters in obese patients with type 2 diabetesmellitus. Diabetes Obes Metab 2000;2:175–87 (24 weeks).
Fukahori M, Aono H, Saito I, Ikebe T, Ozawa H.Program of exercise training as Total Health PromotionPlan and its evaluation. J Occup Health 1999;41:76–82(BMI not ≥ 28 kg/m2).
Fuller PR, Perri MG, Leermakers EA, Guyer LK. Effects of a personalized system of skill acquisition andan educational program in the treatment of obesity.Addict Behav 1998;23:97–100 (6 months).
Georgiades A, Sherwood A, Gullette EC, Babyak MA,Hinderliter A, Waugh R, et al. Effects of exercise andweight loss on mental stress-induced cardiovascularresponses in individuals with high blood pressure.Hypertension 2000;36:171–6 (6 months).
Gilbert S, Garrow JS. A prospective controlled trial ofoutpatient treatment for obesity. Hum Nutr Clin Nutr1983;37C:21–9 (behaviour therapy and dietary advicecomparison not randomised, dietary advice comparedto dietary advice with mazindol was randomised).
Giugliano D, Quatraro A, Consoli G, Minei A, Ceriello A,De Rosa N, et al. Metformin for obese, insulin-treateddiabetic patients: improvement in glycaemic control andreduction of metabolic risk factors. Eur J Clin Pharmacol1993;44:107–12 (6 months).
Glasgow RE, Toobert DJ, Hampson SE, Brown JE,Lewinsohn PM, Donnelly J. Improving self-care amongolder patients with type II diabetes: the ‘SixtySomething …’ Study. Patient Educ Counsel 1992;19:61–74(9 months).
Gomel M, Oldenburg B, Simpson JM, Owen N. Work-site cardiovascular risk reduction: a randomizedtrial of health risk assessment, education, counseling,and incentives. Am J Public Health 1993;83:1231–8 (BMI not ≥ 28 kg/m2).
Appendix 10
312

Gonzalez-Barranco E, Lopez-Amor E, Bandera L, Wong B, Rull JA. Pharmacological intestinaldisaccharidases inhibition in the short and long termtreatment of obesity. Int J Obes 1990;14(Suppl 2):142(abstract only).
Gorbach SL, Morrill-LaBrode A, Woods MN, Dwyer JT,Selles WD, Henderson M, et al. Changes in foodpatterns during a low-fat dietary intervention in women.J Am Diet Assoc 1990;90:802–9 (BMI not ≥ 28 kg/m2).
Gosselin P, Verreault R, Gaudreault C, Guillemette J.Dietary treatment of mild to moderatehypercholesterolemia. Effectiveness of differentinterventions [in French]. Can Fam Physician 1996;42:2160–7 (6 months).
Grembowski D, Patrick D, Diehr P, Durham M,Beresford S, Kay E, et al. Self-efficacy and healthbehavior among older adults. J Health Soc Behav 1993;34:89–104 (no weight data, ?obese).
Grimm RH, Cohen JD, Smith WM, Falvo-Gerard L,Neaton JD. Hypertension management in the MultipleRisk Factor Intervention Trial (MRFIT). Six-yearintervention results for men in special intervention andusual care groups. Arch Intern Med 1985;145:1191–9(BMI not ≥ 28 kg/m2).
Grimm RH, Flack JM, Grandits GA, Elmer PJ, Neaton JD, Cutler JA, et al. Long-term effects on plasmalipids of diet and drugs to treat hypertension. JAMA1996;275:1549–56 (weight advice not randomisedbetween groups).
Grimm RH, Grandits GA, Prineas RJ, McDonald RH,Lewis CE, Flack JM, et al. Long-term effects on sexualfunction of five antihypertensive drugs and nutritionalhygienic treatment in hypertensive men and women.Treatment of Mild Hypertension Study (TOMHS).Hypertension 1997;29:8–14 (weight advice notrandomised between groups).
Grimm RH, Grandits GA, Cutler JA, Stewart AL,McDonald RH, Svendsen K, et al. Relationships ofquality-of-life measures to long-term lifestyle and drugtreatment in the Treatment of Mild Hypertension Study.Arch Intern Med 1997;157:638–48 (weight advice notrandomised between groups).
Hagen RL. Group therapy vs bibliotherapy in weightreduction. Behav Ther 1974;5:222–34 (not 12 months).
Halimi S, Le Berre MA, Grange V. Efficacy and safety ofacarbose add-on therapy in the treatment of overweightpatients with type 2 diabetes inadequately controlledwith metformin: a double-blind, placebo-controlledstudy. Diabetes Res Clin Pract 2000;50:49–56 (6 months).
Hall SM, Bass A, Monroe J. Continued contact andmonitoring as follow-up strategies: a long-term study ofobesity treatment. Addict Behav 1978;3:139–47 (42 weeks).
Hanotin C, Thomas F, Jones SP, Leutenegger E, Drouin P. Efficacy and tolerability of sibutramine inobese patients: a dose-ranging study. Int J Obes 1998;22:32–8 (6 months).
Harris MB, Hallbauer ES. Self-directed weight controlthrough eating and exercise. Behav Res Ther 1973;523–9(10 months).
Harvey-Berino J. The efficacy of dietary fat vs. totalenergy restriction for weight loss. Obes Res 1998;6:202–7(6 months).
Haskell WL, Alderman EL, Fair JM, Maron DJ, Mackey SF, Superko HR, et al. Effects of intensivemultiple risk factor reduction on coronaryatherosclerosis and clinical cardiac events in men andwomen with coronary artery disease. The StanfordCoronary Risk Intervention Project (SCRIP). Circulation1994;89:975–90 (BMI not ≥ 28 kg/m2).
Haynes RB, Harper AC, Costley SR, Johnston M, Logan AG, Flanagan PT, et al. Failure of weightreduction to reduce mildly elevated blood pressure: arandomized trial. J Hypertens 1984;2:535–9 (6 months).
Hellenius ML, Krakau I, de Faire U. Favourable long-term effects from advice on diet and exercise given tohealthy men with raised cardiovascular risk factors. Nutr Metab Cardiovasc Dis 1997;7:293–300 (BMI not≥ 28 kg/m2).
Hellerstedt WL, Jeffery RW. The effects of a telephone-based intervention on weight loss. Am J Health Promot1997;11:177–82 (24 weeks).
Henderson M. Feasibility of a randomized trial of a low-fat diet for the prevention of breast cancer: dietarycompliance in the Women’s Health Trial VanguardStudy. Prev Med 1990;19:115–33 (BMI not ≥ 28 kg/m2).
Hermann LS, Kjellstrom T, Nilsson EP. Effects ofmetformin and glibenclamide alone and in combinationon serum lipids and lipoproteins in patients with non-insulin-dependent diabetes mellitus. Diabetes Metab1991;17:174–9 (6 months).
Hermann LS, Kjellstrom T, Schersten B, Lindgarde F,Bitzen P, Melander A. Therapeutic comparison ofmetformin and sulfonylurea, alone and in variouscombinations. Diabetes Care 1994;17:1100–9 (24 weeks).
Higgins LC, Gray W. Changing the body image concernand eating behaviour of chronic dieters: the effects of apsychoeducational intervention. Psychol Health 1998;13:1045–60 (no usable data).
Insull W, Henderson MM, Prentice RL, Thompson DJ,Clifford C, Goldman S, et al. Results of a randomizedfeasibility study of a low-fat diet. Arch Intern Med 1990;150:421–7 (BMI not ≥ 28 kg/m2).
James JE, Hampton BM. The relative efficacy ofdirective and nondirective treatment in behavioralweight control. Behav Ther 1982;13:463–75 (34 weeks).
Jeffery RW, French SA. Preventing weight gain in adults:design, methods and one year results from the Pound ofPrevention study. Int J Obes Relat Metab Disord 1997;21:457–64 (BMI not ≥ 28 kg/m2).
Jeffery RW, French SA. Preventing weight gain in adults:the pound of prevention study. Am J Public Health 1999;89:747–51 (BMI not ≥ 28 kg/m2).
Health Technology Assessment 2004; Vol. 8: No. 21
313
© Queen’s Printer and Controller of HMSO 2004. All rights reserved.

Kalodner CR, DeLucia JL. The individual and combinedeffects of cognitive therapy and nutrition education asadditions to a behavior modification program for weightloss. Addict Behav 1991;16:255–63 (6 months).
Kanders B, Jones CT, Smits G, McPhie A, Lavin P,Blackburn G. Comparison of two diets in a 27-weekrandomised trial: changes in body weight and bloodpressure in a population of obese hypertensives. Int JObes 1989;13:399 (abstract only).
Katzel LI, Bleecker ER, Colman EG, Rogus EM, Sorkin JD, Goldberg AP. Effects of weight loss vs aerobicexercise training on risk factors for coronary disease inhealthy, obese, middle-aged and older men. Arandomized controlled trial. JAMA 1995;274:1915–21 (9 months).
Keyserling TC, Ammerman AS, Atwood JR, Hosking JD,Krasny C, Zayed H, et al. A cholesterol interventionprogram for public health nurses in the rural southeast:description of the intervention, study design, andbaseline results. Public Health Nurs 1999;16:156–67 (nottargeted at weight loss).
Kjellin A, Ramel S, Rossner S, Thor K. Gastroesophagealreflux in obese patients is not reduced by weightreduction. Scand J Gastroenterol 1996;31:1047–51 (6 months).
Kornitzer M, De Backer G, Dramaix M, Kittel F, Thilly C, Graffar M, et al. Belgian heart diseaseprevention project: incidence and mortality results.Lancet 1983;i:1066–70 (BMI not ≥ 28 kg/m2).
Krachler M, Lindschinger M, Eber B, Watzinger N,Wallner S. Trace elements in coronary heart disease:impact of intensified lifestyle modification. Biol TraceElem Res 1997;60:175–85 (BMI not ≥ 28 kg/m2).
Kraslin HA. A comparative study of three weight lossprograms: physical exercise, psychoeducation, andcombined physical exercise/psychoeducation. DissertAbstr Int 1990;50:1988 (26 weeks).
Krempf M, Louvet JP, Allanic H, Attali JR. Early weightloss with orlistat predicts 18-month weight reduction.Int J Obes 2001;25(Suppl 2):S103 (abstract only).
Krempf M, Louvet JP, Allanic H, Attali JR. Long termweight loss and maintenance with orlistat andhypocaloric diet in obese patients. Int J Obes 2001;25(Suppl 2):S107 (abstract only).
Krinick GB. Evaluation of weight resistance training as acomponent of exercise in the behavioral treatment ofobesity. Dissert Abstr Int B Sci Eng 2000;61:1066 (24weeks).
Kuller LH, Simkin-Silverman LR, Wing RR, Meilahn EN,Ives DG. Women’s Healthy Lifestyle Project: arandomized clinical trial: results at 54 months.Circulation 2001;103:32–7 (BMI not ≥ 28 kg/m2).
Lam KS, Tiu SC, Tsang MW, Ip TP, Tam SC. Acarbosein NIDDM patients with poor control on conventionaloral agents. A 24-week placebo-controlled study. DiabetesCare 1998;21:1154–8 (24 weeks).
Lantz H, Agren L, Torgerson JS. VLCD plus dietary andbehavioural support versus support alone in thetreatment of obesity: a 4-year study. Int J Obes 2001;25(Suppl 2):S135 (abstract only).
LaRosa JC, Cleary P, Muesing RA, Gorman P,Hellerstein HK, Naughton J. Effect of long-termmoderate physical exercise on plasma lipoproteins. TheNational Exercise and Heart Disease Project. Arch InternMed 1982;142:2269–74 (subgroup of main trial NationalExercise and Heart Disease Project; BMI not ≥ 28 kg/m2).
Lean MEJ, Han TS, Prvan T, Richmond PR, Avenell A.Weight loss with high and low carbohydrate 1200 kcaldiets in free living women. Eur J Clin Nutr 1997;51:243–8 (6 months).
Lee A, Morley JE. Metformin decreases foodconsumption and induces weight loss in subjects withobesity with type II non-insulin-dependent diabetes.Obes Res 1998;6:47–53 (34 weeks).
Leermakers EA, Anglin K, Wing RR. Reducingpostpartum weight retention through a correspondenceintervention. Int J Obes 1998;22:1103–9 (6 months).
Lewis CE, Grandits GA, Flack J, McDonald R, Elmer PJ.Efficacy and tolerance of antihypertensive treatment inmen and women with stage 1 diastolic hypertension:results of the treatment of mild hypertension study. Arch Intern Med 1996;156:377–85 (weight advice notrandomised between groups).
Liebson PR, Grandits GA, Dianzumba S, Prineas RJ,Grimm RH, Neaton JD, et al. Comparison of fiveantihypertensive monotherapies and placebo for changein left ventricular mass in patients receiving nutritional-hygienic therapy in the Treatment of Mild HypertensionStudy (TOMHS). Circulation 1995;91:698–706 (weightadvice not randomised between groups).
Lisspers J, Sundin O, Hofman-Bang C, Nordlander R,Nygren A, Ryden L, et al. Behavioral effects of acomprehensive, multifactorial program for lifestylechange after percutaneous transluminal coronaryangioplasty: a prospective, randomized controlled study.J Psychosom Res 1999;46:143–54 (?BMI ≥ 28 kg/m2).
Lohman T, Going S, Pamenter R, Hall M, Boyden T,Houtkooper L, et al. Effects of resistance training onregional and total bone mineral density inpremenopausal women: a randomized prospectivestudy. J Bone Miner Res 1995;10:1015–24 (BMI not ≥ 28 kg/m2).
Lomasky SJ, D’Eramo G, Shamoon H, Fleischer N.Relationship of insulin secretion and glycemic responseto dietary intervention in non-insulin-dependentdiabetes. Arch Intern Med 1990;150:169–72 (no 12-month weight data).
Loprinzi CL, Athmann LM, Kardinal CG, O’Fallon JR,See JA, Bruce BK, et al. Randomized trial of dieticiancounseling to try to prevent weight gain associated withbreast cancer adjuvant chemotherapy. Oncology 1996;53:228–32 (6 months).
Appendix 10
314

MacMahon S, Macdonald G. Treatment of high bloodpressure in overweight patients. Nephron 1987;47(Suppl 1):8–12 (25 weeks).
MacMahon SW, Macdonald GJ, Bernstein L, Andrews G,Blacket RB. Comparison of weight reduction withmetoprolol in treatment of hypertension in youngoverweight patients. Lancet 1985;i:1233–6 (25 weeks).
MacMahon SW, Wilcken DE, Macdonald GJ. The effectof weight reduction on left ventricular mass. Arandomized controlled trial in young, overweighthypertensive patients. N Engl J Med 1986;314:334–9 (25 weeks).
Maza-Turner DD. The effect of behavior therapy withand without exercise on weight loss, body composition,and physical fitness. Dissert Abstr Int 1990;50:4777 (10weeks and 4 months follow-up).
Mendoza ER, Diaz Perez dM, Buitrago F. Effectivenessof serotonergic agonists in the treatment of obesepatients [in Spanish]. Aten Primaria 1995;16:364–6 (6months).
Messier SP, Loeser RF, Mitchell MN, Valle G, Morgan TP,Rejeski WJ, et al. Exercise and weight loss in obese olderadults with knee osteoarthritis: a preliminary study. J Am Geriatr Soc 2000;48:1062–72 (6 months).
Micic D, Ivkovic-Lazar T, Dragojevic R, Jorga J, Stokic E,Hajdukovic Z. Orlistat, a gastrointestinal lipaseinhibitor, in therapy of obesity with concomitanthyperlipidemia. Med Pregl 1999;52:323–33 (24 weeks).
Miller SB. Treatment outcome and attrition in acomprehensive weight loss program: group versus thecombination of group with individual treatmentsessions. Dissert Abstr Int 1989;50:1117 (6 months).
Mulrow C, Bailey S, Sonksen PH, Slavin B. Evaluationof an Audiovisual Diabetes Education Program: negativeresults of a randomized trial of patients with non-insulin-dependent diabetes mellitus. J Gen Intern Med1987;2:215–19 (11 months).
Neaton JD, Grimm Jr RH, Prineas RJ, Stamler J,Grandits GA, Elmer PJ, et al. Treatment of mildhypertension study: final results. JAMA 1993;270:713–24 (weight advice not randomised betweengroups).
Neumark-Sztainer D, Kaufmann NA, Berry EM.Physical activity within a community-based weightcontrol program: program evaluation and predictors ofsuccess. Public Health Rev 1995;23:237–51 (8 months).
Nikolaus T, Schlierf G, Vogel G, Schuler G, Wagner I.Treatment of coronary heart disease with diet andexercise – problems of compliance. Ann Nutr Metab1991;35:1–7 (BMI not ≥ 28 kg/m2).
Nilsson PM, Lindholm LH, Schersten BF. Life stylechanges improve insulin resistance in hyperinsulinaemicsubjects: a one-year intervention study of hypertensivesand normotensives in Dalby. J Hypertens 1992;10:1071–8 (BMI not ≥ 28 kg/m2).
Page RC, Harnden KE, Cook JT, Turner RC. Can life-styles of subjects with impaired glucose tolerance bechanged? A feasibility study. Diabet Med 1992;9:562–6(BMI not ≥ 28 kg/m2).
Pasquali R, Gambineri A, Biscotti D, Vicennati V,Gagliardi L, Colitta D, et al. Effect of long-termtreatment with metformin added to hypocaloric diet onbody composition, fat distribution, and androgen andinsulin levels in abdominally obese women with andwithout the polycystic ovary syndrome. J Clin EndocrinolMetab 2000;85:2767–74 (7 months).
Perry TL, Mann JI, Lewis-Barned NJ, Duncan AW,Waldron MA, Thompson CM. Lifestyle intervention inpeople with insulin-dependent diabetes mellitus (IDDM).Eur J Clin Nutr 1997;51:757–63 (BMI not ≥ 28 kg/m2).
Petersmarck KA, Teitelbaum HS, Bond JT, Bianchi L,Hoerr SM, Sowers MF. The effect of weight cycling onblood lipids and blood pressure in the Multiple RiskFactor Intervention Trial Special Intervention Group.Int J Obes 1999;23:1246–55 (BMI not ≥ 28 kg/m2).
Pijls LT, de Vries H, van Eijk JT, Donker AJ. Adherenceto protein restriction in patients with type 2 diabetesmellitus: a randomized trial. Eur J Clin Nutr 2000;54:347–52 (BMI not ≥ 28 kg/m2).
Prineas RJ, Grimm R, Grandits G, Liebson P, Neaton J,Stamler J, et al. The effect of dietary sodium and bodyweight on echocardiographic measures of leftventricular mass among treated hypertensive men andwomen: Four-year change in the TOMHS study. NierenHochdruckkrankheiten 1994;23:S14–21 (weight advice notrandomised between groups).
Ramsay LE, Ramsay MH, Hettiarachchi J, Davies DL,Winchester J. Weight reduction in a blood pressureclinic. BMJ 1978;ii:244–5 (BMI not ≥ 28 kg/m2).
Reisin E, Abel R, Modan M, Silverberg DS, Eliahou HE,Modan B. Effect of weight loss without salt restrictionon the reduction of blood pressure in overweighthypertensive patients. N Engl J Med 1978;298:1–6 (6months).
Research Group of the Rome Project of Coronary HeartDisease Prevention. Eight-year follow-up results fromthe Rome Project of Coronary Heart Disease Prevention[published erratum appears in Prev Med 1986;15:436]. Prev Med 1986;15:176–91 (BMI not ≥ 28 kg/m2).
Ricci TA, Heymsfield SB, Pierson RN, Stahl T,Chowdhury HA, Shapses SA. Moderate energy restrictionincreases bone resorption in obese postmenopausalwomen. Am J Clin Nutr 2001;73:347–52 (25 weeks).
Rigaud D, Ryttig KR, Angel LA, Apfelbaum M.Overweight treated with energy restriction and a dietaryfibre supplement: a 6-month randomized, double-blind,placebo-controlled trial. Int J Obes 1990;14:763–9 (6 months).
Rissanen P, Makimattila S, Vehmas T, Taavitsainen M,Rissanen A. Effect of weight loss and regional fatdistribution on plasma leptin concentration in obese
Health Technology Assessment 2004; Vol. 8: No. 21
315
© Queen’s Printer and Controller of HMSO 2004. All rights reserved.

women. Int J Obes Relat Metab Disord 1999;23:645–9 (6 months).
Rock CL, Thomson C, Caan BJ, Flatt SW, Newman V,Ritenbaugh C, et al. Reduction in fat intake is notassociated with weight loss in most women after breastcancer diagnosis: evidence from a randomizedcontrolled trial. Cancer 2001;91:25–34 (BMI not≥ 28 kg/m2).
Roderick P, Ruddock V, Hunt P, Miller G. A randomizedtrial to evaluate the effectiveness of dietary advice bypractice nurses in lowering diet-related coronary heartdisease risk. Br J Gen Pract 1997;47:7–12 (BMI not≥ 28 kg/m2).
Rose DP, Connolly JM, Chlebowski RT, Buzzard IM,Wynder EL. The effects of a low-fat dietary interventionand tamoxifen adjuvant therapy on the serum estrogenand sex hormone-binding globulin concentrations ofpostmenopausal breast cancer patients. Breast Cancer ResTreat 1993;27:253–62 (BMI not ≥ 28 kg/m2).
Rosenvinge SA, Toubro S, Bulow J, Krabbe K, Parving H-H, Astrup A. Changes in renal functionduring weight loss induced by high vs low-protein low-fat diets in overweight subjects. Int J Obes 1999;23:1170–7 (6 months).
Ross R, Dagnone D, Jones PJH, Smith H, Paddags A,Hudson R, et al. Reduction in obesity and relatedcomorbid conditions after diet-induced weight loss orexercise-induced weight loss in men: a randomized,controlled trial. Ann Intern Med 2000;133:92–103 (6 months).
Salamone LM, Cauley JA, Black DM, Simkin-Silverman L,Lang W, Gregg E, et al. Effect of a lifestyle interventionon bone mineral density in premenopausal women: a randomized trial. Am J Clin Nutr 1999;70:97–103(BMI not ≥ 28 kg/m2).
Saris WHM, Astrup A, Prentice AM, Zunft HJF,Formiguera X, Verboeket-van de Venne WP, et al.Randomized controlled trial of changes in dietarycarbohydrate/fat ratio and simple vs complexcarbohydrates on body weight and blood lipids: theCARMEN study. Int J Obes 2000;24:1310–18 (6 months).
Schuler G. Regular physical exercise and low-fat diet.Effects on progression of coronary artery disease.Circulation 1992;86:1–11 (BMI not ≥ 28 kg/m2).
Seppelt B, Zunft HJ. Body weight development 6 yearsafter a dietary intervention with low-fat products. Int JObes 2001;25(Suppl 2):S51 (abstract only).
Seppelt B, Weststrate JA, Reinert A, Johnson D, Luder W, Zunft H-J. Long-term effect of fat-reducedfoods on energy intake and body weight. Z Ernahrung1996;35:369–77 (36 weeks).
Shah M, McGovern P, French S, Baxter J. Comparisonof a low-fat, ad libitum complex-carbohydrate diet witha low-energy diet in moderately obese women. Am J ClinNutr 1994;59:980–4 (6 months).
Sheppard L, Kristal AR, Kushi LH. Weight loss in womenparticipating in a randomized trial of low-fat diets. Am JClin Nutr 1991;54:821–8 (BMI not ≥ 28 kg/m2).
Sherwin R. Sudden death in men with increased risk ofmyocardial infarction. The MRFIT programme. Drugs1984;28(Suppl 1):46–53 (BMI not ≥ 28 kg/m2).
Sherwin R, Kaelber CT, Kezdi P. The Multiple RiskFactor Intervention Trial (MRFIT). II. The developmentof the protocol. Prev Med 1981;10:402–25 (BMI not≥ 28 kg/m2).
Sherwood NE, Morton N, Jeffery RW, French SA,Neumark-Sztainer D, Falkner NH. Consumerpreferences in format and type of community-basedweight control programs. Am J Health Promot 1998;13:12–18 (BMI not ≥ 28 kg/m2).
Simkin-Silverman L, Wing RR, Hansen DH, Klem ML,Pasagian-Macaulay AP, Meilahn EN, et al. Prevention ofcardiovascular risk factor elevations in healthypremenopausal women. Prev Med 1995;24:509–17 (BMInot ≥ 28 kg/m2).
Simkin-Silverman LR, Wing RR, Boraz MA, Meilahn EN,Kuller LH. Maintenance of cardiovascular risk factorchanges among middle-aged women in a lifestyleintervention trial. Womens Health 1998;4:255–71 (BMInot ≥ 28 kg/m2).
Simon MS, Heilbrun LK, Boomer A, Kresge C, Depper J,Kim PN, et al. A randomized trial of a low-fat dietaryintervention in women at high risk for breast cancer.Nutr Cancer 1997;27:136–42 (BMI not ≥ 28 kg/m2).
Singh RB, Rastogi SS, Sircar AR, Mehta PJ, Sharma KK.Dietary strategies for risk-factor modification to preventcardiovascular diseases. Nutrition 1991;7:210–14 (BMInot ≥ 28 kg/m2).
Singh RB, Rastogi SS, Verma R, Laxmi B, Singh R,Ghosh S, et al. Randomised controlled trial ofcardioprotective diet in patients with recent acutemyocardial infarction: results of one year follow up. BMJ1992;304:1015–19 (BMI not ≥ 28 kg/m2).
Singh RB, Niaz MA, Ghosh S. Effect on central obesityand associated disturbances of low-energy, fruit- andvegetable-enriched prudent diet in north Indians.Postgrad Med J 1994;70:895–900 (6 months).
Singh RB, Rastogi V, Rastogi SS, Niaz MA, Beegom R.Effect of diet and moderate exercise on central obesityand associated disturbances, myocardial infarction andmortality in patients with and without coronary arterydisease. J Am Coll Nutr 1996;15:592–601 (BMI not≥ 28 kg/m2).
Skov AR, Toubro S, Raben A, Astrup A. A method toachieve control of dietary macronutrient composition inad libitum diets consumed by free-living subjects. Eur JClin Nutr 1997;51:667–72 (6 months).
Skov AR, Toubro S, Ronn B, Holm L, Astrup A.Randomized trial on protein vs carbohydrate in adlibitum fat reduced diet for the treatment of obesity. Int J Obes 1999;23:528–36 (6 months).
Appendix 10
316

Smith CI. Comparison of diet and exercise versus dietalone in relapse of obesity [Thesis]. Ann Arbor, MI:University Microfilms International; 1990 (thesisofficially missing from library).
Smith RB, Katzin DB. Clinical assessment of a novelweight control programme. J Clin Res 1998;1:251–8 (6 months).
Stefanick ML. Effects of the NCEP step 2 diet andexercise on lipoprotein in postmenopausal women andmen with low HDL and high LDL. N Engl J Med 1998;339:12–20 (BMI not ≥ 28 kg/m2).
Stefanick ML, Mackey S, Sheehan M, Ellsworth N,Haskell WL, Wood PD. Effects of diet and exercise inmen and postmenopausal women with low levels ofHDL cholesterol and high levels of LDL cholesterol. N Engl J Med 1998;339:12–20 (BMI not ≥ 28 kg/m2).
Stuart RB. A three-dimensional program for thetreatment of obesity. Behav Res Ther 1971;9:177–86 (10 months).
Svendsen OL, Hassager C, Christiansen C. Six months’follow-up on exercise added to a short-term diet inoverweight postmenopausal women – effects on bodycomposition, resting metabolic rate, cardiovascular riskfactors and bone. Int J Obes Relat Metab Disord 1994;18:692–8 (9 months).
Svendsen OL, Hassager C, Christiansen C, Nielsen JD,Winther K. Plasminogen activator inhibitor-1, tissue-type plasminogen activator, and fibrinogen: effect ofdieting with or without exercise in overweightpostmenopausal women. Arterioscler Thromb Vasc Biol1996;16:381–5 (9 months).
Sweeney ME, Hill JO, Heller PA, Baney R, DiGirolamoM. Severe vs moderate energy restriction with andwithout exercise in the treatment of obesity: efficiency ofweight loss. Am J Clin Nutr 1993;57:127–34 (6 months).
Tanco S, Linden W, Earle T. Well-being and morbidobesity in women: a controlled therapy evaluation. Int JEat Disord 1998;23:325–39 (9 months).
Taylor AH, Doust J, Webborn N. Randomised controlledtrial to examine the effects of a GP exercise referralprogramme in Hailsham, East Sussex, on modifiablecoronary heart disease risk factors. J EpidemiolCommunity Health 1998;52:595–601 (24 weeks).
Taylor CB, Agras WS, Losch M, Plante TG, Burnett K.Improving the effectiveness of computer-assisted weightloss. Behav Ther 1991;22:229–36 (38 weeks).
Toplak H, Wascher TC. Influence of weight reductionon platelet volume: different effects of a hypocaloricdiet and a very low calorie diet. Eur J Clin Invest 1994;24:778–80 (48 weeks).
Toplak H, on behalf of the Austrian Orlistat StudyGroup. Efficacy and safety of orlistat plus a reduced-calorie diet in obese non-diabetic patients: a 1-yearAustrian multicentre study. Int J Obes 2001;25(Suppl 2):S112 (abstract only).
Toubro S, Astrup A, Quaade F. Hypocaloric treatment of obese type 2 diabetics. Proc Nutr Soc 1993;52:369A(abstract only).
Treatment of Mild Hypertension Research Group. Thetreatment of mild hypertension study. A randomized,placebo-controlled trial of a nutritional–hygienicregimen along with various drug monotherapies. ArchIntern Med 1991;151:1413–23 (weight advice notrandomised).
Trento M, Passera P, Tomalino M, Bajardi M, Pomero F,Allione A, et al. Group visits improve metabolic controlin type 2 diabetes. A 2-year follow-up. Diabetes Care2001;24:995–1000 (BMI not ≥ 28 kg/m2).
Van Gaal LF, Broom JI, Enzi G, Toplak H. Efficacy andtolerability of orlistat in the treatment of obesity: a 6-month dose-ranging study. Orlistat Dose-RangingStudy Group. Eur J Clin Pharmacol 1998;54:125–32 (28 weeks).
Velthuis-te Wierik EJ, van den Berg H, Weststrate JA,het Hof KH, de Graaf C. Consumption of reduced-fatproducts: effects on parameters of anti-oxidativecapacity. Eur J Clin Nutr 1996;50:214–19 (BMI not≥ 28 kg/m2).
Wadden TA, Foster GD, Letizia KA, Mullen JL. Long-term effects of dieting on resting metabolic rate inobese outpatients. JAMA 1990;264:707–11 (48 weeks).
Wadden TA, Vogt RA, Andersen RE, Bartlett SJ, Foster GD, Kuehnel RH, et al. Exercise in the treatmentof obesity: effects of four interventions on bodycomposition, resting energy expenditure, appetite, andmood. J Consult Clin Psychol 1997;65:269–77 (48 weeks).
Wadden TA, Considine RV, Foster GD, Anderson DA,Sarwer DB, Caro JS. Short- and long-term changes inserum leptin in dieting obese women: effects of caloricrestriction and weight loss. J Clin Endocrinol Metab 1998;83:214–18 (40 weeks).
Wallner S, Watzinger N, Lindschinger M, Smolle KH,Toplak H, Eber B, et al. Effects of intensified lifestylemodification on the need for further revascularisationafter coronary angioplasty. Eur J Clin Invest 1999;29:372–9 (BMI not ≥ 28 kg/m2).
Weintraub M, Rubio A, Golik A, Byrne L, Scheinbaum ML, et al. Sibutramine in weight control: a dose-ranging, efficacy study. Clin Pharm Ther 1991;50:330–7 (6 months).
White E, Shattuck AL, Kristal AR, Urban N, PrenticeRL, Henderson MM, et al. Maintenance of a low-fat diet– follow-up of the women’s health trial. Cancer EpidemiolBiomarkers Prev 1992;1:315–23 (BMI not ≥ 28 kg/m2).
White N, Carnahan J, Nugent CA, Iwaoka T, DodsonMA. Management of obese patients with diabetesmellitus: comparison of advice education with groupmanagement. Diabetes Care 1986;9:490–6 (6 months).
Williams PT, Krauss RM, Vranizan KM, Albers JJ, Terry RB, Wood PD. Effects of exercise-induced weight
Health Technology Assessment 2004; Vol. 8: No. 21
317
© Queen’s Printer and Controller of HMSO 2004. All rights reserved.

loss on low density lipoprotein subfractions in healthymen. Arteriosclerosis 1989;9:623–32 (BMI not≥ 28 kg/m2).
Williams PT, Albers JJ, Krauss RM, Wood PD.Associations of lecithin:cholesterol acyltransferase(LCAT) mass concentrations with exercise, weight loss,and plasma lipoprotein subfraction concentrations inmen [published erratum appears in Atherosclerosis 1990;84:77]. Atherosclerosis 1990;82:53–8 (BMI not ≥ 28 kg/m2).
Wilson GT, Brownell K. Behavior therapy for obesity:including family members in the treatment process.Behav Ther 1978;9:943–5 (8 months).
Wing RR, Epstein LH, Shapira B, Koeske R. Contingent therapist contact in a behavioral weightcontrol program. J Consult Clin Psychol 1984;52:710–11(10 weeks and 8 months follow-up).
Wing RR, Blair EH, Bononi P, Marcus MD, Watanabe R,Bergman RN. Caloric restriction per se is a significantfactor in improvements in glycemic control and insulinsensitivity during weight loss in obese NIDDM patients.Diabetes Care 1994;17:30–6 (27 weeks).
Wirth A, Krause J. Long-term weight loss withsibutramine: a randomized controlled trial. JAMA 2001;286:1331–9 (44 weeks).
Womack CJ, Harris DL, Katzel LI, Hagberg JM,Bleecker ER, Goldberg AP. Weight loss, not aerobicexercise, improves pulmonary function in older obesemen. J Gerontol A Biol Sci Med Sci 2000;55:M453–7 (10 months).
Wood PD. Increased exercise level and plasmalipoprotein concentrations: a one-year, randomized,controlled study in sedentary middle-aged men.Metabolism 1983;32:31–9 (BMI not ≥ 28 kg/m2).
Wright J, Wood B, Hale G. Evaluation of group versusindividual nutrition education in overweight patientswith myocardial infarction. Aust N Z J Med 1981;11:497–501 (only one group obese).
Yasmin, Mascie-Taylor CG, Brown MJ, Hughes M. The effect of dietary intervention on changes in totalcholesterol, blood pressure and weight in a Cambridgestudy. Int J Clin Pract 1998;52:241–5 (BMI not≥ 28 kg/m2).
Appendix 10
318

Health Technology Assessment 2004; Vol. 8: No. 21
319
© Queen’s Printer and Controller of HMSO 2004. All rights reserved.
Appendix 11
Table of quality assessment of included RCTs
Quality of Description Intention Participants Healthcare Outcome random of to treat? blinded to providers assessors
allocation withdrawals treatment blinded to blinded to concealment and dropouts status? treatment treatment
status? status?
OrlistatBroom, 2001a B(I) A C B(II) B(II) B(I)Broom, 2001b B(I) A C B(II) B(II) B(I)Davidson, 1999 B(I) A C B(II) B(II) B(I)Finer, 2000 A A C B(II) B(II) A(I)Hauptman, 2000 A A C B(II) B(II) B(I)Hill, 1999 B(I) A C B(II) B(II) B(I)Hollander, 1998 A A B B(II) B(II) A(I)Lindgarde, 2000 B(I) A B B(II) B(II) B(I)Rossner, 2000 B(I) A C B(II) B(II) B(I)Sjöström, 1998 A A C B(II) B(II) B(I)SibutramineApfelbaum, 1999 B(I) A C A(I) A(I) B(I)McMahon, 2000 B(I) A C A(II) A(II) B(I)Smith, 2001 B(I) A C A(I) A(I) B(I)STORM, 2000 A A A A(I) A(I) B(I)SSRIsBitsch, 1987 A B(I) A A(I) A(I) A(I)Breum, 1995 B(I) A C A(I) A(I) B(I)Goldstein, 1994 B(I) B(I) C A(I) A(I) A(I)O’Kane, 1994 B(I) A C A(II) A(II) B(I)Wadden, 1995 B(I) A A A(II) A(II) B(I)MetforminBIGPRO1, 1996 A A A A(I) A(I) B(I)Teupe, 1991 B(I) A C C C CUKPDS, 1998 A B(I) B C C B(I)AcarboseChiasson, 1994 B(I) B(I) C A(II) A(II) B(I)All non-drug interventionsBlack, 1984 B(I) B(I) C C C CBlonk, 1994 B(I) A A C C CCohen, 1991 B(I) A B C C B(I)Cousins, 1992 B(I) B(I) C C C Cde Waard, 1993 B(I) B(I) C C C CDISH, 1985 B(I) B(I) B C C CFDPS, 2001 B(I) A C C C A(II)Foreyt, 1993 B(II) B(I) C C C CFrey-Hewitt, 1990 B(I) A C C C CHakala, 1989 B(I) B(I) B C C CHakala, 1993 B(I) B(I) A C C CHankey, 2001 B(I) A A C C CHOT, 1999 B(I) A B C C CHPT, 1990 B(I) B(I) A C C A(I)Jalkanen, 1991 B(I) B(I) B C C CJeffery, 1993 B(I) B(I) B C C C
continued

Appendix 11
320
Quality of Description Intention Participants Healthcare Outcome random of to treat? blinded to providers assessors
allocation withdrawals treatment blinded to blinded to concealment and dropouts status? treatment treatment
status? status?
Jones, 1986 B(I) B(I) C C C CKaplan, 1987 B(I) B(I) B C C B(I)Karvetti, 1992 B(I) A B C C CLaitinen, 1993 B(I) B(I) B C C B(I)Lindahl, 1999 B(I) A C C C B(I)Long, 1983 B(I) B(I) C A(II) C CMurphy, 1982 B(I) B(I) A C C CNarayan, 1998 B(I) A C C C CODES, 1995 A A C C C COst, 1976 B(I) A A C C CPavlou, 1989a B(I) B(I) B C C CPavlou, 1989b B(I) B(I) B C C CPearce, 1981 B(I) B(II) C C C B(I)Phenix, 1991 B(I) B(I) A C C CPritchard, 1997 B(II) A A C C CPritchard, 1999 B(II) B(I) A C C CRosenthal, 1980 B(I) B(I) A C C CShah, 1996 B(I) A C C C CSikand, 1988 B(I) B(I) A C C CSimonen, 2000 B(I) C A C C CStenius-Aarniala, 2000 B(I) A A C C CStraw, 1983 B(I) A C C C CSwinburn, 2001 C B(I) C C C CTAIM, 1992 A A C C C CTOHP I, 1992 A B(I) B C C CTOHP II, 1997 A B(I) B C C A(II)TONE, 1998 B(I) B(I) C C C A(I)Torgerson, 1997 B(I) A A C C CTucker, 1991 B(I) A B C C B(I)Viegener, 1990 B(I) B(I) C C C CWadden, 1989 B(I) A C C C CWadden, 1994 B(I) A A C C CWadden, 1998 B(I) A C C C CWadden, 2001 B(I) A A C C CWing, 1984 B(I) B(I) A C C CWing, 1985 B(I) B(I) A C C CWing, 1988a B(I) B(I) C C C A(I)Wing, 1988b B(I) B(I) C C C A(I)Wing, 1991 B(I) B(I) B C C B(I)Wing, 1991b B(I) B(I) C C C CWing, 1994 B(I) B(I) C C C B(I)Wing, 1998 B(I) B(I) A C C B(I)Wing, 1999 B(I) B(I) A C C CWood, 1988 B(I) A C C C CWood, 1991 B(I) A C C C C

Health Technology Assessment 2004; Vol. 8: No. 21
321
© Queen’s Printer and Controller of HMSO 2004. All rights reserved.
Appendix l2
Summary table of weight loss results

Appendix 12
322
The table shows summary estimates for weight changes from RCTs of weight reduction (WMDs and 95% CI, in kg).
Comparison 12 months 18 months 24 months 30 months 36 months 48 months 60 months
Drug trials
Orlistat added to diet –3.01* –3.26*(–3.48 to –2.54) (–4.15 to –2.37)
Sibutramine added to diet –4.12*(–4.97 to –3.26)
SSRIs added to diet –0.33(–1.49 to 0.82)
Metformin added to diet –1.09 –0.50 –0.12(–2.29 to 0.11) (–4.02 to 3.02) (–1.13 to 0.89)
Acarbose added to diet –0.79*(–1.53 to –0.05)
Diet trials
600 kcal/day deficit or low-fat diet –5.31* –1.15 –2.35* –3.55* –0.20compared with control (–5.86 to –4.77) (–2.76 to 0.45) (–3.56 to –1.15) (–4.54 to –2.55) (–2.03 to 1.63)
LCD compared with control –6.25* –7.00* –6.10*(–9.05 to –3.45) (–10.99 to –3.01) (–10.71 to –1.49)
VLCD compared with control –13.40*(–18.43 to –8.37)
LCD compared with 600 kcal/day or 1.63low-fat diet (–1.26 to 4.52)
VLCD compared with 600 kcal/day or –4.70low-fat diet (–11.79 to 2.39)
VLCD compared with LCD –0.15 –1.13(–2.73 to 2.43) (–5.32 to 3.06)
PSMF compared with LCD –3.57 0.69 –2.17 –1.51 0.20(–7.36 to 0.22) (–1.58 to 2.96) (–4.88 to 0.54) (–5.43 to 2.41) (–5.68 to 6.08)
PSMF compared with VLCD 2.73(0.07 to 5.39)
continued

Health Technology Assessm
ent2004; Vol. 8: No. 21
323
© Q
ueen’s Printer and Controller of H
MSO
2004. All rights reserved.
Comparison 12 months 18 months 24 months 30 months 36 months 48 months 60 months
Trials of diet, exercise or behaviour therapy combinations
Diet and exercise compared with control –4.78* –2.70*(–5.41 to –4.16) (–3.60 to –1.80)
Diet and behaviour therapy compared –7.21* –1.80with control (–8.68 to –5.75) (–4.77 to 1.17)
Adding diet and behaviour therapy to surgery –10.03 –10.56(–22.29 to 2.23) (–23.17 to 2.05)
Diet, exercise and behaviour therapy –4.00* –3.40* –3.00* –4.68* –2.00*compared with control (–4.46 to –3.54) (–3.84 to –2.97) (–3.59 to –2.40) (–6.08 to –3.28) (–2.66 to –1.34)
Family compared with individual therapy –2.96* –1.08 –5.61* –1.55(–5.31 to –0.60) (–3.04 to 0.87) (–10.98 to –0.24) (–7.88 to 4.78)
Group compared with individual therapy 1.59 0.74 8.10 4.40(–1.81 to 5.00) (–4.21 to 5.69) (2.19 to 14.01) (–3.51 to 12.31)
Adding exercise to diet –1.95* –7.63* –8,22*(–3.22 to –0.68) (–10.33 to –4.92) (–15.27 to –1.16)
Adding behaviour therapy to diet –7.67* –4.18* –2.91 1.90(–11.97 to –3.36) (–8.32 to –0.04) (–8.60 to 2.78) (–3.76 to 7.56)
Adding exercise to diet and behaviour –3.02* –2.16*therapy (–4.94 to –1.11) (–4.20 to –0.l2)
Adding exercise and behaviour therapy –0.67 –2.06 –1.40to diet (–4.22 to 2.88) (–5.57 to 1.45) (–5.01 to 2.21)
Behaviour therapy added to LCD and –10.69*exercise (–14.22 to –7.16)
* Significant difference.


IntroductionThe following provides an equation for derivingthe standard deviation for the change in weightfrom baseline given the absolute value of themean change in weight since baseline.
MethodSummary statistics were provided from a series oftrials representing 62 trial–treatment combinations,of which four had no data. A linear regression wasmade of the standard deviation of the meanchange on the absolute mean change for weight.
ResultsOf the 58 trial–treatment combinations, 43 reported both the mean change and thestandard error of the mean change in body weight from baseline to the end of the firsttreatment phase, while eight only reported themean and seven reported neither. The plot ofstandard deviation by the absolute value of themean change (Figure 250) shows two points whereboth the absolute mean and the standarddeviation of the mean are close to zero; both wereexcluded from the linear regression, giving n = 41. The linear regression was also repeatedwith observation 13, which was influential,
Health Technology Assessment 2004; Vol. 8: No. 21
325
© Queen’s Printer and Controller of HMSO 2004. All rights reserved.
Appendix 13
Statistical methods for estimation of standard deviation of change in weight
15
10
5
00 5 10 15 20
Absolute mean change in weight
SD
13
FIGURE 250 Scatterplot of the standard deviation of the mean change in weight by the absolute mean change in weight. Observation13 is labelled

excluded to see whether the regression coefficientschanged.
DiscussionThe results from the two linear regressions weresimilar. Diagnostic plots (not shown) suggestedthat the regression could be improved by allowingfor the increase in variation of the standarddeviation with increasing mean; however, this isunlikely to change the results.
ConclusionWhen the mean change in weight since baseline(mean) is known but its standard deviation isunknown, then the equation:
SD = 5.915 + 0.283 * absolute(mean)
can be used to derive the standard deviation of themean change (Table 24).
Appendix 13
326
TABLE 24 Summary statistics and the equations for the predicted values of the standard deviations of the two linear regressions
n R2 Constant Slope
41 53.7% SD = 5.915 + 0.283 * abs(mean)40 63.4% SD = 5.694 + 0.328 * abs(mean)

Health Technology Assessment 2004; Vol. 8: No. 21
327
© Queen’s Printer and Controller of HMSO 2004. All rights reserved.
Estimation of standard deviationof change in blood pressureIntroductionThe following short report describes the derivationof an equation for the standard deviation for thechange in BP from baseline given the meanchange in BP since baseline. Both SBP and DBPwere available.
MethodSummary statistics were provided from a series oftrials representing 96 trial–treatment–BPcombinations. A linear regression was made of thestandard deviation of the mean change on theabsolute mean change for both systolic anddiastolic data.
ResultsOf the 96 trial–treatment–BP combinations (46 SBP and 50 DBP), 51 (25, 26) reported boththe mean change and the standard error of themean change in BP from baseline to the end of thefirst treatment phase, while 12 (6, 6) only reportedthe mean and 33 (15, 18) reported neither.
The plot of standard deviation by the absolutevalue of the mean change showed the systolic anddiastolic data to be sufficiently different not towarrant a joint regression model. The systolic datashowed greater variation amongst their standarddeviations. One study reported three diastolicabsolute means and the standard deviation of themean that were close to zero and they wereexcluded, linear regression giving n = 25 for SBPand n = 23 for DBP (Table 25).
SBPThe absolute mean had no effect on the standarddeviation. The overall mean for the standarddeviation is reported below.
DBPThe absolute mean had no effect on the standarddeviation. When two influential points wereexcluded there was no change in the result. Theoverall mean for the standard deviation is reportedbelow.
DiscussionOnly just over half of the trial–treatment–BPcombinations were available for use in theregression models. Of the remaining 45, 33 haddata on both the mean and standard deviation ofthe mean at the two time-points available.Standard deviations for the change could bederived if some assumptions on correlation weremade, possibly based on the nine observationswhere all three standard deviations were available.
Conclusion� Standard deviation of the mean change in SBP,
use 12.7 mmHg.� Standard deviation of the mean change in DBP,
use 8.3 mmHg.
Estimation of standard deviationof change in fasting lipids andplasma glucose level controlIntroductionThe following short report describes the derivationof an equation for the standard deviation for thechange in total cholesterol, LDL cholesterol, HDLcholesterol, triglycerides, fasting plasma glucoseand HbA1c from baseline given the mean changesince baseline.
Method Summary statistics were provided from a series oftrials representing 208 trial–treatment–bloodmeasure combinations from 50 trial–treatmentcombinations. The relationship between theabsolute mean change and the standard deviationof the mean change was examined for 6 types ofblood measure: total cholesterol from 44trial–treatment combinations, LDL from 30, HDLfrom 42, TGs from 42, fasting glucose from 30and HbA1c from 20. The relationship could beaffected by whether participants were diabetic ornon-diabetic, in particular for fasting glucose andHbA1c.
The following analysis was done for each bloodmeasure:
Appendix 14
Statistical methods for estimation of standard deviation of change in risk factors

Appendix 14
328
� plot of the number of observations versus thestandard deviation
� summary statistics for the standard deviation bytreatment
� where the SD varied with study size, summarystatistics stratified by study size.
ResultsThe plots suggested that the standard deviationswere quite stable, but below a threshold there werecases where some of the standard deviations weregreater as the number of participants fell (Table 26).The threshold varied for each measure. Causes forthis were not reviewed.
DiscussionThe effect of study size needs to be reviewed whenestimating standard deviations. For the blood
lipids this appears to make little difference andeither the mean or median standard deviationcould be used. Erring on the side of caution wouldsuggest using the mean value. There is, however, astudy size effect for glucose and HbA1c. Thepossibility of using the stratified SDs should beconsidered.
The cause of the effect of the number ofobservations was not reviewed. The main candidatewould be treatment. Plots were reviewed but thereare numerous treatments and there is no clear wayin which to group them.
TABLE 26 Summary statistics for the standard deviations of the risk factors
Blood measure Mean SD Median SD Details
HDL 0.29 0.24 Mostly below 0.4, except for five between 0.4 and 0.6 when n < 100
LDL 0.74 0.71 No relationship with n
TGs 0.96 0.81 Mostly below 1.5, except for four between 1.5 and 3.5 when n < 50
Cholesterol 1.08 0.83 A narrow band of SDs. One outlier. Four higher SDs, three fromsmall trials (n = 30) and one trial (n � 100)
Fasting glucose 2.43 1.42 Clear threshold effect. One outlier (a possible typographicerror). Two high values for two large studies (n � 350). MostSDs < 2
3.11 3.49 When n < 30
1.98 0.95 When n ≥ 30
HbA1c 1.96 1.60 Clear threshold effect. SDs increase rapidly when n < 30
2.70 2.10 Where n < 30
0.76 0.66 Where n ≥ 30
TABLE 25 Summary statistics for the mean standard deviation of the mean change in blood pressure
n Min. Max. Mean SD
Systolic 25 6.80 23.97 12.7070 4.0164Diastolic I 23 5.60 14.75 8.2958 2.1794Diastolic II 21 5.60 9.40 7.7549 1.2773
Diastolic II was based on removing two influential data points.

ObjectiveThe objective of this review is to look atprospective studies systematically to identify theeffects of reduced BMI on long-term healthoutcomes with statistical modelling methodology.
Criteria for considering studiesfor this reviewInclusion criteriaTypes of studies� Information from all prospective or cohort
studies carried out on patients with a BMI ≥ 28 kg/m2
� minimum duration of the study for surgicalfollow-up at least 5 years; for studies with non-surgical follow-up, duration of study at least 2 years
� BMI measured on at least two occasions duringthe study period
� in MEDLINE, terms for cross-sectional studiesand prevalence studies will be included in thesearch strategy to provide studies for economicmodelling. Relevant abstracts will be sent to theeconomist for inclusion. In other databases thesearch terms for the economic modelling will beomitted
� studies published in all languages from 1966 upto April 2001
� major journals that are indexed will be reviewedup to June 2001.
Types of participants� Studies on adults from the age of 18 years up to
70 years� studies on populations who weight-cycle� studies on Caucasian populations. However,
studies on immigrant populations such asAfrican–Americans, Japanese Americans andBritish Asians will be included.
Exclusion criteria� Studies on people with a BMI < 28 kg/m2
� non-human studies
� people with bulimia nervosa� studies on children less than 18 years old, and
people more than 70 years old� population-based studies which include a small
subgroup of obese patients� Oriental, African and Asian population studies� studies with loss to follow-up of more than 20%
of the study population.
Types of outcome measuresData will be extracted on the following outcomemeasures:
� mortality from all causes� morbidity from CVD (including risk factors:
blood lipids, BP)� CHD� cerebrovascular disease: stroke� diabetes mellitus (including risk factor: blood
glucose)� cholelithiasis� musculoskeletal: arthritis� cancer: breast, colorectal, prostate,
endometrial� asthma� sleep apnoea� NASH� urinary incontinence� bone fractures� psychological health and quality of life� co-morbidities� risk scoring systems.
Search strategy for identification of studiesDatabases for the searchA database search for the prospective studies willbe conducted using:
� MEDLINE� EMBASE� CINAHL� HealthSTAR.
Health Technology Assessment 2004; Vol. 8: No. 21
329
© Queen’s Printer and Controller of HMSO 2004. All rights reserved.
Appendix 15
Protocol for a systematic review of observational epidemiological evidence

� Specific MeSH terms will be used and modifiedaccording to the relevant databases, in addition– reference lists of identified articles and review
articles will be searched for further relevantprospective studies
– authors will be contacted for details of thestudy if additional information is necessary.
Method of reviewIdentification of the studiesAll possible studies will be entered into ReferenceManager version 9. Subject keywords and sourceof articles will be added. Abstracts and study titleswill be read by two researchers initially to checkfor consistency, and later on by one researcher.Articles on cross-sectional and prevalence studieson people with obesity and any other relevantarticles will be sent to the economist for evaluationand inclusion.
Quality assessment of the studies Full copies of the eligible studies will be obtainedand assessed by two researchers initially to check
for consistency, and later on by one researcher.Any doubts about the inclusion of a study will beresolved by discussion.
Data extractionThe following data will be extracted using astandard form:
� year of study� author and country� sample size� age and gender of the participants� ethnic groups of participants� specifically targeted groups (diabetes,
hypertension)� co-morbidities� risk factors: smoking, lipids, blood pressure,
blood glucose, family history� details of follow-up: duration, percentage of
follow-up� results: outcomes.
Statistical modelling will be done based on theevidence of effect of weight loss on long-termhealth outcomes from the epidemiological studiesand the RCTs.
Appendix 15
330

The electronic bibliographic databaseMEDLINE (National Library of Medicine, the
electronic version of Index Medicus, USA) wassearched from 1966 to May 2001 using thedeveloped search strategy for the prospective andcohort studies:
1. cohort studies/2. prospective studies/3. follow-up studies/4. longitudinal studies/5. cohort$.tw.6. (prospective adj1 stud$).tw.7. (follow-up adj1 stud$).tw.8. (longitudinal adj1 stud).tw.9. epidemiological studies/10. (epidemiological adj1 stud$).tw.11. (case-control adj1 stud$).tw.12. (retrospective adj1 stud$).tw.13. (cross-sectional adj1 stud).tw.14. (survey or surveys).tw.15. prevalence.tw.16. (prevalence adj1 stud$).tw.17. (relative adj1 (risk or risks)).tw.18. or/1-1719. obesity/20. obesity in diabetes/21. obesity, morbid/22. overweight.tw.23. (weight adj1 reduc$).tw.24. (weight adj1 control$).tw.25. (weight adj1 cycl$).tw.26. (weight adj1 chang$).tw.27. (waist adj3 hip adj3 (ratio or ratios) adj5
chang$).tw.28. (body adj3 mass adj3 index adj5 chang$).tw.29. quetelet$.tw.30. (quetelet$ adj1 index).tw.31. (waist adj1 circumference adj5 chang$).tw.32. (body adj1 weight adj5 chang$).tw.33. or/19-3234. 18 and 3335. limit 34 to human36. limit 35 to (newborn infant <birth to 1
month> or infant <1 to 23 months> orpreschool child <2 to 5 years> or child <6 to 12 years> or adolescence <13 to 18years>)
37. 35 not 36
EMBASE, the Experta Medica database producedby Elsevier Science, was searched from 1980 toweek 17 of 2001. The search terms were modifiedaccording to the relevant MeSH terms:
1. prospective studies/2. (prospective adj1 stud$).tw.3. cohort$.tw.4. (cohort adj1 stud$).tw.5. (follow-up adj1 stud$).tw.6. longitudinal study/7. (longitudinal adj1 stud).tw.8. (epidemiological adj1 stud$).tw.9. or/1-810. obesity/11. morbid obesity/12. diabetic obesity/13. overweight.tw.14. weight reduction/15. (weight adj1 reduc$).tw.16. (weight adj1 control$).tw.17. (weight adj1 cycl$).tw.18. (weight adj1 chang$).tw.19. (waist adj3 hip adj3 (ratio or ratios) adj5
chang$).tw.20. (body adj3 mass adj3 index adj5 chang$).tw.21. (quetelet$ adj1 index).tw.22. quetelet$.tw23. (waist adj1 circumference adj5 chang$).tw.24. (body adj1 weight adj5 chang$).tw.25. or/10-2426. 9 and 2527. Nonhuman/28. 26 not 2729. limit 28 to (adolescent <13 to 17 years> or
child <unspecified age> or embryo <firsttrimester> or infant <to one year> orpreschool child <1 to 6 years> or schoolchild <7 to 12 years>)
30. 28 not 29
HealthSTAR, produced by the National Library of Medicine, was searched from 1975 to December2000:
1. cohort studies/2. longitudinal studies/3. prospective studies/4. follow-up studies/
Health Technology Assessment 2004; Vol. 8: No. 21
331
© Queen’s Printer and Controller of HMSO 2004. All rights reserved.
Appendix 16
Search strategies

5. cohort$.tw.6. (prospective adj1 stud$).tw.7. (follow-up adj1 stud$).tw.8. (longitudinal adj1 stud).tw.9. epidemiological studies/10. (epidemiological adj1 stud$).tw.11. or/1-1012. obesity/13. obesity in diabetes/14. obesity, morbid/15. overweight.tw.16. (weight adj1 reduc$).tw.17. (weight adj1 control$).tw.18. (weight adj1 cycl$).tw.19. (weight adj1 chang$).tw.20. (waist adj3 hip adj3 (ratio or ratios) adj5
chang$).tw.21. (body adj3 mass adj3 index adj5 chang$).tw.22. quetelet$.tw.23. (quetelet$ adj1 index).tw.24. (waist adj1 circumference adj5 chang$).tw.25. (body adj1 weight adj5 chang$).tw.26. or/12-2527. 11 and 2628. (animal not human).sh.29. 27 not 2830. limit 29 to (newborn infant <birth to 1
month> or infant <1 to 23 months> orpreschool child <2 to 5 years> or child <6 to12 years> or adolescence <13 to 18 years>or “aged, 80 and over”)
31. 29 not 3032. limit 31 to nonmedline
CINAHL was searched from 1982 to April 2001:
1. prospective studies/2. (prospective adj1 stud$).tw.
3. cohort$.tw.4. (cohort adj1 stud$).tw.5. (follow-up adj1 stud$).tw.6. (longitudinal adj1 stud).tw.7. epidemiological research/8. (epidemiological adj1 stud$).tw.9. concurrent prospective studies/10. panel studies/11. or/1-1012. obesity/13. obesity, morbid/14. overweight.tw.15. (weight adj1 reduc$).tw.16. weight control/17. (weight adj1 control$).tw.18. (weight adj1 cycl$).tw.19. (weight adj1 chang$).tw.20. (waist adj3 hip adj3 (ratio or ratios) adj5
chang$).tw.21. waist-hip ratio/22. body mass index/23. (body adj3 mass adj3 index adj5 chang$).tw.24. quetelet$.tw.25. (quetelet$ adj1 index).tw.26. (waist adj1 circumference adj5 chang$).tw.27. (body adj1 weight adj5 chang$).tw.28. or/12-2729. 11 and 2830. animal studies/31. 29 not 3032. limit 31 to (pregnancy of fetus <conception to
birth> or newborn infant <birth to 1month> or infant <1 to 23 months> orpreschool child <2 to 5 years> or child <6 to12 years> or adolescence <13 to 18 years>or “aged, 80 and over”)
33. 31 not 32
Appendix 16
332

Data Extraction Form – PROSPECTIVE STUDIES
Search database:
Database ID number: Checked by:
ELIGIBILITY CHECK
DATA EXTRACTION
Final database: Final obesity HTA Unique ID number:
BIBLIOGRAPHIC DETAILS
Authors
Journal
Title
Year Volume Issue Page numbers
Country of origin
Reviewer 1 Reviewer 2
YES NO Unclear or other withdetails
Prospective study
Obese group (at least one subgroup)BMI ≥ 28 kg/m2
Weight loss recorded
Follow-up more than 2 years for non-surgical interventions
Follow-up more than 5 years for surgical interventions
At least one of the specified outcomes
Health Technology Assessment 2004; Vol. 8: No. 21
333
© Queen’s Printer and Controller of HMSO 2004. All rights reserved.
Appendix 17
Data extraction and quality assessment form

SEARCH DETAILS
MEDLINE EMBASE HealthSTAR CINAHL Other (e.g. PhD)
Identified from reference checking (which article?)
Search strategy (key MeSH terms)
SAMPLE DETAILS
Sample size Total: Males: Females:
Sex of the sample
Age of the sample Mean:SD:Range:Others:
Country of the sample
Ethnic groups CaucasiansAfrican–AmericansJapanese AmericansBritish Asians
Socio-economic class Class IClass IIClass IIIClass IVClass V
Body mass index at the start of the study (BMI) Mean: Range:WHO Class (no:)≥ 28–29.930–34.9 35–39.9≥ 40
Waist circumference at the start of study Mean:Range:Others:
Any others measurement at start of study
Appendix 17
334

RISK FACTORS RECORDED
INTERVENTION/PROCEDURE
Intervention Type Details
Was weight loss Intentional/Non-intentional:
Intervention before Surgical/Non-surgical/follow-up Combination of interventions:
Smoking Yes No
Family history of obesity Yes No
Blood pressure Yes No
Cholesterol Yes No
Blood sugars Yes No
Diabetes mellitus Yes No
Health Technology Assessment 2004; Vol. 8: No. 21
335
© Queen’s Printer and Controller of HMSO 2004. All rights reserved.

ASSESSMENT AND FOLLOW-UP
Setting of study Hospital Details:CommunityUrban/RuralGeneral practiceObesity clinicOthers
Duration of follow-up
Number of follow-ups Details:
Percentage of follow-up
Are losses to follow-up described? Yes/No Details:
Medium employed for assessment Specified/Non-specified
Mode of assessment Questionnaires Details of assessment:InterviewsPhysical examinationLab investigationsOthers
Quantification of weight loss % or average weight loss Details:
Change in BMI (WHO class)
Change in waist circumference:
Other measurement:
Appendix 17
336

OTHER DETAILS
OUTCOMES MEASURED
Number of outcomes measured Details of outcomes measured
What are they?
Mortality
Lipids
Blood pressure
Coronary heart disease
Stroke
Blood sugars
Gallstones
Arthritis
Breast cancer
Colorectal cancer
Prostate cancer
Endometrial cancer
Asthma
Sleep apnoea
NASH (non-alcoholic steatohepatitis)
Urinary incontinence
Psychological health/quality of health
Fracture of bones
Weight cycling Yes/No Details:
Number of cycles
Average weight loss in each cycle
Risk scoring systems Yes/No Details:
Health Technology Assessment 2004; Vol. 8: No. 21
337
© Queen’s Printer and Controller of HMSO 2004. All rights reserved.

QUALITY ASSESSMENT FORM
* Ring the appropriate code
TOTAL: (add ringed scores above): (A)
Maximum possible score (2 × 20) (B)
OVERALL RATING (A/B expressed as %) (%)Not satisfactory (1–50%)Moderate (51–80%)Very satisfactory (81–100%)
Queries/Comments
YES UNCLEAR/ NOPOSSIBLY
1. Was the aim of the study clearly stated? 2 1 0
Sample:2. Was sample size justified? 2 1 03. Age of patients defined? 2 1 04. Measurements at start of study clearly stated? 2 1 05. Are measurements likely to be valid and reliable? 2 1 06. Risk factors recorded clearly? 2 1 0
Conduct of the study:7. Was intervention before follow-up defined? 2 1 08. Setting of the study clear? 2 1 09. Is mode of assessment described? 2 1 010. Did untoward events occur during the study? 1 0 2
Follow-up:11. How adequate was the follow-up? 2 1 012. Was follow-up long enough? 2 1 013. Are losses to follow-up described? 2 1 0
Analysis:14. Were basic data adequately described? 2 1 015. Do numbers add up? 2 1 016. Did analysis allow for passage of time? 2 1 017. Was statistical significance assessed? 2 1 0
Interpretation:18. Were the main findings interpreted adequately? 2 1 019. Were the null/negative findings interpreted? 2 1 020. Are important effects overlooked? 0 1 2
Appendix 17
338

1. Research Group of the Rome Project of CoronaryHeart Disease Prevention. Eight-year follow-upresults from the Rome Project of Coronary HeartDisease Prevention [published erratum appears inPrev Med 1986;15:436]. Prev Med 1986;15:176–91.
2. The Roman Coronary Disease Prevention Project:effectiveness of intervention and reduction ofmortality over a 10-year period [in Italian]. G ItalCardiol 1986;16:196–202.
3. Prevalence of overweight – behavioral risk factorsurveillance system, 1987. MMWR Morb MortalWkly Rep 1989;38:421–3.
4. The Hypertension Prevention Trial: three-yeareffects of dietary changes on blood pressure. ArchIntern Med 1990;150:153–62.
5. Tackling obesity. Health News 1994;12:1–4.
6. Allison DB, Faith MS, Heo M, Townsend-Butterworth D, Williamson DF. Meta-analysis ofthe effect of excluding early deaths on theestimated relationship between body mass indexand mortality. Obes Res 1999;7:342–54.
7. Alpert MA, Terry BE, Lambert CR, Kelly DL,Panayiotou H, Mukerji V, et al. Factors influencingleft ventricular systolic function innonhypertensive morbidly obese patients, andeffect of weight loss induced by gastroplasty. Am JCardiol 1993;71:733–7.
8. Amaras K, Hayward CS, Sullivan D, Kelly RP,Campbell LV. Effects of postmenopausal hormonereplacement therapy on central abdominal fat,glycemic control, lipid metabolism, and vascularfactors in type 2 diabetes: a prospective study.Diabetes Care 1999;22:1401–7.
9. Andersen RE, Wadden TA, Bartlett SJ, Vogt RA,Weinstock RS. Relation of weight loss to changesin serum lipids and lipoproteins in obese women.Am J Clin Nutr 1995;62:350–7.
10. Andersen T, Gluud C, Franzmann MB,Christoffersen P. Hepatic effects of dietary weight loss in morbidly obese subjects. J Hepatol1991;12:224–9.
11. Anderson JW, Brinkman VL, Hamilton CC. Weight loss and 2-y follow-up for 80 morbidlyobese patients treated with intensive very-low-calorie diet and an education program. Am J ClinNutr 1992;56(Suppl 1):246S.
12. Ashutosh K, Methrotra K, Fragale-Jackson J.Effects of sustained weight loss and exercise on
aerobic fitness in obese women. J Sports Med PhysFitness 1997;37:252–7.
13. Baanders-Van Halewyn EA, Blankenstein MA,Thijssen JHH, De Ridder CM, De Waard F. Acomparative study of risk factors for hyperplasiaand cancer of the endometrium. Eur J Cancer Prev1996;5:105–12.
14. Bauer J. Obesity and arthrosis – prevention andrehabilitation by weight loss [in German]. Z OrthopIhre Grenzgeb 1998;136:8–9.
15. Beilin LJ, Armstrong BK, Margetts BM, Rouse IL,Vandongen R. Vegetarian diet and blood pressure.Nephron 1987;47(Suppl 1):37–41.
16. Bender R, Trautner C, Spraul M, Berger M.Assessment of excess mortality in obesity. Am JEpidemiol 1998;147:42–8.
17. Bender R, Jockel KH, Trautner C, Spraul M,Berger M. Effect of age on excess mortality inobesity. JAMA 1999;281:1498–504.
18. Bengtsson C, Bjorkelund C, Lapidus L, Lissner L.Associations of serum lipid concentrations andobesity with mortality in women: 20-year follow-upof participants in prospective population study inGothenburg, Sweden. BMJ 1993;307:1385–8.
19. Berman MI, Anderson IR. Comparison of weightlosses with three reducing regimens – diet therapy,phenmetrazine, and an amphetamine combination(obetrol). J Am Geriatr Soc 1966;14:623–30.
20. Birge M, Hauner H. Modern treatment conceptsfor obesity. Klinikarzt 1998;27:289–94.
21. Birketvedt GS, Thom E, Bernersen B, Florhomen J.Combination of diet, exercise and intermittenttreatment of cimetidine on body weight andmaintenance of weight loss. A 42 months follow-upstudy. Med Sci Monit 2000;6:699–703.
22. Bjorkelund CV, Bengtsson CB, Carazo B, Palm L,Tarschys G, Wassen A. Effects of a community riskfactor reducing programme on weight, body fatdistribution, and lipids in obese women. Int J Obes1991;15:251–8.
23. Bjorvell H, Rossner S. A ten-year follow-up ofweight change in severely obese subjects treated ina combined behavioural modification programme.Int J Obes Relat Metab Disord 1992;16:623–5.
24. Blackburn GL, Kanders BS, Lavin PT, Keller SD,Whatley J. Effect of aspartame as part of amultidisciplinary weight-control program on
Health Technology Assessment 2004; Vol. 8: No. 21
339
© Queen’s Printer and Controller of HMSO 2004. All rights reserved.
Appendix 18
Excluded studies

short- and long-term control of body weight. Am JClin Nutr 1997;65:409–18.
25. Bloom E, Reed D, Yano K, MacLean C. Doesobesity protect hypertensives againstcardiovascular disease? JAMA 1986;256:2972–5.
26. Bloomgarden ZT. The European Association forthe Study of Diabetes Annual Meeting, 1998: theUK Prospective Diabetes Study and other topics intype 2 diabetes. Diabetes Care 1999;22:989–95.
27. Bondjers G, Gustafson A, Kral JG. Serumlipoproteins and arterial tissue cholesterol in obesepatients: effects of intestinal bypass. Lakartidningen1979;76:3530–1.
28. Boot H, van Wegen R, Poublon RML, Bogaard JM,Schmitz PIM, van der Meche FG. Long-termresults of uvulopalatopharyngoplasty forobstructive sleep apnea syndrome. Laryngoscope2000;110:469–75.
29. Bosello O, Zamboni M, Armellini F, Todesco T.Biological and clinical aspects of regional body fatdistribution. Diabetes Nutr Metab 1993;6:163–71.
30. Bowen DJ, Tomoyasu N, Cauce AM. The triplethreat: a discussion of gender, class, and racedifferences in weight. Women Health 1991;17:123–43.
31. Boyer L, Boyer A, Biron P. Global approach toobesity: results in 1,225 patients after 5 years [inFrench]. Union Med Canada 1977;106:885–8.
32. Bray GA. Overweight is risking fate. Definition,classification, prevalence, and risks. Ann N Y AcadSci 1987;499:14–28.
33. Bray GA, Gray DS. Obesity. Part I – Pathogenesis.West J Med 1988;149:429–41.
34. Brochu M, Poehlman ET, Ades PA. Obesity, bodyfat distribution, and coronary artery disease. J Cardiopulm Rehabil 2000;20:96–108.
35. Brolin RE. Results of obesity surgery. GastroenterolClin North Am 1987;16:317–38.
36. Brown WJ, Mishra G, Kenardy J, Dobson A.Relationships between body mass index and well-being in young Australian women. Int J Obes 2000;24:1360–8.
37. Brownell KD, Wadden TA. Etiology and treatmentof obesity: understanding a serious, prevalent, andrefractory disorder. J Consult Clin Psychol 1992;60:505–17.
38. Brunt JH, Sheilds L. Preventive behaviours in theHutterite community following a nurse-managedcholesterol screening program. Can J CardiovascNurs 1996;7:6–11.
39. Buchwald H, Schone JL. Gastric obesity surgerycombined with partial ileal bypass forhypercholesterolemia. Obes Surg 1997;7:313–16.
40. Bull RH, Legorreta G. Outcome of gastric surgeryfor morbid obesity: weight changes andpersonality traits. Psychother Psychosom 1991;56:146–56.
41. Calle EE, Thun MJ, Petrelli JM, Rodriguez C,Heath CW, Jr. Body-mass index and mortality in aprospective cohort of U.S. adults. N Engl J Med1999;341:1097–105.
42. Cambien F, Chretien JM, Ducimetiere P, Guize L,Richard JL. Is the relationship between bloodpressure and cardiovascular risk dependent onbody mass index? Am J Epidemiol 1985;122:434–42.
43. Cerulli J, Malone M. Outcomes of pharmacologicaland surgical treatment for obesity.Pharmacoeconomics 1998;14:269–83.
44. Chao D, Espeland MA, Farmer D, Register TC,Lenchik L, Applegate WB, et al. Effect of voluntaryweight loss on bone mineral density in olderoverweight women. J Am Geriatr Soc 2000;48:753–9.
45. Chaturvedi N, Fuller JH. Mortality risk by bodyweight and weight change in people with NIDDM:the WHO Multinational Study of Vascular Diseasein Diabetes. Diabetes Care 1995;18:766–74.
46. Chen ZY, Sea MM, Kwan KY, Leung YH, Leung PF.Depletion of linoleate induced by weight cycling isindependent of extent of calorie restriction. Am JPhysiol 1997;272:R43–50.
47. Cheskin LJ. Review: most obesity treatmentmethods are ineffective over the long term. ACPJournal Club 1999;131:20.
48. Clark K. The effect of age on the associationbetween body-mass index and mortality. J InsurMed 1998;30:48–9.
49. Collazo-Clavell ML. Safe and effectivemanagement of the obese patient. Mayo Clin Proc1999;74:1255–9.
50. Cooney GJ, Storlien LH. Insulin action,thermogenesis and obesity. Baillieres Clin EndocrinolMetab 1994;8:481–507.
51. Corrigan SA, Raczynski JM, Swencionis C,Jennings SG. Weight reduction in the preventionand treatment of hypertension: a review ofrepresentative clinical trials. Am J Health Prom1991;5:208–14.
52. Damon A, Damon ST, Harpending HC, Kannel WB. Predicting coronary heart diseasefrom body measurements of Framingham males. J Chronic Dis 1969;21:781–802.
53. Davidson MH, Hauptman J, DiGirolamo M, Foreyt JP, Halsted CH, Heber D, et al. Weightcontrol and risk factor reduction in obese subjectstreated for 2 years with orlistat: a randomizedcontrolled trial [published erratum appears inJAMA 1999;281:1174]. JAMA 1999;281:235–42.
Appendix 18
340
54. Dawber TR, Thomas HE, Jr. Prophylaxis ofcoronary heart disease, stroke, and peripheralatherosclerosis. Ann N Y Acad Sci 1968;149:1038–57.
55. Detournay B, Fagnani F, Charles MA, Sermet C,Frerot L, Eschwedge E, et al. Obesity in France: ananalysis of the 1991/92 National HouseholdSurvey. Rev Epidemiol Sante Publique 1999;47:385–92.
56. Douketis JD, Feightner JW, Attia J, Feldman WF.Periodic health examination, 1999 update: 1.Detection, prevention and treatment of obesity.CMAJ 1999;160:513–25.
57. Drenick EJ, Simmons F, Murphy JF. Effect onhepatic morphology of treatment of obesity byfasting, reducing diets and small-bowel bypass. N Engl J Med 1970;282:829–34.
58. Drenick EJ, Johnson D. Weight reduction byfasting and semistarvation in morbid obesity: long-term follow-up. Int J Obes 1978;2:123–32.
59. Drenick EJ, Bale GS, Seltzer F, Johnson DG.Excessive mortality and causes of death inmorbidly obese men. JAMA 1980;243:443–5.
60. Drobnik W, Trummer S, Niklas-Eiband G, Lackner KJ, Spener F, Schmitz G. Comparativeclinical evaluation of the effects of a low energydiet alone or supplemented with a proprietaryformula on physical and metabolic parameters. J Clin Res 1998;1:326–38.
61. Ducimetiere P. Weight cycling in adults: morbidityand mortality. Cah Nutr Diet 1994;29:85–7.
62. Ensrud KE, Lipschutz RC, Cauley JA, Seeley D,Nevitt MC, Scott J, et al. Body size and hipfracture risk in older women: A prospective study.Am J Med 1997;103:274–80.
63. Ernst E. Does weight loss reduce plasmafibrinogen? Br Heart J 1993;70:116–18.
64. Feinleib M. Epidemiology of obesity in relation tohealth hazards. Ann Intern Med 1985;103:1019–24.
65. Felson DT, Zhang Y, Anthony JM, Naimark A,Anderson JJ. Weight loss reduces the risk forsymptomatic knee osteoarthritis in women. TheFramingham Study. Ann Intern Med 1992;116:535–9.
66. Felson DT, Zhang Y, Hannan MT, Anderson JJ.Effects of weight and body mass index on bonemineral density in men and women: theFramingham study. J Bone Miner Res 1993;8:567–73.
67. Felson DT. Weight and osteoarthritis. Am J ClinNutr 1996;63(Suppl 3):430–2S.
68. Ferrara A, Barrett-Connor E, Shan J. Total, LDL,and HDL cholesterol decrease with age in oldermen and women. The Rancho Bernardo Study1984–1994. Circulation 1997;96:37–43.
69. Fidanza F. Dietary fat, obesity and coronary heartdisease. Nutritio Dieta 1966;8:200–9.
70. Folsom AR, Kaye SA, Sellers TA, Hong C, Cerhan JR, Potter JD, et al. Body fat distributionand 5-year risk of death in older women. JAMA1993;269:483–7.
71. Folsom AR, Kushi LH, Anderson KE, Mink PJ,Olson JE, Hong C, et al. Associations of generaland abdominal obesity with multiple healthoutcomes in older women. The Iowa Women’sHealth Study. Arch Intern Med 2000;160:2117–28.
72. Fox SR, Oh KH, Fox K. Vertical banded gastroplastyand distal gastric bypass as primary procedures: acomparison. Obes Surg 1996;6:421–5.
73. Franks S, Kiddy D, Sharp P, Singh A, Reed M,Seppala M, et al. Obesity and polycystic ovarysyndrome. Ann N Y Acad Sci 1991;626:201–6.
74. French SA, Jeffery RW, Folsom AR, Williamson DF,Byers T. Relation of weight variability andintentionality of weight loss to disease history andhealth-related variables in a population-basedsample of women aged 55–69 years. Am J Epidemiol1995;142:1306–14.
75. Friedman GD, Kannel WB, Dawber TR. Theepidemiology of gallbladder disease: observationsin the Framingham Study. J Chronic Dis 1966;19:273–92.
76. Fujimoto I, Hamada T, Hasumi K, Masubuchi K,Sakamoto G, Sugano H. Epidemiological surveyon the relationship between obesity andendometrial cancer [in Japanese]. Jpn J Cancer Clin1986;32:1561–6.
77. Furuki K, Honda S, Jahng D, Ikeda M, Okubo T.The effects of a health promotion program onbody mass index. J Occup Health 1999;41:19–26.
78. Galletly C, Clark A, Tomlinson L, Blaney F.Improved pregnancy rates for obese, infertilewomen following a group treatment program. Anopen pilot study. Gen Hosp Psychiatry 1996;18:192–5.
79. Geisler HE, Gibbs CP. Invasive carcinoma of theendometrium. A 5 to 16 year follow-up of 183patients. Am J Obstet Gynecol 1968;102:516–20.
80. Genuth S. Implications of the United Kingdomprospective diabetes study for patients with obesityand type 2 diabetes. Obes Res 2000;8:198–201.
81. Gerber LM, Schwartz JE, Schnall PL, Devereux RB,Warren K, Pickering TG. Effect of body weightchanges on changes in ambulatory andstandardized non-physician blood pressures overthree years. Ann Epidemiol 1999;9:489–97.
82. Giacosa A, Franceschi S, La Vecchia C, Favero A,Andreatta R. Energy intake, overweight, physicalexercise and colorectal cancer risk. Eur J CancerPrev 1999;8(Suppl 1):S53–60.
Health Technology Assessment 2004; Vol. 8: No. 21
341
© Queen’s Printer and Controller of HMSO 2004. All rights reserved.
83. Gittelsohn A, Kinch S. Applications of life tableanalysis and automatic computer selection ofpopulation subgroupings for cardiovascularepidemiologic studies. Ann N Y Acad Sci 1965;126:767–78.
84. Glennon JA. Weight reduction – an enigma. ArchIntern Med 1966;118:1–2.
85. Goodfriend TL, Kelley DE, Goodpaster BH,Winters SJ. Visceral obesity and insulin resistanceare associated with plasma aldosterone levels inwomen. Obes Res 1999;7:355–62.
86. Gordon T, Kannel WB. Obesity and cardiovasculardiseases: the Framingham study. Clin EndocrinolMetab 1976;5:367–75.
87. Grilo CM. Physical activity and obesity. BiomedPharmacother 1994;48:127–36.
88. Gronbaek M, Deis A, Sorensen TIA, Becker U,Borch-Johnsen K, Muller C, et al. Influence of sex,age, body mass index, and smoking on alcoholintake and mortality. BMJ 1994;308:302–6.
89. Halverson JD, Scheff RJ, Gentry K, Alpers DH.Long-term follow-up of jejunoileal bypass patients.Am J Clin Nutr 1980;33(Suppl 2):472–5.
90. Harris T, Kleinman JC, Makuc DM, Gillum R,Feldman JJ. Is weight loss a modifier of thecholesterol–heart disease relationship in olderpersons? Data from the NHANES I epidemiologicfollow-up study. Ann Epidemiol 1992;2:35–41.
91. Harris TB, Savage PJ, Tell GS, Haan M,Kumanyika S, Lynch JC. Carrying the burden ofcardiovascular risk in old age: associations ofweight and weight change with prevalentcardiovascular disease, risk factors, and healthstatus in the Cardiovascular Health Study. Am JClin Nutr 1997;66:837–44.
92. Harris TB, Launer LJ, Madans J, Feldman JJ.Cohort study of effect of being overweight andchange in weight on risk of coronary heart diseasein old age. BMJ 1997;314:1791–4.
93. Haus G, Hoerr SL, Mavis B, Robison J. Keymodifiable factors in weight maintenance: fatintake, exercise, and weight cycling. J Am Diet Assoc1994;94:409–13.
94. Hawthorne V, Kozarevic D, Vojvodic N, Gillis CR,Hole D, Hart C, et al. Effect of smoking on thebody mass index–mortality relation: empiricalevidence from 15 studies. Am J Epidemiol 1999;150:1297–308.
95. Haynes RB. Is weight loss an effective treatmentfor hypertension? The evidence against. Can JPhysiol Pharmacol 1986;64:825–30.
96. Hell E, Miller KA, Moorehead MK, Norman S.Evaluation of health status and quality of life afterbariatric surgery: comparison of standard Roux-en-Y gastric bypass, vertical banded gastroplasty
and laparoscopic adjustable silicone gastricbanding. Obes Surg 2000;10:214–19.
97. Hensrud DD, Weinsier RL, Darnell BE, Hunter GR.A prospective study of weight maintenance inobese subjects reduced to normal body weightwithout weight-loss training. Am J Clin Nutr 1994;60:688–94.
98. Hernandez-Estefania R, Gonzalez-Lamuno D,Garcia-Ribes M, Garcia-Fuentes M, Cagigas JC,Ingelmo A, et al. Variables affecting BMI evolutionat 2 and 5 years after vertical banded gastroplasty.Obes Surg 2000;10:160–6.
99. Herrera MF, Oseguera J, Gamino R, Gutierrez-Cirlos C, Vargas-Vorackova F, Gonzalez-Barranco J,et al. Cardiac abnormalities associated with morbidobesity. World J Surg 1998;22:993–7.
100. Heyden S. The workingman’s diet. II. Effect ofweight reduction in obese patients withhypertension, diabetes, hyperuricemia andhyperlipidemia. Nutr Metab 1978;22:141–59.
101. Heyden S, Borhani NO, Tyroler HA, Schneider KA,Langford HG, Hames CG, et al. The relationshipof weight change to changes in blood pressure,serum uric acid, cholesterol and glucose in thetreatment of hypertension. J Chronic Dis 1985;38:281–8.
102. Himeno E, Nishino K, Okazaki T, Nanri H, Ikeda M. A weight reduction and weightmaintenance program with long-lastingimprovement in left ventricular mass and bloodpressure. Am J Hypertens 1999;12:682–90.
103. Holman SL, Goldstein DJ, Enas GG. Patternanalysis method for assessing successful weightreduction. Int J Obes Relat Metab Disord 1994;18:281–5.
104. Huang Z, Hankinson SE, Colditz GA, Stampfer MJ,Hunter DJ, Manson JE, et al. Dual effects of weightand weight gain on breast cancer risk. JAMA 1997;278:1407–11.
105. Hubert HB. The nature of the relationshipbetween obesity and cardiovascular disease. Int JCardiol 1984;6:268–74.
106. Hubert HB, Eaker ED, Garrison RJ, Castelli WP.Life-style correlates of risk factor change in youngadults: an eight-year study of coronary heartdisease risk factors in the Framingham offspring[published erratum appears in Am J Epidemiol1987;126:559]. Am J Epidemiol 1987;125:812–31.
107. Jacobsen BK, Njolstad I, Thune I, Wilsgaard T,Lochen ML, Schirmer H. Increase in weight in allbirth cohorts in a general population: the TromsoStudy, 1974–1994. Arch Intern Med 2001;161:466–72.
108. Jensen GL, Rogers J. Obesity in older persons. J Am Diet Assoc 1998;98:1308–11.
Appendix 18
342

109. Kamel EG, McNeill G, Van Wijk MCW. Change inintra-abdominal adipose tissue volume duringweight loss in obese men and women: correlationbetween magnetic resonance imaging andanthropometric measurements. Int J Obes 2000;24:607–13.
110. Kannel WB, LeBauer EJ, Dawber TR, McNamara PM. Relation of body weight todevelopment of coronary heart disease. TheFramingham study. Circulation 1967;35:734–44.
111. Kant AK, Graubard BI, Schatzkin A, Ballard-Barbash R. Proportion of energy intake from fatand subsequent weight change in the NHANES Iepidemiologic follow-up study. Am J Clin Nutr1995;61:11–17.
112. Karason K, Lindroos AK, Stenlof K, Sjostrom L.Relief of cardiorespiratory symptoms andincreased physical activity after surgically inducedweight loss. Results from the Swedish ObeseSubjects Study. Arch Intern Med 2000;160:1797–1802.
113. Keller C, Thomas KT. Assessment of overweightand obese patients. Nurse Pract Forum 1997;8:99–104.
114. Keys A. Is overweight a risk factor for coronaryheart disease? Cardiovasc Med 1979;4:1233–43.
115. Kilburn KH, Asmundsson T. Factors influencingthe course of COPD. Postgrad Med 1973;54:135–41.
116. Kirschenbaum DS, Stalonas PM, Zastowny TR,Tomarken AJ. Behavioral treatment of adultobesity: attentional controls and a 2-year follow-up. Behav Res Ther 1985;23:675–82.
117. Kluthe R, Schubert A. Obesity in Europe. AnnIntern Med 1985;103:1037–42.
118. Kochar MS. Hypertension in obese patients.Postgrad Med 1993;93:193–5.
119. Koeppl PM, Heller J, Bleecker ER, Meyers DA,Goldberg AP, Bleecker ML. The influence ofweight reduction and exercise regimes upon thepersonality profiles of overweight males. J ClinPsychol 1992;48:463–71.
120. Kromhout D. Body weight, diet, and serumcholesterol in 871 middle-aged men during 10years of follow-up (the Zutphen Study). Am J ClinNutr 1983;38:591–8.
121. Kumanyika SK. The impact of obesity onhypertension management in African Americans. J Health Care Poor Underserved 1997;8:352–64.
122. Kushner RF, Foster GD. Obesity and quality of life.Nutrition 2000;16:947–52.
123. Landaluce EA, Andres MAD, Garage MAS. Dietaryhabits in a cohort of obese individuals [inSpanish]. Enferm Clin 1996;6:18–23.
124. Lanier VC, Younger RK, Scott HW, Law DH.Metabolic changes in morbidly obese men and
women after massive intestinal bypass. Surg Forum1969;20:397–8.
125. Larsson B, Svardsudd K, Welin L, Wilhelmsen L,Bjorntorp P, Tibblin G. Abdominal adipose tissuedistribution, obesity, and risk of cardiovasculardisease and death: 13 year follow up ofparticipants in the study of men born in 1913.BMJ 1984;288:1401–4.
126. Launer LJ, Harris T, Rumpel C, Madans J. Bodymass index, weight change, and risk of mobilitydisability in middle-aged and older women: theepidemiologic follow-up study of NHANES 1.JAMA 1994;271:1093–8.
127. Lindner H, Muller R, Rahn U, Ritz JP, Tillmann W.Long-term observations on the value of fastingand reducing diets [in German]. Medizin Klin1970;65:1914–19.
128. Lisch HJ, Bolzano K, Herbst M, Sailer S,Sandhofer F, Braunsteiner H. Effect of bodyweight changes on plasma lipids in patients withprimary hyperlipoproteinemia. Atherosclerosis 1974;19:477–84.
129. Lissner L. Causes, diagnosis and risks of obesity.Pharmacoeconomics 1994;5(Suppl 1):8–17.
130. Liu MY, Yeh SL, Chen WJ. Effects of weightreduction on body composition and plasma lipidsin obese women. Nutr Sci J 1998;23:83–93.
131. Losee RH. Variables related to weight loss andmanagement: long-term follow-up [PhD thesis].Boston, MA: Boston University; 1991.
132. Luyckx FH, Lefebvre PJ, Scheen AJ. Non-alcoholicsteatohepatitis: association with obesity and insulinresistance, and influence of weight loss. DiabetesMetab 2000;26:98–106.
133. MacCuish AC, Munro JF, Duncan LJ. Follow-upstudy of refractory obesity treated by fasting. BMJ1968;i:91–2.
134. Macgregor AM, Rand CS. Gastric surgery inmorbid obesity. Outcome in patients aged 55 yearsand older. Arch Surg 1993;128:1153–7.
135. Makhmudov BK, Kadyrova FR, Karimov TM,Kaiumov UK, Adylova MS. 2 years’ results of theimplementation of measures for the multi-factorprevention of ischemic heart disease in men aged40–59 years [in Russian]. Terapevticheskii Arkhiv1986;58:66–8.
136. Manson JE, Stampfer MJ, Hennekens CH, Willett WC. Body weight and longevity. Areassessment. JAMA 1987;257:353–8.
137. Margolis KL, Ensrud KE, Schreiner PJ, Tabor HK.Body size and risk for clinical fractures in olderwomen. Ann Intern Med 2000;133:123–7.
138. Martinez-Gonzalez MA, Fernandez-Garcia J,Sanchez-Izquierdo F, Lardelli-Claret P, Moleon JJ,
Health Technology Assessment 2004; Vol. 8: No. 21
343
© Queen’s Printer and Controller of HMSO 2004. All rights reserved.

Galvez-Vargas R. Life-style factors associated withchanges in serum lipids in a follow-up study ofcardiovascular risk factors. Eur J Epidemiol 1998;14:525–33.
139. McAlindon TE, Wilson PWF, Aliabadi P, Weissman B, Felson DT. Level of physical activityand the risk of radiographic and symptomaticknee osteoarthritis in the elderly: the Framinghamstudy. Am J Med 1999;106:151–7.
140. McLaren BA. Nutritional control of overweight.Can J Public Health 1967;58:483–5.
141. Meinert CL, Borhani NO, Langford HG. Design,methods, and rationale in the HypertensionPrevention Trial. Control Clin Trials 1989;10(Suppl 3):1–29S.
142. Melissas J, Christodoulakis M, Spyridakis M,Schoretsanitis G, Michaloudis D, Papavasiliou E, et al. Disorders associated with clinically severeobesity: significant improvement after surgicalweight reduction. South Med J 1998;91:1143–8.
143. Mertens IL, Van Gaal LF. Overweight, obesity, and blood pressure: the effects of modest weightreduction. Obes Res 2000;8:270–8.
144. Mertz DP, Wobbe HD. Effect of reducing diets ofdifferent calorific value on body weight [inGerman]. Zeitschrift Allgemeinmedizin 1977;53:653–8.
145. Miller K, Mayer E, Pichler M, Hell E. Quality-of-life outcomes of patients with the Lap-Band™versus non-operative treatment of obesity.Preliminary results of an ongoing long-termfollow-up study. Obes Surg 1997;7:280.
146. Moller H, Mellemgaard A, Lindvig K, Olsen JH.Obesity and cancer risk: a Danish record-linkagestudy. Eur J Cancer 1994;30:344–50.
147. Monteforte MJ, Turkelson CM. Bariatric surgeryfor morbid obesity. Obes Surg 2000;10:391–401.
148. Montorsi W, Doldi SB, Klinger R, Montorsi F.Surgical therapy for morbid obesity. Int Surg 1986;71:84–6.
149. Moya Nueno FJ. Modifications of serumcholesterol and triglyceride, blood glucose andblood pressure as cardiovascular risk factors afterweight reduction: a study in a primary assintencialcenter. Clin Cardiovasc 1999;17:26–41.
150. Muls E, Van Gaal L, Autier P, Vansant G. Effects ofinitial BMI and on-treatment weight change onthe lipid-lowering efficacy of fibrates. Int J ObesRelat Metab Disord 1997;21:155–8.
151. Narbro K, Agren G, Jonsson E, Larsson B,Naslund I, Wedel H, et al. Sick leave and disabilitypension before and after treatment for obesity: areport from the Swedish Obese Subjects (SOS)study. Int J Obes Relat Metab Disord 1999;23:619–24.
152. Naslund E, Backman L, Granstrom L, Stockeld D.Seven year results of vertical banded gastroplastyfor morbid obesity. Eur J Surg 1997;163:281–6.
153. Nielsen SE, Andresen JL, Rafaelsen OJ. Diabetesmellitus appearing after 40 years of age.Overweight and attempt at weight reduction [inDanish]. Ugeskr Laeger 1969;131:227–34.
154. Nindl BC, Friedl KE, Marchitelli LJ, Shippee RL ,Thomas CD, Patton JF. Regional fat placement inphysically fit males and changes with weight loss.Med Sci Sports Exerc 1996;28:786–93.
155. Nir Z, Neumann L. Relationship among self-esteem, internal–external locus of control, andweight change after participation in a weightreduction program. J Clin Psychol 1995;51:482–90.
156. Nomura F. Epidemiology and follow-up studies ofobesity-related fatty liver. Bull Phys Fitness Res Inst1990;75:105–8.
157. O’Brien PE, Brown WA, Smith A, McMurrick PJ,Stephens M. Prospective study of a laparoscopicallyplaced, adjustable gastric band in the treatment ofmorbid obesity. Br J Surg 1999;86:113–18.
158. O’Sullivan JB. Population retested for diabetesafter 17 years: new prevalence study in Oxford,Massachusetts. Diabetologia 1969;5:211–14.
159. Owusu W, Willett W, Ascherio A, Spiegelman D,Rimm E, Feskanich D, et al. Body anthropometryand the risk of hip and wrist fractures in men:results from a prospective study. Obes Res 1998;6:12–19.
160. Partinen M, Jamieson A, Guilleminault C. Long-term outcome for obstructive sleep apneasyndrome patients. Mortality. Chest 1988;94:1200–4.
161. Partinen M, Guilleminault C. Daytime sleepinessand vascular morbidity at seven-year follow-up inobstructive sleep apnea patients. Chest 1990;97:27–32.
162. Pasquali R, Colella P, Cirignotta F, Mondini S,Gerardi R, Buratti P, et al. Treatment of obesepatients with obstructive sleep apnea syndrome(OSAS): effect of weight loss and interference ofotorhinolaryngoiatric pathology. Int J Obes 1990;14:207–17.
163. Perri MG, McAdoo WG, McAllister DA, Lauer JB,Yancey DZ. Enhancing the efficacy of behaviortherapy for obesity: effects of aerobic exercise anda multicomponent maintenance program. J Consult Clin Psychol 1986;54:670–5.
164. Perri MG, McAllister DA, Gange JJ, Jordan RC,McAdoo G, Nezu AM. Effects of four maintenanceprograms on the long-term management ofobesity. J Consult Clin Psychol 1988;56:529–34.
165. Peters ET, Seidell JC, Menotti A, Arayanis C,Dontas A, Fidanza F, et al. Changes in body weight
Appendix 18
344

in relation to mortality in 6441 European middle-aged men: the Seven Countries Study. Int J ObesRelat Metab Disord 1995;19:862–8.
166. Petersmarck KA, Teitelbaum HS, Bond JT, Bianchi L, Hoerr SM, Sowers MF. The effect ofweight cycling on blood lipids and blood pressurein the Multiple Risk Factor Intervention TrialSpecial Intervention Group. Int J Obes Relat MetabDisord 1999;23:1246–55.
167. Pi-Sunyer FX. A review of long-term studiesevaluating the efficacy of weight loss inameliorating disorders associated with obesity. Clin Ther 1996;18:1006–35.
168. Pories WJ, Caro JF, Flickinger EG, Meelheim HD,Swanson MS. The control of diabetes mellitus(NIDDM) in the morbidly obese with the GreenvilleGastric Bypass. Ann Surg 1987;206:316–23.
169. Pories WJ, MacDonald KG, Jr, Morgan EJ, Sinha MK, Dohm GL, Swanson MS, et al. Surgicaltreatment of obesity and its effect on diabetes: 10-y follow-up. Am J Clin Nutr 1992;55(Suppl 2):582–5S.
170. Power C, Parsons T. Nutritional and otherinfluences in childhood as predictors of adultobesity. Proc Nutr Soc 2000;59:267–72.
171. Powers PS, Perez A, Boyd F, Rosemurgy A. Eating pathology before and after bariatricsurgery: a prospective study. Int J Eat Disord1999;25:293–300.
172. Purnell JQ, Kahn SE, Albers JJ, Nevin DN,Brunzell JD, Schwartz RS. Effect of weight losswith reduction of intra-abdominal fat on lipidmetabolism in older men. J Clin Endocrinol Metab2000;85:977–82.
173. Ramsay LE. Obesity and hypertension. Nephron1987;47(Suppl 1):5–7.
174. Rand CSW, Kuldau JM, Robbins L. Surgery forobesity and marriage quality. JAMA 1982;247:1419–22.
175. Rebuffe-Scrive M, Hendler R, Bracero N,Cummings N, McCarthy S, Rodin J. Biobehavioraleffects of weight cycling. Int J Obes 1994;18:651–8.
176. Reisin E. Weight reduction in the management ofhypertension: epidemiologic and mechanisticevidence. Can J Physiol Pharmacol 1986;64:818–24.
177. Rexrode KM, Manson JE, Hennekens CH. Obesity and cardiovascular disease. Curr OpinCardiol 1996;11:490–5.
178. Reynolds MW, Fredman L, Langenberg P,Magaziner J. Weight, weight change, mortality in arandom sample of older community-dwellingwomen. J Am Geriatr Soc 1999;47:1409–14.
179. Rippe JM, Crossley S, Ringer R. Obesity as achronic disease: modern medical and lifestylemanagement. J Am Diet Assoc 1998;98:10(Suppl 2):S9–15.
180. Rissanen A, Heliovaara M, Aromaa A. Obesity andbody weight changes. Comments on a long-termFinnish study [in Swedish]. Nordisk Med 1986;101:347.
181. Roschal H, Lang B, Hell E. Effects of surgicaltherapy of extreme obesity on physical andpsychological outcome [in German]. Wien KlinWochenschr 1992;104:467–73.
182. Rosengren A, Wedel H, Wilhelmsen L. Body weightand weight gain during adult life in men inrelation to coronary heart disease and mortality. A prospective population study. Eur Heart J 1999;20:269–77.
183. Rumpel C, Harris TB, Madans J. Modification ofthe relationship between the Quetelet index andmortality by weight-loss history among olderwomen. Ann Epidemiol 1993;3:343–50.
184. Russell CM, Williamson DF, Byers T. Can the Year2000 objective for reducing overweight in theUnited States be reached?: a simulation study ofthe required changes in body weight. Int J ObesRelat Metab Disord 1995;19:149–53.
185. Ryan AS. Insulin resistance with aging: effects ofdiet and exercise. Sports Med 2000;30:327–46.
186. Saito K, Furuta Y, Omatsu T, Yamanishi J,Nishimura Y, Hsieh S, et al. Relation of obesity toblood pressure behavior in patients withborderline hypertension – a ten-year follow-upstudy [in Japanese]. J Jpn Soc Intern Med 1985;74:1395–9.
187. Salmon PA. The results of small intestine bypassoperations for the treatment of obesity. SurgGynecol Obstet 1971;132:965–79.
188. Salonen JT, Tuomilehto J, Puska P. The relation ofphysical activity changes to changes in serumcholesterol and body weight in a three-year follow-up to population sample. Scand J Soc Med 1981;9:109–17.
189. Sarlio-Lahteenkorva S, Rissanen A, Kaprio J. A descriptive study of weight loss maintenance: 6 and 15 year follow-up of initially overweightadults. Int J Obes Relat Metab Disord 2000;24:116–25.
190. Sarwer DB, Wadden TA. The treatment of obesity:what’s new, what’s recommended. J Womens HealthGend Based Med 1999;8:483–93.
191. Scheen AJ, Lefebvre PJ. Management of the obesediabetic patient. Diabetes Rev 1999;7:77–93.
192. Schmitz KH, Jacobs DR, Leon AS, Schreiner PJ,Sternfeld B. Physical activity and body weight:associations over ten years in the CARDIA study.Int J Obes 2000;24:1475–87.
193. Sedgwick AW, Davidson AH, Taplin RE, Thomas DW. Effects of physical activity on riskfactors for coronary heart disease in previouslysedentary women: a five-year longitudinal study.Aust N Z J Med 1988;18:600–5.
Health Technology Assessment 2004; Vol. 8: No. 21
345
© Queen’s Printer and Controller of HMSO 2004. All rights reserved.

194. Seidell JC, Flegal KM. Assessing obesity:classification and epidemiology. Br Med Bull 1997;53:238–52.
195. Seidell JC, Visscher TL, Hoogeveen RT.Overweight and obesity in the mortality rate data:current evidence and research issues. Med SciSports Exerc 1999;31(11 Suppl):S597–601.
196. Settnes A, Jorgensen T, Lange AP. Hysterectomy ina Danish population. Weight-related factors,psychological factors and life style variables [inDanish]. Ugeskr Laeger 1997;159:3408–12.
197. Sharma AM, Pischon T, Engeli S, Scholze J.Choice of drug treatment for obesity-relatedhypertension: where is the evidence? J Hypertens2001;19:667–74.
198. Shick SM, Wing RR, Klem ML, McGuire MT, Hill JO, Seagle H. Persons successful at long-termweight loss and maintenance continue to consumea low-energy, low-fat diet. J Am Diet Assoc 1998;98:408–13.
199. Shike M. Body weight and colon cancer. Am J ClinNutr 1996;63(Suppl 3):442–4S.
200. Shiozaki H, Koga Y, Omori G, Tamaki M. Obesityand osteoarthritis of the knee in women: resultsfrom the Matsudai Knee Osteoarthritis Survey.Knee 1999;6:189–92.
201. Shoff SM, Klein R, Moss SE, Klein BE,Cruickshanks KJ. Weight change and glycemiccontrol in a population-based sample of adultswith older-onset diabetes. J Gerontol Series A 1998;53:M27–32.
202. Sjostrom CD, Lissner L, Sjostrom L. Relationshipsbetween changes in body composition andchanges in cardiovascular risk factors: the SOSIntervention Study. Obes Res 1997;5:519–30.
203. Sjostrom CD, Lissner L, Wedel H, Sjostrom L.Reduction in incidence of diabetes, hypertensionand lipid disturbances after intentional weight lossinduced by bariatric surgery: the SOS InterventionStudy. Obes Res 1999;7:477–84.
204. Soltani H, Fraser RB. A longitudinal study ofmaternal anthropometric changes in normalweight, overweight and obese women duringpregnancy and postpartum [published erratumappears in Br J Nutr 2000;84:947]. Br J Nutr2000;84:95–101.
205. Sorensen TIA, Andersen B, Hylander E, Jensen LI,Laursen K, Klein HC. Prospective study ofmalabsorption induced risk of gall stone formationin relation to fall in plasma cholesterol. Gut 1988;29:108–13.
206. Staessen J, Fagard R, Amery A. The relationshipbetween body weight and blood pressure. J HumHypertens 1988;2:207–17.
207. Steinbach M, Constantineanu M, Harnagea P,Theodorini S, Georgescu M, Mitu S, et al. The
Bucharest multifactorial prevention trial ofcoronary heart disease. General methodology andrisk factor correction after five year follow-up(1971–1977). Med Interne 1982;20:117–36.
208. Stern JS, Hirsch J, Blair SN, Foreyt JP, Frank A,Kumanyika SK, et al. Weighing the options:criteria for evaluating weight-managementprograms. The Committee to Develop Criteria forEvaluating the Outcomes of Approaches to Preventand Treat Obesity. Obes Res 1995;3:591–604.
209. Stevens J, Cai J, Pamuk ER, Williamson DF, Thun MJ, Wood JL. The effect of age on theassociation between body-mass index andmortality. N Engl J Med 1998;338:1–7.
210. Stoll BA. Adiposity as a risk determinant forpostmenopausal breast cancer. Int J Obes RelatMetab Disord 2000;24:527–33.
211. Strobel RJ, Rosen RC. Obesity and weight loss inobstructive sleep apnea: a critical review. Sleep1996;19:104–15.
212. Stunkard AJ, Penick SB. Behavior modification inthe treatment of obesity. The problem ofmaintaining weight loss. Arch Gen Psychiatry 1979;36:801–6.
213. Stunkard AJ. Current views on obesity. Am J Med1996;100:230–6.
214. Suadicani P, Hein HO, Gyntelberg F. Weightchanges and risk of ischaemic heart disease formiddle aged and elderly men. An 8-year follow-upin the Copenhagen Male study. J Cardiovasc Risk1997;4:25–32.
215. Sugerman H, Windsor A, Bessos M, Kellum J,Reines H, DeMaria E. Effects of surgically inducedweight loss on urinary bladder pressure, sagittalabdominal diameter and obesity co-morbidity. IntJ Obes 1998;22:230–5.
216. Swanson DW, Dinello FA. Follow-up of patientsstarved for obesity. Psychosom Med 1970;32:209–14.
217. Taylor CB, Jatulis DE, Fortmann SP, Kraemer HC.Weight variability effects: a prospective analysisfrom the Stanford Five-City Project. Am J Epidemiol1995;141:461–5.
218. Terra JL, Teboul F, Borson-Charzot F, Labrousse F,Berthezene F. The bariatric surgery as a new bodytransplant. Psychol Medicale 1994;26:117–19.
219. Thomas PS, Owen ERTC, Hulands G, Milledge JS.Respiratory function in the morbidly obese beforeand after weight loss. Thorax 1989;44:382–6.
220. Thompson KS, Fletcher SW, O’Malley MS,Buckwalter JA. Long-term outcomes of morbidlyobese patients treated with gastrogastrostomy. J Gen Intern Med 1986;1:85–9.
221. Torres H, Hernandez G, Perea R, Guerrero G. 5.7 cm double silastic ring gastroplasty + posterior
Appendix 18
346

fundoplasty ‘an effective alternative to treatmoderate–severe obesity’. Obes Surg 1997;7:289.
222. Tran ZV, Weltman A. Differential effects of exerciseon serum lipid and lipoprotein levels seen withchanges in body weight. A meta-analysis. JAMA1985;254:919–24.
223. Tremblay A, Doucet E, Imbeault P, Mauriege P,Despres JP, Richard D. Metabolic fitness in activereduced-obese individuals. Obes Res 1999;7:556–63.
224. Tretli S, Magnus K. Height and weight in relationto uterine corpus cancer morbidity and mortality.A follow-up study of 570,000 women in Norway.Int J Cancer 1990;46:165–72.
225. Troiano RP, Frongillo EA, Sobal J, Levitsky DA.The relationship between body weight andmortality: a quantitative analysis of combinedinformation from existing studies. Int J Obes RelatMetab Disord 1996;20:63–75.
226. Tsevat J, Weinstein MC, Williams LW, Tosteson AN,Goldman L. Expected gains in life expectancyfrom various coronary heart disease risk factormodifications [published erratum appears inCirculation 1991;84:2610]. Circulation 1991;83:1194–201.
227. Ulvik NM, Helsingen N. Jejuno-ileal bypass inobesity [in Norwegian]. Tidsskr Nor Laegeforen1973;93:570–3.
228. Vandenbroucke JP, Matroos AW, Heide-Wessel C,van der Heide RM. The Quetelet index aspredictor of life expectancy at middle age;reevaluation after 25 years in 3091 subjects [inDutch]. Ned Tijdschr Geneesk 1982;126:2180–4.
229. Vatten LJ, Kvinnsland S. Prospective study ofheight, body mass index and risk of breast cancer.Acta Oncol 1992;31:195–200.
230. Wadden TA, Frey DL. A multicenter evaluation ofa proprietary weight loss program for thetreatment of marked obesity: a five-year follow-up.Int J Eat Disord 1997;22:203–12.
231. Waki M, Heshka S, Heymsfield SB. Long-termserum lipid lowering, behavior modification, andweight loss in obese women. Nutrition 1993;9:23–8.
232. Walker M, Wannamethee G, Whincup PH, ShaperAG. Weight change and risk of heart attack inmiddle-aged British men. Int J Epidemiol 1995;24:694–703.
233. Wannamethee SG, Shaper AG, Whincup PH,Walker M. Characteristics of older men who loseweight intentionally or unintentionally. Am JEpidemiol 2000;151:667–75.
234. Wechsler JG, Ditschuneit H. Long-term results oftreatment of obesity [in German]. Med Klin 1980;75:544–50.
235. Wechsler JG, Hutt V, Wenzel H. Lipids andlipoproteins during a very-low-calorie diet. Int JObes 1981;5:325–31.
236. Weinsier RL, Wilson LJ, Lee J. Medically safe rateof weight loss for the treatment of obesity: aguideline based on risk of gallstone formation. AmJ Med 1995;98:115–17.
237. Werner I, Hambraeus L, Thoren L. Relationshipbetween weight reduction and state ofmalabsorption after jejunoileal bypass for excessiveobesity. Hum Nutr Appl Nutr 1985;39:95–100.
238. Whelton PK, Adams-Campbell LL, Appel LJ,Cutler J, Donato K, Elmer PJ, et al. National HighBlood Pressure Education Program WorkingGroup report on primary prevention ofhypertension. Arch Intern Med 1993;153:186–208.
239. Willett WC, Manson JE, Stampfer MJ, Colditz GA,Rosner B, Speizer FE, et al. Weight, weight change,and coronary heart disease in women: risk withinthe ‘normal’ weight range. JAMA 1995;273:461–5.
240. Williams KV, Erbey JR, Becker D, Orchard TJ.Improved glycemic control reduces the impact ofweight gain on cardiovascular risk factors in type 1diabetes: the Epidemiology of DiabetesComplications Study. Diabetes Care 1999;22:1084–91.
241. Williamson DF, Pamuk ER. The associationbetween weight loss and increased longevity. Areview of the evidence. Ann Intern Med 1993;119(7 Pt 2):t-6.
242. Wilson PW, Anderson KM, Harris T, Kannel WB,Castelli WP. Determinants of change in totalcholesterol and HDL-C with age: the FraminghamStudy. J Gerontol 1994;49:M252–7.
243. Wing RR, Venditti E, Jakicic JM, Polley BA, LangW. Lifestyle intervention in overweight individualswith a family history of diabetes. Diabetes Care1998;21:350–9.
244. Witt Hamer PC, Hunfeld MA, Tuinebreijer WE.Obesity surgery: discouraging long term resultswith Mason’s vertical banded gastroplasty. Eur JSurg 1999;165:855–60.
245. Wittgrove AC, Clark GW. Laparoscopic gastricbypass: a four year prospective study of 230patients followed from 3 to 42 months. Obes Surg1997;7:285–6.
246. Yajnik C. Interactions of perturbations inintrauterine growth and growth during childhoodon the risk of adult-onset disease. Proc Nutr Soc2000;59:257–65.
247. Yarnell JWG, Patterson CC, Thomas HF,Sweetnam PM. Comparison of weight in middleage, weight at 18 years, and weight changebetween, in predicting subsequent 14 yearmortality and coronary events: CaerphillyProspective Study. J Epidemiol Community Health2000;54:344–8.
Health Technology Assessment 2004; Vol. 8: No. 21
347
© Queen’s Printer and Controller of HMSO 2004. All rights reserved.

248. Yu MC, Mack TM, Hanisch R, Cicioni C,Henderson BE. Cigarette smoking, obesity,diuretic use, and coffee consumption as riskfactors for renal cell carcinoma. J Natl Cancer Inst1986;77:351–6.
249. Zuber J, Gromus B, Potreck-Rose F, Koch U.Differential indication for out-patient grouptherapy of obesity – by the example of the‘Interdisciplinary therapy of obesity’. PsychotherPsychosom Med Psychol 1992;42:110–19.
Obese subgroup studies thatcould not be analysed
1. Borkan GA, Sparrow D, Wisniewski C, Vokonas PS.Body weight and coronary disease risk: patterns ofrisk factor change associated with long-termweight change. The Normative Aging Study. Am JEpidemiol 1986;124:410–19.
2. French SA, Folsom AR, Jeffery RW, Williamson DF.Prospective study of intentionality of weight lossand mortality in older women: the Iowa Women’sHealth Study. Am J Epidemiol 1999;149:504–14.
3. Huang Z, Willett WC, Manson JE, Rosner B,Stampfer MJ, Speizer FE, et al. Body weight,weight change, and risk for hypertension inwomen. Ann Intern Med 1998;128:81–8.
4. Rumpel C, Ingram DD, Harris TB, Madans J. The association between weight change andpsychological well-being in women. Int J Obes RelatMetab Disord 1994;18:179–83.
5. Allison DB, Zannolli R, Faith MS, Heo M,Pietrobelli A, VanItallie TB, et al. Weight lossincreases and fat loss decreases all-cause mortality
rate: results from two independent cohort studies.Int J Obes 1999;23:603–11.
6. Fine JT, Colditz GA, Coakley EH, Moseley G,Manson JE, Willett WC, et al. A prospective studyof weight change and health-related quality of lifein women. JAMA 1999;282:2136–42
Studies that could not beanalysed owing to insufficientinformation in published papers
1. Fumelli P, Boemi M, Romagnoli F, Rabini RA,Brandoni G, Carle F, et al. Influence of body masson glycemic control in a type 2 diabeticpopulation: a 3-year follow-up. Arch GerontolGeriatr 2000;30:1–5.
2. Manson J, Willett WC, Stampfer MJ, Colditz G,Hunter DJ, Hankinson SE, et al. Body weight andmortality among women. N Engl J Med 1995;333:677–85.
3. Resnick HE, Valsania P, Halter JB, Lin X. Relationof weight gain and weight loss on subsequentdiabetes risk in overweight adults. J EpidemiolCommunity Health 2000;54:596–602.
4. Rexrode KM, Hennekens CH, Willett WC, Colditz GA, Stampfer MJ, Rich-Edwards JW, et al.A prospective study of body mass index, weightchange, and risk of stroke in women. JAMA1997;277:1539–45.
5. Wittgrove AC, Clark GW. Laparoscopic gastricbypass: a four year prospective study of 230patients followed from 3 to 42 months. Obes Surg1997;7:285–6.
Appendix 18
348

Health Technology Assessment 2004; Vol. 8: No. 21
349
© Queen’s Printer and Controller of HMSO 2004. All rights reserved.
Appendix 19
Characteristics of prospective studies included in the review, and recent papers and studies toupdate the epidemiology review for long-term
health outcomes
Appendix 19a
Characteristics of prospective studies included in the review

Appendix 19a
350
First author, year Country Sample size Outcomes measured Outcome Intervention Average Percentage indices follow-up (years) follow-up
Prospective studies (n = 28)
Peppard, 2000290 USA 258 Sleep apnoea (AHI) OR None 4 72.8%(M 140, F 128)
Charuzi, 1992264 Israel 51 AI Absolute value Surgical 6.3 86%(M 44, F 7) (bariatric surgery)
Sugerman, 1992291 USA 126 AI, lung volume AI: value; PaO2 and Surgical 4.5 45%(M 78, F 48) PCO2: mmHg (VBG)
Pories, 1992266 USA 515 DM, hypertension Incidence Surgical 11 50% at 5 years(M 77, F 438) (gastric bypass)
Williamson, 1995274 USA 43,457 Mortality: all cause, CVD, Mortality rate ratios None 12.9 ?91%(all F) cancer, DM
Williamson, 1999273 USA 49,337 Mortality: all cause, CVD, Mortality rate ratios None 12.9 ?91%(all M) cancer, DM
Williamson, 2000275 USA 4970 Mortality: all cause, CVD, Mortality rate ratios None 12.9 91.4%(M 2509, F 2461) cancer, DM
Rumpel, 1993276 USA 326 Mortality: all cause, CVD, Relative risks None Median 13.6 ?(all F) cancer, other (weight groups)
Chaturvedi, 1995267 Europe 541 Mortality in NIDDM Relative risks None 8–19 ?(M 210, F 331)
O’Leary, 1980272 USA 274 DM, lipids, hypertension % improved Surgical ?7 (not clear) ?84%(jejunal bypass)
Ford, 1997268 USA 8545 DM Hazard ratio None ?10 ?(M 3220, F 5325) (weight groups)
Moore, 2000269 USA 618 DM Relative risks None 16 ?(M 333, F 285)
Watts, 1990281 USA 135 DM Glucose: mmol/l Non-surgical 4 ?(diet)
Wannamethee, 1999280 UK 7735 DM Relative risks, None Mean 16.8 91%(all M) incidence rate
Wittgrove, 2000289 USA 500 Co-morbidities Proportion of Surgical 3–60 months <1% at reduction (gastric bypass) 5 years
continued

Health Technology Assessm
ent2004; Vol. 8: No. 21
351
© Q
ueen’s Printer and Controller of H
MSO
2004. All rights reserved.
First author, year Country Sample size Outcomes measured Outcome Intervention Average Percentage indices follow-up (years) follow-up
Hess, 1998271 USA 440 Lipids, glucose Lipids and glucose: Surgical 8 21% at 5 years(M 95, F 345) mg/dl (biliopancreatic
diversion)
Wing, 1995282 (W) USA 202 Lipids, BP Lipids: mmol/l or Non-surgical 2.5 76%(M 101, F 101) mg/dl; BP: mmHg (VLCD, exercise and
behaviour)
Kauffman, 1992283 Spain 836 Lipids, BP Correlation Non-surgical 2 77%(M 714, F 125) (diet and exercise)
Gleysteen, 1992286 USA 43 Lipids mmol/l Surgical 5–7 77%(Roux-en-Y bypass)
Rossner, 1980287 Sweden 29 Lipids mmol/l Surgical 3.6 80% (M), (M 10, F 19) (jejunoileal bypass) 53% (F)
Ewbank, 1995284 UK 55 Lipids mmol/l Non-surgical 2 82%(VLCD and behaviour)
Foster, 1996163 (W) USA 48 Psychological well-being No. of events Combined 4.8 45%(all F) (surgical and
non-surgical)
van Gemert, 1998270 Netherlands 62 Psychological well-being NVM, NPV and Surgical 7.2 91%(M 18, F 44) SIG scores (VBG, gastric banding
or bypass)
Holt, 1987265 USA 50 Co-morbidities % improvement of Surgical 2–5 80%(M 12, F 38) (lipids, DM, stress all co-morbidities (VBG)
incontinence, sleep apnoea, togetherhypertension, arthritis)
Kunesova, 1998262 Prague 318 Hypertension mmHg Combined 3.5 32.4%(M 64, F 254) (surgical and
non-surgical)
Carson, 1994263 USA 45 Hypertension % improved Surgical 4 40% at 4 years(M 10; F 35) (gastric bypass)
Foley, 1992288 USA 74 Hypertension % improved Surgical 4.2 91%(M 24, F 50) (Roux-en-Y, VBG)
Sjostrom M, 1999285 Sweden 36 Hypertension, lipids Hypertension: mmHg; Non-surgical 5 lipids: mmol/l
continued

Appendix 19a
352
First author, year Country Sample size Outcomes measured Outcome Intervention Average Percentage indices follow-up (years) follow-up
Non-randomised (n = 3) and randomised (n = 6) trials
Long, 1994279 (NR) USA 109 NIDDM Incidence rates Surgical 6.2 40% at 6 years(M 15, F 94) (bariatric vs
no surgery)
Karason, 1999277 (NR) Sweden 39 Lipids, BP, glucose Lipids and glucose: Surgical 4 92%mmol/l; BP: mmHg (gastric surgery vs
diet)
Sjostrom CD 2000278 Sweden 346 Hypertension, DM, BP HT: incidence and Surgical 8 73%(NR) (M 118, F 228) OR; DM: prevalence, (surgery vs
incidence and OR; customary treatment)BP: mmHg
Wing, 1998176 (R) USA 154 DM, lipids, BP DM: values; Non-surgical 2 81%(M 32, F 122) lipids: mmol/l; (diet, exercise and
BP: mmHg behaviour)
Rossner, 200037 (R) Sweden 718 BP, glucose BP: mmHg Non-surgical 2 60%(M 127, F 591) glucose: mmol/l (orlistat and diet vs
placebo and diet)
Davidson, 199941 (R) USA 880 Lipids, glucose, insulin Lipids and glucose: Non-surgical 2 45.8%(M 139, F 741) mmol/l; insulin: pmol/l (orlistat and diet vs
placebo and diet)
Teupe, 199184 (R) Germany 100 BP, lipids BP: mmHg; Non-surgical 2 46%(M 40, F 60) Lipids: mg/100 ml (metformin and diet
vs diet)
Tuomilehto, 2001168 Finland 522 DM Incidence, Non-surgical 2–6 (mean 3.2) 92%(R) (M 172, F 350) relative risks (diet and exercise vs
control)
Hauptman, 200045 (R) USA 635 Lipids, BP, glucose, insulin Lipids and glucose: Non-surgical 2 52%(M 138, F 497) mmol/l; BP: mmHg; (orlistat and diet vs
insulin: pmol/l placebo and diet)
W, study included weight cycling; NR, non-randomised trial; R, randomised trial; M, male; F, female; AHI, apnoea–hypopnoea index; AI, apnoea index; PaO2, arterial oxygen tension;PCO2, carbon dioxide tension; VBG, vertical banded gastroplasty.

Health Technology Assessment 2004; Vol. 8: No. 21
353
© Queen’s Printer and Controller of HMSO 2004. All rights reserved.
Appendix 19b
Characteristics of recent papers and studies to update the epidemiology review for long-term
health outcomes

Appendix 19b
354
Study and country Participants Interventions Main outcomes Date Notes
Fisher, 2002295
Israel40 untreated, mean ± SDAge 47 ± 10 years, BMI 28.9 ± 4.8 kg/m2
11 weight losers, Age 46 ±13 years, BMI 33.3 ± 4.5 kg/m2
Treated had dietaryprogramme for weightloss. All had reachedtheir target weight
BMI, sleep apnoeameasures
Not given Untreated were followed for 5 ± 2.8 years (mean± SD). Put on some weight (not sig). Effects onsleep apnoea: 0 improved, 22 unchanged, 18worsened
Those treated were followed for 2.5 ± 2.3 years.Lost some weight (sign). Effects on sleep apnoea: 3 improved, 7 unchanged, 1 worsened
Sanchez-Cabezudo,2002296
Origin?
75 morbidly obese participants BPD surgery % EWL, < 50% wasclassed a failure; reasonsfor failure of weight lossto this extent,progression of illnessesand QoL
? All had 5-year follow-up. Even though classed asfailures, the weight lost was sufficient to cure orimprove their preoperative illnesses, thusimproving their QoL
Flechtner-Mors,2000297–299
Germany
100 participants, phase I weightloss period 3 months, phase IIweight maintenance 48 months
Group A prescribedmenus 1200–1500 kcal,group B food substitutes
Weight, BP, lipids, bloodglucose, insulin
Seems to beongoing
Contact with those who dropped out wasattempted to obtain long-term results. 75% werefollowed up.At 4 years: weight loss (mean ± SEM) A: 3.2 ± 0.8%, B: 8.4 ± 0.8%.Glucose and insulin sign improved in each group.Only B had improved TGs and SBP
Paisey, 2002301
UK45 participants with type II DM,BMI >30 kg/m2, diet and exercisefor 6 weeks, monthly meetingsfor 5 months, 6 monthly follow-up
Non-randomised 15 VLCD for at least 6 weeks, 15 intensiveconventional diet (ICD),15 non-compliers
Weight loss, lipids,hypertension, glucose
1994, 5-yearfollow-up
ICD weight loss slower than VLCD but bettermaintained at 5 years where the HDL increased inICD group and DBP reduced
Arribas, 2002302
SpainRetrospective look at a cohort of80 morbidly obese participants,mean age 37 years, initial meanBMI 49.5 kg/m2
VBG surgery BMI, hypertension, lipidsDM status
1986–1994:Follow-upyears forfurther 5 years.
Beneficial changes mainly early. Still there even forthose with tendency to regain weight
continued

Health Technology Assessm
ent2004; Vol. 8: No. 21
355
© Q
ueen’s Printer and Controller of H
MSO
2004. All rights reserved.
Study and country Participants Interventions Main outcomes Date Notes
Gregg, 2003305
USABased on USA National HealthInterview Survey andsupplemental survey, afterexclusions, had n = 6391, >36 years, BMI >25 kg/m2
Interviewsdemographics, healthand lifestyle, weight lossintentionality
Self-reported BMI,height, weight change inprevious year, linked toNational Death Index.Mortality as hazard rateratios using no weightchanges as referent
Supplementalsurvey 1989,deathsfollowed up to1997
Attempted weight loss was associated with lowerall-cause mortality, independent of actual weightchange. Self-reported intentional weight loss wasassociated with lower mortality rates. Unintentionalweight loss was associated with higher mortalityrates
BPD, biliopancreatic diversion; ICD, intensive conventional diet; EWL, excess weight loss.

Health Technology Assessment 2004; Vol. 8: No. 21
357
© Queen’s Printer and Controller of HMSO 2004. All rights reserved.
Appendix 20
Studies and subgroups with mortality results

Appendix 20
358
TABLE 27 List of included studies
Graph key Author & year Gender Type of weight loss Known illness n Mean age SD Initial BMI SD Last BMI SD
5 Williamson, F Unintentional weight loss None given 942 52.9 6.6 30.9 4.1 26.0 3.61995274
Intentional weight loss of < 20 lb None given 2745 51.7 6.3 30.4 3.1 27.3 3.1
Intentional weight loss of > 20 lb None given 3018 50.8 6.4 33.1 4.4 26.6 3.6
Unintentional weight loss Obesity related 812 55.3 6.1 31.9 4.4 26.3 4.0
Intentional weight loss of < 20 lb Obesity related 1550 53.8 6.3 31.5 4.0 28.5 4.0
Intentional weight loss of > 20 lb Obesity related 2598 53.7 6.3 34.8 5.4 27.8 4.5
6 Williamson, M Unintentional weight loss None given 1474 52.0 6.1 29.2 2.9 26.0 2.41999273
Intentional weight loss of < 20 lb None given 2834 51.5 5.8 29 2.2 27.2 2.2
Intentional weight loss of > 20 lb None given 2610 51.5 5.9 31.4 3.4 26.9 2.8
Unintentional weight loss General illness 917 54.4 6.3 29.7 3.1 25.5 2.8
Intentional weight loss of < 20 lb General illness 1310 53.4 5.9 29.1 2.4 27.2 2.4
Intentional weight loss of > 20 lb General illness 2614 53.6 6.0 31.6 3.7 26.7 3.0
7 Williamson, M and F Unintentional weight loss DM 649 55.6 5.7 31.8 4.1 25.9 3.62000275
Intentional weight loss DM 1669 54.6 6.0 33.5 5.0 27.7 4.0
8 Rumpel, 1993276 F Unknown weight loss intention None given 326 58.0 14.0 > 29
9 Chaturvedi, M and F Unknown intention lost > 2 BMI DM 541 48.0 5.6 > 291995267
20 lb = 9 kg.

Health Technology Assessment 2004; Vol. 8: No. 21
359
© Queen’s Printer and Controller of HMSO 2004. All rights reserved.
1.551.33
1.171.2
1.191.211.2
1.271.121.111.13
0.841.2
1.74
0.930.94
0.820.83
0.680.71
0.910.98
0.961.04
0.910.94
0.850.67
0.80.4
[5] F – unintentional loss n = 942[5] F – intentional loss < 20 lb n = 2745[5] F – intentional loss > 20 lb n = 3018
[5] F (obesity illness) – unintentional n = 812[5] F (obesity illness) – intentional loss < 20 lb n = 1550
[5] F (obesity illness) – intentional loss>20 lb n = 2598[6] M – unintentional loss n = 1474
[6] M – intentional loss <20 lb n = 2834[6] M – intentional loss > 20 lb n = 2610
[6] M (general illness) – unintentional loss n = 917[6] M (general illness) – intentional loss < 20 lb n = 1310[6] M (general illness) – intentional loss > 20 lb n = 2614
[7] M+F with DM – unintentional loss n = 649 [7] M+F with DM – intentional loss n = 1669
*[8] F – unknown weight loss intention n = 326[9] M+F with DM – unknown intention loss > 2 BMI n = 541
01 2Relative risk (with 95% CI)
0.940.92
FIGURE 251 All-cause mortality: all subgroups. Key of [study numbers] given in Table 27. * referent was a group that was of normalstable weight. Q = 59.10 with 15 df: reject homogeneity at p = 0.001
1.55
1.33
1.17
1.2
0.94
0.92
1.2
2.3
3.4
0.93
0.94
0.82
0.83
0.68
0.71
0.8
1
1.5
[5] F – unintentional loss n = 942
[5] F – intentional loss < 20 lb n = 2745
[5] F – intentional loss > 20 lb n = 3018
[5] F (obesity illness) – unintentional loss n = 812
[5] F (obesity illness) – intentional loss < 20lb n = 1550
[5] F (obesity illness) – intentional loss > 20 lb n = 2598
[8] F – unknown weight loss intention n = 326
[8] F – unknown intention loss < 8.55% n = ?
[8] F – unknown intention loss > 8.55% n = ?
0 1 2 3 4
Relative risk (with 95% CI)
FIGURE 252(a) All-cause mortality: women only. Key of [study numbers] given in Table 27. Q = 40.00 with 8 df: reject homogeneityat p = 0.001
0.91
0.91
[6] M – unintentional loss n = 1474
[6] M – intentional loss < 20 lb n = 2834
[6] M – intentional loss > 20 lb n = 2610
[6] M (general illness) – unintentional loss n = 917
[6] M (general illness) – intentional loss < 20 lb n = 1310
[6] M (general illness) – intentional loss > 20 lb n = 2614
Combined studies
0.94
1.19
1.21
1.2
1.27
1.12
1.11
1.11
1.04
1.02
0.98
0.96
Relative risk (with 95% CI)0.8 1 1.2 1.4
FIGURE 252(b) All-cause mortality: men only. Key of [study numbers] given in Table 27. Q = 4.57 with 5 df: no reason to rejecthomogeneity, therefore may combine study results

Appendix 20
360
0.68
0.67
[5] F – intentional loss < 20 lb n = 2745
[5] F – intentional loss > 20 lb n = 3018
[5] F (obesity illness) – intentional loss < 20 lb n = 1550
[5] F (obesity illness) – intentional loss > 20 lb n = 2598
[6] M – intentional loss < 20 lb n = 2834
[6] M – intentional loss > 20 lb n = 2610
[6] M (general illness) – intentional loss < 20 lb n = 1310
[6] M (general illness) – intentional loss > 20 lb n =2614
[7] M+F with DM – intentional loss n =1669
0.5
1.33
1.17
0.94
0.92
1.21
1.2
1.12
1.11
0.84
0.94
0.82
0.71
0.98
0.96
0.91
0.94
Relative risk (with 95% CI)1
FIGURE 253(a) All-cause mortality: intentional weight loss. Key of [study numbers] given in Table 27. Q = 44.99 with 8 df: rejecthomogeneity at p = 0.001
0.93
0.83
0.91
0.85
[5] F – unintentional loss n = 942
[5] F (obesity ill) – unintentional weight loss n = 812
[6] M – unintentional loss n = 1474
[6] M (general illness) – unintentional loss n = 917
[7] M+F with DM – unintentional loss n = 649
Combined studies
1.55
1.2
1.19
1.27
1.13
1.14
1.04
1.01
0.7 1.51Relative risk (with 95% CI)
FIGURE 253(b) All-cause mortality: unintentional weight loss. Key of [study numbers] given in Table 27. Q = 4.91 with 4 df: Noreason to reject homogeneity, therefore may combine study results
1.2
1.74
1.09
0.8
0.4
0.74
*[8] F – unknown weight loss intention n = 326
[9] M+F with DM – unknown intention weight loss > 2 BMI n = 541
Combined studies
0 1 2Relative risk (with 95% CI)
FIGURE 253(c) All-cause mortality: unknown weight loss intention. Key of [study numbers] given in Table 27. * Referent is a groupof normal stable weight. Q = 0.03 with 1 df: No reason to reject homogeneity, therefore may combine study results

Health Technology Assessment 2004; Vol. 8: No. 21
361
© Queen’s Printer and Controller of HMSO 2004. All rights reserved.
[5] F – intentional loss > 20 lb
[5] F (obesity illness) – intentional loss < 20 lb
[5] F (obesity illness) – intentional loss > 20 lb
[6] M – intentional loss of < 20 lb
[6] M – intentional loss > 20 lb
[6] M (general illness) – intentional loss < 20 lb
[6] M (general illness) – intentional loss > 20 lb
1
0.93
0.9
1.13
1.12
1.11
0.86
0.59
0.66
0.62
0.85
0.87
0.85
0.88
Combined studies
1.28
1.04
0.88
[5] F – intentional loss < 20 lb
0.5 1
Relative risk (with 95% CI)
0.98
FIGURE 254(a) All-cause mortality: weight loss within 1 year. Key of [study numbers] given in Table 27. Q = 14.88 with 7 df: rejecthomogeneity at p = 0.05 (nearly not significant)
[5] F – intentional loss < 20 lb
[5] F – intentional loss > 20 lb
[5] F (obesity illness) – intentional loss < 20 lb
[5] F (obesity illness) – intentional loss > 20 lb
[6] M – intentional loss of < 20 lb
[6] M – intentional loss > 20 lb
[6] (general illness) – intentional loss < 20 lb
[6] (general illness) – intentional loss > 20 lb
1.93
1.53
1.8
Relative risk (with 95% CI)
0.99
1.31
1.4
1.26
1.29
1.02
0.98
0.71
0.73
1.22
1.01
0.88
0.5 1.5 21
1.03
FIGURE 254(b) All-cause mortality: weight loss taking more than 1 year. Key of [study numbers] given in Table 27. Q = 23.62 with7 df: reject homogeneity at p = 0.01

Appendix 20
362
0.42
0.45
0.29
0.37
[5] F – unintentional loss n = 942
[5] F – intentional loss < 20 lb n = 2745
[5] F – intentional loss > 20 lb n = 3018
[5] F (obesity illness) – unintentional loss n = 812
[5] F (obesity illness) – intentional loss < 20 lb n = 1550
[5] F (obesity illness) – intentional loss > 20 lb n = 2598
0 1 2 3
Relative risk (with 95% CI)
2.44
2.38
1.22
1.96
0.94
1.02
0.65
1.1
FIGURE 255 Mortality from obesity-related illness: all subgroups. Key of [study numbers] given in Table 27. Q = 17.47 with 5 df:reject homogeneity at p = 0.01
[5] F – unintentional loss n = 942
[5] F – intentional loss < 20 lb n = 2745
[5] F – intentional loss >20 lb n = 3018
[5] F (obesity ill) – unintentional loss n = 812
[5] F (obesity illness) – intentional loss < 20 lb n = 1550
[5] F (obesity illness) – intentional loss > 20 lb n = 2598
[6] M – unintentional loss n = 1474
[6] M – intentional loss < 20 lb n = 2834
[6] M – intentional loss > 20 lb n = 2610
[6] M (general illness) – unintentional loss n = 917
[6] M (general illness) – intentional loss < 20 lb n = 1310
[6] M (general illness) – intentional loss >20 lb n = 2614
*[8] F – unknown weight loss intention n = 326
2.02
1.65
1.15
1.3
0.93
0.97
1.64
1.48
1.38
1.86
1.57
1.63
1.5
0.91
0.98
0.62
0.49
0.43
0.52
0.96
0.94
0.86
0.9
0.79
0.96
0.5
0 1 2 3
Relative risk (with 95% CI)
FIGURE 256 Mortality from cancer: all subgroups. Key of [study numbers] given in Table 27. *Referent is a group of normal stableweight. Q = 25.61 with 12 df: Reject homogeneity at p = 0.02

Health Technology Assessment 2004; Vol. 8: No. 21
363
© Queen’s Printer and Controller of HMSO 2004. All rights reserved.
2.02
1.65
1.15
1.3
0.93
0.97
1.5
0.91
0.98
0.62
0.49
0.43
0.52
0.5
[5] F – unintentional loss n = 942
[5] F – intentional loss < 20 lb n = 2745
[5] F – intentional loss > 20 lb n = 3018
[5] F (obesity illness) – unintentional loss n = 812
[5] F (obesity illness) – intentional loss < 20 lb n = 1550
[5] F (obesity illness) – intentional loss > 20 lb n = 2598
*[8] F – unknown weight loss intention n = 326
0 1 2 3
Relative risk (with 95% CI)
FIGURE 257(a) Mortality from cancer: women only. Key of [study numbers] given in Table 27. Q = 16.58 with 6 df: rejecthomogeneity at p = 0.02.
1.64
1.48
1.38
1.86
1.57
1.63
1.33
0.96
0.94
0.86
0.9
0.79
0.96
1.06
[6] M – unintentional loss n = 1474
[6] M – intentional loss < 20 lb n = 2834
[6] M – intentional loss > 20 lb n = 2610
[6] M (general illness) – unintentional loss n = 917
[6] M (general illness) – intentional loss < 20 lb n = 1310
[6] M (general illness) – intentional loss >20 lb n = 2614
Combined studies
0.5 1 1.5 2
Relative risk (with 95% CI)
FIGURE 257(b) Mortality from cancer: men only. Key of [study numbers] given in Table 27. Q = 1.19 with 5 df: no reason to rejecthomogeneity, therefore may combine study results

Appendix 20
364
1.11
1. 2
1.05
1.08
1.11
1.17
1.13
1.03
0.52
0.52
0.66
0.69
0.79
0.81
0.86
0.81
[5] F – intentional loss < 20 lb
[5] F – intentional loss > 20 lb
[5] F (obesity illness) – intentional loss < 20 lb
[5] F (obesity illness) – intentional loss > 20 lb
[6] M – intentional loss < 20 lb
[6] M – intentional loss > 20 lb
[6] M (general illness) – intentional loss < 20 lb
[6] M (general illness) – intentional loss > 20 lb
0.4 1Relative risk (with 95% CI)
FIGURE 258(a) Mortality from cancer: weight loss within 1 year. Key of [study numbers] given in Table 27. Q = 18.14 with 7 df:reject homogeneity at p = 0.02
1.71
1.45
1.27
1.16
2.25
1.71
2.68
1.66
1.28
0.48
0.64
0.21
0.53
0.99
0.88
0.9
0.79
0.94
[5] F – intentional loss < 20 lb
[5] F – intentional loss > 20 lb
[5] F (obesity illness) – intentional loss < 20 lb
[5] F (obesity ill) – intentional loss > 20 lb
[6] M – intentional loss < 20 lb
[6] M – intentional loss > 20 lb
[6] M (general illness) – intentional loss < 20 lb
[6] M (general illness) – intentional loss > 20 lb
Combined studies
0 1 2 3
Relative risk (with 95% CI)
FIGURE 258(b) Mortality from cancer: weight loss taking more than 1 year. Key of [study numbers] given in Table 27. Q = 10.43with 7 df: no reason to reject homogeneity, therefore may combine study results
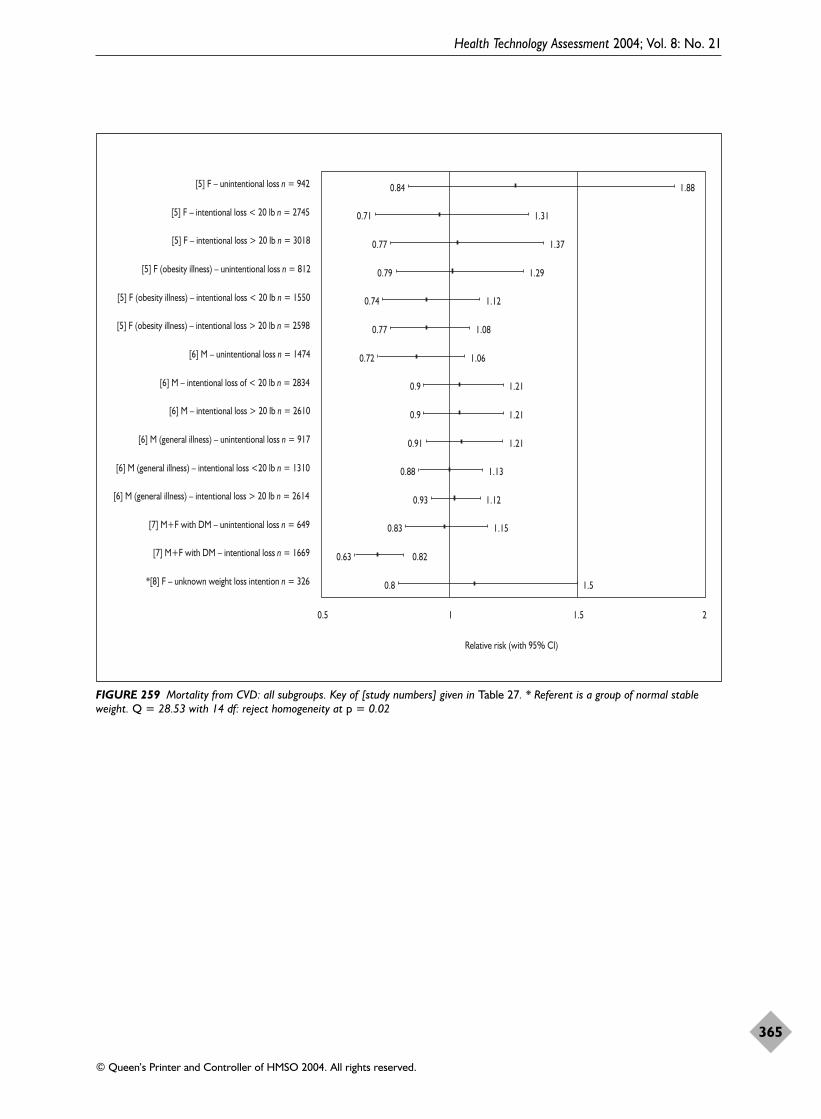
Health Technology Assessment 2004; Vol. 8: No. 21
365
© Queen’s Printer and Controller of HMSO 2004. All rights reserved.
1.88
1.31
1.37
1.29
1.12
1.08
1.06
1.21
1.21
1.21
1.13
1.12
1.15
0.82
1.5
0.84
0.71
0.77
0.79
0.74
0.77
0.72
0.9
0.9
0.91
0.88
0.93
0.83
0.63
0.8
[5] F – unintentional loss n = 942
[5] F – intentional loss < 20 lb n = 2745
[5] F – intentional loss > 20 lb n = 3018
[5] F (obesity illness) – unintentional loss n = 812
[5] F (obesity illness) – intentional loss < 20 lb n = 1550
[5] F (obesity illness) – intentional loss > 20 lb n = 2598
[6] M – unintentional loss n = 1474
[6] M – intentional loss of < 20 lb n = 2834
[6] M – intentional loss > 20 lb n = 2610
[6] M (general illness) – unintentional loss n = 917
[6] M (general illness) – intentional loss <20 lb n = 1310
[6] M (general illness) – intentional loss > 20 lb n = 2614
[7] M+F with DM – unintentional loss n = 649
[7] M+F with DM – intentional loss n = 1669
*[8] F – unknown weight loss intention n = 326
0.5 1 1.5 2
Relative risk (with 95% CI)
FIGURE 259 Mortality from CVD: all subgroups. Key of [study numbers] given in Table 27. * Referent is a group of normal stableweight. Q = 28.53 with 14 df: reject homogeneity at p = 0.02

Appendix 20
366
1.88
1.31
1.37
1.29
1.12
1.08
1.5
1.07
0.84
0.71
0.77
0.79
0.74
0.77
0.8
0.89
[5] F – unintentional loss n = 942
[5] F – intentional loss < 20 lb n = 2745
[5] F – intentional loss > 20 lb n = 3018
[5] F (obesity illness) – unintentional loss n = 812
[5] F (obesity illness) – intentional loss < 20 lb n = 1550
[5] F (obesity illness) – intentional loss > 20 lb n = 2598
*[8] F – unknown weight loss intention n = 326
Combined studies
0 1 2 3
Relative risk (with 95% CI)
FIGURE 260(a) Mortality from CVD: women only. Key of [study numbers] given in Table 27. * Referent is a group of normal stableweight. Q = 3.416 with 6 df: no reason to reject homogeneity, therefore may combine study results
1.06
1.21
1.21
1.21
1.13
1.12
1.07
0.72
0.9
0.9
0.91
0.88
0.93
0.96
[6] M – unintentional loss n = 1474
[6] M – intentional loss < 20 lb n = 2834
[6] M – intentional loss > 20 lb n = 2610
[6] M (general illness) – unintentional loss n = 917
[6] M (general illness) – intentional loss < 20 lb n = 1310
[6] M (general illness) – intentional loss > 20 lb n = 2614
Combined studies
0.6 1
Relative risk (with 95% CI)
FIGURE 260(b) Mortality from CVD: men only. Key of [study numbers] given in Table 27. Q = 2.93 with 5 df: no reason to rejecthomogeneity, therefore may combine study results

Health Technology Assessment 2004; Vol. 8: No. 21
367
© Queen’s Printer and Controller of HMSO 2004. All rights reserved.
1.2
1.17
0.52
0.52
[5] F – intentional loss < 20 lb
[5] F – intentional loss > 20 lb
[5] F (obesity illness) – intentional loss < 20 lb
[5] F (obesity illness) – intentional loss > 20 lb
[6] M – intentional loss < 20 lb
[6] M – intentional loss > 20 lb
[6] M (general illness) – intentional loss < 20 lb
[6] M (general illness) – intentional loss > 20 lb
Combined studies
0.4 1
0.66
0.69
0.79
0.81
1.11
1.05
1.08
1.11
1.03
0.98
0.86
0.81
0.86
Relative risk (with 95% CI)
1.13
FIGURE 261(a) Mortality from CVD: weight loss within 1 year. Key of [study numbers] given in Table 27. Q = 4.11 with 7df: noreason to reject homogeneity, therefore may combine study results
2.75
1.82
1.71
1.18
1.86
1.4
1.3
1.34
1.25
1.05
0.9
0.84
0.78
1.1
0.93
0.83
1.04
1.07
[5] F – intentional loss < 20 lb
[5] F – intentional loss > 20 lb
[5] F (obesity illness) – intentional loss < 20 lb
[5] F (obesity illness) – intentional loss > 20 lb
[6] M – intentional loss < 20 lb
[6] M – intentional loss > 20 lb
[6] M (general illness) – intentional loss < 20 lb
[6] M (general illness) – intentional loss >20 lb
Combined studies
0.4 1 2 3Relative risk (with 95% CI)
FIGURE 261(b) Mortality from CVD: weight loss taking more than 1 year. Key of [study numbers] given in Table 27. Q = 9.41 with7 df: no reason to reject homogeneity, therefore may combine study results

Appendix 20
368
2.77
1.62
1.76
1.56
0.82
0.9
2.46
1.5
2.33
1.22
0.95
0.8
0.5
0.42
0.59
0.67
0.38
0.53
0.75
0.4
0.93
0.7
0.48
0.51
[5] F – unintentional loss n = 942
[5] F – intentional loss < 20 lb n = 2745
[5] F – intentional loss >20 lb n = 3018
[5] F (obesity illness) – unintentional loss n = 812
[5] F (obesity illness) – intentional loss < 20 lb n = 1550
[5] F (obesity illness) – intentional loss > 20 lb n = 2598
[6] M – unitentional loss n = 1474
[6] M – intentional loss < 20 lb n = 2834
[6] M – intentional loss > 20 lb n = 2610
[6] M (general illness) – unintentional n = 917
[6] M (general illness) – intentional loss < 20 lb n = 1310
[6] (general illness) – intentional loss > 20 lb n = 2614
0 1 2 3
Relative risk (with 95% CI)
FIGURE 262 Mortality from diabetes mellitus: all subgroup. Key of [study numbers] given in Table 27. Q = 22.423 with 11 df: rejecthomogeneity at p = 0.05
0.89
0.87
0.9
0.
0.68
0.38
0.42
0.4
0.39
0.47
[5] F (obesity illness) – intentional loss < 20 lb
[5] F (obesity illness) – intentional loss > 20 lb
[6] M (general illness) – intentional loss < 20 lb
[6] M (general illness) – intentional loss > 20 lb
Combined studies
0.3 1
Relative risk (with 95% CI)
7
FIGURE 263(a) Mortality from diabetes mellitus: weight lost within 1 year. Key of [study numbers] given in Table 27. Q = 0.58 with3 df: no reason to reject homogeneity, therefore may combine study results

Health Technology Assessment 2004; Vol. 8: No. 21
369
© Queen’s Printer and Controller of HMSO 2004. All rights reserved.
1.13
1.05
1.6
1.1
0.96
0.22
0.55
0.52
0.61
0.64
[5] F (obesity illness) – intentional loss < 20 lb
[5] F (obesity illness) – intentional loss > 20 lb
[6] M (general illness) – intentional loss < 20 lb
[6] M (general illness) – intentional loss > 20 lb
Combined studies
1
Relative risk (with 95% CI)
FIGURE 263(b) Mortality from diabetes mellitus: weight lost over more than 1 year. Key of [study numbers] given in Table 27. Q =1.56 with 3 df: no reason to reject homogeneity, therefore may combine study results.


Health Technology Assessment 2004; Vol. 8: No. 21
371
© Queen’s Printer and Controller of HMSO 2004. All rights reserved.
Appendix 21
Diabetes mellitus studies with basic results
Appendix 21a
Diabetes mellitus ratios

Appendix 21a
372
TABLE 28 Surgical interventions
Graph Study Genders Description Age (years) Initial weight Last weight or losskey
Mean Spread n weight Spread n weight Spread
4 Pories, 1992266 Both Morbid obese, 18–65 n = 515 135 kg Range kg n = 236 91 kg Range 27% DM 89–257 at 5 year 49–195
Both Morbid obese, 18–6512% IGT
11 O’Leary, 1980272 Both 70% NIDDM n = 274 156 kg Range kg All but 2 lost, 5-year plateau some (Unknown follow-up 95–275 regain 20–30%at 7 years)
Both 6% Insulin DM
20 Hess, 1998271 Both Morbid obese, Whl grp = 40 Whl grp BMI = 50 BMI Range n = 92? BMI = 30DM insulin n = 440 25–77 at 5 year Diff –55 kg
Both Morbid obese, DM non-insulin
28 Long, 1994279 Both IGT (27 did not 36 SD = 8.0 n = 109 BMI = 48 SD = 8.0 % loss of excess weight at Non-RCT have surgery) 5 years = 62 (SD 4)
29 Karason, 1999277 Both Obese Whl SD = 5.0 n = 19 118 kg SD =15 n = 19 diff = –22 kg SD = 10Non-RCT grp = 49 BMI = 38 SD = 3.6 at 4 year BMI diff = –6.8 SD = 3.5
30 Sjostrom CD, Both Obese control 47 SD = 6.0 n = 346 121.6 kg SD = 16.6 n = 251 diff = –20.1 kg SD = 15.72000278 BMI = 42.2 SD = 4.1 at 8 year BMI diff = –6.8 SD = 5.4Non-RCT
Whl grp, whole group; Diff, difference.

Health Technology Assessm
ent2004; Vol. 8: No. 21
373
© Q
ueen’s Printer and Controller of H
MSO
2004. All rights reserved.
TABLE 29 Non-surgical interventions
Graph Study Genders Description Age (years) Initial weight Last weight or losskey
Mean Spread n weight Spread n weight Spread
15 Wing, 1998176 Both Parent(s) DM, ~45.7 SD = 4.4 BMI ~35.9 SD =4.3 n = ? Lost ≥ 4.5 kgRCT patients normal
Both Parent(s) DM, ~45.7 SD = 4.4 BMI ~35.9 SD = 4.3 n = ? Lost ≥ 4.5 kgpatients IGT
16 Watts, 1990281 Both DM – responders 57.4 SD = 1.9 n = 55 94 kg SD = 3.0 n = 55 Lost ≥ 9.1 kg14.7 (SD 2.3) months, took 1 year
50% regained
Both DM – non-responders 55.3 SD = 1.3 94 kg SD = 2.0 n = ? Lost ≥ 9.1 kg26.2 (SD 2.3) months, took 1 year
40% regained
39 Hauptman, 200045 Both Placebo + diet 41.6 SE = 0.7 n = 91 101.0 kg SE = 0.8 n = 91 Diff= –1.54 kg SE = 0.58RCT – drug BMI = 36.2 at 2 years
Both Orlistat + diet 42.6 SE = 0.8 n = 117 100.6 kg SE = 1.6 n = 117 Diff = –5.16 kg SE = 0.78BMI = 36.2 at 2 years
40 Tuomilehto, 2001168 Both DM patients diet + Ex 55 SD = 7.0 n = 257 BMI = 31.3 SD = 4.6 n = ? Diff = –0.8 kg SD = 4.4RCT at 2 years
Both DM patients, control 55 SD = 7.0 n = 265 BMI = 31.0 SD = 4.5 n = ? Diff = –3.5 kg SD = 5.5at 2 years
41 Rossner, 200037 Both Placebo + diet 44.3 SD = 10.8 n = 237 97.7 kg SD =14.6 n = 140 Diff = –4.3 kg SD = 7.5RCT – drug BMI = 35.3 SD = 4.1 at 2 years
Both Orlistat + diet 43.6 SD = 11.4 n = 242 96.7 kg SD = 11.4 n = 136 Diff = –7.6 kg SD = 7.0BMI = 34.7 SD = 3.7 at 2 years
42 Davidson, 199941 Both Placebo + diet 44.0 SE = 0.7 n = 223 100.6 kg SE = 0.9 n = 89 Diff = –4.0 kg SE = 0.5RCT – drug BMI = 36.5 SE = 0.9 at 2 years
Both Orlistat + diet 43.3 SE = 0.6 n = 657 100.7 kg SE = 0.6 n = 103 Diff = –7.6 kg SE = 0.2BMI = 36.2 SE = 0.1 at 2 years

Appendix 21a
374
TABLE 30 No intervention
Graph Study Genders Description Age (years) Initial weight Last weight or losskey
Mean Spread n weight Spread n weight Spread
13 Ford, 1997268 Both? NIDDM Whl grp 18–70+ BMI > 29 Lost ≥ 5 kg
14 Moore, 2000269 Both Lost/gained 40.8 n = 102 BMI = 30.4 n = 102 Lost ≥ 8 lb in 8 years thengained in next 8 years
Both Lost/stable 41.5 n = 109 BMI = 29.3 n = 109 Lost ≥ 8 lb in 8 years then stablein next 8 years
Both Lost/lost 41.6 n = 51 BMI = 30.8 n = 51 Lost ≥ 8 lb in 8 years then lostmore in next 8 years
Botha Lost/lost ≥ 8 lb 41.5 BMI = 29.5 n = ?? Lost ≥ 8 lb in 8 years + 0–7 lb in next 8 years
Botha Lost/lost ≥ 16 lb 41.5 BMI = 30.2 n = ??Lost ≥ 8 lb in 8 years + 8–15 lb in next 8 years
17 Wannamethee, M Not DM Whl grp 40–59 BMI ≥ 28 Lost ≥ 4%1999280
a Subgroup of the lost/lost group, specifying the degree of weight loss.

Health Technology Assessment 2004; Vol. 8: No. 21
375
© Queen’s Printer and Controller of HMSO 2004. All rights reserved.
[30] Surgery, 68% F, OR
[15] Ex & diet, 79%? F, Normal, RR
[15] Ex & diet, 79%? F, IGT at Base, RR
[13] No intervention, 62% F, HR
[14] No intervention, 66% F, lost/gain, RR
[14] No intervention, 41% F, lost/stable, RR
[14] No intervention, 55% F, lost/lost, RR
*[14] No intervention, lost �8 lb, RR
*[14] No intervention, lost �16 lb, RR
[17] No intervention, 100% M, lost 4% weight, RR
[40] RCT over weight DM intervention, 66% F, HR
[40] RCT over weight DM intervention, 34% M, HR
Ratios (95% CI) RR, OR, HR
0 1 2
0.38
0.87
0.9
1.76
2.4
1.4
1.3
1.4
1.3
1.19
0.74
0.82
0.08
0.53
0.59
0.64
0.7
0.37
0.15
0.33
0.18
0.36
0.19
0.21
FIGURE 264 Diabetes mellitus ratios. Key of [study numbers] given in Tables 28–30. * Non-independent subgroup. HR, hazard ratio


Health Technology Assessment 2004; Vol. 8: No. 21
377
© Queen’s Printer and Controller of HMSO 2004. All rights reserved.
Appendix 21b
Weight differences compared with glucose differences in type 2 diabetes mellitus patients

Appendix 21b
378
Intervention type Study Description Follow-up n Weight (SE) n Glucose (SE)(months) difference difference
(kg) (mmol/l)
?? Watts, 1990281 DM non-responders 12+ 80 –9.1* (0.98) 80 –1.90* (0.15)
RCT Drug Hauptman 200045 Placebo + diet 24 91 –1.5* (0.58) 91 0.24 (0.14)Orlistat + diet 24 117 –5.2* (0.78) 117 0.16 (0.12)
Rossner, 200037 Placebo + diet 24 140 –4.3* (0.63) 140 –0.14 (0.11)Orlistat + diet 24 136 –7.6* (0.60) 136 –0.07 (0.12)
Davidson, 199941 Placebo + diet 24 89 –4.0* (0.50) 90 0.20 (0.14)Orlistat + diet 24 103 –7.6* (0.20) 106 0.05 (0.13)
Surgery Hess, 1998271 DM insulin & non 60 92 –55.0* (2.44) –8.25a
Long, 1994279 Non-RCT, IGT 60 –1.00
Karason, 1999277 Obese only 48 19 –22.0* (2.29) 19 –0.30 (0.23)
Standard errors in bold have been estimated as per Appendix 26.a This study seems to have a large glucose difference. It may not be fasting blood sugar.*Significant difference at p < 0.05.

Scatter plots: glucose difference with weight difference SPSS variable names: Wtdff, average weight difference subgroups; GLU_DIF, average glucose difference
Health Technology Assessment 2004; Vol. 8: No. 21
379
© Queen’s Printer and Controller of HMSO 2004. All rights reserved.
Wtdff0–10–20–30–40–50–60
GLU
C_D
IF2
0
–2
–4
–6
–8
–10
Wtdff0–10–20–30
GLU
C_D
IF
0.5
0.0
–0.5
–1.0
–1.5
–2.0
GLU
C_D
IF
0.3
0.2
0.1
0.0
–0.1
–0.2
–0.3
–0.4
(a) All studies Correlation = 0.935 (p < 0.001)
(b) Excluding study by Hess (1998)Correlation = 0.296
(c) Excluding studies by Hess (1998) and Watts (1990)Correlation = 0.794 (p < 0.01)
Wtdff
0–10–20–30

Regression: glucose difference with weight difference (excluding Hessand Watts)
Appendix 21b
380
Model summary
Model
1
R
0.794a
R2
0.631
Adjusted R2
0.557
SE of the estimate
0.1324
a Predictors: (Constant), Wtdff.
Conclusion: glucose difference = 0.194 + 0.02339 (weight difference).
ANOVAa
Model
1 RegressionResidualTotal
Sum ofsquares
0.1508.764E–02
0.237
df
156
Mean square
0.1501.753E–02
F
8.544
Sig.
0.033b
a Dependent variable: GLUC_DIF.b Predictors: (Constant), Wtdff.
Coefficientsa
Model
1 (Constant)Wtdff
B
0.1942.339E–02
SE
0.0780.008 0.794
t
2.4972.923
Sig.
0.0550.033
a Dependent variable: GLUC_DIF.
Standardisedcoefficients
Unstandardisedcoefficients

Health Technology Assessment 2004; Vol. 8: No. 21
381
© Queen’s Printer and Controller of HMSO 2004. All rights reserved.
Appendix 22
Lipid results
Appendix 22a
Lipid paired t-test results
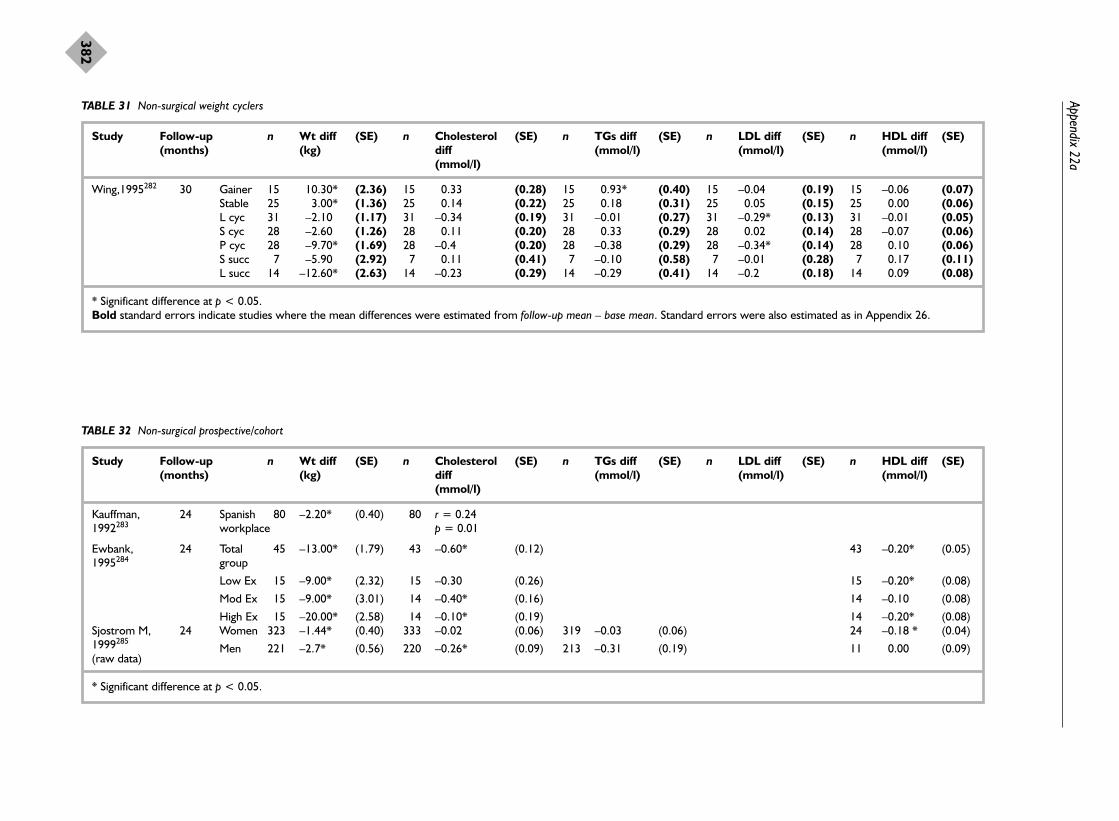
Appendix 22a
382
TABLE 31 Non-surgical weight cyclers
Study Follow-up n Wt diff (SE) n Cholesterol (SE) n TGs diff (SE) n LDL diff (SE) n HDL diff (SE)(months) (kg) diff (mmol/l) (mmol/l) (mmol/l)
(mmol/l)
Wing,1995282 30 Gainer 15 10.30* (2.36) 15 0.33 (0.28) 15 0.93* (0.40) 15 –0.04 (0.19) 15 –0.06 (0.07)Stable 25 3.00* (1.36) 25 0.14 (0.22) 25 0.18 (0.31) 25 0.05 (0.15) 25 0.00 (0.06)L cyc 31 –2.10 (1.17) 31 –0.34 (0.19) 31 –0.01 (0.27) 31 –0.29* (0.13) 31 –0.01 (0.05)S cyc 28 –2.60 (1.26) 28 0.11 (0.20) 28 0.33 (0.29) 28 0.02 (0.14) 28 –0.07 (0.06)P cyc 28 –9.70* (1.69) 28 –0.4 (0.20) 28 –0.38 (0.29) 28 –0.34* (0.14) 28 0.10 (0.06)S succ 7 –5.90 (2.92) 7 0.11 (0.41) 7 –0.10 (0.58) 7 –0.01 (0.28) 7 0.17 (0.11)L succ 14 –12.60* (2.63) 14 –0.23 (0.29) 14 –0.29 (0.41) 14 –0.2 (0.18) 14 0.09 (0.08)
* Significant difference at p < 0.05.Bold standard errors indicate studies where the mean differences were estimated from follow-up mean – base mean. Standard errors were also estimated as in Appendix 26.
TABLE 32 Non-surgical prospective/cohort
Study Follow-up n Wt diff (SE) n Cholesterol (SE) n TGs diff (SE) n LDL diff (SE) n HDL diff (SE)(months) (kg) diff (mmol/l) (mmol/l) (mmol/l)
(mmol/l)
Kauffman, 24 Spanish 80 –2.20* (0.40) 80 r = 0.24 1992283 workplace p = 0.01
Ewbank, 24 Total 45 –13.00* (1.79) 43 –0.60* (0.12) 43 –0.20* (0.05)1995284 group
Low Ex 15 –9.00* (2.32) 15 –0.30 (0.26) 15 –0.20* (0.08)
Mod Ex 15 –9.00* (3.01) 14 –0.40* (0.16) 14 –0.10 (0.08)
High Ex 15 –20.00* (2.58) 14 –0.10* (0.19) 14 –0.20* (0.08)Sjostrom M, 24 Women 323 –1.44* (0.40) 333 –0.02 (0.06) 319 –0.03 (0.06) 24 –0.18 * (0.04)1999285
Men 221 –2.7* (0.56) 220 –0.26* (0.09) 213 –0.31 (0.19) 11 0.00 (0.09)(raw data)
* Significant difference at p < 0.05.

Health Technology Assessm
ent2004; Vol. 8: No. 21
383
© Q
ueen’s Printer and Controller of H
MSO
2004. All rights reserved.
TABLE 33 Non-surgical RCTs
Study Follow- n Wt diff (SE) n Cholesterol (SE) n TGs diff (SE) n LDL diff (SE) n HDL diff (SE)(Follow-up up (kg) diff (mmol/l) (mmol/l) (mmol/l)time) (months) (mmol/l)
Wing, 24 Diet + BT 35 –2.10 (1.28) 35 –0.12 (0.10) 35 0.19 (0.41) 35 –0.16 (0.11) 35 0.02 (0.03)1998176
Ex + BT 31 1.00 (0.84) 31 0.33* (0.11) 31 0.33 (0.26) 31 0.22 (0.11) 31 0.05 (0.03)
Diet + 32 –2.50 (1.48) 32 0.09 (0.12) 32 –0.28 (0.24) 32 0.12 (0.10) 32 0.02 (0.04)Ex + BT
Hauptman, 24 Placebo 91 –1.54* (0.58) 91 0.08 (0.11) 91 –0.19 (0.16) 91 0.17* (0.08) 91 –0.01 (0.03)200045 + diet
Orlistat 117 –5.16* (0.78) 117 –0.15 (0.10) 117 –0.09 (0.14) 117 –0.15 (0.07) 117 0.00 (0.03)+ diet
Davidson, 24 Placebo 89 –4.00* (0.50) 89 –0.22 (0.11) 89 0.03 (0.16) 88 –0.22* (0.08) 89 0.03 (0.03)199941 + diet
Orlistat 103 –7.60* (0.20) 106 –0.32* (0.11) 106 –0.12 (0.15) 104 –0.24* (0.07) 106 –0.01 (0.03)+ diet
Teupe, 24 Metformin 25 –4.00* (1.42) 25 –0.39 (0.22) 25 –0.25 (0.31)199184 + diet
Diet 29 –5.10* (1.39) 29 0.46* (0.20) 29 –0.27 (0.28)
* Significant difference at p < 0.05.Bold standard errors indicate studies where the mean differences were estimated from follow-up mean – base mean. Standard errors were also estimated as in Appendix 26.

Appendix 22a
384
TABLE 34 Surgical
Study Follow- n Wt diff (SE) n Cholesterol (SE) n TGs diff (SE) n LDL diff (SE) n HDL diff (SE)(Follow-up up (kg) diff (mmol/l) (mmol/l) (mmol/l)time) (months) (mmol/l)
Hess, 60 78% 92 –55.00* (2.44) 92 –1.55* (0.11) 92 –0.98* (0.16) 92 –0.98* (0.08) 92 0.13 (0.03)1998271 Women
Gleysteen, 60 Women 24 –35.00* (3.47) 24 –0.28 (0.22) 24 –0.11 (0.31) 24 24 0.26* (0.06)1992286
Men 9 –27.00* (4.82) 9 –0.57 (0.36) 9 –0.84 (0.51) 9 9 0.26* (0.10)
Rossner, 24–60 Women 10 –44.00* (4.00) 10 –1.33* (0.34) 10 –0.34 (0.48) 10 –1.17* (0.23) 10 0.05 (0.09)1980287
Men 8 –42.00* (4.00) 8 –2.12* (0.38) 8 –1.12 (0.54) 8 –1.47* (0.26) 8 –0.08 (0.10)
Karason, 48 21% 19 –22.00* (2.29) 19 –0.50 * (0.16) 19 –0.90* (0.21) 19 –0.40* (0.16) 19 0.20* (0.07)1999277 Women
O’Leary272 5 years Both 274 All but 2/274 lost weight. Plateau at 12–24 months after surgery with some weight regain by 5 years1980
Preoperative 5 yearsHypertriglyceridaemia 51% 88% improved, 12% unchangedHypercholesterolaemia 8% All improved

(i) Regression: weight difference versus cholesterolSPSS variable names: Wtdff, average weight difference; Chol_diff, average cholesterol difference
Health Technology Assessment 2004; Vol. 8: No. 21
385
© Queen’s Printer and Controller of HMSO 2004. All rights reserved.
Appendix 22b
Weight differences compared with lipid differences
Model summarya
Model
1
R
0.856b
R2
0.732
Adjusted R2
0.722
SE of the estimate
0.31450
a Dependent variable: Chol_diff.b Predictors: (Constant), Wtdff.
ANOVAa
Model
1 RegressionResidualTotal
Sum ofsquares
6.7652.4739.237
df
12526
Mean square
6.7650.099
F
68.395
Sig.
0.000b
a Dependent variable: Chol_diff.b Predictors: (Constant), Wtdff.
Coefficientsa
Model
1 (Constant)Wtdff
B
7.009E–02
3.210E–02
SE
0.0760.004 0.856
t
0.9248.270
Sig.
0.3640.000
a Dependent variable: Chol_diff.
Standardisedcoefficients
Unstandardisedcoefficients
Wtdff–60
Cho
l_di
ff
–2.5–50 –40 –30 –20 –10 0 10 20
–2.0
–1.5
–1.0
–0.5
0.0
0.5

Appendix 22b
386
Regression standardised residual
2.50
2.00
1.50
1.00
0.50
0.00
–0.50
–1.00
–1.50
–2.00
–2.50
HistogramDependent variable: Chol_diff
Freq
uenc
y
10
8
6
4
2
0
SD = 0.98 Mean = 0.00n = 27.00
ScatterplotDependent variable: Chol_diff
Chol_diff
0.50.0–0.5–1.0–1.5–2.0–2.5
Regr
essio
n st
anda
rdise
d pr
edic
ted
valu
e
2
1
0
–1
–2
–3
ScatterplotDependent variable: Chol_diff
Regression standardised predicted value
210–1–2–3
Regr
essio
n st
anda
rdise
d re
sidua
l 3
2
1
0
–1
–2
–3

(ii) Regression: weight difference versus TGsSPSS variable names: Wtdff, average weight difference; Tg diff, average triglycerides difference
Health Technology Assessment 2004; Vol. 8: No. 21
387
© Queen’s Printer and Controller of HMSO 2004. All rights reserved.
Model summarya
Model
1
R
0.764b
R2
0.584
Adjusted R2
0.565
SE of the estimate
0.30653
a Dependent variable: Tg diff.b Predictors: (Constant), Wtdff.
ANOVAa
Model
1 RegressionResidualTotal
Sum ofsquares
2.9052.0674.972
df
12223
Mean square
2.9050.094
F
30.913
Sig.
0.000b
a Dependent variable: Tg diff.b Predictors: (Constant), Wtdff.
Coefficientsa
Model
1 (Constant)Wtdff
B
8.265E–02
2.117E–02
SE
0.0770.004 0.764
t
1.0775.560
Sig.
0.2930.000
a Dependent variable: Tg diff.
Standardisedcoefficients
Unstandardisedcoefficients
Wtdff
20100–10–20–30–40–50–60
Tg
diff
1.0
0.5
0.0
–0.5
–1.0
–1.5

Appendix 22b
388
Regression standardised residual
2.001.501.000.500.00–0.50–1.00–1.50
HistogramDependent variable: Tg diff
Freq
uenc
y
8
6
4
2
0
SD = 0.98Mean = 0.00n = 24.00
ScatterplotDependent variable: Tg diff
Tg diff
1.00.50.0–0.5–1.0–1.5
Regr
essio
n st
anda
rdise
d pr
edic
ted
valu
e 2
1
0
–1
–2
–3
ScatterplotDependent variable: Tg diff
Regression standardised predicted value
210–1–2–3
Regr
essio
n st
anda
rdise
d re
sidua
l
3
2
1
0
–1
–2

(iii) Regression: weight difference versus LDLSPSS variable names: Wtdff, average weight difference; LDL diff, average LDL difference
Health Technology Assessment 2004; Vol. 8: No. 21
389
© Queen’s Printer and Controller of HMSO 2004. All rights reserved.
Model summarya
Model
1
R
0.903b
R2
0.816
Adjusted R2
0.804
SE of the estimate
0.20675
a Dependent variable: LDL diff.b Predictors: (Constant), Wtdff.
ANOVAa
Model
1 RegressionResidualTotal
Sum ofsquares
3.0240.6843.708
df
11617
Mean square
3.0240.043
F
70.740
Sig.
0.000b
a Dependent variable: LDL diff.b Predictors: (Constant), Wtdff.
Coefficientsa
Model
1 (Constant)Wtdff
B
–1.206E–02
2.363E–02
SE
0.0580.003 0.903
t
–0.207 8.411
Sig.
0.8390.000
a Dependent variable: LDL diff.
Standardisedcoefficients
Unstandardisedcoefficients
Wtdff
20100–10–20–30–40–50–60
LDL
diff
0.5
0.0
–0.5
–1.0
–1.5
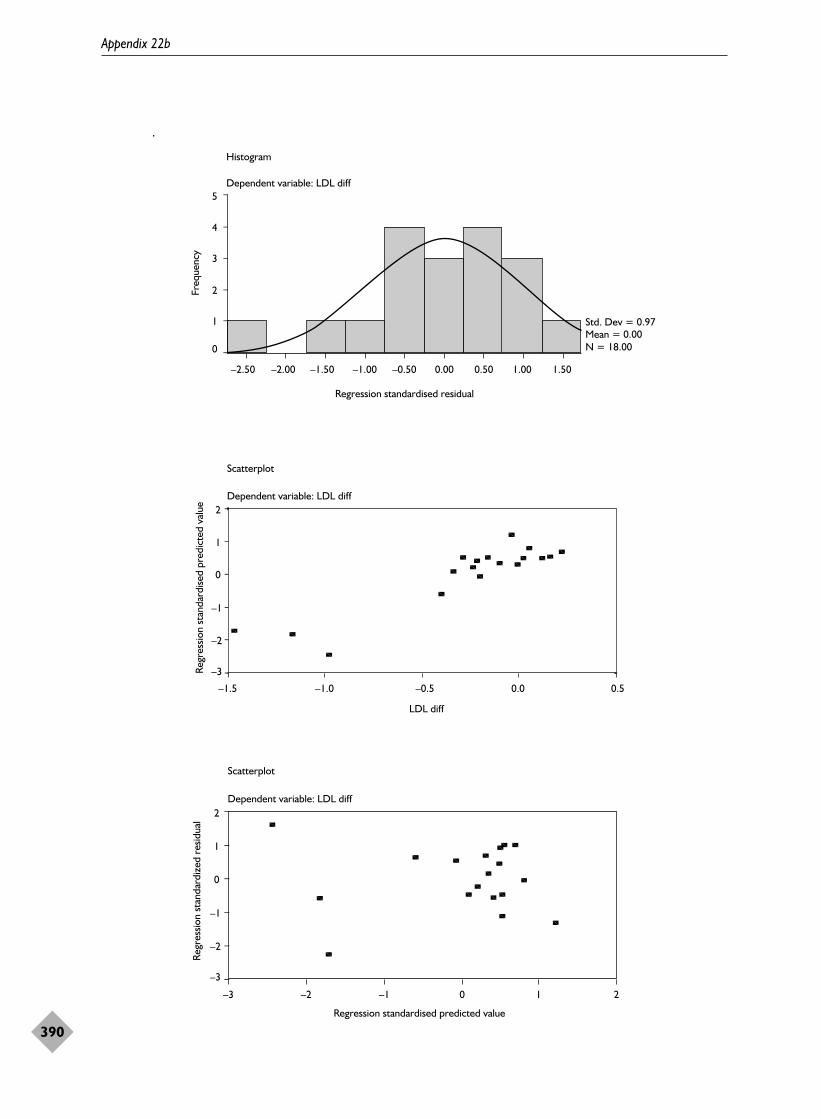
Appendix 22b
390
Regression standardised residual
1.501.000.500.00–0.50–1.00–1.50–2.00–2.50
Histogram
Dependent variable: LDL diff5
4
3
2
1
0
Std. Dev = 0.97 Mean = 0.00N = 18.00
Freq
uenc
y
Scatterplot
Dependent variable: LDL diff
LDL diff
0.50.0–0.5–1.0–1.5
Regr
essio
n st
anda
rdise
d pr
edic
ted
valu
e 2
1
0
–1
–2
–3
Scatterplot
Dependent variable: LDL diff
Regression standardised predicted value
210–1–2–3
2
1
0
–1
–2
–3
Regr
essio
n st
anda
rdiz
ed r
esid
ual
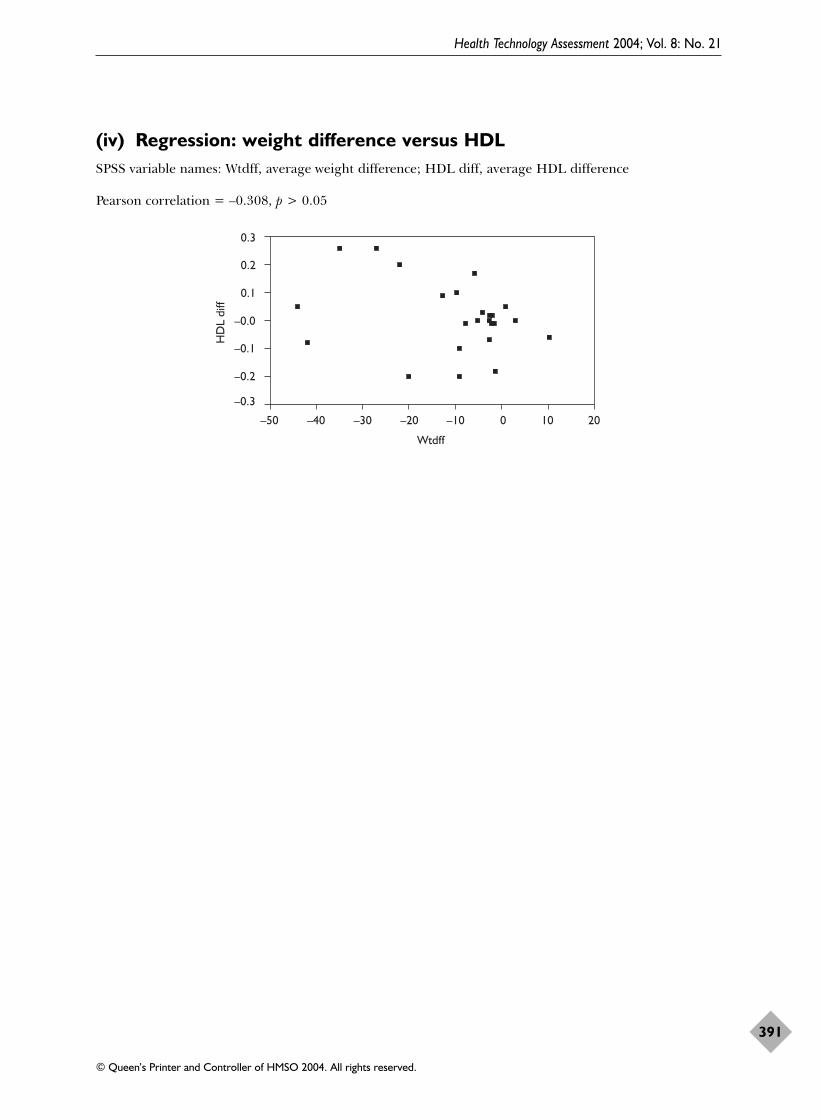
(iv) Regression: weight difference versus HDLSPSS variable names: Wtdff, average weight difference; HDL diff, average HDL difference
Pearson correlation = –0.308, p > 0.05
Health Technology Assessment 2004; Vol. 8: No. 21
391
© Queen’s Printer and Controller of HMSO 2004. All rights reserved.
Wtdff
20100–10–20–30–40–50
HD
L di
ff
0.3
0.2
0.1
–0.0
–0.1
–0.2
–0.3


Health Technology Assessment 2004; Vol. 8: No. 21
393
© Queen’s Printer and Controller of HMSO 2004. All rights reserved.
Appendix 23
Hypertension results
Appendix 23a
Weight differences compared with blood pressure differences for diastolic and systolic blood pressure

Appendix 23a
394
Intervention Study Description Follow- n Weight (SE) n DBP diff (SE) n SBP diff (SE)type up diff (mmHg) (mmHg)
months (kg)
Prospective Part i Wing, 1995282 Gainers 30 15 +10.30* (2.36) 15 +1.5 (2.14) 15 –1.30 (4.39)cohort Stable 30 25 +3.00* (1.36) 25 +3.5* (1.66) 25 –0.40 (3.40)
Large cyclers 30 31 –2.10 (1.17) 31 –2.2 (1.49) 31 –3.10 (3.05)Small cyclers 30 28 +2.60 (1.26) 28 5.0* (1.57) 28 0.40 (3.21)Partial cyclers 30 28 –9. 70* (1.69) 28 –5.1* (1.57) 28 –10.00* (3.21)Small successes 30 7 –5.90 (2.92) 7 –2.4 (3.14) 7 –4.60 (6.43)Large successes 30 14 –12.6* (2.63) 14 –4.1 (2.22) 14 –2.50 (4.54)
Part ii (a) Sjostrom M, CVD risk women 60 323 –1.44* (0.40) 321 –5.0* (0.76) 323 –6.00* (1.15)1999285 CVD risk men 60 221 –2.70* (0.56) 221 –2.94* (0.86) 221 –3.66* (1.40)(raw data)
(b) Kauffmann, Spanish workplace 24 80 –2.20* (0.40) 80 r = 0.2 p = 0.0151992283
RCT – diet & Part iii (a) Wing, 1998176 Diet + BT 24 35 –2.10 (1.28) 35 +3.0 * (1.32) 35 –0.80 (1.59)Ex Ex + BT 24 31 1.00 (0.84) 31 +2.0 (1.44) 31 +0.90 (2.50)
Diet, Ex + BT 24 32 –2.50 (1.48) 32 –0.2 (1.86) 32 –4.80 (2.54)
RCT – drug Part iii (b) Hauptman, Placebo + diet 24 91 –1.54* (0.58) 91 +1.0 (0.87) 91 +3.00 (1.78)200045 Orlistat + diet 24 117 –5.16* (0.78) 117 –1.0 (0.77) 117 0.00 (1.57)Rossner, 200037 Placebo + diet 24 140 –4.30* (0.63) 140 –2.7* (0.70) 140 –5.10* (1.44)
Orlistat + diet 24 136 –7.60* (0.60) 136 –2.6* (0.71) 136 –6.10* (1.46)Teupe, 199184 Metformin + diet 24 25 –4.00* (1.42) 25 –6.0* (1.66) 25 –10.00* (3.40)
diet 24 29 –5.10* (1.39) 29 –5.0* (1.54) 29 –14.00* (3.16)
Surgical Part iv Karason, 1999277 21% women 48 19 –22.0* (2.29) 19 –10.0* (2.75) 19 –18.00* (4.82)Sjostrom C, SOS 96 251 –20.1* (0.99) 251 –1.9* (0.90) 251 +2.90* (1.39)2000278
Carson, 1994263 HT grp > 90 mmHg 48 18 –40.5* (5.00) 18 –3.0 (1.96)Norm HT 48 34 –79.8* (5.50) 34 –4.6* (1.90) 34 –10.70* (3.60)
Kunesova, drug/BT/surgery(?) 24–60 103 –7.09* (1.48) 103 –4.86* (0.82) 103 –5.56* (1.68)1998262
Bold text standard errors indicate studies where the mean differences were estimated from follow-up mean – base mean. Standard errors were also estimated as in Appendix 26.HT, hypertension.* Follow-up – baseline paired t-test significance at p < 0.05.

Pearson correlations for DBP difference with weight differencevariables
Pearson correlations for % DBP difference with weight differencevariables
Health Technology Assessment 2004; Vol. 8: No. 21
395
© Queen’s Printer and Controller of HMSO 2004. All rights reserved.
Appendix 23b
Weight differences compared with diastolic blood pressure differences
All subgroups Extreme initial weight and weight losses excluded
DBP difference Follow-up Initial Weight % Initial Weight %(months) weight diff weight weight diff weight
(kg) (kg) diff (kg) (kg) diff
Correlation r –0.281 –0.293 0.407 0.468* –0.283 0.675** 0.698**p-Value (2-tailed) 0.194 0.175 0.054 0.024 0.214 0.001 0.000n 23 23 23 23 21 21 21
* Correlation is significant at the 0.05 level (2-tailed).** Correlation is significant at the 0.01 level (2-tailed).
All subgroups Extreme initial weight and weight losses excluded
% DBP Follow-up Initial Weight % Initial Weight %difference (months) weight diff weight weight diff weight
(kg) (kg) diff (kg) (kg) diff
Correlation r –0.071 –0.178 0.463 0.587* –0.213 0.780** 0.778**p-Value (2-tailed) 0.802 0.525 0.082 0.021 0.465 0.001 0.001na 15 15 15 15 14 14 14
a Some studies had no baseline blood pressures given, so % DBP could not be calculated; hence n = 15 and n = 14.* Correlation is significant at the 0.05 level (2-tailed).** Correlation is significant at the 0.01 level (2-tailed).

(i) DBP difference with weight difference (excluding > 40 kg absoluteweight loss)
Diff in DBP = –0.299 + 0.340 (wt diff), i.e. –10 kg → 3.7 mmHg drop in DBP
SPSS variable names: MISWTD, average weight difference excluding extreme subgroups; DIADIFF,average DBP difference
Appendix 23b
396
Model summarya
Model
1
R
0.675b
R2
0.456
Adjusted R2
0.428
SE of the estimate
2.76781
a Dependent variable: DIADIFF.b Predictors: (Constant), MISWTD.
ANOVAa
Model
1 RegressionResidualTotal
Sum ofsquares
122.189145.554267.693
df
11920
Mean square
122.138 7.661
F
15.943
Sig.
0.001b
a Dependent variable: DIADIFF.b Predictors: (Constant), MISWTD.
Residuals statisticsa
Predicted valueResidualStd predicted valueStd residual
Min.
–7.7900–4.3389–2.382–1.568
Max.
3.20805.24312.0691.894
Mean
–1.9048 0.0000 0.000 0.000
SD
2.471222.697721.0000.975
n
21212121
a Dependent variable: DIADIFF.
Coefficientsa
Model
1 (Constant)MISWTD
B
–0.299 0.340
SE
0.7260.085 0.675
t
–0.412 3.993
Sig.
0.6850.001
a Dependent variable: DIADIFF.
Standardisedcoefficients
Unstandardisedcoefficients

Health Technology Assessment 2004; Vol. 8: No. 21
397
© Queen’s Printer and Controller of HMSO 2004. All rights reserved.
Regression standardised residual
2.001.501.000.500.00–0.50–1.00–1.50
HistogramDependent variable: DIADIFF
Freq
uenc
y
6
5
4
3
2
1
0
SD = 0.97 Mean = 0.08n = 21.00
ScatterplotDependent variable: DIADIFF
Regression standardised predicted value
3210–1–2–3
Regr
essio
n st
anda
rdise
d re
sidua
l
2.0
1.5
1.0
0.5
0.0
–0.5
–1.0
–1.5
–2.0
ScatterplotDependent variable: DIADIFF
DIADIFF
6420–2–4–6–8–10–12
Regr
essio
n st
anda
rdise
d pr
edic
ted
valu
e 3
2
1
0
–1
–2
–3

(ii) DBP difference versus weight difference(excluding > 40 kg losses)
Diff in DBP = 0.360 (wt diff), i.e. –10 kg → 3.60 mmHg actual drop in DBP
Appendix 23b
398
Model summarya,b
Model
1
R
0.757d
R2 c
0.573
Adjusted R2
0.552
SE of the estimate
2.70976
a Dependent variable: DIADIFF.b Linear regression through the origin.c For regression through the origin (the no-intercept model), R2 measures the proportion of the variability in the dependent variable about the origin explained by regression. This cannot be compared to R2 for models that include an intercept.d Predictors: MISWTD.
ANOVAa,b
Model
1 RegressionResidualTotal
Sum ofsquares
197.027146.856343.883d
df
12021
Mean square
197.027 7.343
F
26.833
Sig.
0.000c
a Dependent variable: DIADIFF.b Linear regression through the origin.c Predictors: MISWTD.d This total sum of squares is not corrected for the constant because the constant is zero for regression through the origin.
Residuals statisticsa,b
Predicted valueResidualStd predicted valueStd residual
Min.
–7.9195–4.5601–2.382–1.683
Max.
3.70775.33552.0691.969
Mean
–1.6975–0.2072 0.000–0.076
SD
2.612592.701431.0000.997
n
21212121
a Dependent variable: DIADIFF.b Linear regression through the origin.
Coefficientsa,b
Model
1 MISWTD
B
0.360
SE
0.069 0.757
t
5.180
Sig.
0.000
a Dependent variable: DIADIFF.b Linear regression through the origin.
Standardisedcoefficients
Unstandardisedcoefficients

Health Technology Assessment 2004; Vol. 8: No. 21
399
© Queen’s Printer and Controller of HMSO 2004. All rights reserved.
Regression standardised residual
2.001.501.000.500.00–0.50–1.00–1.50
HistogramDependent variable: DIADIFF
Freq
uenc
y5
4
3
2
1
0
SD = 1.00 Mean = –0.08n = 21.00
ScatterplotDependent variable: DIADIFF
Regression standardised predicted value
3210–1–2–3
Regr
essio
n st
anda
rdise
d re
sidua
l
3
2
1
0
–1
–2
ScatterplotDependent variable: DIADIFF
DIADIFF
6420–2–4–6–8–10–12
Regr
essio
n st
anda
rdise
d pr
edic
ted
valu
e 3
2
1
0
–1
–2
–3


Health Technology Assessment 2004; Vol. 8: No. 21
401
© Queen’s Printer and Controller of HMSO 2004. All rights reserved.
Appendix 23c
Weight differences compared with systolic blood pressure differences

Appendix 23c
402
(i) Scatterplots
(a) SBP versus weight differences
(b) SBP versus % weight differences
WTDIFF
200–20–40–60–80–100
SYSD
IFF
10
0
–10
–20
MISWTD
20100–10–20–30
SYSD
IFF
10
0
–10
–20
(i) All studies (ii) Excluding extreme weight differences
PERWT
0.20.10.0–0.1–0.2–0.3–0.4–0.5–0.6
SYSD
IFF
10
0
–10
–20
PERMISWT
0.20.10.0–0.1–0.2
SYSD
IFF
10
0
–10
–20
(i) All studies (ii) Excluding extreme weight differences

(ii) Pearson correlations for SBP difference (raw and percentage)with weight difference variables
Health Technology Assessment 2004; Vol. 8: No. 21
403
© Queen’s Printer and Controller of HMSO 2004. All rights reserved.
All subgroups Extreme initial weight and weight losses excluded
SBP difference Follow-up Initial Weight % Initial Weight %(months) weight diff weight weight diff weight
(kg) (kg) diff (kg) (kg) diff
Correlation r 0.041 –0.155 0.393 0.428* 0.005 0.407 0.432p-Value (2-tailed) 0.857 0.492 0.070 0.047 0.983 0.067 0.051n 22 22 22 22 21 21 21
* Correlation is significant at the 0.05 level (2-tailed).
All subgroups Extreme initial weight and weight losses excluded
% SBP Follow-up Initial Weight % Initial Weight %difference (months) weight diff weight weight diff weight
(kg) (kg) diff (kg) (kg) diff
Correlation r 0.015 0.180 0.491 0.502 0.080 0.498 0.509p-Value (2-tailed) 0.960 0.538 0.075 0.067 0.538 0.070 0.063na 14 14 14 14 14 14 14
a Some studies had no baseline blood pressures given, so % SBP could not be calculated; hence, the number of subgroups isreduced to n = 14.

(iii) Regression: SBP with percentage weight difference variables(excluding > 40 kg losses)
diff in SBP = –2.719 + 33.745 (%wt diff), i.e. 10% wt loss → 6.1 mmHg drop in SBP
SPSS variable names: PERMISWT, average % weight difference excluding extreme subgroups; SYSDIFF, average SBP difference
Appendix 23c
404
Model summarya
Model
1
R
0.432b
R2
0.186
Adjusted R2
0.144
SE of the estimate
4.9395
a Dependent variable: SYSDIFF.b Predictors: (Constant), PERMISWT.
ANOVAa
Model
1 RegressionResidualTotal
Sum ofsquares
106.182463.568569.749
df
11920
Mean square
106.182 24.398
F
4.352
Sig.
0.051b
a Dependent variable: SYSDIFF.b Predictors: (Constant), PERMISWT.
Residuals statisticsa
Predicted valueResidualStd predicted valueStd residual
Min.
–9.0107–9.2819–2.076–1.879
Max.
1.212511.1972 2.360 2.267
Mean
–4.2262 0.000 0.000 0.000
SD
2.30424.81441.0000.975
n
21212121
a Dependent variable: SYSDIFF.
Coefficientsa
Model
1 (Constant)PERMISWT
B
–2.71933.745
SE
1.29816.176 0.432
t
–2.096 2.086
Sig.
0.0500.051
a Dependent variable: SYSDIFF.
Standardisedcoefficients
Unstandardisedcoefficients

Health Technology Assessment 2004; Vol. 8: No. 21
405
© Queen’s Printer and Controller of HMSO 2004. All rights reserved.
Regression standardised residual
2.50
2.00
1.50
1.00
0.50
0.00
–0.50
–1.00
–1.50
–2.00
HistogramDependent variable: SYSDIFF
Freq
uenc
y
8
6
4
2
0
SD = 0.97 Mean = 0.00n = 21.00
ScatterplotDependent variable: SYSDIFF
SYSDIFF
100–10–20
Regr
essio
n st
anda
rdise
d pr
edic
ted
valu
e 3
2
1
0
–1
–2
–3
ScatterplotDependent variable: SYSDIFF
Regression standardised predicted value
3210–1–2–3
Regr
essio
n st
anda
rdise
d re
sidua
l
3
2
1
0
–1
–2
10


Health Technology Assessment 2004; Vol. 8: No. 21
407
© Queen’s Printer and Controller of HMSO 2004. All rights reserved.
Appendix 23d
Other results relating to hypertension: all surgical

Appendix 23d
408
Study Participant type Follow-up years Hypertension (HT) Other
Pories, 1992266 Morbid obese 11 years overall Baseline: n = 515, 301 (58.4%) had HTFollow-up: unclear when results redone 96/301 remained hypertensive
O’Leary, 1980272 Obese 7 years overall Baseline: n = 274, 46% were HTFollow-up: unclear when results redone 33% of those with HT at baseline improved, 66% of those with HT at baseline remained hypertensive
Sjostrom C, SOS 8 years Baseline: n = 257, control n = 132, surgical n = 1252000278 hypertensive and Follow-up: control n = 34, surgical n = 33;
obese HT OR = 1.05 (0.58 to 1.89); adjusted for: gender, age,initial weight, weight, smoking status, alcohol, energy in,physical activity
Carson, 1994263 Hypertensive 4 years Baseline n = 45, had HT and 41 had medication Follow-up: resolved HT group BMI = 32, > 90 mmHg and Follow-up: HT results n = 18?; 12/18 resolved, improved HT group BMI = 37.4, obese 2/18 improved, 4/18 no change, 5 still on medication no change HT group BMI = 49.5
Foley, 1992288 Obese 4.2 (SE 0.2) years Baseline n = 74, all HTFollow-up: n = 67; 44/67 (66%) resolved HT; 23/67 (34%) persistent HT

Health Technology Assessment 2004; Vol. 8: No. 21
409
© Queen’s Printer and Controller of HMSO 2004. All rights reserved.
Appendix 24
Changes in weight and psychological measures after a cycle of weight loss and regain
TABLE 35
Baseline 6 months Follow-up
Variable n Mean (SD) Mean (SD) Mean (SD) F p
Weight (kg) 48 105.8 (16.6) 84.7 (13.2) 109.4 (20.0) 5.24 0.03Depression 48 12.7 (8.5) 6.0 (8.9) 9.3 (8.1) 8.43 0.006Binge eating 46 20.7 (7.8) 14.9 (7.1) 14.6 (8.2) 24.02 0.0001Restraint 47 8.2 (3.4) 15.1 (3.4) 8.4 (4.2) 0.0001 0.99Disinhibition 47 11.7 (2.5) 9.6 (3.1) 10.0 (3.2) 17.89 0.001Hunger 47 7.9 (3.5) 6.2 (3.4) 5.9 (3.1) 17.31 0.001
Data from Foster et al. (1996)163 Table 1.F = ANOVA, repeated measures within-subject design. Six-month data included only to assess magnitude of changes duringtreatment. F and p values are for baseline and follow-up comparisons. Depression was assessed by the Beck DepressionInventory; binge eating by the Binge Eating Scale; and restraint, disinhibition and hunger by the Eating Inventory.
TABLE 36 NVM scores of the study population before and after surgery compared with the reference group (standard values of ageneral Dutch population)
Reference Before surgery After surgery
Mean (95% CI) Mean (95% CI) Mean (95% CI)
Negativism 14.7 (14.2 to 15.2) 18.1 (15.9 to 20.3)** 16.7 (14.5 to 18.9)Somatisation 5.3 (4.9 to 5.7) 12.8 (10.7 to 14.9)*** 14.6 (12.1 to 17.1)***Shyness 8.0 (7.6 to 8.4) 14.5 (12.1 to 16.9)*** 9.9 (7.8 to 12.0)Psychopathology 2.7 (2.5 to 2.9) 3.3 (2.5 to 4.1) 3.2 (2.5 to 3.9)Extroversion 17.1 (16.7 to 17.5) 15.1 (13.5 to 16.7)* 16.8 (15.3 to 18.3)
Data from van Gemert et al. (1998)270 Table 1.Separate variance t-test for differences between the values of the study groups (before and after surgery) and the values ofthe reference group (*p < 0.02, **p < 0.001, ***p < 0.001).

Appendix 24
410
TABLE 37 NPV scores of the study population before and after surgery compared with the reference group (standard values of ageneral Dutch population)
Reference Before surgery After surgery
Mean (95% CI) Mean (95% CI) Mean (95% CI)
Inadequacy 13.9 (13.6 to 14.2) 16.8 (14.0 to 19.6)* 13.9 (11.4 to 16.4)Social inadequacy 12.3 (12.0 to 12.6) 15.8 (13.4 to 18.2)** 9.3 (7.1 to 11.5)**Rigidity 30.6 (30.2 to 31.0) 27.3 (25.2 to 29.4)** 27.8 (25.8 to 29.8)**Grievance 18.2 (18.0 to 18.4) 21.2 (19.1 to 23.3)** 19.4 (17.3 to 21.5)Self-satisfaction 13.9 (13.7 to 14.1) 12.5 (10.8 to 14.2) 13.0 (11.6 to 14.4)Dominance 11.9 (11.7 to 12.1) 13.6 (11.5 to 15.7) 15.6 (13.7 to 17.5)***Self-esteem 28.0 (27.9 to 28.1) 24.4 (22.2 to 26.6)** 26.5 (24.5 to 28.5)
Data from van Gemert et al. (1998)270 Table 2.Separate variance t-test for differences between the values of the study groups (before and after surgery) and the values ofthe reference group (*p < 0.02; **p < 0.001; ***p < 0.001).
TABLE 38 Comparison of the SIG scores before and after surgery
Before surgery After Surgery
Frequency of Tension felt Frequency of Tension feltExpressing Expressing
Mean (SD) Mean (SD) Mean (SD) Mean (SD)
Positive feelings 2.7 (0.7) 2.4 (0.9) 3.1 (0.8)** 2.0 (0.9)*Negative feelings 2.7 (0.5) 2.5 (0.8) 3.0 (0.6)* 2.2 (0.8)Self-expression 2.7 (0.7) 2.6 (1.0) 3.1 (0.7)* 2.0 (0.9)**Insecurity 3.4 (0.4) 2.1 (0.7) 3.5 (0.7) 1.8 (0.6)*Total 3.0 (0.5) 2.3 (0.8) 3.2 (0.6)* 2.0 (0.7)*
Data from van Gemert et al. (1998)270 Table 3.Paired Student’s t-test (*p < 0.05; **p < 0.001).

Health Technology Assessment 2004; Vol. 8: No. 21
411
© Queen’s Printer and Controller of HMSO 2004. All rights reserved.
Appendix 25
Sleep apnoea results

Appendix 25
412
Study Description Initial Mean age Initial weight Follow-up Follow-up Weight change Initial AHI Difference in AHI n (years) (kg) (years) n (kg) events/hour events/hour
Peppard, 2000290 Men and women 268 46.6 (SD 7.4) 101.2 (SD 15.5) 4 268 +2.4 (SD 7.4) 7.4 (SD 13.1) +2.0 (SD 12.3)with obesity and Subgroup that lost –20% to –10% 19 –20% to –10% –3.6 (SD 15.3)sleep disordered Model adjusted for age and gender at –20% –32% (95% CI –58 to 11%)breathing
Subgroup that lost –10% to –5% 17 –10% to –20% –2.4 (SD 6.1)Model adjusted for age and gender at –10% –17% (95% CI –34 to 5%)
Stable group: lost –5% to 5% 129 –5% to 5% +1.0 (SD 10.2)Model adjusted for age and gender at –5% –9% (95% CI –18 to 2%)
at +5% +9% (95% CI –2 to 21%)
Charuzi, 1992264 Surgical obesity 51 41.2 (SD 9.5) 138.9 (SD 24.6) 6 (SD 1.79) 42 –37.38 (estimated 60.8 (SD 35.5) n = 6 for full AI at 6 year. and SAS SD 17.76, see Results imply that if weight
Appendix 26) loss is maintained then AI issmall (i.e. like the 1-yearresults)
Sugerman, 1992291 Surgical morbid 110 166 (SD 35) 4.5 (SD 2.3) 57 –54 kg (SD 32) 64 (SD 39) 32 (SD 32)obesity SAS and (67% severe) 38/57 asymptomatic, morbid SAS with 15/57 mild SAS, 4/57 still SAS hypoventilation and obesity hypoventilation
syndrome
AI, apnoea index; SAS, sleep apnoea syndrome.

Appendices 13 and 14 provide a method ofestimating standard deviations from their
associated weight and health outcome differencesas appropriate for RCTs. For the epidemiologicalreview these relationships were re-examined given that some of the weight and health outcome differences were larger (as for surgicalinterventions) and would thus otherwise requireextrapolation. This part of the review also looked at the outcomes in the longer term, which may itself alter the relationship. The models given in Appendices 13 and 14 are used as a basis.
Part A: Estimation of weightdifference measure of spreadAs the weight differences were gathered initiallythe standard deviations did not appear to have alinear relationship with their absolute weightdifferences, causing concern about applying alinear equation as in Appendix 13. The standarderrors did at first appear to have a linearrelationship with the absolute weight differences.However, as the database became complete andthe spread of the differences widened, so did therelationships.
All available studies that gave weight differencesand an appropriate measure of spread for thesedifferences were amalgamated. The relationship
between absolute weight differences and theirassociated standard deviations (r = 0.853) andstandard errors (r = 0.894) were examined andfound to be reasonably linear.
Although there is a slightly stronger linearrelationship between the absolute weight lossesand their associated standard errors, bothregression models were investigated.
The assumptions of such a model require that therelationship is linear, that the observations areindependent and that the residuals are normallydistributed. Although the standard error modelappears to have a better fit, the normality andindependence assumptions were in some doubt.When examined, the residuals from the standarddeviation model appear for this limited data set touphold all of the assumptions.
Reassuringly, this fits in with the conclusion fromAppendix 13. However, there are no right orwrong ways of making such estimates. Theepidemiology review results, when required, usedthe estimates based on the model given here:
Weight diff. SD = 5.837 + 0.319 × (Absolute weight diff.)
This model has the assurance that it is similar tothe RCT-based model but has been developedusing the full breadth of weight differences seen inthe epidemiology review.
Health Technology Assessment 2004; Vol. 8: No. 21
413
© Queen’s Printer and Controller of HMSO 2004. All rights reserved.
Appendix 26
Methods of estimating measures of spread
n Adjusted R2 Dependent Prediction equation
25 0.729 Weight difference SD = 5.837 + 0.319 × (Absolute weight difference)
25 0.790 Weight difference SE = 0.710 + 0.07039 × (Absolute weight difference)

Part B: Estimation of cholesteroldifference standard deviationThe studies that gave cholesterol differences alongwith appropriate measure of spread were consideredtogether. The relationship between cholesteroldifferences and their standard deviations was variedand certainly not linear. Appendix 14 estimates thisas a constant of 1.08 mmol/l that will be adoptedwithin the epidemiology review, given that none ofthe observed measures was larger than this andwould hence be a conservative estimate.
Part C: Estimation of LDLdifference standard deviationAs for cholesterol, the relationship between LDLdifferences and their standard deviations was non-linear and probably constant. The epidemiologydata collected for LDL difference standarddeviations never exceeded 0.74 mmol/l, the valuesuggested in Appendix 14.
Part D: Estimation of HDLdifference standard deviationFour studies gave an HDL difference with itsstandard deviation. Their average was0.245 mmol/l similar to the 0.29 mmol/l estimategiven by Appendix 14. With no other evidence tosuggest otherwise, 0.29 mmol/l was used toestimate HDL difference standard deviations.
Part E: Estimation of TGsdifference standard deviationFour data points were available to estimate thetriglycerides difference measure of spread, hence
linear model was not significant. However, theconstant term in Appendix 14 of 0.96 mmol/lseemed small. Instead, the average of the values in the epidemiology review (1.53 mmol/l) wasused.
Part F: Estimation of glucosedifference standard deviationAlthough the epidemiology review gave results offasting glucose plasma levels there were nodifferences with associated measure of spread. Allthe estimated differences were less than 7 mmol/l,thus the constant given in Appendix 14 of1.35 mmol/l was used to estimate the standarddeviations.
Part G: Estimation of DBP andSBP difference standarddeviationsIntially the epiemiology review produced very few results for DBP and SBP differences withassociated measures of spread. Those availablecompared favourably with those estimated from the RCTs given in Appendix 14.Consequently, all the estimated standarddeviations of the differences for DBP and SBPwere set to the constants 8.3 mmHg and 12.7 mmHg, respectively, as given in Appendix14. Although, more studies later became available, due to time constraints it was notpossible to fully explore the relationship between the mean differences and their standard deviations in order to revise thisdecision.
Appendix 26
414
Health Technology Assessment 2004; Vol. 8: No. 21
415
© Queen’s Printer and Controller of HMSO 2004. All rights reserved.
Appendix 27
Quality assessment
Appendix 27a
Quality assessment scores
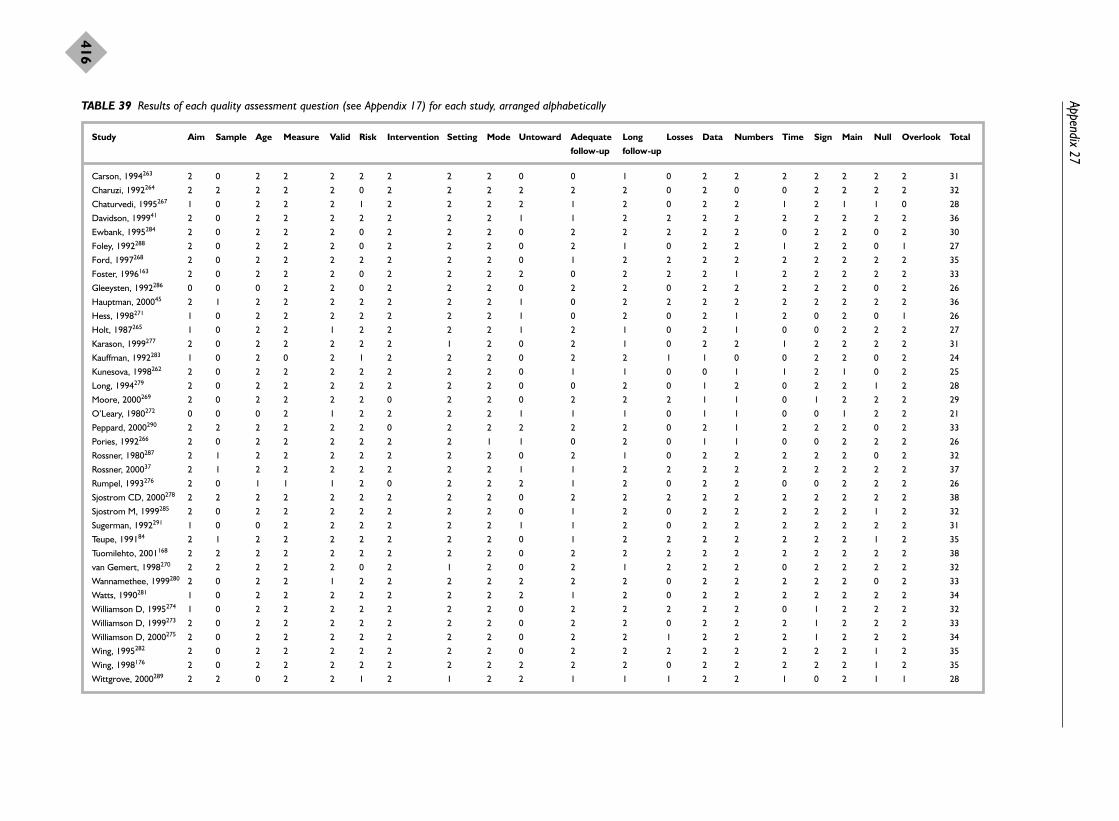
Appendix 27
416
TABLE 39 Results of each quality assessment question (see Appendix 17) for each study, arranged alphabetically
Study Aim Sample Age Measure Valid Risk Intervention Setting Mode Untoward Adequate Long Losses Data Numbers Time Sign Main Null Overlook Total
follow-up follow-up
Carson, 1994263 2 0 2 2 2 2 2 2 2 0 0 1 0 2 2 2 2 2 2 2 31
Charuzi, 1992264 2 2 2 2 2 0 2 2 2 2 2 2 0 2 0 0 2 2 2 2 32
Chaturvedi, 1995267 1 0 2 2 2 1 2 2 2 2 1 2 0 2 2 1 2 1 1 0 28
Davidson, 199941 2 0 2 2 2 2 2 2 2 1 1 2 2 2 2 2 2 2 2 2 36
Ewbank, 1995284 2 0 2 2 2 0 2 2 2 0 2 2 2 2 2 0 2 2 0 2 30
Foley, 1992288 2 0 2 2 2 0 2 2 2 0 2 1 0 2 2 1 2 2 0 1 27
Ford, 1997268 2 0 2 2 2 2 2 2 2 0 1 2 2 2 2 2 2 2 2 2 35
Foster, 1996163 2 0 2 2 2 0 2 2 2 2 0 2 2 2 1 2 2 2 2 2 33
Gleeysten, 1992286 0 0 0 2 2 0 2 2 2 0 2 2 0 2 2 2 2 2 0 2 26
Hauptman, 200045 2 1 2 2 2 2 2 2 2 1 0 2 2 2 2 2 2 2 2 2 36
Hess, 1998271 1 0 2 2 2 2 2 2 2 1 0 2 0 2 1 2 0 2 0 1 26
Holt, 1987265 1 0 2 2 1 2 2 2 2 1 2 1 0 2 1 0 0 2 2 2 27
Karason, 1999277 2 0 2 2 2 2 2 1 2 0 2 1 0 2 2 1 2 2 2 2 31
Kauffman, 1992283 1 0 2 0 2 1 2 2 2 0 2 2 1 1 0 0 2 2 0 2 24
Kunesova, 1998262 2 0 2 2 2 2 2 2 2 0 1 1 0 0 1 1 2 1 0 2 25
Long, 1994279 2 0 2 2 2 2 2 2 2 0 0 2 0 1 2 0 2 2 1 2 28
Moore, 2000269 2 0 2 2 2 2 0 2 2 0 2 2 2 1 1 0 1 2 2 2 29
O’Leary, 1980272 0 0 0 2 1 2 2 2 2 1 1 1 0 1 1 0 0 1 2 2 21
Peppard, 2000290 2 2 2 2 2 2 0 2 2 2 2 2 0 2 1 2 2 2 0 2 33
Pories, 1992266 2 0 2 2 2 2 2 2 1 1 0 2 0 1 1 0 0 2 2 2 26
Rossner, 1980287 2 1 2 2 2 2 2 2 2 0 2 1 0 2 2 2 2 2 0 2 32
Rossner, 200037 2 1 2 2 2 2 2 2 2 1 1 2 2 2 2 2 2 2 2 2 37
Rumpel, 1993276 2 0 1 1 1 2 0 2 2 2 1 2 0 2 2 0 0 2 2 2 26
Sjostrom CD, 2000278 2 2 2 2 2 2 2 2 2 0 2 2 2 2 2 2 2 2 2 2 38
Sjostrom M, 1999285 2 0 2 2 2 2 2 2 2 0 1 2 0 2 2 2 2 2 1 2 32
Sugerman, 1992291 1 0 0 2 2 2 2 2 2 1 1 2 0 2 2 2 2 2 2 2 31
Teupe, 199184 2 1 2 2 2 2 2 2 2 0 1 2 2 2 2 2 2 2 1 2 35
Tuomilehto, 2001168 2 2 2 2 2 2 2 2 2 0 2 2 2 2 2 2 2 2 2 2 38
van Gemert, 1998270 2 2 2 2 2 0 2 1 2 0 2 1 2 2 2 0 2 2 2 2 32
Wannamethee, 1999280 2 0 2 2 1 2 2 2 2 2 2 2 0 2 2 2 2 2 0 2 33
Watts, 1990281 1 0 2 2 2 2 2 2 2 2 1 2 0 2 2 2 2 2 2 2 34
Williamson D, 1995274 1 0 2 2 2 2 2 2 2 0 2 2 2 2 2 0 1 2 2 2 32
Williamson D, 1999273 2 0 2 2 2 2 2 2 2 0 2 2 0 2 2 2 1 2 2 2 33
Williamson D, 2000275 2 0 2 2 2 2 2 2 2 0 2 2 1 2 2 2 1 2 2 2 34
Wing, 1995282 2 0 2 2 2 2 2 2 2 0 2 2 2 2 2 2 2 2 1 2 35
Wing, 1998176 2 0 2 2 2 2 2 2 2 2 2 2 0 2 2 2 2 2 1 2 35
Wittgrove, 2000289 2 2 0 2 2 1 2 1 2 2 1 1 1 2 2 1 0 2 1 1 28
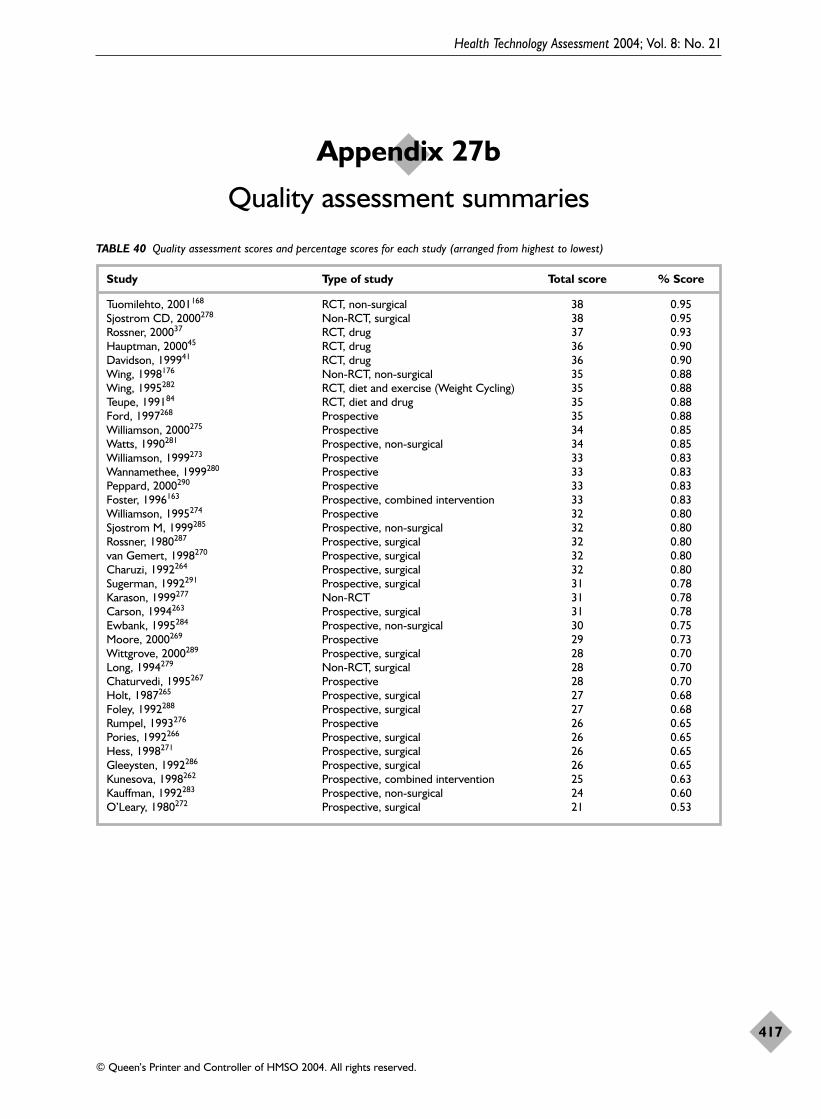
Health Technology Assessment 2004; Vol. 8: No. 21
417
© Queen’s Printer and Controller of HMSO 2004. All rights reserved.
Appendix 27b
Quality assessment summaries
TABLE 40 Quality assessment scores and percentage scores for each study (arranged from highest to lowest)
Study Type of study Total score % Score
Tuomilehto, 2001168 RCT, non-surgical 38 0.95Sjostrom CD, 2000278 Non-RCT, surgical 38 0.95Rossner, 200037 RCT, drug 37 0.93Hauptman, 200045 RCT, drug 36 0.90Davidson, 199941 RCT, drug 36 0.90Wing, 1998176 Non-RCT, non-surgical 35 0.88Wing, 1995282 RCT, diet and exercise (Weight Cycling) 35 0.88Teupe, 199184 RCT, diet and drug 35 0.88Ford, 1997268 Prospective 35 0.88Williamson, 2000275 Prospective 34 0.85Watts, 1990281 Prospective, non-surgical 34 0.85Williamson, 1999273 Prospective 33 0.83Wannamethee, 1999280 Prospective 33 0.83Peppard, 2000290 Prospective 33 0.83Foster, 1996163 Prospective, combined intervention 33 0.83Williamson, 1995274 Prospective 32 0.80Sjostrom M, 1999285 Prospective, non-surgical 32 0.80Rossner, 1980287 Prospective, surgical 32 0.80van Gemert, 1998270 Prospective, surgical 32 0.80Charuzi, 1992264 Prospective, surgical 32 0.80Sugerman, 1992291 Prospective, surgical 31 0.78Karason, 1999277 Non-RCT 31 0.78Carson, 1994263 Prospective, surgical 31 0.78Ewbank, 1995284 Prospective, non-surgical 30 0.75Moore, 2000269 Prospective 29 0.73Wittgrove, 2000289 Prospective, surgical 28 0.70Long, 1994279 Non-RCT, surgical 28 0.70Chaturvedi, 1995267 Prospective 28 0.70Holt, 1987265 Prospective, surgical 27 0.68Foley, 1992288 Prospective, surgical 27 0.68Rumpel, 1993276 Prospective 26 0.65Pories, 1992266 Prospective, surgical 26 0.65Hess, 1998271 Prospective, surgical 26 0.65Gleeysten, 1992286 Prospective, surgical 26 0.65Kunesova, 1998262 Prospective, combined intervention 25 0.63Kauffman, 1992283 Prospective, non-surgical 24 0.60O’Leary, 1980272 Prospective, surgical 21 0.53

Appendix 27
418
TABLE 41 Quality assessment results for each quality assessment question
No Possibly/unclear Yes
Count Count Count
Aims clearly stated 2 7 28Sample size justified 27 4 6Age of people defined 4 1 32Measurements clearly stated 1 1 35Measurements valid and reliable 4 33Risk factors recorded 6 3 28Intervention defined initially 3 34Setting of study clear 3 34Mode of assessment described 1 36Untoward events happen 20 8 9Follow-up adequate 6 12 19Follow-up long enough 9 28Losses to follow-up described 21 3 13Basic data described 1 5 31Do the numbers add up 2 8 27Did analysis allow for time 11 5 21Statistical significance assessed 6 4 27Main findings assessed ok 3 34Null/negative findings interpreted 9 7 21Any important effects missed 1 3 33

The study by Wing and colleagues,282 gave thefollowing definitions for the different weight
cycling groups:
� gainers: those who gained 4.5 kg from baselineto 30 months
� stable: those who remained within ± 4.5 kg oftheir baseline weight throughout the studyperiod
� large cyclers: those who lost 9 kg or moreduring the treatment period but who returnedto within ± 4.5 kg of their baseline weight atthe end of the study
� small cyclers: those who lost between 4.5 and 9 kg during the treatment period but whoreturned to within ± 4.5 kg of their baselineweight at the end of the study
� partial cyclers: those who lost 9 kg or moreduring the treatment period and kept off4.5–9 kg at the end of the follow-up period
� small successes: those who lost 4.5–9 kg duringtreatment and kept off 4.5–9 kg by the end ofthe study
� large successes: those who lost more than 9 kgduring treatment and kept off more than 9 kgby the end of the study.
Health Technology Assessment 2004; Vol. 8: No. 21
419
© Queen’s Printer and Controller of HMSO 2004. All rights reserved.
Appendix 28
Definition of weight cycling


MEDLINE (1966–2002, week 4) (Ovid)
1. “costs and cost analysis”/2. cost benefit analysis/3. economic evaluation.tw.4. economic analys#s.tw.5. cost effective$.ti.6. cost utility.ti.7. or/1-6
EMBASE (1980–2002, week 9) (Ovid)
1. economic evaluation/2. cost benefit analysis/3. cost effectiveness analysis/4. cost minimization analysis/5. cost utility analysis/6. or/1-5
CINAHL (1982–December 2001) (Ovid)
1. “costs and cost analysis”/2. cost benefit analysis/3. economic evaluation.tw.4. economic analys#s.tw.5. cost effective$.ti.6. cost utility.ti.7. or/1-6
PsycINFO (1967–December 2001) (Silverplatter)
1. ‘Costs-and-Cost-Analysis’ in DE2. economic evaluation
3. economic analys?s4. cost utility analysis5. cost effectiveness analysis6. cost benefit analysis7. cost* near3 benefit*8. cost* near outcome*9. #1 or #2 or #3 or #4 or #5 or #6 or #7 or
#8
Science and Social Science Citation Indexes(1981–2002) (Web of Science)
(obes* or weight control or weight loss or weightreduction or overweight or diet therapy) and(economic evaluation or economic analys?s or costbenefit* or cost effectiveness or cost utility)
ASSIA (1987–February 2002) and HMIC (toJanuary 2002) (Silverplatter)
1. economic evaluation2. economic analys?s3. cost* near benefit*4. cost* near outcome*5. cost near1 effectiveness6. cost near1 utility7. #1 or #2 or #3 or #4 or #5 or #6
Health Technology Assessment 2004; Vol. 8: No. 21
421
© Queen’s Printer and Controller of HMSO 2004. All rights reserved.
Appendix 29
Search strategies for the systematic review of economic evaluations


Health Technology Assessment 2004; Vol. 8: No. 21
423
© Queen’s Printer and Controller of HMSO 2004. All rights reserved.
Appendix 30
Data extraction table for economic evaluations: orlistat

Appendix 30
424
Author, year, Intervention and Sources of data Methods and study Results Sensitivity analyses Additional commentsintervention/ outcomes perspectiveevaluation type, country
Foxcroft and Ludders, 1999308 and Foxcroft and Milne, 2000309. See O’Meara et al., 200125 for all other information
Lamotte et al.,2002313
Intervention:orlistat in type 2diabetic patients
Economicevaluation type:cost–utilityanalysis
Country andcurrency:Belgium, 2000euros
Intervention: 2-yeartreatment with orlistatwith diet vs placebowith diet in 4 types ofobese diabetic patients:no other conditions,hypercholesterolaemia,AHT, both conditions
Outcomes: mainoutcome was life-yearsgained. Three clinicalfactors were assessedto determine changesin morbidity andmortality: reduction inHbA1c, LDL cholesteroland DBP (no significantreduction found)
Efficacy data:Hollander et al., 199833;Clark, 1998333;Koskinen et al., 1992334;UKPDS 24, 199888
Mortality andmorbidity: UKPDS 38,1998334
10-year Markov modelwith 6-month periods(20 periods total).Model assumed nocomplications at time ofentry and that weightlost was fully regainedby year 7
Costs were discountedby 3% per year. Effectswere not discountedexcept as a sensitivityanalysis
Assumed (based onHollander)33,34 that4.2% could stop oralantidiabetics and anadditional 10.1%reduced medication by24.8%
Perspective was that ofthe healthcareconsumer
Costs (in year 2000euros): orlistat:€881/year, metformin:€119/year
1998 euro healthcarecosts by patient group:€1726 if no otherconditions, €2578 ifhypercholesterolaemia,€3844 if AHT, €5443 ifboth
Effects (life-yearsgained) by patientgroup: 0.08 if no otherconditions, 0.204 ifhypercholesterolaemia,0.227 if AHT, 0.474 ifboth
ICER (euros per life-year gained) bypatient group:€19,986 if no otherconditions, €7,407 ifhypercholesterolaemia,€7,388 if AHT, €3,462if both
Discounting effects by3% increased the ICER to€23,522 for the no otherconditions group and to€4062 for patients withboth other conditions
Reducing the catch-upperiod to regain weight to2.5 years increased theICER to €26,527 for theno complications groupand to €4565 for patientswith both complications
Effects of variation in theeffect of orlistat on HbA1care provided
Effects of 50% reductionin effect of orlistat onLDL cholesterol areprovided
The authors note thatthey are not able topredict the independenteffect of weight loss onthe incidence ofcomplications and death.Instead, they use theeffect of weight loss onrisk factors and thenestimate the effect of riskfactors on morbidity andmortality, i.e. assumingthat improving risk factorsreduces the number ofcomplications
While the model doesassume that all weight isregained in 7 years, themodel seems to assumethat the benefits from theinitial weight loss accruefor a full 7 years. In otherwords, the beneficialeffect of orlistat on therisk factors appears topersist for 7 years in themodel

Health Technology Assessment 2004; Vol. 8: No. 21
425
© Queen’s Printer and Controller of HMSO 2004. All rights reserved.
Appendix 31
Data extraction table for economic evaluations: sibutramine

Appendix 31
426
Author, year, Intervention and Sources of data Methods and study Results Sensitivity analyses Additional commentsintervention/ outcomes perspectiveevaluation type, country
BASF Pharma/Knoll 2000, company submission. See O’Meara et al. 200226 for all other information

Health Technology Assessment 2004; Vol. 8: No. 21
427
© Queen’s Printer and Controller of HMSO 2004. All rights reserved.
Appendix 32
Data extraction table for economic evaluations: metformin
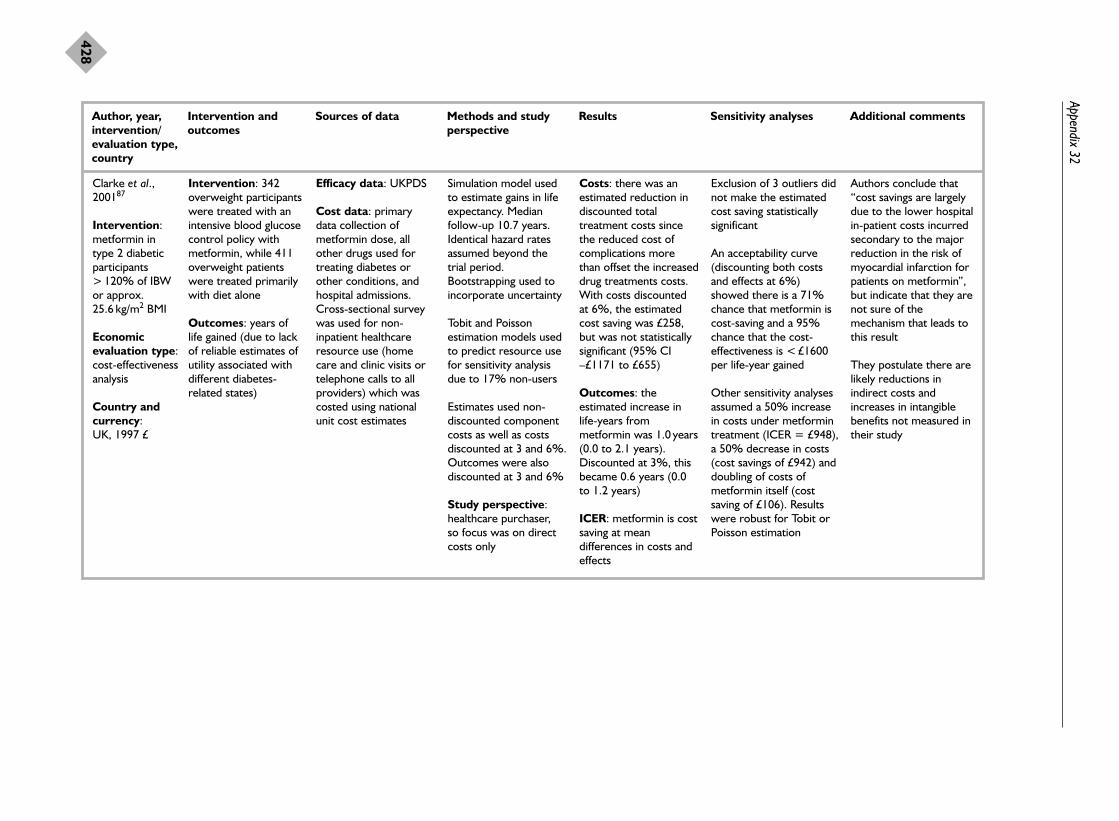
Appendix 32
428
Author, year, Intervention and Sources of data Methods and study Results Sensitivity analyses Additional commentsintervention/ outcomes perspectiveevaluation type, country
Clarke et al.,200187
Intervention:metformin in type 2 diabeticparticipants> 120% of IBWor approx.25.6 kg/m2 BMI
Economicevaluation type:cost-effectivenessanalysis
Country andcurrency: UK, 1997 £
Intervention: 342overweight participantswere treated with anintensive blood glucosecontrol policy withmetformin, while 411overweight patientswere treated primarilywith diet alone
Outcomes: years oflife gained (due to lackof reliable estimates ofutility associated withdifferent diabetes-related states)
Efficacy data: UKPDS
Cost data: primarydata collection ofmetformin dose, allother drugs used fortreating diabetes orother conditions, andhospital admissions.Cross-sectional surveywas used for non-inpatient healthcareresource use (homecare and clinic visits ortelephone calls to allproviders) which wascosted using nationalunit cost estimates
Simulation model usedto estimate gains in lifeexpectancy. Medianfollow-up 10.7 years.Identical hazard ratesassumed beyond thetrial period.Bootstrapping used toincorporate uncertainty
Tobit and Poissonestimation models usedto predict resource usefor sensitivity analysisdue to 17% non-users
Estimates used non-discounted componentcosts as well as costsdiscounted at 3 and 6%.Outcomes were alsodiscounted at 3 and 6%
Study perspective:healthcare purchaser, so focus was on directcosts only
Costs: there was anestimated reduction indiscounted totaltreatment costs sincethe reduced cost ofcomplications morethan offset the increaseddrug treatments costs.With costs discountedat 6%, the estimatedcost saving was £258,but was not statisticallysignificant (95% CI–£1171 to £655)
Outcomes: theestimated increase inlife-years frommetformin was 1.0 years(0.0 to 2.1 years).Discounted at 3%, thisbecame 0.6 years (0.0to 1.2 years)
ICER: metformin is costsaving at meandifferences in costs andeffects
Exclusion of 3 outliers didnot make the estimatedcost saving statisticallysignificant
An acceptability curve(discounting both costsand effects at 6%)showed there is a 71%chance that metformin iscost-saving and a 95%chance that the cost-effectiveness is < £1600per life-year gained
Other sensitivity analysesassumed a 50% increasein costs under metformintreatment (ICER = £948),a 50% decrease in costs(cost savings of £942) anddoubling of costs ofmetformin itself (costsaving of £106). Resultswere robust for Tobit orPoisson estimation
Authors conclude that“cost savings are largelydue to the lower hospitalin-patient costs incurredsecondary to the majorreduction in the risk ofmyocardial infarction forpatients on metformin”,but indicate that they arenot sure of themechanism that leads tothis result
They postulate there arelikely reductions inindirect costs andincreases in intangiblebenefits not measured intheir study

Health Technology Assessment 2004; Vol. 8: No. 21
429
© Queen’s Printer and Controller of HMSO 2004. All rights reserved.
Appendix 33
Data extraction table for economic evaluations: surgery
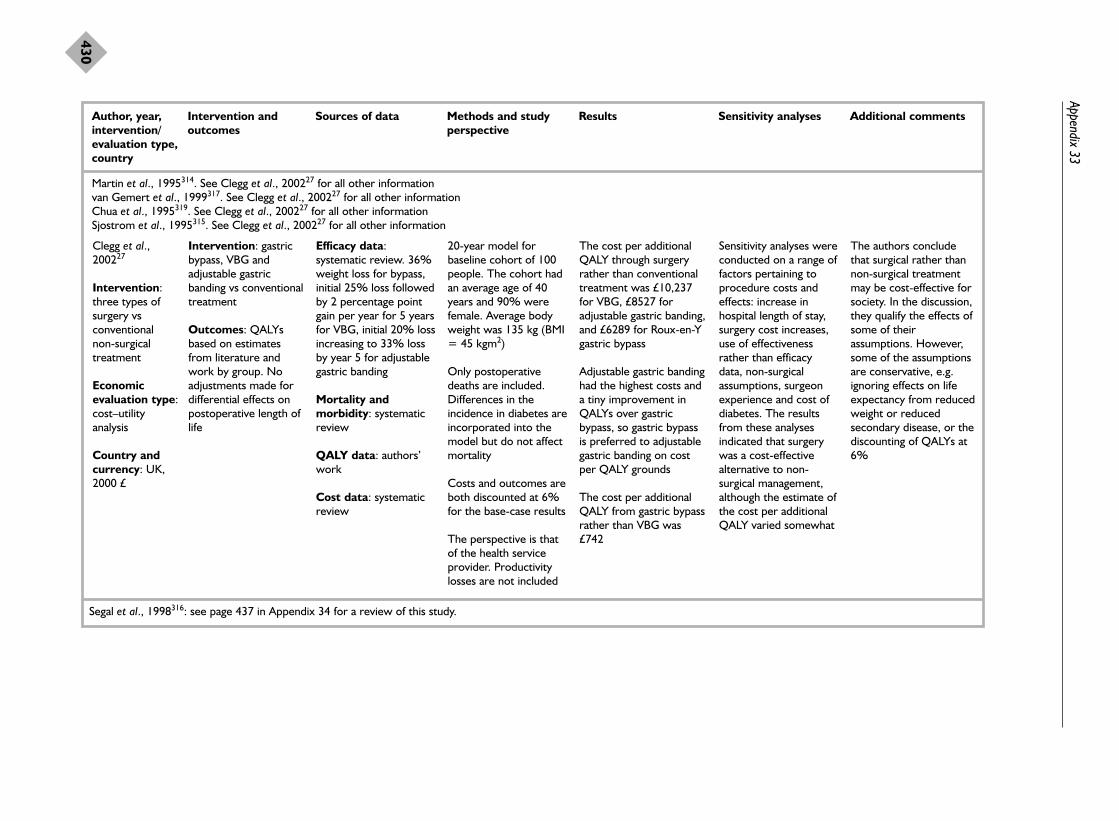
Appendix 33
430
Author, year, Intervention and Sources of data Methods and study Results Sensitivity analyses Additional commentsintervention/ outcomes perspectiveevaluation type, country
Martin et al., 1995314. See Clegg et al., 200227 for all other informationvan Gemert et al., 1999317. See Clegg et al., 200227 for all other informationChua et al., 1995319. See Clegg et al., 200227 for all other informationSjostrom et al., 1995315. See Clegg et al., 200227 for all other information
Clegg et al.,200227
Intervention:three types ofsurgery vsconventional non-surgicaltreatment
Economicevaluation type:cost–utilityanalysis
Country andcurrency: UK,2000 £
Segal et al., 1998316: see page 437 in Appendix 34 for a review of this study.
Intervention: gastricbypass, VBG andadjustable gastricbanding vs conventionaltreatment
Outcomes: QALYsbased on estimatesfrom literature andwork by group. Noadjustments made fordifferential effects onpostoperative length oflife
Efficacy data:systematic review. 36%weight loss for bypass,initial 25% loss followedby 2 percentage pointgain per year for 5 yearsfor VBG, initial 20% lossincreasing to 33% lossby year 5 for adjustablegastric banding
Mortality andmorbidity: systematicreview
QALY data: authors’work
Cost data: systematicreview
20-year model forbaseline cohort of 100people. The cohort hadan average age of 40years and 90% werefemale. Average bodyweight was 135 kg (BMI= 45 kgm2)
Only postoperativedeaths are included.Differences in theincidence in diabetes areincorporated into themodel but do not affectmortality
Costs and outcomes areboth discounted at 6%for the base-case results
The perspective is thatof the health serviceprovider. Productivitylosses are not included
The cost per additionalQALY through surgeryrather than conventionaltreatment was £10,237for VBG, £8527 foradjustable gastric banding,and £6289 for Roux-en-Ygastric bypass
Adjustable gastric bandinghad the highest costs anda tiny improvement inQALYs over gastricbypass, so gastric bypassis preferred to adjustablegastric banding on costper QALY grounds
The cost per additionalQALY from gastric bypassrather than VBG was£742
Sensitivity analyses wereconducted on a range offactors pertaining toprocedure costs andeffects: increase inhospital length of stay,surgery cost increases,use of effectivenessrather than efficacydata, non-surgicalassumptions, surgeonexperience and cost ofdiabetes. The resultsfrom these analysesindicated that surgerywas a cost-effectivealternative to non-surgical management,although the estimate ofthe cost per additionalQALY varied somewhat
The authors concludethat surgical rather thannon-surgical treatmentmay be cost-effective forsociety. In the discussion,they qualify the effects ofsome of theirassumptions. However,some of the assumptionsare conservative, e.g.ignoring effects on lifeexpectancy from reducedweight or reducedsecondary disease, or thediscounting of QALYs at6%

Health Technology Assessm
ent2004; Vol. 8: No. 21
431
© Q
ueen’s Printer and Controller of H
MSO
2004. All rights reserved.
Author, year, Intervention and Sources of data Methods and study Results Sensitivity analyses Additional commentsintervention/ outcomes perspectiveevaluation type, country
Nguyen et al.,2001310
Intervention:laparoscopic vsopen gastricbypass
Economicevaluation type:cost–utilityanalysis
Country andcurrency: USA,1999 to 2001US$
SF-36, Short Form 36; BAROS, Bariatic Analysis and Reporting Outcome System.
Intervention: fromMay 1999 to March2001, 155 patients withBMI of 40–60 kg/m2
were randomlyassigned to undergolaparascopic or opengastric bypass
Outcomes:postoperativeanastomotic leak,wound-relatedcomplications, lateanastomotic strictureand weight loss at 1 year. Also measuredresource use duringhospitalisation, time toreturn to activities ofdaily living, and QoL asmeasured by SF-36scores and BAROSoutcome
Efficacy data: trial data
Quality of life data:postsurgery surveysusing establishedmeasures
Cost data: patientrecords of hospital data.Costs were estimatedusing the University ofCalifornia, Davis,Medical Center’sdecision support systemdatabase. Noinformation aboutdetermination ofindirect costs wasprovided
Methods: the analysiswas on an ITT basis(laparoscopic operationsthat were converted toopen gastric bypasswere analysed aslaparoscopic)
The method ofmeasuring indirect costswas not indicated,although presumably itwas calculated based onquestions pertaining totime to return to work
Discounting was notused, as the maximumfollow-up period was 1 year. The year of thecost data is not clearlyindicated, and it seemslikely that costs may notbe adjusted for inflation
Study perspective:social, due to inclusionof direct health servicecosts as well as indirectcosts due to lostproductivity
Costs: laparoscopicsurgery had higheroperating costs but lowerlength of hospital stay.There were no significantdifferences in directhealth service costs,indirect or total costs
Outcomes: the total rateof major, minor and latecomplications did not varybetween the treatments.Mean percentage ofexcess body weight lostwas significantly greater at 1-year follow-up forlaparoscopic patients atinterim points (e.g. duringthe first and third monthsafter surgery), but wasnot significantly differentat 1 year followingsurgery
ICER: incremental cost-effectiveness calculationswere not provided. Costswere not significantlydifferent, and thelaparoscopic procedureresulted in significantlygreater weight loss aswell as some benefit inQoL measures during therecovery period
Although statistical testswere conducted for allcomparisons in costsand outcome measures,no sensitivity analyseswere conducted aboutany of the assumptions
Although the number ofmajor complications wasnot statistically differentbetween the twoprocedures, it is notablethat laparascopic gastricbypass resulted in fewerintensive care unit stays,shorter hospital stays,faster recoveries and anearlier return to workthan did open surgery. Noeffort was made todetermine the implicationof these differences onQALYs, and the measuredQoL differencesdisappeared by the end ofthe year


Health Technology Assessment 2004; Vol. 8: No. 21
433
© Queen’s Printer and Controller of HMSO 2004. All rights reserved.
Appendix 34
Data extraction table for economic evaluations: lifestyle interventions

Author, year, Intervention and Sources of data Methods and study Results Sensitivity analyses Additional commentsintervention/ outcomes perspectiveevaluation type, country
Johannesson et al., 1992318
Intervention:diet vs drugtreatment forhypertension inobese men
Economicevaluation type:cost-effectivenessanalysis andcost–benefitanalysis
Country andcurrency: Sweden, 1992Swedish crowns(SEK)
continued
Interventions: thedrug intervention was astepped-care approachwith atenolol as thedrug of first choice;diet. 64 men wererandomised and 61completed the study.Follow-up was for 1 year
Outcome: life-yearssaved
Efficacy data:measurements on trialpatients and data fromFramingham study forstroke and coronarydisease risk factors
Cost data: costsincluded treatmentcosts minus saved costsof cardiovascularmorbidity. Indirect costswere included
Methods: used acomputer simulationmodel based on theFramingham logistic riskequations for stroke andCHD. Due to studydesign, it was notpossible to base thecost-effectivenessanalysis upon observedrisk reduction, so asimulation approach wasused. Five simulationswere carried out basedon a 54-year-old man atentry. LDL cholesteroland triglycerides werenot included since it isuncertain whether theserisk factors affect therisk for CVD aftertaking account of thechanges in totalcholesterol and HDLcholesterol
Costs were discountedat 5%. Outcomes wereonly discounted as partof the sensitivity analysis
Study perspective:societal perspective, asdirect and indirect costswere included
Costs: total treatmentcost was approximatelySEK 8300 for the dietgroup and SEK 7900 forthe drug treatment group
Outcomes: after 1 year,the diet group lost 7.6 ±SD 3.1 kg while the druggroup gained 0.9 ± SD2.3 kg. DBP and HDLcholesterol had bothdecreased significantly indrug group relative todiet group
ICER: in 3 simulations thedrug treatment was costsaving, with greater effectat lower total cost. In 2simulations the diettreatment was cost-effective. Both of thesesimulations had the samechange in (expected orhalf of expected) for DBPand total cholesterol, andHDL changes led to areduced risk of CHD.ICER for additional life-year saved from diet vsdrug ranged from 46 to205 K Swedish crowns
Sensitivity analyses wereperformed using onlydirect costs andalternative discountingapproaches
In a cost–benefitanalysis, it was indicatedthat both treatmentsresulted in a losscompared with notreatment, but that thedifference between thetreatments wasnegligible
The authors concludethat non-pharmacologicaltreatment may be lesscost-effective than drugtreatment, but that morestudies and furthermethodologicaldevelopment are needed
Appendix 34
434

Health Technology Assessm
ent2004; Vol. 8: No. 21
435
© Q
ueen’s Printer and Controller of H
MSO
2004. All rights reserved.
Author, year, Intervention and Sources of data Methods and study Results Sensitivity analyses Additional commentsintervention/ outcomes perspectiveevaluation type, country
Kaplan et al.,1987178
Kaplan et al.,1988311
Intervention:diet andbehaviourtherapy, exerciseand behaviourtherapy, diet andexercise andbehaviourtherapy, orcontrol educationabout diabetes
Economicevaluation type:cost-utilityanalysis
Country andcurrency: USA,1986 $
continued
Intervention: 76obese non-insulindependent diabeticswere randomised tothe four treatmentgroups. Each groupreceived 10 weeklyeducation sessionsabout techniquesrelated to theintervention. The dietwas an exchange diet(1200 calories perday). Exerciserecommendationswere based on agraded exercise test
Outcomes: paperreports on HbA1c,weight, and quality oflife at 18 monthsfollow-up. Quality oflife was measuredusing the quality ofwell-being scale
Efficacy data: data werecollected at 3, 6, 12, and18 months followingbaseline
Cost data: estimatedusing 1986 clinicalcharges in the San Diegocommunity. Treatmentcosts include charges forhistory and physical,laboratory work,sessions, and medicalconsultations. Indirectcosts were notconsidered
Methods: change scoreswere used (i.e., measureat follow-up minusmeasure at baseline)using the method ofplanned comparison. (Itis not clear if this meansby intention to treat.) 6 patients dropped out.
Aside from interventiontreatment costs, the onlyother health service usethat was tracked wasmedication use
Costs and effects werenot discounted
Study perspective:health care purchaser(direct health servicecosts)
Costs: the costs of thediet and exercise andbehaviour therapyprogramme wereestimated at US$1000 –changes in medicationuse were not significantlydifferent between thegroup
Effects: diet andbehaviour therapy grouplost the most weight, butall lost, weight among allgroups was regained bythe 18 month follow-up– reduction in HbA1c at 18 months was greatestfor the combined dietand exercise andbehaviour therapy group(p < 0.10) – the increasein QALY for diet andexercise and behaviourtherapy versus controleducation at 18 monthswas 0.092 (p < 0.05) –the diet and behaviourtherapy group also had astatistically significantimprovement of 0.07units in quality of well-being
ICER: US$10,870 perwell life year
No formal sensitivityanalyses of theassumptions wereconducted in Kaplan1987
With respect to changesin the quality of life, thestudy did report that in“planned comparisons”the combined treatmentgroup and the diet andbehaviour therapygroup improvements inquality of life weresignificantly greater thanthe control groupimprovements
Kaplan 1988 conducteda sensitivity analysisaccording toeffectiveness ofintervention andduration of benefit andfound a range ofestimates fromUS$4,503 to US$18,011per additional well yearof life
The authors concludethat benefits in terms ofquality of life and HbA1cappear to be independentof weight loss
Small sample of self-referred individuals maylimit generalisability. Butanalysis is conservative inthat it assumes thatbenefits do not extendbeyond 18 month follow-up and if anything thecontrol group may havehad higher other healthcare costs due to lack ofimprovement in HbA1c

Appendix 34
436
Author, year, Intervention and Sources of data Methods and study Results Sensitivity analyses Additional commentsintervention/ outcomes perspectiveevaluation type, country
Salkeld et al.,1997312
Intervention:two lifestyleinterventionsadministered ingeneral practice
Economicevaluation type:cost–utilityanalysis
Country andcurrency:Australia, 1994Aus$
continued
Interventions: 2interventions (a videoand a video pluswritten self-helpmaterials) werecompared with routinecare in generalpractice. 755participants wererecruited to the study ifthey had one or moreof a set ofcardiovascular riskfactors (totalcholesterol, BMI> 25 kg/m2, currentsmoker, elevated BP).Average BMI was30 kg/m2
Outcomes: life-yearssaved and QALYsgained
Efficacy data: trial datawere collected during1990 and 1991
Effectiveness datarelated to mortality riskafter an MI or strokeand QoL after CHDwere from publishedand unpublished studiesin 1994 and 1995
Cost data: estimatedcosts of interventions,including estimatedchanges inpharmaceutical use.Costs of treating CHDevents were based ondata for MI patientsfrom the AustralianGUSTO trial. Indirectcosts related toproduction losses werealso obtained from theGUSTO trial
Methods: the economicevaluation used acomputer simulationmodel based on riskequations for CHD andstroke from theFramingham heart study.Lifetime costs andeffects of theintervention aremodelled
Costs and benefits werediscounted at 5% peryear
Study perspective:societal perspective
Costs: total discounted(net?) lifetime costs areindicated to be Aus$286and Aus$322 for malesand females in the videoplus self-help group, andAus$107 for males in thehigh-risk group
Outcomes: the full studysample had no benefit inlife-years saved or QALYsin the video group, and anegligible improvement inthe video plus self-helpgroup. A subgroup ofhigh-risk individuals (DBP>95 mmHg or totalcholesterol >6.5 mmol/l)had negligibleimprovement amongmales from the video
ICER: negligibleimprovements inoutcomes made ICERsvery high: Aus$152,128per QALY for males fromvideo, >Aus$11 millionfor females from videoplus self-help, Aus$29,574per QALY for high-riskmales from video
Sensitivity analyses wereperformed on estimatedcosts of productivitylosses and onmaintenance ofbehaviour changethrough time
The authors found thateliminating theproductivity lossesadded Aus$11,000 perlife-year saved orAus$9,000 per QALY, soit lowered the cost-effectiveness only by asmall amount. Thesecond sensitivityanalysis assuming thatthe changes in riskfactors persisted for 2years improved thecost-effectivenessconsiderably from thevideo for high-riskmales, to an ICER ofAus$5,789 per life-yearsaved and Aus$4,342per additional QALY
Possible mistake in Table 4. How can gain inQALYs for males begreater than gain in lifeexpectancy for malesfrom video?
Follow-up time was veryshort, and authorsstressed that long-termfollow-up was necessaryto reduce uncertainty ofresults. However, withoutreinforcement it isunlikely that cost-effectiveness couldimprove
Subgroup analysis usingdata for just obeseparticipants was notperformed but wouldhave been relevant forthis report. However,average baseline BMI washigh

Health Technology Assessm
ent2004; Vol. 8: No. 21
437
© Q
ueen’s Printer and Controller of H
MSO
2004. All rights reserved.
Author, year, Intervention and Sources of data Methods and study Results Sensitivity analyses Additional commentsintervention/ outcomes perspectiveevaluation type, country
Segal et al.,1998316
Intervention:range ofinterventions forprimaryprevention oftype 2 diabetes
Economicevaluation type:cost-effectivenessanalysis
Country andcurrency:Australia, 1997Aus$
continued
Interventions: (I) intensive diet andbehaviouralmodification targetedtowards all seriouslyobese; (II) intensivediet and behaviouralmodification forwomen with previousgestational diabetes;(III) gastric bypasssurgery for seriouslyobese; (IV) groupbehaviouralmodification foroverweight and obesemen; (V) GP advice forhigh-risk adults (e.g.BMI > 27 kg/m2); (VI) media campaignwith communitysupport targeted atgeneral population andoverweight adults
Comparison was withno intervention (NGTor standard care withIGT)
Outcomes: reductionin diabetes years, andlife-years saved
Efficacy data: non-systematic review of theliterature, with apreference for RCTs withat least 5 years of follow-up, recorded impact onweight and diabetesstatus, and opinion ofresearch team whereevidence was lacking
Prevalence, morbidityand mortality data:non-systematic review ofthe literature
Cost data: interventioncosts were constructedby determiningprogramme resourcesand then applying unitcosts, except for thegroup programme foroverweight men, whichwas measured as thecost of a commercialprogramme. Healthservice use costs formanagement of diabeteswere measured using anAustralian survey ofhospital costs and theCommonwealth MedicalBenefits Schedule. Mediaeffort costed for a regionof 4 million people
Methods: a Markovapproach was used tomodel diabetic state andsurvival for a 25-yearpostintervention period.Specific states werenormal glucosetolerance, impairedglucose tolerance orNIDDM
Data on 5-year transitionprobabilities betweenstates, annual mortalityfor men adjusted formetabolic state, andannual mortality for menadjusted for overweightwere used
Key parameters areprovided, including %successful under eachintervention, reducedincidence of NIDDM,and mortality relativerisk
Costs and benefits werediscounted at 5%
Results are provided formixed population (NGTand IGT) and IGT only
Study perspective:healthcare purchaser
Programme costs: (I) AUS$2500; (II) AUS$2500; (III) AUS$15,580; (IV) AUS$195 + screeningcost of AUS$382 per casefound; (V) AUS$420 +screening cost ofAUS$53; (VI) AUS$2million for community of4.5 million people
Downstream cost savingsfor people who do notdevelop NIDDM wereestimated atAus$1800/year
Outcomes: surgery forthe seriously obesereduced diabetes yearsthe most and saved themost life-years
ICER (base case): groupbehavioural therapy andmedia campaign for thegeneral public had costsavings. The diet,behavioural and GPprogrammes had ICERsof Aus$1000–2600.Surgery for severelyobese had an ICER ofAus$12,300 unlesstargeted to IGT patients(ICER = Aus$4600)
Sensitivity analyses wereconducted on theprogrammeeffectiveness parameterfor all interventions.While the estimatedICER fluctuated orchanged to reflect costsavings in some cases,the greatest change inthe ICER was about a50% increase
Additional sensitivityanalyses were alsoconducted for thebehavioural modificationprogramme for theseriously obese. Theseincluded variation in thediscount rate,programme cost, effectof success on incidenceof NIDDM, lifeexpectancy and baselinerisk status
In the effectivenessresults, no consistentrelationship betweenreduction in diabetes life-years and life-years gainedis observed; the authorsspeculate that this isbecause life-years gainedreflects all-cause mortalityas a function of obesity aswell as diabetic state, andaverage excess weightand success vary acrossthe programmes
The authors make thevery useful point that thepopulation at risk of type2 diabetes often does nothave access to the level ofresources available totreat type 2 diabetes
The authors maintain thatthe level of downstreamhealth savings is anunderestimate becausesome costs to diabetics aswell as costs of otherdiseases caused byobesity have not beenincluded


Health Technology Assessment 2004; Vol. 8: No. 21
439
© Queen’s Printer and Controller of HMSO 2004. All rights reserved.
Appendix 35
Quality assessment table for economic evaluations: pharmacological interventions
Intervention Orlistat Orlistat Sibutramine Metformin
Economic evaluation: first author and year Foxcroft, 1999308 Lamotte, 2002312 BASF Pharma/ Clarke, 200187
Knoll, 2000
Systematic review assessing quality (if applicable) O’Meara, 200125 NA O’Meara, 200226 NA
Quality component
Well-defined question Yes Yes Yes Yes
Comprehensive description of alternatives Yes Not clear Yes Yes
Effectiveness established Yes Yes Not clear Yes
Relevant costs and consequences identified Yes Yes Yes Yes
Costs and consequences measured accurately Yes Yes Yes Yes
Costs and consequences valued credibly Yes Yes Yes Yes
Costs and consequences adjusted for differential No Yes Yes Yestiming
Incremental analysis of costs and consequences Yes Yes No Yes
Allowance made for uncertainty in estimates of Yes Yes Yes Yescosts and consequences
Results/discussion included all issues of concern Yes Yes Yes Yesto users

Health Technology Assessment 2004; Vol. 8: No. 21
441
© Queen’s Printer and Controller of HMSO 2004. All rights reserved.
Appendix 36
Quality assessment table for economic evaluations: surgical intervention for obese or
morbidly obese patients

Appendix 36
442
Intervention Roux-en-Y VBG vs Laparoscopic Gastric banding vs Gastric bypass, Laparoscopic gastric bypass no treatment VBG vs VBG vs VBG, adjustable vs open vs VLCD open gastric open gastric gastric banding gastric bypass
bypass bypass vs and non-surgical conventional treatmenttreatment
Economic evaluation: first author and year Martin, 1995314 van Gemert, Chua, 1995319 Sjostrom, 1995315 Clegg, 200227 Nguyen, 2001310
1999317
Systematic review assessing quality (if applicable) Clegg, 200227 Clegg, 200227 Clegg, 200227 Clegg, 200227 NA NA
Quality component
Well-defined question Yes Yes Yes Yes Yes Yes
Comprehensive description of alternatives Yes Yes Yes Yes Yes except non-surgical Yes
Effectiveness established Yes Yes Yes Yes Yes Yes
Relevant costs and consequences identified No No No No Yes Partial
Costs and consequences measured accurately Yes (where Yes (where Yes (where Yes (where Yes Yes (where measured) measured) measured) measured) measured)
Costs and consequences valued credibly Yes (direct costs) Yes (direct costs) Yes (direct costs) Yes (direct costs) Yes Partial
Costs and consequences adjusted for differential timing No Yes No No Yes NA
Incremental analysis of costs and consequences No Yes No No Yes No
Allowance made for uncertainty in estimates of costs No No No No Yes Yesand consequences
Results/discussion included all issues of concern Unclear Unclear Unclear Unclear Yes Yesto users
The study by Segal and colleagues316 that included surgery is assessed in Appendix 34.

Health Technology Assessment 2004; Vol. 8: No. 21
443
© Queen’s Printer and Controller of HMSO 2004. All rights reserved.
Appendix 37
Quality assessment table for economic evaluations: lifestyle interventions

Appendix 37
444
Intervention Diet and behaviour Diet vs drug Video and video Six interventions therapy, exercise (atenolol) treatment plus self-help involving diet, and behaviour for hypertension in materials vs nothing behavioural therapy, diet and obese men for general practice modification and exercise and behaviour patients at high surgerytherapy, vs education risk of CVDon diabetes
Economic evaluation: first author and year Kaplan, 1987178 Johannesson, 1992318 Salkeld, 1997312 Segal, 1998316
Kaplan, 1988311
Systematic review assessing quality (if applicable) NA NA NA NA
Quality component
Well-defined question Yes Yes Yes Yes
Comprehensive description of alternatives Yes Yes Yes Yes
Effectiveness established Yes Limited Limited Not clear
Relevant costs and consequences identified Partial Yes Yes Not clear
Costs and consequences measured accurately Yes (where measured) Yes Yes Not clear
Costs and consequences valued credibly Yes Yes Yes Yes
Costs and consequences adjusted for differential timing No Yes Yes Yes
Incremental analysis of costs and consequences Yes Yes Yes Yes
Allowance made for uncertainty in estimates of costs and consequences Partial Partial Partial Yes
Results/discussion included all issues of concern to users Yes Yes Yes Yes

Health Technology Assessment 2004; Vol. 8: No. 21
445
© Queen’s Printer and Controller of HMSO 2004. All rights reserved.
Appendix 38
DATA 4.0 tree for base-case Markov model

Appendix 38
446
IGT
1
--- Markov InformationInit Cost: (IntCostY1+NoDiabCost)/2Incr Cost: UtilDiscount(IntCostY2+NoDiabCost;.06;_stage)Final Cost: 0Init Eff: .48Incr Eff: UtilDiscount(qalynodiab;.015;_stage)Final Eff: 0
Diabetes onset
0
--- Markov InformationInit Cost: 0Incr Cost: UtilDiscount(IntCostY2+1.5*DiabCost;.06;_stage)Final Cost: 0Init Eff: 0Incr Eff: UtilDiscount(qalydiab;.015;_stage)Final Eff: 0
Diabetes (continuing)
0
--- Markov InformationInit Cost: 0Incr Cost: UtilDiscount(IntCostY2+DiabCost;.06;_stage)Final Cost: 0Init Eff: 0Incr Eff: UtilDiscount(qalydiab;.015;_stage)Final Eff: 0
Die
0
--- Markov InformationInit Cost: 0Incr Cost: 3*DiabCostFinal Cost: 0Init Eff: 0Incr Eff: 0Final Eff: 0
Diet & exercise --- Markov InformationTerm C/E: _stage > futime
IGT
1
--- Markov InformationInit Cost: NoDiabCost/2Incr Cost: UtilDiscount(NoDiabCost;.06;_stage)Final Cost: 0Init Eff: .48Incr Eff: UtilDiscount(qalynodiab;.015;_stage)Final Eff: 0
Diabetes onset
0
--- Markov InformationInit Cost: 0Incr Cost: UtilDiscount(1.5*DiabCost;.06;_stage)Final Cost: 0Init Eff: 0Incr Eff: UtilDiscount(qalydiab;.015;_stage)Final Eff: 0
Diabetes (continuing)
0
--- Markov InformationInit Cost: 0Incr Cost: UtilDiscount(DiabCost;.06;_stage)Final Cost: 0Init Eff: 0Incr Eff: UtilDiscount(qalydiab;.015;_stage)Final Eff: 0
Dead
0
--- Markov InformationInit Cost: 0Incr Cost: 3*DiabCostFinal Cost: 0Init Eff: 0Incr Eff: 0Final Eff: 0
No Intervention --- Markov InformationTerm C/E: _stage > futime
Treatment Optionsage=start_age+_stageDiabCost=1505futime=15IntCostY1=324IntCostY2=178 .NoDiabCost=DiabCost/2.4PropMale=0.33qalydiab=0.900qalynodiab=0.960start_age=55
Survive
DiePropMale*(tNoDiabACMort[start_age+_stage;1])+(1-PropMale)*(tNoDiabACMort[Start_age+_stage;2])
Survive
DiePropMale*(tDiabACMort[start_age+_stage;1])+(1-PropMale)*(tDiabACMort[Start_age+_stage;2])
Survive
DiePropMale*(tDiabACMort[start_age+_stage;1])+(1-PropMale)*(tDiabACMort[Start_age+_stage;2])
Survive
DiePropMale*(tNoDiabACMort[start_age+_stage;1])+(1-PropMale)*(tNoDiabACMort[Start_age+_stage;2])
Survive
DiePropMale*(tDiabACMort[start_age+_stage;1])+(1-PropMale)*(tDiabACMort[Start_age+_stage;2])
Survive
DiePropMale*(tDiabACMort[start_age+_stage;1])+(1-PropMale)*(tDiabACMort[Start_age+_stage;2])
#
#
#
#
#
#
Stay IGT#
Onset of diabetestToDiabInt[_stage]
Stay diabetic#
Improve to IGT.01
Stay diabetic#
Improve to IGT.01
IGT
Diabetes onset
Diabetes (continuing)
Diabetes (continuing)
Diabetes (continuing)
Diabetes (continuing)
IGT
IGT
Diabetes onset
Die
Di
Di
e
e
Stay IGT#
IGT
Onset of diabetestToDiabCon[_stage]
Dead
Stay diabetic#
Improve to IGT.01
IGTDead
Stay diabetic#
Improve to IGT.01
IGTDead
M
M

This version of HTA monograph volume 8, number 21 does not include the 264 pages of appendices. This is to save download time from the HTA website. The printed version of this monograph also excludes the appendices. View/download the appendices (1.01 mbytes).

Health Technology Assessment 2004; Vol. 8: No. 21
455
Health Technology AssessmentProgramme
Prioritisation Strategy GroupMembers
Chair,Professor Tom Walley, Director, NHS HTA Programme,Department of Pharmacology &Therapeutics,University of Liverpool
Professor Bruce Campbell,Consultant Vascular & GeneralSurgeon, Royal Devon & ExeterHospital
Professor Shah Ebrahim,Professor in Epidemiology of Ageing, University of Bristol
Dr John Reynolds, ClinicalDirector, Acute GeneralMedicine SDU, RadcliffeHospital, Oxford
Dr Ron Zimmern, Director,Public Health Genetics Unit,Strangeways ResearchLaboratories, Cambridge
HTA Commissioning BoardMembers
Programme Director, Professor Tom Walley, Director, NHS HTA Programme,Department of Pharmacology &Therapeutics,University of Liverpool
Chair,Professor Shah Ebrahim,Professor in Epidemiology ofAgeing, Department of SocialMedicine, University of Bristol
Deputy Chair, Professor Jenny Hewison,Professor of Health CarePsychology, Academic Unit ofPsychiatry and BehaviouralSciences, University of LeedsSchool of Medicine
Dr Jeffrey AronsonReader in ClinicalPharmacology, Department ofClinical Pharmacology,Radcliffe Infirmary, Oxford
Professor Ann Bowling,Professor of Health ServicesResearch, Primary Care andPopulation Studies,University College London
Professor Andrew Bradbury,Professor of Vascular Surgery,Department of Vascular Surgery,Birmingham HeartlandsHospital
Professor John Brazier, Directorof Health Economics, Sheffield Health EconomicsGroup, School of Health &Related Research, University of Sheffield
Dr Andrew Briggs, PublicHealth Career Scientist, HealthEconomics Research Centre,University of Oxford
Professor Nicky Cullum,Director of Centre for EvidenceBased Nursing, Department ofHealth Sciences, University ofYork
Dr Andrew Farmer, SeniorLecturer in General Practice,Department of Primary HealthCare, University of Oxford
Professor Fiona J Gilbert,Professor of Radiology,Department of Radiology,University of Aberdeen
Professor Adrian Grant,Director, Health ServicesResearch Unit, University ofAberdeen
Professor F D Richard Hobbs,Professor of Primary Care &General Practice, Department ofPrimary Care & GeneralPractice, University ofBirmingham
Professor Peter Jones, Head ofDepartment, UniversityDepartment of Psychiatry,University of Cambridge
Professor Sallie Lamb, ResearchProfessor in Physiotherapy/Co-Director, InterdisciplinaryResearch Centre in Health,Coventry University
Professor Julian Little,Professor of Epidemiology,Department of Medicine andTherapeutics, University ofAberdeen
Professor Stuart Logan,Director of Health & SocialCare Research, The PeninsulaMedical School, Universities ofExeter & Plymouth
Professor Tim Peters, Professorof Primary Care Health ServicesResearch, Division of PrimaryHealth Care, University ofBristol
Professor Ian Roberts, Professorof Epidemiology & PublicHealth, Intervention ResearchUnit, London School ofHygiene and Tropical Medicine
Professor Peter Sandercock,Professor of Medical Neurology,Department of ClinicalNeurosciences, University ofEdinburgh
Professor Mark Sculpher,Professor of Health Economics,Centre for Health Economics,Institute for Research in theSocial Services, University of York
Professor Martin Severs,Professor in Elderly HealthCare, Portsmouth Institute ofMedicine
Dr Jonathan Shapiro, SeniorFellow, Health ServicesManagement Centre,Birmingham
Ms Kate Thomas,Deputy Director,Medical Care Research Unit,University of Sheffield
Professor Simon G Thompson,Director, MRC BiostatisticsUnit, Institute of Public Health,Cambridge
Ms Sue Ziebland,Senior Research Fellow,Cancer Research UK,University of Oxford
Current and past membership details of all HTA ‘committees’ are available from the HTA website (www.ncchta.org)
© Queen’s Printer and Controller of HMSO 2004. All rights reserved.
Health Technology Assessment Programme
456
Diagnostic Technologies & Screening PanelMembers
Chair,Dr Ron Zimmern, Director ofthe Public Health Genetics Unit,Strangeways ResearchLaboratories, Cambridge
Ms Norma Armston,Freelance Consumer Advocate,Bolton
Professor Max BachmannProfessor Health Care Interfaces, Department of Health Policy and Practice,University of East Anglia
Professor Rudy BilousProfessor of Clinical Medicine &Consultant Physician,The Academic Centre,South Tees Hospitals NHS Trust
Dr Paul Cockcroft, Consultant MedicalMicrobiologist/LaboratoryDirector, Public HealthLaboratory, St Mary’s Hospital, Portsmouth
Professor Adrian K Dixon,Professor of Radiology,Addenbrooke’s Hospital,Cambridge
Dr David Elliman, Consultant in Community Child Health, London
Professor Glyn Elwyn,Primary Medical Care Research Group,Swansea Clinical School,University of WalesSwansea
Dr John Fielding,Consultant Radiologist,Radiology Department,Royal Shrewsbury Hospital
Dr Karen N Foster, ClinicalLecturer, Dept of GeneralPractice & Primary Care,University of Aberdeen
Professor Antony J Franks,Deputy Medical Director, The Leeds Teaching HospitalsNHS Trust
Mr Tam Fry, HonoraryChairman, Child GrowthFoundation, London
Dr Edmund Jessop,Medical Adviser,National SpecialistCommissioning Advisory Group(NSCAG), Department ofHealth, London
Dr Jennifer J Kurinczuk,Consultant ClinicalEpidemiologist,National PerinatalEpidemiology Unit,Oxford
Dr Susanne M Ludgate, MedicalDirector, Medical DevicesAgency, London
Dr William Rosenberg, SeniorLecturer and Consultant inMedicine, University ofSouthampton
Dr Susan Schonfield, CPHMSpecialised ServicesCommissioning, CroydonPrimary Care Trust
Dr Margaret Somerville,Director of Public Health,Teignbridge Primary Care Trust
Professor Lindsay WilsonTurnbull, Scientific Director,Centre for MR Investigations &YCR Professor of Radiology,University of Hull
Professor Martin J Whittle,Head of Division ofReproductive & Child Health,University of Birmingham
Dr Dennis Wright, ConsultantBiochemist & Clinical Director,Pathology & The KennedyGalton Centre, Northwick Park& St Mark’s Hospitals, Harrow
Pharmaceuticals PanelMembers
Chair,Dr John Reynolds, ClinicalDirector, Acute GeneralMedicine SDU, OxfordRadcliffe Hospital
Professor Tony Avery, Professor of Primary HealthCare, University of Nottingham
Professor Stirling Bryan,Professor of Health Economics,Health Services Management Centre,University of Birmingham
Mr Peter Cardy, ChiefExecutive, Macmillan CancerRelief, London
Dr Christopher Cates, GP andCochrane Editor, Bushey HealthCentre
Professor Imti Choonara,Professor in Child Health,University of Nottingham,Derbyshire Children’s Hospital
Mr Charles Dobson, SpecialProjects Adviser, Department ofHealth
Dr Robin Ferner, ConsultantPhysician and Director, WestMidlands Centre for AdverseDrug Reactions, City HospitalNHS Trust, Birmingham
Dr Karen A Fitzgerald,Pharmaceutical Adviser, Bro TafHealth Authority, Cardiff
Mrs Sharon Hart, ManagingEditor, Drug & TherapeuticsBulletin, London
Dr Christine Hine, Consultant inPublic Health Medicine, Bristol South & West PrimaryCare Trust
Professor Stan Kaye,Professor of Medical Oncology,Consultant in MedicalOncology/Drug Development,The Royal Marsden Hospital
Ms Barbara Meredith,Project Manager ClinicalGuidelines, Patient InvolvementUnit, NICE
Dr Frances Rotblat, CPMPDelegate, Medicines ControlAgency, London
Professor Jan Scott,Professor of PsychologicalTreatments,Institute of Psychiatry,University of London
Mrs Katrina Simister, NewProducts Manager, NationalPrescribing Centre, Liverpool
Dr Richard Tiner, MedicalDirector, Association of theBritish Pharmaceutical Industry
Dr Helen Williams,Consultant Microbiologist,Norfolk & Norwich UniversityHospital NHS Trust
Current and past membership details of all HTA ‘committees’ are available from the HTA website (www.ncchta.org)

Health Technology Assessment 2004; Vol. 8: No. 21
457
Therapeutic Procedures PanelMembers
Chair, Professor Bruce Campbell,Consultant Vascular andGeneral Surgeon, Royal Devon& Exeter Hospital
Dr Mahmood Adil, Head ofClinical Support & HealthProtection, Directorate ofHealth and Social Care (North),Department of Health,Manchester
Dr Aileen Clarke,Reader in Health ServicesResearch, Public Health &Policy Research Unit,Barts & the London School ofMedicine & Dentistry,Institute of Community HealthSciences, Queen Mary,University of London
Mr Matthew William Cooke,Senior Clinical Lecturer andHonorary Consultant,Emergency Department,University of Warwick, Coventry& Warwickshire NHS Trust,Division of Health in theCommunity, Centre for PrimaryHealth Care Studies, Coventry
Dr Carl E Counsell, SeniorLecturer in Neurology,University of Aberdeen
Dr Keith Dodd, ConsultantPaediatrician, DerbyshireChildren’s Hospital
Professor Gene Feder, Professorof Primary Care R&D, Barts &the London, Queen Mary’sSchool of Medicine andDentistry, University of London
Professor Paul Gregg,Professor of OrthopaedicSurgical Science, Department ofOrthopaedic Surgery,South Tees Hospital NHS Trust
Ms Bec Hanley, FreelanceConsumer Advocate,Hurstpierpoint
Ms Maryann L. Hardy,Lecturer, Division of Radiography,University of Bradford
Professor Alan Horwich,Director of Clinical R&D, TheInstitute of Cancer Research,London
Dr Phillip Leech, PrincipalMedical Officer for PrimaryCare, Department of Health,London
Dr Simon de Lusignan,Senior Lecturer, Primary CareInformatics, Department ofCommunity Health Sciences,St George’s Hospital MedicalSchool, London
Dr Mike McGovern, SeniorMedical Officer, Heart Team,Department of Health, London
Professor James Neilson,Professor of Obstetrics andGynaecology, Dept of Obstetricsand Gynaecology,University of Liverpool,Liverpool Women’s Hospital
Dr John C Pounsford,Consultant Physician, NorthBristol NHS Trust
Dr Vimal Sharma,Consultant Psychiatrist & HonSnr Lecturer,Mental Health Resource Centre,Victoria Central Hospital,Wirrall
Dr L David Smith, ConsultantCardiologist, Royal Devon &Exeter Hospital
Professor Norman Waugh,Professor of Public Health,University of Aberdeen
Current and past membership details of all HTA ‘committees’ are available from the HTA website (www.ncchta.org)

Health Technology Assessment Programme
458Current and past membership details of all HTA ‘committees’ are available from the HTA website (www.ncchta.org)
Expert Advisory NetworkMembers
Professor Douglas Altman,Director of CSM & CancerResearch UK Med Stat Gp,Centre for Statistics inMedicine, University of Oxford,Institute of Health Sciences,Headington, Oxford
Professor John Bond,Director, Centre for HealthServices Research,University of Newcastle uponTyne, School of Population &Health Sciences,Newcastle upon Tyne
Mr Shaun Brogan, Chief Executive, RidgewayPrimary Care Group, Aylesbury
Mrs Stella Burnside OBE,Chief Executive,Office of the Chief Executive.Trust Headquarters,Altnagelvin Hospitals Health &Social Services Trust,Altnagelvin Area Hospital,Londonderry
Ms Tracy Bury, Project Manager, WorldConfederation for PhysicalTherapy, London
Mr John A Cairns, Professor of Health Economics,Health Economics ResearchUnit, University of Aberdeen
Professor Iain T Cameron,Professor of Obstetrics andGynaecology and Head of theSchool of Medicine,University of Southampton
Dr Christine Clark,Medical Writer & ConsultantPharmacist, Rossendale
Professor Collette Mary Clifford,Professor of Nursing & Head ofResearch, School of HealthSciences, University ofBirmingham, Edgbaston,Birmingham
Professor Barry Cookson,Director, Laboratory of HealthcareAssociated Infection,Health Protection Agency,London
Professor Howard Stephen Cuckle, Professor of ReproductiveEpidemiology, Department ofPaediatrics, Obstetrics &Gynaecology, University ofLeeds
Professor Nicky Cullum, Director of Centre for EvidenceBased Nursing, University of York
Dr Katherine Darton, Information Unit, MIND – TheMental Health Charity, London
Professor Carol Dezateux, Professor of PaediatricEpidemiology, London
Mr John Dunning,Consultant CardiothoracicSurgeon, CardiothoracicSurgical Unit, PapworthHospital NHS Trust, Cambridge
Mr Jonothan Earnshaw,Consultant Vascular Surgeon,Gloucestershire Royal Hospital,Gloucester
Professor Martin Eccles, Professor of ClinicalEffectiveness, Centre for HealthServices Research, University ofNewcastle upon Tyne
Professor Pam Enderby,Professor of CommunityRehabilitation, Institute ofGeneral Practice and PrimaryCare, University of Sheffield
Mr Leonard R Fenwick, Chief Executive, Newcastleupon Tyne Hospitals NHS Trust
Professor David Field, Professor of Neonatal Medicine,Child Health, The LeicesterRoyal Infirmary NHS Trust
Mrs Gillian Fletcher, Antenatal Teacher & Tutor andPresident, National ChildbirthTrust, Henfield
Professor Jayne Franklyn,Professor of Medicine,Department of Medicine,University of Birmingham,Queen Elizabeth Hospital,Edgbaston, Birmingham
Ms Grace Gibbs, Deputy Chief Executive,Director for Nursing, Midwifery& Clinical Support Servs, West Middlesex UniversityHospital, Isleworth
Dr Neville Goodman, Consultant Anaesthetist,Southmead Hospital, Bristol
Professor Alastair Gray,Professor of Health Economics,Department of Public Health,University of Oxford
Professor Robert E Hawkins, CRC Professor and Director ofMedical Oncology, Christie CRCResearch Centre, ChristieHospital NHS Trust, Manchester
Professor F D Richard Hobbs, Professor of Primary Care &General Practice, Department ofPrimary Care & GeneralPractice, University ofBirmingham
Professor Allen Hutchinson, Director of Public Health &Deputy Dean of ScHARR,Department of Public Health,University of Sheffield
Dr Duncan Keeley,General Practitioner (Dr Burch& Ptnrs), The Health Centre,Thame
Dr Donna Lamping,Research Degrees ProgrammeDirector & Reader in Psychology,Health Services Research Unit,London School of Hygiene andTropical Medicine, London
Mr George Levvy,Chief Executive, MotorNeurone Disease Association,Northampton
Professor James Lindesay,Professor of Psychiatry for theElderly, University of Leicester,Leicester General Hospital
Professor Rajan Madhok, Medical Director & Director ofPublic Health, Directorate ofClinical Strategy & PublicHealth, North & East Yorkshire& Northern Lincolnshire HealthAuthority, York
Professor David Mant, Professor of General Practice,Department of Primary Care,University of Oxford
Professor Alexander Markham, Director, Molecular MedicineUnit, St James’s UniversityHospital, Leeds
Dr Chris McCall, General Practitioner, The Hadleigh Practice, Castle Mullen
Professor Alistair McGuire, Professor of Health Economics,London School of Economics
Dr Peter Moore, Freelance Science Writer,Ashtead
Dr Andrew Mortimore, Consultant in Public HealthMedicine, Southampton CityPrimary Care Trust
Dr Sue Moss, Associate Director, CancerScreening Evaluation Unit,Institute of Cancer Research,Sutton
Professor Jon Nicholl, Director of Medical CareResearch Unit, School of Healthand Related Research,University of Sheffield
Mrs Julietta Patnick, National Co-ordinator, NHSCancer Screening Programmes,Sheffield
Professor Robert Peveler,Professor of Liaison Psychiatry,University Mental HealthGroup, Royal South HantsHospital, Southampton
Professor Chris Price, Visiting Chair – Oxford, Clinical Research, BayerDiagnostics Europe, Cirencester
Ms Marianne Rigge, Director, College of Health,London
Dr Eamonn Sheridan,Consultant in Clinical Genetics,Genetics Department,St James’s University Hospital,Leeds
Dr Ken Stein,Senior Clinical Lecturer inPublic Health, Director,Peninsula TechnologyAssessment Group, University of Exeter
Professor Sarah Stewart-Brown, Director HSRU/HonoraryConsultant in PH Medicine,Department of Public Health,University of Oxford
Professor Ala Szczepura, Professor of Health ServiceResearch, Centre for HealthServices Studies, University ofWarwick
Dr Ross Taylor, Senior Lecturer, Department of General Practiceand Primary Care, University of Aberdeen
Mrs Joan Webster, Consumer member, HTA –Expert Advisory Network


The National Coordinating Centre for Health Technology Assessment,Mailpoint 728, Boldrewood,University of Southampton,Southampton, SO16 7PX, UK.Fax: +44 (0) 23 8059 5639 Email: [email protected]://www.ncchta.org ISSN 1366-5278
FeedbackThe HTA Programme and the authors would like to know
your views about this report.
The Correspondence Page on the HTA website(http://www.ncchta.org) is a convenient way to publish
your comments. If you prefer, you can send your comments to the address below, telling us whether you would like
us to transfer them to the website.
We look forward to hearing from you.