Long-term Assessment of Geochemical Reactivity of CO2 ...
62
1 International Journal of Greenhouse Gas Control, Volume 20, January 2014, Pages 2–26, http://dx.doi.org/10.1016/j.ijggc.2013.10.022 Long-term Assessment of Geochemical Reactivity of CO 2 Storage in Highly Saline Aquifers: Application to Ketzin, In Salah and Snøhvit storage sites Joachim Trémosa, Christelle Castillo, Chan Quang Vong, Christophe Kervévan, Arnault Lassin and Pascal Audigane BRGM, Bureau de Recherches Géologiques et Minières 3 Av. Claude Guillemin, 45060 Orléans, France Corresponding author: [email protected] Abstract Saline aquifers are choice targets for geological storage of CO 2 because of their storage potential and because these formations are not suitable for other uses. Geochemical modeling is an interesting tool to assess the geochemical behavior of CO 2 in the saline aquifer, including its dissolution in the brine and its interactions with minerals. Two key parameters which determine the confidence one can have in the results of geochemical modeling are tested in this paper: i) the establishment of the conceptual model, including the selection of the primary and secondary minerals expected to react; and ii) the activity model and the associated thermodynamic databases to calculate the interaction energies within the saline solution. In this study, we performed an analysis of a large set of CO 2 storage natural analogues, which makes it possible to identify the minerals that are likely to precipitate and dissolve during CO 2 – brine – rock interactions. Interestingly, this analysis indicates a strong dependence of dawsonite precipitation on the initial sandstone mineralogy. Dawsonite can precipitate in lithic and feldspar rich sandstones but was not observed in quartz rich sandstones. These observations on mineral reactivity are used to establish reactivity conceptual models for three CO 2 storage case-studies in saline sandstone aquifers (Ketzin, In Salah and Snøhvit) and a methodology is proposed to evaluate the long-term geochemical reactivity of these saline aquifers as a result of CO 2 injection. Noticeable differences are obtained between the case-studies as a function of the initial mineralogy and chemical conditions in the sandstones, which highlight that CO 2 mineral trapping can take place in a given storage site but can be almost absent in other storage sites. Regarding the activity model and the database, the Pitzer interaction model is rarely used for simulating CO 2 geochemical behavior in saline aquifers despite the fact that more conventionally
-
Upload
khangminh22 -
Category
Documents
-
view
4 -
download
0
Transcript of Long-term Assessment of Geochemical Reactivity of CO2 ...
1
International Journal of Greenhouse Gas Control, Volume 20, January 2014, Pages 2–26, http://dx.doi.org/10.1016/j.ijggc.2013.10.022
Long-term Assessment of Geochemical Reactivity of
CO2 Storage in Highly Saline Aquifers: Application to
Ketzin, In Salah and Snøhvit storage sites Joachim Trémosa, Christelle Castillo, Chan Quang Vong, Christophe Kervévan, Arnault Lassin and
Pascal Audigane
BRGM, Bureau de Recherches Géologiques et Minières
3 Av. Claude Guillemin, 45060 Orléans, France
Corresponding author: [email protected]
Abstract
Saline aquifers are choice targets for geological storage of CO2 because of their storage potential and
because these formations are not suitable for other uses. Geochemical modeling is an interesting
tool to assess the geochemical behavior of CO2 in the saline aquifer, including its dissolution in the
brine and its interactions with minerals. Two key parameters which determine the confidence one
can have in the results of geochemical modeling are tested in this paper: i) the establishment of the
conceptual model, including the selection of the primary and secondary minerals expected to react;
and ii) the activity model and the associated thermodynamic databases to calculate the interaction
energies within the saline solution. In this study, we performed an analysis of a large set of CO2
storage natural analogues, which makes it possible to identify the minerals that are likely to
precipitate and dissolve during CO2 – brine – rock interactions. Interestingly, this analysis indicates a
strong dependence of dawsonite precipitation on the initial sandstone mineralogy. Dawsonite can
precipitate in lithic and feldspar rich sandstones but was not observed in quartz rich sandstones.
These observations on mineral reactivity are used to establish reactivity conceptual models for three
CO2 storage case-studies in saline sandstone aquifers (Ketzin, In Salah and Snøhvit) and a
methodology is proposed to evaluate the long-term geochemical reactivity of these saline aquifers as
a result of CO2 injection. Noticeable differences are obtained between the case-studies as a function
of the initial mineralogy and chemical conditions in the sandstones, which highlight that CO2 mineral
trapping can take place in a given storage site but can be almost absent in other storage sites.
Regarding the activity model and the database, the Pitzer interaction model is rarely used for
simulating CO2 geochemical behavior in saline aquifers despite the fact that more conventionally
2
used activity models are not valid for such salinities. A comparison between calculated mineral
solubility evolution with salinity versus experimental data is performed here using both B-dot and
Pitzer activity models as well as six different databases. This comparison exercise shows that
chemical interactions within saline solutions can only be reproduced using the Pitzer model, even
though Pitzer databases are still incomplete or are not coherent for a wide range of chemical species
and temperatures. The geochemical simulations of CO2 injection in Ketzin, In Salah and Snøhvit saline
aquifers give divergent results using different activity models and databases. A high uncertainty on
the simulation results is then linked to the database choice and this study clearly stresses the need
for a Pitzer database that can be confidently used in all physical/chemical conditions found in deep
sedimentary aquifers.
1 Introduction Carbon capture and storage (CCS) is considered as a promising option to limit the effects of
anthropogenic greenhouse gas emissions on climate change (IPCC, 2007). Deep saline aquifers are
interesting targets for geological storage of carbon dioxide (CO2) because of their storage potential
and because these formations are not suitable for other uses. Indeed, waters from deep saline
aquifers in sedimentary basins have salinities ranging from 5 to >350 g L-1 and contain dissolved toxic
and radioactive metals which limit their use as a resource, in particular for potable use (Kharaka and
Hanor, 2003). Before implementing CCS technology on a large scale, the viability of this technology
must be evaluated and uncertainties must be removed regarding injectivity, containment and long-
term safety. Within this purpose of assessing the viability of CO2 storage, it is essential to predict the
geochemical behavior of the CO2 in the reservoir and in the underground media as well as the
chemical and mineralogical changes linked to CO2 injection. Assessing the geochemical evolution is
mainly required for predicting near-well interactions which can alter injectivity, CO2 trapping in the
reservoir, interactions with the caprock and leakage pathways and chemical impacts in overlying
aquifers (Gaus, 2010).
Different complementary methods can be undertaken to assess the behavior of the CO2 stored in
saline sandstone aquifers and its interactions with water and the minerals of the host formation CO2-
fluid-rock in a storage site (Czernichoswki-Lauriol et al., 2006; Gaus, 2010). The first method is the
characterization of natural CO2 storage sites, which makes it possible to consider geological
timescales at the reservoir and basin scales. The second method consists in laboratory experiments,
which provide direct observations of CO2-fluid-rock interactions, but at the experiment duration and
spatial scales. Field and demonstration tests are also a valuable way to obtain information on the
interactions occurring during CO2 injection. However, only changes in gas and water compositions
3
are generally monitored during these tests and not changes on the rock. The last method is
numerical geochemical and reactive transport modeling, which can be used to interpret and simulate
natural analogues, laboratory experiments and field tests or to predict the behavior of a CO2
geological storage, including over large time and spatial scales. In order to make accurate simulations
and predictions, modeling requires a good description of the processes taking place and a precise
characterization of the parameters involved in the calculations.
In geochemical modeling, the quality of the calculations is determined by the constraint of some key
parameters and processes: the thermo-physical properties of CO2, the interactions within the brine,
the selection of the reacting mineral phases and their solubility properties and the kinetic laws and
parameters (Marini, 2006; Gaus et al., 2008). Constraining these parameters is a challenging but
essential task to understand and accurately simulate the geochemical evolution of a CO2 storage. This
work is focused on the selection of the minerals to consider in a model and on the influence of the
different options offered to a modeler for describing the interaction processes within the solution.
Many modeling studies on the geochemical evolution of CO2 storages including mineral changes have
been carried out over recent years (Xu et al., 2003, 2010; Knauss et al., 2005; Lagneau et al., 2005;
Zerai et al., 2006; Audigane et al., 2007, 2009). However, the selection of the minerals involved in the
interaction processes does not always rest on a solid conceptual model specific to the studied
storage site. Indeed, it is essential to first interpret in terms of reactivity the mineral and pore
solution initial states and, then, based on natural system observations and on laboratory interaction
experiments, to establish what reactions are expected when CO2 is introduced into this particular
water – rock system. All primary minerals are sometimes considered in the simulation (Xu et al.,
2003; Zhang et al., 2009), without any consideration of the minerals really expected to react, and the
behavior of the system is controlled by the thermodynamics and the kinetics of the reaction, in spite
of their uncertainties. This kind of simulation leads to a complicated and certainly erroneous
behavior where some primary minerals replace in several years or hundreds of years other primary
minerals because they are thermodynamically more stable, although these minerals can coexist in
natural systems over millions of years. Furthermore, the selection of the secondary minerals
resulting from CO2 injection into sandstone is still under debate, in particular for dawsonite. Under
storage conditions, this Na-Al carbonate is thermodynamically favored to precipitate but is not often
observed in CO2 natural storage analogues and never in laboratory experiments at low pH and
temperatures relevant for CO2 storage. The purpose is then to be able to establish a solid conceptual
model clearly pointing out the minerals likely to react in a given sandstone, in coherence with the
overall observations from natural analogues and experiments, as a function of the mineralogical and
4
chemical properties of the studied formation (Gaus, 2010; Dethlefsen et al., 2011; Hellevang et al.,
2011). Such a good constraint on the conceptual model appears all the more important in that it has
been demonstrated that mineral trapping is highly influenced by the selection of the initial and
secondary minerals (Kihm et al., 2012).
When performing geochemical simulations in deep saline aquifers, it should be recalled that the high
pressure, temperature and salinity characterizing these aquifers confer to the system a different
chemical behavior than in surface conditions. Conventional activity models of Debye-Hückel type are
frequently used in simulations of CO2 storage in deep saline aquifers, even though these models are
only valid for dilute solutions. Likewise, thermodynamic databases are also used out of their
temperature validity range or for chemical species without interaction coefficients in Pitzer
databases. On this topic, the purpose of this paper is to evaluate the uncertainty of the activity
model and the thermodynamic database used on the simulation results. This paper investigates the
conditions to assess the geochemical behavior of CO2 storage in deep saline aquifers aiming at
improving the establishment of the conceptual model and at evaluating the effect of the activity
model and thermodynamic database selection on the simulation results. These subjects are
illustrated and discussed on the basis of three case studies: Ketzin, In Salah and Snøhvit CO2 storage
sites.
2 Geochemical modeling approach for CO2 storage in saline
aquifers
2.1 Conceptual model of long-term CO2 evolution in saline sandstone
aquifers: insights provided by natural analogues
In a CO2 geological storage, CO2 is injected into the host formation in a supercritical state and will
distribute according to four trapping mechanisms, namely structural, residual, solubility and mineral
trapping, respectively to the increase of storage safety (Benson and Cole, 2008). The distribution of
CO2 in these four traps will evolve over time, distance from the injection point and physical
conditions (P, T, salinity) in the host formation. From a geochemical perspective and over long time
spans, perturbations linked to CO2 will mainly concern the dissolved CO2 and the interaction with the
rock.
The dissolution of CO2 in brines leads to an acidification and an increase in bicarbonate content,
which have important consequences regarding the evolution of the geochemical system in the saline

5
sandstone aquifer. Information on the resulting interactions is given by laboratory experiments and
by the study of natural CO2 geological disposal analogues. During laboratory interaction experiments
between CO2 saturated brines and sandstones or rock-constituting minerals (e.g., Kaszuba et al.,
2003, 2005; Hangx and Spiers, 2009; Ketzer et al., 2009; Luquot et al., 2012), only fast reactions can
be observed but system conditions are well controlled, allowing a precise characterization of the
observed interaction processes. Natural analogues make it possible to observe the results of CO2 –
water – rock interactions over geological periods, mainly regarding the dissolution and precipitation
of minerals obeying slow reaction kinetics. However, in natural analogues uncertainties remain
regarding the fluid and gas compositions during the interaction with CO2, the initial mineralogy, the
temperature during interaction and the interaction duration. A compilation of natural analogues of
CO2 storage in saline aquifers is presented in Table 1. It emphasizes the changes in mineralogy that
occurred during CO2 intrusion in deep saline sandstone aquifers. It is necessary to consider both fast
and slow CO2 – water – rock reactions given by laboratory experiments and natural analogues to
establish an interaction model. These insights make it possible to select the minerals expected to
react or to precipitate during the interaction with CO2 saturated brines, calibrate the model and
compare the simulation results with data.
During the interaction of CO2 saturated brines and sandstones calcite, dolomite and sulfate minerals
dissolve rapidly and the the solutions are close to equilibrium with these phases. Such fast reactions
are observed during laboratory experiments and evidenced in natural analogues. Aluminosilicate
primary sandstone minerals, such as feldspars, clay minerals, micas, chlorites or zeolites, also tend to
dissolve because of the brine acidity. However these minerals have slow rates of dissolution and can
persist over geological periods in thermodynamically unstable conditions. Natural analogues (Table
1) present dissolution footprints on primary aluminosilicate minerals but these minerals are still
present even after several Ma of interaction. The dissolution of primary rock minerals induces a
supply of cations in the brine, such as Ca, Mg, Na, Al, Fe and Si, which are available for precipitation
of secondary minerals. Chalcedony or quartz are expected to precipitate relatively rapidly, since their
precipitation is observed during CO2 – sandstone interaction experiments accelerated using higher
temperature and pressure than in the aquifers (Kaszuba et al., 2005) or even during experiments at
in situ temperature and pressure (Luquot et al., 2012). With a few exceptions, quartz precipitation
linked to CO2 intrusion is observed in almost all natural analogues (Table 1). These exceptions are
probably due to the difficulty of dating all quartz cementations in the rock in relation to their
diagenesis event. Kaolinite is expected to precipitate as a result of primary aluminosilicate mineral
6
dissolution. Kaolinite precipitation is slow and is commonly observed in natural analogues but rarely
during laboratory experiments (Ketzer et al., 2009; Luquot et al., 2012).
CO2 mineral trapping occurs because of precipitation of carbonate minerals, in relation to the
available dissolved cations in the brine. Commonly observed carbonate phases are calcite, dolomite,
ankerite, siderite and dawsonite (Table 1). Precipitation of Ca, Mg and Fe carbonates are observed in
all CO2 storage analogues. Precipitation of dawsonite (NaAlCO3(OH)2) is not observed in all cases after
interaction with CO2 rich brines. The introduction of dawsonite into geochemical simulations of CO2
storage in saline aquifers is controversial (Haszeldine et al., 2005; Hellevang et al., 2005, 2011;
Kaszuba et al., 2011) since its precipitation is predicted by numerical simulations (Xu et al., 2003;
Audigane et al., 2007) but dawsonite has rarely been observed in sedimentary basins (Smith and
Milton, 1966; Baker et al., 1995). The thermodynamic properties of dawsonite were recently re-
evaluated (Benezeth et al., 2007) and confirm that this mineral can be thermodynamically stable
under CO2 storage conditions (Cantucci et al., 2009). With regards to the thermodynamic database, it
has also been pointed out that a consistent database for Al – phases and the Al system is required for
a correct reproduction of dawsonite behavior (Kaszuba et al., 2011). Uncertainties regarding the
kinetics of dawsonite precipitation and its nucleation have been suggested as a cause of the
discrepancy between simulation predictions and field observations. The difference between rates
measured during laboratory experiments and rates at the field scale is particularly uncertain to
address (Zhu, 2005; Gannor et al., 2007). However, sensitivity analysis on the reaction rates and the
nucleation rates (Hellevang et al., 2011) only indicate dawsonite precipitation is brought forward or
postponed. After a long duration of interaction, dawsonite is predicted to precipitate. A dependence
of the dawsonite precipitation rate on the aluminosilicate mineral dissolution rates has also been
pointed out (Hellevang et al., 2010), because of a limited Al supply rate from aluminosilicates. It is
difficult to estimate the time required for dawsonite to precipitate from the natural analogues. The
only insight is given by the Bravo Dome analogue, where the absence of dawsonite can partly be
explained by the too recent CO2 intrusion in the arkosic sandstone, which occurred 8,000 to 100,000
years ago (Baines and Worden, 2004). However, the mineralogical assemblage of Bravo Dome
analogue also suggests the sandstone underwent open-system alteration, leaching out the source-
ions for dawsonite. Further natural CO2 storage analogues have also been investigated in recent
years and dawsonite precipitations were observed in various saline aquifers as a result of CO2 rich
brine – sandstone interaction (Moore et al., 2005; Worden, 2006; Gao et al., 2009; Wilkinson et al.,
2009; Liu et al., 2011; Zalba et al., 2011). Dawsonite precipitation related to CO2-rich fluid flooding
has also been observed in carbonate veins in mudstone of the Cretaceous Izumi group (SW Japan),
7
which can be considered as a natural analogue of CO2 storage caprock (Okuyama and Take, 2011).
These studies on natural analogues indicate that dawsonite is more frequent than previously
thought. It is also possible that dawsonite is missed in non-precise mineralogical and petrographical
investigations since this mineral is characterized by a petrographical aspect similar to that of illites
(Smith and Milton, 1966; Baines and Worden, 2004; Worden, 2006).
The influence of the initial composition of the sandstone can be considered to explain why dawsonite
is sometimes observed in natural analogues and is sometimes absent. Dawsonite can precipitate
from slightly acidic Na rich brines with high CO2 contents and a source of Al (Worden, 2006; Benezeth
et al., 2007; Hellevang et al., 2011). Only a relatively moderate CO2 fugacity of some bars is required
for the brine to be within the dawsonite stability zone (Worden, 2006). Studies on the reaction paths
for dawsonite formation have shown that its precipitation follows the dissolution of an
aluminosilicate mineral, such as a feldspar or a clay mineral (Johnson et al., 2001, 2004; Benezeth et
al., 2007; Hellevang et al., 2011). Indeed, dawsonite is frequently observed to pseudomorphically
replace feldspar crystals (Table 1). With regards to the temperature, dawsonite can form over a
range from 25 to 120 °C (Table 1). An overall reaction is frequently proposed (Zerai et al., 2006;
Audigane et al., 2007; Gaus, 2010) to represent the feldspar (NaAlSi2O8) evolution to dawsonite
(NaAlCO3(OH)2) and chalcedony (SiO2) in CO2-rich brines. The reaction can be written as follows:
2232283 3)( SiOOHNaAlCOOHCOONaAlSi (1)
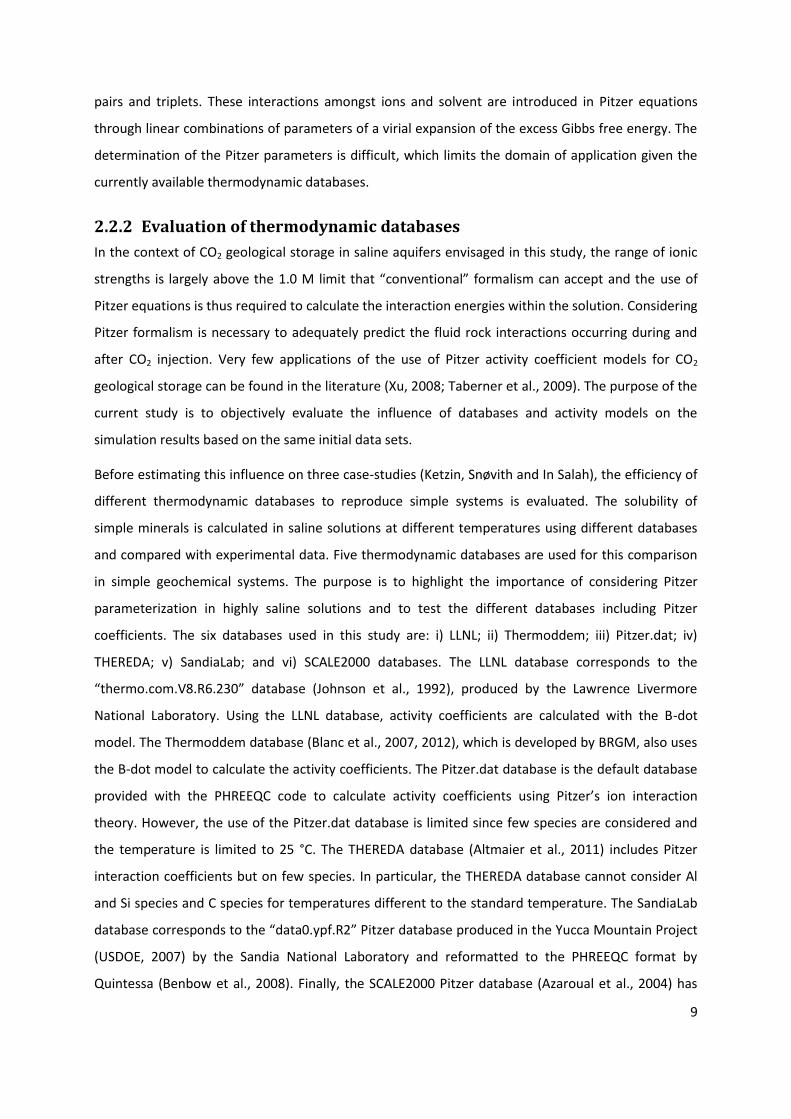
The compositions of the detrital phases of natural CO2 storage analogue sandstones are shown in a
Folk’s diagram (Figure 1) with a distinction between dawsonite bearing sandstones and sandstones
without dawsonite. The mineralogical composition of the total rock (i.e., not only including the
detrital phases) is given in Table 1 for each analogue. Note that the Folk’s diagram (Figure 1) shows
some uncertainty regarding the composition of several analogues: i) the available mineralogical
compositions of the Bravo Dome and Vert le Grand analogues are not detailed; ii) for the Miller Field
analogue, relatively different mineralogical compositions are given by the different authors
(Marchand et al., 2001; Baines and Worden, 2004); and iii) the Aldebaran sandstones of the Bowen,
Gunnedah and Sydney basins present heterogeneities so that their compositions vary from
litharenite to quartzarenite (Baker et al., 1995) but there are no details as to whether dawsonite is
encountered or not in all facies.
From the Folk’s diagram, which reports fourteen natural CO2 geologic disposal analogues, a zonation
of the sandstone compositions is highlighted regarding the occurrence or the absence of dawsonite.
It appears that dawsonite bearing sandstones generally contain less quartz than sandstones without
8
dawsonite. Figure 1 also indicates that reactive minerals, such as clay minerals or volcanic or
metamorphic derived phyllosilicates or tectosilicates (classified as lithics), may be necessary for
dawsonite precipitation, in addition to feldspars. Indeed, these silicate rock fragments affect the
silica activity and the pH, which are known to be crucial in dawsonite stability (Hellevang et al., 2011).
On the other hand, it is observed that subarkose and arkose sandstones cannot lead to the
precipitation of dawsonite consecutively to an interaction of the rock with CO2-rich brines. In fact,
mineralogical compositions of the whole rocks (Table 1) indicate that there are more feldspars in
sandstones with dawsonite than in sandstones without dawsonite, in spite of being classified as
subarkoses or arkoses. There are also more aluminosilicate minerals in dawsonite bearing
sandstones. Immature sandstones (with a low SiO2/Al2O3 ratio in aluminosilicates) seem
consequently more adequate for dawsonite precipitation. Conversely, natural analogues suggest that
no dawsonite can be expected in mature sandstones (with a high SiO2/Al2O3 ratio).
Together with a diagram of the thermodynamic stability and the content of reactive minerals in the
total rocks, this type of Folk’s diagram compiling a set of natural CO2 storage analogues seems
interesting to evaluate the pertinence of introducing dawsonite to simulate the long-term interaction
between a determined saline sandstone aquifer and CO2. This diagram is further used for the
selection of the minerals introduced in Ketzin, In-Salah and Snøhvit CO2 storage site simulations.
2.2 Modeling aspects inherent to high salinity waters
2.2.1 Simulation code and activity models
In this study, the calculations were performed using the PHREEQC v2.18 code (Parkhurst and Appelo,
1999). PHREEQC is a computer program for simulating chemical reactions and transport processes in
natural water systems. PHREEQC v2.18 allows high salinity solutions to be considered, such as
sedimentary basin brines, using the Pitzer formalism as activity model. When concentrated solutions
are considered, the solution ideality assumption is no longer valid and an activity coefficient is used
to account for deviations from ideal behavior. Debye-Hückel (Debye and Hückel, 1923), extended
Debye-Hückel, or Davies activity models are the most often used to calculate the activity coefficients.
These models can provide an excellent description of the interactions occurring between solutes in
solutions with an ionic strength lower than 0.5 to 0.7 M. In the case of higher concentrated solutions,
the B-dot model (Helgeson et al., 1969), an extension of the Debye-Hückel model, can be used for
NaCl dominant solutions. However, the more adequate formalism to consider the solution ideality
deviation at high salinities is the Pitzer formalism (Pitzer et al., 1973; Pitzer, 1991). The Pitzer model
considers both the electrostatic interactions between ions and the specific interactions between ion
9
pairs and triplets. These interactions amongst ions and solvent are introduced in Pitzer equations
through linear combinations of parameters of a virial expansion of the excess Gibbs free energy. The
determination of the Pitzer parameters is difficult, which limits the domain of application given the
currently available thermodynamic databases.
2.2.2 Evaluation of thermodynamic databases
In the context of CO2 geological storage in saline aquifers envisaged in this study, the range of ionic
strengths is largely above the 1.0 M limit that “conventional” formalism can accept and the use of
Pitzer equations is thus required to calculate the interaction energies within the solution. Considering
Pitzer formalism is necessary to adequately predict the fluid rock interactions occurring during and
after CO2 injection. Very few applications of the use of Pitzer activity coefficient models for CO2
geological storage can be found in the literature (Xu, 2008; Taberner et al., 2009). The purpose of the
current study is to objectively evaluate the influence of databases and activity models on the
simulation results based on the same initial data sets.
Before estimating this influence on three case-studies (Ketzin, Snøvith and In Salah), the efficiency of
different thermodynamic databases to reproduce simple systems is evaluated. The solubility of
simple minerals is calculated in saline solutions at different temperatures using different databases
and compared with experimental data. Five thermodynamic databases are used for this comparison
in simple geochemical systems. The purpose is to highlight the importance of considering Pitzer
parameterization in highly saline solutions and to test the different databases including Pitzer
coefficients. The six databases used in this study are: i) LLNL; ii) Thermoddem; iii) Pitzer.dat; iv)
THEREDA; v) SandiaLab; and vi) SCALE2000 databases. The LLNL database corresponds to the
“thermo.com.V8.R6.230” database (Johnson et al., 1992), produced by the Lawrence Livermore
National Laboratory. Using the LLNL database, activity coefficients are calculated with the B-dot
model. The Thermoddem database (Blanc et al., 2007, 2012), which is developed by BRGM, also uses
the B-dot model to calculate the activity coefficients. The Pitzer.dat database is the default database
provided with the PHREEQC code to calculate activity coefficients using Pitzer’s ion interaction
theory. However, the use of the Pitzer.dat database is limited since few species are considered and
the temperature is limited to 25 °C. The THEREDA database (Altmaier et al., 2011) includes Pitzer
interaction coefficients but on few species. In particular, the THEREDA database cannot consider Al
and Si species and C species for temperatures different to the standard temperature. The SandiaLab
database corresponds to the “data0.ypf.R2” Pitzer database produced in the Yucca Mountain Project
(USDOE, 2007) by the Sandia National Laboratory and reformatted to the PHREEQC format by
Quintessa (Benbow et al., 2008). Finally, the SCALE2000 Pitzer database (Azaroual et al., 2004) has
10
been developed at BRGM for high saline solutions and brines (up to 300 g L-1) at high pressure and
temperature conditions. The last two Pitzer databases, i.e. the SandiaLab and SCALE2000 databases,
contain most species of interest for performing calculations in deep saline sedimentary
environments. However, the establishment of Pitzer databases is still on-going and there are no
Pitzer interaction coefficients available for all species (e.g. for Al in the SCALE2000 database), or are
valid only for a limited range of temperatures (e.g. many species have only interaction coefficients at
25 °C in the SandiaLab database), or incoherencies can be observed between the data. In particular,
redox issues cannot be addressed using Pitzer databases since no interaction parameters describing
the electron behavior in saline solutions are available at the present time. An attempt to deal with
redox reactions in saline solutions using O2 fugacity rather than electron activity has been
undertaken by Marion et al. (2003). However, formalisms for redox reactions involving O2 and
related Pitzer interaction coefficients have not been introduced in the available databases. As a
consequence, species which behavior is highly dependent to the redox, in particular Fe and S
systems, cannot been considered in models when Pitzer formalism is used.
As a result, none of the currently available databases is totally appropriate for the purpose of the
present study. Therefore, several databases are used to evaluate the uncertainties associated with
the activity coefficient models. The comparison of the results calculated using these different
databases with experimental data of simple mineral solubilities enables the accuracy of the different
databases to be evaluated. Solubility measurements as a function of solution molarity were obtained
from the literature for gibbsite in NaCl solutions from 30 to 70 °C (Palmer and Wesolowski, 1992), for
silica in KCl, CaCl2, MgSO4 and MgCl2 solutions at 25 °C (Marshall and Warakomski, 1980), for silica in
NaCl solutions at 25 and 150 °C (Chen and Marshall, 1982), for calcite in NaCl solutions at 25 and 60
°C (Wolf et al., 1989) and for gypsum in NaCl solutions at 25 °C (Linke and Seidell, 1965). Solubilities
were calculated for these minerals under the experimental conditions using the different databases
previously presented. Calculations using the Pitzer.dat database were only performed for calcite and
gypsum because this database does not contain Si and Al species.
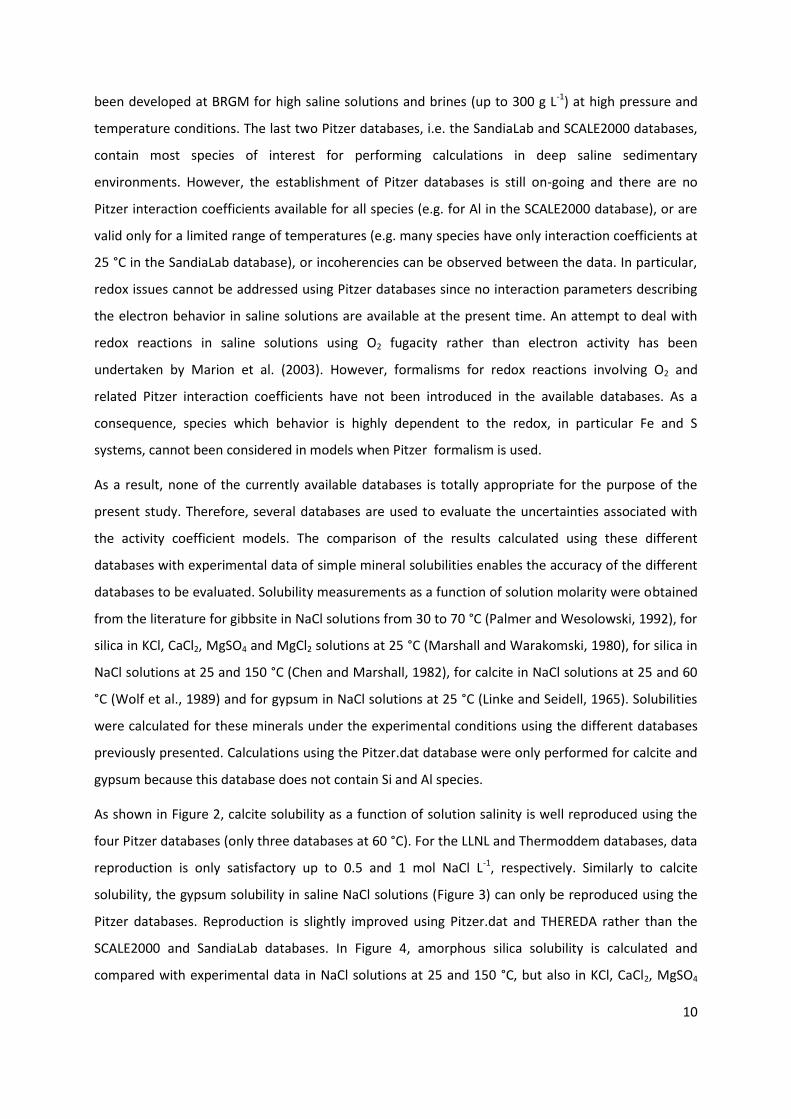
As shown in Figure 2, calcite solubility as a function of solution salinity is well reproduced using the
four Pitzer databases (only three databases at 60 °C). For the LLNL and Thermoddem databases, data
reproduction is only satisfactory up to 0.5 and 1 mol NaCl L-1, respectively. Similarly to calcite
solubility, the gypsum solubility in saline NaCl solutions (Figure 3) can only be reproduced using the
Pitzer databases. Reproduction is slightly improved using Pitzer.dat and THEREDA rather than the
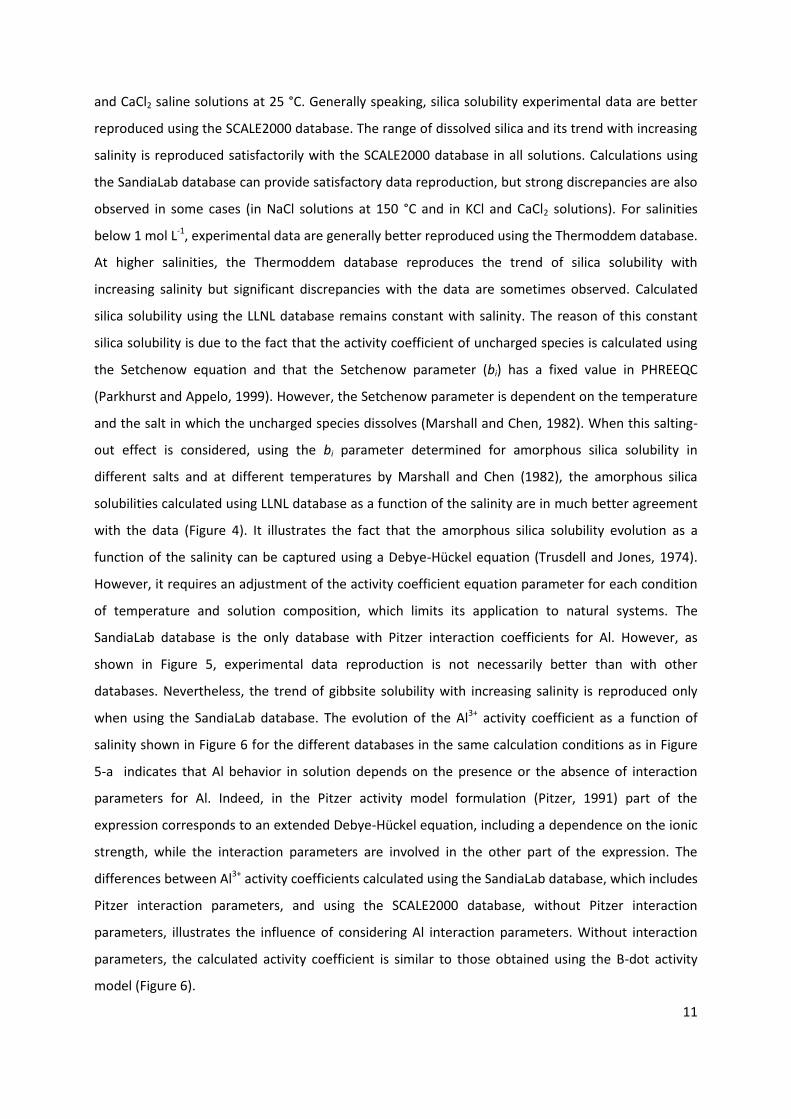
SCALE2000 and SandiaLab databases. In Figure 4, amorphous silica solubility is calculated and
compared with experimental data in NaCl solutions at 25 and 150 °C, but also in KCl, CaCl2, MgSO4
11
and CaCl2 saline solutions at 25 °C. Generally speaking, silica solubility experimental data are better
reproduced using the SCALE2000 database. The range of dissolved silica and its trend with increasing
salinity is reproduced satisfactorily with the SCALE2000 database in all solutions. Calculations using
the SandiaLab database can provide satisfactory data reproduction, but strong discrepancies are also
observed in some cases (in NaCl solutions at 150 °C and in KCl and CaCl2 solutions). For salinities
below 1 mol L-1, experimental data are generally better reproduced using the Thermoddem database.
At higher salinities, the Thermoddem database reproduces the trend of silica solubility with
increasing salinity but significant discrepancies with the data are sometimes observed. Calculated
silica solubility using the LLNL database remains constant with salinity. The reason of this constant
silica solubility is due to the fact that the activity coefficient of uncharged species is calculated using
the Setchenow equation and that the Setchenow parameter (bi) has a fixed value in PHREEQC
(Parkhurst and Appelo, 1999). However, the Setchenow parameter is dependent on the temperature
and the salt in which the uncharged species dissolves (Marshall and Chen, 1982). When this salting-
out effect is considered, using the bi parameter determined for amorphous silica solubility in
different salts and at different temperatures by Marshall and Chen (1982), the amorphous silica
solubilities calculated using LLNL database as a function of the salinity are in much better agreement
with the data (Figure 4). It illustrates the fact that the amorphous silica solubility evolution as a
function of the salinity can be captured using a Debye-Hückel equation (Trusdell and Jones, 1974).
However, it requires an adjustment of the activity coefficient equation parameter for each condition
of temperature and solution composition, which limits its application to natural systems. The
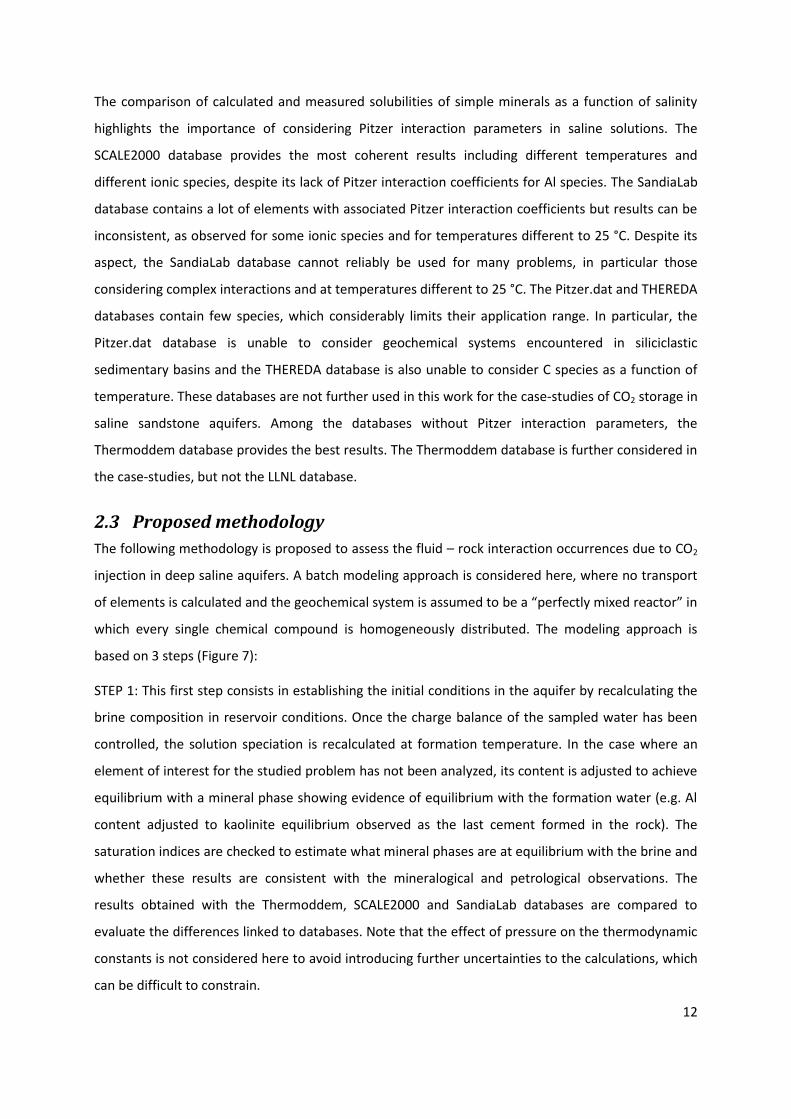
SandiaLab database is the only database with Pitzer interaction coefficients for Al. However, as
shown in Figure 5, experimental data reproduction is not necessarily better than with other
databases. Nevertheless, the trend of gibbsite solubility with increasing salinity is reproduced only
when using the SandiaLab database. The evolution of the Al3+ activity coefficient as a function of
salinity shown in Figure 6 for the different databases in the same calculation conditions as in Figure
5-a indicates that Al behavior in solution depends on the presence or the absence of interaction
parameters for Al. Indeed, in the Pitzer activity model formulation (Pitzer, 1991) part of the
expression corresponds to an extended Debye-Hückel equation, including a dependence on the ionic
strength, while the interaction parameters are involved in the other part of the expression. The
differences between Al3+ activity coefficients calculated using the SandiaLab database, which includes
Pitzer interaction parameters, and using the SCALE2000 database, without Pitzer interaction
parameters, illustrates the influence of considering Al interaction parameters. Without interaction
parameters, the calculated activity coefficient is similar to those obtained using the B-dot activity
model (Figure 6).
12
The comparison of calculated and measured solubilities of simple minerals as a function of salinity
highlights the importance of considering Pitzer interaction parameters in saline solutions. The
SCALE2000 database provides the most coherent results including different temperatures and
different ionic species, despite its lack of Pitzer interaction coefficients for Al species. The SandiaLab
database contains a lot of elements with associated Pitzer interaction coefficients but results can be
inconsistent, as observed for some ionic species and for temperatures different to 25 °C. Despite its
aspect, the SandiaLab database cannot reliably be used for many problems, in particular those
considering complex interactions and at temperatures different to 25 °C. The Pitzer.dat and THEREDA
databases contain few species, which considerably limits their application range. In particular, the
Pitzer.dat database is unable to consider geochemical systems encountered in siliciclastic
sedimentary basins and the THEREDA database is also unable to consider C species as a function of
temperature. These databases are not further used in this work for the case-studies of CO2 storage in
saline sandstone aquifers. Among the databases without Pitzer interaction parameters, the
Thermoddem database provides the best results. The Thermoddem database is further considered in
the case-studies, but not the LLNL database.
2.3 Proposed methodology
The following methodology is proposed to assess the fluid – rock interaction occurrences due to CO2
injection in deep saline aquifers. A batch modeling approach is considered here, where no transport
of elements is calculated and the geochemical system is assumed to be a “perfectly mixed reactor” in
which every single chemical compound is homogeneously distributed. The modeling approach is
based on 3 steps (Figure 7):
STEP 1: This first step consists in establishing the initial conditions in the aquifer by recalculating the
brine composition in reservoir conditions. Once the charge balance of the sampled water has been
controlled, the solution speciation is recalculated at formation temperature. In the case where an
element of interest for the studied problem has not been analyzed, its content is adjusted to achieve
equilibrium with a mineral phase showing evidence of equilibrium with the formation water (e.g. Al
content adjusted to kaolinite equilibrium observed as the last cement formed in the rock). The
saturation indices are checked to estimate what mineral phases are at equilibrium with the brine and
whether these results are consistent with the mineralogical and petrological observations. The
results obtained with the Thermoddem, SCALE2000 and SandiaLab databases are compared to
evaluate the differences linked to databases. Note that the effect of pressure on the thermodynamic
constants is not considered here to avoid introducing further uncertainties to the calculations, which
can be difficult to constrain.
13
STEP 2: The second step consists in introducing the perturbation into the formation brine due to the
CO2 injection. The perturbation is introduced by solubilizing CO2 in the brine at a given fugacity of
CO2. The fugacity of CO2 is calculated using an equation of state (Duan and Sun, 2003) for 1.5 times
the initial formation fluid pressure. Indeed, the CO2 is planned to be injected at a pressure 1.5 times
higher than the formation fluid pressure, at least in large reservoirs with high permeability. A mixing
approach between a water acidified at the CO2 injection fugacity end-member and a non-perturbed
water end-member is then used to mimic the CO2 impact at various distances from the injection well.
Considering the different databases, the effect on pH is checked. The saturation indices are also
computed to identify the mineral phases destabilized by the CO2-induced acidification.
STEP 3: This last step consists in calculating the geochemical and mineralogical evolution of the
system due to the CO2 perturbation. For this purpose, a water-rock interaction model is proposed for
each case-study. The goal is to quantify the mineral changes induced by the injection of CO2 and, in
particular, those contributing to CO2 mineral trapping. Special attention is paid to the influence of the
database on the calculation results. These interaction models are based on the characterization of
the geochemical system for the different saline sandstone aquifers (step 2) and the identification of
the minerals expected to dissolve or to precipitate, in agreement with the conceptual model
previously presented (cf. section 2.1). The reactions introduced into the interaction model are
summarized in Table 3. Dissolution of primary aluminosilicate minerals is kinetically controlled while
thermodynamic equilibrium governs the precipitation of secondary phases. Kinetics are introduced
for aluminosilicate dissolution because alteration of these mineral phases may last over very long
time periods and equilibrium assumptions are not realistic. On the contrary, precipitation can be
considered at equilibrium over long time periods for the sake of calculation simplicity (Helgeson,
1968). Precipitation is then controlled by the release of cations by dissolution of primary minerals
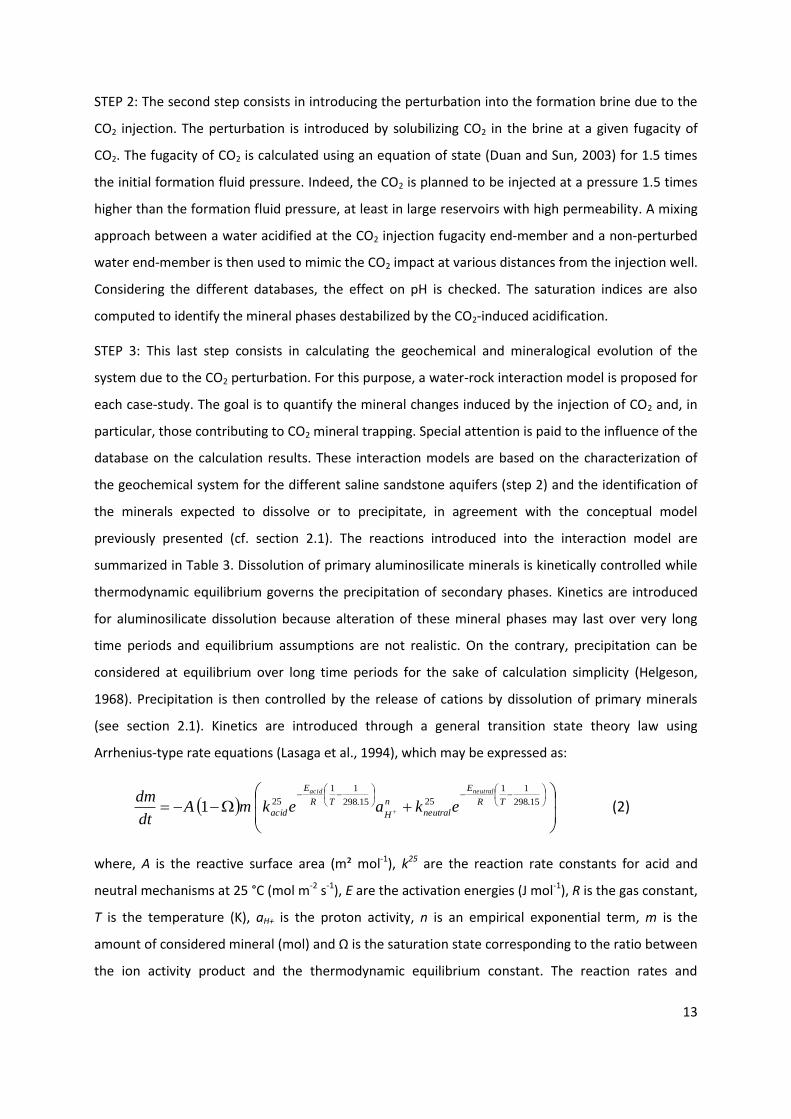
(see section 2.1). Kinetics are introduced through a general transition state theory law using
Arrhenius-type rate equations (Lasaga et al., 1994), which may be expressed as:
15.298
11
2515.298
11
251 TR
E
neutral
n
H
TR
E
acid
neutralacid
ekaekmAdt
dm (2)
where, A is the reactive surface area (m² mol-1), k25 are the reaction rate constants for acid and
neutral mechanisms at 25 °C (mol m-2 s-1), E are the activation energies (J mol-1), R is the gas constant,
T is the temperature (K), aH+ is the proton activity, n is an empirical exponential term, m is the
amount of considered mineral (mol) and Ω is the saturation state corresponding to the ratio between
the ion activity product and the thermodynamic equilibrium constant. The reaction rates and
14
activation energies used in these calculations come from the compilation by Palandri and Kharaka
(2004). Table 4 summarizes these parameters together with the reactive surface areas used for the
different minerals. Important differences are usually observed between the dissolution rates
measured in laboratory experiments, such as those reported by Palandri and Kharaka (2004), and
long-term field dissolution rates (Steefel et al., 2005; Zhu, 2005; Gannor et al., 2007). In practice, this
difference is often corrected by introducing a scaling factor of 0.001 on the reactive surface area
measured on individual minerals at the laboratory scale (Gaus, 2005). Such a scaling factor is also
used in the present calculations for the different case-studies.
Calculations were carried out over 1000 years considering the interaction between Ketzin, In Salah
and Snøhvit sandstone and brines with acidified brine mixing ratios of 0, 5, 20, 50, 70 and 100 %. The
storage aquifer temperature of 36 °C was considered and the SCALE2000, SandiaLab and
Thermoddem databases were used. Calculations with a non-perturbed brine correspond to a
baseline case without CO2, making it possible to distinguish the brine-mineral interactions due to
sandstone natural evolution from the interactions due to the CO2 intrusion.
3 Case-studies for evaluating the long-term geochemical
evolution of CO2 in saline aquifers
3.1 Ketzin
3.1.1 Site presentation
Ketzin is an onshore site located in the Northeast German Basin for pilot injection of CO2 into an 80 m
thick saline sandstone aquifer (Förster et al., 2006). The Ketzin injection project was funded by the
European Commission under the FP6 framework (CO2SINK Project). A modest amount of CO2 was
injected (60,000 tons) into an anticlinal structure of the Triassic Stuttgart Formation located at a
depth of about 650 m above a salt pillow situated deeper (Figure 8). The Stuttgart Formation is of
fluvial origin and exhibits a heterogeneous lithology showing alternations of mudstones, siltstones
and fluvial sandstones (Förster et al., 2006, 2010). This formation has good reservoir properties, with
an average porosity of 23 % and a permeability of 50 to 100 mD (Wiese et al., 2010). Reservoir
temperatures of 33 and 36 °C were measured at depths of 600 and 700 m, respectively. Formation
pressure at 700 m depth is determined to range between 70 and 75 bars. The brines sampled in the
formation have a salinity of about 230 g L-1 (Würdermann et al., 2010). The Stuttgart formation is
overlaid by mudstones of the Weser and Arnstadt formations, which form a 210 m thick caprock
section (Förster et al., 2006). At Ketzin experimental site, food grade CO2 (purity 99.9 %) and CO2
from an oxyfuel pilot plant (purity 99.7%) were injected (Martens et al., 2012).
15
3.1.2 STEP 1: Initial reservoir conditions at the Ketzin site
A detailed characterization of the Ketzin site has been carried out before injecting CO2 (Förster et al.,
2006). In particular, the evaluation of the water – rock interactions at the initial state in the Stuttgart
Fm can be confidently addressed since several water sampling analyses (Würdermann et al., 2010)
and a detailed mineralogical and petrological analysis (Förster et al., 2010) are available. Formation
water was sampled (Würdermann et al., 2010) after pumping several times the borehole volume to
obtain a water sample representative of the formation. The composition of water once the borehole
volume was pumped 6.8 times (KTZI 202, No 26) is reported in Table 2 and used in this study. Waters
sampled after 5 times or more the borehole volume was pumped have similar compositions.
Fluorescein was used as a tracer to ensure the sampled waters were not perturbed by the drilling
mud (Würdermann et al., 2010). Stuttgart Fm water has a total dissolved solids (TDS) content of
about 235 g L-1 and is mainly composed of Na and Cl, with noticeable amounts of Ca, SO4 and Fe.
Note that Al content was not determined. Charges are balanced within the solution, which has a 1.4
% error.
At Ketzin, the Stuttgart Fm presents channel and overbank facies, respectively corresponding to
interbedded sandstones and thin mudstone and coal layers. Mineralogy composition is obtained
from Förster et al. (2010). Quartz content ranges from 30 to 40 %. The sandstone has a high feldspar
content (from 20 to 40 %), mainly plagioclase but also K-feldspar. Mg-, Fe-, K-sheet minerals,
including chlorite, illite, mixed layered illite/smectite and micas are also present in the sandstone at
relatively important amounts (between 10 and 15 %). These phyllosilicates can be detrital or
authigenic minerals. Amongst the authigenic minerals, analcime (a Na-zeolite) and anhydrite are the
most frequent and most abundant phases. Further authigenic minerals observed at low amounts, but
not in all samples, are feldspar, quartz, ferric iron oxides, clay minerals and dolomite. Petrological
observations, in particular with regards to the mineral crystallinity state or the presence of
dissolution footprints and overgrowths, give reliable information on the equilibrium of the mineral
phases respectively to the brine in the formation conditions. At Ketzin (Förster et al., 2010), feldspar
grains are partially or totally altered and replaced by illite or by other authigenic cements. An
albitization of K-feldspar and plagioclase also occurred as an early diagenetic process. Lithics are
strongly altered, mainly the illite and chlorite-rich grains and the feldspar-rich rock fragments. The
first minerals to precipitate during diagenesis were quartz, albite and iron oxides. These
precipitations were followed by precipitations of clay minerals and analcime. Dolomite then
precipitated, followed by anhydrite as the latest authigenic mineral.
16
The last aluminosilicate minerals to precipitate were illite and analcime and, even if these phases are
not the last phases to precipitate during diagenesis, they do not show dissolution footprints. Illite can
then be considered at equilibrium with the actual fluids circulating in the formation. Based on this
hypothesis, Al content is adjusted to achieve solution equilibrium with illite (Mg-illite for the
SCALE2000 and Thermoddem databases and Mg, K-illite for the SandiaLab database). When the
solution speciation is recalculated at the formation temperature (36 °C), pH values of 6.40, 6.36 and
6.32 are obtained with the SCALE2000, SandiaLab and Thermoddem databases, respectively. These
values are close to the 6.40 pH value measured during sampling (Table 2). Carbon dioxide fugacity log
values of -1.86, -1.92 and -1.86 are calculated using the different databases. This narrow range of CO2
fugacities can be compared with the CO2 fugacity values measured in sedimentary basins and
reported as a function of temperature by Coudrain-Ribstein et al. (1998). Calculated CO2 fugacity
values for the Ketzin injection site at a temperature of 36 °C are in the range of typical CO2 fugacity in
sedimentary formations for the corresponding temperature. This comparison suggests that the
measured pH value is reliable and that the carbonate system is reliably constrained for this case-
study. Indeed, the pH and carbonate system can be easily altered during sampling in a deep
formation, mainly because of CO2 outgassing.
Figure 9 shows the saturation indices of calcite, dolomite (medium-ordered dolomite), microcline,
albite (low-ordered albite), anorthite, a Mg-chlorite (clinochlore), a Na-zeolite (analcime), quartz,
anhydrite, kaolinite and dawsonite calculated using the SCALE2000, SandiaLab and Thermoddem
databases. Stuttgart Fm porewater, with Al content adjusted to achieve illite equilibrium, is close to
equilibrium with microcline, albite, analcime, quartz, anhydrite and dawsonite. A good agreement
between databases is observed for these phases. Dolomite is slightly oversaturated when using the
SCALE2000 and SandiaLab databases but undersaturated using the Thermoddem database. A similar
difference in saturation state is obtained for kaolinite, which is oversaturated according to the
SandiaLab and Thermoddem databases but is undersaturated using the SCALE2000 database.
Anorthite and clinochlore are strongly undersaturated with the three databases. However, an
important difference is observed between clinochlore saturation indices calculated with the
SCALE2000 database and using the SandiaLab and Thermoddem databases. One can then expect
different evolutions of the system after CO2 perturbation, depending on the database.
3.1.3 STEP 2: Acidification of Ketzin brine by CO2
In this second step, the effect of CO2 on the formation brine is simulated, without considering
interactions with the rock at this stage. Under the injection pressure (1.5 times the formation
pressure of about 75 bars) and temperature (36 °C) conditions at the Ketzin injection site, CO2
17
fugacity is 56.8 bars. The initial formation brine is equilibrated with such a CO2 fugacity to calculate
the brine composition and speciation with maximal CO2 perturbation. Several mixings between CO2-
perturbed (100 %) and non-perturbed (0 %) end-member brines are then computed, leading to
brines acidified at different levels.
Speciation, pH and saturation indices are calculated for the different resulting solutions using the
SCALE2000, SandiaLab and Thermoddem databases (Figure 10). pH calculations show a decrease
from about 6.4 for the non-perturbed brine to about 3.1 with the SCALE2000 and Thermoddem
databases or 4.39 with the SandiaLab database for the acidified brine. pH strongly decreases even for
solutions with low percent of acidified brines. Indeed, for a 5 % acidified brine ratio the pH is
calculated at 4.21, 4.13 and 6.07 using the SCALE2000, Thermoddem and SandiaLab databases,
respectively. This decrease is to be compared with the increase in CO2 fugacity observed for mixed
solutions. In Figure 10, calcite has been elected to show the carbonate mineral saturation index
evolution and microcline for the aluminosilicate minerals. Saturation indices of these different
minerals are calculated to strongly decrease when acidified brines are considered, because of the pH
decrease. A decrease in saturation index is observed both for silicate and carbonate minerals, in spite
of the increase in dissolved carbonate content. Differences in saturation index evolution are
observed between the different databases. Higher saturation indices are calculated using the
SandiaLab database for which higher pH are calculated. Differences in saturation index are also
related to the considerations of ion interactions, since differences are observed between the
SCALE2000 and Thermoddem databases, although pH are similar in both calculations.
3.1.4 STEP 3: Evaluation of CO2 – water – rock interactions at Ketzin by
batch modeling
This step aims at estimating the long-term geochemical and mineralogical interactions between the
CO2 perturbed brine and Ketzin injection site sandstone. An interaction model is proposed for the
Ketzin site, based on the sandstone aquifer mineralogy and the observations derived from CO2
storage natural analogues and laboratory experiments, presented in section 2.1. Ketzin sandstone
has an important content in feldspars and aluminosilicate minerals such as chlorite, illite and zeolite
(Förster et al., 2010). As indicated by the feldspar alteration observations, feldspars are unstable
under present-day conditions in the formation. Feldspars are all the more unstable when the brine is
acidified as a consequence of CO2 introduction (Figure 10) and microcline saturation indices indicate
that microcline is slightly more unstable than plagioclase. Chlorite (clinochlore) also shows alteration
indications and is calculated to be strongly undersaturated in initial Ketzin brine (Figure 9) and in
acidified brines (Figure 10). Illite and analcime precipitated during sandstone diagenesis and are
18
considered at equilibrium with the aquifer porewater (Figure 9 and section 3.1.2). These
aluminosilicates were identified in section 2.1 as reactive phases likely to dissolve as a result of
interaction with CO2-rich water and saturation indices calculated for the CO2 perturbed Ketzin brine
indicate that these phases are unstable when a CO2 perturbation is considered (Figure 10).
Microcline has been selected as reactive feldspar because this phase is abundant in Ketzin sandstone
and is already partially altered and, consequently, more sensitive to another perturbation.
Microcline, clinochlore, analcime and Mg-illite are then introduced in the interaction model as
phases that can dissolve (Table 3). With regards to the minerals that can precipitate as a result of
high CO2 content in water and the dissolution of primary minerals, kaolinite, quartz or chalcedony
and carbonate minerals were identified in section 2.1 to precipitate in almost all natural analogues
and during laboratory experiments. Kaolinite, chalcedony and dolomite are then introduced into the
interaction model for Ketzin as phases allowed to precipitate. Chalcedony has been preferred over
quartz because it can form more easily and is often observed as secondary silica phase. Dolomite has
been selected because precipitations of Ca, Mg (and Fe) carbonates are generally observed in the
natural analogues rather than pure Ca or Mg carbonates. Furthermore, Mg is expected to be released
in solution if clinochlore and Mg-illite dissolve. In addition to these secondary phases, dawsonite is
also introduced into the CO2-water-rock model for Ketzin as a potential secondary phase. This choice
has been made because Ketzin sandstone has large amounts of reactive aluminosilicate minerals and
sandstones with similar composition that have been subject to CO2 perturbation exhibit dawsonite
precipitation.In particular, Ketzin sandstone has a composition similar to the sandstone of the
Songliao Basin analogue where dawsonite has been observed (Liu et al., 2011). At Ketzin reservoir
temperature (36 °C), dawsonite precipitation can perhaps be slow (Hellevang et al., 2011), but
dawsonite precipitation has been observed in natural analogues for temperatures ranging for 25 to
120 °C and can then take place at Ketzin.
Calculation results for the Ketzin injection site are shown in Figure 11, where the cumulated mineral
evolution over 1000 years is expressed as variations in mineral %wt within the rock. Analcime is the
main mineral to dissolve as a result of sandstone interaction with CO2-rich brine. Up to 2 % of
analcime is calculated to dissolve for the acidified brine. Analcime dissolution is less important when
a mix of initial and acidified brines is considered and its dissolution increases regularly with the ratio
of acidified brine. Other minerals allowed to dissolve evolve at low and non-representative amounts.
A maximum of 0.016 % of illite is predicted to dissolve while less than 0.0001 % of clinochlore and
0.000008 % of microcline are calculated to dissolve (not shown in Figure 11). The main simulated
precipitations are chalcedony and dawsonite (up to 1 % each for the acidified brine). Dissolved and
precipitated amounts increase regularly with the ratio of acidified brine. Some differences in the
19
results are observed between the different databases. A little more analcime is calculated to dissolve
using the SandiaLab database and a little more chalcedony also precipitates. Using the SandiaLab
database, limited amounts of dolomite and kaolinite are also calculated to precipitate, while these
minerals are not observed (or at very small amounts) with the two other databases. More noticeable
differences between databases then occur for minerals precipitating or dissolving at very limited
amounts. When the initial brine is considered, mineralogy does not evolve or does so to a very
limited extent.
Regarding the evolution of the modeled system over time, in the present batch conditions without
sustaining the CO2 perturbation, aluminosilicate saturation indices become positive or null after
relatively few dissolution steps. Dissolution then stops or becomes very limited after several tens of
years. The time needed to reach system equilibrium tends to increase when more acidified brines are
considered. Brine pH values increase during system evolution and these values are similar once
system equilibrium is reached, whatever the acidified brine mixing ratio of the solution. Final pH
values are 6.30, 7.46 and 6.66 using the SCALE2000, SandiaLab and Thermoddem databases,
respectively. Solute component contents remain relatively stable over system evolution with a small
increase in Al and Mg, but most components released by aluminosilicate dissolution are calculated to
reprecipitate. Even the decrease in carbonate content due to dawsonite and dolomite precipitation
tends to be limited.
3.2 In Salah
3.2.1 Site presentation
In Salah is located in the Sahara desert in Algeria and the methane production and CO2 injection
project is developed jointly by BP, Statoil and Sonatrach at the Carboniferous Krechba gas field. The
produced gas contains up to 10 % of CO2 while export sales require concentrations less than 0.3 %.
To achieve this limit, 17 Mt of CO2 have been separated and geologically stored over 20 years since
2004. At the In Salah site (Figure 8), a 20 m thick sandstone of Tournaisian age known as ’C10’
sandstone forms the principal reservoir in an anticlinal structure for gas production but also for CO2
injection. It is overlaid by over 950 m of Carboniferous mudstones forming an efficient seal. The
producing wells are located in the hydrocarbon gas column on the crest of the structure and CO2 is
injected through 3 wells on the flanks of the reservoir, below the gas – water contact. The reservoir
lies at depths of around 1800 m below the surface and comprises fine-grained quartzose sandstones.
According to the site description given within the CO2ReMoVe FP6 European project (Wildenborg et
al., 2009; Vong et al., 2010), porosities range from 13 to 20 % and permeabilities are highly variable
20
as a function of the chlorite content, but average around 10 mD. Temperature and pressure in the
reservoir are about 96 °C and 180 bars, respectively. Brine salinity is about 170 g L-1, with Na, Ca and
Cl as main components. The injected gas is composed of CO2 at concentrations higher than 99 % and
by trace amounts of methane, nitrogen and other components (including heavy alkanes, benzene
and toluene).
3.2.2 STEP 1: Initial reservoir conditions at the In Salah site
The composition of a water sample taken in November 2004 at the bottomhole of one of the CO2
injection wells (Kb502) has been provided through the CO2ReMoVe project as representative of the
‘C10’ Tournaisian sandstone porewater (Table 2). This water has a TDS of about 175 g L-1 and is
mainly composed of Na, Ca and Cl, with noticeable amounts of Mg. Note that the Al content is
missing for this water. Solution electroneutrality is achieved, with an error of less than 0.1 %.
The Tournaisian sandstone at the In Salah injection site is mainly composed of quartz (between 69.9
and 88.5 %). Further detrital phases are mica and illite (about 5 %). the main authigenic minerals are
Fe-rich chlorite (from 5 to 10 %) and siderite (from 1.2 to 11.7 %). Small amounts (less than 1 % each)
of pyrite, dolomite and kaolinite also compose the In Salah reservoir. Diagenesis consisted first in
cementation of chlorite, siderite, Fe-dolomite and pyrite. This first cementation was followed by
chalcedony precipitation and, then, by a dissolution event which mainly affected the detrital clays,
chlorite and pyrite. The last observed diagenetic event was a minor precipitation of kaolinite.
As the last authigenic mineral to precipitate, kaolinite can be assumed to be at equilibrium with
present-day formation water. Therefore, the missing Al content is adjusted to achieve kaolinite
equilibrium. Solution speciations recalculated at reservoir temperature (96 °C) with the SCALE2000,
SandiaLab and Thermoddem databases give pH values of 5.55, 5.16 and 5.33, while the pH value
measured after sampling is 5.20 (Table 2). Calculated carbon dioxide fugacities are similar, with log
values of -0.57, -0.51 and -0.49 using the SCALE2000, SandiaLab and Thermoddem databases,
respectively. These values are in the range of CO2 fugacities measured in sedimentary basins for a
temperature corresponding to the In Salah reservoir temperature (Coudrain-Ribstein et al., 1998),
suggesting pH and carbonate system are reliable for the In Salah formation water.
Figure 12 shows the saturation indices calculated at 98 °C with Al content set at kaolinite equilibrium
using the different databases for calcite, dolomite, illite, clinochlore, quartz, anhydrite and
dawsonite. According to these calculations, calcite, dolomite, quartz and anhydrite are close to
equilibrium in the brine. Illite, clinochlore and dawsonite equilibrium states are uncertain because of
differences between databases. A good agreement between databases is obtained for quartz and
21
anhydrite saturation indices. For calcite and dolomite, slight differences are observed but minerals
are oversaturated using the SCALE2000 database and undersaturated using the SandiaLab and
Thermoddem databases. Strong differences in aluminosilicate saturation indices are calculated
according to the database used. The same reaction constants for illite and clinochlore are used in the
SCALE2000 and Thermoddem databases but not in the Sandialab database. These differences in
saturation indices are then partly due to reaction constant differences but mostly to differences
related to the ion interaction treatments, as illustrated by the differences in the Al3+ activity
coefficient calculated in Figure 6 depending on whether Pitzer interaction parameters for Al are
considered or not. A difference in saturation indices is also observed for dawsonite, because of the
differences in Al behavior in solution when the different databases are used.
3.2.3 STEP 2: Acidification of In Salah brine by CO2
Acidification of the In Salah injection site brine is made considering a CO2 fugacity of 143.8 bars,
corresponding to the fugacity calculated for 1.5 times the 180 bars formation pressure at a
temperature of 96 °C. In Figure 13, pH is shown to decrease from 5.55 to 3.43 using the SCALE2000
database, from 5.16 to 2.80 using the SandiaLab database and from 5.33 to 3.06 using the
Thermoddem database. pH decreases significantly even for low acidified brine ratios. Saturation
indices are also calculated to decrease with respect to their initial values in the reference brine.
Noticeable differences in saturation indices for acidified brines are obtained with the different
databases. For 100 % acidified brine, calcite saturation index is -1.2 with the SCALE2000 database, -
2.4 with the SandiaLab database and -2.2 with the Thermoddem database. For illite, this difference is
even more pronounced with a saturation index of around -11 with the SCALE2000 and Thermoddem
databases and a saturation index of -18.5 using the SandiaLab database. Differences in saturation
index increase with the percent of acidified brine. Carbon dioxide fugacities of the mixed solutions
are similar using the different databases and notably increase even for solutions with the lowest
acidified brine mixing ratios.
3.2.4 STEP 3: Evaluation of CO2 – water – rock interactions at In Salah by
batch modeling
The interaction model for simulating interactions between CO2-rich brine and the sandstone at the In
Salah injection site is based on the rock mineralogy. In Salah sandstone is mainly composed of quartz,
which is a phase with a relatively weak reactivity. The rock forming aluminosilicate minerals expected
to dissolve as a consequence of interaction with CO2-rich brine are illite, mica and chlorite. Note that
there are no feldspars in this sandstone. One of the latest events during rock diagenesis was
dissolution of clays and chlorite. Therefore, these phases are not at equilibrium with the brine prior
22
to CO2 injection. Because of database differences, calculated saturation indices (Figure 12) cannot
confirm these petrological observations. Furthermore, these phases are likely to dissolve in contact
with acidified brines (Figure 13 and section 2.1). Mg-illite and clinochlore are then considered as the
phases able to dissolve in the interaction model for In Salah (Table 3). Carbonate minerals (siderite
and dolomite) precipitated during the rock evolution and can precipitate in CO2-rich brine when
cations are released by aluminosilicate dissolution. Dolomite is then considered in the model as a
mineral allowed to precipitate. Chalcedony and kaolinite are also allowed to precipitate as a
consequence of illite and clinochlore dissolution (section 2.1). Dawsonite precipitation seems unlikely
in In Salah sandstone. Indeed, this sandstone has little amounts of reactive minerals and the study of
CO2 storage natural analogues showed that dawsonite is observed to precipitate in sandstone with
elevated relative contents in aluminosilicates (section 2.1). In Figure 1, the In Salah composition is
covered in the composition range of the Bowen-Gunnedah-Sydney Basin analogue. This analogue
contains dawsonite but a heterogeneous composition is reported for it (Baker et al., 1995) without
being precise whether dawsonite is observed for all sandstone types. Given the observations
provided by other analogues, it is not very probable that dawsonite precipitates in a sandstone with
In Salah sandstone composition and, therefore, it will not be considered in the interaction model.
Results of mineralogy changes calculated with the interaction model are shown in Figure 14.
Important differences are observed depending on the database. Up to 3 % of illite is expected to
dissolve using the SandiaLab database, while approximately half this amount dissolved using the
Thermoddem database and less than 0.1 % of illite is found to dissolve using the SCALE2000
database. The second mineral allowed to dissolve, namely clinochlore, dissolves at limited amounts,
0.15 % at a maximum, for all the databases. Precipitations are influenced by the noticeable
differences in dissolution between databases. Indeed, up to 2.5 % of kaolinite and up to 0.6 % of
chalcedony precipitate using the SandiaLab database, while about half this amount precipitates using
the Thermoddem database. Using the SCALE2000 database, no kaolinite is calculated to precipitate
and less than 0.1 % of chalcedony precipitates. Precipitation of dolomite is also predicted, with less
difference between databases. The evolution of dolomite precipitation with the increase in the
acidified brine mixing ratio seems irregular, contrary to illite dissolution evolution and kaolinite and
chalcedony precipitation evolutions, which are regular. No significant mineralogical modifications are
simulated when the initial brine is considered in the interaction model.
In the case of In Salah CO2 injection simulation, very different results are obtained as a function of
the databases. While limited mineralogical modifications are expected using the SCALE2000
database, relatively important changes are observed using the SandiaLab database. However, the
23
most important differences do not concern dolomite precipitation, which contributes to CO2 mineral
trapping.
The water evolution shows a pH increase during the simulations (Figure 14) but, contrary to the
Ketzin case, different final pH values are obtained depending on the acidified brine mixing ratio of
the initial solution. The pH value further increases using the database predicting the most reactive
system (i.e. the SandiaLab database), up to being buffered at non-perturbed brine pH values for the
solutions with the lowest acidified brine mixing ratios.
3.3 Snøhvit
3.3.1 Site presentation
Snøhvit is an offshore CO2 injection site located in the south western Barents Sea in Norway in the
central part of the Hammerfest Basin. CO2 is re-injected after its separation from methane produced
at the Snøhvit, Albatross and Askeladd fields, which contain 5 to 8 % of CO2. The Snøhvit production
and injection site is operated by Statoil and owned by Statoil, Petoro, Total E&P, GDF Suez, Hess and
RWE-Dea. Injection started in 2008 and about 23 Mt of CO2 are planned to be injected over the 30
year lifespan of the project. The reservoir lithostratigraphic formations are late Triassic – Middle
Jurassic formations called Fruholmen, Tubåen, Nordmela and Stø and are mainly composed of
sandstones interbedded with thin shale layers (Linjordet and Grung Olsen, 1992). They are overlaid
by Jurassic shale and thick Cretaceous shale caprocks (Figure 8). Natural gas is extracted from the Stø
Fm reservoir and CO2 is re-injected into the Tubåen saline aquifer and into the Stø Fm since 2011
after unexpected pressure increase in the Tubåen Fm (Hermanrud et al., 2013). The Tubåen aquifer
has a thickness of about 45 to 75 m and is situated below the Stø Fm, at a depth of 2600 m. The
Nordmela formation is sandwiched by the Tubåen and Stø formations and a shale-rich level of the
Nordmela Fm acts as a caprock for the CO2 storage. The Tubåen Fm is dominated by sandstones with
subordinate shales and minor coals. The Tubåen aquifer porosity and permeability range from 10 to
15 % and 185 to 883 mD, respectively. Reservoir pressure and temperature are 285 bars and 98 °C,
respectively. A high salinity of about 160 g L-1 is measured in the Tubåen aquifer. The injected gas is
mainly composed of CO2 (99.8 %) with trace amounts of methane and heavy alkanes (Vong et al.,
2010).
3.3.2 STEP 1: Initial reservoir conditions at the Snøhvit site
Relatively little information is available on the Tubåen Fm at Snøhvit, where CO2 is injected. However,
sufficient data for its geochemical characterization can be deduced from the overlying Stø Fm
exploited gas reservoir, which is better characterized. Some information from the Stø Fm can be used
24
for the Tubåen Fm because no sedimentary hiatuses are observed between these two formations
and because X-ray, neutron porosity and sonic logs (Linjordet and Grung Olsen, 1992) show similar
trends for both formations.
The composition of a brine sampled by Statoil in the Tubåen Fm (well 7121/4-1) prior to CO2 injection
is reported in Table 2. Contents in minor components such as Ni, Fe and SiO2 were deduced by
Rochelle et al. (2007) from CO2 – rock interaction experiments using Tubåen Fm sandstone. However
Al content is missing in the water analysis. Tubåen Fm brine has a TDS of about 160 g L-1 and is mainly
composed of Na and Cl, with subordinate content in Ca. Brine is charge balanced, with a 0.2 % error.
No precise mineralogical and petrological descriptions of the Tubåen Fm sandstone are available.
However the Stø and Tubåen formations have similar lithologies (Linjordet and Grung Olsen, 1992),
with more argillaceous layers in the Tubåen Fm than in the Stø Fm. The mineralogy of the Stø Fm
(Linjordet and Grung Olsen, 1992) is consequently considered here for the Tubåen Fm. Detrital
minerals are mainly quartz with 80 to 90 % of monocrystalline quartz, polycrystalline quartz and
chert. Further detrital phases are mica, K-feldspar, plagioclase, metamorphic and sedimentary rock
fragments and heavy minerals. Quartz is the main cementing material. Cement is also composed of
ankerite, dolomite, calcite, kaolinite, illite and pyrite.
In the absence of a precise diagenetic evolution description, illite is assumed to be at equilibrium
with the actual formation water. Indeed, kaolinite and K-feldspar are expected to react together to
form illite, which is observed as an authigenic mineral in the sandstone. Missing Al content is then
adjusted to achieve solution equilibrium with Mg-illite. Solution speciation is recalculated at reservoir
temperature (98 °C) using the SCALE2000, SandiaLab and Thermoddem databases. Calculated pH at
reservoir temperature (6.19, 6.11 and 6.21, with the respective databases) is similar to the pH
measured at surface conditions (6.20). Carbon dioxide fugacity log values of -0.42, -0.44 and -0.40 are
calculated using the SCALE2000, SandiaLab and Thermoddem databases, respectively. These CO2
fugacity values are in the range of measured and predicted CO2 fugacity values in sedimentary basins
at Tubåen Fm temperature (Coudrain-Ribstein et al., 1998). This observation suggests that outgassing
and perturbation of the carbonate system equilibrium were limited during brine sampling. This brine
can consequently be considered as representative of the Tubåen Fm porewater.
Saturation indices of calcite, dolomite, microcline, albite, kaolinite, Mg-chlorite, quartz, anhydrite
and dawsonite calculated using the SCALE2000, SandiaLab and Thermoddem databases are shown in
Figure 15. Saturation indices of aluminosilicate minerals (kaolinite and chlorite) and dawsonite
calculated for Snøhvit injection reservoir water show noticeable differences, depending on the
database used for the calculations. In particular, saturation indices calculated with the SCALE2000

25
database are different to saturation indices calculated using the SandiaLab and Thermoddem
databases. Similar saturation indices are calculated with the three databases for further minerals
shown in Figure 15 (calcite, dolomite, quartz and anhydrite). These differences concern only Al-
bearing minerals, suggesting they are related to differences in Al behavior using the SCALE2000,
SandiaLab and Thermoddem databases. Aluminosilicates are, depending on the database, slightly
oversaturated to strongly oversaturated in the Tubåen Fm porewater. Calcite and dolomite are also
oversaturated, while quartz is at equilibrium and anhydrite is slightly undersaturated.
3.3.3 STEP 2: Acidification of Snøhvit brine by CO2
For the Snøhvit injection site case-study, a CO2 fugacity of 207.9 bars is calculated considering 1.5
times the 300 bars formation pressure at a temperature of 98 °C. As a consequence of brine
equilibrium with such a CO2 fugacity, the pH value is calculated to decrease from about 6.3 to about
3.5 (Figure 16). pH values calculated with the three different databases show small differences. Small
differences between databases are also noted for the calcite saturation index (Figure 16), which
decreases to a minimal value of -1.6. Stronger differences are observed for aluminosilicate mineral
saturation indices. For example, microcline saturation index for 100 % acidified brine is -7.2 and -9.7
using the SCALE2000 and SandiaLab databases, respectively, while it is only -3.9 using the
Thermoddem database. Same CO2 fugacities are calculated for a same mixing factor using the three
databases.
3.3.4 STEP 3: Evaluation of CO2 – water – rock interactions at Snøhvit by
batch modeling
The same approach as in previous case-studies is undertaken to evaluate the long-term interactions
between sandstone and CO2-rich brine at the Snøhvit injection site. The Snøhvit target reservoir for
CO2 injection is mainly composed of quartz, both as detrital component and as cement. Rock-forming
aluminosilicate minerals likely to react with CO2-rich brine are feldspars, mica, chlorite (as
metamorphic and sedimentary fragment) and illite (section 2.1). Furthermore, these minerals are
undersaturated in acidified Snøhvit brine (Figure 16). In the interaction model for Snøhvit, microcline
and Mg-chlorite are introduced as minerals allowed to dissolve (Table 3), following kinetic laws. Ca-,
Mg- and Fe-carbonates, kaolinite and quartz are already present in the sandstone reservoir and these
minerals can precipitate as a consequence of rock interaction with CO2-rich brine (section 2.1).
Dolomite, kaolinite and chalcedony are allowed to precipitate in the interaction model, at
equilibrium. Dawsonite is not expected to form because the Snøhvit sandstone initial composition,
with little amounts of reactive minerals, does not correspond to any sandstone composition in which
dawsonite is observed, according to CO2 storage natural analogues (section 2.1 and Figure 1).
26
Relatively limited amounts of minerals are calculated to dissolve and precipitate in the Snøhvit case
(Figure 17). At most, for the acidified brine, 0.15 % of microcline and 0.07 % of clinochlore dissolve.
Chalcedony, dolomite and kaolinite precipitate in a similar range of proportions and at limited
amounts; i.e. less than 0.1 % at a maximum for each mineral. Note that no kaolinite precipitates
using the SCALE2000 database, while the most important dolomite precipitations are calculated with
this database. Largest microcline dissolutions are obtained using the SandiaLab database, as well as
the most important chalcedony and kaolinite precipitations.
During system evolution, brine pH increases but its variation is lower than for the Ketzin and In Salah
cases. This low pH buffering by the Snøhvit geochemical system is related to the lower reactivity of
the system compared with the other case-studies. Using the different databases, pH values range in
approximately 0.5 pH units.
4 Discussion The characterization of the baseline geochemical systems of Ketzin, In Salah and Snøhvit CO2
injection sites has highlighted three cases that are relatively different regarding their reactivity.
Ketzin sandstone has high contents of reactive minerals while the two other sandstones are mainly
composed of quartz. Amongst the two quartz-rich sandstones, the In Salah initial porewater is more
acidic than the Snøhvit porewater, suggesting that dissolution of minerals in In Salah sandstone is
likely to be more pronounced than in Snøhvit sandstone. Based on the mineralogical and petrological
observations, a reactive model has been proposed for each case-study in the presence of CO2. For
dissolution, these models consider mineral phases present in the rock and expected to be altered by
a CO2-rich brine according to the general conceptual model based upon the laboratory experiments
and natural analogue observations. Several aluminosilicates were selected for dissolution for each
site but these minerals did not necessarily dissolve because the dissolution of an aluminosilicate can
prevent another aluminosilicate from dissolving by switching its thermodynamic state to
oversaturation. Dolomite, chalcedony and kaolinite were selected in all cases because these phases
are commonly observed as secondary minerals in CO2 storage natural analogues for all sandstone
compositions. Dawsonite has been selected only for the Ketzin storage site, the reservoir of which
contains large proportions of reactive minerals such as zeolite, feldspars and clay minerals. The
conceptual model has highlighted that the possibility of dawsonite precipitation in a sandstone
consequent to CO2 seepage is strongly dependent on the sandstone composition (Figure 1). Indeed,
dawsonite precipitation is rarely observed in natural analogues with high quartz contents and low
clay contents but can precipitate in rocks with higher reactive mineral contents.
27
These differences in apparent reactivity between case-studies leading to the establishment of
different models are logically observed in the simulation results. First of all, the Snøhvit case-study
was identified as having potentially a low reactivity and presents very limited mineralogical changes
after 1000 years of interaction for both acidified brine mixing ratios of the reacting solutions. pH
buffering also seems limited. The most reactive case is effectively Ketzin, for which zeolite (analcime)
is the most unstable primary aluminosilicate mineral under these conditions and up to 1 % of
dawsonite is simulated to precipitate. Such a dawsonite precipitation after zeolite alteration is
reported for the Cerro Barcino Formation CO2 storage natural analogue, where up to 25 % of
dawsonite is observed to precipitate (Zalba et al., 2011). A buffering of pH was also obtained for all
degrees of CO2 perturbation. For the In Salah site using the SandiaLab database, higher amounts of
primary silicates are simulated to dissolve than for the Ketzin case, but this higher dissolution is not
observed with the other databases. At In Salah, the precipitation of carbonates (dolomite) is also
more restricted than at Ketzin.
Chlorite (clinochlore) is observed to be the main phase to dissolve at the In Salah and Snøhvit
injection sites. Chlorite has already been shown in previous studies to preferentially dissolve in
thermodynamic conditions corresponding to CO2 disposal in sandstone layers (Khim et al., 2012).
However, when present in the sandstone, zeolite is even more reactive than chlorite, as observed for
the Ketzin site. Considering the most reactive case, only 1 % of carbonate minerals are calculated to
precipitate. This suggests that mineralogical changes are limited in the presence of an acidic CO2-rich
brine. However, it is not possible to quantify CO2 mineral trapping with such batch calculations
considering only an input of CO2 as dissolved CO2 at the beginning of the calculations (Fig. 6). Indeed,
here the perturbation in CO2 is not maintained over time whereas, in a storage, the gas phase
maintains high aqueous CO2 contents when dissolved CO2 is consumed by mineral reactions. In the
present calculations, partial return to system equilibrium tends to consume a large proportion of the
initially introduced CO2, but the reactivity is kinetically controlled and the carbonation rate will not
necessarily be higher if the CO2 perturbation is maintained. Hydrodynamics also play a crucial role in
CO2 behavior in a deep aquifer, including on the system reactivity. In particular, chemical dynamics
can establish within the reservoir with carbonate dissolution in some parts of the reservoir and
precipitation in other parts (Audigane et al., 2007; Neufeld et al., 2010). Therefore, an extrapolation
of the contribution of the different trapping mechanisms from these calculations appears hazardous.
In our calculations, mineral precipitation was assumed to occur at equilibrium, without kinetic
constraints, for calculation time reasons and because of uncertainties in the kinetic parameters to be
used for precipitation reactions. This assumption can be made since the objective of this work is to
28
consider long-term reactivity (1000 years or more). Moreover, the precipitations are limited by the
dissolution of the primary minerals, including during the first calculation time-steps because
secondary minerals are initially undersaturated in most acidified brines, as shown in Figure 10, Figure
13 and Figure 16.
Regarding the calculation method, it is also important to point out that the dissolution kinetics
introduces a correction of 0.001 on the reactive surface area. This correction is in the range of
corrections commonly applied in modeling studies using laboratory kinetic data at the natural system
scale, where only part of the mineral surface is involved in the fluid-rock reaction (Gaus, 2005; Zerai
et al., 2006; Xu et al., 2010). The reactive surface area always shows a strong uncertainty in a
calculation and the selection of the correction factor can lead to noticeable overestimations or
underestimations (White and Brantley, 2003; Ganor et al., 2007).
In order to evaluate the possible effect of the thermodynamic database on the simulation results, the
calculations were performed for the three case-studies using the Thermoddem, SCALE2000 and
SandiaLab databases. These three databases were selected from six databases after comparing
calculated mineral solubility with experimental data. This preliminary comparison exercise
highlighted the importance of using the Pitzer equations (Pitzer et al., 1973) as activity model when
saline solutions are considered. The B-dot activity model, such as used with the Thermoddem
database, is not sufficient to represent system behavior at high salinity (typically, beyond that of
standard seawater). Between the three case-studies, using a given database does not tend to
systematically favor or inhibit the system reactivity with the exception that mineral changes seem
perhaps more pronounced when the SandiaLab database is used. However, fundamental differences
in the geochemical system behavior are observed for the In Salah and Snøhvit case-studies as a
function of the database used in the calculations. For the In Salah case, an important dissolution of
illite and an important precipitation of kaolinite are calculated using the SandiaLab database while no
changes in the amounts of these minerals are obtained using the SCALE2000 database and the half of
illite dissolution and kaolinite precipitation is calculated using the Thermoddem database. The same
discrepancy is obtained for the Snøhvit case regarding microcline dissolution and kaolinite
precipitation, although dissolution and precipitation occur in more limited amounts. The evaluation
of the different databases presented in section 2.2.2 suggested that the SCALE2000 database
generally provides the most coherent results, including for the Si system at temperatures different to
25 °C. However, it should be recalled that parameters for Al species are not considered, impeding a
correct representation of Al behavior in highly saline systems. The SandiaLab database contains
Pitzer interaction parameters for Al allowing Al behavioral trends in solution to be reproduced, but

29
with a lack of accuracy that was evidenced in our tests. This lack of accuracy in the representation of
the Si and Al chemical systems in saline solutions is most likely the cause of the differences between
the results obtained using the different databases. It is difficult to conclude which reactivity case
obtained with the SCALE2000 and SandiaLab databases is the most relevant since both database
present limitations. However, it clearly illustrates the need to use a Pitzer database which includes all
relevant chemical species over large ranges of temperature. Such a database is not available at the
present time and requires further developments including the determination of many missing
interaction parameters and the assessment of the global coherence of the database.
Another limitation related to the use of the Pitzer activity model concerns the redox. Redox reactions
cannot be considered because the electron interaction has not been parameterized in saline
solutions. As a consequence, an Fe or S system including Fe- or S-bearing minerals cannot be
considered in these calculations because the behavior of these species is strongly dependent on
redox.
Therefore, the calculations carried out in this study show uncertainties regarding some parameters
and limitations in the representativeness of the results at the reservoir scale. However, these
calculations make it possible to assess the possible reactivity of the storage system and evaluate
what reactions are expected over long-term periods. These calculations consist in an essential first
step before performing reactive-transport calculations considering both gas and aqueous phases.
Pitzer formalism has been implemented in various reactive-transport codes such as TOUGHREACT
(Zhang et al., 2006) or BIO-CORE2D (Zhang et al., 2005). Using an adequate database, accurate
simulations of geochemical evolution due to CO2 injection can then be carried out, including
multiphase-flow in the geological media geometry.
5 Conclusion The aim of this work was to improve the constraint on two aspects determining the confidence in
geochemical modeling of CO2 storage in deep saline sandstone aquifers, namely, the way to calculate
the interactions within the brine and the selection of the reactive mineral phases. Main results
include:
- The synthesis of observations of mineralogical changes in sandstones applied to a CO2
perturbation obtained from natural analogues and from laboratory experiments makes it
possible to determine with good confidence the primary minerals expected to react and the
minerals that are going to precipitate.
30
- The proposition of a way to identify whether dawsonite, a mineral which inclusion in models
is under debate, can be formed as a secondary mineral during interaction with CO2 from the
initial mineralogy of the sandstone. Indeed, it has been shown from a review of observations
in natural analogues that dawsonite is only observed in lithic and feldspar rich sandstones
and is not observed in quartz rich sandstones. These observations can be related to the
conditions of silica activity and pH which influence dawsonite stability.
- A method was established to assess the geochemical reactivity of the Ketzin, In Salah and
Snøhvit case-studies and to evaluate the changes in mineralogy over a long-time period.
Because of the mineralogical and chemical differences between these three CO2 storage sites
in saline sandstone aquifers, clear differences in geochemical behavior are predicted for
these case-studies, with a higher mineral trapping expected for the Ketzin site than for In
Salah and Snøhvit. This method constitutes an indispensable first step before considering
reservoir geometry, mass transport and more realistic gas phase behavior.
- Two kinds of aqueous speciation models and several thermodynamic databases associated
with these speciation models were tested. First in a comparison with experimental data, and
then for the three CO2 storage case-studies.
- Calculations using the B-dot model, an extension of the Debye-Hückel activity model, failed
in reproducing simple mineral solubilities for salinities higher than 1 mol L-1 even though the
saline waters are of NaCl type. Two B-dot model databases were tested and better results
were obtained using the Thermoddem database rather than the LLNL database.
- Calculations using the Pitzer interaction model clearly improved experimental data
reproduction and allowed mineral solubility to be captured as a function of salinity in a
relatively good manner. However, this study also points out that few Pitzer thermodynamic
databases are currently available and the two databases containing interaction coefficients
for a large number of ionic species, the SCALE2000 and SandiaLab databases, cannot
confidently calculate the aqueous interaction energies and reproduce mineral solubility in all
the physical/chemical conditions expected to be encountered in deep sedimentary aquifers.
- More experimental developments are clearly still needed to establish coherent databases for
temperature ranges from 25 to 150 °C and to perform robust geochemical simulations
involving saline solutions. It is all the more important to have reliable databases given that
geochemical reactivity calculations for the Ketzin, In Salah and Snøhvit case-studies show
strong differences as a function of the database used in the calculations.
31
Acknowledgments
This work was part of CO2ReMoVe (2006-2012) and CO2CARE (2011-2013) projects. CO2ReMoVe
project is funded by the European Commission under the 6th Framework Program for Research and
Technological Development and by the In Salah Gas Joint Industry Project (BP, Statoil, Sonatrach).
CO2CARE project is funded by the European Commission within the 7th Framework Program and also
co-financed by an industrial consortium consisting of Statoil, Shell, TOTAL, RWE, Vattenfall, and
Veolia. S. Martens (GFZ) is thanked for her comments on this paper. Two anonymous reviewers are
also gratefully acknowledged for their constructive comments which notably improved this paper.
References
Altmaier, M., Brendler, V., Bube, C., Marquardt, C., Moog, H. C., Richter, A., Scharge, T., Voigt, W.,
and Wilhelm, S., 2011. THEREDA. Thermodynamic reference database. Final Report, GRS-265,
https://www.thereda.de/.
Audigane, P., Gaus, I., Czernichowski-Lauriol, I., Pruess, K., and Xu, T., 2007. Two-dimensional reactive
transport modeling of CO2 injection in a saline aquifer at the Sleipner site, North Sea. American
Journal of Science 307, 974-1008.
Audigane, P., Lions, J., Gaus, I., Robelin, C., Durst, P., Van der Meer, B., Geel, K., Oldenburg, C. M., and
Xu, T., 2009. Geochemical modeling of CO2 injection into a methane gas reservoir at the K12-B
Field, North Sea. In: Grobe, M., Pashin, J. C., and Dodge, R. L. Eds.), Carbon dioxide sequestration
in geological media - State of the science.
Azaroual, M., Kervévan, C., Durance, M.-V., and Brochot, S., 2004. SCALE2000 (v3.1), manuel
utilisateur. BRGM.
Baines, S. J. and Worden, R. H., 2004. The long-term fate of CO2 in the subsurface: natural analogues
for CO2 storage. Geological Society, London, Special Publications 233, 59-85.
Baker, J. C., Bai, G. P., Hamilton, P. J., Golding, S. D., and Keene, J. B., 1995. Continental-scale
magmatic carbon dioxide seepage recorded by dawsonite in the Bowen-Gunnedah-Sydney Basin
system, eastern Australia. Journal of Sedimentary Research 65, 522-530.
32
Benbow, S. J., Metcalfe, R., and Wilson, J. C., 2008. Pitzer databases for use in thermodynamic
modeling. Quintessa.
Benson, S. M., and Cole, D. R., 2008. CO2 sequestration in deep geological formations. Elements 4,
325-331.
Bénézeth, P., Palmer, D. A., Anovitz, L. M., and Horita, J., 2007. Dawsonite synthesis and reevaluation
of its thermodynamic properties from solubility measurements: Implications for mineral
trapping of CO2. Geochimica et Cosmochimica Acta 71, 4438-4455.
Blanc, P., Lassin, A., and Piantone, P., 2007. Thermoddem a database devoted to waste minerals.
http://thermoddem.brgm.fr. BRGM, Orléans, France.
Blanc, P., Lassin, A., Piantone, P., Azaroual, M., Jacquemet, N., Fabbri, A., and Gaucher, E. C., 2012.
Thermoddem: A geochemical database focused on low temperature water/rock interactions and
waste materials. Applied Geochemistry 27, 2107-2116.
Cantucci, B., Montegrossi, G., Vaselli, O., Tassi, F., Quattrocchi, F., and Perkins, E. H., 2009.
Geochemical modeling of CO2 storage in deep reservoirs: The Weyburn Project (Canada) case
study. Chemical Geology 265, 181-197.
Chen, C.-T. A. and Marshall, W. L., 1982. Amorphous silica solubilities-IV. Behavior in pure water and
aqueous sodium chloride, sodium sulfate, magnesium chloride, and magnesium sulfate solutions
up to 350°C. Geochimica et Cosmochimica Acta 46, 279-288.
Coudrain-Ribstein, A., Gouze, P., and de Marsily, G., 1998. Temperature-carbon dioxide partial
pressure trends in confined aquifers. Chemical Geology 145, 73-89.
Czernichowski-Lauriol, I., Rochelle, C., Gaus, I., Azaroual, M., Pearce, J., and Durst, P., 2006.
Geochemical interactions between CO2, pore-waters and reservoir rocks. Advances in the
Geological Storage of Carbon Dioxide. In Lombardi, S., Altunina, L. K., and Beaubien, S. E. (Eds.),
NATO Science Series: IV: Earth and Environmental Sciences 65, 157-174.
Debye, P. and Hückel, E., 1923. The theory of electrolytes. I. Lowering of freezing point and related
phenomena. Physikalische Zeitschrift 24, 185-206.
Dethlefsen, F., Haase, C., Ebert, M., and Dahmke, A., 2011. Uncertainties of geochemical modeling
during CO2 sequestration applying batch equilibrium calculations. Environmental Earth Sciences,
1-13.
Duan, Z. and Sun, R., 2003. An improved model calculating CO2 solubility in pure water and aqueous
NaCl solutions from 273 to 533 K and from 0 to 2000 bar. Chemical Geology 193, 257-271.
33
Förster, A., Norden, B., Zinck-Jørgensen, K., Frykman, P., Kulenkampff, J., Spangenberg, E., Erzinger,
J., Zimmer, M., Kopp, J., Borm, G., Juhlin, C., Cosma, C.-G., and Hurter, S., 2006. Baseline
characterization of the CO2SINK geological storage site at Ketzin, Germany. Environmental
Geosciences 13, 145-161.
Förster, A., Schöner, R., Förster, H. J., Norden, B., Blaschke, A. W., Luckert, J., Beutler, G., Gaupp, R.,
and Rhede, D., 2010. Reservoir characterization of a CO2 storage aquifer: The Upper Triassic
Stuttgart Formation in the Northeast German Basin. Marine and Petroleum Geology 27, 2156-
2172.
Ganor, J., Lu, P., Zheng, Z., and Zhu, C., 2007. Bridging the gap between laboratory measurements
and field estimations of silicate weathering using simple calculations. Environmental Geology 53,
599-610.
Gao, Y., Liu, L., and Hu, W., 2009. Petrology and isotopic geochemistry of dawsonite-bearing
sandstones in Hailaer basin, northeastern China. Applied Geochemistry 24, 1724-1738.
Gaus, I., 2010. Role and impact of CO2–rock interactions during CO2 storage in sedimentary rocks.
International Journal of Greenhouse Gas Control 4, 73-89.
Gaus, I., Azaroual, M., and Czernichowski-Lauriol, I., 2005. Reactive transport modelling of the impact
of CO2 injection on the clayey cap rock at Sleipner (North Sea). Chemical Geology 217, 319-337.
Hangx, S. J. T. and Spiers, C. J., 2009. Reaction of plagioclase feldspars with CO2 under hydrothermal
conditions. Chemical Geology 265, 88-98.
Haszeldine, R., S., Quinn, O., England, G., Wilkinson, M., Shipton, Z., K., Evans, J., P., Heath, J.,
Crossey, L., Ballentine, C., J., and Graham, C., M., 2005. Analogues géochimiques naturels pour le
stockage du dioxyde de carbone en réservoir géologique poreux profond : perspective pour le
Royaume-Uni. Oil & Gas Science and Technology - Rev. IFP 60, 33-49.
Helgeson, H. C., 1968. Evaluation of irreversible reactions in geochemical processes involving
minerals and aqueous solutions I. Thermodynamic relations. Geochimica et Cosmochimica Acta
32, 853-877.
Helgeson, H. C., Brown, T. H., and Leeper, R. H., 1969. Handbook of theoretical activity diagrams
depicting chemical equilibria in geologic systems involving an aqueous phase at one Atm and 0
to 300 °C. Freeman, Cooper & Company, 253 pp.
Hellevang, H., Aagaard, P., Oelkers, E. H., and Kvamme, B., 2005. Can Dawsonite Permanently Trap
CO2? Environmental Science & Technology 39, 8281-8287.
34
Hellevang, H., Declercq, J., Kvamme, B., and Aagaard, P., 2010. The dissolution rates of dawsonite at
pH 0.9 to 5 and temperatures of 22, 60 and 77 °C. Applied Geochemistry 25, 1575-1586.
Hellevang, H., Declercq, J., and Aagaard, P., 2011. Why is Dawsonite Absent in CO2 Charged
Reservoirs? Oil Gas Sci. Technol. – Rev. IFP Energies nouvelles 66, 119-135.
Hermanrud, C., Eiken, O., Hansen, O.R., Nordgaard Bolaas, H., Simmenes, T., Teige, G., Hansen, H.
and Johansen, S., 2013. Importance of pressure management in CO2 storage. 2013 Offshore
Technology Conference, May 06 - 09, 2013 2013, Houston, TX, USA
IPCC, 2007. Special report on carbon dioxide capture and storage. Special report of the
Intergovernmental Panel on Climate Change – Summary for Policymakers and technical
summary. Intergovernmental Panel on Climate Change.
Johnson, J. W., Nitao, J. J., and Knauss, K. G., 2004. Reactive transport modelling of CO2 storage in
saline aquifers to elucidate fundamental processes, trapping mechanisms and sequestration
partitioning. Geological Society Special Publications 233, 107-128.
Johnson, J. W., Nitao, J. J., Steefel, C., and Knauss, K. G., 2001. Reactive transport modelling of
geological CO2 sequestration in saline aquifers; the influence of intra-aquifer shales and the
relative effectiveness of structural, solubility and mineral trapping during prograde and
retrograde sequestration. First Annual Conference on Carbon Sequestration, Washington.
Johnson, J. W., Oelkers, E. H., and Helgeson, H. C., 1992. SUPCRT92: A software package for
calculating the standard molal thermodynamic properties of minerals, gases, aqueous species,
and reactions from 1 to 5000 bar and 0 to 1000°C. Computers & Geosciences 18, 899-947.
Kaszuba, J. P., Janecky, D. R., and Snow, M. G., 2003. Carbon dioxide reaction processes in a model
brine aquifer at 200 °C and 200 bars: implications for geologic sequestration of carbon. Applied
Geochemistry 18, 1065-1080.
Kaszuba, J. P., Janecky, D. R., and Snow, M. G., 2005. Experimental evaluation of mixed fluid reactions
between supercritical carbon dioxide and NaCl brine: Relevance to the integrity of a geologic
carbon repository. Chemical Geology 217, 277-293.
Kaszuba, J. P., Viswanathan, H. S., and Carey, J. W., 2011. Relative stability and significance of
dawsonite and aluminum minerals in geologic carbon sequestration. Geophysical Research
Letters 38, L08404.
Ketzer, J. M., Iglesias, R., Einloft, S., Dullius, J., Ligabue, R., and de Lima, V., 2009. Water–rock–CO2
interactions in saline aquifers aimed for carbon dioxide storage: Experimental and numerical
35
modeling studies of the Rio Bonito Formation (Permian), southern Brazil. Applied Geochemistry
24, 760-767.
Kharaka, Y. K. and Hanor, J. S., 2003. 5.16 - Deep Fluids in the Continents: I. Sedimentary Basins. In:
Heinrich, D. H. and Karl, K. T. (Eds.), Treatise on Geochemistry. Pergamon, Oxford.
Kihm, J.-H., Kim, J.-M., Wang, S., and Xu, T., 2012. Hydrogeochemical numerical simulation of impacts
of mineralogical compositions and convective fluid flow on trapping mechanisms and efficiency
of carbon dioxide injected into deep saline sandstone aquifers. Journal of Geophysical Research
117, B06204.
Knauss, K. G., Johnson, J. W., and Steefel, C. I., 2005. Evaluation of the impact of CO2, co-contaminant
gas, aqueous fluid and reservoir rock interactions on the geologic sequestration of CO2. Chemical
Geology 217, 339-350.
Lagneau, V., Pipart, A., and Catalette, H., 2005. Modélisation couplée chimie-transport du
comportement à long terme de la séquestration géologique de CO2 dans des aquifères salins
profonds. Oil & Gas Science and Technology - Rev. IFP 60, 231-247.
Lasaga, A. C., Soler, J. M., Ganor, J., Burch, T. E., and Nagy, K. L., 1994. Chemical weathering rate laws
and global geochemical cycles. Geochimica et Cosmochimica Acta 58, 2361-2386.
Linjordet, A. and Grung Olsen, R., 1992. The Jurassic Snøhvit gas fields, Hammerfest Basin, offshore
Northern Norway. In: Halbouty, M. T. (Ed.), Giant oil and gas fields of the decade 1978-1988,
Proceedings of the Conference held in Stavanger, Norway, September 9-12, 1990. American
Association of Petroleum Geologists.
Linke, W. F. and Seidell, A., 1965. Solubilities of inorganic and metalorganic compounds. American
Chemical Society, Washington D.C.
Liu, N., Liu, L., Qu, X., Yang, H., Wang, L., and Zhao, S., 2011. Genesis of authigene carbonate minerals
in the Upper Cretaceous reservoir, Honggang Anticline, Songliao Basin: A natural analog for
mineral trapping of natural CO2 storage. Sedimentary Geology 237, 166-178.
Luquot, L., Andreani, M., Gouze, P., and Camps, P., 2012. CO2 percolation experiment through
chlorite/zeolite-rich sandstone (Pretty Hill Formation – Otway Basin–Australia). Chemical
Geology 294–295, 75-88.
Marchand, A. M. E., Haszeldine, R. S., Smalley, P. C., Macaulay, C. I., and Fallick, A. E., 2001. Evidence
for reduced quartz-cementation rates in oil-filled sandstones. Geology 29, 915-918.

36
Marini, L., 2006. Geological sequestration of carbon dioxide. Thermodynamics, kinetics and reaction
path modeling. Elsevier.
Marion, G. M., Catling, D. C. and Kargel, J. S., 2003. Modeling aqueous ferrous iron chemistry at low
temperatures with application to Mars. Geochimica et Cosmochimica Acta 67, 4251-4266.
Marshall, W. L. and Warakomski, J. M., 1980. Amorphous silica solubilities—II. Effect of aqueous salt
solutions at 25°C. Geochimica et Cosmochimica Acta 44, 915-924.
Marshall, W. L. and Chen, C-T. A., 1982. Amorphous silica solubilities—V. Predictions of solubility
behavior in aqueous mixed electrolyte solutions to 300°C. Geochimica et Cosmochimica Acta 46,
289-291.
Martens, S., Kempka, T., Liebscher, A., Lüth, S., Möller, F., Myrttinen, A., Norden, B., Schmidt-
Hattenberger, C., Zimmer, M. and Kühn, M., 2012. Europe’s longest-operating on-shore CO2
storage site at Ketzin, Germany: a progress report after three years of injection. Environmental
Earth Sciences 67, 323-334.
Michael, K., Arnot, M., Cook, P., Ennis-King, J., Funnell, R., Kaldi, J., Kirste, D., and Paterson, L., 2009.
CO2 storage in saline aquifers I—Current state of scientific knowledge. Energy Procedia 1, 3197-
3204.
Moore, J., Adams, M., Allis, R., Lutz, S., and Rauzi, S., 2005. Mineralogical and geochemical
consequences of the long-term presence of CO2 in natural reservoirs: An example from the
Springerville–St. Johns Field, Arizona, and New Mexico, U.S.A. Chemical Geology 217, 365-385.
Neufeld, J. A., Hesse, M. A., Riaz, A., Hallworth, M. A., Tchelepi, H. A., and Huppert, H. E., 2010.
Convective dissolution of carbon dioxide in saline aquifers. Geophys. Res. Lett. 37, L22404.
Okuyama, Y. and Take, S., 2011. Dawsonite-aragonite association in the Cretaceous Izumi Group, SW
Japan: Evidence of CO2-rich fluid invasion in the area of classical study. Journal of Mineralogical
and Petrological Sciences 106, 79-84.
Palmer, D. A. and Wesolowski, D. J., 1992. Aluminum speciation and equilibria in aqueous solution: II.
The solubility of gibbsite in acidic sodium chloride solutions from 30 to 70°C. Geochimica et
Cosmochimica Acta 56, 1093-1111.
Parkhurst, D. L. and Appelo, C. A. J., 1999. User's guide to PHREEQC (Version 2)--a computer program
for speciation, batch-reaction, one-dimensional transport, and inverse geochemical calculations.
U.S. Geological Survey.
37
Pauwels, H., Gaus, I., le Nindre, Y. M., Pearce, J., and Czernichowski-Lauriol, I., 2007. Chemistry of
fluids from a natural analogue for a geological CO2 storage site (Montmiral, France): Lessons for
CO2–water–rock interaction assessment and monitoring. Applied Geochemistry 22, 2817-2833.
Pearce, J. M., Holloway, S., Wacker, H., Nelis, M. K., Rochelle, C., and Bateman, K., 1996. Natural
occurrences as analogues for the geological disposal of carbon dioxide. Energy Conversion and
Management 37, 1123-1128.
Pearce, J. M., Kirby, G. A., Lacinska, A., Bateson, L., Wagner, D., Rochelle, C. A., and Cassidy, M., 2011.
Reservoir-scale CO2 -fluid rock interactions: Preliminary results from field investigations in the
Paradox Basin, Southeast Utah. Energy Procedia 4, 5058-5065.
Pinti, D. L. and Marty, B., 1995. Noble gases in crude oils from the Paris Basin, France: Implications for
the origin of fluids and constraints on oil-water-gas interactions. Geochimica et Cosmochimica
Acta 59, 3389-3404.
Pitzer, K. S., 1973. Thermodynamics of electrolytes, 1, Theoretical basis and general equations.
Journal of Physical Chemistry 77, 268-277.
Pitzer, K. S., 1991. Activity coefficients in electrolyte solutions. Boca Raton, CRC Press.
Pruess, K. and García, J., 2002. Multiphase flow dynamics during CO2 disposal into saline aquifers.
Environmental Geology 42, 282-295.
Rochelle, C., Pearce, J. M., Shaw, R., Taylor, H., Turner, G., and Williams, C., 2007. Geochemical
interactions between CO2 and host rocks at the Snøhvit field. Results of fluid-rock interaction
experiments. British Geological Survey Commissioned Report CR/07/218.
Smith, J. W. and Milton, C., 1966. Dawsonite in the Green River Formation of Colorado. Economic
Geology 61, 1029-1042.
Taberner, C., Zhang, G., and Catwright, L., 2009. Injection of Supercritical CO2 into Deep Saline
Carbonate Formations, Predictions from Geochemical Modeling. 2009 SPE EUROPEC/EAGE
Annual Conference and Exhibition, Amsterdam, The Netherlands.
Truesdell, A.H. and B. F. Jones, 1974. WATEQ a computer program for calculating chemical equilibria
of natural waters. Journal of Research of the U.S. Geological Survey 2, 233-248
USDOE, 2007. In-Drift Precipitates/Salts Model. United States Department of Energy (USDOE).
38
Vong, C. Q., Jacquemet, N., Audigane, P. and Frykman, P., 2010. Compilation of geochemical data and
injected gas compositions for modeling of fluid-rock reactions in the In Salah, Snøhvit, Ketzin
and Sleipner CCS sites. CO2REMOVE, Deliverable D2.2.2C+D, restricted access.
Watson, M. N., Zwingmann, N., and Lemon, N. M., 2004. The Ladbroke Grove–Katnook carbon
dioxide natural laboratory: A recent CO2 accumulation in a lithic sandstone reservoir. Energy 29,
1457-1466.
White, A. F. and Brantley, S. L., 2003. The effect of time on the weathering of silicate minerals: why
do weathering rates differ in the laboratory and field? Chemical Geology 202, 479-506.
White, A. F. and Brantley, S. L., 2003. The effect of time on the weathering of silicate minerals: why
do weathering rates differ in the laboratory and field? Chemical Geology 202, 479-506.
Wiese, B., Böhner, J., Enachescu, C., Würdemann, H., and Zimmermann, G., 2010. Hydraulic
characterisation of the Stuttgart formation at the pilot test site for CO2 storage, Ketzin,
Germany. International Journal of Greenhouse Gas Control 4, 960-971.
Wildenborg, T., Bentham, M., Chadwick, A., David, P., Deflandre, J.-P., Dillen, M., Groenenberg, H.,
Kirk, K., Le Gallo, Y., 2009. Largescale CO2 injection demos for the development of monitoring
and verification technology and guidelines (CO2ReMoVe), GHGT 9, Energy Procedia 1, 2367-
2374.
Wilkinson, M., Haszeldine, R. S., Fallick, A. E., Odling, N., Stoker, S. J., and Gatliff, R. W., 2009. CO2–
Mineral Reaction in a Natural Analogue for CO2 Storage—Implications for Modeling. Journal of
Sedimentary Research 79, 486-494.
Wolf, M., Breitkopf, O., and Puk, R., 1989. Solubility of calcite in different electrolytes at
temperatures between 10° and 60°C and at CO2 partial pressures of about 1 kPa. Chemical
Geology 76, 291-301.
Worden, R. H., 2006. Dawsonite cement in the Triassic Lam Formation, Shabwa Basin, Yemen: A
natural analogue for a potential mineral product of subsurface CO2 storage for greenhouse gas
reduction. Marine and Petroleum Geology 23, 61-77.
Worden, R. H., Coleman, M. L., and Matray, J. M., 1999. Basin scale evolution of formation waters: a
diagenetic and formation water study of the Triassic Chaunoy Formation, Paris Basin.
Geochimica et Cosmochimica Acta 63, 2513-2528.
Würdemann, H., Möller, F., Kühn, M., Heidug, W., Christensen, N. P., Borm, G., and Schilling, F. R.,
2010. CO2SINK—From site characterisation and risk assessment to monitoring and verification:
39
One year of operational experience with the field laboratory for CO2 storage at Ketzin, Germany.
International Journal of Greenhouse Gas Control 4, 938-951.
Xu, T., 2008. TOUGHREACT testing in high ionic strength brine sandstone systems. Lawrence Berkeley
National Laboratory, Berkeley, California, USA.
Xu, T., Apps, J. A., and Pruess, K., 2003. Reactive geochemical transport simulation to study mineral
trapping for CO2 disposal in deep arenaceous formations. J. Geophys. Res. 108, 2071.
Xu, T., Kharaka, Y. K., Doughty, C., Freifeld, B. M., and Daley, T. M., 2010. Reactive transport modeling
to study changes in water chemistry induced by CO2 injection at the Frio-I Brine Pilot. Chemical
Geology 271, 153-164.
Zalba, P. E., Conconi, M. S., Morosi, M., Manassero, M., and Comerio, M., 2011. Dawsonite in tuffs
and litharenites of the Cerro Castaño member, Cerro Barcino formation, Chubut group
(Cenomanian), Los Altares, Patagonia, Argentina. The Canadian Mineralogist 49, 503-520.
Zerai, B., Saylor, B. Z., and Matisoff, G., 2006. Computer simulation of CO2 trapped through mineral
precipitation in the Rose Run Sandstone, Ohio. Applied Geochemistry 21, 223-240.
Zhang, G., Spycher, N., Xu, T., Sonnenthal, E., and Steefel, C., 2006. Reactive Geochemical Transport
Modeling of Concentrated Aqueous Solutions: Supplement to TOUGHREACT User's Guide for the
Pitzer Ion-Interaction Model.
Zhang, G., Zheng, Z., and Wan, J., 2005. Modeling reactive geochemical transport of concentrated
aqueous solutions. Water Resour. Res. 41, W02018.
Zhang, W., Li, Y., Xu, T., Cheng, H., Zheng, Y., and Xiong, P., 2009. Long-term variations of CO2 trapped
in different mechanisms in deep saline formations: A case study of the Songliao Basin, China.
International Journal of Greenhouse Gas Control 3, 161-180.
Zhu, C., 2005. In situ feldspar dissolution rates in an aquifer. Geochimica et Cosmochimica Acta 69,
1435-1453.

40
Figure 1 : Folk’s diagram of CO2 geologic disposal natural analogue compositions where the presence or
absence of dawsonite is shown. Numbers correspond to natural analogues: 1) Bowen-Gunnedah-Sydney
Basin; 2) Lam Formation; 3) Fizzy accumulation; 4) Songliao Basin; 5) Cerro Barcino Formation; 6)
Springerville – St Johns Field; 7) Hailer Basin; 8) Miller Field; 9) Magnus Field; 10) Bravo Dome; 11) Vert le
Grand; 12) Ladbroke Grove Field; 13) Montmiral reservoir; 14) Paradox Basin. Ketzin, In Salah and Snøhvit
case-study sandstone compositions are also reported.
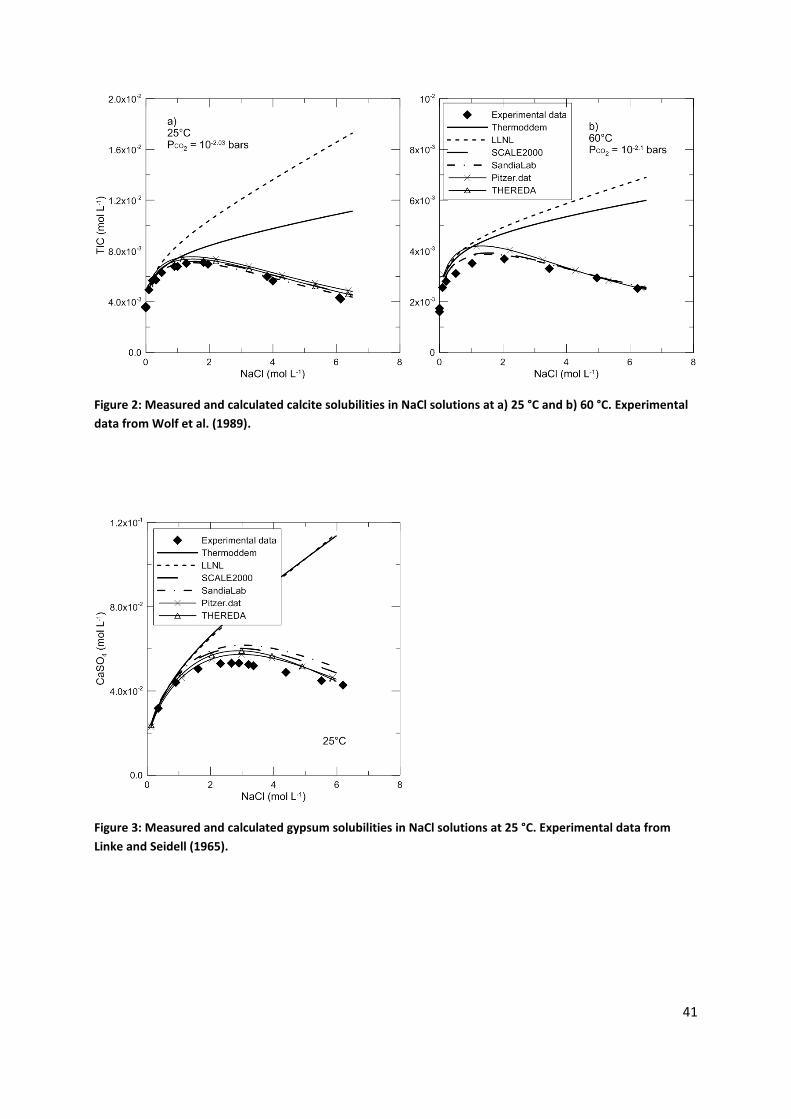
41
Figure 2: Measured and calculated calcite solubilities in NaCl solutions at a) 25 °C and b) 60 °C. Experimental
data from Wolf et al. (1989).
Figure 3: Measured and calculated gypsum solubilities in NaCl solutions at 25 °C. Experimental data from
Linke and Seidell (1965).
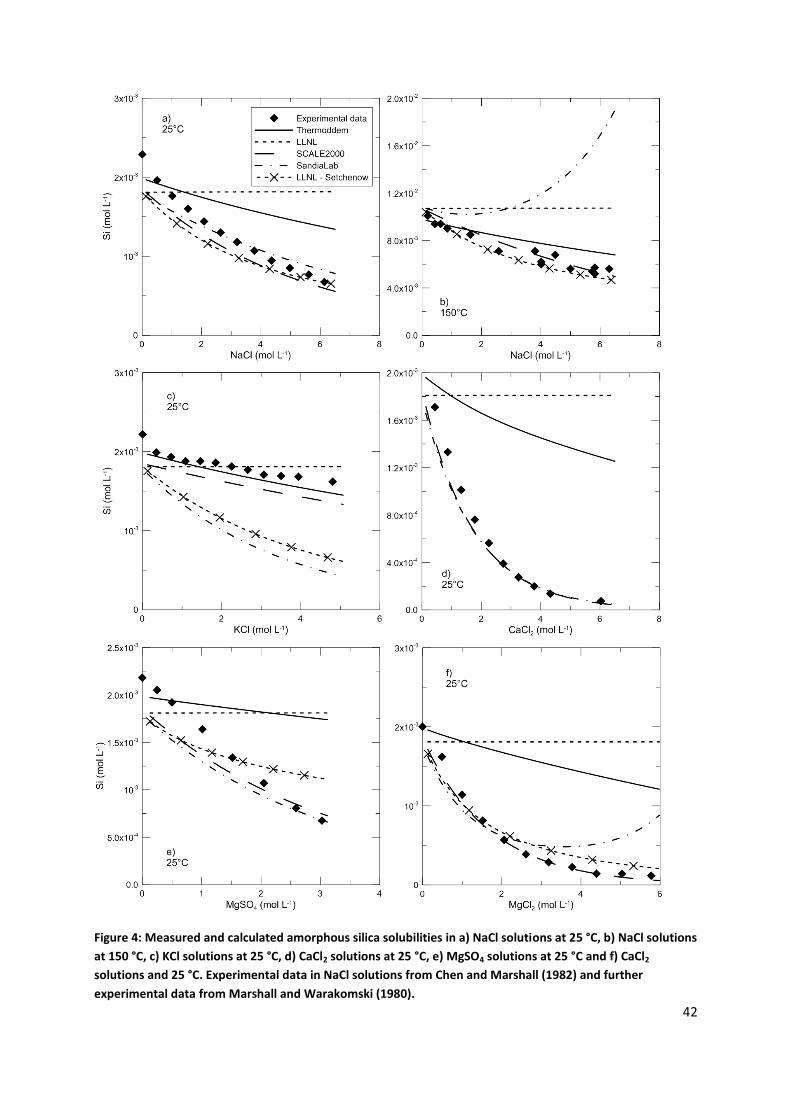
42
Figure 4: Measured and calculated amorphous silica solubilities in a) NaCl solutions at 25 °C, b) NaCl solutions
at 150 °C, c) KCl solutions at 25 °C, d) CaCl2 solutions at 25 °C, e) MgSO4 solutions at 25 °C and f) CaCl2
solutions and 25 °C. Experimental data in NaCl solutions from Chen and Marshall (1982) and further
experimental data from Marshall and Warakomski (1980).

43
Figure 5: Measured and calculated gibbsite solubilities in NaCl solutions at a) 30 °C and b) 70 °C. Experimental
data from Palmer and Wesolowski (1992).
Figure 6: Al3+
activity coefficient evolution as a function of the ionic strength for different databases during
gibbsite solubility calculations shown in Figure 5-a.
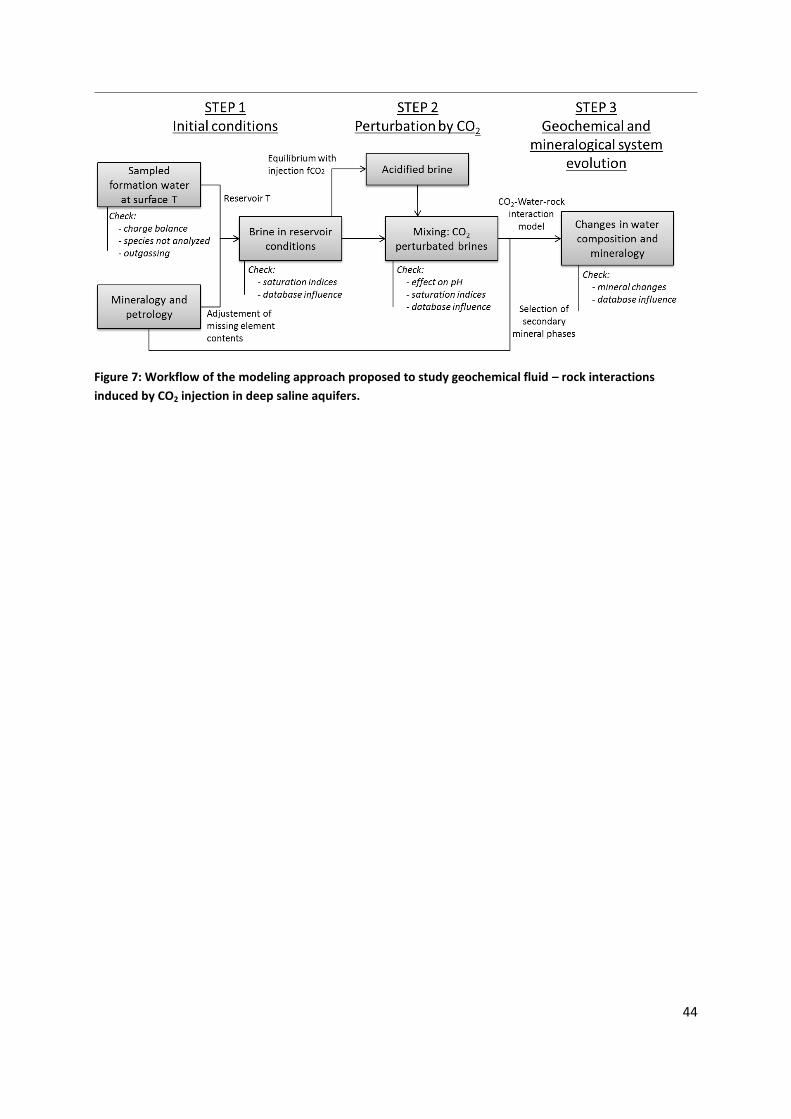
44
Figure 7: Workflow of the modeling approach proposed to study geochemical fluid – rock interactions
induced by CO2 injection in deep saline aquifers.
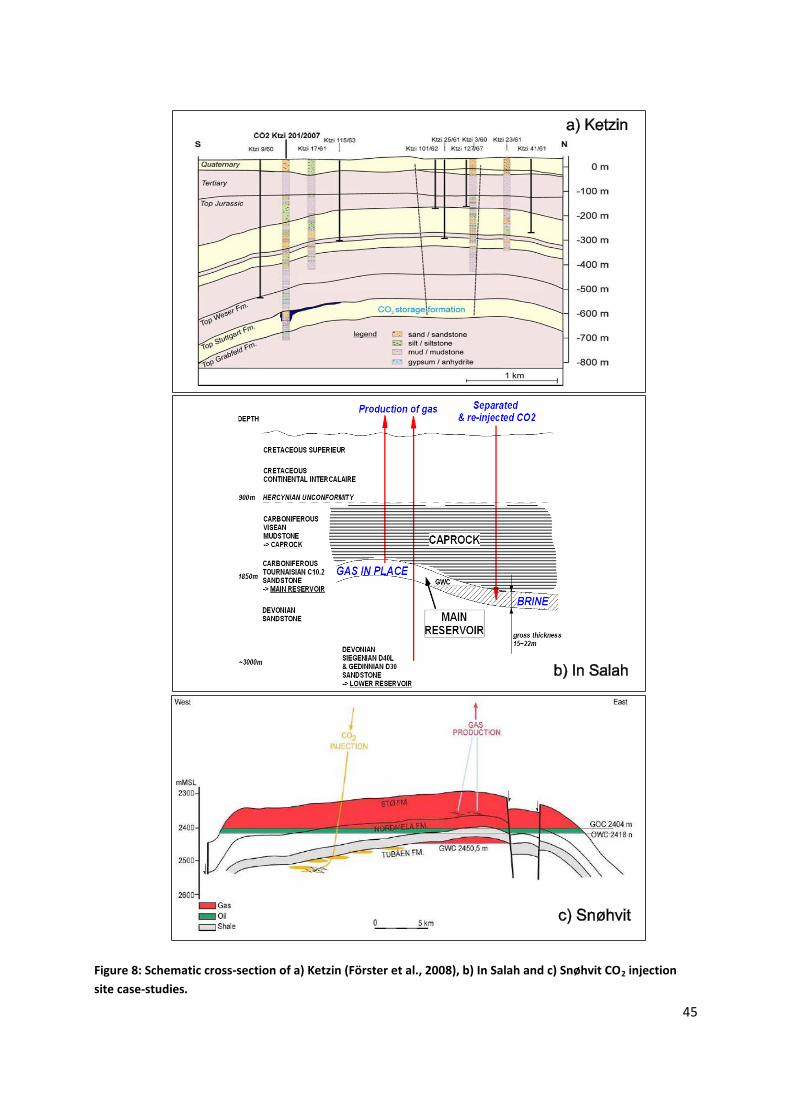
45
Figure 8: Schematic cross-section of a) Ketzin (Förster et al., 2008), b) In Salah and c) Snøhvit CO2 injection
site case-studies.

46
Figure 9: Mineral saturation indices and CO2 fugacities of Ketzin site porewater calculated using SCALE2000,
SandiaLab and Thermoddem databases.
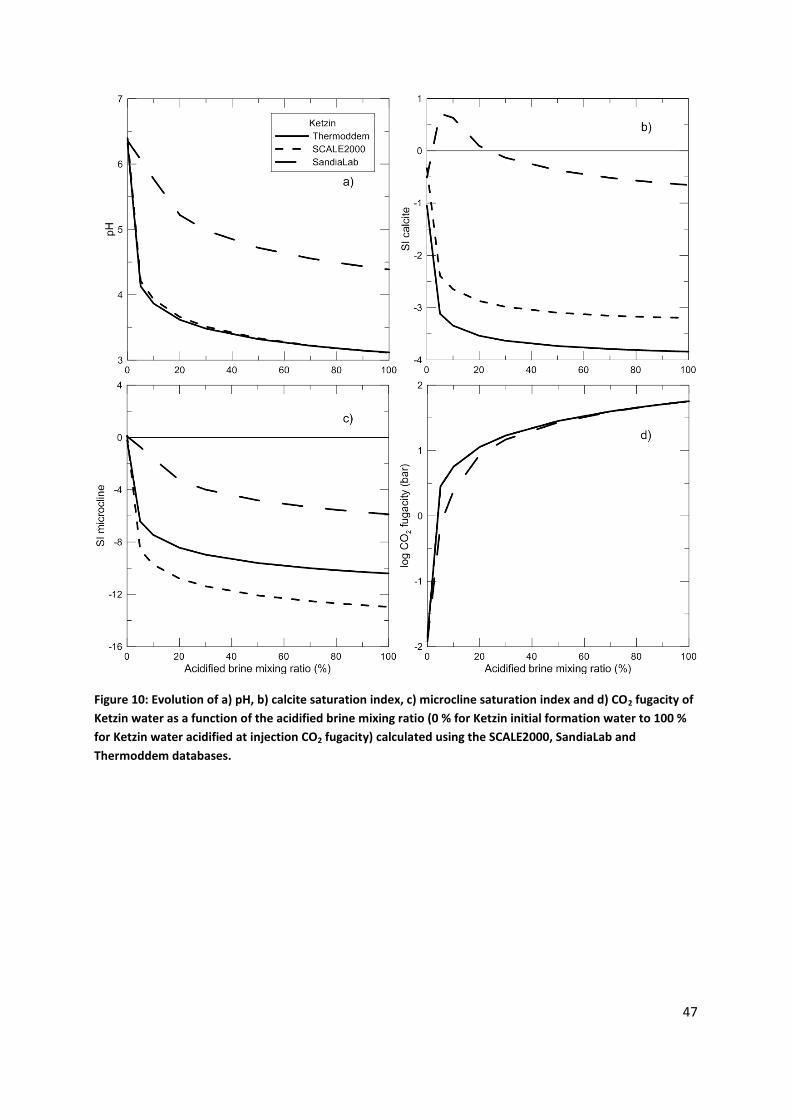
47
Figure 10: Evolution of a) pH, b) calcite saturation index, c) microcline saturation index and d) CO2 fugacity of
Ketzin water as a function of the acidified brine mixing ratio (0 % for Ketzin initial formation water to 100 %
for Ketzin water acidified at injection CO2 fugacity) calculated using the SCALE2000, SandiaLab and
Thermoddem databases.
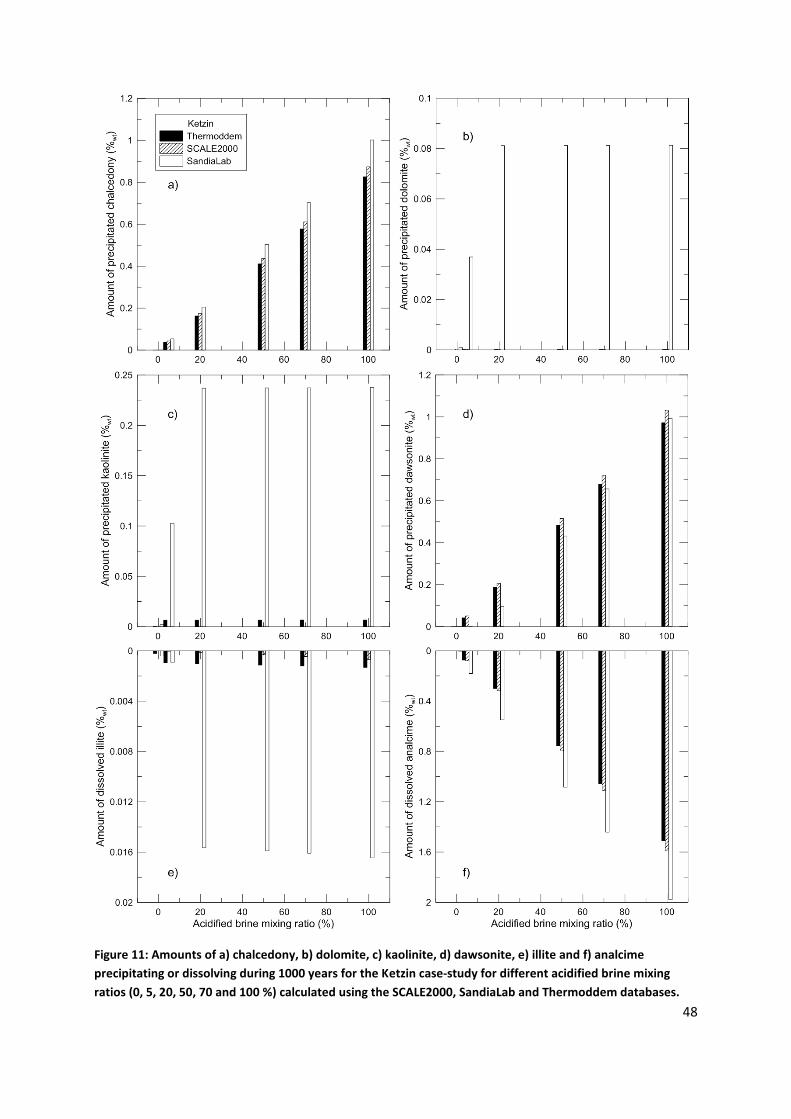
48
Figure 11: Amounts of a) chalcedony, b) dolomite, c) kaolinite, d) dawsonite, e) illite and f) analcime
precipitating or dissolving during 1000 years for the Ketzin case-study for different acidified brine mixing
ratios (0, 5, 20, 50, 70 and 100 %) calculated using the SCALE2000, SandiaLab and Thermoddem databases.
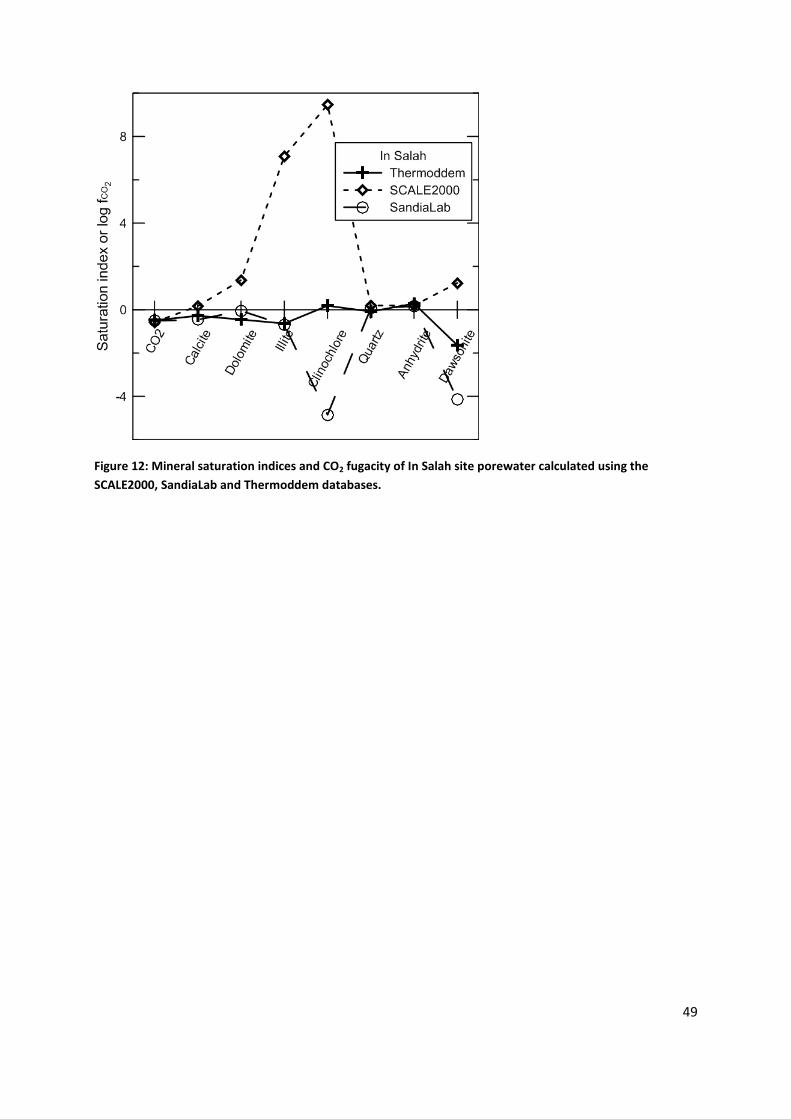
49
Figure 12: Mineral saturation indices and CO2 fugacity of In Salah site porewater calculated using the
SCALE2000, SandiaLab and Thermoddem databases.
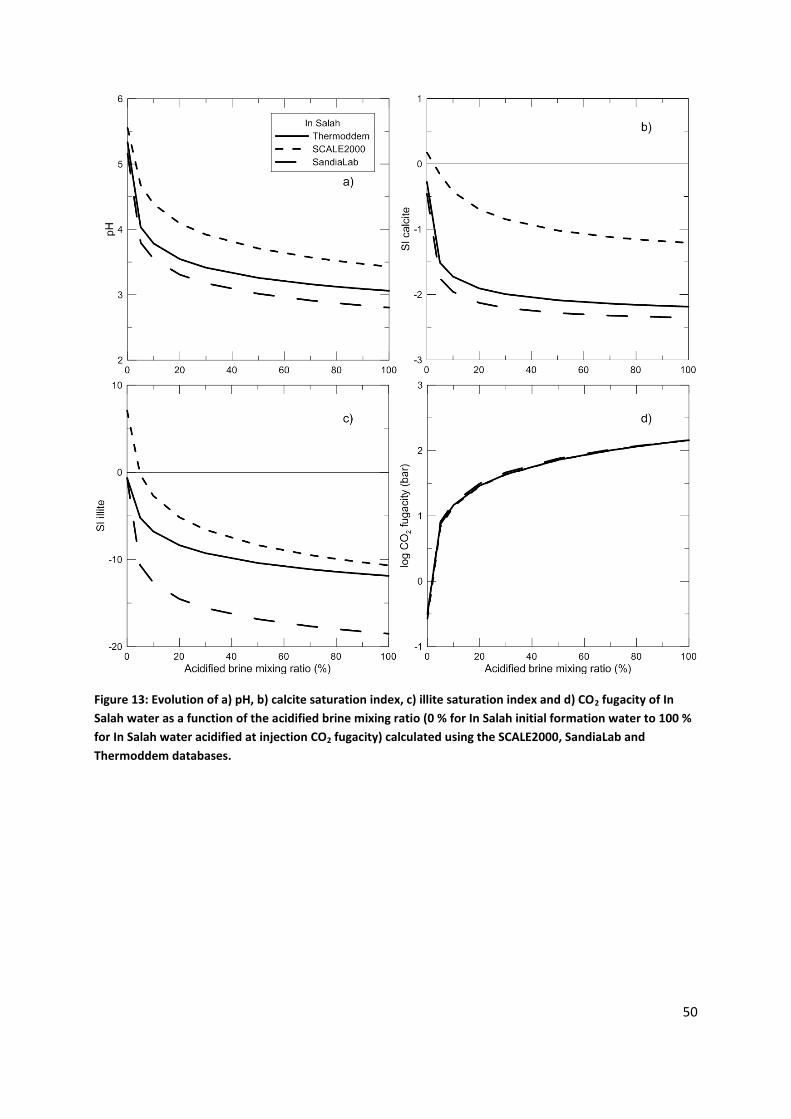
50
Figure 13: Evolution of a) pH, b) calcite saturation index, c) illite saturation index and d) CO2 fugacity of In
Salah water as a function of the acidified brine mixing ratio (0 % for In Salah initial formation water to 100 %
for In Salah water acidified at injection CO2 fugacity) calculated using the SCALE2000, SandiaLab and
Thermoddem databases.
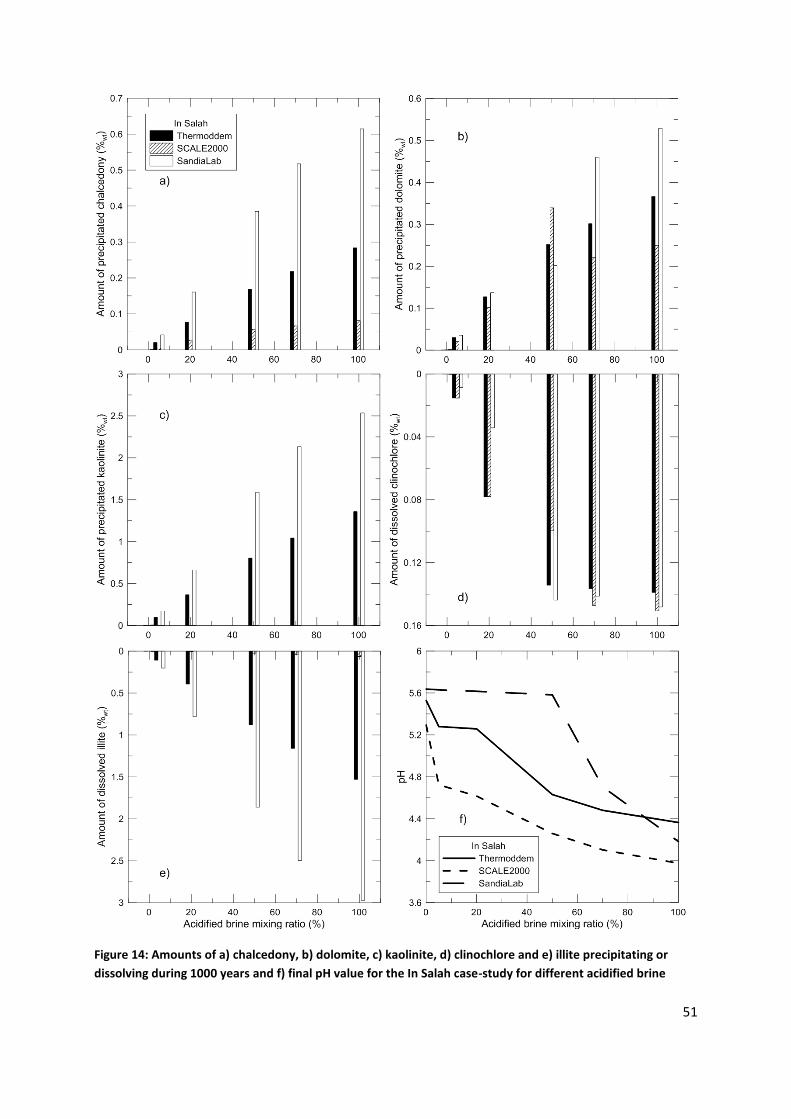
51
Figure 14: Amounts of a) chalcedony, b) dolomite, c) kaolinite, d) clinochlore and e) illite precipitating or
dissolving during 1000 years and f) final pH value for the In Salah case-study for different acidified brine
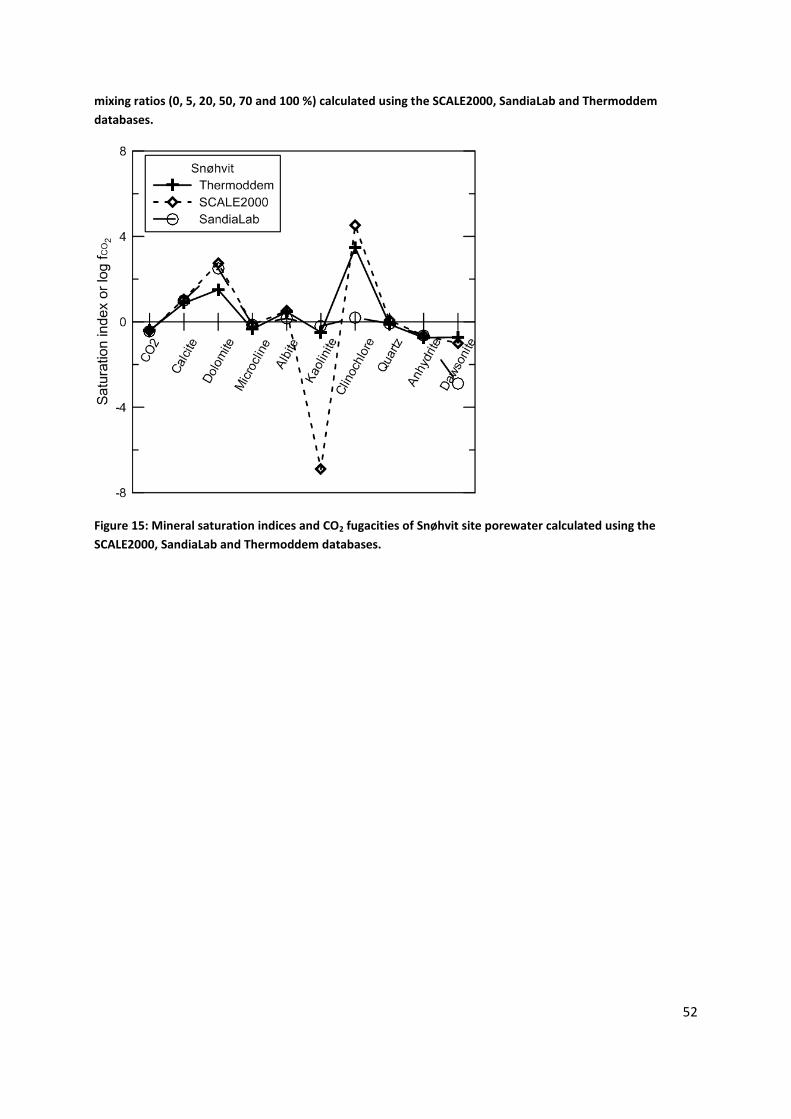
52
mixing ratios (0, 5, 20, 50, 70 and 100 %) calculated using the SCALE2000, SandiaLab and Thermoddem
databases.
Figure 15: Mineral saturation indices and CO2 fugacities of Snøhvit site porewater calculated using the
SCALE2000, SandiaLab and Thermoddem databases.

53
Figure 16: Evolution of a) pH, b) calcite saturation index, c) microcline saturation index and d) CO2 fugacity of
Snøhvit water as a function of the acidified brine mixing ratio (0 % for Snøhvit initial formation water to 100
% for Snøhvit water acidified at injection CO2 fugacity) calculated using the SCALE2000, SandiaLab and
Thermoddem databases.
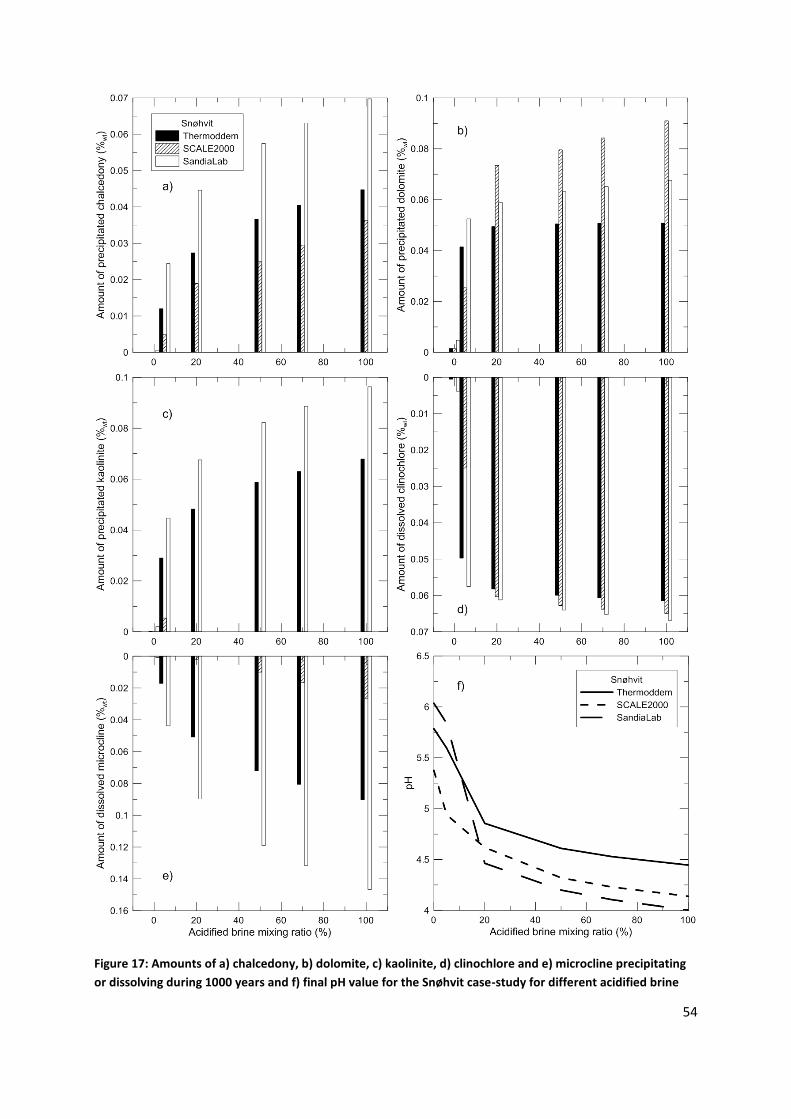
54
Figure 17: Amounts of a) chalcedony, b) dolomite, c) kaolinite, d) clinochlore and e) microcline precipitating
or dissolving during 1000 years and f) final pH value for the Snøhvit case-study for different acidified brine

55
mixing ratios (0, 5, 20, 50, 70 and 100 %) calculated using the SCALE2000, SandiaLab and Thermoddem
databases.
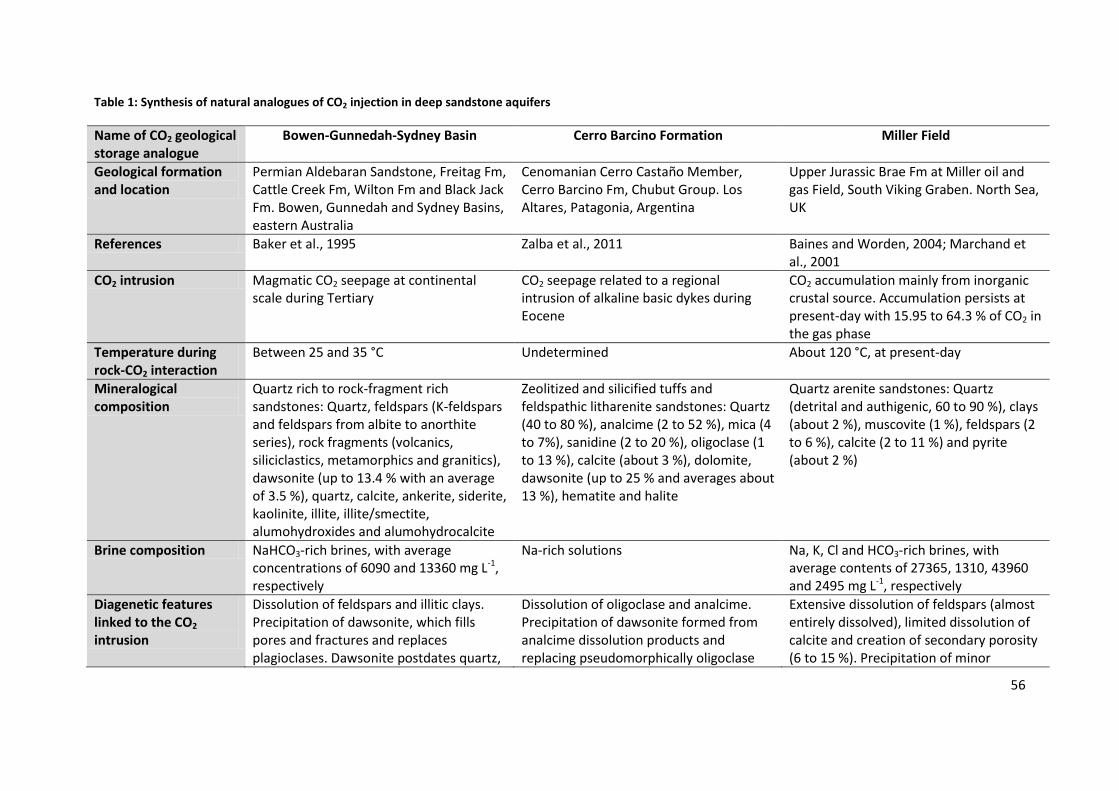
56
Table 1: Synthesis of natural analogues of CO2 injection in deep sandstone aquifers
Name of CO2 geological storage analogue
Bowen-Gunnedah-Sydney Basin Cerro Barcino Formation Miller Field
Geological formation and location
Permian Aldebaran Sandstone, Freitag Fm, Cattle Creek Fm, Wilton Fm and Black Jack Fm. Bowen, Gunnedah and Sydney Basins, eastern Australia
Cenomanian Cerro Castaño Member, Cerro Barcino Fm, Chubut Group. Los Altares, Patagonia, Argentina
Upper Jurassic Brae Fm at Miller oil and gas Field, South Viking Graben. North Sea, UK
References Baker et al., 1995 Zalba et al., 2011 Baines and Worden, 2004; Marchand et al., 2001
CO2 intrusion Magmatic CO2 seepage at continental scale during Tertiary
CO2 seepage related to a regional intrusion of alkaline basic dykes during Eocene
CO2 accumulation mainly from inorganic crustal source. Accumulation persists at present-day with 15.95 to 64.3 % of CO2 in the gas phase
Temperature during rock-CO2 interaction
Between 25 and 35 °C Undetermined About 120 °C, at present-day
Mineralogical composition
Quartz rich to rock-fragment rich sandstones: Quartz, feldspars (K-feldspars and feldspars from albite to anorthite series), rock fragments (volcanics, siliciclastics, metamorphics and granitics), dawsonite (up to 13.4 % with an average of 3.5 %), quartz, calcite, ankerite, siderite, kaolinite, illite, illite/smectite, alumohydroxides and alumohydrocalcite
Zeolitized and silicified tuffs and feldspathic litharenite sandstones: Quartz (40 to 80 %), analcime (2 to 52 %), mica (4 to 7%), sanidine (2 to 20 %), oligoclase (1 to 13 %), calcite (about 3 %), dolomite, dawsonite (up to 25 % and averages about 13 %), hematite and halite
Quartz arenite sandstones: Quartz (detrital and authigenic, 60 to 90 %), clays (about 2 %), muscovite (1 %), feldspars (2 to 6 %), calcite (2 to 11 %) and pyrite (about 2 %)
Brine composition NaHCO3-rich brines, with average concentrations of 6090 and 13360 mg L-1, respectively
Na-rich solutions Na, K, Cl and HCO3-rich brines, with average contents of 27365, 1310, 43960 and 2495 mg L-1, respectively
Diagenetic features linked to the CO2 intrusion
Dissolution of feldspars and illitic clays. Precipitation of dawsonite, which fills pores and fractures and replaces plagioclases. Dawsonite postdates quartz,
Dissolution of oligoclase and analcime. Precipitation of dawsonite formed from analcime dissolution products and replacing pseudomorphically oligoclase
Extensive dissolution of feldspars (almost entirely dissolved), limited dissolution of calcite and creation of secondary porosity (6 to 15 %). Precipitation of minor
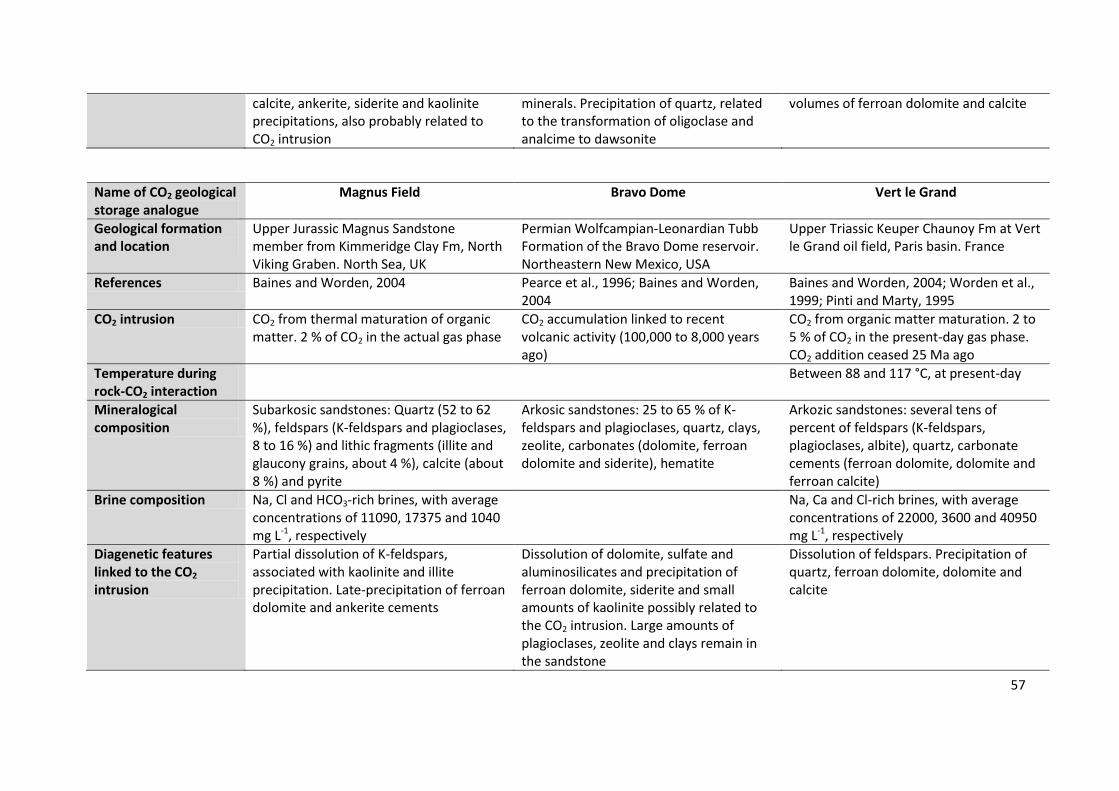
57
calcite, ankerite, siderite and kaolinite precipitations, also probably related to CO2 intrusion
minerals. Precipitation of quartz, related to the transformation of oligoclase and analcime to dawsonite
volumes of ferroan dolomite and calcite
Name of CO2 geological storage analogue
Magnus Field Bravo Dome Vert le Grand
Geological formation and location
Upper Jurassic Magnus Sandstone member from Kimmeridge Clay Fm, North Viking Graben. North Sea, UK
Permian Wolfcampian-Leonardian Tubb Formation of the Bravo Dome reservoir. Northeastern New Mexico, USA
Upper Triassic Keuper Chaunoy Fm at Vert le Grand oil field, Paris basin. France
References Baines and Worden, 2004 Pearce et al., 1996; Baines and Worden, 2004
Baines and Worden, 2004; Worden et al., 1999; Pinti and Marty, 1995
CO2 intrusion CO2 from thermal maturation of organic matter. 2 % of CO2 in the actual gas phase
CO2 accumulation linked to recent volcanic activity (100,000 to 8,000 years ago)
CO2 from organic matter maturation. 2 to 5 % of CO2 in the present-day gas phase. CO2 addition ceased 25 Ma ago
Temperature during rock-CO2 interaction
Between 88 and 117 °C, at present-day
Mineralogical composition
Subarkosic sandstones: Quartz (52 to 62 %), feldspars (K-feldspars and plagioclases, 8 to 16 %) and lithic fragments (illite and glaucony grains, about 4 %), calcite (about 8 %) and pyrite
Arkosic sandstones: 25 to 65 % of K-feldspars and plagioclases, quartz, clays, zeolite, carbonates (dolomite, ferroan dolomite and siderite), hematite
Arkozic sandstones: several tens of percent of feldspars (K-feldspars, plagioclases, albite), quartz, carbonate cements (ferroan dolomite, dolomite and ferroan calcite)
Brine composition Na, Cl and HCO3-rich brines, with average concentrations of 11090, 17375 and 1040 mg L-1, respectively
Na, Ca and Cl-rich brines, with average concentrations of 22000, 3600 and 40950 mg L-1, respectively
Diagenetic features linked to the CO2 intrusion
Partial dissolution of K-feldspars, associated with kaolinite and illite precipitation. Late-precipitation of ferroan dolomite and ankerite cements
Dissolution of dolomite, sulfate and aluminosilicates and precipitation of ferroan dolomite, siderite and small amounts of kaolinite possibly related to the CO2 intrusion. Large amounts of plagioclases, zeolite and clays remain in the sandstone
Dissolution of feldspars. Precipitation of quartz, ferroan dolomite, dolomite and calcite
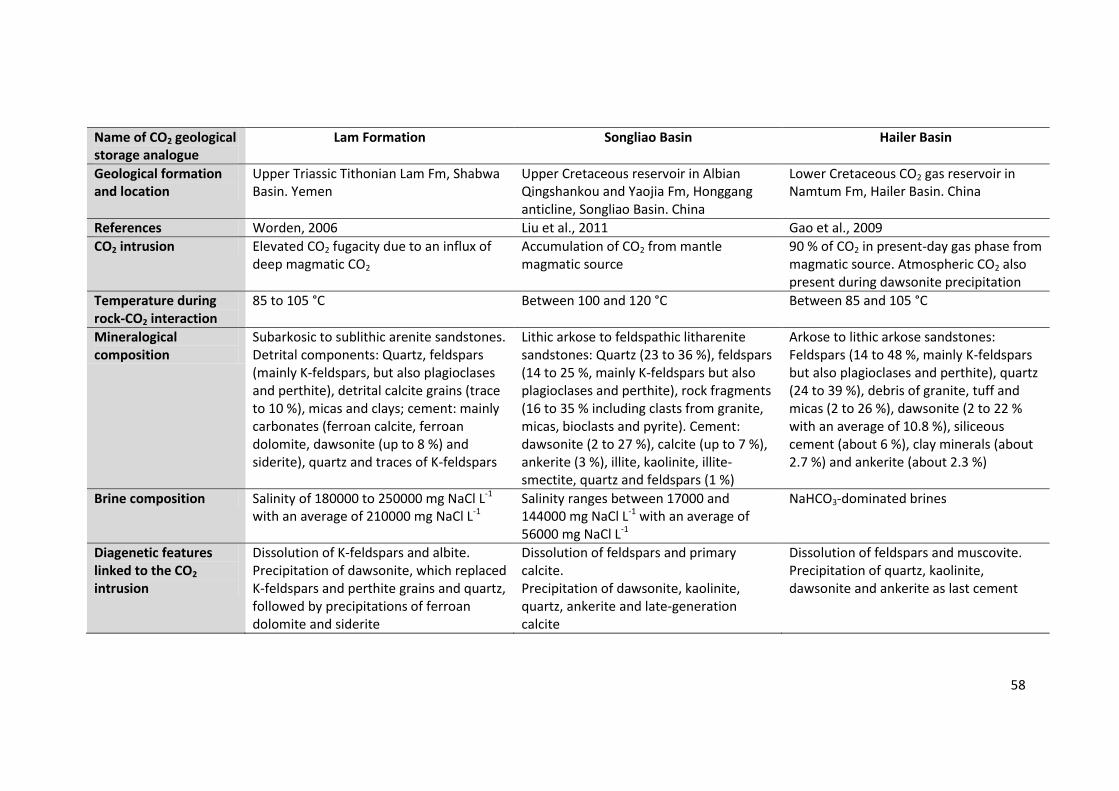
58
Name of CO2 geological storage analogue
Lam Formation Songliao Basin Hailer Basin
Geological formation and location
Upper Triassic Tithonian Lam Fm, Shabwa Basin. Yemen
Upper Cretaceous reservoir in Albian Qingshankou and Yaojia Fm, Honggang anticline, Songliao Basin. China
Lower Cretaceous CO2 gas reservoir in Namtum Fm, Hailer Basin. China
References Worden, 2006 Liu et al., 2011 Gao et al., 2009
CO2 intrusion Elevated CO2 fugacity due to an influx of deep magmatic CO2
Accumulation of CO2 from mantle magmatic source
90 % of CO2 in present-day gas phase from magmatic source. Atmospheric CO2 also present during dawsonite precipitation
Temperature during rock-CO2 interaction
85 to 105 °C Between 100 and 120 °C Between 85 and 105 °C
Mineralogical composition
Subarkosic to sublithic arenite sandstones. Detrital components: Quartz, feldspars (mainly K-feldspars, but also plagioclases and perthite), detrital calcite grains (trace to 10 %), micas and clays; cement: mainly carbonates (ferroan calcite, ferroan dolomite, dawsonite (up to 8 %) and siderite), quartz and traces of K-feldspars
Lithic arkose to feldspathic litharenite sandstones: Quartz (23 to 36 %), feldspars (14 to 25 %, mainly K-feldspars but also plagioclases and perthite), rock fragments (16 to 35 % including clasts from granite, micas, bioclasts and pyrite). Cement: dawsonite (2 to 27 %), calcite (up to 7 %), ankerite (3 %), illite, kaolinite, illite-smectite, quartz and feldspars (1 %)
Arkose to lithic arkose sandstones: Feldspars (14 to 48 %, mainly K-feldspars but also plagioclases and perthite), quartz (24 to 39 %), debris of granite, tuff and micas (2 to 26 %), dawsonite (2 to 22 % with an average of 10.8 %), siliceous cement (about 6 %), clay minerals (about 2.7 %) and ankerite (about 2.3 %)
Brine composition Salinity of 180000 to 250000 mg NaCl L-1 with an average of 210000 mg NaCl L-1
Salinity ranges between 17000 and 144000 mg NaCl L-1 with an average of 56000 mg NaCl L-1
NaHCO3-dominated brines
Diagenetic features linked to the CO2 intrusion
Dissolution of K-feldspars and albite. Precipitation of dawsonite, which replaced K-feldspars and perthite grains and quartz, followed by precipitations of ferroan dolomite and siderite
Dissolution of feldspars and primary calcite. Precipitation of dawsonite, kaolinite, quartz, ankerite and late-generation calcite
Dissolution of feldspars and muscovite. Precipitation of quartz, kaolinite, dawsonite and ankerite as last cement
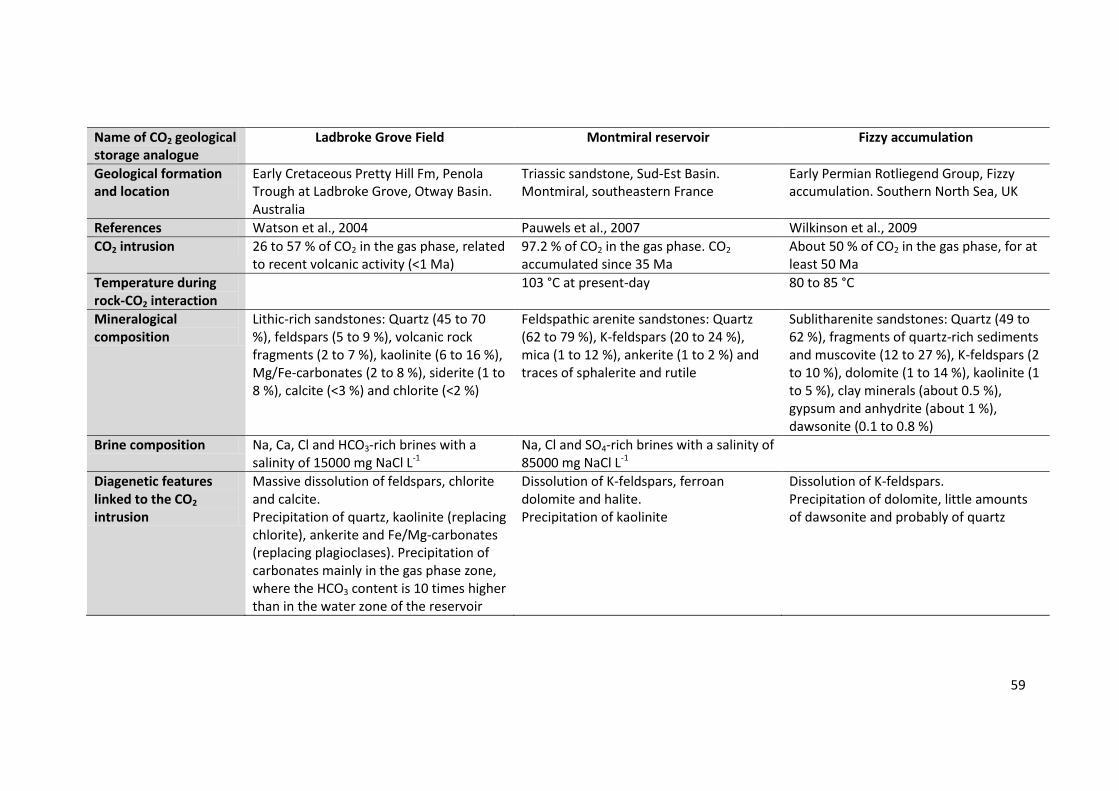
59
Name of CO2 geological storage analogue
Ladbroke Grove Field Montmiral reservoir Fizzy accumulation
Geological formation and location
Early Cretaceous Pretty Hill Fm, Penola Trough at Ladbroke Grove, Otway Basin. Australia
Triassic sandstone, Sud-Est Basin. Montmiral, southeastern France
Early Permian Rotliegend Group, Fizzy accumulation. Southern North Sea, UK
References Watson et al., 2004 Pauwels et al., 2007 Wilkinson et al., 2009
CO2 intrusion 26 to 57 % of CO2 in the gas phase, related to recent volcanic activity (<1 Ma)
97.2 % of CO2 in the gas phase. CO2 accumulated since 35 Ma
About 50 % of CO2 in the gas phase, for at least 50 Ma
Temperature during rock-CO2 interaction
103 °C at present-day 80 to 85 °C
Mineralogical composition
Lithic-rich sandstones: Quartz (45 to 70 %), feldspars (5 to 9 %), volcanic rock fragments (2 to 7 %), kaolinite (6 to 16 %), Mg/Fe-carbonates (2 to 8 %), siderite (1 to 8 %), calcite (<3 %) and chlorite (<2 %)
Feldspathic arenite sandstones: Quartz (62 to 79 %), K-feldspars (20 to 24 %), mica (1 to 12 %), ankerite (1 to 2 %) and traces of sphalerite and rutile
Sublitharenite sandstones: Quartz (49 to 62 %), fragments of quartz-rich sediments and muscovite (12 to 27 %), K-feldspars (2 to 10 %), dolomite (1 to 14 %), kaolinite (1 to 5 %), clay minerals (about 0.5 %), gypsum and anhydrite (about 1 %), dawsonite (0.1 to 0.8 %)
Brine composition Na, Ca, Cl and HCO3-rich brines with a salinity of 15000 mg NaCl L-1
Na, Cl and SO4-rich brines with a salinity of 85000 mg NaCl L-1
Diagenetic features linked to the CO2 intrusion
Massive dissolution of feldspars, chlorite and calcite. Precipitation of quartz, kaolinite (replacing chlorite), ankerite and Fe/Mg-carbonates (replacing plagioclases). Precipitation of carbonates mainly in the gas phase zone, where the HCO3 content is 10 times higher than in the water zone of the reservoir
Dissolution of K-feldspars, ferroan dolomite and halite. Precipitation of kaolinite
Dissolution of K-feldspars. Precipitation of dolomite, little amounts of dawsonite and probably of quartz
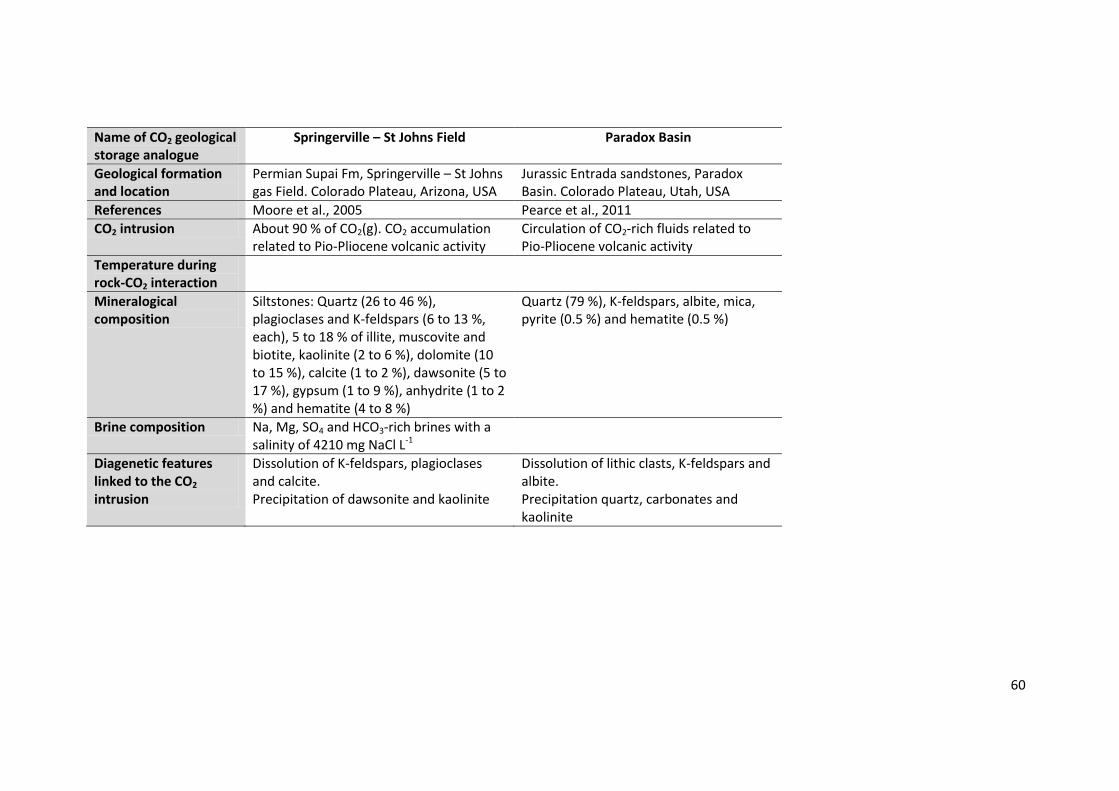
60
Name of CO2 geological storage analogue
Springerville – St Johns Field Paradox Basin
Geological formation and location
Permian Supai Fm, Springerville – St Johns gas Field. Colorado Plateau, Arizona, USA
Jurassic Entrada sandstones, Paradox Basin. Colorado Plateau, Utah, USA
References Moore et al., 2005 Pearce et al., 2011
CO2 intrusion About 90 % of CO2(g). CO2 accumulation related to Pio-Pliocene volcanic activity
Circulation of CO2-rich fluids related to Pio-Pliocene volcanic activity
Temperature during rock-CO2 interaction
Mineralogical composition
Siltstones: Quartz (26 to 46 %), plagioclases and K-feldspars (6 to 13 %, each), 5 to 18 % of illite, muscovite and biotite, kaolinite (2 to 6 %), dolomite (10 to 15 %), calcite (1 to 2 %), dawsonite (5 to 17 %), gypsum (1 to 9 %), anhydrite (1 to 2 %) and hematite (4 to 8 %)
Quartz (79 %), K-feldspars, albite, mica, pyrite (0.5 %) and hematite (0.5 %)
Brine composition Na, Mg, SO4 and HCO3-rich brines with a salinity of 4210 mg NaCl L-1
Diagenetic features linked to the CO2 intrusion
Dissolution of K-feldspars, plagioclases and calcite. Precipitation of dawsonite and kaolinite
Dissolution of lithic clasts, K-feldspars and albite. Precipitation quartz, carbonates and kaolinite

61
Table 2: Aquifer brine compositions prior to CO2 injection at Ketzin (Sample KTZI 202, No 26 from
Würdermann et al., 2010), In Salah and Snøhvit.
Ketzin In Salah Snøhvit
Components mg L-1 mg L-1 mg L-1
Na 90400 35500 56418 Ca 2090 22400 4628 Mg 842 5276 477 Sr 48.9 506.0 207 Fe 5.56 262 14 K 282 225 496 Ba 0.082 10.0 4 Cl 139000 110250 96418 SO4 3744 656 210 HCO3 58.7 178 482 I --- 6.6 --- Br 44.9 --- --- Si 8.8 38 36 NH4 18.9 --- --- Mn 1.4 34 --- Li 1.8 13 --- B 36.2 8 --- Zn --- 1.5 --- Ni --- --- 1 Al --- <3 --- P --- <3 ---
TDS (g L-1) 236.5 175.4 159.4 pH 6.4 (at 27°C) 5.2 (at 20°C) 6.2 (at 20°C) Density (g cm-3) 1.151 (at 27°C) 1.1279 (at 20°C) 1.104 (at 20°C)
Table 3: Mineral phases allowed to dissolve and precipitate in CO2-brine-sandstone interaction models for
Ketzin, In Salah and Snøhvit case-studies.
Case study Minerals considered for kinetics dissolution
Minerals considered for equilibrium precipitation
Ketzin Analcime Mg-Illite Microcline Clinochlore
Chalcedony Dolomite Kaolinite Dawsonite
In Salah Mg-Illite Clinochlore
Chalcedony Dolomite Kaolinite
Snøhvit Microcline Clinochlore
Chalcedony Dolomite Kaolinite

62
Table 4: Kinetic parameters used in the calculations: reaction rates at 25 °C (k25), activation energies (Ea)
exponential terms on H+ activity (n) and reactive surface areas (A). Analcime kinetic parameters (k25, Ea and
n) taken as leucite parameters.
Mineral A (m² g-1) Neutral mechanism Acid mechanism
log k25 (mol m-2 s-1)
Ea (KJ mol-1) log k25
(mol m-2 s-1) Ea (KJ mol-1) n
Analcime 35.5 -9.2 75.5 -6 132.2 0.7 Mg-Illite 30 -12.78 35.0 -10.98 23.6 0.34 Microcline 0.12 -12.41 38.0 -10.06 51.7 0.5 Clinochlore 0.0027 -12.52 88.0 -11.11 88.0 0.5