Long Range Transportation Plan - City of Sumter
199
The Sumter Urban Area Transportation Study November 2018 SUATS 2045 Long Range Transportation Plan
-
Upload
khangminh22 -
Category
Documents
-
view
1 -
download
0
Transcript of Long Range Transportation Plan - City of Sumter

The Sumter Urban Area Transportation Study
November 2018
SUATS 2045Long Range Transportation Plan

TABLE OF CONTENTS
2045 Long Range Transportation Plan
i Table of Contents | Final Report | November 2018
Acknowledgements Development of the SUATS Long-Range Transportation Plan was a collaborative process that involved numerous stakeholders, including the Planning Advisory Committee, City and County staff, and the South Carolina Department of Transportation. The general public also provided input for this plan through an online survey that ran from September 14, 2017 through November 1, 2017, as well as at public workshops held on October 12, 2017 and April 16, 2018. All of their efforts are greatly appreciated.
Planning Advisory Committee
Benar Amado
Jeffrey Belcher
Lori Campbell
Herb Cooper
Michael Dennis
Jim Frierson
Clarence Gaines
Ray Goodman
Carol Hamlin
Brett Harrelson
Al Harris
Jessica Hekter
Byron Jones
Lottie Jones
William Jordan
Kyle Kelly
Emily Lawton
Deron McCormick
Donna McCullum
Mike Mikota
Gary Mixon
Yolanda Morris
Eddie Newman
James Olsen
Beth Reames
Cathy Rice
Sandra Riley
Jay Schwedler
Curtis Spencer
Joe Sturm
Mike Sullivan
Emily Thomas
SUATS Planning Staff
Jeff Derwort
George McGregor
Charles Robbins
Wanda Scott
Consultants
Allison Fluitt
Jonathan Guy
Kristina King
Tim Padgett
Joe Robertson
Allison Wright

TABLE OF CONTENTS
2045 Long Range Transportation Plan
ii Table of Contents | Final Report | November 2018
Table of Contents Chapter 1 – Background and History
Native and Colonists Populations .................................................................1-1
The War for Independence............................................................................1-1
Transportation and Commerce ..................................................................... 1-1
The Civil War and Reconstruction ............................................................... 1-1
Community Advancement, Transportation Improvements and
Economic Development............................................................................. 1-2
Shaw Air Force Base and the Growth of the Military Economy ............ 1-2
Looking Back and Moving Forward ............................................................ 1-2
Chapter 2 – Introduction and Vision
Introduction ...................................................................................................... 2-1
What is an LRTP and Why Update? ..................................................... 2-1
Public Outreach ............................................................................................... 2-3
Transportation Plan Steering Committee............................................. 2-3
Public Questionnaire................................................................................ 2-3
Public Workshops..................................................................................... 2-4
Previous Planning Efforts....................................................................... 2-4
Vision.................................................................................................................. 2-4
Goals .................................................................................................................. 2-5
Federal Regulations ......................................................................................... 2-5
MAP-21...................................................................................................... 2-5
FAST Act ................................................................................................... 2-5
Performance Based Planning ................................................................. 2-5
Elements of a Transportation Plan............................................................... 2-6
Chapter 3 – Social and Environmental
Social and Environmental Features .............................................................. 3-1
Environmental Features.......................................................................... 3-1
Social Features .......................................................................................... 3-1
Environmental Justice..................................................................................... 3-5
Planning Guidelines ......................................................................................... 3-6
Chapter 4 – Existing Roadway Conditions
Introduction ......................................................................................................4-1
Transportation Corridors & Activity Centers ..................................... 4-1
Functional Classification................................................................................. 4-2
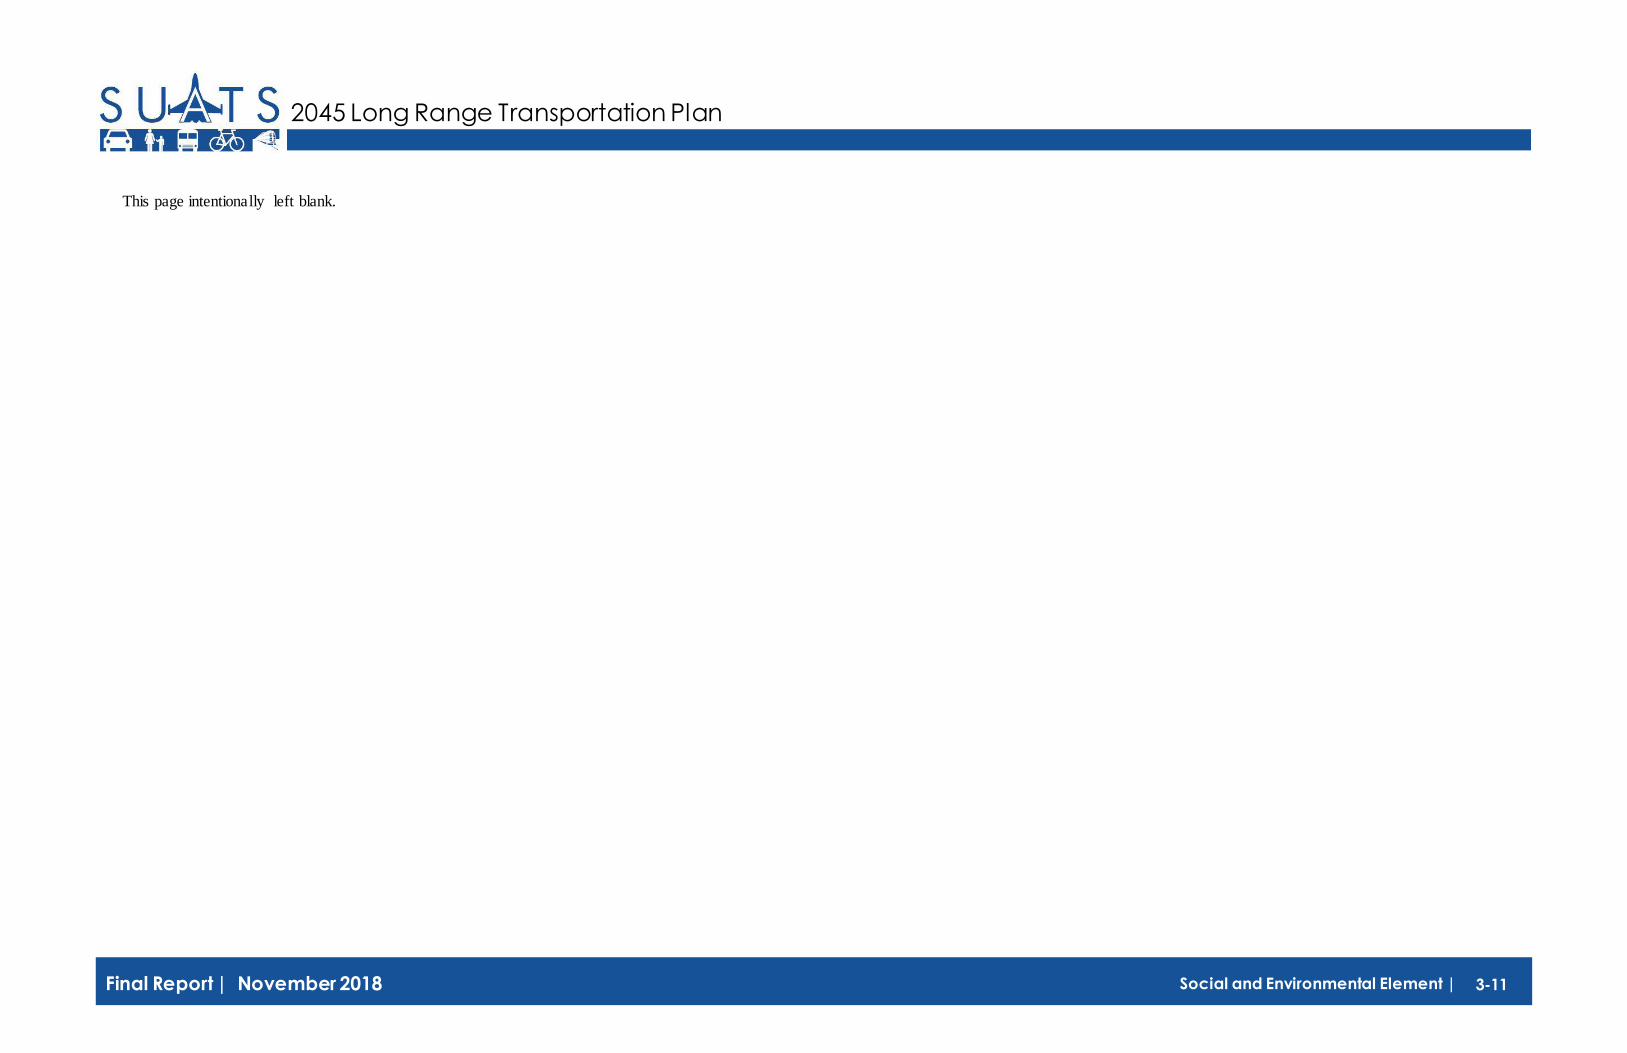
Arterials ...................................................................................................... 4-4
Collectors ................................................................................................... 4-4
Locals .......................................................................................................... 4-4
Corridor Operations........................................................................................ 4-5
Regional Access......................................................................................... 4-5
Congested Corridors ................................................................................ 4-5
Traffic Safety and Crash History .................................................................. 4-7
Priority Locations ..................................................................................... 4-7
Priority Intersection Analysis.................................................................. 4-9
Recommended Countermeasures..........................................................4-9
Chapter 5 – Future Roadway Element
Introduction ...................................................................................................... 5-1
Existing + Committed Conditions................................................................ 5-1
Penny for Progress ................................................................................... 5-1
Security .............................................................................................................. 5-2
Security Measures..................................................................................... 5-2
Recommendations ........................................................................................... 5-2
Principal and Minor Arterials ................................................................. 5-4
Collectors ................................................................................................... 5-5
Roadway Project Prioritization...................................................................... 5-6
Access Management...................................................................................... 5-11
Access Management Strategy Toolkit ................................................. 5-11
Types of Corridors and Potential Solutions....................................... 5-14
SUATS Access Management Corridor Strategies ............................. 5-14

TABLE OF CONTENTS
2045 Long Range Transportation Plan
iii Table of Contents | Final Report | November 2018
Complete Streets ............................................................................................ 5-17
Context Realm......................................................................................... 5-17
Pedestrian Realm .................................................................................... 5-18
Travelway Realm .................................................................................... 5-19
Intersection Realm ................................................................................. 5-20
Project Sheets ................................................................................................. 5-20
Chapter 6 – Bicycle and Pedestrian Element
Introduction ...................................................................................................... 6-1
Complete Streets Promote Bicycling and Walking..................................... 6-1
City of Sumter Code of Ordinances ..................................................... 6-2
Facility and Program Opportunities .............................................................6-2
Bicycle Users ............................................................................................. 6-2
Bicycle Facilities ........................................................................................ 6-2
Pedestrian Facilities .................................................................................. 6-4
Multi-Use Facilities................................................................................... 6-5
Existing Conditions.......................................................................................... 6-6
Bicycle Network ....................................................................................... 6-6
Pedestrian Network ................................................................................. 6-7
Existing Groups, Programs, and Initiatives ....................................... 6-10
Recommendations ......................................................................................... 6-11
Facility Recommendations.................................................................... 6-11
Bicycle Program Recommendations ................................................... 6-21
Bicycle and Sidewalk Recommendations ........................................... 6-26
Chapter 7 – Transit Element
Introduction ...................................................................................................... 7-1
Transit and Urban Form ......................................................................... 7-1
History of Transit in Sumter .................................................................. 7-1
Existing Transit Services ................................................................................ 7-1
Santee Wateree Regional Transportation Authority........................... 7-1
Other Public Transportation Providers................................................ 7-3
Public Involvement ......................................................................................... 7-3
Public Questionnaire................................................................................ 7-3
SUATS Planning Advisory Committee ................................................ 7-4
Public Workshop #1 ................................................................................ 7-4
On-Board Survey ..................................................................................... 7-4
Financial Challenges SWRTA Faces............................................................. 7-5
Background ............................................................................................... 7-5
Restructuring Fixed Bus Routes Study ................................................. 7-5
Performance Based Planning and Programming in Transit ................... 7-15
System Recommendations ........................................................................... 7-16
Conclusion....................................................................................................... 7-20
Chapter 8 – Freight & Aviation Element
Freight Element................................................................................................ 8-1
Highway and Rail Freight Trends .......................................................... 8-1
Existing Conditions .................................................................................. 8-1
Truck Route Recommendations ............................................................ 8-4
Street Design Recommendations .......................................................... 8-9
Aviation Element ........................................................................................... 8-10
Existing Conditions ................................................................................ 8-10
Recommendations.................................................................................. 8-13
Chapter 9 – Financial Plan
Introduction .................................................................................................... 9-1
Financial Planning Scenario ......................................................................... 9-1
System Costs and Revenues ................................................................. 9-1
Alternative Funding Strategies..................................................................... 9-11
Chapter 10 – Implementation Plan
Introduction .................................................................................................... 10-1
Responsible Agencies ............................................................................ 10-1
Action Plan...................................................................................................... 10-1
General Action Items............................................................................. 10-1

iv Table of Contents | Final Report | November 2018
2045 Long Range Transportation Plan
Policy Action Items ................................................................................ 10-2
Roadway Improvement Action Items ................................................. 10-2
Bicycle and Pedestrian Improvement Action Items ......................... 10-3
Transit Improvement Action Items..................................................... 10-5
Freight Improvement Action Items ..................................................... 10-5
Land Use Action Items ........................................................................... 10-6
Chapter 11 – Performance Measures
What is Performance Based Planning? ...................................................... 11-1
National Goals................................................................................................ 11-1
Federal Requirements ................................................................................... 11-2
Targets ...................................................................................................... 11-2
Reporting.................................................................................................. 11-2
Assessments ............................................................................................. 11-2
Safety................................................................................................................ 11-2
Safety Needs within the MPO ............................................................. 11-2
Safety Strategies ...................................................................................... 11-3
Safety Targets.......................................................................................... 11-3
Next Steps ................................................................................................ 11-3
Appendices
Appendix A – Public Engagement Summary
Introduction .................................................................................................. AA-1
Online Survey........................................................................................ AA-1
Plan Advisory Committee Meeting #1 ............................................. AA-7
Public Workshop #1 ............................................................................ AA-8
Plan Advisory Committee Meeting #2 ........................................... AA-10
Public Workshop #2 .......................................................................... AA-10
Appendix B – Scenario Planning
Introduction .................................................................................................. AB-1
Urban Form and Travel Behavior ..................................................... AB-1
The Transect ......................................................................................... AB-2
Development Scenarios.............................................................................. AB-9
Sprawl Development ........................................................................... AB-9
Compact Development ..................................................................... AB-10
Scenario Planning Results ................................................................. AB-10
Policy and Guidelines Toolbox................................................................ AB-11
Tool 1: Promote Sustainable Land Development ........................ AB-11
Tool 2: Support Efforts to Increase Connectivity within and
Between Developments ................................................................ AB-11
Tool 3: Promote Development Design to Manage Access and
Reduce Congestion Levels on Major Roadways ....................... AB-12
Tool 4: Encourage Growth Management Initiatives to
Manage Growth.............................................................................. AB-12
Recommendations ..................................................................................... AB-13
Desired Outcome: Improved Coordination between
Land Use and Transportation ....................................................... AB-13
Desired Outcome: Efficient Use of the Transportation
System......................................................................................... AB-13

v Table of Contents | Final Report | November 2018
2045 Long Range Transportation Plan
Tables & Figures Chapter 1 – Background & History
None
Chapter 2 – Introduction & Vision
Table 2.1 – Percent of Work Trips Beginning and Ending in County......2-1
Figure 2.1 – SUATS MPO Area ..................................................................... 2-2
Chapter 3 – Social & Environmental Resources
Figure 3.1 – Natural Resources ....................................................................... 3-2
Figure 3.2 – Environmental Issues ................................................................. 3-3
Figure 3.3 – Social Features ............................................................................. 3-4
Table 3.1 – Minority Population Comparison .............................................. 3-5
Figure 3.4 – Percent Minority Population ..................................................... 3-7
Figure 3.5 – Percent Hispanic Population..................................................... 3-8
Figure 3.6 – Percent Low-Income Population ............................................. 3-9
Figure 3.7 – Percent No Vehicle Households ............................................ 3-10
Chapter 4 – Existing Roadway Conditions
Table 4.1 – Activity Centers............................................................................. 4-2
Figure 4.1 – Roadway Network ...................................................................... 4-3
Figure 4.2 – Existing Congested Corridors ................................................... 4-6
Table 4.2 – Intersection Priority Rankings .................................................... 4-7
Figure 4.3 – Crash Locations ........................................................................... 4-8
Chapter 5 – Future Roadway Element
Figure 5.1 – E+C Congested Corridors......................................................... 5-3
Table 5.1 – Project Evaluation Matrix Proposed Roadway Widening Projects...........................................................................................................5-7
Table 5.2 – Project Evaluation Matrix Proposed Roadway Operational/Design Projects .....................................................................5-8
Table 5.3 – Proposed New Location Roadway Projects.............................5-9
Table 5.4 – Project Evaluation Matrix Proposed Intersection Improvements ..............................................................................................5-9
Figure 5.2 – Recommended Roadway Projects .......................................... 5-10
Table 5.2 – Benefits of Corridor Access Management ............................. 5-11
Table 5.3 – Types of Corridors and Potential Solutions ........................... 5-14
Chapter 6 – Bicycle and Pedestrian Element
Figure 6.1A – Existing Bicycle and Pedestrian Facilities ............................6-8
Figure 6.1B – Existing Bicycle and Pedestrian Facilities Inset................... 6-9
Figure 6.2 – Existing and Proposed Bicycle Facilities ............................... 6-14
Figure 6.3A – Existing and Proposed Pedestrian Facilities ...................... 6-15
Figure 6.3B – Existing and Proposed Pedestrian Facilities Inset ............ 6-16
Figure 6.4 – Existing Bicycle Rack Locations ............................................. 6-20
Figure 6.5 – Bicycle and Pedestrian Accident Locations .......................... 6-24
Figure 6.6 – Bicycle and Pedestrian Accident Locations in Relation to Vehicle Accessibility ..................................................................................... 6-25
Figure 6.7 – Proposed Bicycle Facilities ...................................................... 6-27
Table 6.5 – Proposed Bicycle Facilities Improvement List ...................... 6-28
Table 6.6 – Proposed Trail Improvement List ........................................... 6-29
Figure 6.8 – Proposed Sidewalk Construction ........................................... 6-30
Table 6.7 – Proposed Sidewalk Improvement List .................................... 6-31
Figure 6.5C9 – Proposed Pedestrian Improvements................................. 6-32
Table 6.8A – Proposed Intersection Improvement List ........................... 6-33
Table 6.8B – Proposed Midblock Improvement List................................ 6-33
Chapter 7 – Transit Element
Figure 7.1– Existing SWRTA Routes ............................................................. 7-2
Table 7.1 – Fixed Route Operations in Sumter............................................ 7-2
Table 7.2 – 2015 to 2016 Transit Comparison ............................................. 7-6
Table 7.3 – 2011 to 2016 Transit Comparison ............................................. 7-6
Table 7.4 – Bus Route Profit Analysis ........................................................... 7-6
Table 7.5 – Bus Route Revenue Mileage ....................................................... 7-7
Table 7.6 – Proposed Route Revenue Mile Cost ......................................... 7-7
Figure 7.5 – Bus Route 1- Current and Proposed........................................ 7-9
Figure 7.6 – Bus Route 4- Current and Proposed...................................... 7-10
Figure 7.7 – Bus Route 5- Current and Proposed...................................... 7-11

vi Table of Contents | Final Report | November 2018
2045 Long Range Transportation Plan
Figure 7.8 – Bus Route 6- Current and Proposed...................................... 7-12
Figure 7.9 – Bus Route 7- Current and Proposed...................................... 7-13
Figure 7.10 – Bus Route 9- Current and Proposed ................................... 7-14
Table 7.7 – Transit Performance Measures................................................. 7-15
Table 7.8 – SWRTA Transit Asset Management (TAM) Plan................. 7-15
Figure 7.11 – Vehicle Ownership and Transit Route ................................ 7-17
Figure 7.12 – Population Density and Transit Route ................................ 7-18
Chapter 8 – Freight and Aviation Element
Figure 8.1– Existing Railroad Facilities and Industrial Parks .....................8-3
Figure 8.2 – 2012 Freight Analysis Framework............................................ 8-6
Figure 8.3 – 2045 Freight Analysis Framework............................................ 8-7
Figure 8.4 – Proposed Truck Route Designations....................................... 8-8
Table 8.1 – Historical Based Aircraft ........................................................... 8-11
Figure 8.3 – Existing Airport.......................................................................... 8-12
Table 8.2 – Based Aircraft by Type .............................................................. 8-13
Table 8.3 – Projected Emplaned Pilots and Passengers............................ 8-13
Chapter 9 – Financial Plan
Table 9.1 – LRTP Revenue Forecast ........................................................... 9-1
Table 9.2 – LRTP Costs ................................................................................. 9-1
Table 9.3 – Highway Costs and Revenues .................................................. 9-2
Table 9.8 – Pedestrian and Bicycle Costs and Revenues .......................... 9-2
Table 9.4 – Roadway Projects for 2018 Interim Year ............................... 9-3
Table 9.5 – Roadway Projects for 2030 Interim Year ............................... 9-4
Table 9.6 – Roadway Projects for 2040 Horizon Year ............................. 9-5
Table 9.7 – Roadway Projects for Vision Plan............................................ 9-5
Figure 9.1 – Financially Constrained Roadway Capital Projects.............9-8
Figure 9.2 – Financially Constrained Congested Corridors.....................9-9
Figure 9.3 – Vision Plan Congested Corridors ..........................................9-10
Table 9.9 – Transit Costs and Revenues.................................................... 9-11
Chapter 10 – Implementation Plan
None
Chapter 11 – Performance Measures
Table 11.1 – Highway Performance Measures ......................................... 11-1
Table 11.2 – Transit Performance Measures ............................................ 11-2
Table 11.3 – Safety Targets Baseline .......................................................... 11-3

CHAPTER 1 — BACKGROUND AND HISTORY
2045 Long Range Transportation Plan
1-1 Background and History | Final Report | November 2018
Located near the geographic heart of South Carolina, the City of Sumter is situated in the western “High Hills of the Santee” area of Sumter County. A rich history of native communities, local conflict, and economic growth has provided the environment which has allowed Sumter to become the community it is today.
Native and Colonist Populations Long before European settlers moved to the banks of the Wateree River, Native Americans populated the surrounding countryside. The present-day Wateree and Santee Rivers are named for the local tribes that lived on the land. English speaking explorers first encountered the tribes in 1567, but it would be a century before their lives would be documented by European immigrants. A war in 1715 between the native tribes and foreign settlers signaled the end of Native American control in the area that would become Sumter.
Only a few decades passed before townships developed inland to protect the burgeoning coastal settlement at Charleston. One of the earliest public roads, designated in 1753, started as a path through the wilderness connecting these isolated townships. For the early settlers, traveling by river was easiest though far from ideal. The lack of access to the area hindered settlement efforts, and in 1758, thirty-eight pioneers signed a petition requesting new roads.
In addition to a lack of transportation infrastructure, other difficulties faced the area’s early inhabitants. Settlers cleared the land of large trees, built shelter, hunted, fished, and prepared the soil for growing corn, wheat, tobacco, and indigo. Life in the midlands remained simple but hard through the years leading up to the fight for independence.
The War for Independence The City and County of Sumter were named in honor of General Thomas Sumter, the “Fighting Gamecock” or “Gamecock General” of the American Revolution who took an interest in local issues. While few events in the War of Independence took place in the area, the region contributed to and was affected by the struggle. Many local men participated in the war, and present-day Highway 261 was an important route between Camden and Charleston for troops and supplies.
The war had a damaging effect on the economic and social structure of the area as armies on both sides of the conflict seized supplies and larger towns throughout the region were destroyed. Like other areas in the new country, disorder and lawlessness marked the years after the war.
In response to post-war chaos, the Sumter District was established at the turn of the 19th century. The original area included 1,672 square miles before being reduced to its current size of 681 square miles when Clarendon and Lee Counties formed in 1855 and 1902, respectively.
By purchasing land in the High Hills and planning the Village of Statesburg’s design, General Sumter maintained an active interest in the district that would eventually bear his name. A few miles to the east of Statesburg, the community of Sumterville incorporated in 1845. Originally a plantation settlement, Sumterville was recognized as early as 1801 when it was identified by the postmaster general of the United States.
Transportation and Commerce Following the American Revolution, effective transportation in the Sumter area remained elusive. General Sumter formed a company in 1787 to open the Catawba and Wateree Rivers and connect Statesburg with Charleston, but the attempt proved too costly and was eventually abandoned.
A key road to the Sumter area, King’s Highway (SC 261) originally connected the larger cities of Camden and Charleston and served as a trade route for settlers and Native Americans. As a result of the settlers’ petition in 1758, another road was constructed along the Black River. Prior to the arrival of railroad, all local commerce went through Charleston and traveled these two primitive roads. Ferries provided necessary links to a variety of locations, including the new capital at Columbia. Commerce accompanied the transportation links as a collection of general stores, taverns, and inns developed as roads were constructed and ferries were launched.
A cotton mill near Statesburg began operating in 1790. When it was discovered that cotton could be produced profitably in the midlands and uplands of South Carolina, the crop replaced rice and indigo as the region’s principal harvest. Fluctuations in price, however, challenged cotton farmers throughout the 1800s. Manufacturing didn’t fare much better, and growth in the area’s population and economy stagnated.
Similar to areas throughout the United States, the arrival of the railroad changed Sumterville. Residents clamored for rail service in the early 1830s, but high costs, political wrangling, poor weather, and an inconsistent economy conspired to delay its arrival for nearly 20 years. When the railroad was eventually established in the region, it was accompanied by the construction of new buildings and homes, a new jail, freight depot, and bank. With this growth came the need for additional services, such as fire protection and improved infrastructure. Streets in town were improved, and by 1855 the town known as Sumter had grown considerably.
The Civil War and Reconstruction Sumter’s role in the Civil War began early: the first shot in the war was fired from Fort Sumter in Charleston by a Sumter soldier. As men of all ages marched off to war, women and children of Sumter assumed responsibilities left behind by the absence of men. Tending to farms and supporting the war effort by making uniforms and supplies became everyday chores. As the wounded returned home, women tended to their injuries in makeshift hospitals and private homes throughout the region.
Near the end of the Civil War, Sumter residents thought they had been spared the destruction during General William Sherman’s March to the Sea. The hopes of local residents and business owners were soon shattered when General Edward Potter marched inland from Georgetown and in the process destroyed mills, gins, farms, plantations, railroads, engines, and lumber.
When he arrived in Sumter on April 9, 1865, General Potter met some resistance by an overmatched local militia. This was the same day General Robert E. Lee surrendered, but it would take nearly two weeks for word of the events in Appomattox to reach General Potter. On April 10, he directed his men to go house to house to search for contraband and take food, clothing, and other valuables. As a result, Sumter’s shops and printing press were destroyed.
Similar to the Revolutionary War, Sumter emerged from the Civil War in disarray. While many were initially left homeless, life began to return to normal as public buildings, bridges, and railroads appeared from the ruins of war. By the early 1870s, Sumter once again began to grow.
Post-Civil War decades proved challenging for the region. The South’s economy had to be restructured following the abolishment of slavery,

1-2 Background and History | Final Report | November 2018
2045 Long Range Transportation Plan
and freed slaves and whites clashed in a number of racial conflicts. In addition, labor disputes and poor crop yields made life difficult for mill workers and farmers.
On the upside, more railroads began operating at the close of the century. A direct line from Sumter to Camden opened in 1888, followed by a branch linking Sumter to the Southern Railroad in 1899. In 1880, a short line connected Sumter with the logging interests in Bishopville. New communities developed along these railroads, including Pinewood, Oswego, and Hagood. Commerce also was supported by the railroad. In 1884, Sumter boasted a cotton factory, 73 flour and grist mills, 31 lumber mills, and 10 turpentine establishments. Good access by rail and ample cotton and lumber resources gave particular strength to these industries.
Community Advancement,
Transportation Improvements,
and Economic Development Sumter proved to be an innovative community, recognized as the first city in the United States to incorporate the basic principles of the council-manager form of government. Sumter adopted this style in 1912, ahead of the more than 3,400 cities and 371 counties that now use the council-manager or council-administrator form. For Sumter, the new government was better equipped to keep up with the growing city’s water, sewer, and electricity needs. A program inaugurated in 1915 expanded the few paved roads and sidewalks along Sumter’s Main Street.
Not to be left behind by the City of Sumter, Sumter County led the state with a commitment to improve the roadway network. The county held a referendum in 1920 that approved $2.5 million in bonds for construction of paved roads. By 1924, the total had been increased to $4 million. Within the next few years, hundreds of miles of new highways radiated from city to the county limits, including a highway across the Wateree Swamp that connected Sumter with the state capital in Columbia. Only after the state began constructing highways in 1925 did portions of the Sumter County paved roads become part of the state system and fall under the state’s maintenance program.
The bonds also funded improvements to a sidewalk network that included 10 miles of elevated sidewalks made of compacted clay held in shape by wooden curbs.
Like others throughout the country, the people of Sumter had to endure the good and bad times brought on by the World Wars and Great Depression during the first half of the 20th century. Through the 1950s, the economy of Sumter County relied on agriculture. More than 3,000 farms covered the landscape, although manufacturing began establishing a niche market during this time. Eventually, Sumter benefited from a resurgent economy following World War II.
Shaw Air Force Base and
the Growth of the Military
Economy The history of Sumter is forever tied to the events of August 30, 1941, the day Shaw Field was activated to train cadets to fly before sending them off to the European and Pacific campaigns of World War II. The military facility’s name honored Ervin D. Shaw, the first Sumter County pilot to die in combat during World War I.
The training field not only served as the site of pilot instruction throughout the war, but also housed German prisoners-of-war in 1945 and early 1946. Activity at Shaw doubled in 1951 with the addition of the 363rd Tactical Reconnaissance Wing from Langley Air Force Base in Virginia. The facility received another boost in 1954 when the 9th Air Force headquarters was assigned to Shaw from Pope Air Force Base in North Carolina.
By the 1990s, Shaw Air Force Base was serving as an essential component of Sumter’s economy and a key contributor to U.S. defense operations worldwide. During the early stages of the Gulf War, F-16 Fighting Falcons flew missions to stop Iraqi ground forces from invading Saudi Arabia. Throughout the war, troops and equipment from Shaw supported the military effort.
As a result of the 2005 Defense Base Realignment and Closure (BRAC) Commission recommendations, Shaw grew to an approximate total of 1,500 military and civilian employees with the relocation of the Third Army. The growth of the base had an impact on business in the Sumter area as well as the services offered to military and civilian personnel.
Growth continues to come to Shaw Air Force Base. In 2017, Shaw was selected to be the home for an additional MQ-9 Reaper remotely piloted aircraft unit, with an anticipated growth of 430 personnel.
Looking Back and Moving Forward The transportation options available to Sumter residents are constantly evolving. The National Interstate and Highway Defense Act of 1956 brought increased access to the area. As a result, the region is now encircled by three Interstate Highways: I-95, I-20, and I-26. In 1973, the state legislature passed a series of laws in response to a need for public transportation throughout South Carolina which led to the formation of the Santee Wateree Regional Transportation Authority (SWRTA) in 1978. SWRTA has expanded to reach into eight counties, including Sumter County, with fixed route, paratransit, and Medicaid transportation services.
Local industry continues to take advantage of new opportunities brought by improved access. Today, a good transportation network and growing economic base positions the City and County of Sumter for a healthy future. By undertaking the development of a long-range transportation plan, Sumter is committing to preserving the region’s unique historical, cultural, and natural resources while expanding services to meet the needs of the area’s changing population.

1-3 Background and History | Final Report | November 2018
2045 Long Range Transportation Plan
This page left intentionally blank.

CHAPTER 2 — INTRODUCTION AND VISION
2045 Long Range Transportation Plan
2-1 Introduction and Vision | Final Report | November 2018
Introduction To plan for the future of the SUATS MPO area, we must understand a series of fundamental relationships—how the past influences the present, how land use interacts with transportation, and how collective vision becomes a real, desirable future. This financially constrained transportation plan recognizes the need to embrace our history as we build for our future. The 2045 SUATS Long Range Transportation Plan is the result a multi-level partnership that brought local, state, and federal policy-makers to the table with local residents, business owners, and stakeholders.
What Is an LRTP and Why Update?
At its core, a long-range transportation plan (LRTP) identifies ways a region expects to invest resources to enhance its transportation system. The underlying principles and recommended actions of an LRTP reflect choices made by the public and private sectors regarding transportation investments, land use decisions, and infrastructure improvements. A typical LRTP consists of two parts—a description of the vision for the region and a detailed list of policies, operational strategies, and projects to achieve the vision. The LRTP must include a variety of actions that lead to “the development of an integrated intermodal transportation system that facilitates the efficient movement of people and goods”.1
These tasks are accomplished within the context of policy review and public involvement to produce an intermodal transportation system that respects an area’s history and heritage while providing true choice to all users. Federal regulations require the region’s LRTP be updated every 5 years to reflect changing needs and priorities. This plan updates the existing Sumter Area Transportation Study Metropolitan Planning Organization (SUATS MPO) LRTP last updated April 2013.
The federal government requires a comprehensive, cooperative, and continuing process for initiatives to be eligible for federal transportation
1 (23 CFR450C, Sec.450.322)
funding. To that end, several stakeholders had a hand in this updated plan, including:
▪ SUATS MPO
▪ City and County of Sumter
▪ Various local, regional, state, and federal agencies, including the
Santee Wateree Regional Transit Authority, the South Carolina Department of Transportation (SCDOT), the Federal Transit Authority (FTA), and the Federal Highway Administration (FHWA)
Figure 2.1 illustrates the SUATS MPO area.
Growth and Changing Transportation Trends
The SUATS MPO area’s changing needs and priorities are the result of continued growth and changing transportation trends. The South Carolina Revenue and Fiscal Affairs Office estimates Sumter County will add approximately 2% of its 2010 population by 2030. The state population is expected to grow by approximately 18% within the same timeframe.
But the slower pace may not fully account for increased personnel transferring to Shaw Air Force Base following the 2005 round of military base closures and realignments. In its most recent recommendation, the Department of Defense made a commitment to the long-term future of Shaw AFB when it approved through the BRAC process the relocation of the Third Army and more recently the addition of the MQ-9 Reaper unit. A potential of several thousand new residents is expected when including the employees’ families.
Additional growth provides residents with new cultural, recreational, and economic opportunities but creates renewed challenges for preserving the area’s high quality of life. These challenges include increased traffic congestion and pollution as well as loss of open space and evolving
commuting patterns. Presently, a significant percentage of Sumter County residents stay within the county for work. Based on U.S. Census data, approximately 57.3% of workers who live in Sumter County also work there. More information can be found in Table 2.1. Regional growth has resulted in an expanded urbanized area and MPO boundary.
A more centralized employment base places more pressure on local officials to establish a transportation system that balances the economic needs of the region. In Sumter County’s case, the central employment base does little to discourage local residents from using personal transportation to get to work. According to the 2013 and 2015 American Community Survey, the share of commuters choosing to drive alone to work increased slightly from 84.3% to 84.4% between 2013 and 2015. Public transportation users decreased by 0.2% and those biking or walking to work increased from 2.4% to 3.6%.
The increased reliance on driving alone to work can create a burden on the transportation system. However, the average travel time to work for Sumter County workers (21.8 minutes) remains slightly below South Carolina (23.1 minutes) and national (24.8 minutes) averages.
Table 2.1 – Where workers live in relation to Sumter County
County Where workers live who are employed in Sumter County
Where workers are employed who live in Sumter County
Avg. Percent
Sumter 21,334 21,334 57.3%
Richland 2,072 4,177 8.3%
Clarendon 2,242 972 4.3%
Florence 808 1,175 2.7%
Kershaw 874 1,015 2.5%
Charleston 547 684 1.6%
Horry 498 546 1.4% All other Counties
8,139 8,108 21.8%
Source: U.S. Census Bureau, 2015


2045 Long Range Transportation Plan
2-3 Introduction and Vision | Final Report | November 2018
A multimodal transportation system providing true choice to all users can reduce the burden. The SUATS 2045 Long Range Transportation Plan accounts for growth in population and traffic as well as shifting travel patterns. The plan balances the SUATS MPO area’s quality of life with the need to effectively and efficiently move goods and people to a variety of local, regional, and national locations.
To ensure the plan becomes a working document, projects identified as highest priority will move into the Transportation Improvement Program (TIP), a six-year, intermodal program of prioritized transportation initiatives. The TIP is updated every three-year period, and projects not listed in the TIP are ineligible for FHWA and FTA funds.
Public Outreach Transportation planning is a cooperative process led by the region’s MPO and involving key stakeholders and the general public. The public involvement process offers a diversity of opinions from residents, business community, civic groups, and environmental groups. In particular, the plan must represent the viewpoints of traditionally underserved groups such as the minority, low income, and Hispanic communities. At the start of the update, the project team developed a public involvement plan that was proactive, continuous, and collaborative. Public outreach occurred through a variety of small- and large-group meetings and through an assortment of media.
Transportation Plan Steering Committee
The plan Steering Committee consisted of a group of federal, state, regional, and local agency partners and local elected officials. This group worked with the SUATS MPO area to represent the needs and interests of the region’s citizens and to ensure the final plan incorporated several viewpoints and concerns. Beginning with a meeting on October 12, 2017, the plan Steering Committee and City/County staff met periodically to fulfill the mission of examining the existing deficiencies and potential solutions for bicycling, walking, driving, transit, and freight, as well as the relationship between transportation and land use to help shape the plan. The group’s duties included serving as a sounding board for project team ideas, participating in visioning and mapping exercises, providing feedback to the project team, and spearheading the promotion of other public involvement efforts.
At its first meeting, the plan Steering Committee discussed general issues and specific concerns that had arisen since the previous update in 2013. These issues included current influences on commuting patterns and freight movement, maintaining the small town, family-oriented feel of the area, promoting continued economic development through transportation infrastructure decisions, and identifying and improving specific problem corridors. The group also discussed the impending performance measures mandated by the State.
In their subsequent meeting, the plan Steering Committee had the opportunity to offer feedback on recommended multimodal improvements, project prioritization, potential funding sources, and the results from the public survey and other public outreach events.
Public Survey
A public survey distributed to the general public provided the project team with information on a variety of topics. The questionnaire was made available on the Internet before and after the first public workshop. The 12-question survey asked a variety of questions on all aspects of the transportation network. In addition, respondents were given the opportunity to offer feedback using an interactive map. The results of this effort helped to direct the recommendations development process.
An important question from the survey asked participants to rate how traffic conditions in the Sumter area improved, stayed the same, or worsened in the last 5 years. The responses indicate room for improvements. In fact, the majority of respondents believed conditions have slightly or significantly worsened within that time frame (72%). 20% of respondents believed it to stay the same, while 8% believed conditions have slightly or significantly improved.
Another question asked participants which improvement is the most important to them in order to improve traffic safety. 60% of respondents found that improving transportation safety at the region’s most dangerous intersections was the most important in order to improve traffic safety. This was followed by investing in smart technologies and making the transportation network more reliable and travel times more predictable. More information from the survey can be found in the appendix.
In your opinion, in the last 5 years, has traffic conditions in the
Sumter area improved, stayed the same, or worsened?
Which of the following is the most important to you in order to improve traffic safety?
1%
7%
20%
38%
34%
1%
Significantly improved
Slightly improved
Stayed the same
Slightly worsened
Significantly worsened
Blanks (Skipped)
60%
24%
15%
2%
Improving transportation
safety at the regions most
dangerous intersections
Investing in smart
transportation technologies
Making the transportation
network more reliable and
travel times more
predictable
Blanks (Skipped)

Draft Report | November 2017
2045 Long Range Transportation Plan
2-4 Introduction and Vision | Final Report | November 2018
Public Workshops
Citizens understand the strengths and weaknesses of the SUATS MPO area’s transportation system and are affected by transportation decisions on a very personal level. To tap into the special knowledge of the citizens of the MPO area, the project team held two public workshops at the Swan Lake Visitors Center on October 12, 2017 and April 16, 2018. Attendees had the opportunity to view existing conditions maps as well as participate in several activities that allowed them to voice their opinions as well as their priorities regarding transportation. The comments spanned all the elements of the long-range transportation plan. A brief synopsis of the workshop is below while a full summary can be found in the appendix.
One Word
Describe in one word your vision for the FUTURE:
Priority Pyramid
In the priority pyramid activity, participants were asked to rank the plan’s guiding principles from most important priority to least important priority. The guiding principles are: culture & environment, economic vitality, growth & development, mobility & accessibility, safety & security, and network preservation.
Participants ranked the guiding principles as follows:
1. Safety & Security 2. Economic Vitality 3. Mobility & Accessibility 4. Growth & Development 5. Culture & Environment 6. Network Preservation
The comments received during the first workshop and the public survey informed the development of recommended facilities and policies. Prior to submitting a draft plan, the project team and plan Steering Committee again assembled with the public to discuss progress and recommendations. During the second workshop, the project team reviewed with the public the plan’s vision and multimodal recommendations, along with supporting information that was used in the prioritization process, allowing participants the opportunity to offer input that would influence the final recommendations of the plan.
Previous Planning Efforts
To enhance the public involvement efforts specific to the SUATS 2045 Long Range Transportation Plan, the project team considered the involvement from other recent planning activities. Recent planning efforts at SWRTA, greenway planning undertaken by Sumter City-County Planning Department, SCDOT safety and resurfacing plans, Penny for Progress projects, and recent federal legislation changes (SCDOT Performance Measures) provided valuable insight into the
public’s vision for the SUATS MPO area as well as the local, state, and federal funding and regulatory mechanisms.
Success in public engagement is measured not only in plan adoption but also in rapid implementation of projects identified as high-priority. The vision and objectives of the SUATS 2045 Long Range Transportation Plan provide the foundation for project identification.
Vision The vision for the SUATS Long-Range Transportation Plan was developed based on the input received from the plan Steering Committee and the public. The vision statement is as follows:
SUATS MPO area citizens envision
a livable, growing community that
attracts “new economy” as well
as residents that desire higher
quality lifestyles linked to a safe,
efficient, maintainable, and
environmentally compatible
transportation system that
provides convenient choices for
accessing destinations throughout
the SUATS MPO area.

Draft Report | November 2017
2045 Long Range Transportation Plan
2-5 Introduction and Vision | Final Report | November 2018
Goals After the vision for the plan was established, the next step was to develop a set of goals that would serve as a guide for shaping the remainder of the plan. The goals that follow balance the vision with the results of the public involvement process. These goals guided the development of the SUATS 2045Long Range Transportation Plan.
Federal Regulations
MAP-21
The Moving Ahead for Progress in the 21st Century Act (MAP-21) was signed into law on July 6, 2012. It provides over $105 billion in funding for surface transportation programs for fiscal years 2013 and 2014 and will guide the growth and development of America’s transportation infrastructure. The goals of MAP-21 include:
▪ Strengthening America’s highways
▪ Establishing a performance-based program
▪ Creating jobs and supporting economic growth
▪ Supporting the United States’ Department of Transportation’s
aggressive safety agenda
▪ Streamlining Federal highway transportation programs
▪ Accelerating project delivery and promoting innovation
The goals of MAP-21 manifest themselves into eight broad planning factors that have been identified within the MPO long range transportation planning program and are addressed through this plan. Local officials must consider how projects and transportation initiatives address the following areas:
▪ Support the economic vitality of the metropolitan area, especially by
enabling global competitiveness, productivity, and efficiency
▪ Increase the safety of the transportation system for motorized and
non-motorized users
▪ Increase the security of the transportation system for motorized
and non-motorized users
▪ Increase the accessibility and mobility of people and for freight
▪ Protect and enhance the environment, promote energy
conservation, improve quality of life, and promote consistency between transportation improvements and State and local planned growth and economic development patterns
▪ Enhance the integration and connectivity of the transportation
system, across and between modes, for people and freight
▪ Promote efficient system management and operation
▪ Emphasize the preservation of the existing transportation system
FAST Act
On December 4, 2015, Public Law 114-94, the Fixing America’s Surface Transportation Act (FAST Act) was signed into law. The FAST Act funds transportation programs for fiscal years 2016 through 2020 and is the first long-term surface transportation authorization enacted in a decade that provides funding certainty for surface transportation. The FAST Act supports critical transportation projects to ease congestion and facilitate freight movement on major roads by establishing and funding new policies and programs.
The FAST Act carried forward the federal mandate for performance based planning established as a part of MAP-21. In addition, the FAST Act established a focus on new planning areas such as travel and tourism, system resiliency, and regional transit.
Performance Based Planning
Performance based planning is a strategic approach that uses system information and data to make important investment and policy decisions to achieve goals set for the transportation system within the MPO. Performance based planning and programming (PBPP) refers to transportation agencies’ application of performance management as standard practice in the planning and programming processes. As it currently stands, the Federal Highway Administration (FHWA) and the Federal Transit Administration (FTA) requires state DOTs and MPOs to monitor transportation systems using specific performance measures for both highway and transit performance respectively. More information on this process can be found in Chapter 12.
Minimize environmental impacts of the transportation systems by utilizing planning tools to preserve and promote natural assets.
Support the local economy by making it easier to move people and freight around and through the area while maximizing benefits and minimizing costs.
Create a system of interconnected streets with appropriate use by developing a plan that supports existing and future development.
Provide a balanced transportation system that makes it easier to walk, ride a bike, and take transit by encouraging streetscape and “built-in” traffic calming.
Provide and promote a safe and secure transportation system for all users by reducing crashes and improving pedestrian and bicycle facilities.
Ensure the quality of the current network is upheld to provide robust service to residential, commercial, industrial, and military uses.

Draft Report | November 2017
2045 Long Range Transportation Plan
2-6 Introduction and Vision | Final Report | November 2018
Elements of a Transportation Plan This plan serves as a tool and guide for decision-makers in the implementation of the SUATS MPO area’s transportation system. The plan represents the collective vision of a safe, multimodal, and interconnected transportation system that supports continued economic development without comprising the natural, historic, and social resources vital to the SUATS MPO area’s sustainability. Elements of the plan include:
Social and Environmental Screening
The SUATS 2045 Long Range Transportation Plan concludes with two critical chapters. The Financial Plan investigates potential funding sources and revenues and identifies probable costs for the recommendations in order to produce a fiscally-constrained plan program. The Implementation Plan provides a roadmap for design and construction of proposed projects.
Roadway Element Bicycle and Pedestrian Element
Transit Element Freight and Aviation Element Scenario Planning

Draft Report | November 2017
2045 Long Range Transportation Plan
2-7 Introduction and Vision | Final Report | November 2018
This page intentionally left blank.

CHAPTER 3 — SOCIAL AND ENVIRONMENTAL
ELEMENT 2045 Long Range Transportation Plan
3-1 Social and Environmental Element | Final Report | November 2018
Transportation projects have the potential to create significant impacts to the natural environment and can disrupt communities as much as they improve traffic mobility. Only through early awareness and responsible planning can these impacts be minimized or even avoided. Environmental and social issues must be addressed early in the planning process in order to avoid inefficient use of time and resources. The result is a transportation plan that is respectful of the environment and cost-effective in its implementation.
The majority of impacts associated with projects in a typical long-range transportation plan (LRTP) are associated with roadway projects. This is mainly due to the large amounts of land required to build roadway projects. The resulting facility that can become not only a conduit for traffic but also a barrier to the surrounding community. Sidewalks and bicycle facilities are much more limited in the magnitude of their impacts, due to smaller cross-sections and greater flexibility to avoid problem areas. Furthermore, pedestrian and bicycle facilities are most often built in conjunction with roadway facilities and have only marginal impacts, if any, beyond those of the roadway itself.
Transit improvements such as bus route and service expansions typically involve no new construction and therefore tend to have minimal impacts on either the natural or manufactured environment. In general, transit improvements improve social and environmental conditions because increased service tends to reduce vehicle miles traveled (VMT), lower air emissions, and improve accessibility in disadvantaged neighborhoods.
The following chapter examines the social and environmental conditions in the SUATS MPO area. It also includes a series of maps that illustrate some of the discussion of the plan’s environmental screening. These maps include elements such as wetlands, recycling centers, hazardous waste treatment and storage facilities, schools, churches, hospitals, as well as socioeconomic distributions. When overlaid with the proposed transportation projects, these will prove to be useful tools in assessing the relative impacts to the environment.
Social and Environmental Features
Environmental Features
When both the existing growth rate and the projected influx of military population are considered, it is clear that the SUATS MPO area will continue to urbanize. As growth occurs, impacts to the environment are inevitable. With the development of new infrastructure, it will be important to manage and minimize these impacts. Some natural amenities, however, such as clean water and open spaces must be maintained to satisfy not only residents’ desires for a high quality of life, but also state and federal environmental policies. Figures 3.1 and 3.2 depict important environmental features within the SUATS study area. Figure 3.1 shows that there are a significant number of wetlands in the SUATS region. Lake Marion is partially contained within Sumter County, and the large number of streams and rivers drain towards the coast. There are also 14 locations in the study area (3 more than in 2013) with 401 certification, granting the state authority to protect the water quality at the site under the Clean Water Act (CWA). Figure 3.2 displays other environmental issues such as the locations of infectious waste generators, dry cleaners, underground storage tanks, and recycling centers.
Social Features
Figure 3.3 shows the locations of many social features of the SUATS MPO area, such as schools, places of worship, libraries, hospitals, and shopping areas. All of these locations can serve as popular destination points as well as important community landmarks. Shaw Air Force Base is also shown on this map and is important to consider as a hub of residential, industrial, and commercial growth.
The environmental and social features shown in these figures should be considered together in order to create a more complete picture of the SUATS area. Responsible planning dictates that these features should be considered during the planning process.


3-3 Social and Environmental Element | Final Report | November 2018
2045 Long Range Transportation Plan

3-4 Social and Environmental Element | Final Report | November 2018
2045 Long Range Transportation Plan

3-5 Social and Environmental Element | Final Report | November 2018
2045 Long Range Transportation Plan
Environmental Justice Environmental justice is a movement intended to avoid the use of federal funds for projects, programs, or other activities that generate disproportionate or discriminatory adverse impacts on minority or low-income populations. This effort is consistent with Title IV of the 1964 Civil Rights Act, and is promoted by the U.S. Department of Transportation (USDOT) as an integral part of the long-range transportation planning process, as well as individual project planning and design. The environmental justice assessment incorporated in this LRTP update was based on three basic principles, derived from guidance issued by the USDOT:
▪ The planning process should avoid, minimize, or mitigate
environmental impacts (including economic, social, and human health impacts) that affect minority and low-income populations with disproportionate severity.
▪ Transportation benefits should not be delayed, reduced, or denied to minority and low-income populations.
▪ Any community potentially affected by outcomes of the transportation planning process should be provided with the opportunity for complete and equitable participation in decision-making.
As part of this transportation plan update, 2015 American Community Survey data was used to identify the geographic distribution of minority (non-white), Hispanic, low-income populations, and no vehicle households so positive and negative effects of various transportation investments in the transportation plan could be assessed. This information is depicted on Figures 3.4, 3.5, 3.6 and 3.8.
Figure 3.4 depicts the minority population in the SUATS study area. This figure indicates that there is a large minority population in the SUATS MPO area. In fact, the population of Sumter County is divided almost 50/50 between minority and non-minority residents with the majority of downtown Sumter being 80% or above minority residents. When compared with other counties in South Carolina, Sumter County has the 12th highest percentage of minority population with 51.4% (according to 2016 American Community Survey data). The racial makeup of Sumter County is compared with South Carolina and the United States in Table 3.1 and the chart to the right.
Figure 3.5 depicts the Hispanic population in the SUATS area. As is shown in the figure, the Hispanic population is slightly lower than the statewide average. Census data for Sumter County indicates that 3.7% of the county population is Hispanic. However, the Hispanic population is the fastest growing population cohort in Sumter County.
Figure 3.6 depicts the percentage of the population in the SUATS area that is below the poverty line. The figure indicates that the portions of the study area with the greatest percentage of population below the poverty level are in East Sumter, with other areas located near Shaw Air Force Base.
While it is nearly impossible to construct infrastructure without impacts, it is through careful planning and early consideration that the SUATS 2045 Long Range Transportation Plan intends to manage impacts to communities effectively. Rather than an ad hoc approach to environmental justice planning, this transportation plan identified sensitive communities early in the process. Early identification allows for an assessment of the existing transportation plan and influences the selection and alignment of future transportation improvements.
Minority Population Composition
0%
20%
40%
60%
80%
100%
120%
United States South Carolina Sumter County
Two or More Races
Some Other Race alone
Native Hawaiian and Other Pacific Islander alone
Asian alone
American Indian and Alaska Native alone
Black or African American alone
White alone
Table 3.1 Minority Population Comparison
Category United States
South Carolina
Sumter County
White alone 223,657,078 3,252,000 52,297
Black or African American alone 40,241,818 1,322,368 50,317
American Indian and Alaska Native alone
2,597,817 15,417 231
Asian alone 16,614,625 68,553 1,317
Native Hawaiian and Other Pacific Islander alone
560,021 2,784 5
Some Other Race alone 15,133,856 73,149 723
Two or More Races 9,752,947 100,082 2,792
Total 318,558,162 4,834,605 107,682
% Minority Population 26.7% 32.7% 51.4%
Source: 2016 American Community Survey

3-6 Social and Environmental Element | Final Report | November 2018
2045 Long Range Transportation Plan
Planning Guidelines During the development of the transportation plan, the SUATS study team met and discusses how to avoid and minimize impacts to known environmental features based on available data. The collection and consideration of this data early in the planning process is intended to lessen environmental impacts and reduce potential conflicts during permitting. In addition, when considering new roadway alignments and extensions, planners and engineers should use a guiding set of principles, including those listed below, to ensure that environmental considerations are followed:
▪ Avoid steep slopes and otherwise unsuitable topography
▪ Minimize impacts to the built environment
▪ Stay away from FEMA designated floodplains
▪ Minimize the number of wetland (National Wetland Inventory)
impacts
▪ Minimize the amount of each wetland impact (e.g., don’t cross a wide
wetland when a narrower one can be crossed)
▪ Minimize the number of stream crossings
▪ Minimize the length of stream crossings
▪ Minimize impacts to school sites
▪ Minimize the number and size of impacts to historic features and districts
▪ Minimize the number and size of impacts to threatened and endangered species
▪ Minimize the number and size of impacts to hazardous waste sites
▪ Minimize the number and size of impacts to superfund sites
▪ Minimize or avoid impacts to neighborhoods
▪ Avoid unnecessary or disproportionate impacts to minority and low-
income communities
▪ Avoid impacts to parks and designated open spaces
▪ Minimize gameland impacts
▪ Minimize the number of new facilities in critical watershed areas
▪ Be aware of existing development patterns
▪ Capitalize on street connectivity opportunities such as stub-out streets
▪ Encourage a multimodal system with the promotion of pedestrian, bicycle, and transit networks


3-11 Social and Environmental Element | Final Report | November 2018
2045 Long Range Transportation Plan
This page intentionally left blank.

CHAPTER 4 — EXISTING ROADWAY ELEMENT
2045 Long Range Transportation Plan
4-1 Existing Roadway Element | Final Report | November 2018
Introduction Sumter is the county seat of Sumter County, approximately 15 miles west of Interstate 95 and 18 miles south of Interstate 20. Established by settlers in the 1740s, the city has grown into the largest city in the county, and the seventh largest metropolitan area in South Carolina. Within Sumter County, Shaw Air Force Base, Sumter School District, Pilgrims Pride Poultry Processing, the Continental Tire manufacturing plant, and Toumey Healthcare System are the primary employment centers and attract numerous peak hour trips each day. The majority of significant commercial development in the county is located along primary transportation corridors such as US 378, US 521, and Broad Street. In the future, planned development will result in increased traffic volumes, similar to that currently generated by major employers and commercial developments in the area.
As commercial development continues and population increases, traffic volumes can be expected to climb. This increase in traffic volumes will create new deficiencies on the existing transportation network. Traffic bottlenecks may become evident in places that currently function adequately and existing deficiencies will be magnified.
Evaluating the existing transportation system helps to better identify needs and priorities for the purposes of planning. The discussion of existing highway conditions is organized into the following sections:
▪ Transportation Corridors and Activity Corridors
▪ Functional Classification
▪ Corridor Operations
▪ Traffic Safety and Crash History
Transportation Corridors and Activity
Centers
An inherent relationship exists between land use and transportation. As development occurs and more vehicles take to the road, roadway improvements are needed to reduce traffic congestion. These roadway improvements often enhance access, thus raising land values and attracting more development. The figure to the right illustrates this continuing cycle of influence between land use and transportation.
The interaction between activity centers and the transportation corridors that link them to other centers and destinations is important, as are the mobility choices that are provided within the center. Often neighborhoods and activity centers rely on a small number of transportation corridors to provide essential links between home, school, employment, shopping, social, and recreation destinations. The extent to which these origins and destinations blend into multi-purpose activity centers has a dramatic effect on a person’s ability to choose between modes for their trip. In many cases, the range of trip alternatives (walk, bike drive, or transit) also can influence the overall perception of a community. Table 4.1 on the following page summarizes three types of activity centers – regional, community, and neighborhood – and provides local examples.
The level of success for corridors within and between activity centers depends in large part on the intended function of the street. A unique challenge for the future will be to balance the area’s mobility needs with other priorities. Often traffic mobility has been given priority without regard for other considerations such as the function of the street, corridor relationship to land use, urban design, and the promotion of alternate modes.
One of the unique challenges in creating a successful transportation system for the SUATS region is blending connectivity and access functions with preservation of natural features and the unique character of the SUATS MPO area. Neighborhoods and smaller communities within the region may have different needs and priorities. While recognizing these differences, it is important not to lose focus of the practical concept of overall connectivity. This concept is particularly relevant as it relates to people’s desires to make safe and efficient trips not only by driving, but also by walking, bicycling, or using public transportation. The discussion of complete streets in Chapter 5 sets the stage for the region to balance the mobility and access functions of a roadway.

4-2 Existing Roadway Element | Final Report | November 2018
2045 Long Range Transportation Plan
Functional Classification
The classification of streets into several “functional” categories aids in communication among policy makers, planners, engineers, and citizens for expanding the transportation system. The functional classification system groups streets according to the land use served (or to be served) and provides a general designation of the type of traffic each street is intended to serve. The functional classification system primarily defines the street in terms of roadway design and character, as well as operational features for the movement of vehicles.
Two major considerations for classifying arterials from neighborhood streets are access and mobility. The primary function of local or neighborhood streets is to provide access. These streets are intended to serve localized areas or neighborhoods, including local commercial and mix-use land uses (i.e. low speeds, low volumes, short distances). Local streets are not intended for use by through traffic. The primary function of arterials is mobility. Limiting access points (intersections and driveways) on arterials enhances mobility. Too much mobility at high speeds limits access by pedestrians and bicyclists. The arterial is designed with the intent to carry more traffic than is generated within its corridor (i.e. higher speeds, higher volumes, and longer distances).
Classifying the SUATS MPO area street system required close examination of roles that each street performs in the overall transportation system. Sumter City-County Planning Department worked with SCDOT in 2012 to update the MPO’s functional classification network. As a result of this exercise, the existing public street network in Sumter is divided into several functional classifications, including freeways, major arterials, and collector streets. Figure 4.1 illustrates the functional classifications for Sumter’s roadway network.
Table 4.1 – Activity Centers
Center Type Characteristics
Regional Activity Center
Local Example
▪ Downtown Central Business District
Transportation Corridor
▪ Main Street
▪ Large-scale, transit supportive center of employee-intensive land uses
▪ Core areas contain large-scale and high intensity urban land uses supported by and serving communities
within the region
▪ Accessed by interstates/freeways, major arterials, and public transportation
▪ Served by municipal water and sewer
▪ Higher residential densities
▪ Balance between residential/non-residential land use
Community Activity Center
Local Example
▪ Sumter Mall
Transportation Corridor
▪ Broad Street
▪ Include a combination of retail, personal services, civic, educational, and social uses
▪ Core areas contain medium-scale development that serve the day-to-day needs and activities of the core area
occupants and the surrounding neighborhoods
▪ Accessed by major arterials and public transportation
▪ Served by municipal water and sewer
▪ Medium density residential areas
▪ Residential/non-residential land use mix is approximately 60/40
Neighborhood Activity Center
Local Example
▪ Wilson Hall Neighborhood
Transportation Corridor
▪ South Wise Drive
▪ Mostly residential with a mixed-use core that serves as a focal point for the neighborhood and provides
retail and service needs
▪ Accessed by major and minor arterials with integrated collector street access
▪ Mixture of low and medium density residential areas
▪ Transit service provided or desired

4-4 Existing Roadway Element | Final Report | November 2018
2045 Long Range Transportation Plan
Arterials
Arterials provide high mobility, operate at higher speeds (45 mph and above), provide significant roadway capacity, have a greater degree of access control, and serve longer distance travel. Arterials can be subdivided into categories that include facilities with full access control such as freeways and expressways, as well as major and minor arterials. Arterials usually connect to one another or to collector streets. Very few arterials connect to local streets.
Expressways and Freeways
Expressways and freeways provide the most mobility and least access (since access is only available at interchanges). Freeway/ expressway facilities typically serve longer distance travel and support regional mobility. The state funds roadway improvement and maintenance on these facilities. The US 76-378 Bypass (Robert Graham Freeway) is
classified as an expressway/freeway.
Major Arterials
Major arterials typically have tightly controlled access and few, if any, individual site driveways. These facilities serve medium to longer distance travel and typically connect minor arterials and collector streets to freeways and other higher type roadway facilities. Generally, roadway improvements and maintenance on major arterials are funded by the state.
Major arterials within the SUATS area include Broad Street (US 76 Business), US 15, US 521, SC 441, US 76
west of the US 76-378 Bypass, and US 401 north of the US 76-378 Bypass.
Minor Arterials
Minor arterials primarily serve a mobility function but often have more closely spaced intersections, some individual site driveways, and generally lower design and posted speeds compared to other arterials. The minor arterial network is primarily intended to serve travel demand within the local area. These roadways connect to other minor arterials, to major arterials, and to collector streets. Minor arterials provide a higher level of access to adjacent land uses than major arterials and typically have lower traffic volumes. For the most part, minor arterials are maintained by the state, but the cost of improvement may be the responsibility of local governments.
In general, minor arterials in Sumter have two-lane undivided cross-sections with little or no paved shoulders and an occasional left-turn lane at intersections and major driveways. Posted speed limits on minor arterials range from 35 mph to 45 mph. other characteristics may include sidewalks, signalized intersections, and on-street parking (in residential areas and the centralized business district).
Minor arterials in Sumter include Alice Drive, Patriot Parkway, Pinewood
Road, North Main Street, Wedgefield Road, and Loring Mill Drive.
Collectors
Collectors typically provide less overall mobility, operate at lower speeds (less than 35 mph), have more frequent and greater access flexibility with adjacent land uses, and serve shorter distance travel than arterials. Collectors provide critical connections in the roadway network by bridging the gap between arterials and locals. Thus, the majority of collector streets connect with
one another, with local streets, and with non-freeway/expressway arterials.
The primary purpose of the collector street system is to collect traffic from neighborhoods and distribute it to the system of major and minor arterials throughout an area. In general, collector streets have two lanes and often have exclusive left-turn lanes at intersections with major and minor arterials and less frequently at intersections with other collector streets. Collector streets are rarely constructed and funded by the state. Responsibility for collector streets usually falls to the local government and the development community for funding, design, and construction.
Within Sumter, collector streets have a wide range of physical characteristics, some of which are attributable to the neighborhoods in which they exist. Though different, the one commonality is that of providing good connectivity.
Examples of collector streets in the SUATS area include Carter Road, East Calhoun Street extended, Kingbury Drive, Lewis Road, South Main Street, and Stadium Road.
Locals
Local facilities provide greater access and the least amount of mobility. These facilities typically connect to one another or to collector streets and provide a high level of access to adjacent land uses/development (i.e. frequent driveways). Locals serve short distance travel and have low posted speeds limits (25 mph to 35 mph). Most roadways within the SUATS area are classified as locals.
Expressway/Freeway – US 76-378
Major Arterial – Broad Street
Minor Arterial – Alice Drive Collector – Loring Place Local Road

4-5 Existing Roadway Element | Final Report | November 2018
2045 Long Range Transportation Plan
Corridor Operations
Regional Access
Regional access in the SUATS area is provided by three major US routes: US 15, US 521, and US 378. While US 15 and US 521 are not freeways today, these corridors connect to the region’s freeways (including US 378) and provide for the relatively efficient movement of high volumes of traffic and increased mobility (except during peak traffic periods).
The primary north-south route is US 15, which connects Sumter to I-20 to the north and I-95 to the south. US 521 provides an alternate connection to I-95 and points south. Movements east and west rely on the network of roads near downtown as well as the US 76-378 Bypass (Robert Graham Freeway). US 76-378 connects Sumter with Columbia to the west. To the east, US 378 connects Sumter to I-95 before continuing to Conway and Myrtle Beach.
Congested Corridors
Congestion in corridors is related to a number of factors, but is often the result of bottlenecks – primarily at intersections – along the corridor. Aside from individual bottleneck locations in corridors, congestion frequently results from too many people trying to use a route that is already at or over-capacity.
Traffic volumes signify the total number of vehicles traveling along a roadway segment on an average day. Figure 4.2 illustrates existing congested corridors in the SUATS MPO area during the model base year of 2015, determined using the SCDOT’s regional travel demand model. The region’s highest traffic volume of 24,500 vehicles per day occurs on Broad Street south of the US 76-378 Bypass (Robert Graham Freeway). W Liberty Street experiences high traffic volumes (19,100 vehicles per day) between Alice Drive and Loring Mill Drive. Other arterials with high traffic volumes include Alice Drive between W Liberty Street and Miller Road (11,600 to 19,750 vehicles per day).
However, traffic volumes alone should not be used to determine congested corridors because this measurement does not take into account different functional classifications and roadway capacity. A better measurement for this comparison is volume-to-capacity (V/C) ratios. V/C ratios are calculated by dividing the traffic volume of a roadway
segment by the theoretical capacity of the roadway. Although V/C can be tied to level of service (LOS), V/C allows for a more specific analysis. The result is a universal quantitative measurement. The V/C ratios shown in Figure 4.2 fall into one of the following categories:
▪ Approaching Capacity (V/C = 0.9 to 1.09) – A roadway with a V/C less than 0.8 typically operates with efficiency. As the V/C nears 1.0, the roadway becomes more congested. A roadway approaching capacity may operate effectively during non-peak hours but be congested during peak travel periods.
▪ At Capacity (V/C = 1.10 to 1.29) – Roadways operating at capacity
or slightly above capacity are heavily congested during peak periods and moderately congested during non-peak periods. A change in capacity due to incidents greatly impacts the travel flow on corridors operating within this V/C range.
▪ Over Capacity (V/C > 1.30) – The roadways in this category represent the most congested corridors in the SUATS area. These roadways are congested during non-peak hours and most likely operate in stop-and-go gridlock conditions during the morning and evening peak travel periods.
Growth in the SUATS MPO area, along with insufficient increases in
roadway capacity, has resulted in peak hour traffic congestion on many major area roadways. During the morning and afternoon peak travel periods, sections of commuter travel corridors are frequently congested.
The most notable congestion occurs on US 521. This was noted as having high congestion in the 2013 plan update. Based on the 2013 model, much of this corridor operates over capacity, however with the increased granularity of the 2018 model, the corridor operates at a lower capacity apart from the section at the Camden Highway merge which operates at a V/C ratio of 2.36. Other congested corridors include:
▪ St. Pauls Church Road from Cane Savannah Road to McCrays Mill Road
▪ McCrays Mill Road from Santa Fe Trail to Lyman Road
▪ Patriot Parkway from Deschamps Road to Lost Creek Drive
The Transportation Improvement Program (TIP) provides a financially constrained list of the most immediate priority transportation improvements for an area. The current (2017-2022) TIP projects of interest in the SUATS MPO area include intersection improvements at Pinewood Road at McCrays Mill Road, Robert E. Graham Freeway at Myrtle Beach highway & N. Pike E. Road and S. Pike E. Road, and Thomas Sumter Highway at Camden Highway. Several other projects involve corridor improvements which are funded through the Pennies for Progress sales tax program. The recommendations that follow in Chapter 5 as well as the multimodal solutions presented in Chapters 6-8 aim to alleviate system-wide congestion in a cost-effective and time-efficient manner.
Level of Service A Level of Service B Level of Service E or F

4-6 Existing Roadway Element | Final Report | November 2018
2045 Long Range Transportation Plan

4-7 Existing Roadway Element | Final Report | November 2018
2045 Long Range Transportation Plan
Traffic Safety and Crash History Traffic safety is a key component to any successful transportation plan, and a thorough examination of crash history and traffic patterns can usually predict key locations where an improvement in traffic safety will be beneficial to both motorists and the community as a whole. A traditional approach to determining locations for safety countermeasures involves studying the number and type of crashes in a location, as well as the associated crash rate for the location.
The methodology used in this analysis builds on that traditional approach, while factoring in other key components such as total volume of vehicles entering the intersection per day, equivalent property damage only rate, inclusion in the state transportation improvement program, and functional classification of the intersecting roadways. The inclusion of these components allows the user to establish a priority ranking system that will allow money earmarked for safety projects to be spent in the most efficient and cost-effective manner.
The worst-case crash locations considered for safety improvement in the SUATS study area are shown in Table 4.2. The summary of crash data shown in the table represents reported crashes at the specified locations from 2013-2016. These locations are further detailed in Figure 4.3. Each location was analyzed and given a weighted score based on criteria such as frequency, severity, and traffic volume. The overall weighted scores were used to determine the safety ranking of the intersection.
Contributing factors to a location’s high crash frequency include intersection design, access considerations, and traffic congestion. Many of the locations identified with high crash frequency were also locations where congestion often exists. A direct relationship exists between traffic congestion and crash frequency, which justifies the ongoing efforts to provide adequate funding for transportation projects that minimize traffic congestion. Driveway access in proximity to intersections can also contribute to crash frequency by increasing the unexpected conflict points near the intersection.
The following sections provide a more detailed analysis of the top ten priority locations concerning crashes, as well as recommendations for potential countermeasures based on the priority ranking system and a detailed engineering field review.
Priority Locations
Table 4.2 and Figure 4.3 show the top seventeen worst-case crash locations in the SUATS study area as rated by SCDOT. Three additional intersections were looked at during the prioritization process outlined in Chapter 10 to understand the full scope of congested intersections in conjunction with high crash rate intersections within the study area. A complete list of analyzed intersections can be found in that chapter. The following section provides more details on the intersections featured in Table 4.2. For each location a list of crash statistics, potential causational factors, and recommended countermeasures are included.
Table 4.2 – Intersection Priority Rankings
# Intersection 2013-2016
Total Crashes
Crash
Rate
1 US 15 & S 25 (Lewis Road/Old Manning) 74 2.49
2 Broad Street & Wilson Hall Road 66 1.79
3 N Washington Street & W Calhoun Street 35 1.74
4 N Guignard Drive & West Liberty Street 68 1.74
5 Broad Street & Wise Drive 35 1.66
6 N Lafayette Drive & E Liberty Street 49 1.64
7 Broad Street & Loring Mill Drive 48 1.45
8 Broad Street & Miller Road 42 1.35
9 Broad Street & N St. Pauls Church Road 42 1.31
10 Broad Street & Mason Road 47 1.29
11 Wedgefield Road & Pinewood Road/W Liberty
45 1.25
12 Broad Street & Robert Dinkins Road 41 1.18
13 Broad Street & Stamey Livestock Road 36 1.02
14 Alice Drive & W Liberty Street 26 0.77
15 Broad Street & Eagle Road 17 0.61
16 Camden Highway & Alice Drive 14 0.50
17 N Guignard Drive & Miller Road 17 0.41

4-8 Existing Roadway Element | Final Report | November 2018
2045 Long Range Transportation Plan

4-9 Existing Roadway Element | Final Report | November 2018
2045 Long Range Transportation Plan
Priority Intersection Analysis
1. US 15/ S-25 (Lewis Road / Old Manning Road)
The intersection of US 15 and S-25 (Lewis Road/Old Manning Road) experienced 74 total crashes over the 3-year analysis period. Of these 74 crashes, none were fatal and 25 involved at least one injury. Additionally, 1 crash involved a pedestrian.
2. Broad Street and Wilson Hall Road
The intersection of Broad Street and Wilson Hall Road experienced 66 total crashes over the 3-year analysis period. Of these 66 crashes, 2 were fatal and 17 involved at least one injury.
3. N Washington Street and W Calhoun Street
The intersection of N Washington Street and W Calhoun Street experienced 35 total crashes over the 3-year analysis period. Of these 35 crashes, none were fatal and 11 involved at least one injury. Additionally, 2 crashes involved cyclists and 1 involved a pedestrian.
4. N Guignard Drive and W Liberty Street
The intersection of N Guignard Drive and W Liberty Street experienced 68 total crashes over the 3-year analysis period. Of these 68 crashes, 1 was fatal and 24 involved at least one injury. Additionally, 1 crash involved a pedestrian.
5. Broad Street and Wise Drive
The intersection of Broad Street and Wise Drive experienced 44 total crashes over the 3-year analysis period. Of these 44 crashes, none were fatal and 15 involved at least one injury.
6. N Lafayette Drive and E Liberty Street
The intersection of N Lafayette Drive 15 and E Liberty Street experienced 49 total crashes over the 3-year analysis period. Of these 49 crashes, none were fatal and 18 involved at least one injury. Additionally, 3 crashes involved a cyclist.
7. Broad Street and Loring Mill Drive
The intersection of Broad Street and Loring Mill Drive experienced 48 total crashes over the 3-year analysis period. Of these 48 crashes, none were fatal and 10 involved at least one injury. Additionally, 1 crash involved a pedestrian.
8. Broad Street and Miller Road
The intersection of Broad Street and Miller Road experienced 42 total crashes over the 3-year analysis period. Of these 42 crashes, none were fatal and 12 involved at least one injury.
9. Broad Street and N St. Pauls Church Road
The intersection of Broad Street and N St. Pauls Church Road experienced 42 total crashes over the 3-year analysis period. Of these 42 crashes, 1 was fatal and 19 involved at least one injury.
10. Broad Street and Mason Road
The intersection of Broad Street and Mason Road experienced 47 total crashes over the 3-year analysis period. Of these 47 crashes, 1 was fatal and 18 involved at least one injury.
11. Wedgefield Road and Pinewood Road/W Liberty
Street
The intersection of Wedgefield Road and Pinewood Road/W Liberty Street experienced 45 total crashes over the 3-year analysis period. Of these 45 crashes, none were fatal and 9 involved at least one injury.
12. Broad Street and Robert Dinkins Road
The intersection of Broad Street and Robert Dinkins Road experienced 41 total crashes over the 3-year analysis period. Of these 41 crashes, 1 was fatal and 18 involved at least one injury.
13. Broad Street and Stamley Livestock Road
The intersection of Broad Street and Stamley Livestock Road experienced 36 total crashes over the 3-year analysis period. Of these 36 crashes, none were fatal and 6 involved at least one injury.
14. Alice Drive & W Liberty Street
The intersection of Alice Drive and W Liberty Street experienced 26 total crashes over the 3-year analysis period. Of these 26 crashes, none were fatal and 4 involved at least one injury. Additionally, 1 crash involved a pedestrian.
15. Broad Street and Eagle Road
The intersection of Broad Street and Eagle Road experienced 17 total crashes over the 3-year analysis period. Of these 17 crashes, none were fatal and 4 involved at least one injury.
16. Camden Highway and Alice Drive
The intersection of Camden Highway and Alice Drive experienced 14 total crashes over the 3-year analysis period. Of these 14 crashes, none were fatal and 3 involved at least one injury.
17. N Guignard Drive and Miller Road
The intersection of N Guignard Drive and Miller Road experienced 17 total crashes over the 3-year analysis period. Of these 17 crashes, none were fatal and 5 involved at least one injury.
Recommended Countermeasures
The countermeasures outlined in this section were developed based on data analysis and field observations. Further analysis of each location should be undertaken before determining which final countermeasure should be implemented. A detailed study of crash reports for each location will likely yield the most beneficial and cost-effective solution.
Priority rankings should be considered while assessing the order of intersection improvements. However, in order to maximize available resources, implementation order should also be guided by public demand and by leveraging funding mechanisms as they come available.
The most important aspect of this analysis is that the established safety problems are addressed. In addition, the priority rankings should be updated periodically to determine the effectiveness of the implemented countermeasures and to determine new locations that may need safety treatments.

4-10 Existing Roadway Element | Final Report | November 2018
2045 Long Range Transportation Plan
This page intentionally left blank.

CHAPTER 5 — FUTURE ROADWAY ELEMENT
2045 Long Range Transportation Plan
5-1 Future Roadway Element | Final Report | November 2018
Introduction The challenges facing the future of the transportation network in Sumter are the collective result of sustained low-density suburban growth, continued reliance on the automobile for even short trips, and competing agendas for scarce transportation funds. State forecasters expect Sumter County’s 2010 population to grow almost 20 percent by 2035. If this growth coupled with the recent observed growth of commuters in single-occupancy vehicles continues, the few projects with committed funding will do little to address deficiencies in the transportation network.
The Future Roadway Element considers these dynamics as it examines the future transportation network under a variety of conditions. A travel demand model was utilized to assess existing and future travel conditions. This TransCAD model tested the operation of the future highway network under various scenarios. Two scenarios for 2045 travel conditions developed using the model included the travel conditions given (1) the construction of existing and committed projects and (2) the construction of all recommended projects.
This chapter begins with an overview of the existing plus committed scenario, which considers the impact committed projects will have on future travel conditions. The recommendation section explores how financially constrained projects can improve future travel conditions. Unfunded recommendations in the form of a Vision Plan (Chapter 9) are proposed to address the remaining deficiencies. The chapter concludes with access management strategies, an overview of complete streets, and a collection of project sheets that describe the proposed recommendations.
Existing + Committed Conditions The initial step in identifying projects for the SUATS Long-Range Transportation Plan is to analyze how the existing transportation network combined with committed projects will perform in 2045 given current growth patterns. The 2017-2022 STIP provides a record of projects within the SUATS boundary that will receive state or federal funding. There are eight capital roadway projects in the 2017-2022 STIP, including:
▪ McCrays Mill Road at Pinewood Road Intersection Safety
Improvements
▪ US 378 at SC 763 Intersection Safety Improvements ▪ US 521 at Camden Highway Intersection Safety Improvements
▪ Manning Avenue Revitalization Plan Project ▪ North Main Street Revitalization Plan Project
▪ St. Paul’s Church Road Corridor Safety Improvements ▪ Tindal Road Corridor Safety Improvements
▪ Cockerill Road Corridor Safety Improvements
These projects are detailed further in Chapter 9.
The Existing + Committed (E+C) conditions shown in Figure 5.1 include these projects in addition to current projects under construction and existing facilities (determined using SCDOT’s regional travel demand model for the SUATS MPO area). Compared to Figure 4.2, which shows the current (2015) congested corridors in Sumter, the E+C projects address but do not solve all of the congestion problems throughout the SUATS region. Congestion slightly improves in some areas while worsening on Alice Drive but worsens on several roads, including Wedgefield Road, St. Pauls Church Road, and McCrays Mill Road.
Penny for Progress
The "Penny for Progress" is a term coined by supporters of the Sumter County Capital Projects Sales Tax referendum of 2008. That term has been adopted in Sumter because it is widely recognized by Sumter County residents in association with the referendum.
The most recent Penny for Progress was approved by Sumter County voters in the general elections of November of 2014 to continue a 1 cent county sales tax from 2008. Passage of that referendum authorized Sumter County Council to levy a temporary sales tax to fund 28 capital projects. The 7-year sales tax was implemented in May of 2016 and includes $75.6 million in projects. More information about the Penny for Progress projects can be found at: http://www.sumtercountysc.org/?q=penny-progress/about-penny-progress.
The 28 projects are being managed by a team of experienced project coordinators, and overseen by the Sumter County Administrator and Sumter County Council. Nine capital roadway projects are part of the overall sales tax effort, as noted in Chapter 9 and below:
Manning Avenue Bridge
Renovation of the Manning Avenue bridge.
Manning Avenue Corridor
Pedestrian, streetscape, intersection, traffic calming, lighting, access, and landscaping improvements to the Manning Avenue Corridor and connections to the Southern Gateway project.
North Main Street Corridor
Pedestrian, streetscape, intersection, traffic calming, lighting, access, and landscaping improvements to the Main Street Corridor and connections to the Lafayette intersection projects.
Wilson Hall Road and Wise Drive Intersection
Improvements
Improvements to the existing right-of-way will be implemented to relieve congestion near the intersection and improve overall traffic flow conditions during peak hours.
Wilson Hall Road at Carter Road and Wesmark
Boulevard
Improvements to existing right-of-way to improve traffic flow during peak traffic hours.
Shot Pouch Greenway
A pedestrian greenway will connect the City and County vertically from Dillon Park on the north to Swan Lake on the South, crossing over several major corridors including the US 76/378 bypass, Broad Street, and Guignard Drive.

5-2 Future Roadway Element | Final Report | November 2018
2045 Long Range Transportation Plan
Downtown Sumter Intersections and Infrastructure
Infrastructure and building improvements in the historic central business district will include as a minimum pedestrian crosswalks, utilities, streets and sidewalks, lighting, landscaping to address safety, quality of life and investment in the central business district for economic development.
County Paving and Resurfacing
Sumter County has identified 18 miles of new paving projects for existing dirt roads and 198 miles of pavement resurfacing projects. Both pavement and resurfacing project goals are to ease public travel and emergency vehicle accessibility and to improve maintenance service on other Sumter County roads.
Community Sidewalks
The project expands the community sidewalk network, providing safe walking connections to neighborhoods, schools, parks, and commercial areas to include:
▪ North Columbia Drive
▪ Crestwood Drive ▪ North Guignard Drive
▪ Highland Avenue ▪ North Lafayette Drive ▪ Lewis Road
▪ Lynam Road ▪ West Oakland Avenue
▪ West Red Bay Road
Security With the adoption of SAFETEA-LU and the subsequent adoption of MAP-21 and the FAST Act, the federal government established security as an independent planning factor for consideration in long range transportation plans. This plan seeks to evaluate transportation security while making recommendations for future improvement.
Emphasizing security during the transportation planning process helps identify and implement ways to improve security and mitigate imminent threats. For the transportation element, this effort is tied closely to the SUATS LRTP. The MPO has the advantage of considering security at a
regional level, which is a logical first step to ensuring protection at the local level. While general strategies can be formulated at the regional level and the MPO can create multimodal recommendations that enhance security, implementation for many strategies will be the responsibility of local organizations. In the SUATS region, key security considerations include evacuation routes for coastal communities, the evacuation of affected areas in proximity to sensitive facilities, protection of freight corridors, the maintenance of bridges, and the safeguard of transit operations. Each of the considerations should continue to be a focus of the SUATS Policy Committee.
Security Measures
In order to ensure security is a continued area of focus for the MPO, the following strategies are recommended:
▪ Maintain continued coordination with key agencies such as the US
Department of Homeland Security, the Federal Emergency Management Agency (FEMA), the National Incident Management System (NIMS), the South Carolina Public Safety Department, the South Carolina Emergency Management Division, and the applicable Regional Emergency Management program.
▪ Continue to discuss how changes to the entry and exit points from Shaw Air Force Base may potentially affect evacuation from the base.
▪ Continue to coordinate closely with Shaw Air Force Base to understand the implications of new missions and troop movements on the security needs of the region.
▪ Consider implementing ITS technologies along potential evacuation routes.
▪ Work with Santee Wateree Regional Transit Authority to enhance
security on buses and at bus stops.
▪ Coordinate with the City of Sumter Police Department and the
Sumter County Sherriff’s Office to identify areas of transportation concern that could benefit from increased patrolling.
Recommendations As we evaluate the transportation network in to the future, it is evident that increasing demands will be placed on the existing road network. With limitations to new construction including natural and man-made barriers it will become even more important to protect the integrity of the existing system. This document provides a list of proposed improvements specific to key corridors throughout the region. The list includes projects that emerged during discussions with area stakeholders, local officials, the Steering Committee, and the general public as well as those previously recommended in the 2013 update that are still relevant.
Recommendations are placed into three categories: Operational/Design Improvements, Existing Road Widening, and New Location Construction. It should be noted that, wherever possible, the recommendations emphasize the protection of existing roadways through the inclusion of plantable medians and better access management design. That is, if a corridor warrants widening or other capacity improvements, a median may be proposed to improve safety, control access, and to enhance the corridor aesthetics.
The following list details recommended capital roadway improvements for specific corridors in the SUATS region. This list represents all of the recommended roadway corridors proposed for improvement. All of these recommendations are part of the region’s financially unconstrained Vision Plan. Chapter 9 identifies the subset of roadway projects included as part of the financially constrained plan.
Four Categories of Security
Security measures typically fall into one of four categories: prevention, protection, redundancy, and recovery.
▪ Prevention mainly limits access to ensure the safety of the transportation system.
▪ Protection — in coordination with prevention elements — focuses on vulnerable components of the transportation system such as bridges and rail corridors.
▪ Redundancy within the transportation network creates identifiable alternative routes in the event of an incident. Redundancy most often refers to an interconnected street network, though similar methods should be extended to the bicycle and pedestrian network, transit system, and rail corridors.
▪ Recovery refers to both the initial response during an emergency and long-term activities that aid in the return of normal operations.

5-3 Future Roadway Element | Final Report | November 2018
2045 Long Range Transportation Plan
Insert Figure 5.1 – Congested Corridors (Existing Plus Committed)

5-4 Future Roadway Element | Final Report | November 2018
2045 Long Range Transportation Plan
Principal and Minor Arterials
Operational/Design Improvements
Operational and design improvements typically occur without altering the existing right-of-way. These projects include retrofitting a median into an existing two way left turn lane or implementing other access management strategies. Although these improvements will slightly increase the capacity of the roadway, the main outcome of the projects will be to enhance access and mobility while increasing traffic safety along the corridor. The following roadways are recommended for operational and design improvements:
▪ Bradford Street & S Purdy Street – S Guignard Drive to Oakland
Avenue
▪ Broad Street (US 76) – Robert Graham Freeway (US 76/378
Bypass) to N Washington Street
▪ Bultman Drive – Broad Street (US 76) to Miller Road
▪ Cains Mill Road – S St. Pauls Church Road to Clipper Road
▪ Cane Savannah Road – S Kings Highway to N St. Pauls Church Road
▪ Clipper Road – Cains Mill Road to US 15
▪ E Brewington Road – US 15 to US 378
▪ Frierson Road – Shaw AFB Frierson Road Gate to US 521
▪ Lafayette Drive – Pocalla Drive to US 76/378
▪ McCrays Mill Road – S Saint Pauls Church Road to S Guignard
Drive
▪ N Pike W – Bordeaux Avenue to N Main Street
▪ N St. Pauls Church Road – Cane Savannah Road to Patriot
Parkway
▪ Old Manning Road – US 15 to Twelve Bridges Road
▪ Pinewood Road –Wedgefield Road to Stadium Road
▪ Pitts Road – Wedgefield Highway to McCrays Mill Road
▪ Pocalla Road – S Guignard Drive to Lafayette Drive
▪ Red Bay Road – US 15 to Coleman Street
▪ S Kings Highway (SC 261) – US 76/378 to Cane Savannah Road
▪ S Pike W – N Bultman Drive to Russel Avenue
▪ Twelve Bridges Road – Old Manning Road to US 521
▪ US 15 N/N Main Street/N Lafayette Drive – Loring Drive to Brewington Road
▪ US 521/Camden Highway – Thomas Sumter Highway to Robert Graham Freeway
▪ US 76/378 Bypass (Robert Graham Freeway) – Loring Mill
Road to US 76 split
▪ W Brewington Road – US 521 to US 15
▪ W Calhoun Street – N Guignard Drive to N Washington Street
▪ W Liberty Street – N Washington Street to Wedgefield Road
▪ Wesmark Boulevard/Carter Road – Broad Street (US 76) to Broad Street Extension
Existing Road Widening
Roads recommended to be widened represent facilities currently operating over capacity or projected to be over capacity. Additional lanes should accommodate the additional traffic volumes projected for 2045. A typical widening project should be constructed in two lane phases, with the use of two-way left turn lanes minimized to only those locations where traffic volumes or adjacent land uses require them. Numerous studies have shown that raised medians are safer than two-way left turn lanes. The following facilities are recommended for widening in the SUATS region:
▪ Alice Drive – Wise Drive to Liberty Street – widen to 4 lane divided
▪ Cains Mill Road – S St. Pauls Church Road to Clipper Road – widen to 4 lane divided
▪ Camden Highway – Queen Chapel Road to US 521 – widen to 4 lane divided
▪ Cane Savannah Road – S Kings Highway to N St. Pauls Church
Road – widen to 4 lane divided
▪ Clipper Road – Cains Mill Road to US 15 – widen to 4 lane divided
▪ E Brewington Road – US 521 to US 378 – widen to 4 lane divided
▪ Lewis Road – McCrays Mill Road to US 15 – widen to 3 lane
▪ Loring Mill Road – US 76/378 to S Wise Drive – widen to 4 lane divided
▪ Mason Road – Weldon Drive to Camden Highway (US 521) –
widen to 4 lane divided
▪ N St. Pauls Church Road – Cane Savannah Road to Patriot
Parkway – widen to 4 lane divided
▪ Old Manning Road – US 15 to Twelve Bridges Road – widen to 4 lane divided
▪ Patriot Parkway – Loring Mill Road to Camden Highway – widen to 4 lane divided
▪ S Kings Highway (SC 261) – US 76/378 to Cane Savannah Road – widen to 4 lane divided
▪ S Wise Drive – Loring Mill Road to Alice Drive (SC 120) – widen
to 4 lane divided
▪ Terry Road –Carter Road to Mason Road – widen to 4 lane
divided; realign with Mason Road
▪ Twelve Bridges Road – Old Manning Road to US 521 – widen to 4 lane divided
▪ US 15 – Nettles Road to Pearson Road – widen to 4 lane divided
▪ W Brewington Road – US 521 to US 15 – widen to 4 lane divided
▪ Wedgefield Road (SC 763) – Deschamps Road to Pinewood Road – widen to 4 lane divided
▪ Wesmark Boulevard/Carter Road – Broad Street (US 76) to
Broad Street extension – widen to 2 lane divided, reserve ROW for four lane divided

5-5 Future Roadway Element | Final Report | November 2018
2045 Long Range Transportation Plan
New Location Construction
In some instances, traffic congestion can be alleviated only by providing alternative routes between over-capacity facilities. These connections typically are constructed as collector streets. However, sometimes it is necessary to provide new connections in the form of a principal or minor arterial. Newly constructed arterials should improve the continuity between higher-level roadways. The following roadways are proposed in the SUATS region:
▪ Alice Drive Extension – US 521 to Wise Drive (This new facility
is proposed to create network continuity and promote economic development)
▪ New Frierson Road – Patriot Parkway to Frierson Road (This
new facility is a Department of Defense led and funded project)
▪ New Frierson Road Unconnected Alternative – Patriot Parkway to Elm Street (This new facility is proposed to allow access to Shaw Heights Elementary School and High Hills Elementary School while maintaining Shaw Air Force Base security)
▪ Red Bay Road – Coleman Street to US 76/378 (This new facility
is proposed to promote freight movements through the region)
Collectors
The projects previously listed represent only the principal and minor arterials recommended in the plan. Collector streets are recommended throughout the region to improve the general connectivity of the road network. The collector street system provides critical connections in the transportation network by bridging the gap between arterials and locals. Collectors gather traffic from neighborhoods and distribute it to the system of major and minor thoroughfares throughout the area. Recommended collector streets connect some of Sumter’s key facilities and growing neighborhoods. These new facilities are envisioned to have two lanes and often have exclusive left turn lanes at intersections with principal and minor arterials and less frequently at intersections with other collectors. As the images on this page show, collectors can include
a variety of features depending on the surrounding land use context. Figure 5.2 in the following section shows all of the proposed principal and minor arterial projects, as well as proposed collector streets.
Cross section examples of new collector streets facilities.

2045 Long Range Transportation Plan
5-6 Future Roadway Element | Final Report | November 2018
Roadway Project Prioritization In order to best understand how to allocate the region’s limited financial resources, it is important to establish priorities for widening, new location, and intersection improvement projects. In order to create a balanced set of priorities, project evaluations need to go beyond traffic impacts to consider cultural, environmental, economic, multimodal, and land use considerations. Recognizing the need to create a balanced prioritization to establish project rankings, the State of South Carolina passed Act 114 in 2007. Act 114 added Sections 57-1-370 and 57-1-460 to the South Carolina Code of Laws. These sections provide details of the ranking process to be used by SCDOT, as well as its affiliated MPOs and councils of government (COGs).
As noted throughout this chapter, there are a variety of access management, widening, new location, and intersection/intercha nge improvements recommended for the SUATS region. Per the direction of SCDOT, this prioritization process was used to determine the rankings of regionally significant projects that could potentially receive funding from SUATS guideshare money. Access management projects are by their nature smaller projects that would not be considered as regionally significant. As a result, these projects are not assessed using the SCDOT ranking criteria. Recommended improvements to the Interstate network would be funded through other mechanisms than regional guideshare money, and as a result are also not included in the regional project rankings.
This page contains a detailed description of the ranking criteria established by SCDOT for the purposes of prioritizing roadway widening projects. Using the standard SCDOT methodology allows SUATS to best understand how the region’s projects will compete for state and federal funding. As a result, no local ranking criteria were proposed or considered for project areas that were rated by SCDOT.
Table 5.1 shows the weighting factors, project information, and rankings for the proposed roadway widening projects while Table 5.2 shows those factors for operational/design improvement projects. All the projects are shown in order of their SCDOT-determined rankings. Tables 5.3 and 5.4 show the SCDOT determined rankings and scoring criteria for new location roadways and intersection improvements, respectively.
The purpose of the process is not to determine the explicit impact of a project, but rather simply to identify resources or communities in proximity to recommendations. A more detailed analysis, including a field survey, will be necessary to determine specific impacts on a project-by-project basis when individual project studies are begun
Statewide MPO/COG Priority Ranking (source: South Carolina Department of Transportation)
In cooperation with the state’s metropolitan planning organizations (MPOs) and council of governments (COGs), SCDOT has developed processes for ranking road widening, new location, and intersection improvements.
SCDOT will maintain a statewide list of ranked widening projects using criteria consistent with Act 114. The statewide list provides a uniform process for evaluating project priorities within each MPO, COG, as well as a statewide basis. MPOs and COGs have the discretion of using the statewide list to establish local priorities or they may use criteria consistent with Act 114, in addition to other criteria that address local desires and/or concerns related to transportation improvements.
The statewide list considers criteria in Act 114 in the following manner:
▪ Financial Viability – considered as a quantifiable criterion based on estimated project cost and estimated 20-year maintenance cost in relation to the current vehicle miles of travel. The criterion is weighted at 10% of the total project score.
▪ Public Safety – considered as a quantifiable criterion based on accident data. The criterion is weighted at 15% of the total project score. ▪ Potential for Economic Development – considered as a quantifiable criterion based on an assessment of short-term, intermediate, and long-
term development potential as a result of the proposed improvement. The criterion is weighted at 10% of the total project score. ▪ Traffic Volume and Congestion – considered as a quantifiable criterion based on current traffic volumes and the associated level-of-service
condition. The criterion is weighted at 35% of the total project score. ▪ Truck Traffic – considered as a quantifiable criterion based on current volume and average daily truck traffic estimates. The criterion is
weighted at 10% of the total project score. ▪ Pavement Quality Index – considered as a quantifiable criterion based on pavement condition assessments. The criterion is weighted at 10% of
the total project score. ▪ Environmental Impact – considered as a quantifiable criterion based on an assessment of potential impacts to natural, social, and cultural
resources. The criterion is weighted at 10% of the total project score. ▪ Alternative Transportation Solutions – considered independently of ranking process. Transit propensity is evaluated based on surrounding
population and employment characteristics to support transit service as a potential alternative or in addition to a proposed improvement. ▪ Consistency with Local Land Use Plans – considered independently of ranking process. A determination of consistency will be made during the
long-range plan development process.

2045 Long Range Transportation Plan
5-7 Future Roadway Element | Final Report | November 2018
Notes: Safety Score is ranked on a scale of 1-5; 1 those with a lower crash rate and 5 being those with a higher crash rate.
Viability Rank is the financial ranking of a project. 10- estimated cost is less than annual guideshare budget ($2.428 million); 5- Estimated cost is more than annual guideshare budget, but les than 5 X annual budget; 1- Estimated cost is more than 5 X annual guideshare budget.
V/C Rank is a project’s rank of volume to capacity. 1- Base of future V/C below 0.4; 3- Base or future V/C above 0.4; 5- Base or future V/C above 0.6; 7- Base or future V/C above 0.8; 10- Base or future V/C above 1.0.
Truck Rank is based on percentiles of truck traffic. 0- No data or data not available; 3- Corridor is in the bottom 25th percentile for truck traffic percentage; 5- Corridor is in the 25th-49th percentile for truck traffic percentage; 7- Corridor is in the 50th-74th percentile for truck traffic percentage; 10- Corridor is in the 75th percentile or higher of truck traffic percentage.
Table 5.1 Project Evaluation Matrix Proposed Roadway Widening Projects
Project ID
Route Route Name Length (Miles)
Project Extents 2045 Project
Cost Estimate Functional
Classification Existing
Lanes Future Lanes
PQI Weighted
Score
Safety Score
Viability Rank
V/C Rank
Truck Rank
Overall Rank
Original Recommendation
Date
K S-1342 Camden Highway 3.28 Queen Chapel Road to US 521 $31,770,000 Urban- Collector 2 4 4.62 3 1 3 3 1 2013
A SC 120 Alice Drive 1.36 Wise Drive to Liberty Street $14,390,000 Urban- Minor Arterial 2 4 4.42 4 1 7 10 2 2013
BB SC 441 Patriot Parkway 7.98 Loring Mill Road to Camden Highway $79,320,000 Urban- Minor Arterial 2 4 4.20 3 1 5 7 3 2013- 2018 Update
HH S-40 N Saint Pauls Church Road 4.73 Cane Savannah Road to Patriot Parkway $45,800,000 Rural- Major Collector 2 4 4.07 3 1 5 10 4 2013- 2018 Update
RR SC 763 Wedgefield Road 2.29 Deschamps Road to Pinewood Road $22,150,000 Urban- Minor Collector 2 4 3.87 3 1 5 5 5 2013
Q SC 261 S Kings Highway 0.33 US 76/378 to Cane Savannah Road $3,250,000 Rural- Minor Collector 2 4 3.85 5 5 5 5 6 2013
MM US 15 US 15 3.71 Nettles Road to Pearson Road $35,890,000 Rural- Minor Collector 2 4 3.82 3 1 7 5 7 2013
V S-204 Loring Mill Road 2.47 US 76/378 to Wise Drive $23,920,000 Urban- Minor Arterial 2 4 3.52 2 1 7 3 8 2013
UU S-380 S Wise Drive 2.88 Loring Mill Road to Alice Drive (SC 120) $23,180,000 Urban- Minor Arterial 2 4 3.20 3 1 5 7 9 2013
Z S-25 Old Manning Road 6.35 US 15 to Twelve Bridges Road $61,480,000 Rural- Major Arterial 2 4 2.92 3 1 3 10 10 2013
TT S-1074/467 Wesmark Boulevard/Carter Road 2.80 Broad Street (US 76) to Broad Street Extension $27,870,000 Urban- Collector 2 4 2.82 2 1 3 10 11 2013
L S-539/370 Cane Savannah Road 4.77 S Kings Highway (SC 261) to N Saint Pauls Church Road $46,140,000 Urban- Collector 2 4 2.77 3 1 3 7 12 2013
W S-673 Mason Road 0.87 Weldon Drive to Camden Highway (US 521) $8,420,000 Urban- Minor Arterial 2 4 2.70 3 5 3 7 13 2013
I S-458 Cains Mill Road 3.58 S Saint Pauls Church Road to Clipper Road $34,650,000 Urban- Collector 2 4 2.57 2 1 1 10 14 2013
T S-25 Lewis Road 3.05 McCrays Mill Road to US 15 $14,250,000 Urban- Collector 2 3 2.52 3 1 3 3 15 2013
C S-81 W Brewington Road 5.44 US 521 to US 15 $52,670,000 Urban- Collector 2 4 2.37 3 1 1 10 16 2013
D S-81 E Brewington Road 10.00 US 15 to US 378 $96,820,000 Urban- Collector 2 4 2.22 3 1 1 10 17 2013
KK S-32 Twelve Bridges Road 2.00 Old Manning Road to US 521 $19,400,000 Rural- Major Collector 2 4 2.18 3 1 1 10 18 2013
JJ Local Terry Road 0.74 Carter Road to Mason Road $7,180,000 Urban- Collector 2 4 1.40 1 5 1 3 19 2013
N S-486 Clipper Road 1.42 Cains Mill Road to US 15 $13,740,000 Rural- Local 2 4 1.20 1 1 1 3 20 2013

5-8 Future Roadway Element | Final Report | November 2018
2045 Long Range Transportation Plan
Note: Refer to notes on page 5-7 for ranking definitions.
*Refers to a route that additionally has a widening recommendation
Table 5.2 Project Evaluation Matrix Proposed Roadway Operational/Design Projects
Project
ID Route Route Name
Length
(Miles) Project Extents
2045 Project
Cost Estimate
Functional
Classification
Existing
Lanes
Future
Lanes
PQI
Weighted Score
Safety
Score
Viability
Rank
V/C
Rank
Truck
Rank
Overall
Rank
Original
Recommendation Date
PP US 76/378 US 76/378/Broad Street 7.98 Loring Mill Road to US 76 Split $4,630,000 Urban- Major Arterial 4 4 5.47 4 5 3 10 1 2013
OO US 521 US 521/Camden Highway 1.75 Thomas Sumter Highway to Robert Graham Freeway $1,020,000 Urban- Collector 4 4 5.42 4 10 3 7 2 2013
S US 15 Lafayette Drive 3.60 Pocalla Road to US 76/378 $2,090,000 Urban- Minor Arterial 4 4 5.32 4 10 3 10 3 2013
EE US 15 Pocalla Road 1.10 S Guignard Drive to Lafayette Drive $640,000 Urban- Minor Arterial 4 4 5.17 4 10 1 10 4 2013
G US 76 Broad Street 3.15 US 76/378 to Washington Street $1,830,000 Urban- Major Arterial 4 4 5.12 2 10 3 10 5 2013
H US 521 Bultman Drive 0.87 Broad Street (US 76) to Miller Road $510,000 Urban- Minor Arterial 4 4 5.12 2 10 3 10 6 2013
GG S-1429 S Pike W 1.24 Bultman Drive to Russel Avenue $720,000 Urban- Minor Arterial 2 2 4.80 3 10 10 7 7 2018
B S-68 Bradford Street & S Purdy Street 0.25 S Guignard Drive to Oakland Avenue $150,000 Minor- Local 2 2 4.72 5 10 10 1 8 2018
Y S-1428 N Pike W 0.17 Bordeaux Avenue to N Main Street $100,000 Urban- Minor Arterial 2 2 4.58 4 10 10 3 9 2018
DD S-507 Pitts Road 1.00 Wedgefield Highway to McCrays Mill Road $580,000 Rural- Collector 2 2 4.42 2 10 10 3 10 2018
II S-40 N Saint Pauls Church Road* 4.73 Cane Savannah Road to Patriot Parkway $2,750,000 Rural- Major Collector 2 4 4.27 3 5 7 10 11 2013- 2018 Update
R SC 261 S Kings Highway* 0.33 US 76/378 to Cane Savannah Road $200,000 Rural- Minor Collector 2 4 4.10 5 10 5 5 12 2013
NN US 15 US 15N/N Main Street/N Lafayette Drive 2.78 Loring Drive to Brewington Road $1,620,000 Urban- Major Arterial 4 4 3.87 5 10 5 10 13 2018
U US 76 W Liberty Street 2.43 N Washington Street to Wedgefield Road $1,410,000 Urban- Major Arterial 4 4 3.87 5 10 5 10 14 2013- 2018 Update
SS S-1074/467 Wesmark Boulevard/Carter Road* 2.80 Broad Street (US 76) to Broad Street Extension $1,630,000 Urban- Collector 2 4 3.27 2 10 3 10 15 2013
X S-33 McCrays Mill Road 5.77 S Saint Pauls Church Road to S Guignard Drive $3,350,000 Rural- Collector 2/4 2/4 3.22 3 5 7 5 16 2013
AA S-25 Old Manning Road* 6.35 US 15 to Twelve Bridges Road $3,690,000 Rural- Major Arterial 2 4 3.12 4 5 3 10 17 2013
CC SC 120 Pinewood Road 1.62 Wedgefield Road to Stadium Road $940,000 Urban- Minor Arterial 4 4 3.05 3 10 3 7 18 2013
J S-458 Cains Mill Road* 3.58 S Saint Pauls Church Road to Clipper Road $2,080,000 Urban- Collector 2 4 3.02 2 10 3 10 19 2013
M S-539/370 Cane Savannah Road* 4.77 S Kings Highway (SC 261) to N Saint Pauls Church Road $2,770,000 Urban- Collector 2 4 2.97 3 5 3 7 20 2013
P S-364 Frierson Road 2.60 Shaw AFB Frierson Road Gate to US 521 $1,510,000 Urban- Collector 2 2 2.87 2 10 5 3 21 2013
LL S-32 Twelve Bridges Road* 2.00 Old Manning Road to US 521 $1,170,000 Rural- Major Collector 2 4 2.63 3 10 1 10 22 2013
E* S-81 W Brewington Road* 5.44 US 521 to US 15 $3,160,000 Urban- Collector 2 4 2.57 3 5 1 10 23 2013
QQ S-102 W Calhoun Street 1.06 N Guignard Drive to N Washington Street $620,000 Urban- Collector 2 2 2.55 3 10 1 7 24 Stantec Plan- 2018
F S-81 E Brewington Road* 10.00 US 15 to US 378 $5,800,000 Rural- Collector 2 4 2.42 3 5 1 10 25 2013
FF S-466 Red Bay Road 1.30 US 15 to Coleman Street $760,000 Urban- Local 2 2 1.95 4 10 1 3 26 2013
O S-486 Clipper Road* 1.42 Cains Mill Road to US 15 $830,000 Rural- Collector 2 4 1.65 1 10 1 3 27 2013

5-9 Future Roadway Element | Final Report | November 2018
2045 Long Range Transportation Plan
Note: Refer to notes on page 5-7 for ranking definitions.
*These projects are discussed in Chapter 4
Table 5.3 Proposed New Location Roadway Projects
Project ID
Route Route Name Length (Miles)
Project Extents 2045 Project
Cost Estimate Functional
Classification
PQI Weighted
Score
Overall Rank
Original Recommendation
Date
B1 S-43-364 New Frierson Road 1.41 Patriot Parkway to Frierson Road $9,730,000 Urban- Collector 2.32 1 2013
D1 S-43-364 New Frierson Road- Unconnected 1.04 Patriot Parkway to Elm Street $5,210,000 Urban- Collector 2.35 2 2018
A1 SC 120 Alice Drive Extension 1.44 US 521 to Wise Drive $16,770,000 Urban- Minor Arterial 1.95 3 2013
C1 S-43-466 Red Bay Road 2.58 Coleman Street to US 76/378 $31,570,000 Urban- Minor Arterial 1.95 4 2013
Table 5.4 Project Evaluation Matrix Proposed Intersection Improvements
Project ID
Intersection Route 1 Cross Street 1 Route 2 Cross Street 2 Leg 1 AADT
Leg 2 AADT
Leg 3 AADT
Leg 4 AADT
Safety Score
Overall Rank
2 Broad Street/N St Paul Church Road US 76/378 N St Pauls Church Road S-40 Broad Street/N St Paul Church Road 24,000 24,000 2,300 - 3 1
20 N Guignard Drive/W Liberty Street US 521 W Liberty Street SC 763 N Guignard Drive/W Liberty Street 18,000 19,100 13,700 10,600 3 2
3 Broad Street/Loring Mill Drive US 76/378 Loring Mill Road S-204 Broad Street/Loring Mill Drive 24,000 24,000 4,000 - 2 3
10 Broad Street/Robert Dinkins Road US 76/378 Robert Dinkins Road S-490 Broad Street/Robert Dinkins Road 27,200 27,200 - - 2 4
5 Broad Street/Stamey Livestock Road US 76/378 Stamey Livestock Road S-91 & L-91 Broad Street/Stamey Livestock Road 26,000 26,000 3,100 - 2 5
22 Wedgefield Road/Pinewood Road/W Liberty Street SC 763 W Liberty Street/Pinewood Road SC 120 Wedgefield Road/Pinewood Road/W Liberty Street 12,700 - 20,000 23,600 2 6
6 Broad Street/Mason Road US 76/378 Mason Road S-673 Broad Street/Mason Road 26,000 26,000 4,900 - 2 7
21 Alice Drive/W Liberty Street SC 120 W Liberty Street SC 763 Alice Drive/W Liberty Street 23,600 13,700 15,400 - 2 8
7 Broad Street/Wilson Hall Road US 76/378 Wilson Hall Road S-467 Broad Street/Wilson Hall Road 26,000 26,000 5,900 - 3 9
13 Broad Street/Wise Drive US 76 Bus./378 Wise Drive S-269 & S-380 Broad Street/Wise Drive 15,500 15,500 5,800 4,800 3 10
19 N Lafayette Drive/E Liberty Street US 15 E Liberty Street US 76 Bus. N Lafayette Drive/E Liberty Street 14,100 15,100 8,300 9,300 3 11
9 Camden Highway/Alice Drive US 521 Alice Drive S-911 Camden Highway/Alice Drive 19,200 19,200 5,700 - 2 12
1 Broad Street/Eagle Road US 76/378 Eagle Road S-370 Broad Street/Eagle Road 18,600 24,000 1,450 - 2 13
17 N Washington Street/W Calhoun Street US 76 Bus./378 W Calhoun Street US 401 & S-401 N Washington Street/W Calhoun Street 12,500 7,400 4,500 7,100 2 14
15 Broad Street/Miller Road US 76/378 Bus. Miller Road S-55 Broad Street/Miller Road 15,500 15,500 10,600 7,000 2 15
25 US 15 S/Lewis Road/Old Manning Road US 15 S Lewis Road/Old Manning Road S-25 US 15 S/Lewis Road/Old Manning Road 11,600 21,700 6,500 6,700 3 16
14 N Guignard Drive/Miller Road US 521 Miller Road S-55 N Guignard Drive/Miller Road 23,100 23,200 8,700 10,600 2 17
26 Wise Drive/N Guignard Drive S-380 N Guignard Drive S-644 Wise Drive/N Guignard Drive 7,500 5,200 6,800 6,800 2 18
27 N Guignard Drive/Gion Street S-644 & S-1268 Gion Street S-276 N Guignard Drive/Gion Street 5,000 6,800 - - 3 19


2045 Long Range Transportation Plan
5-11 Future Roadway Element | Final Report | November 2018
Access Management In an environment of revenue-constrained transportation planning and competing agendas, access management is not just good policy but essential to the integrity of the entire transportation network. Access management balances the needs of motorists using a roadway with the needs of adjacent property owners dependent upon access to the roadway. Access management results from a cooperative effort between state and local agencies and private land owners to systematically control the “location, spacing, design, and operation of driveways, median openings, interchanges, and street connections to a roadway.”1
A corridor with poor access management includes endless driveways and several traffic signals. The result affects all motorists as commute times increase, fuel efficiency lowers and vehicle emissions rise. Poor access management has a direct impact on the livability and economic vitality of commercial corridors, ultimately discouraging potential customers. Signs of a corridor with poor access management include:
▪ More crashes between motorists, pedestrians, and cyclists
▪ Increasingly poor efficiency of the roadway
▪ Congestion outpacing growth in traffic
▪ Spillover cut-through traffic on adjacent residential streets
▪ Limited sustainability of commercial development
As development continues to sprout around heavily traveled corridors, protecting the through capacity will be important for the well-being of the transportation system and economic vitality of the region. Without access management, the function and character of major roadway corridors can deteriorate rapidly and adjacent properties can suffer from declining property values and high turnover. Access management benefits all users as shown in Table 5.2.
1 Access Management Manual, Transportation Research Board, National Academy of Sciences, Washington DC, 2003
Access Management Strategy Toolkit
Access management is not a one-size fits all solution to corridor congestion. Successful strategies differ throughout a region and even along the same road. The toolkit provides a general overview of the various strategies available to mitigate congestion and its effects. A comprehensive access management program includes evaluation methods and supports the efficient and safe use of the corridors for all transportation modes. The purpose of the toolkit is to provide local
engineering and planning officials with access management strategies as well as an overview of their application and use.
Driveway Treatments
Number of Driveways
In many cases, new development occurs adjacent to an existing site or adjacent to another new development. In these cases, driveway permit applicants should be encouraged to seek cross access easements/agreements from an existing adjacent property or coordinate with an adjacent proposed development to create interconnected internal circulation systems and shared-use external driveways. Approximate construction cost varies and is usually the responsibility of private development.
Driveway Placement/Relocation
Driveways located close to intersections create and contribute to operational and safety issues. These issues include intersections and driveway blockages, increased points of conflict, frequent/unexpected stops in the through travel lanes, and driver confusion as to where vehicles are turning. Driveways close to intersections should be relocated or closed, as appropriate. As a best planning practice, no driveway should be allowed within 100 feet of the nearest intersection.
Table 5.2 - Benefits of Corridor Access Management
User Benefit
Motorists ▪ Fewer delays and reduced travel times
▪ Safer traveling conditions
Bicyclists
▪ Safer traveling conditions
▪ More predictable motorist movements
▪ More options in a connected street network
Pedestrians ▪ Fewer access points and median refuges increases safety
▪ More pleasant walking environment
Transit Users ▪ Fewer delays and reduced travel times
▪ Safer, more convenient trips to and from transit stops in a connected street and sidewalk network
Freight ▪ Fewer delays and reduced travel times lower cost of delivering goods and services
Business Owners
▪ More efficient roadway system serves local and regional customers
▪ More pleasant roadway corridor attracts customers
▪ Improved corridor aesthetics
▪ Stable property values
Government Agencies
▪ Lower costs to achieve transportation goals and objectives
▪ Protection of long-term investment in transportation infrastructure
Communities ▪ More attractive, efficient roadways without the need for
constant road widening

5-12 Future Roadway Element | Final Report | November 2018
2045 Long Range Transportation Plan
On-Site Treatments
Improved On-Site Traffic Circulation
On-site traffic circulation can be improved by managing the driveway throat length, defined as the distance from the edge of the public street to the first internal site intersection. An adequate separation should be provided (minimum 100 feet for large shopping centers) to prevent internal site operations from affecting an adjacent public street, ultimately causing spillback problems. Approximate construction cost varies and is usually the responsibility of private development.
Turn Treatments
Left Turn Storage Bays
Where possible, exclusive left-turn lanes/bays should be constructed to provide adequate storage space for turning vehicles, exclusive of through traffic. The provision of these bays reduces vehicle delay related to waiting turning vehicles and may also decrease the frequency of rear-end and other collisions attributable to lane blockages. In some cases turn
bays/lanes can be constructed within an existing median, in other cases, additional right-of-way is required and construction may be more costly.
Offset Left Turn Treatment
Exclusive left turn lanes at intersections are generally configured in such a way as to cause opposing left turning vehicles to block one another’s forward visibility. An offset left turn treatment involves shifting the left turn lanes to the left, adjacent to the innermost lane of oncoming through traffic. In cases where permissive left turn phasing is used, this treatment can improve efficiency by reducing crossing and exposure time and
distance for left-turning vehicles. In addition, the positive off-set improves sight distance and may improve gap recognition. Where there is sufficient median width, this treatment can be easily retrofitted. Where there is not sufficient right-of-way width, the construction of this treatment can be difficult and costly. Approximate construction cost varies.
Median Treatments
Non-Traversable Median
These features are raised or depressed cross section elements that physically separate opposing traffic flows. Inclusion in a new cross section or retrofit of an existing cross section should be considered for some multi-lane arterials (general) and for multi-lane roadways with high pedestrian volumes, high collision rates, or in locations where aesthetics are a priority. As these treatments are considered, sufficient spacing and locations for U- and left-turn bays must be identified. Approximate construction cost varies.
▪ Advantages—increased safety and capacity by separating opposing vehicle flows, providing space for pedestrians to find refuge, and restricting turning movements to locations with appropriate turn lanes.
▪ Disadvantages—increased emergency vehicle response time (indirect
routes to some destinations), inconvenience, increased travel
distance for some movements, and potential opposition from the general public and affected property owners.
Median U-Turn Treatment
These treatments involve prohibiting or preventing minor street left turns at signalized intersections. Instead, these turns are made by first making a right-turn and then making a U-turn at a nearby median opening. These treatments can increase safety and efficiency of roadway corridors with high volumes of through traffic, but should not be used where there is not sufficient space available for the provision of U-turn movements. The location of U-turn bays must consider weaving distance, but also not contribute to excessive travel distance. Approximate construction cost is $50,000 - $60,000 per median opening.
▪ Advantages—reduced delay for major intersection movements, potential for better two-way traffic progression (major and minor street), fewer stops for through traffic, and fewer points of conflict (for pedestrians and vehicles) at intersections.
▪ Disadvantages—increased delay for some turning movements, increased travel distance, increased travel time for minor street left turns, and driver confusion.
Befo
re
Aft
er
Driveway Throat

5-13 Future Roadway Element | Final Report | November 2018
2045 Long Range Transportation Plan
Directional Crossover (Left-Over Crossing)
When a median exists on a corridor, special attention must be given to locations where left turns are necessary. A left-over is a type of directional crossover that prohibits drivers on the cross road (side street) from proceeding straight through the intersection with the main road. To accomplish this movement, a right turn followed by a U-turn is required. Such designs are appropriate in areas with high traffic volumes on the major road and lower volumes of through traffic on the cross road. The treatment is especially helpful in locations where traffic needs to make left turns from the main line onto the minor street. A properly implemented left-over crossing reduces delay for through-traffic and diverts some left-turn maneuvers from intersections. By reducing the number of conflict points for vehicles along the corridor, these treatments improve safety.
Intelligent Transportation System
Closed Circuit Television Traffic Monitoring
Closed Circuit Television (CCTV) cameras are primarily used on interstate facilities and major arterials to provide visual traffic volume and flow information to traffic management or monitoring centers. These centers use this information to deploy incident response patrols/equipment and to provide roadway travel delay information to motorists. By having visual roadway information, traffic
management centers are able to identify incidents quickly and respond appropriately and efficiently, helping to reduce the effect of incidents on a single location or on multiple roadways. Approximate construction cost is $20,000 per location.
Adaptive Signal Control
This technology involves continuously collecting automated intersection traffic volumes and using the volumes to alter signal timing and phasing to best accommodate actual—real time—traffic volumes. Adaptive signal control can increase isolated intersection capacity as well as improve overall corridor mobility by up to twenty percent during off-peak periods and ten percent during peak periods. Approximate construction cost is $250,000 per system and $10,000 per intersection in addition to 25% of capital costs in training, etc.
Emergency Vehicle Preemption
This strategy involves an oncoming emergency or other suitably equipped vehicle changing the indication to green of a traffic signal to favor the direction of desired travel. Preemption improves emergency vehicle response time, reduces vehicular lane and roadway blockages, and improves the safety of the responders by stopping conflicting movements. Approximate construction cost is $5,000-$7,000 per intersection plus $2,000 per equipped vehicle.
Signalization
Sometimes the volume of traffic attracted to some side streets or site driveways is more than can be accommodated acceptably under an unsignalized condition. Delays for minor street movements as well as left-turn movements on the main street may create or contribute to undue delays on the major roadway and numerous safety issues. The installation of a traffic signal at appropriate locations can mitigate these types of issues without adversely affecting the operation of the major roadway. Approximate construction cost is $100,000 to $150,000 per signal for wood or metal poles and wires. If constructed with mast arm poles, the cost would range from $150,000 to $200,000.
Intersection and Minor Street Treatments
Skip Marks (Dotted Line Markings)
These pavement markings can reduce driver confusion and increase safety by guiding drivers through complex intersections. Intersections that benefit from these lane markings include offset, skewed or multi-legged intersections. Skip marks are also useful at intersections with multiple turn lanes. The dotted line markings extend through the intersection the line markings of approaching roadways. The markings should be designed not to confuse drivers in adjacent or opposing lanes.
Intersection and Driveway Curb Radii
Locations with inadequate curb radii have the potential to necessitate that turning vehicles use opposing travel lanes to complete their turning movement. Inadequate curb radii may cause vehicles to “mount the curb” as they turn a corner and cause damage to the curb and gutter, sidewalk, and any fixed objects located on the corner. This also may endanger pedestrians standing on the corner. Curb radii should be adequately sized for area context and likely vehicular usage.
Minor Street Approach Improvements
At signalized intersections, minor street vehicular volumes and associated delays may require that a disproportionate amount of green time be allocated to the minor street, contributing to higher than desired main street delay. Often, with laneage improvements to the minor street approaches, such as an additional left-turn lane or right-turn lane, signal timing can be re-allocated and optimized.

5-14 Future Roadway Element | Final Report | November 2018
2045 Long Range Transportation Plan
One-Way Frontage Roads
Many older major roadway corridors have two-way service roads along both sides of the street. Converting these service roads to one-way with slip ramps has the potential to improve their safety and efficiency—decreasing the number of intersection conflict points from 96 (two-
way) to 36 (one-way) at minor road intersections and also reducing confusion at intersections. Approximate construction cost is $1,000,000 per mile.
Types of Corridors and Potential Solutions
Some access management strategies are better suited to one corridor type than another. Table 5.3 lists four popular cross sections with local examples and the potential access management strategies.
SUATS Access Management Corridor
Strategies
Sumter can proactively combat worsening congestion and deteriorating corridors by implementing appropriate access management strategies. In the 2035 LRTP the following five strategic corridors were identified for detailed analysis and recommendations:
▪ Liberty Street (Alice Drive to Main Street)
▪ Broad Street (Market Street to Wise Drive)
▪ Bultman Drive (Broad Street to Kilgo Street)
▪ McCrays Mill Road (Stadium Road to Lewis Road)
▪ Pinewood Road (Stadium Road to Oakland Avenue)
The corridors, as well as a summary discussion of their recommendations, are included in the following section.
Table 5.3 – Types of Corridors and Potential Solutions
Cross Section Access Management Strategy
Five Lanes (Predominantly Retail Land Uses)
▪ Adaptive signal control
▪ Median U-turn treatment
▪ Non-traversable median treatment
▪ Offset left turn treatment
▪ Intersection and driveway curb radii
▪ Left-turn storage bays
▪ Minor street approach improvements (left-turn lane and right-turn lane)
▪ Emergency vehicle preemption
▪ Driveway throat length
▪ Consolidate driveways/cross access
▪ Driveway placement/relocation
Local Example
▪ Broad Street
▪ Bultman Drive
▪ Lafayette Drive
▪ McCrays Mill Road
Four-Lane Divided with Landscaped Median
▪ Adaptive signal control
▪ Median U-turn treatment
▪ Offset left turn treatment
▪ Intersection and driveway curb radii
▪ Minor street approach improvements (left-turn lane and right-turn lane)
▪ Emergency vehicle preemption
▪ Driveway throat length
▪ Consolidate driveways/cross access
▪ Driveway placement/relocation
▪ Signalization (driveways)
▪ Left-turn storage bays
Local Example
▪ Broad Street west of Robert Graham Freeway (US 76/378 Bypass)
Four-Lane Undivided
▪ Adaptive signal control
▪ Offset left turn treatment
▪ Intersection and driveway curb radii
▪ Minor street approach improvements (left-turn lane and right-turn lane)
▪ Emergency vehicle preemption
▪ Driveway throat length
▪ Consolidate driveways/cross access
▪ Driveway placement/relocation
▪ Signalization (driveways)
▪ Left-turn storage bays
Local Example
▪ Liberty Street
Four-Lane with Service Roads and Partially Controlled Access
▪ Adaptive signal control
▪ CCTV traffic monitoring
▪ Non-traversable median treatment
▪ One way frontage road system with skip ramps
▪ Emergency vehicle preemption Local Example
▪ Robert E. Graham Freeway (US 76/378 Bypass)

5-15 Future Roadway Element | Final Report | November 2018
2045 Long Range Transportation Plan
Liberty Street Corridor (Alice Drive to Main Street)
As a part of the 2035 LRTP, a detailed analysis and recommendations
were developed for the Liberty Street Corridor. These recommendations have been reviewed as part of the 2045 LRTP planning process and remain valid. The recommendations are listed below.
Specific Recommendations
Recommendation #1 – The approximately ¼-mile section between Alice Drive and Swan Lake is mostly a 5-lane section with a two-way left turn lane. The City should work with local land owners to encourage improvements to on-site circulation and consolidate driveways. A median
treatment that restricts access to
right-in/right-out will reduce safety concerns and improve the capacity and aesthetics of the roadway. In particular, the intersection of Liberty Street and Alice Drive suffers from high traffic volumes and a confusing design. Two of the three legs of the
intersection operate at level of service F.
This intersection should be improved by considering following:
▪ Add skip marks for all motorists turning left
▪ Move driveway access away from intersection to avoid vehicle
conflict
▪ Install channelized right-in/right-out island
▪ Install a gateway sign to welcome visitors to the community
Recommendation #2 – From Swan Lake to Guignard Drive, Liberty Street remains a 5-lane section with a two-way left turn lane. As the road approaches Guignard Street, adjacent land uses become mostly commercial. The following two measures are recommended:
▪ Construct a non-traversable landscaped median in lieu of the two-way left-turn lane to control access and increase safety
▪ Move driveway access away from the intersection with Artillery Drive to improve traffic flow and reduce congestion
Recommendation #3 – Between Guignard and Main Streets the cross section changes to four lanes with multiple side roads and driveways servicing adjacent commercial property. To improve the function and safety of this segment, the following recommendations should be considered:
▪ Coordinate traffic signals to reduce driver delay and frustration in
the area
▪ Increase signage in advance of intersections to reduce driver
confusion and improve safety
▪ Consolidate driveways to combine turning movements, increase
safety, limit driver confusion, and ease congestion
▪ Improve on-site traffic circulation to prevent spillback issues and safety problems on Liberty Street
Several recommendations can improve the intersections along this section of Liberty Street. These recommendations include:
▪ Replace curb and gutter and provide protected left turns for all approaches at Guignard Street
▪ Provide protected left turns for motorists turning left onto Liberty Street from Purdy Street
▪ Move driveway access away from intersection with Washington Street
▪ Install channelized right-in/right-out islands to control access and improve traffic flow
Broad Street Corridor (Market Street to Wise Drive)
As a part of the 2035 LRTP, a detailed analysis and recommendations were developed for the Broad Street Corridor. These recommendations have been reviewed as part of the 2045 LRTP planning process and remain valid. The recommendations are listed below.
Specific Recommendations
Recommendation #1 – The intersection of Broad and Market Streets is a T-intersection with dual left turn lanes from Market onto southbound Broad Street. For the three-year period ending in 2005, 12 crashes occurred here. The following suggestions should improve the safety of the intersection:
▪ Add skip marks for motorists turning left off Market Street
▪ Replace curb and gutter to better define the roadway
Liberty Street and Alice Drive
Liberty Street at Swan Lake
Broad Street and Gion Street

5-16 Future Roadway Element | Final Report | November 2018
2045 Long Range Transportation Plan
Recommendation #2 – The following recommendations are intended to improve the safety and function of the corridor between Wesmark Boulevard and Bultman Drive, including the intersection of Broad and Gion Streets at which 29 crashes occurred:
▪ Move or close driveway access near Wesmark Boulevard intersection
▪ Construct a non-traversable landscaped median with u-turn and right-in/right-out access as a means to improve traffic flow and reduce crashes at the intersections with Gion Street and Sumter Mall
▪ Restrict access to right-in/right-out at site driveways by installing
channelized islands
▪ Consolidate driveways in front of Sumter Mall to ease congestion
and improve safety
Recommendation #3 – The Broad Street intersections with Bultman Drive and Wise Drive can be improved with the following recommendations:
▪ Upgrade signalization to provide protected left turn for all
approaches at the Broad Street and Bultman Drive intersection
▪ Add skip marks for left tuning movements on all approaches to the intersection with Bultman Drive
▪ Move driveway access away from both intersections
▪ Replace curb and gutter at the intersection with Wise Drive
Bultman Drive Corridor (Broad Street to Kilgo Street)
As a part of the 2035 LRTP, a detailed analysis and recommendations were developed for the Bultman Drive Corridor. These recommendations have been reviewed as part of the 2045 LRTP planning process and remain valid. The recommendations are listed below .
Specific Recommendations
Recommendation #1 – The following recommendations for the intersection of Bultman Drive and Broad Street repeat those found in the Broad Street Corridor recommendations:
▪ Upgrade signalization to provide protected left turn for all approaches at the Broad Street and Bultman Drive intersection
▪ Add skip marks for left tuning movements on all approaches to the intersection with Bultman Drive
▪ Consolidate and move driveways within 75 feet of intersection
Recommendation #2 – More than 20,000 vehicles per day pass through the intersection of Bultman Drive and Wise Drive. High volumes of left turns and multiple driveways affect the functionality and safety of the intersection. The following recommendations are intended to improve these conditions:
▪ Upgrade signalization to provide protected left turn for all
approaches
▪ Consolidate and move driveways within 75 feet of intersection
McCrays Mill Road Corridor (Stadium Road to Lewis
Road)
As a part of the former 2035 LRTP, a detailed analysis and recommendations were developed for the McCrays Mill Road Corridor. These recommendations have been reviewed as part of the 2045 LRTP planning process and remain valid. The recommendations are listed below.
Specific Recommendations
Recommendation #1 – On an average day, 32,200 vehicles enter the intersection of McCrays Mill and Pinewood Roads. Between 2003 and 2005, nine crashes resulting in three injuries occurred at the intersection. The number of crashes and poor function of the roadway could be improved by implementing the following recommendations:
▪ Consolidate and better define driveways with curb and gutter to combine turning movements, increase safety, limit driver confusion, and ease congestion
▪ Move or consolidate driveway access away from intersections
▪ Improve on-site traffic circulation
Recommendation #2 – East of Pinewood Road, a two-way left turn lane divides the two travel lanes. The turn lane should be replaced with a landscaped median with u-turn and right-in/right-out access to control access and increase safety.
Broad Street and Bultman Drive McCrays Mill Road and Pinewood Road

5-17 Future Roadway Element | Final Report | November 2018
2045 Long Range Transportation Plan
Pinewood Road Corridor (Stadium Road to Oakland
Avenue)
As a part of the 2035 LRTP, a detailed analysis and recommendations were developed for the Pinewood Road Corridor. These recommendations have been reviewed as part of the 2045 LRTP planning process and remain valid. The recommendations are listed below .
Specific Recommendations
Recommendation #1 – Development along the Pinewood Road Corridor has focused at the McCrays Mill Road intersection. The following recommendations for this intersection repeat those found in the McCrays Mill Road Corridor recommendations:
▪ Consolidate and better define driveways with curb and gutter to combine turning movements, increase safety, limit driver confusion, and ease congestion
▪ Move or consolidate driveway access away from intersections
▪ Improve on-site traffic circulation
Recommendation #2 – North of the McCrays Mill Road intersection, several driveways serve the strip mall and outparcels west of Pinewood Road. To improve the traffic entering and existing this shopping area and to prevent internal site operations from affecting Pinewood Road, driveways should be consolidated and on-site traffic circulation improved.
Complete Streets A Complete Street is a community-oriented street that safely and conveniently accommodates all modes of travel. Such a street allows pedestrians, bicyclists, motorists, and transit users to use the street safely and conveniently regardless of their age or ability to move. The citizens, business owners, and local officials in the SUATS region recognize the importance of a shift away from an automobile-dominated roadway and toward a balanced, multi-modal transportation system that respects all users of the roadway and the rights of adjacent land owners. The concepts presented in this section extend to all the elements that follow, including the Bicycle and Pedestrian Element, Transit, and Freight Elements. Complete streets as described below are divided into four basic zones or realms – context realm, pedestrian realm, travelway realm, and intersection realm. Together these street designs ensure the needs of all users are accommodated.
Context Realm
The context realm is defined by buildings that frame the major roadway. Guidance for the context realm focuses on four areas of consideration.
Building Form and Massing
High-quality street design should be supplemented with buildings located close to the street that frame the public space enjoyed by pedestrians. In more urban areas, these buildings should be located directly behind the sidewalk, and with stairs, stoops, or awnings, may even encroach into the pedestrian realm to provide visual interest and access to the public space. Suburban environments that must incorporate setbacks for adjacent buildings should limit this distance to 20 feet or less and avoid off-street parking between buildings and the pedestrian realm. Larger setbacks in these suburban areas will diminish the sense of enclosure afforded to the pedestrian and move access to the buildings farther away from the street. In both environments, building heights should measure at least 25% of the corridor width. That is, a 100-foot wide roadway right-of-way should be framed by buildings that are at least 25 feet high on both sides with facades that are at most 20 feet from the edge of right-of-way.
Architectural Elements
Careful placement and design of buildings adjacent to the major roadway offer opportunities for meaningful interaction between transportation and land use. These opportunities are greatly enhanced when land uses such as restaurants, small shops and boutiques, residential units and offices are located adjacent to the street. Building scale and design details incorporated into individual buildings foster a comfortable, engaging environment focused on the pedestrian. Common building design treatments generally favored in a pedestrian environment include awnings, porches, balconies, stairs, stoops, windows, appropriate lighting, promenades, and opaque windows.
Pinewood Road south to McCrays Mill Road Pinewood Road north of McCrays Mill Road

5-18 Future Roadway Element | Final Report | November 2018
2045 Long Range Transportation Plan
Transit Integration
Areas targeted for high-quality transit service must be supported through land use and zoning policies that sustain transit-oriented development and reflect the benefits of increased access to alternative modes of travel. Policy examples include appropriate densities and intensities for supporting transit use, parking ratios that reflect reduced reliance on the automobile, and setback and design guidelines that result in pedestrian supportive urban design. In addition, potential transit service identified for transportation corridors within the community should take into consideration the land use, density/intensity, and urban design characteristics of the surrounding environment before selecting proposed technologies or finalizing service plans.
Site Design
The complete street is truly integrated into the surrounding environment when the interface between the site and the street is complementary to the pedestrian environment created along the entire corridor. Access to the site should be controlled through a comprehensive access management program to minimize excessive driveways that create undesirable conflicts for traveling pedestrians. Building orientation, further defined by landscape and architectural elements incorporated into the site should reinforce the public space protected between the buildings. Public paths through sites should be provided to shorten blocks longer than 600 feet.
Pedestrian Realm
The pedestrian realm extends between the outside edge of sidewalk and the face-of-curb located along the street. Safety and mobility for pedestrians within this ‘public’ realm is predicated upon the presence of continuous sidewalks along both sides of the street built to a sufficient width for accommodating different space needs within different environments; such as suburban verses downtown settings. The quality of the pedestrian realm is also greatly enhanced by the presence of high-quality buffers between pedestrians and moving traffic, safe and
convenient opportunities to cross the street, and consideration for shade and lighting needs. Each is discussed below.
The pedestrian realm may consist of up to four distinct functional zones – frontage zone, throughway zone, furnishing zone, and edge zone. The frontage zone is located near the back of sidewalk and varies in width to accommodate potential window shoppers, stairs, stoops, planters, marquees, outdoor displays, awnings or café tables. The throughway zone provides clear space for pedestrians to move between destinations and varies in width from 5 to more than 10 feet based on the anticipated demand for unimpeded walking area. The furnishing zone provides an important buffer between pedestrians and moving traffic. It generally measures at least 8 feet wide to accommodate street trees, planting strips, street furniture, utility poles, sign poles, signal and electrical cabinets, phone booths, fire hydrants, bicycle racks or retail kiosks targeted for the pedestrian realm. The edge zone is incorporated into the pedestrian realm concurrent with the presence of on-street parking to allow sufficient room for opening car doors.
Incorporation of one or more of these function zones is generally based upon the context of the surrounding built environment. For example, a more urban, downtown environment will include all four zones in the pedestrian realm and could measure up to 24 feet wide. An equally important link to the pedestrian network that is located in a more suburban setting may omit one or more of the function zones listed above; with an overall minimum width of 10 feet.
Recommended design elements for promoting a healthy pedestrian realm generally focus on one of four areas of concentration: pedestrian mobility, quality buffers, vertical elements, and public open space. Together, these best practices can be implemented in both urban and suburban environments, to varying degrees, for promoting healthy pedestrian environments.
Pedestrian Mobility
The presence of a comprehensive, continuous pedestrian network serves as the foundation for fostering a walkable community that supports active transportation and mode choice. Sidewalks generally provide clear zones of 5 to 10 feet wide to accommodate pedestrian travel. In more urban environments, amenities in the frontage zone and furniture zone will greatly increase the overall width of the corridor as compared to more suburban settings. Mid-block pedestrian crosswalks should be incorporated into the urban fabric as needed to ensure convenient and safe crossing opportunities are provided approximately every 300 feet. As a general rule, mid-block crossings should be considered on two-lane streets with a block length greater than 500 feet when the posted speed limit for the travel lanes does not exceed 40 miles per hour.
Quality Buffers
Lateral separation between pedestrians and moving traffic greatly enhances the character of the pedestrian realm. The amount of separation incorporated into the pedestrian realm may vary between corridors based on the context of the surrounding built environment or on streets with different travel speed and/or traffic volume characteristics. In downtown areas, on-street parking, either parallel or angled, provides sufficient distance (8 to 18 feet) for separating pedestrian and vehicle traffic. Likewise, landscape planting areas at least 5 feet wide incorporated into either urban or suburban environments provide adequate lateral separation for pedestrians. In urban areas, street trees may be placed in tree wells within an overall hardscaping surface instead of using suburban-style grass areas.

5-19 Future Roadway Element | Final Report | November 2018
2045 Long Range Transportation Plan
Vertical Elements
Vertical elements traditionally incorporated into the pedestrian realm include street trees, pedestrian-scale street lighting, and utilities. Street trees provide necessary shade to pedestrians and soften the character of the surrounding built environment. They should be spaced between 15 and 30 feet apart, be adapted to the local environment, and fit the scale and character of the surrounding area. Pedestrian-scale street lighting incorporated into the pedestrian realm should use metal halide fixtures mounted between 12 and 20 feet high. Utilities should not interfere with pedestrian circulation or block entrances to buildings, curb cuts, or interfere with sight distance triangles. In some cases, burying utilities avoids conflict and clutter caused by utility poles and overhead wires. Relocation of overhead utilities to tall poles on just one side of the
roadway is a cost-effective aesthetic alternative to burial of utilities in a duct bank under the road.
Public Open
Space
The pedestrian realm serves a dual purpose within the built environment –
acting as both a transportation corridor and a public open space accessible to the entire community. Therefore, specific design elements incorporated into the pedestrian environment should reinforce this area as a public space; including opportunities for visitors to enjoy the unique
character of the corridor in both formal and informal seating areas. Public art and/or specialized surfaces and materials introduced into the pedestrian realm are appreciated by slower moving pedestrians. In more urban areas, street furniture and/or outdoor cafes provide opportunities for ‘people
watching’ that foster community ownership in the pedestrian realm. Furthermore, building encroachments in downtown areas, such as stairs and stoops, provide for interesting points of access to the pedestrian realm. Lastly, awnings and canopy trees provide shade which is helpful in the temperate climate of this region.
Travelway Realm
The travelway realm is defined by the edge of pavement, or curb line in more urban areas, that traditionally accommodates the travel or parking lanes needed to provide mobility for bicycles, transit vehicles, and automobiles sharing the transportation corridor. This area also separates the two pedestrian realms defined within the complete street and may provide carefully-designed crossing opportunities between intersections. Recommended design elements incorporated into the travelway realm serve to achieve greater balance between travel modes sharing the corridor and favor design solutions that promote human scale for the street and minimize pedestrian crossing distance. Guidance for the travelway realm focuses on two areas of consideration – modes of travel and medians.
Multimodal Corridors
Balance between travel modes within a transportation corridor provides choice for mobility that could lead to reduced congestion on major roadways and a healthier citizenry. On a complete street, safe and convenient access to the transportation network for bicycles, transit vehicles, and automobiles is afforded within the travelway realm. Travel lanes for automobiles and transit vehicles should measure between 11 and 13 feet wide to manage travel speeds and reinforce the intended character of the street. Parking lanes incorporated into the travelway realm should not exceed 8 feet in width (including the gutter pan) and may be protected by bulb-outs evenly spaced throughout the corridor. Bus stops located along the corridor should be well-designed to include shelters and benches that comfort patrons while waiting for transit service. On-street bicycle lanes (typically 4 to 6 feet wide) should be considered when vehicle speeds range from 30 to 40 miles per hour. Wide outside lanes may be preferred on streets with slower speeds. To avoid situations where citizens with only basic skills may be attracted to a corridor, designated bicycle routes on parallel corridors may be the best option when speeds on the major street exceed 40 mph. According to state law, bicyclists are considered vehicles and are permitted on all corridors except freeways and access-controlled highways.
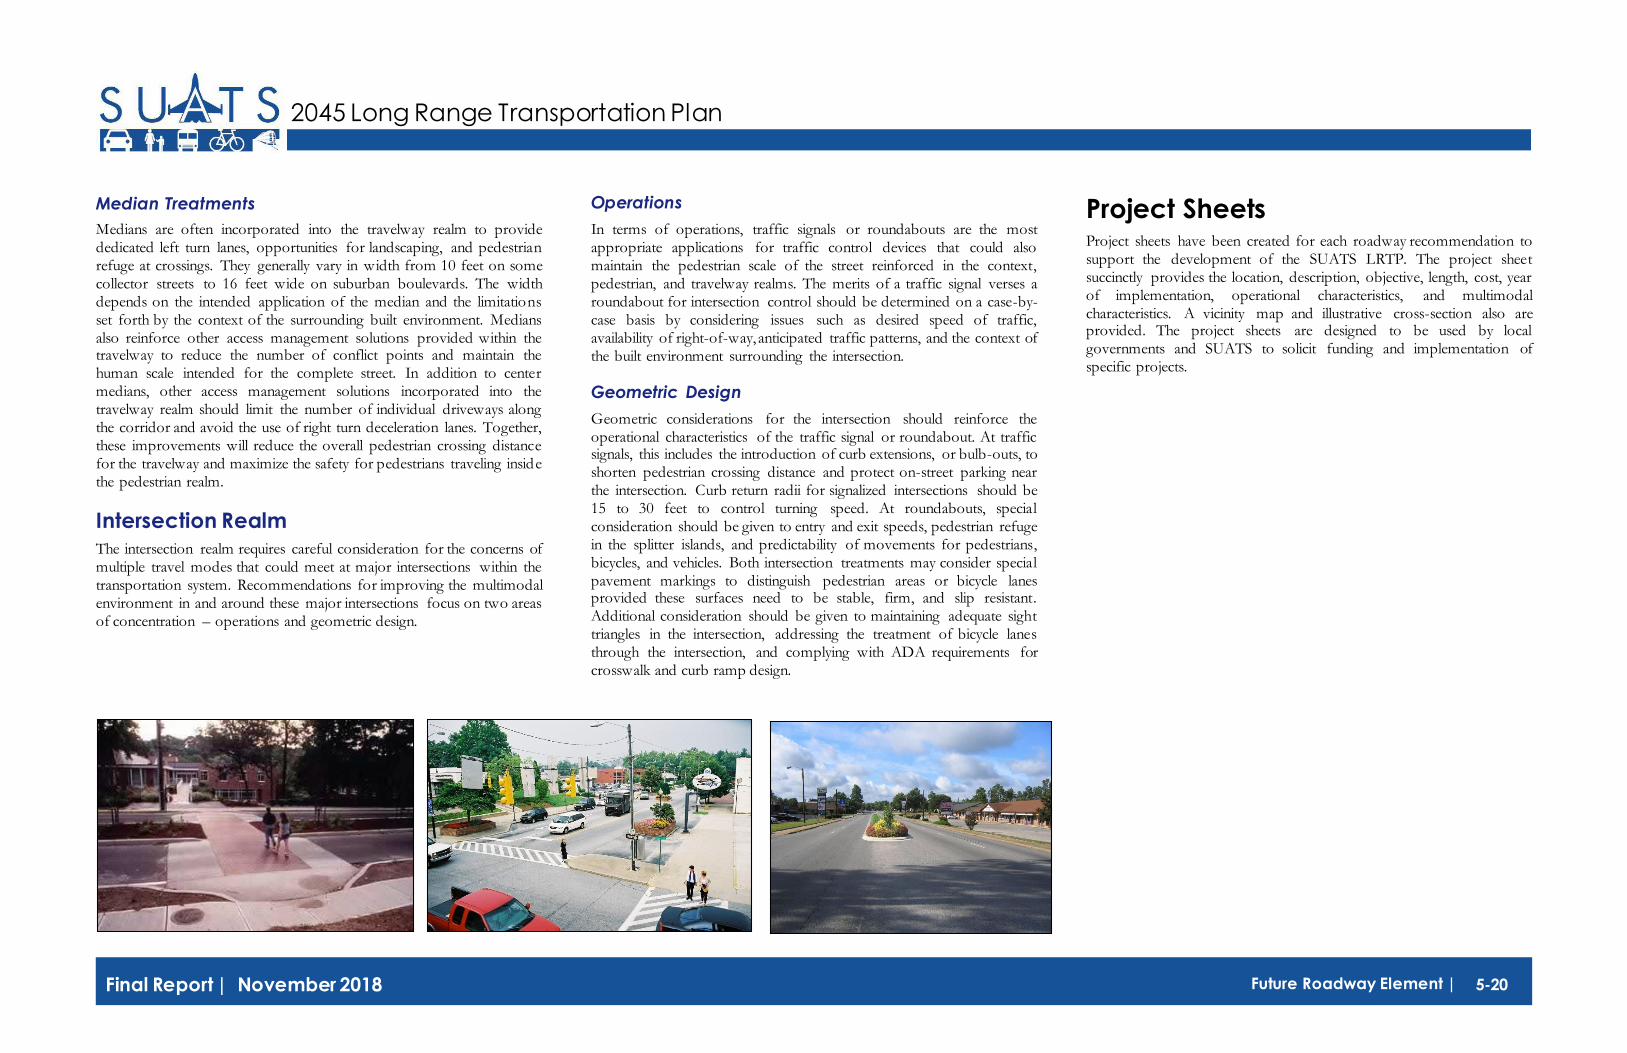
5-20 Future Roadway Element | Final Report | November 2018
2045 Long Range Transportation Plan
Median Treatments
Medians are often incorporated into the travelway realm to provide dedicated left turn lanes, opportunities for landscaping, and pedestrian refuge at crossings. They generally vary in width from 10 feet on some collector streets to 16 feet wide on suburban boulevards. The width depends on the intended application of the median and the limitations set forth by the context of the surrounding built environment. Medians also reinforce other access management solutions provided within the travelway to reduce the number of conflict points and maintain the human scale intended for the complete street. In addition to center medians, other access management solutions incorporated into the travelway realm should limit the number of individual driveways along the corridor and avoid the use of right turn deceleration lanes. Together, these improvements will reduce the overall pedestrian crossing distance for the travelway and maximize the safety for pedestrians traveling inside the pedestrian realm.
Intersection Realm
The intersection realm requires careful consideration for the concerns of multiple travel modes that could meet at major intersections within the transportation system. Recommendations for improving the multimodal environment in and around these major intersections focus on two areas of concentration – operations and geometric design.
Operations
In terms of operations, traffic signals or roundabouts are the most appropriate applications for traffic control devices that could also maintain the pedestrian scale of the street reinforced in the context, pedestrian, and travelway realms. The merits of a traffic signal verses a roundabout for intersection control should be determined on a case-by-case basis by considering issues such as desired speed of traffic, availability of right-of-way, anticipated traffic patterns, and the context of the built environment surrounding the intersection.
Geometric Design
Geometric considerations for the intersection should reinforce the operational characteristics of the traffic signal or roundabout. At traffic signals, this includes the introduction of curb extensions, or bulb-outs, to shorten pedestrian crossing distance and protect on-street parking near the intersection. Curb return radii for signalized intersections should be 15 to 30 feet to control turning speed. At roundabouts, special consideration should be given to entry and exit speeds, pedestrian refuge in the splitter islands, and predictability of movements for pedestrians, bicycles, and vehicles. Both intersection treatments may consider special pavement markings to distinguish pedestrian areas or bicycle lanes provided these surfaces need to be stable, firm, and slip resistant. Additional consideration should be given to maintaining adequate sight triangles in the intersection, addressing the treatment of bicycle lanes through the intersection, and complying with ADA requirements for crosswalk and curb ramp design.
Project Sheets Project sheets have been created for each roadway recommendation to support the development of the SUATS LRTP. The project sheet succinctly provides the location, description, objective, length, cost, year of implementation, operational characteristics, and multimodal characteristics. A vicinity map and illustrative cross-section also are provided. The project sheets are designed to be used by local governments and SUATS to solicit funding and implementation of specific projects.

5-21 Future Roadway Element | Final Report | November 2018
2045 Long Range Transportation Plan
Project A – Alice Drive Widening Alice Drive (Project A) is proposed to be widened between Wise Drive and Liberty Street. Currently, parts of this road are approaching or at capacity, with segments becoming over capacity in the future. Widening this corridor would alleviate congestion and provide a more reliable north-south route through the city. Improvements on this corridor would tie in with the Alice Drive/W Liberty Street proposed intersection improvement. Improvements to this section of Alice Drive would serve as a complement to those currently underway on the northern section of this corridor, giving the corridor a uniform cross-section and operating characteristics. This recommendation was previously included in the SUATS 2040 LRTP.
Project at a Glance
Project ID A
Project Type Widening
Project Ranking 2
Primary Purpose Congestion Relief
Length 1.36 miles
Probable Construction Cost (in Build-Out Year)
$14,390,000
LRTP Horizon Year 2030
Safety Score 4
Operational Characteristics
Existing Future
Facility Type Minor Arterial Minor Arterial
Travel Lanes 2 4
Volume 11,594 12,170
Capacity 12,667 12,400
Multimodal Characteristics
Existing Improvement
Bike/Ped
Corridor
Sidewalk on East
Side
Wide Outside Lanes /
Sidewalk on West Side
Transit Corridor
SWARTA W Liberty Route
No Improvement
Freight
Corridor No No Improvement
Project A – Vicinity Map
Project A – Proposed Typical Cross-Section

5-22 Future Roadway Element | Final Report | November 2018
2045 Long Range Transportation Plan
Project BB – Patriot Parkway
Widening Patriot Parkway (Project BB) is proposed to be widened between Loring Mill Road and Camden Highway. Portions of this corridor are beginning to approach capacity and are forecasted to be at capacity by the plan’s 2045 horizon year. This corridor also serves as a key access route to Shaw Air Force Base. Improvements to this facility will help serve regional growth spurred by the AFB, along with increased demand. This recommendation was previously included in the SUATS 2040 LRTP however the extents were changed in the 2045 update.
Project at a Glance
Project ID BB
Project Type Widening
Project Ranking 3
Primary Purpose Accessibility & Congestion Relief
Length 7.98 miles
Probable Construction Cost (in Build-Out Year)
$79,320,000
LRTP Horizon Year Vision Plan
Safety Score 3
Operational Characteristics
Existing Future
Facility Type Principal Arterial Principal Arterial
Travel Lanes 2 4
Volume 7,957 9,093
Capacity 13,165 12,699
Multimodal Characteristics
Existing Improvement
Bike/Ped Corridor
Sidewalk on Portion of West Side
Bike Route Signage/Sidewalks
Transit Corridor
SWRTA Shaw Shuttle Route
No Improvement
Freight
Corridor No No Improvement
Project BB – Vicinity Map
Project BB – Proposed Typical Cross-Section

5-23 Future Roadway Element | Final Report | November 2018
2045 Long Range Transportation Plan
Project C – W Brewington Road
Widening W Brewington Road (Project C) is proposed to be widened between US 521 and US 15. With improvements to better accommodate freight, this route could effectively serve as a northern bypass for truck traffic. The route provides a direct connection between US 378 east of Sumter to US 521 north of Sumter, and could be used as an alternate route to US 76/US 378. This route also serves an area in the northern portion of the SUATS area identified as ripe for future growth. Widening this road would serve freight traffic or other increased vehicular traffic in the future. Enhancements to this route could also better serve bicycle and pedestrian traffic in the area. This recommendation was also previously included in the SUATS 2040 LRTP.
Project at a Glance
Project ID C
Project Type Widening
Project Ranking 16
Primary Purpose Goods Movement
Length 5.44 miles
Probable Construction Cost (in Build-Out Year)
$52,670,000
LRTP Horizon Year Vision Plan
Safety Score 3
Operational Characteristics
Existing Future
Facility Type Collector Minor Arterial
Travel Lanes 2 4
Volume 1,456 2,271
Capacity 8,600 8,600
Multimodal Characteristics
Existing Improvement
Bike/Ped Corridor None Paved Shoulders
Transit Corridor None No Improvement
Freight Corridor Yes Widening
Project C – Vicinity Map
Project C – Proposed Typical Cross-Section

5-24 Future Roadway Element | Final Report | November 2018
2045 Long Range Transportation Plan
Project D – E Brewington Road
Widening E Brewington Road (Project D) is proposed to be widened between US 15 and US 378. With improvements to better accommodate freight, this route could effectively serve as a northern bypass for truck traffic. The route provides a direct connection between US 378 east of Sumter to US 521 north of Sumter, and could be used as an alternate route to US 76/US 378. This route also serves an area in the northern portion of the SUATS area identified as ripe for future growth. Widening this road would serve freight traffic or other increased vehicular traffic in the future. Enhancements to this route could also better serve bicycle and pedestrian traffic in the area. This recommendation was previously included in the SUATS 2040 LRTP.
Project at a Glance
Project ID D
Project Type Widening
Project Ranking 17
Primary Purpose Goods Movement
Length 10.00 miles
Probable Construction Cost (in Build-Out Year)
$96,820,000
LRTP Horizon Year Vision Plan
Safety Score 3
Operational Characteristics
Existing Future
Facility Type Collector Minor Arterial
Travel Lanes 2 4
Volume 704 862
Capacity 8,600 8,600
Multimodal Characteristics
Existing Improvement
Bike/Ped Corridor None Paved Shoulders
Transit Corridor None No Improvement
Freight Corridor Yes Widening
Project D – Vicinity Map
Project D – Proposed Typical Cross-Section
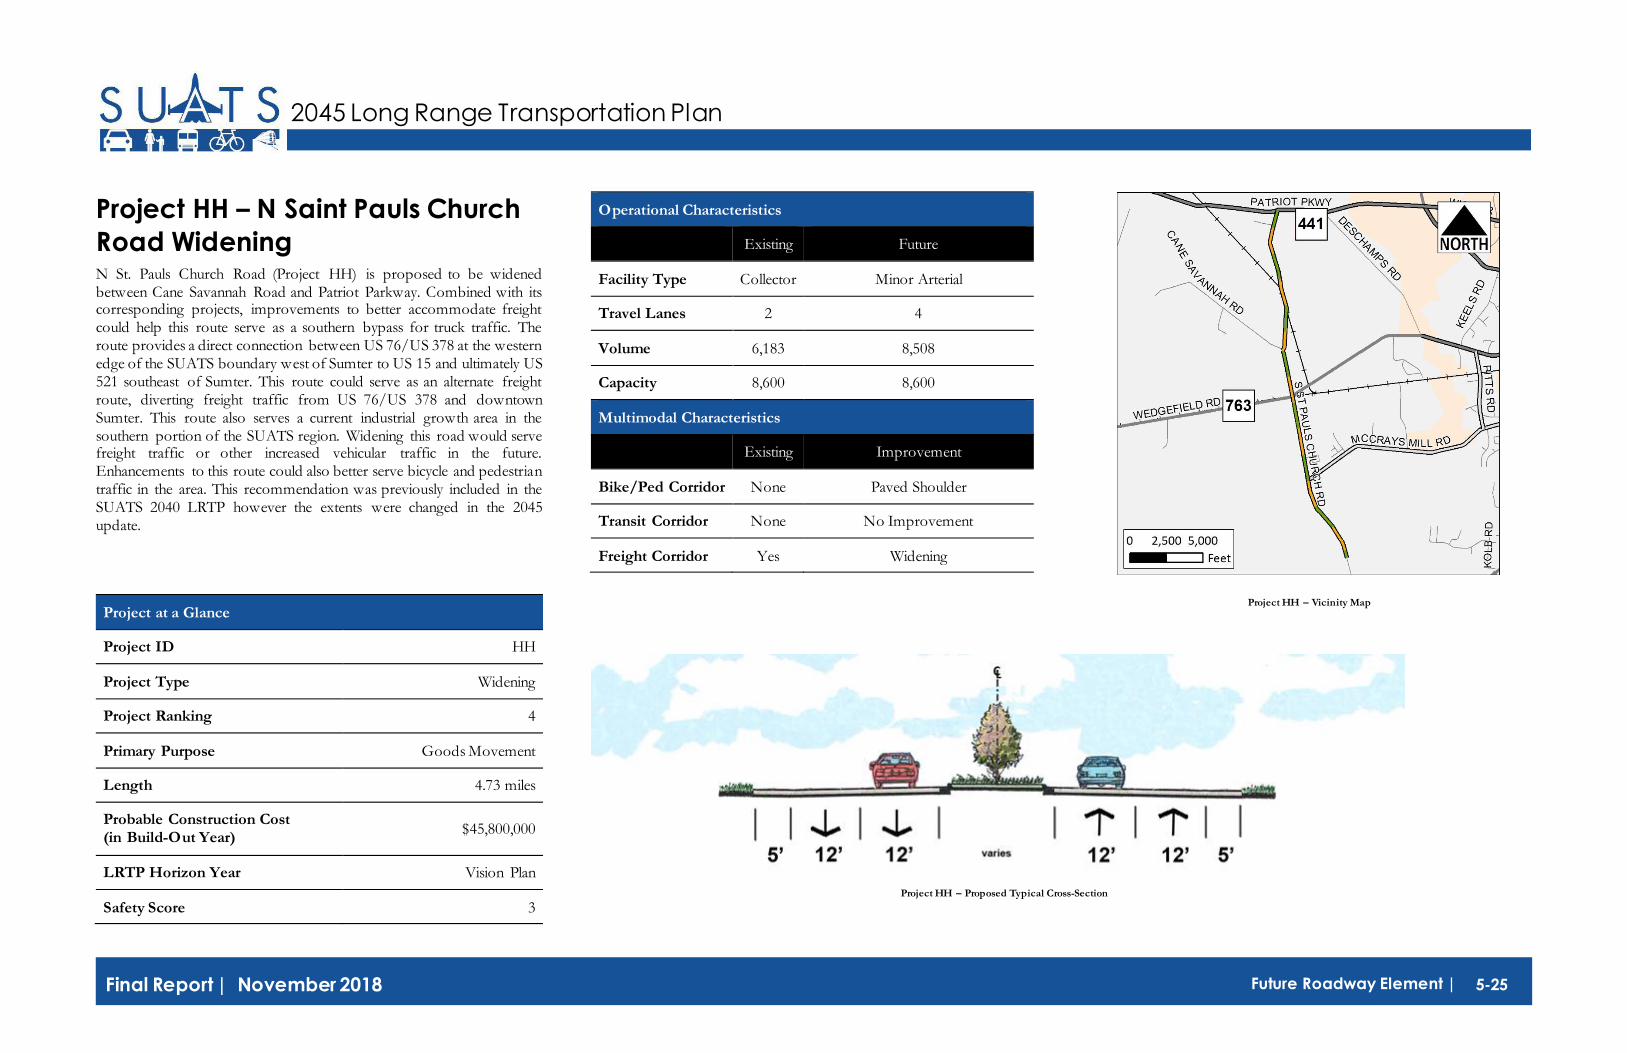
5-25 Future Roadway Element | Final Report | November 2018
2045 Long Range Transportation Plan
Project HH – N Saint Pauls Church
Road Widening N St. Pauls Church Road (Project HH) is proposed to be widened between Cane Savannah Road and Patriot Parkway. Combined with its corresponding projects, improvements to better accommodate freight could help this route serve as a southern bypass for truck traffic. The route provides a direct connection between US 76/US 378 at the western edge of the SUATS boundary west of Sumter to US 15 and ultimately US 521 southeast of Sumter. This route could serve as an alternate freight route, diverting freight traffic from US 76/US 378 and downtown Sumter. This route also serves a current industrial growth area in the southern portion of the SUATS region. Widening this road would serve freight traffic or other increased vehicular traffic in the future. Enhancements to this route could also better serve bicycle and pedestrian traffic in the area. This recommendation was previously included in the SUATS 2040 LRTP however the extents were changed in the 2045 update.
Project at a Glance
Project ID HH
Project Type Widening
Project Ranking 4
Primary Purpose Goods Movement
Length 4.73 miles
Probable Construction Cost (in Build-Out Year)
$45,800,000
LRTP Horizon Year Vision Plan
Safety Score 3
Operational Characteristics
Existing Future
Facility Type Collector Minor Arterial
Travel Lanes 2 4
Volume 6,183 8,508
Capacity 8,600 8,600
Multimodal Characteristics
Existing Improvement
Bike/Ped Corridor None Paved Shoulder
Transit Corridor None No Improvement
Freight Corridor Yes Widening
Project HH – Vicinity Map
Project HH – Proposed Typical Cross-Section

5-26 Future Roadway Element | Final Report | November 2018
2045 Long Range Transportation Plan
Project I – Cains Mill Road
Widening Cains Mill Road (Project I) is proposed to be widened between S St. Pauls Church Road and Clipper Road. Combined with its corresponding projects, improvements to better accommodate freight could help this route serve as a southern bypass for truck traffic. The route provides a direct connection between US 76/US 378 at the western edge of the SUATS boundary west of Sumter to US 15 and ultimately US 521 southeast of Sumter. This route could serve as an alternate freight route, diverting freight traffic from US 76/US 378 and downtown Sumter. This route also serves a current industrial growth area in the southern portion of the SUATS region. Widening this road would serve freight traffic or other increased vehicular traffic in the future. Enhancements to this route could also better serve bicycle and pedestrian traffic in the area. This recommendation was previously included in the SUATS 2040 LRTP.
Project at a Glance
Project ID I
Project Type Widening
Project Ranking 14
Primary Purpose Goods Movement
Length 3.58 miles
Probable Construction Cost
(in Build-Out Year) $34,650,000
LRTP Horizon Year Vision Plan
Safety Score 2
Operational Characteristics
Existing Future
Facility Type Collector Minor Arterial
Travel Lanes 2 4
Volume 3,081 3,547
Capacity 8,600 8,600
Multimodal Characteristics
Existing Improvement
Bike/Ped Corridor None Paved Shoulders
Transit Corridor None No Improvement
Freight Corridor Yes Widening
Project I – Vicinity Map
Project I – Proposed Typical Cross-Section

5-27 Future Roadway Element | Final Report | November 2018
2045 Long Range Transportation Plan
Project JJ – Terry Road Widening Terry Road (Project JJ) is proposed to be widened between Carter Road and Mason Road. Currently, the intersections of Mason Road and Terry Road with Broad Street are offset. Linking these two roadways and improving them will enhance safety by establishing one ninety-degree intersection that can be signalized rather than two unconnected and skewed intersections. This will provide a more seamless linkage across US 76/US 378 as well as improved connectivity to US 521. This recommendation was previously included in the SUATS 2040 LRTP.
Project at a Glance
Project ID JJ
Project Type Widening
Project Ranking 19
Primary Purpose Congestion Relief
Length 0.74 miles
Probable Construction Cost
(in Build-Out Year) $67,180,000
LRTP Horizon Year Vision Plan
Safety Score 1
Operational Characteristics
Existing Future
Facility Type Collector Minor Arterial
Travel Lanes 2 4
Volume Not Available Not Available
Capacity Not Available Not Available
Multimodal Characteristics
Existing Improvement
Bike/Ped Corridor None Sidewalks
Transit Corridor None No Improvement
Freight Corridor No No Improvement
Project JJ – Vicinity Map
Project JJ – Proposed Typical Cross-Section

5-28 Future Roadway Element | Final Report | November 2018
2045 Long Range Transportation Plan
Project K – Camden Highway
Widening Camden Highway (Project K) is proposed to be widened between Queen Chapel Road and US 521. This corridor is above capacity at the intersection of Camden Highway and Thomas Sumter Highway, a condition that is forecasted to worsen in the future. Widening this corridor would alleviate congestion and provide a more reliable alternative to US 521 north of the city. This project also falls within an area experiencing growth as a result of operations at Shaw Air Force Base. This recommendation was included in the SUATS 2040 LRTP.
Project at a Glance
Project ID K
Project Type Widening
Project Ranking 1
Primary Purpose Congestion Relief
Length 3.28 miles
Probable Construction Cost (in Build-Out Year)
$31,770,000
LRTP Horizon Year Vision Plan
Safety Score 3
Operational Characteristics
Existing Future
Facility Type Collector Minor Arterial
Travel Lanes 2 4
Volume 4,519 4,281
Capacity 8,600 8,600
Multimodal Characteristics
Existing Improvement
Bike/Ped Corridor None No Improvement
Transit Corridor None No Improvement
Freight Corridor No No Improvement
Project K – Vicinity Map
Project K – Proposed Typical Cross-Section

5-29 Future Roadway Element | Final Report | November 2018
2045 Long Range Transportation Plan
Project KK – Twelve Bridges Road
Widening Twelve Bridges Road (Project KK) is proposed to be widened between Old Manning Road and US 521. Combined with its corresponding projects, improvements to better accommodate freight could help this route serve as a southern bypass for truck traffic. The route provides a direct connection between US 76/US 378 at the western edge of the SUATS boundary west of Sumter to US 15 and ultimately US 521 southeast of Sumter. This route could serve as an alternate freight route, diverting freight traffic from US 76/US 378 and downtown Sumter. This route also serves a current industrial growth area in the southern portion of the SUATS region. Widening this road would serve freight traffic or other increased vehicular traffic in the future. Enhancements to this route could also better serve bicycle and pedestrian traffic in the area. This recommendation was previously included in the 2040 LRTP
Project at a Glance
Project ID KK
Project Type Widening
Project Ranking 18
Primary Purpose Goods Movement
Length 2.00 miles
Probable Construction Cost
(in Build-Out Year) $19,400,000
LRTP Horizon Year Vision Plan
Safety Score 3
Operational Characteristics
Existing Future
Facility Type Collector Minor Arterial
Travel Lanes 2 4
Volume Not Available Not Available
Capacity Not Available Not Available
Multimodal Characteristics
Existing Improvement
Bike/Ped Corridor None Paved Shoulders
Transit Corridor None No Improvement
Freight Corridor Yes Widening
Project KK – Vicinity Map
Project KK – Proposed Typical Cross-Section

5-30 Future Roadway Element | Final Report | November 2018
2045 Long Range Transportation Plan
Project L – Cane Savannah Road
Widening Cane Savannah Road (Project L) is proposed to be widened between S Kings Highway (SC 261) and St. Pauls Church Road. Combined with its corresponding projects, improvements to better accommodate freight could help this route serve as a southern bypass for truck traffic. The route provides a direct connection between US 76/US 378 at the western edge of the SUATS boundary west of Sumter to US 15 and ultimately US 521 southeast of Sumter. This route could serve as an alternate freight route, diverting freight traffic from US 76/US 378 and downtown Sumter. This route also serves a current industrial growth area in the southern portion of the SUATS region. Widening this road would serve freight traffic or other increased vehicular traffic in the future. Enhancements to this route could also better serve bicycle and pedestrian traffic in the area. This recommendation was previously included in the SUATS 2040 LRTP.
Project at a Glance
Project ID L
Project Type Widening
Project Ranking 12
Primary Purpose Goods Movement
Length 4.77 miles
Probable Construction Cost
(in Build-Out Year) $46,140,000
LRTP Horizon Year Vision Plan
Safety Score 3
Operational Characteristics
Existing Future
Facility Type Collector Minor Arterial
Travel Lanes 2 4
Volume 3,454 4,915
Capacity 8,600 8,600
Multimodal Characteristics
Existing Improvement
Bike/Ped Corridor None Paved Shoulders
Transit Corridor None No Improvement
Freight Corridor Yes Widening
Project L – Vicinity Map
Project L – Proposed Typical Cross-Section

5-31 Future Roadway Element | Final Report | November 2018
2045 Long Range Transportation Plan
Project MM – US 15 Widening US 15 (Project MM) is proposed to be widened between Nettles Road and Pearson Road. This project would continue the four lane cross-section already in place on US 15 north of Nettles Road. Portions of this corridor are approaching capacity, and are forecasted to be at capacity by the plan’s 2045 horizon year. Improvements on this corridor would also serve a key freight route and a growing industrial area. This recommendation was previously included in the SUATS 2040.
Project at a Glance
Project ID MM
Project Type Widening
Project Ranking 7
Primary Purpose Congestion Relief & Good Movement
Length 3.71 miles
Probable Construction Cost (in Build-Out Year)
$35,890,000
LRTP Horizon Year Vision Plan
Safety Score 3
Operational Characteristics
Existing Future
Facility Type Minor Arterial Minor Arterial
Travel Lanes 2 4
Volume 8,996 10,435
Capacity 10,953 10,953
Multimodal Characteristics
Existing Improvement
Bike/Ped Corridor None No Improvement
Transit Corridor None No Improvement
Freight Corridor Yes Widening
Project MM – Vicinity Map
Project MM – Proposed Typical Cross-Section

5-32 Future Roadway Element | Final Report | November 2018
2045 Long Range Transportation Plan
Project N – Clipper Road Widening Clipper Road (Project N) is proposed to be widened between Cains Mill Road and US 15. Combined with its corresponding projects, improvements to better accommodate freight could help this route serve as a southern bypass for truck traffic. The route provides a direct connection between US 76/US 378 at the western edge of the SUATS boundary west of Sumter to US 15 and ultimately US 521 southeast of Sumter. This route could serve as an alternate freight route, diverting freight traffic from US 76/US 378 and downtown Sumter. This route also serves a current industrial growth area in the southern portion of the SUATS region. Widening this road would serve freight traffic or other increased vehicular traffic in the future. Enhancements to this route could also better serve bicycle and pedestrian traffic in the area. This recommendation was previously included in the SUATS 2040 LRTP.
Project at a Glance
Project ID N
Project Type Widening
Project Ranking 20
Primary Purpose Goods Movement
Length 1.42 miles
Probable Construction Cost (in Build-Out Year)
$13,740,000
LRTP Horizon Year Vision Plan
Safety Score 1
Operational Characteristics
Existing Future
Facility Type Collector Minor Arterial
Travel Lanes 2 4
Volume 537 890
Capacity 8,600 8,600
Multimodal Characteristics
Existing Improvement
Bike/Ped Corridor None Paved Shoulders
Transit Corridor None No Improvement
Freight Corridor Yes Widening
Project N – Vicinity Map
Project N – Proposed Typical Cross-Section

5-33 Future Roadway Element | Final Report | November 2018
2045 Long Range Transportation Plan
Project Q – S Kings Highway
Widening S Kings Highway (Project Q) is proposed to be widened between US 76/378 and Cane Savannah Road. Combined with its corresponding projects, improvements to better accommodate freight could help this route serve as a southern bypass for truck traffic. The route provides a direct connection between US 76/US 378 at the western edge of the SUATS boundary west of Sumter to US 15 and ultimately US 521 southeast of Sumter. This route could serve as an alternate freight route, diverting freight traffic from US 76/US 378 and downtown Sumter. This route also serves a current industrial growth area in the southern portion of the SUATS region. Widening this road would serve freight traffic or other increased vehicular traffic in the future. Enhancements to this route could also better serve bicycle and pedestrian traffic in the area. This recommendation was previously included in the SUATS 2040.
Project at a Glance
Project ID Q
Project Type Widening
Project Ranking 6
Primary Purpose Goods Movement
Length 0.33 miles
Probable Construction Cost
(in Build-Out Year) $3,250,000
LRTP Horizon Year Vision Plan
Safety Score 5
Operational Characteristics
Existing Future
Facility Type Minor Arterial Minor Arterial
Travel Lanes 2 4
Volume 6,414 7,139
Capacity 10,671 10,671
Multimodal Characteristics
Existing Improvement
Bike/Ped Corridor None Paved Shoulders
Transit Corridor None No Improvement
Freight Corridor No Widening
Project Q – Vicinity Map
Project Q – Proposed Typical Cross-Section

5-34 Future Roadway Element | Final Report | November 2018
2045 Long Range Transportation Plan
Project RR – Wedgefield Road
Widening Wedgefield Road (Project RR) is proposed to be widened between Deschamps Road and Pinewood Road. Wedgefield Road is a key east-west linkage across the study area. Portions of this corridor are currently approaching or at capacity and are projected to continue this trend in the future with some areas reaching above capacity by the plan’s 2045 horizon year. This recommendation was previously included in the SUATS 2040 LRTP.
Project at a Glance
Project ID RR
Project Type Widening
Project Ranking 5
Primary Purpose Congestion Relief
Length 2.29 miles
Probable Construction Cost
(in Build-Out Year) $22,150,000
Original LRTP Horizon Year Vision Plan
Safety Score 3
Operational Characteristics
Existing Future
Facility Type Minor Arterial Minor Arterial
Travel Lanes 2 4
Volume 8,073 12,002
Capacity 10,800 10,800
Multimodal Characteristics
Existing Improvement
Bike/Ped Corridor None Bike Route Signage
Transit Corridor None No Improvement
Freight Corridor No No Improvement
Project RR – Vicinity Map
Project RR – Proposed Typical Cross-Section

5-35 Future Roadway Element | Final Report | November 2018
2045 Long Range Transportation Plan
Project T – Lewis Road Lewis Road (Project T) is proposed to be widened between McCrays Mill Road and US 15. Lewis Road and its continuation as Old Manning Road serve an important role for freight mobility in the southern part of the SUATS region. Portions of this corridor are approaching capacity and are forecasted to be at capacity by the plan’s 2045 horizon year. Improvements on this corridor would correspond with the proposed intersection improvement at US 15 S/Lewis Road/Old Manning Road. This recommendation was previously included in the SUATS 2040 LRTP.
Project at a Glance
Project ID T
Project Type Widening
Project Ranking 15
Primary Purpose Congestion Relief and Goods Movement
Length 3.05 miles
Probable Construction Cost
(in Build-Out Year) $14,250,000
LRTP Horizon Year 2030
Safety Score 3
Operational Characteristics
Existing Future
Facility Type Collector Minor Arterial
Travel Lanes 2 3
Volume 5,018 5,821
Capacity 8,600 8,600
Multimodal Characteristics
Existing Improvement
Bike/Ped Corridor None No Improvement
Transit Corridor None No Improvement
Freight Corridor Yes Widening
Project T – Vicinity Map
Project T – Proposed Typical Cross-Section

5-36 Future Roadway Element | Final Report | November 2018
2045 Long Range Transportation Plan
Project TT – Wesmark
Boulevard/Carter Road Widening Wesmark Boulevard/Carter Road (Project TT) is proposed to be widened between Broad Street and Broad Street Extension. At this time, a full four lane widening for this facility is not needed. However, reserving right of way for further widening would help ensure the corridor doesn’t become prohibitively constrained. Portions of this corridor are approaching capacity and will be at capacity by the 2045 horizon year. This recommendation was previously included in the SUATS 2040 LRTP.
Project at a Glance
Project ID TT
Project Type Widening
Project Ranking 11
Primary Purpose Congestion Relief
Length 2.80 miles
Probable Construction Cost (in Build-Out Year)
$27,870,000
LRTP Horizon Year Vision Plan
Safety Score 2
Operational Characteristics
Existing Future
Facility Type Collector Minor Arterial
Travel Lanes 2 4
Volume 4,643 5,552
Capacity 10,443 10,443
Multimodal Characteristics
Existing Improvement
Bike/Ped Corridor
Partial Sidewalks Paved Shoulders / Bike
Route Signage / Sidewalks
Transit Corridor
SWRTA Shaw Shuttle Route
No Improvement
Freight
Corridor No No Improvement
Project TT – Vicinity Map
Project TT – Proposed Typical Cross-Section

5-37 Future Roadway Element | Final Report | November 2018
2045 Long Range Transportation Plan
Project UU – S Wise Drive Widening S Wise Drive (Project UU) is proposed to be widened between Cane Savannah Road and Patriot Parkway. Sections of this corridor are currently approaching capacity with this trend continuing with some portions at capacity. When continuing onto Patriot Parkway, this corridor also serves as a key access route from downtown Sumter to Shaw Air Force Base. This recommendation was previously included in the SUATS 2045 LRTP however the extents were changed in the 2045 update.
Project at a Glance
Project ID HH
Project Type Widening
Project Ranking 4
Primary Purpose Accessibility & Congestion Relief
Length 4.73 miles
Probable Construction Cost
(in Build-Out Year) $45,800,000
LRTP Horizon Year 2040
Safety Score 3
Operational Characteristics
Existing Future
Facility Type Minor Arterial Minor Arterial
Travel Lanes 2 4
Volume 7,506 8,450
Capacity 10,800 10,800
Multimodal Characteristics
Existing Improvement
Bike/Ped Corridor
Sidewalk on North Side
Wide Outside Lanes / Sidewalk on South Side
Transit
Corridor
SWRTA West
Liberty Route No Improvement
Freight Corridor
No No Improvement
Project UU – Vicinity Map
Project UU – Proposed Typical Cross-Section
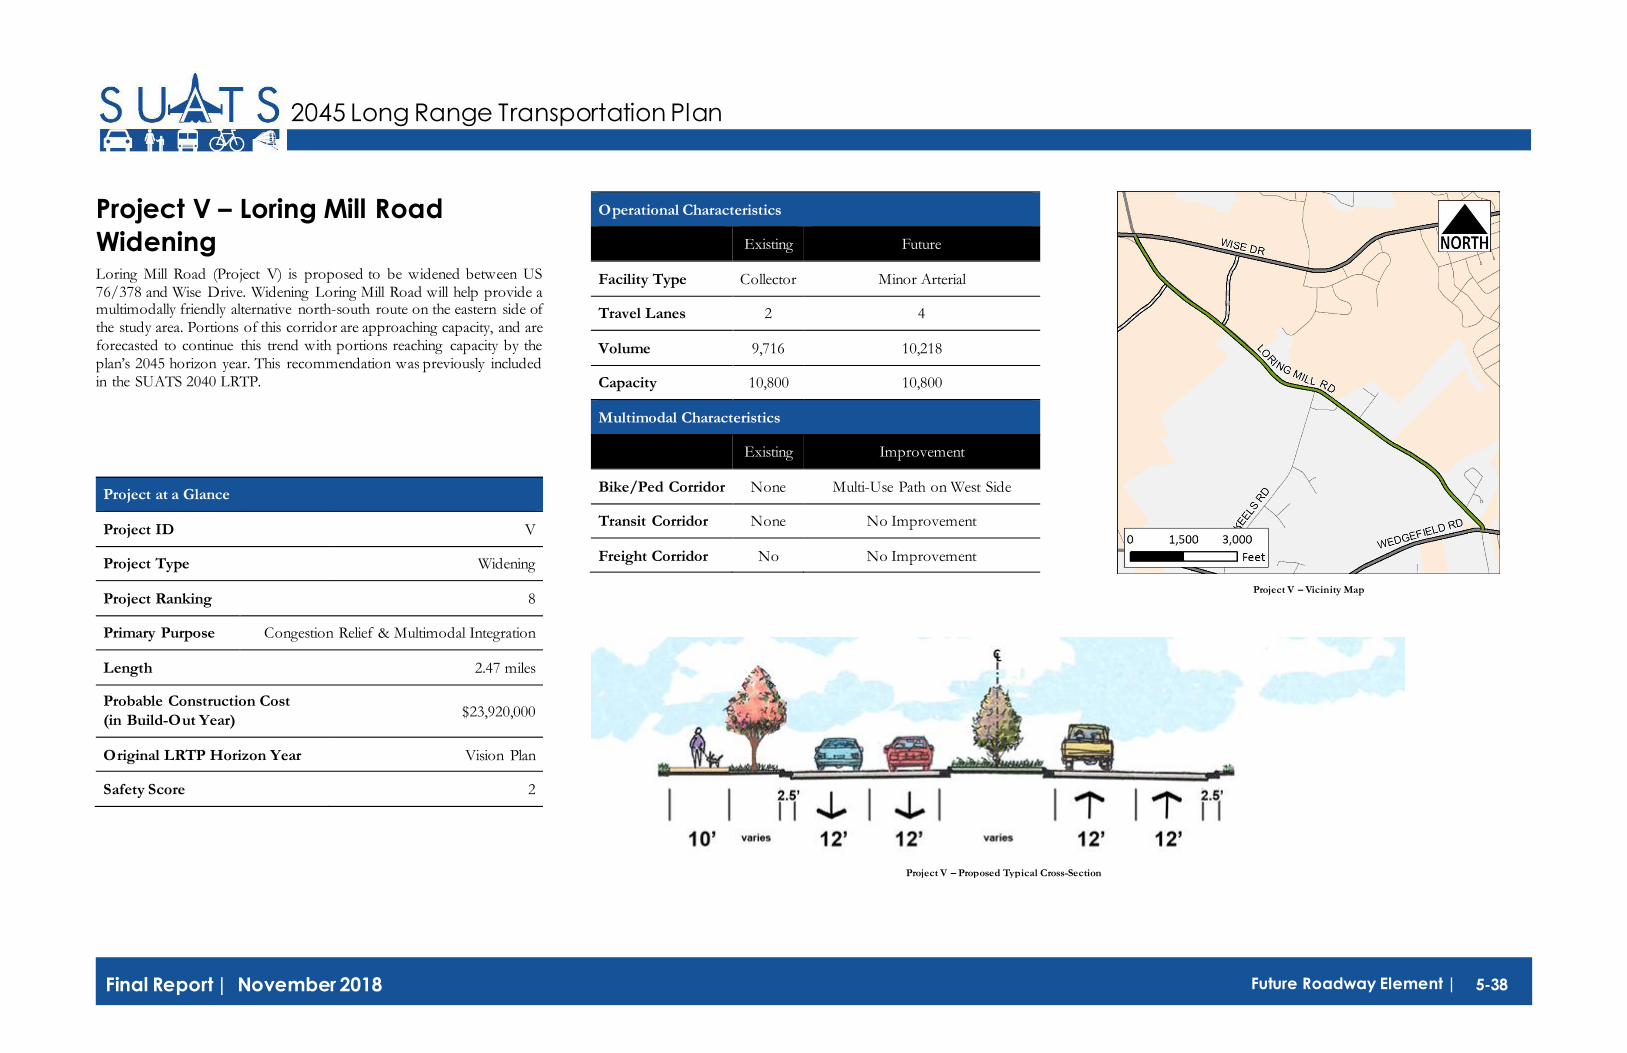
5-38 Future Roadway Element | Final Report | November 2018
2045 Long Range Transportation Plan
Project V – Loring Mill Road
Widening Loring Mill Road (Project V) is proposed to be widened between US 76/378 and Wise Drive. Widening Loring Mill Road will help provide a multimodally friendly alternative north-south route on the eastern side of the study area. Portions of this corridor are approaching capacity, and are forecasted to continue this trend with portions reaching capacity by the plan’s 2045 horizon year. This recommendation was previously included in the SUATS 2040 LRTP.
Project at a Glance
Project ID V
Project Type Widening
Project Ranking 8
Primary Purpose Congestion Relief & Multimodal Integration
Length 2.47 miles
Probable Construction Cost
(in Build-Out Year) $23,920,000
Original LRTP Horizon Year Vision Plan
Safety Score 2
Operational Characteristics
Existing Future
Facility Type Collector Minor Arterial
Travel Lanes 2 4
Volume 9,716 10,218
Capacity 10,800 10,800
Multimodal Characteristics
Existing Improvement
Bike/Ped Corridor None Multi-Use Path on West Side
Transit Corridor None No Improvement
Freight Corridor No No Improvement
Project V – Vicinity Map
Project V – Proposed Typical Cross-Section

5-39 Future Roadway Element | Final Report | November 2018
2045 Long Range Transportation Plan
Project W – Mason Road Widening Mason Road (Project W) is proposed to be widened between Weldon Drive and Camden Highway (US 521). Currently, the intersections of Mason Road and Terry Road with Broad Street are offset. Linking these two roadways and improving them will enhance safety by establishing one ninety-degree intersection that can be signalized rather than two unconnected and skewed intersections. This will provide a more seamless linkage across US 76/US 378 as well as improved connectivity to US 521. Although congestion on these unimproved roads is not forecast, linking and improving these facilities could help relieve congestion on neighboring roads. This recommendation was previously included in the SUATS 2040 LRTP.
Project at a Glance
Project ID W
Project Type Widening
Project Ranking 13
Primary Purpose Congestion Relief
Length 0.87 miles
Probable Construction Cost (in Build-Out Year)
$8,240,000
LRTP Horizon Year Vision Plan
Safety Score 3
Operational Characteristics
Existing Future
Facility Type Minor Arterial Minor Arterial
Travel Lanes 2 4
Volume 4,746 4,450
Capacity 10,800 10,800
Multimodal Characteristics
Existing Improvement
Bike/Ped Corridor None Sidewalks
Transit Corridor None No Improvement
Freight Corridor No No Improvement
Project W – Vicinity Map
Project W – Proposed Typical Cross-Section

5-40 Future Roadway Element | Final Report | November 2018
2045 Long Range Transportation Plan
Project Z – Old Manning Road
Widening Old Manning Road (Project Z) is proposed to be widened between US 15 and Twelve Bridge Road. Combined with its corresponding projects, improvements to better accommodate freight could help this route serve as a southern bypass for truck traffic. The route provides a direct connection between US 76/US 378 at the western edge of the SUATS boundary west of Sumter to US 15 and ultimately US 521 southeast of Sumter. This route could serve as an alternate freight route, diverting freight traffic from US 76/US 378 and downtown Sumter. This route also serves a current industrial growth area in the southern portion of the SUATS region. Widening this road would serve freight traffic or other increased vehicular traffic in the future. Enhancements to this route could also better serve bicycle and pedestrian traffic in the area. Improvements on this corridor would correspond with the US 15 S/Lewis Road/Old Manning Road proposed intersection improvement. Existing and projected future congested conditions could also be addressed through improvements at this location. This recommendation was previously included in the 2040 SUATS LRTP.
Project at a Glance
Project ID Z
Project Type Widening
Project Ranking 10
Primary Purpose Goods Movement
Length 6.35 miles
Probable Construction Cost (in Build-Out Year)
$61,480,000
LRTP Horizon Year Vision Plan
Safety Score 3
Operational Characteristics
Existing Future
Facility Type Collector Minor Arterial
Travel Lanes 2 4
Volume 4,343 4,901
Capacity 8,600 8,600
Multimodal Characteristics
Existing Improvement
Bike/Ped Corridor None Paved Shoulders
Transit Corridor None No Improvement
Freight Corridor Yes Widening
Project Z – Vicinity Map
Project Z – Proposed Typical Cross-Section

5-41 Future Roadway Element | Final Report | November 2018
2045 Long Range Transportation Plan
Project A1 – Alice Drive Extension Alice Drive Extension (Project A1) is a proposed roadway between US 521 and Wise Drive. This project would extend the existing Alice Drive corridor up to Wise Drive in the northern portion of the study area. Extending Alice Drive would create an alternative route for multimodal traffic between the city center and the northern portion of the study area. This facility will improve network continuity and promote economic development. This recommendation was previously included in the 2040 LRTP.
Project at a Glance
Project ID A1
Project Type Proposed New Location
Project Ranking 3
Primary Purpose Livability and complete streets
Length 1.44 miles
Probable Construction Cost
(in Build-Out Year) $16,770,000
LRTP Horizon Year Vision Plan
Crash Rate (100 mvmt) N/A
Operational Characteristics
Existing Future
Facility Type N/A Minor Arterial
Travel Lanes N/A 4
Volume N/A 12,170
Capacity N/A 12,400
Multimodal Characteristics
Existing Improvement
Bike/Ped Corridor N/A Bicycle Lanes / Sidewalks
Transit Corridor N/A No Improvement
Freight Corridor N/A No Improvement
Project A1 – Vicinity Map
Project A1 – Proposed Typical Cross-Section

5-42 Future Roadway Element | Final Report | November 2018
2045 Long Range Transportation Plan
Project B1 – New Frierson Road New Frierson Road (Project B1) is a proposed roadway between Patriot Parkway and Frierson Road. This project would create a new linkage through the Shaw Air Force Base, establishing a new gatehouse entrance off of SC 441. This project is being planned, designed, and funded using US Department of Defense funds. This recommendation was previously included in the 2040 LRTP.
Project at a Glance
Project ID B1
Project Type Proposed New Location
Project Ranking 1
Primary Purpose Accessibility
Length 1.41 miles
Probable Construction Cost (in Build-Out Year)
$9,730,000
LRTP Horizon Year 2018
Safety Score N/A
Operational Characteristics
Existing Future
Facility Type N/A Collector
Travel Lanes N/A 2
Volume N/A 890
Capacity N/A 8,600
Multimodal Characteristics
Existing Improvement
Bike/Ped Corridor N/A Sidewalk on North Side
Transit Corridor N/A No Improvement
Freight Corridor N/A No Improvement
Project B1 – Vicinity Map
Project B1 – Proposed Typical Cross-Section

5-43 Future Roadway Element | Final Report | November 2018
2045 Long Range Transportation Plan
Project C1 – Red Bay Road Red Bay Road (Project C1) is a proposed roadway between Coleman Street and US 76/378. This project would extend the existing Red Bay Road corridor up to US 76/US 378. The need for this project has been studied independently through the Red Bay Road Corridor Study. Extending Red Bay Road will create a direct connection for freight traffic between US 15/US 521 and US 378, thereby avoiding travel through the city. Extension of this corridor would also serve a growing industrial area. This recommendation was previously included in the SUATS 2040 LRTP.
Project at a Glance
Project ID C1
Project Type Proposed New Location
Project Ranking 4
Primary Purpose Goods Movement
Length 2.58 miles
Probable Construction Cost
(in Build-Out Year) $31,570,000
LRTP Horizon Year Vision Plan
Crash Rate (100 mvmt) N/A
Operational Characteristics
Existing Future
Facility Type N/A Minor Arterial
Travel Lanes N/A 4
Volume N/A 10,218
Capacity N/A 10,800
Multimodal Characteristics
Existing Improvement
Bike/Ped Corridor N/A Wide Outside Lanes /
Sidewalk on North Side
Transit Corridor N/A No Improvement
Freight Corridor N/A Widening
Project C1 – Vicinity Map
Project C1 – Proposed Typical Cross-Section

5-44 Future Roadway Element | Final Report | November 2018
2045 Long Range Transportation Plan
Project D1 – New Frierson Road-
Unconnected New Frierson Road- Unconnected (Project D1) is an alternative to the New Frierson Road proposed roadway between Patriot Parkway and Elm Street. This project would follow the same route as Project B1, however would end at Elm Street instead of connecting through to Frierson Road. This would allow access to neighborhoods and two schools without causing security issues for Shaw Airforce Base. This project would be planned, designed, and funded using US Department of Defense funds. This recommendation is new to the 2045 LRTP.
Project at a Glance
Project ID D1
Project Type Proposed New Location
Project Ranking 2
Primary Purpose Accessibility
Length 1.04 miles
Probable Construction Cost (in Build-Out Year)
$5,210,000
LRTP Horizon Year 2018
Safety Score N/A
Operational Characteristics
Existing Future
Facility Type N/A Collector
Travel Lanes N/A 2
Volume N/A 890
Capacity N/A 8,600
Multimodal Characteristics
Existing Improvement
Bike/Ped Corridor N/A Sidewalk on North Side
Transit Corridor N/A No Improvement
Freight Corridor N/A No Improvement
Project D1 – Vicinity Map
Project D1 – Proposed Typical Cross-Section

5-45 Future Roadway Element | Final Report | November 2018
2045 Long Range Transportation Plan
Areas of Future Study As part of this study, a broad overview of potential areas of future study was reviewed. These areas for future study should be considered for individual planning studies. Recommendations coming from these areas for future study may be incorporated as a part of a future Long Range Transportation Plan.
US 76/US 378/ Robert E Graham Freeway
Currently, US 76/US 378/Robert E. Graham Freeway is a four lane divided highway that runs east to west north of downtown Sumter. North and South Pike Streets run parallel. This highway acts as a barrier between the northern portion of the SUATS area and the southern portion for cars, bicyclists, and pedestrians. This highway should be considered as an area of future study to determine the impact of changing the classification from a high-speed divided highway to one that allows for multimodal transportation.

5-46 Future Roadway Element | Final Report | November 2018
2045 Long Range Transportation Plan
This page intentionally left blank.

CHAPTER 6 — BICYCLE AND PEDESTRIAN ELEMENT
2045 Long Range Transportation Plan
6-1 Bicycle and Pedestrian Element | Final Report | November 2018
Introduction Throughout the nation, densely populated areas turn to cycling and walking as a viable means of transportation. Sometimes commuters find cycling more efficient, affordable, and convenient than traveling by automobile on congested urban streets. Although most people in the United States choose to travel by automobile, cycling and walking remain the only option for some people. The 2016 American Community Survey identified that in Sumter County, 4% of workers aged 16 and up did not have access to a vehicle. 19.9% only had one vehicle available per household. Bicycling and walking can be an appealing alternative to traveling by car when considering it:
▪ Is environmentally-friendly — A shift from automobile travel
to cycling or walking conserves fuel, improves air quality, and reduces noise.
▪ Promotes good health practices — South Carolina ranks seventh in the nation for obesity, with 31.7% of its residents being obese (2013). The United States Surgeon General advises Americans to get 30 to 60 minutes of exercise 4 to 6 times per week. Bicycling and walking is a low-impact way to exercise and can improve a person’s health by lowering blood pressure, strengthening muscles, lowering stress levels, burning fat, increasing metabolism, and increasing the size, strength, and efficiency of the heart and cardiovascular system.
▪ Saves money — According to a Bureau of Labor Statistics report released in August 2017, typical American households in 2016 spent an average of $9,049 on transportation costs, including insurance, repair, maintenance, fuel costs, taxes, and other fees — a significant annual investment (see https://www.bls.gov/news.release/cesan.nr0.htm). By comparison, a 2012 estimate by the League of American Bicyclists notes that the average cyclist spends only $308 per year on bicycle costs. Choosing to ride a bicycle rather than to use a personal automobile could save one person thousands of dollars in a single year.
▪ Eases congestion — Since a bicyclist takes up about a quarter of the physical space of the average car and a pedestrian even less, both can maneuver more easily through traffic in urban areas. Often, cyclists and pedestrians can use dedicated bicycle lanes or greenways, allowing for an even more efficient trip.
▪ Represents the “livability” of a place — A bikable and walkable place protects the environment, encourages a healthy, active community, saves money, and increases the mobility of all users. This adds up to a livable community with strong social interaction.
▪ Can be Viable – According to a 2009 National Household Transportation Survey (NHTS), 23% of workers are willing to walk to their workplace if less than one mile. The average travel time to work in Sumter is approximately 21.8 minutes.
Even after conveying these benefits to prospective bicyclists and pedestrians, moving from potential use of non-automotive transportation to its reality in the SUATS region is not easy. Through nearly all channels of public feedback, residents noted a need for improved bicycle and pedestrian facilities and programs to balance the region’s transportation network. The bicycle and pedestrian element of the long-range transportation plan has evolved as a product of community input and outreach, including stakeholder interviews with the parks and recreation department, and local groups such as the Sumter County Active Lifestyles. This element begins with an overview of facility and program opportunities and a description of existing conditions. Recommendations are then presented based on the “Four E’s of Bicycle and Pedestrian Planning”: Engineering, Education, Encouragement, and Enforcement.
Complete Streets Promote
Bicycling and Walking Complete streets are community oriented streets that are designed to accommodate all modes of travel safely and conveniently. Bicyclists, pedestrians, motorists, and transit users can use the streets safely and conveniently regardless of their age or physical ability. The Sumter community realizes the importance of complete streets by shifting from automobile-oriented roadway design towards a bike and walk friendly environment. A recent example of the community’s commitment to complete streets is the intersection improvement projects at Alice Drive/Broad Street in which bicycle lanes were paved and marked. Sumter officials have echoed this community realization by adopting a city ordinance allowing bicyclists to travel on city sidewalks.
Complete streets can provide a variety of amenities that make them suitable for bicyclists and pedestrians. Paved and marked bicycle lanes along the roadway or posted “Share the Road” signs and markings can alert motorists to look out for bicyclists. Bicycles are considered vehicles and as such their right to use the road is legally recognized and affirmed. Reference materials such as the AASHTO Green Book and the Manual for Uniform Traffic Control Devices provide guidance for design and construction.
Wide sidewalks provide able and disabled pedestrians space in which to travel. Residential sidewalks vary from 4 to 8 feet wide. However, for sidewalks less than 5 feet wide, a passing section must be provided in segments for wheelchair maneuvering. Marked crosswalks or raised crosswalks designate a safe place for pedestrians to cross streets. Curb ramps designed in accordance with the Americans with Disabilities Act (ADA) provide blind people and wheelchair riders an easy and safe access to crossing streets.
Complete streets are safe and easy to access for all users in part because government sets the policy to implement them through the planning, design, construction, maintenance and retrofitting of transportation facilities. Thirty-three states, Puerto Rico, and the District of Columbia have already adopted Complete Streets policies (see https://smartgrowthamerica.org/program/national-complete-streets-coalition/policy-development/policy-atlas/). Complete Streets policies can be adopted either by legislative action or by resolution. SCDOT
Downtown Sumter Sidewalk Alice Drive Bicycle Lane

6-2 Bicycle and Pedestrian Element | Final Report | November 2018
2045 Long Range Transportation Plan
adopted the policy by Commission Resolution in 2003; two county governments (Richland and Spartanburg) and ten cities in South Carolina (Anderson, Camden, Columbia, Conway, Greenville, Greenwood, Myrtle Beach, Ninety-Six, North Myrtle Beach, and Spartanburg) have also adopted the policy either in ordinance or resolution. (See http://www.completestreets.org/webdocs/policy/cs-chart-allpolicies.pdf)
There are three primary reasons supporting the implementation of a Complete Streets policy. First, when a street is designed with pedestrians and bicycle riders in mind, certain design features such as raised medians, wide sidewalks, better lighting, better bus stop placement, turning access control, treatments for disabled travelers, and traffic calming measures can provide a safe environment for bicycle and sidewalk users. Second, a complete streets policy promotes health in the community. When the infrastructure of a community is friendly to pedestrians and bicyclists, it encourages people to walk or bike. As the body burns calories, the risks of heart disease and obesity are reduced. The federal government created the Safe Routes to School program in 2005 (since folded into the Transportation Alternatives Program) in part to promote exercise after the childhood obesity epidemic rose to an alarming level. Third, when an area in a community becomes more attractive and balanced, land values increase. An old saying of real estate pricing, “location, location, location”, can be found true in an area with wide sidewalks, paved and marked bicycle paths on roadways, raised crosswalks with visible markings, and other traffic calming measures.
The Sumter 2030 Comprehensive Plan, adopted by the City of Sumter Council and County of Sumter Council, endorses the Complete Street concept in its Transportation Policies. The City Code encourages bicyclists to ride more often by allowing bicycle travel on the sidewalks in designated areas around town. Ordinance language relating to bicycle and pedestrian travel is included in the following section.
City of Sumter Code of Ordinances –
Use of Bicycle on Sidewalks
CODE 1976. ARTICLE IV. SIDEWALKS. SECTION 78-117. USE OF BICYCLES.
(a) Persons may ride bicycle, not motor-driven, on all sidewalks of the city, save and except the sidewalks on that section of Main Street bounded by Calhoun Street on the north and Oakland on the South, and that section of Liberty Street bounded by Harvin on the east and Washington Street on the west.
(b) No person who is riding a bicycle, tricycle, etc., on any sidewalk shall ride the same across the intersection.
(c) Pedestrians using the sidewalks of the city have the right-of-way over persons riding bicycles or children riding tricycles on the sidewalks. Anyone propelling a bicycle upon the sidewalks of the city shall propel the bicycle at a reasonable rate of speed under existing circumstance and conditions.
The City and County’s commitment to Complete Streets concepts were applied in in 2016 when the Earmark Repurpose Act secured the funding of a neighborhood revitalization project. A total of $16.4 million, including $5 million of local funding from the County Penny for Progress (P4P) Sales Tax, helped implement Complete Streets and intersection improvements on North Main Street and Manning Avenue. Both the Manning Avenue corridor project and the North Main Street corridor project are anticipated to start construction in late 2020 with completion in late 2022.
Facility and Program Opportunities To develop and integrate the bicycle and pedestrian element into the LRTP, the types of users, facilities, and programs must be understood.
Bicycle Users
In order to develop an appropriate bicycle element, the needs and expectations of all users — regardless of skill level — must be addressed. The following “ABCs” of cyclists need to be clear for both planners and end users.
Advanced
Advanced cyclists — usually the most experienced on the road — have the ability to safely ride in typical arterial conditions of higher traffic volume and speeds. Most advanced cyclists prefer shared roadways in lieu of striped bike lanes and paths, but may be more willing to accept striped bike lanes when the street gutter is cleaned regularly.
Basic
Due to being less secure in their ability to ride in traffic without special accommodations, basic cyclists are casual or new adult/teenage riders who typically prefer multi-use paths or separated bike lanes on collector or arterial streets. Such facilities reduce basic cyclists’ exposure to fast-moving and heavy traffic. Surveys of the cycling public indicate that about 80% of cyclists can be categorized as basic cyclists.
Child
The children on bicycles that make up this group have a limited field of vision while riding and generally keep to neighborhood streets, sidewalks, and greenways. On busier streets, this group is likely to stay on sidewalks or off-street facilities that protect them from traffic. In Sumter, cycling on sidewalks is permitted everywhere except downtown. While in general riding on sidewalks should be discouraged, the comfort level of child cyclists warrant riding on sidewalks provided they yield to pedestrians.
Bicycle Facilities
Like drivers, cyclists gain experience over time by riding. As cyclists ride and gain more experience operating in traffic, they graduate from basic to advanced cyclists. This transition ensures that the needs of all three types of cyclists must be constantly evaluated and accommodated. To make sure adequate amenities are available to users of all skill levels, the facilities identified here should be incorporated into roadway projects in the Sumter area. Two bicycle design guideline documents were reviewed for this chapter:
▪ AASHTO Guide for the Development of Bicycle Facilities — Referred to as the Bicycle Guide, this is a federal document which sets forth the current design practices accepted by FHWA. This document discusses planning, design, operations, and maintenance issues associated with bicycle facilities. With respect to design, it addresses width

6-3 Bicycle and Pedestrian Element | Final Report | November 2018
2045 Long Range Transportation Plan
dimensions, grades, cross slopes, radii, acceleration rates, deceleration rates, and sight distances. The Bicycle Guide is not intended to establish strict standards. It provides “sound guidelines that are valuable in attaining good design sensitive to the needs of both bicyclists and other highway users” (p. 2).
▪ FHWA Manual on Uniform Traffic Control Devices (MUTCD) —Unlike the AASHTO Bicycle Guide¸ the MUTCD does constitute a standard. Failure to comply with the MUTCD can result in being denied federal funds and makes liable non-compliant jurisdictions in the event of a crash. The MUTCD addresses standards for signing, striping, markings, signals, islands, and traffic work zone devices (e.g., cones and barricades). It provides information on what symbols may be used on signs and when sign text can vary from the signs provided. The color, width, types, and applications of striping are defined in detail. It also provides dimensions and shapes of pavement markings and pavement lettering.
SCDOT engineering directives also inform the proper design of these facilities.
Bicycle Lanes
A bike lane is a portion of the roadway that has been designated by striping, signing, and pavement markings for the preferential or exclusive use of bicyclists. Bike lanes are always located on both sides of the road (except one way streets), and carry bicyclists in the same direction as adjacent motor vehicle traffic. The minimum width for a bicycle lane is 4 feet (on roads with no curb and gutter); 5- and 6-foot bike lanes are typical for collector and arterial roads. Increasing the width of bike lanes provides greater comfort for bicyclists.
The AASHTO Bicycle Guide states, “[Bike lanes may be provided] by reducing the width of vehicular lanes or prohibiting parking…” (p. 8). SCDOT, adapting the AASHTO Bicycle Guide, specifies a minimum width of 4 feet on rural sections with ADT greater than 500. When speeds exceed 50mph or the percentage of trucks, buses, and recreational
vehicles increases significantly, SCDOT recommends a minimum width of 6 feet.
Wide Outside Lanes
Wide outside lanes (typically 14 feet wide) have been used to provide
extra space for bicyclists. While wide outside lanes are an effective way to encourage motorists to give bicyclists adequate clearance when passing, they are largely unrecognized by casual bicyclists as bike facilities. Having a striped bike lane greatly improves feelings of safety and comfort for bicyclists. However, each roadway should be evaluated individually to determine what treatment is most appropriate for the surroundings and conditions.
Paved Shoulders
Paved shoulder space improves the safety and comfort of bicyclists and also extends the service life of the road surface by reducing edge deterioration. There is no minimum width for paved shoulders; however, a width of 4 feet is preferred. Even wider shoulders provide greater levels of bicyclist safety and comfort. On many roadways, motor vehicle travel lanes can be narrowed to provide more shoulder space. According to the AASHTO Bicycle Guide, “where 4-foot widths cannot be achieved, any additional shoulder width is better than none at all.” Paved shoulders also improve safety for motor vehicles, prevent pavement damage to the travel lanes, and provide space for pedestrians. The AASHTO guide further addresses the design and location of bicycle lane appropriate rumble strips.
SCDOT encourages at least 2-foot paved shoulders on rural sections with ADT less than 500 and 4-foot minimums on sections with greater than 500 ADT. While paved shoulders are generally acceptable for roadway sections without frequent intersections, on those where
intersections are frequent, appropriate bike lane striping should be applied.
Maintenance is an important issue for bicycle infrastructure. Debris, dirt, and trash can impede bicyclists and are a major safety factor, in shoulders as well as bicycle lanes. Special
Paved Shoulder on Patriot Parkway
Shared Roadway in Downtown Sumter
Signed Bicycle Route in Cary, NC
McCrays Mill Road Bicycle Lane
Wide Outside Lane

6-4 Bicycle and Pedestrian Element | Final Report | November 2018
2045 Long Range Transportation Plan
attention to maintenance should be kept by the City, County, and SCDOT.
Shared Roadways
Shared roadways are streets and roads where bicyclists can be served by sharing the travel lanes with motor vehicles. Usually, these are streets with low traffic volumes and/or low speeds, which do not need special bicycle accommodations in order to be bicycle-friendly.
Signed Bicycle Routes
Signed routes will be an integral part of the bicycling network in the SUATS area. These facilities are an inexpensive way to guide riders to more bicycle-friendly roads. They can be used with any of the facilities listed above, including roads with bicycle lanes, shared roadways, and multi-use paths. The traffic and geometry of a road are important considerations when determining the location of a signed route. In addition, the functionality of the route for the purpose it was intended (e.g., scenic route or utilitarian connector) is a necessary component in
the decision-making process.
SHARE THE ROAD signs (MUTCD W11-1 warning
sign with W28-1 subplate) can be used to alert drivers to the presence of bicyclists. They are typically considered when one or more of the following criteria are met:
▪ Safety problems exist and the roadway cannot be improved with bicycle lanes
▪ Bicycling volumes are high
▪ A conflict or obvious courtesy problem exists between motor vehicle and bicycle traffic sharing the road
BIKE ROUTE signing (MUTCD D11-1 sign with D1-1b subplate) is another treatment which can be implemented to improve conditions for bicyclists.
BIKE ROUTE signs help guide bicyclists to preferred routes —
roads with lower motor vehicle traffic speeds, fewer trucks, or lower volumes. Typically, they are supplemented with destination and distance signing.
Special signs can also be designed to guide bicyclists along the recommended routes. These signs should incorporate their own colors and logo so that they can be recognized easily and help advertise the route to potential bicyclists, and should include the name of the route being utilized.
Other Bicycle Facilities and Amenities
Design considerations should also be given to ancillary bicycle facilities and amenities such as bike racks, bikes on buses and bike amenities at transit stops, and bike-friendly drainage inlets. The SCDOT Engineering Directive Memorandum recommends drainage inlets be placed outside bicycle facilities when appropriate. If the inlet must be placed within the bicycle facility, it should be flush with the pavement. SCDOT also discourages longitudinal rumble strips where bicycle travel is expected. Additional descriptions of ancillary facilities are provided in the recommendations identified later in this chapter.
Pedestrian Facilities
Analysis and development of recommendations in this chapter involved reviewing pedestrian facility design guidelines for sidewalks and walkways, curb ramps, marked crosswalks and enhancements, and transit stop treatments.
Sidewalks and Walkways
The Federal Highway Administration (FHWA) defines sidewalks as “walkways that are parallel to a street or highway” and walkways as “pedestrian paths, including plazas and courtyards.” The FHWA recommends that sidewalks and walkways be designed with the following characteristics in mind:
▪ Wide pathways with minimal obstacles or protruding objects
▪ Clearly defined pedestrian furniture, and frontage zones
▪ Moderate grades and cross slopes
▪ Rest areas outside of pedestrian zone
▪ Minimal changes in level
▪ Firm, stable, and slip resistant surfaces
▪ Good lighting
The Institute of Traffic Engineers (ITE), the American Association of State Highway and Transportation Officials (AASHTO), and FHWA all recommend a minimum width of 5 feet for a sidewalk or walkway to allow two people to pass comfortably or to walk side-by-side, and they prefer 4- to 6-foot buffer zones be provided to separate pedestrians from the street. For those with mobility impairments, sidewalks and walkways should be designed to minimize grades and cross slopes. FHWA recommends that the grade and cross slope
Crosswalk without curb ramp (Pinewood Road)
Crosswalk and curb ramp in Downtown Sumter
Narrow Sidewalk on Sumter street Crosswalk and curb ramp on Sumter street

6-5 Bicycle and Pedestrian Element | Final Report | November 2018
2045 Long Range Transportation Plan
not exceed 5% and 2%, respectively, wherever possible.
Curb Ramps
For persons with disabilities, curb ramps provide critical access between the sidewalk and street. While allowing for site-specific designs for curb ramps, FHWA suggests the ramp provide a level land area, be within the marked crosswalk area, avoid large changes of grade, and be distinguishable from surrounding terrain. The Federal Americans with Disabilities Act (ADA) mandates curb ramps at all intersections and mid-block locations where pedestrian crossings exist.
Marked Crosswalks and Enhancements
Marked crosswalks indicate the optimal location for pedestrians to cross a street. While crosswalks are usually installed at signalized intersections, mid-block crosswalks are becoming more popular. In locations that require increased levels of pedestrian visibility, the following enhancements can be incorporated into the crosswalk and street design:
▪ Raised Crosswalk. A raised crosswalk elevates the roadway by 3 to
6 inches, in effect reducing the speed of automobiles and providing increased visibility for high pedestrian-traveled areas. Raised crosswalks must be well-lit and well-marked to allow motorists to detect them at night and during inclement weather.
▪ Pedestrian Refuge Island. These raised islands in the center of a street protect pedestrians from vehicles. At such crossings, pedestrians can concentrate on one direction of traffic at a time by crossing to the center island and waiting for a gap in traffic to complete the trip across the street.
▪ Curb Extensions. Curb extensions can be placed at intersections or mid-block crossings. They extend the sidewalk into the street to improve pedestrian safety by calming traffic, increasing driver awareness of pedestrian activity, and shortening the crossing distance for pedestrians. When combined with landscaping, curb extensions can compensate for overly wide streets and improve the street’s character.
In South Carolina, pedestrians within a crosswalk have the right-of-way and motorists must yield.
Transit Stop Treatments
Most transit trips require pedestrian or bicycle connections. In addition to having well-planned routes, a good transit system provides riders with safe, accessible stops. The design of transit stops should be tailored to the number of riders and provide:
▪ Buffer from vehicle traffic
▪ Sheltered seating
▪ Trash cans
▪ Bicycle parking
▪ Clear signage that includes route information
To encourage active use of the transit system, a network of sidewalks and paths should connect high-volume transit stops to popular destinations. Pedestrian-level lighting along these paths improves visibility and increases safety for users.
Multi-Use Facilities
Some facilities are designed to accommodate both bicyclists and pedestrians. These multi-use facilities separate non-motorized users from automobile traffic.
Multi-Use Paths on Independent Alignments
Multi-use paths — or shared use trails — are becoming quite popular, not only with bicyclists, but also with many non-motorized transportation device users across the country. They can provide a high-quality bicycling experience in an environment that is protected from motorized traffic because they are constructed in their own corridor, often within open-space area. Multi-use paths can be paved and should be a minimum of 10-feet wide. Their width may be reduced to 8 feet if there are physical or right-of-way constraints. Additional width should be considered for areas with difficult terrain or heavy traffic.
Multi-use paths are, in effect, little roads and should be designed with clearance requirements, minimum radii, stopping sight distance requirements, and other criteria just as roadways are designed. Additionally, designers must comply with the MUTCD and AASHTO Bicycle Guide when designing these facilities.
Transit stop treatment
(Source: City of Sumter, SC)
Raised crosswalk Pedestrian refuge island Curb extension

6-6 Bicycle and Pedestrian Element | Final Report | November 2018
2045 Long Range Transportation Plan
Though paths should be thought of as roadways for geometric and operational design purposes, they require much more consideration of amenities. Shade and rest areas with benches and water sources should be designed along multi-use paths. Where possible, vistas should be preserved. Way finding signs (e.g., how far to the library or the next rest area, or directions to restrooms) are important for non-motorized users. These types of design considerations can help make a multi-use path more attractive to potential users.
Sidepaths/Wide Sidewalks
A sidepath is essentially a multi-use path that is oriented alongside a road. The AASHTO Guide to the Development of Bicycle Facilities strongly cautions those contemplating a sidepath (or wide sidewalk) facility to investigate various elements of the roadway corridor environment and right-of-way before deciding upon a final design. AASHTO provides nine cautions/criteria (pp. 34-35) for designing sidepaths. Research confirms that bicycle/motor vehicle crash rates can be higher for bicyclists riding on a sidepath compared to riders on the roadway. Crashes between motor vehicles and bicyclists on sidepaths can occur when motorists falsely expect bicyclists to yield at all cross streets and driveways. Likewise, stopped vehicles entering or exiting side streets or driveways may block the bicyclists’ path. However, careful design can mitigate some of these concerns.
Some high-volume, high-speed roadways exist where sidepaths are the best bicycle facility that can be provided without very costly changes to the roadway corridor. In these cases, it may be desirable to provide a sidepath. This decision must consider the magnitude of intersecting
driveway and roadway conflicts. If possible, sidepaths should be provided on both sides of the roadway to encourage bicyclists to ride in the same direction as adjacent traffic. The long-term strategy on these roadways should be to widen the road or narrow the lanes to provide additional space for bicyclists in on-street bike lanes or shoulders.
Existing Conditions
Bicycling and walking often falls into two distinct types of travel:
1. Utilitarian, non-discretionary travel. Children, persons with disabilities, and many elderly are not able to drive. Some households simply cannot afford an automobile. According to the 2016 American Community Survey, approximately 2.8% of all households in Sumter County do not have a vehicle available. This percentage is higher than the state (2.1%), but lower than the national average (4.4%). For those unable to drive and persons living in households with no vehicles, transit, bicycling, and walking may be their only option for daily necessary trips.
2. Recreational, discretionary travel. Bicycle clubs organize rides throughout the year, while many other bicyclists ride in informal groups. Many more informal joggers, bicyclists, and walkers can be seen throughout Sumter on a regular basis.
Both types of travelers require a complete network of bicycle and pedestrian facilities as well as programs that educate and encourage current and future users. The chart to the right illustrates how respondents to the public survey rated infrastructure improvement
approaches in Sumter. Focusing on ways to improve existing conditions was voted the highest while constructing numerous new smaller projects (e.g., short street connections and bicycle and pedestrian facilities) was ranked the lowest. Figures 6.1A and 6.1B illustrate existing bicycle and pedestrian facilities in the SUATS area.
Bicycle Network
Bicyclists can use multi-use paths with pedestrians or mix with vehicular traffic on select roadways. Therefore, bicycle facilities can range from wide curb lanes with no
striping to marked bicycle lanes to off-road bicycle paths. The target user for each application and the unique circumstances of the particular roadway help to determine the bicycle treatment that is most appropriate. For example, on roadways with relatively low automobile volumes and slow travel speeds, experienced bicyclists often feel comfortable riding in mixed-flow traffic with no specific bicycle facilities provided. Marked bicycle facilities or adjacent bicycle paths are desirable as traffic volumes and travel speeds become higher.
Existing Bikeways
The bicycle network in Sumter remains in its infancy. Bike lanes are provided on McCrays Mill Road, and multi-use sidepaths along Patriot Parkway continuing onto Loring Mill Road that connect Wise Drive to Wedgefield Road. Bicyclists also have access to a few trails in the area. Two existing trails will become part of the proposed Cypress Trail. One 3-mile segment connects the Wise Drive entrance of Dillon Park to Cypress Park. A short ½-mile multi-use path also is available near the YMCA between Broad Street and North Guignard Drive. Although beyond the SUATS boundary, a portion of the Palmetto Trail runs through Manchester State Forest and Poinsett State Park. Once complete, the Palmetto Trail will stretch 425 miles from the mountains to sea. Manchester State Forest also includes several mountain bike trails.
Question 7: Which of the following is the most important to you when traveling around the Sumter area without a personal vehicle?
24%
24%
12%
36%
5%Investing in pedestrian-specific
facilities (e.g., sidewalks and
crosswalks)
Investing in public transportation
(e.g., increase bus service area)
Investing in bicycle-specific
facilities (e.g., bike lanes)
Investing in multi-use facilities
(e.g., greenways and multi-use
paths)
Blanks (skipped)
Sidepath on Loring Mill Road
LRTP Update Survey, 2017

6-7 Bicycle and Pedestrian Element | Final Report | November 2018
2045 Long Range Transportation Plan
Pedestrian Network Walking is a key element to a healthy community’s transportation system. Every trip begins and ends as a walking trip, yet walking is often a forgotten mode during the planning process. When a proper pedestrian environment is provided, walking offers a practical transportation choice that provides benefits for both individuals and their communities. The potential for increased walking is enormous since ¼ of all trips in the United States are less than one mile in length. Features that contribute to making communities more walkable include a healthy mix of land uses, wide sidewalks, buffers between the edge of pavement and the sidewalk, and trees to shade walking routes. Slowing traffic, narrowing streets to reduce pedestrian crossing distance, and incorporating pedestrian infrastructure (i.e., signage, crosswalks, and adequate pedestrian phasing at signals) into future roadway design plans also ensure walkability.
The availability of pedestrian facilities and amenities plays an important role in encouraging the use of alternative modes of travel to the automobile. In addition to shifting trips from automobile to foot, the success of transit and other alternative travel modes depends greatly on the state of pedestrian facilities and amenities.
Existing Sidewalks, Trails, and Routes
In order for walking to be considered a realistic transportation alternative, conditions need to be favorable for pedestrian use. In Sumter, sidewalk deficiencies and a largely inhospitable pedestrian environment contribute to a reliance on the automobile even for shorter trips. The most walkable areas in Sumter are in the downtown area. Here, pedestrians benefit from a relatively complete sidewalks network, though some facilities need maintenance. Beyond the downtown area, sidewalks appear less frequently. However, a number of existing sidewalks are located along major arterials such as McCrays Mill Road, Loring Mill Road, Alice Drive, Broad Street, and Guignard Drive. Sidewalks become much less frequent near the city limits and few exist in unincorporated areas of Sumter County.
One method in which new sidewalks may be built is through a subdivision zoning application. During this process, the developer may be required to build sidewalks within the new development and in some cases outside the development if the access points are close to existing public facilities. Additionally, new sidewalk construction in Sumter County is one of the major infrastructure investment projects of the
Penny for Progress Sales Tax program (P4P). $2.3 million was allocated for sidewalk construction under the 2016 P4P. This project expands the community’s sidewalk network, providing safe walking connections to neighborhoods, schools, parks, and commercial areas that include: N. Columbia Drive, Crestwood Drive, N. Guignard Drive, Highland Avenue, N. Lafayette Drive, Lewis Road, W. Oakland Avenue, and W. Red Bay Road.
In addition to sidewalks, the Cypress and Palmetto Trails provide recreational opportunities for pedestrians in the Sumter area. Shorter trails around Swan Lake, within Iris Gardens, and near the YMCA provide additional recreational opportunities.
The organization Sumter County Active Lifestyles has identified several routes in and between downtown and Swan Lake/Iris Gardens. The routes are identified on an informational map and range in length from less than a mile for trails within Swan Lake/Iris Gardens to more than 3.5 miles for a loop from Swan Lake to West Oakland Avenue.
Cypress Trail ( Source: SC Department of Health and Environmental Control)
High-pedestrian use area without sidewalks adjacent to Lafayette Drive
Sidewalk without buffer f rom traffic on Broad Street

CHAPTER 6 — BICYCLE AND PEDESTRIAN ELEMENT
2045 Long Range Transportation Plan
6-8 Bicycle and Pedestrian Element | Final Report | November 2018

6-9 Bicycle and Pedestrian Element | Final Report | November 2018
2045 Long Range Transportation Plan

6-10 Bicycle and Pedestrian Element | Final Report | November 2018
2045 Long Range Transportation Plan
Existing Groups, Programs, and Initiatives
Several groups team with local officials to produce educational materials, sponsor bicycling and pedestrian events, and advocate the utilitarian and recreational pursuits of bicyclists and pedestrians.
Sumter Chain Gang Bicycle Club
The Sumter region has a bicycling club called the Sumter Chain Gang Bicycle Club that organizes recreational group rides.
The Chain Gang also built and maintains a bike trail in Manchester State Forest. The club organizes group rides multiple times a week at varying levels of difficulty. In addition, the group maps their rides using STRAVA to track their distance and difficulty. The club also sponsors a series of races on the Killer Three loop each year in the Manchester State Forest.
Other Programs
Other formal programs help people of all ages recognize the benefits of bicycling and walking while equipping them with the necessary skills and knowledge to make the most of their experiences.
Safe Routes to School/Transportation Alternatives Program
Federal transportation legislation in 2005 introduced the Safe Routes to School program, dedicating funding for bicycle and pedestrian travel around schools. Beginning with the Moving Ahead for Progress in the 21st Century (MAP-21) Act, and continuing with the most recent Fixing America’s Surface Transportation (FAST) Act, safe routes to school funding has been folded in to the Transportation Alternatives Program. This funding source allows safe route to school projects to compete for funds alongside other transportation enhancements programs and recreational trails.
League Cycling Instructor
SCAL helps coordinate local participation in the League Cycling Instructor program. LCI is a national certification administered by the League of American Bicyclists. Certified instructors are better equipped to teach bicycle education to children and adults. The two-day course is held at various locations throughout the nation. For more information, visit www.active-living.org or call 864-598-9638.
National Trails Day
National Trails Day is an annual event initiated in 1993 by the American Hiking Society to increase awareness of community trails and coordinate maintenance and construction activities. Events occur nationwide, with the goal of improving thousands of miles of trails. SCAL and the Sumter County Recreation and Parks Department have sponsored events associated with National Trails Day in the past. These local activities have previously included a bike ride and fitness walk.
SCAL Signed Pedestrian Route ( Source: SC Department of Health and Environmental Control)
Sumter Community Bike Ride

6-11 Bicycle and Pedestrian Element | Final Report | November 2018
2045 Long Range Transportation Plan
Recommendations As described in Chapter 2, local officials must consider how projects and programs support a spectrum of planning factors. The recommended bicycle and pedestrian projects, programs, and initiatives that follow address these factors:
▪ Support economic vitality
▪ Increase safety and security of the transportation system
▪ Increase accessibility and mobility of people
▪ Protect and enhance the environment
▪ Foster connectivity across and between modes
▪ Emphasize preservation of the existing transportation system
▪ Infrastructure safety improvements, such as pedestrian skywalk
The comprehensive package of projects and programs recommended for Sumter rely on the “Four E’s of Bicycle and Pedestrian Planning.” Addressing these four interrelated components helps create a transportation network that balances the needs of bicyclists, pedestrians, and motorists.
Engineering
Engineering refers to the network of pathways that must be planned, designed, and constructed. A well-planned bicycle and pedestrian system can enhance user safety and enjoyment and may increase the attraction of each mode.
Education
Once the pathways are in place, new and experienced cyclists and pedestrians must be made aware of their locations and the destinations that can be reached by using them. Bicyclists, pedestrians, and motorists must be educated on the “rules of the road” to ensure everyone’s safety while operating on and adjacent to the bicycle and pedestrian facilities.
Encouragement
People need to be encouraged to bicycle and walk. Encouragement should become easier as the network of pathways makes the SUATS area more bicycle- and pedestrian-friendly. Encouragement becomes more critical as these facilities are constructed to justify their investment.
Enforcement
To ensure the safety of all users and the long-term sustainability of the bicycle and pedestrian system, the formal and informal “rules of the road” must be heeded by all.
The recommendations that follow balance the need for improved facilities with programs designed to educate users in the safe use of these facilities, encourage the active use of facilities, and enforce the rules of the road.
Facility Recommendations
Sidewalks are necessary elements in urban areas that have higher land use densities and more pedestrian activity. Sidewalks downtown and in activity centers should be wide enough to provide at least a 5-foot-wide clear width for walking, plus a furniture zone next to the street (for benches, waste receptacles, poles, street trees, and newspaper racks). Consideration should also be given to an edge zone next to buildings. This would allow space for plants and people to stand while window-shopping, or café tables if adjacent business owners want to offer
sidewalk service to their customers. The minimum sidewalk width in a downtown retail area should be 12 feet.
In other areas, a network of sidewalks, multi-use paths, and trails should serve pedestrians. In general, sidewalk widths should be a minimum of 5 feet in residential neighborhoods with at least a 5-foot-wide buffer to the travelway. Sidewalks adjacent to the street without a buffer should be discouraged because of the discomfort it creates for pedestrians.
In the May Highway Design Manual, SCDOT recognized the need for sidewalks in both urban and rural areas where pedestrians are present:
Generally, sidewalks are an integral part of city streets. For suburban residential areas, the construction of sidewalks is often deferred. However, sidewalks in rural and suburban areas are still often justified at points of community development such as schools, local businesses, shopping centers and industrial plants that result in pedestrian concentrations along the highway. If pedestrian activity is anticipated, include sidewalks as part of the construction.
Bike facilities are no different. On-street facilities such as bicycle lanes, paved shoulders, and wide curb lanes should be carefully located depending upon the intended character of the street and anticipated experience level of cyclists. These facilities should be supplemented with multi-use paths where appropriate.
The construction of on-street bicycle facilities and sidewalks can occur as stand-alone enhancement projects or can be incorporated into public and private infrastructure projects. The second option may be more time- and cost-effective. Infrastructure projects include roadway widening, regular street maintenance, utility work, and new road construction. Adopted City and County policies should require that these projects provide new bicycle and pedestrian facilities.
Programs should educate bicyclists on the “rules of the road”
Wide sidewalk in Downtown Sumter Example of caf é tables in edge zone next to buildings

6-12 Bicycle and Pedestrian Element | Final Report | November 2018
2045 Long Range Transportation Plan
Connectivity should be an integral part in all residential and commercial developments. Where connections for motor vehicles are not provided, multi-use paths can provide connections within and shortcuts through neighborhoods (i.e. connecting two cul-de-sac streets). At a minimum, local policies also should require sidewalks in new residential developments.
Many of the recommendations presented in this chapter to enhance the bicycle and pedestrian network could be implemented by the private sector during the land development process. In addition to requiring these facilities, adopted City and County policies should specify the private sector’s role in financing and/or constructing these projects. For example, the City of Jacksonville, Florida requires new subdivision streets to include bicycle facilities that meet city design standards that are laid out in their Land Development Procedures Manual.
On-Street Bicycle
Facilities
Bicycle Lanes
While only one bicycle lane is proposed, the new bicycle lane on Lynam Road will connect the two existing bicycle facilities located along Loring Mill Road and on McCrays Mill Road.
The paved and marked bicycle lane of 2.12 miles along Alice Drive connects Wesmark Boulevard on the south and Camden Highway on the north and provides bicyclists with a designated path along the same road with hundreds of motorists driving by. These facilities, along with the other types listed below, can be found in Figure 6.2
Wide Outside Lanes
The recommended wide outside lanes provide extra room for bicyclists and motorists without having to exclusively dedicate pavement to bicyclists. The recommendations help complete the bicycle network by connecting to other existing and recommended facilities. Priority locations for wide outside lanes include:
▪ Wise Drive between Loring Mill Road and the Cypress Trail
▪ Red Bay Road between the signed routes proposed for South Main Street and Boulevard Road
Paved Shoulders
Paved shoulders are recommended within the city limits and along key routes in unincorporated portions of Sumter County. Within the city, a paved shoulder on Stadium Drive will connect the existing and recommended facilities at McCrays Mill Road to the recommended extension of the Cypress Trail. A paved shoulder on Wesmark Boulevard will connect the recommended signed route on Wilson Hall Road to the recommended wide outside lane on Alice Drive.
Beyond the city limits, recommended paved shoulders are coordinated to meet the needs of bicyclists and the freight community. In addition to providing extra room for bicyclists, paved shoulders in rural areas help prolong the life of pavement under the stress of truck traffic.
Paved shoulders are recommended along a route that extends from Patriot Highway (SC 441) east of Sumter to US 15 south of the city. This corridor utilizes several roadways, including Eagle Road, Cane Savannah Road, St. Pauls Church Road, Cains Mill Road, and Clipper Road and provides key connections to other proposed facilities on Wedgefield Road, McCrays Mill Road, and Pinewood Road.
Additional candidates for paved shoulders include:
▪ Brewington Road from Thomas Sumter Highway (US 521) north of
Sumter to US 378 east of the SUATS boundary
▪ Jefferson Road from Camden Highway (US 521) and Queen Chapel
Road
▪ McCrays Mill Road from St. Pauls Church Road to Stadium Road
Signed Routes
As mentioned earlier in this chapter, signed routes are an integral part of the recommended bicycle network. These inexpensive facilities guide riders to bicycle-friendly roads. For that reason, the roadways were judged based on traffic conditions and the geometry of the road. The signed routes shown in Figure 6.2 create a route system that promotes loop rides in which riders start and begin at the same point. Other bicyclists
will benefit from the increased motorist attention to them as they move from one facility type to another.
Sidewalks
In the public questionnaire, the top priority identified for improvements in the Sumter region was walkable neighborhoods and commercial centers. The recommended sidewalks shown in Figures 6.3A and 6.3B provide key connections between existing sidewalks and high pedestrian areas.
Many of these recommended sidewalks are focused on schools and high traffic public areas currently not connected by sidewalks. These include Palmetto Park, USC at Sumter, Central Carolina Technical College, Willow Drive Elementary, Alice Drive Elementary and Middle schools, and Sumter High School. Sidewalk and crossing improvements for Alice Drive Elementary are currently being planned for implementation.
A bicycle lane on Lynam Road will connect with this existing bicycle lane on McCrays Mill Road
Recommended corridors for paved shoulders will connect Patriot Highway to US 15

6-13 Bicycle and Pedestrian Element | Final Report | November 2018
2045 Long Range Transportation Plan
Multi-Use Paths
Multi-use paths can accommodate bicyclists and pedestrians while providing a high-quality experience protected from traffic.
Shot Pouch Greenway
The 2007 LRTP stated “The existing Cypress Trail and multi-use path near the YMCA should be supplemented with improved connections to the existing and proposed on-street bicycle facilities and sidewalks.” In 2011 the Planning Department produced a master plan for Shot Pouch Creek, including a greenway proposal and a plan for introducing “Nodes”. Nodes are the focal points where recreational and business activities interact, such as an ice-cream shop that sells to walkers and bikers at the crossing point of the business district and the trail path. The plan also includes concepts for new recreational amenities that would draw interest to portions of the Greenway, such as a canoe and kayak center, and a fishing spot. The Shot Pouch Greenway, when complete, will connect the city like a vertical spine, starting at Dillon Park, crossing the 378 Bypass, Broad Street, Guignard Drive, Liberty Street and Swan Lake to end at McCray’s Mill Road. This project is currently in design and is planned for construction in 2019/2020.
Future multi-use path construction could benefit from existing right-of-way available from several abandoned rail lines in the region. Portions of these lines are being used currently as components of two existing bicycle trails.
A portion of the Cypress Trail will replace worn paths and utilize the underpass of an abandoned rail corridor.
Proposed sidewalks should be wide with minimal obstacles and buf fered f rom traffic.
Part of the newly constructed sidewalk that connects Bates Middle School with the surrounding neighborhood.
The completed Cypress Trail will connect homes and businesses with activity centers such as the YMCA.

6-14 Bicycle and Pedestrian Element | Final Report | November 2018
2045 Long Range Transportation Plan

6-15 Bicycle and Pedestrian Element | Final Report | November 2018
2045 Long Range Transportation Plan

CHAPTER 6 — BICYCLE AND PEDESTRIAN ELEMENT
2045 Long Range Transportation Plan
6-16 Bicycle and Pedestrian Element | Final Report | November 2018

6-17 Bicycle and Pedestrian Element | Final Report | November 2018
2045 Long Range Transportation Plan
Ancillary Facilities
In order to form a complete system, the recommended on-street facilities, sidewalks, and multi-use paths need to be supplemented with ancillary facilities. These facilities are often low-cost measures designed to enhance the functionality and safety of the bicycle and pedestrian network. Ancillary facilities include physical components of education, encouragement, and enforcement programs recommended later in this chapter.
Traffic Calming
The importance of traffic calming increases as motorists find short cuts around congested roads and intersections. Even the best planned street networks fall prey to unwanted cut-through and speeding traffic. Traffic calming includes a variety of tools to slow speeds, reduce cut-through traffic, and improve the appearance of the street while increasing safety for pedestrians, bicyclists, and vehicles.
Best practices for traffic calming are widely published, but the best programs include specific measures and general methods tailored to local travel patterns and citizen expectations. As high speeds and changing travel habits continue to threaten bicyclists and pedestrians, the City of Sumter and Sumter County are encouraged to develop traffic calming plans for the most unsafe roadways.
The most effective traffic calming measures used by urban designers include:
▪ Street Trees and other landscaping
▪ “Road Diets” whereby the road is narrowed to accommodate bus stop areas, multi-use paths, bike lanes, etc. Narrowing the travel lane forces traffic to slow down and has been proven much more effective than speed limits and enforcement measures
▪ On-street parking, either parallel or angled
▪ Landscape medians in the center of the road, utilizing existing “suicide lanes” and providing refuge for pedestrians
▪ Pavement at pedestrian crossings that contrasts with the
surrounding street in color and texture, to act as a visual cue to drivers that this is a pedestrian crossing
▪ Tightening of turning radii at corners, to eliminate the
“racecourse” phenomenon, forcing drivers to slow down considerably before turning a corner
▪ Parking in the rear of the building and commercial building facades set close to the street to create a walkable, pedestrian scale environment near the street
▪ Reduce or eliminate the number of curb cuts for accessing a site
Signage and Mapping Projects
Comprehensive Route Systems
In order to maximize the use of the new and retrofitted facilities, users must know the location of routes, accessible destinations, connections to other routes, and provisions along the way. A route signage plan is recommended to include information on the direction and distance to destinations spaced so bicyclists receive periodic confirmation that they remain on the right route. Different types of facilities can benefit from comprehensive route systems, including multi-use paths, bike lanes, shoulders, and wide
outside curb lanes.
In addition to comprehensive route signing, informative maps of bicycle routes and pedestrian trails and pathways should be produced. Sumter County Active Lifestyles has taken the lead in signing local routes and distributing bicycle and pedestrian maps.
Share the Road Signing Initiative
“Share the Road” signs make motorists more aware of the presence of bicyclists on high-use roads with potentially hazardous conditions. These signs serve as important and cost-effective safety and education tools. South Carolina acknowledged the visibility and impact of these signs by issuing a “Share the Road” license plate. The additional funds received through the
sale of this
license plate go to the Palmetto Cycling Coalition, Inc. to promote bicycle safety and education
programs.
Shared Lane Symbol
The use of Shared Lane Symbols can reduce crashes but should be used in moderation. Also called a “sharrow,” this lane marking reduces crashes in which a parked motorist opens a car door into the path of cyclists and cuts down on the number of cyclists traveling in the wrong direction. The treatment should be limited to travel lanes adjacent to on-street parking or on roadways that complete a link in a bicycle route.
Raised sidewalk slows speeds and improves pedestrian saf ety (Source: www.pedbikeimages.org)
Example of a sharrow in Portland

6-18 Bicycle and Pedestrian Element | Final Report | November 2018
2045 Long Range Transportation Plan
Intersection Signage
Static and blank out signs reduce vehicular crashes with pedestrians. Static signs with messages such as “No Turn on Red When Pedestrians Present” or “Left Turning Vehicles Yield to Pedestrians” should be used only where problems have been documented and relatively constant pedestrian/bicycle use exists. Any overuse of the signs limits their effectiveness by diluting the ability of the sign to command the attention of motorists.
At locations where conflicts are not frequent enough to warrant a static sign, a blank out sign may be appropriate. These signs are activated when there is a potential conflict. Thus, if a pedestrian enters the crosswalk, the motorist will see a “Yield to Pedestrian” sign next to the permissive turn signal. The real-time aspect ensures the signs will be visible when needed and never relegated to visual clutter.
Bicycle Parking Facilities
Like motorists, bicyclists need a place to park their bicycles. It is recommended that bicycle parking be included near shopping areas, schools, and recreational areas as well as in downtown and near business frequented by bicycle riders.
A 2011 survey in Sumter discovered a total of forty-one bicycle racks located near libraries, parks, schools, and commercial, governmental, and industrial areas. See map Figure 6-4.
It is not enough to simply place a bike rack at a random location. The bike rack should be highly visible, preferably near store fronts or in high pedestrian use zones to reduce the threat of theft. If bicycles are parked after dark, the area should also be well lit. The necessary protection varies according to the purpose of the bicycle trip. For short trips, a U-shaped bicycle rack may be acceptable. For commuter trips, bike lockers or covered parking may be more appropriate. Finally, bicycle racks also provide an opportunity to enhance the character of an area when they reflect the community culture or character.
For additional information on bike rack designs, the Association of Pedestrian and Bicycle Professionals has produced a guidance document that covers rack design, rack placement, and specifics for appropriate layout of the rack area in dimensions and relation to the surrounding land uses.
In addition to bicycle parking facilities, benches, water fountains, public restrooms, and changing areas would be helpful near popular downtown locations and near major destination points such as shopping areas and schools.
Bicycle parking should vary for short-term and commuter parking Elementary School Bicycle Rack

6-19 Bicycle and Pedestrian Element | Final Report | November 2018
2045 Long Range Transportation Plan
Spot Improvement and Maintenance Programs
General Considerations
Regarding bicycle safety, several questions should be used to assess the maintenance of a roadway — Has debris collected in the bike lane? Are longitudinal cracks present? Are there longitudinal drainage grates? Are utility covers uneven with the roadway surface?
An answer of “yes” to any of these questions should result in roadway maintenance. All bicycle facilities, including trails and the right side of roadways, require additional effort to ensure acceptable maintenance. A more frequent maintenance cycle to address these defects should be provided for bicycle routes. Likewise, areas where excessive debris tends to build and bicyclists have limited refuge should be maintained even more frequently.
Traffic Signal Considerations
Traffic signal location, timing, and loops along bicycle facilities require extra attention. The MUTCD requires signal faces to be adjusted or separated for optimal visibility by bicyclists and for signal timing to consider the needs of bicyclists. Additional guidance for signal timing and loops is provided by AASHTO.
Roadway Symbol Buildup
Bike lane symbols, lane directional symbols, and crosswalks use thermoplastic markings. To prevent handling problems for bicyclists, the number of layers of thermoplastic should be limited to one. In addition to build-up, the slipperiness of thermoplastic and paints can cause problems. The texture of the treatment can be altered by adding sharp silica sand to the glass spheres during application.
Safety Railings along Bicycle Facilities
Bridge railing heights have been the subject of recent revisions to the AASHTO Bicycle Guide and ongoing debates among bicycle facility design professionals. The current guide states that railing heights should be at least 42 inches to prevent bicyclists who hit the railing from tipping over the top. However, the current AASHTO Bridge Specifications require a 54-inch railing. In practice, designers have been using the 54-inch railing when a structure is being built to the AASHTO specifications and a 42-inch railing along non-structural locations, such as when protecting bicyclists from embankments.
Transit Interface
The Santee-Wateree Regional Transportation Authority provides bike racks on all City buses (ADA buses, however, lack bicycle racks). These racks help eliminate barriers presented to those individuals who need their bicycles for supplemental transportation after getting off the bus. The result is a multimodal riding experience. This program should continue to expand and be coordinated with the installation of bike racks near popular bus stops and destinations.
Bicycle facilities should be coordinated with transit (Source: SWRTA)
McCrays Mill Road bike lane in need of maintenance

CHAPTER 6 — BICYCLE AND PEDESTRIAN ELEMENT
2045 Long Range Transportation Plan
6-20 Bicycle and Pedestrian Element | Final Report | November 2018

2045 Long Range Transportation Plan
6-21 Bicycle and Pedestrian Element | Final Report | November 2018
Bicycle Program Recommendations
The facility recommendations described above must be supplemented with coordinated education, enforcement, and encouragement programs. Some programs instruct and encourage bicyclists and pedestrians in the full and proper use of the non-motorized transportation network. Other programs ensure the safety of the system is upheld by enforcing rules and regulations.
Education Programs
Education programs can be initiated from a variety of sources. Local governments can host workshops and bike rodeos, law enforcement officers can launch school-based education programs, and local advocacy groups can distribute educational materials.
School-Based Safety Education
More than any other age group, school-age children need to be educated about bicycle and pedestrian safety. Education programs can be incorporated into local school curricula and tailored to specific age groups. Younger children could be taught pedestrian safety, while older students could receive hands-on bicycle safety lessons. The program can be a collaborative effort of the city and county, local law enforcement departments, and local advocacy groups.
Walkable Community Workshops
These interactive workshops bring a variety of experts and stakeholders to the table with residents to identify real-world problems and proactive solutions for their community. The workshops last several hours and include an educational presentation, walking audit, and strategy session. The key to Walkable Community Workshops are the walking audits in which a professional leads participants on a tour to identify problems and solutions.
Bike Rodeos
At bike rodeos, school-age children learn bicycling skills, rules, and safety tips in a fun, interactive environment. Bike rodeos are flexible in that they can be part of a larger safety education program, an independent program, or part of other fun group riding activities.
Public Outreach
Sumter County Active Lifestyles funded a series of paid safety advertisements on television and developed educational materials for distribution. These campaigns can be tailored to target any age group and can be directed at pedestrians, bicyclists, or motorists. Outreach efforts such as these should be encouraged.
Encouragement Programs
Encouragement programs are important regardless of age. The programs that follow include individual and city-wide endeavors.
Safe Routes to School
As discussed earlier in this chapter, Safe Routes to School is a national initiative supported by Transportation Alternatives Program funding that has encouraged many children to bike and walk to school through bicycle and pedestrian education. The city and county should partner with local schools and advocacy groups to leverage state and federal funding. More information on the program can be found at www.saferoutesinfotoschool.org.
Walk or Bicycle to School Day
In September 2004, the South Carolina legislature designated the first Wednesday of October as “Walk or Bicycle with Your Child to School Day.” These programs provide local schools a forum in which to promote walking and bicycling as a fun, healthy way for children to travel. At the same time, the programs allow users to identify necessary improvements to make walking or bicycling safer and easier.
(Source: www.pedbikeimages.org)

6-22 Bicycle and Pedestrian Element | Final Report | November 2018
2045 Long Range Transportation Plan
Bicycle Rideabout
At a bicycle rideabout, local citizens take part in a short 3- to 5-mile ride along bicycle-friendly roads and attend informational sessions about bicycle safety and ongoing projects in the community. The events should include local law enforcement officers to promote safety and local advocacy groups to recruit new members. A bicycle rideabout can be a stand-alone fun activity or part of a larger event. A rideabout is also a great way to kick off a new initiative or open a new facility.
Bicycle to Work Week
For adults, Bicycle to Work Week can serve as a week-long reminder that bicycling can be a good way to get to work. The success of Bicycle to Work Week often depends on local employers. Successful programs have included friendly competition between employers to see which can get the highest percentage of employees to ride bikes to work. Employers could also sponsor a raffle for employees that bike to work during the week to give away a new bicycle, helmet, or gift certificates to local bike shops.
Bicycle Mentor Program
This program matches experienced riders with those who want to learn more about commuting by bicycle. Volunteers from local riding clubs such as the Sumter Chain Gang Bicycle Club can organize and provide volunteers. The idea is to help a new rider find the best route to work and to educate him or her on how to ride in traffic, in the dark, or in poor weather.
Bicycle Friendly Community
A Bicycle Friendly Community is designated by the League of American Bicyclists (LAB) as a way to recognize communities that provide safe accommodations for bicyclists and encourages bicycling as a means of
transportation and recreation. Currently, six South Carolina municipalities have been named Bicycle Friendly Communities.
In Spring 2012 the City of Sumter applied for Bicycle Friendly Community (BFC) status with the League of American Bicyclists (LAB). The City did not achieve BFC status, however the LAB sent feedback for how the community could improve and possibly achieve BFC status in the future.
The following recommendations would boost BFC Status for the next application:
▪ Formally adopt a Complete
Streets policy and implementation strategy
▪ Create a position for a Bicycle / Pedestrian Program Manager,
▪ his/her job would include:
▪ Acquiring bike & pedestrian grants
▪ Facilitating bicycle parking amenities at popular destinations
▪ Coordinating with City personnel on maintenance issues
▪ Coordinating training opportunities, events such as bicycle races and ‘bike to work day’, education, workshops, Safe Routes to School projects and linkages to Manchester State Forest mountain biking facilities, the Palmetto Trail, etc.
▪ Working with SWRTA to ensure that buses and transit stops have bicycle amenities
▪ Measuring bicycle LOS at roads and intersections to help identify and prioritize projects
▪ Working with law enforcement to educate motorists and cyclists, and promote safer share the road policies
▪ Hosting seminars for league cycling instructors, bicycling skills classes, bike repair clinics, commuter classes, etc.
▪ Working with planning department to improve ordinances in city promoting bicycling
▪ Working with community groups to reach out to traditionally underserved portions of city
▪ Create a Bicycle Advisory Committee represented by the following members: Users (cyclists from the community), law enforcement, chamber of commerce, public health officials, planning department, SCDOT, school board, parks and recreation department, and SWRTA.
Enforcement Programs
South Carolina affords bicycles the same legal status as motor vehicles. As such, bicyclists have all the rights on the roadway as a motorist while being subject to the same rules, regulations, and responsibilities. Other laws are specific to bicyclists and include:
▪ Bicyclists must use a front lamp and rear reflector when riding at night
▪ Bicyclists traveling below the posted speed limit must ride in the
right-hand lane or as close as practicable to the right-hand curb or highway edge, except when passing another vehicle or preparing for a left turn
Rules and regulations such as these should be conveyed during education and encouragement initiatives. To ensure the safety of bicyclists, pedestrians, and motorists, education and encouragement programs must be supplemented with enforcement. Enforcement often falls into the hands of local and state law enforcement. The City and County of Sumter should partner with law enforcement to develop a coordinated bicycle and pedestrian enforcement campaign.
Bicyclists, pedestrians, and motorists contribute to unsafe roadways. Bicyclists often ignore traffic laws by running red lights and stops signs or by riding on the wrong side of the street. Many bicyclists riding at night do not have proper reflectors and lights. Pedestrians break the law by crossing streets between parked cars and at unmarked mid-block locations rather than at intersections. Motorists often pass too close to bicyclists or do not yield to turning bicyclists.
These unlawful and potential harmful habits must be broken to maintain a safe transportation network. Local authorities also should require safety helmets be worn by all bicyclists regardless of age on all public facilities. Police patrols, particularly those on bicycles, should be increased on local
Bicycle Rideabout

6-23 Bicycle and Pedestrian Element | Final Report | November 2018
2045 Long Range Transportation Plan
streets as well as off-street trails and parks. The programs identified here should accompany the increased enforcement campaign.
Bicycle Licensing/Registration Program
Bicycle licensing should be considered as a way to enforce bicycle safety and reduce losses to theft. A registered bicycle helps local authorities identify an unresponsive cyclist in the event of an accident and return to its owner a stolen bicycle.
Positive Reinforcement
Positive reinforcement can be a valuable way to encourage safe actions by bicyclists and pedestrians. Police departments across the nation have recognized and rewarded children operating their bicycle in a safe manner. The rewards can include coupons for free ice cream, pizza, or movie tickets, or for discounts at local bicycle shops. This program encourages the child to continue to act safely and encourages their peers to follow their example.
Bicyclist and Pedestrian Accident Statistics
In accordance with the South Carolina Department of Public Safety (SCDPS) accident data, a total of 5 fatalities occurred in 2014 (2 fatalities), 2015 (2 fatalities), 2016 (1 fatality). During these three years, a total of 67 incidents occurred in Sumter involving bicyclists, pedestrians, and motorists. (See Figure 6.5)
Of these 67 accidents, 27 were caused by the motorists. The graph above shows the 12 different primary reasons caused by motorists on bicyclists or pedestrian accidents. The highest number of accidents was caused by drivers failing to yield the right of way (ROW) to bicyclists or pedestrians.
However, accidents caused by the non-motorists (40 incidents) account for more than half of the total accidents. The greatest number of accidents caused by pedestrian/bicyclist is illegally laying on the path of the Road/ROW for use by vehicles only. The second highest cause of accidents is failing to yield the ROW, as reflected on the chart on the following page.
The majority of accidents occurred within the Sumter City limits, while only 8% took place outside of City limits. (See Figure 6.5) Near half of the City accidents occurred inside the neighborhood with a high percentage of the population with no access to a vehicle and also had a
high percentage of population living below the poverty level income. (See Figure 6.6) Nearly all the accidents occurred at intersections. This phenomenon is quite alarming. Three major high accidents within ¼ mile radius.
Apparently, the residents that live in these areas
rely heavily on bicycling or walking as their primary means of transportation.
Based upon field observations, the Staff found several common characteristics of infrastructure in some high accidents locations:
▪ No bicycle or pedestrian sign posted to
warn drivers
▪ Poor pavement conditions on roads with
potholes and uneven surfaces
▪ Lack of mid-block crossing markings on
S Washington St at Toumey Hospital for
across street parking lot access and at
Miller and Community Street in the
neighborhood of YMCA
▪ High volume of light commercial
vehicles in residential area without traffic
calming devices installed
▪ Untrimmed plants blocking sight
distance at stop sign at the corner
(Fulton Street and Brand St)
Conveying the proper way to operate on roadways and paths is basic to any pedestrian and bicycle safety education campaign. The following “rules of the road” provide a good foundation.
For Pedestrians
▪ Always walk on the sidewalk if one is available. If there isn't a sidewalk, walk facing traffic so that you can see cars coming and drivers can see you.
▪ Cross streets at intersections or marked mid-block crossings.
▪ Be sure to look left, then right, and then left again before crossing a street even if you have the right-of-way (a marked crosswalk, walk signal or green light for traffic in the direction you are going). Continue to look left and right as you cross to be sure cars aren't coming.
▪ Dress in light clothing if you are walking at night — cars may not be able to see you if you are wearing dark clothes.
▪ Obey the Walk/Don't Walk signals at intersections.
▪ Hold a child's hand when he or she is crossing the street.
▪ Obey pedestrian signs at construction zones.
For Bicyclists
▪ Always wear a properly fitting helmet.
▪ Be visible. If riding at night, use lights, reflectors, and bright clothing.
▪ Ride predictably and defensively. Use hand signals before turning.
▪ Follow the same laws that apply to motorists, obeying all traffic signals, signs, and lane markings.
▪ Always yield to pedestrians.
▪ Ride on the right side of the road with the flow of traffic, never against it.
▪ Avoid riding on sidewalks. If it is necessary to ride on a sidewalk, be aware of risks at intersections.
For Motorists
▪ Obey speed limits. Higher speeds result in greater injuries to cyclists and pedestrians.
▪ Obey signs, signals, and markings. Never run red lights.
▪ Yield to cyclists. Always look for bicyclists when turning.
▪ Pass cyclists with care. Slow down and provide enough space when passing.
▪ Do not honk your horn close to cyclists.
▪ Look for cyclists when opening car doors.
▪ Watch for children.
▪ Watch for bicyclists riding at night.

2045 Long Range Transportation Plan
6-24 Bicycle and Pedestrian Element | Final Report | November 2018

6-25 Bicycle and Pedestrian Element | Final Report | November 2018
2045 Long Range Transportation Plan

6-26 Bicycle and Pedestrian Element | Final Report | November 2018
2045 Long Range Transportation Plan
Bicycle & Sidewalk Recommendations
Based upon the findings listed above, SUATS staff made the following recommendations for implementation:
▪ Provide mid-block crossing to help mitigate high pedestrian
volumes, i.e. Toumey Hospital at Washington Street.
▪ Redesign signal lights timing to allow for extended pedestrian
crossings at intersections.
▪ Pave and designate bicycle lanes along W. Liberty Street,
Manning Avenue, S. Washington Street and Boulevard Road.
▪ Examine zoning and land use development ordinances for ways
to strengthen requirements for the provision of bike/ped
improvements associated with private development projects.
▪ Work with SCDOT on maintenance responsibility for new
bike/ped improvements in SCDOT right-of-way.
▪ Provide fixed bus route services to residential areas as
recommended in Chapter 7 (Transit Element).
▪ Educate cyclists to wear visible clothing when riding bicycles.
▪ Consider alternatives to efficiently and safely cross/traverse the
US 76/378 Bypass.
▪ Consider a City of Sumter focused Comprehensive Bicycle and
Pedestrian Plan.
Bicyclist
Proposed Bicycle Facilities Improvements Priority List: Figure 6.7 & Table 6.5 & 6.6
Pedestrian
Proposed Sidewalk Construction Priority List: Figure 6.8 & Table 6.7
Proposed Intersection & Midblock Pedestrian Improvements List: Figure 6.9 & Table 6.8A & B
0
1
2
3
4
5
6
7
8
9
10
Nu
mb
er o
f A
ccid
ents
Sumter Accidents Primarily Caused by Motorists2014-2016
0
2
4
6
8
10
12
14
Nu
mb
er o
f A
ccid
ents
Sumter Accidents Primarily Caused by Non-Motorists2014-2016

6-27 Bicycle and Pedestrian Element | Final Report | November 2018
2045 Long Range Transportation Plan

2045 Long Range Transportation Plan
6-28 Bicycle and Pedestrian Element | Final Report | November 2018
Table 6.5- Proposed Bicycle Facilities Improvement List
Location ID
Type of Improvement
Length (miles)
Location Termini Purpose/Needs Priority
A Signed Route 2.07 South Main St W Calhoun St to W Red Bay Rd Provide safe route for commuter and recreational bicyclists 1
B Signed Route 1.37 N Guignard Dr/Bultman Dr Wise Dr to W Calhoun St Provide safe route to school and parks for students, and recreational and commuter bicyclists 1
C Signed Route 2.45 Boulevard Rd, Timmons Rd, Hauser St E Liberty sty to E Red Bay Rd Provide safe route to school and parks for students, and recreational and commuter bicyclists 1
D Signed Route 3.30 Liberty St Pinewood Rd to Boulevard Rd Provide safe access for commuter and recreational bicyclists 1
E Signed Route 1.09 Guignard Dr W Calhoun Rd to McCrays Mill Rd Provide safe access for commuter and recreational bicyclists 1
F Signed Route 1.60 W Calhoun St W Liberty St to N Main St Provide safe access for commuter bicyclists to downtown employment centers 1
G Wide Outside Lane 1.57 Red Bay Rd S Main St to Boulevard Rd Provide commuter connection between Hwy Route 15 and Boulevard Rd for bicyclists 2
H Bike Lane 0.80 Lynam Rd Wedgefield Rd to McCrays Mill Rd Provide safe access for students and recreational bicyclists 2
I Signed Route 1.13 Keels Rd Wedgefield Rd to Loring Mill Rd Provide safe access for commuter and recreational bicyclists 2
J Signed Route 7.85 Wedgefield Rd Hwy 261 S to Loring Mill Rd Provide safe access for commuter and recreational bicyclists 2
K Paved Shoulder 2.11 McCrays Mill Rd St Pauls Church Rd to Meadowcroft Dr Provide safe access for commuter and recreational bicyclists 2
L Signed Route 4.22 Pinewood Rd Stadium Rd to S St Pauls Church Rd Provide safe access for commuter and recreational bicyclists 2
M Paved Shoulder 1.60 Stadium Rd McCrays Mill Rd to Kingsbury Rd Provide safe access for students, and commuter and recreational bicyclists 2
N Paved Shoulder 1.35 Kingsbury Rd Stadium Rd to Decatur St Provide safe access for students, and commuter and recreational bicyclists 2
O Paved Shoulder 0.82 W Wesmark Blvd Wilson Hall Rd to Alice Dr Provide alternative transportation mode connection between commercial and residential areas 2
P Signed Route 1.27 Wilson Hall Rd W Wesmark Blvd to Wise Dr Provide safe access for student bicyclists 2
Q Signed Route 8.55 Thomas Sumter Hwy Peach Orchard Rd to Alice Dr Provide safe access for commuter and recreational bicyclists 2
R Wide Outside Lane 1.37 Alice Dr Wise Dr to Liberty St Provide safe access for students, and commuter and recreational bicyclists 2
S Sidepath 1.81 Loring Mill Rd Wise Dr to Broad St Provide safe route for commuter and recreational bicyclists 2
T Paved Shoulder 15.44 Brewington Rd Thomas Sumter Hwy to Myrtle Beach Hwy Provide safe access for commuter and recreational bicyclists 3
U Signed Route 2.05 Deschamps Rd Patriot Pkwy to Wedgefield Rd Provide safe access for commuter and recreational bicyclists 3
V Signed Route 3.85 Patriot Pkwy Broad St to Lisbon Dr Provide safe access for commuter and recreational bicyclists 3
W Paved Shoulder 7.01 Cane Savannah Rd/St Pauls Church Rd Patriot Pkwy to Pinewood Rd Provide safe access for students, and commuter and recreational bicyclists 3
X Paved Shoulder 4.97 Cains Mill Rd S St Pauls Church Rd to Hwy 15 S Provide safe access for commuter and recreational bicyclists 3
Y Signed Route 8.20 Pinewood Rd S St Pauls Church Rd to Hwy 261 S Provide safe access bicyclists connection for commuter and recreational bicyclists between the Town of Pinewood and Downtown Sumter
3
Z Signed Route 12.18 Hwy 261 S Wedgefield Rd to Pinewood Rd Provide safe access for commuter and recreational bicyclists 3
AA Signed Route 8.54 Black River Rd Peach Orchard Rd Cotton Acres Rd Camden Hwy to Queen Chapel Rd Provide safe access for commuter and recreational bicyclists 3
BB Signed Route 6.34 Peach Orchard Rd Broad St to Thomas Sumter Hwy Provide safe access for students, and commuter and recreational bicyclists 3
CC Paved Shoulder 3.89 Hwy 261 S Broad St to Wedgefield Rd Provide safe access for commuter and recreational bicyclists 3
DD Signed Route 9.20 Queens Chapel Rd Thomas Sumter Hwy to Jefferson Rd Provide safe access for commuter and recreational bicyclists 3
EE Paved Shoulder 2.44 Jefferson Rd Camden Hwy to Queen Chapel Rd Provide safe access for commuter and recreational bicyclists 3

6-29 Bicycle and Pedestrian Element | Final Report | November 2018
2045 Long Range Transportation Plan
Table 6.6 -Proposed Trail Improvement List
Location ID
Type of Improvement
Length (miles)
Location Termini Purpose/Needs Priority
GG Paved Trail 0.55 North Shot Pouch Creek Broad St to Hillard Dr Provide recreational opportunities and connect Dillon Park and existing Cypress Trail with existing Shot Pouch Creek Trail 1
HH Paved Trail 0.19 South Shot Pouch Creek N Guignard Dr to Haynsworth St Provide recreational opportunities and connect existing YMCA Trail with proposed North Swan Lake Trail 1
II Paved Trail 0.53 North Swan Lake Haynsworth St to W Liberty St Provide recreational opportunities and connect proposed South Shot Pouch Creek Trail with proposed South Swan Lake Trail 1
JJ Paved Trail 0.72 South Swan Lake W Liberty St to W Oakland Ave Provide recreational opportunities and connect proposed North Swan Lake Trail with proposed Green Swamp Trail 1
KK Paved Trail 2.87 Lafayette Dr and N Main St James St to E Liberty St Provide recreational opportunities and connect existing Cypress Trail with proposed Industrial Blvd Trail 2
LL Mixed Surface Trail 1.99 Green Swamp W Oakland Ave to Kingsbury Dr Provide recreational opportunities and connect proposed South Swan Lake Trail with proposed Kingsbury Rd Trail 2
MM Paved Trail 1.31 Industrial Blvd E Liberty St to Timmons St Provide recreational opportunities and connect proposed Lafayette Dr Trail with proposed Turkey Creek Trail 2
NN Mixed Surface Trail 3.17 Turkey Creek Hauser St to Hwy 521 South Provide recreational opportunities and connect proposed Industrial Blvd Trail with proposed Pocalla Creek Trail 3
OO Mixed Surface Trail 2.88 Pocalla Creek Hwy 521 South to Hwy 15 South Provide recreational opportunities and connect proposed Turkey Creek Trail with proposed Hwy 15 South Trail 3
PP Mixed Surface Trail 2.36 Hwy 15 South Clipper Rd to S Guignard Pkwy Provide recreational opportunities and connect proposed Pocalla Creek Trail with proposed Kingsbury Rd Trail 3
QQ Mixed Surface Trail 0.71 Kingsbury Rd and Guignard Dr Pocalla Rd to Kingsbury Dr Provide recreational opportunities and connect proposed Hwy 15 South Trail with proposed Swamp Trail 3

2045 Long Range Transportation Plan
6-30 Bicycle and Pedestrian Element | Final Report | November 2018

2045 Long Range Transportation Plan
6-31 Bicycle and Pedestrian Element | Final Report | November 2018
Table 6.7- Proposed Sidewalk Improvement List
Location ID
Length (miles)
Location Termini Purpose/Needs Priority
A 0.09 S Main St Bartlette St to Oakland Ave Phase 1 of project B (Manning Ave Southgate Project) 1
B 1.18 Manning Ave Watkins St to Pocalla Rd/Lafayette Dr Provide sidewalk connectivity to Southgate project 1
C 0.13 Boulevard Rd E Liberty St to Center St Connect existing sidewalks along Boulevard Rd and E Liberty St to provide access to downtown 1
D 0.80 Lyman Rd Wedgefield Rd to McCrays Mill Rd Link residential neighborhoods and existing sidewalk to Loring Mill Rd with Sumter High School on McCrays Mill Rd 1
E 0.85 E Charlotte Ave N Lafayette Dr to Oswego Hwy Link residential neighborhoods to Crosswell Elementary School and Crosswell Dr Park 1
F 0.59 Theatre Dr Wise Dr to Guignard Dr Connect Sumter Tennis Center, CCTC, USC Sumter, and Alice Dr Elementary and Middle schools 2
G 0.26 N Guignard Dr Wise Dr to Theatre Dr Sidewalk to connect residential areas and proposed sidewalks (K) and € with Sumter Tennis Center, USC Sumter, and Alice Dr Elementary and Middle schools
2
H 0.34 Winn St Masoncroft Dr to W Calhoun St Connect existing sidewalks from Downtown/Historic District to Willow Dr Elementary and YMCA 2
I 0.17 E Newberry Ave Manning Ave to S Lafayette Dr Addition to South Gateway Improvement Project to connect residential areas with Wilder Elementary and Bates Middle School 2
J 0.18 Wise Dr Broad St to Bultman Dr Connect Broad St with proposed sidewalks (K), €, (F), and (L) that would service the Sumter Tennis Center, Alice Dr schools, and CCTC and USC Sumter
2
K 2.17 Peach Orchard Rd Edgehill Rd to Broad St Connect Residential to Retail: Supermarket, Restaurant, and Oakland Elementary School 2
L 0.47 Wise Dr Theatre Dr to Bultman Dr Sidewalk to connect residential areas with Sumter Tennis Center, CCTC, USC Sumter, and Alice Dr Elementary and Middle schools 3
M 0.30 University Dr Theatre Dr to Miller Rd Connect the Sumter Tennis Center, CCTC, USC Sumter, and Alice Dr Elementary and Middle schools 3
N 0.09 Bynum St Miller Rd to Willow Dr Connect existing sidewalk on Miller Rd and Willow Dr at YMCA and Willow Dr Elementary 3
O 0.63 N Wise Dr S Pike W to Broad St Connect proposed sidewalk (I) on Wise Dr to Dillon Park and Cypress Trail 3
P 1.96 Kolb Rd McCrays Mill Rd to Pinewood Rd Connect residential neighborhoods to Sumter High School and Career Center 3
Q 2.00 Pinewood Rd Shallowford Rd to Kolb Rd Connect residential neighborhoods to Sumter High School and Career Center 3
R 3.84 Patriot Rd Lisbon Dr to Broad St Supplement to Patriot Park biking and walking facilities 3
S 1.44 Alice Dr US-521 to Wise Dr Extend the Alice Dr sidewalk along the proposed extension to Wise Dr 3
T 1.61 Terry Rd/Mason Rd
Carter Rd to US-521 Add sidewalks to the proposed road realignment of Terry Rd and Mason Rd 3

2045 Long Range Transportation Plan
6-32 Bicycle and Pedestrian Element | Final Report | November 2018

2045 Long Range Transportation Plan
6-33 Bicycle and Pedestrian Element | Final Report | November 2018
Table 6.8A- Proposed Intersection Improvement List
Location ID
Type of Improvement Location Purpose/Needs Priority
I-1 Crosswalk Refuge Manning Ave and Newberry Ave Provide safe crosswalk access to elementary and middle schools from residential neighborhoods 1
I-2 Crosswalk on All Four Corners N Guignard Dr and Miller Rd Crosswalk markings to increase driver alertness and indicate pedestrian presence at intersection 1
I-3 Relocate Pedestrian Crosswalk Warning Signs N and S N Guignard Dr and Bultman Dr Relocation of pedestrian crosswalk warning signs will provide better advance warning for drivers 1
I-4 Crosswalk on All Four Corners N Main St and College St Provide safe access on all four corners of intersection with crosswalk markings 2
I-5 Crosswalk on All Four Corners Manning Ave and Fulton St Provide safe access on all four corners of intersection with crosswalk markings 2
I-6 Crosswalk Maintenance Upkeep S Lafayette Dr and Fulton St Repaint crosswalk markings for better visibility of pedestrian area 2
I-7 Crosswalk Maintenance Upkeep W Liberty Dr and Crosswell Dr Repaint crosswalk markings for better visibility of pedestrian area 2
Table 6.8B-Proposed Midblock Improvement List
Location ID
Type of Improvement Location Purpose/Needs Priority
M-1 Miller Rd and Us 76/378 Pedestrian Skywalk Across US-76/378 at Tupelo Ln and Carolina Ave Provide safe access for pedestrian and bicycles over US-76/378 between the N and S Pike and reduce pedestrian fatality accidents 1
M-2 Midblock crosswalk with marked pavement Between W Calhoun St and W Liberty St Provide safe access between Toumey unpaved employee parking lot and Toumey Hospital grounds 1
M-3 Midblock crosswalk with marked pavement Between Community St and Palmer Dr Provide connectivity safety between existing YMCA Trail and proposed N Swan Lake trail 1
M-4 Midblock crosswalk with marked pavement and refuge Between Community St and Newman St Provide safe access between Shot Pouch Creek and proposed South Dillon Park Trail 2
M-5 Midblock crosswalk with marked pavement Between Bland Ave and Swan Lake Dr Supplement skywalk access and provide safe road level access between North and South Swan Lake Park 2
M-6 Improved crosswalk with refuge Between Bynam St and Community St Improve pedestrian safety conditions between Shot Pouch Creek Trail and YMCA Trail 3
M-7 Midblock crosswalk with marked pavement Between Briarwood Dr and marigold St Provide safe access between the proposed South Swan Lake Trail and the proposed Fire Training Grounds Trail 3
M-8 Midblock crosswalk with marked pavement and refuge Between National St and Black St Provide safe access between the proposed Fire Training Grounds Trail and the proposed trail between McCrays Mill Rd and Kingsbury Dr 3
M-9 Midblock crosswalk with marked pavement Between S Pike W and Adrena Dr Provide safe access between residential and commercial properties 3

6-34 Bicycle and Pedestrian Element | Final Report | November 2018
2045 Long Range Transportation Plan
This page intentionally left blank.

CHAPTER 7 — TRANSIT ELEMENT
2045 Long Range Transportation Plan
7-1 Transit Element | Final Report | November 2018
Introduction For some residents in Sumter, taking transit is a necessity rather than a choice. Residents without access to private automobiles depend on transit for access to jobs, medical care, services, and many other aspects of daily life. As the region grows and development patterns shift, convenient and reliable transit service becomes more important, and in some ways, more difficult. This Transit Element identifies local issues related to transit as well as strategies aimed to enhance access and mobility for all residents of the region, particularly the one-third who cannot drive—children and the elderly, persons with disabilities, and those who cannot afford a car.
One of the goals of the SUATS Long-Range Transportation Plan is to provide viable transportation alternatives to decrease dependence on the automobile, in turn decreasing the demand on the existing transportation system. One way to encourage transit use is to develop around each stop a safe, comfortable customer delivery system complete with attractive and convenient amenities. And because most regular transit users walk or bike to and from the stop, a network of sidewalks, safe street crossings, and lighting should complement the amenities provided at the stop.
The efficiency of transit also depends on an interconnected system of roads and highways suitable for bus traffic and bicycle and pedestrian features that provide access to transit stops. Transit cannot be considered in isolation, and the strategies presented in this chapter support improvements to the larger transportation system.
Transit and Urban Form
Based on community discussions, many people agree that they would use transit if service was fast, frequent, dependable, and easy to use. While such criteria require a complete system of roads, sidewalks, and bikeways, transit also must provide connections to the places people need to go at a time when they need to get there. As a result, transit must be introduced or expanded within a framework of transit-supportive urban form. Two development types that maximize potential transit ridership include transit-oriented development and transit-ready development.
Transit-oriented developments (TODs) provide a mixture of residential and commercial uses focused around a transit station or bus stop. The transit stop is surrounded by relatively high density development that spreads out as you move away from the center. The scale of a TOD
generally is limited to ¼- to ½-mile in diameter to establish the walkability of the neighborhood. The design of such places maximizes access to transit and support walking and biking between destinations.
In locations that lack existing transit facilities or demand to support a TOD, regulations and guidelines that support transit-ready development should be enforced. Transit-ready development describes the coordinated design of new neighborhoods and activity centers that supports future transit expansion. Like TODs, transit-ready developments include a mixture of land uses, pedestrian-friendly design, appropriate locations and/or routes for transit, an interconnected network of internal streets, and appropriate densities supportive of future transit use.
While transit-oriented and transit-ready developments represent ideal urban form for transit destinations, many existing single-use locations in Sumter are viable long-term facilities. The mall, grocery stores, and business parks are just a few examples of vital destinations for many Sumter residents, and while their urban design may not be ideal for transit, they are locations where access to public transportation continues to be an important priority.
The population in the region is projected to grow substantially to 131,041 in 2040, from 107,456 (2010). As population increases, the demand for public transportation will also increase. This chapter reviews the current transportation services and recommends improvements of such to meet the projected increasing demand.
History of Transit in Sumter
The transportation options available to Sumter residents are constantly evolving. The National Interstate and Highway Defense Act of 1956 brought increased access to the area, and as a result, the region is now encircled by three Interstate Highways: I-95, I-20, and I-26. In 1973, the state legislature passed a series of laws (South Carolina Code of Laws Section 58-225-30) in response to a need for public transportation throughout South Carolina. The effects of those laws in Sumter became evident in 1978, when the Santee Wateree Regional Transportation Authority (SWRTA) was created following the closure of the Sumter Bus Company. The new transportation authority served six counties of the Santee Lynches region including Sumter, Clarendon, Kershaw, Lee, Calhoun, and Orangeburg.
Since then, SWRTA has expanded the type and geographic reach of its services. Today, the footprint of SWRTA covers more than 5,000 square miles in six counties with a variety of services such as paratransit, commuter, and fixed-route services. As a result, SWRTA is the second largest small urban and rural public transportation system in South Carolina.
Existing Transit Services Public transportation services are provided by the Santee Wateree Regional Transportation Authority. SWRTA provides fixed-route service in the City of Sumter and commuter and paratransit (dial-a-ride) services in the surrounding region. In addition to SWRTA, several private transportation and taxicab companies provide local transportation services, and Southeastern Stages (Greyhound) provides intercity bus service. In addition to these existing services, several groups actively advocate for the mobility needs of the general public throughout the region. The Regional Transit Council, which formed in 2004, includes members from public and private transportation providers, human service agencies, faith-based and community organizations, and advocates. The Council seeks to enhance the freedom of mobility by promoting transit services, assisting with transit planning, and pursuing funds for improved services.
Santee Wateree Regional Transportation
Authority
The Santee Wateree Regional Transportation Authority (SWRTA) offers fixed route and ADA service in the City of Sumter. According to Lottie Jones, the Executive Director of SWRTA, “through trained and empowered employees, SWRTA will provide customers with superb, high-quality transportation services, while connecting them to the workplace, goods, and services. SWRTA will continuously improve on providing mobility options, in the safest responsible way, while enriching lives of the citizens we serve.”

7-2 Transit Element | Final Report | November 2018
2045 Long Range Transportation Plan
Fixed Route Service
In May 2012, SWRTA launched new fixed bus route schedules with one hour and two hour headways on its bus routes of the following except Route 8 (Vocational Rehab on North Main):
• Route 1 (West Liberty) – 1-hour headway
• Route 5 (South Main) – 1-hour headway
• Route 9 (Broad Street) – 1-hour headway
• Route 4 (North Main) – 2-hour headway
• Route 6 (East Liberty) – 2-hour headway
• Route 7 (Shaw Shuttle) – 2-hour headway
The seven fixed route services in the City of Sumter consist of a “hub and spoke” layout with seven routes (or spokes) originating from a hub located at the transfer point Telephone Street at the Transit Center. The hub and spoke layout of the SWRTA fixed-route system emphasizes trips originating from or destined to the downtown area. Table 7.1 below lists each route with operating hours and frequency. The routes are shown in Figure 7.1.
Table 7.1- Fixed Route Operations in Sumter
Operating Hours Total Operation
Route Name Earliest Latest Hours
1 West Liberty 7:30am 5:40pm 2.5 hrs
4 North Main 7:10am 5:10pm 3.6 hrs
5 South Main 7:00am 5:10pm 2.5 hrs
6 East Liberty 7:10am 5:10pm 3.9 hrs
7 Shaw Shuttle 6:10am 3:10pm 7.0 hrs
8 Vocational Rehab 8:10am 3:30pm 1.2 hrs
9 Broad Street 7:10am 5:10pm 8.6 hrs
Source: Santee Wateree Regional Transportation Authority
Source: Santee Wateree Regional Transportation Authority Route Map

7-3 Transit Element | Final Report | November 2018
2045 Long Range Transportation Plan
Paratransit (Dial-A-Ride) Service
For residents who meet certain requirements, paratransit service operates in the urban and rural areas of the county. The demand response, or dial-a-ride, service is provided on a contracted rate basis for Medicaid, Department of Social Services, SC Vocational Rehabilitation, Workforce Investment program under the Santee-Lynches Regional Council of Governments, and others. The service also provides county residents the opportunity to ride any county route on a space available basis as a cash client. ADA passengers living within ¾-mile of fixed bus routes can use the service for $2.00 each way. Non-fixed bus route passenger within a 10-mile radius may ride for $3.00; $5.00 from 11-20 miles; $7.00 from 21 to 30 miles. All paratransit vans are ADA accessible.
Carpool and Vanpool Services
SWRTA organizes several vanpool services to link residents of Sumter with employment centers in Columbia and Camden.
Often carpool and vanpool involvement fails to reach its potential because potential participants are unable to find persons with similar commuting needs. A recent addition to www.SWRTA.com helps overcome this barrier by providing a web-based interface designed to match commuters with similar travel patterns.
Other Public Transportation Providers
General discussions of public transportation traditionally center on the services similar to those provided by SWRTA, namely fixed-route and paratransit. These transit services are important components of the larger public transportation network that also includes taxis and intercity bus travel.
Taxis
Several taxicab companies operate within the city limits of Sumter, including City Service Cab Company, Liberty Street Taxi, Northside Cab Service, Southside Cab Service, and Yellow Cab Company. These companies provide service based on drop-off, per-mile, and waiting time rates. The number of taxicabs in Sumter has no direct correlation to the level of anticipated ridership for transit. However, the presence of the companies does indicate a need within the Sumter population for a means of travel other than privately owned automobiles.
Intercity Bus Service
From its terminal at 129 S. Harvin Street in Sumter, Greyhound provides service to and from thousands of locations throughout North America, including 20 cities in South Carolina. Fares vary based on the trip’s distance and departure date.
In addition to the reduced price of advanced purchases, Greyhound offers a variety of discounts for military personnel and companion travel. Schedules for Greyhound service vary by day and time. Station and ticketing hours are Monday to Saturday 9:30 AM to 4 PM and 8:00 PM to 9:30 PM. More information is available at www.greyhound.com.
Southeastern Stages, an intercity bus service serving the Carolinas and Georgia, also operates out of the Greyhound station. More information is available at www.southeasternstages.com.
Regional Public Transportation
In addition to the services offered by public transportation providers in Sumter, many residents choose to drive to larger cities nearby to take advantage or their public transportation options. In particular, Sumter citizens travel to Columbia for air service and Camden for Amtrak service.
Public Involvement
The public expressed their thoughts regarding transit within the Sumter region via a series of public input opportunities including an online survey questionnaire, SUATS study team meetings, and public workshops.
Public Questionnaire
A 12-question online survey was posted on the City website and the public was invited to participate. Among the 12 questions, 3 questions (questions 2, 5, and 7) were related to public transit. Question 2 asked respondents that are employed to note what travel mode they use to commute to work. Based on survey results, only 1% of employed commuters take the bus to work.
Question 2: If you are employed, how do you commute to work? (check all that apply)
Despite a low percentage of commuter transit, improvements are still needed. The survey shows a public desire for infrastructure improvements that help to “increase transit service areas and frequency of bus services.” This was identified as the second highest priority in regard to fixing the region’s traffic conditions.
4%
1%2%
76%
0% 4%
14%
Walk
By bus
By bike
By car
By rideshare (e.g., Uber, Lyft, Zipcar)
I work from home
I do not work
6%5%
57%
9%
12%
12%
Construct more sidewalks
Designate more on street bike ways and
greenways
Improve condition of roadways and
intersections (e.g., resurfacing the road
pavements, signage, restripe the markings)Reduce the number of driveways in the
commercial corridors
Increase transit service areas and frequency
of bus services
Other (please specify)
Question 5: Based on your answer to the question above, in your opinion, which of the following is a top priority? (choose one)

7-4 Transit Element | Final Report | November 2018
2045 Long Range Transportation Plan
Personal use of vehicles for traveling is the most common form of transportation in Sumter. When asked in Question 7 to drill down into what types of facilities are needed when traveling without a personal vehicle, respondents were most interested in the provision of multi-use facilities, pedestrian facilities, and transit improvements, such as an increase in bus service area.
SUATS Planning Advisory Committee
On October 12, 2017, the SUATS study team, together with the consultant team, Kimley-Horn and Associates, formed the Planning Advisory Committee. The Planning Advisory Committee is composed of agency partners including SCDOT, FHWA, Santee Wateree RTA, Santee-Lynches COG, as well as both Sumter City and County Staff and elected officials.
In the meeting, SWRTA representatives stated that the agency was looking into restructuring bus routes to allow more county activity such as more rural to urban routes to Columbia or Florence.
Public Workshop #1
As discussed in Chapter 2, a public workshop was held on October 12, 2017. Maps of bus routes were displayed and opinions cards were handed out to attendees to solicit their suggestions for current transit system
improvements. Shown in the word cloud below, the public wants bus shelters, greater accessibility, more signage where riders actually live, and an expansion of the existing bus routes and operation hours (preferably having 24 hour service).
On-Board Survey
In the summer of 2010, Santee Lynches Council of Governments (SLCOG) assisted the Santee Wateree Regional Transportation Agency (SWRTA) to conduct a passenger survey on the grading of SWRTA services in Sumter. (See Santee Wateree Regional Transportation Authority Public Transportation Study, September 2010 prepared by SLCOG) The survey forms were distributed to passengers on buses and were collected before passengers got off. A total of 207 individuals responded to the survey. The survey questionnaire was composed of nine questions and printed in both English and Spanish. The number 1 question on the survey was “What grade would you give the Public Transportation services in Sumter?” A letter grade A to F was given for passengers to rate the RTA services. “A” is the best service and “F” is the failing performance. However, passengers were given the option to describe why a certain grade was given.
Following are the survey respondents/passengers’ reasons for giving a specific grade for SWRTA services:
• Grade A—Friendly drivers, safe, and very reliable, longer hours
needed on Friday and need Saturday services
• Grade B—Times are always switching, need more friendly
drivers, need weekend services and longer weekday services.
• Grade C—Cannot find the bus stops—they need to be marked,
bus needs to be on time, buses should operate consistently.
• Grade D—Only been riding for two days and do not know
where the bus stops are, and do not know when to catch the
bus.
• Grade F—Failure in bus services performance
Less than half of the survey respondents were totally satisfied with bus service performance. Respondents expected RTA to provide longer service hours on Friday and Saturday service.
24%
24%
12%
36%
5%Investing in pedestrian-specific
facilities (e.g., sidewalks and
crosswalks)
Investing in public transportation (e.g.,
increase bus service area)
Investing in bicycle-specific facilities
(e.g., bike lanes)
Investing in multi-use facilities (e.g.,
greenways and multi-use paths)
Blanks (skipped)
Question 7: Which of the following is the most important to you when traveling around the Sumter area without a personal vehicle?

7-5 Transit Element | Final Report | November 2018
2045 Long Range Transportation Plan
Financial Challenges SWRTA Faces (This section is an insert of the 2012 report: Executive Summary of Restructuring SWRTA Fixed Bus Routes Study in the City of Sumter, SC. The data referred to in this section may or may not necessarily reflect any data after March 2012)
Background
The Santee Wateree Regional Transportation Authority, commonly referred to as SWRTA, provides transit services in the Santee-Lynches region. The Santee-Lynches region covers the four counties of Clarendon, Kershaw, Lee, and Sumter. Additionally, SWRTA provides transit services for Calhoun and Orangeburg Counties. It operates approximately 46 vehicles to provide public transit and contract services to these areas.
In the urbanized area of Sumter, SWRTA operates 18 vehicles to provide public transit fixed bus routes, commuter services, complimentary ADA paratransit services, “call in”— demand response services, and transit services for special events such as the Iris Festival and Shaw Fest. Approximately 114,000 annual passenger trips were provided in FY2010-FY2011. Additionally, approximately 40,000 annual passenger trips were provided under various human transportation service contracts and a brokerage contract to provide non-emergency medical transportation (NEMT) for the South Carolina Department of Health and Human Services.
Currently, seven (7) fixed bus routes runs within the City of Sumter and one (1) fixed bus route runs between Sumter and Columbia, which serves commuters. The one-way fare for all fixed bus routes within the City is $1 for each passenger, including the Shaw Air Force Base route which charges $1 per passenger. Senior citizens (65 or above), handicapped, or Medicare cardholders pay half fare and children under six ride for free. Transfers between routes are free. However, starting in late 2010, free-fare Fridays were implemented for all City fixed bus routes so that passengers could ride for free within the City limits on Fridays.
In the early spring of 2011, SWRTA received a financial warning from the Santee Lynches Regional Development Corporation, subsidiary of SLCOG, after the Corporation analyzed SWRTA’s income and expenditure data.
Restructuring Fixed Bus Routes Study
In February 2012, the SWRTA requested the Planning Department of Sumter to assist in restructuring the City of Sumter fixed bus routes as a possible way to reduce operating costs. The staff, in cooperation with the staff of SLCOG, has conducted a preliminary study on all seven fixed bus routes. The findings and recommendations of this study are described below.
Study Methodology
The findings and recommendations of restructuring fixed bus routes are based upon extensive research of published data and field observations. After careful data analysis and discussions with the staff of SLCOG, the study’s focus centered on how to increase ridership on the fixed bus route services within the City of Sumter.
Published Data Collection Approach
The Staff collected and analyzed various variables of transit data from the following sources:
▪ Transit Data Report by SCDOT Fiscal Year 2010-2011
▪ Santee Wateree Regional Transportation Authority Public
Transportation Study, Sept 2010, by SLCOG
▪ SWRTA Business and Route Analysis by Profit Centers (Proforma: “As Is” Case) 12/31/2011 (cover 6-month period) data submitted by SWRTA (calculations by SLCOG)
▪ SWRTA Small Urban Fixed Route Trips (2001-2011 Fiscal Years and Includes Trips Through 1/31/12) submitted by SWRTA
Field Survey Approach
The Staff observed and identified the locations of the following potential passenger trip generators along all seven fixed city bus routes:
▪ Public Housing residential area
▪ Apartment complex
▪ Public schools
▪ Super markets
▪ Commercial strips (banks, restaurants, retail stores)
▪ Hospitals and clinics
▪ Low income and high density residential area
▪ Major employment /industry
▪ Social Facility such as Iris Garden, Opera House, Hope Centers etc.
Objective of the Study
The objectives of restructuring the City fixed bus routes Study are to:
▪ Increase ridership
▪ Reduce costs
▪ Discover underserved areas
▪ Improve visibility and awareness of transit services
▪ Enhance connectivity of bus services
One of the approaches to increase the ridership in the City is to serve the areas where there are high probabilities of using transit services. For example, car ownership is relatively low in low income and public housing residential areas. School buses do not pick up students within one mile radius of where schools are located. Blue collar workers need transportation for commuting to work places. Physical able retirees need to do grocery shopping in the nearby super market.

7-6 Transit Element | Final Report | November 2018
2045 Long Range Transportation Plan
Findings
Overall Transit System
In accordance with the SCDOT Transit Data Report, the Staff has compared the transit data of FY 2015 with FY 2016 and found that FY 2016 has increased in revenue by $56,743 and decreased in fare box recovery by 0.70%. (See Table 7.2 below) However, the ridership (the number of passenger trips) has decreased by 5,993, a significant drop from the annual passenger trips in in the previous update (16,076).
Table 7.2 – 2015 to 2016 Transit Comparison
Urban Service Area Only*
FY 2015 FY 2016 Trend Fleet size 11 11 No Change Annual Pass. Trips 106,792 100,799 -5,993 Annual Revenue Miles 252,140 254,547 2,407 Annual Vehicle Revenue Hours 14,321 14,312 -9 Annual Operating Revenue 808,235 864,978 56,743 Annual Operating Expenses 593,142 864,977 271,835 Cost per pass. Trip 5.55 8.58 3.03 Cost per vehicle Revenue Mile 2.35 3.40 1.05
Fare box Recovery Ratio 7.80% 7.10% decreased by
0.70%
*SWRTA provides both urbanized and non-urbanized service areas
The fleet size remained the same with 11; however, it is a substantial decrease from 18 in 2012. Furthermore, there was a significant increase in annual operating expenses – a difference of $271,835 between 2015 and 2016.
Table 7.3 compares SWRTA operations status between the previous update and the above information.
Table 7.3 – 2011 to 2016 Transit Comparison
Urban Service Area Only*
FY 2011 FY 2016 Trend Fleet size 18 11 -7 Annual Pass. Trips 153,726 100,799 -52,927 Annual Revenue Miles 366,435 254,547 -111,888 Annual Vehicle Revenue Hours 23,086 14,312 -8,774 Annual Operating Revenue 856,423 864,978 8,555 Annual Operating Expenses 1,144,162 864,977 -279,185 Cost per pass. Trip 7.44 8.58 1.14 Cost per vehicle Revenue Mile 3.12 3.40 0.28
Fare box Recovery Ratio 22.40% 7.10% decreased by
15.3%
*SWRTA provides both urbanized and non-urbanized service areas
Following a reduction of fleet size and annual operating expenses, SWRTA increased its annual operating revenue to $864,978 (2016) from $856,423 (2011). The cost per vehicle revenue mile slightly increased to $3.40 from $3.12 and cost per passenger trip increased to $8.58 from $7.44. To this end, the transit system data appears to show the improvements on its operations.
During the field survey, the Staff found the following:
▪ Bus schedules were not posted in any stop location
▪ 7 bus shelters along all seven bus routes in the City
▪ The bus routes serve abandoned industrial areas
▪ Some social facilities such as parks and schools are not along the bus routes
▪ Some of the public housing residential areas are not along the bus
routes
▪ Lack of connectivity of bus services in shopping mall.
▪ No connectivity of bus service to Industrial Park where the major employers are located on Route 15 South.
▪ Route 1 “on call” service runs through neighborhoods with higher than average income and vehicle ownership
▪ Route 1 runs along McCrays Mill Road with minimal residential ridership.
▪ No bus stop service available to Swan Lake.
▪ No bus route runs along the North Pike frontage road to Dillon Park where significant residential neighborhoods are in vicinity. Additional, there were no bus services to the Crosswell low income residential neighborhood. Following the Study, SWRTA has created a route that services both the North Pike frontage road and the Crosswell Elementary School neighborhood.
▪ Limited bus service area covers the vast number and area of trailers/mobile homes in Cherryvale area.
Individual Bus Route
Based on the redirected source of data from SLCOG, the staff has evaluated, as shown in Table 7.4, the profitability of each route based upon cost and revenue per passenger.
Table 7.4 – Bus Route Profit Analysis
Route Cost ($)/ Passenger
Revenue ($)/ Passenger
Difference
9 5.89 3.50 (2.39)
8 12.91 12.49 (0.42)
7 8.79 7.63 (1.16)
6 6.41 4.23 (2.18)
5 6.15 3.86 (2.29)
4 6.17 3.91 (2.26)
1 6.16 3.86 (2.30)
Columbia 25.35 11.02 (14.33)
Myrtle Beach 17.06 15.56 (1.50)

7-7 Transit Element | Final Report | November 2018
2045 Long Range Transportation Plan
Recommendations
Based upon the above findings, the Staff recommends the following:
Overall Transit System
▪ Active promotions of existing bus route services by mass media advertisements, placing bus schedules in public places such as shopping mall, schools, and grocery stores.
▪ Improve the “on call”-demand response service by restructuring
system requiring 24 hour advance call in and provide pick up services along major roadway intersections.
▪ Assign one vehicle (mini- van or 15 passenger bus) for “call in” –demand response services for reducing costs of operations.
▪ Designate a “at pulse” transfer point at the Wesmark Plaza by the Staples and Big Lots stores for Bus Route 7, and 9 and 4 for free transfer.
▪ Install more bus stop sign poles with bus schedules posted.
▪ Eliminate Bus Route 8 service which only carried 140 passengers in
a 6 month period, and also incurred the highest cost per passenger ($12.91). Instead, assign another 15 passenger bus or mini-van to “on call” demand response system to transport customers to and from the Vocational Rehabilitation Center on North Main.
Individual Routes
A series of individual bus route maps are included on the pages that follow. Each bus route map has a current bus route and a proposed new bus route for comparison of the changes. Also, a comparison of current and proposed revenue miles is shown below:
The total cost for all bus routes revenue miles is $466.69 for one loop. The individual route proposed cost is shown in the table below:
Table 7.6 – Proposed Route Revenue Mile Cost
(Terminal to Terminal)
Route # Proposed
Revenue Miles Cost per
Revenue Mile * Proposed Revenue
Miles Cost
1 12.94 4.03 $ 52.15
4 ** 33.16 3.99 $ 132.31
5 9.26 4.03 $ 37.32
5 Peak 7.68 4.03 $ 30.95
6 12.23 3.83 $ 46.84
7 38.27 2.91 $ 111.37
9 13.12 4.25 $ 55.76
Total Routes
Cost $ 466.69
** Two Buses Running Simultaneously in Opposite Directions
Table 7.5 – Bus Route Revenue Mileage
Route # Current Revenue Miles Proposed Revenue Miles
1 8.15 12.94
1 by Request 3.85 -
4 10.71 33.16 *
4 by Request 0.48 0.48
5 9.47 9.26
5 Peak Hour - 7.68
6 12.14 12.23
6 by Request 1.14 -
7 38.27 38.6
7 by Request 2.21 -
8 8.12 -
9 12.67 13.12
Total 107.21 127.47
* Route 4 has two buses running simultaneously in opposite directions.

7-8 Transit Element | Final Report | November 2018
2045 Long Range Transportation Plan
The following section describes the proposed changes for the various fixed-routes in Sumter.
Route 1 - West Liberty/ Guignard (Figure 7.2)
▪ The “on-call” demand response service from Wise Drive, via Henderson Street and Phelps Street, to W. Liberty Street is eliminated.
▪ The “on-call” service route to Sumter High School will be changed to regular bus service route.
▪ Designate a bus stop in the shopping center at the Bi-Lo Supermarket.
▪ Eliminate the loop portion on McCrays Mill Road to Birnie Hope
Center. Designate Pinewood Road as a return route and designate bus stops at Swan Lake and Civic Center. Right turn on Liberty Street eastbound to stop at low income apartment units right across from the Birnie Hope Center and northbound on Guignard Drive back to Liberty Street toward the Terminal.
Route 4 - North Main/Sumter Mall & Wesmark Plaza (Figure 7.3)
▪ Two buses running simultaneously on opposite directions. Both buses leave the bus terminal simultaneously, with one bus going towards N. Main Street and the other going to N. Lafayette Drive to Loring and Croswell areas. Bus A goes toward Sumter Mall/Wesmark Plaza via Miller Road and Pullman Drive and stops at the Staples/Big Lots transfer point. Bus A waits for Bus B which heads towards the transfer points via N. Lafayette Drive and North Pike Frontage Road, through Dillon Park, Wise Drive and loops into a retirement apartment complex and stops at the transfer point.
▪ The connectivity point for bus A and bus B meet at the Staples/Big Lots (Wesmark Mall) transfer point.
▪ The transfer point is where Routes 4, 7, and 9 meet.
▪ The Wall Street area “on call” services remains.
Route 5 - South Main/Pilgrim’s Pride (Figure 7.4)
▪ Route 5 will extend services to Pilgrim’s Pride industrial park during
the morning and evening peak hours only. During off peak hours, bus will loop at S. Guignard Parkway and Pocalla Road for the returning trip.
▪ Bus will stop at Bates Middle School and the Southside Park (public housing).
Route 6 - East Liberty/ Aquatic Center (Figure 7.5)
▪ Route 6 bus will provide service along S. Main St. to Fulton Park low income area.
▪ Route 6 “on call” service extends to DMV of SCDOT along
Oswego Road.
▪ Bus stop pole must be erected at the Aquatic Center.
Route 7 - Shaw Shuttle (Figure 7.6)
▪ Bus will meet at the Transfer Point in the Wesmark Plaza for connectivity for Bus Route 9 and Route 4.
▪ Bus service area will expand at Cherryvale (See Figure 7.9).
▪ City bound bus route 7 will turn at Wilson Hall Road, down on Wesmark, up on Alice Drive, and stop at Walmart before going to the Transfer point in Wesmark Plaza.
▪ Bus will go from Staples/Big Lots to Sumter Mall and then return
to the bus terminal.
Route 8 - North Main/Vocational Rehab
▪ Eliminate Route 8 and have one bus designated for “on call”
services.
▪ The “on call” service requires at least minimum of 24 hours advance reservations. Designate pick up locations on major roadway intersections. This “on call” service MUST NOT provide door to door services. The door to door services may be provided through the FTA human services coordination program
Route 9 - Broad Street (Figure 7.7)
▪ The diversion on Highland Avenue and Miller Road will be
eliminated.
▪ Bus stop pole will be erected in front of the library.
▪ Bus will stop at K mart and the retirement apartment units behind
such
▪ Bus will meet Route 4 and Route 7 buses at the Transfer point.
▪ Bus shelters are recommended on Broad Street in front of Aldi and Piggly Wiggly.
Conclusions
By restructuring the current bus routes, the proposed total revenue miles will be increased to 127.47 miles from 107.21. Ridership is most likely to increase for a significant percentage of the expanded service areas where passenger trip generators of grocery stores, schools, social facilities, and low percentage of vehicle ownerships residential areas. In addition, by improving the connectivity of bus services, passengers are more willing to use public transit for their choice of shopping malls, restaurants, clinics, and even employment places. Following the Study, SWRTA adopted several recommendations and implemented them into the fixed bus routes services.

7-9 Transit Element | Final Report | November 2018
2045 Long Range Transportation Plan
Figure 7.2

7-10 Transit Element | Final Report | November 2018
2045 Long Range Transportation Plan
Figure 7.3

7-11 Transit Element | Final Report | November 2018
2045 Long Range Transportation Plan
Figure 7.4

7-12 Transit Element | Final Report | November 2018
2045 Long Range Transportation Plan
Figure 7.5

7-13 Transit Element | Final Report | November 2018
2045 Long Range Transportation Plan
Figure 7.6

7-14 Transit Element | Final Report | November 2018
2045 Long Range Transportation Plan
Figure 7.7

7-15 Transit Element | Final Report | November 2018
2045 Long Range Transportation Plan
Performance Based Planning and
Programming in Transit The Moving Ahead for Progress in the 21st Century (MAP-21) Act initiated the performance management approach on all federally funded transportation programs and projects. This initiation was reauthorized by the Fixing America’s Surface Transportation (FAST) Act in 2015.
Performance management is a strategic approach that uses system information to make investment and policy decisions to achieve goals set for the multimodal transportation systems in the MPO study area. When this strategic approach applies to transportation planning and programming, it is known as Performance Based Planning and Programming (PBPP).
In accordance with the federal legislations and codified regulations, the PBPP must apply to Long Range Transportation Plan (LRTP), Statewide and metropolitan Transportation Improvement Programs (STIPs and TIPs) and other federally funded plans and processes such as Transit Agency Asset Management Plans, Transit Agency Safety Plans, Congestion Management Process etc.
Recipients of public transit funds – which can include states, local authorities and public transportation providers – are required to establish performance targets for safety and state of good repair; to develop transit asset management and transit safety plans; and to report on their progress toward achieving targets. Public transportation providers are directed to share information with MPOs and states so that all plans and performance reports are coordinated. When local transit agencies establish performance targets, the targets must be in consistent with the National goals. Table 7.7 shows the national goals and criteria for performance measurement. These performance measures have helped to decrease SWRTA accidents by half since 2013 as seen in the table below.
SCDOT has set performance targets for SWRTA on rolling stock, equipment and facilities as shown in Table 7.8. These targets are set to support the national goals monitoring infrastructure condition of transit assets.
Table 7.7- Transit Performance Measures
National Goal Transit
Performance Area or Asset Category
Performance Measure
Safety
Fatalities Total number of reportable fatalities and rate per total vehicle revenue miles by mode
Injuries Total number of reportable injuries and rate per total vehicle revenue miles by mode
Safety Events Total number of reportable events and rate per total vehicle revenue miles by mode
System Reliability Mean distance between major mechanical failures by mode
Infrastructure Conditions (State of Good Repair; Transit Asset Management)
Equipment Percentage of vehicles that have met or exceeded their Useful Life Benchmark (ULB)
Rolling Stock Percentage of vehicles within a particular asset class that have met or exceeded their ULB
Facilities Percentage of facilities within an asset class rated below 3.0 on the FTA Economic Requirements Model scale
Table 7.8 SWRTA Transit Asset Management (TAM) Plan
Asset Category Time Span Performance Target
Rolling Stock
Buses 14 years Performance Target 15% of Useful Life Benchmark
Cutaways 10 years Performance Target 30% of Useful Life Benchmark
Vans 8 years Performance Target 20% of Useful Life Benchmark
Equipment Automotive 8 years Performance Target 30% of Useful Life Benchmark
Facilities Administrative/Maintenance
Performance Target 0% rated
under 3.0 of Transit Economic Requirements Model (TERM) Scale
13 10 117 6
0
10
20
2013 2014 2015 2016 2017# o
f Acc
iden
ts
Year
SWRTA Accident Data

7-16 Transit Element | Final Report | November 2018
2045 Long Range Transportation Plan
System Recommendations Transit riders typically fall into one of two categories – captive or choice. Choice transit riders choose to leave their vehicle at home to save time and money or for other reasons. Captive transit riders use transit because they have no other choice. This may be because they lack access to a personal vehicle or because they have a physical impediment. Captive riders also include those too young to drive, the elderly, persons with disabilities, and those without the financial means to own and operate a personal vehicle.
Figures 7.11 and 7.12 show the existing SWRTA fixed-routes in relation to Sumter’s population density and percentage of persons without access to a personal vehicle. Figure 7.11 indicates the more dense areas of the city are served by transit with the exception of southwestern portions of the city between McCrays Mill and Pinewood Roads. Information in Figure 7.12 is based on census block groups, the smallest census geography for which the information is available. While the image indicates households near downtown without access to automobiles are served by bus routes, pockets of households in the county that need transit are forced to rely on paratransit if they qualify or seek alternative options such as taxis.
The recommendations that follow recognize the need to enhance existing service in order to meet the needs of both choice and captive transit users. An underlying goal is to encourage further dialogue regarding the benefits of transit for choice riders and the critical role transit plays in the life of captive users. The recommended improvements were established through analysis and public outreach efforts and balanced with the needs identified for other elements presented in the SUATS Long-Range Transportation Plan. The recommended improvements are grouped by general findings. Many of the recommendations will address more than one finding.
Finding: Public perception of transit limits its effectiveness. The general perception of transit in the Sumter area is that transit serves only those people without access to or the ability to use personal automobiles. In order to establish transit as a viable mode for choice riders and to encourage those in need of the mobility offered by transit to use the service, public perceptions must be identified and addressed.
Recommendations:
▪ Conduct a ridership survey. A focused ridership survey with proper distribution will go a long way in determining overall levels of customer satisfaction and help identify issues of importance for transit users. The results of the survey should help reaffirm the transit initiatives launched as part of the SUATS Long-Range Transportation Plan while also serving as a prelude to a new transit master plan.
▪ Develop a transit master plan. A transit master plan should be
developed to explore multiple alternatives and detailed solutions for the near- and long-term transit needs of the Sumter community. The master plan should include a detailed review of existing conditions (ridership trends, travel times, customer preferences, etc.), recommended bus routes and service improvements, recommended delivery system upgrades (bus stops, sidewalks, etc.), implementation strategies, and funding resources. A detailed plan coordinated with the recommendations presented throughout the SUATS Long-Range Transportation Plan can help inform the land development review process in addition to transportation project prioritization.
▪ Introduce a coordinated marketing plan. The indication in the survey that the public does not want to spend more money on transit shows the benefits of this mode of travel is not reaching the general public. A marketing effort through print and broadcast media outlets should be coordinated with improved signage and informational handouts (route maps, fare books, etc.). SCDOT is exploring how to approach some of these issues on a statewide basis, which should provide opportunities for local agencies to collaborate.
▪ Finding: Transit does not fulfill the existing needs of some captive users. As shown in Figures 7.11 and 7.12, SWRTA’s routes provide critical access to persons that require transit to access jobs and services. Additional routes or changes to existing routes can fill holes in the region’s transit service without incurring unnecessary costs. In addition, the frequency and operating hours of some routes need to be altered to meet the needs of existing and potential customers.
Recommendations:
▪ Extend duration of routes. Extending the duration of routes,
particularly during the evening for Route 7 Shaw Shuttle, will accommodate evening commutes for the region’s largest employment generator.
▪ Utilize the master planning process to assess current service and explore changes in route frequency and duration. The transit master plan should be targeted to the needs of captive users while accommodating potential increases in choice riders. Public outreach efforts for the LRTP identified a need to re-evaluate the location, frequency, and headway times between transit stops, a process that should be a key component of the transit master planning process. Discussions with the community and analysis of existing conditions show the overall route system accommodates many of the more dense areas in Sumter. However, changes to some routes or the addition of new routes is needed to serve the growing population in the southwest planning area along Loring Mill Road, McCrays Mill Road, Wedgefield Highway, and Pinewood Road.
▪ Improve the quality of taxicab services. The presence of taxi
companies is indicative of the need to give residents and visitors a means of travel other than privately owned automobiles. However, compared to other South Carolina metropolitan areas the taxi companies in Sumter provide a lower quality of service, which adversely could impact customer service as well as the image Sumter is trying to create for the area. City and County officials should investigate how other metropolitan areas have been able to improve the quality of their taxicab services without causing undue financial hardships on this industry.

7-17 Transit Element | Final Report | November 2018
2045 Long Range Transportation Plan

7-18 Transit Element | Final Report | November 2018
2045 Long Range Transportation Plan

7-19 Transit Element | Final Report | November 2018
2045 Long Range Transportation Plan
Finding: Hub and spoke design may become ineffective as the region grows. The hub and spoke layout of the SWRTA fixed-route system supports the downtown area by emphasizing trips originating from or destined to the downtown area. The long headways created by these one-way routes may become outdated as the region’s activity centers become more diverse.
Recommendations:
▪ Identify satellite transfer stations for future expansion. As the system grows to accommodate new demand, locations near emerging activity centers where multiple routes converge should be designated as satellite transfer stations. The exact location of these facilities should be determined through additional study and in coordination with property owners, SWRTA, and local officials. Amenities at these stops should be enhanced to include shelters, informational boards, benches, route information, and bus pull-outs.
Finding: Transit must be flexible to growth within the region. Growth in Sumter will increase the burden on the area’s transportation system and will bring to the region more persons dependent upon public transportation for their daily traveling needs. Both situations require a flexible system designed to grow with the region and meet changing travel patterns and trends.
Recommendations:
▪ Promote coordination and collaborative partnerships between
the urban and rural transportation programs of SWRTA as well as with other public transit and human service agencies. Fixed-route and paratransit services provide complementary services that reach out to those with easy access to a bus stop as well as rural residents who depend on public transportation to access services and employment. The existing partnership between these two segments of SWRTA should continue to be evaluated to ensure no gaps in coverage exist. As part of the Regional Transit Council at the Santee-Lynches Council of Governments (COG), SWRTA is working with other regional partners to provide comprehensive transit service. Current efforts include coordinating Section 5310 (elderly and persons with disabilities) programs and Medicaid services with the Lower Savannah COG as well as working to develop a SmartRide program in the Orangeburg area. SWRTA also works closely with the Central Midlands COG and
coordinates with CMRTA in Columbia for its SmartRide and Eastover Services. These partnerships should be enhanced where appropriate.
▪ Utilize technology to ensure reliability of the transit system. Because the extent of SWRTA’s coverage area – 5,000 sq. mi. – is so large, emerging technology designed to coordinate scheduling, determine efficient routes, and provide real-time information to customers should be implemented. SWRTA currently utilizes a Route Match Scheduling and Dispatch Program for its paratransit (dial-a-ride) service. In 2004, SWRTA became the first transit system in the state to operate the Palmetto 800 system, a radio communication-based public safety network. Such progressive use of technology should be encouraged. The ability to provide real time information to customers should be explored as funding permits.
▪ Future routes should be responsive to future land use patterns. SWRTA should work alongside the City and County planning departments to ensure transit service is considered in future development projects. In locations with larger scale development and redevelopment impacts, the review process should ensure transit-ready development features such as a mixture of land uses at appropriate densities, interconnected streets, and pedestrian-friendly design.
▪ Civic land uses should be within walking distance of public transit. Civic land uses such as libraries, parks, city/county administration, and social services should be located within walking distance of public transit service. Existing transit routes and amenities should be evaluated to ensure equal accessibility to those choosing to ride transit. In addition, when evaluating locations for future public facilities the ability to provide access via transit should be a priority.
▪ Maximize the use of the James E. Clyburn Intermodal Transportation Center. Named for Sumter native and U.S Representative James E. Clyburn, the redeveloped historic warehouse at Harvin and Telephone Streets opened in Summer 2008 as a hub for local and regional bus service as well as intercity and interstate bus service provided by Southeastern Stages (Greyhound). The Center also houses offices for SWRTA and rents office space to other companies. The strategic location of this
project can serve as a catalyst for the revitalization of the southern edge of the central business district. Its location adjacent to the city’s CSX rail yard also can help support the potential long-term implementation of Amtrak service or commuter rail from Greenville through Charleston by way of Sumter.
Finding: Services for commuters must be a priority for the regional transportation system. Many residents of the Sumter region depend on jobs in other locations – whether service jobs in Myrtle Beach or government jobs in Columbia. Services designed to encourage alternatives to single-occupant private vehicles can help alleviate traffic congestion at the regional level.
Recommendations:
▪ Expand carpool matching service. The current carpool matching service offered through AlterNetRides on the SWRTA homepage provides a forum to match potential carpoolers. This service should be promoted through the coordinated marketing plan as a way to save commuters time and money. In particular, vanpooling for Shaw AFB personnel should be promoted.
▪ Expand SmartRide service in the Sumter market. SmartRide is
marketed as a safe, comfortable, and convenient commuter service between Camden, Lugoff, and Columbia. The current vanpool from Sumter to Columbia operates as a SmartRider Service and has carried more than 17 people for more than three years. To provide opportunities for more riders, vehicle capacity should be added as funding permits. In addition, vanpools can provide an opportunity for focused commuter purposes.

7-20 Transit Element | Final Report | November 2018
2045 Long Range Transportation Plan
Finding: Focus is needed on increasing passenger amenities such as sidewalks, shelters, and benches. A successful and thriving transit system depends on a system of safe and convenient sidewalks and bikeways to delivery users to transit stops. The stops themselves should provide a safe and comfortable environment while users wait for the bus to arrive.
Recommendations:
▪ Coordinate upgrades to transit stops with improvements to the pedestrian and bicycle network. The SUATS Long-Range Transportation Plan recommends strategic sidewalks and bikeways designed to connect activity centers and neighborhoods. Improvements to the pedestrian and bicycle network, especially those constructed as part of new road construction and/or widening, should be coordinated with existing and future transit needs.
▪ Enhance bus stops. Current bus stops are little more than a sign on the side of the road. To encourage new riders and better accommodate existing users, bus stops should be enhanced to include benches and shelters. Initial locations for transit stop improvements should be identified during the master planning process. Where possible, partnerships between SWRTA and land owners should be established to provide funding for shelter construction with the understanding the land owner can advertise his or her property on the shelter. In locations where sheltered bus stops are not possible or necessary, bus stop signs should be updated to include route information.
▪ Right sized fleet. The size of buses used to carry passengers should reflect the usual average number of passengers of the route.
Conclusion Many of the recommendations for transit in Sumter involve promoting transit as a safe, convenient, and dependable form of transportation. An improved image and appearance can be achieved using short-term, low-cost measures. Long-term solutions target improvements for captive and choice riders to ensure transit exists as a sustainable transportation alternative. For overall success to be achieved, Sumter must make a commitment to provide and support alternative modes of travel. Efforts
independent of SCDOT and SWRTA must be initiated to promote mobility choices throughout the City and County.
Strategies for transit extend beyond the realm of what typically is considered transit planning. Many of the strategies presented throughout the SUATS Long-Range Transportation Plan can help make transit a viable alternative for residents and visitors. Improving roadways and creating a more connected roadway network can allow transit vehicles to service people more efficiently. Constructing a consistent bicycle and pedestrian network can help residents move between bus stops and their final destination. Coordinating the land use and transportation decision-making process ensure new development – whether roads, homes, offices, or shops – support existing and future transit service.
As stated in the introduction to this chapter, transit enhances the access and mobility for those who have no other transportation options. The transit-dependent population will continue to grow as the Baby Boomer generation ages. At the same time, the City continues to reach out to the senior population and market the area as an attractive place for retirees. Improvements to transit service will help make the area a more attractive location for retirees.
Perhaps the two most critical elements for transit to flourish in the region are progressive planning and dedicated funding. A more detailed transit master plan can explore the underlying issues presented in this chapter and help develop comprehensive strategies to ensure the fulfillment of long-term needs of choice and captive riders. Likewise, local and regional planning efforts should continue to leverage on-going statewide transit planning efforts. As for funding, SWRTA notes the region often does not pursue federal grants due to a lack of local and state match funds. Dedicated funding for transit must be emphasized.

7-21 Transit Element | Final Report | November 2018
2045 Long Range Transportation Plan
This page intentionally left blank.

CHAPTER 8 — FREIGHT AND AVIATION ELEMENT
2045 Long Range Transportation Plan
8-1 Freight and Aviation Element | Final Report | November 2018
Freight Element The movement of goods through and between communities is often overlooked, but these freight activities play a vital role in our economy. A safe and efficient system that accommodates the needs of freight is an important element to consider during Sumter’s long-range transportation planning process.
Freight has been an important part of life in Sumter since the original King’s Highway (SC 261) connected the larger cities of Camden and Charleston. Freight between Sumter and Charleston traveled by road and ferry until the railroad arrived in the mid-19th century. The growth of the railroad improved freight mobility and contributed significantly to the local and regional economy. Today, freight continues to move through the area by rail, but the expansion of the interstate highway system in the region has shifted much of the dependence from rail to trucks. An effective transportation network combines all modes of freight movement to achieve a level of efficiency that ensures the marketplace can operate without interruption.
The economy of the SUATS MPO area depends on the movement of goods through the SUATS MPO area and High Hills region. To better understand the existing conditions and needs of freight providers in the SUATS MPO area, a brief survey was distributed during the 2013 SUATS Long Range Transportation Plan update to more than 170 companies. More detailed information was obtained through phone interviews with several freight operators.
Highway and Rail Freight Trends
According to the 2016 Bureau of Transportation Statistics, trucks and rail accounted for 85% of the nation's domestic freight volume, up 1.6% from 2015. The balance is carried by pipelines, waterways, air, and multiple modes. Trucks carried $57.2 billion of imports and $496.9 billion of exports.
In 2015, trucks moved 10,766 million tons of goods (imports and exports) while freight railroads moved 1,459 million tons. Trucks are projected to continue to be used as the most common mode of transporting goods through 2045. (Table 2-1, Bureau of Transportation Statistics, Freight Facts and Figures 2017, USDOT)
For decades, the nation's freight railroads have been losing market share to highway freight (trucks). This trend has led to increased levels of traffic congestion on our nation’s freeways and highways. It is logical to assume that the continued loss of rail freight market shares to trucks would have a more significant impact because of the difficulty of building new highway capacity through the most congested travel corridors.
Existing Conditions
Highways
Freight movements originating in Sumter travel along the area’s US highways and major arterials to the region’s network of interstate highways. Sumter is strategically located in the heart of a triangle formed by three interstates: I-95, I-20, and I-26. The primary north-south route is US 15, which connects Sumter to I-20 to the north and I-95 to the south. Sumter Industrial Complex, the area’s largest industrial park, lies just west of US 15 south of Sumter. US 521 provides an alternate connection to I-95 and points south. Movements east and west rely on the network of roads near downtown as well as the US 76-378 Bypass (Robert Graham Freeway). US 76-378 connects Sumter with Columbia to the west. To the east, US 378 connects Sumter to I-95 before continuing to Myrtle Beach. According to the 2013 freight survey, Alice Drive and Guignard Drive also are used for freight.
The freight surveys re-emphasized the critical regional connections to interstate highways provided by these non-interstate highways. The surveys, however, provided a range of opinions on the challenges facing freight providers and the weak links in the transportation system. Respondents noted the lack of a true bypass around Sumter and the difficulty in getting from north of Sumter to the industrial areas south of the city without traveling through the downtown area. Specific comments from the freight survey included:
▪ “The bypass does not operate as a true bypass.”
▪ “It’s very difficult to get from the north side of Town to the industrial areas on the south side of Town without traveling through the downtown area. This can be problematic due to the traffic congestion and the roadway geometry.”
▪ “The lack of effective access to the east-west routes such as I-20 and I-26 is a challenge, though access to I-95 is relatively easy.”
▪ “Roadway construction has not kept pace with the increasing travel demands in the area.”
▪ “The weakest link is the poor condition of the roadways and bridges in the state. I don’t think the Sumter area receives a “fair” share of the funding for roadways.”
▪ “Many of the roadways in the area are not suitable for 18-wheel
vehicles.”
▪ “Since most of the roadways in the area lead to the bypass, there
are few alternatives when selecting routes.”

8-2 Freight and Aviation Element | Final Report | November 2018
2045 Long Range Transportation Plan
Rail
The existing rail network in the SUATS MPO area includes track owned and operated by two major railroad companies (CSX Corporation and Norfolk-Southern Railway Company) as well as the U.S. government. Figure 8.1 shows the existing rail network in the study area. CSX Corporation provides freight rail service to the heart of Sumter with three railroad lines approaching downtown from the south, southwest, and west. These lines are part of the company’s 1,300 miles of railroad in South Carolina that links Sumter with the state’s major cities. The more than 22,000 miles of CSX track that blanket the eastern United States connect Sumter to major cities from Canada to southern Florida and as far west as St. Louis.
The Norfolk-Southern Railway Company has a single line just west of the study area that runs north to Columbia and south to Charleston. Like CSX, the Norfolk-Southern line is part of an extensive network of more than 21,000 miles of railroad that connects Sumter with points across the eastern U.S.
The final link in the SUATS MPO area railroad network is owned and operated by the U.S. government. The line owned and operated by the federal government includes a 5-mile railroad spur that connects Shaw AFB with the east-west CSX line at Cane Savannah just west of the city limits. The line’s sole purpose is to haul jet fuel to the military base.
Several local companies depend on private rail for importing materials and exporting products. Rail access can be a major selling point to businesses looking to relocate to area. In addition to strengthening the local economy, the use of rail for moving freight has a significant impact on the area’s roadways, particularly given the large ports on the South Carolina coast. According to the CSX Corporation, every railcar trip provided by the company removes approximately three truck trips from the state’s highways.
Despite the benefits of using rail to move freight, barriers limit the effectiveness in the region. Several respondents to the rail transportation portion of the freight survey ranked costs and equipment availability as fair to poor.

8-3 Freight and Aviation Element | Final Report | November 2018
2045 Long Range Transportation Plan

8-4 Freight and Aviation Element | Final Report | November 2018
2045 Long Range Transportation Plan
Truck Route Recommendations
Trucks are defined as vehicles with a manufacturer's gross vehicle weight of 33,000 pounds or more. This definition excludes most straight, panel, and delivery trucks, but includes large trucks with more than two axles, such as tractor-trailers and tandem axle dump trucks. This definition also excludes public service vehicles, such as garbage collection trucks.
The Federal Highway Administration’s (FHWA) Freight Analysis Framework was analyzed to determine route designation and recommendations. When comparing the 2012 framework to the 2045 framework, freight routes change very little. Each of the major routes carry less than 20,000 kilotons per year in both models. The framework for both 2012 and 2045 can be seen in Figures 8.2 and 8.3.
With this framework in mind and upon designation of routes, signs should continue to be posted at the city limits, highway exits, and other appropriate locations directing truck drivers to those streets on which their movements are permitted. Restrictions may include limiting their travel to US and SC routes or designated/signed routes through the city. Truck enforcement strategies within city limits should be revisited to ensure that trucks are prohibited on local streets.
Truck designations for major routes and industrial streets could prove beneficial. Those streets critical to the freight community and intended to serve truck traffic are logical selections for truck route designation. These streets include US 76, US 378, US 15, and US 521. Utilization of these routes provides better defined east-west and north-south freight corridors. Likewise, truck traffic should be discouraged on roadways that do not meet the design criteria necessary to facilitate heavy truck traffic.
The Lafayette Drive Corridor Study, a by-product of a previous update of the SUATS Long-Range Transportation Plan, created a community-based plan to reinvigorate one of the area’s critical north-south corridors. Currently, heavy vehicles are using several facilities throughout Sumter to travel between the Bypass and the various industrial parks. These roads include routes through the central business district that were not intended to facilitate major truck traffic.
Recommendations from that study for wayfinding, signage, and truck route designation include consolidating the current designations into a continuous truck route through the city that utilizes the capacity and geometrics of Lafayette Drive (designated as US 15). From the north, the consolidated truck route would utilize the proposed interchange at US
76/378 before proceeding down Lafayette Drive. Figure 8.4 displays the proposed truck route designation along Lafayette Drive as well as other truck routes in the study area.
Increased industrial development will require efficient truck access and circulation to the arterial system, ultimately improving freight mobility while limiting cut-through truck traffic in neighboring subdivisions.
Additional tasks associated with establishing a series of truck routes through the urban area include: Work with SCDOT to prioritize resurfacing of designated routes in an effort to reduce noise and vibration from trucks.
▪ Adjust signal timing along high priority routes to allow
uninterrupted through movements based on posted speed limits. The result will be improved travel times and reduced noise and air pollution.
▪ Publish and distribute educational materials to businesses and industries concerning proposed designated truck routes.
▪ Work with SCDOT to make improvements to critical
intersections on truck routes to facilitate and encourage their use by truck operators. Improved turning radii, lane width, and the provision of dedicated turn lanes will greatly improve the efficiency and safety of these corridors.
▪ Identify streets in industrial areas that function as industrial collectors and work with stakeholders to evaluate and implement the appropriate cross-section presented in Chapter 5.
Performance Measures
In accordance with the Federal Highway Administration (FHWA) and the Federal Transit Administration (FTA), SUATS must continue to meet performance measures as laid out in MAP-21 and the FAST ACT. Furthermore, these measures must be in line with the South Carolina Statewide Freight Plan which sets the following policy goals:
▪ Goal 1: Mobility and System Reliability ▪ Goal 2: Safety

8-5 Freight and Aviation Element | Final Report | November 2018
2045 Long Range Transportation Plan
▪ Goal 3: Infrastructure Condition ▪ Goal 4: Economic and Community Vitality
▪ Goal 5: Environmental
More information on performance measures can be found in Chapter 11 of this document.

8-6 Freight and Aviation Element | Final Report | November 2018
2045 Long Range Transportation Plan

8-7 Freight and Aviation Element | Final Report | November 2018
2045 Long Range Transportation Plan

8-8 Freight and Aviation Element | Final Report | November 2018
2045 Long Range Transportation Plan
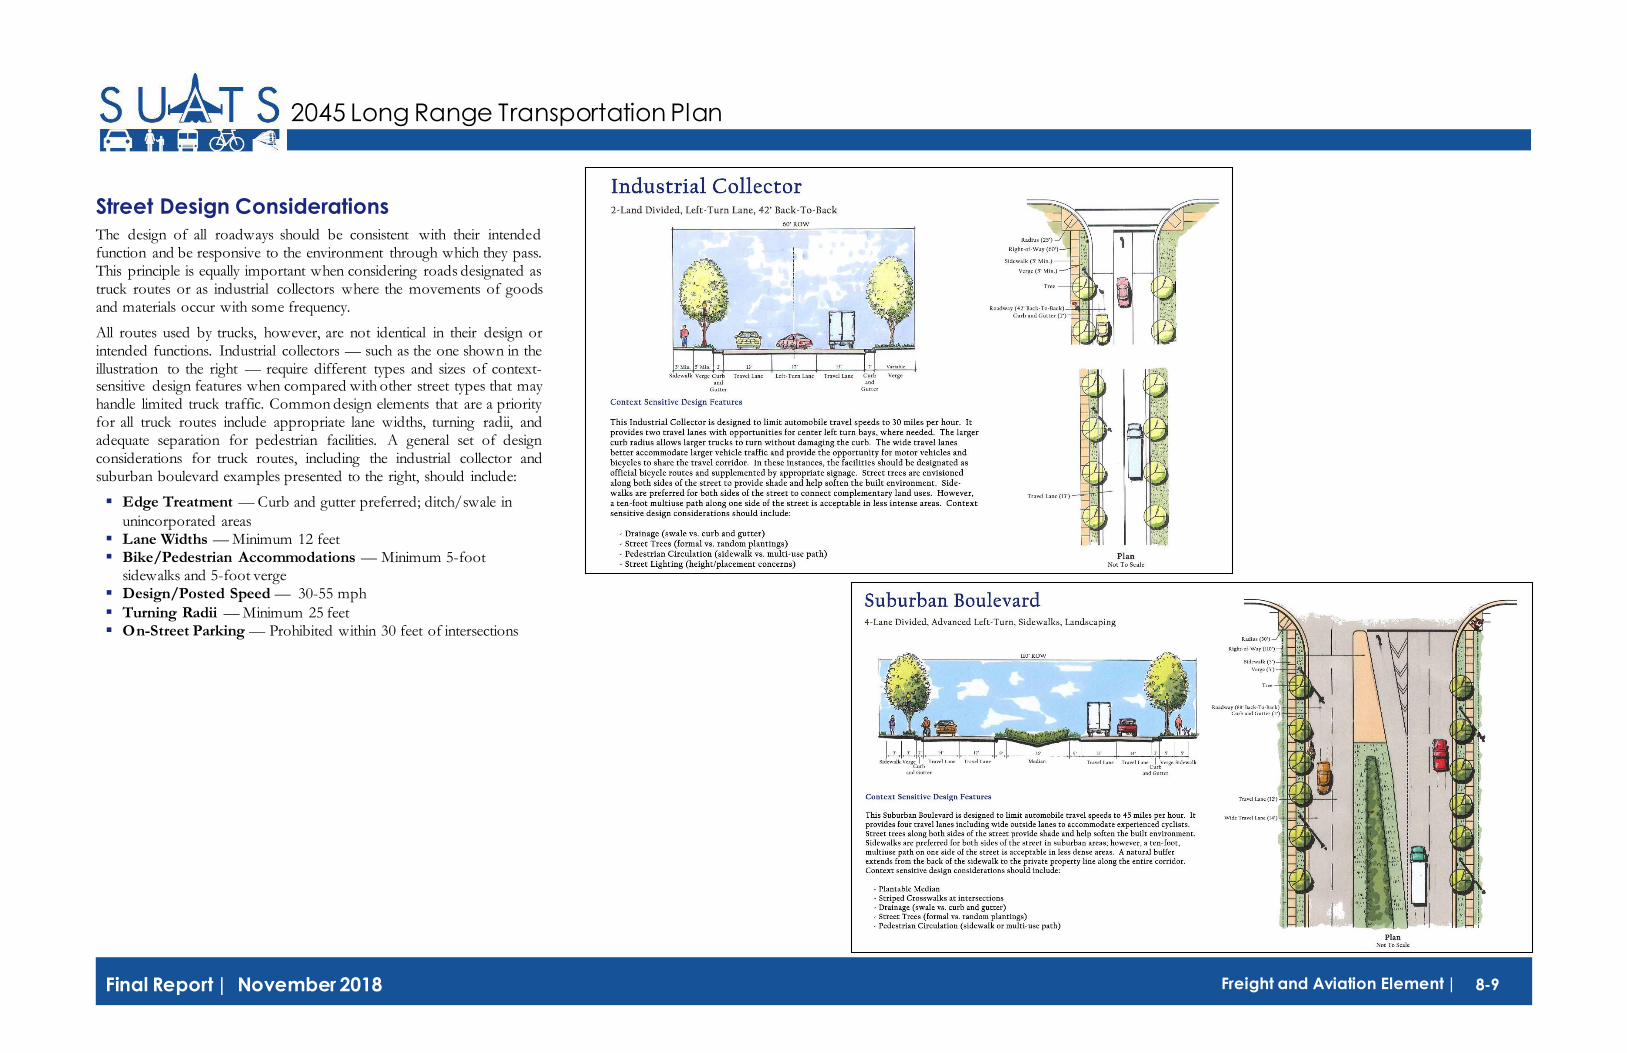
8-9 Freight and Aviation Element | Final Report | November 2018
2045 Long Range Transportation Plan
Street Design Considerations
The design of all roadways should be consistent with their intended function and be responsive to the environment through which they pass. This principle is equally important when considering roads designated as truck routes or as industrial collectors where the movements of goods and materials occur with some frequency.
All routes used by trucks, however, are not identical in their design or intended functions. Industrial collectors — such as the one shown in the illustration to the right — require different types and sizes of context-sensitive design features when compared with other street types that may handle limited truck traffic. Common design elements that are a priority for all truck routes include appropriate lane widths, turning radii, and adequate separation for pedestrian facilities. A general set of design considerations for truck routes, including the industrial collector and suburban boulevard examples presented to the right, should include:
▪ Edge Treatment — Curb and gutter preferred; ditch/swale in
unincorporated areas ▪ Lane Widths — Minimum 12 feet ▪ Bike/Pedestrian Accommodations — Minimum 5-foot
sidewalks and 5-foot verge ▪ Design/Posted Speed — 30-55 mph
▪ Turning Radii — Minimum 25 feet ▪ On-Street Parking — Prohibited within 30 feet of intersections

8-10 Freight and Aviation Element | Final Report | November 2018
2045 Long Range Transportation Plan
Aviation Element Airports throughout South Carolina serve the needs of the flying public, whether as passengers on an airline or piloting private passenger or freight aircraft. The state’s airports vary in size and function, but each is an important component of the statewide transportation system and vital to the state’s economy. While the majority of air passengers travel to and from the state’s international airports (Greenville-Spartanburg, Charleston, and Myrtle Beach), many daily trips originate and end at one of the many smaller facilities located throughout South Carolina. In general, airport facilities in South Carolina can be categorized into one of two groups:
▪ Air carrier airports
▪ General aviation (GA) airports
Air Carrier — These include the group of facilities that serve regularly scheduled passenger service. They are large facilities with the capacity to handle significant volumes of freight and passengers on a daily basis. The three international airports mentioned above account for the majority of revenue and traffic generated by airports within this classification; however, airports such as Columbia Metropolitan and Hilton Head also qualify under this classification.
General Aviation — These airports include the network of smaller facilities that exist in the majority of counties throughout the state. These facilities typically have paved runways 2,000 feet to 5,500 feet in length and are capable of accommodating small-sized (single engine) and medium-sized (multi-engine) aircraft. These airports often provide opportunities for businesses with suitable aircraft to avoid the use of larger facilities and minimize lag time associated with air travel. They also have proven useful in attracting businesses to communities throughout the state.
Existing Conditions
Sumter Airport is a general aviation facility without scheduled passenger service. The County owns Sumter Airport, which is located in north central Sumter County. Figure 8.5 illustrates the location of Sumter Airport. The existing conditions and recommendations for this section are derived from the Sumter Airport Layout Plan (ALP) Update, which was completed in November 2004.
Sumter Airport (SMS)
Characteristics of the runways, taxiway, and facilities at the airport include:
Airport Facilities
Primary Runway
▪ Designation — 5/23
▪ Surface — Asphalt
▪ Length — 5,500 feet
▪ Width — 100 feet
▪ Load Bearing — 26,000 lbs. (single gear); 55,000 lbs. (dual gear)
South Carolina Airports
Sumter Airport Aerial
Sumter Airport Terminal
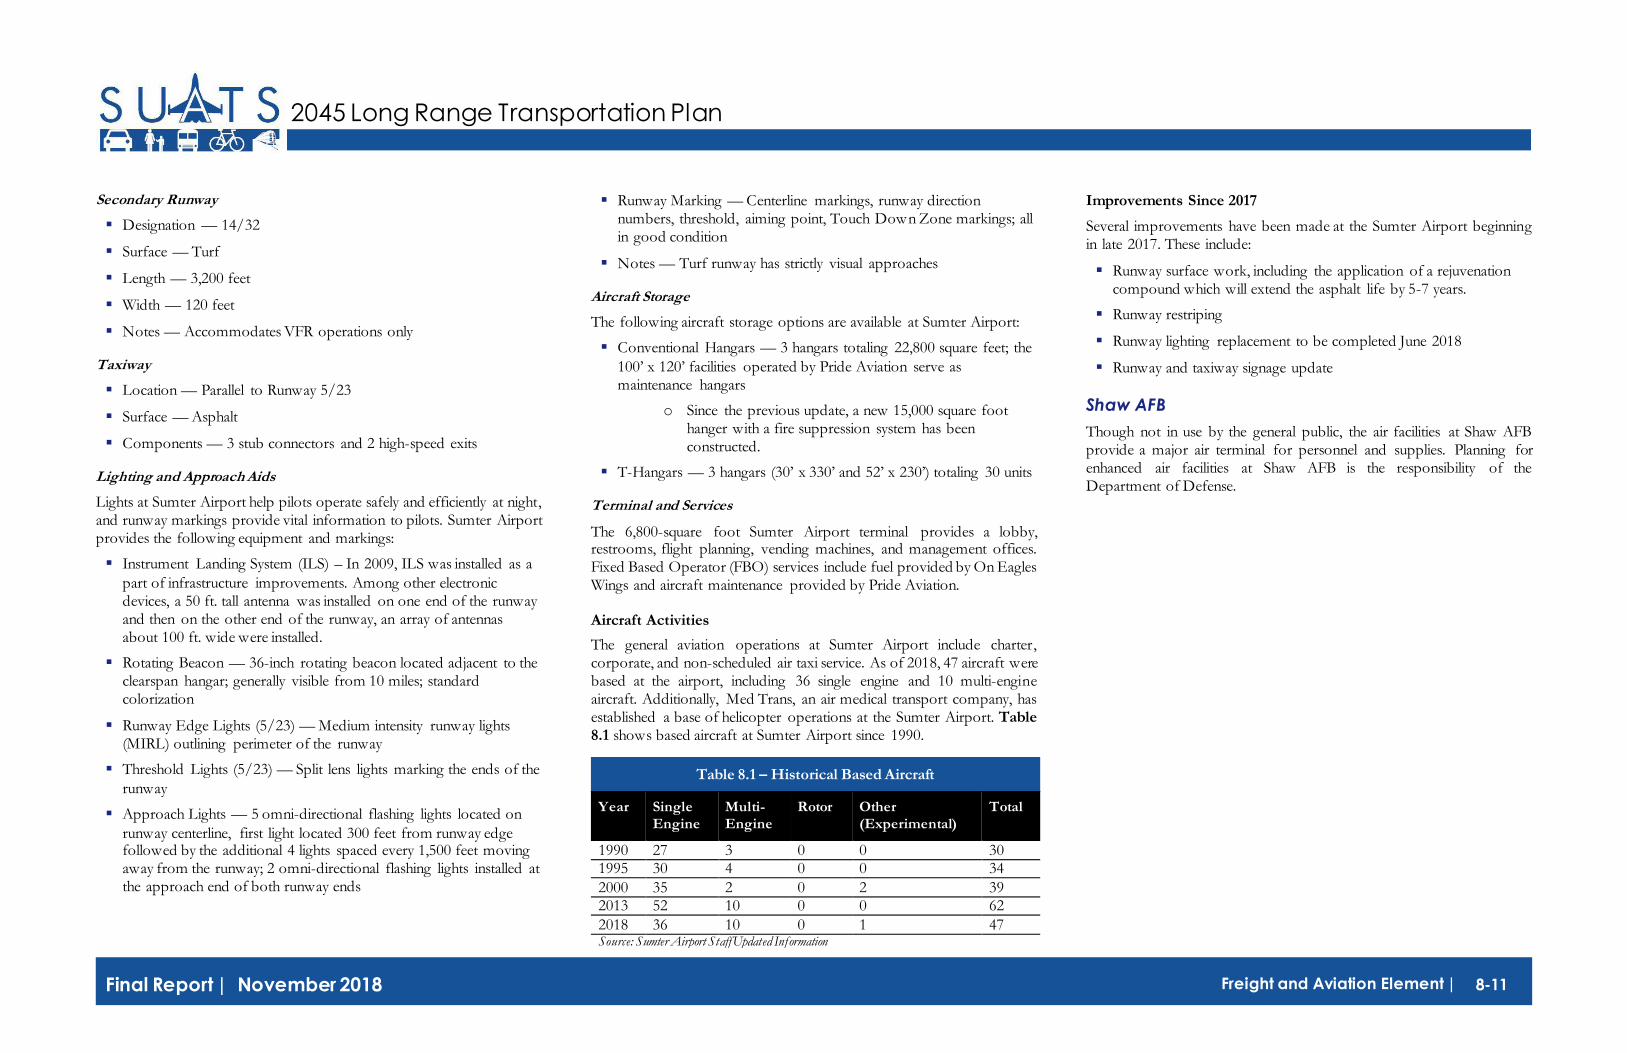
8-11 Freight and Aviation Element | Final Report | November 2018
2045 Long Range Transportation Plan
Secondary Runway
▪ Designation — 14/32
▪ Surface — Turf
▪ Length — 3,200 feet
▪ Width — 120 feet
▪ Notes — Accommodates VFR operations only
Taxiway
▪ Location — Parallel to Runway 5/23
▪ Surface — Asphalt
▪ Components — 3 stub connectors and 2 high-speed exits
Lighting and Approach Aids
Lights at Sumter Airport help pilots operate safely and efficiently at night, and runway markings provide vital information to pilots. Sumter Airport provides the following equipment and markings:
▪ Instrument Landing System (ILS) – In 2009, ILS was installed as a
part of infrastructure improvements. Among other electronic devices, a 50 ft. tall antenna was installed on one end of the runway and then on the other end of the runway, an array of antennas about 100 ft. wide were installed.
▪ Rotating Beacon — 36-inch rotating beacon located adjacent to the clearspan hangar; generally visible from 10 miles; standard colorization
▪ Runway Edge Lights (5/23) — Medium intensity runway lights (MIRL) outlining perimeter of the runway
▪ Threshold Lights (5/23) — Split lens lights marking the ends of the
runway
▪ Approach Lights — 5 omni-directional flashing lights located on
runway centerline, first light located 300 feet from runway edge followed by the additional 4 lights spaced every 1,500 feet moving away from the runway; 2 omni-directional flashing lights installed at the approach end of both runway ends
▪ Runway Marking — Centerline markings, runway direction numbers, threshold, aiming point, Touch Down Zone markings; all in good condition
▪ Notes — Turf runway has strictly visual approaches
Aircraft Storage
The following aircraft storage options are available at Sumter Airport:
▪ Conventional Hangars — 3 hangars totaling 22,800 square feet; the
100’ x 120’ facilities operated by Pride Aviation serve as maintenance hangars
o Since the previous update, a new 15,000 square foot hanger with a fire suppression system has been constructed.
▪ T-Hangars — 3 hangars (30’ x 330’ and 52’ x 230’) totaling 30 units
Terminal and Services
The 6,800-square foot Sumter Airport terminal provides a lobby, restrooms, flight planning, vending machines, and management offices. Fixed Based Operator (FBO) services include fuel provided by On Eagles Wings and aircraft maintenance provided by Pride Aviation.
Aircraft Activities
The general aviation operations at Sumter Airport include charter, corporate, and non-scheduled air taxi service. As of 2018, 47 aircraft were based at the airport, including 36 single engine and 10 multi-engine aircraft. Additionally, Med Trans, an air medical transport company, has established a base of helicopter operations at the Sumter Airport. Table 8.1 shows based aircraft at Sumter Airport since 1990.
Improvements Since 2017
Several improvements have been made at the Sumter Airport beginning in late 2017. These include:
▪ Runway surface work, including the application of a rejuvenation compound which will extend the asphalt life by 5-7 years.
▪ Runway restriping
▪ Runway lighting replacement to be completed June 2018
▪ Runway and taxiway signage update
Shaw AFB
Though not in use by the general public, the air facilities at Shaw AFB provide a major air terminal for personnel and supplies. Planning for enhanced air facilities at Shaw AFB is the responsibility of the Department of Defense.
Table 8.1 – Historical Based Aircraft
Year Single Engine
Multi-Engine
Rotor Other (Experimental)
Total
1990 27 3 0 0 30 1995 30 4 0 0 34
2000 35 2 0 2 39 2013 52 10 0 0 62
2018 36 10 0 1 47 Source: Sumter Airport Staff Updated Information

8-12 Freight and Aviation Element | Final Report | November 2018
2045 Long Range Transportation Plan

8-13 Freight and Aviation Element | Final Report | November 2018
2045 Long Range Transportation Plan
Recommendations
According to the Sumter Airport Layout Plan Update, the airport should experience steady growth during the plan’s 20-year planning horizon (2001 to 2021). Tables 8.2 and 8.3 detail projected growth of Sumter Airport.
Based on the growth potential, the Sumter Airport Layout Plan Update provides several recommendations grouped into three stages of implementation: Stage I (0-5 years), Stage II (6-10 years), and Stage III (11-20 years). Recommendations for the airport include the following:
Stage I (Completed):
▪ Land should be acquired in the safety area at the south end of Runway 5/23
▪ Vegetation should be cleared on north approach to Runway 5/23
▪ Instrument landing system should be implemented on Runway 23
to ensure reliable, all-weather operation
Stage II (Completed):
▪ Evaluate and possible renovate existing terminal
▪ Expand available parking spaces to a total of 100 spaces
Stage III (In Progress):
▪ Runway 5/23 should be extended to 6,000 feet to accommodate larger corporate jets (could be sooner if corporate activity increases)
▪ Runway 5/23 pavement should be strengthened to 70,000 lbs. (dual
gear)
▪ Taxiway should be extended at the time of Runway 5/23 extension
Additional recommendations call for improved hangar and tie-down facilities, increased fuel storage capacity, and improved directional signage for persons trying to access the airport.
Table 8.2 – Based Aircraft By Type
Year Single Engine
Multi-Engine
Turbo Prop
Jet Rotor Experi-mental
Other Total
2001 40 2 0 0 2 0 0 44 2006 42 7 2 2 3 0 0 56
2011 47 9 2 3 3 1 1 66 2016 55 10 3 4 3 1 2 78
2021 64 11 3 6 4 2 3 93 Source: Sumter Airport Layout Plan Update; November 4, 2004
Table 8.3 – Projected Emplaned Pilots and Passengers
Year Pilots/ Passengers
Design Hour Peak (pilots/passengers per hr)
Design Day Peak (pilots/passengers per day)
2001 36,496 N/A N/A
2006 47,313 73 362 2011 56,571 87 432
2016 68,086 105 521 2021 81,154 125 620
Source: Sumter Airport Layout Plan Update; November 4, 2004

8-14 Freight and Aviation Element | Final Report | November 2018
2045 Long Range Transportation Plan
This page intentionally left blank.

9-1 Financial Plan | Final Report | November 2018
CHAPTER 9 — FINANCIAL PLAN
2045 Long Range Transportation Plan
Introduction Federal MAP-21 and FAST Act legislation requires a financial plan be performed as a part of a Metropolitan Planning Organization’s (MPO) Long-Range Transportation Plan. The financial plan shows proposed investments that are realistic in the context of reasonably anticipated future revenues over the life of the plan and for future network years, set for the purpose of the 2045 SUATS Long Range Transportation Plan as 2022, 2035, and 2045. Meeting this test is referred to as “financial constraint.”
The 2045 SUATS Long Range Transportation Plan is financially constrained. The mix of transportation recommendations proposed to meet metropolitan transportation needs over the next 27 years is consistent with revenue forecasts. The Financial Plan details both proposed investments toward these recommendations and revenue forecasts over the life of the plan.
The proposed recommendations were developed in collaboration with the SUATS MPO, City and County of Sumter, SCDOT, and the Santee Wateree Regional Transportation Authority (SWRTA). These projects include roadway, transit, bicycle, and pedestrian facilities and services for the life of this plan and reflect existing and committed projects, the Transportation Improvement Program (TIP), and the future plans of the MPO, SCDOT, the City and County of Sumter, and SWRTA. These recommendations also reflect travel demand benefits and socioeconomic impacts studied using the evaluation process. Finally, these projects are a result of an extensive public participation process, both through public workshops and the project Steering Committee.
Revenue forecasts were developed after a review of previous state and local expenditures, current funding trends, and likely future funding levels. The revenue forecasts involved consultation with SCDOT, the City and County of Sumter, SUATS MPO, and SWRTA. All dollar figures discussed in this section initially were analyzed in current year dollars (i.e. 2018) and then inflated to reflect projected year of funding or implementation. Based on current national standards, an annual inflation rate of 4% was used to forecast costs and revenues.
This chapter provides an overview of revenue assumptions, probable cost estimates, and financial strategies along with the detailed research results used to derive these values. Since this is a planning level funding exercise,
all funding programs, projects, and assumptions will have to be re-evaluated in subsequent plan updates.
Financial Planning Scenario The SUATS MPO currently obtains the majority of its funding through federal and state guideshare funding. This funding amount is determined largely by current and projected regional population and vehicle miles traveled compared to other regions of the state. As a result, funding levels are not expected to increase substantially over the life of this plan. These low funding levels will not be sufficient to implement many of the projects identified as a part of this study, thereby leaving many deficiencies unaddressed across all modes of transportation.
In order to mitigate this funding shortage, alternative funding sources that can be generated using other methods need to be identified. These funding sources will be discussed in greater detail at the end of this chapter.
The financial plan incorporates the current iteration of the Penny for Progress sales tax, which began in 2016. The sales tax is a 7-year initiative, with a current sunset of 2022. As a means to demonstrate a continued local commitment to support transportation improvements, the 1-cent sales tax is assumed to be renewed every 7 years to last through the duration of the plan. In order to determine a reasonable expectation for future funding, sales tax renewals were assumed to remain consistent with the $75.6 million in projected funding for the current tax. Sales tax funds are not assumed to increase with inflation at each renewal, so the amount for each remains constant until the subsequent renewal year. Following this assumption, the funding level currently being dedicated to transportation projects (20%) is assumed to continue on in future sales tax renewals. Within the sales tax, 80% of funding would be dedicated to highway capital projects and 20% would be dedicated to bicycle and pedestrian funding. This funding split is intended to demonstrate a commitment to non-motorized travel in the
SUATS MPO area while allocating the majority of funds to highway capital projects.
It is important to note that the purpose of the 2045 SUATS Long Range Transportation Plan is only to provide a reasonable expectation of future funding. The composition of any future sales tax referenda will be a topic of discussion for the City and County of Sumter, and will ultimately be decided on by voters.
System Costs and Revenues
Tables 9.1 and 9.2 show the forecasted revenues and costs for the 2045 SUATS Long Range Transportation Plan, assuming the continuation of current funding levels and the 1-cent sales tax. Funding is divided to reflect 2022 and 2035 interim years and a 2045 final plan year. Highway capital projects, highway maintenance projects, bicycle and pedestrian, transit operations, and transit capital each are divided into individual costs and revenues.
These tables indicate that using current funding level estimates total projected overall revenue during the planning period would be approximately $259.7 million. After considering the estimated costs for all modes, the total cost over the planning period would be approximately $259.3 million. Tables 9.1 and 9.2 show the forecasted revenues and costs for the LRTP.
Table 9.2: Long Range Transportation Plan Costs
Period Highway Capital
Transit Capital
Transit Operations
Pedestrian/ Bicycle
Highway Maintenance
Totals
2018-2022 $ 16,891,000 $ 1,283,000 $ 2,838,000 $ 5,400,000 $ 16,964,000 $ 43,376,000
2023-2035 $ 48,106,000 $ 3,335,000 $ 7,380,000 $ 14,040,000 $ 45,809,000 $ 118,670,000
2036-2045 $ 41,213,000 $ 2,565,000 $ 5,677,000 $ 10,800,000 $ 37,039,000 $ 97,294,000
Totals $ 106,210,000 $ 7,183,000 $ 15,895,000 $ 30,240,000 $ 99,812,000 $ 259,340,000
Table 9.1: Long Range Transportation Plan Revenue Forecast
Period Highway Capital
Transit Capital
Transit Operations
Pedestrian/ Bicycle
Highway Maintenance
Totals
2018-2022 $ 16,891,000 $ 1,283,000 $ 2,838,000 $ 5,400,000 $ 16,964,000 $ 43,376,000
2023-2035 $ 50,329,000 $ 3,335,000 $ 7,380,000 $ 14,040,000 $ 45,809,000 $ 120,893,000
2036-2045 $ 39,423,000 $ 2,565,000 $ 5,677,000 $ 10,800,000 $ 37,039,000 $ 95,504,000
Totals $ 106,643,000 $ 7,183,000 $ 15,895,000 $ 30,240,000 $ 99,812,000 $ 259,773,000

9-2 Financial Plan | Final Report | November 2018
2045 Long Range Transportation Plan
Highway Funding
Table 9.3 reflects the proposed costs and revenues for highway projects. The costs and revenues are broken up between highway capital projects and maintenance.
Maintenance Funding
Maintenance funding in the SUATS MPO area primarily is used for roadway maintenance and paving of dirt roads, though pedestrian and bicycle facilities also are maintained with these funds. Maintenance currently is funded by C-funds in this area. C-funds are based from the county gas tax. Of the total, 25% go to city road maintenance, 25% go to state road maintenance, and 50% go to the county. The county splits its 50% equally between paving dirt roads and maintenance. This fund generates approximately $1.7 million annually, an amount that is expected to rise less than 1% annually based on previous trends.
SCDOT also uses statewide funding sources for maintenance efforts such as repaving and bridge replacement. The SUATS MPO should continue regular coordination with SCDOT to determine if maintenance needs are being satisfied exclusive of guideshare funding.
Highway Capital Funding
Currently, guideshare funding received from SCDOT comprises the entire federal and state capital highway funding available in the SUATS MPO area. A range of intersection improvements and corridor revitalization plans are funded in the 2017-2022 STIP as shown in Table 9.4 on the next page (for more information on the STIP, please visit https://www.scdot.org/inside/planning-stip.aspx). Guideshare funding yields an annual amount of approximately $2.6 million. The guideshare amount received annually by SCDOT is not keeping pace with inflation; however, a guideshare increase of 3% every 10 years has been incorporated to reflect changes to the formula resulting from the decennial Census. With the completion of debt service in 2020, SUATS will receive their full amount of guideshare money.
The Penny for Progress sales tax is currently being used to fund several different highway capital improvements, including intersection improvements, interchange rehabilitation, and sidewalk safety improvements. As described above, this funding source is assumed to continue, with 80% of its transportation funds being allocated to highway capital projects.
Once the funding levels have been established, the next step is to consider what needs to be filled within the three horizon year periods of the plan. To do this, the evaluation matrices shown in Chapter 5 has been consulted. While it would be ideal to implement all of these projects, only a portion can be accommodated in the funded plan.
The following tables and figures divide the projects in the evaluation matrix into 2022, 2035, and 2045 funded horizon years and a vision plan. Tables 9.3, 9.4, 9.5, 9.6 and 9.7 show projects during each of these three horizons. It should be noted that both New Frierson Road and New Frierson Road-Unconnected may be considered for federal Department of Defense funding, meaning that they may potentially advance independent of SCDOT funding availability. The map displayed as Figure 9.1 shows the financially constrained highway projects. Figures 9.2 and 9.3 depict the changes in congestion based on the build out of the financially constrained and vision plan projects. Congestion following the build out of the financially constrained projects changes little from existing congestion other than along Alice Drive at W. Liberty Street. The majority of congestion is lessened or removed altogether following the build out of the vision plan.
Bicycle and Pedestrian Funding
Table 9.8 reflects the proposed costs and revenues for bicycle and pedestrian projects. In the past, new bicycle and pedestrian facilities in the SUATS MPO area have been funded using the Transportation Enhancement program. Enhancement funds have historically been available from the state annually as a part of STP and guideshare funding sources. In order for enhancement funds to be used, these funds required a 20% local match. SUATS has $888,857 allocated in the 2017-2022 SUATS TIP for bicycle and pedestrian projects using enhancement funds.
The MAP-21 legislation combined the Enhancement, Recreational Trails, and Safe Routes to School programs and combined them into a new Transportation Alternatives (TA) funding source, a funding source that was continued as part of the FAST Act. TA funds are competitive in nature, rather than a fixed allocation. For the purposes of this plan, it is
assumed that an annual amount similar to what is currently available will continue through the life of the plan. This funding level expresses the desire of the SUATS MPO area to continue to pursue and receive funding for future bicycle and pedestrian projects.
Considering the current and projected funding sources from the state, matched with a 20% assumption for bicycle and pedestrian funds being generated out of the transportation portion of a renewed 1-cent sales tax, approximately $30.2 million will be available for bicycle and pedestrian funding over the life of this plan. It is anticipated that the total cost of bicycle and pedestrian facilities in the 2045 SUATS Long Range Transportation Plan will exceed the available revenues.
Period Costs Revenues Difference
2018-2022 5,400,000$ 5,400,000$ -$
2023-2035 14,040,000$ 14,040,000$ -$
2036-2045 10,800,000$ 10,800,000$ -$
Totals 30,240,000$ 30,240,000$ -$
* Maintenance expenses accounted for under roadways.
Table 9.8: Pedestrian & Bicycle Costs and Revenues*
Capital Maintenance Total Capital Maintenance Total
2018-2022 16,891,000$ 16,964,000$ 33,855,000$ 16,891,000$ 16,964,000$ 33,855,000$ -$
2023-2035 48,106,000$ 45,809,000$ 93,915,000$ 50,329,000$ 45,809,000$ 96,138,000$ 2,223,000$
2036-2045 41,213,000$ 37,039,000$ 78,252,000$ 39,423,000$ 37,039,000$ 76,462,000$ 433,000$
Totals 106,210,000$ 99,812,000$ 206,022,000$ 106,643,000$ 99,812,000$ 206,455,000$ 433,000$
DifferenceCosts Revenue
Table 9.3: Highway Costs and Revenues
Period

9-3 Financial Plan | Final Report | November 2018
2045 Long Range Transportation Plan
Table 9.4: Committed Roadway Projects in the 2018-2022 State Transportation Improvement Program
Funding Sources
Project Project Type FY 2018 FY 2019 FY 2020 FY 2021 FY 2022 Total 2018-2022
STBGP Pinewood Road at McCrays Mill Road Intersection Improvements $ 200,000 $ 1,000,000 $ 1,200,000
HSP US 378 at SC 763 Intersection Improvements $ 650,000 $ 650,000
HSP US 521 at Camden Highway Intersection Improvements $ 370,000 $ 370,000
Sales Tax Appropriation
Earmark Manning Avenue Revitalization Plan Project $ 1,064,000 $ 7,182,000 $ 8,246,000
Sales Tax Appropriation
N Main Street Revitalization Plan Project $ 1,064,000 $ 7,182,000 $ 8,246,000
STBGP MTN NHP
SFP
Sumter County Pavements Pavement Rehabilitation $ 7,142,000 $ 761,000 $ 7,903,000
NHP US 76 Bypass over US 15 Bridge Replacement $ 100,000 $ 5,700,000 $ 5,800,000
NHP US 76 Bypass over US 76 Bridge Replacement $ 50,000 $ 5,900,000 $ 5,950,000
STBGP = State Transportation Block Grant Program
HSP = Highway Safety Program
MTN = Maintenance
NHP = National Highway Program

9-4 Financial Plan | Final Report | November 2018
2045 Long Range Transportation Plan
Table 9.5: Roadway Projects for 2035 Interim Year
Project ID Project Project Extents Length (miles)
2018 Project Cost Estimate
Future Year Cost
Roadway Operations Projects
PP US 76/378/Broad Street Loring Mill Road to US 76 Split 7.98 $ 4,630,000 $ 7,128,000
OO US 521/Camden Highway Thomas Sumter Highway to Robert Graham Freeway 1.75 $ 1,020,000 $ 1,570,000
S Lafayette Drive Pocalla Road to US 76/378 3.60 $ 2,090,000 $ 3,217,000
EE Pocalla Road S Guignard Drive to Lafayette Drive 1.10 $ 640,000 $ 985,000
G Broad Street US 76/378 to Washington Street 3.15 $ 1,830,000 $ 2,817,000
H Bultman Drive Broad Street to Miller Road 0.87 $ 510,000 $ 785,000
GG S Pike W N Bultman Drive to Russel Avenue 1.24 $ 720,000 $ 1,108,000
B Bradford Street & S Purdy Street S Guignard Drive to Oakland Avenue 0.25 $ 150,000 $ 231,000
Y N Pike W Bordeaux Avenue to N Main Street 0.17 $ 100,000 $ 154,000
DD Pitts Road Wedgefield Highway to McCrays Mill Road 1.00 $ 80,000 $ 893,000
II N Saint Pauls Church Road Cane Savannah Road (S-370) to Patriot Parkway 4.73 $ 2,750,000 $ 4,233,000
R S Kings Highway US 76/378 to Cane Savannah Road (S-539) 0.33 $ 200,000 $ 308,000
NN US 15N/N Main Street/N Lafayette Dr Loring Drive to Brewington Road 2.78 $ 1,620,000 $ 2,494,000
U W Liberty Street N Washington Street to Wedgefield Road 2.43 $ 1,410,000 $ 2,171,000
Intersection Improvement Projects
2 US 76/378 and S-40 Broad Street & N St Pauls Church Road $ 3,000,000 $ 4,618,000
20 US 521 and SC 763 N Guignard Drive/S Guignard Drive & W Liberty Street $ 3,500,000 $ 5,388,000
3 US 76/378 S-204 Broad Street & Loring Mill Road $ 3,000,000 $ 4,618,000
10 US 76/378 and S-490 Broad Street & Robert Dinkins Road $ 3,500,000 $ 5,388,000

9-5 Financial Plan | Final Report | November 2018
2045 Long Range Transportation Plan
Table 9.6: Roadway Projects for 2045 Horizon Year
Project ID Project Project Extents Length (miles)
2018 Project Cost Estimate
Future Year Cost
Roadway Widening Projects
A Alice Drive Wise Drive (S-43-380) to Liberty Street (S-763) 1.36 $ 14,390,000 $ 34,103,000
Intersection Improvement Projects
6 US 76/278 and S-673 Broad Street & Mason Road $ 3,000,000 $ 7,110,000
Table 9.7: Roadway Projects for Vision Plan
Project ID Project Project Extents Length (miles)
2018 Project Cost Estimate
Vision Cost
Roadway Operations Projects
SS Wesmark Boulevard/Carter Road Broad Street (US 76) to Broad Street Extension (S-1429) 2.80 $ 1,630,000 $ 4,888,000
X McCrays Mill Road S Saint Pauls Church Road to S Guignard Drive 5.77 $ 3,350,000 $ 10,046,000
AA Old Manning Road US 15 to Twelve Bridges Road (S-32) 6.35 $ 3,690,000 $ 11,065,000
CC Pinewood Road Wedgefield Road to Stadium Road 1.62 $ 940,000 $ 2,819,000
J Cains Mill Road S Saint Pauls Church Road (S-40) to Clipper Road (S-486) 3.58 $ 2,080,000 $ 6,237,000
M Cane Savannah Road S Kings Highway (SC 261) to N Saint Pauls Church Road (S-40)
4.77 $ 2,770,000 $ 8,306,000
P Frierson Road Shaw AFB Frierson Road Gate to US 521 2.60 $ 1,510,000 $ 4,528,000
LL Twelve Bridges Road Old Manning Road (S-25) to US 521 2.00 $ 1,170,000 $ 3,508,000
E W Brewington Road US 521 to US 15 5.44 $ 3,160,000 $ 9,476,000
QQ W Calhoun Street N Guignard Drive to N Washington Street 1.06 $ 620,000 $ 1,859,000
F E Brewington Road US 15 to US 378 10.00 $ 5,800,000 $ 17,392,000
FF Red Bay Road US 15 to Coleman Street 1.30 $ 760,000 $ 2,279,000

9-6 Financial Plan | Final Report | November 2018
2045 Long Range Transportation Plan
Table 9.7: Roadway Projects for Vision Plan (continued)
Project ID Project Project Extents Length (miles)
2018 Project Cost Estimate
Vision Cost
Roadway Operations Projects
O Clipper Road Cains Mill Road (S-458) to US 15 1.42 $ 830,000 $ 2,489,000
Roadway Widening Projects
K Camden Highway Queen Chapel Road (S-92) to US 521 3.28 $ 31,770,000 $ 95,269,000
BB Patriot Parkway Loring Mill Road (S-370 to Camden Highway 7.98 $ 79,320,000 $ 237,857,000
HH N Saint Pauls Church Road Cane Savannah Road (S-370) to Patriot Parkway 4.73 $ 45,800,000 $ 137,341,000
RR Wedgefield Road Deschamps Road (S-93) to Pinewood Road 2.29 $ 22,150,000 $ 66,421,000
Q S Kings Highway US 76/378 to Cane Savanah Road (S-539) 0.33 $ 3,250,000 $ 9,746,000
MM US 15 Nettles Road (S-251) to Pearson Road (S-131) 3.71 $ 35,890,000 $ 107,623,000
V Loring Mill Road US 76/378 to S Wise Drive (S-380) 2.47 $ 23,920,000 $ 71,729,000
UU S Wise Drive Loring Mill Road (S-208) to Alice Drive (SC 120) 2.88 $ 23,180,000 $ 69,510,000
Z Old Manning Road US 15 to Twelve Bridges Road (S-32) 6.35 $ 61,480,000 $ 184,360,000
TT Wesmark Boulevard/Carter Road Broad Street (US 76) to Broad Street Extension (S-1429) 2.80 $ 27,870,000 $ 83,574,000
L Cane Savannah Road S Kings Highway (SC 261) to N Saint Pauls Church Road (S-
40) 4.77 $ 46,140,000 $ 138,360,000
W Mason Road Weldon Drive to Camden Highway (US 521) 0.87 $ 8,420,000 $ 25,249,000
I Cains Mill Road S Saint Pauls Church Road (S-40) to Clipper Road (S-486) 3.58 $ 34,650,000 $ 103,905,000
T Lewis Road McCrays Mill Road (S-33) to US 15 3.05 $ 14,250,000 $ 42,732,000
C W Brewington Road US 521 to US 15 5.44 $ 52,670,000 $ 157,942,000
D E Brewington Road US 15 to US 378 10.00 $ 96,820,000 $ 290,334,000
KK Twelve Bridges Road Old Manning Road (S-25) to US 521 2.00 $ 19,400,000 $ 58,175,000
JJ Terry Road Carter Road (S-467) to Mason Road 0.74 $ 7,180,000 $ 21,531,000

9-7 Financial Plan | Final Report | November 2018
2045 Long Range Transportation Plan
Table 9.7: Roadway Projects for Vision Plan (continued)
Project ID Project Project Extents Length (miles)
2018 Project Cost Estimate
Vision Cost
Roadway Widening Projects
N Clipper Road Cains Mill Road (S-458) to US 15 1.42 $ 13,740,000 $ 41,202,000
New Location Roadway Projects
B1 New Frierson Road Patriot Parkway to Frierson Road 1.41 $ 9,730,000 $ 29,177,000
D1 New Frierson Road- Unconnected Patriot Parkway to Elm Street 1.04 $ 5,210,000 $ 15,623,000
A1 Alice Drive Extension US 521 to Wise Drive 1.44 $ 16,770,000 $ 50,288,000
C1 Red Bay Road Coleman Street to US 76/378 2.58 $ 31,570,000 $ 94,669,000
Intersection Improvement Projects
5 US 76/378 and S-91 & L-91 Broad Street & Stamey Livestock Road $ 3,500,000 $ 10,495,000
22 SC 763 and SC 120 Wedgefield Road & W Liberty Street/Pinewood Road $ 3,500,000 $ 10,495,000
21 SC 120 and SC 763 Alice Drive & W Liberty Street $ 3,500,000 $ 10,495,000
7 US 76/378 and S-467 Broad Street & Wilson Hall Road $ 3,500,000 $ 10,495,000
13 US 76 Bus/378 and S-269 & S-380 Broad Street & Wise Drive $ 3,500,000 $ 10,495,000
19 US 15 and US 76 Bus N Lafayette Drive & E Liberty Street $ 3,500,000 $ 10,495,000
9 US 521 and S-911 Camden Highway & Alice Drive $ 3,500,000 $ 10,495,000
1 US 76/378 and S-370 Broad Street & Eagle Road $ 3,500,000 $ 10,495,000
17 US 76 Bus/378 and US 401 & S-401 N Washington Street & W Calhoun Street $ 3,500,000 $ 10,495,000
15 US 76/378 Bus and S-55 Broad Street & Miller Road $ 3,500,000 $ 10,495,000
25 US 15S and S-25 US 15S & Lewis Road/Old Manning Road $ 3,500,000 $ 10,495,000
14 US 521 and S-55 N Guignard Drive & Miller Road $ 3,500,000 $ 10,495,000
26 S-380 and S-644 Wise Drive & N Guignard Drive $ 3,500,000 $ 10,495,000
27 S-644 & S-1268 and S-276 N Guignard Drive & Gion Street $ 3,500,000 $ 10,495,000

9-8 Financial Plan | Final Report | November 2018
2045 Long Range Transportation Plan

9-9 Financial Plan | Final Report | November 2018
2045 Long Range Transportation Plan

9-10 Financial Plan | Final Report | November 2018
2045 Long Range Transportation Plan

9-11 Financial Plan | Final Report | November 2018
2045 Long Range Transportation Plan
Transit Funding
Table 9.9 reflects the proposed costs and revenues for transit capital and operations projects. Detailed annual cost and revenue projections for capital and operations projects were developed by SWRTA and served as the basis for expected revenue and expenditures for the Urbanized Area of SWRTA.
Federal transit funding went through a shift as a result of the MAP-21 and FAST Act legislation. This plan assumes a continued funding level consistent with historical funding for both transit capital and operations projects.
Capital Transit Funding
Capital transit funds come from several federal and state sources. Currently, SWRTA receives Federal 5307, 5310, 5311, and State funds. The funding amounts are projected to increase with inflation. The total capital transit funding available for the Urbanized Area of SWRTA totals approximately $13.4 million.
Transit Operations Funding
Transit operations funding comes from Federal 5307 grants, State funds, City funds, local cash fares, local contracts, and other local miscellaneous sources. The transit operations funding for the Urbanized Area of SWRTA is projected to total approximately $15.9 million over the life of the LRTP. Funding from each of these sources is expected to increase with inflation. For more information on SWRTA, see http://www.swrta.com/.
Alternative Funding Strategies Based on the revenue assumptions developed in this financial plan, the total projected cost for all highway capital projects within the SUATS MPO area is approximately $2.5 billion. Of this total, approximately $2.4 billion is expected to remain unfunded during the 2045 horizon year. Unmet transit needs exist in both capital and operational categories. As a result, it is important to identify potential funding sources for these projects as well as for projects from other modes.
State revenues alone will not sufficiently fund a systematic program of constructing transportation projects in the SUATS MPO area. Therefore, the MPO must consider alternative funding measures that could allow for the implementation of this plan. One alternative funding measure, a 1-cent sales tax, has already been implemented and has been found to produce dramatic results. Several alternative funding measures under consideration in other areas follow.
Impact Fees
Developer impact fees and system development charges provide another funding option for communities looking for ways to fund collector streets and associated infrastructure. They are most commonly used for water and wastewater system connections or police and fire protection services, but recently they have been used to fund school systems and pay for the impacts of increased traffic on existing roads. Impact fees place the costs of new development directly on developers and indirectly on those who buy property in the new developments. Impact fees free other taxpayers
from the obligation to fund costly new public services that do not directly benefit them. A few communities in South Carolina have approved the use of impact fees (e.g., Berkeley County). The use of impact fees requires special authorization by the South Carolina General Assembly.
Transportation Bonds
Transportation bonds have been instrumental in the strategic implementation of local roadways and non-motorized travel throughout South Carolina. Voters in communities both large and small regularly approve the use of bonds in order to improve their transportation system. Projects that historically have been funded through transportation bonds include sidewalks, road extensions, new road construction, and streetscape enhancements.
Developer Contributions
Through diligent planning and earlier project identification, regulations, policies, and procedures could be developed to protect future arterial corridors and require contributions from developers when the property is subdivided. These measures would reduce the cost of right-of-way and would in some cases require the developer to make improvements to the roadway that would result in a lower cost when the improvement is actually constructed. To accomplish this goal, it will take a cooperative effort between local planning staff, SCDOT planning staff, and the development community.
One area where developers can be expected to assist in the implementation of transportation improvements is for new collector streets. Collector streets support the traffic impacts associated with local development. For this reason, developer contributions should be responsible sharing the cost of these improvements.
Oversize Agreement
An oversize agreement provides cost sharing between the city/county and a developer to compensate a developer for constructing a collector street instead of a local street. For example, instead of a developer constructing a 28-foot back-to-back local street, additional funding would be provided by the locality to upgrade the particular cross-section to a 34-foot back-to-back cross section to accommodate bike lanes.
Grant Anticipation Revenue Vehicles (GARVEE)
Bonds
GARVEE Bonds can be utilized by a community to implement a desired project more quickly than if they waited to receive state or federal funds. These bonds are let with the anticipation that federal or state funding will
Table 9.9: Transit Costs and Revenues
Period Costs Revenue
Difference Capital Operations Total Capital Operations Total
2018-2022 $ 1,283,000 $ 2,838,000 $ 4,121,000 $ 1,283,000 $ 2,838,000 $ 4,121,000 $ -
2023-2035 $ 3,335,000 $ 7,380,000 $ 10,715,000 $ 3,335,000 $ 7,380,000 $ 10,715,000 $ -
2036-2045 $ 2,565,000 $ 5,677,000 $ 8,242,000 $ 2,565,000 $ 5,677,000 $ 8,242,000 $ -
Totals $ 7,183,000 $ 15,895,000 $ 23,078,000 $ 7,183,000 $ 15,895,000 $ 23,078,000 $ -

9-12 Financial Plan | Final Report | November 2018
2045 Long Range Transportation Plan
be forthcoming. In this manner, the community pays for the project up front, and then receives debt service from the state. GARVEE bonds also are an excellent way to capitalize on lower present-day construction and design costs, thereby finishing a project more quickly and economically than if it was delayed to meet state timelines.
Better Utilizing Investments to Leverage Development
BUILD Transportation Program
BUILD Transportation grants will replace the existing Transportation Investment Generating Economic Recovery (TIGER) grant program beginning FY 2018. The grants are to be used for “investments in surface transportation infrastructure and are to be awarded on a competitive basis for projects that will have a significant local or regional impact.” (USDOT) Additionally, funding from these grants can help to support bridges, transit, rail, intermodal transportation, and ports in addition to roads.
Bicycle and Pedestrian Funding
Bicycle and pedestrian projects are often eligible for their own funding sources. For instance, the Robert Wood Johnson foundation funds a grant program called Active Living by Design. The purpose of this program is to provide communities with a small grant to study bicycle, pedestrian, or other healthy living initiatives. There are other such grant programs in existence for bicycle and pedestrian projects, which would help to supplement the funding currently received by these modes.
Aesthetic Enhancement Funding
In order to create a more pleasing transportation system, small aesthetic improvements often have a large impact. Sumter already has local businesses adopt decorative signs that serve as a gateway to the community. SCDOT has two formal programs to help provide an avenue for community involvement in the transportation system. The Adopt-A-Highway program allows individuals or groups to help maintain a part of the highway system. SCDOT’s Adopt-An-Interchange program actually provides 80% funding towards landscaping and beautifying an interchange, with only a 20% local match. This initiative is a part of the state’s enhancement funding program.
Transportation Alternatives Program Grants
State and federal grants can play an important role in implementing strategic elements of the transportation network. Several grants have multiple applications, including Transportation Alternatives Program (TAP) Grants as well as state and federal transit grants. TAP, established by Congress through MAP-21, combines the Enhancement Grant program, Recreational Trails program, and Safe Routes to School (SRTS) program into one competitive funding source. TAP ensures the implementation of projects not typically associated with the road-building mindset. While the construction of roads is not the intent of the grant, the construction of bicycle and pedestrian facilities is one of many enhancements that the grant targets and could play an important role in enhancing the bicycle and pedestrian safety and connectivity in the SUATS MPO area.
For additional information on alternative funding strategies please consult the following websites:
GARVEE Bonds
https://www.fhwa.dot.gov/ipd/finance/tools_programs/federal_debt_financing/garvees/
Bicycle and Pedestrian Funding
https://healthyplacesbydesign.org/
http://www.pedbikeinfo.org/planning/funding.cfm
Adopt-A-Highway
http://palmettopride.org/adopt-a-highway/
Transportation Alternatives Program Grants
https://www.fhwa.dot.gov/environment/transportation_alternatives/

9-13 Financial Plan | Final Report | November 2018
2045 Long Range Transportation Plan
This page intentionally left blank.

CHAPTER 10 — IMPLEMENTATION PLAN
2045 Long Range Transportation Plan
10-1 Implementation Plan | Final Report | November 2018
Introduction All long range plans benefit from a good implementation or action plan. Taking action on the many recommendations in the SUATS 2045 Long Range Transportation Plan requires attention to several factors, not the least of which is the ability to secure funding. The SUATS MPO area has risen to the challenge of diminishing state and federal revenues in recent years through the passage of the Penny for Progress sales tax. Leaders continue to face the challenge of allocating appropriate levels of funding to the highest priority projects. The need also exists to identify cost-effective projects that provide additional safety improvements or protect specific corridors through enhanced access management strategies. Lastly, given the scarcity of federal dollars coming to the region and the anticipated population and employment growth, we can expect the quality of the SUATS transportation system to diminish without continued support from alternative funding sources. Renewal of the 1-cent sales tax along with innovative financing strategies like transportation bonds, developer impact fees, vehicle registration fees, or a combination thereof will be needed over the next decade to maintain the quality of life and economic vitality of the region.
To adopt and implement the plan, the MPO’s Policy Board and Sumter City-County Planning Department must work proactively with stakeholders such as:
▪ Citizens and businesses
▪ South Carolina Department of Transportation
▪ Santee Wateree Regional Transportation Authority (SWRTA)
▪ City of Sumter
▪ Sumter County
▪ Shaw Air Force Base
▪ Private Development Industry
▪ Elected leadership in the South Carolina General Assembly
▪ Santee Lynches Regional Council of Governments
Completion of the SUATS 2045 Long Range Transportation Plan represents an important step toward implementing multimodal improvements that affect travel safety, mobility, development patterns, and the aesthetics of
the Sumter region. Some of the recommended improvements will be implemented through the development review process. Major infrastructure improvements most likely will be a product of state and federal funding. Continued funding through a 1-cent sales tax renewal could be put toward spot improvements or as matching funds for major infrastructure needs.
During the course of this study a number of transportation and land development issues were raised by citizens, including frustration over delays in getting transportation improvements completed. Unfortunately, the planning, design, and construction of publicly-funded transportation projects typically takes 10 years or longer in environmentally-sensitive areas. Local, state, and private partnerships offer strategic advantages to implementing improvements on a timely basis. The implementation plan recognizes each challenge and suggests strategies to address them. General recommendations and actions strategies follow to help the SUATS MPO area achieve its goals.
Responsible Agencies
To fully implement the plan, the region must identify stable, timely, and equitable methods of funding. Some municipalities are negotiating with developers to share responsibility for the “cost of growth” and eventually shift these costs to home buyers and businesses. It is expected that similar debates will occur in other communities throughout the region before the next update to the state’s Transportation Improvement Program (TIP). Evolution toward a creative and effective mix of funding from various sources and stakeholders in the economy and transportation system of this region is a worthy goal.
To successfully implement this plan, responsible agencies with influence and authority to enact recommendations have been identified. Policy and program initiatives, for the most part, will occur at the local level. Some of the proposed transportation improvements will encompass right-of-way that is owned by different public or private agencies, and some improvements will occur as a result of development and redevelopment opportunities. However, the majority of responsibility for implementing these recommendations will require a coordinated effort between SCDOT and the SUATS MPO.
Action Plan The following action items list appropriate steps for local leaders to implement the recommendations of this plan and key agencies that should be involved with the task. Some of the tasks are recommended to be initiated during the first two to four years following the completion of the plan to take advantage of momentum gained during the planning process. While all the listed items are not expected to be completed within this time frame, the process should be initiated.
Beyond the tasks listed below, the success of this plan hinges on the City and County continuing to work with and educate local citizens and businesses. While public support can encourage implementation, opposition can significantly delay a project.
General Action Items
▪ Adopt the SUATS 2045 Long Range Transportation Plan. As a part of FWHA’s FAST Act requirements, federal funds cannot be allocated to a local highway project without it being a part of a mutually adopted, financially-constrained plan.
▪ Once adopted by the MPO, the plan should be submitted to
SCDOT Planning Office. The plan will then be forwarded to the Federal Highway Administration staff in Columbia.
▪ Request inclusion of high-priority projects in the next update of the state’s Transportation Improvement Program (TIP).
▪ Create a citizen-based standing committee that will encourage and educate the public as well as seek to aid in the implementation of this plan.
The SUATS MPO area has risen to the challenge of diminishing state and federal revenues in recent years through the passage of the Penny for Progress sales tax.

10-2 Implementation Plan | Final Report | November 2018
2045 Long Range Transportation Plan
▪ As areas are developed and redeveloped, introduce traffic calming improvements to minimize impacts that negatively affect the character and integrity of adjacent neighborhoods.
▪ Promote alternative modes of transportation through better street design and improved developer participation.
▪ As physical infrastructure improvements are made, avoid and/or
minimize impacts to environmentally sensitive areas to preserve the natural environment.
▪ Proactively support bicycle and pedestrian provisions in all SCDOT
street improvements.
▪ Create aesthetic gateways (at key locations along major radial routes) that invite and welcome citizens and visitors to the SUATS region.
▪ Implement access management policies and construct measures that create a balance between the need for access to the transportation system and the desire to protect the mobility of major corridors. The recommendations in Chapter 5 emphasize the protection of existing roadways through the inclusion of plantable medians and better access management design.
▪ Discuss the possibility of introducing the renewal of the Penny for Progress sales tax following the current program’s expiration in 2022. Local leaders at the City and County levels will need to be consulted to identify potential needs and distribution of funds across improvement types.
Policy Action Items
▪ As a requirement of the MAP-21 and FAST Acts, local highway improvements should be based on an analysis that reflects regional congestion needs. This report identifies grouped prioritization (high, medium, and low) of projects based on the need for addressing current and long-term congestion needs. With this in mind, SUATS transportation decision-makers should revisit the prioritization of highway needs (Chapter 5) based on their own annual state TIP update process.
▪ The SUATS MPO area and its affiliated agencies should adopt a “Complete Streets” policy that establishes the need to accommodate bicycle, pedestrian, and transit safety and mobility as
well vehicular needs to encourage a well-balanced transportation system.
▪ Revise local ordinances to require subdivisions larger than 100
dwelling units to include at least two points of access from a publicly maintained street and at least one stub-out street to extend and connect with future streets (where applicable).
▪ Create a US 76/378 Broad Street Corridor Overlay District within the City of Sumter’s Zoning Ordinance that will implement the intent of this plan. Items that should be addressed in the Overlay District include street signage control, streetscape elements, landscaping, access and cross access, parking, and building orientation and frontage.
Roadway Improvement Action Items
Short-Term Action Items (1 – 5 years implementation)
▪ Pursue “spot safety funds” through the SCDOT District
office. Funds are needed for immediate improvements to the following locations based on three-year crash statistics. Also, continue to coordinate with SCDOT to ensure that intersections currently programmed for improvement are addressed in the near term. These projects would not be slated to receive short-term funding without specific funding provided by SCDOT for their construction.
o Work with SCDOT to advance the projects in the 2017-2022 STIP. Allocate available guideshare funds to facilitate completion of high-priority improvements. In addition, allocate funds to facilitate completion of ongoing projects partially funded by the penny sales tax.
o Continue to advance the transportation projects in the Penny for Progress program.
Mid-Term Action Items (6 – 17 years implementation)
▪ Work with SCDOT officials and available local funding sources to actively pursue planning, engineering, and construction dollars for the following operational and design improvement projects:
o US 76/378/Broad Street
o US 521/Camden Highway
o Lafayette Drive
o Pocalla Road
o Broad Street
o Bultman Drive
o S Pike W
o Bradford Street & S Purdy Street
o N Pike W
o Pitts Road
o N Saint Pauls Church Road
o S Kings Highway
o US 15N/N Main Street/N Lafayette Dr
o W Liberty Street
▪ Work with SCDOT officials and available local funding sources to actively pursue planning, engineering, and construction dollars for the following intersection improvement projects:
o US 76/378 and S-40
o US 521 and SC 763
o US 76/378 S-204
o US 76/378 and S-490
▪ Aggressively pursue FAST Act Transportation Alternatives Program funding to provide sidewalk connections between existing sidewalks and high traffic pedestrian areas.

10-3 Implementation Plan | Final Report | November 2018
2045 Long Range Transportation Plan
** Project prioritization based on SCDOT Act 114 project rankings and conversations with project staff (Chapter 5) as well as projected funding levels and reflects FAST Act compliance with congestion mitigation.
Long-Term Action Items (18 – 27 years implementation)
▪ Work with SCDOT officials and available local funding
sources to actively pursue planning, engineering, and construction dollars for the following operational and design improvement projects:
o Alice Drive
▪ Work with SCDOT officials and available local funding
sources to actively pursue planning, engineering, and construction dollars for the following intersection improvement projects:
o US 76/378 and S-673
▪ Aggressively pursue FAST Act Transportation Alternatives
Program funding to provide sidewalk connections between existing sidewalks and high traffic pedestrian areas.
** Project prioritization based on SCDOT Act 114 project rankings and conversations with project staff (Chapter 5) as well as projected funding levels and reflects FAST Act compliance with congestion mitigation.
Bicycle and Pedestrian Improvement
Action Items
▪ Adopt a policy that states all new collector streets and arterials must accommodate provisions for bicycles and pedestrians. Refer to project sheets in Chapter 5 for proposed bicycle and pedestrian facilities on widening and new location projects.
▪ Aggressively pursue FAST Act Transportation Alternatives Program funding to complete the following high-priority bicycle projects consistent with recommendations in Chapter 6:
o Wise Drive should be retrofitted to include wide outside lanes from Loring Mill Road to the Cypress Trail.
o Red Bay Road should be retrofitted to include wide outside lanes from South Main Street to Boulevard Road.
o Brewington Road should be retrofitted to include wide paved shoulders from Thomas Sumter Highway (US 521) north of Sumter to US 378 east of the SUATS boundary.
o Jefferson Road should be retrofitted to include wide paved shoulders from Camden Highway (US 521) to Queen Chapel Road.
o McCrays Mill Road should be retrofitted to include wide paved shoulders from St. Pauls Church Road to Stadium Road.
▪ Aggressively pursue FAST Act Transportation Alternatives Program funding to provide sidewalk connections between existing sidewalks and high traffic pedestrian areas, including:
o Palmetto Park
o USC at Sumter
o Central Carolina Technical College
o Willow Drive Elementary School
o Alice Drive Elementary School
o Alice Drive Middle School
o Sumter High School
▪ Aggressively pursue FAST Act Transportation Alternatives Program funding to implement the following high-priority multi-use path locations:
o Shot Pouch Greenway – The Shot Pouch Greenway, when complete, will connect the city like a vertical spine, starting at Dillon Park, crossing the 378 Bypass, Broad Street, Guignard Drive, Liberty Street and Swan Lake to end at McCrays Mill Road.
▪ Establish the following bicycle- and pedestrian-related
programs:
o Education — New and experienced bicyclists need to be made aware of where suitable routes are and what destinations can be accessed. Motorists, pedestrians, and cyclists need to understand
the “rules of the road” to keep themselves safe while operating not only on but also adjacent to these facilities. Consider various means of educating the public in these regards.
o Encouragement — People need to be encouraged to walk and bicycle. The more desirable the region becomes for pedestrians and cyclists (by providing more destinations oriented for them), the more successful these modes will become. Set a goal regionally and locally to be widely recognized as bicycle-friendly.
o Enforcement — Work with local and county law enforcement officials to ensure laws pertaining to the interaction between motorists and pedestrians/cyclists are obeyed. Ensure high proportions (more than 90%) of such citations are upheld in court.
o Parking — Consideration should be given to providing bicycle parking at key destination points throughout the region. Some potential areas include, but are not limited to, malls, theaters, parks, central business districts, libraries and schools. The cost for such amenities ranges from a few hundred to several thousand dollars, depending on the type and quality of the facility. A program to partially subsidize the cost could be considered. The following specific locations should be considered high priority:
▪ The SUATS MPO should work cooperatively with the Safe
Routes to School committee, the Sumter Chain Gang Cycling Club and other local constituents to initiate the following programs to better integrate bicycle and pedestrian facilities into the community:
o Initiate a Safe Routes to School Program
o Publicize and participate in the National Walk to School Day
o Initiate annual rideabouts and bike rodeos
o Participate in the School-Based Safety Education Program
o Develop public services announcements to encourage a healthy community through enhanced cycling and walking

10-4 Implementation Plan | Final Report | November 2018
2045 Long Range Transportation Plan
Transit Improvement Action Items
▪ Consider the following changes and improvements to the existing SWRTA service:
o Active promotions of existing bus route services by mass media advertisements, place bus schedules in public places such as shopping mall, schools, and grocery stores.
o Improve the “on call”-demand response service by restructuring system requiring 24 hour advance call in and provide pick up services along major roadway intersections.
o Assign one vehicle (mini- van or 15 passenger bus) for “call in” –demand response services for reducing costs of operations.
o Designate an “at pulse” transfer point at the Wesmark Plaza by the Staples and Big Lots stores for Bus Routes 7, and 9 and 4 for free transfer.
o Install more bus stop sign poles with bus schedules posted.
o Eliminate Bus Route 8 service due to low ridership. Instead, assign another 15 passenger bus or mini-van to “on call” demand response system to transport customers to and from the Vocational Rehabilitation Center on North Main.
o Consider modifications to the SWRTA fixed route service to better accommodate demand as outlined in Chapter 7.
o Conduct a ridership survey.
o Develop a transit master plan.
o Introduce a coordinated marketing plan.
o Extend duration of routes.
o Utilize the master planning process to assess current service and explore changes in route frequency and duration.
o Improve the quality of taxicab services.
o Identify satellite transfer stations for future expansion.
▪ Develop future transit expansion and system modifications based on the growth within the region by:
o Promoting coordination and collaborative partnerships between the urban and rural transportation programs of SWRTA as well as with other public transit and human service agencies
o Utilizing technology to ensure reliability of the transit system
o Ensuring future routes are responsive to future land use patterns
o Locating public transit within walking distance to civic land uses
o Maximizing the use of the James E. Clyburn Intermodal Transportation Center
▪ Services for commuters must be a priority for the regional transportation system. Enhance service by expanding carpool matching service and SmartRide service in the Sumter market.
▪ Increase passenger amenities such as sidewalks, shelters, and
benches by enhancing bus stops and coordinating upgrades to transit stops with improvements to the pedestrian and bicycle network.
▪ Coordinate upgrades to transit stops with improvements to the pedestrian and bicycle network.
Freight Improvement Action Items
▪ Designate truck routes and sign appropriately as recommended in Chapter 8. Truck route signage should be posted at the city limits, highway exits, and other appropriate locations directing truck drivers to those streets on which their movements are permitted. Consolidated truck routes should be clearly designated for the following primary routes:
o US 76/US 378 Bypass: primary east-west truck route through town
o US 15/US 521: primary north-south truck routes through town
▪ Work with SCDOT to prioritize resurfacing on designated
routes to reduce noise and vibration from trucks.
▪ Publish and distribute educational materials to businesses and industries concerning truck routes.
▪ Work with the South Carolina Trucking Association and SCDOT to create a secondary truck route between US 76/378 (west) and US 15 (south) by upgrading portions of Kings Highway (SC 261), Cane Savannah Road, St. Pauls Church Road, Cains Mill Road, and Clipper Road.
▪ Work with SCDOT to make improvements at critical
intersections on truck routes to more easily facilitate large vehicle movements and encourage their use by truckers.
▪ Adjust signal timing along high priority routes to allow uninterrupted through movements based on posted speed limits.

10-5 Implementation Plan | Final Report | November 2018
2045 Long Range Transportation Plan
This page intentionally left blank.

CHAPTER 11 — PERFORMANCE MEASURES
2045 Long Range Transportation Plan
Performance Measures | 11-1
Final Report | November 2018
What is Performance Based Planning? Performance based planning is a strategic approach that uses system information and data to make important investment and policy decisions to achieve goals set for the transportation system within the MPO. Performance based planning and programming (PBPP) refers to transportation agencies’ application of performance management as standard practice in the planning and programming processes.
The goal of PBPP is to ensure that transportation investment decisions- both long-term planning and short-term programming- are based on the ability to meet established goals. As a federal requirement, states will invest resources in projects to achieve individual targets that collectively will make progress toward national goals. MPOs are also responsible for developing LRTPs and TIPS “through a performance-driven, outcome-based approach to planning.”
National Goals As it currently stands, the Federal Highway Administration (FHWA) and the Federal Transit Administration (FTA) requires state DOTs and MPOS to monitor transportation systems using specific performance measures for both highway and transit performance respectively. While more detailed information may be provided, the following two tables outline what must be addressed at a minimum.
Table 11.1: Highway Performance Measures
National Goal Performance Area Performance Measure
PM
1
Safety- To achieve a signif icant reduction in traffic fatalities and serious injuries on all public roads
Injuries & Fatalities
▪ Number of fatalities ▪ Fatality rate (per 100 million vehicle miles
traveled)
▪ Number of serious injuries ▪ Serious injury rate (per 100 million vehicle
miles traveled)
▪ Number of non-motorized fatalities and non-motorized serious injuries
PM
2
Infrastructure Condition- To maintain the highway infrastructure asset system in a state of good repair
Pavement Condition
▪ Percentage of pavements on the Interstate System in Good condition
▪ Percentage of pavements on the Interstate System in Poor condition
▪ Percentage of pavements on the non-Interstate National Highway System (NHS) n Good condition
▪ Percentage of pavements on the non-Interstate NHS in Poor condition
Bridge Condition
▪ Percentage of NHS bridges classified as in Good condition
▪ Percentage of NHS bridges classified as in Poor condition
System Reliability- To achieve a significant reduction in congestion on the National Highway
System
Performance of the National Highway System
▪ Percent of person miles traveled on the non-Interstate NHS that are reliable
PM
3
Freight Movement and Economic Vitality- To improve the National Highway Freight Network, strengthen the ability of rural communities to access national and international trade markets, and support regional economic development
Freight Movement on the Interstate System
▪ Truck Travel Time Reliability Index
Congestion Reduction- To achieve a significant reduction in congestion on the National Highway System
Traffic Congestion ▪ Annual hours of peak-hour excessive delay per
capita ▪ Percent of non-single-occupant vehicle travel
Environmental Sustainability*- To enhance the performance of the transportation system while protecting and enhancing the natural environment
On-Road Mobile Source Emissions*
▪ Total emissions reduction*
*Only applies in non-attainment or maintenance areas
over a prescribed population threshold.
Flow chart describing the process for Performance Management, provided by the National Highway Institute
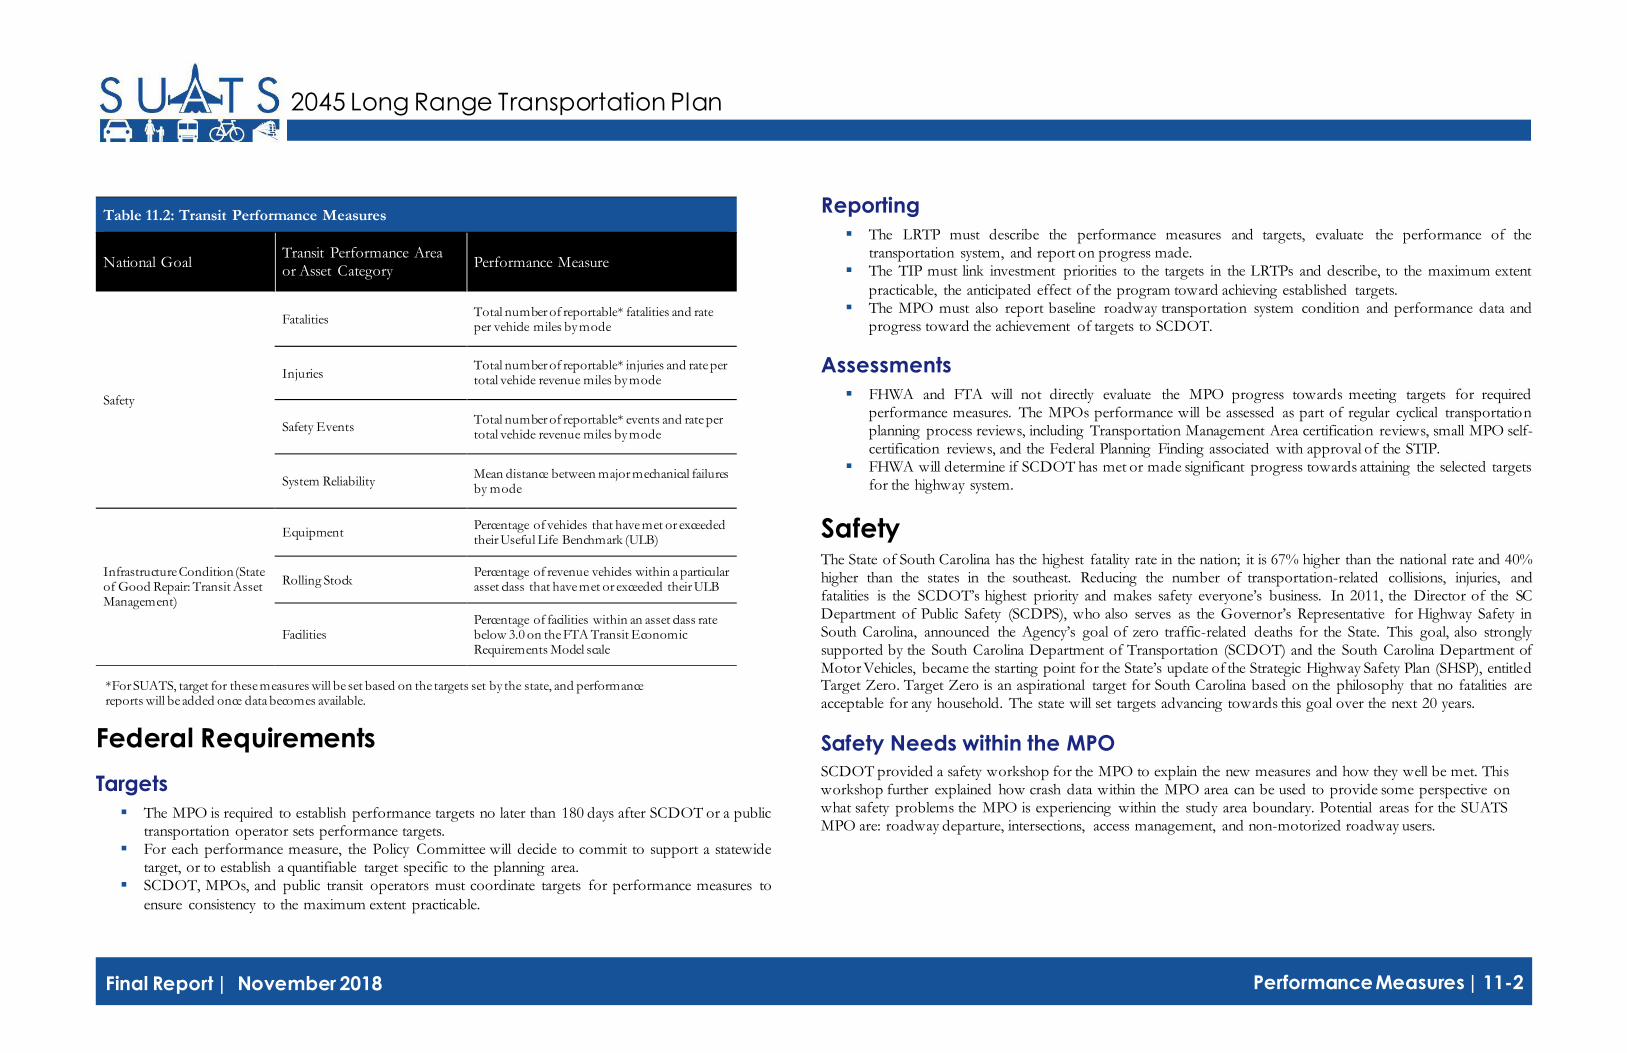
Performance Measures | 11-2
Final Report | November 2018
2045 Long Range Transportation Plan
Reporting
▪ The LRTP must describe the performance measures and targets, evaluate the performance of the transportation system, and report on progress made.
▪ The TIP must link investment priorities to the targets in the LRTPs and describe, to the maximum extent
practicable, the anticipated effect of the program toward achieving established targets. ▪ The MPO must also report baseline roadway transportation system condition and performance data and
progress toward the achievement of targets to SCDOT.
Assessments
▪ FHWA and FTA will not directly evaluate the MPO progress towards meeting targets for required performance measures. The MPOs performance will be assessed as part of regular cyclical transportation planning process reviews, including Transportation Management Area certification reviews, small MPO self-certification reviews, and the Federal Planning Finding associated with approval of the STIP.
▪ FHWA will determine if SCDOT has met or made significant progress towards attaining the selected targets for the highway system.
Safety The State of South Carolina has the highest fatality rate in the nation; it is 67% higher than the national rate and 40% higher than the states in the southeast. Reducing the number of transportation-related collisions, injuries, and fatalities is the SCDOT’s highest priority and makes safety everyone’s business. In 2011, the Director of the SC Department of Public Safety (SCDPS), who also serves as the Governor’s Representative for Highway Safety in South Carolina, announced the Agency’s goal of zero traffic-related deaths for the State. This goal, also strongly supported by the South Carolina Department of Transportation (SCDOT) and the South Carolina Department of Motor Vehicles, became the starting point for the State’s update of the Strategic Highway Safety Plan (SHSP), entitled Target Zero. Target Zero is an aspirational target for South Carolina based on the philosophy that no fatalities are acceptable for any household. The state will set targets advancing towards this goal over the next 20 years.
Federal Requirements
Targets
▪ The MPO is required to establish performance targets no later than 180 days after SCDOT or a public transportation operator sets performance targets.
▪ For each performance measure, the Policy Committee will decide to commit to support a statewide target, or to establish a quantifiable target specific to the planning area.
▪ SCDOT, MPOs, and public transit operators must coordinate targets for performance measures to
ensure consistency to the maximum extent practicable.
Safety Needs within the MPO
SCDOT provided a safety workshop for the MPO to explain the new measures and how they well be met. This workshop further explained how crash data within the MPO area can be used to provide some perspective on what safety problems the MPO is experiencing within the study area boundary. Potential areas for the SUATS MPO are: roadway departure, intersections, access management, and non-motorized roadway users.
Table 11.2: Transit Performance Measures
National Goal Transit Performance Area or Asset Category
Performance Measure
Safety
Fatalities Total number of reportable* fatalities and rate per vehicle miles by mode
Injuries Total number of reportable* injuries and rate per total vehicle revenue miles by mode
Safety Events Total number of reportable* events and rate per total vehicle revenue miles by mode
System Reliability Mean distance between major mechanical failures by mode
Infrastructure Condition (State of Good Repair: Transit Asset Management)
Equipment Percentage of vehicles that have met or exceeded their Useful Life Benchmark (ULB)
Rolling Stock Percentage of revenue vehicles within a particular asset class that have met or exceeded their ULB
Facilities Percentage of facilities within an asset class rate below 3.0 on the FTA Transit Economic Requirements Model scale
*For SUATS, target for these measures will be set based on the targets set by the state, and performance reports will be added once data becomes available.

Performance Measures | 11-3
Final Report | November 2018
2045 Long Range Transportation Plan
Safety Strategies
The safety of the regional transportation system is a top priority for SUATS. Therefore, additional guideshare funding has been allocated in the SUATS 2045 LRTP update financial plan for safety and intersection improvements. Making these types of projects a priority should help move the baseline and improve overall safety in the coming years.
Safety Targets
SCDOT was required to evaluate and report on safety targets for the five required measures on August 31, 2017. This action starts the 180-day clock for the MPO to take action to evaluate and set regionally specific targets or to accept and support the state’s targets.
When setting safety performance targets for the state, statisticians performed extensive analysis of the data related to each measure (traffic fatalities and severe injuries and vehicle miles traveled). South Carolina utilized a seven-data-point graphical analysis with a five-year rolling average. After the data points were plotted and graphical representations of the data were created, a trend line was added that could be used to predict future values. The trend lines were based on linear and non-linear equations with R-squared (best fit measure) values.
Using the statistical models, statisticians were able to predict the values for
the current year. Examining current and planned education and engineering safety initiatives, expected reductions in the number of fatalities and severe injuries were estimated, resulting in the calculation of the safety performance targets for the state. Staff from the SCDOT Traffic Engineering Office also met with representatives from the MPO/ COGs, delivering a presentation on target setting and how the state’s targets were established. The following table shows the baseline information for the MPO, the State of South Carolina, and the National baseline. The table also include the targets for the State of South Carolina.
*Per 100 million vehicle miles traveled
Next Steps
Additional Measures Coming Soon
In the future, the MPO will need to decide whether it will support state targets or set its own targets for other federally required performance measures related to infrastructure condition, system reliability, congestion reduction, freight movement and economic vitality, and environmental sustainability. MPO staff will provide updated information as timelines for
these other federally required performance measures are established. The MPO will also choose whether to establish other (non-federally required) performance measures for other goal areas, and whether to develop targets for these measures.
As the MPO makes this action, the performance measures will be added to this document until the MPO undertakes its next LRTP update. At that point, the MPO would fully integrate to a performance based LRTP, where this discussion is integrated within the elements of the LRTP and associated decision making processes.
Table 11.3: Safety Targets Baseline (2012-2016 Average)
Traffic Fatalities
Fatality Rate*
Severe Injuries
Severe Injury Rate
Non-motorized
SC
Baseline 890.2 1.75 3194.4 6.3 376.4
SC Targets
970.4 1.81 3067.0 5.71 371.3
MPO Baseline
10.8 1.70 40.8 6.44 4.8
For the 2018 performance period, the MPO has elected to accept and support the State of South Carolina’s safety targets for all five safety performance measures. This means the MPO will:
▪ Address areas of concern for fatalities or serious injuries within the metropolitan planning area through coordination with SCDOT and incorporation of safety considerations on all projects;
▪ Integrate safety goals, objectives, performance measures, and targets into the planning process; and
▪ Include the anticipated effect toward achieving the targets noted above within the TIP, effectively linking investment priorities to safety target achievement

11-4 Performance Measures | Final Report | November 2018
2045 Long Range Transportation Plan
This page intentionally left blank.

APPENDIX A — PUBLIC ENGAGEMENT
2045 Long Range Transportation Plan
AA-1 Public Engagement | Final Report | November 2018
Introduction Public involvement, from both direct and indirect contact is an important part of the planning process as well as the SUATS 2045 LRTP update. This plan relies on public input to ensure that the recommendations reflect what is truly needed in the community in the near and distance future. Because of this, local staff and the project team reached out to the public throughout the planning process in several ways.
Online Survey
As part of the SUATS 2045 LRTP update, a survey conducted through the online platform Wikimapping was used to gain a sense of the public perception of transportation and transportation related issues in the Sumter area. Respondents had the opportunity to answer a more generalized transportation based survey as well as using the online tools to map specific routes, general destinations, and improvements. 129 people responded to the online survey. The results of this survey are presented on the following pages.
Question 1: How long have you lived in the Sumter area?
Question 2: If you are employed, how do you commute to work? (check all that apply)
Question 3: How long is your commute?
Question 4: In your opinion, in the last 5 years, have traffic conditions in the Sumter area improved, stayed the same, or worsened? (choose one)
0
20
40
60
80
100
120
Walk By bus By bike By car By
rideshare
(e.g., Uber,
Lyft,
Zipcar)
I work
from home
I do not
work
Nu
mb
er o
f R
esp
on
den
ts1%
7%
20%
38%
34%
1%
Significantly improved
Slightly improved
Stayed the same
Slightly worsened
Significantly worsened
Blanks (Skipped)
2%
10%
9%
71%
8%
Less than 1 year
1-5 years
5-10 years
More than 10 years
I do not live in the
Sumter Area
▪ SUATS Public Engagement
o Online Survey: September 14, 2017 to November 1, 2017
o Plan Advisory Committee Meeting #1: October 12, 2017
o Public Workshop #1: October 12, 2017 o Plan Advisory Committee Meeting #2:
April 16, 2018 o Public Workshop #2: April 16, 2018
46%
24%
7%
6%
3%13%
Less than 15 minutes
More than 15, but less than 30
minutes
More than 30 minutes, but less
than 45 minutes
More than 45 minutes, but less
than 1 hour
More than 1 hour
Blanks (I do not work)

AA-2 Public Engagement | Final Report | November 2018
2045 Long Range Transportation Plan
Question 5: Based on your answer to the question above, in your opinion, which of the following is a top priority? (choose one)
Other (please specify)
All of the above Install concrete barriers at major intersections to stop left hand turns into businesses.
Traffic light controls
Ban trucks on Cains Mill Road
Add more turning lanes
Do something about Broad St Traffic
1,2 and 5 are all priorities for me. I am an avid bicyclist and walker.
More turn lanes in congested areas
Better intersections
Take congestion out of residential areas. Make an intersection and stop light at Wesmark Dr. and Hwy. 378 to add new access to city of Sumter.
ENFORCE the traffic laws!
Reduce traffic on Calhoun; remove center lane and turn lanes from Broad
Time traffic lights to move traffic more effectively.
Question 6: Which of the following is the most important to you in order to improve traffic safety?
Question 7: Which of the following is the most important to you when traveling around the Sumter area without a personal vehicle?
Question 8: If the plan recommends the improvement of infrastructure in the region, which of the following approaches do you prefer? (check one)
Question 9: Do you have a specific roadway or intersection that you want to see improvements on?
Roadways and intersections that were specified can be found on the next page.
0
10
20
30
40
50
60
70
80
Construct moresidewalks
Designate moreon street bike
ways andgreenways
Improvecondition ofroadways andintersections
(e.g., resurfacingthe road
pavements,signage, restripethe markings)
Reduce thenumber of
driveways in thecommercialcorridors
Increase transitservice areas andfrequency of bus
services
Other (pleasespecify)
Nu
mb
er o
f R
esp
on
den
ts
60%24%
15%
2%
Improving transportation safety
at the regions most dangerous
intersections
Investing in smart
transportation technologies
Making the transportation
network more reliable and travel
times more predictable
Blanks (Skipped)
24%
24%
12%
36%
5%Investing in pedestrian-specific
facilities (e.g., sidewalks and
crosswalks)
Investing in public transportation
(e.g., increase bus service area)
Investing in bicycle-specific
facilities (e.g., bike lanes)
Investing in multi-use facilities
(e.g., greenways and multi-use
paths)
Blanks (skipped)
0
10
20
30
40
50
60
70
80
90
No Yes, please specify Blanks (skipped)
Nu
mb
er o
f R
esp
on
den
ts
0
10
20
30
40
50
60
70
80
90
Constructing a few important newlarge projects (e.g., major roadway
widening or new roadways)
Constructing numerous newsmal ler projects (e.g., short street
connections and bicycle andpedestrian facilities)
Focusing on ways to improve theconditions of our existing
roadways
Nu
mb
er o
f R
esp
on
den
ts

A-3 Public Engagement | Final Report | November 2018
2045 Long Range Transportation Plan
Specific Roadways and Intersection that the public would like to see improvements on.
Alice Drive and W Liberty
Wise Dr. at Guignard Dr. by cemetery
W Liberty St. from Sumter to Guignard, excellent intersection for traffic circle Alice Drive and West Liberty Street, the streets are very bumpy like a washboard. Did it once...will not type all of that again. Gist is the roads in Sumter suck with potholes.
The intersection of Liberty Street and Alice Drive
Broad Street and Guignard Drive
McCrays Mill at Pinewood Road
Wesmark and Wilson Hall Rd 4 Way Stop
Broad street heading downtown Sumter
Guignard/McCrays Mill
Broad Street
Broad St. going towards Freuds. The roads can damage any vehicle
Intersection of Beckwood and Camden Highway
Route 378 Bypass desperately needs resurfacing. I'd also like to see bike lanes built on Broad Street from Mason Road to downtown. Lastly, we need to eliminate some commercial entrances on Broad Street in order to allow traffic to more continuously flow.
Intersection of Broad Street and the by-pass
Add right turn lane from 378 eastbound onto 441
Lafayette at Calhoun; Bartlette at Main
Liberty St. & Alice Dr. - Intersection
Broad St
The entire Broad Street. Most people use that street each day.
Highland Ave and Broad St
Corner of Broad and Mason. Traveling west bound, people always turn right and stop to turn into the bingo hall instead of traveling a few extra yards to turn directly into the lot. Usually people are stopped on Mason waiting for the light to change and those folks for the bingo hall just sit. I had many instances of where I turned left onto Mason traveling eastbound down broad where I was stuck in the middle of the road barely avoiding an accident.
Liberty St at Alice Dr.
Oakland Avenue
Broad St, and the intersections. Bultman and Guignard Dr. resurfacing.
The length of Broad Street, particularly between Church Street up to Alice Drive- There are too many people trying to make turns in and out of businesses, disrupting traffic flow and creating hazards when center turn lanes are inadequate.
HWY 53, HWY 15 North
Broad St and Bultman
All of Liberty St. needs to be repaved, but the Alice Dr. intersection is the worst.
South Salem Avenue
Alice Drive, Bultman, 378
Wesmark, Carter Rd. Corridor.
A possible sink hole exists at 15 south and the entrance to Pocalla Springs subdivision. Where the new Family Dollar light is on 15.
Broad street light timings not aligned resulting in significant backups/congestion.
McCray's Mill and Pinewood Road
Broad Street
Need to work on timing of lights on broad street
All of them
Alice Drive and Liberty...that road and intersection is horrible
Broad Street from the western city limit through to Washington St.
Broad at Guignard
Yes. Alice drive & Liberty.
These roadways may not be with in the SUATS area, but are in dire need of attention: Highway 76 East from Sumter to the Lee County Line, and Highway 53 from 378E to the Florence County line.
Guignard, Liberty near the Alice Drive intersection
Main at 76/378
Intersections at North Main and Pike
Intersections - Old 521 & Mason Rd and Beach Forest connecting to the new 521. Broad Street, specifically at the Bultman intersection. Though the whole road need help...
Wesmark and Wilson Hall
4 way stop by Bynum insurance
Alice Drive and Liberty Street. (roads are in horrible condition) McCrays Mill and St. Paul Church Road. (intersection is not perpendicular and 18 wheelers turning off St. Paul Church onto McCrays Mill is an issue. Intersection used by a large number of military so it is always busy.
S. Wise Dr. and N. Guignard intersection should be a round-about.
Wesmark Blvd
The intersection at Pike and 15 North under the 378 bridge.
North Main and Frontage roads
Main St., Manning Ave., Broad street
E. Calhoun Street people drive too fast and this is residential area with families/young children!
4 way stop at the Wise St and Guignard intersection
I would like there to be a stop light put in at the end of Wesmark Blvd. so that you could get on to Hwy 378 in either direction. It would also connect over to the other side of Hwy 378 so it would be easier to get to the industrial park.
Have a stop light at the end of Wesmark Blvd to get on Hwy 76 bypass.
1) Alice Drive & Liberty 2) Pinewood & McCray Mills Roads
Would like for there to be a stop light at the end of Wesmark Blvd. in order to get on Hwy 76 in either direction. This would also allow you to get over to the industrial park that Hwy 76 divides Sumter.
Would like to be able to access Hwy 378/76 off of Wesmark Blvd. This would allow a lot more opportunities for out of town business.
provide a way to enter onto Hwy 378/76 at the end of Wesmark Blvd. Traffic light would also allow to reach the other side of Sumter.
Needs to have a stop light to enter on to Hwy 378/76 from Wesmark Blvd.
Repaving Alice Drive from Wise drive to Liberty.
Create an intersection with traffic lights at 378 and Wesmark Blvd for better access to broad streets business district
I believe that it would be beneficial to have a traffic light at the end of Wesmark Blvd. to enter onto Hwy 378/76. This would also allow us to gain access to the other side of Sumter where the industrial park is located.
Have access from Wesmark Blvd. to get on 378/76. By putting a stop light at this intersection, we would be able to gain better entrance way to industrial park as well.
Alice Drive and Miller Road (during school hours)

A-4 Public Engagement | Final Report | November 2018
2045 Long Range Transportation Plan
Specific Roadways and Intersection that the public would like to see improvements on. (continued)
Main Overpass at 378
Guignard
US 378 (bypass) @ US 15 @ North main
North Main & Pike
Alice Drive
Intersection of Twin Lakes Dr. and McCrays Mill Rd. Reduce the speed limit and McCrays Mill Rd. and ENFORCE the speed limit.
Alice Drive & Liberty Street Intersection
NORTH MAIN STREET AT 378.
Wesmark and Wilson Hall Rd, Wilson Hall Rd and Hwy 378
Sidewalk on N. Guignard Dr. and Gion St. I see people walking on the street for lacking of sidewalk.
We need a sidewalk for pedestrians on N. Guignard
Haynsworth & Guignard
The unimproved portion of Alice Drive, especially the part by Alice Drive Elementary.
Guignard & Calhoun
Liberty at Alice
Alice Drive @ Liberty
A bus stop near new mental health facility on N. Pike Rd
The most frequent comments from this question mentioned the following intersections and roads that are in need of improvement:
▪ Alice Drive and West Liberty ▪ Broad Street
▪ Main Street ▪ Wesmark Boulevard ▪ Guignard Drive
Question 10: If the plan recommends improvement to the transportation system in the region, which of the following guiding principles should the plan focus on?
Question 11: What is your age?
Question 12: What is your race?
In addition to the general transportation survey, respondents were able to map destinations, routes, and intersections that they felt need improvement. A map of these locations can be found on the next page.
0
5
10
15
20
25
30
35
40
45
50
19 and under 20 to 34 years 35 to 54 years 55 to 64 years 65 years andover
Prefer not toanswer
Nu
mb
er o
f R
esp
on
den
ts
0
5
10
15
20
25
30
35
40
45
50
Supporting economicdevelopment and job
creation
Strengtheningconnectivity within the
region
Making it easier to travelbetween homes and job
creation
Increasing access to parksand natural resources
Nu
mb
er o
f R
esp
on
den
ts
63%
26%
2%1%
9%
White
African American
Asian
American Indian or Alaska
Native
Prefer not to answer
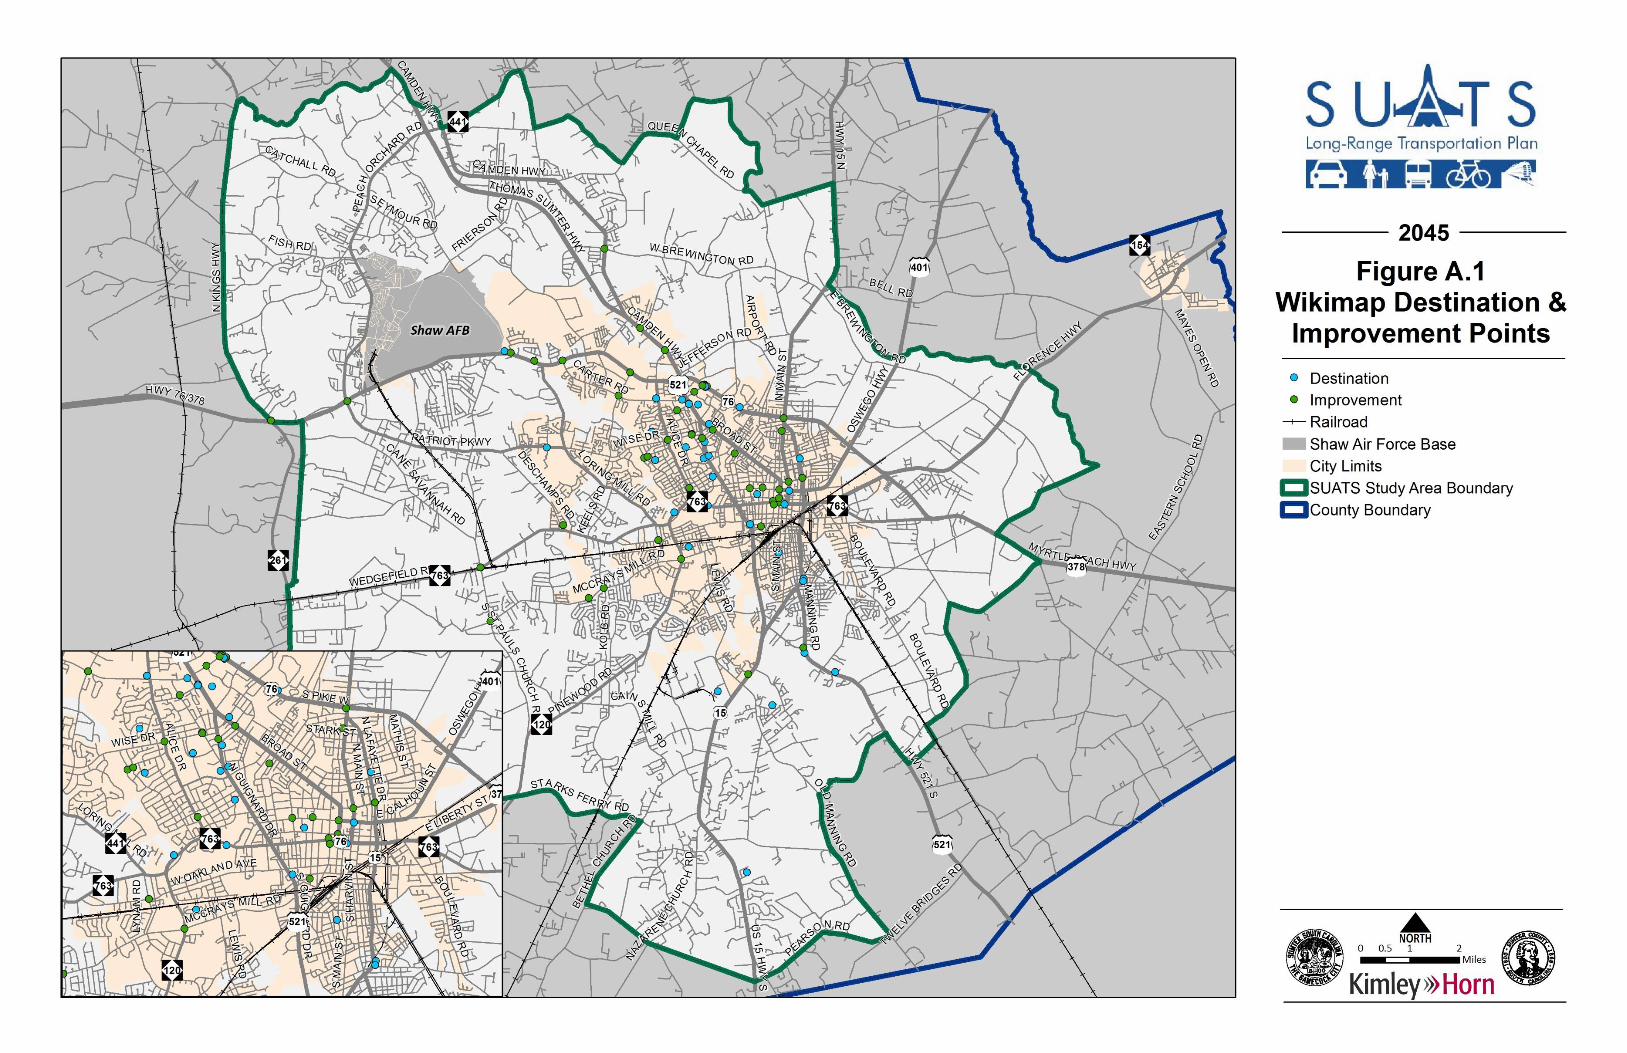


2045 Long Range Transportation Plan
A-7 Public Engagement | Final Report | November 2018
Plan Advisory Committee Meeting #1
On October 12, 2017, the project team met with the Planning Advisory Committee to discuss updates and developments with transportation that have occurred since the last plan update. The Planning Advisory Committee is composed of agency partners including SCDOT, FHWA, Santee Wateree RTA, Santee-Lynches RCOG, as well as both Sumter city and county staff and elected officials. A summary of that meeting is as follows.
Performance Measures
▪ Performance measures are system wide and federally mandated ▪ This will be adopted as a standalone LRTP amendment ▪ The safety performance measure is due February 2017
o The committee agreed that State DOT safety and performance measures and baselines would be used in lieu of creating separate SUATS criteria.
▪ Refer to Chapter 12 of this document for more
information on the SCDOT performance measures and where the SUATS study area falls within them.
o Asset Management and Mobility measures may follow next ▪ Act 114 provides streamlined prioritization
o Roadway prioritization will be conducted in order to distribute guideshare money from the State
o Sumter will have new data, but the same criteria
Changes to the Region (Last 5 Years)
▪ Continental Tire Factory opened
o The entire 521 corridor should be looked at ▪ Congestion on Broad Street is still a big issue
o There are a large amount of curb cuts and intersections ▪ A new Air Force squadron is locating to Shaw Air Force Base,
which will bring approximately 1,000 people to the area ▪ The committee noted that 521 needs to be 4-lanes all the way to I-
20 to fill the missing link that is currently there. ▪ SCDOT is working on funds to help with freight routes, however
the program is not yet up and running with real dollars ▪ The TIP should fund statewide projects
▪ The penny sales tax, which originally began in 2006, was once again voted in
o 7-year program o Several roadway projects and a greenway project are being
funded through this tax ▪ The state recently passed a gas tax increase, which will help fund
state projects, but this is not guideshare money ▪ Santee Wateree RTA
o The SWRTA is looking at restructuring routes to allow for more county activity
▪ More rural to urban routes such as to Florence and
Columbia o This fiscal year is currently underway
▪ Bicycles and Pedestrians o Extensive sidewalks are being funded through the penny
sales tax o Guideshare money can be leveraged for other modes of
transportation if certain criteria are met. This would need to be discussed with the policy committee
o Sumter is very car heavy and the Committee would like to add more bike/ped facilities
▪ There have been significant improvements on N Main/Manning with the help of the penny sales tax
▪ Downtown
o Downtown is busier than ever and has many more businesses than in previous years
o There has been a significant amount of freight traffic going right through downtown
▪ Is this due to management or route issues?
o Perhaps a freight bypass or additional signage would help this issue
▪ Some sort of side bypass is needed to the industrial park from 76/378
o The penny sales tax has helped, and is continuing to help, fund pedestrian facilities and intersections in Downtown
▪ Growth o Public comments will help to determine growth issues o 15 S has growth and congestion problems o West Sumter is the main area experiencing growth o In the Pinewoods area, the new Walmart will hopefully
facilitate growth
o The airport corridor is experiencing new growth which will lead to more traffic on 521 N
o Additionally, a casket company is being built ▪ This will bring more jobs, but more traffic as well

A-8 Public Engagement | Final Report | November 2018
2045 Long Range Transportation Plan
Public Workshop #1
A public workshop was held on October 12, 2017 from 5:30 PM to 8:00 PM at the Swan Lake Visitors Center. Sixteen people attended the meeting along with SUATS staff and the project team. Existing conditions maps and several activities allowed the public to voice their opinions as well as their priorities in regard to transportation. A summary of each activity can be found on the following pages.
One Word
In this exercise, participants were asked to describe the SUATS study area both now, as it stands today, as well as what they’d like to see it as in the future. These words were then put into a word cloud software system to show the biggest issues now as well as priorities for the future.
Describe the Sumter area in one word TODAY:
Describe in one word your vision for the FUTURE:
Priority Pyramid
In the priority pyramid activity, participants were asked to rank the plan’s guiding principles from most important priority to least important priority. The guiding principles are:
Minimize environmental impacts of the transportation systems by utilizing planning tools to preserve and promote natural assets.
Support the local economy by making it easier to move people and freight around and through the area while maximizing benefits and minimizing costs.
Create a system of interconnected streets with appropriate use by developing a plan that supports existing and future development.
Provide a balanced transportation system that makes it easier to walk, ride a bike, and take transit by encouraging streetscape and “built-in” traffic calming.
Provide and promote a safe and secure transportation system for all users by reducing crashes and improving pedestrian and bicycle facilities.
Ensure the quality of the current network is upheld to provide robust service to residential, commercial, industrial, and military uses.

A-9 Public Engagement | Final Report | November 2018
2045 Long Range Transportation Plan
Participants ranked the guiding principles as follows:
1. Safety & Security 2. Economic Vitality 3. Mobility and Accessibility 4. Growth & Development 5. Culture & Environment 6. Network Preservation
Thought Wall
Following the priority pyramid activity, participants were asked to write down their top transportation wish for Sumter and place it under the appropriate guiding principle. Comments are listed below.
Map Exercise
The final activity was an area where participants were able to share their thoughts directly on a map of the study area. A scan of the map is to the right.
No comments
▪ Have direct access to Highway 378/76 from the end of Wesmark Blvd. This would mean putting a stop light there to gain entrance to the other side of Highway 378 as well.
▪ Increase job opportunities
▪ Greater/easier access to Wesmark business district other than Broad or Alice Drive
▪ Closer bus stops ▪ Bus stop signs ▪ Improve transportation to 24 hour service to
accommodate shifts at industries 7 AM-7 PM; 7 PM-7 AM
▪ Removal of all bushes, trees, signs, etc. that block
the view at intersections when trying to enter another street. Major safety issue!
▪ Left turn arrows at left turn lanes ▪ More lighting for safety ▪ More lighting; trimming trees on our streets ▪ When gardening is done- keep grass out of the
street ▪ Increase lighting; increase police patrol
No comments

A-10 Public Engagement | Final Report | November 2018
2045 Long Range Transportation Plan
Plan Advisory Committee Meeting #2
On April 16, 2018, the project team met with the Plan Advisory Committee to discuss updates and present corridor recommendations that had been completed since the first meeting. As with the first meeting, the Plan Advisory Committee, composed of agency partners including SCDOT, FHWA, Santee Wateree RTA, Santee-Lynches COG, as well as both Sumter city and county staff and elected officials, attended. A summary of that meeting is as follows.
Priority Investments by System
▪ Guideshare money is applied on a system basis o Interested in how DOT and local priorities line up
▪ DOT has higher system priorities ▪ This should be noted as part of the financial constraint text
Recommendations
▪ Extend Wise Drive (Project ID UU) to Bultman (through Guignard)
o Potentially look as intersection improvement ▪ Work with COG to look at projects that extend past the SUATS
boundary line as they make recommendations for their long range plan
▪ New Frierson Road (Project ID D1)– potential horseshoe concept to allow school access
o Have future conversation with Shaw AFB about options for this road
▪ Alice Drive (Project IS A1) – potentially continue to Wise Drive; sidewalks being built by SUATS
Public Workshop #2
A second public workshop was held on April 16, 2018 from 5:00 PM to 7:00 PM at the Swan Lake Visitors Center. Nine people attended the meeting along with SUATS staff and the project team. Corridor recommendations were presented in map and tabular form (as seen in Chapter 5) and allowed the public to voice their opinions to ensure their feedback from the first public meeting and the online survey was addressed. All recommendations were agreed upon by attendees. A map and table of the recommendations can be found in Chapter 5.

APPENDIX B — SCENARIO PLANNING
2045 Long Range Transportation Plan
Final Report | November 2018 Scenario Planning | AB-1
Although this scenario planning exercise was conducted as part of the 2035 SUATS LRTP, it still retains its utility for the current plan. Scenario planning is intended to analyze a future horizon year and the fact that the year analyzed (2030) is not the plan horizon year (2045) does not diminish the value of the results.
Introduction Scenario planning represents the next generation of analytical processes created to evaluate the influence of development intensities and land use patterns on the efficiency of a proposed transportation system. Visualization of the interaction between land use and transportation decisions, as well as causational factors that explain the push-pull relationship between them, provide community leaders with the information they need to evaluate the consequences of potential actions. Building on this momentum, the Federal Highway Administration, Environmental Protection Agency, and other federal agencies are actively promoting the use of scenario planning models by state departments of transportation, metropolitan planning organizations, and local governments to better integrate transportation and land use decisions in the Long Range Transportation Planning process.
The SUATS Metropolitan Planning Organization is leading the movement in South Carolina to incorporate scenario planning in the process of developing its Long Range Transportation Plan (LRTP). A spatial data planning model using Community Viz software was developed that evaluates the impacts of land use decisions on surrounding public facilities and services.
An enhanced spatial data planning model was developed by the consultant preparing the LRTP to measure the influence of urban form on regional travel behavior.
Evaluating the relationship between urban form and regional travel behavior in a scenario planning analysis produces several benefits. When considered together, decisions and investments regarding both elements can have a significant bearing on the SUATS study area:
▪ The impacts to sensitive land uses can be minimized when facilities identified for transportation investments are located after considering appropriate land use patterns and development intensities for the area.
▪ Prime locations for development can be stimulated if transportation
investments consider available capacity or appropriate mobility options.
▪ Complementary activities can be placed next to existing or planned transportation infrastructure, making the most of land use opportunities and dedicated transportation investments.
▪ The quantity and location of travel demand can be influenced by land use decisions, making the possibility of real choices for various modes of travel both accessible and attractive.
Urban Form & Travel Behavior
Scholars explain urban form as the spatial footprint of our cities; it is measured by street patterns, block length, mix of land uses, maximum building height, average residential density, and non-residential intensity. Categorization of these design elements measures a city’s coherence and follows a natural progression from rural to suburban to urban. Urban form categories and the surrounding transportation system often influence each other in a cyclical pattern.
Elements of transportation — including roads and pedestrian, bicycle, and transit facilities — impact how land is developed in terms of density
and even types of land use. Further, where land uses fall and how they are distributed inevitably impacts decisions regarding where people travel and how transportation facilities are prioritized. If low-density development is spread out, the residents of such areas must rely almost entirely on automobiles to get from one location or land use to another. On the other hand, denser urban centers that combine complementary land uses near each other enable greater choice in transportation.
Reorganization of urban form in the SUATS study area for a more efficient transportation system requires that community leaders evaluate the four Ds commonly associated with the relationship between land use, urban design, and transportation – density, diversity, design and destinations. By doing so, the SUATS MPO and City and County of Sumter will collectively be able to shorten the commuting distance between complementary land uses, provide more travel choices, and create a more efficient transportation system.

AB-2 Scenario Planning | Final Report | November 2018
2045 Long Range Transportation Plan
The Transect1
The transect is an urban planning model developed by Andres Duany, an American architect and urban planner who co-founded the Congress of New Urbanism in 1993. The transect provides a framework for organizing the components of urban form within the human environment. It follows a continuum from natural environment to urban center, with discrete categories established for specific urban form categories that vary by level of intensity and urban character (see diagram below).
These discrete categories become the basis for organizing components of the built environment: densities/intensities, street patterns, land use, and other physical elements. In planning for new development and redevelopment, purposeful combination of the components that define specific urban form categories creates immersive environments – places that have an integrity and coherence about them to reinforce an intended sense of place. At the boundaries between urban form categories, an overlap of defining elements allows them to fit together smoothly.
The transect applied to the SUATS study area was divided into six discrete urban form categories: natural areas, rural, suburban, general urban, urban core, and a special district created to represent the Shaw Air Force Base. As defined by the mix of land uses, average residential density and non-residential intensity, typical street pattern and block lengths, and maximum building height, each urban form category represents a unique development pattern in the SUATS study area. The illustrations that follow in Figures B.1 through B.6 describe in detail the physical elements used to define the six urban form categories.
1 Description of the transect developed from various publications of Andres Duany and
Emily Talen: Transect Planning, 2002; Making the Good Easy:The Smart Code Alternative, 2002; and A New Theory of Urbanism, 2000.
The plan above illustrates how the transect classifies elements of the human environment from rural to urban, in a left-to-right sequence. (Source: Duany, Plater-Zyberk, 2007)

AB-3 Scenario Planning | Final Report | November 2018
2045 Long Range Transportation Plan
Natural areas remain generally undeveloped to preserve the integrity of the landscape and protect local natural resources.
Local Examples
Environmentally-sensitive area near Patriot Parkway Aircraft protection zones serving Shaw AFB
*Persons per household data derived from 2000 U.S. Census data for Sumter County, SC
This table summarizes general development characteristics for natural areas that were incorporated into the scenario planning analysis. These areas remain generally undeveloped to protect local natural resources; however, isolated large-lot, single-family homes could be built in natural areas subject to the principles of low-impact
development.
Natural areas include land zoned for Conservation Preservation in the City and County of Sumter Zoning Ordinance and land identified in the
aircraft protection zones (APZs) for Shaw Air Force Base.
Environmentally Sensitive Areas
General Development Characteristics
Average Base Residential Density 0.2 d.u. / acre
Typical Street Pattern Curvilinear
Typical Block Length N/A
General Land Use Pattern Isolated Uses
Maximum Building Height (stories) 2 stories
Site Efficiency Factor 10%
Mix of Land Uses
Residential Ratio 2%
Commercial Ratio 0%
Office Ratio 0%
Industrial Ratio 0%
Open Space Ratio 98%
Non-Residential Intensities
Commercial FAR 0.05
Office FAR 0.05
Industrial FAR 0.05
Persons per Household* 2.68
Urban Form Category Descriptions
T1 – Natural Areas Figure B.1

AB-4 Scenario Planning | Final Report | November 2018
2045 Long Range Transportation Plan
Rural areas support primarily low-density, residential development at the outskirts of the urbanized area.
Local Examples
Buckhorn of Wedgefield Subdivision Claremont Road at Kings Highway
*Persons per household data derived from 2000 U.S. Census data for Sumter County, SC
This table summarizes general development characteristics for rural areas that were incorporated into the scenario planning analysis. Generally, this urban form category isolates different land use types in low-density development patterns. The predominate land use type is single-family residential; however, small pockets of
commercial and industrial uses spread throughout the landscape may exist to serve rural residents.
Rural areas represent land primarily at the extremes of the study area.
Rural Areas
General Development Characteristics
Average Base Residential Density 0.5 d.u. / acre
Typical Street Pattern Curvilinear
Typical Block Length N/A
General Land Use Pattern Isolated Uses
Maximum Building Height (stories) 2 stories
Site Efficiency Factor 60%
Mix of Land Uses
Residential Ratio 35%
Commercial Ratio 0%
Office Ratio 0%
Industrial Ratio 0%
Open Space Ratio 65%
Non-Residential Intensities
Commercial FAR 0.15
Office FAR 0.15
Industrial FAR 0.10
Persons per Household* 2.68
Urban Form Category Descriptions
T2 – Rural
Figure B.2
Urban Form Category Descriptions
T1 – Natural Areas Figure 9.3

AB-5 Scenario Planning | Final Report | November 2018
2045 Long Range Transportation Plan
Suburban areas support low-density residential and non-residential development characteristic of most U.S. cities developed after World War II.
Local Examples
Lindley Street (Burns Down Subdivision) Broad Street near Wise Drive
*Persons per household data derived from 2000 U.S. Census data for Sumter County, SC This table summarizes general development characteristics
for suburban areas that were incorporated into the scenario planning analysis. Generally, this urban form category isolates different land use types in relatively low-density development patterns. Residential, commercial, office, and industrial uses are prevalent in the suburban landscape; however, the separation between
complementary land uses often necessitates travel by automobile to satisfy daily needs.
Suburban areas include land with generally low-density expansive development patterns along most major thoroughfares and newer residential subdivisions inside city limits.
Urban Form Category Descriptions
T3 – Suburban
Figure B.3
Suburban Areas
General Development Characteristics
Average Base Residential Density 2.5 d.u. / acre
Typical Street Pattern Curvilinear / Radial
Typical Block Length N/A
General Land Use Pattern Isolated Uses
Maximum Building Height (stories) 3 stories
Site Efficiency Factor 55%
Mix of Land Uses
Residential Ratio 13%
Commercial Ratio 10%
Office Ratio 12%
Industrial Ratio 5%
Open Space Ratio 60%
Non-Residential Intensities
Commercial FAR 0.20
Office FAR 0.20
Industrial FAR 0.05
Persons per Household* 2.68

AB-6 Scenario Planning | Final Report | November 2018
2045 Long Range Transportation Plan
General urban areas represent the first tier of expansion from the traditional downtown center of Sumter. The short blocks and grid street pattern originating from the downtown extend to relatively dense neighborhoods, which are separated by multilane radial streets that traverse several miles from the downtown center.
Local Examples
Washington Street near Loring Drive Calhoun Street near Purdy Street
*Persons per household data derived from 2000 U.S. Census data for Sumter County, SC This table summarizes general development characteristics for general urban areas that were incorporated into the scenario planning analysis. Generally, this urban form
category isolates different land use types, but supports more dense development patterns compared to previous urban form categories. Residential, commercial, office, and industrial uses are prevalent in the general urban landscape, and the grid street pattern and shorter block lengths support travel mode choices between complementary land
uses.
General urban areas include land that surrounds the historical downtown for Sumter.
General Urban
General Development Characteristics
Average Base Residential Density 5.0 d.u. / acre
Typical Street Pattern Grid
Typical Block Length N/A
General Land Use Pattern Isolated
Maximum Building Height (stories) 3 stories
Site Efficiency Factor 55%
Mix of Land Uses
Residential Ratio 13%
Commercial Ratio 7%
Office Ratio 25%
Industrial Ratio 0%
Open Space Ratio 55%
Non-Residential Intensities
Commercial FAR 0.30
Office FAR 0.30
Industrial FAR 0.15
Persons per Household* 2.68
Urban Form Category Descriptions
T4 – General Urban
Figure B.4
Urban Form Category Descriptions
T1 – Natural Areas Figure 9.3

AB-7 Scenario Planning | Final Report | November 2018
2045 Long Range Transportation Plan
The urban core represents the historical center of Sumter, and continues to be the government and medical hub for the community. A fine mix of residential and non-residential land uses occurs block-by-block and vertically within certain buildings.
Local Examples
Main Street south of Hampton Street Dugan Street between Sumter Street and Main Street
*Persons per household data derived from 2000 U.S. Census data for Sumter County, SC This table summarizes general development characteristics for the urban center that were incorporated into the scenario planning analysis. Generally, this urban form
category mixes different land use types by block and by building; and supports more dense development patterns compared to previous urban form categories. Residential, commercial, and office uses are prevalent in the general urban landscape, and the grid street pattern and shorter block lengths support travel mode choices between
complementary land uses.
The urban core includes land that lies within the historical limits for downtown Sumter.
Urban Core
General Development Characteristics
Average Base Residential Density 10.0 d.u. / acre
Typical Street Pattern Grid
Typical Block Length N/A
General Land Use Pattern Mixed
Maximum Building Height (stories) 6 stories
Site Efficiency Factor 90%
Mix of Land Uses
Residential Ratio 40%
Commercial Ratio 10%
Office Ratio 35%
Industrial Ratio 0%
Open Space Ratio 15%
Non-Residential Intensities
Commercial FAR 0.50
Office FAR 0.75
Industrial FAR 0.25
Persons per Household* 2.68
Urban Form Category Descriptions
T5 – Urban Core
Figure B.5
Urban Form Category Descriptions
T1 – Natural Areas Figure 9.3

AB-8 Scenario Planning | Final Report | November 2018
2045 Long Range Transportation Plan
This special district recognizes certain development restrictions associated with Shaw Air Force Base for military operations, and the spatial impact that the base and its immediate environs have on the region.
Local Examples
Off-Base Housing near West Hampton Avenue Entrance to Shaw Air Force Base (Guard Gate)
*Persons per household data derived from 2000 U.S. Census data for Sumter County, SC This table summarizes general development characteristics for Shaw Air Force Base that were incorporated into the scenario planning analysis. Generally, this urban form
category supports military operations and surrounding off-base housing for enlisted families.
The Shaw Air Force Base special district includes all land zoned for military operations (SHAW) in the City of Sumter Zoning Ordinance.
Special District
General Development Characteristics
Average Base Residential Density 6.0 d.u. / acre
Typical Street Pattern Grid
Typical Block Length N/A
General Land Use Pattern Mixed
Maximum Building Height (stories) 4 stories
Site Efficiency Factor 60%
Mix of Land Uses
Residential Ratio 20%
Commercial Ratio 0%
Office Ratio 0%
Industrial Ratio 60%
Open Space Ratio 20%
Non-Residential Intensities
Commercial FAR 0.20
Office FAR 0.20
Industrial FAR 0.10
Persons per Household* 2.68
Urban Form Category Descriptions
T6 – Special District (Shaw AFB)
Figure B.6
Urban Form Category Descriptions
T1 – Natural Areas Figure 9.3

AB-9 Scenario Planning | Final Report | November 2018
2045 Long Range Transportation Plan
Development Scenarios Two extreme future year development scenarios were created for the Long Range Transportation Plan that measure the impact urban form may have on the demand factors (i.e., trip generation, trip length, travel distance, and travel mode choice) that influence the efficiency of the transportation system. Both development scenarios represent the same study area, planning horizon year (2030), and control totals for population, number of households, and number of employees by commercial, office, and industrial categories reported in the 2030 Sumter Area Transportation System (SUATS) Regional Travel Demand Model maintained by the South Carolina Department of Transportation. Differences between the two development scenarios were limited to the 4 Ds commonly associated with the relationship between land use, urban design, and transportation – density, diversity, design, and destinations.
For the purposes of land use scenario planning, a study area similar to the LRTP study area was used. Areas beyond the metropolitan areas of the county were excluded to maintain a compact urban form analysis. A detailed description of the two future year development scenarios is provided below.
Sprawl Development
The sprawl development scenario represents a continuation of adopted plans, programs, and policies administered in the City and County of Sumter Comprehensive Plans, and implementing zoning ordinances, to accommodate future year growth through 2030. The historical central business district, originating from the intersection of Liberty Road and Main Street, represents the only location for concentrated, mixed-use development. Surrounding downtown, low-density development and the physical distance between complementary land uses tend to promote automobile travel, particularly since safe, convenient facilities are not easily available for pedestrians and bicyclists. Increased traffic means less mobility for Sumter citizens and others traveling through the region.
Compact Development Scenario Sprawl Development Scenario

AB-10 Scenario Planning | Final Report | November 2018
2045 Long Range Transportation Plan
Compact Development
The compact development scenario represents a paradigm shift in planning philosophy for the City and County of Sumter toward more sustainable development – measured by environmental stewardship and equitable distribution of community resources – that reflects the community’s unique character and local values. Under this planning scenario, future year growth anticipated for 2030 was directed to an expanding downtown core and high-growth corridors along Broad Street, Guignard Road, Lafayette Drive, and Manning Avenue. The diversity of close-by, complementary land uses and local travel options within the designated activity centers encourages better distribution of trips and shorter trip lengths, thereby reducing the number of vehicles region-wide vying for similar routes. This scenario also assumes a safe environment for pedestrians and bicyclists to travel from one land use to another.
Scenario Planning Results
The SUATS Metropolitan Planning Organization is committed to fostering a more efficient, multimodal transportation system, supportive of an overarching community goal for the City and County of Sumter to implement a more sustainable land use plan that reflects the unique character and local values celebrated by its citizens. Comparative statistics for the two development scenarios confirm that reorganization of urban form throughout the study area into a more compact, nodal development pattern significantly improves the efficiency of the transportation system, while preserving unspoiled natural areas immediately surrounding the SUATS study area.
Summary statistics for evaluating the impacts of sprawl development and compact development scenarios were reported using Community Viz software and the 2030 SUATS Regional Travel Demand Model maintained by the South Carolina Department of Transportation. Measures of Effectiveness (MOEs) generated by the two software programs articulate the significance of reorganizing development densities/intensities and land use patterns to improve efficiency of the regional transportation system.
Compared to a sprawling development pattern, the alternative development scenario emphasizes compact, walkable urban and neighborhood centers, and supports future opportunities for regional bus transit for higher order trips. Higher order trips typically represent trip lengths over one-half mile in length, whereby walking or bicycling would not be the primary means of travel between two destinations. Non-motorized modes of transportation could provide connections to transit stops and/or close-by land uses that make alternatives to single-occupant automobile travel more viable.
Viable travel alternatives and more compact, mixed-use centers also reduce travel distance between complementary land uses and reliance on the automobile for day-to-day activities. This leads to less vehicle miles traveled, less vehicle hours traveled, and higher average automobile travel speeds (system-wide) compared to a more sprawling development pattern. Further, vehicle miles traveled at times of highest demand on the transportation system are reduced by nearly 8%, resulting in a more efficient transportation system. Table B.1 summarizes the MOEs from the 2030 SUATS Regional Travel Demand Model for the two development scenarios.
A compact development scenario also reduces the spatial footprint of urban development on surrounding hinterlands. Urban and neighborhood centers identified in the hypothetical scenario would limit creeping low-density, sprawl development patterns and reduce accompanying public infrastructure costs.
Output data from Community Viz indicates that up to 56.8% of the total land area included in the study area could be maintained in a rural context compared to 49.0% in the sprawl development scenario – while accommodating the same growth projections for 2030. Beyond environmental stewardship, the compact development scenario supports prudent fiscal responsibility for capital improvements planning and room for purposeful growth beyond the 25-year planning horizon. Table B.2 summarizes the land use profile, by urban form category, for both sprawl and compact development scenarios.
Table B.1 – Comparison of Daily Travel Characteristics
Measure of Effectiveness (MOE) Benefit of Compact vs. Sprawl Development
Total Population N/A
Total Trips (1,000s) Reduced 6,000 trips
Trips per Person Reduced 0.05 trips per person
Vehicle Miles Traveled (1000s) Reduced 86,000 vehicle miles
Vehicle Miles Traveled per Person Reduced 0.8 vehicle miles per person
Vehicle Hours Traveled (1000s) Reduced 300 vehicle hours
Vehicle Hours Traveled per Person Reduced 0.03 vehicle miles per person
Average Travel Speed Increased average travel speed 0.03 mph
Vehicle Miles Traveled at LOS E (1000s) Reduced 38,000 congested vehicle miles traveled
% Vehicle Miles Traveled Over Capacity Reduced congested vehicle miles traveled 0.8 percent
Table B.2 – Comparison of Scenario Land Use Profiles
Urban Form Category
Sprawl Development Scenario
Compact Development Scenario
Net Change
Acres % Acre % Acres %
Natural Area 4,071 3.6% 4,244 3.8% 173 0.2%
Rural 55,168 49.0% 64,015 56.8% 8,847 7.8%
Suburban 47,642 42.3% 33,346 29.6% - 14,296 - 12.7%
General Urban 2,595 2.3% 7,593 6.7% 4,998 4.4%
Urban Core 134 0.1% 382 0.3% 248 0.2%
Shaw AFB Special District 3,097 2.7% 3,127 2.8% 30 0.1%
Total 112,707 100.0% 112,707 100.0% 0 0.0%

AB-11 Scenario Planning | Final Report | November 2018
2045 Long Range Transportation Plan
Policy and Guidelines Toolbox
The following policies and guidelines serve as a toolbox for the SUATS Metropolitan Planning Organization and the City and County of Sumter to strengthen the connections between the four D’s commonly associated with improving the relationship between land use, urban design, and transportation – density, diversity, design, and destinations. By doing so, community leaders will be able to shorten commuting distance between complementary land uses, provide more travel choices, and create a more efficient transportation system. These tools were selected following discussions with City and County planning staff and a review of local zoning and development standards ordinances.
Tool 1: Promote Sustainable Land
Development
A development can have a positive or negative impact on the transportation system, either creating more congestion or providing alternate routes for traffic. The City and County should not only consider how a mix of land uses will relate when considering development opportunities but also keep in mind the way each use is accessed. If sustainable land development principles are followed, local officials can plan for land use and developments that reduce congestion. Offering smart alternatives will help limit the number and lengths of local trips as well as provide alternatives to the already congested corridors in the SUATS study area.
Efficient travel between land uses can be encouraged by promoting development patterns that favor higher densities and intensities, a mix of land uses, and an environment that accommodates transit, bicycles, and pedestrians. In turn, the transportation system should connect complementary land uses and focus on more efficient travel behavior defined by mode and route choices.
To encourage on-site improvements for promoting a more sustainable land development pattern, the area’s transportation system should favor efficient travel between interior destinations and safe, predictable connections to adjacent properties. The orientation of buildings and parking lots should favor a “park once” mentality, whereby the design, location, and supply of parking should promote a more balanced
transportation environment that facilitates walking once arriving to the site.
By not providing excessive parking, the City and County will encourage pedestrian and bicycle travel and discourage automobile travel. Pedestrian walkways within a new or re-developed site should connect building entrances and provide safe crossings. Locating parking and vehicle driveways away from building entrances also will encourage pedestrian activity. At the edges of development, rules and standards should be adopted that require purposeful connections to the public sidewalk and greenway system for promoting alternative modes of travel for accessing the site.
Tool 2: Support Efforts to Increase
Connectivity within and Between
Developments
Street connectivity refers to the directness of routes and the density of connections (i.e., intersections) within a transportation system. As connectivity increases, travel distances decrease and route options increase, allowing the transportation system to be used more efficiently by pedestrians, bicyclists, transit, and automobiles. When the local street network is not sufficient, arterials often become the preferred travel route. Unfortunately, this reduces regional mobility for through traffic.
A highly connected transportation system includes several options for entering or leaving a new development. Whenever possible, these options are located on secondary roads rather than highways. The number of street systems without access to other roads should be limited, just as cul-de-sacs would be restricted to areas where topography, environment, or existing development make other street connections prohibitive. Stub-outs should be encouraged and signed to accommodate future street extensions and connections with neighboring parcels. The City and County also should encourage developments to include regulations that require minimum street spacing, which will support efforts to diffuse traffic congestion and more easily connect with other streets and developments.
Connectivity in the area should not be limited to automobiles, however. Encouraging a network of connected pedestrian and bicycle facilities offers more transportation alternatives, especially when that network provides access to a variety of land uses, roadways, and developments. Greenway, bicycle, and pedestrian connections are highlighted in Chapter 6.
Connections need to be not only planned but also implemented during the development review process. Promoting a highly connected
Compact, Mixed-Use Development
Newer development initiatives recognize the benefits of increased density, mixture of land uses, and pedestrian-friendly design on the regional transportation system.
Park Once Districts
To promote sustainable land development, buildings should be oriented and parking located to favor a “park once” mentality. Excessive parking should be discouraged.
Reorganization of traditional suburban scale development creates a “park once”, walkable environment.
Traditional “sea of asphalt parking” typically serves big box suburban development.
Sustainable Transportation Initiatives in Land Development:

AB-12 Scenario Planning | Final Report | November 2018
2045 Long Range Transportation Plan
transportation system through implementation will require revisions to local zoning and subdivision ordinances. In addition, the City and County of Sumter should develop clear traffic impact study (TIS) guidelines, which require a TIS, prepared by a professional engineer specializing in traffic operations, accompany all development applications or any other development deemed necessary by the Planning Director for review. The study will facilitate the review process and promote connectivity within and between developments.
Tool 3: Promote Development Design to
Manage Access and Reduce Congestion
Levels on Major Roadways
For the study area to truly achieve transportation efficiency, the City and County will need to consider the potential conflicts between the transportation system’s mobility (transportation) and accessibility (land use). Access management will help balance mobility and accessibility.
From a land use perspective, the number, location, and spacing of driveways along the street network significantly impact vehicular movements and levels of congestion. Land use and transportation professionals agree that the number of driveways or curb cuts serving a property should be minimized and that regulations and incentives can be used to encourage shared-use driveways. Sumter can promote greater street network efficiency through cross access agreements, which limit the number of driveways and allow roadway access for multiple parcels across a single property.
Building on the momentum of this collaborative planning process, local leaders should partner with SCDOT to review the state’s current access management guidelines and local ordinances that regulate access to the street network. Following this review, a formal access management overlay ordinance should enforce consistent access management standards that ensure the proper function of existing and planned arterials for mobility. In particular, minimum spacing and maximum driveways per development should be regulated. Strengthening and enforcing minimum lot frontage requirements will prevent the establishment of small frontage lots along the corridor. In addition, regulations should encourage the construction of parallel routes for backdoor access. These routes can be integrated into the local street system when small frontage lots are unavoidable.
Implementation of access management tools can be accomplished in a number of ways — changing local zoning ordinances, developing an access management overlay ordinance, or approving rules and regulations for the subdivision and site plan review process to include application of access management solutions. More detailed access management techniques are discussed in Chapter 5.
Tool 4: Encourage Growth
Management
Initiatives to Manage
Growth
It is clear that mobility and congestion are directly affected by growth. The rate and direction of growth are capable of canceling the benefits of new transportation improvements if proper planning has not occurred. Some communities in the state facing similar growth pressures to Sumter have implemented growth management tools for influencing the location and timing of new development consistent with available infrastructure.
Growth management tools in the State of South Carolina are somewhat limited; however, two tools gaining favor among communities of similar size to Sumter are adequate public facilities ordinances and capital improvement plans. An adequate public facilities ordinance controls the timing and location of development. In this instance, development is approved conditionally upon proof that sufficient public facilities and services are present or will be provided to maintain adopted level of service standards (e.g., transportation mobility). The second tool, a capital improvements plan (CIP), guides future funding, schedule, and construction of large dollar, capital improvements so that necessary infrastructure is in place consistent with demand. By scheduling long-
term capital improvements over the long-term planning horizon, a CIP restricts the extension of services into areas where development should be limited until a time that is appropriate.
An additional growth management tool gaining favor in South Carolina is developer impact fees. Developer impact fees and system development charges are another funding option for communities looking for ways to pay for transportation infrastructure. They are most commonly used for water and wastewater system connections or police and fire protection services but they have recently been used to fund school systems and pay
Regulating Left Turns (i.e. left-over treatment)
Shared Driveway Use
Befo
re
Aft
er
Driveway Throat
Internal Site Circulation
Access Management Examples:

AB-13 Scenario Planning | Final Report | November 2018
2045 Long Range Transportation Plan
for the impacts of increased traffic on existing roads. Impact fees place the costs of new development directly on developers and indirectly on those who buy property in the new developments. Impact fees free other taxpayers from the obligation to fund costly new public services that do not directly benefit them. Only a handful of communities in South Carolina have approved the use of impact fees (e.g. Berkeley County).
Recommendations The scenario planning analysis confirms that reorganization of urban form throughout the study area into a more compact, nodal development pattern significantly improves the efficiency of the transportation system while preserving unspoiled natural areas immediately surrounding the SUATS study area. Successful implementation of a compact, nodal development pattern will require fundamental changes to certain land use plans, programs, and policies administered by the City and County of Sumter. Purposeful coordination among private landowners, officials for City and County government, and the South Carolina Department of Transportation to combine land use and transportation planning processes traditionally completed in isolation will ensure a more efficient and fiscally responsible regional transportation system.
Building on the Policy and Guidelines Toolbox, the following recommendations are intended to improve the relationship between urban form and travel behavior in the SUATS study area.
Desired Outcome: Improved coordination
between land use and transportation
Transportation facilities can impact the density, intensity, and types of land uses. The location and type of land uses, in turn, influence where and how people travel. Promoting development patterns that favor higher densities and intensities, a mix of land uses, and an environment that accommodates pedestrians helps encourage the efficient use of the transportation system. These developments should be supported by a comprehensive transportation system that connects complementary land uses.
Recommended Action: Define common design
elements along the corridor.
The City and County should work together to define common design elements that collectively reinforce a sense of place for high-profile corridors identified within the study area. These design elements then should be used to promote effective decisions regarding appropriate land use and development patterns for the area. In addition, a streetscape plan for specific corridors (e.g., Broad Street, Bultman Drive, Liberty Street, McCrays Mill Road, or Pinewood Road) should be developed as a community initiative for protecting the long-term sustainability of the community. Elements of the streetscape plan may include plantable medians, street trees, highly visible crosswalks, pedestrian countdown signals, pedestrian-level lighting, and utility consolidations. This plan should be coordinated with the access management strategies presented in Chapter 5.
Recommended Action: Increase the minimum
sidewalk width for major or minor subdivision and site
plans.
The City of Sumter Zoning and Development Standards Ordinance requires that sidewalks measure a minimum 4 ½ feet in width. City officials should consider increasing the minimum width to 5 feet in residential neighborhoods with a 5-foot vegetative buffer from the street, and up to 12 feet in width in retail centers or downtown that may accommodate benches, outdoor seating, etc. See Chapter 6 for more detailed sidewalk recommendations.
Recommended Action: Promote compact
development design principles.
The City and County of Sumter should consider including the guiding principles for compact development in their respective Comprehensive Plans for implementing a more efficient transportation system.
Desired Outcome: Efficient use of the
transportation system
An efficient transportation system includes an interconnected network of different size streets that offer varying levels of access and mobility
depending upon their intended function. Connections to and between these streets should be planned in order to decease travel distances and increase route choice. This allows the transportation system to be used more efficiently by pedestrians, bicyclists, transit, and automobiles.
Recommended Action: Revise street width and right-
of-way requirements to implement complete street
design principles.
The City of Sumter Zoning and Development Standards Ordinance requires that all streets be designed to the minimum standards set forth in Exhibits 17 and 18. City and County officials should revise the right-of-way profiles and street width requirements included in existing ordinances to mimic the recommended typical sections included in the Long Range Transportation Plan (see Chapter 5).
Recommended Action: Adopt an access
management overlay ordinance.
Access management overlay ordinances have been adopted across the country to complement existing local zoning and subdivision regulations. An overlay ordinance will not change the rules and requirements associated with the underlying zoning district. The ordinance will provide a legal framework for the City and County to administer and enforce consistent access management standards along high-profile corridors.
The ordinance should contain rules and requirements for the “core” components of a comprehensive access management strategy, including minimum spacing standards for traffic signals, median openings, and driveways; provisions for corner clearance, joint access, and connectivity; and design requirements for building access connections. The ordinance also should require cross access between adjacent properties, consolidation/elimination of excessive driveways, and retrofitting site access to the side and rear portions of the site. These standards would be applicable to all properties directly abutting corridors with an access management overlay designation.
Recommended Action: Adopt a formal connectivity
ordinance.
A formal connectivity ordinance will increase the connections between existing and new developments and redevelopments by requiring

AB-14 Scenario Planning | Final Report | November 2018
2045 Long Range Transportation Plan
coordination between the vehicular and non-vehicular circulation systems. Such ordinances have been instituted in cities and counties across the nation, including several localities in the Carolinas.
A standard connectivity ordinance embraces connections as a way to reduce the burden on arterial streets by offering a variety of routes between two destinations. In Cary, NC, connectivity is calculated by dividing the number of street links by the number of street nodes and intersections. A development must have a connectivity index of 1.2 or greater. This requirement can be waived by the Planning Director if it is deemed unreasonable to require such connections. However, when the requirement is waived, a six-foot pedestrian trail must be provided to link cul-de-sacs within a residential development. (See Section 7.10 at http://vic.townofcary.org/index.htm)
A connectivity ordinance should be adopted by the City and County, using one of several numerical standards. The ordinance should limit the number of cul-de-sacs to areas where topography, environment, or existing development make other street connections prohibitive.