
Log Classification in the Hardwood Timber Industry: Method and Value Analysis
41
Log Classification in the Hardwood Timber Industry: Method and Value Analysis Alvaro Gil Jean-Marc Frayret October 2014 CIRRELT-2014-54
Transcript of Log Classification in the Hardwood Timber Industry: Method and Value Analysis

Log Classification in the Hardwood Timber Industry: Method and Value Analysis Alvaro Gil Jean-Marc Frayret October 2014
CIRRELT-2014-54

Log Classification in the Hardwood Timber Industry:
Method and Value Analysis
Alvaro Gil, Jean-Marc Frayret*
Interuniversity Research Centre on Enterprise Networks, Logistics and Transportation (CIRRELT) and Department of Mathematics and Industrial Engineering, Polytechnique Montréal, P.O. Box 6079, Station Centre-ville, Montréal, Canada H3C 3A7
Abstract. Industries with variable inputs, such as the forest product industry (FPI), the mining industry or the recycling industry, must cope with material variability, which affects both their efficiency and their ability to accurately predict output yields. In order to deal with this, the industry can use transformation processes and technologies that adapt to variability, or plan operations taking material variability into account. In the FPI, the first approach is generally used. For instance, the Canadian softwood lumber industry has adopted sophisticated transformation technologies that adapt sawing patterns to logs’ and work-in-process characteristic using scanners technology that acquire accurate information about their shape. Another approach to deal with material variability is input material classification. Specific characteristics can be measured to classify input material and reduce variability within each class. However, whether the process involves logs, mining ores or recycled papers, material classification has both a value and a cost. This paper first proposes a method based on classification tree analysis to classify hardwood logs. Next, using agent-based simulation, it analyses the value of different classification strategies, from detailed, to no classification at all. Results show in the context of the Québec hardwood lumber industry that the benefit of detailed classification is offset by its cost, while a relatively simple classification strategy dramatically improves output yield at relatively low cost.
Keywords: Hardwood timber industry, material classification, classification tree analysis, agent-based simulation.
Acknowledgement. The authors would like to thank Mr. Jean McDonald of FPInnovations for his collaboration. This work was founded by the Natural Sciences and Engineering Research Council of Canada (NSERC), Strategic Research Network on Value Chain Optimization (VCO).
Results and views expressed in this publication are the sole responsibility of the authors and do not necessarily reflect those of CIRRELT.
Les résultats et opinions contenus dans cette publication ne reflètent pas nécessairement la position du CIRRELT et n'engagent pas sa responsabilité. _____________________________
* Corresponding author: [email protected]
Dépôt légal – Bibliothèque et Archives nationales du Québec Bibliothèque et Archives Canada, 2014
© Gil, Frayret and CIRRELT, 2014

1 Introduction
A common issue faced by many industries, such as the forest product industry (FPI), the mining
industry or the recycling industry, concerns the need to make decision with unreliable or
incomplete information about input material. This variability concerns many aspects of decision-
making, including demand, input material attributes, cost, prices, quality, and transformation
yield. On the one hand, studies have shown that more detailed and accurate information can lead
to better supply chain performance (D'Amours, Montreuil, Lefrançois, & Soumis, 1999). On the
other hand, flexibility and agility in manufacturing are instrumental to dealing with both input
and demand variability (Kouiss, Pierreval, and Mebarki (1997), J. M. Frayret, D'Amours,
Rousseau, Harvey, and Gaudreault (2007)). However, in order to become agile, it is necessary to
develop advanced processes and technologies that detect and adapt to changes and variability.
This paper proposes and analyzes an approach to deal with input material variability in the
context of the Quebec hardwood timber industry. In this industry, logs have unique and variable
attributes. For sawmill managers, unless logs are systematically scanned and somehow tagged
when there are delivered, this variability leads to information incompleteness about their status,
which, in turn, leads to uncertainty with respect to their transformation. In other words, it is
difficult to predict both the transformation output yield (i.e., sawn timber volume) and mix (i.e.,
sawn timber attributes and quality).
Traditionally, sawmills managers organize operations and procurement in order to increase total
yield, based on sawn timber dimensions and quality parameters specified by the NHLA standards
(i.e., National Hardwood Lumber Association). Sawmills can also produce specific timber
Log Classification in the Hardwood Timber Industry: Method and Value Analysis
CIRRELT-2014-54 1

dimension and quality according to the specific needs of their customers. Next, timber is
transformed into specific secondary product components such as floors, cabinets, and palettes.
This general transformation strategy assumes that most NHLA standard timber products provide
adequate secondary transformation (i.e., component manufacturing) yields, instead of adapting
operations to meet actual demand requirements. This results in inadequate inventory levels of
products that do not meet demand expectations, and consequently, a loss of opportunity and
profits due to inventory cost and discount sale.
These inefficiencies are mainly the consequence of three causes. First, the use of NHLA
standards makes hardwood timber a commodity product. Therefore, the industry focuses its
continuous improvement efforts on yield maximization, in order to increase production volumes.
Second, the use of NHLA standards also leads the industry to ignore the specific needs of
secondary transformations. In other words, first transformation is not managed in order to
maximize the yields of secondary transformations, which leads to inefficient use of material and
resources. Finally, logs have very different attributes with respect to their physical dimension
and quality, which makes it even more difficult to accurately predict the secondary
transformation yields of every single log and every single potential secondary application.
Therefore, this paper proposes a hybrid methodological approach in order to solve this issue by
combining a statistical classification method of logs, and an agent-based simulation to analyse
the value of different classification strategies.
Log Classification in the Hardwood Timber Industry: Method and Value Analysis
2 CIRRELT-2014-54

2 Literature review
The forest product industry (i.e., FPI) has been extensively studied in the scientific community.
The operation research and industrial engineering community has proposed many approaches to
maximize output yields and lower cost in many different contexts. Rönnqvist (2003) proposes a
complete review of optimization problems in forestry, as well as the most common techniques
for solving them. Along the same line, Gunn (2009) proposes a review of mathematical
optimization methods for forest management. These two contributions illustrate both the extent
of OR applications in forestry, the efficiency of these methods and, indirectly, the potential value
of quality information in decision-making.
With a focus on sawmill operations optimization, Maturana, Pizani, and Vera (2010) and Alvarez
and Vera (2011) highlight the need for reliable information in the context of robust optimization
and heuristic techniques applications. The need to deal with information uncertainty has also
been addressed in other contexts of forestry. For instance Beaudoin, LeBel, and Frayret (2007)
propose a mixed integer programming approach to support the annual harvest planning process,
which uses a Monte Carlo analysis (see below) and a simple rule-based simulation in order to
address information uncertainty. Similarly, Zanjani, Nourelfath, and Ait-Kadi (2009) proposed a
multi-stage stochastic programming model for sawmill production planning with input materials
and demand information uncertainty. The same authors developed a similar approach, which
uses robust optimization for sawmill production planning with random yield (Zanjani, Ait-Kadi,
and Nourelfath (2010)). These technics were proven to be efficient approaches to deal with
information variability issues. However, they do not consider the impact of input material
information uncertainty on secondary transformation yields, which is addressed in this paper.
Log Classification in the Hardwood Timber Industry: Method and Value Analysis
CIRRELT-2014-54 3

Another effective tool to deal with uncertainty is simulation. Computer simulations can be used
to better understand the impacts of specific decisions, policies, or systems configurations through
the use of computer simulation of real systems. Computer simulations can also be used in
educational settings in order to develop specific skills, in which students control part of the
computer simulation variables through user interfaces. Beside spreadsheet simulation, there are
four main simulation technics, including Monte Carlo simulation, Discrete-Event Simulation,
System Dynamics and Agent-Based Simulation.
Monte Carlo Simulation uses, repeatedly, random sets of numbers from known probability
distribution of different sources of uncertainty in order to compute the results of a mathematical
model or algorithm (i.e., the system's model). From these results, the general behavior or
performance of that system can be inferred. It is used in practice when the behavior of the system
cannot be easily calculated analytically. Discrete-Event Simulation aims to create simulation
models of queuing-type systems, in which time moves forward either by equal time increments
or from one event to the next. Events and flows between the system’s components occur
according to known probability distributions, which specify processing and transit times, and
priority rules. Similarly, System Dynamics aims to model complex systems in order to analyze
their general behavior. However, System Dynamics uses a top-down modeling approach based
on stocks, flows, feedback loops and time delays, in order to simulate the complex interactions
between the components of a system. In other words, System Dynamics aims to capture the
ripple effect of changes to these components throughout the entire system, in order to model and
study the resulting non-linear behavior of the system. System Dynamics only models the mutual
dependencies between these components. It does not model the elementary interactions between
the individual elements of the system, which is what Agent-Based Simulation aims to model and
Log Classification in the Hardwood Timber Industry: Method and Value Analysis
4 CIRRELT-2014-54

simulate. Agent-Based Simulation is an emerging simulation tool (Macal & North, 2006), which
takes a bottom-up approach to model the individual behaviors and interactions of a system's
elements, referred to as agents. Therefore, instead of modeling the relationships between the
components a system, Agent-Based Simulation captures how the individual elements of a system
behave with respect to their own local environment and state, and how they interact,
communicate, make collective decisions, or influence each other. The Agent-Based Simulation
modeling paradigm generally uses theoretical models to capture individual behaviors.
In the timber production context, Reeb (2003) and Grigolato, Bietresato, Asson, and Cavalli
(2011) use Discrete-Event Simulation in order to develop production scenarios and forecast
production outcomes based on attributes such as length and logs diameter. More recently, in the
context of a log yard management, Beaudoin et al. (2012) achieve to reduce the average truck
cycle time and the total distance per loader, by changing the allocation strategy, using Discrete-
Event Simulation to test several configurations.
Concerning Agent-Based Simulation, Frayret (2011) presents an introduction of agent-based
technology applications in the forestry sector. In the specific domain of forest product supply
chain, several contributions have been proposed (Farnia et al. (2013), J. M. Frayret et al. (2007),
Forget et al, (2008), Cid Yanez et al (2009), Elghoneimy and Gruver (2011)). In these
applications, software agents are usually developed to simulate procurement and production
planning and scheduling decisions and how they are coordinated across the supply chain in
response to changing exogenous parameters. These applications are generally used to evaluate
production planning methodologies or supply chain coordination technics. Again, these
simulation applications are mainly concerned, so far, by forest operations and the first
Log Classification in the Hardwood Timber Industry: Method and Value Analysis
CIRRELT-2014-54 5

transformation (i.e., sawing, drying, planing). Secondary transformation operations are only
modeled as randomly generated purchase orders.
Another important issue dealing with material variability is automated inspection technology. By
providing detailed information about input material (i.e., trees, logs, work-in-process timber),
these technologies enable the adaption of transformation operations to individual log and WIP
attributes. For instance, in the softwood timber industry, scanners are used at different points in
the transformation process in order to maximize productions yield according to specific price
lists, which give a prioritizing value to each single type of WIP and timber piece. However, for
various reasons, this technology is not used in the hardwood first transformation, although
advanced applications exist in the furniture industry, which are capable of identifying knots and
decay on both faces of a piece of timber in order to optimize component production.
Finally, a practical alternative approach to deal with material variability is material classification.
Material classification aims to create classes of material, which attributes are similar, so the
transformation of material (e.g., logs) within a class has similar output. More specifically, the
characteristics of timber products made with logs of the same class are similar. Statistical
analysis techniques are used to create such classes. For instance, Petutschnigg and Katz (2005)
developed a non-linear model that can predict both timber performance according to log
diameter and length, and the type of timber, based on historical observations. A similar
procedure was used in Zhang & Liu (2006) by applying parametric and non-parametric
regression methods to predict lumber volume recovery for black spruce. This technic leads to
good results in small and medium sized trees. Finally, Tong and Zhang (2006) used detailed
information from scanned logs in order to compute the production yields of a plant using a
software simulation tool called Optitek. Optitek is a simulation tool that aims to predict yields
Log Classification in the Hardwood Timber Industry: Method and Value Analysis
6 CIRRELT-2014-54

based on log attributes and machine characteristics. This method, similar in part to the approach
used in this paper, requires the scanning of a representative sample of logs.
3 Objectives and methodology
When logs are delivered to a sawmill, they are laid down in the log yard and measured in order
to assess their volume and quality, for the sole purpose of paying the supplier. Then, they are
sorted into different piles according to their species. This simple classification rule only allows
production managers to select the logs to transform according to the most general attribute of
customer demand (i.e., the species). Specific details about customers' applications are
disregarded. Consequently, building on the reviewed literature, this paper aims, on the one hand,
to propose a novel log classification approach based on secondary transformation yield
similarities. More specifically, these similarities are based on the unit procurement cost of
secondary transformation. More specifically, the first transformation of a single log is a
diverging production process that leads to the manufacturing of several pieces of timber with
different dimensions and quality. If used for a specific type of secondary application, these
pieces of timber can be transformed into different volumes of components. Therefore, in order to
produce a given quantity of a specific type of component, it takes different volume of each type
of log according to their “appropriateness”. Consequently, it is theoretically relevant for the
production manager of the first transformation to know what type of logs should be transformed
in order to minimize the procurement volume of timber for each specific type of secondary
application. However, because such detailed classification of logs can lead to high handling and
sorting cost in the yard, its customer value can be offset by high first transformation cost.
Log Classification in the Hardwood Timber Industry: Method and Value Analysis
CIRRELT-2014-54 7

Consequently, this study aims, on the other hand, to assess the performance of different levels of
log class aggregation, and therefore, to measure the value of log attribute information.
3.1 General sawmill processes
Once logs are measured and valued, they are transported into different piles according to their
species. This simple classification rule only allows production managers to select the logs to
transform according to the most general attribute of customer demand (i.e., the species). Then, a
loader takes several logs from a selected pile and puts them on the feeder of the sawing line,
which contains about 20 minutes of workload. Next, they are transformed into several pieces of
timber. Such a production campaign aims to transform a specific species, and not to produce
specific timber for a second transformation application. The output timber is then planed, sorted
according to NHLA standard, and dried before been sent to a second transformation process,
which is usually carried out by other companies. Only specific classes of timber are sent. The
remaining classes are sold later.
In this process, demand information is only used in order to select the appropriate standard
timber products from inventory. This implies that such production campaigns (also referred to as
production plans in the remaining of this work) are only planned based on the required species
and not on customers’ applications (e.g., furniture, panel, molding).
This approach has two consequences. The first is the general disconnection between demand and
production, which is pushed to customers. The second consequence is the inability of hardwood
sawmills to control production output, which leads to missed opportunities and the use of logs
that are inappropriate for the required applications.
Log Classification in the Hardwood Timber Industry: Method and Value Analysis
8 CIRRELT-2014-54

3.2 Available information
In order to develop log classes, we used actual data from a typical sample of logs. Data
collection was carried out by FPInnovations. To do so, they analyzed the input logs and output
products of a sawmill. Sawing is considered as a non-parametric process, which, for a given log,
always produces the same output. The sample includes 240 yellow birch logs, for a population of
1900 logs transformed in a full workday of an average hardwood sawmill with two production
lines in Quebec (Canada). For each log, the following attributes were known:
x The position of the log in the tree (i.e., U –up-, or B -bottom-);
x The log diameter measured under the bark at the small end;
x The number of clear faces;
x The percentage of heart wood;
x The deduction percentage of different defects in the log, such as curvature and decay;
x The log quality based on the Québec Minister of Natural Resources standard;
x The sawing time;
x The cost.
The statistical distributions of the main attributes of these logs are presented in Figure 1. These
logs were cut into 2150 pieces of timbers, which were then analyzed with BorealScan (Caron,
2005). BorealScan is an industrial scanner developed by the Centre de recherche industrielle du
Québec, which aims to optimize the use of hardwood timber for appearance wood applications.
BorealScan is designed to scan the dimension and appearance of timber and anticipate its
expected yield per volume for each type of secondary transformation application (i.e., foot-board
produced per cubic meter of log, in fbm/m3, McDonald and Drouin (2010); Drouin, Beauregard,
and Duchesne (2010)). These secondary transformation applications are hardwood floor,
wardrobe, staircase, paneling, cabinet, moulding and palette.
Log Classification in the Hardwood Timber Industry: Method and Value Analysis
CIRRELT-2014-54 9

Log diameter
% Heart
Sawing time (min)
Cost
Figure 1: Logs statistical distributions of diameter, % of heartwood, sawing time and cost
Using this yield for each log and each application, and the cost of each log, we computed the unit
cost of timber per 1.000 fbm (i.e., foot-board measure, 1 Mfbm) of secondary transformation
component for log l and application a, expressed in $/Mfbm as follows, referred to as :
unit cost of timber for log and application ; (1)
with
L set of all logs;
A set of secondary transformation applications;
cost of log l;
expected yield of log l for application a;
Log Classification in the Hardwood Timber Industry: Method and Value Analysis
10 CIRRELT-2014-54

For each specific log, this unit cost represents the procurement cost to produce 1.000 fbm of
components of a given application, if all logs had identical attributes. Because not all logs can
produce pieces of timber useful for all applications, the terms useful log refers here to logs from
which we obtained pieces of timber that can be used (i.e., subset ) for a given application (i.e.,
with a yield greater than zero). Next, we computed, the average procurement cost for logs
and for all application , as follows:
∑
(2)
with
set of useful logs; nu number of useful logs
The number of logs with available information and the average procurement cost per application
are presented in table Table 1. Next, we identified the set of attributes to classify the logs
according to the target application. To do this, we use classification trees.
Table 1: General procurement information per transformation application
Floor Wardrobe Staircase Paneling Cabinet Molding Palette
# of useful logs (nu) 240 170 179 170 240 94 226
APC ($/Mpmp) $2,326 $3,498 $2,699 $3,664 $1,271 $6,964 $1,964
3.3 Classification trees
A classification tree is a nonlinear methodology, which uses decision rules to predict the
membership of a case, to one of multiples categories based on a set of attributes called the
predictor variables. In this data mining technique, the tree is constructed by partitioning the data
Log Classification in the Hardwood Timber Industry: Method and Value Analysis
CIRRELT-2014-54 11

into a tree-like structure with branches and nodes. At every node, a simple decision rule is
defined by creating a linear relation between one of the independent predictor variables and the
binary membership variable, which becomes the dependent variable. Here, the selection of a
predictor variable at a given node was done using information theory, by measuring the Shannon
entropy of every possibilities and selecting the one with the highest information gain. The
number of branches depends on the type of variable (i.e., quantitative or categorical) and the
algorithm used. One of the most effective and popular algorithms is the Classification And
Regression Tree, CART (Breiman, Friedman, Stone, & Olshen, 1984). The partition is repeated
until a pre-defined level (i.e. a fixed number of branches) or until a node is reached for which no
split improves the information gain. The final nodes are known as terminals, and the resulting
equations are used as classification rules.
In the dataset, the predictor variables are the logs’ attributes and the dependent variables are the
binary membership variables of each application (i.e., whether or not the log can be used for the
application). Consequently, in order to apply this method, a classification tree must be built for
each application. Since there is insufficient information for all the logs (i.e, not all logs have non-
zero yield for all applications), the first step is to choose how many of the observations (i.e.,
logs) are relevant for each category (i.e., application). In order to do this, we divided the range of
unit cost of timber per application of all logs (i.e., ) into percentiles. This resulted in a matrix
of binary values indicating whether or not the log belongs to the percentile. Since the cost Cl and
yield for each application of all logs is known, as well as the number of logs in each
percentile (Table 2), we calculated the average procurement cost of each percentile
(Table 3).
Log Classification in the Hardwood Timber Industry: Method and Value Analysis
12 CIRRELT-2014-54

Table 2: Observations (# of logs) per percentile and second transformation application
Percentile Floor Wardrobe Staircase Paneling Cabinet Molding Palette
10% 24 17 18 17 24 10 23 20% 48 34 36 34 48 19 45 30% 72 51 54 51 72 28 68 40% 96 68 72 68 96 38 90 50% 120 85 89 85 120 47 113 60% 144 102 107 102 144 56 135 70% 168 119 125 119 168 66 158 80% 192 136 143 136 192 75 180 90% 216 153 178 170 239 94 226
100% 240 170 179 170 240 94 226
Table 3: Average procurement cost per percentile and second transformation application Percentile Floor Wardrobe Staircase Paneling Cabinet Molding Palette
10% $ 788 $ 860 $ 746 $ 837 $ 599 $ 1,500 $ 535 20% $ 876 $ 1,000 $ 822 $ 1,006 $ 652 $ 1,711 $ 666 30% $ 941 $ 1,161 $ 914 $ 1,188 $ 698 $ 1,882 $ 782 40% $ 1,010 $ 1,339 $ 1,019 $ 1,373 $ 735 $ 2,251 $ 899 50% $ 1,085 $ 1,526 $ 1,146 $ 1,565 $ 769 $ 2,688 $ 1,025 60% $ 1,167 $ 1,701 $ 1,297 $ 1,752 $ 806 $ 3,150 $ 1,154 70% $ 1,261 $ 1,906 $ 1,475 $ 1,979 $ 847 $ 3,710 $ 1,292 80% $ 1,378 $ 2,191 $ 1,709 $ 2,309 $ 896 $ 4,439 $ 1,418 90% $ 1,547 $ 2,624 $ 2,674 $ 3,664 $ 1,265 $ 6,964 $ 1,964
100% $ 2,326 $ 3,498 $ 2,699 $ 3,664 $ 1,271 $ 6,964 $ 1,964
Next, for all percentiles p and applications a, a decision tree DTpa was built considering only the
attributes of the logs in the selected percentile (i.e., , with being the subset of logs of
percentile p for application a). The resulting equations at the terminal nodes were used to predict
the membership of all logs in the database to each application. The actual membership of log l to
application a and percentile p is noted (i.e., =1 if , 0 otherwise), while the
prediction of is noted ̂. In order to measure the quality of this learning process, we
introduced the binary variable and the prediction accuracy of the decision tree DTpa for
percentile p and application a, as follows:
Log Classification in the Hardwood Timber Industry: Method and Value Analysis
CIRRELT-2014-54 13

{ ̂ (3)
∑ | |
(4)
This indicator allows us to evaluate the learning accuracy for each decision tree DTpa, and its
associated threshold (i.e., the value of p), and each application. The of all the computed trees
(i.e., for all applications and thresholds) is presented in Table 4, showing the high prediction
efficiency of the methodology at every level. However, because the log sample used to build the
trees did not include enough logs, we were not able to measure the overall prediction accuracy
using an independent log sample. This aspect remains for future work.
The objective of this step is to find accurate classification rules (i.e., decision trees) that
simultaneously optimize secondary transformation yield and procurement cost. However, as
presented in Table 4, high learning accuracy is linked to high threshold p (i.e., with larger log
sample), which has also a higher procurement cost (see Table 3). Therefore, the challenge is to
find the right percentile per application, with low procurement cost and high accuracy. Appendix
1 presents the learning accuracy versus the average procurement cost.
Table 4: Learning accuracy per percentile and transformation application Percentile Floor Wardrobe Staircase Paneling Cabinet Molding Palette
10% 85% 95% 90% 93% 90% 95% 90% 20% 80% 88% 86% 88% 81% 92% 89% 30% 71% 86% 85% 85% 77% 90% 82% 40% 73% 79% 81% 82% 69% 89% 82% 50% 71% 75% 82% 80% 68% 88% 78% 60% 71% 78% 77% 79% 72% 83% 76% 70% 74% 78% 76% 77% 83% 80% 75% 80% 80% 80% 82% 80% 89% 76% 79% 90% 100% 85% 90% 85% 100% 75% 94%
Log Classification in the Hardwood Timber Industry: Method and Value Analysis
14 CIRRELT-2014-54

In order to avoid small log samples, which can lead the procedure to exclude several relevant
logs, we consider only percentile higher than 20%. In order to select the most appropriate
classification tree for each application, we choose the highest learning accuracy beyond 20%
with the lowest average procurement cost. Table 5 presents the chosen thresholds and the main
indicators. Since the number of independent variables is relatively big, the number of branches
found by the classification tree algorithm can also be large, however we tried to keep a relatively
low number of branches in order to reduce the complexity of the methodology, granted this
represents a loss in terms of both learning and prediction accuracy. An example of the
classification trees is presented in the Figure 2.
Once a classification tree has been found for each application, we calculated the procurement
cost per application based on the logs resulting for the use of these classification trees. In other
words, since the learning accuracy of these trees is lower than 100%, the logs predicted to be
useful for an application is different from the log sample used to build the trees. Therefore, a
different average procurement cost is to be expected. Table 6 presents the final sample size and
average cost per application once the classification trees are applied.
Table 5: Learning accuracy and average cost of chosen percentile per application
Floor Wardrobe Staircase Paneling Cabinet Molding Palette
APC ($/Mpmp) before classification
$2,326 $3,498 $2,699 $3,664 $1,271 $6,964 $1,964
Chosen threshold 40% 30% 30% 40% 50% 50% 30%
# of logs in sample 96 51 54 68 120 47 68
Classification accuracy 73.3% 85.8% 84.6% 82.1% 67.5% 87.9% 81.7%
APC ($/Mpmp) of sampled logs $1,010 $1,161 $914 $1,373 $769 $2,688 $782
Log Classification in the Hardwood Timber Industry: Method and Value Analysis
CIRRELT-2014-54 15

Figure 2: Example of a classification tree for the application wardrobe
The average cost reduction after classification shows that in all cases at least a 30% savings can
be achieved. Based on these classification rules, we build a joint classification grid that can be
used during the log reception process (see Annexe 2) to help operators classify logs according to
the production campaign. In other words, this grid allows them to select the most cost effective
logs to transform for specific secondary applications.
Table 6: General class characteristics for each application
Floor Wardrobe Staircase Paneling Cabinet Molding Palette
APC ($/Mpmp) before classification
$2,326 $3,498 $2,699 $3,664 $1,271 $6,964 $1,964
Selected percentile 40% 30% 30% 40% 50% 50% 30%
# of branches 6 4 6 4 5 5 5
# of logs 109 53 44 53 72 26 78
Classification accuracy 75.4% 85.8% 87.5% 82.1% 67.5% 87.9% 81.7%
APC ($/Mpmp) $1,594 $1,762 $1,216 $1,744 $866 $1,987 $1,235
Cost reduction 31.4% 49.6% 55.0% 52.4% 31.9% 71.5% 37.1%
Diameter < 26 No
Heart >= 45%
Yes
No
No
Yes
Clear Faces < 4
Yes
Yes
Yes
Start classification
Diameter < 34
No
No
Log Classification in the Hardwood Timber Industry: Method and Value Analysis
16 CIRRELT-2014-54

4 Simulation and experimentation phase
This section presents an agent-based simulation study of various strategies to implement the
classification rules identified in the previous chapter. Because these rules have been developed
for each application, they may be lead in practice to complex sorting and yard management
processes. Therefore, based on their similarity, these classes can be aggregated from 7 classes
(i.e., one rule per application) to 1 class (i.e. no classification rule). Consequently, we developed
seven aggregation strategies that needed to be evaluated. This chapter first presents the yard
management and sawing processes as it is generally implemented in hardwood sawmills. Next,
the agent-based simulation model is presented, as well as the seven aggregation strategies.
4.1 Yard management and sawing processes
The processes studied in this project include four main steps: log delivery; log handling in the
yard; log feeding; and timber storage after sawing. First, trucks arrive at the reception area,
carrying a load of 80 to 120 logs. During this step, logs are placed on the ground and measured
for payment purpose. Next, a loader takes a small batch and transports them to specific piles in
the log yard. As mentioned before, this basic yard management approach only segregates log
species. Third, when the sawmill inventory buffer is below a specific threshold, the loader takes
a batch of logs to the sawing feeding area. Finally, once logs are sawn, timber is temporarily
stored until they are delivered to their customer.
The proposed simulation model considers the sawing process as an aggregated and divergent
transformation process, which always transforms logs in a similar manner (i.e., a specific log will
always produce the same mix of timber). As mentioned earlier, because different classification
rules can be generated through different class aggregations, their practical implementation in this
Log Classification in the Hardwood Timber Industry: Method and Value Analysis
CIRRELT-2014-54 17

basic yard management process requires several adjustments to both yard management
operations and layout configurations. Similarly, because these configurations involve different
handling processes and transportation distances, their costs are not equivalent. Therefore, in
order to identify an efficient log yard layout configuration and log class aggregation strategy, as
well as to evaluate the impact of log handling on production, we developed an agent-based
simulation of a log yard and sawmill. This simulation model is described in the next section.
4.2 Simulation model
The general architecture of this model is presented in Figure 3, which represents the basic
process. However, information flows are slightly more complex to simulate the class aggregation
strategies, which require log sorting to be coordinated with the production campaign. This
section first presents in a general manner the model architecture, as well as the physical layout
implemented. Next, the different agents and their function are described. Finally, the
experimental design and the different log class aggregation strategies are presented.
Figure 3: Basic sawmill process model
This simulation model was built using AnyLogic, a hybrid discrete-event and agent-based
simulation platform. The development of the model was inspired by a real hardwood sawmill in
Planning agent
Sawing DryingRule-based Sorting
Second transformation
Source from harvesting
Sawmill activities
Customer
Basic sorting
b c da
Log Classification in the Hardwood Timber Industry: Method and Value Analysis
18 CIRRELT-2014-54

the province of Québec, with a reception area, a log yard and a sawmill, as described previously.
Handling distances are therefore roughly equivalent to that of the real sawmill.
4.2.1 Agents definition
Truck agents
Truck agents are responsible for delivering logs to the sawmill. They are simple reactive agents.
Every truck agent has a similar transportation capacity. However, the mix of logs they deliver is
different. In order to simulate a realistic procurement of various logs, logs are randomly chosen
from the initial database containing 240 log, resulting in a dynamic mix of logs for each truck.
Loader agent
Loader agent carries out two tasks. The first task is to unload trucks, while the second is to sort
logs at the receiving area. Concerning sorting, the loader use the classification grid developed in
Section 3. Since all the attributes are measured at the reception of the logs in order to know their
price, we assume that once a log is valued, the grid can be simultaneously used to identify the
applications the log can be used for. According to the active aggregation strategy, these
applications can also be merged together to create families of application (see further). The
aggregated classes are then compared with the active production campaign. If there is a positive
match between the log and the campaign, the log is temporarily placed in a pile with similar logs
dedicated to the production campaign. Otherwise, it is temporarily placed in a different pile
according to its potential application and the classification strategy.
After this pre-sorting process, the loader brings every pile of logs in batch of 5 to 10 to their final
pile in the log-yard (storage area), using the same classification strategy. In the mean time, if the
Log Classification in the Hardwood Timber Industry: Method and Value Analysis
CIRRELT-2014-54 19

sawing process feeding inventory (i.e., the feeder) is below certain level (i.e. 20 minutes of
workload), logs are transported directly to the feeder instead the storage zone.
Finally, loader agents are also responsible for transporting logs to the sawmill agent. Since all
logs have been previously classified according to a specific application (or group of
applications), one pile becomes the main source of logs for the sawmill according to the
production campaign. Every time a feeding order is triggered (i.e., the sawmill inventory is
below a certain level), the loader is responsible to feed the buffer with logs from this pile. If the
pile is empty, the loader brings logs from the nearest alternative pile.
Sawmill agent
Like the truck agent, the sawmill agent is a simple reactive agent, which aims to emulate, in an
aggregated manner, the sawing process. Because sawmills are currently managed to process logs
in only one manner, each log leads systematically to the same mix of timber pieces. However,
because logs are different, the resulting mix of timber is different for each log. Therefore, we
used the data from the transformation of the initial log sample in order to create a large
transformation matrix that describe the input-output relationship of the entire sample, as well as
the processing time for each log according to the diameter. Thus, the role of the sawmill agent
consists in simply transforming the logs brought by the loader into various pieces of timber.
Next, we simulate a week of production that follows a sequence of production campaigns (i.e., a
series of 1 to 3 secondary applications), which we refer to as a production plan. Production plans
do not affect the function of the sawing agent. They only affect the loader agents, which classify
the logs according to the active production campaign. These production plans are exogenous
parameters developed mainly to evaluate the different log yard configurations in all possible
Log Classification in the Hardwood Timber Industry: Method and Value Analysis
20 CIRRELT-2014-54

production settings. Finally, the sawn timber is classified according to NHLA standard, and
performance indicators are computed for comparison purpose.
4.2.2 Log yard layout design
This study is inspired by an actual sawmill in Quebec. Since the log yard is where most activities
take place, the proposed layout models are based on the log yard configuration of that sawmill.
This log yard is a terrain with an irregular geometry surrounding the sawmill. In order to
evaluate various classification strategies, we developed several log yard configurations and
handling networks that represent each of the tested configurations. Each of these configurations
was defined for a specific classification strategy. The next section describes the experiments
carried out to evaluate the classification strategies.
4.3 Experimental design
In order to measure the value of log attributes information, we designed a set of experiments,
which aims at emulating an extended range of production settings and evaluate all classification
strategies within these settings. In order to create a first reference to which every configuration
can be compared to, we also develop a reference simulation model using the basic layout
configuration and classification strategy. For simplification purpose, and because we only had
data for yellow birch, this experimental design also only considers one single species, which
represents a limit of the study. However, it is not unusual for a sawmill to process only a single
species during a week of production, which is the length of the simulation horizon.
The model simulates a 5-day period, with working shift from 8AM to 5PM, two breaks of 15
minutes, and one lunch hour at noon. The modeled sawmill uses one standard loader agent at the
reception area, with a maximum capacity of 15 logs per charge. The sawmill has one production
Log Classification in the Hardwood Timber Industry: Method and Value Analysis
CIRRELT-2014-54 21

line, for a production capacity of 1000 logs. For comparison purpose, we computed the total
yield, the yield of each target application, the total procurement cost of the transformed logs, the
ratio between yield and cost, and finally the utilization rate of the loader.
4.3.1 Initial log inventory
Using the distribution of the initial log sample, we developed a random function to create three
initial stock levels: 0, 12,000 and 24,000 logs. According to the sawmill average output, these
inventory levels represents: no inventory, two weeks and four weeks of work, which is common.
We also classified these logs and located them in the log yard according to the considered
classification strategy. This process was carried out outside the simulation horizon in order to
measure only the real loader utilization during the receiving and classification process.
4.3.2 Production plan generation
Sawmills’ operations are generally organized by campaigns in a weekly manner, in order to meet
the specific order for secondary transformation customers. In other words, a week is divided into
at most 3 sequential campaigns of production, which represent the production plan of the week.
The minimum length of a campaign is half a day, and the maximum is 5 days. Because each
campaign can be set to produce timber for 1 of 7 possible types of application, there is a limited
number of possible production plans. If a typical week can transform up to 3 products, the total
number of scenarios is 259 (7P1 + 7P2 + 7P3). However, since the palette application has a very
low demand and only use low quality logs, no production campaign is normally allocated for this
application. It is rather a by-product of log transformation. Nevertheless, because all logs must
be transformed, including low quality logs that can only produce palette timber, in our simulation
model, we allocated the last time slot of the week to producing palette timber using low quality
Log Classification in the Hardwood Timber Industry: Method and Value Analysis
22 CIRRELT-2014-54

logs (i.e. Friday afternoon). This also guaranties that classification does not improve
performance based on the skimming of low quality logs. Consequently, the total number of
scenarios is 156 (6P1 + 6P2 + 6P3), as presented in Figure 4.
Figure 4: Production plan possible configurations
4.3.3 Classification strategies
In order to design classification strategies, we develop a process to aggregate several of the 7
initial classes (one per application) to obtain fewer classes. To do so, we analyzed the initial
database and calculated the yield correlation between these classes (see Table 7).
Table 7: Correlation matrix of logs yield in each secondary application
Floor Wardrobe Staircase Paneling Cabinet Molding Palette
Floor 1.000 0.320 0.380 0.320 0.879 0.307 -0.041
Wardrobe 1.000 0.873 1.000 0.631 0.941 -0.063
Staircase 1.000 0.873 0.720 0.812 -0.040
Paneling 1.000 0.631 0.941 -0.063
Cabinet 1.000 0.594 -0.024
Molding 1.000 -0.039
Palette 1.000
Many similarities can be observed. For example, the Wardrobe, Paneling and Staircase
applications have a perfect, or near perfect match, meaning that the same logs can be used for
any of these applications. Along the same line, the logs that are appropriate for these high value
Log Classification in the Hardwood Timber Industry: Method and Value Analysis
CIRRELT-2014-54 23

applications are not appropriate for lower value applications such as Palette. Next, to identify
which class should be aggregated with another, we analyzed the correlation matrix and identified
either the class with the least correlation, and created a new class, or the class with highest
correlation and aggregated these classes. This process is illustrated in the next paragraph. Note
that this aggregation strategy does not guaranty optimality, and other strategies exist.
4.3.4 Application of the classification strategies
The first classification strategy is to have a class per application with a total of 7 classes. Next,
because Palette has the least correlation with any of the other applications, a second
classification strategy can be to separate Palette from the other applications, and create a 2-class
strategy. For a third strategy, we aggregated Floor and Cabinet into a single class. Keeping a
separate class for the Palette, this strategy has 3 classes. For a fourth strategy, we use the third
strategy and created a separate class for Molding. At this stage, we realized that the class for
Floor and Cabinet contained too many logs. Therefore, for a fifth strategy, we separated Cabinet
from this group, while keeping the same four other classes. For a sixth strategy we separated
Staircase from the larger class group. These strategies are presented in Appendix 3. The next
Section describes the different log yard layouts that were developed according these strategies.
4.3.5 Layout Strategy
Once the classification strategies classes were developed, we defined for each of them a specific
layout configuration. In order to do that, using the distribution of the log sample, and therefore
the volume of logs in each category, we first divided the yard layouts in seven zones to be
allocated to specific log classes. Next, we developed a unified grid with specific applications per
zone for each classification strategy, as presented in Table 8. Each of these 7 strategies was
Log Classification in the Hardwood Timber Industry: Method and Value Analysis
24 CIRRELT-2014-54

simulated with all 156 production plans, for a total of 1,092 combinations, with 10 replications
and 3 initial stock scenarios for a total of 32,760 experiments. The results are presented and
analyzed in the next section.
Table 8: Aggregation strategies applied to the layout zones in the log-yard Strategy Zone 1 Zone 2 Zone 3 Zone 4 Zone 5 Zone 6 Zone 7
1
Floor,
Wardrobe, Staircase, Paneling, Cabinet, Molding, Palette
2
Floor,
Wardrobe, Staircase, Paneling, Cabinet, Molding
Palette
3 Floor, Cabinet
Wardrobe, Staircase, Paneling, Molding
Palette
4 Floor, Cabinet
Wardrobe, Staircase, Paneling
Molding
Palette
5 Floor Wardrobe,
Staircase, Paneling
Molding Cabinet Palette
6 Floor Wardrobe, Paneling Staircase Molding Cabinet Palette
7 Floor Wardrobe Paneling Staircase Molding Cabinet Palette
5 Results and analysis
For each simulation run, we computed four key performance indicators in order to compare the
general results. These performance indicators are:
1. The total first transformation yield;
Log Classification in the Hardwood Timber Industry: Method and Value Analysis
CIRRELT-2014-54 25

2. The anticipated production yield;
3. The ratio between the anticipated yield and the total procurement cost;
4. The utilization rate of the loader.
5.1 Performance analysis
Once the results dataset were generated, data from the ten repetitions were averaged. The 156
production plans were also analysed by considering the number of production campaign (i.e. 1 to
3). Every indicator was also analyzed for each aggregation strategy (i.e. 1 to 7), and for different
level of initial inventory (i.e. 0, 12,000 and 24,000 logs). The results are presented below.
5.1.1 Total first transformation yield
The first indicator is the total first transformation yield generated for each scenario. In this case
we found that when the initial inventory is zero, the total production yield is reduced when a
sorting strategy is introduced. This happens because the new log sorting and handling process
increases loader utilization, which becomes a bottleneck (Figure 5).
Figure 5: Total first transformation yield (fbm) per initial stock and strategy
Log Classification in the Hardwood Timber Industry: Method and Value Analysis
26 CIRRELT-2014-54

When the initial inventory is positive, sorting increases yield by 8 to 20%. The peak yield level is
reached with two piles (i.e., 2-class strategy). This suggests that only by separating the logs
belonging to the Palette application, it is possible to achieve higher first transformation yields.
Other strategies also exclude Palette application logs; however, they require more handling.
The analysis of this yield, for different number of products in the production plan, leads to
similar conclusion when sorting is introduced (Figure 6). Similarly, we can also observe that the
yield increases when more product types are produced (from 1 to 3). This improvement is linked
to the increased effectiveness of classification strategies for a mix of products. Indeed, since
classification requires predefined zones to store the logs per applications, only one pile is
dedicated to feed the sawing process. Consequently, less handling is expected.
Figure 6: Total first transformation yield (fbm) for different product types in the
production campaign
Log Classification in the Hardwood Timber Industry: Method and Value Analysis
CIRRELT-2014-54 27

5.1.2 Anticipated production yield
The anticipated production yield is the volume of timber produced in each campaign for the
corresponding secondary application. For this indicator, we observe that if there is no initial
inventory, sorting has no impact on yield since the same logs are transformed in all scenarios.
However, with initial inventory, the anticipated production yield increases by 28% on average,
because of the ability of the system to use previously delivered logs (Figure 7). The anticipated
production yield is also affected in similar proportion with respect to the number of product
types in the production plan (Figure 8). Again, the indicator shows that the use of sorting
strategies has a better performance in presence of a mix of products in the production plan, with
an average increase of 2.9% when three product types are transformed instead of one.
Figure 7: Average anticipated production yield (fbm) for every strategy and inventory level
Log Classification in the Hardwood Timber Industry: Method and Value Analysis
28 CIRRELT-2014-54

Figure 8: Average anticipated production yield (fbm) for different product types in the production campaign
5.1.3 Ratio between the anticipated yield and the total procurement cost
With the selection of more appropriate logs to transform for any secondary application, one
expects to reduce procurement cost for a given volume of component produced. In order to
validate this important benefit, we propose to study the ratio between the total procurement cost
and anticipated secondary transformation yield ($/fbm). This indicator provides a measure of the
total expenses for producing secondary transformation products.
The results show an average reduction of 12% of the ratio with sorting (Figure 9). Moreover,
results show that sorting strategies with more classes have lower ratios. In other words, increased
classification can lead to lower procurement cost with respect to the second transformation
sector. Similarly, as expected, the indicator also shows that lower ratios are achieved when
sorting is applied to production plans with several types of products, with an average reduction
of 15.7% when three types of products are present in the production campaign (Figure 10).
Log Classification in the Hardwood Timber Industry: Method and Value Analysis
CIRRELT-2014-54 29

Figure 9: Ratio between anticipated yield and procurement cost for different initial inventory
Figure 10: Ratio between anticipated yield and procurement cost for different product types in the production campaign
5.1.4 Loader utilization
Concerning loader utilization, the introduction of a sorting strategy represents an average
increase of 37% of the loader utilization. This result is a logical consequence of the log-yard
management and log handling (Figure 11). When the initial inventory is high and sorting
Log Classification in the Hardwood Timber Industry: Method and Value Analysis
30 CIRRELT-2014-54
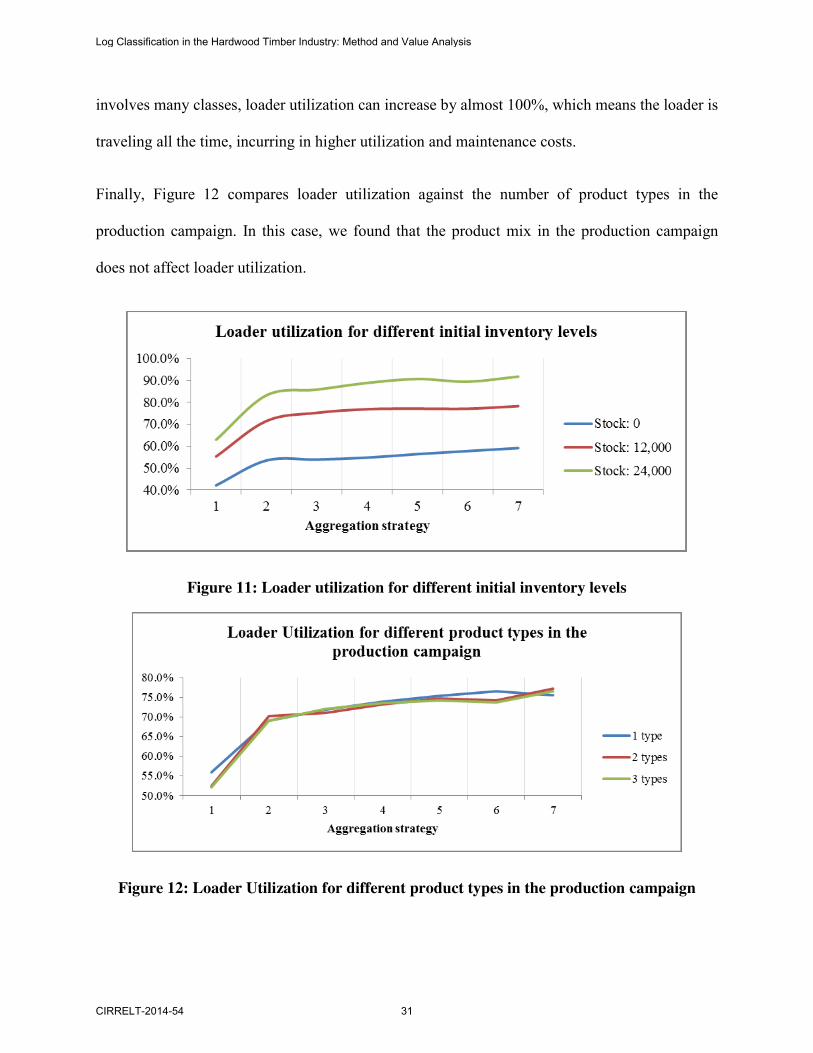
involves many classes, loader utilization can increase by almost 100%, which means the loader is
traveling all the time, incurring in higher utilization and maintenance costs.
Finally, Figure 12 compares loader utilization against the number of product types in the
production campaign. In this case, we found that the product mix in the production campaign
does not affect loader utilization.
Figure 11: Loader utilization for different initial inventory levels
Figure 12: Loader Utilization for different product types in the production campaign
Log Classification in the Hardwood Timber Industry: Method and Value Analysis
CIRRELT-2014-54 31

5.2 Results analysis
With the results of the simulation experiments, we found that the presence of a classification
strategy can increase the total first transformation yield by 8 to 20%, as well as the anticipated
volume of secondary transformation products by 28%. We also found that the use of
classification strategies is more effective when the production campaign has more product types,
which tends to lead to the conclusion that log classification might be necessary for a sawmill to
become more customer-driven and agile. Along the same line, in all the measured indicators, the
presence of initial inventory improves the results.
Although an average procurement cost increase of 11% has been observed with sorting, a higher
production yield is also expected. The ratio between the total procurement cost and the
anticipated yield ($/fbm) shows an average reduction of 12% when log sorting is used. This
indicator also shows that sorting strategies of higher complexity (more sorting classes) has better
results, meaning that a better initial classification can lead to lower procurement cost for the
second transformation sector. However, loader utilization is also considerably affected. When
sorting is implemented, an average of 37% increase is observed. In general, sorting strategies
with 4 classes and more, lead only to the marginal contribution of the yield, while loader
utilization increases more rapidly.
In conclusion, this study shows that the used of a classification strategy improves sawmill
operations and performance. However, the benefits of complex classification strategies involving
the use of many different classes can become quickly offset by increased loader utilization.
Furthermore, it is impossible to generalize these results to other industrial applications. Many
industries must deal with variable raw material/input. For instance, recycling industries, such as
Log Classification in the Hardwood Timber Industry: Method and Value Analysis
32 CIRRELT-2014-54

the recycled pulp and paper industry, deal regularly with variable inputs. However, this study
presents a basic methodological approach to evaluate to benefits of input material classification
to any sectors.
6 Conclusion
This research proposed a new application and combination of known methodologies to deal with
input uncertainty in terms of quality and performance. This study was specifically applied to a
hardwood sawmill in Quebec (Canada), which transform yellow birch logs into pieces of timber
for various secondary transformation applications. These logs were initially measured and their
output transformation was analyzed with an industrial scanner in order to anticipate their yield
for various secondary transformation applications. This methodology implies the development of
a classification grid that can be used during the receiving process to classify raw material. It was
demonstrated that this classification grid can lead to significant secondary yield performance
improvement (i.e., 28%). However, this high quality production increase is offset by the increase
in the resource utilization (i.e. loader), which increases its average utilization by 37%.
The procurement cost also increases by an average of 11% as a consequence of higher
production. However, the ratio between the procurement cost and the secondary yield shows an
average reduction of 12%, meaning that the total useful yield increased more than the
procurement cost. In this research, we did not analyse this financial trade-off and further analysis
is required. Finally, this study shows that a large portion of this improvement can be achieved by
a classification strategy that involves much less classes. Indeed, after a large number of
experiments, we found that using only 3 classes, instead of 7, can achieve more than 90% of this
Log Classification in the Hardwood Timber Industry: Method and Value Analysis
CIRRELT-2014-54 33

improvement, meaning an increase of 34% of loader utilization and 14% in procurement cost but
also, an increase of 29% in the anticipated production yield (fbm).
6.1 Further work
Although this result is encouraging for sawmill managers, the tested log yard layouts were not
optimal. Log yard layout design is a complex optimization process. Research must be done to
improve how log yards are designed and operated. We also suggest a more detailed study of the
financial benefits of the project, to compare whether the new approach results are sustainable.
Also, the introduction of a new loader might also contribute to the result. Future work also
includes the analysis of other species in order to develop new specific classification grids.
Future work also includes the adaptation of the proposed methodology to other sectors, such as
the recycling of industrial and domestic wastes.
Acknowledgements
The authors would like to thank Jean McDonald of FPInnovations for his collaboration. This
work was founded by the VCO Network and the NSERC.
References
Alvarez, P., & Vera, J. (2011). Application of Robust Optimization to the Sawmill Planning Problem. Annals of Operations Research, 1-19. doi: 10.1007/s10479-011-1002-4
Beaudoin, D., LeBel, L., & Frayret, J. M. (2007). Tactical supply chain planning in the forest products industry through optimization and scenario-based analysis. Canadian Journal of Forest Research-Revue Canadienne De Recherche Forestiere, 37(1), 128-140.
Beaudoin, D., Beaudoin, L., LeBel, M., and Soussi. 2012. Discrete Event Simulation to Improve Log Yard Operations. INFOR. Information systems and operational research 50, 175-185.
Log Classification in the Hardwood Timber Industry: Method and Value Analysis
34 CIRRELT-2014-54

Breiman, L., Friedman, J., Stone, C., & Olshen, R. A. (1984). Classification and Regression Trees (Vol. 1): Chapman and Hall/CRC.
Caron, M. (2005, July 25-26, 2005). BorealScanTM: CRIQ's endline achievement in vision and process optimisation technologies. . Paper presented at the 1 Ith International Conference on Scanning Technology and Process Optimization for the Wood Industry (ScanTech), Las Vegas, Nevada.
Cid Yanez, F. C., Frayret, J. M., Leger, F., & Rousseau, A. (2009). Agent-based simulation and analysis of demand-driven production strategies in the timber industry. International Journal of Production Research, 47(22), 6295-6319.
D'Amours, S., Montreuil, B., Lefrançois, P., & Soumis, F. (1999). Networked manufacturing:: The impact of information sharing. International Journal of Production Economics, 58(1), 63-79.
Drouin, M., Beauregard, R., & Duchesne, I. (2010). Impact of Paper Birch (Betula papyrifera) Tree Characteristics on Lumber Color, Grade Recovery, and Lumber Value. Forest Products Journal, 60(3), 236-243.
Elghoneimy, E., & Gruver, W. (2011). Intelligent Decision Support and Agent-Based Techniques Applied to Wood Manufacturing. In A. Abraham, J. Corchado, S. González & J. De Paz Santana (Eds.), (Vol. 91, pp. 85-88). International Symposium on Distributed Computing and Artificial Intelligence: Springer Berlin / Heidelberg.
Farnia, F., Frayret, J.-M., Lebel, L., Beaudry, C., 2013. Multiple-Round Timber Auction Design and Simulation, International Journal of Production Economics, 146(1), pp 129-141.
Forget, P., D'Amours, S., & Frayret, J. M. (2008). Multi-behavior agent model for planning in supply chains: An application to the lumber industry. Robotics and Computer-Integrated Manufacturing, 24(5), 664-679.
Frayret, J.-M. (2011). Multi-Agent System applications in the forest products industry. [Invited review paper]. Journal of Science and Technology for Forest Products and Processes, 1(2), 15-29.
Frayret, J. M., D'Amours, S., Rousseau, A., Harvey, S., & Gaudreault, J. (2007). Agent-based supply-chain planning in the forest products industry. International Journal of Flexible Manufacturing Systems, 19(4), 358-391.
Grigolato, S., Bietresato, M., Asson, D., & Cavalli, R. (2011). Evaluation of the manufacturing of desk and stringer boards for wood pallets production by discrete event simulation. Biosystems Engineering, 109(4), 288-296.
Gunn, E. (2009). Some Perspectives on Strategic Forest Management Models and the Forest Products Supply Chain. Infor, 47(3), 261-272.
Kouiss, K., Pierreval, H., & Mebarki, N. (1997). Using multi-agent architecture in FMS for dynamic scheduling. Journal of Intelligent Manufacturing, 8(1), 41-47.
Macal, C., & North, M. (2006). Introduction to Agent-Based Modeling and Simulation. Argonne (IL): Center for Complex Adaptive Agent Systems Simulation (CAS2), Argonne National Laboratory.
Log Classification in the Hardwood Timber Industry: Method and Value Analysis
CIRRELT-2014-54 35

Maturana, S., Pizani, E., & Vera, J. (2010). Scheduling production for a sawmill: A comparison of a mathematical model versus a heuristic. Computers & Industrial Engineering, 59(4), 667-674.
McDonald, J., & Drouin, M. (2010). Évaluation de procédés de débitage axés sur les besoins de la deuxième et de la troisième transformation Programme des technologies transformatrices (pp. 47): FPInnovations.
Petutschnigg, A. J., & Katz, H. (2005). A loglinear model to predict lumber quality depending on quality parameters of logs. Holz als Roh - und Werkstoff, 63(2), 112-117.
Reeb, J. (2003). Simulating an extra grader in a sawmill. Forest Products Journal, 53(11/12), 81-84.
Rönnqvist, M. (2003). Optimization in forestry. Mathematical Programming, 97(1-2), 267-284.
Tong, Q., & Zhang, S. (2006). Modelling jack pine lumber value recovery in relation to tree characteristics using Optitek simulation. Forest Products Journal, 56(1), 66-72.
Zanjani, M. K., Ait-Kadi, D., & Nourelfath, M. (2010). Robust production planning in a manufacturing environment with random yield: A case in sawmill production planning. European Journal of Operational Research, 201(3), 882-891.
Zanjani, M. K., Nourelfath, M., & Ait-Kadi, D. (2009). A multi-stage stochastic programming approach for production planning with uncertainty in the quality of raw materials and demand. International Journal of Production Research, 48(16), 4701-4723.
Zhang, S. Y., & Liu, C. (2006). Predicting the lumber volume recovery of Picea mariana using parametric and non-parametric regression methods. Scandinavian Journal of Forest Research, 21(2), 158-166.
Log Classification in the Hardwood Timber Industry: Method and Value Analysis
36 CIRRELT-2014-54

Annexe 1 – Classification tree accuracy vs. average cost per application
Note: The right axe belongs to the
accuracy and the left to the procurement
cost
Log Classification in the Hardwood Timber Industry: Method and Value Analysis
CIRRELT-2014-54 37

Ann
exe 2
– J
oint
clas
sific
atio
n gr
id p
er tr
ansf
orm
atio
n ap
plic
atio
n
Fl
oor
War
drob
e St
airc
ase
Pane
ling
Cab
inet
M
oldi
ng
Pale
tte
Posit
ion
U
B
B
U
B
Min
imal
diam
eter
>=
32cm
<
32cm
26 to
32 c
m
>= 3
4
cm
26 to
30 c
m
>= 3
2
cm
26 to
32 c
m
>= 3
4
cm
>= 2
6
cm
>= 3
8
cm
>= 2
2 cm
<=
22
cm
24 to
26 c
m
Num
ber
of c
lear
face
s
0 or
1 >=
2
>= 3
4
0 to
3
4 3
or 4
4
0 to
3
4
Hea
rt’s
size
at
poin
t’s e
nd
<
45%
< 28%
< 45
%
<
46%
>=
32%
% o
f ded
uctio
n
MR
N
> 12%
17%
< 7%
Log Classification in the Hardwood Timber Industry: Method and Value Analysis
38 CIRRELT-2014-54

Annexe 3 – Aggregation strategies
# of classes
Applications in each group
1 All applications in the same group
2 G1: Floor, Wardrobe, Staircase, Paneling, Cabinet and Molding G2: Palette
3 G1: Floor and Cabinet G2: Wardrobe, Staircase, Paneling and Molding G3: Palette
4
G1: Floor and Cabinet G2: Wardrobe, Staircase and Paneling G3: Molding G4: Palette
5
G1: Floor G2: Wardrobe, Staircase and Paneling G3: Cabinet G4: Molding G5: Palette
6
G1: Floor G2: Wardrobe and Paneling G3: Staircase G4: Cabinet G5: Molding G6: Palette
7 A pile for each application
Log Classification in the Hardwood Timber Industry: Method and Value Analysis
CIRRELT-2014-54 39