Location Strategies- Cara Menentukan Lokasi Usaha
41
8 - 1 © 2011 Pearson Education, Inc. publishing as Prentice Hall 8 Location Strategies PowerPoint presentation to accompany Heizer and Render Operations Management, 10e Principles of Operations Management, 8e PowerPoint slides by Jeff Heyl
-
Upload
independent -
Category
Documents
-
view
0 -
download
0
Transcript of Location Strategies- Cara Menentukan Lokasi Usaha
8 - 1© 2011 Pearson Education, Inc. publishing as Prentice Hall
8 Location Strategies
PowerPoint presentation to accompany Heizer and Render Operations Management, 10e Principles of Operations Management, 8e
PowerPoint slides by Jeff Heyl

8 - 2© 2011 Pearson Education, Inc. publishing as Prentice Hall
Location Strategy
The objective of location strategy is to maximize the benefit of location to the
firm

8 - 3© 2011 Pearson Education, Inc. publishing as Prentice Hall
Location Strategy One of the most important
decisions a firm makes Increasingly global in nature Significant impact on fixed and
variable costs Decisions made relatively
infrequently The objective is to maximize
the benefit of location to the firm
8 - 4© 2011 Pearson Education, Inc. publishing as Prentice Hall
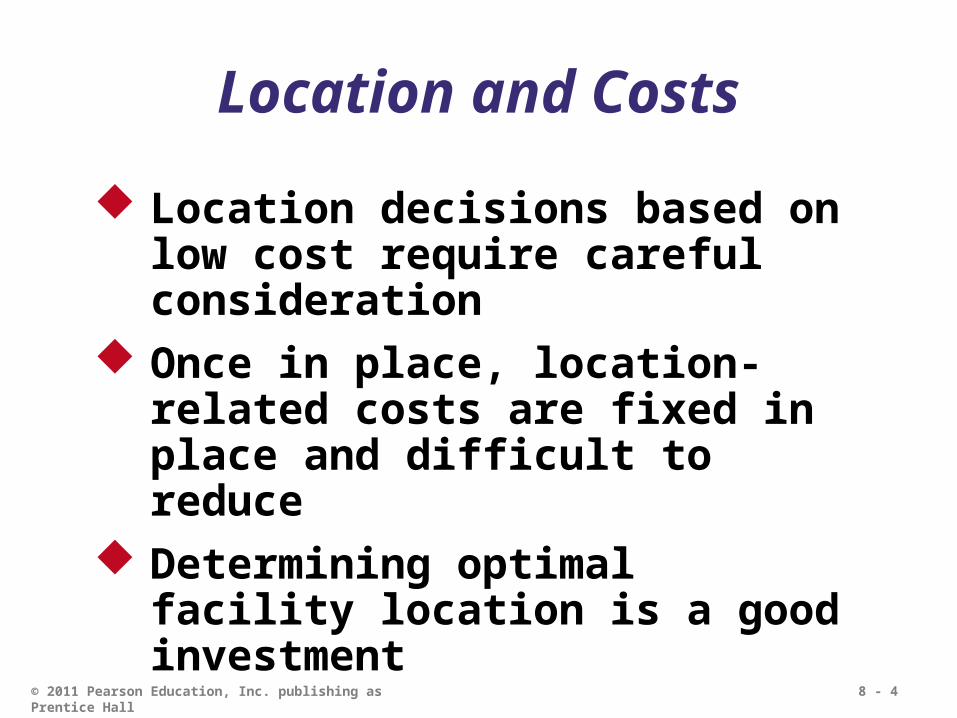
Location and Costs Location decisions based on
low cost require careful consideration
Once in place, location-related costs are fixed in place and difficult to reduce
Determining optimal facility location is a good investment

8 - 5© 2011 Pearson Education, Inc. publishing as Prentice Hall
Location and Innovation Cost is not always the most
important aspect of a strategic decision
Four key attributes when strategy is based on innovation High-quality and specialized
inputs An environment that encourages
investment and local rivalry A sophisticated local market Local presence of related and
supporting industries

8 - 6© 2011 Pearson Education, Inc. publishing as Prentice Hall
Location Decisions
Long-term decisions Decisions made infrequently Decision greatly affects
both fixed and variable costs
Once committed to a location, many resource and cost issues are difficult to change

8 - 7© 2011 Pearson Education, Inc. publishing as Prentice Hall
Location DecisionsCountry Decision Key Success Factors
1. Political risks, government rules, attitudes, incentives
2. Cultural and economic issues
3. Location of markets4. Labor talent,
attitudes, productivity, costs
5. Availability of supplies, communications, energy
6. Exchange rates and currency risks
Figure 8.1
8 - 8© 2011 Pearson Education, Inc. publishing as Prentice Hall
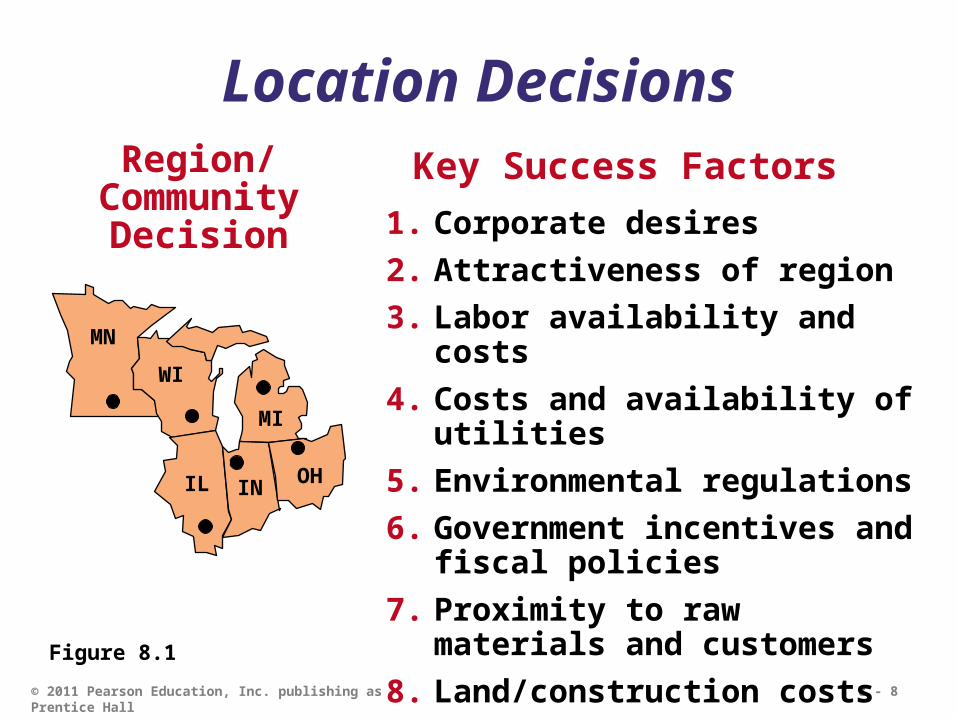
Location DecisionsRegion/ Community Decision
Key Success Factors1. Corporate desires2. Attractiveness of region 3. Labor availability and
costs4. Costs and availability of
utilities5. Environmental regulations6. Government incentives and
fiscal policies7. Proximity to raw
materials and customers8. Land/construction costs
MNWI
MI
IL IN OH
Figure 8.1

8 - 9© 2011 Pearson Education, Inc. publishing as Prentice Hall
Location DecisionsSite Decision Key Success Factors
1. Site size and cost2. Air, rail, highway,
and waterway systems
3. Zoning restrictions4. Proximity of
services/ supplies needed
5. Environmental impact issues
Figure 8.1
8 - 10© 2011 Pearson Education, Inc. publishing as Prentice Hall
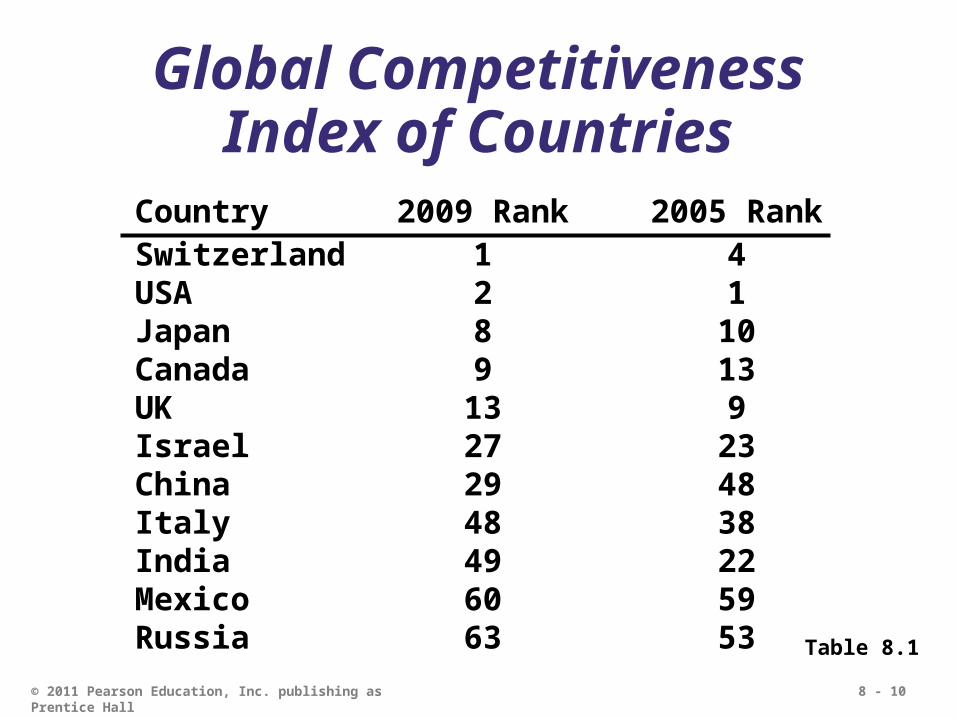
Global Competitiveness Index of Countries
Country 2009 Rank 2005 RankSwitzerland 1 4USA 2 1Japan 8 10Canada 9 13UK 13 9Israel 27 23China 29 48Italy 48 38India 49 22Mexico 60 59Russia 63 53 Table 8.1
8 - 11© 2011 Pearson Education, Inc. publishing as Prentice Hall
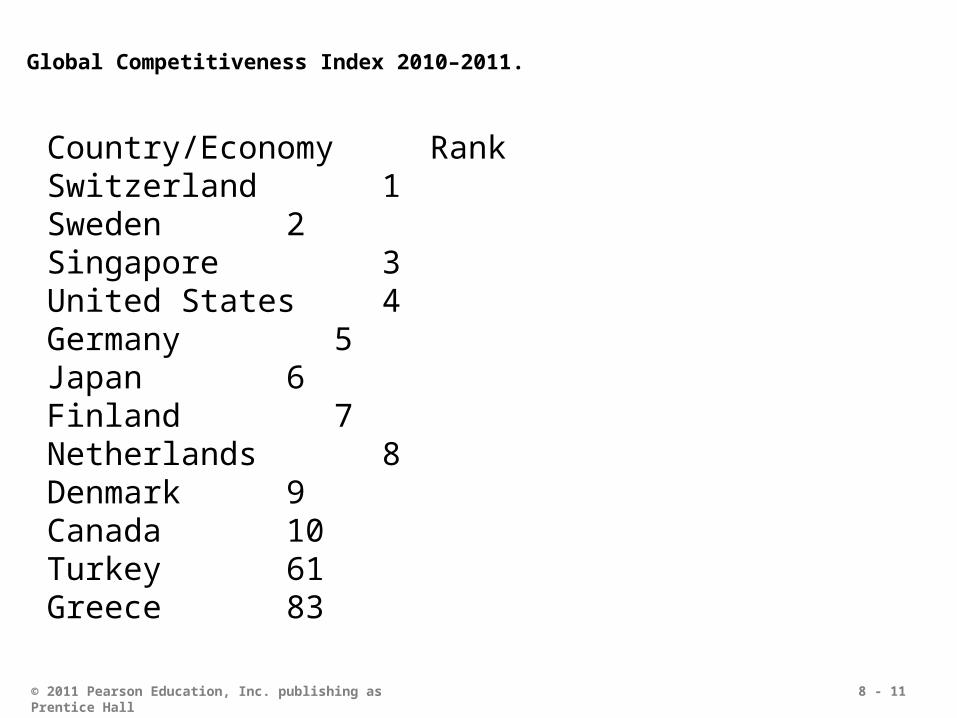
Global Competitiveness Index 2010–2011.
Country/Economy RankSwitzerland 1Sweden 2Singapore 3United States 4Germany 5Japan 6Finland 7Netherlands 8Denmark 9Canada 10Turkey 61Greece 83
8 - 12© 2011 Pearson Education, Inc. publishing as Prentice Hall
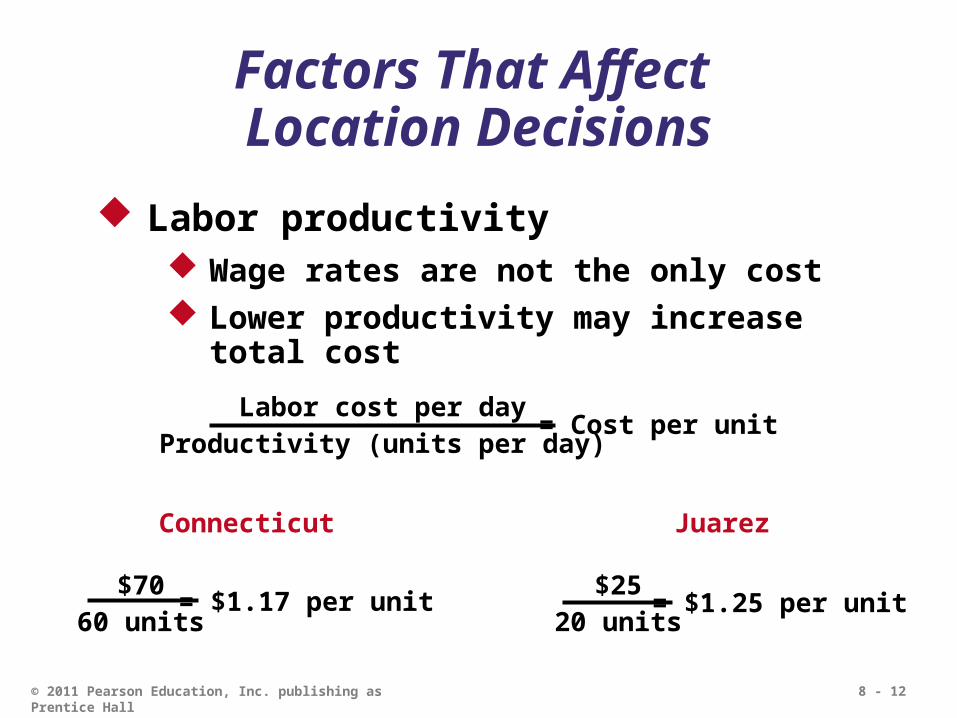
Factors That Affect Location Decisions
Labor productivity Wage rates are not the only cost Lower productivity may increase
total costLabor cost per day
Productivity (units per day)= Cost per unit
Connecticut
= $1.17 per unit$7060 units
Juarez
= $1.25 per unit$2520 units
8 - 13© 2011 Pearson Education, Inc. publishing as Prentice Hall
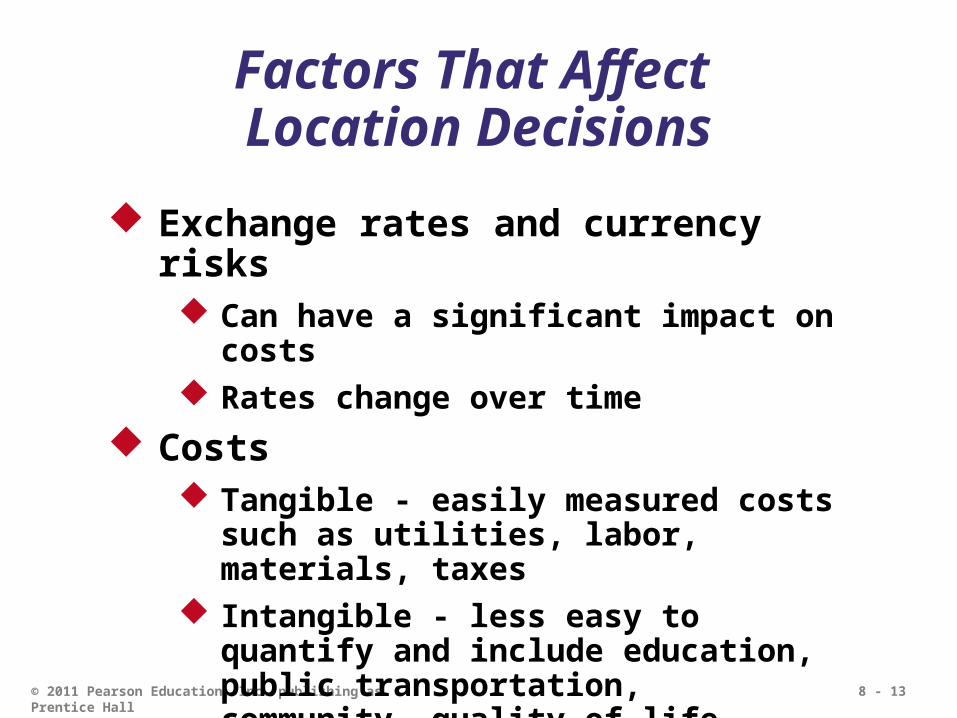
Factors That Affect Location Decisions
Exchange rates and currency risks Can have a significant impact on
costs Rates change over time
Costs Tangible - easily measured costs
such as utilities, labor, materials, taxes
Intangible - less easy to quantify and include education, public transportation, community, quality-of-life

8 - 14© 2011 Pearson Education, Inc. publishing as Prentice Hall
Factors That Affect Location Decisions
Exchange rates and currency risks Can have a significant impact on
cost structure Rates change over time
Costs Tangible - easily measured costs
such as utilities, labor, materials, taxes
Intangible - less easy to quantify and include education, public transportation, community, quality-of-life
Location decisions
based on costs alone can create
difficult ethical
situations

8 - 15© 2011 Pearson Education, Inc. publishing as Prentice Hall
Factors That Affect Location Decisions
Political risk, values, and culture National, state, local governments
attitudes toward private and intellectual property, zoning, pollution, employment stability may be in flux
Worker attitudes towards turnover, unions, absenteeism
Globally cultures have different attitudes towards punctuality, legal, and ethical issues
8 - 16© 2011 Pearson Education, Inc. publishing as Prentice Hall
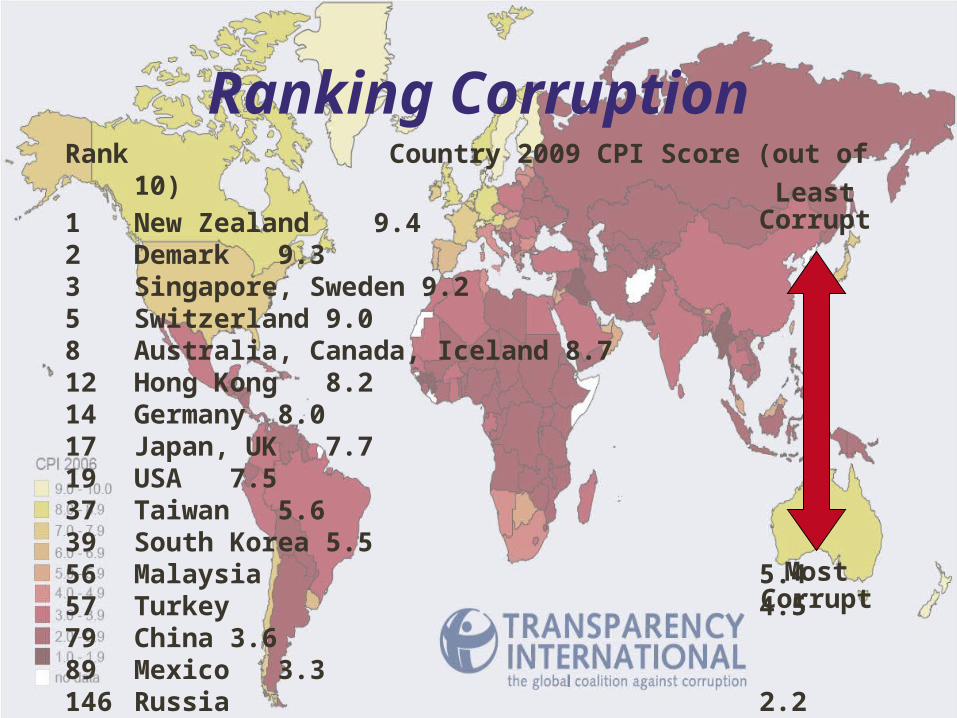
Ranking CorruptionRank Country 2009 CPI Score (out of
10)1 New Zealand 9.42 Demark 9.33 Singapore, Sweden 9.25 Switzerland 9.08 Australia, Canada, Iceland 8.712 Hong Kong 8.214 Germany 8.017 Japan, UK 7.719 USA 7.537 Taiwan 5.639 South Korea 5.556 Malaysia 5.457 Turkey 4.579 China 3.689 Mexico 3.3146 Russia 2.2
Least Corrupt
Most Corrupt
8 - 17© 2011 Pearson Education, Inc. publishing as Prentice Hall
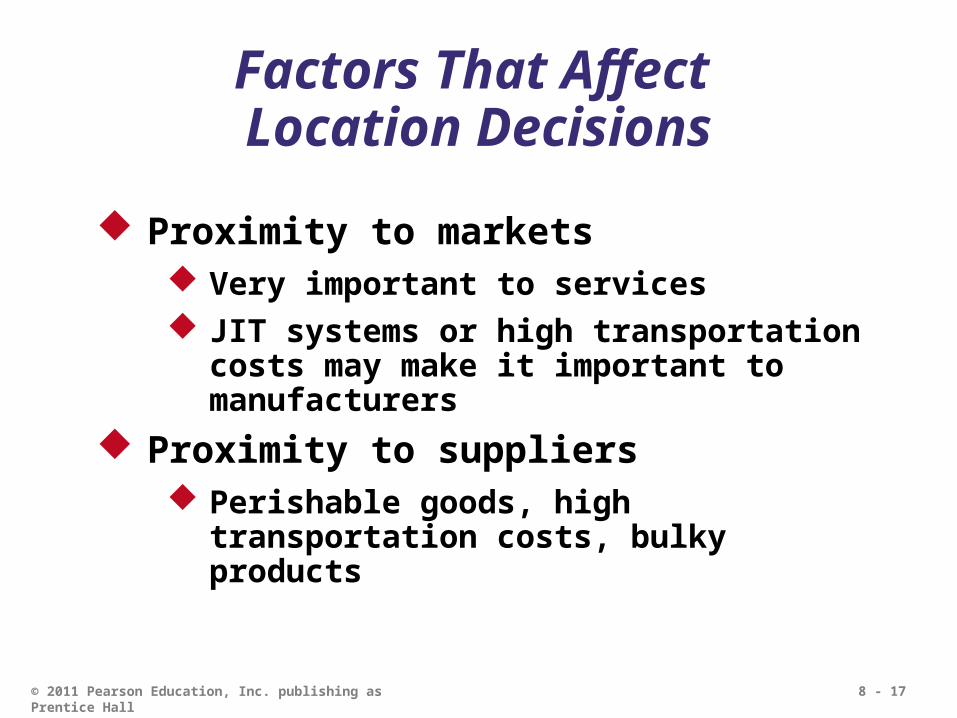
Factors That Affect Location Decisions
Proximity to markets Very important to services JIT systems or high transportation
costs may make it important to manufacturers
Proximity to suppliers Perishable goods, high
transportation costs, bulky products
8 - 18© 2011 Pearson Education, Inc. publishing as Prentice Hall
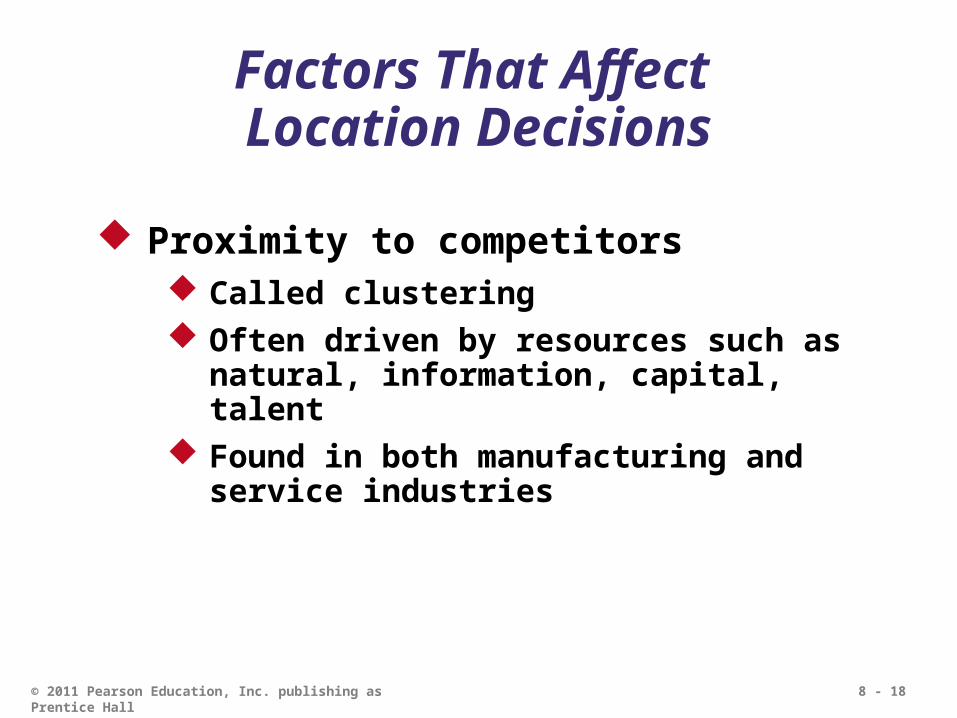
Factors That Affect Location Decisions
Proximity to competitors Called clustering Often driven by resources such as
natural, information, capital, talent
Found in both manufacturing and service industries
8 - 19© 2011 Pearson Education, Inc. publishing as Prentice Hall
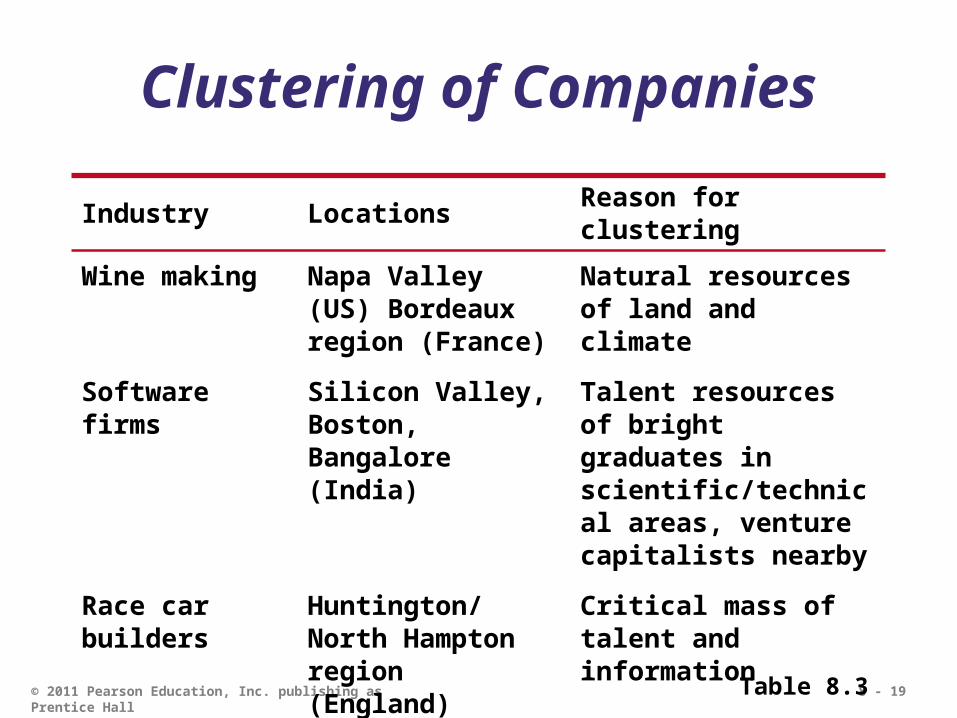
Clustering of Companies
Industry Locations Reason for clustering
Wine making Napa Valley (US) Bordeaux region (France)
Natural resources of land and climate
Software firms
Silicon Valley, Boston, Bangalore (India)
Talent resources of bright graduates in scientific/technical areas, venture capitalists nearby
Race car builders
Huntington/North Hampton region (England)
Critical mass of talent and informationTable 8.3

8 - 20© 2011 Pearson Education, Inc. publishing as Prentice Hall
Clustering of Companies
Industry Locations Reason for clustering
Theme parks (Disney World, Universal Studios)
Orlando, Florida
A hot spot for entertainment, warm weather, tourists, and inexpensive labor
Electronics firms
Northern Mexico NAFTA, duty free export to US
Computer hardware manufacturers
Singapore, Taiwan
High technological penetration rate and per capita GDP, skilled/educated workforce with large pool of engineers
Table 8.3
8 - 21© 2011 Pearson Education, Inc. publishing as Prentice Hall
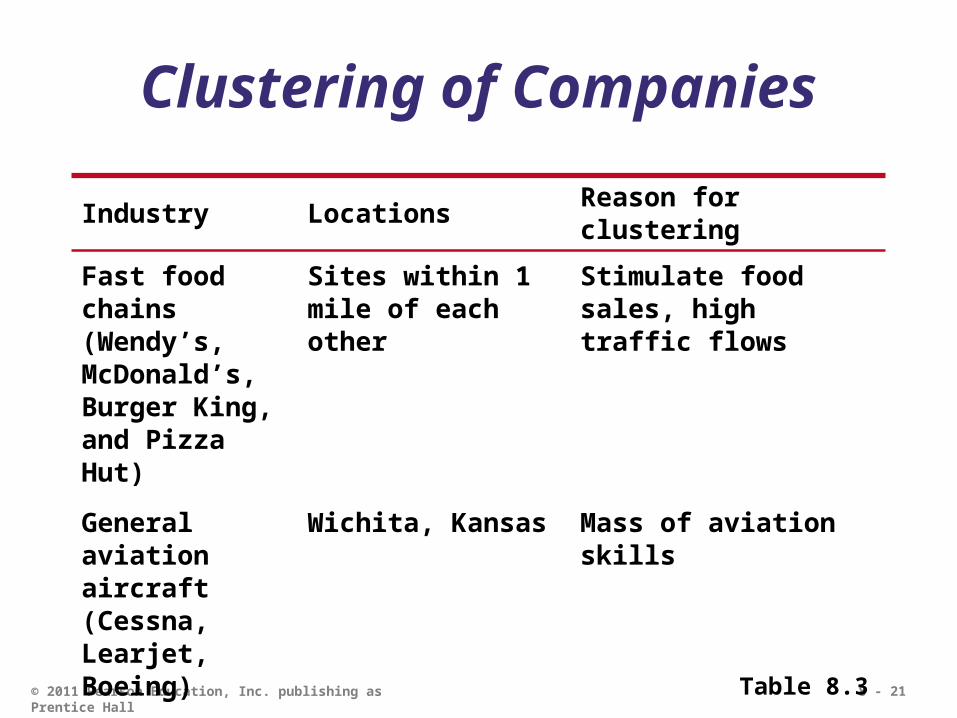
Clustering of Companies
Industry Locations Reason for clustering
Fast food chains (Wendy’s, McDonald’s, Burger King, and Pizza Hut)
Sites within 1 mile of each other
Stimulate food sales, high traffic flows
General aviation aircraft (Cessna, Learjet, Boeing)
Wichita, Kansas Mass of aviation skills
Orthopedic device manufacturing
Warsaw, Indiana Ready supply of skilled workers, strong U.S. market
Table 8.3
8 - 22© 2011 Pearson Education, Inc. publishing as Prentice Hall
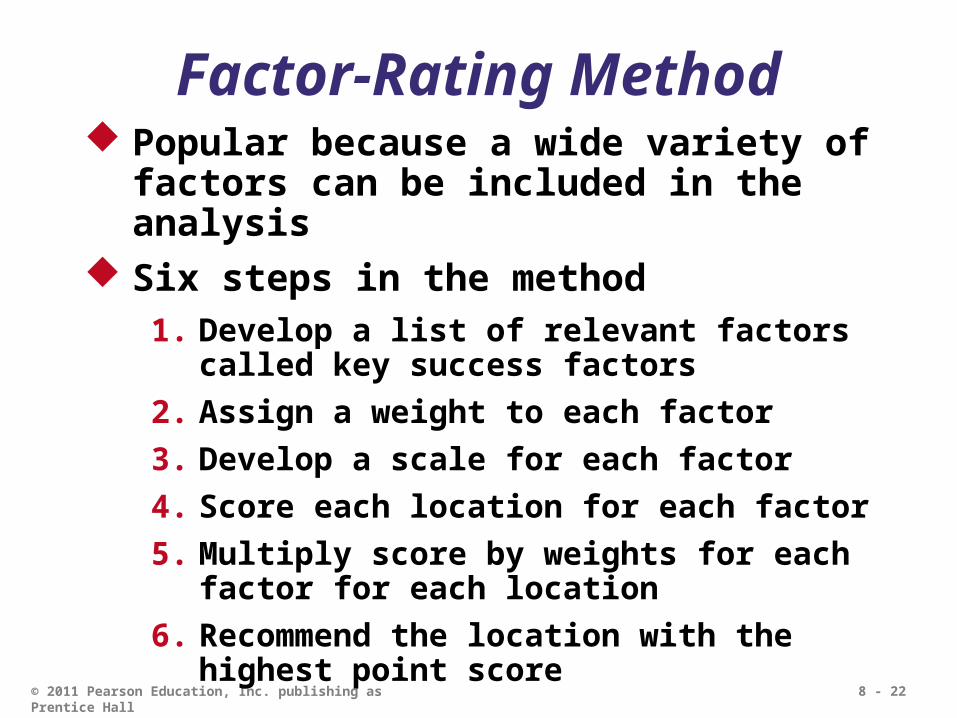
Factor-Rating Method Popular because a wide variety of
factors can be included in the analysis
Six steps in the method1. Develop a list of relevant factors
called key success factors2. Assign a weight to each factor3. Develop a scale for each factor4. Score each location for each factor5. Multiply score by weights for each
factor for each location6. Recommend the location with the
highest point score
8 - 23© 2011 Pearson Education, Inc. publishing as Prentice Hall
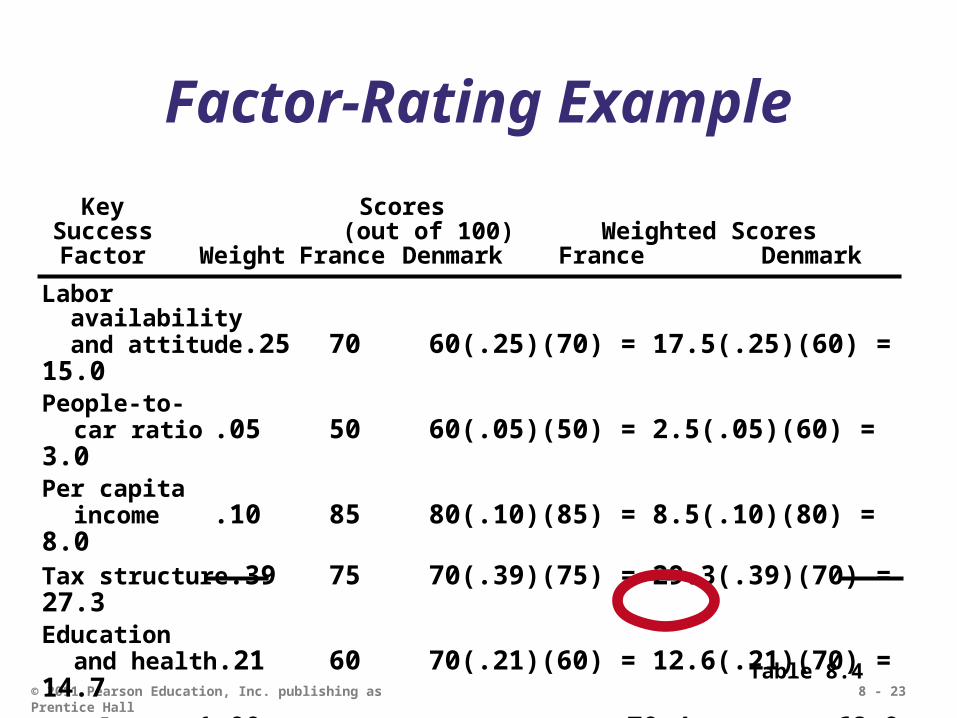
Factor-Rating ExampleKey Scores
Success (out of 100) Weighted ScoresFactor Weight France Denmark France Denmark
Labor availability and attitude.25 70 60(.25)(70) = 17.5(.25)(60) = 15.0People-to- car ratio .05 50 60(.05)(50) = 2.5(.05)(60) = 3.0Per capita income .10 85 80(.10)(85) = 8.5(.10)(80) = 8.0Tax structure.39 75 70(.39)(75) = 29.3(.39)(70) = 27.3Education and health.21 60 70(.21)(60) = 12.6(.21)(70) = 14.7Totals 1.00 70.4 68.0
Table 8.4

8 - 24© 2011 Pearson Education, Inc. publishing as Prentice Hall
Locational Break-Even Analysis
Method of cost-volume analysis used for industrial locations
Three steps in the method1. Determine fixed and variable
costs for each location2. Plot the cost for each location 3. Select location with lowest total
cost for expected production volume
8 - 25© 2011 Pearson Education, Inc. publishing as Prentice Hall
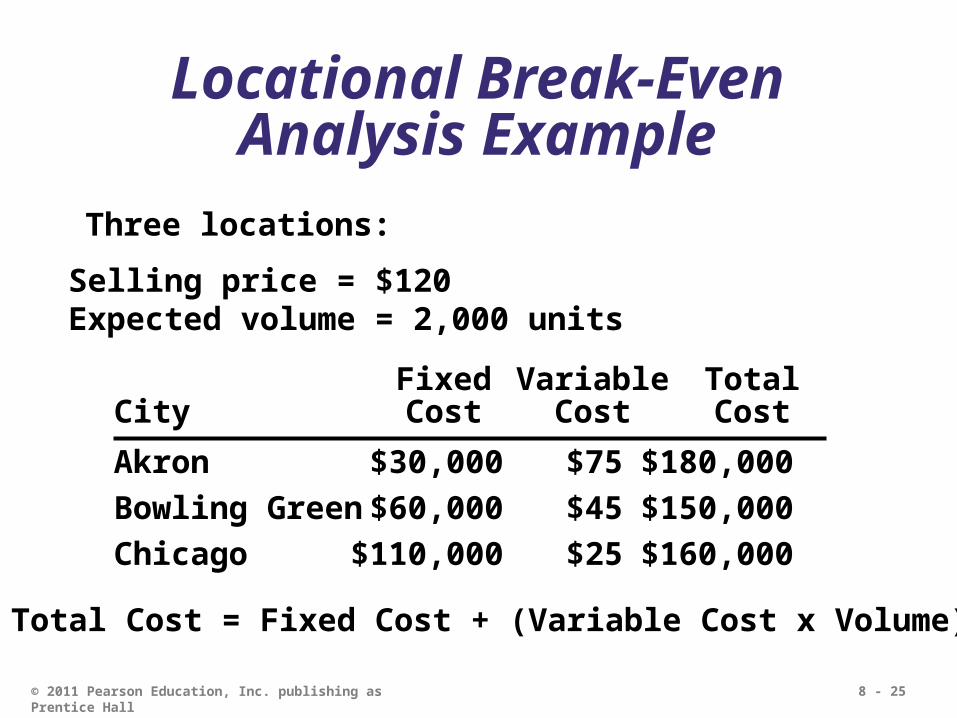
Locational Break-Even Analysis Example
Three locations:
Akron $30,000 $75 $180,000Bowling Green $60,000 $45 $150,000Chicago $110,000 $25 $160,000
Fixed Variable TotalCity Cost Cost Cost
Total Cost = Fixed Cost + (Variable Cost x Volume)
Selling price = $120Expected volume = 2,000 units

8 - 26© 2011 Pearson Education, Inc. publishing as Prentice Hall
Locational Break-Even Analysis Example
–$180,000 –
–$160,000 –$150,000 –
–$130,000 –
–$110,000 –
––
$80,000 ––
$60,000 –––
$30,000 ––
$10,000 ––
Annu
al c
ost
| | | | | | |
0 500 1,000 1,500 2,000 2,500 3,000Volume
Akron lowest cost
Bowling Green lowest cost
Chicago lowest cost
Chicago co
st curve
Akron
cost
curve
Bowlin
g Gree
n
cost c
urve
Figure 8.2

8 - 27© 2011 Pearson Education, Inc. publishing as Prentice Hall
Center-of-Gravity Method Finds location of
distribution center that minimizes distribution costs
Considers Location of markets Volume of goods shipped to
those markets Shipping cost (or distance)

8 - 28© 2011 Pearson Education, Inc. publishing as Prentice Hall
Center-of-Gravity Method Place existing locations on
a coordinate grid Grid origin and scale is
arbitrary Maintain relative distances
Calculate X and Y coordinates for ‘center of gravity’ Assumes cost is directly
proportional to distance and volume shipped
8 - 29© 2011 Pearson Education, Inc. publishing as Prentice Hall
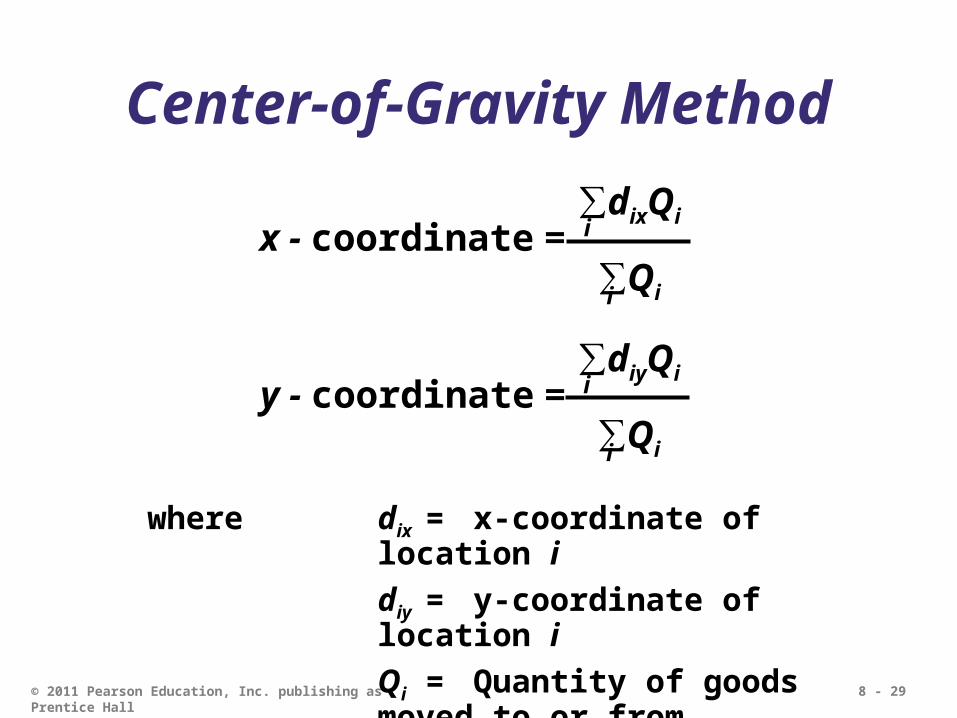
Center-of-Gravity Method
x - coordinate =∑dixQi
∑Qi
i
i
∑diyQi
∑Qi
i
i
y - coordinate =
where dix = x-coordinate of location idiy = y-coordinate of location iQi = Quantity of goods moved to or from location i

8 - 30© 2011 Pearson Education, Inc. publishing as Prentice Hall
Center-of-Gravity MethodNorth-South
East-West
120 –
90 –
60 –
30 –
–| | | | | |
30 60 90 120 150Arbitrary origin
Chicago (30, 120)New York (130, 130)
Pittsburgh (90, 110)
Atlanta (60, 40)
Figure 8.3

8 - 31© 2011 Pearson Education, Inc. publishing as Prentice Hall
Center-of-Gravity MethodNumber of Containers
Store Location Shipped per MonthChicago (30, 120) 2,000Pittsburgh (90, 110) 1,000New York (130, 130) 1,000Atlanta (60, 40) 2,000
x-coordinate =(30)(2000) + (90)(1000) + (130)(1000) + (60)(2000)2000 + 1000 + 1000 + 2000
= 66.7
y-coordinate =(120)(2000) + (110)(1000) + (130)(1000) + (40)(2000)2000 + 1000 + 1000 + 2000
= 93.3

8 - 32© 2011 Pearson Education, Inc. publishing as Prentice Hall
Center-of-Gravity MethodNorth-South
East-West
120 –
90 –
60 –
30 –
–| | | | | |
30 60 90 120 150Arbitrary origin
Chicago (30, 120)New York (130, 130)
Pittsburgh (90, 110)
Atlanta (60, 40)
Center of gravity (66.7, 93.3)+
Figure 8.3

8 - 33© 2011 Pearson Education, Inc. publishing as Prentice Hall
Transportation Model
Finds amount to be shipped from several points of supply to several points of demand
Solution will minimize total production and shipping costs
A special class of linear programming problems
8 - 34© 2011 Pearson Education, Inc. publishing as Prentice Hall
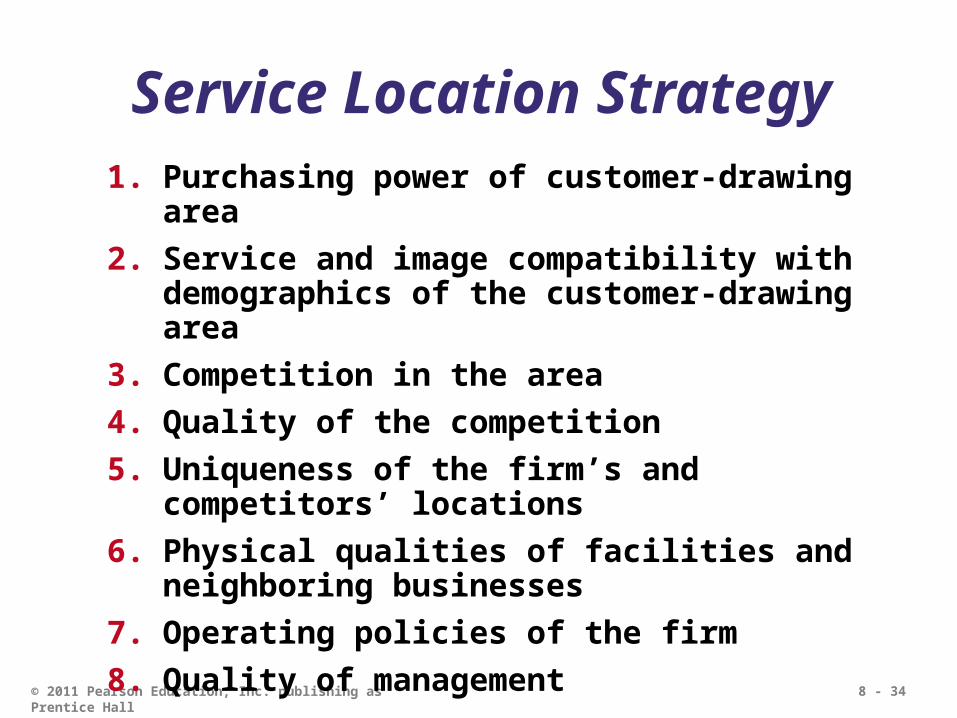
Service Location Strategy1. Purchasing power of customer-drawing
area2. Service and image compatibility with
demographics of the customer-drawing area
3. Competition in the area4. Quality of the competition5. Uniqueness of the firm’s and
competitors’ locations6. Physical qualities of facilities and
neighboring businesses7. Operating policies of the firm8. Quality of management

8 - 35© 2011 Pearson Education, Inc. publishing as Prentice Hall
Location Strategies
Table 8.6
Service/Retail/Professional Location Goods-Producing Location Revenue Focus Cost Focus
Volume/revenueDrawing area; purchasing powerCompetition; advertising/pricing
Physical qualityParking/access; security/lighting; appearance/image
Cost determinantsRentManagement caliberOperations policies (hours, wage rates)
Tangible costsTransportation cost of raw materialShipment cost of finished goodsEnergy and utility cost; labor; raw material; taxes, and so on
Intangible and future costsAttitude toward unionQuality of lifeEducation expenditures by stateQuality of state and local government

8 - 36© 2011 Pearson Education, Inc. publishing as Prentice Hall
Location Strategies
Table 8.6
Service/Retail/Professional Location Goods-Producing Location Techniques Techniques
Regression models to determine importance of various factors
Factor-rating methodTraffic countsDemographic analysis of drawing area
Purchasing power analysis of area
Center-of-gravity methodGeographic information systems
Transportation methodFactor-rating methodLocational break-even analysisCrossover charts

8 - 37© 2011 Pearson Education, Inc. publishing as Prentice Hall
Location Strategies
Table 8.6
Service/Retail/Professional Location Goods-Producing Location Assumptions Assumptions
Location is a major determinant of revenue
High customer-contact issues are critical
Costs are relatively constant for a given area; therefore, the revenue function is critical
Location is a major determinant of cost
Most major costs can be identified explicitly for each site
Low customer contact allows focus on the identifiable costs
Intangible costs can be evaluated

8 - 38© 2011 Pearson Education, Inc. publishing as Prentice Hall
How Hotel Chains Select Sites Location is a strategically
important decision in the hospitality industry
La Quinta started with 35 independent variables and worked to refine a regression model to predict profitability
The final model had only four variables Price of the inn Median income levels State population per inn Location of nearby colleges
r2 = .5151% of the profitabili
ty is predicted by just
these four variables!

8 - 39© 2011 Pearson Education, Inc. publishing as Prentice Hall
The Call Center Industry Requires neither face-to-
face contact nor movement of materials
Has very broad location options
Traditional variables are no longer relevant
Cost and availability of labor may drive location decisions
8 - 40© 2011 Pearson Education, Inc. publishing as Prentice Hall
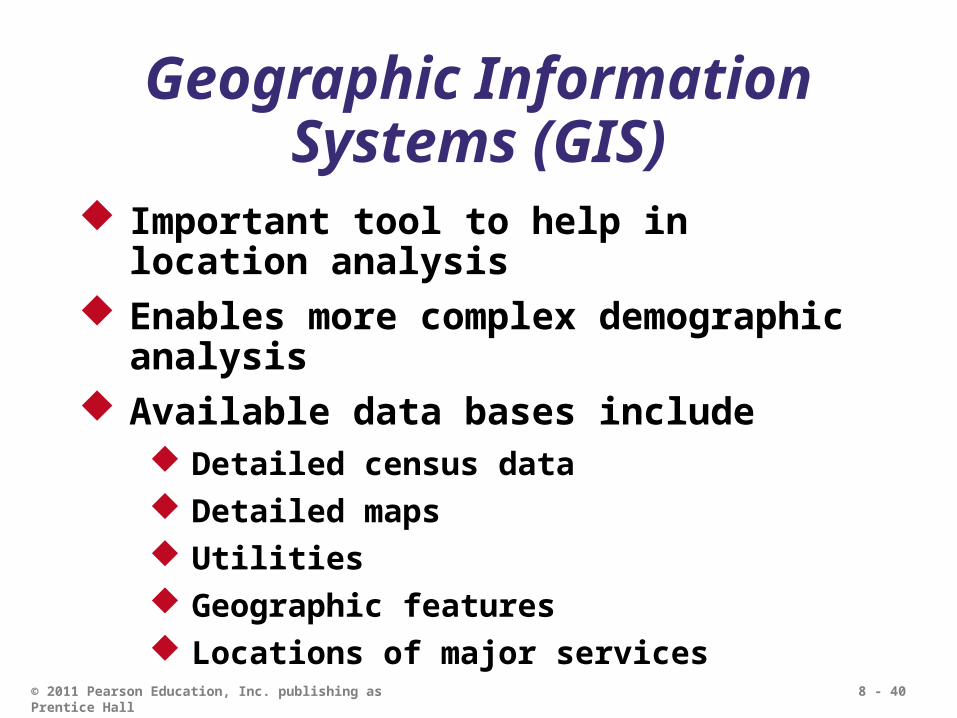
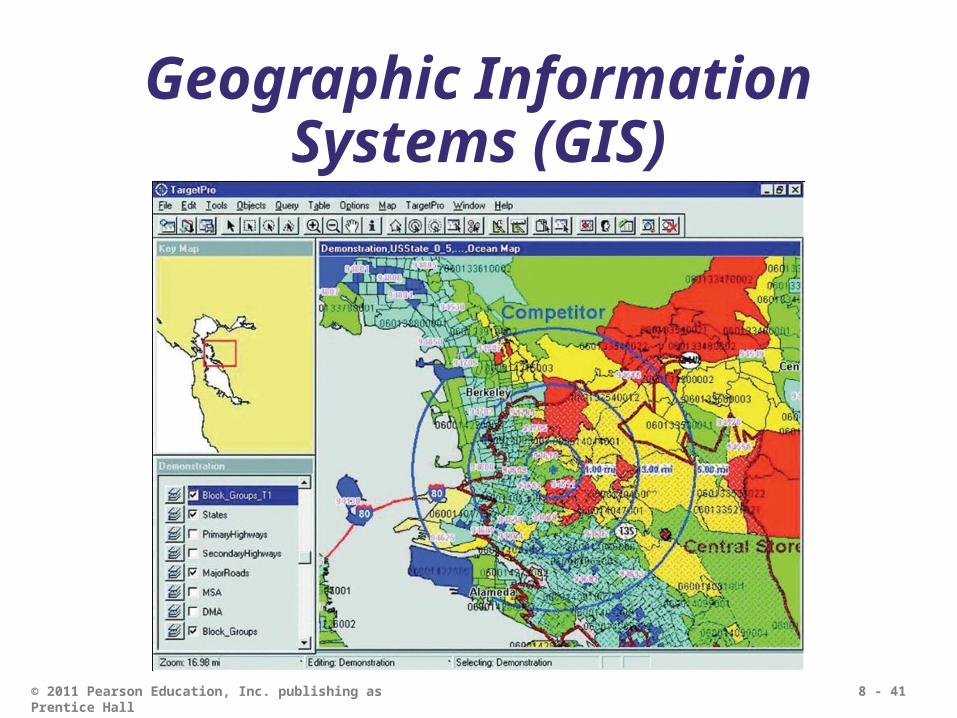
Geographic Information Systems (GIS)
Important tool to help in location analysis
Enables more complex demographic analysis
Available data bases include Detailed census data Detailed maps Utilities Geographic features Locations of major services
8 - 41© 2011 Pearson Education, Inc. publishing as Prentice Hall
Geographic Information Systems (GIS)