A Multicountry Assessment of Tropical Resource Monitoring by Local Communities
Upload
khangminh22Category
view
0download
0
Tameside Metropolitan Borough Council
Local Plan Authority’s Monitoring Report 2011/12
Tameside Metropolitan Borough Council Strategic Planning Council Offices Wellington Road Ashton-under-Lyne OL6 6DL Tel: 0161 342 3346 Email: [email protected] Web: www.tameside.gov.uk/strategicplanning

3 Authority’s Monitoring Report 2011/12
Tameside Metropolitan Borough Council
Contents
1 Introduction 04
2 Employment, The Local Economy & Skills 06
Recent Activity and Take-up 06 Land Supply 06 Character of The Local Economy 07 Employment, The Local Economy and Skills Output Indicators 09 Employment, The Local Economy and Skills Significant Effects Indicators 10 Employment, The Local Economy and Skills Contextual Indicators 11
3 Housing and Population 13
Housing Trajectory 13 Population 14 Deprivation 14 Social and Affordable Housing 14 Housing and Population Output Indicators 16 Housing and Population Significant Effects Indicators 17 Housing and Population Contextual Indicators 20
4 Transport 21
Transport 21 Parking Standards and Public Transport Journey Times 21
Transport Significant Effects Indicators 22 Transport Contextual Indicators 22
5 Local Services and Retail 24
Local Services and Retail Output Indicators 25 Local Services and Retail Significant Effect Indicators 25 Local Services and Retail Contextual Indicators 26
6 Conservation and the Environment 27
Conservation and The Environment Output Indicators 28
Conservation and The Environment Significant Effect Indicators 29 Conservation and The Environment Contextual Indicators 30
7 Minerals and Waste 31
Minerals and Waste Output Indicators 31 Minerals and Waste Significant Effects Indicators 32 Minerals and Waste Contextual Indicators 32
8 Local Development Scheme Monitoring 33
Development Plan Documents 33 The Core Strategy and Development Management Policies 33 Site Allocations Development Plan Document 33 The Proposals Map Development Plan Document 33 Greater Manchester Joint Waste Development Plan Document 33 Greater Manchester Joint Minerals Development Plan Document 34 Supplementary Planning Documents 34 Statement of Community Involvement 34 Unitary Development Plan Saved Policies 34 Regional Planning Context 35 Review of the Local Plan 35 Local Development Documents Milestone Details. 35
9 Appendices 37
A - Sustainability Appraisal Objectives 37
B - List of Indicators 38
Local Development Framework Core Output Indicators 38 Tameside Unitary Development Plan output Indicators 38
Significant Effects Indicators 39 Contextual Indicators 40
C - Duty to Co-operate 41
D - Saved Policies 42
E - Abbreviations 44

Introduction The Authority’s Monitoring Report (AMR) sets out the progress made on a number of topics that affect the Borough. These range from the number of houses built, the amount of employment land developed to the state of our natural and built environment and the progress made with Tameside’s Local Plan. This, the eighth Tameside AMR has been prepared to comply with Section 35 of The Planning and Compulsory Purchase Act 2004, Section 33A of the Localism Act 2011 and Regulation 34 of The Town and Country Planning (Local Planning) (England) Regulations 2012.
The Council is no longer required to submit its monitoring report to the Secretary of State for Communities and Local Government as outlined by Bob Neill MP on 30th March 2011. Although the Government has reduced the demands of top down monitoring upon Local Authorities, the 2004 and 2011 Acts make it clear that there is a duty upon Authorities to meet the requirements of the relevant UK and EU legislation. The Council sees these requirements as part of effectively planning, monitoring and reviewing its planning policy and providing supplementary information to inform the decision making process. The period addressed by this report covers two monitoring years from the 1st April 2010 to 31st March 2011 and 1st April 2011 to 31st March 2012. Where data demonstrates change that has occurred over the year, such as the amount of floorspace developed, the figures relate to that complete time period unless otherwise indicated. Where data relates to a snapshot during the year, such as the amount of employment land available, the figures relate to the situation at the end of March for that year unless otherwise indicated. The Government has outlined its intentions to revoke Regional Spatial Strategies (RSS) although a Strategic Environmental Assessment is required to complete the revocation. This has implications for the interim period before adoption of the Core Strategy where the Council will give material consideration to the RSS until such a time when it adopts new policies based upon more up to date evidence. The Council therefore intends to adopt an interim housing statement due to the impending revocation of the North West of England Plan RSS. Until such a statement is adopted it is the intention of the Council is to maintain the annual 750 dwellings per annum target set out in the RSS. There are similar impacts upon the provision of employment land. Policy W3 of the RSS required Greater Manchester to supply between an additional 536 and 917 hectares of land during the period 2005-2021. The Association of Greater Manchester Authorities (AGMA) commissioned the Greater Manchester Employment Land Position Statement by Nathaniel Lichfield and Partners in 2009. This sets out in its conclusions that Tameside may need to provide somewhere between 94 and 130 hectares of employment land over the period 2007 to 2026. Tameside will determine the exact level of provision given the current localism policy context through the Core Strategy process. The report provides data on a number of indicators. As it is now largely for the Council to determine the indicators it monitors, scope exists to review the indicators that have traditionally been used. That said, consistency of indicators does allow for a degree of analysis to occur from the current monitoring and that of subsequent years. The Council has chosen to divide its indicators in each thematic area into:
Core output indicators were the standard indicators defined nationally by the Department for Communities and Local Government (DCLG) and includes the housing trajectory. Where data continues to be collected the indicator has been retained.
Local output indicators complement the core output indicators to monitor the implementation of local policies and documents. These have been derived from the indicators set out in the Tameside Unitary
Development Plan (UDP) adopted November 2004.
Significant effects indicators provide additional data to enable a robust assessment of policy implementation with the core and local output indicators. They are linked to the Sustainability Appraisal objectives and enable comparisons to be made with the predicted and actual effects observed during the implementation of policies. Significant effects indicators have been updated to reflect those within the Core Strategy Sustainability Appraisal (2012).
Contextual indicators present background information on the environment in which policies are operating such as market trends and conditions.
This AMR also contains the detailed progress made on the documents contained in the Council’s Local Development Scheme (LDS). It lists all of the titles of the documents and outlines the full production timetable for comparison, to comply with The Town and Country Planning (Local Development) (England) Regulations 2012 part 8. It shows progress during the monitoring year with information regarding:
The timetable and stage that a document has reached in preparation; If the document’s preparation is behind the time table and reasons for any delay; and An indication of the steps to be taken for the continued preparation or not of the document.
The LDS shows which documents have been adopted with dates, except for the UDP, which for the sake of completeness was adopted on 17th November 2004. This report will also contain details of any policies which the authority is not implementing, the reasons why and the steps if any, required to secure implementation of the policy. In addition it details the steps it is taking to comply with the Duty to Cooperate requirements of the aforementioned regulations. On the 18th September 2007, the Secretary of State for Communities and Local Government in exercise of the power conferred by paragraph 1(3) of Schedule 8 to the Planning and Compulsory Purchase Act 2004 directed that for the purposes of all of the policies contained in the adopted Tameside UDP, paragraph 1(2)(a) of Schedule 8 to the Planning and Compulsory Purchase Act 2004 does not apply. This means that all saved policies in the adopted UDP continue to be implemented until new policies replace them. At present, the Council is using all saved policy as appropriate in the consideration of proposals.

Figure 1.1 Borough of Tameside within a Greater Manchester context and indicative rural and urban areas

6 Authority’s Monitoring Report 2011/12
Tameside Metropolitan Borough Council
Employment, the Local Economy and Skills
Recent Activity and Take-Up
For the purposes of this AMR, employment uses are classed according to Policy E3 of the adopted Tameside UDP as business (B1), general industrial (B2), storage and distribution (B8) plus sui generis commercial uses which have similar characteristics to industry or storage. During the 2011/12 year, a number of employment generating development schemes were completed, taking-up 1.35 ha of land
for employment purposes and creating 8,317 m2 of new employment floorspace. Significant completions include:
Land North of Park Road, New Industrial Units, Dukinfield Extension to Acorn Works, Mossley
The proportion of employment floorspace completed on previously-developed land was 94.7%. The only development on greenfield land was Broadcarr Lane, Mossley (which took up approximately 0.2 ha). Since the end of the monitoring period employment development activity has continued. There was around 1,353 sq m of employment generating floorspace under construction on 31st March 2012 on sites which totalled 0.8 ha of the overall supply. During the monitoring year, permission was granted for employment schemes totalling over 14,593m2 of floorspace on around 3.5 ha of land and further permissions have been granted following the monitoring period. This is a significant decline since the previous monitoring year and is a potent indicator of the impact the recession has caused on the development of employment floorspace. Noteworthy outstanding permissions include many schemes from the previous list:
St. Petersfield Office Buildings K1 and K2, Stamford Street West, Ashton-under-Lyne; Office and light industrial development, Fairfield Clough South, Kings Road, Audenshaw; Three storey office block, Turner Street Industrial Estate, Denton; Large warehouse extension, Turner Bianca site, Globe Lane, Dukinfield; Redevelopment at Newton Mill, Ashton Road, Hyde Redevelopment at Wharf Mill Site, Dukinfield Road, Hyde Office development adjacent to new Findel's office, Ashton Road, Hyde; and 53 modular industrial units at Raglan Street, Hyde.
In addition the outline permissions for large scale employment development at Plot 3000 on Ashton Moss and for various developments at St. Petersfield in Ashton still remain valid. The site at Ashton Moss is suitable for a variety of industrial uses and is the largest single employment site in the Tameside supply. The site will be made more accessible as a development opportunity when the Metrolink extension to Ashton-under-Lyne opens in 2013/14. Over the next few years some of these sites will come under pressure for release to non-employment uses, primarily residential development. In some cases this may be acceptable but the Council aims to protect its future employment land supply through UDP Policy E3 and the additional Employment Land Supplementary Planning Document. Land Supply The total supply of land available for development for employment purposes in Tameside on the 31st March 2012 was 80.72ha. This is a small increase on last year's supply (80.46 ha). This supply figure consists of both vacant and redevelopment sites with planning permission and sites previously allocated. Sites are removed from the supply when development is completed or where evidence comes forward to confirm that the site is unsuitable as part of the supply – such as the continued long-term operational use of site. The increase in available land supply can be explained by the addition of new sites following the annual assessment of the employment land availability schedule. The inclusion of a site in the available supply does not indicate any intentions of the owner(s) to offer the site for development so some of the supply will consist of sites not on the open market and sites intended for development by owners or occupiers for their own use. In fact, of the total supply, 40.52 ha was classed as 'immediately available'. The sites in the immediately available supply are listed on the MIDAS website and for sale on the open market. This is a significant increase from the 27.7 ha recorded in 2009/10 (no data is available for 2010/11). This significant increase can be explained by a thorough reappraisal of the sites in the supply that takes into account updates to the marketing information available.

7 Authority’s Monitoring Report 2011/12
Tameside Metropolitan Borough Council
A breakdown of the different types of employment land in the available supply is shown in the table below.
Table 2.1 Available Employment Land By Type An analysis of the sites in the supply reveals that just over a third of the total supply has the potential to be genuinely available in a reasonable timeframe, is of a serviceable quality and free from excessive constraints. 2011/12 has been another difficult year for employment development in Tameside. However, there have been some significant completions: at Park Road, Dukinfield and Acorn Works in Mossley. However, these completions account for over 50% of all industrial development in the Borough over the reporting period. On 31st March 2012, approximately 0.8 ha of the previous years supply was under construction and permission was granted for schemes on 3.5 ha of land that now form part of the employment land supply. The measured employment land supply has reduced steadily since 1995/96, when it stood at 190 hectares, to the level it is at today, 80.72 hectares. The rise in supply over the past two years shows evidence of the continuing difficulty faced in the office and industrial markets. The decline in supply indicated growing interest in Tameside's development sites, borne out by the number of completions since the mid 1990s continuing through to the mid 2000s. Based on the historic trend it would have been logical to predict that take-up rates would increase but in the current economic climate this would now seem to be very uncertain given the performance since 2009. However, the overall trend of a declining supply is an indicator that under normal economic circumstances Tameside is an attractive location for developers. With the continued impact of the economic downturn there is the possibility that the life of the current supply could be prolonged. The employment land supply could even significantly increase over the period because of rationalisation and closures within local industries. Additionally the impact of business rates on vacant premises has become widespread with the clearance of many sites across the Borough. The other side of this is that the poor economic climate and low or negative return on employment development has led to increased pressure for non-employment development on these sites. This is a problem where significant abnormal costs are identified, such as remediation of significant contamination. It is considered that this level of supply is not adequate in terms or quality and availability. This position is backed up by the findings of the emerging Employment Land Review and the Nathaniel Lichfield & Partners study (2009) which concluded that Tameside would require an employment land supply of between 94 and 130 hectares for the period 2007 - 2026. Consequently it will become a critical issue for the evidence base of the core strategy to investigate and to determine the amount of employment land supply that will ensure the long-term development of Tameside's economy. The Employment Land SPD gives guidance on the development of employment land and promotes the recycling of existing employment sites for new employment generating development. For more information please see the Tameside Council website: http://www.tameside.gov.uk/planning/ldf/spd/employland
Character of the Local Economy
The local economy in Tameside remains in a state of change, with the manufacturing industry of the Borough still contracting as part of a national trend and the proportion of manufacturing jobs in the Borough decreasing every year since 1999. However, the borough still retains a significant proportion of its employment in manufacturing (18.5%) which is greater than any other in Greater Manchester. This means that there remains a heavy reliance on industries that are likely to decline further in the coming years. Many of the older large manufacturing firms have ceased operations in Tameside in recent years and the economy is now characterised by small and medium-sized businesses. Data from the Annual Business Inquiry (ABI) (2008) suggests that 83.9% of businesses in the Borough employ 10 people or less. This data is now unavailable due to a change from the ABI to the Business Register and Employment Survey from 2008 onwards. When compared to the regional (0.74) and national average (0.77) the jobs density (ratio of total jobs to working-age population 16-64) in the Borough is low (0.53). This is a significant factor and indicates that people have to travel outside of the Borough to find work. This ratio has steadily fallen since a peak of 0.62 in 2004. Tameside only has around 5.7% (67,424) of all employment (excluding the self-employed) in Greater Manchester (GM 1,174,821), despite having 8% of the working age population (2011 mid-year population estimates). The rate of unemployment in Tameside based on the monthly claimant count showed an increase since April 2010. There were 6,806 claimants (4.8%) in April 2010 rising to 7,168 in September 2012 (5.1%). At September 2012 the claimant count for Tameside was above the North West average (4.4%) and the average for the UK (3.8%). See Figure 2.1, Unemployment rate (resident based Job Seekers Allowance claimant count) April 2010 to Sept 2012, below.
i The General category includes all development within the B use classes where the sites have not been individually identified as being of one specific B use.
Type Amount Available (ha) B1 5.61 B2 22.71 B8 0.82 General Industriali 51.58 Total 80.73

Figure 2.1 Unemployment rate (resident based Job Seekers Allowance claimant count) Apr 2010 to Sept 2012 Tameside has a significantly lower than average number of people employed in occupations in the socio-economic classification (SOC) 2000 major groups 1-3, with a higher than average number of people employed in SOC 2000 major groups 4-5 and 8-9 (see table 2.2 below). The proportion of people in Tameside employed in major group 1-3 has decreased by over 3% for 2011/12 to 32.8% when compared to 2010/11 (33.7%). This is getting close to the lowest level (31.9%) seen since AMR reporting started in 2004/05. The proportion employed in major group 4-5 has slightly decreased between 2010/11 and 2011/12. The proportion employed in major group 6-7 has significantly increased whilst in group 8-9 there has been a marked decline. VAT registration data is no longer recorded as an indicator as a means of determining the health of the economy. The Office of National Statistics now publishes a set of data for business demography as a means of giving a more detailed picture of business health and entrepreneurship. This data is now displayed as Sustainability Appraisal Significant Effects Indicator SE 20.1 in table 2.4. Business demographics have been calculated retrospectively back to 2004/5. During the period 2004/5 to 2011/12 the total business count in Tameside has increased by 125, from 5,860 to 5,985. However, during this period the figure peaked in 2007/8 at 6,280 so this shows a decline in total business numbers since the peak of 295. It should also be noted that in the last two reporting years that the difference between births and deaths was negative, i.e. more deaths than births.
3.0
3.5
4.0
4.5
5.0
5.5P
erce
ntag
e
Tameside
United Kingdom
North West

9 Authority’s Monitoring Report 2011/12
Tameside Metropolitan Borough Council
Tameside (2004/05)
Tameside (2005/06)
Tameside (2006/07)
Tameside (2007/08)
Tameside (2008/09)
Tameside (2009/10)
Tameside (2010/11)
Tameside (2011/12)
North West (2011/12)
Great Britain (2011/12)
Soc 2000 major group 1-3 36.0 33.5 31.9 35.1 33.4 35.3 33.7 32.8 39.7 43.4
1 Managers and senior officials 13.1 11.6 10.6 12.8 11.8 13.0 12.0 9.8 9.1 10.0
2 Professional occupations 8.3 8.2 7.9 9.7 8.5 8.1 9.6 11.5 17.9 19.2
3 Associate professional & technical 14.5 13.7 13.4 12.6 13.1 14.2 12.1 11.3 12.6 14.0
Soc 2000 major group 4-5 26.3 30.5 27.7 27.1 28.2 20.8 25.8 24.3 22.3 22.0
4 Administrative & secretarial 14.0 16.8 15.3 12.6 14.7 11.4 12.9 12.1 11.9 11.1
5 Skilled trades occupations 12.3 13.6 12.4 14.5 13.5 9.4 12.8 12.0 10.4 10.8
Soc 2000 major group 6-7 17.0 17.7 18.3 16.1 17.3 19.7 17.9 23.5 19.1 17.2
6 Personal service occupations 7.1 6.9 7.8 8.4 9.0 9.9 10.2 11.4 10.2 9.1
7 Sales & customer service occupations 9.8 10.8 10.5 7.7 8.3 9.8 7.6 11.9 8.8 8.1
Soc 2000 major group 8-9 20.7 18.3 22.1 21.4 20.9 23.6 22.5 19.5 19.0 17.4
8 Process plant & machine operatives 10.5 9.6 9.7 9.7 10.2 10.6 10.3 8.3 7.0 6.4
9 Elementary occupations 10.1 8.7 12.3 11.8 10.7 13.0 12.2 11.1 11.9 10.9 Table 2.2 Employment by occupation. Percentages based on all persons in employment. Source: Annual Population Survey
Employment, the Local Economy and Skills Core and Local Output Indicators
Reference Indicator 2004/05 2005/06 2006/07 2007/08 2008/09 2009/10 2010/11 2011/12 Notes
Core BD1(i)
Total gross employment Floorspace completed (by type)
B1: Nil 4,241 m2 5,770 m2 733 m2 10,786 m2 6,552 m2 Nil Nil Very low level of completions indicates the full impact of the recession. B2: 1,495 m2 1,286 m2 14,324 m2 4,879 m2 4,894 m2 Nil 431 m2 533 m2
B8: 33,693 m2 6,871 m2 3,574 m2 460 m2 1,349 m2 25 m2 5,698 m2 1,945 m2
General Employment:
Nil Nil Nil 16,131 m2 11,710 m2 Nil 3,030 m2 5,839 m2
Total: 35,560 m2 12,398 m2 23,668 m2 22,663 m2 28,739 m2 6,577 m2 9,159 m2 8,317 m2
Core BD1(ii)
Total net employment floorspace (by type)
B1: N/A N/A N/A -4,067 m2 8,961 m2 6428.3 m2 Nil Nil
B2: N/A N/A N/A -1 m2 4,024 m2 -129,903 m2 -1,333.9 m2 -1,619 m2
B8: N/A N/A N/A 460 m2 1,177 m2 25 m2 Nil -4,305 m2
General Employment:
N/A N/A N/A 16,131 m2 2,921 m2 Nil 3,030 m2 5,839 m2
Total: N/A N/A N/A 10,798 m2 17,083 m2 -123,450m2 1,696.1 m2 -85 m2
Core BD2 Total amount of employment floorspace on previously developed land (by type)
B1: Nil 3,509 m2 5,770 m2 733 m2 1,537 m2 5,320 m2 Nil Nil Figures for 04/05, 05/06 and 06/07 relate to former Core Indicator 1c. Figures for 07/08 have been updated. B2: 1,867 m2 1,286 m2 3,902 m2 4,119 m2 2,940.8 m2 Nil 431 m2 533 m2
B8: 7,188 m2 2,100 m2 209 m2 460 m2 1,349 m2 25 m2 5,698m2 1,945 m2
General Employment:
Nil Nil Nil 5,457 m2 11,710 m2 Nil 3,030m2 5,401 m2
Total: 9,055 m2 6,895 m2 9,881 m2 11,434 m2 17,536.8m2 5345 m2 9,159 m2 7,879 m2
Core BD3 UDP2
Employment land available (by type)
B1: 16.18 ha 8.99 ha 5.67 ha 7.81 ha 6.54 ha 4.61 ha 5.17 ha 5.61 ha Fairly stable level of employment land – balanced by removal of some sites and the B2: 6.14 ha 13.80 ha 9.09 ha 8.60 ha 3.60 ha 12.79 ha 20.82 ha 22.71 ha

10 Authority’s Monitoring Report 2011/12
Tameside Metropolitan Borough Council
Reference Indicator 2004/05 2005/06 2006/07 2007/08 2008/09 2009/10 2010/11 2011/12 Notes
B8: 2.97 ha 1.62 ha 1.70 ha 0.49 ha 0.49 ha 0.49 ha 2.18 ha 0.82 ha additional of a number of new permissions.
General Employment:
67.03 ha 58.47 ha 59.08 ha 57.29 ha 60.60 ha 52.53 ha 52.29 ha 51.58 ha
Total: 92.32 ha 82.88 ha 75.54 ha 74.19 ha 71.22 ha 70.41 ha 80.46 ha 80.73ha
UDP1 Area of land developed for employment purposes
B1: Nil 1.14 ha 0.38 ha 0.13 ha 3.37 ha 0.95 ha Nil Nil
B2: 0.47 ha 0.32 ha 4.23 ha 1.29 ha 1.08 ha 0 ha 0.06 ha 0.05 ha
B8: 10.02 ha 2.57 ha 1.04 ha 0.14 ha 0.98 ha 0.004 ha 0.57 ha 0.26 ha
General Employment:
Nil Nil Nil 4.09 ha 2.08 ha 0 ha 0.86 ha 1.04 ha
Total: 10.49 ha 4.03 ha 5.65 ha 5.65 ha 7.51 ha 0.951 ha 1.49 ha 1.35 ha
UDP3 Area of land previously used for employment which was developed for other uses
4.13 ha 9.83 ha 2.62 ha 3.64 ha 0.1 ha 1.01 ha 3.73 ha Nil Relates to land previously used for employment (i.e. working sites not necessarily in the supply of land available). Sites are deemed to have been lost to employment - generating uses once alternative development has commenced.
Table 2.3 Employment, the Local Economy and Skills Core and Local Output Indicators
Employment, the Local Economy and Skills Significant Effects Indicators
These significant effects indicators measure progress against sustainability appraisal objectives. For details of these objectives please see Appendix A 'Sustainability Appraisal Objectives'. Ref SA Obj Indicator Source 2004/05 2005/06 2006/07 2007/08 2008/09 2009/10 2010/11 2011/12 Target/
Rationale Notes
SE 5.1 5 The number of rural buildings brought back into business use.
Tameside MBC
Data is currently unavailable for this indicator.
SE 14.1 14 Total amount of employment floorspace on previously developed land (by type).
Tameside MBC
See Core and Local Output Indicator BD2
SE 19.1 19 Average weekly income for residents within the Borough.
Nomis - Annual Population Survey
Male £383.00 £382.50 £389.00 £431.00 £452.90 £449.10 £442.50 £449.80 Increase.
Female £293.30 £311.10 £333.30 £380.80 £349.50 £373.60 £375.50 £375.80
Total £355.10 £349.90 £372.20 £415.60 £413.20 £425.50 £414.20 £425.30
SE 20.1 20 Birth, deaths and count of active businesses during the year.
Nomis and Neighbourhood Statistics. From 2008/09 onward Business Demography (ONS)
Births 700 810 770 790 690 580 620 Data available 2012/13
Increase. Indicator amended due to change in data collected. VAT registered businesses data only available to 2007. Business demography from 2008/09 onward.
Deaths 735 610 590 650 615 775 835 Data available 2012/13
Count 5,860 5,915 6,075 6,280 6,220 6,165 5,985 Data available 2012/13
SE 21.1 21 Economic activity rates as a
Nomis – Annual Population
Male 82.7 82.8 83.3 81.6 81.7 80.8 80.4 80.6 Increase economic
Definition change to an age range of 16-
Female 68.9 69.9 69.3 68.9 70.2 71.1 65.9 65.9

11 Authority’s Monitoring Report 2011/12
Tameside Metropolitan Borough Council
Ref SA Obj Indicator Source 2004/05 2005/06 2006/07 2007/08 2008/09 2009/10 2010/11 2011/12 Target/ Rationale
Notes
percentage of working age population.
Survey Total 75.8 76.3 76.2 75.2 75.8 75.9 73.1 73.2 activity. 64.
SE 22.1 22 Percentage of occupations by different category.
Nomis – Annual Population Survey See Local Economy Contextual indicator Econ 7
New indicator.
Table 2.4 Employment, the Local Economy and Skills Significant Effects Indicators
Employment, the Local Economy and Skills Contextual Indicators
Ref
Indicator Source 2004/05 2005/06 2006/07 2007/08 2008/09 2009/10 2010/11 2011/12 Notes / Target
Econ 1 Working age resident population (16-64)
ONS Midyear Population Estimates (population on 30th June)
Males 68,200 68,300 68,600 68,800 69,100 69,300 69,500 70,700
Females 69,300 69,500 69,800 70,000 70,400 70,700 70,900 71,700
Total 137,500 137,800 138,400 138,800 139,500 139,900 140,300 142,500
Econ 2 Economically active population (16-64)
ONS Annual Population Survey
Males 56,600 56,900 57,700 56,600 56,900 56,400 56,500 56,700 Females 46,800 48,700 49,100 49,000 50,300 50,400 47,200 47,300 Total 103,400 105,600 106,800 105,600 107,100 106,800 103,700 104,000
Econ 3 Percentage unemployment gap between the average top three highest and bottom three lowest wards in the borough
Tameside Area Agreement PR3b from 2008/09 onward.
3.33% 3.50% 4.00% 3.30% 9.0% (May 2008)
11.5% (May 2009)
15.4% (May 2010)
15.4% (May 2011)
Data from 2008/09 onward relates to the difference between the best and the worst lower super output area.
Econ 4 Household income level
CACI £26,300 £28,032 £29,123 £31,166 £32,394 £32,324 £32,826 £32,943 Mean household income. Data unlikely to be available beyond 2011/12.
Econ 6 Median average gross weekly pay for full time workers
Annual Survey of Hours and Earnings – Resident Analysis
£355.10 £349.90 £372.20 £415.60 £413.20 £425.50 £414.20 £425.30
Econ 7 Employment by Occupation
Annual Population Survey (April – March)
Managers & Senior Officials
13.1% 11.6% 10.6% 12.8% 11.8% 13.0% 12.0% 9.8%
Professional Occupations
8.3% 8.2% 7.9% 9.7% 8.5% 8.1% 9.6% 11.5%
Assoc Prof & Technical
14.5% 13.7% 13.4% 12.6% 13.1% 14.2% 12.1% 11.3%
Admin & Secretarial
14.0% 16.8% 15.3% 12.6% 14.7% 11.4% 12.9% 12.1%
Skilled Trades Occupations
12.3% 13.6% 12.4% 14.5% 13.5% 9.4% 12.8% 12.0%
Personal Services Occupations
7.1% 6.9% 7.8% 8.4% 9.0% 9.9% 10.2% 11.4%
Sales & Customer Services Occupations
9.8% 10.8% 10.5% 7.7% 8.3% 9.8% 7.6% 11.9%
Plant & Machine Ops
10.5% 9.6% 9.7% 9.7% 10.2% 10.6% 10.3% 8.3%
Elementary Occupations
10.1% 8.7% 12.3% 11.8% 10.7% 13.0% 12.2% 11.1%

12 Authority’s Monitoring Report 2011/12
Tameside Metropolitan Borough Council
Ref
Indicator Source 2004/05 2005/06 2006/07 2007/08 2008/09 2009/10 2010/11 2011/12 Notes / Target
Econ 8 Jobs density (ratio of total jobs to working age population)
Office for National Statistics - NOMIS
0.59 (2003)
0.62 (2004)
0.62 (2005)
0.59 (2006)
0.60 (2007)
0.55 (2008)
0.56 (2009)
0.53 (2010)
2010 Comparisons: North West 0.74 Great Britain 0.77
Econ 9 Average house price
Land Registry – House Price Index (March 2010)
£84,026 £101,940 £110,077 £115,081 £120,020 £101,888 £97,845 £97,578 Revised - based on sales for March of the reporting year.
Econ 10 Proportion of all employment in manufacturing
Annual Business Inquiry (ABI) 22.9% 20.8% 22.4% 20.8% 19.3% 18.5% No new data available
Post ABI 2006 data is not directly comparable to previous years due to changes in survey methodology and in 2009/10 was suspended.
Econ 11 Percentage of all businesses that employ 10 people or less
Annual Business Inquiry (ABI) 81.8% 82.9% 82.8% 83.3% 83.9%
No new data available
Econ 12 Losses of employment land in local authority area
Tameside MBC 3.94 ha 1.11 ha 3.88 ha 7.28 ha 0.1 ha 1.01 ha 3.73 ha provisional figure
Nil Relates to losses of employment land from the last year's supply.
Econ 13 Amount of employment land lost to residential development
Tameside MBC 1.37 ha 1.11 ha 1.53 ha 7.28 ha 0.1 ha 0.80 ha 3.73 ha provisional figure
Nil Relates to losses of employment land from the last year's supply.
Table 2.5 Employment, the Local Economy and Skills Contextual Indicators

13 Authority’s Monitoring Report 2011/12
Tameside Metropolitan Borough Council
Housing and Population
Housing Trajectory
The graph below, Figure 3.1, indicates Tameside’s expected housing performance. It shows past housing completion rates, then projected completions for 15 years from 2012. It is intended to show how the ‘plan, monitor and manage’ approach to housing delivery will work in Tameside.
The graph below estimates the provision of housing by adding together the allocated housing sites, sites with planning permission, and the remainder of sites under construction. Then an estimate of the number of sites likely to come forward from the Tameside’s Strategic Housing Land Availability Assessment (April 2011) is added. For each year, as the trajectory progresses, the accumulating over, or under provision is divided by the number of years left in the timescale. This is the time left in the trajectory to deal with accumulating over or under-provision. The predicted level of provision by 2021 meets the RSS target although a slight decline in provision is expected in the residual period to 2027. The area based regeneration of Hattersley resulted in a period of relatively high level of dwelling losses due to either demolitions or conversions causing a significant gap between the actual rates of house building and net annual completions, peaking at 375 losses in 2007-2008. This figure has now reduced significantly to 35 dwellings during 2010/11 and 5 dwellings during 2011/12. As the Council is unlikely to declare another major period of ambitious housing regeneration in the immediate future an estimate number of 50 dwellings will be used to calculate the housing trajectory figures. This housing trajectory updates those published in previous AMR’s, and will continue to be updated annually. As required, the current trajectory shows:
Net Additional dwellings for the five year period 1st April 2007 to 31st March 2012; Housing delivery for the reporting year 2011 - 2012; and The level of additional housing expected to come forward over the 15 year period up to 2027, starting with the current monitoring year. Gross completion figures are shown and an allowance made for clearance and
other losses. Figure 3.1 Tameside Housing Trajectory based on the RSS target of 750 net additional dwellings per annum
0
100
200
300
400
500
600
700
800
900
1,000
2003
-200
420
04-2
005
2005
-200
620
06-2
007
2007
-200
820
08-2
009
2009
-201
020
10-2
011
2011
-201
220
12-2
013
2013
-201
420
14-2
015
2015
-201
620
16-2
017
2017
-201
820
18-2
019
2019
-202
020
20-2
021
2021
-202
220
22-2
023
2023
-202
420
24-2
025
2025
-202
620
26-2
027
2027
-202
820
28-2
029
Dw
ellin
gs
Net additional dwellings completed 2003-2012
Net annual housing expected to come forward (from April 2012onwards)
Annual housing target (net of clearance)
Annual net completion rate required to address the housing targetshortfall accumulated since 2003, over the remaining Plan period.

14 Authority’s Monitoring Report 2011/12
Tameside Metropolitan Borough Council
Population
Tameside is just over 103 km² in size and has a resident population of 219,700 giving an average population density of 2,133 persons per km². Given that the borough has distinct urban and rural areas, there is a wide variation in population density. The proportion of residents from different ethnic minorities varies greatly within the borough. In Ashton St Peters ward, the Black and Minority Ethnic (BME) population accounted for 24% of people in the 2001 (Census), whilst in the Longdendale ward, this figure was only 1.5%. There is a large Bangladeshi community in Hyde, and sizeable Indian and Pakistani communities in Ashton.
Tameside % 2001 2009 Tameside % 2011 North West % 2001
2009 North West % 2011
England & Wales % 2001
2009 England & Wales % 2001
White 94.57 91.4
New Census data will be released in 2012/13 for 2011
94.44 91.7
New Census data will be released in 2012/13 for 2011
91.31 87.9
New Census data will be released in 2012/13 for 2011
British 92.70 88.9 92.17 88.4 87.49 83.3 Irish 0.91 0.9 1.15 1.0 1.23 1.0 Other White 0.96 1.6 1.11 2.2 2.59 3.5
Mixed 0.79 1.3 0.93 1.4 1.27 1.8 White & Black Caribbean 0.31 0.5 0.33 0.4 0.46 0.6 White & Black African 0.11 0.2 0.15 0.2 0.15 0.2 White & Asian 0.24 0.4 0.26 0.4 0.36 0.6 Other Mixed 0.13 0.2 0.20 0.3 0.30 0.4
Asian or Asian British
3.97 5.8 3.42 4.7 4.37 5.9 Indian 1.45 1.7 1.07 1.6 1.99 2.6 Pakistani 1.22 2.1 1.74 2.1 1.37 1.8 Bangladeshi 1.17 1.4 0.39 0.6 0.54 0.7 Other Asian 0.14 0.6 0.22 0.4 0.46 0.7
Black or Black British
0.27 0.9 0.62 1.2 2.19 2.8 Caribbean 0.16 0.3 0.30 0.4 1.08 1.1 African 0.08 0.5 0.24 0.6 0.92 1.5 Other Black 0.03 0.1 0.08 0.1 0.18 0.2
Chinese or Other Ethnic Group
0.40 0.7 0.60 1.1 0.86 1.6 Chinese 0.30 0.4 0.40 0.6 0.44 0.8 Other Ethnic Group 0.11 0.3 0.20 0.5 0.42 0.8
Table 3.1 Ethnic Composition. Data Source: Census 2001. Please note that data for 2009 are estimate experimental statistics from ONS.
Tameside % Tameside % 2011 North West % North West % 2011 England & Wales % England & Wales % 2001 Christian 75.54
New Census data will be released in 2012/13 for
2011
78.01
New Census data will be released in 2012/13 for
2011
71.75
New Census data will be released in 2012/13 for
2011
Buddhist 0.13 0.18 0.28 Hindu 1.36 0.40 1.06 Jewish 0.04 0.42 0.50 Muslim 2.52 3.04 2.99 Sikh 0.03 0.10 0.63 Other 0.17 0.16 0.29 No Religion 12.10 10.48 14.81 Not Stated 8.11 7.23 7.71
Table 3.2 Religion. Data Source: Census 2001
Deprivation According to the 2010 Index of Multiple Deprivation (IMD), Figure 3.2, Tameside is the 42nd most deprived local authority area (out of 326). This is a decline from the 2007 IMD where Tameside was ranked as the 56th most deprived local authority area. It is important to note that the total number of authority areas has also declined over the same period from 354 to 326. There are great differences in levels of deprivation throughout the borough. Although there are a number of Super Output Areas (SOAs) that appear in the least deprived categories, there are also many that are within the 10% most deprived in the country.
Social and Affordable Housing
At present, social and affordable housing in Tameside can be expected to be delivered by Registered Providers (RP’s) and not the private sector. UDP policy H4 allows the Council to seek an element of subsidised or low cost market housing to be provided in conjunction with development proposals. Although this policy is not presently implemented by the Council, the situation is being kept under review. A number of housing studies including the forthcoming update of the Strategic Housing Market Assessment and Interim Housing Position Statement commissioned by the Council as part of the emerging Local Plan evidence base, may provide justification for the Council to commence implementation of this policy.

15 Authority’s Monitoring Report 2011/12
Tameside Metropolitan Borough Council
Figure 3.2 Tameside index of multiple deprivation 2007 and 2010 data of all scoring criteria.
2007
2010

16 Authority’s Monitoring Report 2011/12
Tameside Metropolitan Borough Council
Housing and Population Core and Local Output Indicators
Ref Indicator 2004/5 2005/6 2006/7 2007/8 2008/9 2009/10 2010/11 2011/12 Notes Core H1 Plan Period and
housing target Start of Plan period
Indicator not recorded prior to 2007/8.
1/4/2003 1/4/2003 1/4/2003 1/4/2003 1/4/2003 Until such time of the revocation of the Regional Spatial Strategy, it’s target for net additional dwellings will continue to stand for Tameside.
End of plan period
31/3/2021 31/3/2021 31/3/2021 31/3/2021 31/3/2021
Total housing required
13,500 13,500 13,500 13,500 13,500
Source of plan target
North West of England Regional Spatial Strategy to 2021
North West of England Regional Spatial Strategy to 2021
North West of England Regional Spatial Strategy to 2021
North West of England Regional Spatial Strategy to 2021
North West of England Regional Spatial Strategy to 2021
Core H2(a)
Net additional dwellings - in previous years
99-00
Indicator not recorded prior to 2007/8.
227 227 227 227 227 00-01 172 172 172 172 172 01-02 268 268 268 268 268 02-03 105 105 105 105 105 03-04 515 515 515 515 515 04-05 383 383 383 383 383 05-06 684 684 684 684 684 06-07 563 563 563 563 563 07-08 - 789 789 789 789 08-09 - 652 652 652 652 09-10 253 253 253 10-11 286 286 11-12 350
Core H2(b)
Net additional dwellings - for the reporting year
11-12 Indicator not recorded prior to 2007/8.
- - 253 286 350
Core H2(c)(i)
Net additional dwellings - in future years
10-11 Indicator not recorded prior to 2007/8. 700 750 400
Data not available
- Identified within the Housing Trajectory Fig 3.1 as Net annual housing expected to come forward.
11-12 800 900 600 - 12-13 885 1150 780 420 13-14 930 1250 880 480 14-15 930 1150 930 500 15-16 880 880 950 525 16-17 880 880 1040 550 17-18 880 880 1125 600 18-19 830 830 1100 625 19-20 830 830 1000 650 20-21 780 780 860 675 21-22 780 780 780 700 22-23 730 730 750 750 23-24 780 24-25 800 25-26 830 26-27 790
Core H2 (c) (ii)
Estimated gross area (ha) of gross completions
09-10 Indicator not recorded prior to 2007/8. 12.7 - -
Data not available
- Core indicator H2(c)(i) and clearance at an estimated average rate of 50 dwellings per annum. Development to occur at an average density of 35 dwellings per hectare.
10-11 15.4 15.0 - - 11-12 17.4 20.0 17.40 - 12-13 19.1 25.0 19.10 - 13-14 20.0 25.0 20.00 15.1 14-15 23.0 20.00 15.7 15-16 20.00 16.4 16-17 17.1 17-18 18.5
Core H2(c)(iii)
Target for annual average rate of housing provision (net of clearance)
2003-2023
Indicator not recorded prior to 2007/8.
750 750 750 750 750

17 Authority’s Monitoring Report 2011/12
Tameside Metropolitan Borough Council
Ref Indicator 2004/5 2005/6 2006/7 2007/8 2008/9 2009/10 2010/11 2011/12 Notes Core H2(d)
Managed delivery target
07-08
Indicator not recorded prior to 2007/8.
790 - -
Data not available
- Net additional dwellings expected to come forward over the remaining plan period (2012 onwards). Identified within the Housing Trajectory Fig 3.1 as Annual net completion rate required to address the housing shortfall.
08-09 700 789 - - 09-10 565 652 813 - 10-11 700 565 826 - 11-12 800 700 878 - 12-13 885 800 926 500 13-14 930 885 962 525 14-15 930 930 985 550 15-16 880 930 1000 575 16-17 880 880 1012 650 17-18 880 880 1024 700 18-19 830 880 1020 725 19-20 830 830 985 750 20-21 780 830 928 800 21-22 780 780 856 850 22-23 730 780 900 23-24 730 925 24-25 950 25-26 950 26-27 950 27-28 925
Core H3, UDP 6
Percentage of new and converted dwellings on previously developed land
79.2% 84.9% 80.9% 75.3% 77.26% 73% 78% 77.75% (provisional figure)
Former Core Indicator 2b.
Core H4 Net additional pitches - Gypsy and Traveller
Indicator not recorded prior to 2007/8
Nil 2 5 Nil Nil
Core H5 UDP 7
Affordable housing completions
None 44 48 54 102 56 41 72 Former Core Indicator 2d.
Core H6 Housing Quality - Building for Life Assessments
New indicator from 2010/11 onwards
See notes 1 pre commencement assessment for Barratt housing development at Hattersley achieving the minimum score of 14.
The Council requires that applications for 10 or more dwellings have a minimum Building for Life score of 14 pre 2011/12. Building for life 12 will be applied for applications from 2012/13 onward. Scores of 12 can apply building for life diamond status.
UDP 4 Total number of new dwellings completed
574
940 675 1164 921 347 321 355 Figures are a gross total.
UDP 5 Number of dwellings completed on windfall sites
126 348 399 929 736 data unavailable data unavailable 189 Includes completions on any sites not identified for housing in the adopted UDP 2004.
UDP 8 Number of dwellings cleared, including tenure and occupancy
191 256 112 375 269 94 34 0
UDP 9 Remaining supply of land for housing development (ha)
152.5 ha 140.2 ha 141.6 ha 138.1 ha 126.8 ha 127.43 ha data unavailable 120.97ha provisional figure
Cumulative of land available for housing contained within the 5 year supply. 2011/12 based on estimated number of deliverable dwellings 3629 at 30dph.
Table 3.3 Housing and Population Core and Local Output Indicators

18 Authority’s Monitoring Report 2011/12
Tameside Metropolitan Borough Council
Housing and Population Significant Effect Indicators
These significant effects indicators measure progress against sustainability appraisal objectives. For details of these objectives please see Appendix A ‘Sustainability Appraisal Objectives’. Ref SA
Obj Indicator Source 2004/5 2005/6 2006/7 2007/8 2008/9 2009/10 2010/11 2011/12 Target/ Rationale Notes
SE 1.1
1 Increase in affordable housing
Tameside MBC 2 dwellings brought back to use
44 social/ affordable dwellings completed
48 social/ affordable dwellings completed
54 social/ affordable dwellings completed
102 social/ affordable dwellings completed
56 social/ affordable dwellings completed
41 social/ affordable dwellings completed
72 social rendered properties completed
Implementation of affordable housing policy currently being reviewed.
SE 1.2
1 Housing quality – Building for life assessments
Tameside MBC See Core and Local Output Indicator H6
SE 1.3
1 Number of BREEAM accredited buildings
BRE 1 Bespoke 'Good' certified development
None 1 EcoHomes 'Very Good', 1 Office rating of 'Good'
4 Ecohomes rated 'Good' and 1 bespoke 'Very Good' certified development
1 EcoHomes rated 'Pass' and 1 Office rating of 'Very Good'. 8 dwellings certified by the Code for Sustainable Homes
No known commercial developments achieving standards
No known commercial developments achieving standards
1 interim assessment of Very Good for Tesco Hattersley (awaiting final assessment by RPS)
Rating levels: Outstanding Excellent Very Good Good Pass Acceptable
BREEAM assessment now only applicable to commercial developments from 2009/10.
SE 1.4
1 Percentage of dwellings empty
DCLG Housing Strategy Statistical Index
- 4.44% (01/04/05)
4.62% (01/04/06)
5.14% (01/04/07)
3.97% (01/04/08)
4.40% (01/04/09)
2.04% (01/04/10)
1.7% (01/04/11) (1.4% (31/03/2012))
Reduce the number of empty properties, to assist with delivering the housing needs of the borough.
Total stock 31/03/2012 98370 of which 1396 are considered to be empty. Of the 1396, 1239 are in private ownership
SE 1.5
1 Percentage of homes unfit for use
DCLG Housing Strategy Statistical Index
- 4.62% (01/04/05)
4.92% (01/04/06)
- 4.76% (01/04/08)
7% (01/04/09)
- (0.1% (31/03/2012))
Reduce. Recorded as Category 1 Hazard’s. There are 121 Category 1 Hazards recorded in the private sector.
SE 1.7
1 Net additional pitches for Gypsies and Travellers
Tameside MBC
See Core and Local Output Indicator H4
SE 2.1
2 Life expectancy at birth
Office for National Statistics
Male 74.1 years 74.6 years 74.9 years 75.67 years 75.67 years 75.7 years Data available 2012/13
Community Strategy seeks to reduce death rates for the under 75’s.
Female 79.4 years 79.5 years 79.8 years 79.58 years 79.58 years 80.3 years Data available 2012/13
SE 2.2
2 % of population living in SOA’s ranked by IMD within the 33% most deprived areas due to health factors
Index of multiple Deprivation
IMD 2004 75.7%
IMD 2004 75.7%
IMD 2004 75.7%
IMD 2007 71.1%
IMD 2007 71.1%
IMD 2007 71.1%
IMD 2010 74.6%
IMD 2010 74.6%

19 Authority’s Monitoring Report 2011/12
Tameside Metropolitan Borough Council
Ref SA Obj
Indicator Source 2004/5 2005/6 2006/7 2007/8 2008/9 2009/10 2010/11 2011/12 Target/ Rationale Notes
SE 3.1
3 % of people who think that their local area is a place where people from different backgrounds get on well together
Residents' Opinion Survey every third year, and the Tameside Area Agreement between.
58% ROS - - 65% ROS 55.4% TAA 58.5% TAA 81% ROS 55.5% TAA Increase. Next Residents Opinion Survey takes place winter 2013/14.
SE 4.1
4 Net change in population
Midyear Population Estimates
- - 400 + 200 + / - 0 + 1,200 + 1,000 + 1,482 +2,818 Reduce out-migration. Population growth assists economic growth.
Figures adjusted from previous AMR.
SE 4.2
4 % of population living in SOAs ranked by IMD in the 33% most deprived due to all factors
Index of Multiple Deprivation
59.74% (IMD 2004)
59.74% (IMD 2004)
53.40% (IMD 2007)
53.40% (IMD 2007)
53.40% (IMD 2007)
53.40% (IMD 2007)
55.76% (IMD 2010)
55.76% (IMD 2010)
Reduce. IMD 2004/ 2007/2010.
SE 9.1
9 Percentage of pupils obtaining 5 or more GCSE’s at grades A* - C.
Tameside MBC 44.7% 51.7% 49.8% 55.2% 60.6% (2008) 69.3% (2009) 74.4% (2010) 80.8% (2011) Increase.
SE 9.2
9 Qualifications of working age resident population
Annual Population Survey
NVQ4 and above
18.7% 17.1% 19.0% 20.0% 18.8% 17.6% 21.0%
NVQ3 and above
39.7% 41.4% 40.9% 41.9% 40.6% 40.8% 40.7%
NVQ2 and above
58.7% 60.6% 59.0% 58.9% 57.3% 60.4% 60.3%
NVQ1 and above
75.6% 76.7% 75.7% 75.4% 75.1% 77.6% 76.6%
Other qualifications
4.7% 4.8% 6.4% 7.9% 8.1% 7.7% 9.3%
No qualifications
19.8% 18.5% 17.9% 16.7% 16.8% 14.7% 14.1%
SE 9.3
9 Number of Tameside residents entering further education
Student Loans Database / Department for Education
2,948 3,061 3,021 3,326 3,565 4,470 (end of 2009)
4,320 (end of 2010)
Data available 2012/13
Increase.
SE 9.4
9 School leavers in education, employment or training
Tameside Area Agreement indicator PR5b
85.6% 88.8% 89.3% 89.9% 89.7% 89.5% 90.23% 84.6% Increase. 2006/7 onward relates to the percentage of school leavers in education and work base learning.
SE 14.2
14 Percentage of new and converted dwellings on previously developed land
Tameside MBC
See Core and Local Output Indicator H3
SE 1.6
1 Energy efficiency SAP rating for social housing
Housing Corporation Regulatory and Statistical
New Charter
71.5% 70.3% 70.3% -
62% 71% 63% Improve the energy efficiency of the housing stock of
Peak Valley
- 59.7% 73% - 74%
72.9% 75%

20 Authority’s Monitoring Report 2011/12
Tameside Metropolitan Borough Council
Ref SA Obj
Indicator Source 2004/5 2005/6 2006/7 2007/8 2008/9 2009/10 2010/11 2011/12 Target/ Rationale Notes
Returns Survey Ashton Pioneer
- 86% Not required to submit information due to volume of housing stock
Registered Providers.
Irwell Valley
- - 64% - 71.4% 69% 70.9%
Table 3.4 Housing and Population Significant Effects Indicators.
Housing and Population Contextual Indicators Ref Indicator Source 2004/5 2005/6 2006/7 2007/8 2008/9 2009/10 2010/11 2011/12 Notes Pop 1 Total resident
population Midyear Population Estimates
Males 103,900 103,900 103,900 103,900 104,600 105,100 106,045 107,800 Increase. Figures adjusted from previous AMR. 2011/12 rapid rise due to revisions from 2011 Census data.
Females 109,500 109,200 109,300 109,300 109,800 110,200 110,837 111,900 Total 213,400 213,000 213,200 213,200 214,400 215,400 216,882 219,700
Pop 2 Average population density
Midyear Population Estimates
2,072 2,075 2,078 2,078 2,092 2,088 2,102 2,133
Pop 4 Dwelling stock DCLG Housing Strategy Statistical Appendix
92,684 (01/04/04)
95,945 (01/04/05)
- 97,210 (01/04/07)
97,885 (01/04/08)
97,729 (01/04/09)
97,980 (01/04/10)
99,161 (01/04/11)
Pop 7 Average Household size
Census 2001 and 2011
2.4 2.4 2.4 2.4 2.4 2.4 2.4 2.3
Pop 9 Number of unfit homes in social housing
DCLG Housing Strategy Statistical Appendix
None
None None None None None LSVT (Large Scale Voluntary Transfer)
LSVT (Large Scale Voluntary Transfer)
Pop 10 Proportion of social housing not meeting the Decent Homes Standard
Community Strategy Update 2005
21.60% 23.40% 10.86% 8.14% No data available
3.2% LSVT (Large Scale Voluntary Transfer)
LSVT (Large Scale Voluntary Transfer)
Pop 13 Local authority area multiple deprivation rank
Communities and Local Government
49 (IMD 2004) 49 (IMD 2004) 49 (IMD 2004) 56 (IMD 2007) 56 (IMD 2007) 56 (IMD 2007) 42 (IMD 2010) 42 (IMD 2010) 1 = most deprived; 326 = least deprived. Deprivation data from IMD 2004/ 2007/2010. Please note 2010 data saw a reduction in the number of authorities from 354 to 326.
Pop 14 Energy efficiency average SAP rating for private sector housing
DCLG Housing Strategy Statistical Appendix
- 58% (01/04/05)
61% (01/04/06)
70% (01/04/07)
70% (01/04/08)
63% (01/04/09)
63% (01/04/10)
63% (01/04/11)
Increase.
Table 3.5 Housing and Population Contextual Indicators

21 Authority’s Monitoring Report 2011/12
Tameside Metropolitan Borough Council
Transport Transport
Three major initiative schemes: Metrolink to Droylsden and Ashton-under-Lyne; the Ashton Northern Bypass Stage 2; and the Greater Manchester Retaining Wall Major Maintenance scheme, a major initiative between Tameside, Oldham, Rochdale and Stockport MBC’s to renew a number of major structures across the local area have been completed or are cumulatively under construction. Following the March 2009 withdrawal by the Highways Agency from the adjourned Mottram-Tintwistle Bypass Public Inquiry, Tameside proposed the development of an integrated transport strategy for
Longdendale. This area suffers from severe congestion problems caused by traffic travelling between the M67, Glossop and Sheffield. An integrated transport strategy would include a broad package of measures, such as improved public transport provision, walking and cycling, though the strategy is likely to rely on the construction of a local bypass to relieve the congestion before the other measures could flourish and reach their full potential. No firm cost estimates for the delivering LITS are available, as Tameside MBC has yet to progress the scheme to the detailed development stage. However, as part of the original funding approved by AGMA, the scheme had a £100m budget. £90m of this stemmed from the Department for Transport’s Regional Funding Allocation and £10m from the Greater Manchester Transport Fund. Parking Standards and Public Transport Journey Times
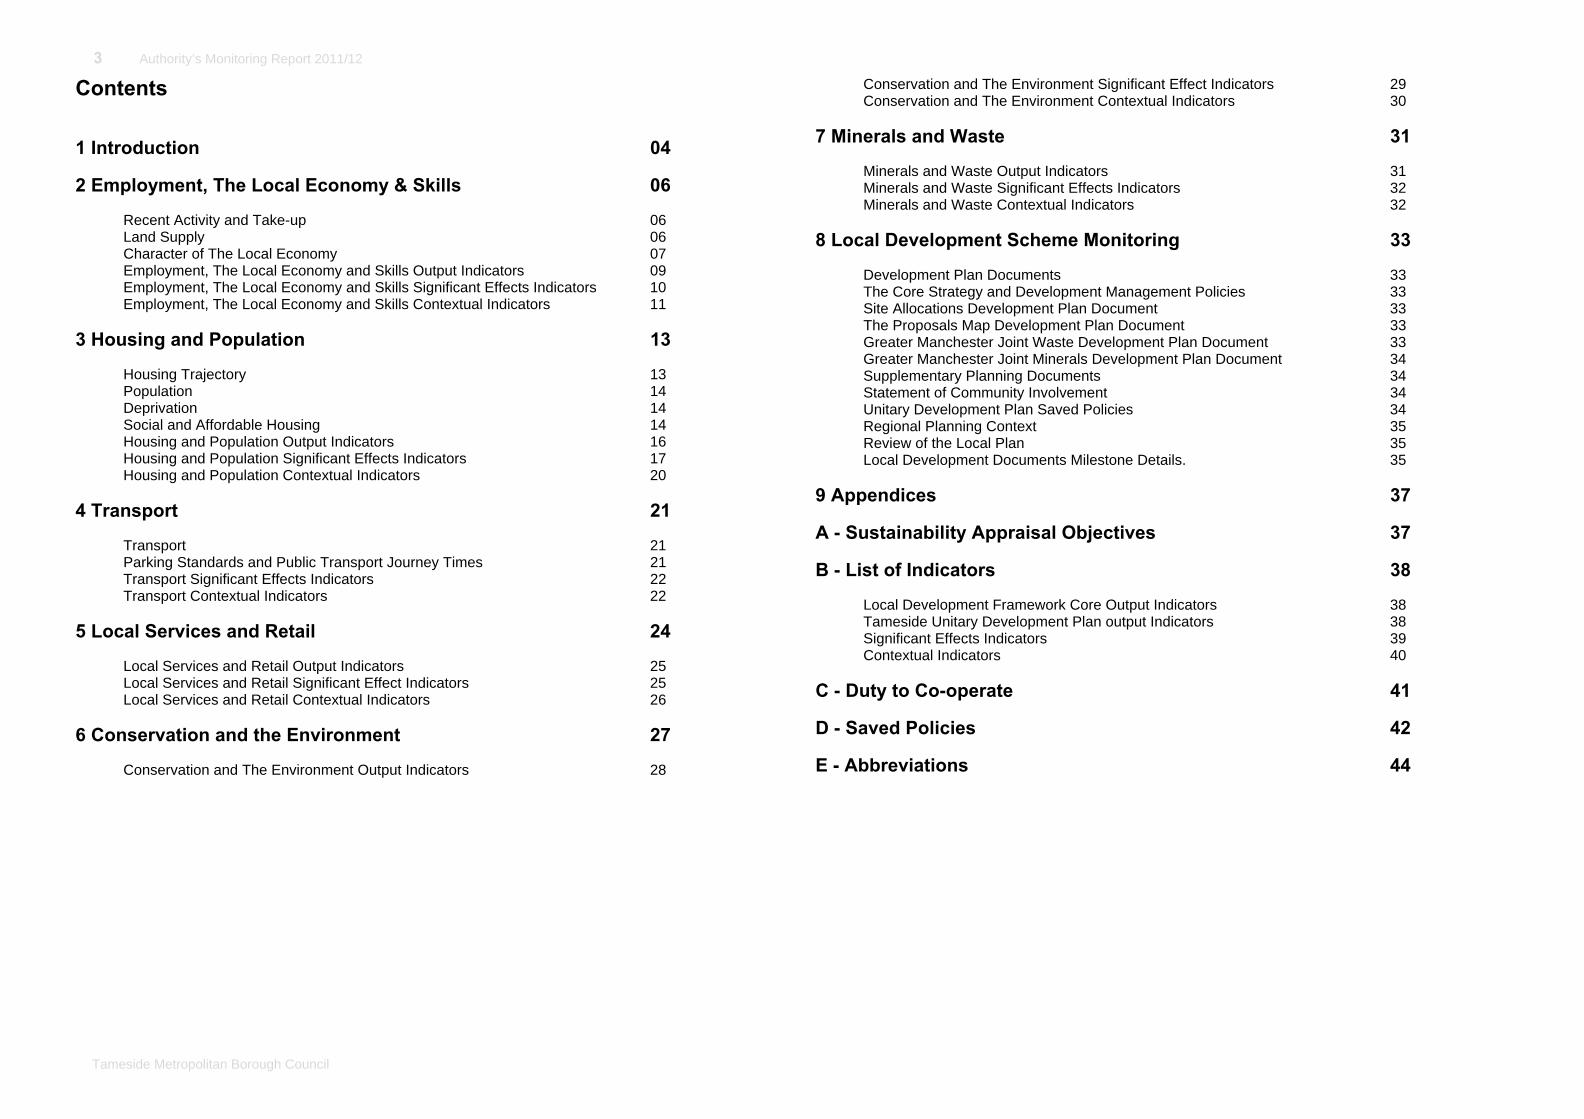
The monitoring of the amount of residential development, in table 4.4, within 30 minutes public transport time of a variety of facilities and services has been conducted in accordance with the monitoring guidelines utilising accession software to calculate journey times using public transport. Data provided by Transport for Greater Manchester. Distance Percentage of People 2001 Percentage of People 2011 Works from home 7.73%
New Census data will be released in 2012/13 for 2011
Less than 2km 20.92% 2km or more but less than 5 km 24.41% 5km or more but less than 10km 22.17% 10km or more but less than 20km 15.77% 20km or more but less than 30km 1.91% 30km or more but less than 40km 0.78% 40km or more but less than 60km 1.10% 60km or more 1.58% No fixed place of work 3.46% Working outside the UK 0.13% Working at offshore installation 0.04% Table 4.1 Distance travelled to work (resident population). Source: Census
Method Percentage of People 2001 Percentage of People 2011 Works from home 4.89%
New Census data will be released in 2012/13 for 2011
Underground, metro, light rail or tram 0.07% Train 1.42% Bus, minibus or coach 7.76% Taxi or minicab 0.42% Driving car or van 35.56% Passenger in car or van 4.68% Motorcycle, scooter or moped 0.61% Bicycle 0.99% On foot 6.62% Other 0.18% Not currently working 36.81% Table 4.2 Method of travel to work (resident population). Source: Census

22 Authority’s Monitoring Report 2011/12
Tameside Metropolitan Borough Council
Transport Significant Effects Indicators
These significant effects indicators measure progress against sustainability appraisal objectives. For details of these objectives please see Appendix A 'Sustainability Appraisal Objectives'. Ref SA Obj Indicator Source 2004/5 2005/6 2006/7 2007/8 2008/9 2009/10 2010/11 2011/12 Target /
Rationale Notes
SE 6.1 6 Distance travelled to work by the resident population
Census See Table 4.1
SE 6.2 6 Percentage of population living in SOA’s ranked by IMD within the 33% most deprived areas due to access.
Communities and Local Government
IMD 2004 8.1%
IMD 2004 8.1%
IMD 2004 8.1%
IMD 2007 3.6%
IMD 2007 3.6%
IMD 2007 3.6%
IMD 2010 1.5%
IMD 2010 1.5%
This indicator measures the physical and financial accessibility of housing and key local services. The indicators used to create this fall into two sub-groups: ‘geographical barriers’, which relate to the physical proximity of local services, and ‘wider barriers’ which includes issues relating to access to housing such as affordability.
SE17.1 17 Amount of new residential development within 30 mins public transport time to GPs, Hospital, Primary School, Secondary School, Area of Employment and Major Retail Centre.
Tameside MBC and Transport for Greater Manchester
See Contextual Indicator Tran 6
New Sustainability Appraisal indicator.
SE23.1 23 Travel to work by different modes
ONS Census
See Table 4.2
Increase use of sustainable forms of transport.
Replaces former Significant Effects indicator 27.1.
SE23.3 23 Car ownership - % of households owning one or more car/van
ONS Census
67.3 % (2001)
New Sustainability Appraisal indicator.
Table 4.3 Transport Significant Effects Indicators
Transport Contextual Indicators
Ref Indicator Source 2004/05 2005/06 2006/07 2007/08 2008/09 2009/10 2010/11 2011/12 Notes Tran 1 Percentage of people travelling to work by public
transport Census 15% New Census
data will be released in 2012/13 for 2011
New Census data will be released in 2012/13 for 2011.
Tran 2 Percentage of public transport users owning a car or van
Census 67% New Census data will be released in 2012/13 for 2011
New Census data will be released in 2012/13 for 2011.
Tran 3 Percentage of people travelling less than 10km to work
Census 76% New Census data will be released in 2012/13 for 2011
New Census data will be released in 2012/13 for 2011.
Tran 4 Number of people killed and seriously injured on the road
Formerly BVPI 99a
77 (2004) 70 (2005) 67 (2006) 78 (2007) 54 (2008) 49 (2009) 58 (2010) 57 (2011) Steady decline.
Tran 5 Amount of Completed non-residential
Class A (Floorspace)
TMBC 100% 100% 1.46% 0% 0% 100% 24.66% 33.3% Formerly Core Indicator 3a. Please note that from 2010/11 car parking
23 Authority’s Monitoring Report 2011/12
Tameside Metropolitan Borough Council
development within Use Classes A, B and D complying with car-parking standards set out in the Local Development Framework
Class A (no. of developments)
TMBC 100% 100% 75.0% 0% 0% 100% 40% 9.9% standards are assessed as meeting maximum standards detailed within policy RT2 of the North West Plan Partial Review (July 2009). Class B
(Floorspace) TMBC 93.6% 74.1% 92.2% 52.1% 0% 0% Data
available 2012/13
Data available 2012/13
Class B (no. of developments)
TMBC 50.0% 70.0% 83.3% 25.0% 0% 0% Data available 2012/13
Data available 2012/13
Class D (Floorspace)
TMBC 33.1% N/A N/A N/A N/A N/A 19.41% 6.8%
Class D (no. of developments)
TMBC 50.0% N/A N/A N/A N/A N/A 33.33% 25.0%
Total (floorspace) TMBC 92.2% 75.3% 46.8% 49.3% 0% 19.9% 20.22% 7.7% (from Class A and D floorspace developments only 228/2946)
Total (no. of developments)
TMBC 55.6% 72.7% 80% 20% 0% 50% 37.50% 30% (from Class A and D floorspace developments only 3/10)
Tran 6 Amount of new residential development within 30 minutes public transport time of various facilities and services
GP:
TMBC 100% 99.9% 98.7% 99.9% 100% 91.4% 100% 100% Formerly Core Indicator 3b. Public transport times were calculated using NW Traveline Journey Planner: http://www.traveline-northwest.co.uk. 2004/5 figures included cycling in the definition of public transport. Later figures exclude cycling. 2011/12 figures provisional.
Hospital:
TMBC 100% 64.5% 68.0% 58.1% 60.4% 46.0% 56.4% 58%
Primary School:
TMBC 100% 100% 98.7% 99.8% 100% 100% 100% 100%
Secondary School TMBC 100% 99.9% 98.7% 99.8% 100% 99.4% 100% 100%
Area of Employment
TMBC 100% 99.8% 98.7% 99.8% 100% 99.4% 100% 100%
Major retail centre TMBC 100% 99.8% 98.7% 99.8% 99.8% 99.4% 100% 100%
Table 4.4 Transport contextual indicators

24 Authority’s Monitoring Report 2011/12
Tameside Metropolitan Borough Council
Local Services and Retail Retail completions within Tameside over the monitoring year have been relatively small in scale and in number. Many schemes have consisted of small extensions or alterations to existing retailing locations. The impact of the recession is clear with people having a more constrained disposable income and the high street facing competition from other sources such as the internet, supermarkets and out of town retail parks. The trend of retail completions has been toward providing smaller scale more localised provision. Many of Tameside’s centres continue to face challenges in retaining existing key retailers, minimising vacancies and recycling floorspace effectively. Although challenges do exist, vacant floorspace in Ashton, Hyde and Denton has been recycled relatively well when compared to Droylsden, Stalybridge and Mossley. In many instances vacant floorspace has been utilised by discount retailers who have
sought to meet the needs of a more astute and savvy shopper seeking better value for money. However the reluctance of national multiples to expand operations reflects nervousness amongst investors, developers and retailers to expand operations and reduced levels confidence in the future of the high street. Beyond the monitoring year, Hyde is receiving investment in its outdoor market which will see new stalls, improvements to the public realm and a shared public events space. In addition metrolink work around Droylsden is drawing to a close with improvements to the surrounding public realm. The Portas review, commissioned by the Government, into town centre retailing and the state of our high streets has galvanised opinions about the importance of our town centres and as a result many towns within Tameside either have are in the process of establishing Town Teams. In 2010 White Young Green (WYG) updated the Councils retail study, the key message from which is about creating an enhanced and improved retail provision primarily within Ashton to re-affirming its role as the Boroughs primary shopping destination, a message which is being taken forward through the emerging Local Plan. The key findings from the WYG retail study are contained within the data table below. The full WYG Study, including appendices, can be downloaded at http://www.tameside.gov.uk/planning/ldf/retailstudy2010
Table 5.1 Capacity for Additional Retail Floorspace within Tameside (2009-2027) over and above outstanding commitments at the time of the study, taken from White Young Green Retail Study, Summer 2010.
Surplus Expenditure
(£m) Potential Floorspace Requirements
(sq m net) 2009 2014 2019 2024 2027 2009 2014 2019 2024 2027
Convenience Goods Borough 47.04 71.38 97.84 126.29 144.38 2,830-9,315 5,815-14,135 7,890-19,180 10,085-24,510 11,460-27,855 Ashton-under-Lyne 36.18 46.60 58.48 71.24 79.34 2,875-7,235 3,795-9,225 4,715-11,465 5,690-13,825 6,295-15,305 Hyde 7.00 12.76 18.94 25.59 29.82 575-1,400 1,040-2,525 1,525-3,715 2,045-4,965 2,365-5,755 Denton - - - - - - - - - - Stalybridge 13.37 16.20 19.23 22.49 24.55 1,100-2,675 1,320-3,205 1,550-3,770 1,795-4,365 1,950-4,735 Droylsden 1.66 2.78 4.46 6.28 7.43 135-330 225-550 360-875 500-1,220 590-1,435 Comparison Goods Borough - - 20.63 167.83 289.38 - - 3,645-6,075 27,520-45,865 45,375-75,625 Ashton-under-Lyne - - 25.03 120.30 193.05 - - 4,420-7,370 19,725-32,875 30,270-50,450 Hyde - 2.88 14.44 37.77 55.52 - 550-915 2,550-4,250 6,195-10,320 8,705-14,510 Denton - - - 19.70 42.38 - - - 3,230-5,385 6,645-11,075 Stalybridge - - - 0.49 4.07 - - - 80-135 640-1,065 Droylsden - - - - - - - - - - Notes: WYG (2010) Floorspace requirement based on an average sales density of between £5,000 - £12,155 per sq m for convenience goods and allowing for increased productivity of +0.2% per annum Floorspace requirement based on an average sales density of between £3,000 - £5,000 per sq m for comparison goods and allowing for increased productivity of +1.0% per annum between 2009 and 2014 and +1.5% per annum post 2014 at 2007 prices

25 Authority’s Monitoring Report 2011/12
Tameside Metropolitan Borough Council
Local Services and Retail Core and Local Output Indicators
Ref Indicator 2004/5 2005/6 2006/7 2007/8 2008/9 2009/10 2010/11 2011/12 Notes Core BD4 (i) UDP 11
Amount of completed retail, office and leisure development respectively in town centre.
Retail 7,621 m2 Nil 27,180 m2 Nil 3,744 m2 183 m2 553 m2 160 m2 Please note that office floorspace counted as employment development (B uses) in core indicator BD1(i) cannot be double counted in this section.
Office Nil Nil Nil Nil Nil Nil Nil Nil
Leisure Nil Nil Nil Nil Nil 792 m2 Nil 142 m2
Core BD4 (ii)
Amount of complete retail, office and leisure development respectively across centres.
Retail 7,621 m2 600 m2 27,180 m2 1,154 m2 3,940 m2 1,957 m2 648 m2 867 m2 Please note that office floorspace counted as employment development (B uses) in core indicator BD1(i) cannot be double counted in this section.
Office Nil Nil Nil Nil Nil Nil Nil Nil
Leisure 1,796 Nil Nil Nil Nil 792 m2 2,859 m2 2,079 m2
UDP 10 Number of town centre commercial premises vacant.
Ashton 67
No data available
116 16
No data available
32 Please note that 2004/5 data are from Experian Goad surveys. Data from 2009/10 onwards represents a more focused town centre commercial environment.
Denton 17 30 15 17 Droylsden 15 26 25 23 Hattersley Not surveyed Not surveyed Not surveyed Not surveyed Hyde 59 64 14 9 Mossley Not surveyed 8 6 10 Stalybridge 42 64 22 24
Table 5.2 Local Services and Retail Core and Local Output Indicators Local Services and Retail Significant Effects Indicators These significant effects indicators measure progress against sustainability appraisal objectives. For details of these objectives, please see Appendix A ‘Sustainability Appraisal Objectives’. Ref SA
Obj Indicator Source 2004/5 2005/6 2006/7 2007/8 2008/9 2009/10 2010/11 2011/12 Target Notes
SE 7.2
7 Recorded Crime per 1,000 population. Tameside Area Agreement indicator SA1c victim based crime from 2008/9 onward.
British Crime Survey (Home Office prior to 2008/09, Tameside Area Agreement HMIC onward)
75.4 crimes per 1,000 residents (ratified data of 24,484 crimes)
77.5 crimes per 1,000 residents (25,855)
70.1 crimes per 1,000 residents (23,987)
61.8 crimes per 1,000 residents (22,036)
85 crimes per 1,000 residents (18,289)
78 crimes per 1,000 residents (16,797)
74 crimes per 1,000 residents (16,131)
64 crimes per 1,000 residents (14,023)
Reduce For 2007/8 this is the number of British Comparator crimes per 1,000 residents. The figure for 2006/7 is the rate of comparator crimes in the British Crime Survey and is not comparable to the previous figure. From 2008/09 onward figures relate to Tameside Area Agreement indicator SA1c of victim based crime HMIC.
SE 7.3
7 Proportion of adults who feel safe in their neighbourhood during the day and night
Citizens Panel Survey
Daytime very safe
41% 41% 40% 46.6% 49.0% 49.8% 49.7% Improve feeling of safety
Daytime fairly safe
54% 54% 57% 49.5% 47.8% 48% 48%
Daytime fairly unsafe
5% 4% 3% 2.8% 2.6% 2% 2.1%
Daytime very unsafe
1% 1% 1% 1.0% 0.7% 0.3% 0.3%
After dark very safe
8% 5% 6% 9.1% 9.4% 10.4% 11%
After dark fairly safe
36% 41% 51% 54.3% 55.4% 56.4% 55.7%
After dark fairly unsafe
54% 37% 30% 25.8% 27.5% 25.9% 25.7%
After dark very unsafe
18% 16% 12% 10.8% 7.8% 7.3% 7.6%
SE 8.1
8 Percentage of residents who think
Residents Opinion
51% ROS - - 34% ROS - - 39% ROS - Increase inclusion. Next Residents Opinion Survey takes place winter

26 Authority’s Monitoring Report 2011/12
Tameside Metropolitan Borough Council
that the council listens to residents views.
Survey occurs every three years
2013/14.
Table 5.3 Local Services and Retail Significant Effects Indicators Local Services and Retail Contextual Indicators
Table 5.4 Local Services and Retail Contextual Indicators
REF Indicator 2004/5 2005/6 2006/7 2007/8 2008/9 2009/10 2010/11 2011/12 Retail 1 Percentage of gross retail development
completed within town centre locations 100.00% 0.00% 100.00% 0.00% 95.03% 9.35% 85.34% 18.45%
Retail 2 Percentage of vacant units within town centres vacant for longer than 12 months.
Ashton
New statistic from 2011/12
40.63% Stalybridge shows a much higher long term vacancy than other centres as a result of technical data issues. It is expected that this will reduce in 2012/13.
Denton 52.94% Droylsden 56.52% Hattersley - Hyde 22.22% Mossley 50.00% Stalybridge 75.00%
Retail 3 Percentage of town centre units vacant
Ashton 14.44%
No data available
18.62% 6.99%
No data available
11.85% Denton 9.88% 14.29% 10.64% 12.06% Droylsden 10.00% 18.06% 24.27% 22.33% Hattersley - - - - Hyde 20.85% 17.16% 11.97% 7.38% Mossley - 11.43% 11.32% 18.87% Stalybridge 20.49% 28.19% 19.47% 20.86%

27 Authority’s Monitoring Report 2011/12
Tameside Metropolitan Borough Council
Conservation and the Environment
In Tameside, there are 317 Listings covering 428 individual buildings. Listed buildings are well distributed throughout the Borough. The exact location of which can be seen below and on the Councils interactive map at www.tameside.gov.uk

28 Authority’s Monitoring Report 2011/12
Tameside Metropolitan Borough Council
Conservation and the Environment Core and Local Output Indicators
Ref Indicator 2004/5 2005/6 2006/7 2007/8 2008/9 2009/10 2010/11 2011/12 Notes Core E1 Number of planning permissions granted contrary to the
advice of the Environment Agency on either flood defence grounds or water quality
None None None None None 2 None None
Core E2 UDP 14
Change in areas of biodiversity importance (sites of international, national, regional, sub-regional or local significance)
SACs/SPAs Net change in number
n/a n/a n/a 0 0 0 0 0
Net change in area
n/a n/a n/a 0 0 0 0 0
Total number n/a n/a n/a 1 1 1 1 1 Total area n/a n/a n/a 105.98 ha 105.98 ha 105.98 ha 105.98 ha 105.98 ha
SSSIs Net change in number
n/a n/a n/a 0 0 0 0 0
Net change in area
n/a n/a n/a 0 0 0 0 0
Total number n/a n/a n/a 3 3 3 3 3 Total area n/a n/a n/a 122.1 ha 122.1 ha 122.1 ha 122.14 ha 122.14 ha
SBIs Net change in number
0 +1 0 0 0 +1
-2 0
Net change in area
+4.8 ha +7.3 ha +216.6 ha +169.4 ha +20.03 ha -5.83 ha +3.00 ha +11.7 ha
Total number 54 55 55 55 55 56 54 54 Total area 996.4 ha 1003.7 ha 1220.3 ha 1389.7 ha 1409.73 ha 1403.9 ha 1406.9 ha 1418.6 ha
Core E3 Renewable energy capacity installed by type
None known None known 2 solar 1 wind None known None known 2 domestic solar pv installation.
1 domestic air source heat pump, 1 community air source heat pump, 5 public building/school solar pv, 1 commercial solar pv, 1 domestic solar pv.
13 applications for solar pv, 1 application for solar thermal
Capacity given planning permission, rather than installed. Many renewable energy generating technologies can now be installed without requiring planning approval.
UDP 12 Net change in protected green space
Area at start of period
1053 1052.3 1049.47 1049.47 1049.47 1049.47 1049.47 1049.47
Lost 0.66 ha 2.87 ha 0.00 ha 0.00 ha 0.00 ha 0.00 ha 0.00 ha 0.28 ha Gain 0.00 ha 0.00 ha 0.00 ha 0.00 ha 0.00 ha 0.00 ha 0.00 ha 0.00 ha Net change -0.66 ha -2.87 ha +/-0.00 ha +/-0.00 ha +/-0.00 ha +/-0.00 ha +/-0.00 ha -0.28 ha
UDP 13 Net change in buildings protected for heritage value and number of buildings at risk
Listed buildings at start of year 312 listings covering 423 buildings
312 listings covering 423 buildings
312 listings covering 423 buildings
312 listings covering 423 buildings
312 listings covering 423 buildings
313 listings covering 424 buildings
315 listings covering 427 buildings
315 listing covering 427 buildings
In 2011/12, buildings misattributed to Tameside have been rectified on the national register. This includes some long since demolished buildings. A comprehensive review of the buildings at risk register is proposed and will inform the buildings at risk data for the following year.
Change during year +/- 0 +/- 0 +/- 0 +/- 0 +1 +2 +/- 0 +2 Listed buildings at end of year 312 listings
covering 423 buildings
312 listings covering 423 buildings
312 listings covering 423 buildings
312 listings covering 423 buildings
313 listings covering 424 buildings
315 listings covering 427 buildings
315 listings covering 427 buildings
317 listings covering 428 buildings
Buildings at risk at start of year 72 71 71 71 See notes Change during year -1 0 0 -3 See notes Buildings at risk at end of year 71 71 71 68 See notes
UDP 15 Net change in protected trees and woodland
Trees +217 +125 +53 +122 n/a n/a n/a +4 Woodland +0.76 ha +13.2 ha +15.53 ha +5.9 ha n/a n/a n/a +/- 0
UDP 16 Net change in area of derelict land Net change -5.53 ha -4.46 ha -4.8 ha -4.9 ha -2.7 ha +28.57 ha No new data available
No new data available
The 2009/10 review includes all NLUD category C. Derelict land and buildings.
Year end total 88.4 ha 83.9 ha 79.1 ha 79.7 ha 77.0 ha 107.57 ha No new data available
No new data available
Table 6.1 Conservation and The Environment Core and Local Output Indicators
29 Authority’s Monitoring Report 2011/12
Tameside Metropolitan Borough Council
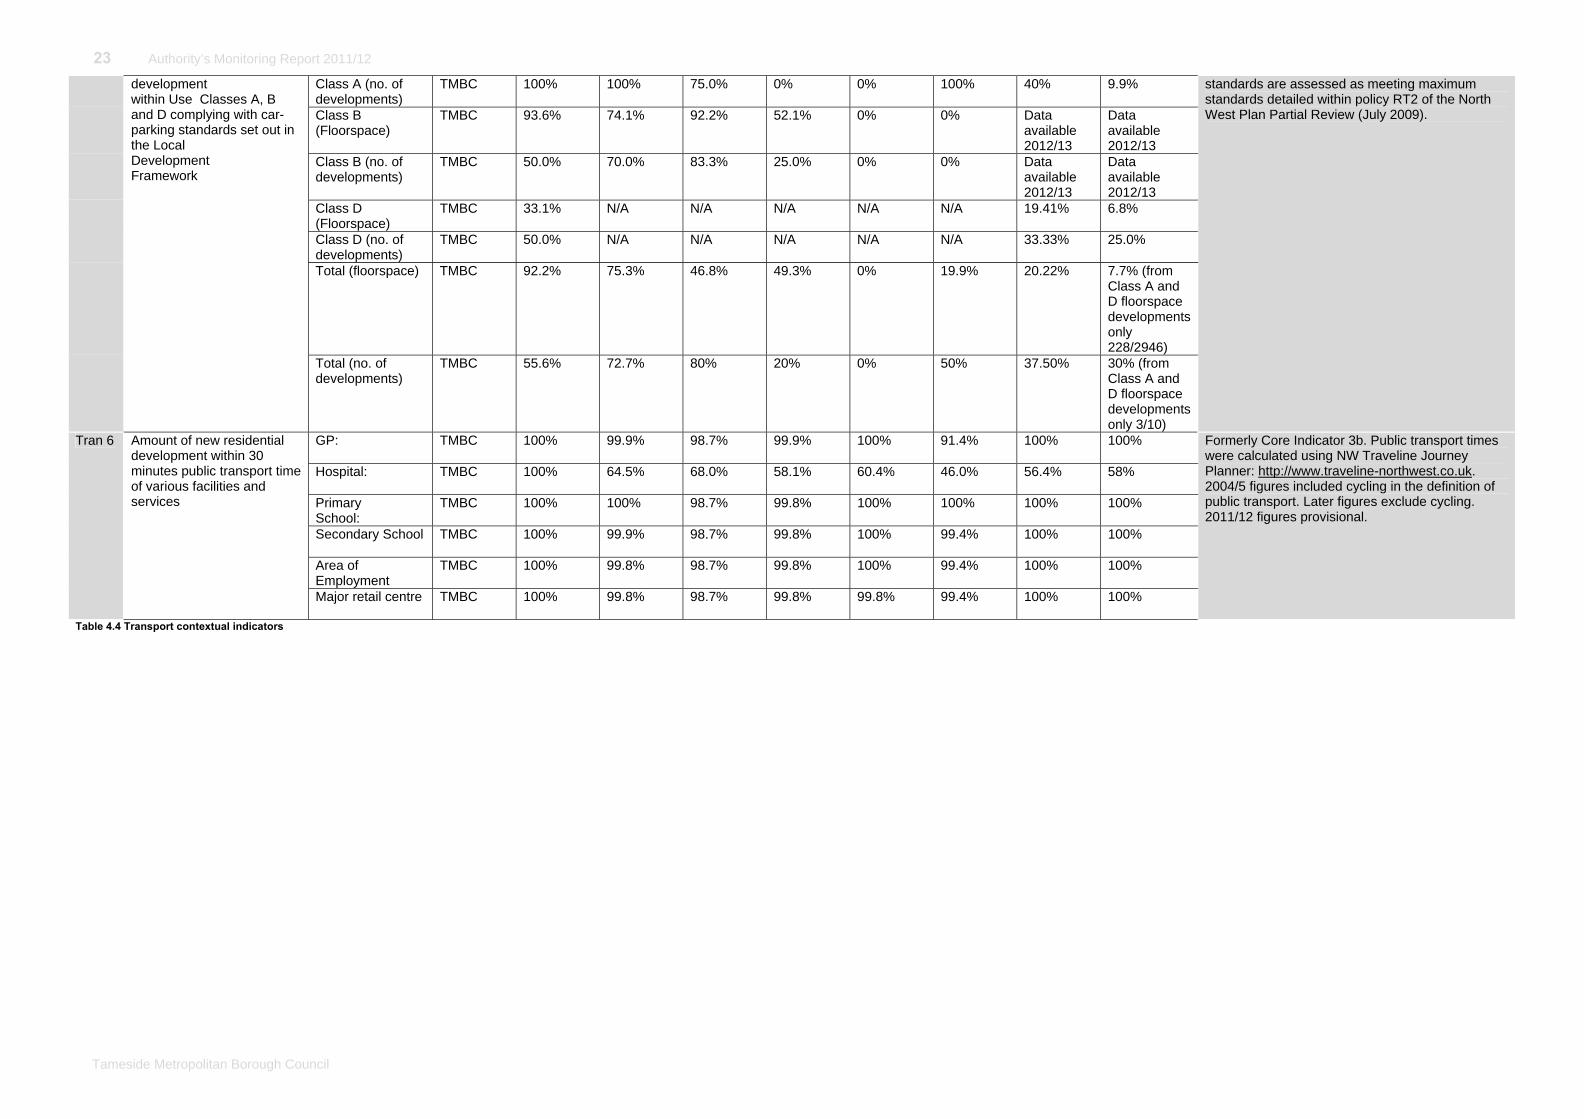
Conservation and the Environment Significant Effects Indicators
These significant effects indicators measure progress against sustainability appraisal objectives. For Details of these objectives please see Appendix A ‘Sustainability Appraisal Objectives’. Ref SA
Obj Indicator Source 2004/5 2005/6 2006/7 2007/8 2008/9 2009/10 2010/11 2011/12 Target Notes
SE 4.4 4 Proportion of land that has significant or heavy deposits of litter and/or detritus
Tameside Area Agreement AT1a and AT1b average, formally NI195
n/a 23% 8% 9% 8% 7% 2% 5.25% Reduce 2010/11 onward data based upon Tameside Area Agreement indicators AT1a and AT1b average.
SE 10.1
10 Net change in buildings protected for heritage value and number of buildings at risk
Tameside MBC See Core and Local Output Indicator UDP13
SE 12.1
12 Change in areas of biodiversity importance (sites of international, national, regional, sub-regional or local significance)
Greater Manchester Ecology Unit and Natural England See Core and Local Output Indicator E2
SE 12.2
12 Percentage of SSSI in favourable condition http://www.english-nature.org.uk /special/sssi/search.cfm
Natural England
All n/a n/a 50.97% 50.0% n/a 7.45% 24.90% 24.90% Increase 2004/5 to 2007/8 figure not directly comparable to current. 2009/10 onward refers to SSSI units only within Tameside rather than the whole SSSI.
Huddersfield Narrow Canal
n/a n/a 100% 100% Not available
0% 0% 0% (last assessed November 2010)
Increase
Hollinwood Branch Canal
n/a n/a 0% 0% Not available
0% 0% (last assessed 2007)
0% (last assessed July 2011)
Increase
Dark Peak n/a n/a 52.91% n/a Not available
22.34% 29.24% 28.77% (last assessed August 2011)
Increase
SE 15.1
15 Estimated water consumption (average household consumption)
Ofwat / United Utilities Water Resources Management Plan Annual Review
150 litres per person per day
140 litres per person per day
137 litres per person per day
135 litres per person per day
Data not available
134 litres per person per day
132 litres per person per day
Reduce United Utilities supply area.
SE 10.4
10 Percentage of land area covered by Conservation Areas
Tameside MBC 1.54% 1.54% 1.54% 1.54% 1.54% 1.54% 1.54% 1.54% Increase
SE 10.5
10 Number and percentage of conservation areas with published management proposals.
Tameside MBC 9, (0%) 9, (0%) 9, (0%) 9, (0%) 9, (0%) 9, (0%) 9, (0%) 9, (0%) Increase Management proposals expected to be 80-100% in 2011/12
SE 16.1
16 Number of planning permissions granted contrary to the advice of the Environment Agency on either flood defence grounds or water quality
Environment Agency
See Core and Local Output indicator E1
SE 16.2
16 Renewable energy capacity installed by type
Tameside MBC See Core and Local Output indicator E3
Table 6.2 Conservation and the Environment Significant Effects Indicators

30 Authority’s Monitoring Report 2011/12
Tameside Metropolitan Borough Council
Conservation and the Environment Contextual Indicators
Ref Indicator Source 2004/5 2005/6 2006/7 2007/8 2008/9 2009/10 2010/11 2011/12 Notes Env1 Percentage of
residents satisfied with local parks and open spaces
2004/5 ODPM Neighbourhood Renewal Unit 2005-2007 Citizens Panel Survey
67% (2003) 67% (Spring 2006)
82% (Spring 2007)
74% (Winter 2008)
81% (Winter 2009)
Data no longer available for reporting
2005/6 and 2006/7 data is not directly comparable to 2004/5 Data is no longer collected.
Env7 Number of Air Quality Management areas declared
Air Quality Management Plan
6 AQMAs around the M60 Ashton, A57/M67, A635, A57 Mottram and B6169 Audenshaw
Following a review there is 1 AQMA covering 1158.2 ha (11.2% of the borough)
1 AQMA covering 1158.2 ha (11.2% of the borough)
1 AQMA covering 1158.2 ha (11.2% of the borough)
1 AQMA covering 1158.2 ha (11.2% of the borough)
1 AQMA covering 1158.2 ha (11.2% of the borough)
1 AQMA covering 1158.2 ha (11.2% of the borough)
1 AQMA covering 1158.2 ha (11.2% of the borough)
No change in the AQMA area although a review in 2012 may result in a change in the 2012/13 figure.
Env9 Number of conservation areas and combined area in ha.
Tameside UDP Adopted 2004
9 (158.6 ha in total)
Likely to be small increase/decrease in 2011/12 figure as conservation area management appraisals suggest boundary changes.
Env10 Amount of eligible open spaces managed to green flag award standard
Total Open Space 1,488 ha 1,485 ha 1,485 ha 1,485 ha 1,485 ha 1,485 ha 1,485 ha 1,485ha Formerly recorded as Core Indicator 4C. Investment within Stamford Park and Mossley Park are likely to lead to increases within 2012/13.
Open Space with award (ha)
120 ha 120 ha 123.9 ha 144.33 ha 169.05 ha 179.51 ha 179.51 ha 179.51ha
% of open space with award
8.06% 8.08% 8.34% 9.72% 11.38% 12.09% 12.09% 12.09%
Table 6.3 Conservation and the Environment Contextual Indicators.

31 Authority’s Monitoring Report 2011/12
Tameside Metropolitan Borough Council
Minerals and Waste
There are two waste disposal authorities in Greater Manchester; they are Wigan MBC which manages waste produced within Wigan and Greater Manchester Waste Disposal Authority which manages the waste of the other 9 authorities in Greater Manchester. The Greater Manchester Municipal Waste Management Strategy, adopted in 2004 and updated in 2007 covers 9 of the 10 districts and sets out the framework for managing waste to 2030. To assist in delivering the strategy, the GM Waste Delivery Authority have signed a 25 year contract for waste and recycling with Viridor Laing. The contract includes a construction programme of waste recycling facilities over the next 5 years, of which the household recycling centre at Bayley Street, Stalybridge and Ash Road, Droylsden have been
constructed and are operational. The ten unitary authorities in Greater Manchester agreed to produce a Joint Waste Development Plan Document under the provisions of the Planning and Compulsory Purchase Act 2004. The Minerals and Waste Planning Unit are responsible for all aspects of plan production and consultation with assistance from the Greater Manchester authorities. The Waste Plan was submitted to the Secretary of State on 28th February 2011 for examination. Following this the Planning Inspectorate confirmed that the plan was sound and met all necessary legislative requirements. On the 21st February 2012 the Council approved the adoption of the plan which will be adopted by all Councils on the 1st April 2012. Outside of the monitoring year progress continues to be made on the Joint Minerals Development Plan Document. As above the Minerals and Waste Planning Unit are responsible for all aspects of plan production. The Minerals Plan Public Examination Hearing was held on 21st and 22nd February 2012. Due to modifications to the document it was re-consulted upon later in the year and reconvened hearing dates are set for November 2012.
Minerals and Waste Core and Local Output Indicators
Ref Indicator 2004/5 2005/6 2006/7 2007/8 2008/9 2009/10 2010/11 2011/12 Notes Core M1 Production of
primary land won aggregates
Combined figure for Greater Manchester, Merseyside, Halton and Warrington
1.9 million tonnes (2003)
1.6 million tonnes
1.94 million tonnes
1.4 million tonnes
1.14 million tonnes
No new data available
0.67million tonnes (2009)
0.51 million tonnes (2010)
The data is only available at the scale listed for confidentiality reasons.
Core M2 Production of secondary / recycled aggregates
Recycled aggregates combined figure for the Northwest region.
4.68 million tonnes (2003)
No data available
0.31 million tonnes
0.14 million tonnes
0.43 million tonnes (2008)
No new data available
0.14 million tonnes (2009)
0.14 million tonnes (2009)
The data is only available at the scale listed for confidentiality reasons.
Core W1 Capacity of new waste management facilities by type
Data unavailable Nil Nil Data unavailable Data unavailable See notes
2 household recycling centres. Planning application reference numbers 07/01127/FUL and 07/01099/FUL with capacities of 28,000 and 12,000 tonnes per annum.
Nil
Core W2 Amount of municipal waste arising and managed by management type, and the percentage each management type represents of the waste managed.
Total waste 103,232 102,226 103,870 104,915 96,212.61 73,634.79 72,998.74 72,637.09 Recycled 10,395 14,751 15,388 16,674 16,674 17,716.26 17,269.74 15,432.77 Composted 4,870 5,733 6,170 7,106.93 8,309.36 9,537.68 Incinerated 170 170 179 188.63 89.00 … … … landfill 98,667 87,305 83,433 82,318.50 73,489.37 66,032.26 61,301.73 57,878.58
Table 7.1 Minerals and Waste Core and Local Output Indicators
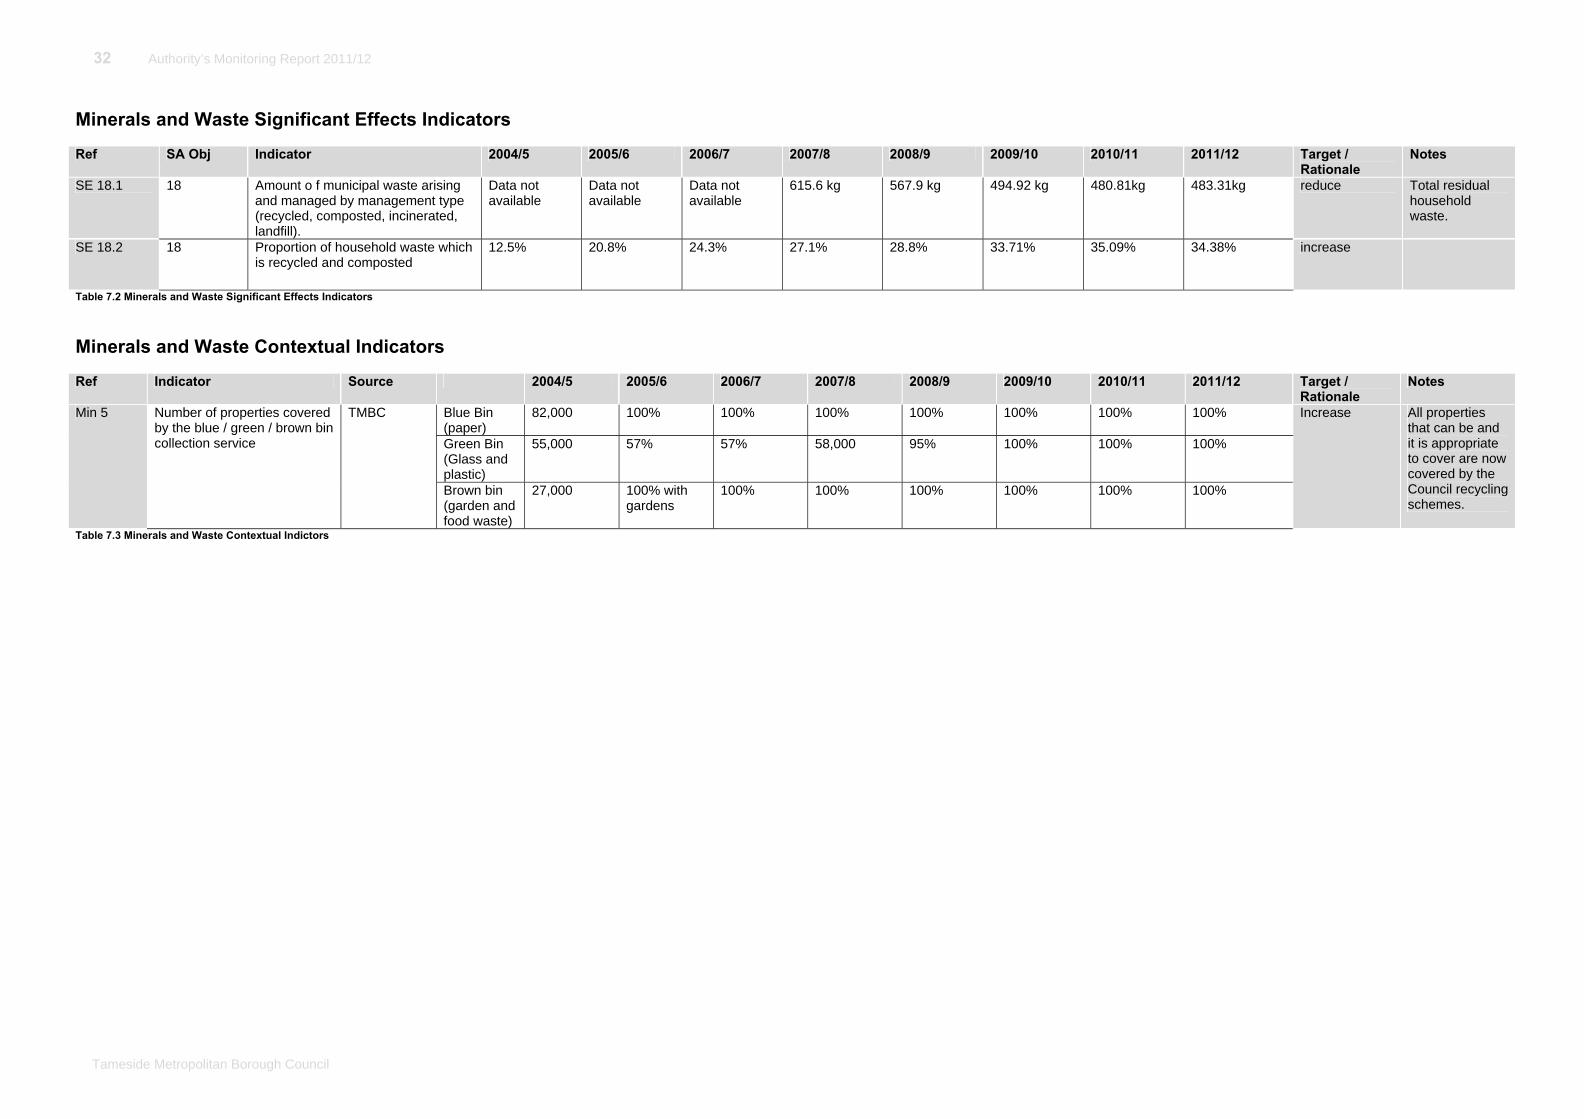
32 Authority’s Monitoring Report 2011/12
Tameside Metropolitan Borough Council
Minerals and Waste Significant Effects Indicators
Ref SA Obj Indicator 2004/5 2005/6 2006/7 2007/8 2008/9 2009/10 2010/11 2011/12 Target / Rationale
Notes
SE 18.1 18 Amount o f municipal waste arising and managed by management type (recycled, composted, incinerated, landfill).
Data not available
Data not available
Data not available
615.6 kg 567.9 kg 494.92 kg 480.81kg 483.31kg reduce Total residual household waste.
SE 18.2 18 Proportion of household waste which is recycled and composted
12.5% 20.8% 24.3% 27.1% 28.8% 33.71% 35.09% 34.38% increase
Table 7.2 Minerals and Waste Significant Effects Indicators
Minerals and Waste Contextual Indicators
Ref Indicator Source 2004/5 2005/6 2006/7 2007/8 2008/9 2009/10 2010/11 2011/12 Target / Rationale
Notes
Min 5 Number of properties covered by the blue / green / brown bin collection service
TMBC Blue Bin (paper)
82,000 100% 100% 100% 100% 100% 100% 100% Increase All properties that can be and it is appropriate to cover are now covered by the Council recycling schemes.
Green Bin (Glass and plastic)
55,000 57% 57%
58,000 95% 100% 100% 100%
Brown bin (garden and food waste)
27,000 100% with gardens
100% 100% 100% 100% 100% 100%
Table 7.3 Minerals and Waste Contextual Indictors

33 Authority’s Monitoring Report 2011/12
Tameside Metropolitan Borough Council
Local Development Scheme Monitoring
Local Development Scheme Monitoring
This section looks at Local Plan progress for the period January 2011 to March 2012. The current Local Development Scheme was updated and adopted by the Council May 2011. This version superseded Version 3 of the Local Development Scheme which was adopted in January 2010. The following section covers the main issues and changes required in the revised Local Development Scheme.
Development Plan Documents
Progress has been made on developing a comprehensive evidence base for the Local Plan and particularly the Core Strategy and Development Management Policies DPD (the ‘Core Strategy’). This focus has allowed the Council to progress through to currently working on the Preferred Options for the Core Strategy. The following is an account of the work that has been undertaken so far:
The updated Sustainability Appraisal has been produced by environmental consultants AMEC. The Sustainability Appraisal of the Core Strategy Issues and Options document was published for consultation between February and April 2012;
The Strategic Housing Land Availability Assessment was completed, approved and published April 2011. A call for sites will be carried out in 2012 and be used to inform an update of the SHLAA. The Affordable Housing Economic Viability Assessment was finalised in January 2010 following on from the Strategic Housing Market Assessment in 2008. Both of these pieces of work will be updated through the Council’s Interim Housing Position Statement which will be completed in 2012;
The Level 2 Strategic Flood Risk Assessment from Scott Wilson has been completed; The Recreation Needs and Demand Study being prepared by Knight, Kavannah and Page was completed August 2010; The Retail Study update by White Young Green was completed in May 2010; The Infrastructure Study has been received in draft and will be published in 2012. A follow on Tameside Infrastructure Delivery Plan will be produced as evidence to support the Local Plan and the Community
Infrastructure Levy; and The Conservation Area Appraisals are being progressed, eight of which have gone through public consultation.
The Council now intends to produce the following Development Plan Documents within the timeframe of the Local Development Scheme which. This new project plan reflects the new milestones contained in The Town and Country Planning (Local Development) Regulations 2012 amendments that now accompany the Planning and Compulsory Purchase Act 2004.
The Core Strategy and Development Management Policies Development Plan Document
There should be few obstacles to the production of this document now a comprehensive evidence base is largely assembled. Milestones for the production of this document have been missed which has necessitated the drafting of a replacement Local Development Scheme. It is expected that the Core Strategy will now be adopted in early 2014 and not May 2013 as currently stated in the May 2011 LDS. The document will contain the key spatial policies and proposals of the Local Plan for Tameside. It will comprise of a spatial vision and strategic objectives for the Borough, a locally distinctive place shaping strategy, a project plan for achieving the strategy and a monitoring framework. Underlying development management policies will also be developed. The timescales are outlined in the project plan at Table 8.1 which summarises the progress with each element of the Local Plan.
Site Allocations Development Plan Document
This Development Plan Document will closely follow the Core Strategy with the intention of identifying sites for certain types of development. This Development Plan Document will establish the principles of proposed uses on the allocated sites and is programmed to follow on 18 months after the production stages of the Core Strategy which means the Development Plan Document could have passed through all production stages and adoption could be achieved 2016. This is a revision to the date in the May 2011 LDS because of delays in producing the Core Strategy.
The Proposals Map Development Plan Document
When the Council adopts its first Development Plan Document it will update the adopted Proposals Map (Tameside Unitary Development Plan, November 2004) to cover amendments and additions arising from adopted Development Plan Documents. The Proposals Map covers the whole borough and is a geographical representation of all policy designations and proposals. This is updated and re-adopted at the same time as each new Development Plan Document is adopted.
Greater Manchester Joint Waste Development Plan Document
The Greater Manchester Joint Waste Development Plan Document will be adopted by the ten Greater Manchester authorities 1 April 2012. The document will replace a number of the 2004 UDP policies, the remaining UDP policies relevant to waste will be replaced by the Core Strategy and Development Management Policies DPD.

34 Authority’s Monitoring Report 2011/12
Tameside Metropolitan Borough Council
Greater Manchester Joint Minerals Development Plan Document
The Joint Minerals Development Plan Document (JMDPD) will become Greater Manchester’s jointly preferred approach to minerals planning. The JMDPD aims to identify mineral resources to enable the development of a framework to secure the winning of the minerals required to meet the regional performance expected of us and to meet the needs of strategic planning in Greater Manchester. At this stage the Examination in Public into the JMDPD has been adjourned to allow for additional discussion and consultation into a number of proposed main modifications. The consultation is likely to happen between August and September 2012. It is expected that the completion through to adoption of the JMDPD will take place within the timeframe set out in the proposed revised LDS. If this is not the case then amendments will be made, as required, to the LDS in a further revision. In order to provide planning policy coverage during the plan preparation period, relevant policies in the Unitary Development Plan have been saved until replaced.
Supplementary Planning Documents
These documents provide detailed advice on specific issues or individual sites to clarify development plan policies. They have not introduced new policy; rather they clarify how policy will be applied or offer advice on best practice. However, because they are duly made, where relevant, they must be taken into account in the determination of planning applications. They are subject to participation and are formally adopted documents (Reg 19 of the 2004 Regulations) but they are not subject to examination in public because they do not introduce substantive policy. The following Supplementary Planning Documents have been duly made and adopted. These are:
Sustainable Design & Construction Guide – adopted October 2005 Brookbottom Development Brief, Mossley – adopted July 2005 A Guide to Developer Contributions – adopted November 2006 Trees, Landscaping and Development – adopted March 2007 Employment Land Supplementary Planning Document – adopted January 2009 Ashton Town Centre Strategy Supplementary Planning Document – adopted January 2010 Residential Design Supplementary Planning Document – adopted March 2010
See the Strategic Planning website at www.tameside.gov.uk/strategicplanning The following Supplementary Planning Documents are proposed. These are:
Stalybridge Town Centre Strategy Hyde Town Centre Strategy Historic Environment
Statement of Community Involvement
This sets out how the Council will engage stakeholders and the community in the preparation of planning documents. The current adopted document (July 2006) is still operative. It sets out how consultation on the production of new planning policies and planning applications will be undertaken. See www.tameside.gov.uk/strategicplanning.
Unitary Development Plan - Saved Policies
The Tameside Replacement Unitary Development Plan (UDP) was adopted by the Council in November 2004 and was up to date and in conformity with the Regional Spatial Strategy (Regional Planning Guidance for the North West) at that time. Unitary Development Plan Part 1 Policies and generic development control policies in Part 2 will be replaced by the Core Strategy and Development Management Policies DPD by 2014 which, in turn, will be in conformity with regional and national policy. The Unitary Development Plan policies, plans and guidance material were produced under the former development plans system enabled by the 1991 Planning Act. These have been saved for the moment until such time as they are in part or wholly replaced by the new documents of the Local Plan. The Council’s web site contains the details of the direction which was issued by the Secretary of State on 18th September 2007 which enabled this. See www.tameside.gov.uk/udp/direction The saved policies are outlined in the Local Development Scheme (May 2011). Some site specific policies will remain until the adoption of the Site Allocation DPD where appropriate to do so. In particular, housing and employment sites will necessitate site allocations and site specific policies to guide development. Appendix D details each saved policy and indentifies how the Council intends to replace them.

35 Authority’s Monitoring Report 2011/12
Tameside Metropolitan Borough Council
Regional Planning Context
The second Regional Spatial Strategy for North West England was published by the Secretary of State for Communities and Local Government in 2008. It was prepared by the North West Regional Assembly, as the Regional Planning Body, and was subject to consultation between March and June 2006. The report of the Panel who conducted the Examination in Public between October 2006 and February 2007 preceded a final Regional Spatial Strategy which was adopted in September 2008. This document replaced all previous versions of the strategy. This document was added to by a partial review which dealt with Gypsies and Travellers pitch provision and regional car parking standards and a new Single Regional Strategy for the Northwest (RS2010) was also under preparation. It is the Government's policy to revoke existing regional strategies outside London. At this stage the process to revoke the regional strategies is ongoing. The Department for Communities and Local Government is currently updating the environmental reports and undertaking additional consultation. The updated environmental reports will be published and include consideration of all responses submitted during the first period October 2011 to January 2012. The Government is clear that the proposed revocation of the regional strategies may be regarded as a material consideration by decision makers when determining planning applications and appeals. Local Plan documents must be in general conformity with the regional strategy until revocation. The government position is that local authorities can bring forward proposals with a local interpretation as long as they are based on sound evidence and justified by local circumstance. A final date for revocation of the North West of England Plan has yet to come forward.
Review of the Local Plan
The Local Plan will need to be continually reviewed and revised. The Authority Monitoring Report will be the primary mechanism for identifying the need for revised or additional local development documents, although ad-hoc monitoring may also indicate the need for changes. Revisions will have to be programmed in the Local Development Scheme and agreed through the Council before it can be re-published.
Local Development Documents Milestone Details Document Type LDS
Date Started LDS
Date Actual Date
LDS Date Actual Date
LDS Date
Actual Date
LDS Date
Actual Date
LDS Date
Actual Date
LDS Date
Actual Date
Estimate Actual Date
LDS Date
Actual Date
Core Strategy for Tameside
DPD Jan-10 � N/A Dec-09 – May-11
May-11 – Oct-11
Feb - Apr 2012
Mar-12 Sep-12
Jan-13 Feb-13 Apr-13 May-13
Current Status: Preferred Options Production Site Allocations Development Plan Document
DPD Jan-13 Feb- May 2013
May - Nov 2013
Apr-14 Oct-14 Feb-15
Mar-15 May-15 Jun-15
Current Status: Not yet commenced Greater Manchester Joint Waste DPD
DPD Sep-06 � Sep-06 Sep-06 Dec-09 Sep 2006 - Jan 2010
Nov-10 Nov-10 Feb-11
Feb-11 Apr-11 Apr-11 Jun-11 Jun-11 Oct-11 Nov-11 Jan-12 Apr-12 (tbc)
Current Status: Adopted Greater Manchester Joint Minerals DPD
DPD Oct-09 � Nov - Dec 2009
Oct-09 Nov 2009 - Nov 2010
Nov 2009 - Nov 2010
July - Aug 2011
Nov 2010 - Sept 2011
Dec-11
Nov-11 Feb-12
Dec-11 Apr-12 Feb-12 Aug-12 Oct-12
Current Status: Examination in Public adjourned Table 8.1 Tameside Local Plan – Local Development Scheme Monitoring, Development Plan Documents Document Type LDS Date Started LDS Date Actual Date LDS Date Actual Date LDS Date Actual Date LDS Date Actual Date Brookbottom Development Brief
SPD Aug-Oct 2004 � N/A Nov-04 Nov-Dec 2004 Nov-04 Mar-05 Mar-05 Jul-05 Jul-05
Current Status: Adopted Residential Guidelines and Extensions
SPD Sept-Dec 2004 � N/A Feb-04 Jan-Feb 2005 Feb-05 May-05 May-05 Aug-05 Aug-05

36 Authority’s Monitoring Report 2011/12
Tameside Metropolitan Borough Council
Current Status: Adopted Sustainable Design and Construction Guide
SPD Completed 2003 � N/A N/A Completed 2003 � Jan-05 Jan-05 Oct-05 Oct-05
Current Status: Adopted Trees, Landscape and Development
SPD Feb-April 2005 � N/A Aug-06 May-Jun 2005 Oct-05 Nov-06 Feb-06 Mar-07
Current Status: Adopted Guide to Developer Contributions
SPD Mar-July 2005 � N/A Aug-Sept 2005 Sep-05 Jul-06 Oct-06 Nov-06
Current Status: Adopted Employment Land SPD SPD Jan-Apr 2007 � N/A Sep-07 � Jul-07 Mar-07 Jan-09
Current Status: Adopted Ashton Town Centre Strategy SPD
SPD Apr-Dec 2006 � N/A Early 2007 � Jun-07 Sept-Oct 2009 N/A Jan-10
Current Status: Adopted Amended Residential Development Guidelines SPD
SPD Started N/A Started � Feb-10 Dec-09 to Jan-10
Mar-10 Mar-10
Current Status: Adopted Hyde Town Centre Strategy SPD
SPD Jan-11 � N/A Jan-Mar 2011 � Aug-11 May-Jun 2011 Oct-11
Current Status: Ongoing Stalybridge Town Centre Strategy SPD
SPD Feb-11 � N/A Mar-Jul 2011 Nov-11 Feb-12
Current Status: Ongoing Historic Environment SPD Jan-10 � N/A Jan-Jun 2010 Aug-10 Nov-10
Current Status: Ongoing Table 8.2 Tameside Local Plan – Local Development Scheme Monitoring, Supplementary Planning Documents

37 Authority’s Monitoring Report 2011/12
Tameside Metropolitan Borough Council
Sustainability Appraisal Objectives
Objective Number Description 1 To improve access to good quality, affordable and resource efficient housing 2 To enable people to enjoy long life, free from disease and limiting illness 3 To develop strong and positive relationships between people from different backgrounds and communities 4 To deliver urban renaissance 5 To regenerate rural areas 6 To improve access to and use of basic goods, services and amenities 7 To reduce crime, disorder and the fear of crime 8 To enable groups and communities to contribute to decision making 9 To provide education which is accessible to all and valued by all and produces achievements above the norm 10 To protect places and enhance, landscapes and buildings of historic, cultural and archaeological value 11 To protext and improve local environmental quality 12 To protect and enhance biodiversity 13 To protect and improve the quality of controlled waters 14 To protect and improve land quality 15 To ensure the prudent use of natural resources and the sustainable management of existing resources 16 To address the need to limit and adapt to climate change 17 To reduce the need to travel 18 To ensure the sustainable management of waste, minimise its production, and increase re-se, recycling and recovery rates. 19 To establish a prosperous Borough that offers attractive opportunities to individuals, businesses and communities 20 To exploit the growth potential of business sectors 21 To secure economic inclusion 22 To develop and maintain a healthy labour market 23 To develop strategic transport, communication and economic infrastructure

38 Authority’s Monitoring Report 2011/12
Tameside Metropolitan Borough Council
List of Indicators
Local Development Framework Core Output Indicators
Ref Indicator Core BD1(i) Total amount of gross additional employment floorspace by type Core BD1(ii) Total amount of net additional employment floorspace by type Core BD2 Total amount of employment floorspace on previously developed land by type Core BD3 Employment land available, by type Core BD4(i) Total amount of floorspace for town centre uses within town centres Core BD4(ii) Total amount of floorspace for town centre uses within the local authority area Core H1 Plan period housing targets Core H2(a) Net additional dwellings – in previous year Core H2(b) Net additional dwellings – for the reporting year Core H2(c)(i) Net additional dwellings – in future years Core H2(c)(ii) Estimated gross area (ha) of gross completions Core H2(c)(iii) Target for annual average rate of housing provision (net of clearance) Core H2(d) Managed delivery target Core H3 New and converted dwellings on previously developed land Core H4 Net additional pitches (Gypsy and Traveller) Core H5 Gross affordable housing completions Core H6 Housing quality – Building for Life assessments Core E1 Number of planning permissions granted contrary to Environment Agency advice on flooding and water quality grounds Core E2 Change in areas of biodiversity importance Core E3 Renewable energy generation Core M1 Production of primary land won aggregates by mineral planning authority Core M2 Production of secondary and recycled aggregates by mineral planning authority Core W1 Capacity of new waste management facilities by waste planning authority Core W2 Amount of municipal waste arising, and managed by management type by waste planning authority
Tameside Unitary Development Plan Output Indicators
Ref Indicator UDP 1 Area of land developed for employment purposes, and floorspace provided UDP 2 Remaining supply of land for employment development UDP 3 Area of land previously used for employment which was developed for other uses UDP 4 Total number of new dwellings completed UDP 5 Number of dwellings completed on windfall sites UDP 6 Number and proportion of dwellings completed on brownfield sites and through conversions UDP 7 Number of social or affordable dwellings completed UDP 8 Number of dwellings cleared, including tenure and occupancy UDP 9 Remaining supply of land for housing development UDP 10 Number of commercial premises in each town centre and vacancy ratio UDP 11 New retail and leisure floorspace completed in-centre, edge-of-centre and out-of-centre UDP 12 Net change in protected green space UDP 13 Net change in buildings protected for heritage value and in number of buildings at risk UDP 14 Net change in sites protected for nature conservation value UDP 15 Net change in protected trees and woodland UDP 16 Net change in area of derelict land

39 Authority’s Monitoring Report 2011/12
Tameside Metropolitan Borough Council
Significant Effects Indicators
Ref SA Objective Indicator SE 1.1 1 Increase in affordable housing SE 1.2 1 Housing quality – building for life assessment SE 1.3 1 Number of BREEAM buildings SE 1.4 1 % of Empty Dwellings SE 1.5 1 Percentage of homes unfit for use SE 1.6 1 Energy efficiency SAP rating for social housing SE 1.7 1 Net additional pitches – Gypsy and Travellers SE 2.1 2 Life expectancy at birth SE 2.2 2 % of population living in SOA’s ranked by IMD most deprived due to health factors SE 3.1 3 % of residents who think their local area is a place where people from different backgrounds get on well together. SE 3.2 3 % of residents satisfied with their area as a place to live SE 4.1 4 Population levels SE 4.2 4 % of population living in SOAs ranked by IMD in the 33% most deprived due to all factors SE 4.3 4 Satisfaction with the Borough as a place to live SE 4.4 4 Proportion of land that has significant or heavy deposits of litter and/or detritus SE 5.1 5 The number of rural buildings brought back into business use SE 6.1 6 Distance travelled to work – resident population SE 6.2 6 % of population living in SOAs ranked by IMS in the 33% most deprived due to access SE 7.1 7 % change in recorded levels of crime for the seven key offences identified in the British Crime Survey SE 7.2 7 Recorded Crime per 1,000 population SE 7.3 7 Proportion of adults who feel safe in their neighbourhood during the day and night SE 8.1 8 Percentage of residents who think that the council listens to residents views SE 9.1 9 % of pupils obtaining 5 or more GCSE’s at grades A*-C SE 9.2 9 Qualifications of working age population SE 9.3 9 Number of Tameside residents entering higher education SE 9.4 9 School leavers in education, employment or training SE 10.1 10 Number of listed buildings and number of listed buildings at risk SE 10.2 10 Number of scheduled ancient monuments, individual records on the sites and monuments register and registered historic parks and gardens SE 10.3 10 Significant archaeological sites recorded and lost due to development SE 10.4 10 % of land area covered by conservation areas SE 10.5 10 Number and % of conservation areas with published management proposals SE 10.6 10 Number of visits to and useage of museums per 1000 population SE 11.1 11 % of residents satisfied with the cleanliness of the area SE 12.1 12 Change in areas of biodiversity importance (sites of international, national, regional, sub-regional or local significance) SE 12.2 12 Percentage of SSSI in favourable condition SE 12.3 12 Number of planning applications which incorporate features of biodiversity gain. SE 13.1 13 Number of developments with sustainable urban drainage system SE 14.1 14 % of employment development on previously developed land SE 14.2 14 % of housing development on previously developed land SE 14.3 14 Extent of brownfield and potentially contaminated land within the Borough SE 15.1 15 Estimated water consumption (average household water consumption (l/head/day) SE 16.1 16 Number of planning applications granted contrary to the advice of the Environment Agency on either flood defence grounds or water quality SE 16.2 16 Renewable energy capacity installed by type SE 17.1 17 Amount of new residential development within 30 minutes public transport time to GP’s, Hospital, Primary School, Secondary School, Area of Employment and Major Retail Centre SE 18.1 18 Amount of municipal waste arising and managed by management type (recycled, composted, incinerated, landfill) SE 18.2 18 Proportion of household waste which is recycled and composted SE 19.1 19 Average weekly income for residents within the borough SE 20.1 20 Births, deaths and count of active businesses during the year SE 21.1 21 Economic activity rates as a percentage of working age population SE 22.2 22 % of occupations by different category SE 23.1 23 Travel to work by different modes ( e.g. bus, train, car) SE 23.2 23 Distance to work or sporting facilities and methods of travel used SE 23.3 23 Car ownership - % of households owning on or more car/van

40 Authority’s Monitoring Report 2011/12
Tameside Metropolitan Borough Council
Contextual Indicators
Ref Indicator Econ 1 Working age resident population Econ 2 Economically active population Econ 3 Percentage unemployment gap between the average top three highest and bottom three lowest wards in the borough Econ 4 Household income level Econ 6 Gross weekly pay for full time workers Econ 7 Employment by occupation Econ 8 Jobs density (ratio of total jobs to working age population) Econ 9 Average house price Econ 10 Proportion of all employment in manufacturing Econ 11 Percentage of all business that employ 10 people or less Econ 12 Losses of employment land in local authority area Econ 13 Amount of employment land lost to residential development Pop 1 Total resident population Pop 2 Population density Pop 3 Number of households Pop 4 Dwelling stock Pop 7 Average household size Pop 9 Number of unfit homes in social housing Pop 10 Proportion of social housing not meeting the decent homes standard Pop 12 Percentage of dwellings empty Pop 13 Indices of multiple deprivation Tran 1 Percentage of people travelling to work by public transport Tran 2 Percentage of public transport users owning a car or van Tran 3 Percentage of people travelling less than 10km to work Tran 4 Number of people killed and seriously injured on the road Tran 5 Amount of completed non-residential development within use classes A, B, and D complying with car parking standards set out in the Local Development Framework Tran 6 Amount of new residential development within 30 minutes of public transport time to various facilities and services Env 1 Satisfaction with the borough as a place to live NEED TO CHANGE THIS TO MIRROR THE ABOVE LOCAL PARKS AND OPEN SPACES Env 7 Number of air quality management areas declared Env 9 Number of conservation areas and combined area in hectares Env 10 Amount of eligible open spaces managed to green flag award standards Min 5 Number of properties covered by the blue / green / brown bin services

41 Authority’s Monitoring Report 2011/12
Tameside Metropolitan Borough Council
Duty to Co-operate
The Localism Act was given Royal Assent on the 15 November 2011, the five key measures from which are aimed at transferring power from central government into the hands of local government and communities. One such measure is in relation to producing local plans. When producing Local Plans there are now several additional elements which change the way things are now done. The Governments stated aim in introducing these changes is “to make the planning system clearer, more democratic, and more effective”. One such element is the Duty to Cooperate. The Duty to Cooperate, introduced under the Localism Act, is to ensure that neighbouring authorities work together on planning issues that necessitate a collaborative approach. In effect the Duty replaces regional planning, which the Government intends to revoke, with a duty to have regard. The onus is therefore placed upon each authority to where they see fit implement a more localised
form of regional planning. In Greater Manchester this approach has already been followed since 1986 through the joint work of the Association of Greater Manchester Authorities. This has seen a Joint Waste Plan produced for Greater Manchester and Joint Minerals Plan nearing completion. Tameside therefore readily engages with neighbouring authorities and retains documentary evidence compiled for the purposes of providing evidence of this. The Duty to Cooperate requirements are outlined within the National Planning Policy Framework (NPPF) paragraph 178. Matters considered to be strategic priorities which require strategic policies and cooperation are:
The homes and jobs needed in the area;
The provision of retail leisure and other commercial development;
The provision of infrastructure for transport, telecommunications, waste management, water supply, wastewater, flood risk and costal change management, and the provision of minerals and energy (including heat);
The provision of heat, security, community and cultural infrastructure and other local facilities; and
Climate change mitigation and adaptation, conservation and enhancement of the natural and historic environment, including landscape.
Bodies to which the above applies as prescribed within the Town and Country Planning (Local Planning) (England) Regulations 2012 and with which Tameside engage in addition to neighbouring authorities are the:
Environment Agency
Historic Buildings and Monuments Commission for England (English Heritage)
Natural England
Civil Aviation Authority
Homes and Communities Agency
Primary Care Trust
Office of Rail Regulation
Transport For Greater Manchester
Highways Authority
Marine Management Organisation
In addition regard is also had to the aims and objectives of the Local Enterprise Partnership and the Local Nature Partnership.

42 Authority’s Monitoring Report 2011/12
Tameside Metropolitan Borough Council
Saved Policies
PART ONE POLICIES: Policy will be superseded by policy contained in the following Development Plan Documents. 1.1 Capturing Quality Jobs for Tameside People Core Strategy & Development Management DPD 1.2 Maintaining an Integrated Transportation Strategy Core Strategy & Development Management DPD 1.3 Creating a Cleaner and Greener Environment Core Strategy & Development Management DPD 1.4 Providing More Choice and Quality of Homes Core Strategy & Development Management DPD 1.5 Following the Principles of Sustainable Development Core Strategy & Development Management DPD 1.6 Securing Urban Regeneration Core Strategy & Development Management DPD 1.7 Supporting the role of town centres Core Strategy & Development Management DPD 1.8 Retaining and Improving Opportunities for Sport, Recreation and Leisure Core Strategy & Development Management DPD 1.9 Maintaining Local Access to Employment and Services Core Strategy & Development Management DPD 1.10 Protecting and Enhancing the Natural Environment Core Strategy & Development Management DPD 1.11 Conserving Built Heritage and Retaining Local Identity Core Strategy & Development Management DPD 1.12 Ensuring and Accessible, Safe and Healthy Environment Core Strategy & Development Management DPD 1.13 Meeting Obligations on Minerals, Waste and Energy Core Strategy & Development Management DPD PART TWO POLICIES: E1 Regional Investment Site / Strategic Regional Site Core Strategy & Development Management DPD & Site Allocations DPD E2 Development Opportunity Areas Core Strategy & Development Management DPD & Site Allocations DPD E3 Established Employment Areas Core Strategy & Development Management DPD & Site Allocations DPD E5 Local Employment Opportunities and Mixed Uses Core Strategy & Development Management DPD & Site Allocations DPD E6 Detailed Design of Employment Developments Core Strategy & Development Management DPD & Site Allocations DPD E7 Local Access to New Employment Core Strategy & Development Management DPD & Site Allocations DPD H1 Housing Land Provision Core Strategy & Development Management DPD & Site Allocations DPD H2 Unallocated Sites Core Strategy & Development Management DPD & Site Allocations DPD H4 Type, Size and Affordability of Dwellings Core Strategy & Development Management DPD & Site Allocations DPD H5 Open Space Provision Core Strategy & Development Management DPD & Site Allocations DPD H6 Education and Community Facilities Core Strategy & Development Management DPD & Site Allocations DPD H7 Mixed Use and Density Core Strategy & Development Management DPD & Site Allocations DPD H8 Gypsies, Travellers and Showmen Core Strategy & Development Management DPD & Site Allocations DPD H9 Backland and Garden Development Core Strategy & Development Management DPD & Site Allocations DPD H10 Detailed Design of Housing Developments Core Strategy & Development Management DPD & Site Allocations DPD S1 Town Centre Improvement Core Strategy & Development Management DPD & Site Allocations DPD S2 New Retail Developments in Town Centres Core Strategy & Development Management DPD & Site Allocations DPD S3 New Retail Developments outside Town Centres Core Strategy & Development Management DPD & Site Allocations DPD S4 Retail Dominance and Shopping Frontages Core Strategy & Development Management DPD & Site Allocations DPD S5 Changes of Use in Local Shopping Centres Core Strategy & Development Management DPD & Site Allocations DPD S6 New Local Shopping Developments Core Strategy & Development Management DPD & Site Allocations DPD S7 Food and Drink Establishments and Amusement Centres Core Strategy & Development Management DPD & Site Allocations DPD S8 Built Recreation, Leisure and Tourism Developments Core Strategy & Development Management DPD & Site Allocations DPD S9 Detailed Design of Retail and Leisure Developments Core Strategy & Development Management DPD & Site Allocations DPD S10 Existing Out-of-Centre Retail Parks and Stores Core Strategy & Development Management DPD & Site Allocations DPD OL1 Protection of the Green Belt Core Strategy & Development Management DPD & Site Allocations DPD OL2 Existing Buildings in the Green Belt Core Strategy & Development Management DPD & Site Allocations DPD OL3 Major Developed Sites in the Green Belt Core Strategy & Development Management DPD & Site Allocations DPD OL4 Protected Green Space Core Strategy & Development Management DPD & Site Allocations DPD OL6 Outdoor Sport, Recreation and Play Space Developments Core Strategy & Development Management DPD & Site Allocations DPD OL7 Potential of Water Areas Core Strategy & Development Management DPD & Site Allocations DPD OL8 Informal Recreation and Countryside Access Core Strategy & Development Management DPD & Site Allocations DPD OL9 Derelict Land Reclamation Core Strategy & Development Management DPD & Site Allocations DPD OL10 Landscape Quality and Character Core Strategy & Development Management DPD & Site Allocations DPD OL11 Support for Agriculture Core Strategy & Development Management DPD & Site Allocations DPD
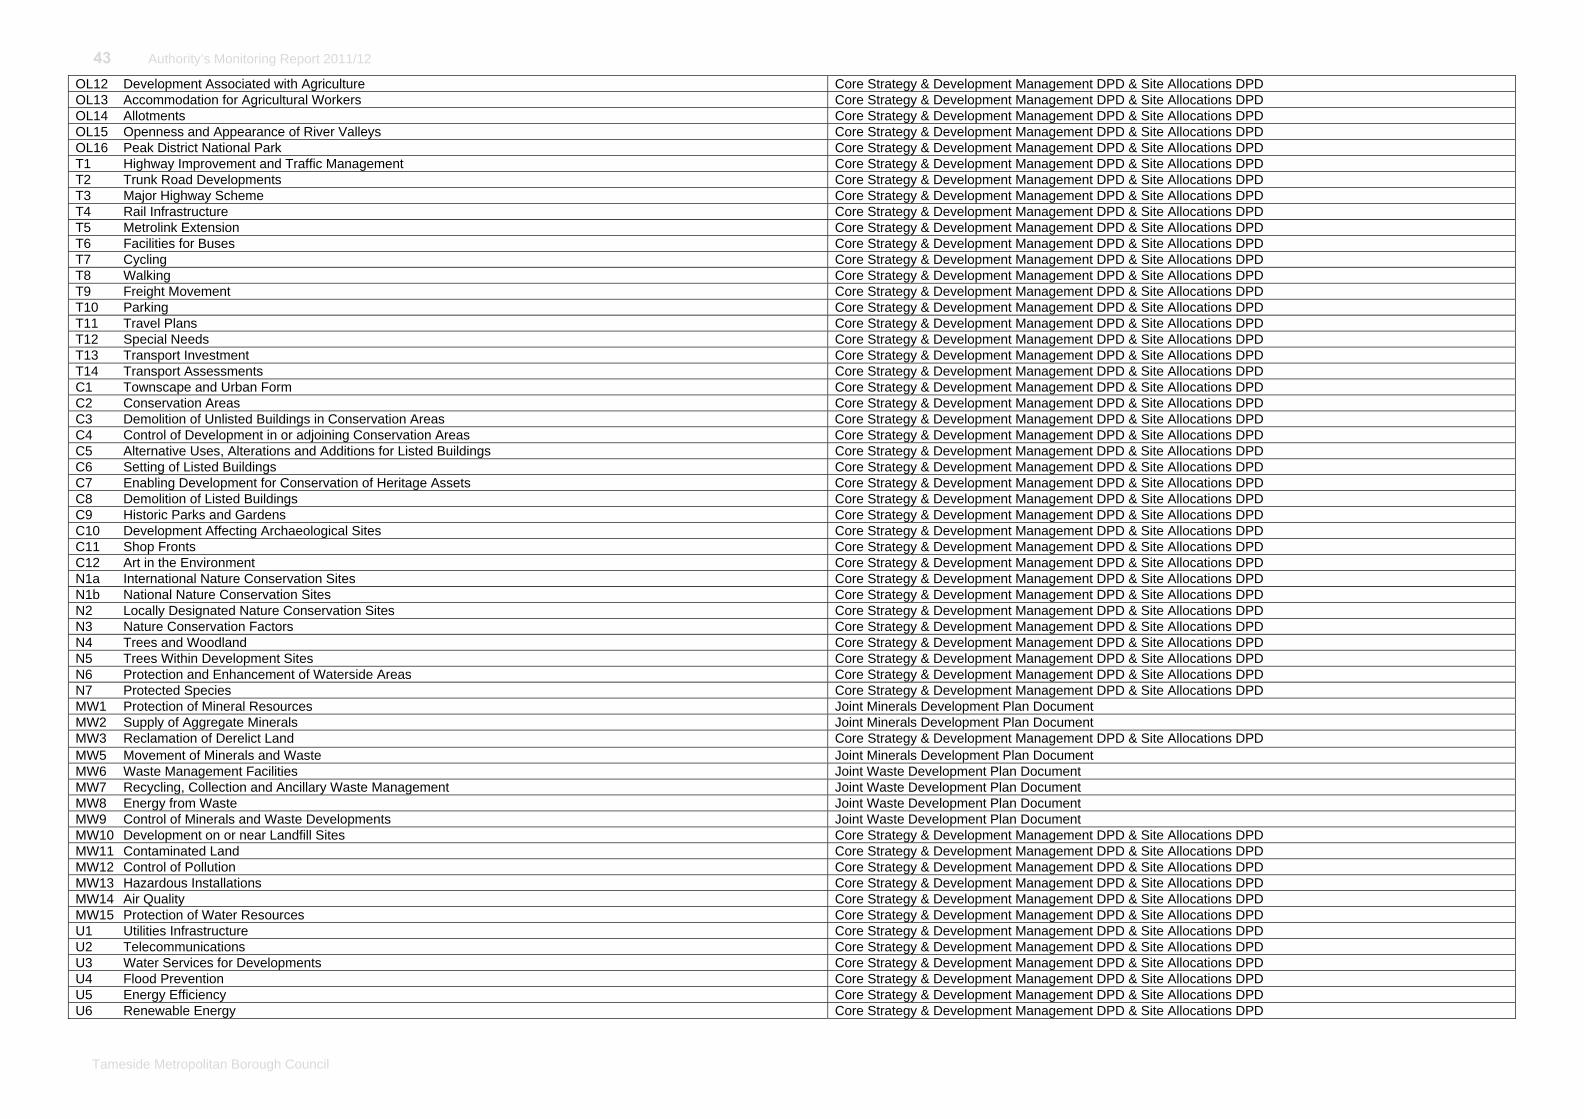
43 Authority’s Monitoring Report 2011/12
Tameside Metropolitan Borough Council
OL12 Development Associated with Agriculture Core Strategy & Development Management DPD & Site Allocations DPD OL13 Accommodation for Agricultural Workers Core Strategy & Development Management DPD & Site Allocations DPD OL14 Allotments Core Strategy & Development Management DPD & Site Allocations DPD OL15 Openness and Appearance of River Valleys Core Strategy & Development Management DPD & Site Allocations DPD OL16 Peak District National Park Core Strategy & Development Management DPD & Site Allocations DPD T1 Highway Improvement and Traffic Management Core Strategy & Development Management DPD & Site Allocations DPD T2 Trunk Road Developments Core Strategy & Development Management DPD & Site Allocations DPD T3 Major Highway Scheme Core Strategy & Development Management DPD & Site Allocations DPD T4 Rail Infrastructure Core Strategy & Development Management DPD & Site Allocations DPD T5 Metrolink Extension Core Strategy & Development Management DPD & Site Allocations DPD T6 Facilities for Buses Core Strategy & Development Management DPD & Site Allocations DPD T7 Cycling Core Strategy & Development Management DPD & Site Allocations DPD T8 Walking Core Strategy & Development Management DPD & Site Allocations DPD T9 Freight Movement Core Strategy & Development Management DPD & Site Allocations DPD T10 Parking Core Strategy & Development Management DPD & Site Allocations DPD T11 Travel Plans Core Strategy & Development Management DPD & Site Allocations DPD T12 Special Needs Core Strategy & Development Management DPD & Site Allocations DPD T13 Transport Investment Core Strategy & Development Management DPD & Site Allocations DPD T14 Transport Assessments Core Strategy & Development Management DPD & Site Allocations DPD C1 Townscape and Urban Form Core Strategy & Development Management DPD & Site Allocations DPD C2 Conservation Areas Core Strategy & Development Management DPD & Site Allocations DPD C3 Demolition of Unlisted Buildings in Conservation Areas Core Strategy & Development Management DPD & Site Allocations DPD C4 Control of Development in or adjoining Conservation Areas Core Strategy & Development Management DPD & Site Allocations DPD C5 Alternative Uses, Alterations and Additions for Listed Buildings Core Strategy & Development Management DPD & Site Allocations DPD C6 Setting of Listed Buildings Core Strategy & Development Management DPD & Site Allocations DPD C7 Enabling Development for Conservation of Heritage Assets Core Strategy & Development Management DPD & Site Allocations DPD C8 Demolition of Listed Buildings Core Strategy & Development Management DPD & Site Allocations DPD C9 Historic Parks and Gardens Core Strategy & Development Management DPD & Site Allocations DPD C10 Development Affecting Archaeological Sites Core Strategy & Development Management DPD & Site Allocations DPD C11 Shop Fronts Core Strategy & Development Management DPD & Site Allocations DPD C12 Art in the Environment Core Strategy & Development Management DPD & Site Allocations DPD N1a International Nature Conservation Sites Core Strategy & Development Management DPD & Site Allocations DPD N1b National Nature Conservation Sites Core Strategy & Development Management DPD & Site Allocations DPD N2 Locally Designated Nature Conservation Sites Core Strategy & Development Management DPD & Site Allocations DPD N3 Nature Conservation Factors Core Strategy & Development Management DPD & Site Allocations DPD N4 Trees and Woodland Core Strategy & Development Management DPD & Site Allocations DPD N5 Trees Within Development Sites Core Strategy & Development Management DPD & Site Allocations DPD N6 Protection and Enhancement of Waterside Areas Core Strategy & Development Management DPD & Site Allocations DPD N7 Protected Species Core Strategy & Development Management DPD & Site Allocations DPD MW1 Protection of Mineral Resources Joint Minerals Development Plan Document MW2 Supply of Aggregate Minerals Joint Minerals Development Plan Document MW3 Reclamation of Derelict Land Core Strategy & Development Management DPD & Site Allocations DPD MW5 Movement of Minerals and Waste Joint Minerals Development Plan Document MW6 Waste Management Facilities Joint Waste Development Plan Document MW7 Recycling, Collection and Ancillary Waste Management Joint Waste Development Plan Document MW8 Energy from Waste Joint Waste Development Plan Document MW9 Control of Minerals and Waste Developments Joint Waste Development Plan Document MW10 Development on or near Landfill Sites Core Strategy & Development Management DPD & Site Allocations DPD MW11 Contaminated Land Core Strategy & Development Management DPD & Site Allocations DPD MW12 Control of Pollution Core Strategy & Development Management DPD & Site Allocations DPD MW13 Hazardous Installations Core Strategy & Development Management DPD & Site Allocations DPD MW14 Air Quality Core Strategy & Development Management DPD & Site Allocations DPD MW15 Protection of Water Resources Core Strategy & Development Management DPD & Site Allocations DPD U1 Utilities Infrastructure Core Strategy & Development Management DPD & Site Allocations DPD U2 Telecommunications Core Strategy & Development Management DPD & Site Allocations DPD U3 Water Services for Developments Core Strategy & Development Management DPD & Site Allocations DPD U4 Flood Prevention Core Strategy & Development Management DPD & Site Allocations DPD U5 Energy Efficiency Core Strategy & Development Management DPD & Site Allocations DPD U6 Renewable Energy Core Strategy & Development Management DPD & Site Allocations DPD

44 Authority’s Monitoring Report 2011/12
Tameside Metropolitan Borough Council
Abbreviations
ABI Annual Business Inquiry AQMA Air Quality Management Area AMR Authority’s Monitoring Report DCLG Department for Communities and Local Government DPH Dwellings per Hectare GVA Gross Value Added IMD Index of Multiple Deprivation LDF Local Development Framework LDS Local Development Scheme NLUD National Land Use Database NUTS Nomenclature of Units for Territorial Statistics NWRA North West Regional Assembly ODPM Office of the Deputy Prime Minister QBC Quality Bus Corridor RSL Registered Social Landlord RSS Regional Spatial Strategy SA Sustainability Appraisal SAC Special Area of Conservation SBI Site of Biological Importance SHLAA Strategic Housing Land Availability Assessment SOA Super Output Area SPA Special Protected Area SSSI Site of Special Scientific Inertest TIF Transport Innovation Fund TPO Tree Preservation Order UDP Unitary Development Plan
Copyright © 2022 FDOKUMEN