local government councils' performance and public service ...
56
Angela S. Byangwa . Victoria N. Busiinge ACODE Public Service Delivery and Accountability Report Series No.31, 2014 LOCAL GOVERNMENT COUNCILS’ PERFORMANCE AND PUBLIC SERVICE DELIVERY IN UGANDA Kabarole District Council Score-Card Report 2012/2013
-
Upload
khangminh22 -
Category
Documents
-
view
1 -
download
0
Transcript of local government councils' performance and public service ...

Angela S. Byangwa . Victoria N. Busiinge
ACODE Public Service Delivery and Accountability Report Series No.31, 2014
LOCAL GOVERNMENT COUNCILS’ PERFORMANCE AND PUBLIC SERVICE
DELIVERY IN UGANDA
Kabarole District Council Score-Card Report 2012/2013

LOCAL GOVERNMENT COUNCILS’ PERFORMANCE AND PUBLIC SERVICE
DELIVERY IN UGANDA
Kabarole District Council Score-Card Report 2012/2013
Angela S. Byangwa . Victoria N. Busiinge
ACODE Public Service Delivery and Accountability Report Series No.31, 2014

Published by ACODEP. O. Box 29836, KampalaEmail: [email protected]; [email protected]: http://www.acode-u.org
Citation:
Senabulya, A., B., and Namugga, V., B., (2014). Local Government Councils’ Performance and Public Service Delivery in Uganda: Kabarole District Council Score-Card Report 2012/13. ACODE Public Service Delivery and Accountability Report Series No.31, 2014. Kampala.
© ACODE 2014
All rights reserved. No part of this publication may be reproduced, stored in a retrieval system or transmitted in any form or by any means electronic, mechanical, photocopying, recording or otherwise without the prior written permission of the publisher. ACODE policy work is supported by generous donations and grants from bilateral donors and charitable foundations. The reproduction or use of this publication for academic or charitable purposes or for purposes of informing public policy is excluded from this restriction.
ISBN: 978 9970 34 029 3
Cover Illustrations:
Part of the uncontrolled mining of sand and stones along the banks of River Mpanga that is partly responsible for its degradation. The District Administration needs to control such activities that increase destruction of vegetation cover of the water catchment areas to protect this river.

CONTENTSLIST OF TABLES AND FIGURES ............................................................. IABBREVIATIONS .................................................................................. IIACKNOWLEDGEMENT ......................................................................... IVEXECUTIVE SUMMARY ......................................................................... V1. BACKGROUND ................................................................................. 1
1.1 Introduction .............................................................................. 11.2 District Profile ............................................................................ 21.3 District Leadership ..................................................................... 21.3.1 Political leadership .................................................................. 31.3.2 Technical leadership ................................................................ 31.4. Methodology ............................................................................. 41.4.1 The Scorecard ......................................................................... 41.4.2 The Scorecard Administration .................................................. 51.4.3 Data Management and Analysis ............................................... 6
2. BUDGET ARCHITECTURE AND STATUS OF SERVICE DELIVERY IN KABAROLE DISTRICT ..................................................................... 7
2.1 Kabarole District Budget Performance ................................ 72.1.1 Kabarole District Resource Envelope ................................. 72.1.2 Sectoral Budget Allocations .............................................. 82.2 Status of Service Delivery ................................................ 102.2.1 Primary Education ......................................................... 112.2.2 Functional Adult Literacy ................................................ 132.2.3 Health ............................................................................ 142.2.4 Agriculture ..................................................................... 152.2.5 Road Network ................................................................ 162.2.6 Access to Water and Sanitation ...................................... 182.2.7 Environment and Natural Resources ............................... 19
3. THE SCORECARD: FINDINGS AND INTERPRETATION ................... 203.1 Performance of the District Council ................................... 203.2 Performance of the District Chairperson ........................... 223.3 Performance of the District Speaker ................................. 253.4 Performance of District Councilors .................................... 27

3.5 Interpretation of Results ................................................... 323.5.1 Endogenous Factors affecting performance ..................... 323.5.2 Exogenous Factors affecting performance ....................... 33
4. GENERAL CONCLUSION AND RECOMMENDATIONS ...................... 354.1 Conclusion .............................................................................. 354.2 Recommendations ................................................................... 36
REFERENCES ..................................................................................... 37ANNEXES ........................................................................................... 38PUBLICATIONS IN THIS SERIES ......................................................... 41

LIST OF TABLESTable 1: Kabarole District Administrative Units ...................................... 2Table 2: Showing the Secretaries of Council Standing/Sectoral Committees of Kabarole District .................................................... 3Table 3 : Political Heads in Kabarole District ......................................... 3Table 4: The District’s Departmental Heads ........................................... 4Table 5: Kabarole District Revenue Performance and Plans .................... 8Table 6: Service Delivery Indicators in Kabarole District (2012/2013) .. 10Table 7: Total Number of Roads Constructed with External Support .... 17Table 8: Scorecard Performance for Kabarole District Council in
FY2012/13 .................................................................................. 21Table 9: Chairperson’s Scorecard ........................................................ 22Table 10: Speaker’s Scorecard ............................................................ 25Table 11: Councilors’ Scorecard .......................................................... 29
LIST OF FIGURESFigure 1: Budget Allocations by Sector 2012/2013 ............................... 9Figure 2: Kabarole District PLE Performance for the Last 6 Years ......... 12Figure 3: A Pupil in Rutete Sub-County Consults her Teacher for Guidance ..................................................................................... 12Figure 4: Kabarole District Health Sector Budget Performance FY 2012/13 ................................................................................. 14Figure 5: A Section of the Road to Karangura Sub-County Headquarters .............................................................................. 17
i

LIST OF ACRONYMSACODE Advocates Coalition for Development and Environment
CAO Chief Administrative Officer
CBO Community Based Organization
CSO Civil Society Organization
DCC District Contact Committee
DDP District Development Plan
DP Democratic Party
DSC District Service Commission
ENR Environment and Natural Resource
FAL Functional Adult Literacy
FDC Forum for Democratic Change
FGD Focus Group Discussion
FY Financial Year
HC Health Centre
LC Local Council
LG Local Government
LGCSC Local Government Councils’ Scorecard
LGCSCI Local Government Councils’ Scorecard Initiative
LGDP Local Government Development Programme
LLG Lower Local Government
MoLG Ministry of Local Government
MOU Memorandum of Understanding
NAADS National Agriculture Advisory Services
NGO Non-Governmental Organization
NPPA National Priority Programme Area
NRM National Resistance Movement
NWSC National Water and Sewerage Corporation
PHC Primary Health Care
PLE Primary Leaving Examinations
PWD People with Disabilities
TPC Technical Planning Committee
UBOS Uganda Bureau of Statistics
ii

ULGA Uganda Local Government Association
UNEB Uganda National Examinations Board
UNRA Uganda National Roads Authority
UPE Universal Primary Education
PEAS Promoting Equality in African Schools
iii

ACKNOWLEDGEMENTThis scorecard was prepared as part of the Local Government Councils’ Scorecard Initiative (LGCSCI). The Initiative is a partnership between the Uganda Local Government Association (ULGA) and the Advocates Coalition for Development and Environment (ACODE). The report is an output of consultations with the district political and technical leadership. We are grateful to community members and especially sub-county leaders who participated in this exercise through Focus Group Discussions. We acknowledge the contributions of the LGCSCI project team at ACODE and the district-based researchers across the country.
At the district level, we are particularly indebted to the offices of the District Chairperson, the District Speaker, the Chief Administrative Officer and the District Clerk to Council for their support to the assessment process. We acknowledge the cooperation of the district councilors who are the primary unit of the study and analysis for the scorecard. We are grateful to Drake Rukundo for peer reviewing and Mukotani Rugyendo for technical editing of this report.
Funding for this assessment was provided by the Democratic Governance Facility (DGF). We are grateful to the DGF and contributing partners, namely: the United Kingdom (UK), Denmark, Norway, Ireland, Sweden, The Netherlands, Austria and the European Union (EU).
Finally, it is important to recognize that there still remain considerable gaps of information and data required to fully assess the performance of district councils and councilors. We have taken due care to ensure that where such information exists, it is presented as accurately as possible. However, we take responsibility for any errors or omissions.
iv

EXECUTIVE SUMMARY
For the past five years, the Advocates Coalition for Development and Environment (ACODE) has been assessing the performance of the local governments through the Local Government Scorecard Initiative (LGSCI). Initiated by ACODE, LGSCI is a tool that seeks to deepen decentralization so as to deliver effective governance and quality goods and services to the citizens.
In Kabarole District, the first assessment was done in 2011/12 which makes this the second assessment report for Kabarole District Local Government. Assessment was done on four categories of the district political leadership, i.e. the Council, the District Chairperson, the Speaker, and the individual Councilors.
Like all the other districts of Uganda, Kabarole remains heavily dependent on central government financial transfers 85 per cent of the district’s funding comes from the central government, 65 per cent of which is conditional grants. The remaining 35 per cent can hardly fund the district’s priority programme areas. In the year under review, nearly all the district programmes that depend on local revenue were not implemented, simply because 76 per cent of the district’s local revenue was spent on payment of a debt accruing from lost court cases and URA tax arrears.
In the year under review, Kabarole District had 37 councillors, including the district chairperson. However, one of the councillors – Hon. Halima Wakabu Nakivumbi, passed on during the assessment period. Thirty-six councillors were thus assessed. The best performing councillor was a female. Hon. Stella Kyorampe improved from 54 per cent scored during the 2011/12 assessment to top the table at 88 per cent. Overall, there was a general improvement in the performance of the councillors, although council as an entity dropped from 75 per cent in 2011/12 to 63 per cent in 2012/13.
The district chairperson’s performance improved from 80 per cent to 88 per cent, while the speaker – Hon. Clovis Mugabo improved from 54 per cent to 68 per cent.
Overall, the assessment findings revealed an upward trend in the general social-economic development of the district, although there is still a lot of room for improvement. In the education and health sectors, the National Priority Programme Areas (NPPAs) are above the national targets, yet service delivery especially in the rural areas is still lacking.
v

The score-card urges and inspires Council to do better, and also focuses on poor performers; not to undermine their political aspirations, but to define standards they can use to elevate their performance.
vi

Local Government Councils’ Performance and Public Service Delivery in Uganda: Kabarole District Council Score-Card Report 2012/13 1
1. BACKGROUND
1.1 IntroductionThe Local Government Scorecard Initiative (LGSCI) is a tool developed by the Advocates Coalition for Development and Environment (ACODE) that seeks to deepen decentralization so as to deliver effective governance and quality goods and services to the citizens. During financial year 2012/13, LGSCI was implemented in 26 districts of Uganda. The first local government councils’ scorecard covering financial year 2008/09 was conducted in 10 local governments. The second scorecard assessment covering financial year 2009/10 covered 20 local government councils, while the third and fourth – 2011/2012 and 2012/13 covered 26 districts, including Kabarole. In the 2011/12 assessment, Kabarole District emerged fourth out of the 26 districts assessed.
The scorecard indicators are developed based on the local government core mandate, responsibilities and functions as set out in the Constitution of Uganda (1995) and the Local Government Act 1997 (as amended). Local government councils, chairpersons, speakers and councilors are assessed to determine how best they perform their political responsibilities and functions as set out in the Act. Based on the assessment, the major limitations to effective performance are identified and policy response options to improve performance presented.
The scorecard objective is two-pronged. One, it seeks to contribute to improved performance of selected local governments by assessing their performance using an open and transparent mechanism; and two, it seeks to empower the communities through delivering an issue-based civic education that enables them to demand for accountability from the elected leaders.
The assessment is conducted by way of interviews, focus group discussion, document review and field visits, among others. Findings from the scorecard are widely disseminated at national and district levels. At district level, the findings are presented at an interactive workshop that brings together the assessed political leaders, district technical officials, lower local government leaders, civil society organizations and the community.

Local Government Councils’ Performance and Public Service Delivery in Uganda: Kabarole District Council Score-Card Report 2012/132 Local Government Councils’ Performance and Public Service Delivery in Uganda: Kabarole District Council Score-Card Report 2012/13
Quite different from the previous assessments, the 2011/12 scorecard findings were published in calendars which were widely disseminated to the electorate. The calendars served a duo purpose of: one, sensitizing the electorate about their civic rights and, the duties and responsibilities of their leaders; and two, displaying the performance results of their respective councilors.
This report comprises five chapters, i.e., the background; the budget architecture and service delivery; scorecard findings and interpretation; internal and external factors affecting service delivery in the district; and, the general conclusion and recommendations from the study.
1.2 District ProfileKabarole District is located in western Uganda and lies on the foothills of Mount Rwenzori, between 0.6000° N, 30.3000° E Longitude. The district is bordered by Kasese District in the South, Kamwenge in the South-East, Kyenjojo in the East, Ntoroko in the North-West and Kibale in the North-East. Kabarole District Local Government is composed of a number of administrative units termed as Lower Local Governments (LLGs) as shown in Table 1.
Table 1: Kabarole district administrative units
Municipalities 01
Number of counties 02
Number of sub-counties 15
Number of town councils 04
Number of divisions 03
Number of parishes 78
Number of villages 699
1.3 District LeadershipKabarole District, like other districts in Uganda, is headed by the Chairperson who heads the political wing but works hand-in-hand with the technical wing comprising of civil servants headed by the Chief Administration Officer (CAO) to provide services in the district.
This scorecard focuses on the political leadership because the technical staff is assessed by the Ministry of Local Government annually and, therefore, the former have not been assessed. As a result since 2009, ACODE in partnership with ULGA have focused on assessing the performance of political leaders on their roles and responsibilities to improve service delivery not only at the district level but in Uganda as a whole.

Local Government Councils’ Performance and Public Service Delivery in Uganda: Kabarole District Council Score-Card Report 2012/13 3
1.3.1 Political leadershipIn accordance with the Local Government Act (LGA), the Council is the highest organ of the district which is administratively represented by the District Executive Committee headed by the District Chairperson. In the year under review, Council was headed by Chairman Richard Rwabuhinga working with 36 elected councilors including the District Speaker. In terms of gender, 21 councilors were male and 15 female.
Table 2: Political leadership of Kabarole District Local Government
Designation Name
Chairperson Hon. Richard Rwabuhinga
District Vice Chairperson Hon. Moses Ikagobya
District Speaker Hon. Clovis Mugabo
Members of Parliament
Hon. Alex Ruhunda –Fort Portal Municipality
Hon. Victoria Businge -Women MP
Hon. Stephen Kagwera - Burahya County
Hon. Adolf Mwesigye-Bunyagabo County
Resident District Commissioner Mr. Abdullah Namuyimba
D/RDCs Mr. Elijah Biryabarema
Council business is conducted through five policy or sectoral committees that deliberate on policy and programme implementation matters and make recommendations to the full council. The committees include: Water; land and technical services, health, education and sports; Community services, Production, marketing and natural resources; and, Finance, Planning, Management and Investments. During the year under review, the secretaries to the above sectors were as follows:
Table 3: Secretaries of Council Standing/Sectoral Committees of Kabarole District
Sectoral Committee Secretary
Works, Land and technical services Moses Ikagobya
Health, education and sports Richard Rwabuhinga
Community services Masipa Masika
Production, marketing and natural resources Florence Kadoma
Finance, planning, management and investments Stella Kyorampe
Source: Kabarole District Council Minutes (2012-2013)
1.3.2 Technical leadershipThe technical leadership is headed by the Chief Administrative Officer (CAO). In the year under review, Mr. Juma Nyende was the CAO, deputized by Ms. Joanita Nakityo. However, Mr. Nyende was transferred and replaced by Mr.

Local Government Councils’ Performance and Public Service Delivery in Uganda: Kabarole District Council Score-Card Report 2012/134 Local Government Councils’ Performance and Public Service Delivery in Uganda: Kabarole District Council Score-Card Report 2012/13
Nicholas Ocakara as the new district CAO. The district technical business was manned by different heads of departments as shown in Table 4.
Table 4: Kabarole District Technical Leadership
Department/Title Name
District Health Officer Dr. Richard Mugahi
District Education Officer Mr. Patrick Rwakaikara
Community Based Services Coordinator Mr. Tadeo Balinsanga
Chief Finance Officer Mr. Robert Nkojo
District Engineer Mr. Steven Wakatama
District Planner Mr. Sam Mugume
Head of Natural Resources Mr. Godfrey Ruyonga
District Production and Marketing Officer Mr. Amos Mugume
Administration Ms. Joanita Nakityo
District Internal Auditor Mr.Rwabuhoro Charles Ndibalema
Clerk to Council Mr. Smart Bwango
1.4 MethodologyThe process of conducting the assessment used a variety of methods consistent with the goals and the theory of change1 of the scorecard. The following approaches were used in the process.
1.4.1 The ScorecardThe scorecard is premised on a set of parameters which assess the extent to which local government council organs and councilors perform their responsibilities.2 These parameters are based on the responsibilities of the local government councils. The organs assessed include: the district council, district chairperson, district speaker and the individual councilors. The parameter assessed include: legislation, contact with the electorate, planning and budgeting, participation in lower local governments and monitoring service delivery.3
The scorecard is reviewed and ratified annually by internal and external teams. The internal team comprises ACODE researchers and local partners. The Expert Task Group, which is the external team, comprises individual experts
1 For a detailed Methodology, See Godber Tumushabe, E. Ssemakula and J. Mbabazi (2012). Strengthening the Local Government System to Improve Public Service Delivery Accountability and Governance.ACODE Policy Research Series, No. 53, 2012. Kampala
2 See Third Schedule of the Local Governments Act, Section 8.
3 See, Tumushabe, Godber. Ssemakula, E., and Mbabazi, J., (2012). Strengthening the Local Government System to Improve Public Service Delivery Accountability and Governance ACODE Policy Research Series, No. 53, 2012. Kampala.

Local Government Councils’ Performance and Public Service Delivery in Uganda: Kabarole District Council Score-Card Report 2012/13 5
and professionals from local governments, the public sector, civil society and the academia.
1.4.2 Scorecard AdministrationBefore commencement of the assessment exercise, an inception meeting was organized in on 28 March 2013 for councilors, technical staff, and selected participants from civil society and the general public. This meeting was designed as a training workshop on the purpose of the scorecard, nature of assessment, and to orient councilors for the assessment.
a) Literature Review. The assessment involved comprehensive review of documents and reports on Kabarole District Local Government. Box 1 shows the different categories of documents and reports reviewed.
b) Key Informant Interviews. Key informants were purposively selected for the interviews owing to their centrality and role in service delivery in the district. Interviews were conducted with the district technical and political leaders. The interviews focused on the state of services, level of funding, and their individual contribution to service delivery in the district. For the political leaders, these interviews are the first point of contact with the researchers and they generate assessment values that feed into the scorecard. They also offer an opportunity for civic education on roles and responsibilities of political leaders. Interviews with the technical leaders provide an independent voice and an opportunity to verify information.
c) Focus Group Discussions (FGDs). Focus group discussions (FGDs) were conducted based on the criteria set in the score card FGD guide. A total of 44 FGDs were organized in the 22 sub-counties in the district. FGDs
Box 1: Categories of Official District Documents used in the Assessment
• Kabarole District Local Government (2011/12-15) District Development Plan
• Kabarole District Budget Framework Paper (2011/12 and 2012/13)
• Kabarole District (2012/13) District Budget and Annual Work Plan
• Kabarole District (2012/13) Internal Audit Report
• Kabarole District (2012/13) State of Environment Report
• Kabarole District Minutes for Ordinary Council Meetings held in June, August, November (2012) and, February, April and June (2013)
• (2012/13) Kabarole District Revenue Enhancement Plan
• Kabarole District Capacity Building Plan.
• (2012/13) Kabarole District State of Affairs Report
• 2011/12) District Executive Committee (DEC) Minutes
• Standing Committee Reports
Local Government Councils’ Performance and Public Service Delivery in Uganda: Kabarole District Council Score-Card Report 2012/136 Local Government Councils’ Performance and Public Service Delivery in Uganda: Kabarole District Council Score-Card Report 2012/13
were platforms for civic education and empowerment about the roles of councilors and other political leaders. They were mainly organized to enable voters verify information provided by their respective councilors. Four hundred sixty-five (465) people, of whom 187 were women and the rest men, participated in the FGDs.
d) Visits to Service Delivery Units. Field visits to service delivery units (SDUs) were undertaken in each sub-county by the research team. In each sub-county, visits were made to primary schools, health centres, water source points, demonstration sites, FAL centres, and roads. Field visits were mainly observatory and, where possible, interviews were conducted with the personnel at the SDUs. These visits were also meant to verify the accuracy of the information provided by the political leaders.
1.4.3 Data Management and AnalysisThe data collected during the assessment was both qualitative and quantitative. Qualitative data was categorized thematically for purposes of content analysis. Thematic categorization helped in the identification of the salient issues in service delivery. Quantitative data was generated through assigning values based on individual performance on given indicators. These data were used to generate frequency and correlation matrices that helped make inferences and draw conclusions on individual and general performance.

Local Government Councils’ Performance and Public Service Delivery in Uganda: Kabarole District Council Score-Card Report 2012/13 7
2. BUDGET PERFORMANCE AND THE STATUS OF SERVICE DELIVERY IN KABAROLE DISTRICT
The budget is the primary policy tool through which development priorities are realized. The scorecard therefore assesses the architecture of the local government budgets and their local revenue and the implication of this architecture for effective intervention. The analysis examines the composition of the local government budget resources, the intra-budget allocation of these resources, the level of local revenue contribution to the local government budget and the authority of the local government over its budget.
2.1 Kabarole District Budget PerformanceThe Constitution of Uganda provides that “there shall be established for each local government unit a sound financial base with reliable sources of revenue. The primary function of government is to provide services to citizens. This, however, depends on the amount of financial resources available. Under decentralization, several functions were devolved to LGs. This section presents information on the district budget and the state of service delivery
2.1.1 Kabarole District Resource Envelope
The budget of Kabarole Local Government comprises three revenue sources: central government grants, local revenue and donor funding. Central government grants comprise unconditional grants and conditional grants. Local revenues comprise funds collected from sources that have been designated as local revenue sources by Parliament. Donor revenues are funds that are provided directly to the district through Donors and NGOs.
Kabarole District revenue is highly dependent on the central government releases. Kabarole District’s budget for the financial year 2012/13 was Shs. 27,269,613,000 but by the end of March 2013, Shs.19, 506,704,000 (71 per cent) of the approved budget had been received. In the year under review,

Local Government Councils’ Performance and Public Service Delivery in Uganda: Kabarole District Council Score-Card Report 2012/138 Local Government Councils’ Performance and Public Service Delivery in Uganda: Kabarole District Council Score-Card Report 2012/13
central government contributed 87.4 per cent of the total district revenue, up from 84 per cent in the previous financial year (2011/12). The remaining 12.6 per cent was contributed by local revenue (8.4 per cent), and donor funds (4.2 per cent).
Considering the fact that the largest percentage of the central government releases comprises conditional grants, the district has to source out other means to generate more revenue to for the district priority areas of development. The district’s revenue enhancement plan lays down great strategies to increase her revenue but, unfortunately, most of these remain on paper. Once actualized, the district’s revenue base will widen and hence enable Kabarole address some of her immediate priority development needs.
In the year under review, the performance of the district’s recurrent budget was greatly affected by two factors, namely: servicing of debts accruing from court cases and settlement of URA tax arrears. Out of the unconditional grant of 476 million, 361 million was spent on debts. This implies that 76 per cent of the local revenue was expended on payment of debts and this certainly hindered the implementation of other activities. By implication, most of the activities which depend on local revenue remained unimplemented.
Table 5: Composition of the Resource Envelope for Kabarole District
SourceApproved Budget (‘000s) 2011/12
Receipts by end of June (‘000s) 2012
Approved Budget (‘000s) 2012/13
1. Locally Raised Revenues 724,947 339,665 1,793,285 6.6
2a. Discretionary Government Transfers , 3,815,680 3,274,461 4,520,355
2b. Conditional Government Transfers 16,474,009 16,503,841 17,690,035
2c. Other Government Transfers 1,794,138 1,306,123 1,623,178
3. Local Development Grant 498,263 439,970 497,870 1.8
4. Donor Funding 724,147 768,966 1,144,890 4.2
Total Revenues 24,031,183 22,633,026 27,269,613
Source: Kabarole District budget estimates for the year 2012/2013
2.1.2 Sectoral Budget Allocations
Every year, the district council allocates resources to the different sectors based on the indicative planning figures (IPFs) that are provided by the Ministry of Finance, Planning and Economic Development, aligned to national priorities. Since the district’s largest budget contribution (84 per cent) comes from the central government (68 per cent of which is conditional), it will be by default that government’s priority programme areas will be emphasized. With a high debt burden (mostly accruing from the lost court cases), the

Local Government Councils’ Performance and Public Service Delivery in Uganda: Kabarole District Council Score-Card Report 2012/13 9
generated local revenue will not contribute much to the district’s development programmes.
Similar to last year’s budget allocations, education took precedence over all the other sectors (47.8 per cent of the total district budget) followed by the health sector, whose budget allocation was 10.3 per cent. Despite the fact that agriculture is the backbone of the nation’s economy, it only received 8.8 per cent (although this was above the3.4 per cent national figure), followed by the roads sector which received 8.7 per cent. The natural resources sector, on the other hand, received only 0.51 per cent of the overall budget allocation.
Whereas council is obliged to oversee the performance of the multi-billion district budget, its allocation is so negligible. Lots of funds are allocated to implementation of different programmes, yet administrative mechanisms to ensure proper utilization of these funds are almost non-existent. The fund allocation to the internal audit component, for example, is almost zero per cent (0%). The minimal provision for checks and balances of the budget expenditure can only widen the risk of abuse and diversion of the already suffocated financial base.
Figure 1: Sectoral budget allocations for the various sectors financial year 2012/13
Source: Kabarole District Local Government, Final Accounts for FY 2012/13.
Administration 3%
Multi-sectoral transfers
8% Finance 2%
Statutory bodies 2%
Production 9%
Health 10%
Education 48%
Roads and engineering
9%
Water 4% Natural resources
1%
Community based services
3%
Planning 1%
Internal audit 0%

Local Government Councils’ Performance and Public Service Delivery in Uganda: Kabarole District Council Score-Card Report 2012/1310 Local Government Councils’ Performance and Public Service Delivery in Uganda: Kabarole District Council Score-Card Report 2012/13
2.2 Status of Service DeliveryPrimary education, Health care, Agriculture and marketing, Works (roads and water), and the Environment and Natural Resources (ENR) sectors are the key National Priority Programme Areas (NPPAs). The quality of service delivery in these sectors will more or less determine the level of development in a given area. Deliberate efforts have been made to raise the standard of these sectors. Targets have been set, although many of these are yet to be realized.
Table 6: Service Delivery Indicators in Kabarole District (2012/2013)
Sect
or
IndicatorsNational standard/ NDP target
Level of achievement 2011/12
District Target
2012/13
Level of achievement 2012/13
Educ
atio
n -
Pri
mar
y Ed
ucat
ion
Children of primary school-going age (6-12) -
Enrolment - 90,000 89,852
Pupil-Classroom Ratio (PCR) 55:1 55:1 57:1
Pupil-Teacher Ratio (PTR) 55:1 55:1 57:1
Pupil-to-Desk Ratio (PDR) 3:1 3:1 5:1
PLE Performance -
Div 1 - 11.4%
Div II- 56.6%
Div III- 15.2%
Div IV- 8.9%
U- 4.2%
X- 3.4%
Div 1 - 23.57024
Div II- 57.78734
Div III- 8.73126
Div IV- 3.983898
Hea
lth
Car
e se
rvic
es
ANC 4th Visit 60% 75% 55% 53%
Deliveries in Health Centres 35% 1:19178 75% 82%
Total beds - 129/1000
Access to Maternity services - 45% 100% 100%
MMR 506 498/100,000
IMR 87% 86/1000
Staffing Levels - 70% 60%
Roa
d Su
b-se
ctor
Km of roads under routine maintenance - Not known 252 252
Km of roads rehabilitated - Not known 73 (under -
Km of roads under periodic maintenance Not known 106.3 79.3
Proportion of roads in good condition 80km 60% 50%
Construction of bridges - Not known 8 5
Opening up new community roads - - - -
Wat
er a
nd
San
itat
ion
Water coverage 65% 57% 84% 81%
Number of boreholes sunk - 3 03% 03
Number of boreholes rehabilitated - 3 11 4
Functionality of water sources 80% 100% 76%
Proportion of the population within 1km of an improved water source
- 84% 81%
Pit latrine coverage 90% 88% 100% 84%

Local Government Councils’ Performance and Public Service Delivery in Uganda: Kabarole District Council Score-Card Report 2012/13 11
Agr
icul
ture
Number of extension workers per S/county - 35 3 per sub-
Number of service points - 1 59,000 22,000
Number of demonstration farms - 1252 520 800
Technical back-up visits -96 Subject Matter
90 SMSs
Technical back-up visits -
FAL
Number of instructors 30
Number of participants 4342
Number of service centres - 2 per parish
Level of coverage - Not known
Envi
ron
men
t an
d N
atur
al R
esou
rces
Staffing Level 2 70% 12 07
Conduct Environmental monitoring and assessment
- Not known 100%
Production and update District State of the Environment Report (DSOER)
- - Suspended
District Environment Action Plan - - 60% 40%
Preparation of District Wetland Ordinance - - N/A
Monitor wetland systems in the district - 100% 100%
Establishment of Agro-forestry nurseries Not seen 100% 0%
2.2.1 Primary Education ServicesKabarole District has 124 government grant-aided primary schools with an enrolment of 89,773 pupils. The 2012/13 budget allocation for primary education in Kabarole District was Sh. 7,094,856,000/= for wage and none wage (development fund).
Education in Kabarole is on an upward trend, registering better PLE performance every other year. The increase in the number of pupils who passed in Division 1, for example, was over 100per cent between 2011 and 2012, while those passing in Divisions 3 and 4 declined. In the 2012 PLE, Kabarole District was one of the best 10 schools in the country with over 81 per cent of the pupils passing in Divisions 1 and 2.

Local Government Councils’ Performance and Public Service Delivery in Uganda: Kabarole District Council Score-Card Report 2012/1312 Local Government Councils’ Performance and Public Service Delivery in Uganda: Kabarole District Council Score-Card Report 2012/13
Figure 2: Kabarole District PLE performance for the last 6 years
Although the number of the male school-going children is still higher than that of the female children (54.4 per cent and 46.6 per cent respectively) the gap between the two has been greatly reduced – depicting equal opportunity for education for both boys and girls.
Figure 3: A pupil consults her teacher at Rutete Primary School, Rutete Sub-county
Source: ACODE Digital Library 2013
0
500
1000
1500
2000
2500
3000
3500
4000
4500
Div.1 D2 D3 D4 DU DX
2007
2008
2009
2010
2011
2012

Local Government Councils’ Performance and Public Service Delivery in Uganda: Kabarole District Council Score-Card Report 2012/13 13
The biggest challenge facing the education sector in Kabarole District still lies in overcrowding, especially in the lower primary classes, thereby increasing the teacher pupil ratio. The national minimum standard for the teacher-pupil ratio is 1:50, yet in most rural lower primary schools the ratio is 1:80 or even, in other instances, 1:90. Examples include: Harugongo Primary School, in Kicwamba Sub-county, Kasunganyanja Primary School in Kibiito Sub-county and Kiboota Primary School in Buhesi Sub-county. The classes are usually so crowded that there is hardly any space for the teacher to stand.
Shoddy construction of school buildings and latrines is yet another evidence of poor service delivery. A number of cases were reported with collapsed latrines, incomplete structures or even sub-standard quality works. Kibiito Primary School, for example, with over 2,000 pupils had only one latrine block of five stances, after the second one constructed under the presidential pledge collapsed and sunk in, hardly five years after completion. In the same school, the classrooms constructed under the same presidential pledge collapsed
Considering the negligible funds available for monitoring government programmes, this may not be shocking since dubious contractors tend to take advantage of the situation, well knowing that no one is keeping a close watch on their works.
2.2.2 Functional Adult LiteracyFunctional Adult Literacy (FAL) is a government programme under the Ministry of Gender and Social Development that was introduced to reduce the illiteracy levels in the country. It targets individuals who never went to school. In Kabarole, an estimated 4,342 learners (876 male and 3,448 female) were attending FAL classes. Unlike the situations in primary, secondary and tertiary education facilities, there was more female than male participation in FAL classes. Literacy discrepancies between males and females are caused by various factors – some of which are as a result of traditional thinking, while others are dictated by nature (like unwanted pregnancies among the girl children). Hence, in terms of gender, literacy levels were higher among the males than the females. This probably explained the higher participation of females in FAL classes – as an opportunity to enable those who for one reason or the other may have missed the chance of going to school. This was a positive step towards development since when women upgraded their levels of education, they would be able to contribute to development just like their male counterparts. Performance in this department was, however, still lacking due to poor enrolment/attendance. In some areas, the FAL classes had closed due to various factors. The non-functionality of these FAL centers

Local Government Councils’ Performance and Public Service Delivery in Uganda: Kabarole District Council Score-Card Report 2012/1314 Local Government Councils’ Performance and Public Service Delivery in Uganda: Kabarole District Council Score-Card Report 2012/13
was mostly blamed on inadequate funding; while in other areas there was lack of commitment from students and tutors .
Like in the previous financial year (2011/12), less than half of the councilors had made effort to visit the FAL centres. From our interviews, it was revealed that the councilors’ interest in FAL was very minimal. Most of the councilors claimed that the FAL classes in their areas were non-functional and, therefore, there was no need to monitor them.
2.2.3 Health In the year under review, Kabarole District had 61 functional health facilities, of which 42 were government owned, four private, while the remaining 15 were owned by NGOs.
The district registered improvement in the availability of drugs in all health units, with remarkable reduction in stock-outs in public health facilities. The percentage of health facilities ordering and receiving essential medicines every two months was at 100 per cent. Additionally, access to HIV/AIDS testing with the use of CD4 count machines was at 100 per cent. The state of health services in the district paints a bright future. With support coming in from donors such as BAYLOR and PEAS; and other government programmes, access to health services has greatly improved. The challenge, however, remains that of access to drugs. Given the government’s push system of drug distribution to health facilities, drug stock-outs are a major problem experienced in several parts of the district – especially the rural areas.
Figure 4: Kabarole District Health Sector Budget Performance 2012/13
Source:
0
100,000,000
200,000,000
300,000,000
400,000,000
500,000,000
600,000,000
700,000,000
Baylor Global Fund PHC

Local Government Councils’ Performance and Public Service Delivery in Uganda: Kabarole District Council Score-Card Report 2012/13 15
The budget performance for the health sector in the year under review was as follows: Sh 112 million from Baylor Uganda for comprehensive HIV/AIDS activities sub-grant to 33 health facilities; Sh 95 million from Global Fund to support Malaria training for 150 teachers, 164 health workers and private health providers; and, a total of Sh 645,416,000 received for Primary Health Care non-wage funds for NGO hospitals and Government health facilities
Although the largest contribution to this sector was from government, the supplement made by donors played a big role in improving the quality of health services, especially for HIV/AIDS programmes and maternal health.
2.2.4 AgricultureUganda is predominantly an agricultural country with over 83 per cent of the population engaged in agriculture. Like in most parts of the country, agriculture is the backbone of the district’s economy, with a large percentage of the population involved in the sector. The main cash crops grown in the district include: tea, bananas, passion fruits and rice. Additionally, a number of farmers are engaged in dairy and poultry farming.
The National Agricultural Advisory Services (NAADS)
NAADS is one of the seven components under the Plan for Modernization of Agriculture (PMA). As provided for under the National Agricultural Advisory Services (NAADS) Act, 2001, the mandate of NAADS is to contribute to the modernization of the agricultural sector in order to increase total factor productivity of both the land and labour for the benefit of the farmers.
True to its objectives, the NAADS programme has greatly improved farmers’ livelihoods in the district. From the focus group discussions held in various parts of the district, many attested to the benefits realized from the programme. These include: substantial positive impacts on the availability and quality of advisory services provided to farmers; promoting the adoption of new crop and livestock enterprises as well as improving adoption and use of modern agricultural production technologies and practices. The programme has further promoted greater use of post-harvest technologies and commercial marketing of commodities, consistent with its mission to promote more commercially-oriented agriculture.
Despite the above benefits, the programme still manifests some gaps, some of which are externally generated while others are ‘farmer/beneficiary’ generated. The public image of this programme has, however, improved based on the field findings from therespondents. In one of the FGDs carried out in Kasenda during the 2011/12 assessment, only 35 per cent of the participants

Local Government Councils’ Performance and Public Service Delivery in Uganda: Kabarole District Council Score-Card Report 2012/1316 Local Government Councils’ Performance and Public Service Delivery in Uganda: Kabarole District Council Score-Card Report 2012/13
commended the government for this programme, while the remaining 65 per cent insisted that the programme was only accelerating corruption. Surprisingly, over 85 per cent of the respondents from the same sub-county (Kasenda) when interviewed during this year’s (2012/13assessment, were appreciative of the programme, insisting that only the farmers who had failed to comply with the required terms of reference had large issues.
Challenges faced
The production sector in Kabarole District was hit by two major setbacks in the year under review:
a. The African swine fever – a ban on the sale, consumption and transportation of pigs was declared, to lower the risk of infection and transmission. Although the ban was later lifted, the losses suffered by the farmers cannot be underrated.
b. The Banana Bacteria Wilt (BBW), which affected most of the banana crops. Despite various efforts geared towards addressing the problem, the Banana Bacterial Wilt is still a challenge to farmers in Kabarole District.
2.2.5 Roads SubsectorKabarole District has a total of 295.6km network of feeder roads, of which 45km are gravel, while 250.6km are earth roads. The total length of community access roads in the district is about 800km. In the year under review, out of the target 106.3 km, 79.3 km of road were worked upon under periodic maintenance. Five bridges out of the eight district target were constructed; but there were no new community roads opened. Over 25km of road were not worked upon despite their approval at the beginning of the 2012/13 financial year. This was due to failure to release the fourth quarter funds under Roads.

Local Government Councils’ Performance and Public Service Delivery in Uganda: Kabarole District Council Score-Card Report 2012/13 17
Figure 5: A section of the Road to Karangura Sub-county Headquarters
Source: ACODE Digital Library, September 2013
The district received support from development partners and companies (especially tea companies) to construct new roads. A total of 12 kms of roads were obtained through such support, as seen in the Table 7.
Table 7: Total number of roads constructed with external support
Constructed road No. of kilometres
Kiko Centre – Kiko Factory road in Kiko Town Council 2kms
Mugusu – Kihingimi road in Buroso Sub-county 3.5kms
Kibasi – Kigando Road in Hakibaale Sub-county 5kms
Hakibaale – Busasa road in Hakibaale Sub-county 1.5kms
Although 50 per cent of the roads were reported to be in good condition, the road sector in Kabarole is still faced with a number of challenges: Most of the district road surface deteriorates fast especially during the rainy season. It is expensive to maintain the district roads with the limited funds received especially since there is scarcity of gravel.

Local Government Councils’ Performance and Public Service Delivery in Uganda: Kabarole District Council Score-Card Report 2012/1318 Local Government Councils’ Performance and Public Service Delivery in Uganda: Kabarole District Council Score-Card Report 2012/13
2.2.6 Access to Water and SanitationThe 2012/13 water department statistics for Kabarole indicated that the district water coverage was at 81 per cent, compared to the previous year’s 57 per cent, and way above the national average of 65 per cent. In the year under review, fourteen shallow wells were rehabilitated in the sub-counties of Karambi, Kisomoro, Buheesi and Mugusu. Other water projects carried out include: rehabilitation of Buheesi gravity flow scheme in Kiboota (2 km of pipeline were replaced); the extension of Pohe Gravity Flow Scheme to Rwano in Kabonero (3 km of pipeline) was effected; Kichwamba Gravity Flow Scheme was extended to Geme and Bwanika (6.5 km of pipeline); and, the extension of Mugusu Gravity Flow Scheme to Nyaihanga (3 km of pipeline were laid).
Despite the district’s efforts to increase safe water coverage, a number of gaps still exist. The demand for water is still high, yet the budget allocation to this sector continues to be very low. There is a challenge of communities not owning and maintaining water sources within their localities, which leads to low rate of functionality. A case in point is Kijura Town Council (Nsoro Ward) where clean water is hardly accessible, with over 500 households in a radius of 5km accessing the only shallow well – which tends to dry up during the dry season. According to Rosette Basemera (a local resident), this is a result of planting eucalyptus trees near shallow-well catchment areas.
The current situation of sanitation in the district shows a higher proportion of people in Fort Portal Municipality (4.6 per cent) having no toilet facility as compared to Bunyangabu (2.6 per cent), Burahya (0.7 per cent) and the overall district average, which is 1.8 per cent better than the 12 per cent National figures (Uganda Demographic and Health Survey). Water works and construction of ECOSAN toilets per rural growth centre are ongoing and is at 95% completion level.
The sector is, however, still faced with a number of challenges including: breakdown of existing water facilities due to poor operation and maintenance practice by the communities; heavy rains in the region which lead to faster deterioration of water facilities especially in mountainous areas that suffer from landslides; lack of transport facilities in water section for effective monitoring of water projects; inadequate funds sent to the district - making it difficult to provide safe water to all the un served areas of the district. The district thus needs to consider addressing these challenges in order to register remarkable improvement and access to clean and safe water by all.

Local Government Councils’ Performance and Public Service Delivery in Uganda: Kabarole District Council Score-Card Report 2012/13 19
2.2.7 Environment and Natural ResourcesThe district is greatly endowed with various environment and natural resources including: forests, rivers, lakes, wetlands, wildlife and game parks/reserves, among others. In the year under review, the sector collected revenue amounting to Sh 46,390,000/=.
Unfortunately, environmental degradation remains a big challenge in the district, making it susceptible to its associated adverse effects, including global warming. In a bid to address this challenge, the district embarked on a robust environmental management plan. Activities carried out included, among others, reforestation of the banks of River Mpanga with indigenous trees.

Local Government Councils’ Performance and Public Service Delivery in Uganda: Kabarole District Council Score-Card Report 2012/1320 Local Government Councils’ Performance and Public Service Delivery in Uganda: Kabarole District Council Score-Card Report 2012/13
3. THE SCORECARD: FINDINGS AND INTERPRETATION
The Local Government Councils’ Scorecard uses a standard methodology and a set of qualitative and quantitative indicators to assess the performance of local government council leaders. The organs assessed are the District Local Government Council, District Chairperson, District Speaker and the individual Councilors. The indicators are more aligned to service delivery objectives where councilors are assessed by their substantive contributions to monitoring and promoting the delivery of public services across the five National Priority Programme Areas (NPPAs). Second, local government councils are assessed on the extent to which they address national public policy issues such as corruption, governance and respect for human rights. Finally, a set of indicators that measure the extent to which councilors provide feedback to their constituencies are included in the scorecard.
3.1 Performance of the District Council Council is the highest political authority within the area of jurisdiction of a local government. The district council is made up of the district chairperson, one councilor directly elected to represent an electoral area of a district, two councilors (male and female) representing the youth in the district, two councilors (male and female) representing persons with disabilities and women councilors forming one third of the council. Assessment was based on four parameters, namely: legislative role, accountability to citizens, planning and budgeting, and, monitoring service delivery on the NPPAs.

Local Government Councils’ Performance and Public Service Delivery in Uganda: Kabarole District Council Score-Card Report 2012/13 21
Table 8: Performance of Kabarole District Council in FY 2012/13
Performance Indicators Year Actual Score Maximum Scores
Remarks
2011/12 2012/13
1. LEGISLATIVE ROLE 13 13 25
Adopted model rules of Procedure with/without debate (amendments)
2 2 2 The rules of procedure were reviewed and adopted in the preceding year – 2011/12. However, no evidence was provided to prove that the annual subscription to ULGA had been paid, despite being members.
Council committees were also proved to be functional, and always held meetings prior to each bi-annual council meeting.
There was a motion by some councilors to withdraw confidence from the CAO but council discussed this issue to have it amicably resolved. The CAO was, however, transferred later at the end of the financial year 2012/13.
There were no specific capacity building programmes in legislation organized within the course of the year. However, a trip to Kigali - Rwanda was organized for all the councilors and technical heads to learn some best practices from the Rwandese Local government.
Membership to ULGA 1 0 2
Functionality of the Committees of Council 2 3 3
Lawful Motions passed by the council 1 3 3
Ordinances passed by the council 0 1 3
Conflict Resolution Initiatives 1 1 1
Public Hearings 0 0 2
Evidence of legislative resources 1 2 4
Petitions 2 0 2
Capacity building initiatives 3 2 3
2. ACCOUNTABILITY TO CITIZENS 14 16 25
Fiscal Accountability 4 3 4 The district endeavoured to stick to the approved work plans and budgets, although not all approved activities were implemented for various reasons – one, the funds released were less than those approved, and secondly, the largest percentage of the district’s local revenue was used to meet costs of lost court cases.
There were some councilors who received funds for the trip to Kigali but did not go. Council passed a resolution that such councilor should refund the money taken.
Within the year, the council moved into its own chambers; although members lacked furniture, it was a big step for the district to own its own chambers. The council chambers did not have a citizens’ gallery, although the public was allowed to attend council sessions. They sat at the back
The district PACs were fully functional. However, none of their reports were reviewed by council throughout the year. They were received but shelved. A number of MoUs were signed with different private agencies including Baylor Medical College, PEAS, and SOS Children’s Villages Association among others. These greatly support the district financially and technically, contributing to improved service delivery.
Political Accountability 4 5 8
Administrative Accountability 4 8
Involvement of CSOs, CBOs, Citizens private sector, professionals, and other non-state actors in service delivery
2 6 2
Commitment to principles of accountability and transparency
0 2 3

Local Government Councils’ Performance and Public Service Delivery in Uganda: Kabarole District Council Score-Card Report 2012/1322 Local Government Councils’ Performance and Public Service Delivery in Uganda: Kabarole District Council Score-Card Report 2012/13
3. PLANNING & BUDGETING 18 13 20
Existence of Plans, Vision and Mission Statement
5 5 5 The district had its plans, vision and mission. The vision and mission were well displayed in different areas within the district premises.
The district budget was presented to council, discussed and approved
The district initiated various avenues to increase her local revenue base, one of them being charging a 2% tax on all contracts above one million shillings, the pozolona tax – where council resolved in the council sitting of April 26, 2013 to charge 10,000 per truck that transports stones from Harugongo – Kicwamba Sub-county.
Approval of the District Budget 4 4 4
Local Revenue 9 4 11
4. MONITORING SERVICE DELIVERY ON NPPAs
30 20 30
Education 5 3 5 Kabarole District Council carried out various monitoring activities in all the sectors. Reports were compiled and in every council sitting, the committee secretary was expected to present their monitoring finding to council for discussion and adoption.
Health 5 4 5
Water and Sanitation 4 2 4
Roads 4 3 4
Agriculture and Extension 4 3 4
Functional adult Literacy 4 2 4
Environment and Natural Resources 4 3 4
TOTAL 75 63 100 Performance dropped
3.2 District ChairpersonThe Chairperson of Kabarole District in the year under review 2012/13 was Hon. Richard Rwabuhinga. He was assessed on the five performance parameters, namely: political leadership; legislative performance; the degree of contact with the electorate; participation in communal and development activities; and monitoring of service delivery on national priority programme areas (NPPAs).The effectiveness of the Local Government Council Chairpersons is important for the overall development of the respective local government systems because they hold political as well as executive authority. The scorecard indicators therefore assess the extent to which the Chairperson provided political and executive leadership to the District Local Government.
Table 9: Chairperson’s Scorecard in FY2012/13
Name Richard Rwabuhinga
District Kabarole
Political Party Independent
Gender Male
Number of Terms 1

Local Government Councils’ Performance and Public Service Delivery in Uganda: Kabarole District Council Score-Card Report 2012/13 23
Total Score 88
ASSESSMENT PARAMETERActual Score Maximum
ScoreComments
2011/12 2012/13
1. POLITICAL LEADERSHIP 19 19 (20) DEC meetings were held on a weekly basis, of which the chairperson presided over 85%, delegating only 15 % .
The chairperson wrote to the Ministry of Local Government seeking permission to hire graders to work on the roads of Geme-Hurugongo – Nyabukara and others as resolved in the council sitting of February 27, 2013.
No independent assessment of councilors was done.
Regaining the title of Butebe Forest Reserve and Kagote are some of the contentious issues resolved by the chairperson.
Under conflict resolution, the chairperson mediated in a conflict in Kijura Town Council where the mayor wanted to resign, and also the conflict between Karago and Kiko Town Council where the chairpersons had resigned.
The state of the district affairs report was presented to council on June 25, 2013 – minute kabcou 72/6/13.
The chairperson made various written communications to the CAO including; Ref: COU/401/1. – Agricultural inputs received in the district – letter dated to the CAO on January 15, 2013. – The chair asked the CAO to implement the council directive to cause the Ag. Production Coordinator to account to the District Executive Committee.
The CAO on behalf of the civil servants attended over 75% of the DEC meetings held.
Presiding over meetings of the Executive Committee
3 3 3
Monitoring and Administration 6 5 7
Overseeing performance of civil servants 4 3 4
Overseeing the function of DSC and other boards /committee
2 2 2
Engagement with Central government and National Institutions
4 4 4
2. LEGISLATIVE ROLE 4 11 (15) The chairperson attended all the 6 council sessions.
The chairperson moved a motion to hire a grader to work on the bad roads, to which council consented.
The executive further moved a motion to display all the funds received by the LLGs, most of them complied.
The district proposed a bill on creation of a new tax – the pozolana tax.
Regular attendance of council sessions 2 2 2
Motions presented by the Executive 2 4 6
Bills presented by the Executive 0 5 7

Local Government Councils’ Performance and Public Service Delivery in Uganda: Kabarole District Council Score-Card Report 2012/1324 Local Government Councils’ Performance and Public Service Delivery in Uganda: Kabarole District Council Score-Card Report 2012/13
3. CONTACT WITH ELECTORATE 10 10 (10) The chairman’s diary and note book showed that he had held several meetings with the community. This was evidenced by the visitors’ books viewed at sub-counties, e.g. the launch of the food security programme in Mugusu Sub-county. The chairperson also held radio talk shows on HITS FM and VOT FM on a quarterly basis, where he informed the electorate about various issues, he also allowed a session of call-back to enable the community seek clarification/updates on various development programmes in the district.
Programme of meetings with Electorate 5 5 5
Handling of issues raised and feedback to the electorate
5 5 5
4. INITIATION AND PARTICIPATION IN PROJECTS IN ELECTORAL AREA
7 10(10)
The chairperson initiated various projects including construction of a bridge in Due-Kitaka in Rubona TC, staff house in Kasenda HCIII and construction of a HCIII in Buhesi. He also made financial contributions to Kiko coffee farmers (4.5m) and to Kyanga FAL class
Projects initiated 2 3 3
Contributions to communal Projects/activities 2 2 2
Linking the community to Development Partners/NGOs
3 55
5. MONITORING SERVICE DELIVERY ON NATIONAL PRIORITY PROGRAMME AREAS
45 39 (45)The Chairman monitored NPPAs as verified by the sub-county visitors’ books and the monitoring reports made on health, roads, schools, water, environment and natural resources sectors that were brought to the attention of Council. He monitored 95 % of the health centres in the district, 10 farmer groups, 76% of the government aided primary schools in the district and visited all the roads in the district.
Monitored Agricultural services 7 7 7
Monitored Health Service delivery 4 7 7
Monitored schools in every sub-county 7 7 7
Monitored road works in the district 7 7 7
Monitored water sources in every sub-county 7 7 7
Monitored functional Adult literacy session 5 1 5
Monitored Environment and Natural Resources protection
3 3 5
TOTAL 80 89 100
The Chairman’s overall score was 89 out of 100, an improvement of 9 points from the previous financial year’s score. Different from the previous year, the chairman endeavoured to correspond to the CAO through writing. In the previous year, communication between the two leaders had been mostly verbal. Although DEC meetings are minimally supposed to be a minimum of 12 per annum, the chairman engaged his DEC members on a weekly basis to discuss reports, plans and key issues of district concern. Hon. Rwabuhinga further displayed mediation skills by addressing/intervening in various conflicts, especially at the lower local government level. He particularly made effort to visit over 90 per cent of the health centres in the district to understand their state in order to improve service delivery.
As part of his obligation to manifest downward accountability, the chair held periodic talk shows and press briefs on two local FM stations, i.e. HITS FM and VOT FM.

Local Government Councils’ Performance and Public Service Delivery in Uganda: Kabarole District Council Score-Card Report 2012/13 25
3.3 District SpeakerThe District Speaker in the year under review was Hon. Clovis Mugabo, of the NRM party and represented the people of Mugusu Sub-county. The district speakers were assessed according to the following parameters: presiding over and preservation of order of council; contact with the electorate; participation in lower local governments; and, monitoring service delivery on national priority programme areas. In accordance with the Local Government Act, a district council is presided over by the speaker and therefore the speaker effectiveness has a direct bearing on the functioning and outputs of the council. Therefore the scorecard indicators are not only limited to the extent to which the speaker provides leadership to the council, but also how he executes his individual roles and responsibilities as a councillor.
Table 10: Speaker’s Performance in FY 2012/13
Name Clovis Mugabo
District Kabarole Gender Male
Constituency Mugusu No. of Terms 2
Political Party NRM Total Score 66
ASSESSMENT PARAMETERActual Score Maximum
Score2011/12 2012/13
1. PRESIDING AND PRESERVATION OF ORDER IN COUNCIL
14 22 (25)
Chairing lawful council/ meetings 3 3 3 The Speaker presided over five meetings, and delegated to the deputy once.
The rules of procedure were adopted and closely followed.
No petitions were presented in the year under review but all the council documents including motions and issues for discussion were filed and kept with the Clerk to Council.
The Speaker is a veterinary doctor and therefore used his education and professional background to guide council on how to proceed with the quarantine to contain the outbreak of swine fever
Rules of procedure 5 9 9
Business Committee 1 3 3
Records book with Issues/ petitions presented to the office
2 2 2
Record of motions/bills presented in council 3 3 3
Provided special skills/knowledge to the Council or committees.
0 2 5
2. CONTACT WITH ELECTORATE 17 20 (20)

Local Government Councils’ Performance and Public Service Delivery in Uganda: Kabarole District Council Score-Card Report 2012/1326 Local Government Councils’ Performance and Public Service Delivery in Uganda: Kabarole District Council Score-Card Report 2012/13
Meetings with Electorate 11 11 11 The Speaker conducted six meetings with various members of the community to address different issues. On March 11, 2013, he held a meeting in Kinyankende, together with the DPC and here, they sensitized the public on community policing. Other meetings were held with parents of Kaboyo on Ju ly 12, 2012, with the farmers of Kinyankende on November 8, 2012, with the youth of Kiboha on January 1, 2013, among others. In all these, he responded to the electorate’s concerns as well as updated them on the upcoming developments in their sub-county and district at large.
Office or coordinating centre in the constituency 6 9 9
3. PARTICIPATION IN LOWER LOCAL GOVERNMENT 2 10 (10)
Attendance in sub-county Council sessions 2 10 10 The Speaker attended all the four sub-county council sessions .
4. MONITORING SERVICE DELIVERY ON NATIONAL PRIORITY PROGRAMME AREAS
21 14 (45)
Monitoring Health Service delivery 5 5 7 TThe Speaker made effort to monitor various projects including; Nyabuswa Health Centre, six primary schools in Mugusu Sub-county including Kinyambende, Kamabale, Mugusu, and Kiboha. Under agriculture, Hon. Mugabo met farmers of Kinyankende who had issues of concern regarding the NAADS programme. Mr. Mugabo also visited Burungu shallow well after receiving reports that it had collapsed. He visited all the four roads in Mugusu and observed that all had been graded. Under FAL, the Speaker did not visit any centre, the reason being that none was functional. He however raised this concern to the area Community Development Officer (who was newly recruited) and he promised to take it up.
On the side of natural resources, Mr. Mugabo visited Kiboha swamp and Busaiga swamp, where he discovered that they had been encroached on.
Monitoring Education services 1 5 7
Monitoring Agricultural projects 5 1 7
Monitoring Water service 1 1 7
Monitoring Road works 5 1 7
Monitoring Functional Adult Literacy 0 0 5
Monitoring Environment and Natural Resources 4 1 5
TOTAL 54 66 100

Local Government Councils’ Performance and Public Service Delivery in Uganda: Kabarole District Council Score-Card Report 2012/13 27
The Speaker scored 66 out of 100, a great improvement from the previous year’s performance where he had scored 54 per cent. Improvement was exhibited in all the parameters, save for the monitoring role where he dropped from 21 to 14 points. His major weakness here was failure to compile reports, despite clear evidence presented to prove that he had actually monitored various service delivery points. In the previous assessment, little effort had been made by the speaker to attend the lower local government council sessions but in the 2012/13 financial year, the speaker endeavoured to attend all the four council sessions of Mugusu.
3.4 District CouncilorsThe district councilors through their council are vested with various powers and obligations, to determine the growth and development of their constituencies and the district at large. Their roles and responsibilities can be split into two, i.e. legislative and political. In assessing their performance, the district councilors of Kabarole were assessed based on four main parameters, i.e., legislative functions and representation; (ii) contact with the electorate; (iii) participation in lower local governments; and (iv) monitoring service delivery on NPPAs.
In the year under review, Kabarole District Council was made up of 37 councilors including the district chairperson. On a sad note, one of the female councilors – Ms. Halima Wakabu Nakivumbi representing East Division passed on. This means that the total number of councilors scored was 36, out of whom 27 were interviewed. Eight of the remaining 9 councilors declined to be interviewed for assessment and, therefore, secondary data was used to obtain their performance results. One councilor – Hon. Rosemary Kabona representing Persons with Disabilities -- was not interviewed on health grounds. She confessed that due to health problems, she was unable to fulfil her council obligations in the year under review. Hon Kabona was reported to have been sick for the greater part of the year and therefore did not perform to her expectation. It is on this ground that she declined to be interviewed.
Different from last year, the 2012/13 scorecard was marred by various challenges; mostly stemming from the 2011/12 assessment findings. A motion was tabled in the district council plenary to ban the scorecard assessment from the district – a factor that greatly affected councilors’ response to the call. Although 27 out of the 36 councilors were eventually interviewed, it was not an easy job. The exercise thus turned out to be costly in terms of funds and time.

Local Government Councils’ Performance and Public Service Delivery in Uganda: Kabarole District Council Score-Card Report 2012/1328 Local Government Councils’ Performance and Public Service Delivery in Uganda: Kabarole District Council Score-Card Report 2012/13
For the councilors who totally declined to be interviewed, we assessed their performance based on the available data (such as council minutes, visitors’ books and consultation with the community through FGDs). These councilors include: Joseph Mashuruko–Karambi, Emmanuel Tugume – Kasenda, Richard Nyakana– Busoro, Stephen Agaba –Youth, Sylvia Rwabwogo – East Division, Byabasaija Monday – Kisomoro/Rubona TC (woman councilor), Patrick Mugenyi – Kisomoro, John Kyaligonza –Kabonero and Rose Kajubu – Karambi and Mugusu (woman councilor).

Local Government Councils’ Performance and Public Service Delivery in Uganda: Kabarole District Council Score-Card Report 2012/13 29
Legi
slat
ive
role
Cont
act
with
el
ecto
rate
Part
icip
atio
n in
LL
Gs
Del
iver
y on
NPP
AName
Sub-county
Party
Gender
Terms
2011/12
2012/13
% change
Plenary
Committee
Motion
Special skill
Sub total
Meeting electorate
Office
Subtotal
Sub county meetings
Health
Education
Agriculture
Water
Roads
FAL
ENR
Sub Total
Stel
la K
yora
mpe
Buso
ro/H
akib
ale/
Kiju
raN
RM
F1
5584
538
82
018
119
2010
77
37
73
236
Mos
es K
agob
yaBu
hees
iIn
dM
268
8322
88
20
189
918
107
77
77
11
37
Rich
ard
Tatin
aKi
jura
TC
In
dM
154
8354
88
20
1811
920
107
77
77
00
35
Pros
per
Busi
nge
Wes
t D
ivis
ion
Ind
M1
7082
178
82
321
116
178
77
37
70
536
John
Man
ume
Kate
ebw
aN
RM
M2
6480
258
85
122
59
1410
57
75
50
534
Flor
ence
Kad
oma
Buku
ku/
Kara
gura
/Ka
rago
NRM
F
463
7925
88
20
1811
920
107
57
17
31
31
Paul
Kat
isa
PWD
N
RM
M1
6779
188
82
321
99
1810
75
35
55
030
Josh
ua K
agab
aRu
tete
/Kik
o TC
N
RM
M2
7874
-58
82
422
119
2010
77
15
10
122
Patr
ick
Kara
tung
aKi
bito
NRM
M
156
6923
58
00
138
917
105
57
55
11
29
Step
hen
Mun
ihir
aKa
ragu
ruN
RM
M1
6367
68
80
319
49
138
05
57
50
527
Faith
Nya
kair
uSo
uth
Div
isio
n
N
RM
F5
5066
328
85
223
119
208
33
33
01
215
Am
ina
K. K
aija
Kibi
to/
Kabo
nero
/Ki
bito
TC
NRM
F
566
65-2
88
00
169
918
105
15
55
00
21
Den
is
Muk
was
ibw
eRw
imi T
/C
N
RM
M1
6163
38
82
119
119
204
53
11
51
420
Char
les
Ruta
kirw
aKa
wam
baN
RM
M1
5662
118
82
119
96
1510
55
15
10
118
Am
on R
uten
taKi
bito
TC
N
RM
M4
6261
-28
80
016
119
204
55
14
50
121
Tabl
e 11
: Sco
re-c
ard
Per
form
ance
for
Kab
arol
e D
istr
ict
Coun
cilo
rs in
FY
2012
/13

Local Government Councils’ Performance and Public Service Delivery in Uganda: Kabarole District Council Score-Card Report 2012/1330 Local Government Councils’ Performance and Public Service Delivery in Uganda: Kabarole District Council Score-Card Report 2012/13
Legi
slat
ive
role
Cont
act
with
el
ecto
rate
Part
icip
atio
n in
LL
Gs
Del
iver
y on
NPP
A
Name
Sub-county
Party
Gender
Terms
2011/12
2012/13
% change
Plenary
Committee
Motion
Special skill
Sub total
Meeting electorate
Office
Subtotal
Sub county meetings
Health
Education
Agriculture
Water
Roads
FAL
ENR
Sub Total
Jora
n Bi
tany
aSo
uth
Div
isio
n
FD
C
M
170
61-1
38
85
021
116
176
11
13
70
417
Mon
day
Robe
rtso
n H
akib
aale
NRM
M
172
59-1
88
80
016
89
174
54
55
11
122
Ann
et R
. Ku
sem
erer
wa
Buhe
esi
NRM
F
160
58-3
88
23
218
917
43
33
33
01
16
Pasc
al K
ato
Byom
aBu
kuku
NRM
M
250
5714
88
21
198
210
101
50
55
11
18
Ann
ah B
yaba
saija
Rwim
i SC
&TC
NRM
F
372
55-2
45
50
010
99
1810
15
15
50
017
Jose
ph M
ashu
ruko
Kara
mbi
NRM
M
167
53-2
18
82
018
95
1410
11
11
51
111
Esth
er M
atsi
paKa
teeb
wa/
Kara
gura
NRM
F
277
53-3
18
80
016
99
184
33
13
31
115
Ger
trud
e Ba
linda
Rute
ete/
Kase
nda
Ind
F1
2651
968
85
021
49
134
14
04
00
413
Sylv
ia R
wab
wog
oEa
st D
ivis
ion
N
RM
F1
3949
268
85
021
65
1110
11
11
11
17
Rich
ard
Nya
kana
Buso
roN
RM
M1
8148
-41
88
50
210
55
101
01
15
04
12
Am
bros
e Ka
taba
ziRw
imi
NRM
M
157
47-1
85
80
114
59
146
11
51
10
413
Emm
anue
l Tu
gum
eKa
send
aIn
dM
153
43-1
98
85
021
05
54
11
11
50
413
Stel
la K
emig
abo
Yout
h
Ind
F1
3440
181
80
09
59
1410
11
11
10
27
Step
hen
Aga
baYo
uth
N
RM
M1
5040
-20
88
20
180
55
101
11
11
11
7
John
Kya
ligon
zaKa
bone
roN
RM
M1
4038
-58
80
016
05
510
11
11
11
17
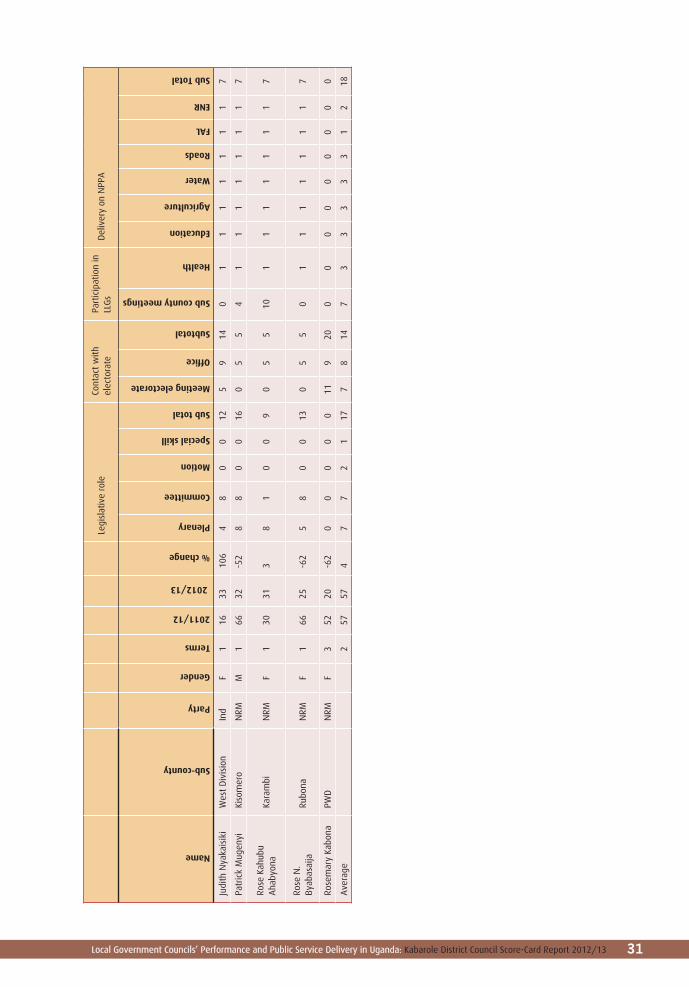
Local Government Councils’ Performance and Public Service Delivery in Uganda: Kabarole District Council Score-Card Report 2012/13 31
Legi
slat
ive
role
Cont
act
with
el
ecto
rate
Part
icip
atio
n in
LL
Gs
Del
iver
y on
NPP
A
Name
Sub-county
Party
Gender
Terms
2011/12
2012/13
% change
Plenary
Committee
Motion
Special skill
Sub total
Meeting electorate
Office
Subtotal
Sub county meetings
Health
Education
Agriculture
Water
Roads
FAL
ENR
Sub Total
Judi
th N
yaka
isik
iW
est
Div
isio
n
In
dF
116
3310
64
80
012
59
140
11
11
11
17
Patr
ick
Mug
enyi
Kiso
mer
oN
RM
M1
6632
-52
88
00
160
55
41
11
11
11
7
Rose
Kah
ubu
Aha
byon
aKa
ram
biN
RM
F1
3031
38
10
09
05
510
11
11
11
17
Rose
N.
Byab
asai
jaRu
bona
NRM
F
166
25-6
25
80
013
05
50
11
11
11
17
Rose
mar
y Ka
bona
PWD
N
RM
F3
5220
-62
00
00
011
920
00
00
00
00
0
Ave
rage
257
574
77
21
177
814
73
33
33
12
18

Local Government Councils’ Performance and Public Service Delivery in Uganda: Kabarole District Council Score-Card Report 2012/1332 Local Government Councils’ Performance and Public Service Delivery in Uganda: Kabarole District Council Score-Card Report 2012/13
3.5 Interpretation of ResultsThe 2013 assessment results exhibited a 50 per cent improvement in the performance of the district councilors. Save for those declined to be interviewed, most of the councilors exhibited better performance in the year under review than they did in the previous assessment. Most of the councilors who performed better attributed their improvement to the ACODE scorecard, saying that the initiative was an eye-opener that enabled them to understand better their expected roles and obligations.
The scorecard results further revealed that all councilors attended most of the council plenary sessions, save for one who attended less than four meetings. Hon. Rosemary Kabona attended only three plenary sessions throughout the year, owing to her illness that affected her performance as a councilor.
Despite attending most of the plenary sessions, not all councilors debated during council meetings. A closer review of the council minutes proved that debating in council was a role reserved for a certain category of councilors. In fact, there were some councilors who hardly debated in plenary throughout the year. Some councilors were only seen to second others’ proposed motions, while others simply registered their attendance.
Improvement was also registered in the councilors’ record keeping and report writing, although this is still below average.
Participation in the lower local government meetings was also above average. Most of the councilors endeavored to attend the lower local government meetings, save for a few who claimed to have poor working relationships with the sub-county leadership. In such cases, the district councilors alleged that they were hardly invited for the sub-county meetings . Education, health and agriculture are the sectors that were monitored most, while FAL and the Natural resource sector were hardly monitored. This could be attributed to a number of factors, including budget allocations, as well as the pressure exerted by the demand side – the electorate.
3.5.1 Endogenous factors affecting performanceThe performance of councilors is contingent upon various factors, some of which are of their own making while others are externally generated
a) Level of education
One of the major internal factors affecting the performance of the councilors is their level of education. In general terms, councilors with higher levels of education performed better under the legislative parameter than their

Local Government Councils’ Performance and Public Service Delivery in Uganda: Kabarole District Council Score-Card Report 2012/13 33
counterparts with the lowest levels of education. However, there are some councilors who performed well despite their low levels of education.
b) Personality
Individual personality and character is yet another factor that was seen to affect the performance of the councilors. Interviews held with the different councilors revealed that individual commitment was a key determining factor for performance. Despite the meagre resources, there are some councilors who are so determined to serve their electorate. Such councilors utilize every available opportunity to execute their obligations such as monitoring government programmes, giving feedback on any new developments to the community as well as sourcing for developmental projects to benefit their electorate. This level of commitment was also exhibited in taking heed of the advice given during the previous assessment such as preparing monitoring reports and making good use of the diaries provided.
c) The district’s local revenue base
Kabarole district revenue base is still very minimal, contributing less than 5 per cent to the district’s total financial base. This is too small to make any substantial contribution to the district’s development. In the year under review, 76 per cent of all the local revenue was expended on debts accruing from the lost court cases and this certainly hindered the implementation of other activities.
3.5.2 Exogenous factors affecting performancea) Dependence on central government funding
Dependence on the central government for the largest part of her financing is one of the greatest factors affecting service delivery in Kabarole District. Local revenue contributes less than 5 per cent of the total district budget, yet only 35per cent of the central government releases can be dispensed unconditionally. Such factors are likely to suffocate the development pace of the district, considering the fact that what government considers as priorities will definitely be adopted as the district’s priorities.
b) Budget cuts
Related to the above factor is the issue of budget cuts. The district develops plans and budgets for proposed programmes but, more often than not, the funds released are less than budgeted, hence impeding implementation of all the proposed programmes. For instance, the development grant for the fourth quarter in the year under review was not released and, as a result,

Local Government Councils’ Performance and Public Service Delivery in Uganda: Kabarole District Council Score-Card Report 2012/1334 Local Government Councils’ Performance and Public Service Delivery in Uganda: Kabarole District Council Score-Card Report 2012/13
planned activities like roads, all shallow wells and classroom construction were rolled over to the next financial year.
c) Unrealistic demands from the electorate
A number of councilors attributed their failure to hold community meetings to the unrealistic demands from the electorate. They alleged that the dependency syndrome introduced by NGOs and other government programmes makes it extremely expensive to hold such meetings, as the invitees tend to expect transport refund and lunch allowances once called upon. Additionally, the people’s lack of awareness about councilors’ duties and obligations exacerbates the problem, as they demand for social support such as school fees for their children. Consequently, there is a tendency for some councilors to shun their constituencies since they cannot meet the demands of their electorate.
d) Meagre facilitation
Nearly all the councilors fronted this as the biggest hindrance to their monitoring role. Though not facilitated, councilors are mandated by the local government act to monitor all government programs. The allowances provided can hardly facilitate a community meeting or even routine monitoring. The councilors have therefore got to look for funds from elsewhere to perform their roles, short of which their roles are compromised.

Local Government Councils’ Performance and Public Service Delivery in Uganda: Kabarole District Council Score-Card Report 2012/13 35
4. GENERAL CONCLUSION AND RECOMMENDATIONS
4.1 ConclusionDependency on central government funding is by far the largest factor affecting service delivery in Kabarole District. The central government is the largest financier of the district’s budget (contributing over 85 per cent) but 65 per cent of the funds are conditional grants. This means that the district can only prioritize programmes dictated by the central government. The locally generated revenue combined with donor funds contributes only 15 per cent of the total budget. The donor funds too are conditioned to specific programmes. BAYLOR support is, for example, tagged to the health sector while PEAS concentrates on education. Sectors with more donor support in the year under review performed better than those with less donor support.
The 2012/13 performance results for Kabarole District Council are evidence that LGSCI is positively impacting the performance of the district’s legislators, hence contributing to improved service delivery. A good number of councilors performed better than they did in the previous financial year and, better still, they were committed to better performance and improvement in the next assessment.
On the other hand, however, some councilors still held reservations for the initiative for fear of affecting their political careers. Others insisted that if the initiative was to realize its objectives, it should not only stop at assessing their performance but rather, should make deliberate efforts to ensure a conducive working environment. A number of recommendations were drawn to this effect – including increment of the councilors’ facilitation allowances, massive sensitization of the electorate to understand the roles and obligations of the elected leaders and the electorate, 40 per cent of the councilors were opposed to the publication of this assessment finding in calendars).

Local Government Councils’ Performance and Public Service Delivery in Uganda: Kabarole District Council Score-Card Report 2012/1336 Local Government Councils’ Performance and Public Service Delivery in Uganda: Kabarole District Council Score-Card Report 2012/13
4.2 Recommendations
4.2.1 Improving the Status of Service DeliveryThere is need to diversify the sources of the district’s local revenue in order to direct resources to meet its development priorities. A number of plans have been drawn to this effect – including the pozolona tax, but a lot more is still desired to step up the district’s financial resources.
4.2.2 Councilors’ remuneration and capacity building programsCouncilors ought to be motivated with modest pay if they are to produce any tangible results. Public campaigns with public address systems and announcements come at a cost. Secondly, refresher courses and induction training should be made compulsory for both new and old councilors if they are going to improve on their performance.

Local Government Councils’ Performance and Public Service Delivery in Uganda: Kabarole District Council Score-Card Report 2012/13 37
ReferencesKabarole District Local Government (2011/12-15)District Development Plan
____________ (2011) Budget Framework Paper (2012/13)
____________ (2012) District Budget and Annual Work Plan
____________ (2012) Internal Audit Report
____________ (2012) State of Environment Report
____________ Minutes for Ordinary Council Meetings held in June, August, November (2012) and, February, April and June (2013)
____________ (2012/13) Kabarole District Revenue Enhancement Plan
Kabarole District Capacity Building Plan.
____________ (2012/13) Kabarole District State of Affairs Report
____________ 2011/12) District Executive Committee (DEC) Minutes
Republic of Uganda (1995) Constitution of the Republic of Uganda
____________ (1997) Local Government Act 1997
____________ (2005) Local Government Amendment Act 2005
____________ (2006) Local Government Amendment Act 2006
____________ Kabarole District Rules of procedures

An
nex
1: S
umm
ary
of C
oun
cils
’ P
erfo
rman
ce (
FY 2
012/
13)
Legi
slat
ive
Role
Acc
ount
abili
ty T
o Ci
tizen
sPl
anni
ng &
Bud
getin
gM
onito
ring
NPP
As
District
2011/12
2012/13
% change
Rules of procedure
Membership ULGA
Functionality of committees
Lawful motions
Ordinances
Conflict resolution
Public hearings
Legislative resources
Petitions
Capacity building
Sub Total
Fiscal accountability
Political accountability
Administrative
accountability
Involvement of CSOs
Principles of accountability
Sub Total
Planning and budgeting
District budget
Local revenue
Sub Total
Education
Health
Water
Roads
Agriculture
FAL
Environment
Sub Total
Wak
iso
7176
72
03
11
12
22
115
36
82
120
54
716
45
34
32
425
Gul
u82
75-9
22
23
01
24
22
204
56
23
205
42
115
53
33
32
24
Mpi
gi67
727
12
33
11
24
01
184
58
20
195
42
115
54
42
04
24
Am
uria
7670
-82
22
33
10
40
219
46
32
318
44
412
45
24
24
021
Ruku
ngiri
6970
12
23
21
12
31
219
45
72
018
54
211
55
34
30
222
Ntu
ngam
o64
698
21
32
11
04
11
164
47
20
175
47
162
33
33
33
20
Neb
bi51
6935
21
32
11
02
13
164
54
23
185
44
135
53
43
02
22
Mba
le55
6824
22
32
01
02
23
174
73
22
185
47
165
32
22
03
17
Muk
ono
7867
-14
21
31
11
22
23
183
53
22
155
46
153
54
31
03
19
Kam
uli
4067
681
02
20
10
31
313
34
62
015
53
412
55
44
43
227
Hoi
ma
4867
402
13
33
12
12
220
24
32
011
54
211
55
44
24
125
Jinja
4466
501
23
11
12
32
319
45
72
119
54
413
22
24
22
115
Moy
o55
6315
22
30
10
04
01
134
65
22
195
42
115
52
22
04
20
Kaba
role
7563
-16
20
33
11
02
02
143
56
20
165
44
133
42
33
23
20
Lira
4962
272
13
30
02
22
318
35
62
016
54
716
03
03
33
012
Mba
rara
5362
171
13
20
00
30
212
33
82
016
54
413
44
22
24
321
Budu
da60
612
21
31
11
12
22
163
73
21
165
44
133
31
42
03
16
Nak
apir
ipiri
t56
619
22
11
10
01
23
134
52
23
165
44
133
41
44
03
19
Soro
ti68
60-1
22
13
00
10
32
315
45
82
221
43
310
22
22
22
214
Bulii
sa57
605
22
33
01
12
01
153
73
20
155
44
134
43
33
00
17
Luw
ero
7060
-14
20
30
01
01
21
104
46
22
185
42
113
34
33
32
21
Kanu
ngu
6757
-15
11
21
11
02
20
114
46
20
165
42
113
32
32
24
19
Mor
oto
5556
22
13
31
11
30
217
26
32
013
54
211
31
32
32
115
Toro
ro40
5538
22
22
11
14
11
172
54
21
145
32
103
40
02
14
14
Aga
go
51
21
31
01
02
12
133
44
20
135
42
112
22
22
22
14
Am
uru
3040
332
21
00
10
21
110
34
32
113
44
917
00
00
00
00
Aver
age
5963
122
13
21
11
31
216
35
52
117
54
413
44
23
22
219

An
nex
2: S
umm
ary
of t
he
Chai
rper
son
s’ P
erfo
rman
ce (
FY 2
012/
13)
Per
form
ance
Polit
ical
Lea
ders
hip
Legi
slat
ive
Role
Cont
act
W
ith
Elec
tora
te
Dev
elop
men
t
Proj
ects
Mon
itori
ng S
ervi
ce D
eliv
ery
On
NPP
As
Name
Gender
District
Political Party
Number of Terms
2011/12
2012/13
% change
DEC
Monitoring admin
State of affairs
Oversight civil servants
Commissions/Boards
Central gov’t
Sub Total
Council
Motions Executive
Bills by Executive
Subtotal
Meetings Electorate
Issues by electorate
Subtotal
Projects initiated
Communal Projects
NGOs
SubTotal
Agriculture
Health
Schools
Roads
Water Sources
FAL
Environment
Sub Total
Rich
ard
Rwab
uhin
gaM
Kaba
role
Ind
180
8911
35
23
24
192
45
115
510
32
510
77
77
71
339
Prsc
ovia
Sal
aam
Mus
umba
FKa
mul
iFD
C1
881
52
22
416
06
713
55
103
25
103
76
67
55
39
Mar
tin O
jara
Map
endu
MG
ulu
FDC
191
88-3
35
24
24
202
45
115
510
32
510
57
57
53
537
Fred
rick
Ngo
bi G
ume
MJin
jaN
RM1
6687
323
52
41
419
26
715
55
103
25
105
55
55
35
33
Mat
ia L
wan
ga B
wan
ika
MW
akis
oD
P1
7082
213
52
42
420
22
37
55
103
21
67
77
57
15
39
Emm
anue
l Osu
naM
Toro
roN
RM2
7882
53
52
42
319
24
511
45
93
15
95
75
55
25
34
John
Mar
y Lu
wak
anya
MM
pigi
NRM
180
800
35
22
24
182
60
85
510
11
57
77
77
70
237
Char
les
K. B
yaba
kam
aM
Ruku
ngiri
NRM
144
8082
33
23
03
142
43
94
59
31
59
76
67
73
339
Fran
cis
Luko
oya
M.
MM
ukon
oN
RM2
8080
02
52
31
417
26
311
55
103
15
93
77
74
05
33
Mar
k A
ol M
usoo
kaM
Mor
oto
NRM
176
783
35
22
22
162
40
65
510
31
59
67
76
60
537
Ant
hony
Om
ach
Atu
beM
Am
uru
NRM
254
7844
34
24
14
182
20
44
59
32
510
56
56
55
537
Geo
rge
Mic
hael
Egu
nyu
MSo
roti
NRM
182
78-5
35
24
24
200
40
45
510
32
510
77
77
30
334
Fran
cis
Olu
ma
MA
mur
iaN
RM1
7478
53
52
32
419
26
311
52
73
15
93
77
75
03
32
Geo
rge
Tink
aman
yire
MH
oim
aN
RM3
6576
173
42
42
419
22
37
55
103
20
55
75
75
33
35
Ale
x O
rem
o A
lot
MLi
raU
PC1
4076
903
42
42
419
26
08
45
93
25
106
66
66
00
30
Deu
sded
it Tu
mus
iime
MM
bara
raN
RM1
7075
73
52
32
419
20
02
35
83
05
86
66
66
44
38
John
Lor
otM
Nak
apir
ipit
NRM
269
759
33
23
24
172
43
95
510
31
59
57
17
52
330
Robe
rt O
kum
uM
Neb
biN
RM1
6574
143
52
42
420
24
06
55
101
23
60
77
77
22
32
Den
is S
inga
haky
eM
Ntu
ngam
oN
RM1
6974
73
52
41
419
24
511
55
103
23
84
35
72
23
26
Bern
ard
M. M
ujas
iM
Mba
leN
RM3
7074
63
32
42
317
24
39
45
92
15
86
37
37
05
31
Jose
phin
e Ka
sya
FKa
nung
uN
RM3
5374
403
42
42
217
22
04
55
103
25
107
37
73
33
33
John
Bap
tist
Nam
besh
eM
Budu
daN
RM1
6271
163
52
42
420
22
37
55
103
25
107
33
33
23
24
Fred
Luk
umu
MBu
liisa
NRM
256
7025
34
12
24
162
60
85
05
32
510
67
77
30
131
Abd
ul N
addu
liM
Luw
eero
NRM
363
6910
35
24
24
202
20
45
510
32
05
55
57
50
330
Jimm
y O
kudi
Vuk
oni
MM
oyo
Ind
152
6219
35
24
24
202
60
85
27
31
04
72
26
22
223
Pete
r O
dok
W'O
ceng
MA
gago
NRM
147
112
51
32
316
00
00
30
33
25
102
22
62
22
18
Ave
rage
267
7719
35
23
24
182
42
85
49
32
49
56
66
52
333

Local Government Councils’ Performance and Public Service Delivery in Uganda: Kabarole District Council Score-Card Report 2012/13
An
nex
3: S
umm
ary
of D
istr
ict
Spea
kers
’ P
erfo
rman
ce F
Y 20
12/
13
Per
form
ance
Pres
idin
g A
nd P
rese
rvat
ion
Of
Ord
er In
Co
unci
lCo
ntac
t W
ith
Elec
tora
tePa
rtic
ipat
ion
In L
LGM
onito
ring
NPP
As
Name
Political Party
District
sub county
Gender
Terms
2011/12
2012/13
% Change
Chairing council
Rules of procedure
Business Committee
Records book
Record of motions
special skills
Sub Total
Meetings with Electorate
Coordinating center
Sub Total
Participation in LLG
Health
Education
Agriculture
Water
Roads
FAL
Environment
Sub total
Sam
uel B
amw
ole
NRM
Kam
uli
Naw
anya
goM
387
37
32
30
1811
920
107
77
77
04
39
Pete
r D
ougl
as O
kello
NRM
Gul
uLa
logi
M1
8984
-63
93
23
525
119
208
55
51
55
531
Jam
es K
ezaa
la K
unob
wa
NRM
Muk
ono
Seet
a N
amug
anga
M2
7379
83
63
23
320
79
1610
55
75
33
533
Julie
t Je
mba
NRM
Mpi
giM
udum
a/Ki
ring
ente
F2
4078
953
63
23
017
119
2010
77
15
70
431
Muh
amm
ed M
afab
iIn
dM
bale
Bubw
angu
M2
7577
33
43
23
217
119
2010
33
77
35
230
Mar
tin O
cen
Ody
ekU
PCLi
raRa
ilway
M1
2675
188
39
32
35
253
69
27
77
77
31
39
Dan
Nab
iman
yaN
RMN
tung
amo
Ruko
ni W
est
M1
6675
143
93
23
020
99
1810
71
55
50
427
Hen
ry N
dyab
ahik
aN
RMRu
kung
iriBu
hung
aM
264
7517
39
32
30
205
914
67
65
57
14
35
Rich
ard
May
engo
NRM
Jinja
Maf
ubir
a B
M3
6873
73
93
23
222
89
178
55
51
15
426
Pros
covi
a N
aman
saN
RMLu
wer
oKa
tikam
u/F
364
7314
39
30
30
1811
920
107
70
47
00
25
Idda
Fua
mbe
NRM
Neb
biN
yara
vur/
Ate
goF
468
737
39
32
22
219
918
107
10
73
15
24
Dau
di B
yekw
aso
Muk
iibi
NRM
Wak
iso
Kaki
riM
375
73-3
29
32
30
199
918
105
57
05
04
26
Jam
es P
aul M
ichi
NRM
Toro
roEa
ster
n D
iv.
M1
3269
116
26
32
35
217
916
23
34
55
55
30
Chris
toph
er O
dong
kara
NRM
Am
uru
Pabb
oM
151
6935
29
30
30
179
918
66
27
47
11
28
Char
les
Eche
mu
Engo
ruN
RMA
mur
iaA
sam
ukM
241
6866
29
00
32
166
915
107
74
50
04
27
Char
les
Besh
esya
NRM
Kanu
ngu
M1
6168
113
93
23
020
119
202
55
15
51
426
Clov
is M
ugab
oN
RMKa
baro
leM
ugus
uM
254
6622
39
32
32
2211
920
105
15
11
01
14
Did
an A
mam
aIn
dBu
liisa
Ngw
edo
M1
3165
110
36
20
00
1111
920
07
73
37
34
34
Nat
han
Kitw
e Is
ingo
ma
NRM
Hoi
ma
Busi
siM
133
6494
39
32
32
227
916
61
33
37
12
20
Will
iam
K. T
ibam
anya
NRM
Mba
rara
Ru
gand
oM
158
6410
39
32
30
207
916
25
51
55
14
26
Mic
hael
Mat
syet
sye
NRM
Budu
daBu
mas
heti
M2
3563
803
63
23
017
116
174
14
55
51
425
Mar
tin C
haig
aN
RMM
oyo
Moy
oM
244
6343
39
22
30
1911
920
07
70
13
15
24
And
rew
Odo
ngo
FDC
Soro
tiW
/Div
M1
6160
-23
93
23
525
119
204
21
11
11
411
Ceas
ar L
omet
oN
RMM
orot
oYo
uth
M1
4954
103
62
23
016
79
166
35
50
11
116
Joth
am L
oyor
NRM
Nak
apiri
pirit
Kako
mon
gole
M3
6244
-29
34
22
30
147
29
43
51
51
11
17
John
Bos
tify
Ow
eka
FDC
Aga
goO
mot
M1
232
63
03
014
02
20
11
11
11
17
Ave
rage
255
6838
38
32
31
199
817
65
44
44
23
26

Local Government Councils’ Performance and Public Service Delivery in Uganda: Kabarole District Council Score-Card Report 2012/13 41
Publications in this SeriesNamara-Wamanga, S., et.al., (2013). Local Government Councils’ Performance and Public Service Delivery in Uganda: Luwero District Council Score-Card Report 2011/12. ACODE Public Service Delivery and Accountability Report Series
No.1, 2013. Kampala.
Muyomba-Tamale, L., et.al., (2013). Local Government Councils’ Performance and Public Service Delivery in Uganda: Mpigi District Council Score-Card Report 2011/12. ACODE Public Service Delivery and Accountability Report Series
No.2, 2013. Kampala.
Namara-Wamanga, S., et.al., (2013). Local Government Councils’ Performance and Public Service Delivery in Uganda: Wakiso District Council Score-Card Report 2011/12. ACODE Public Service Delivery and Accountability Report Series
No.3, 2013. Kampala.
Otile, O., M., et.al., (2013). Local Government Councils’ Performance and Public Service Delivery in Uganda: Amuru District Council Score-Card Report 2011/12. ACODE Public Service Delivery and Accountability Report Series No.4, 2013. Kampala.
Owor, A., et.al., (2013). Local Government Councils’ Performance and Public Service Delivery in Uganda: Gulu District Council Score-Card Report 2011/12. ACODE Public Service Delivery and Accountability Report Series No.5, 2013. Kampala.
Egunyu, M., et.al., (2013). Local Government Councils’ Performance and Public Service Delivery in Uganda: Mbale District Council Score-Card Report 2011/12. ACODE Public Service Delivery and Accountability Report Series No.6, 2013. Kampala.
Mbabazi, J., et.al., (2013). Local Government Councils’ Performance and Public Service Delivery in Uganda: Lira District Council Score-Card Report 2011/12. ACODE Public Service Delivery and Accountability Report Series No.7,
2013. Kampala.
Asimo, N., et.al., (2013). Local Government Councils’ Performance and Public Service Delivery in Uganda: Kamuli District Council Score-Card Report 2011/12. ACODE Public Service Delivery and Accountability Report Series No.8, 2013. Kampala.
Bainomugisha, A., et.al., (2013). Local Government Councils’ Performance and Public Service Delivery in Uganda: Mbarara District Council Score-Card

Local Government Councils’ Performance and Public Service Delivery in Uganda: Kabarole District Council Score-Card Report 2012/1342 Local Government Councils’ Performance and Public Service Delivery in Uganda: Kabarole District Council Score-Card Report 2012/13
Report 2011/12. ACODE Public Service Delivery and Accountability Report Series No.9, 2013. Kampala.
Ssemakula, E., et.al., (2013). Local Government Councils’ Performance and Public Service Delivery in Uganda: Tororo District Council Score-Card Report 2011/12. ACODE Public Service Delivery and Accountability Report Series No.10, 2013. Kampala.
Muyomba-Tamale, L., et.al., (2013). Local Government Councils’ Performance and Public Service Delivery in Uganda: Mukono District Council Score-Card Report 2011/12. ACODE Public Service Delivery and Accountability Report Series, No.11 , 2013. Kampala.
Mbabazi, J., et.al., (2013). Local Government Councils’ Performance and Public Service Delivery in Uganda: Nebbi District Council Score-Card Report 2011/12. ACODE Public Service Delivery and Accountability Report Series, No.12 , 2013. Kampala.
Asimo, N., et.al., (2013). Local Government Councils’ Performance and Public Service Delivery in Uganda: Jinja District Council Score-Card Report 2011/12. ACODE Public Service Delivery and Accountability Report Series, No.13 , 2013. Kampala.
Mbabazi, J., et.al. (2013). Local Government Councils’ Performance and Public Service Delivery in Uganda: Lira District Council Score-Card Report 2012/13. ACODE Public Service Delivery and Accountability Report Series No.14, 2013. Kampala.
Namara, S., W., et.al. (2013). Local Government Councils’ Performance and Public Service Delivery in Uganda: Luwero District Council Score-Card Report 2012/13. ACODE Public Service Delivery and Accountability Report Series No.15, 2013. Kampala.
Muyomba, L., T., et.al. (2013). Local Government Councils’ Performance and Public Service Delivery in Uganda: Mpigi District Council Score-Card Report 2012/13. ACODE Public Service Delivery and Accountability Report Series No.16, 2013. Kampala.
Muyomba, L., T., et.al. (2013). Local Government Councils’ Performance and Public Service Delivery in Uganda: Mukono District Council Score-Card Report 2012/13. ACODE Public Service Delivery and Accountability Report Series No.17, 2013. Kampala.
Namara, S., W., et.al. (2013). Local Government Councils’ Performance and Public Service Delivery in Uganda: Wakiso District Council Score-Card Report

Local Government Councils’ Performance and Public Service Delivery in Uganda: Kabarole District Council Score-Card Report 2012/13 43
2012/13. ACODE Public Service Delivery and Accountability Report Series No.18, 2013. Kampala.
Owori, A., et.al. (2013). Local Government Councils’ Performance and Public Service Delivery in Uganda: Gulu District Council Score-Card Report 2012/13. ACODE Public Service Delivery and Accountability Report Series No.19, 2013. Kampala
Owori, A., et.al. (2013). Local Government Councils’ Performance and Public Service Delivery in Uganda: Gulu District Council Score-Card Report 2012/13. ACODE Public Service Delivery and Accountability Report Series No.19, 2013. Kampala.
Otile, M., O., et.al. (2013). Local Government Councils’ Performance and Public Service Delivery in Uganda: Gulu District Council Score-Card Report 2012/13. ACODE Public Service Delivery and Accountability Report Series No.20, 2013. Kampala.
Mbabazi, J., et.al. (2014). Local Government Councils’ Performance and Public Service Delivery in Uganda: Agago District Council Score-Card Report 2012/13. ACODE Public Service Delivery and Accountability Report Series No.21, 2014. Kampala.
Mbabazi, J., et.al. (2014). Local Government Councils’ Performance and Public Service Delivery in Uganda: Nebbi District Council Score-Card Report 2012/13. ACODE Public Service Delivery and Accountability Report Series No.22, 2014. Kampala.
Ssemakula, E., G., et.al. (2014). Local Government Councils’ Performance and Public Service Delivery in Uganda: Moroto District Council Score-Card Report 2012/13. ACODE Public Service Delivery and Accountability Report Series No.23, 2014. Kampala.
Ssemakula, E., G., et.al. (2014). Local Government Councils’ Performance and Public Service Delivery in Uganda: Nakapiripirit District Council Score-Card Report 2012/13. ACODE Public Service Delivery and Accountability Report Series No.24, 2014. Kampala.
Asimo, N., et.al. (2014). Local Government Councils’ Performance and Public Service Delivery in Uganda: Kamuli District Council Score-Card Report 2012/13. ACODE Public Service Delivery and Accountability Report Series No.25, 2014. Kampala.
Egunyu, M., et.al. (2014). Local Government Councils’ Performance and Public Service Delivery in Uganda: Bududa District Council Score-Card Report

Local Government Councils’ Performance and Public Service Delivery in Uganda: Kabarole District Council Score-Card Report 2012/1344 Local Government Councils’ Performance and Public Service Delivery in Uganda: Kabarole District Council Score-Card Report 2012/13
2012/13. ACODE Public Service Delivery and Accountability Report Series No.26, 2014. Kampala.
Owor, E., et.al., (2014). Local Government Councils’ Performance and Public Service Delivery in Uganda: Tororo District Council Score-Card Report 2012/13. ACODE Public Service Delivery and Accountability Report Series No.27, 2014. Kampala.
Asimo, N., Lusala, J., B., (2014). Local Government Councils’ Performance and Public Service Delivery in Uganda: Jinja District Council Score-Card Report 2012/13. ACODE Public Service Delivery and Accountability Report Series No.28, 2014. Kampala.
Asiku, M., et.al. (2014). Local Government Councils’ Performance and Public Service Delivery in Uganda: Buliisa District Council Score-Card Report 2012/13. ACODE Public Service Delivery and Accountability Report Series No.29, 2014. Kampala.
Natamba, E., F., et.al. (2014). Local Government Councils’ Performance and Public Service Delivery in Uganda: Ntungamo District Council Score-Card Report 2012/13. ACODE Public Service Delivery and Accountability Report Series No.30, 2014. Kampala.

Local Government Councils’ Performance and Public Service Delivery in Uganda: Kabarole District Council Score-Card Report 2012/13
ABOUT THE AUTHORS
Angela Ssenabulya Byangwa is a Ugandan lawyer and the Executive Director of Rwenzori Anti-Corruption Coalition. She holds a Degree in Law from Makerere University and a Diploma in Legal Practice from Law Development Centre. Angela has vast knowledge and working experience of 9 years in governance, policy analysis, monitoring and evaluation and anti-corruption as well as strategic planning and management. She is an Alumnus of the Les Aspin Center for Government of United States of America, the Danish Fellowship Center in Denmark and the TCDC center in Arusha, Tanzania.
Victoria Namugga Busiinge is a Communications and Documentation Officer for Rwenzori Anti-Corruption Coalition (RAC) and Chief Editor of The TRACK – a quarterly newsletter of RAC . She previously worked with the Center for Conflict Resolution, Rwenzori Forum for Peace and Justice, Rwenzori Association for NGOs and Networks. Victoria holds a Bachelor’s Degree in Development Studies from Makerere University and numerous trainings in human rights, democracy, peace building and conflict resolution.
Advocates Coalition for Development and Environment
Plot 96, Kanjokya Street, Kamwokya
P. O. Box 29836, Kampala
Tel: +256 312 812150
Email: [email protected]; [email protected]
Website: www.acode-u.org
ISBN: 978 9970 34 029 3
9 7 8 9 9 7 0 3 4 0 2 0 09 7 8 9 9 7 0 3 4 0 2 1 79 7 8 9 9 7 0 3 4 0 2 2 49 7 8 9 9 7 0 3 4 0 2 3 19 7 8 9 9 7 0 3 4 0 2 4 89 7 8 9 9 7 0 3 4 0 2 5 59 7 8 9 9 7 0 3 4 0 2 6 29 7 8 9 9 7 0 3 4 0 2 7 99 7 8 9 9 7 0 3 4 0 2 8 69 7 8 9 9 7 0 3 4 0 2 9 3