Loading of nutrient from a land-based fish farm(Orbetello, Italy) at different times
12
UNCORRECTED PROOF 1 Loading of nutrient from a land based fish farm 2 (Orbetello, Italy) at different times 3 S. PORRELLO 1,* , M. LENZI 2 , G. FERRARI 1 , E. PERSIA 1 , 4 F. SAVELLI 1 and P. TOMASSETTI 1 5 1 Central Institute for Marine Research (ICRAM) Via di Casalotti, 300-00166 Rome, 6 Italy; 2 Lagoon Ecology and Aquaculture Laboratory (LEALab), OPL s.r.l. Orbetello, 7 Italy; * Author for correspondence (e-mail: [email protected]; phone: +6-61-57-04- 8 16; fax: +6-61-56-19-06) 9 Received 27 October 2003; accepted 19 February 2004 10 Abstract. A marine fish farm (production ~100 tonnes per year) located in the Orbetello 11 lagoon area (Tuscany, Italy) was selected to study the waste water quality discharged. 12 The aims of study were: a) quantify the nitrogen and phosphorus discharged from fish 13 farm at the beginning and the end of feeding time; b) verify nutrient trend during a daily 14 cycle, and difference of release between nitrogen and phosphorus by reared biomass. 15 From June 1999 to May 2000, water temperature, pH, salinity, dissolved oxygen and 16 redox were hourly recorded in output wastewater station (E). Two water sampling 17 strategy were adopted: (1) monthly, in E, two field water samples at 8:00 a.m. (E8), at 18 the beginning of feeding, and at 4:00 p.m. (E16), at the end of feeding time, were 19 collected. The dissolved and particulate nitrogen and phosphorus were analysed. Re- 20 spect to total dissolved nitrogen (TDN), the total ammonia (NH 3 +NH 4 + ) concen- 21 tration constituted more than 64%. Respect to total nitrogen and phosphorus, the 22 particulated component represented, respectively, the 16% and 29–36%. (2) A 24 h 23 water sampling, at 4:00, 10:00, 12:00 a.m and p.m., was carried out. The results showed 24 that TDN was excreted shortly after feeding, with a peak 4 h after the end of feeding. 25 The most of total dissolved phosphorus (TDP) was excreted after many hours, with a 26 peak 8 h after the end of feeding. 27 Key words: Ammonia, Aquaculture wastewater, Fish nutrient excretion, Marine 28 fish-farm, Nitrogen, Phosphorus 30 Introduction 31 Nitrogenous and phosphorus are important waste products of fish 32 farms. Ammoniotelism is the predominant process of N excretion in 33 marine teleost (Forster and Goldstein, 1969). Ammonia is excreted 34 mainly through the gills and represents 75 to over 85% of the nitrogen 35 loss, while phosphorus is mainly excreted as phosphate by the kidney 36 (Handy and Poxton, 1993). Metabolic waste concentration may reach Journal : AQUI Dispatch : 29-5-2004 Pages : 12 PIPS No. : 5379027 h LE h TYPESET MS Code : AQUI FO6 h CP h DISK 4 4 Aquaculture International 00: 00–00, 2004. Ó 2004 Kluwer Academic Publishers. Printed in the Netherlands. UNCORRECTED PROOF! PDF-OUTPUT
-
Upload
independent -
Category
Documents
-
view
0 -
download
0
Transcript of Loading of nutrient from a land-based fish farm(Orbetello, Italy) at different times
UNCO
RRECTEDPR
OOF
1 Loading of nutrient from a land based fish farm
2 (Orbetello, Italy) at different times
3 S. PORRELLO1,*, M. LENZI2, G. FERRARI1, E. PERSIA1,4 F. SAVELLI1 and P. TOMASSETTI1
5 1Central Institute for Marine Research (ICRAM) Via di Casalotti, 300-00166 Rome,6 Italy; 2Lagoon Ecology and Aquaculture Laboratory (LEALab), OPL s.r.l. Orbetello,7 Italy; *Author for correspondence (e-mail: [email protected]; phone: +6-61-57-04-
8 16; fax: +6-61-56-19-06)
9 Received 27 October 2003; accepted 19 February 2004
10 Abstract. A marine fish farm (production ~100 tonnes per year) located in the Orbetello11 lagoon area (Tuscany, Italy) was selected to study the waste water quality discharged.
12 The aims of study were: a) quantify the nitrogen and phosphorus discharged from fish13 farm at the beginning and the end of feeding time; b) verify nutrient trend during a daily14 cycle, and difference of release between nitrogen and phosphorus by reared biomass.
15 From June 1999 to May 2000, water temperature, pH, salinity, dissolved oxygen and16 redox were hourly recorded in output wastewater station (E). Two water sampling17 strategy were adopted: (1) monthly, in E, two field water samples at 8:00 a.m. (E8), at
18 the beginning of feeding, and at 4:00 p.m. (E16), at the end of feeding time, were19 collected. The dissolved and particulate nitrogen and phosphorus were analysed. Re-20 spect to total dissolved nitrogen (TDN), the total ammonia (NH3+NH4
+) concen-21 tration constituted more than 64%. Respect to total nitrogen and phosphorus, the
22 particulated component represented, respectively, the 16% and 29–36%. (2) A 24 h23 water sampling, at 4:00, 10:00, 12:00 a.m and p.m., was carried out. The results showed24 that TDN was excreted shortly after feeding, with a peak 4 h after the end of feeding.
25 The most of total dissolved phosphorus (TDP) was excreted after many hours, with a26 peak 8 h after the end of feeding.
27 Key words: Ammonia, Aquaculture wastewater, Fish nutrient excretion, Marine
28 fish-farm, Nitrogen, Phosphorus
30 Introduction
31 Nitrogenous and phosphorus are important waste products of fish32 farms. Ammoniotelism is the predominant process of N excretion in33 marine teleost (Forster and Goldstein, 1969). Ammonia is excreted34 mainly through the gills and represents 75 to over 85% of the nitrogen35 loss, while phosphorus is mainly excreted as phosphate by the kidney36 (Handy and Poxton, 1993). Metabolic waste concentration may reach
Journal : AQUI Dispatch : 29-5-2004 Pages : 12
PIPS No. : 5379027h LE h TYPESET
MS Code : AQUI FO6 h CP h DISK4 4
Aquaculture International 00: 00–00, 2004.� 2004 Kluwer Academic Publishers. Printed in the Netherlands.
UNCORRECTED
PROOF!
PDF-OUTPUT
UNCO
RRECTEDPR
OOF
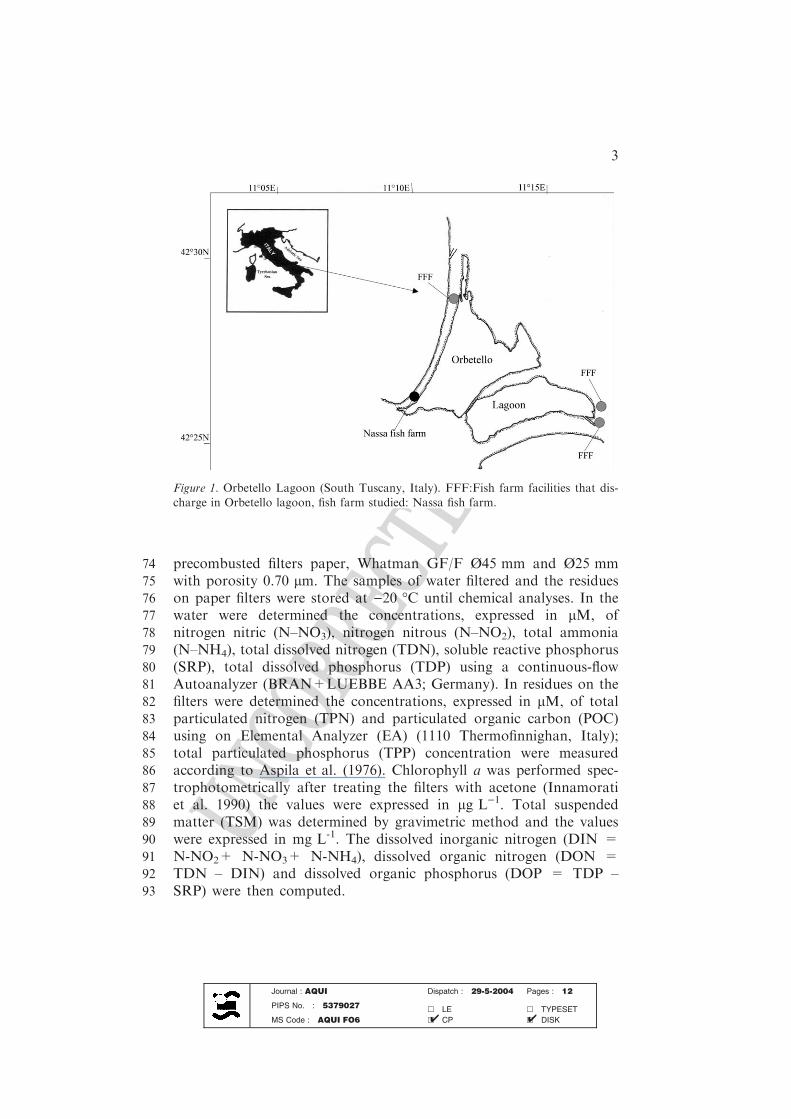
37 high level in tanks since to limit fish growth and survival (Guerin-38 Ancey, 1976; Handy and Poxton, 1993), as well as may produce pol-39 lution in close aquatic environment.40 Over the last 30 years, the Orbetello lagoon area (South Tuscany,41 Italian West Coast) has seen the development of intensive fish farming42 carried on by land based farms which withdraw water from the lagoon43 itself and from brackish water table (Lenzi, 1992). In this lagoon there44 are four intensive land-based fish farming facilities (Figure 1) which45 have a total wastewater outflow of about 51.7 · 106 m3 per year, re-46 cently estimated as the equivalent of 132.2 tonnes per year of nitrogen47 and 6.7 tonnes per year of phosphorus (Lenzi et al., 2004). The result is48 a strong environmental impact leading to an extensive cyclic growth of49 opportunistic macrochlorophyceae, which cause serious degeneration50 processes in Spring and Summer (Bombelli and Lenzi, 1996). The aims51 of the study were: a) quantify the nitrogen and phosphorus discharged52 into the lagoon (final receiving body) from fish farm at the beginning53 and the end of feeding time; b) verify nutrient trend during a daily cycle,54 and difference of release between nitrogen and phosphorus by reared55 biomass.
56 Materials and methods
57 An intensive fish farm located near the sea-lagoon canal of Nassa58 (Figure 1) was investigated. This farm produces about 100 tonnes per59 year of European sea bass (Dicentrarchus labrax L.) and gilt head sea60 bream (Sparus aurata, L.) in 450 m2 soft PVC tanks, with a total volume61 of 9000 m3. The wastewater are conveyed into four phytotreatment62 ponds, and then discharges into the nearby sea-lagoon canal. The63 feeding regime is standardised from 8:00 a.m. to 4:00 p.m., and depends64 on seasonal conditions. In the fish farm, during the study period, the65 total biomass reared and the total food supply were recorded; food66 conversion ratio (FCR) was calculated.
67 Monthly sampling strategy
68 To observe the daytime nutrient variations, a sampling station (E) was69 placed at discharged point of fish farm. Monthly, between June 199970 and May 2000, quadruple samples of fish farm wastewater were col-71 lected at 8:00 a.m. (E8) and at 4:00 p.m. (E16).72 Water samples were immediately transferred to the laboratory73 where determined volumes were filtered through a preweighted and
Journal : AQUI Dispatch : 29-5-2004 Pages : 12
PIPS No. : 5379027h LE h TYPESET
MS Code : AQUI FO6 h CP h DISK4 4
2
UNCO
RRECTEDPR
OOF
74 precombusted filters paper, Whatman GF/F Ø45 mm and Ø25 mm75 with porosity 0.70 lm. The samples of water filtered and the residues76 on paper filters were stored at )20 �C until chemical analyses. In the77 water were determined the concentrations, expressed in lM, of78 nitrogen nitric (N–NO3), nitrogen nitrous (N–NO2), total ammonia79 (N–NH4), total dissolved nitrogen (TDN), soluble reactive phosphorus80 (SRP), total dissolved phosphorus (TDP) using a continuous-flow81 Autoanalyzer (BRAN+LUEBBE AA3; Germany). In residues on the82 filters were determined the concentrations, expressed in lM, of total83 particulated nitrogen (TPN) and particulated organic carbon (POC)84 using on Elemental Analyzer (EA) (1110 Thermofinnighan, Italy);85 total particulated phosphorus (TPP) concentration were measured86 according to Aspila et al. (1976). Chlorophyll a was performed spec-87 trophotometrically after treating the filters with acetone (Innamorati88 et al. 1990) the values were expressed in lg L)1. Total suspended89 matter (TSM) was determined by gravimetric method and the values90 were expressed in mg L-1. The dissolved inorganic nitrogen (DIN =91 N-NO2+ N-NO3+ N-NH4), dissolved organic nitrogen (DON =92 TDN – DIN) and dissolved organic phosphorus (DOP = TDP –93 SRP) were then computed.
Figure 1. Orbetello Lagoon (South Tuscany, Italy). FFF:Fish farm facilities that dis-charge in Orbetello lagoon, fish farm studied: Nassa fish farm.
Journal : AQUI Dispatch : 29-5-2004 Pages : 12
PIPS No. : 5379027h LE h TYPESET
MS Code : AQUI FO6 h CP h DISK4 4
3
UNCO
RRECTEDPR
OOF
94 Twenty-four hours sampling strategy
95 Todescribe the releasenutrient trendsduring24 h,a tankwithcommercial96 size fishes (350–500 g) was selected. In February, two samples were97 collectedonwater inflow(I) andonwateroutflow(O) fromthe tankat4:0098 a.m., 8:00a.m., 12:00a.m., 4:00p.m., 8:00p.m., 12:00p.m.Theparameters99 analysed were TDN and TDP. To define the fish nutrient excretion the
100 result obtained in O was subtracted of the result obtained in I.
101 Hydrology
102 In order to determine water mass discharges from fish farming, total103 tanks volume and water flow rate (in each rearing tank) were consid-104 ered. A propeller type current meter (OTT mod. C2; data processed105 using BEAVER2 software) was used. The results were processed using a106 mathematical model composed by a system of ordinary differential107 equations, simulating the variation of the substance concentration in-108 side each tank, where a uniformly dissolved substance was considered109 (Tchobanoglous and Schroeder, 1985). The mean residence time (MRT)110 was calculated by the water flow rate and the tank volume.
111 Physical and physico-chemical parameters
112 The physico-chemical parameters were measured using a multiparam-113 eter probe (HYDROLAB, Data sonde 3) located at station E. Data114 were recorded hourly. The parameters examined in water were:115 temperature (T �C), pH, salinity (PSU), dissolved oxygen expressed as116 saturation percentage (DO).
117 Results
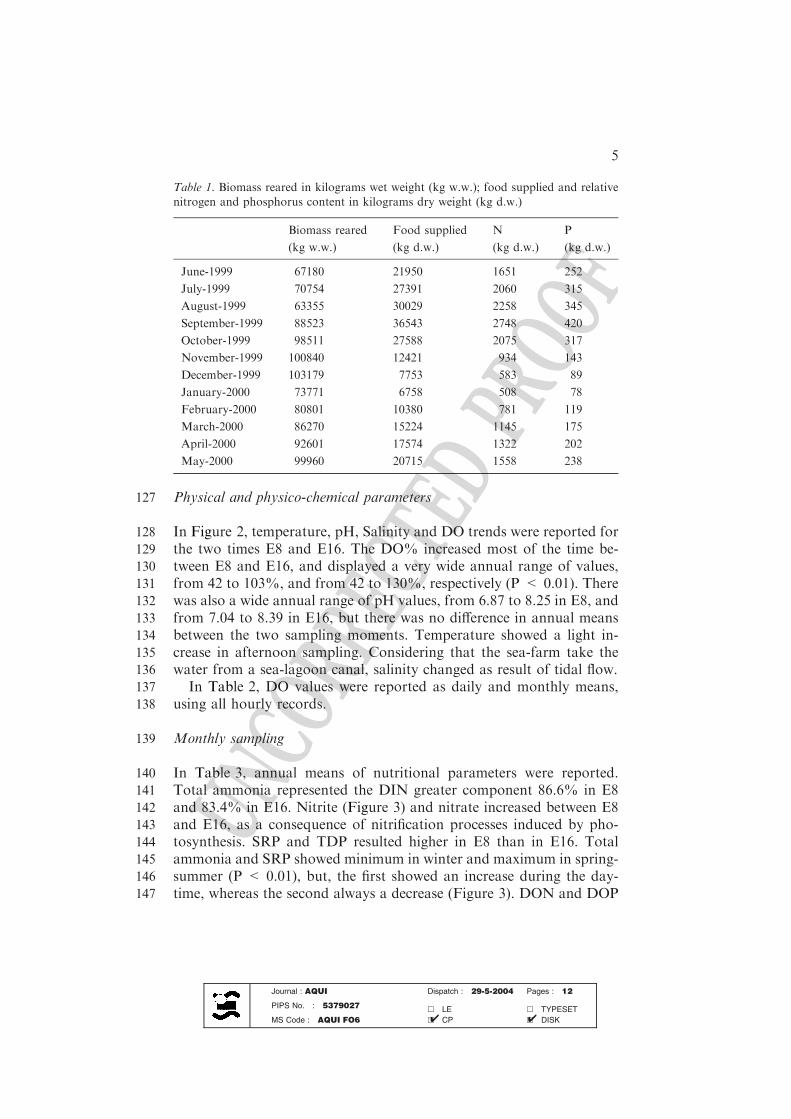
118 Monthly biomass reared, food quantity supplied (dry weight) and rel-119 ative nitrogen and phosphorus contents are reported in Table 1. The120 annual FCR resulted 1:2.5. The food supply data recorded showed a121 significant correlation (P < 0.01) with the nitrogen and phosphorus122 parameters and with temperature, pH and dissolved oxygen data.123 Increasing food supply the dissolved oxygen and pH decreased.
124 Hydrology
125 The mean residence time (MRT) resulted 8 h for each rearing tank with126 a 1.34 water renewals per day.
Journal : AQUI Dispatch : 29-5-2004 Pages : 12
PIPS No. : 5379027h LE h TYPESET
MS Code : AQUI FO6 h CP h DISK4 4
4
UNCO
RRECTEDPR
OOF
127 Physical and physico-chemical parameters
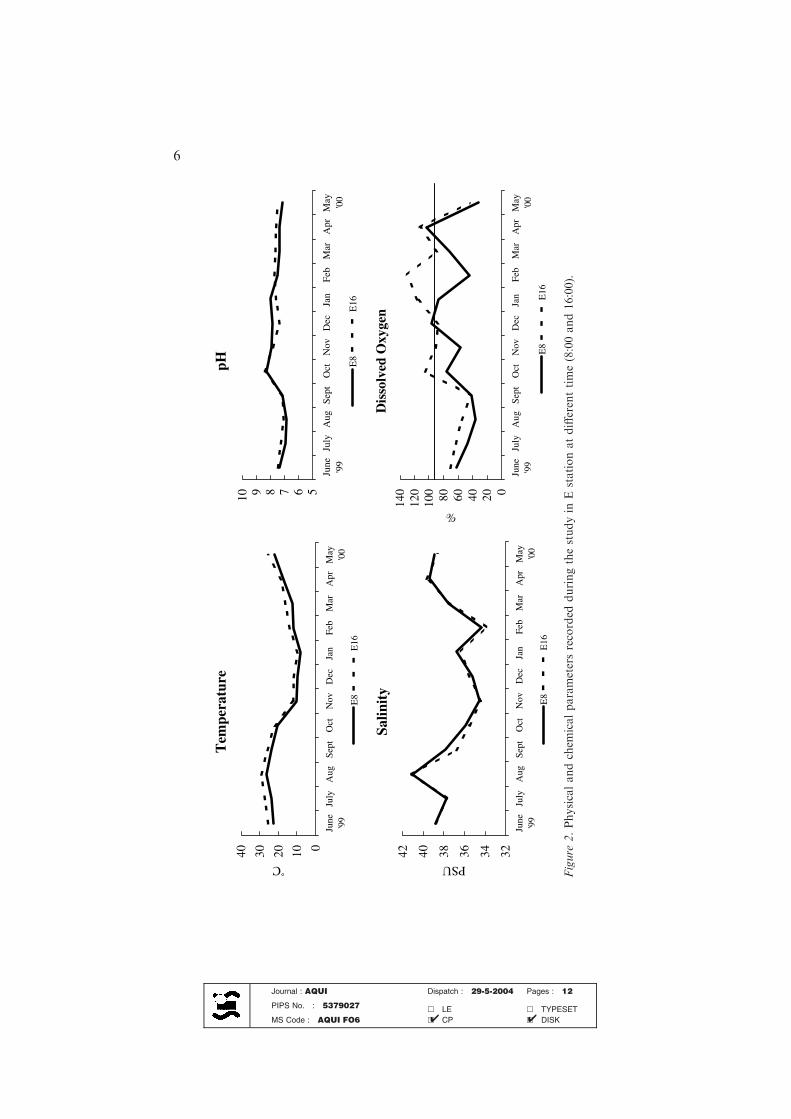
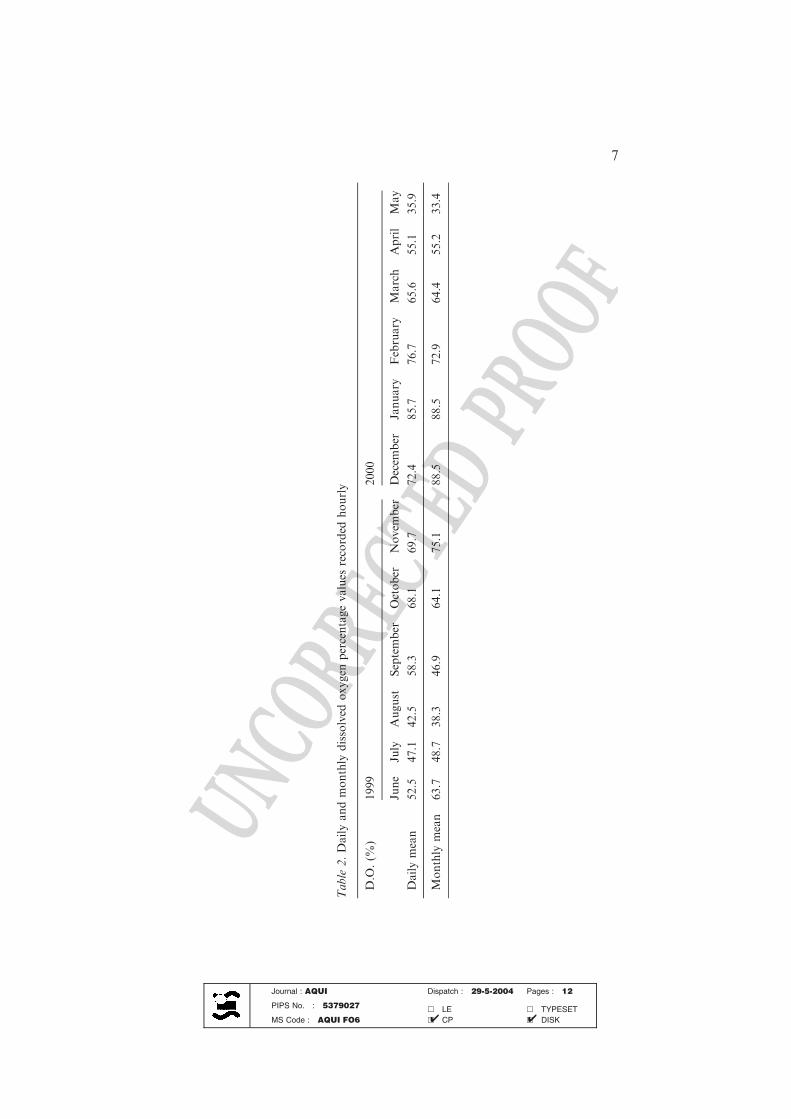
128 In Figure 2, temperature, pH, Salinity and DO trends were reported for129 the two times E8 and E16. The DO% increased most of the time be-130 tween E8 and E16, and displayed a very wide annual range of values,131 from 42 to 103%, and from 42 to 130%, respectively (P < 0.01). There132 was also a wide annual range of pH values, from 6.87 to 8.25 in E8, and133 from 7.04 to 8.39 in E16, but there was no difference in annual means134 between the two sampling moments. Temperature showed a light in-135 crease in afternoon sampling. Considering that the sea-farm take the136 water from a sea-lagoon canal, salinity changed as result of tidal flow.137 In Table 2, DO values were reported as daily and monthly means,138 using all hourly records.
139 Monthly sampling
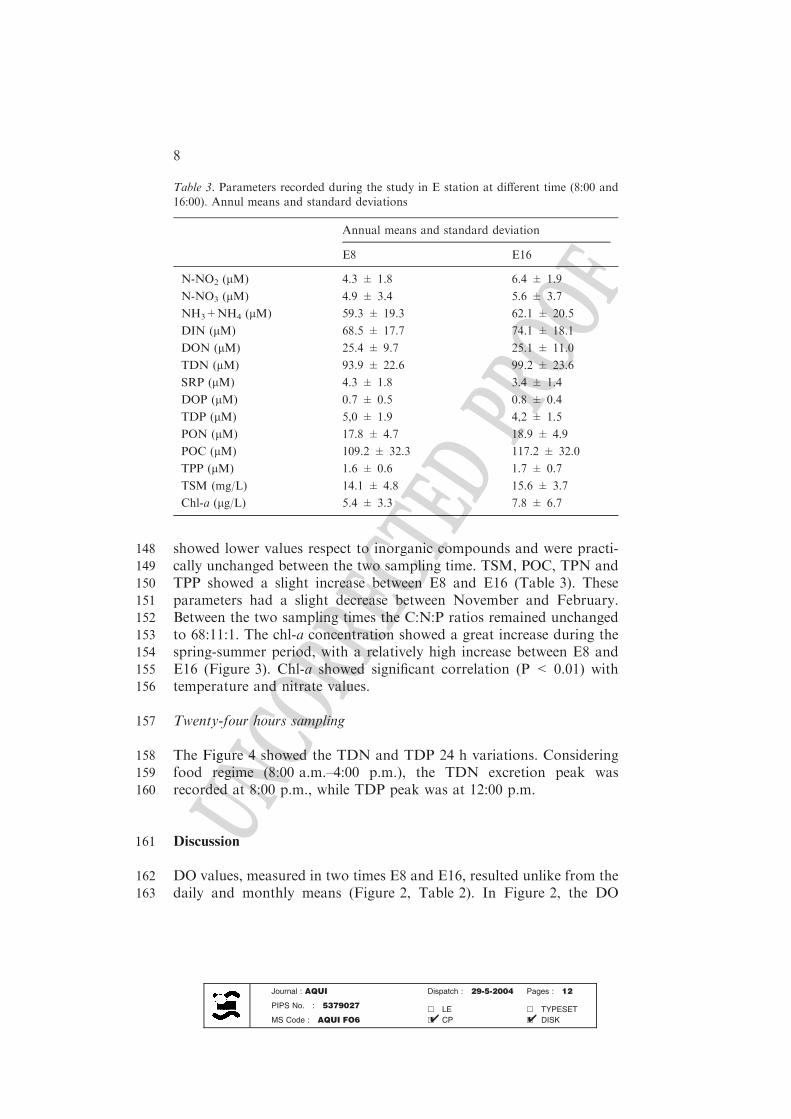
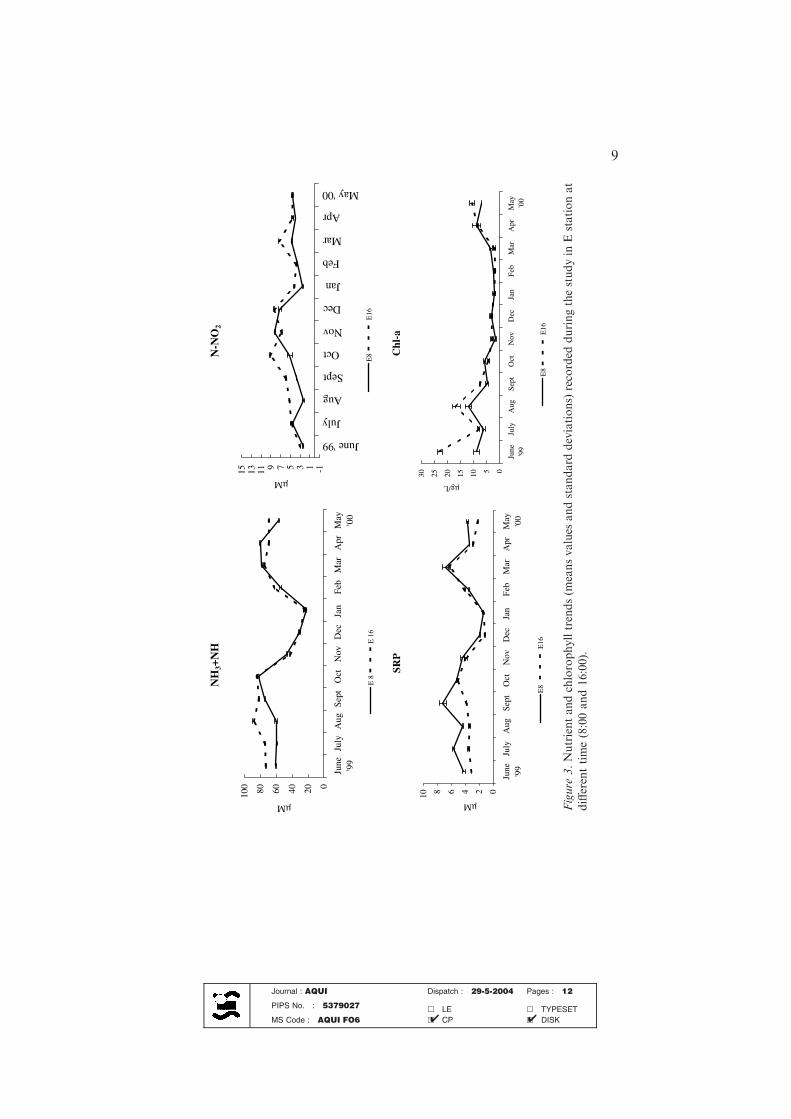
140 In Table 3, annual means of nutritional parameters were reported.141 Total ammonia represented the DIN greater component 86.6% in E8142 and 83.4% in E16. Nitrite (Figure 3) and nitrate increased between E8143 and E16, as a consequence of nitrification processes induced by pho-144 tosynthesis. SRP and TDP resulted higher in E8 than in E16. Total145 ammonia and SRP showed minimum in winter and maximum in spring-146 summer (P < 0.01), but, the first showed an increase during the day-147 time, whereas the second always a decrease (Figure 3). DON and DOP
Table 1. Biomass reared in kilograms wet weight (kg w.w.); food supplied and relativenitrogen and phosphorus content in kilograms dry weight (kg d.w.)
Biomass reared
(kg w.w.)
Food supplied
(kg d.w.)
N
(kg d.w.)
P
(kg d.w.)
June-1999 67180 21950 1651 252
July-1999 70754 27391 2060 315
August-1999 63355 30029 2258 345
September-1999 88523 36543 2748 420
October-1999 98511 27588 2075 317
November-1999 100840 12421 934 143
December-1999 103179 7753 583 89
January-2000 73771 6758 508 78
February-2000 80801 10380 781 119
March-2000 86270 15224 1145 175
April-2000 92601 17574 1322 202
May-2000 99960 20715 1558 238
Journal : AQUI Dispatch : 29-5-2004 Pages : 12
PIPS No. : 5379027h LE h TYPESET
MS Code : AQUI FO6 h CP h DISK4 4
5
UNCO
RRECTEDPR
OOF
Tem
pera
ture
010203040
June '99
July
Aug
Sept
Oct
Nov
Dec
Jan
Feb
Mar
Apr
May '00
˚C
E8
E16
E8
E16
pH
5678910
June
'99
July
Aug
Sept
Oct
Nov
Dec
Jan
Feb
Mar
Apr
May '00
E8
E16
Salin
ity
323436384042
June '99
July
Aug
Sept
Oct
Nov
Dec
Jan
Feb
Mar
Apr
May '00
PSU
Dis
solv
ed O
xyge
n
020406080100
120
140
June '99
July
Aug
Sept
Oct
Nov
Dec
Jan
Feb
Mar
Apr
May '00
%
E8
E16
Figure
2.Physicalandchem
icalparametersrecorded
duringthestudyin
Estationatdifferenttime(8:00and16:00).
Journal : AQUI Dispatch : 29-5-2004 Pages : 12
PIPS No. : 5379027h LE h TYPESET
MS Code : AQUI FO6 h CP h DISK4 4
6
UNCO
RRECTEDPR
OOF
Table
2.Dailyandmonthly
dissolved
oxygen
percentagevalues
recorded
hourly
D.O
.(%
)1999
2000
June
July
August
September
October
Novem
ber
Decem
ber
January
February
March
April
May
Dailymean
52.5
47.1
42.5
58.3
68.1
69.7
72.4
85.7
76.7
65.6
55.1
35.9
Monthly
mean
63.7
48.7
38.3
46.9
64.1
75.1
88.5
88.5
72.9
64.4
55.2
33.4
Journal : AQUI Dispatch : 29-5-2004 Pages : 12
PIPS No. : 5379027h LE h TYPESET
MS Code : AQUI FO6 h CP h DISK4 4
7
UNCO
RRECTEDPR
OOF
148 showed lower values respect to inorganic compounds and were practi-149 cally unchanged between the two sampling time. TSM, POC, TPN and150 TPP showed a slight increase between E8 and E16 (Table 3). These151 parameters had a slight decrease between November and February.152 Between the two sampling times the C:N:P ratios remained unchanged153 to 68:11:1. The chl-a concentration showed a great increase during the154 spring-summer period, with a relatively high increase between E8 and155 E16 (Figure 3). Chl-a showed significant correlation (P < 0.01) with156 temperature and nitrate values.
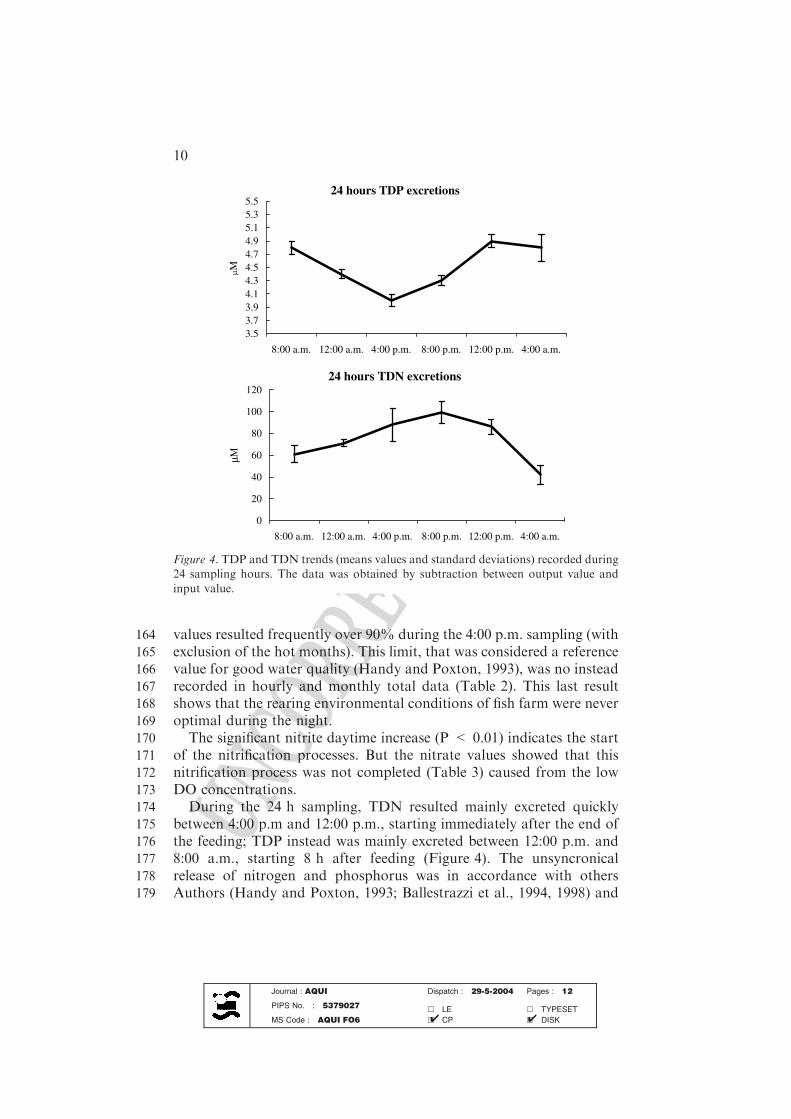
157 Twenty-four hours sampling
158 The Figure 4 showed the TDN and TDP 24 h variations. Considering159 food regime (8:00 a.m.–4:00 p.m.), the TDN excretion peak was160 recorded at 8:00 p.m., while TDP peak was at 12:00 p.m.
161 Discussion
162 DO values, measured in two times E8 and E16, resulted unlike from the163 daily and monthly means (Figure 2, Table 2). In Figure 2, the DO
Table 3. Parameters recorded during the study in E station at different time (8:00 and16:00). Annul means and standard deviations
Annual means and standard deviation
E8 E16
N-NO2 (lM) 4.3 ± 1.8 6.4 ± 1.9
N-NO3 (lM) 4.9 ± 3.4 5.6 ± 3.7
NH3+NH4 (lM) 59.3 ± 19.3 62.1 ± 20.5
DIN (lM) 68.5 ± 17.7 74.1 ± 18.1
DON (lM) 25.4 ± 9.7 25.1 ± 11.0
TDN (lM) 93.9 ± 22.6 99.2 ± 23.6
SRP (lM) 4.3 ± 1.8 3.4 ± 1.4
DOP (lM) 0.7 ± 0.5 0.8 ± 0.4
TDP (lM) 5,0 ± 1.9 4,2 ± 1.5
PON (lM) 17.8 ± 4.7 18.9 ± 4.9
POC (lM) 109.2 ± 32.3 117.2 ± 32.0
TPP (lM) 1.6 ± 0.6 1.7 ± 0.7
TSM (mg/L) 14.1 ± 4.8 15.6 ± 3.7
Chl-a (lg/L) 5.4 ± 3.3 7.8 ± 6.7
Journal : AQUI Dispatch : 29-5-2004 Pages : 12
PIPS No. : 5379027h LE h TYPESET
MS Code : AQUI FO6 h CP h DISK4 4
8
UNCO
RRECTEDPR
OOF
NH
3+N
H
020406080100
June '99
July
Aug
Sept
Oct
Nov
Dec
Jan
Feb
Mar
Apr
May
'00
µM
E 8
E 1
6
N-N
O2
-113579111315
June '99
July
Aug
Sept
Oct
Nov
Dec
Jan
Feb
Mar
Apr
May '00
µM
E8
E16
SRP
0246810
June
'99
July
Aug
Sept
Oct
Nov
Dec
Jan
Feb
Mar
Apr
May
'00
µM
E8
E16
Chl
-a
051015202530
June '99
July
Aug
Sept
Oct
Nov
Dec
Jan
Feb
Mar
Apr
May '00
µg/L
E8
E16
Figure
3.Nutrientandchlorophylltrends(m
eansvalues
andstandard
deviations)
recorded
duringthestudyin
Estationat
differenttime(8:00and16:00).
Journal : AQUI Dispatch : 29-5-2004 Pages : 12
PIPS No. : 5379027h LE h TYPESET
MS Code : AQUI FO6 h CP h DISK4 4
9
UNCO
RRECTEDPR
OOF
164 values resulted frequently over 90% during the 4:00 p.m. sampling (with165 exclusion of the hot months). This limit, that was considered a reference166 value for good water quality (Handy and Poxton, 1993), was no instead167 recorded in hourly and monthly total data (Table 2). This last result168 shows that the rearing environmental conditions of fish farm were never169 optimal during the night.170 The significant nitrite daytime increase (P < 0.01) indicates the start171 of the nitrification processes. But the nitrate values showed that this172 nitrification process was not completed (Table 3) caused from the low173 DO concentrations.174 During the 24 h sampling, TDN resulted mainly excreted quickly175 between 4:00 p.m and 12:00 p.m., starting immediately after the end of176 the feeding; TDP instead was mainly excreted between 12:00 p.m. and177 8:00 a.m., starting 8 h after feeding (Figure 4). The unsyncronical178 release of nitrogen and phosphorus was in accordance with others179 Authors (Handy and Poxton, 1993; Ballestrazzi et al., 1994, 1998) and
24 hours TDP excretions
3.53.73.94.14.34.54.74.95.15.35.5
8:00 a.m. 12:00 a.m. 4:00 p.m. 8:00 p.m. 12:00 p.m. 4:00 a.m.
µM
24 hours TDN excretions
0
20
40
60
80
100
120
8:00 a.m. 12:00 a.m. 4:00 p.m. 8:00 p.m. 12:00 p.m. 4:00 a.m.
µM
Figure 4. TDP and TDN trends (means values and standard deviations) recorded during24 sampling hours. The data was obtained by subtraction between output value andinput value.
Journal : AQUI Dispatch : 29-5-2004 Pages : 12
PIPS No. : 5379027h LE h TYPESET
MS Code : AQUI FO6 h CP h DISK4 4
10
UNCO
RRECTEDPR
OOF
180 was further supported from the annual mean between E8 and E16. In181 fact, during the feeding time TDN showed a 5.6% increase and TDP182 instead showed a – 17.2% decrease.183 The undissociated ammonia concentrations recorded represent a184 critical factor for reared fish and for output water quality that is con-185 veyed outside the fish-farm towards the Orbetello lagoon. Applying the186 formula reported in Bower and Bidwell (1978), was possible to calculate187 undissociated ammonia in function of total dissolved ammonia for188 variable values of temperature and pH to constant salinity. Considering189 0.021 mg L)1 (1.50 lM) concentration limit level of N-NH3 as safety190 limit for marine fish life (Handy and Poxton 1993), this limit was ex-191 ceeded 12.5% respect to total ammonia data collected during the study.192 Ammonia levels dramatically also vary after feeding (Poxton and193 Allouse 1987; Poxton and Lloyd 1989). Applying the regression equa-194 tions reported in Porrello et al. (2003a), the total ammonia concentra-195 tions data vs food supplied were plotted. The results showed a 86.2% of196 total ammonia variability was function of food supplied. In this con-197 dition, 2.5 FCR must be considered a very high value. Therefore the198 achievement of dangerous concentration limits for the reared fishes was199 more likely to arise from poor farming practise. The use of intermediate200 phytotreatment volumes favours the atmospheric dispersion of the201 undissociated ammonia, as a result of volatilisation processes deter-202 mined by the pH conditions (Porrello et al., 2003a), and produces an203 nutritional load abatement (Porrello et al., 2003b,c). But in a sensitive204 coastal area as Orbetello lagoon, the reduction of intensive conditions205 (30–40 kg m)3 of fish biomass, at the end of rearing cycle) must be206 considered a good control measures to protect the natural environment207 and to safeguard the developing aquaculture industry, according to208 better animal welfare.
209 References
210 Aspila, K.I., Agemiam, H. and Chau, A.S.Y. 1976. A semiautomated method for the211 determination of inorganic, organic and total phosphate in sediments. Analyst 101:
212 187–197.213 Ballestrazzi, R., Lanari, D., D’Agaro, E. and Mion, A. 1994. The effect of dietary214 protein level and source on growth, body composition, total ammonia and reactive
215 phosphate excretion of growing sea-bass (Dicentrarchus labrax, L.). Aquaculture216 127: 197–206.217 Ballestrazzi, R., Lanari, D. and D’Agaro, E. 1998. Performance, nutrient retention218 efficiency, total ammonia and reactive phosphorus excretion of growing European
219 sea-bass (Dicentrarchus labrax, L.) as affected by diet processing and feeding level.220 Aquaculture 161: 55–65.
Journal : AQUI Dispatch : 29-5-2004 Pages : 12
PIPS No. : 5379027h LE h TYPESET
MS Code : AQUI FO6 h CP h DISK4 4
11
UNCO
RRECTEDPR
OOF
221 Bombelli, V. and Lenzi, M. 1996. Italy. The Orbetello Lagoon and the Tuscany Coast.
222 In: Schramm and Nienhuis (eds.), Marine Benthic Vegetation, Vol. 123. Springer-223 Verlag, Ecological Studies, Berlin Heiderlberg, pp. 331–337.224 Bower, C.E. and Bidwell, J.P. 1978. Ionization of ammonia in sea water effects of
225 temperature, pH, and salinity on Salmo salar L. J. Fish. Res. Board Can. 35: 1012–226 1016.227 Forster, R.P. and Goldstein, L. 1969. Formation of excretory products. In Hoar W.S.
228 and Randall, D.J. (eds.), Fish Physioplogy, Vol. 1. Academic Press, New York, pp.229 313–50.230 Guerin-Ancey, O. 1976. Etude experimentale de l’excretion azotee du bar (Dicentrarchus231 labrax, L.) en cours de croissance. I. Effects de la temperature et du poids du corps
232 sur l’excretion. Aquaculture 9: 71–80.233 Handy, R.D. and Poxton, M.G. 1993. Nitrogen pollution in mariculture: toxicity and234 excretion of nitrogenous compounds by marine fish. Review of Fisheries and
235 Biological Fisheries 3: 205–241.236 Innamorati, M., Ferrari, I., Marino, D. and Ribera D’Alcala, M. 1990. Metodi237 nell’ecologia del plancton marino. Nova Thalassia 11: 372.
238 Lenzi, M. 1992. Experiences for the management of Orbetello Lagoon: eutrophication239 and fishing. Science of the Total Environment (Suppl. 1992), Elsevier Science Publ.240 B.V. Amsterdam, pp. 1189–1198.
241 Lenzi, M., Palmieri, R. and Porrello, S. 2004. Restoration of the eutrophic Orbetello242 lagoon (Tyrrhenian Sea, Italy): water quality management. Marine Pollution243 Bulletin 46: 1540–1548.244 Porrello, S., Ferrari, G., Lenzi, M. and Persia, E. 2003a. Ammonia variations in
245 phytotreatment ponds of land-based fish farm wastewater. Aquaculture 219:246 485–494.247 Porrello, S., Lenzi, M., Tomassetti, P., Persia, E., Finoia, M. G. and Mercatali, I. 2003b.
248 Eutrophication by intensive aquaculture using a phytotreatment pond system. I.249 Dissolved and particulate nitrogen and phoshorus. Aquaculture 219: 515–529.250 Porrello, S., Lenzi, M., Persia, E., Tomassetti, P., Finoia, M.G. and Mercatali, I. 2003c.
251 Eutrophication by intensive aquaculture using a phytotreatment pond system. II.252 Nitrogen and phosphorus content in pond macroalgae and sediment. Aquaculture253 219: 531–544.
254 Poxton, M.G. and Allouse, S.B. 1987. Cyclical fluctuations in ammonia and nitrite-255 nitrogen resulting from the feeding of turbot, Scophthalmus maximus (L.), in256 recirculating systems. Aquaculture Engineering 6: 301–22.257 Poxton, M.G. and Lloyd, N.J. 1989. Fluctuations in ammonia by eel (Anguilla anguilla
258 L.) as a result of feeding strategy. In: De Pawn N., Jaspers E., Ackerfors, H. and259 Wilkins, N. (eds.), Aquaculture – A Biotechnology in Progress. European260 Aquaculture Society, Bredene, Belgium, pp. 1125–35.
261 Tchobanoglous G. and Schroeder E.D. 1985. Water Quality. Addison Wesley, Reading,262 Mass., 768 pp.
Journal : AQUI Dispatch : 29-5-2004 Pages : 12
PIPS No. : 5379027h LE h TYPESET
MS Code : AQUI FO6 h CP h DISK4 4
12