
Lithospheric structure of the Aegean obtained from P and S receiver functions
23
Lithospheric structure of the Aegean obtained from P and S receiver functions F. Sodoudi, 1 R. Kind, 1,2 D. Hatzfeld, 3 K. Priestley, 4 W. Hanka, 1 K. Wylegalla, 1 G. Stavrakakis, 5 A. Vafidis, 6 H.-P. Harjes, 7 and M. Bohnhoff 1 Received 6 July 2005; revised 2 August 2006; accepted 8 September 2006; published 27 December 2006. [1] Combined P and S receiver functions from seismograms of teleseismic events recorded at 65 temporary and permanent stations in the Aegean region are used to map the geometry of the subducted African and the overriding Aegean plates. We image the Moho of the subducting African plate at depths ranging from 40 km beneath southern Crete and the western Peloponnesus to 160 km beneath the volcanic arc and 220 km beneath northern Greece. However, the dip of the Moho of the subducting African plate is shallower beneath the Peloponnesus than beneath Crete and Rhodes and flattens out beneath the northern Aegean. Observed P-to-S conversions at stations located in the forearc indicate a reversed velocity contrast at the Moho boundary of the Aegean plate, whereas this boundary is observed as a normal velocity contrast by the S-to-P conversions. Our modeling suggests that the presence of a large amount of serpentinite (more than 30%) in the forearc mantle wedge, which generally occurs in the subduction zones, may be the reason for the reverse sign of the P-to-S conversion coefficient. Moho depths for the Aegean plate show that the southern part of the Aegean (crustal thickness of 20–22 km) has been strongly influenced by extension, while the northern Aegean Sea, which at present undergoes the highest crustal deformation, shows a relatively thicker crust (25–28 km). This may imply a recent initiation of the present kinematics in the Aegean. Western Greece (crustal thickness of 32–40 km) is unaffected by the recent extension but underwent crustal thickening during the Hellenides Mountains building event. The depths of the Aegean Moho beneath the margin of the Peloponnesus and Crete (25–28 and 25–33 km, respectively) show that these areas are also likely to be affected by the Aegean extension, even though the Cyclades (crustal thickness of 26–30 km) were not significantly involved in this episode. The Aegean lithosphere-asthenosphere boundary (LAB) mapped with S receiver functions is about 150 km deep beneath mainland Greece, whereas the LAB of the subducted African plate dips from 100 km beneath Crete and the southern Aegean Sea to about 225 km under the volcanic arc. This implies a thickness of 60–65 km for the subducted African lithosphere, suggesting that the Aegean lithosphere was not significantly affected by the extensional process associated with the exhumation of metamorphic core complexes in the Cyclades. Citation: Sodoudi, F., R. Kind, D. Hatzfeld, K. Priestley, W. Hanka, K. Wylegalla, G. Stavrakakis, A. Vafidis, H.-P. Harjes, and M. Bohnhoff (2006), Lithospheric structure of the Aegean obtained from P and S receiver functions, J. Geophys. Res., 111, B12307, doi:10.1029/2005JB003932. 1. Introduction [2] The crustal and upper mantle structures of the Aegean are the result of a complex tectonic history that started probably during the late Cretaceous [e.g., McKenzie, 1972] and resulted in the subduction of Africa beneath Eurasia, the building of mountain belts and the creation of stretched regions. The present-day kinematics and deformation are reasonably well known because of the large number of GPS measurements covering the Aegean [e.g., Le Pichon et al., 1995; Reilinger et al., 1997; McClusky et al., 2000]. However, the present-day kinematics is certainly different from that of the past, as is attested by the large amount of JOURNAL OF GEOPHYSICAL RESEARCH, VOL. 111, B12307, doi:10.1029/2005JB003932, 2006 Click Here for Full Articl e 1 GeoForschungsZentrum Potsdam, Potsdam, Germany. 2 Also at Department of Geophysics, Freie Universita ¨t Berlin, Berlin, Germany. 3 Laboratoire des Geophysique Interne et Tectonophysique, Grenoble, France. 4 Bullard Laboratory, Cambridge, UK. 5 National Observatory of Athens, Athens, Greece. 6 Department of Mineral Resources Engineering, Technical University of Chania, Chania, Greece. 7 Department of Geosciences, Ruhr-University Bochum, Bochum, Germany. Copyright 2006 by the American Geophysical Union. 0148-0227/06/2005JB003932$09.00 B12307 1 of 23
Transcript of Lithospheric structure of the Aegean obtained from P and S receiver functions

Lithospheric structure of the Aegean obtained from P and S
receiver functions
F. Sodoudi,1 R. Kind,1,2 D. Hatzfeld,3 K. Priestley,4 W. Hanka,1 K. Wylegalla,1
G. Stavrakakis,5 A. Vafidis,6 H.-P. Harjes,7 and M. Bohnhoff1
Received 6 July 2005; revised 2 August 2006; accepted 8 September 2006; published 27 December 2006.
[1] Combined P and S receiver functions from seismograms of teleseismic eventsrecorded at 65 temporary and permanent stations in the Aegean region are used to map thegeometry of the subducted African and the overriding Aegean plates. We image the Mohoof the subducting African plate at depths ranging from 40 km beneath southern Crete andthe western Peloponnesus to 160 km beneath the volcanic arc and 220 km beneathnorthern Greece. However, the dip of the Moho of the subducting African plate isshallower beneath the Peloponnesus than beneath Crete and Rhodes and flattens outbeneath the northern Aegean. Observed P-to-S conversions at stations located in theforearc indicate a reversed velocity contrast at the Moho boundary of the Aegean plate,whereas this boundary is observed as a normal velocity contrast by the S-to-P conversions.Our modeling suggests that the presence of a large amount of serpentinite (more than30%) in the forearc mantle wedge, which generally occurs in the subduction zones, maybe the reason for the reverse sign of the P-to-S conversion coefficient. Moho depths for theAegean plate show that the southern part of the Aegean (crustal thickness of 20–22 km)has been strongly influenced by extension, while the northern Aegean Sea, which atpresent undergoes the highest crustal deformation, shows a relatively thicker crust(25–28 km). This may imply a recent initiation of the present kinematics in the Aegean.Western Greece (crustal thickness of 32–40 km) is unaffected by the recent extension butunderwent crustal thickening during the Hellenides Mountains building event. The depthsof the Aegean Moho beneath the margin of the Peloponnesus and Crete (25–28 and25–33 km, respectively) show that these areas are also likely to be affected by the Aegeanextension, even though the Cyclades (crustal thickness of 26–30 km) were notsignificantly involved in this episode. The Aegean lithosphere-asthenosphere boundary(LAB) mapped with S receiver functions is about 150 km deep beneath mainland Greece,whereas the LAB of the subducted African plate dips from 100 km beneath Crete andthe southern Aegean Sea to about 225 km under the volcanic arc. This implies a thicknessof 60–65 km for the subducted African lithosphere, suggesting that the Aegeanlithosphere was not significantly affected by the extensional process associated with theexhumation of metamorphic core complexes in the Cyclades.
Citation: Sodoudi, F., R. Kind, D. Hatzfeld, K. Priestley, W. Hanka, K. Wylegalla, G. Stavrakakis, A. Vafidis, H.-P. Harjes, and
M. Bohnhoff (2006), Lithospheric structure of the Aegean obtained from P and S receiver functions, J. Geophys. Res., 111, B12307,
doi:10.1029/2005JB003932.
1. Introduction
[2] The crustal and upper mantle structures of the Aegeanare the result of a complex tectonic history that startedprobably during the late Cretaceous [e.g., McKenzie, 1972]and resulted in the subduction of Africa beneath Eurasia, thebuilding of mountain belts and the creation of stretchedregions. The present-day kinematics and deformation arereasonably well known because of the large number of GPSmeasurements covering the Aegean [e.g., Le Pichon et al.,1995; Reilinger et al., 1997; McClusky et al., 2000].However, the present-day kinematics is certainly differentfrom that of the past, as is attested by the large amount of
JOURNAL OF GEOPHYSICAL RESEARCH, VOL. 111, B12307, doi:10.1029/2005JB003932, 2006ClickHere
for
FullArticle
1GeoForschungsZentrum Potsdam, Potsdam, Germany.2Also at Department of Geophysics, Freie Universitat Berlin, Berlin,
Germany.3Laboratoire des Geophysique Interne et Tectonophysique, Grenoble,
France.4Bullard Laboratory, Cambridge, UK.5National Observatory of Athens, Athens, Greece.6Department of Mineral Resources Engineering, Technical University
of Chania, Chania, Greece.7Department of Geosciences, Ruhr-University Bochum, Bochum,
Germany.
Copyright 2006 by the American Geophysical Union.0148-0227/06/2005JB003932$09.00
B12307 1 of 23

rotation that the Hellenic arc experienced since the Oligo-cene [Kissel and Laj, 1988].[3] During the past 3–5 million years, the Aegean has
been moving to the southwest with respect to Eurasia at anaverage velocity of �3.5 cm/yr across the Hellenic trench[e.g., McKenzie, 1972; Jackson and McKenzie, 1988;McClusky et al., 2000] and has lead to the northwardsubduction of the African lithosphere beneath the Aegean[Papazachos and Comninakis, 1969]. Relative to Eurasiathe African lithosphere is converging at a rate of �1 cm/yr[DeMets et al., 1990], whereas the Aegean is extending at arate of �3 cm/yr (Figure 1). To a first approximation, themotion of the Aegean relative to Eurasia can be described asthe superposition of a rigid rotation of Anatolia and the localextension that affects the Aegean probably related to theslab retreat [Le Pichon and Angelier, 1979]. Data fromsatellite geodesy [Kahle et al., 1998], seismicity [Ekstromand England, 1989; Hatzfeld et al., 1997; Jackson et al.,1994], sediments infillings and deformation [Mascle and
Martin, 1990; Mercier et al., 1989] all show that at present,the crustal deformation is highest in the northern AegeanSea along the North Aegean Trough and is also concentratedin grabens located west and east of the Aegean region[Armijo et al., 1996].[4] Details of earlier episodes of Aegean deformation are
less well known. It is likely that prior to the Oligo-Miocenetime, the slow convergence between Africa and Eurasia wasaccommodated by the northward dipping subduction of theAfrican lithosphere along an E-W trending boundary. Dur-ing the Oligo-Miocene time, extension started in the south-ern Aegean as attested by the creation of deep basins[Mascle and Martin, 1990] and the exhumation of meta-morphic core complexes mostly in the Cyclades [e.g.,Gautier and Brun, 1994]. This earlier mode of extensionwas greatest in the Sea of Crete where it reaches a factor oftwo [McKenzie, 1978; Angelier et al., 1982], and it isresponsible for the curvature of the Hellenic arc. Thisextension is consistent with paleomagnetic rotations of rock
Figure 1. Location map of the seismological stations used in this study. Hexagons denote the locationof both NOA and sfg stations. Small circles indicate epicenters of the shallow and intermediate (mb �4.5) depth earthquakes [Engdahl et al., 1988]. Locations of the Hellenic trench and the North AegeanTrough are drawn with black solid lines. Dashed line denotes location of the volcanic arc. The arrowsindicate the direction of the motion relative to Eurasia [McClusky et al., 2000].
B12307 SODOUDI ET AL.: LITHOSPHERIC STRUCTURE OF THE AEGEAN
2 of 23
B12307
units in the opposite sense observed on the east and westsides of the Aegean [e.g., Kissel and Laj, 1988]. This earlierepisode of deformation was discontinuous both in time andin space [Mercier et al., 1989]. Unlike the present episodeof deformation, the North Anatolian fault (initiated andactive only since the Pliocene time) was not involved inthis earlier deformation.[5] The nature of the forces responsible for the complex
motion of the Aegean is a subject of debate. Deformationmay result from forces applied to the edges of rigid blocks[e.g., Taymaz et al., 1991], from forces acting within themantle [e.g., Makris, 1976], from buoyancy forces [e.g., LePichon et al., 1982; Hatzfeld et al., 1997], from the suddenslab retreat due to a tear in the subducting slab [Sorel et al.,1988; Jolivet, 2001], or some combination of these. Higher-resolution images of the seismic structure to deeper depthsthan previously available will help resolve these questions.[6] The lithospheric structure in the Aegean area has been
the focus of many studies. Traveltime analysis from local andregional earthquakes [Panagiotopoulos and Papazachos,1985] resulted in a broad-scale averaged picture of thecrustal structure. Refraction profiles mapped the shallowstructure beneath specific areas in the Aegean [Makris,1973, 1978; Makris and Stobbe, 1984; Delibasis et al.,1988; Bohnhoff et al., 2001; Clement et al., 2004], but thefew data that do exist are of varying quality. The mosthomogeneous image of the Aegean lithospheric velocitystructure is deduced from tomographic studies at the scaleof the Aegean [Spakman, 1986; Spakman et al., 1988;Drakatos and Drakopoulos, 1991; Spakman et al., 1993;Papazachos et al., 1995; Papazachos and Nolet, 1997].These large-scale teleseismic and regional studies are com-plemented by more detailed local tomographic studies usingtraveltime arrivals recorded by local network [Christodoulouand Hatzfeld, 1988; Ligdas et al., 1990; Ligdas and Main,1991; Ligdas and Lees, 1993]. These studies all assume alayered starting velocity structure divided into blocks ofvarious sizes and compute lateral variation in the velocitystructure. Therefore a traveltime delay for a specific blockcould be due either to a real low relative velocity zone in theblock or to a variation in the thickness of the block. For thisreason, tomography may not be the most appropriate tool tomap the Moho depth over a large area.[7] Maps of the Moho topography derived from gravity
data image the variation of the crustal thickness in theAegean [Le Pichon and Angelier, 1979; Makris and Stobbe,1984; Tsokas and Hansen, 1997; Tiberi et al., 2001; Tirel etal., 2004]. However, all these Moho maps suffer severelimitations due to the corrections made for the subductedslab and the thickness of the shallow sediments. As a result,the Moho maps provided by Tsokas and Hansen [1997] orMakris and Stobbe [1984] and recently by Tirel et al. [2004]show considerable differences.[8] Karagianni et al. [2005] used Rayleigh wave group
velocities to infer a three-dimensional (3-D) tomographicimage of the shear wave velocity structure of the crust andupper mantle in the Aegean Sea using regional events. Thiswork is complemented with a group and phase velocitystudy at longer period using teleseismic events [Bourova etal., 2005]. They found different crustal thicknesses in theAegean Sea and beneath Greece, which are in agreement
with the general characteristics estimated from previousworks in this area.[9] In general, thicker crust (40–45 km) exists beneath
western Greece and the Peloponnesus along the Hellenidesmountain range [Makris, 1976; Papazachos and Nolet,1997; Tsokas and Hansen, 1997; Tiberi et al., 2000;Karagianni et al., 2002, 2005], while thinner crust (30–34 km) is found below eastern Greece. In the southernAegean Sea, the crust is approximately 20–30 km thick,whereas the northern Aegean Sea exhibits a crustal thick-ness of about 25–30 km [Makris, 1976; Papazachos andNolet, 1997; Tsokas and Hansen, 1997; Tiberi et al., 2000;Knapmeyer and Harjes, 2000; Karagianni et al., 2002;Marone et al., 2003; Karagianni et al., 2005]. The com-plexity of the crustal structure beneath the island of Crete,probably due to its location in the forearc of the subductionzone, has been shown in a number of studies [Makris, 1978;Knapmeyer and Harjes, 2000; Bohnhoff et al., 2001; Li etal., 2003; Endrun et al., 2004], but the average crustalthickness of Crete is about 28–30 km.[10] The subducted African plate is imaged as a velocity
feature at least down to 600 km depth [Spakman et al.,1988; Wortel et al., 1990; Papazachos and Nolet, 1997];however, the zone of seismicity terminates at a depth ofabout 180 km [Papazachos and Comninakis, 1971]. Thesubducted African lithosphere resolved from seismicity[Makropoulos and Burton, 1984; Papazachos, 1990;Hatzfeld and Martin, 1992; Papazachos et al., 2000] andseismic tomography [Papazachos et al., 1995; Papazachosand Nolet, 1997] shows a remarkable shape with anincreasing dip from west to the east.[11] Receiver function studies of the lithospheric structure
in the Aegean area and Greece are more limited. The earlywork of Knapmeyer and Harjes [2000] using P receiverfunctions in western Crete showed a downgoing oceanicMoho at a depth of 40–70 km, while Li et al. [2003]mapped the Moho to a depth of 100 km beneath Santorini inthe volcanic arc. However, the absence of seismologicalstations in the Sea of Crete makes this structure difficult toinvestigate with P receiver functions (Figure 1).[12] The main goal of this paper is to derive a more
homogeneous image of the crustal thickness and subductingAfrican lithosphere for the entire Aegean area from directseismological observations. To achieve this goal, we em-ploy the P and S receiver function technique to existing datarecorded by 65 stations belonging to various seismologicalnetworks across continental Greece, the Aegean Sea and theisland of Crete. P receiver functions resolve the mostprominent structures beneath each seismological station,however, they suffer from multiples. S receiver functionsare essentially free of multiples and provide information onstructures at greater distances from the seismic stations thando P receiver functions and therefore enhance the spatialsampling of the earth structure.
2. Data and Method of Analysis
2.1. Data
[13] Four different data sets were combined to construct adense coverage of the Aegean region (Figure 1). The firstdata set consists of 22 stations from a temporary networkoperated for six months in 1997 (the Seisfaultgreece project
B12307 SODOUDI ET AL.: LITHOSPHERIC STRUCTURE OF THE AEGEAN
3 of 23
B12307

[Hatzfeld et al., 2001]) using Lennartz LE5S, GuralpCMG40 and Guralp CMG3 seismometers (labeled Sfg inFigure 1). The second data set consists of recordings from8 permanent broadband stations from the GEOFON (http://www.gfz-potsdam.de/geofon/) network on the island ofCrete and in the southern Aegean Sea. These stations areequipped with STS2 seismometers and have been in oper-ation since 1996. To further improve spatial coverage on theisland of Crete, we used data recorded from one broadbandMEDNET (http://mednet.ingv.it/) station equipped with aSTS2 sensor. The third data set consists of recordings from21 permanent stations of the National Observatory ofAthens (NOA; http://www.gein.noa.gr/). These sites haveeither Lennartz LE20S or Guralp CMG40 seismometers andhave been in operation since March 2003. The fourth dataset consists of recordings from 22 temporary seismographs(19 Mark L4-3D and 3 STS2 seismometers) of the CYC-NET that was operated in 2002–2004 by the BochumUniversity (http://www.geophysik.ruhr-uni-bochum.de/research/seismology/cyclades/).
2.2. P Receiver Function Technique
[14] The P receiver function method is now a routineseismological technique for constraining crust and uppermantle velocity discontinuities [e.g., Langston, 1977;Owens et al., 1984; Kind and Vinnik, 1988; Kosarev etal., 1999]. The teleseismic P wave coda contains P-to-Sconversions generated at significant and relatively sharpvelocity discontinuities in the crust and upper mantlebeneath a seismograph site (Figure 2a). The delay time ofthe converted phase relative to the arrival time of the directP wave depends on the depth of the discontinuity, the rayparameter of the incident P wave and the velocity of thelayers. Rotation of ZNE component waveforms into thelocal P-SV-SH ray-based coordinate system isolates the Psconverted phases on the SV component, which is perpen-dicular to the direction of the P component containing theP wave motion. To eliminate the influence of instrumentand source parameters, the instrument responses areremoved and the P component is deconvolved from theSV component. The final P receiver function contains, inaddition to the primary converted phases, multiple phasesgenerated by reflections between the Earth’s surface andvelocity discontinuities (Figure 2c, first panel).[15] Positive amplitudes in the P receiver function indi-
cate a velocity increase with depth, whereas negativeamplitudes indicate a velocity decrease with depth. Includ-ing the multiples in the receiver function analysis givesadditional information about the depth of the Moho discon-tinuity and the Poisson’s ratio of the crust [Zandt andAmmon, 1995; Zhu and Kanamori, 2000; Yuan et al.,2002]. However, the presence of significant sedimentsmay cause large amplitude reverberations masking theprimary Ps converted phases and make the estimation ofthe discontinuity depth difficult.
2.3. S Receiver Function Technique
[16] S-to-P conversions produced at significant velocitydiscontinuities beneath the station (Figure 2a) can beobtained by deconvolving the SV component from the Pcomponent. S receiver functions have a significant advan-tage over P receiver functions because the converted Sp
phase arrives earlier than the main S phase [e.g., Faber andMuller, 1980; Bock, 1991; Farra and Vinnik, 2000; Li et al.,2004; Kumar et al., 2005a, 2005b; Sodoudi et al., 2006],and therefore upper mantle conversions are free frominterference of crustal multiples (Figure 2c, second panel).[17] The converted Sp phases are generally best observed
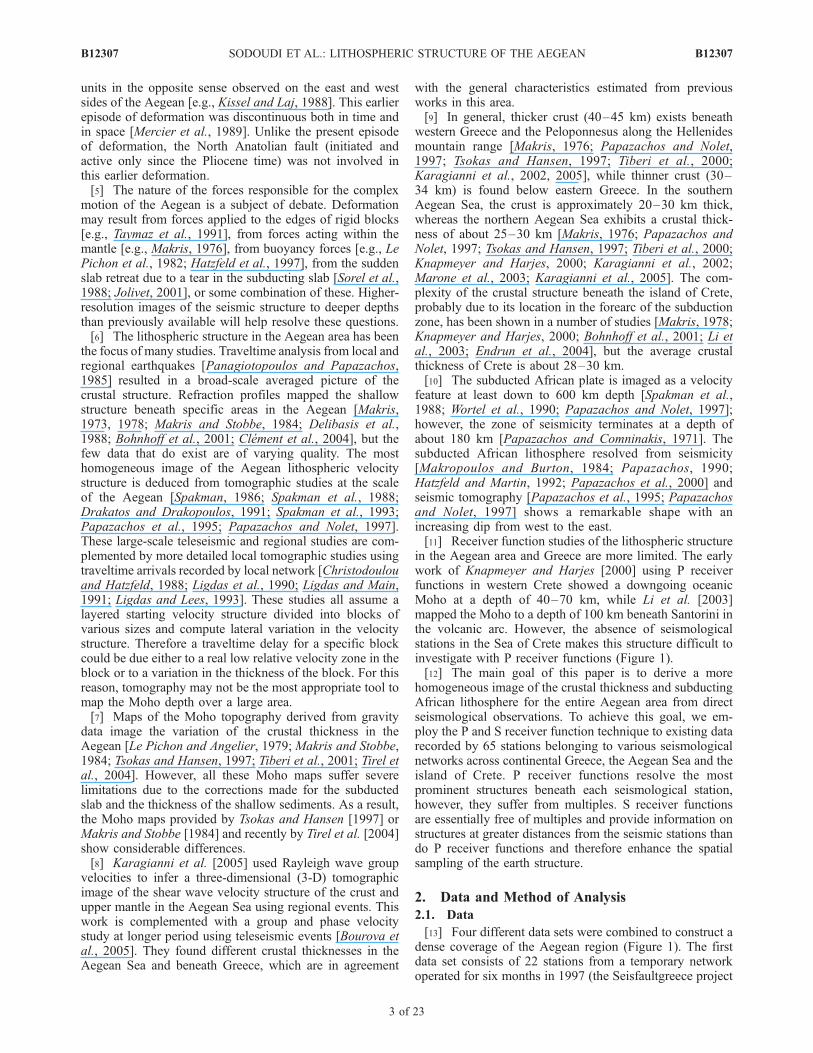
at epicentral distances between 60� and 85� [Faber andMuller, 1980]. Since the time difference between convertedSp and S waves depends on the ray parameter, we correctthe S-to-P conversions to a common distance using areference slowness of 6.4 s/deg. Although this velocity isnot necessarily realistic for S waves, it is used to make Pand S receiver function timescales directly comparable. Sreceiver functions are much noisier than P receiver func-tions due to their later arrival times. They also have longerperiods in comparison with the P receiver functions andresolve less fine structure within the crust and mantlelithosphere. However, the fact that they are free of multiplesenables the identification of Sp conversions at mantlediscontinuities. Therefore mantle discontinuity conversions,which are masked by crustal multiples arriving at nearly thesame time in P receiver functions, can be isolated in the Sreceiver functions (Figure 2c).[18] Figure 2c shows synthetic P and S receiver functions
obtained from a simple two-layered model over a half-space(Figure 2b) containing the crust-mantle and the lithosphere-asthenosphere boundaries at 30 and 125 km depth, respec-tively. The P onset (for P receiver function) and S onset (forS receiver function) are fixed to be at zero time. While a Psconverted phase at the Moho boundary (Figure 2c, firstpanel) arrives later than the direct P wave, the converted SpMoho phase is a precursor of the direct S wave, and cannotbe disturbed by multiples (Figure 2c, second panel). Thecomputed P receiver function shows the converted Ps phaseat the Moho boundary as well as its multiples (Figure 2c,first panel). The converted phase from the lithosphere-asthenophere boundary (labeled LAB) is in this casemasked by the Moho multiple (with negative amplitude)arriving at the same time in the P receiver function. Thisboundary is however clearly observed in the S receiverfunction at �14 s reversed time (Figure 2c, second panel).To make the S receiver functions directly comparable withthe P receiver functions, we reverse the time axis (Figure 2c,third panel) and the polarities of the S receiver functions(Figure 2c, fourth panel; see also Yuan et al. [2006]).Therefore, consistent with the P receiver function, positiveamplitude in the S receiver function indicates an increasingvelocity with depth.
3. Observations
3.1. P Receiver Functions
[19] To compute P receiver functions, we select tele-seismic records for events with magnitude greater than mb
5.5 and epicentral distances ranging between 30� and 95�.Receiver functions filtered between 1 and 20 s and correctedto a reference distance of 67� are shown for two stations,LIMN and NEO in Figure 3 (see Figure 1 for stationslocation). At LIMN, the primary converted phase from thecontinental Aegean Moho and its first multiple arrive at adelay time of approximately 3.4 s and 10 s, respectively,while those at NEO are observed at approximately 3.3 s and
B12307 SODOUDI ET AL.: LITHOSPHERIC STRUCTURE OF THE AEGEAN
4 of 23
B12307
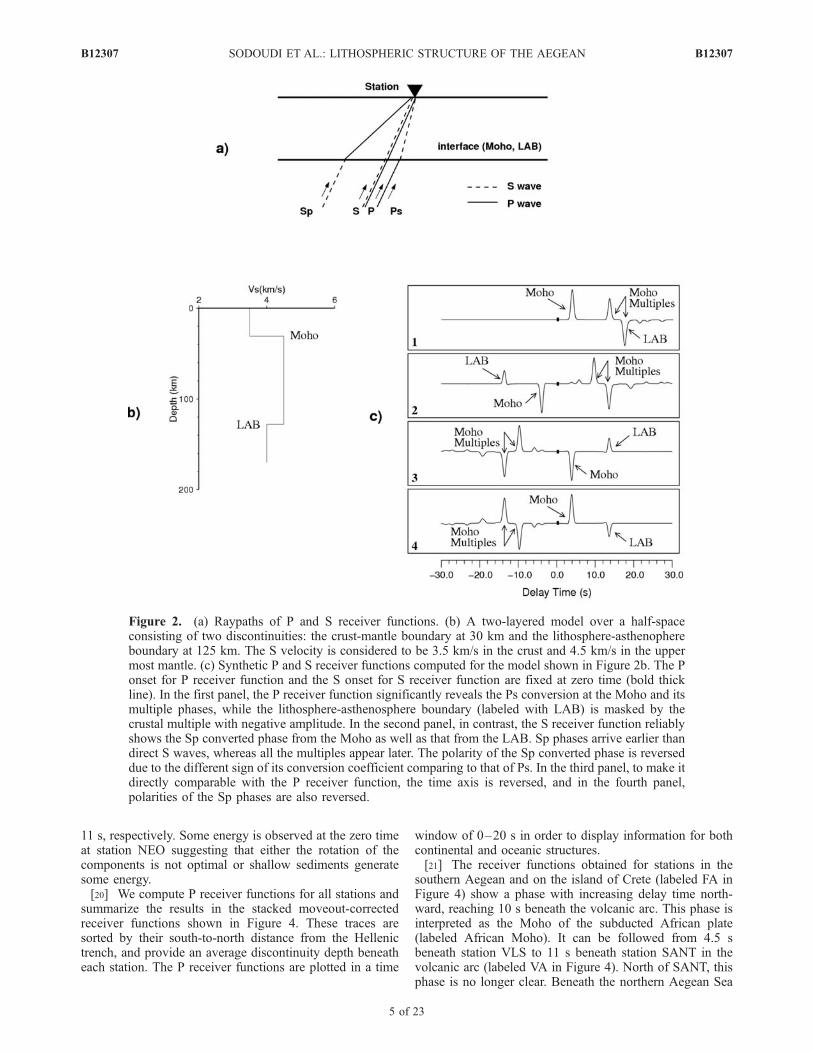
11 s, respectively. Some energy is observed at the zero timeat station NEO suggesting that either the rotation of thecomponents is not optimal or shallow sediments generatesome energy.[20] We compute P receiver functions for all stations and
summarize the results in the stacked moveout-correctedreceiver functions shown in Figure 4. These traces aresorted by their south-to-north distance from the Hellenictrench, and provide an average discontinuity depth beneatheach station. The P receiver functions are plotted in a time
window of 0–20 s in order to display information for bothcontinental and oceanic structures.[21] The receiver functions obtained for stations in the
southern Aegean and on the island of Crete (labeled FA inFigure 4) show a phase with increasing delay time north-ward, reaching 10 s beneath the volcanic arc. This phase isinterpreted as the Moho of the subducted African plate(labeled African Moho). It can be followed from 4.5 sbeneath station VLS to 11 s beneath station SANT in thevolcanic arc (labeled VA in Figure 4). North of SANT, thisphase is no longer clear. Beneath the northern Aegean Sea
Figure 2. (a) Raypaths of P and S receiver functions. (b) A two-layered model over a half-spaceconsisting of two discontinuities: the crust-mantle boundary at 30 km and the lithosphere-asthenophereboundary at 125 km. The S velocity is considered to be 3.5 km/s in the crust and 4.5 km/s in the uppermost mantle. (c) Synthetic P and S receiver functions computed for the model shown in Figure 2b. The Ponset for P receiver function and the S onset for S receiver function are fixed at zero time (bold thickline). In the first panel, the P receiver function significantly reveals the Ps conversion at the Moho and itsmultiple phases, while the lithosphere-asthenosphere boundary (labeled with LAB) is masked by thecrustal multiple with negative amplitude. In the second panel, in contrast, the S receiver function reliablyshows the Sp converted phase from the Moho as well as that from the LAB. Sp phases arrive earlier thandirect S waves, whereas all the multiples appear later. The polarity of the Sp converted phase is reverseddue to the different sign of its conversion coefficient comparing to that of Ps. In the third panel, to make itdirectly comparable with the P receiver function, the time axis is reversed, and in the fourth panel,polarities of the Sp phases are also reversed.
B12307 SODOUDI ET AL.: LITHOSPHERIC STRUCTURE OF THE AEGEAN
5 of 23
B12307
and continental Greece (labeled NA and CG in Figure 4,respectively), the strongest phase observed between 3 and4.8 s (labeled Aegean Moho) is interpreted to be the Ps
conversion from the Moho of the continental Aegean plate.This phase is not well observed under the forearc (FA inFigure 4). There it is replaced by a significant negative
Figure 3. (a) Individual P receiver functions for station LIMN located in the northern Aegean Sea.Positive amplitudes are plotted in black, and negative amplitudes are shown in gray. Individualseismograms are plotted equally spaced and sorted according to their back azimuth. The Ps conversionphase from the Aegean Moho and its multiple and the Ps conversion from the sediment layer are labeledon the summation trace. (b) Same for station NEO located in mainland Greece.
B12307 SODOUDI ET AL.: LITHOSPHERIC STRUCTURE OF THE AEGEAN
6 of 23
B12307

amplitude phase (dashed box in Figure 4). This negativephase was also reported for most stations located on Crete[Knapmeyer and Harjes, 2000; Li et al., 2003; Endrun etal., 2004].[22] In Figure 5, the stacked receiver functions are sorted
by increasing time of the converted Ps phase from theAegean Moho. Stations from the forearc with possiblynegative Moho signals are not contained in Figure 5. Thedata show clear primary Moho conversions where theamplitude of the Moho multiples appear to be reduced sincewe used the moveout curve for direct Ps conversions andnot that for multiples. To compute the depth of the Aegean
Moho beneath the stations, we used an average crustalvelocity of 6.2 km/s and a Vp/Vs ratio of 1.73. This is afirst-order estimate of the Aegean velocity structure andkeeps our depth values independent from possible errors ofpreliminary shear velocity models. However, we estimatethe deviation to this model to be less than 5%. Thereforethis procedure results in an 1.5–2 km error in the Mohodepth determination. The calculated Aegean Moho depthsare listed in Table 1. We could not estimate the delay timesof the converted phases from the Aegean Moho at stationsin the forearc region due to the presence of unclear negativesignals.
Figure 4. Stacked P receiver functions sorted according to their distance from the Hellenic trench fromsouth to north. The north dipping phase in the southern part labeled ‘‘African Moho’’ indicates Psconversions from the Moho of the subducting African lithosphere. This phase can be traced from stationVLS to the station SANT in the volcanic arc. Ps conversions from the Moho of the continental Aegeanlithosphere (labeled Aegean Moho) are observed in the northern part and disappear southward. The blackdashed box indicates negative conversions which are seen at the expected Moho conversion times. Thenumber of P receiver functions for each station is shown in brackets. FA, forearc; VA, volcanic arc; NA,northern Aegean; CG, continental Greece.
B12307 SODOUDI ET AL.: LITHOSPHERIC STRUCTURE OF THE AEGEAN
7 of 23
B12307

3.2. S Receiver Functions
[23] We compute S receiver functions from seismogramsof events with magnitude greater than 5.7 (mb) and epicen-tral distances between 60� and 85� for 50 of the stationswithin the area. Moveout corrected and band-pass-filtered(6–20 s) S receiver functions at the GEOFON station KRISlocated on the island of Crete are shown in Figure 6. Thefirst phase at about 3 s (labeled Aegean Moho) representsthe converted Sp phase from the Aegean Moho discontinu-ity; the second phase at about 8 s (labeled African Moho) isassociated with the Moho of the subducted African litho-sphere; and the third phase with a strong negative amplitude
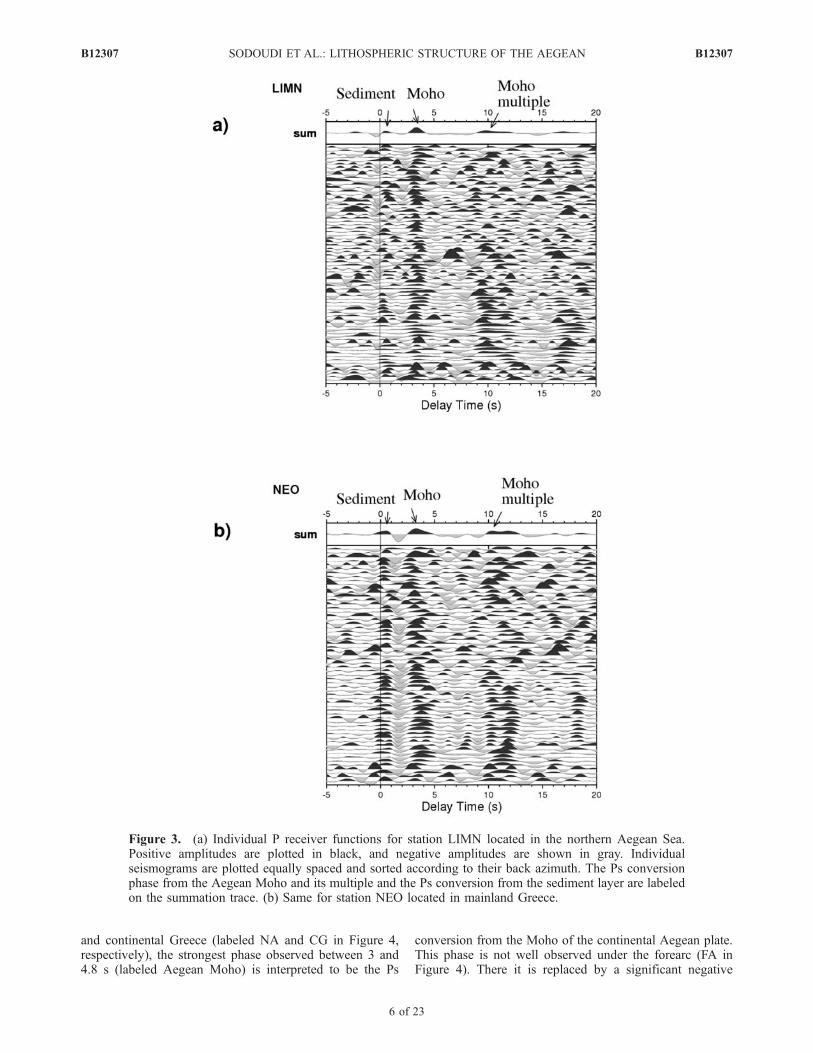
at about 13 s delay time (labeled LAB) is interpreted as aconversion from the lithosphere-asthenosphere boundary.[24] Figure 7 shows the location of the Ps and Sp piercing
points at 80 km depth. This depth was chosen based on theP receiver functions, which show the African Moho at delaytimes ranging from 8 to 10 s beneath the southern Aegean Sea(see also Figure 4). As Figure 7 shows, while P piercingpoints are located close to the stations, S piercing points arelocated much farther away from the stations. Therefore thetwo together provide reasonably dense spatial coverage (seealso Figure 2a). For example, while the Sea of Crete is poorlysampled by the P receiver function observations, it is wellcovered by S receiver function observations. We plot two setsof cross sections from S receiver functions (Figure 8). Thefirst set consists of three parallel S-N trending cross sectionsacross the Aegean and continental Greece (Figures 8a–8c).
Figure 5. Estimated arrival times of Moho conversions(Aegean Moho), displayed with white circles for stationswith positive amplitudes and sorted according to theirvalues from 3 to 4.8 s. The stacked receiver functions arefiltered with 1–20 s band-pass filter. Arrival times areconverted to depth (km) using a Vp of 6.2 and a Vp/Vs ratioof 1.73. Moho conversion times and depths are listed inTable 1.
Table 1. Stations, Geographical Coordinates, Ps Conversion
Times at the Aegean Moho and Their Corresponding Depths, Ps
Conversion Times at the African Moho, and Their Corresponding
Depths
Stations Longitude Latitude
Aegean Moho African Moho
Time, s Depth, km Time, s Depth, km
AGGI 22.32 39.01 4.4 36 - -ALEX 25.79 40.97 3.7 30 - -ANAT 22.68 39.74 3.8 31 - -APEZa 24.88 34.97 4 33 6.2 52ATH 23.72 37.97 3.1 25.5 - -DRAM 24.01 41.2 4.1 34 - -EVR 21.81 38.92 4 33 - -FODEa 24.95 35.37 4 33 6.7 58FLOR 21.38 40.78 4.8 40 - -GVD 24.08 34.83 3.3 27 5.8 48.5HIOS 26.04 38.25 3 25 - -IDIa 24.89 35.28 4 33 7.1 61ITM 21.93 37.18 3.5 28.5 5 41JAN 20.85 39.66 3.4 28 - -KARP 27.17 35.55 - - 6.2 52KEK 19.8 39.71 3.3 27 - -KOS1 27.21 36.84 3.2 26 - -KOZA 21.78 40.3 4.5 37 - -KRISa 25.5 35.17 2.5 21 8.1 70LESB 26.26 39.24 3.8 31 - -LIMN 25.16 39.95 3.4 28 - -LITO 22.48 40.1 3.7 30 - -LKR 23 38.65 3 25 - -MILO 24.44 36.67 4.4 36 10.2 90.5NAXO 25.52 37.07 3.3 27 - -NEO 23.22 39.31 3.3 27 - -NPSa 25.61 35.26 2.5 21 7.4 64NVR 23.86 41.35 4.8 40 - -PENT 23.96 38.04 4.5 37 - -PLG 23.45 40.37 3.7 30 - -RLSa 21.47 38.06 3 25 8 69.5RODO 28.02 36.08 3 25 5.5 46SAMO 26.83 37.7 3.5 28.5 - -SANT 25.45 36.37 4.2 34.5 11.1 99SKDa 23.92 35.41 4 33 7.2 62SKIR 24.57 38.85 3.2 26 - -SKOP 23.74 39.11 3 25 - -THES 22.96 40.63 3.6 29.5 - 100VAMa 24.2 35.41 4 33 7.3 63VELI 22.94 36.71 3.3 27 7.2 62VLS 20.59 38.18 3.4 28 4.5 36.5ZKRa 26.31 35.11 3.1 25.5 6.2 52
aNo observed positive Ps Moho conversion, the delay times of Mohoconversions are inferred from S receiver functions.
B12307 SODOUDI ET AL.: LITHOSPHERIC STRUCTURE OF THE AEGEAN
8 of 23
B12307

The second set consists of three profiles perpendicular to theHellenic trench (Figures 8d–8f ). Individual S receiverfunctions are considered in the data bands of 1.25� at eachside of the profiles and sorted by the latitude of theirpiercing points at 80 km depth. A 4 s low-pass filter isapplied to the data. Although they are much noisier thanstacked data, they allow a more detailed image of thegeometry of the Aegean Moho and of the subducting slab.The traces in Figure 8 are plotted in trace spacing. Thatmeans all traces are equally spaced in the sequence of theirlatitude, but not in a linear scale. This is a good techniquefor screening all individual traces and for detecting phasescorrelatable over larger distances. In order to obtain sectionswith a linear latitude-scale, traces must be binned. We
divide the region into 39 boxes (see also Figure 7) and astacked S receiver function is computed for each box fromall individual S receiver functions (Figure 8) whose piercingpoint (at 80 km) fell into the respective box. It is importantto note that the 80 km deep piercing point is not appropriatefor deeper phases with later arrival times (�15–20 s).Therefore, for the northern Aegean and mainland Greece,the data are also sorted with piercing points at 200 km depthin the same boxes. However, no considerable difference isobserved in the arrival times of the seismic phases beneaththe northern part of the area if we use piercing points at200 km depth. In Figure 9, stacked S receiver functionscomputed for each box (see Figure 7) are shown alongprofiles DD1-FF1 (see Figures 8d–8f). The stacking methodenhances the conversions and reduces the error of the depthdetermination by averaging the information of many singletraces within each box. Note that the African Moho obtainedby stacked data in Figure 9 is similar to that obtained fromindividual traces in Figures 8d–8f.
3.3. Moho Topography of the Subducting African Plate
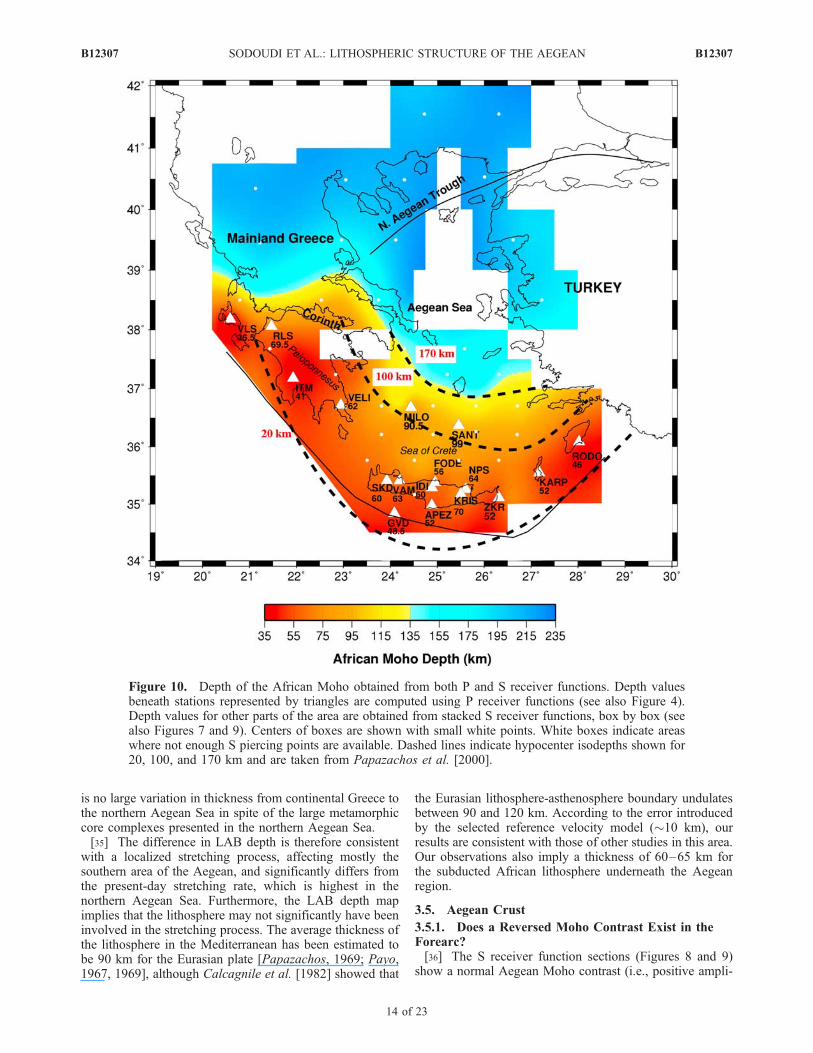
[25] Figure 10 shows a map of the topography of theAfrican Moho derived from our data. This map combinesresults from P and S receiver function techniques. Along theHellenic arc, results from stacked P receiver functions from17 stations are used (data from Figure 4). The 17 stationlocations are indicated by triangles in Figure 10. At largerdepths, where P receiver functions poorly resolve theAfrican Moho, stacked S receiver functions in the boxesof Figure 7 are used to determine the times of the Mohoconversions (Figures 8 and 9). The centers of the boxes arealso marked in Figure 10 (white small points). Depths aredetermined from delay times using the IASP91 referencemodel [Kennett and Engdahl, 1991]. Because of the ab-sence of a model covering the entire area, we preferred touse a well known and frequently used global referencemodel for the depth determination. The times and depths ofthe African Moho at stations and boxes are given in Tables 1and 2, respectively. The delay times in Tables 1 and 2 maybe used later with improved P and S velocity models to inferdepths. Future improved receiver function observationsmight, for example, be able to resolve multiples, whichwould be very helpful for determining Vp/Vs ratios[Zhu and Kanamori, 2000]. In the following, we describethe African Moho imaged by cross sections AA1-FF1
(Figure 8).[26] In addition to the Sp conversion at the Aegean
Moho, which can be seen between 2.5 and 4 s along profileAA1 (Figure 8a), we clearly observe the Moho of thesubducting African plate (labeled African Moho). Thisphase can be traced from 6 s (�50 km deep) in the southernAegean to about 25 s (�220 km deep) in northern Greece.Because of the lack of seismological stations in the AegeanSea this phase could only be imaged by P receiver functionsto 10 s beneath station SANT in the volcanic arc (see alsoFigure 4). The subducted African lithosphere has beenimaged by tomography down to 600 km [Spakman et al.,1988] and even to 1200 km [Bijwaard et al., 1998] beneathnorthern Greece. Papazachos et al. [1995] also reported thecontinuity of the African lithosphere up to northern Greeceby tomographic images, even though the deepest earth-
Figure 6. The 53 individual S receiver functions forbroadband station KRIS on Crete sorted by back azimuth.The S receiver functions are plotted in reversed time andreversed polarities to allow direct comparison with Preceiver functions. The arrows on the stacked trace (top)show the average time of the Sp conversions generated bythe continental Aegean Moho, the oceanic Moho of thesubducted African plate and the lithosphere-asthenosphereboundary, respectively.
B12307 SODOUDI ET AL.: LITHOSPHERIC STRUCTURE OF THE AEGEAN
9 of 23
B12307
quakes are at depths of approximately 180 km in the easternpart of the trench (see also Figure 1).[27] Along profile AA1, the African Moho has a notice-
ably variable downgoing slope. It starts at low angle (�10�)in the southern Aegean and becomes steeper under thevolcanic arc (�30�). It flattens out beneath the centralAegean and then steepens again beneath northern AegeanSea and continental Greece. In the central part of theHellenic subduction zone (along profile BB1), the AfricanMoho is clearly deeper than in the eastern part. It can befollowed from 9 s in the southern Aegean to 23 s beneathnorthern Greece. It also dips gradually at a low angle(�10�) to the northern Aegean and becomes horizontaltoward mainland Greece. Beneath the western Peloponnesusand western Greece (profile CC1), the African Moho isshallow (delay time 5–6 s) and the arrival time of thisconverted phase is very close to that of the Aegean Mohoconverted phase. The phase at 5–6 s has generally beeninterpreted as related to the Aegean Moho boundary at
45 km depth [e.g., Karagianni et al., 2002; van der Meijdeet al., 2003; Karagianni et al., 2005]. However, Figure 8cindicates that the converted phase at 5 s beneath thePeloponnesus is associated with the African Moho. TheAfrican Moho is almost horizontal beneath the Peloponne-sus, dips steeply (�45�) beneath the Gulf of Corinth andflattens out under continental Greece. This result is alsoconsistent with the shallow seismicity recorded beneath thePeloponnesus [Hatzfeld, 1989; Papazachos et al., 2000].[28] It is interesting to note that all three S receiver
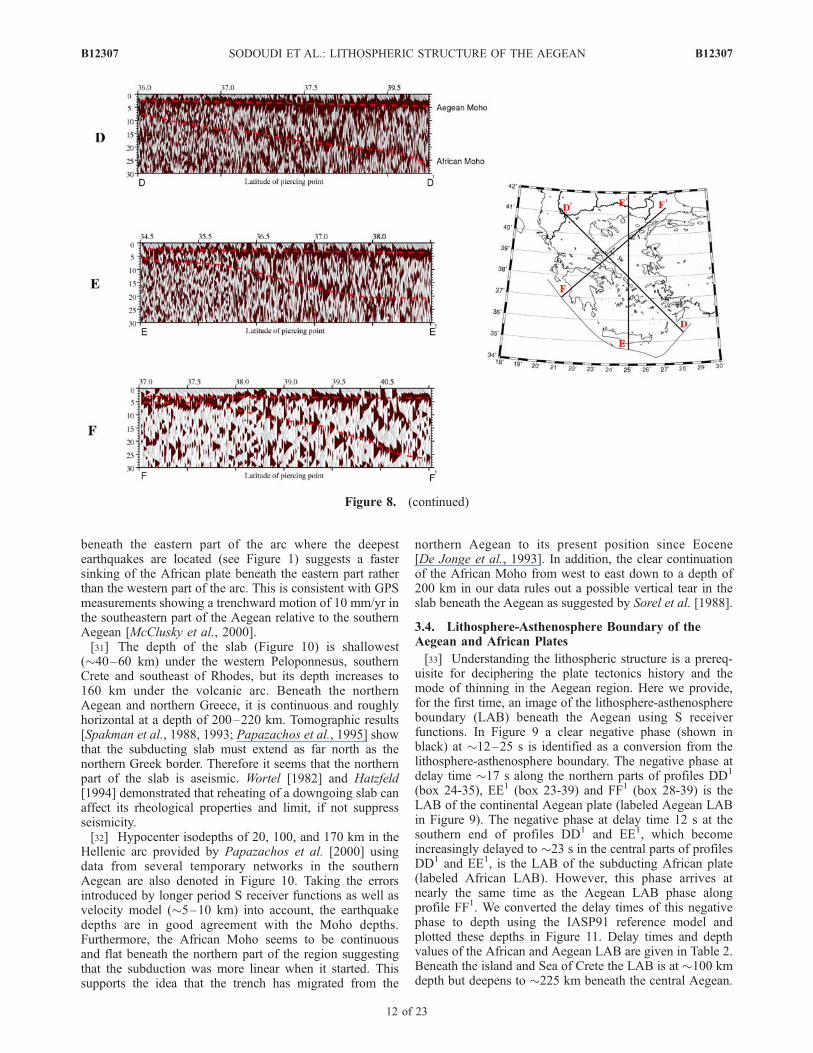
function profiles in Figures 8d–8f demonstrate a significantMoho phase with positive amplitude in the forearc area,while P receiver functions exhibit a reversed Moho velocitycontrast (see also Figure 4). Profile DD1 indicates a steeperAfrican Moho in the eastern part in comparison with otherparts of the arc. The continuity of the subducted plate up tonorthern Greece is well illustrated in profile EE1. TheAfrican Moho is also visible to about 25 s (�220 km)along this profile. Spakman et al. [1988] showed the
Figure 7. Location of piercing points of P (blue crosses) and S (red crosses) receiver functions at 80 kmdepth. Triangles denote stations. Because of the differing ray parameters for Ps and Sp conversions, theCretan Sea is well covered with S piercing points and so compliment the P receiver functions. The studyarea is divided into 39 boxes that sample different geological formations relative to the positions of Spiercing points.
B12307 SODOUDI ET AL.: LITHOSPHERIC STRUCTURE OF THE AEGEAN
10 of 23
B12307
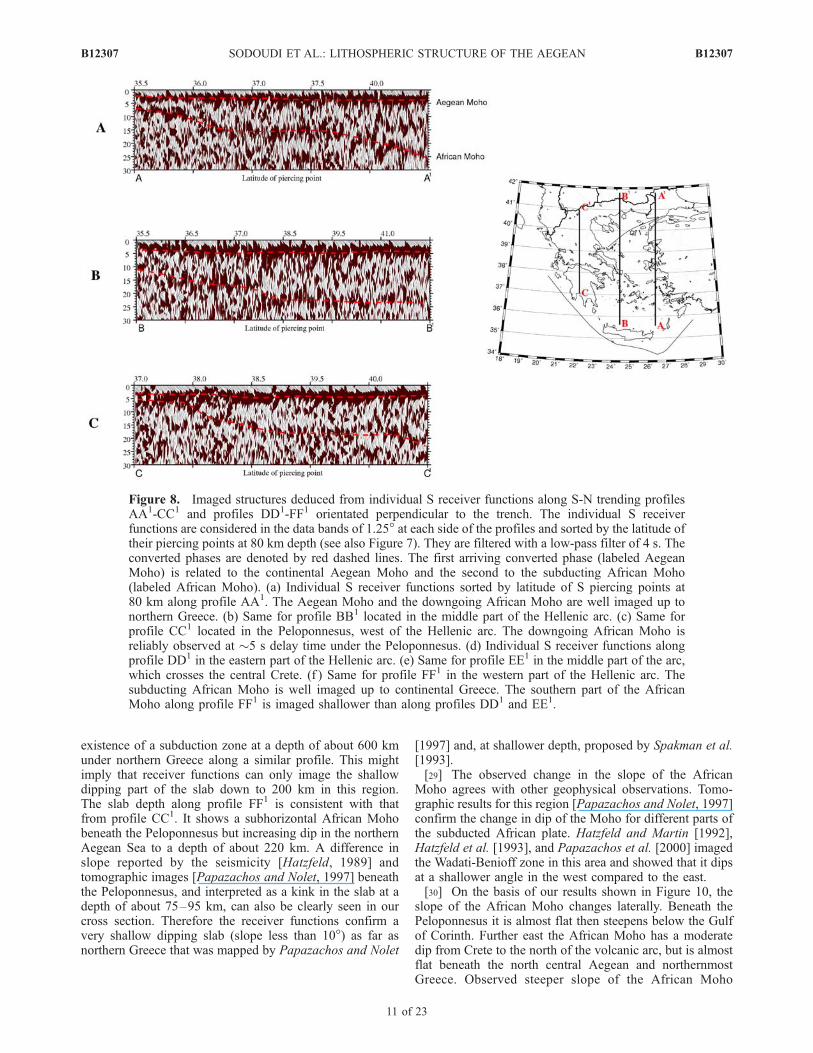
existence of a subduction zone at a depth of about 600 kmunder northern Greece along a similar profile. This mightimply that receiver functions can only image the shallowdipping part of the slab down to 200 km in this region.The slab depth along profile FF1 is consistent with thatfrom profile CC1. It shows a subhorizontal African Mohobeneath the Peloponnesus but increasing dip in the northernAegean Sea to a depth of about 220 km. A difference inslope reported by the seismicity [Hatzfeld, 1989] andtomographic images [Papazachos and Nolet, 1997] beneaththe Peloponnesus, and interpreted as a kink in the slab at adepth of about 75–95 km, can also be clearly seen in ourcross section. Therefore the receiver functions confirm avery shallow dipping slab (slope less than 10�) as far asnorthern Greece that was mapped by Papazachos and Nolet
[1997] and, at shallower depth, proposed by Spakman et al.[1993].[29] The observed change in the slope of the African
Moho agrees with other geophysical observations. Tomo-graphic results for this region [Papazachos and Nolet, 1997]confirm the change in dip of the Moho for different parts ofthe subducted African plate. Hatzfeld and Martin [1992],Hatzfeld et al. [1993], and Papazachos et al. [2000] imagedthe Wadati-Benioff zone in this area and showed that it dipsat a shallower angle in the west compared to the east.[30] On the basis of our results shown in Figure 10, the
slope of the African Moho changes laterally. Beneath thePeloponnesus it is almost flat then steepens below the Gulfof Corinth. Further east the African Moho has a moderatedip from Crete to the north of the volcanic arc, but is almostflat beneath the north central Aegean and northernmostGreece. Observed steeper slope of the African Moho
Figure 8. Imaged structures deduced from individual S receiver functions along S-N trending profilesAA1-CC1 and profiles DD1-FF1 orientated perpendicular to the trench. The individual S receiverfunctions are considered in the data bands of 1.25� at each side of the profiles and sorted by the latitude oftheir piercing points at 80 km depth (see also Figure 7). They are filtered with a low-pass filter of 4 s. Theconverted phases are denoted by red dashed lines. The first arriving converted phase (labeled AegeanMoho) is related to the continental Aegean Moho and the second to the subducting African Moho(labeled African Moho). (a) Individual S receiver functions sorted by latitude of S piercing points at80 km along profile AA1. The Aegean Moho and the downgoing African Moho are well imaged up tonorthern Greece. (b) Same for profile BB1 located in the middle part of the Hellenic arc. (c) Same forprofile CC1 located in the Peloponnesus, west of the Hellenic arc. The downgoing African Moho isreliably observed at �5 s delay time under the Peloponnesus. (d) Individual S receiver functions alongprofile DD1 in the eastern part of the Hellenic arc. (e) Same for profile EE1 in the middle part of the arc,which crosses the central Crete. (f ) Same for profile FF1 in the western part of the Hellenic arc. Thesubducting African Moho is well imaged up to continental Greece. The southern part of the AfricanMoho along profile FF1 is imaged shallower than along profiles DD1 and EE1.
B12307 SODOUDI ET AL.: LITHOSPHERIC STRUCTURE OF THE AEGEAN
11 of 23
B12307
beneath the eastern part of the arc where the deepestearthquakes are located (see Figure 1) suggests a fastersinking of the African plate beneath the eastern part ratherthan the western part of the arc. This is consistent with GPSmeasurements showing a trenchward motion of 10 mm/yr inthe southeastern part of the Aegean relative to the southernAegean [McClusky et al., 2000].[31] The depth of the slab (Figure 10) is shallowest
(�40–60 km) under the western Peloponnesus, southernCrete and southeast of Rhodes, but its depth increases to160 km under the volcanic arc. Beneath the northernAegean and northern Greece, it is continuous and roughlyhorizontal at a depth of 200–220 km. Tomographic results[Spakman et al., 1988, 1993; Papazachos et al., 1995] showthat the subducting slab must extend as far north as thenorthern Greek border. Therefore it seems that the northernpart of the slab is aseismic. Wortel [1982] and Hatzfeld[1994] demonstrated that reheating of a downgoing slab canaffect its rheological properties and limit, if not suppressseismicity.[32] Hypocenter isodepths of 20, 100, and 170 km in the
Hellenic arc provided by Papazachos et al. [2000] usingdata from several temporary networks in the southernAegean are also denoted in Figure 10. Taking the errorsintroduced by longer period S receiver functions as well asvelocity model (�5–10 km) into account, the earthquakedepths are in good agreement with the Moho depths.Furthermore, the African Moho seems to be continuousand flat beneath the northern part of the region suggestingthat the subduction was more linear when it started. Thissupports the idea that the trench has migrated from the
northern Aegean to its present position since Eocene[De Jonge et al., 1993]. In addition, the clear continuationof the African Moho from west to east down to a depth of200 km in our data rules out a possible vertical tear in theslab beneath the Aegean as suggested by Sorel et al. [1988].
3.4. Lithosphere-Asthenosphere Boundary of theAegean and African Plates
[33] Understanding the lithospheric structure is a prereq-uisite for deciphering the plate tectonics history and themode of thinning in the Aegean region. Here we provide,for the first time, an image of the lithosphere-asthenosphereboundary (LAB) beneath the Aegean using S receiverfunctions. In Figure 9 a clear negative phase (shown inblack) at �12–25 s is identified as a conversion from thelithosphere-asthenosphere boundary. The negative phase atdelay time �17 s along the northern parts of profiles DD1
(box 24-35), EE1 (box 23-39) and FF1 (box 28-39) is theLAB of the continental Aegean plate (labeled Aegean LABin Figure 9). The negative phase at delay time 12 s at thesouthern end of profiles DD1 and EE1, which becomeincreasingly delayed to �23 s in the central parts of profilesDD1 and EE1, is the LAB of the subducting African plate(labeled African LAB). However, this phase arrives atnearly the same time as the Aegean LAB phase alongprofile FF1. We converted the delay times of this negativephase to depth using the IASP91 reference model andplotted these depths in Figure 11. Delay times and depthvalues of the African and Aegean LAB are given in Table 2.Beneath the island and Sea of Crete the LAB is at �100 kmdepth but deepens to �225 km beneath the central Aegean.
Figure 8. (continued)
B12307 SODOUDI ET AL.: LITHOSPHERIC STRUCTURE OF THE AEGEAN
12 of 23
B12307
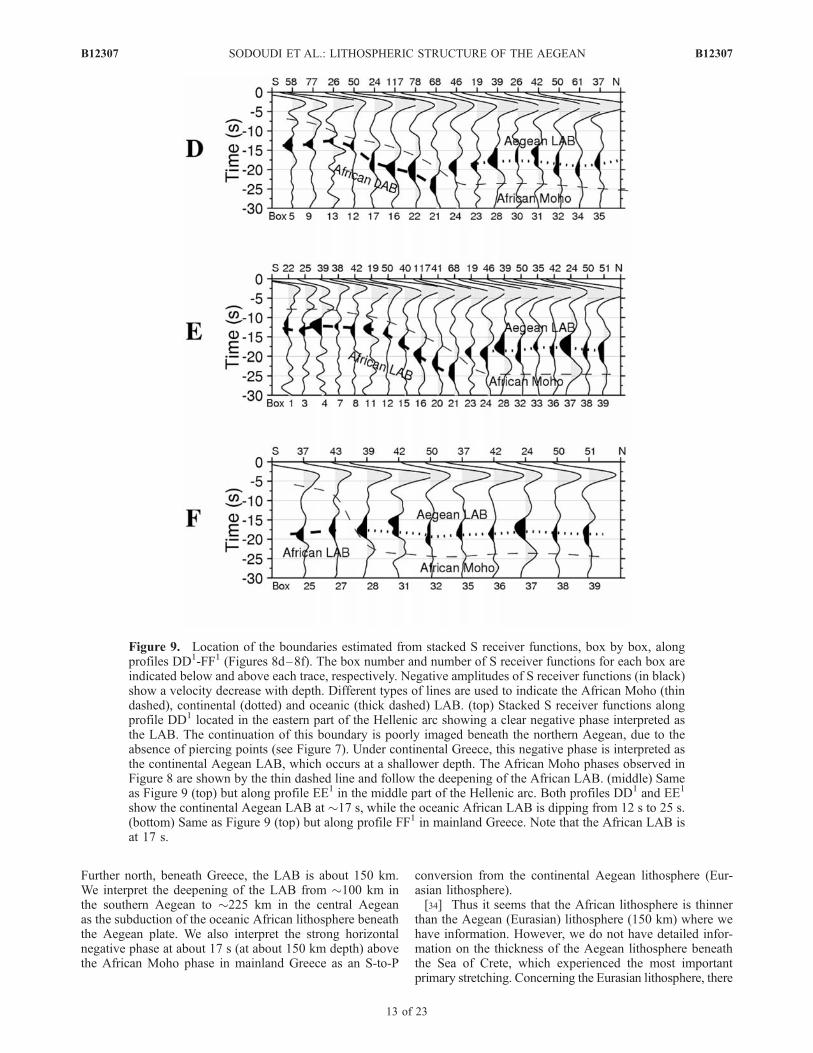
Further north, beneath Greece, the LAB is about 150 km.We interpret the deepening of the LAB from �100 km inthe southern Aegean to �225 km in the central Aegeanas the subduction of the oceanic African lithosphere beneaththe Aegean plate. We also interpret the strong horizontalnegative phase at about 17 s (at about 150 km depth) abovethe African Moho phase in mainland Greece as an S-to-P
conversion from the continental Aegean lithosphere (Eur-asian lithosphere).[34] Thus it seems that the African lithosphere is thinner
than the Aegean (Eurasian) lithosphere (150 km) where wehave information. However, we do not have detailed infor-mation on the thickness of the Aegean lithosphere beneaththe Sea of Crete, which experienced the most importantprimary stretching. Concerning the Eurasian lithosphere, there
Figure 9. Location of the boundaries estimated from stacked S receiver functions, box by box, alongprofiles DD1-FF1 (Figures 8d–8f). The box number and number of S receiver functions for each box areindicated below and above each trace, respectively. Negative amplitudes of S receiver functions (in black)show a velocity decrease with depth. Different types of lines are used to indicate the African Moho (thindashed), continental (dotted) and oceanic (thick dashed) LAB. (top) Stacked S receiver functions alongprofile DD1 located in the eastern part of the Hellenic arc showing a clear negative phase interpreted asthe LAB. The continuation of this boundary is poorly imaged beneath the northern Aegean, due to theabsence of piercing points (see Figure 7). Under continental Greece, this negative phase is interpreted asthe continental Aegean LAB, which occurs at a shallower depth. The African Moho phases observed inFigure 8 are shown by the thin dashed line and follow the deepening of the African LAB. (middle) Sameas Figure 9 (top) but along profile EE1 in the middle part of the Hellenic arc. Both profiles DD1 and EE1
show the continental Aegean LAB at �17 s, while the oceanic African LAB is dipping from 12 s to 25 s.(bottom) Same as Figure 9 (top) but along profile FF1 in mainland Greece. Note that the African LAB isat 17 s.
B12307 SODOUDI ET AL.: LITHOSPHERIC STRUCTURE OF THE AEGEAN
13 of 23
B12307
is no large variation in thickness from continental Greece tothe northern Aegean Sea in spite of the large metamorphiccore complexes presented in the northern Aegean Sea.[35] The difference in LAB depth is therefore consistent
with a localized stretching process, affecting mostly thesouthern area of the Aegean, and significantly differs fromthe present-day stretching rate, which is highest in thenorthern Aegean Sea. Furthermore, the LAB depth mapimplies that the lithosphere may not significantly have beeninvolved in the stretching process. The average thickness ofthe lithosphere in the Mediterranean has been estimated tobe 90 km for the Eurasian plate [Papazachos, 1969; Payo,1967, 1969], although Calcagnile et al. [1982] showed that
the Eurasian lithosphere-asthenosphere boundary undulatesbetween 90 and 120 km. According to the error introducedby the selected reference velocity model (�10 km), ourresults are consistent with those of other studies in this area.Our observations also imply a thickness of 60–65 km forthe subducted African lithosphere underneath the Aegeanregion.
3.5. Aegean Crust
3.5.1. Does a Reversed Moho Contrast Exist in theForearc?[36] The S receiver function sections (Figures 8 and 9)
show a normal Aegean Moho contrast (i.e., positive ampli-
Figure 10. Depth of the African Moho obtained from both P and S receiver functions. Depth valuesbeneath stations represented by triangles are computed using P receiver functions (see also Figure 4).Depth values for other parts of the area are obtained from stacked S receiver functions, box by box (seealso Figures 7 and 9). Centers of boxes are shown with small white points. White boxes indicate areaswhere not enough S piercing points are available. Dashed lines indicate hypocenter isodepths shown for20, 100, and 170 km and are taken from Papazachos et al. [2000].
B12307 SODOUDI ET AL.: LITHOSPHERIC STRUCTURE OF THE AEGEAN
14 of 23
B12307
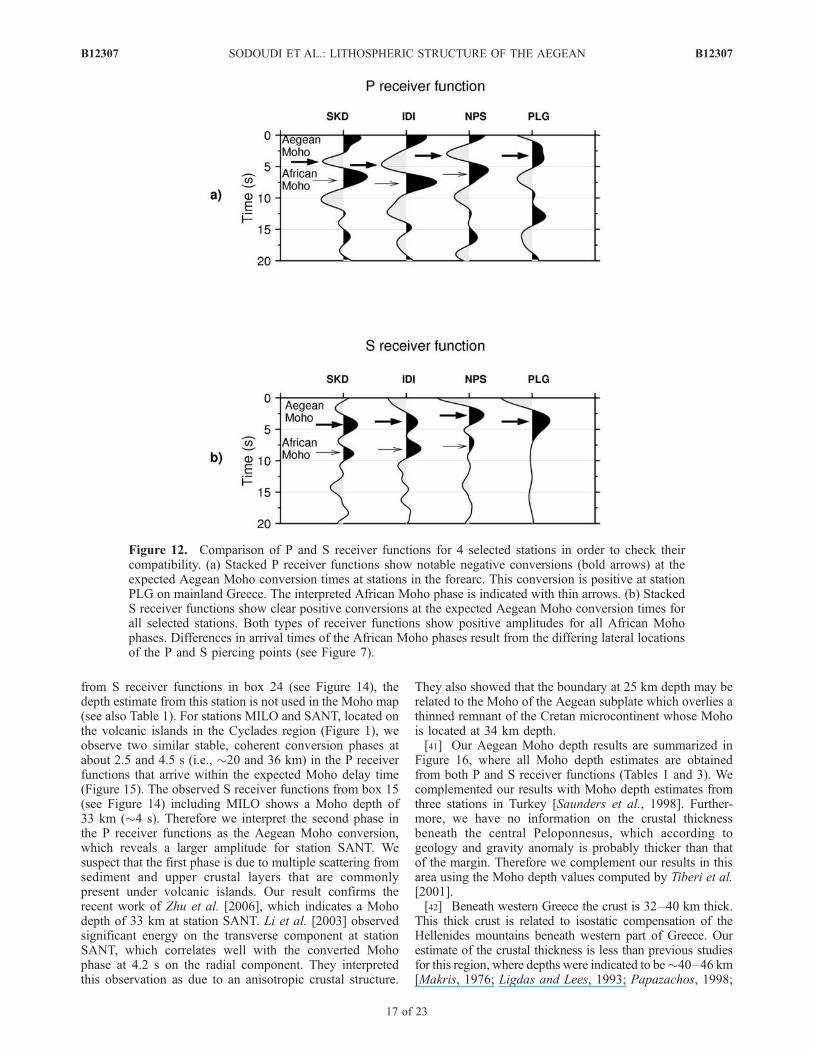
tude) in the forearc, whereas the P receiver functions at thesame sites show a reversed velocity contrast (i.e., negativeamplitude) (Figure 4). Such a reversal of sign for the Mohoconversion has been previously observed by Bostock et al.[2002] beneath the Cascadia subduction zone. To obtain acomplete picture and examine the origin of the negativeamplitude Ps Moho conversion at the forearc stations, weselected and compared P and S receiver functions recordedat four stations (Figure 12); three of them are located in theforearc (SKD, IDI, NPS) and one in continental Greece(PLG). We stack P and S receiver functions and apply aband-pass filter of 4–20 s (Figure 12).[37] On both the Ps and Sp plots, the bold vector indicates
the converted phase from the continental Aegean Moho andthe thin vector shows the converted phase from the sub-ducted African Moho. There are no conversions with clearpositive amplitude from the Aegean Moho in the P receiverfunction data at the three forearc stations. Instead, strongconverted phases with negative amplitudes appear at delaytimes of 3–4 s (marked with the bold vectors). Threeexplanations have been given for the negative amplitude
Ps receiver function Moho conversions recorded in Crete.Knapmeyer and Harjes [2000] interpret the weak negativesignal recorded in western Crete as due to a thick fossilaccretionary wedge. Li et al. [2003] interpret the negativephase recorded in western and northern central Crete as areversed Moho velocity contrast caused by a large amountof serpentinite in the mantle wedge. Finally, Endrun et al.[2005] conclude that significant Moho topography canprovide inverted Moho phases in the forearc.[38] Considering the results from both the P and S
receiver functions, we can discriminate between thesedifferent models. Although the Moho converted phases inFigure 12 reveal different polarities for P and S receiverfunctions at stations located in the forearc, the conversionshave the same polarity and arrival time at the station locatedon mainland Greece. We consider three different crust-mantle contrasts [Hacker et al., 2003] and calculate theircorresponding Ps and Sp conversion coefficients (Figure 13).A normal crust overlain by 100% peridotite uppermostmantle shows a positive Ps and a negative Sp conversioncoefficient. If the uppermost mantle contains 30% serpen-tinite, Ps conversion coefficients tend to have smaller
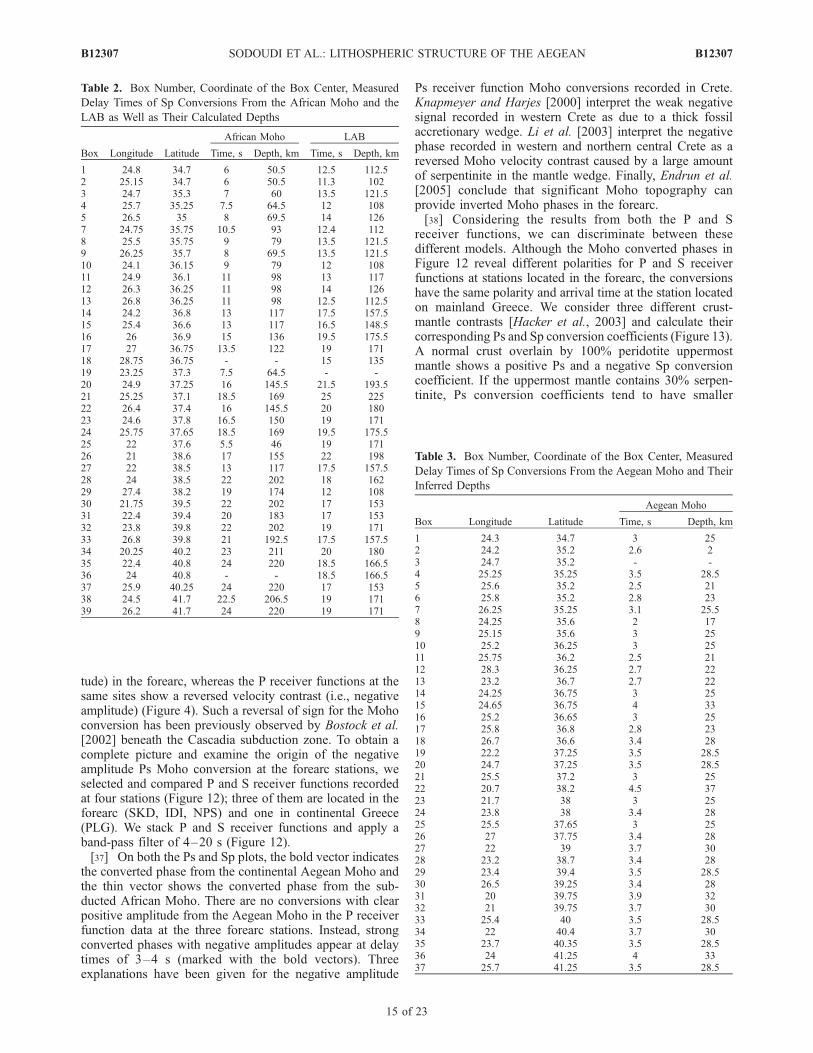
Table 2. Box Number, Coordinate of the Box Center, Measured
Delay Times of Sp Conversions From the African Moho and the
LAB as Well as Their Calculated Depths
Box Longitude Latitude
African Moho LAB
Time, s Depth, km Time, s Depth, km
1 24.8 34.7 6 50.5 12.5 112.52 25.15 34.7 6 50.5 11.3 1023 24.7 35.3 7 60 13.5 121.54 25.7 35.25 7.5 64.5 12 1085 26.5 35 8 69.5 14 1267 24.75 35.75 10.5 93 12.4 1128 25.5 35.75 9 79 13.5 121.59 26.25 35.7 8 69.5 13.5 121.510 24.1 36.15 9 79 12 10811 24.9 36.1 11 98 13 11712 26.3 36.25 11 98 14 12613 26.8 36.25 11 98 12.5 112.514 24.2 36.8 13 117 17.5 157.515 25.4 36.6 13 117 16.5 148.516 26 36.9 15 136 19.5 175.517 27 36.75 13.5 122 19 17118 28.75 36.75 - - 15 13519 23.25 37.3 7.5 64.5 - -20 24.9 37.25 16 145.5 21.5 193.521 25.25 37.1 18.5 169 25 22522 26.4 37.4 16 145.5 20 18023 24.6 37.8 16.5 150 19 17124 25.75 37.65 18.5 169 19.5 175.525 22 37.6 5.5 46 19 17126 21 38.6 17 155 22 19827 22 38.5 13 117 17.5 157.528 24 38.5 22 202 18 16229 27.4 38.2 19 174 12 10830 21.75 39.5 22 202 17 15331 22.4 39.4 20 183 17 15332 23.8 39.8 22 202 19 17133 26.8 39.8 21 192.5 17.5 157.534 20.25 40.2 23 211 20 18035 22.4 40.8 24 220 18.5 166.536 24 40.8 - - 18.5 166.537 25.9 40.25 24 220 17 15338 24.5 41.7 22.5 206.5 19 17139 26.2 41.7 24 220 19 171
Table 3. Box Number, Coordinate of the Box Center, Measured
Delay Times of Sp Conversions From the Aegean Moho and Their
Inferred Depths
Box Longitude Latitude
Aegean Moho
Time, s Depth, km
1 24.3 34.7 3 252 24.2 35.2 2.6 23 24.7 35.2 - -4 25.25 35.25 3.5 28.55 25.6 35.2 2.5 216 25.8 35.2 2.8 237 26.25 35.25 3.1 25.58 24.25 35.6 2 179 25.15 35.6 3 2510 25.2 36.25 3 2511 25.75 36.2 2.5 2112 28.3 36.25 2.7 2213 23.2 36.7 2.7 2214 24.25 36.75 3 2515 24.65 36.75 4 3316 25.2 36.65 3 2517 25.8 36.8 2.8 2318 26.7 36.6 3.4 2819 22.2 37.25 3.5 28.520 24.7 37.25 3.5 28.521 25.5 37.2 3 2522 20.7 38.2 4.5 3723 21.7 38 3 2524 23.8 38 3.4 2825 25.5 37.65 3 2526 27 37.75 3.4 2827 22 39 3.7 3028 23.2 38.7 3.4 2829 23.4 39.4 3.5 28.530 26.5 39.25 3.4 2831 20 39.75 3.9 3232 21 39.75 3.7 3033 25.4 40 3.5 28.534 22 40.4 3.7 3035 23.7 40.35 3.5 28.536 24 41.25 4 3337 25.7 41.25 3.5 28.5
B12307 SODOUDI ET AL.: LITHOSPHERIC STRUCTURE OF THE AEGEAN
15 of 23
B12307
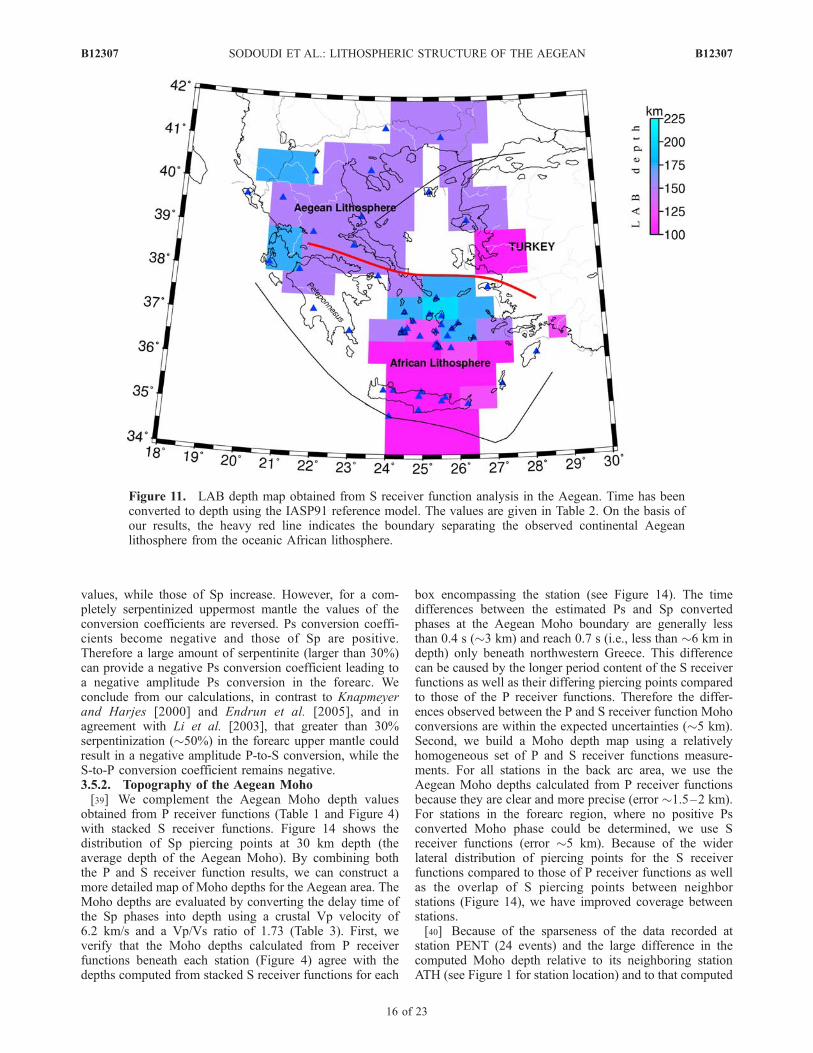
values, while those of Sp increase. However, for a com-pletely serpentinized uppermost mantle the values of theconversion coefficients are reversed. Ps conversion coeffi-cients become negative and those of Sp are positive.Therefore a large amount of serpentinite (larger than 30%)can provide a negative Ps conversion coefficient leading toa negative amplitude Ps conversion in the forearc. Weconclude from our calculations, in contrast to Knapmeyerand Harjes [2000] and Endrun et al. [2005], and inagreement with Li et al. [2003], that greater than 30%serpentinization (�50%) in the forearc upper mantle couldresult in a negative amplitude P-to-S conversion, while theS-to-P conversion coefficient remains negative.3.5.2. Topography of the Aegean Moho[39] We complement the Aegean Moho depth values
obtained from P receiver functions (Table 1 and Figure 4)with stacked S receiver functions. Figure 14 shows thedistribution of Sp piercing points at 30 km depth (theaverage depth of the Aegean Moho). By combining boththe P and S receiver function results, we can construct amore detailed map of Moho depths for the Aegean area. TheMoho depths are evaluated by converting the delay time ofthe Sp phases into depth using a crustal Vp velocity of6.2 km/s and a Vp/Vs ratio of 1.73 (Table 3). First, weverify that the Moho depths calculated from P receiverfunctions beneath each station (Figure 4) agree with thedepths computed from stacked S receiver functions for each
box encompassing the station (see Figure 14). The timedifferences between the estimated Ps and Sp convertedphases at the Aegean Moho boundary are generally lessthan 0.4 s (�3 km) and reach 0.7 s (i.e., less than �6 km indepth) only beneath northwestern Greece. This differencecan be caused by the longer period content of the S receiverfunctions as well as their differing piercing points comparedto those of the P receiver functions. Therefore the differ-ences observed between the P and S receiver function Mohoconversions are within the expected uncertainties (�5 km).Second, we build a Moho depth map using a relativelyhomogeneous set of P and S receiver functions measure-ments. For all stations in the back arc area, we use theAegean Moho depths calculated from P receiver functionsbecause they are clear and more precise (error �1.5–2 km).For stations in the forearc region, where no positive Psconverted Moho phase could be determined, we use Sreceiver functions (error �5 km). Because of the widerlateral distribution of piercing points for the S receiverfunctions compared to those of P receiver functions as wellas the overlap of S piercing points between neighborstations (Figure 14), we have improved coverage betweenstations.[40] Because of the sparseness of the data recorded at
station PENT (24 events) and the large difference in thecomputed Moho depth relative to its neighboring stationATH (see Figure 1 for station location) and to that computed
Figure 11. LAB depth map obtained from S receiver function analysis in the Aegean. Time has beenconverted to depth using the IASP91 reference model. The values are given in Table 2. On the basis ofour results, the heavy red line indicates the boundary separating the observed continental Aegeanlithosphere from the oceanic African lithosphere.
B12307 SODOUDI ET AL.: LITHOSPHERIC STRUCTURE OF THE AEGEAN
16 of 23
B12307
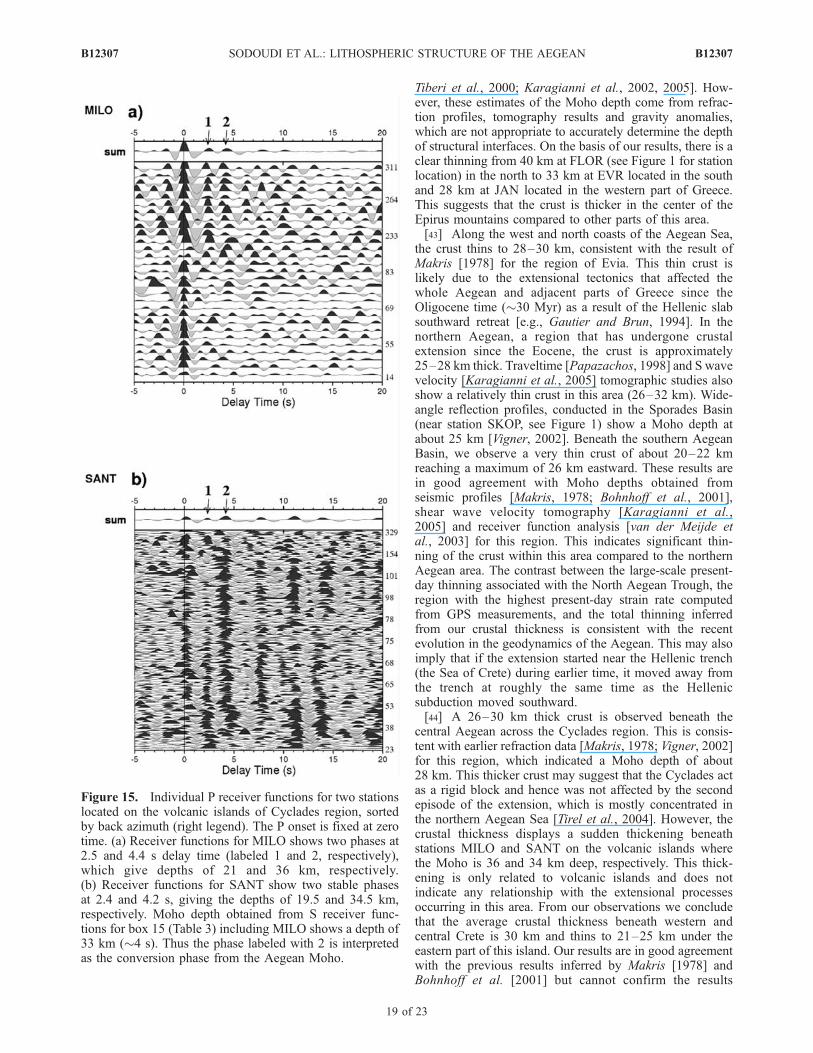
from S receiver functions in box 24 (see Figure 14), thedepth estimate from this station is not used in the Moho map(see also Table 1). For stations MILO and SANT, located onthe volcanic islands in the Cyclades region (Figure 1), weobserve two similar stable, coherent conversion phases atabout 2.5 and 4.5 s (i.e., �20 and 36 km) in the P receiverfunctions that arrive within the expected Moho delay time(Figure 15). The observed S receiver functions from box 15(see Figure 14) including MILO shows a Moho depth of33 km (�4 s). Therefore we interpret the second phase inthe P receiver functions as the Aegean Moho conversion,which reveals a larger amplitude for station SANT. Wesuspect that the first phase is due to multiple scattering fromsediment and upper crustal layers that are commonlypresent under volcanic islands. Our result confirms therecent work of Zhu et al. [2006], which indicates a Mohodepth of 33 km at station SANT. Li et al. [2003] observedsignificant energy on the transverse component at stationSANT, which correlates well with the converted Mohophase at 4.2 s on the radial component. They interpretedthis observation as due to an anisotropic crustal structure.
They also showed that the boundary at 25 km depth may berelated to the Moho of the Aegean subplate which overlies athinned remnant of the Cretan microcontinent whose Mohois located at 34 km depth.[41] Our Aegean Moho depth results are summarized in
Figure 16, where all Moho depth estimates are obtainedfrom both P and S receiver functions (Tables 1 and 3). Wecomplemented our results with Moho depth estimates fromthree stations in Turkey [Saunders et al., 1998]. Further-more, we have no information on the crustal thicknessbeneath the central Peloponnesus, which according togeology and gravity anomaly is probably thicker than thatof the margin. Therefore we complement our results in thisarea using the Moho depth values computed by Tiberi et al.[2001].[42] Beneath western Greece the crust is 32–40 km thick.
This thick crust is related to isostatic compensation of theHellenides mountains beneath western part of Greece. Ourestimate of the crustal thickness is less than previous studiesfor this region, where depths were indicated to be�40–46 km[Makris, 1976; Ligdas and Lees, 1993; Papazachos, 1998;
Figure 12. Comparison of P and S receiver functions for 4 selected stations in order to check theircompatibility. (a) Stacked P receiver functions show notable negative conversions (bold arrows) at theexpected Aegean Moho conversion times at stations in the forearc. This conversion is positive at stationPLG on mainland Greece. The interpreted African Moho phase is indicated with thin arrows. (b) StackedS receiver functions show clear positive conversions at the expected Aegean Moho conversion times forall selected stations. Both types of receiver functions show positive amplitudes for all African Mohophases. Differences in arrival times of the African Moho phases result from the differing lateral locationsof the P and S piercing points (see Figure 7).
B12307 SODOUDI ET AL.: LITHOSPHERIC STRUCTURE OF THE AEGEAN
17 of 23
B12307
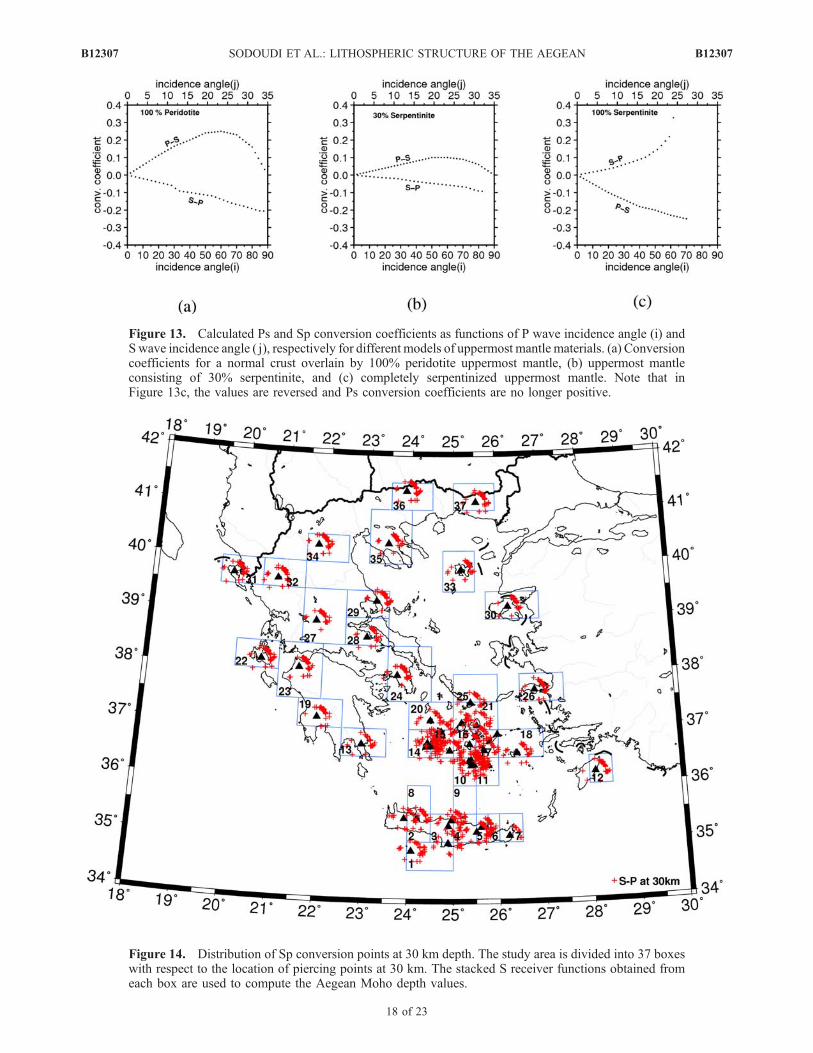
Figure 13. Calculated Ps and Sp conversion coefficients as functions of P wave incidence angle (i) andSwave incidence angle ( j), respectively for different models of uppermost mantle materials. (a) Conversioncoefficients for a normal crust overlain by 100% peridotite uppermost mantle, (b) uppermost mantleconsisting of 30% serpentinite, and (c) completely serpentinized uppermost mantle. Note that inFigure 13c, the values are reversed and Ps conversion coefficients are no longer positive.
Figure 14. Distribution of Sp conversion points at 30 km depth. The study area is divided into 37 boxeswith respect to the location of piercing points at 30 km. The stacked S receiver functions obtained fromeach box are used to compute the Aegean Moho depth values.
B12307 SODOUDI ET AL.: LITHOSPHERIC STRUCTURE OF THE AEGEAN
18 of 23
B12307
Tiberi et al., 2000; Karagianni et al., 2002, 2005]. How-ever, these estimates of the Moho depth come from refrac-tion profiles, tomography results and gravity anomalies,which are not appropriate to accurately determine the depthof structural interfaces. On the basis of our results, there is aclear thinning from 40 km at FLOR (see Figure 1 for stationlocation) in the north to 33 km at EVR located in the southand 28 km at JAN located in the western part of Greece.This suggests that the crust is thicker in the center of theEpirus mountains compared to other parts of this area.[43] Along the west and north coasts of the Aegean Sea,
the crust thins to 28–30 km, consistent with the result ofMakris [1978] for the region of Evia. This thin crust islikely due to the extensional tectonics that affected thewhole Aegean and adjacent parts of Greece since theOligocene time (�30 Myr) as a result of the Hellenic slabsouthward retreat [e.g., Gautier and Brun, 1994]. In thenorthern Aegean, a region that has undergone crustalextension since the Eocene, the crust is approximately25–28 km thick. Traveltime [Papazachos, 1998] and S wavevelocity [Karagianni et al., 2005] tomographic studies alsoshow a relatively thin crust in this area (26–32 km). Wide-angle reflection profiles, conducted in the Sporades Basin(near station SKOP, see Figure 1) show a Moho depth atabout 25 km [Vigner, 2002]. Beneath the southern AegeanBasin, we observe a very thin crust of about 20–22 kmreaching a maximum of 26 km eastward. These results arein good agreement with Moho depths obtained fromseismic profiles [Makris, 1978; Bohnhoff et al., 2001],shear wave velocity tomography [Karagianni et al.,2005] and receiver function analysis [van der Meijde etal., 2003] for this region. This indicates significant thin-ning of the crust within this area compared to the northernAegean area. The contrast between the large-scale present-day thinning associated with the North Aegean Trough, theregion with the highest present-day strain rate computedfrom GPS measurements, and the total thinning inferredfrom our crustal thickness is consistent with the recentevolution in the geodynamics of the Aegean. This may alsoimply that if the extension started near the Hellenic trench(the Sea of Crete) during earlier time, it moved away fromthe trench at roughly the same time as the Hellenicsubduction moved southward.[44] A 26–30 km thick crust is observed beneath the
central Aegean across the Cyclades region. This is consis-tent with earlier refraction data [Makris, 1978; Vigner, 2002]for this region, which indicated a Moho depth of about28 km. This thicker crust may suggest that the Cyclades actas a rigid block and hence was not affected by the secondepisode of the extension, which is mostly concentrated inthe northern Aegean Sea [Tirel et al., 2004]. However, thecrustal thickness displays a sudden thickening beneathstations MILO and SANT on the volcanic islands wherethe Moho is 36 and 34 km deep, respectively. This thick-ening is only related to volcanic islands and does notindicate any relationship with the extensional processesoccurring in this area. From our observations we concludethat the average crustal thickness beneath western andcentral Crete is 30 km and thins to 21–25 km under theeastern part of this island. Our results are in good agreementwith the previous results inferred by Makris [1978] andBohnhoff et al. [2001] but cannot confirm the results
Figure 15. Individual P receiver functions for two stationslocated on the volcanic islands of Cyclades region, sortedby back azimuth (right legend). The P onset is fixed at zerotime. (a) Receiver functions for MILO shows two phases at2.5 and 4.4 s delay time (labeled 1 and 2, respectively),which give depths of 21 and 36 km, respectively.(b) Receiver functions for SANT show two stable phasesat 2.4 and 4.2 s, giving the depths of 19.5 and 34.5 km,respectively. Moho depth obtained from S receiver func-tions for box 15 (Table 3) including MILO shows a depth of33 km (�4 s). Thus the phase labeled with 2 is interpretedas the conversion phase from the Aegean Moho.
B12307 SODOUDI ET AL.: LITHOSPHERIC STRUCTURE OF THE AEGEAN
19 of 23
B12307
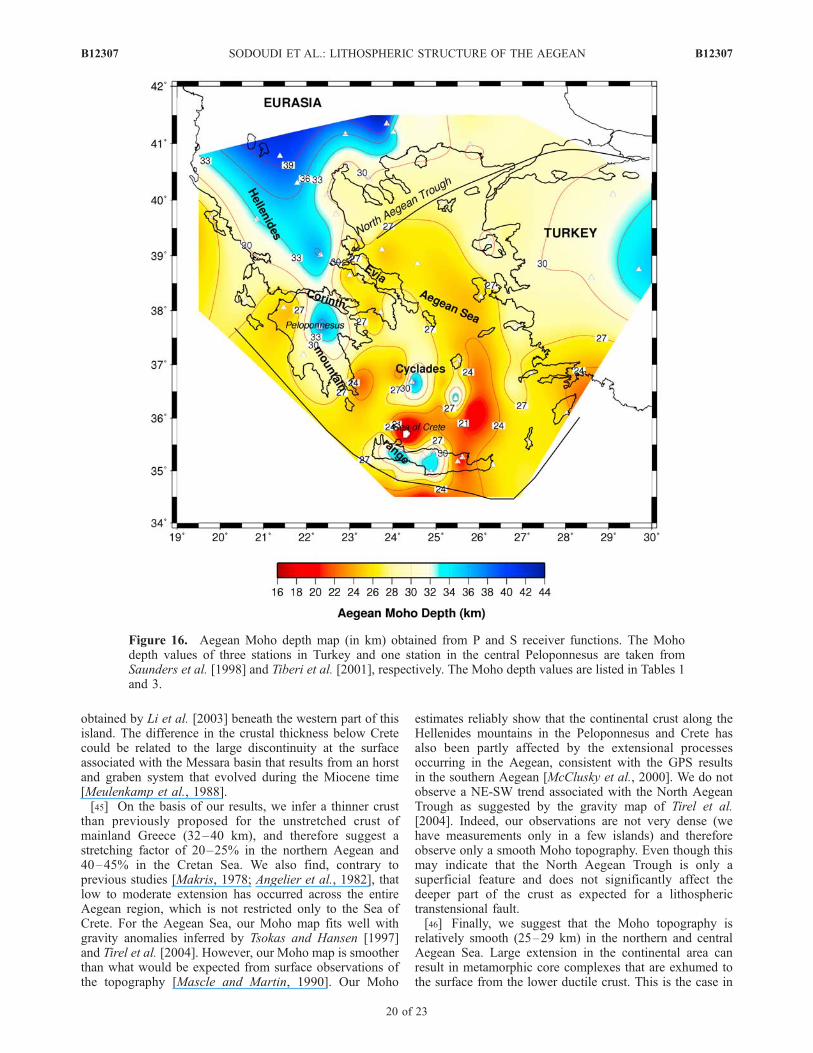
obtained by Li et al. [2003] beneath the western part of thisisland. The difference in the crustal thickness below Cretecould be related to the large discontinuity at the surfaceassociated with the Messara basin that results from an horstand graben system that evolved during the Miocene time[Meulenkamp et al., 1988].[45] On the basis of our results, we infer a thinner crust
than previously proposed for the unstretched crust ofmainland Greece (32–40 km), and therefore suggest astretching factor of 20–25% in the northern Aegean and40–45% in the Cretan Sea. We also find, contrary toprevious studies [Makris, 1978; Angelier et al., 1982], thatlow to moderate extension has occurred across the entireAegean region, which is not restricted only to the Sea ofCrete. For the Aegean Sea, our Moho map fits well withgravity anomalies inferred by Tsokas and Hansen [1997]and Tirel et al. [2004]. However, our Moho map is smootherthan what would be expected from surface observations ofthe topography [Mascle and Martin, 1990]. Our Moho
estimates reliably show that the continental crust along theHellenides mountains in the Peloponnesus and Crete hasalso been partly affected by the extensional processesoccurring in the Aegean, consistent with the GPS resultsin the southern Aegean [McClusky et al., 2000]. We do notobserve a NE-SW trend associated with the North AegeanTrough as suggested by the gravity map of Tirel et al.[2004]. Indeed, our observations are not very dense (wehave measurements only in a few islands) and thereforeobserve only a smooth Moho topography. Even though thismay indicate that the North Aegean Trough is only asuperficial feature and does not significantly affect thedeeper part of the crust as expected for a lithospherictranstensional fault.[46] Finally, we suggest that the Moho topography is
relatively smooth (25–29 km) in the northern and centralAegean Sea. Large extension in the continental area canresult in metamorphic core complexes that are exhumed tothe surface from the lower ductile crust. This is the case in
Figure 16. Aegean Moho depth map (in km) obtained from P and S receiver functions. The Mohodepth values of three stations in Turkey and one station in the central Peloponnesus are taken fromSaunders et al. [1998] and Tiberi et al. [2001], respectively. The Moho depth values are listed in Tables 1and 3.
B12307 SODOUDI ET AL.: LITHOSPHERIC STRUCTURE OF THE AEGEAN
20 of 23
B12307
the Aegean [e.g., Gautier and Brun, 1994], even though themechanism of exhumation is still disputed. The Mohotopography of the Basin and Range province (another areaexperiencing large extension) is rather flat [Gans, 1987],supporting a model where the lower crust flows to accom-modate extension and yield a smooth Moho topography. Inthe Aegean, our results also show little topography (lessthan 4 km except beneath the volcanic islands), whereastectonic observations suggest a larger variability of stretch-ing. This variation is two times less than that proposed byZhu et al. [2006] and, therefore shows a smaller differencein the viscosity of the lower crust between the Basin andRange province and the Aegean area. On the basis of ourresults, the Aegean and the Basin and Range province showsimilar variation in Moho topography and so suggestssimilar mechanical properties for the lower crust.
4. Conclusions
[47] By combining P and S receiver function observationswe have obtained a dense seismic sampling of the AegeanSea and the surrounding regions. We observe a crustalthinning from 38–40 km in western Greece to 28–30 kmin the northern and eastern coasts of the Aegean to 25–28 kmin the northern Aegean Sea. The discrepancy between thepresent-day strain rate located mostly in the northernAegean Sea and the greatest crustal thinning observedbeneath the southern Aegean Sea (crustal thickness of20–22 km) confirms that the present-day kinematic patternis new. Furthermore, a crustal thickness of 26–30 kmbeneath the Cyclades in the central Aegean Sea supportsthis idea, that the second episode of the crustal thinning hasnot significantly affected this area. The relatively constantMoho depth observed in the northern and central Aegeanacross the metamorphic complex area suggests that thelower ductile crust compensates the stretching of the uppercrust. Observation of the reversed Moho velocity contrastobtained from P receiver functions at forearc stations (Crete,Peloponnesus, Rhodes) indicates serpentinization (�50%)in the mantle wedge of the overriding Aegean plate and isresponsible for the reversed sign of the P-to-S conversioncoefficient. We found different crustal thicknesses beneathCrete (21–25 km in the east and 30–33 km in the west) andestimate a crustal thickness of 25–28 km beneath themargin of the Peloponnesus.[48] A high-resolution image of the Hellenic subduction
zone demonstrates the penetration of the Moho of thesubducting African plate from the Hellenic trench to north-ern Greece at depths between 40 and 220 km. The shape ofthe African Moho is coherent with the intermediate seis-micity and shows a shallow dip beneath the westernPeloponnesus, which becomes steeper beneath Crete andsoutheast of Rhodes. On the basis of our S receiverfunctions, the lithosphere-asthenosphere boundary of thesubducting African plate is at 100 km depth beneath thesouthern part of the Aegean region and dips beneaththe volcanic arc to a depth of about 225 km and thereforeimplies a thickness of 60–65 km for the subducted Africanlithosphere. Beneath western and northern Greece as well asin the northern Aegean Sea, the continental Aegean litho-sphere lies above the downgoing African Moho and isobserved at about 150 km depth. The thick Eurasian
lithosphere, which seems to be smooth across continentalGreece and the northern Aegean Sea, suggests that the crustwas significantly more involved in the stretching processthan the lithosphere. This is associated with the metamor-phic core complexes evidenced in the northern Aegean andCyclades islands.
[49] Acknowledgments. The project has been supported by grantsfrom the Deutsche Forschungsgemeinschaft (DFG) by the GFZ Potsdam;the GFZ Geophysical Instrument Pool; the MIDSEA project of ETH ZurichSwitzerland; the Bochum University, Germany; the University of Chania,Crete, Greece; the National Observatory of Athens (NOA); and theSeismological Network of the Thessaloniki. Seisfaultgreece was supportedby the contract ENV4-CT96-0277 from the program Environment andClimate of the European Commission and by the program IDYL of INSU-CNRS. We thank A. Kirtazi and K. Makropoulos for their invaluable helpand observers of both the Geophysical Lab of Thessaloniki and theGeophysical Lab of Athens for their help in the Seisfaultgreece experiment.We also thank Doug Angus for carefully reading the manuscript and helpfulcomments. Constructive reviews by Meredith Nettles, James Gaherty, and aJGR Associated Editor significantly improved our manuscript.
ReferencesAngelier, J., N. Lyberis, X. Le Pichon, E. Barrier, and P. Huchon (1982),The neotectonic development of the Hellenic arc and the Sea of Crete: Asynthesis, Tectonophysics, 86, 159–196.
Armijo, R., B. Meyer, G. King, A. Rigo, and D. Papanastassiou (1996),Quaternary evolution of the Corinth Rift and its applications for the lateCenozoic evolution of the Aegean, Geophys. J. Int., 126, 11–53.
Bijwaard, H., W. Spakman, and E. R. Engdahl (1998), Closing the gapbetween regional and global travel time tomography, J. Geophys. Res.,103, 30,055–30,078.
Bock, G. (1991), Long-period S to P converted waves and the onset ofpartial melting beneath Oahu, Hawaii, Geophys. Res. Lett., 18, 869–872.
Bohnhoff, M., J. Makris, D. Papanikolaou, and G. Stravakakis (2001),Crustal investigation of the Hellenic subduction zone using wide apertureseismic data, Tectonophysics, 343, 239–262.
Bostock, M. G., R. D. Hyndman, S. Rondeny, and S. M. Peacock (2002),An inverted continental Moho and serpentinization of the forearc mantle,Nature, 417, 536–538.
Bourova, E., I. Kassaras, H. A. Pedersen, T. Yanovskaya, D. Hatzfeld, andA. Kirtazi (2005), Constraints on absolute S velocities beneath the Ae-gean Sea from surface wave analysis, Geophys. J. Int., 160, 1006–1019.
Calcagnile, G., F. D’Ingeo, P. Farrugia, and G. F. Panza (1982), The litho-sphere in the central-eastern Mediterranean area, Pure Appl. Geophys.,120, 389–406.
Christodoulou, A., and D. Hatzfeld (1988), Three-dimensional crustal andupper mantle structure beneath Chalkidiki (northern Greece), Earth Pla-net. Sci. Lett., 88, 153–168.
Clement, C., M. Sachpazi, P. Charvis, D. Graindorge, M. Laigle, A. Hirn,and G. Zafiropoulos (2004), Reflection-refraction seismic in the Gulf ofCorinth: Hints at deep structure and control of the deep marine basin,Tectonophysics, 391, 97–108.
De Jonge, M. R., M. J. R. Wortel, and W. Spakman (1993), From tectonicreconstruction to upper mantle model: An application to the Alpine-Mediterranean region, Tectonophysics, 223, 53–65.
Delibasis, N., J. Makris, and J. Drakopoulos (1988), Seismic investigationof the crust and the upper mantle in western Greece, Ann. Geol. PaysHellen., 33, 69–83.
DeMets, C., R. G. Gordon, D. F. Argus, and S. Stein (1990), Current platemotions, Geophys. J. Int., 101, 425–478.
Drakatos, G., and J. Drakopoulos (1991), 3-D velocity structure beneath thecrust and upper mantle of the Aegean sea region, Pure Appl. Geophys.,135, 401–420.
Ekstrom, G., and P. England (1989), Seismic strain rates in regions ofdistributed continental deformation, J. Geophys. Res., 94, 10,231–10,257.
Endrun, B., T. Meier, M. Bischoff, and H. P. Harjes (2004), Lithosphericstructure in the area of Crete constrained by receiver functions and disper-sion analysis of Rayleigh phase velocities,Geophys. J. Int., 158, 592–608.
Endrun, B., L. Ceranna, T. Meier, M. Bohnhoff, and H. P. Harjes (2005),Modeling the influence of Moho topography on receiver functions: Acase study from the central Hellenic subduction zone, Geophys. Res.Lett., 32, L12311, doi:10.1029/2005GL023066.
Engdahl, E. R., R. van der Hilst, and R. Buland (1988), Global teleseismicearthquake relocation with improved travel times and procedures fordepth determination, Bull. Seismol. Soc. Am., 88, 722–743.
B12307 SODOUDI ET AL.: LITHOSPHERIC STRUCTURE OF THE AEGEAN
21 of 23
B12307
Faber, S., and G. Muller (1980), Sp phases from the transition zone betweenthe upper and lower mantle, Bull. Seismol. Soc. Am., 70, 487–508.
Farra, V., and L. Vinnik (2000), Upper mantle stratification by P and Sreceiver functions, Geophys. J. Int., 141, 699–712.
Gans, P. B. (1987), An open-system, two layer crustal stretching model forthe eastern Great Basin, Tectonics, 6, 1–12.
Gautier, P., and J.-P. Brun (1994), Ductile crust exhumation and extensionaldetachments in the central Aegean (Cyclades and Evia islands), Geodyn.Acta, 7, 57–85.
Hacker, B. R., G. A. Abers, and S. M. Peacock (2003), Subduction factory:1. Theoretical mineralogy, densities, seismic wave speeds, and H2O con-tents, J. Geophys. Res., 108(B1), 2029, doi:10.1029/2001JB001127.
Hatzfeld, D. (1989), The Hellenic subduction beneath the Peloponnesus:First results of a microearthquake study, Earth Planet. Sci. Lett., 93,283–291.
Hatzfeld, D. (1994), On the shape of the subducting slab beneath thePeleponnese, Greece, Geophys. Res. Lett., 21, 173–176.
Hatzfeld, D., and C. Martin (1992), The Aegean intermediate seismicitydefined by ISC data, Earth Planet. Sci. Lett., 113, 267–275.
Hatzfeld, D., M. Besnard, K. Makropoulos, N. Voulgaris, V. Kouskouna,P. Hatzidimitriou, D. Panagiotopoulos, G. Karakaisis, A. Deschamps, andH. Lyon-Caen (1993), Subcrustal microearthquake seismicity and faultplane solutions beneath the Hellenic arc, J. Geophys. Res., 98, 9861–9870.
Hatzfeld, D., J. Martinod, G. Bastet, and P. Gautier (1997), An analogexperiment for the Aegean to describe the contribution of gravitationalpotential energy, J. Geophys. Res., 102, 649–659.
Hatzfeld, D., E. Karagianni, I. Kassaras, A. Kiratzi, E. Louvari, H. Lyon-Caen,K. Makropoulos, P. Papadimitriou, G. Bock, and K. Priestley (2001),Shear wave anisotropy in the upper mantle beneath the Aegean relatedto internal deformation, J. Geophys. Res., 106, 30,737–30,753.
Jackson, J. A., and D. P. McKenzie (1988), The relationship between platemotions and seismic moment tensors, and the rates of active deformationin the Mediterranean and Middle East, Geophys. J.R. Astron. Soc., 93,45–73.
Jackson, J. A., J. Haines, and W. Holt (1994), A comparison of satellitelaser ranging and seismicity data in the Aegean region, Geophys. Res.Lett., 21, 2849–2852.
Jolivet, L. (2001), A comparison of geodetic and finite strain in the Aegean:Geodynamic implications, Earth Planet. Sci. Lett., 187, 95–104.
Kahle, H.-G., C. Straub, R. Reilinger, S. McClusky, R. King, K. Hurst,G. Veis, K. Kastens, and P. Cross (1998), The strain field in the easternMediterranean region, estimated by repeated GPS measurements, Tecto-nophysics, 294, 237–252.
Karagianni, E. E., D. G. Pabagiotopoulos, G. F. Panza, P. Suhadolc, C. B.Papazachos, B. C. Papazachos, A. Kirtazi, D. Hatzfeld, K. Makropoulos,K. Priestley, and A. Vuan (2002), Rayleigh wave group velocity tomo-graphy in the Aegean area, Tectonophysics, 358, 187–209.
Karagianni, E. E., C. B. Papazachos, D. G. Panagiotopoulos, P. Suhadolc,A. Vuan, and G. F. Panza (2005), Shear velocity structure in the Aegeanarea obtained by inversion of Rayleigh waves, Geophys. J. Int., 160,127–143.
Kennett, B. L. N., and E. R. Engdahl (1991), Travel times for globalearthquake location and phase identification, Geophys. J. Int., 105,429–465.
Kind, R., and L. P. Vinnik (1988), The upper mantle discontinuities under-neath the GRF array from P-to-S converted phases, J. Geophys., 62,138–147.
Kissel, C., and C. Laj (1988), The tertiary geodynamical evolution of theAegean arc; a paleomagnetic reconstruction,Tectonophysics, 146, 183–201.
Knapmeyer, M., and H.-P. Harjes (2000), Imaging crustal discontinuities andthe downgoing slab beneath western Crete, Geophys. J. Int., 143, 1–21.
Kosarev, G., R. Kind, S. V. Sobolev, X. Yuan, W. Hanka, and S. Oreshin(1999), Seismic evidence for a detached Indian lithosphere mantlebeneath Tibet, Science, 283, 1306–1309.
Kumar, P., et al. (2005a), The lithosphere-asthenosphere boundary in thenorth west Atlantic region, Earth Planet. Sci. Lett., 236, 249–257.
Kumar, P., X. Yuan, R. Kind, and G. Kosarev (2005b), The lithosphere-asthenosphere boundary in the Tien Shan-Karakoram region from S re-ceiver functions: Evidence of continental subduction, Geophys. Res. Lett.,32, L07305, doi:10.1029/2004GL022291.
Langston, C. A. (1977), The effect of planar dipping structure on sourceand receiver responses for constant ray parameter, Bull. Seismol. Soc.Am., 67, 1029–1050.
Le Pichon, X., and J. Angelier (1979), The Hellenic arc and trench system:A key to the neotectonic evolution of the eastern Mediterranean area,Tectonophysics, 60, 1–42.
Le Pichon, X., N. Lyberis, J. Angelier, and V. Renard (1982), Strain dis-tribution over the east Mediterranean ridge: A synthesis incorporatingnew Sea-Beam data, Tectonophysics, 86, 243–274.
Le Pichon, X., N. Chamot-Rooke, and S. Lallemant (1995), Geodeticdetermination of the kinematics of central Greece with respect to Europe:Implications for eastern Mediterranean tectonics, J. Geophys. Res., 100,12,675–12,690.
Li, X., G. Bock, A. Vafidis, R. Kind, H.-P. Harjes, W. Hanka, K. Wylegalla,M. v. d. Meijde, and X. Yuan (2003), Receiver function study of theHellenic subduction zone: Imaging crustal thickness variations and theoceanic Moho of the descending African lithosphere, Geophys. J. Int.,155, 733–748.
Li, X., R. Kind, X. Yuan, I. Wolbern, and W. Hanka (2004), Rejuvenationof the lithosphere by the Hawaiian plume, Nature, 427, 827–829.
Ligdas, C. N., and J. M. Lees (1993), Seismic velocity constrains in theThessaloniki and Chalkidiki areas (northern Greece) from a 3-D tomo-graphic study, Tectonophysics, 228, 97–121.
Ligdas, C. N., and I. G. Main (1991), On the resolving power of tomo-graphic images in the Aegean area, Geophys. J. Int., 107, 197–203.
Ligdas, C. N., I. G. Main, and R. D. Adams (1990), 3-D structureof the lithosphere in the Aegean Sea region, Geophys. J. Int., 102,219–229.
Makris, J. (1973), Some geophysical aspects of the evolution of the Helle-nides, Bull. Geol. Soc. Greece, 10, 206–213.
Makris, J. A. (1976), A dynamic model of the Hellenic arc deduced fromgeophysical data, Tectonophysics, 36, 339–346.
Makris, J. (1978), The crust and upper mantle structure of the Aegeanregion from deep soundings, Tectonophysics, 46, 269–284.
Makris, J., and C. Stobbe (1984), Physical properties and state of the crustand upper mantle of the eastern Mediterranean Sea deduced from geo-physical data, Mar. Geol., 55, 347–363.
Makropoulos, K., and P. Burton (1984), Greek tectonics and seismicity,Tectonophysics, 106, 275–304.
Marone, F., M. van der Meijde, S. van der Lee, and D. Giardini (2003),Joint inversion of local, regional and teleseismic data for crustal thicknessin the Eurasia-Africa boundary region, Geophys. J. Int., 154, 499–514.
Mascle, J., and L. Martin (1990), Shallow structure and recent evolution ofthe Aegean Sea: A synthesis based on continuous reflection profiles,Mar.Geol., 94, 271–299.
McClusky, S., et al. (2000), Global Positioning System constraints on platekinematics and dynamics in the eastern Mediterranean and Caucasus,J. Geophys. Res., 105, 5695–5719.
McKenzie, D. P. (1972), Active tectonics of the Mediterranean region,Geophys. J.R. Astron. Soc., 30, 109–185.
McKenzie, D. P. (1978), Active tectonics of the Alpine-Himalayan belt:The Aegean Sea and surrounding regions, Geophys. J.R. Astron. Soc., 55,217–254.
Mercier, J., D. Sorel, P. Vergely, and K. Simeakis (1989), Extensionaltectonic regimes in the Aegean basins during the Cenozoic, Basin Res.,2, 49–71.
Meulenkamp, J. E., M. J. R. Wortel, W. A. Wamel, W. Spakman, andE. Hoogerduyn Starting (1988), On the Hellenic subduction zone andthe geodynamic evolution of Crete since the late middle Miocene, Tecto-nophysics, 146, 203–215.
Owens, T. J., G. Zandt, and S. R. Taylor (1984), Seismic evidence for anancient rift beneath the Cumberland Plateau, Tennessee: A detailed ana-lysis of broadband teleseismic P waveforms, J. Geophys. Res., 89, 7783–7795.
Panagiotopoulos, D. G., and B. C. Papazachos (1985), Travel times of Pnwaves in the Aegean and surrounding area, Geophys. J.R. Astron. Soc.,80, 165–176.
Papazachos, B. C. (1969), Phase velocities of Rayleigh waves in the south-eastern Europe and eastern Mediterranean Sea, Pure Appl. Geophys., 75,47–55.
Papazachos, B. C. (1990), Seismicity of the Aegean and surrounding area,Tectonophysics, 178, 287–308.
Papazachos, B. C., and P. E. Comninakis (1969), Geophysical features ofthe Greek Island arc and eastern Mediterranean ridge, C.R. Seances Conf.Reunie Madrid, 16, 74–75.
Papazachos, B. C., and P. E. Comninakis (1971), Geophysical and tectonicfeatures of the Aegean arc, J. Geophys. Res., 76, 8517–8533.
Papazachos, B. C., V. G. Karakostas, C. B. Papazachos, and E. M. Scordilis(2000), The geometry of the Wadati-Benioff zone and lithospheric kine-matics in the Hellenic arc, Tectonophysics, 319, 275–300.
Papazachos, C. B. (1998), Crustal and upper mantle P and S velocitystructure of the Serbomacedonian massif (northern Greece), Geophys.J. Lett., 134, 25–39.
Papazachos, C. B., and G. Nolet (1997), P and S deep velocity structure ofthe Hellenic area obtained by robust nonlinear inversion of travel times,J. Geophys. Res., 102, 8349–8367.
Papazachos, C. B., P. M. Hatzidimitriou, D. G. Panagiotopoulos, and G. N.Tsokas (1995), Tomography of the crust and upper mantle in southeastEurope, J. Geophys. Res., 100, 12,405–12,422.
B12307 SODOUDI ET AL.: LITHOSPHERIC STRUCTURE OF THE AEGEAN
22 of 23
B12307

Payo, G. (1967), Crustal structure of the Mediterranean Sea by surfacewaves, I, Group velocity, Bull. Seismol. Soc. Am., 57, 151–172.
Payo, G. (1969), Crustal structure of the Mediterranean Sea by surfacewaves, II, Phase velocity and travel time, Bull. Seismol. Soc. Am., 59,23–42.
Reilinger, R., S. McClusky, M. B. Oral, R. W. King, and M. N. Toksoz(1997), Global Positioning System measurements of present-day crustalmovements in the Arabia-Africa-Eurasia plate collision zone, J. Geophys.Res., 102, 9983–9999.
Saunders, P., K. Priestley, and T. Taymaz (1998), Variations in the crustalstructure beneath western Turkey, Geophys. J. Int., 134, 373–389.
Sodoudi, F., X. Yuan, Q. Liu, R. Kind, and J. Chen (2006), Lithosphericthickness beneath the Dabie Shan, central eastern China from S recieverfunctions, Geophys. J. Int., 166, 1363–1367.
Sorel, D., J. L. Mercier, B. Keraudren, and M. Cushing (1988), Le rule de latraction de la lithosphere subductee dans l’Evolution geodynamique Plio-Pleistocene de l’arc Egeen: mouvement verticaux alternes et variations duregime tectonique, C.R. Acad. Sci., 307, 1981–1986.
Spakman, W. (1986), Subduction beneath Eurasia in connection with theMesozoic Tethys, Geol. Mijnbouw., 65, 145–153.
Spakman, W., M. J. R. Wortel, and N. S. Vlaar (1988), The Hellenicsubduction zone: A tomographic image and its geodynamical implica-tions, Geophys. Res. Lett., 15, 60–63.
Spakman, W., S. Van der Lee, and R. D. Van der Hilst (1993), Travel timetomography of the European-Mediterranean mantle down to 1400 km,Geophys. Res. Lett., 15, 60–63.
Taymaz, T., J. A. Jackson, and D. McKenzie (1991), Active tectonics of thenorth and central Aegean Sea, Geophys. J. Int., 106, 433–490.
Tiberi, C., H. Lyon-Caen, D. Hatzfeld, U. Achauer, E. Karagianni,A. Kirtazi, E. Louvari, D. Panagiotopoulos, I. Kassaras, G. Kaviris,K. Makropoulos, and P. Papadimitriou (2000), Crustal and upper mantlestructure beneath the Corinth rift (Greece) from a teleseismic tomographystudy, J. Geophys. Res., 105, 28,159–28,172.
Tiberi, C., M. Diament, H. Lyon-Caen, and T. King (2001), Moho topo-graphy beneath the Corinth Rift area (Greece) from inversion of gravitydata, Geophys. J. Int., 145, 797–808.
Tirel, C., F. Gueydan, C. Tiberi, and J.-P. Brun (2004), Aegean crustalthickness inferred from gravity inversion Geodynamical implications,Earth Planet. Sci. Lett., 228, 267–280.
Tsokas, G. N., and R. O. Hansen (1997), Study of the crustal thickness andsubducting lithosphere in Greece from gravity data, J. Geophys. Res.,102, 20,585–20,597.
van der Meijde, M., S. van der Lee, and D. Giardini (2003), Crustal struc-ture beneath broad-band seismic stations in the Mediterranean region,Geophys. J. Int., 152, 729–739.
Vigner, A. (2002), Images sismiques par reflexions verticale et grand-anglede la croute en contexte extensif, Les Cyclades et le Fosse Nord-Egeen,these, 269 pp., Inst. Phys. du Globe de Paris, Paris.
Wortel, M. J. R., S. D. B. Goes, and W. Spakman (1990), Structure andseismicity of the Aegean subduction zone, Terra Nova, 2, 554–562.
Wortel, R. (1982), Seismicity and rheology of subducted slabs, Nature, 296,553–556.
Yuan, X., S. V. Sobolev, and R. Kind (2002), Moho topography in thecentral Andes and its geodynamic implication, Earth Planet. Sci. Lett.,199, 389–402.
Yuan, X., R. Kind, X. Li, and R. Wang (2006), The S receiver functions:Synthetics and data example, Geophys. J. Int., 165, 555–564.
Zandt, G., and C. J. Ammon (1995), Continental crust composition con-strained by measurements of crustal Poisson’s ratio, Nature, 374, 152–154.
Zhu, L., and H. Kanamori (2000), Moho depth variation in southern Cali-fornia from teleseismic receiver functions, J. Geophys. Res., 105, 2890–2969.
Zhu, L., B. J. Mitchell, N. Akyol, I. Cemen, and K. Kekovali (2006),Crustal thickness variations in the Aegean region and implications forthe extension of continental crust, J. Geophys. Res., 111, B01301,doi:10.1029/2005JB003770.
�����������������������M. Bohnhoff, GeoForschungsZentrum Potsdam, Telegrafenberg, 14473
Potsdam, Germany.W.Hanka,R. Kind, F. Sodoudi, andK.Wylegalla, GeoForschungsZentrum
Potsdam, Telegrafenberg, D-14473 Potsdam, Germany. ([email protected])H.-P. Harjes, Department of Geosciences, Ruhr-University Bochum,
D-44780 Bochum, Germany.D. Hatzfeld, Laboratoire des Geophysique Interne et Tectonophysique,
1381, rue de la Piscine, F- 38041 Grenoble Cedex 9, France.K. Priestley, Bullard Laboratory, Madingley Rise, Cambridge CB3 0EZ,
UK.G. Stavrakakis, National Observatory of Athens, P.O. Box 20048, GR-
11810 Athens, Greece.A. Vafidis, Department of Mineral Resources Engineering, Technical
University of Chania, GR-73100 Chania, Crete, Greece.
B12307 SODOUDI ET AL.: LITHOSPHERIC STRUCTURE OF THE AEGEAN
23 of 23
B12307