
Preparation and characterization of solid dispersion of simvastatin
Upload
independentCategory
view
1download
0
ORIGINAL ARTICLE
Lipidomic analysis of variation in response to simvastatinin the Cholesterol and Pharmacogenetics Study
Rima Kaddurah-Daouk • Rebecca A. Baillie • Hongjie Zhu •
Zhao-Bang Zeng • Michelle M. Wiest • Uyen Thao Nguyen •
Steven M. Watkins • Ronald M. Krauss
Received: 18 January 2010 / Accepted: 4 March 2010 / Published online: 1 April 2010
� The Author(s) 2010. This article is published with open access at Springerlink.com
Abstract Statins are commonly used for reducing
cardiovascular disease risk but therapeutic benefit and
reductions in levels of low-density lipoprotein cholesterol
(LDL-C) vary among individuals. Other effects, including
reductions in C-reactive protein (CRP), also contribute to
treatment response. Metabolomics provides powerful tools
to map pathways implicated in variation in response to
statin treatment. This could lead to mechanistic hypotheses
that provide insight into the underlying basis for individual
variation in drug response. Using a targeted lipidomics
platform, we defined lipid changes in blood samples from
the upper and lower tails of the LDL-C response distribu-
tion in the Cholesterol and Pharmacogenetics study.
Metabolic changes in responders are more comprehensive
than those seen in non-responders. Baseline cholesterol
ester and phospholipid metabolites correlated with LDL-C
response to treatment. CRP response to therapy correlated
with baseline plasmalogens, lipids involved in inflamma-
tion. There was no overlap of lipids whose changes cor-
related with LDL-C or CRP responses to simvastatin
suggesting that distinct metabolic pathways govern statin
effects on these two biomarkers. Metabolic signatures
could provide insights about variability in response and
mechanisms of action of statins.
Keywords Cardiovascular disease � Lipidomics �Metabolomics � Pharmacogenomics �Pharmacometabolomics � Simvastatin
1 Introduction
Statins or HMG-CoA reductase inhibitors are used to treat
or prevent cardiovascular disease (CVD), which affects
over 64 million Americans and remains the leading cause
of death for all major ethnic groups in the U.S. (AHA
2004). Statins are the largest single class of drugs pre-
scribed for CVD prevention, with over 120 million pre-
scriptions and over $13 billion in sales in 2003 (Lawrence
and Zaugg 2004). Several clinical trials including Scandi-
navian Simvastatin Survival Study, Cholesterol and
Recurrent Events, and Jupiter (Baigent et al. 2005; Ridker
et al. 2008; Zhou et al. 2006) have demonstrated the ben-
eficial effects of statin therapy for primary and secondary
prevention of CVD. The primary clinical rationale for
statin use is to reduce low-density lipoprotein cholesterol
(LDL-C) and, thereby, to reduce CVD risk (Grundy 2001).
This effect is due in large part to increased LDL and
Electronic supplementary material The online version of thisarticle (doi:10.1007/s11306-010-0207-x) contains supplementarymaterial, which is available to authorized users.
R. Kaddurah-Daouk (&)
Duke University Medical Center, Box 3950, Durham,
NC 27710, USA
e-mail: [email protected]
R. A. Baillie
Rosa & Co. LLC, 751 Laurel St., Suite 127, San Carlos,
CA 94070, USA
M. M. Wiest � U. T. Nguyen � S. M. Watkins
Lipomics Technologies-Tethys Bioscience, 3410 Industrial
Boulevard, West Sacramento, CA 95691, USA
H. Zhu � Z.-B. Zeng
Department of Statistics and Bioinformatics Research Center,
North Carolina State University, Raleigh, NC 27695-7566, USA
R. M. Krauss (&)
Children’s Hospital Oakland Research Institute, Oakland,
CA 94609, USA
e-mail: [email protected]
123
Metabolomics (2010) 6:191–201
DOI 10.1007/s11306-010-0207-x
intermediate-density lipoprotein (Neidlinger et al. 2006)
clearance as a result of the up-regulation of LDL receptors
(Bilheimer et al. 1983).
Intervention trials with statin drugs have demonstrated a
remarkable degree of consistency in their ability to reduce
risk for both CVD and stroke (Grundy 2001; Grundy et al.
2004) nevertheless, in all of these trials, residual CVD risk
remains high (60–75%), and potential drug-related toxicity,
while infrequent, is a significant concern. Response to
statins varies among individuals, and mechanisms of
interindividual variation in response remain poorly under-
stood with no validated biomarkers that can adequately
predict outcome. Several studies, including the cholesterol
and atherosclerosis pharmacogenetics (CAP) have dem-
onstrated a wide range of lipid and lipoprotein responses to
statin therapy (Simon et al. 2006) with decrease in LDL-C
for a given statin ranging from less than 5% to greater than
60%, even when compliance is taken into account. Similar
variation has been observed for other statin effects that
can contribute to CVD outcomes, including reductions in
triglyceride and very low-density lipoproteins (VLDL),
increases in high-density lipoproteins (HDL), and reduc-
tions in the inflammatory marker C-reactive protein (CRP)
(Sathyapalan et al. 2008; Bonnet et al. 2008; Ridker et al.
2008).
Since the correlation between statin-induced reductions
in LDL-C and CRP is weak (r = 0.13) (Baigent et al.
2005), the variation in CRP response cannot be explained
by LDL-C alone. Patients receiving statins have lower
event rates than predicted by their achieved LDL-C, raising
the possibility of distinct mechanisms beyond cholesterol
reduction (cholesterol-independent effects). Some choles-
terol-independent or ‘‘pleiotropic’’ beneficial effects of
statins include: improvement of endothelial function,
reduction of platelet activity, stabilization of atheroscle-
rotic plaques, antioxidant, anti-inflammatory and immu-
nomodulatory effects (Jasinska et al. 2007). Many of these
pleiotropic effects might be mediated via inhibition of the
L-mevalonic acid pathway, blocking the synthesis of
isoprenoid intermediates.
Lipidomics, or global mapping of metabolites, offers a
means of identifying markers that may be indicative of
pathways that modulate response to statin treatment. In this
study, we performed such analyses in pre- and post-treat-
ment plasma samples from 48 individuals selected from the
upper and lower tails of the distribution of LDL response to
simvastatin treatment in the CAP trial. Out of 300 lipids
measured within seven lipid classes, we identified lipids
whose baseline concentrations predicted statin-induced
changes in LDL-C and CRP, and also examined correla-
tions of these changes with changes in the lipidomic
measurements. In this manner, we were able to identify
distinct lipid signatures for statin effects in subjects who do
and do not respond significantly to treatment as defined by
changes in on these two CVD risk markers.
2 Materials and methods
Samples were selected from the Cholesterol and Pharma-
cogenetics (CAP) Study, study, which was designed to
examine genetic and non-genetic factors affecting the
response to simvastatin therapy among African-Americans
and whites. With response to therapy defined as the per-
centage change in LDL cholesterol after treatment, a group
of 12 ‘‘good’’ responders were selected at random from the
top 10% of responders in the CAP study and matched for
body mass index, race, and gender to 12 subjects in the
lowest 10% of responders, considered ‘‘poor’’ responders.
The sample size was calculated for each metabolite, based
on variability found in previous metabolomics studies, at a
fixed significance (a = 0.05) and power (b = 0.8). Twelve
subjects per group were selected to provide 10–50 signif-
icant metabolite differences between the groups. The initial
analysis was conducted to generate hypotheses of possible
differences between good and poor responders. A second
set of good and poor responders was selected and analyzed
separately, for a total of 24 good and 24 poor responders.
Data from each set are presented as supplemental material.
The subjects in the two groups were selected at random so
the data could be analyzed as a combined set. Since the
main findings did not differ significantly between the two
subgroups, the data sets were combined to increase the
sample size and power, analyzed, and the results presented
in this paper.
The study population has been reported previously
(Simon et al. 2006). Subjects were 944 participants, aged
60 years, with a baseline total serum cholesterol level of
160–400 mg/dl. Participants were followed for a total of
6 weeks on simvastatin therapy (40 mg at bedtime) and
were seen at clinic visits conducted at 2-week intervals.
Blood specimens from each subject were obtained after
overnight fast at baseline and 6 weeks of therapy.
An assessment of plasma lipid profiles was performed,
as described previously (Watkins et al. 2002). Quantitative
measurements of fatty acids in lipid classes were deter-
mined as nmol fatty acid/gram of plasma. SFA, MUFA,
PUFA, n3, n6, n7, and n9 fatty acid groups were calculated.
Metabolites were identified by the lipid class and the fatty
acid moiety, e.g. arachidonic acid in phosphatidylcholine:
PC20:4n6. Abbreviations for lipid classes are as follows:
cholesterol esters (CE), diacylglycerols (DG), free fatty
acids (FA), lysophosphatidylcholine (LYPC), phosphati-
dylcholine (PC), phosphatidylethanolamine (PE) and tria-
cylglycerols (TG), free cholesterol (FC), cholesterol (CH),
polyunsaturated fatty acid (PUFA), monounsaturated fatty
192 R. Kaddurah-Daouk et al.
123
acid (MUFA), saturated fatty acid (SFA), plasmalogen
(dm), total lipid class (LC), very low density lipoprotein
(VLDL), low density lipoprotein (LDL), C-reactive protein
(CRP).
In addition, fatty acids are identified first by the number
of carbons in the molecule (e.g. 20), the number of double
bonds in the molecule (e.g. 4), and lastly the position of the
double bonds (e.g. n6). Thus PC20:4n6 would be a phos-
phatidylcholine molecule containing a 20 carbon fatty acid
with 4 double bonds, at the n6 position.
Heat maps were created to visualize differences in
metabolites pre- and post-treatment and to evaluate corre-
lation among metabolites and drug responses. Data from the
paired t-tests were used for pre- and post-treatment heat
maps. For treatment effects significant at an a = 0.05, mean
percentage difference in the concentration of the metabolite
induced by treatment was calculated. The pre- and post-
treatment heat maps can be read as follows: the column
headers display the fatty acid and the row headers the family
of fatty acids present in each lipid class. Metabolites sig-
nificantly increased by treatment are displayed in red; those
decreased are displayed in green. Correlation heat maps
were created using the correlation analysis described below.
Treatment effects significant at a P \ 0.05 were included in
the heat map with blue as a positive correlation and yellow
as negative. The brightness of each color corresponds to the
magnitude of the difference in quartiles with the brighter the
square, the larger the difference. Spearman’s correlation
coefficients were used to assess relationships between pre-
treatment metabolites and baseline LDL or CRP concen-
tration. q-values were calculated for all correlation analyses
(Storey and Tibshirani 2003).
To test associations of metabolites with LDL-C, we
utilized Wilcoxon rank test to evaluate the differences
between good and poor responders pre-treatment, post-
treatment, and post-treatment minus pre-treatment, and
Spearman’s correlation coefficients to assess relationships
between metabolites and LDL-C or CRP. Metabolite
changes were defined as post-treatment minus pre-treatment
level. Lipid changes were correlated with LDL-C or CRP
response to treatment by calculating their Spearman’s cor-
relation coefficients with the post-treatment level of LDL or
CRP, adjusting for pre-treatment level. For predicting LDL
or CRP response to statin treatment, Spearman’s correlation
coefficients were calculated using pre-treatment metabo-
lites with post-treatment level of LDL or CRP, adjusting for
pre-treatment level.
Activities of enzymes involved in fatty acid synthesis
were estimated using product to precursor ratios: 18:3(n-6)/
18:2(n-)6 or 24:5(n-6)/24:4(n-6) for delta 6 desaturase;
20:3(n-6)/18:3(n-6), 22:4(n-6)/20:4(n-6)or 24:4n6/22:4
(n-6) for elongase; and 20:4(n-6)/20:3(n-6) for delta 5
desaturase. The graphic is displayed with activities or
metabolites significantly increased by treatment in red and
those decreased in green.
3 Results
With response to therapy defined as the percentage change
in LDL cholesterol after treatment, 24 ‘‘good’’ responders
were selected from the top 10% of responders in the CAP
study and matched for body mass index, race, and gender
to 24 subjects in the lowest 10% of responders, considered
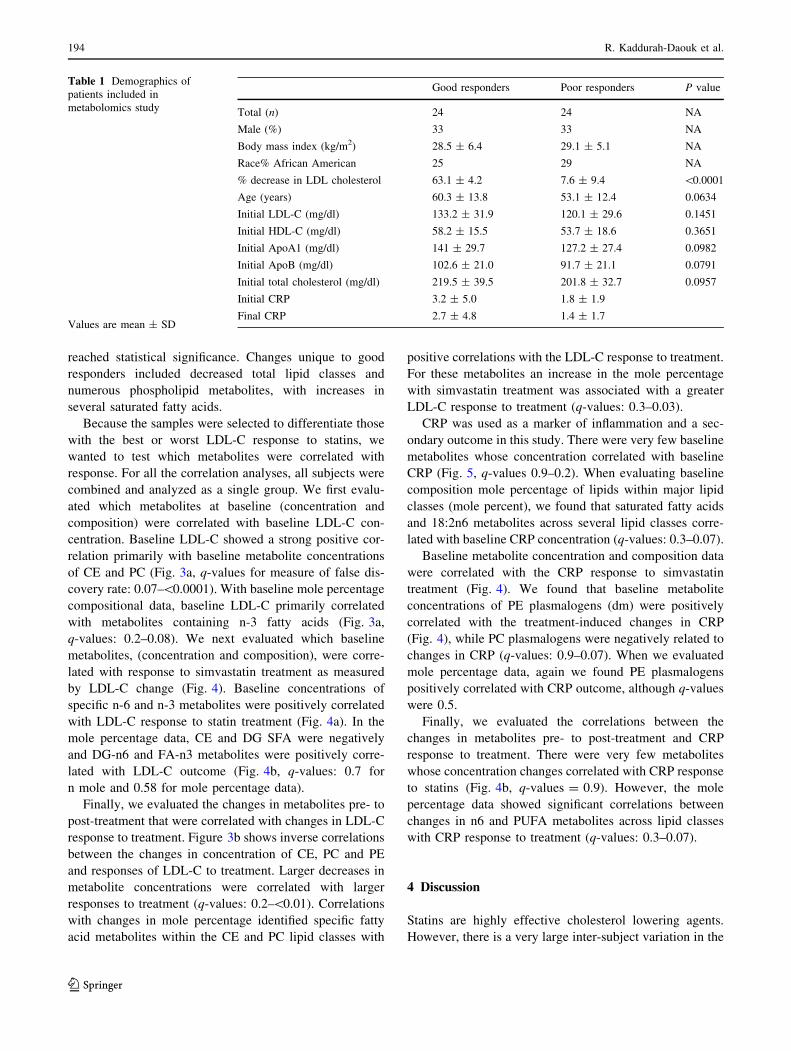
‘‘poor’’ responders. Demographics for the two groups are
shown in Table 1. Because this is a select subgroup of
subjects, demographics vary slightly from the full study
population. Good responders were slightly older than poor
responders, with marginally higher initial cholesterol, HDL
cholesterol, ApoA1, ApoB, and CRP levels. The 48 sub-
jects in this analysis were older and included a lower
percentage of males and African Americans than the
remainder of the subjects from the top and bottom 10% of
subjects in the full study (Age: 52.93 ± 12.61, 55% male,
46% African American). CRP levels were not reported in
the original paper.
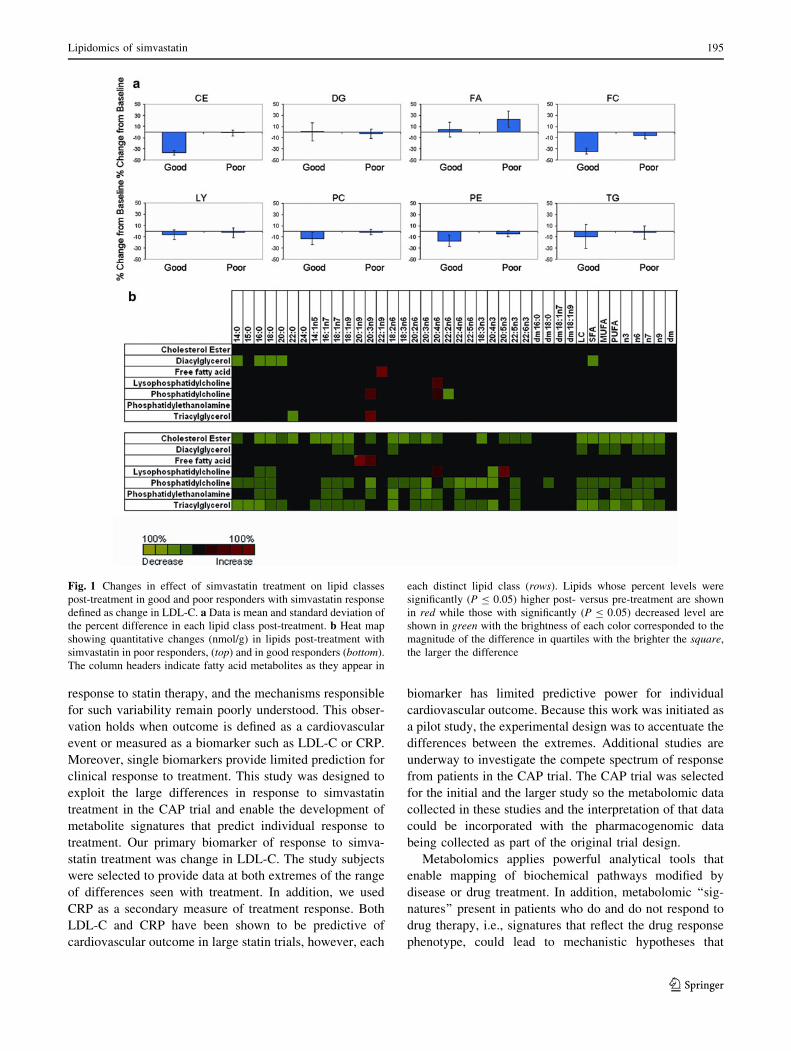
The effects of simvastatin treatment on concentrations of
seven lipid classes in the good and poor responder groups are
shown in Fig. 1. The good responders showed decreases in
concentrations of CE, FC, PC, and PE while both good and
poor responders decreased the amount of TG. In good
responders, most of the fatty acid metabolites decreased with
statin treatment, however there were specific fatty acids
within the FA and LY classes that increased in concentration.
In poor responders, fewer changes were seen, and five spe-
cific metabolites increased in concentration.
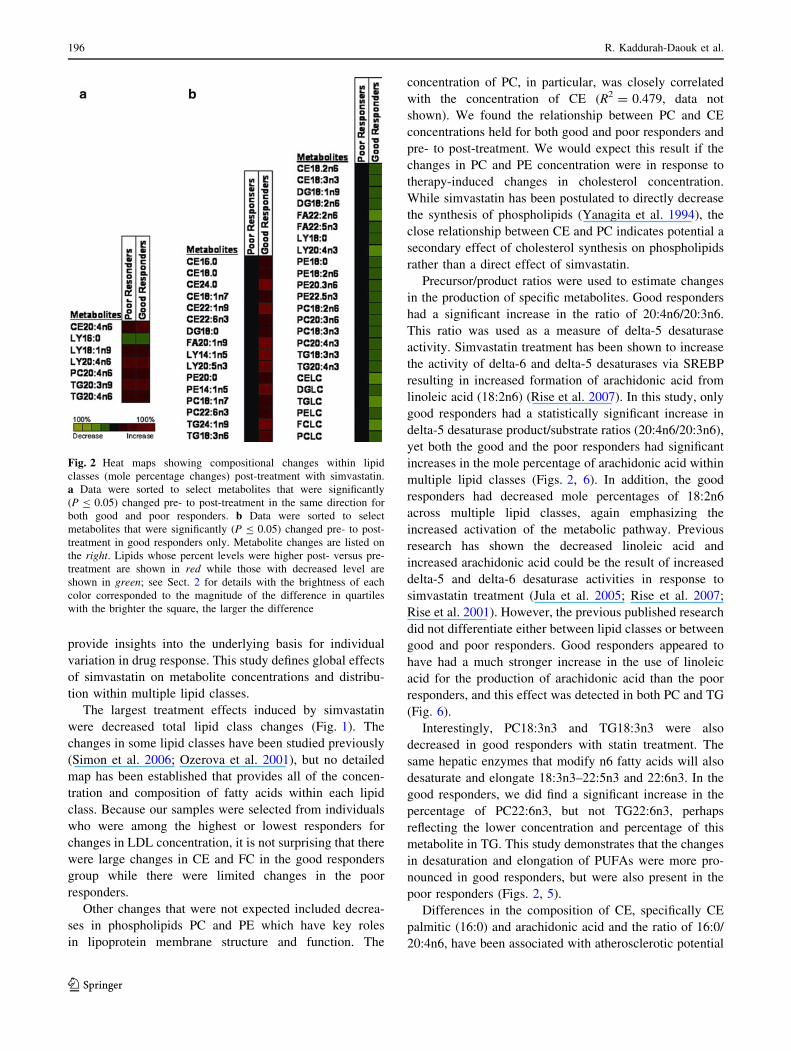
In addition to metabolite concentration changes, the
mole percentages of all fatty acids within each lipid class
were used to define compositional changes within lipid
classes. This approach assigns a total class as 100% and
each fatty acid within the class is calculated as % of the
total lipid class, allowing evaluation of whether individual
fatty acids changed disproportionately within a class.
Approximately 40 metabolites were altered by drug treat-
ment in the good responders but not in the poor responders
(Supplemental data). Of metabolites that were increased
selectively in the good responders, 13 of 16 contained
saturated or monounsaturated fatty acids. Among metabo-
lites that were selectively decreased in good responders, six
were total lipid classes and 15 of 18 were PUFAs. There
were seven metabolites with mole percentages changed
similarly by treatment for both groups (Fig. 2). Four
metabolites contained arachidonic acid (20:4n6) and were
increased in both groups. The mole percentage of arachi-
donic acid increased post-treatment in all lipid classes for
both good and poor responders, although not all changes
Lipidomics of simvastatin 193
123
reached statistical significance. Changes unique to good
responders included decreased total lipid classes and
numerous phospholipid metabolites, with increases in
several saturated fatty acids.
Because the samples were selected to differentiate those
with the best or worst LDL-C response to statins, we
wanted to test which metabolites were correlated with
response. For all the correlation analyses, all subjects were
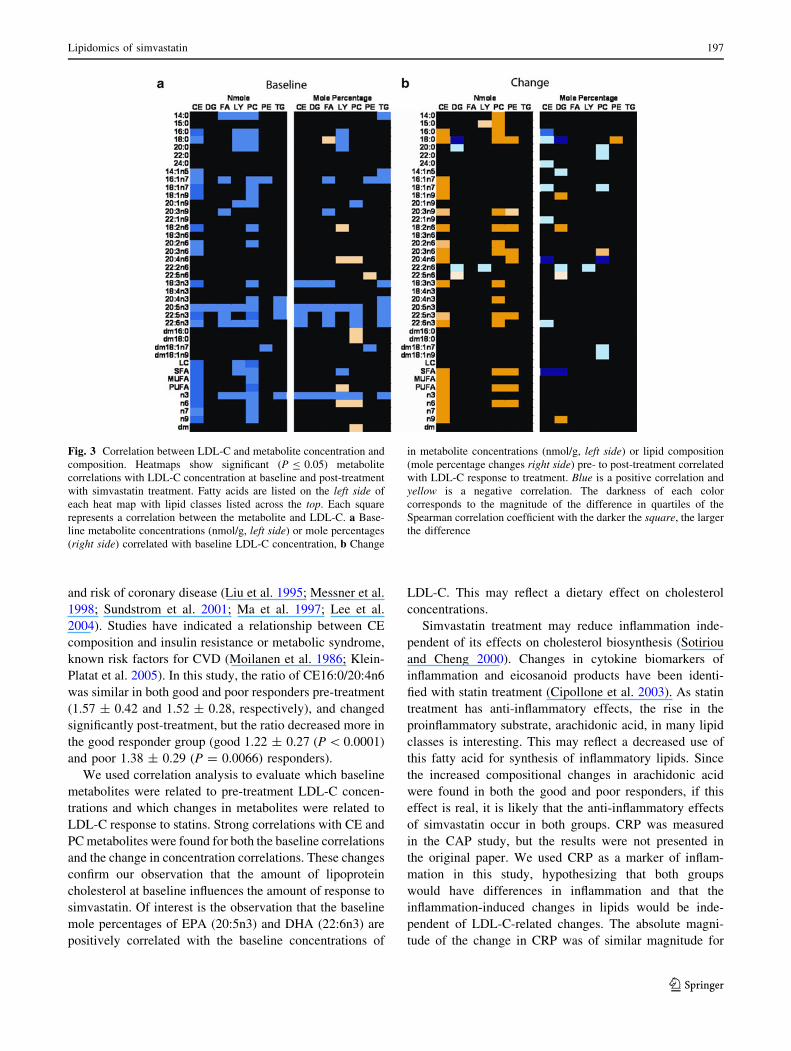
combined and analyzed as a single group. We first evalu-
ated which metabolites at baseline (concentration and
composition) were correlated with baseline LDL-C con-
centration. Baseline LDL-C showed a strong positive cor-
relation primarily with baseline metabolite concentrations
of CE and PC (Fig. 3a, q-values for measure of false dis-
covery rate: 0.07–\0.0001). With baseline mole percentage
compositional data, baseline LDL-C primarily correlated
with metabolites containing n-3 fatty acids (Fig. 3a,
q-values: 0.2–0.08). We next evaluated which baseline
metabolites, (concentration and composition), were corre-
lated with response to simvastatin treatment as measured
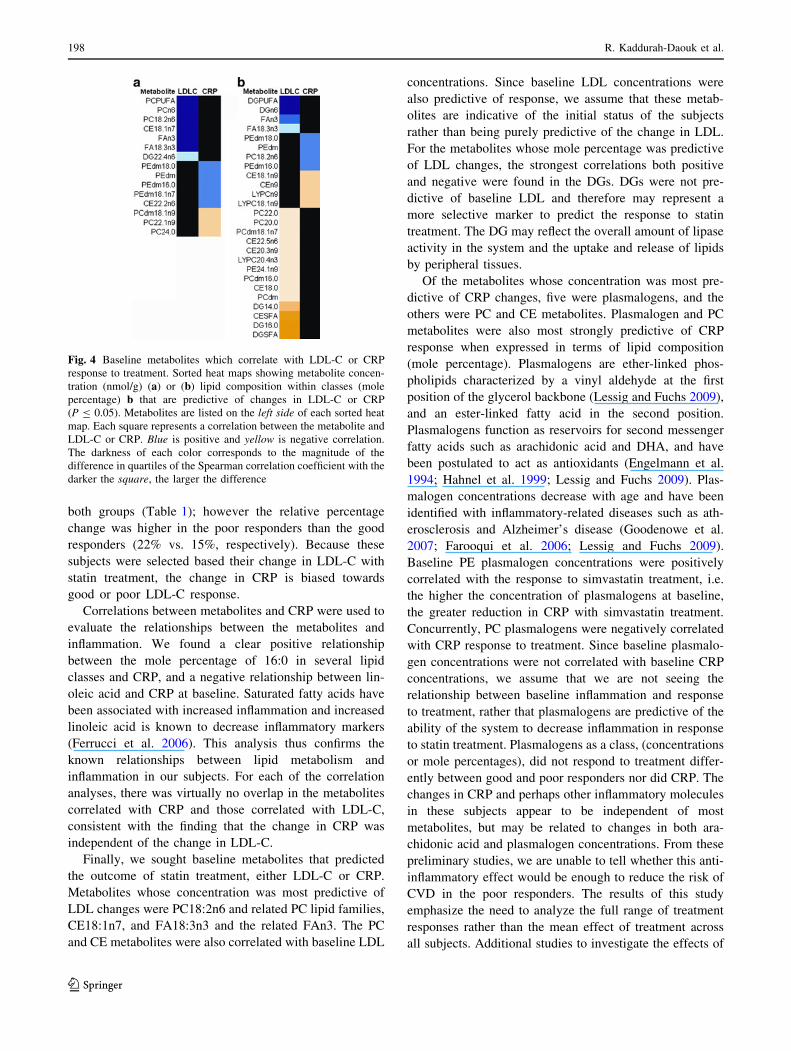
by LDL-C change (Fig. 4). Baseline concentrations of
specific n-6 and n-3 metabolites were positively correlated
with LDL-C response to statin treatment (Fig. 4a). In the
mole percentage data, CE and DG SFA were negatively
and DG-n6 and FA-n3 metabolites were positively corre-
lated with LDL-C outcome (Fig. 4b, q-values: 0.7 for
n mole and 0.58 for mole percentage data).
Finally, we evaluated the changes in metabolites pre- to
post-treatment that were correlated with changes in LDL-C
response to treatment. Figure 3b shows inverse correlations
between the changes in concentration of CE, PC and PE
and responses of LDL-C to treatment. Larger decreases in
metabolite concentrations were correlated with larger
responses to treatment (q-values: 0.2–\0.01). Correlations
with changes in mole percentage identified specific fatty
acid metabolites within the CE and PC lipid classes with
positive correlations with the LDL-C response to treatment.
For these metabolites an increase in the mole percentage
with simvastatin treatment was associated with a greater
LDL-C response to treatment (q-values: 0.3–0.03).
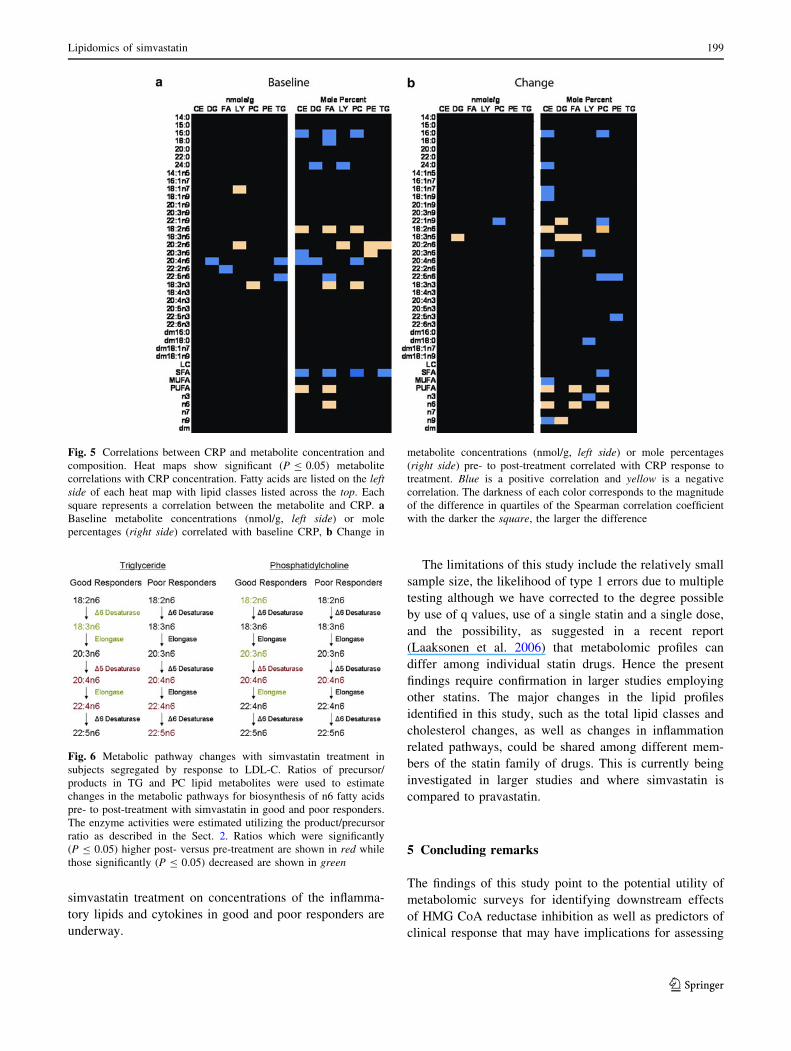
CRP was used as a marker of inflammation and a sec-
ondary outcome in this study. There were very few baseline
metabolites whose concentration correlated with baseline
CRP (Fig. 5, q-values 0.9–0.2). When evaluating baseline
composition mole percentage of lipids within major lipid
classes (mole percent), we found that saturated fatty acids
and 18:2n6 metabolites across several lipid classes corre-
lated with baseline CRP concentration (q-values: 0.3–0.07).
Baseline metabolite concentration and composition data
were correlated with the CRP response to simvastatin
treatment (Fig. 4). We found that baseline metabolite
concentrations of PE plasmalogens (dm) were positively
correlated with the treatment-induced changes in CRP
(Fig. 4), while PC plasmalogens were negatively related to
changes in CRP (q-values: 0.9–0.07). When we evaluated
mole percentage data, again we found PE plasmalogens
positively correlated with CRP outcome, although q-values
were 0.5.
Finally, we evaluated the correlations between the
changes in metabolites pre- to post-treatment and CRP
response to treatment. There were very few metabolites
whose concentration changes correlated with CRP response
to statins (Fig. 4b, q-values = 0.9). However, the mole
percentage data showed significant correlations between
changes in n6 and PUFA metabolites across lipid classes
with CRP response to treatment (q-values: 0.3–0.07).
4 Discussion
Statins are highly effective cholesterol lowering agents.
However, there is a very large inter-subject variation in the
Table 1 Demographics of
patients included in
metabolomics study
Values are mean ± SD
Good responders Poor responders P value
Total (n) 24 24 NA
Male (%) 33 33 NA
Body mass index (kg/m2) 28.5 ± 6.4 29.1 ± 5.1 NA
Race% African American 25 29 NA
% decrease in LDL cholesterol 63.1 ± 4.2 7.6 ± 9.4 \0.0001
Age (years) 60.3 ± 13.8 53.1 ± 12.4 0.0634
Initial LDL-C (mg/dl) 133.2 ± 31.9 120.1 ± 29.6 0.1451
Initial HDL-C (mg/dl) 58.2 ± 15.5 53.7 ± 18.6 0.3651
Initial ApoA1 (mg/dl) 141 ± 29.7 127.2 ± 27.4 0.0982
Initial ApoB (mg/dl) 102.6 ± 21.0 91.7 ± 21.1 0.0791
Initial total cholesterol (mg/dl) 219.5 ± 39.5 201.8 ± 32.7 0.0957
Initial CRP 3.2 ± 5.0 1.8 ± 1.9
Final CRP 2.7 ± 4.8 1.4 ± 1.7
194 R. Kaddurah-Daouk et al.
123
response to statin therapy, and the mechanisms responsible
for such variability remain poorly understood. This obser-
vation holds when outcome is defined as a cardiovascular
event or measured as a biomarker such as LDL-C or CRP.
Moreover, single biomarkers provide limited prediction for
clinical response to treatment. This study was designed to
exploit the large differences in response to simvastatin
treatment in the CAP trial and enable the development of
metabolite signatures that predict individual response to
treatment. Our primary biomarker of response to simva-
statin treatment was change in LDL-C. The study subjects
were selected to provide data at both extremes of the range
of differences seen with treatment. In addition, we used
CRP as a secondary measure of treatment response. Both
LDL-C and CRP have been shown to be predictive of
cardiovascular outcome in large statin trials, however, each
biomarker has limited predictive power for individual
cardiovascular outcome. Because this work was initiated as
a pilot study, the experimental design was to accentuate the
differences between the extremes. Additional studies are
underway to investigate the compete spectrum of response
from patients in the CAP trial. The CAP trial was selected
for the initial and the larger study so the metabolomic data
collected in these studies and the interpretation of that data
could be incorporated with the pharmacogenomic data
being collected as part of the original trial design.
Metabolomics applies powerful analytical tools that
enable mapping of biochemical pathways modified by
disease or drug treatment. In addition, metabolomic ‘‘sig-
natures’’ present in patients who do and do not respond to
drug therapy, i.e., signatures that reflect the drug response
phenotype, could lead to mechanistic hypotheses that
Fig. 1 Changes in effect of simvastatin treatment on lipid classes
post-treatment in good and poor responders with simvastatin response
defined as change in LDL-C. a Data is mean and standard deviation of
the percent difference in each lipid class post-treatment. b Heat map
showing quantitative changes (nmol/g) in lipids post-treatment with
simvastatin in poor responders, (top) and in good responders (bottom).
The column headers indicate fatty acid metabolites as they appear in
each distinct lipid class (rows). Lipids whose percent levels were
significantly (P B 0.05) higher post- versus pre-treatment are shown
in red while those with significantly (P B 0.05) decreased level are
shown in green with the brightness of each color corresponded to the
magnitude of the difference in quartiles with the brighter the square,
the larger the difference
Lipidomics of simvastatin 195
123
provide insights into the underlying basis for individual
variation in drug response. This study defines global effects
of simvastatin on metabolite concentrations and distribu-
tion within multiple lipid classes.
The largest treatment effects induced by simvastatin
were decreased total lipid class changes (Fig. 1). The
changes in some lipid classes have been studied previously
(Simon et al. 2006; Ozerova et al. 2001), but no detailed
map has been established that provides all of the concen-
tration and composition of fatty acids within each lipid
class. Because our samples were selected from individuals
who were among the highest or lowest responders for
changes in LDL concentration, it is not surprising that there
were large changes in CE and FC in the good responders
group while there were limited changes in the poor
responders.
Other changes that were not expected included decrea-
ses in phospholipids PC and PE which have key roles
in lipoprotein membrane structure and function. The
concentration of PC, in particular, was closely correlated
with the concentration of CE (R2 = 0.479, data not
shown). We found the relationship between PC and CE
concentrations held for both good and poor responders and
pre- to post-treatment. We would expect this result if the
changes in PC and PE concentration were in response to
therapy-induced changes in cholesterol concentration.
While simvastatin has been postulated to directly decrease
the synthesis of phospholipids (Yanagita et al. 1994), the
close relationship between CE and PC indicates potential a
secondary effect of cholesterol synthesis on phospholipids
rather than a direct effect of simvastatin.
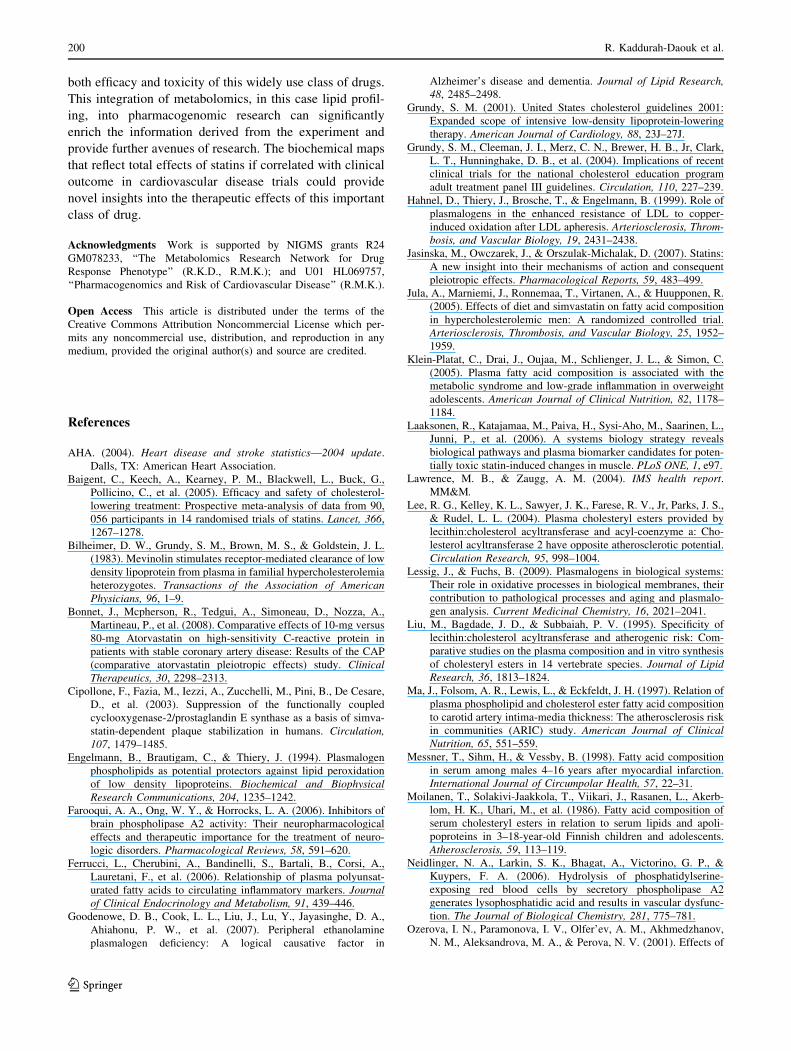
Precursor/product ratios were used to estimate changes
in the production of specific metabolites. Good responders
had a significant increase in the ratio of 20:4n6/20:3n6.
This ratio was used as a measure of delta-5 desaturase
activity. Simvastatin treatment has been shown to increase
the activity of delta-6 and delta-5 desaturases via SREBP
resulting in increased formation of arachidonic acid from
linoleic acid (18:2n6) (Rise et al. 2007). In this study, only
good responders had a statistically significant increase in
delta-5 desaturase product/substrate ratios (20:4n6/20:3n6),
yet both the good and the poor responders had significant
increases in the mole percentage of arachidonic acid within
multiple lipid classes (Figs. 2, 6). In addition, the good
responders had decreased mole percentages of 18:2n6
across multiple lipid classes, again emphasizing the
increased activation of the metabolic pathway. Previous
research has shown the decreased linoleic acid and
increased arachidonic acid could be the result of increased
delta-5 and delta-6 desaturase activities in response to
simvastatin treatment (Jula et al. 2005; Rise et al. 2007;
Rise et al. 2001). However, the previous published research
did not differentiate either between lipid classes or between
good and poor responders. Good responders appeared to
have had a much stronger increase in the use of linoleic
acid for the production of arachidonic acid than the poor
responders, and this effect was detected in both PC and TG
(Fig. 6).
Interestingly, PC18:3n3 and TG18:3n3 were also
decreased in good responders with statin treatment. The
same hepatic enzymes that modify n6 fatty acids will also
desaturate and elongate 18:3n3–22:5n3 and 22:6n3. In the
good responders, we did find a significant increase in the
percentage of PC22:6n3, but not TG22:6n3, perhaps
reflecting the lower concentration and percentage of this
metabolite in TG. This study demonstrates that the changes
in desaturation and elongation of PUFAs were more pro-
nounced in good responders, but were also present in the
poor responders (Figs. 2, 5).
Differences in the composition of CE, specifically CE
palmitic (16:0) and arachidonic acid and the ratio of 16:0/
20:4n6, have been associated with atherosclerotic potential
Fig. 2 Heat maps showing compositional changes within lipid
classes (mole percentage changes) post-treatment with simvastatin.
a Data were sorted to select metabolites that were significantly
(P B 0.05) changed pre- to post-treatment in the same direction for
both good and poor responders. b Data were sorted to select
metabolites that were significantly (P B 0.05) changed pre- to post-
treatment in good responders only. Metabolite changes are listed on
the right. Lipids whose percent levels were higher post- versus pre-
treatment are shown in red while those with decreased level are
shown in green; see Sect. 2 for details with the brightness of each
color corresponded to the magnitude of the difference in quartiles
with the brighter the square, the larger the difference
196 R. Kaddurah-Daouk et al.
123
and risk of coronary disease (Liu et al. 1995; Messner et al.
1998; Sundstrom et al. 2001; Ma et al. 1997; Lee et al.
2004). Studies have indicated a relationship between CE
composition and insulin resistance or metabolic syndrome,
known risk factors for CVD (Moilanen et al. 1986; Klein-
Platat et al. 2005). In this study, the ratio of CE16:0/20:4n6
was similar in both good and poor responders pre-treatment
(1.57 ± 0.42 and 1.52 ± 0.28, respectively), and changed
significantly post-treatment, but the ratio decreased more in
the good responder group (good 1.22 ± 0.27 (P \ 0.0001)
and poor 1.38 ± 0.29 (P = 0.0066) responders).
We used correlation analysis to evaluate which baseline
metabolites were related to pre-treatment LDL-C concen-
trations and which changes in metabolites were related to
LDL-C response to statins. Strong correlations with CE and
PC metabolites were found for both the baseline correlations
and the change in concentration correlations. These changes
confirm our observation that the amount of lipoprotein
cholesterol at baseline influences the amount of response to
simvastatin. Of interest is the observation that the baseline
mole percentages of EPA (20:5n3) and DHA (22:6n3) are
positively correlated with the baseline concentrations of
LDL-C. This may reflect a dietary effect on cholesterol
concentrations.
Simvastatin treatment may reduce inflammation inde-
pendent of its effects on cholesterol biosynthesis (Sotiriou
and Cheng 2000). Changes in cytokine biomarkers of
inflammation and eicosanoid products have been identi-
fied with statin treatment (Cipollone et al. 2003). As statin
treatment has anti-inflammatory effects, the rise in the
proinflammatory substrate, arachidonic acid, in many lipid
classes is interesting. This may reflect a decreased use of
this fatty acid for synthesis of inflammatory lipids. Since
the increased compositional changes in arachidonic acid
were found in both the good and poor responders, if this
effect is real, it is likely that the anti-inflammatory effects
of simvastatin occur in both groups. CRP was measured
in the CAP study, but the results were not presented in
the original paper. We used CRP as a marker of inflam-
mation in this study, hypothesizing that both groups
would have differences in inflammation and that the
inflammation-induced changes in lipids would be inde-
pendent of LDL-C-related changes. The absolute magni-
tude of the change in CRP was of similar magnitude for
Fig. 3 Correlation between LDL-C and metabolite concentration and
composition. Heatmaps show significant (P B 0.05) metabolite
correlations with LDL-C concentration at baseline and post-treatment
with simvastatin treatment. Fatty acids are listed on the left side of
each heat map with lipid classes listed across the top. Each square
represents a correlation between the metabolite and LDL-C. a Base-
line metabolite concentrations (nmol/g, left side) or mole percentages
(right side) correlated with baseline LDL-C concentration, b Change
in metabolite concentrations (nmol/g, left side) or lipid composition
(mole percentage changes right side) pre- to post-treatment correlated
with LDL-C response to treatment. Blue is a positive correlation and
yellow is a negative correlation. The darkness of each color
corresponds to the magnitude of the difference in quartiles of the
Spearman correlation coefficient with the darker the square, the larger
the difference
Lipidomics of simvastatin 197
123
both groups (Table 1); however the relative percentage
change was higher in the poor responders than the good
responders (22% vs. 15%, respectively). Because these
subjects were selected based their change in LDL-C with
statin treatment, the change in CRP is biased towards
good or poor LDL-C response.
Correlations between metabolites and CRP were used to
evaluate the relationships between the metabolites and
inflammation. We found a clear positive relationship
between the mole percentage of 16:0 in several lipid
classes and CRP, and a negative relationship between lin-
oleic acid and CRP at baseline. Saturated fatty acids have
been associated with increased inflammation and increased
linoleic acid is known to decrease inflammatory markers
(Ferrucci et al. 2006). This analysis thus confirms the
known relationships between lipid metabolism and
inflammation in our subjects. For each of the correlation
analyses, there was virtually no overlap in the metabolites
correlated with CRP and those correlated with LDL-C,
consistent with the finding that the change in CRP was
independent of the change in LDL-C.
Finally, we sought baseline metabolites that predicted
the outcome of statin treatment, either LDL-C or CRP.
Metabolites whose concentration was most predictive of
LDL changes were PC18:2n6 and related PC lipid families,
CE18:1n7, and FA18:3n3 and the related FAn3. The PC
and CE metabolites were also correlated with baseline LDL
concentrations. Since baseline LDL concentrations were
also predictive of response, we assume that these metab-
olites are indicative of the initial status of the subjects
rather than being purely predictive of the change in LDL.
For the metabolites whose mole percentage was predictive
of LDL changes, the strongest correlations both positive
and negative were found in the DGs. DGs were not pre-
dictive of baseline LDL and therefore may represent a
more selective marker to predict the response to statin
treatment. The DG may reflect the overall amount of lipase
activity in the system and the uptake and release of lipids
by peripheral tissues.
Of the metabolites whose concentration was most pre-
dictive of CRP changes, five were plasmalogens, and the
others were PC and CE metabolites. Plasmalogen and PC
metabolites were also most strongly predictive of CRP
response when expressed in terms of lipid composition
(mole percentage). Plasmalogens are ether-linked phos-
pholipids characterized by a vinyl aldehyde at the first
position of the glycerol backbone (Lessig and Fuchs 2009),
and an ester-linked fatty acid in the second position.
Plasmalogens function as reservoirs for second messenger
fatty acids such as arachidonic acid and DHA, and have
been postulated to act as antioxidants (Engelmann et al.
1994; Hahnel et al. 1999; Lessig and Fuchs 2009). Plas-
malogen concentrations decrease with age and have been
identified with inflammatory-related diseases such as ath-
erosclerosis and Alzheimer’s disease (Goodenowe et al.
2007; Farooqui et al. 2006; Lessig and Fuchs 2009).
Baseline PE plasmalogen concentrations were positively
correlated with the response to simvastatin treatment, i.e.
the higher the concentration of plasmalogens at baseline,
the greater reduction in CRP with simvastatin treatment.
Concurrently, PC plasmalogens were negatively correlated
with CRP response to treatment. Since baseline plasmalo-
gen concentrations were not correlated with baseline CRP
concentrations, we assume that we are not seeing the
relationship between baseline inflammation and response
to treatment, rather that plasmalogens are predictive of the
ability of the system to decrease inflammation in response
to statin treatment. Plasmalogens as a class, (concentrations
or mole percentages), did not respond to treatment differ-
ently between good and poor responders nor did CRP. The
changes in CRP and perhaps other inflammatory molecules
in these subjects appear to be independent of most
metabolites, but may be related to changes in both ara-
chidonic acid and plasmalogen concentrations. From these
preliminary studies, we are unable to tell whether this anti-
inflammatory effect would be enough to reduce the risk of
CVD in the poor responders. The results of this study
emphasize the need to analyze the full range of treatment
responses rather than the mean effect of treatment across
all subjects. Additional studies to investigate the effects of
Fig. 4 Baseline metabolites which correlate with LDL-C or CRP
response to treatment. Sorted heat maps showing metabolite concen-
tration (nmol/g) (a) or (b) lipid composition within classes (mole
percentage) b that are predictive of changes in LDL-C or CRP
(P B 0.05). Metabolites are listed on the left side of each sorted heat
map. Each square represents a correlation between the metabolite and
LDL-C or CRP. Blue is positive and yellow is negative correlation.
The darkness of each color corresponds to the magnitude of the
difference in quartiles of the Spearman correlation coefficient with the
darker the square, the larger the difference
198 R. Kaddurah-Daouk et al.
123
simvastatin treatment on concentrations of the inflamma-
tory lipids and cytokines in good and poor responders are
underway.
The limitations of this study include the relatively small
sample size, the likelihood of type 1 errors due to multiple
testing although we have corrected to the degree possible
by use of q values, use of a single statin and a single dose,
and the possibility, as suggested in a recent report
(Laaksonen et al. 2006) that metabolomic profiles can
differ among individual statin drugs. Hence the present
findings require confirmation in larger studies employing
other statins. The major changes in the lipid profiles
identified in this study, such as the total lipid classes and
cholesterol changes, as well as changes in inflammation
related pathways, could be shared among different mem-
bers of the statin family of drugs. This is currently being
investigated in larger studies and where simvastatin is
compared to pravastatin.
5 Concluding remarks
The findings of this study point to the potential utility of
metabolomic surveys for identifying downstream effects
of HMG CoA reductase inhibition as well as predictors of
clinical response that may have implications for assessing
Fig. 5 Correlations between CRP and metabolite concentration and
composition. Heat maps show significant (P B 0.05) metabolite
correlations with CRP concentration. Fatty acids are listed on the leftside of each heat map with lipid classes listed across the top. Each
square represents a correlation between the metabolite and CRP. aBaseline metabolite concentrations (nmol/g, left side) or mole
percentages (right side) correlated with baseline CRP, b Change in
metabolite concentrations (nmol/g, left side) or mole percentages
(right side) pre- to post-treatment correlated with CRP response to
treatment. Blue is a positive correlation and yellow is a negative
correlation. The darkness of each color corresponds to the magnitude
of the difference in quartiles of the Spearman correlation coefficient
with the darker the square, the larger the difference
Fig. 6 Metabolic pathway changes with simvastatin treatment in
subjects segregated by response to LDL-C. Ratios of precursor/
products in TG and PC lipid metabolites were used to estimate
changes in the metabolic pathways for biosynthesis of n6 fatty acids
pre- to post-treatment with simvastatin in good and poor responders.
The enzyme activities were estimated utilizing the product/precursor
ratio as described in the Sect. 2. Ratios which were significantly
(P B 0.05) higher post- versus pre-treatment are shown in red while
those significantly (P B 0.05) decreased are shown in green
Lipidomics of simvastatin 199
123
both efficacy and toxicity of this widely use class of drugs.
This integration of metabolomics, in this case lipid profil-
ing, into pharmacogenomic research can significantly
enrich the information derived from the experiment and
provide further avenues of research. The biochemical maps
that reflect total effects of statins if correlated with clinical
outcome in cardiovascular disease trials could provide
novel insights into the therapeutic effects of this important
class of drug.
Acknowledgments Work is supported by NIGMS grants R24
GM078233, ‘‘The Metabolomics Research Network for Drug
Response Phenotype’’ (R.K.D., R.M.K.); and U01 HL069757,
‘‘Pharmacogenomics and Risk of Cardiovascular Disease’’ (R.M.K.).
Open Access This article is distributed under the terms of the
Creative Commons Attribution Noncommercial License which per-
mits any noncommercial use, distribution, and reproduction in any
medium, provided the original author(s) and source are credited.
References
AHA. (2004). Heart disease and stroke statistics––2004 update.
Dalls, TX: American Heart Association.
Baigent, C., Keech, A., Kearney, P. M., Blackwell, L., Buck, G.,
Pollicino, C., et al. (2005). Efficacy and safety of cholesterol-
lowering treatment: Prospective meta-analysis of data from 90,
056 participants in 14 randomised trials of statins. Lancet, 366,
1267–1278.
Bilheimer, D. W., Grundy, S. M., Brown, M. S., & Goldstein, J. L.
(1983). Mevinolin stimulates receptor-mediated clearance of low
density lipoprotein from plasma in familial hypercholesterolemia
heterozygotes. Transactions of the Association of AmericanPhysicians, 96, 1–9.
Bonnet, J., Mcpherson, R., Tedgui, A., Simoneau, D., Nozza, A.,
Martineau, P., et al. (2008). Comparative effects of 10-mg versus
80-mg Atorvastatin on high-sensitivity C-reactive protein in
patients with stable coronary artery disease: Results of the CAP
(comparative atorvastatin pleiotropic effects) study. ClinicalTherapeutics, 30, 2298–2313.
Cipollone, F., Fazia, M., Iezzi, A., Zucchelli, M., Pini, B., De Cesare,
D., et al. (2003). Suppression of the functionally coupled
cyclooxygenase-2/prostaglandin E synthase as a basis of simva-
statin-dependent plaque stabilization in humans. Circulation,107, 1479–1485.
Engelmann, B., Brautigam, C., & Thiery, J. (1994). Plasmalogen
phospholipids as potential protectors against lipid peroxidation
of low density lipoproteins. Biochemical and BiophysicalResearch Communications, 204, 1235–1242.
Farooqui, A. A., Ong, W. Y., & Horrocks, L. A. (2006). Inhibitors of
brain phospholipase A2 activity: Their neuropharmacological
effects and therapeutic importance for the treatment of neuro-
logic disorders. Pharmacological Reviews, 58, 591–620.
Ferrucci, L., Cherubini, A., Bandinelli, S., Bartali, B., Corsi, A.,
Lauretani, F., et al. (2006). Relationship of plasma polyunsat-
urated fatty acids to circulating inflammatory markers. Journalof Clinical Endocrinology and Metabolism, 91, 439–446.
Goodenowe, D. B., Cook, L. L., Liu, J., Lu, Y., Jayasinghe, D. A.,
Ahiahonu, P. W., et al. (2007). Peripheral ethanolamine
plasmalogen deficiency: A logical causative factor in
Alzheimer’s disease and dementia. Journal of Lipid Research,48, 2485–2498.
Grundy, S. M. (2001). United States cholesterol guidelines 2001:
Expanded scope of intensive low-density lipoprotein-lowering
therapy. American Journal of Cardiology, 88, 23J–27J.
Grundy, S. M., Cleeman, J. I., Merz, C. N., Brewer, H. B., Jr, Clark,
L. T., Hunninghake, D. B., et al. (2004). Implications of recent
clinical trials for the national cholesterol education program
adult treatment panel III guidelines. Circulation, 110, 227–239.
Hahnel, D., Thiery, J., Brosche, T., & Engelmann, B. (1999). Role of
plasmalogens in the enhanced resistance of LDL to copper-
induced oxidation after LDL apheresis. Arteriosclerosis, Throm-bosis, and Vascular Biology, 19, 2431–2438.
Jasinska, M., Owczarek, J., & Orszulak-Michalak, D. (2007). Statins:
A new insight into their mechanisms of action and consequent
pleiotropic effects. Pharmacological Reports, 59, 483–499.
Jula, A., Marniemi, J., Ronnemaa, T., Virtanen, A., & Huupponen, R.
(2005). Effects of diet and simvastatin on fatty acid composition
in hypercholesterolemic men: A randomized controlled trial.
Arteriosclerosis, Thrombosis, and Vascular Biology, 25, 1952–
1959.
Klein-Platat, C., Drai, J., Oujaa, M., Schlienger, J. L., & Simon, C.
(2005). Plasma fatty acid composition is associated with the
metabolic syndrome and low-grade inflammation in overweight
adolescents. American Journal of Clinical Nutrition, 82, 1178–
1184.
Laaksonen, R., Katajamaa, M., Paiva, H., Sysi-Aho, M., Saarinen, L.,
Junni, P., et al. (2006). A systems biology strategy reveals
biological pathways and plasma biomarker candidates for poten-
tially toxic statin-induced changes in muscle. PLoS ONE, 1, e97.
Lawrence, M. B., & Zaugg, A. M. (2004). IMS health report.MM&M.
Lee, R. G., Kelley, K. L., Sawyer, J. K., Farese, R. V., Jr, Parks, J. S.,
& Rudel, L. L. (2004). Plasma cholesteryl esters provided by
lecithin:cholesterol acyltransferase and acyl-coenzyme a: Cho-
lesterol acyltransferase 2 have opposite atherosclerotic potential.
Circulation Research, 95, 998–1004.
Lessig, J., & Fuchs, B. (2009). Plasmalogens in biological systems:
Their role in oxidative processes in biological membranes, their
contribution to pathological processes and aging and plasmalo-
gen analysis. Current Medicinal Chemistry, 16, 2021–2041.
Liu, M., Bagdade, J. D., & Subbaiah, P. V. (1995). Specificity of
lecithin:cholesterol acyltransferase and atherogenic risk: Com-
parative studies on the plasma composition and in vitro synthesis
of cholesteryl esters in 14 vertebrate species. Journal of LipidResearch, 36, 1813–1824.
Ma, J., Folsom, A. R., Lewis, L., & Eckfeldt, J. H. (1997). Relation of
plasma phospholipid and cholesterol ester fatty acid composition
to carotid artery intima-media thickness: The atherosclerosis risk
in communities (ARIC) study. American Journal of ClinicalNutrition, 65, 551–559.
Messner, T., Sihm, H., & Vessby, B. (1998). Fatty acid composition
in serum among males 4–16 years after myocardial infarction.
International Journal of Circumpolar Health, 57, 22–31.
Moilanen, T., Solakivi-Jaakkola, T., Viikari, J., Rasanen, L., Akerb-
lom, H. K., Uhari, M., et al. (1986). Fatty acid composition of
serum cholesteryl esters in relation to serum lipids and apoli-
poproteins in 3–18-year-old Finnish children and adolescents.
Atherosclerosis, 59, 113–119.
Neidlinger, N. A., Larkin, S. K., Bhagat, A., Victorino, G. P., &
Kuypers, F. A. (2006). Hydrolysis of phosphatidylserine-
exposing red blood cells by secretory phospholipase A2
generates lysophosphatidic acid and results in vascular dysfunc-
tion. The Journal of Biological Chemistry, 281, 775–781.
Ozerova, I. N., Paramonova, I. V., Olfer’ev, A. M., Akhmedzhanov,
N. M., Aleksandrova, M. A., & Perova, N. V. (2001). Effects of
200 R. Kaddurah-Daouk et al.
123
simvastatin on the phospholipid composition of high-density
lipoproteins in patients with hypercholesterolemia. Bulletin ofExperimental Biology and Medicine, 132, 763–765.
Ridker, P. M., Danielson, E., Fonseca, F. A., Genest, J., Gotto, A. M.,
Jr, Kastelein, J. J., et al. (2008). Rosuvastatin to prevent vascular
events in men and women with elevated C-reactive protein. NewEngland Journal of Medicine, 359, 2195–2207.
Rise, P., Ghezzi, S., Carissimi, R., Mastromauro, F., Petroni, A., &
Galli, C. (2007). Delta5 desaturase mRNA levels are increased
by simvastatin via SREBP-1 at early stages, not via PPARalpha,
in THP-1 cells. European Journal of Pharmacology, 571,
97–105.
Rise, P., Pazzucconi, F., Sirtori, C. R., & Galli, C. (2001). Statins
enhance arachidonic acid synthesis in hypercholesterolemic
patients. Nutrition, Metabolism & Cardiovascular, 11, 88–94.
Sathyapalan, T., Atkin, S. L., & Kilpatrick, E. S. (2008). Variability
of lipids in patients with type 2 diabetes taking statin treatment:
Implications for target setting. Diabetic Medicine, 25, 909–915.
Simon, J. A., Lin, F., Hulley, S. B., Blanche, P. J., Waters, D.,
Shiboski, S., et al. (2006). Phenotypic predictors of response to
simvastatin therapy among African-Americans and Caucasians:
The cholesterol and pharmacogenetics (CAP) Study. AmericanJournal of Cardiology, 97, 843–850.
Sotiriou, C. G., & Cheng, J. W. (2000). Beneficial effects of statins in
coronary artery disease––beyond lowering cholesterol. Annals ofPharmacotherapy, 34, 1432–1439.
Storey, J. D., & Tibshirani, R. (2003). Statistical significance for
genomewide studies. Proceedings of the National Academy ofSciences of the United States of America, 100, 9440–9445.
Sundstrom, J., Lind, L., Vessby, B., Andren, B., Aro, A., & Lithell, H.
(2001). Dyslipidemia and an unfavorable fatty acid profile
predict left ventricular hypertrophy 20 years later. Circulation,103, 836–841.
Watkins, S. M., Reifsnyder, P. R., Pan, H. J., German, J. B., & Leiter,
E. H. (2002). Lipid metabolome-wide effects of the PPAR-
gamma agonist rosiglitazone. Journal of Lipid Research, 43,
1809–1817.
Yanagita, T., Yamamoto, K., Ishida, S., Sonda, K., Morito, F., Saku,
K., et al. (1994). Effects of simvastatin, a cholesterol synthesis
inhibitor, on phosphatidylcholine synthesis in HepG2 cells.
Clinical Therapeutics, 16, 200–208.
Zhou, Z., Rahme, E., & Pilote, L. (2006). Are statins created equal?
Evidence from randomized trials of pravastatin, simvastatin, and
atorvastatin for cardiovascular disease prevention. AmericanHeart Journal, 151, 273–281.
Lipidomics of simvastatin 201
123
Copyright © 2022 FDOKUMEN