Omega-3 biotechnology: Thraustochytrids as a novel source of omega-3 oils
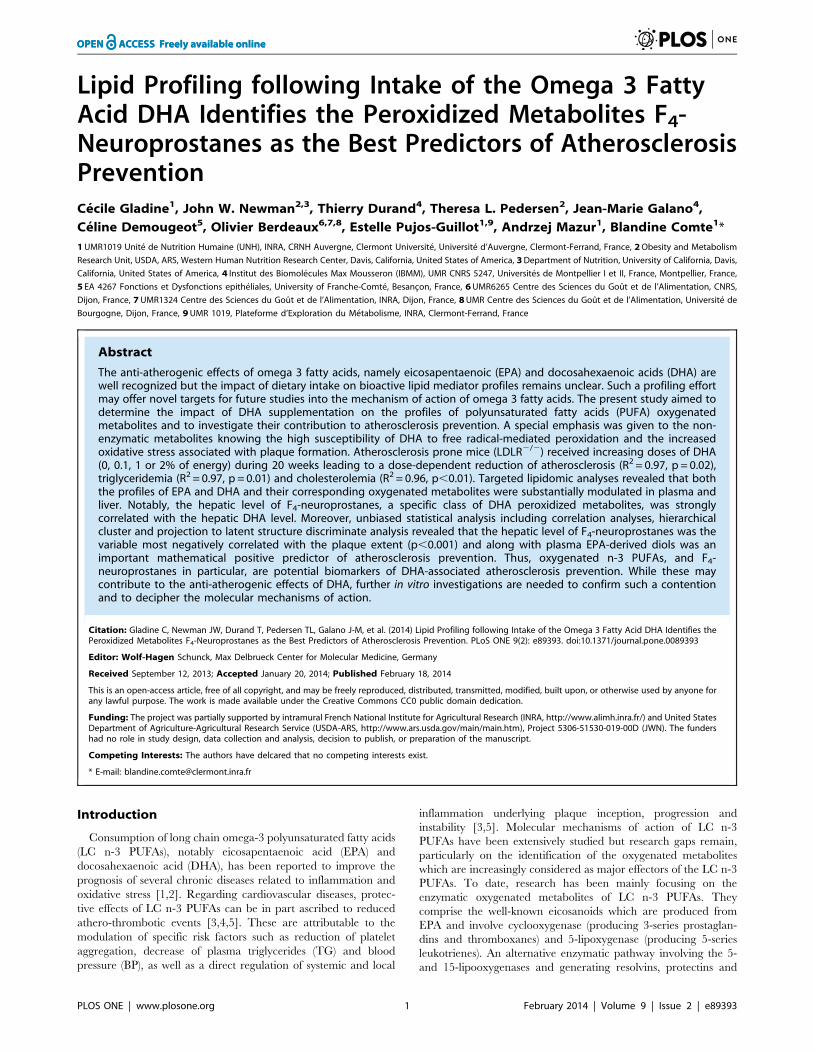
Lipid Profiling following Intake of the Omega 3 FattyAcid DHA Identifies the Peroxidized Metabolites F4-Neuroprostanes as the Best Predictors of AtherosclerosisPreventionCecile Gladine1, John W. Newman2,3, Thierry Durand4, Theresa L. Pedersen2, Jean-Marie Galano4,
Celine Demougeot5, Olivier Berdeaux6,7,8, Estelle Pujos-Guillot1,9, Andrzej Mazur1, Blandine Comte1*
1 UMR1019 Unite de Nutrition Humaine (UNH), INRA, CRNH Auvergne, Clermont Universite, Universite d’Auvergne, Clermont-Ferrand, France, 2 Obesity and Metabolism
Research Unit, USDA, ARS, Western Human Nutrition Research Center, Davis, California, United States of America, 3 Department of Nutrition, University of California, Davis,
California, United States of America, 4 Institut des Biomolecules Max Mousseron (IBMM), UMR CNRS 5247, Universites de Montpellier I et II, France, Montpellier, France,
5 EA 4267 Fonctions et Dysfonctions epitheliales, University of Franche-Comte, Besancon, France, 6 UMR6265 Centre des Sciences du Gout et de l’Alimentation, CNRS,
Dijon, France, 7 UMR1324 Centre des Sciences du Gout et de l’Alimentation, INRA, Dijon, France, 8 UMR Centre des Sciences du Gout et de l’Alimentation, Universite de
Bourgogne, Dijon, France, 9 UMR 1019, Plateforme d’Exploration du Metabolisme, INRA, Clermont-Ferrand, France
Abstract
The anti-atherogenic effects of omega 3 fatty acids, namely eicosapentaenoic (EPA) and docosahexaenoic acids (DHA) arewell recognized but the impact of dietary intake on bioactive lipid mediator profiles remains unclear. Such a profiling effortmay offer novel targets for future studies into the mechanism of action of omega 3 fatty acids. The present study aimed todetermine the impact of DHA supplementation on the profiles of polyunsaturated fatty acids (PUFA) oxygenatedmetabolites and to investigate their contribution to atherosclerosis prevention. A special emphasis was given to the non-enzymatic metabolites knowing the high susceptibility of DHA to free radical-mediated peroxidation and the increasedoxidative stress associated with plaque formation. Atherosclerosis prone mice (LDLR2/2) received increasing doses of DHA(0, 0.1, 1 or 2% of energy) during 20 weeks leading to a dose-dependent reduction of atherosclerosis (R2 = 0.97, p = 0.02),triglyceridemia (R2 = 0.97, p = 0.01) and cholesterolemia (R2 = 0.96, p,0.01). Targeted lipidomic analyses revealed that boththe profiles of EPA and DHA and their corresponding oxygenated metabolites were substantially modulated in plasma andliver. Notably, the hepatic level of F4-neuroprostanes, a specific class of DHA peroxidized metabolites, was stronglycorrelated with the hepatic DHA level. Moreover, unbiased statistical analysis including correlation analyses, hierarchicalcluster and projection to latent structure discriminate analysis revealed that the hepatic level of F4-neuroprostanes was thevariable most negatively correlated with the plaque extent (p,0.001) and along with plasma EPA-derived diols was animportant mathematical positive predictor of atherosclerosis prevention. Thus, oxygenated n-3 PUFAs, and F4-neuroprostanes in particular, are potential biomarkers of DHA-associated atherosclerosis prevention. While these maycontribute to the anti-atherogenic effects of DHA, further in vitro investigations are needed to confirm such a contentionand to decipher the molecular mechanisms of action.
Citation: Gladine C, Newman JW, Durand T, Pedersen TL, Galano J-M, et al. (2014) Lipid Profiling following Intake of the Omega 3 Fatty Acid DHA Identifies thePeroxidized Metabolites F4-Neuroprostanes as the Best Predictors of Atherosclerosis Prevention. PLoS ONE 9(2): e89393. doi:10.1371/journal.pone.0089393
Editor: Wolf-Hagen Schunck, Max Delbrueck Center for Molecular Medicine, Germany
Received September 12, 2013; Accepted January 20, 2014; Published February 18, 2014
This is an open-access article, free of all copyright, and may be freely reproduced, distributed, transmitted, modified, built upon, or otherwise used by anyone forany lawful purpose. The work is made available under the Creative Commons CC0 public domain dedication.
Funding: The project was partially supported by intramural French National Institute for Agricultural Research (INRA, http://www.alimh.inra.fr/) and United StatesDepartment of Agriculture-Agricultural Research Service (USDA-ARS, http://www.ars.usda.gov/main/main.htm), Project 5306-51530-019-00D (JWN). The fundershad no role in study design, data collection and analysis, decision to publish, or preparation of the manuscript.
Competing Interests: The authors have delcared that no competing interests exist.
* E-mail: [email protected]
Introduction
Consumption of long chain omega-3 polyunsaturated fatty acids
(LC n-3 PUFAs), notably eicosapentaenoic acid (EPA) and
docosahexaenoic acid (DHA), has been reported to improve the
prognosis of several chronic diseases related to inflammation and
oxidative stress [1,2]. Regarding cardiovascular diseases, protec-
tive effects of LC n-3 PUFAs can be in part ascribed to reduced
athero-thrombotic events [3,4,5]. These are attributable to the
modulation of specific risk factors such as reduction of platelet
aggregation, decrease of plasma triglycerides (TG) and blood
pressure (BP), as well as a direct regulation of systemic and local
inflammation underlying plaque inception, progression and
instability [3,5]. Molecular mechanisms of action of LC n-3
PUFAs have been extensively studied but research gaps remain,
particularly on the identification of the oxygenated metabolites
which are increasingly considered as major effectors of the LC n-3
PUFAs. To date, research has been mainly focusing on the
enzymatic oxygenated metabolites of LC n-3 PUFAs. They
comprise the well-known eicosanoids which are produced from
EPA and involve cyclooxygenase (producing 3-series prostaglan-
dins and thromboxanes) and 5-lipoxygenase (producing 5-series
leukotrienes). An alternative enzymatic pathway involving the 5-
and 15-lipooxygenases and generating resolvins, protectins and
PLOS ONE | www.plosone.org 1 February 2014 | Volume 9 | Issue 2 | e89393

maresins from both EPA and DHA have been more recently
described [6]. Various alcohols, ketones, epoxides and diols can
also be produced from LC n-3 PUFAs by the independent or
coordinated action of lipoxygenases, peroxidases, alcohol dehy-
drogenases, cytochrome P450 epoxygenases and epoxide hydro-
lase [7]. The non-enzymatic pathways also referred to as the free-
radical-mediated peroxidation pathway has been much less
considered as a putative source of bioactive n-3 PUFAs
metabolites. However, LC n-3 PUFAs, and DHA in particular,
are highly prone to free-radical-mediated peroxidation [8] which
produce an array of metabolites from hydroperoxide decomposi-
tion and rearrangement including hydroxyhexenal (HHE) and the
isoprostanes/neuroprostanes (IsoPs/NeuroPs) [9,10,11]. More-
over, the free radical-mediated peroxidation of DHA is likely a
major metabolic pathway during atherogenesis because of the
enhanced production of free radicals in the artery wall [12]. This
emphasizes a conceptual paradox between the atheroprotective
properties of DHA and its susceptibility to peroxidation during
atherogenesis. We thus hypothesized that non-enzymatic oxygen-
ated metabolites generated from DHA could also play a role in
atherosclerosis prevention. To broaden our understanding of
metabolic changes associated with atherosclerosis progression in
the presence and absence of DHA, we designed experiments to ask
two specific questions: 1) What is the impact of DHA supplemen-
tation on the profiles of PUFA oxygenated metabolites? 2) Is there
a relationship between the production of oxygenated metabolites
and the atherosclerotic plaque progression? To address these
questions, we conducted a dose-response intervention study with
DHA in atherosclerosis-prone LDLR2/2 mice and used targeted
lipidomic analyses to quantify PUFA-derived oxygenated metab-
olites in plasma and liver. Multivariate analysis methods including
correlation analyses, hierarchical cluster and projection to latent
structure discriminate analysis (PLS-DA) were finally used to
investigate relationships between plaque extent and the levels of
PUFA oxygenated metabolites. This integrated biological and
biostatistical analysis resulted in oxygenated PUFA metabolite
profiling and the identification of potent predictive variables of
atherosclerosis.
Materials and Methods
Ethics StatementThis study was carried out in strict accordance with the
Institutional Ethics Committee of the INRA. The protocol was
approved by the Committee on the Ethics of Animal Experiments
of the Auvergne Region (Permit Number: CE-2910). All efforts
were made to minimize suffering during the protocol and before
the final experiment.
Mice, Diets and Study OutlineLDLR2/2 mice (n = 120) were purchased from Jackson Labora-
tories (Charles River Laboratories, L’Arbresle, France), housed 10
percage, ina temperaturecontrolledenvironment (2260.8uC)witha
12-h light–dark cycle, and allowed free access to food and water. At 8
weeks of age, mice were given a diet enriched in animal fat (10% of
lard) and low in cholesterol (0.045%, Sigma-Aldrich C75209), and
were randomized into four different groups on the basis of body
weight. In parallel to the diet, mice received by daily oral gavages
(50 mL, 5 days/week) of either oleic acid rich sunflower oil (Lesieur,
Asnieres-sur-Seine, France; Control group) or a mixture of oleic acid
rich sunfloweroil and DHArich tunaoil (OMEGAVIEDHA 90 TG,
Polaris Nutritional Lipids, France containing 90% of DHA as TG).
This oil mixture provided 0.1% (or 1.77 mg/d/mouse), 1% (or
17.7 mg/d/mouse) or 2% (or 35.5 mg/d/mouse) of energy as DHA
(DHA1, DHA2 and DHA3 groups respectively). These 3 doses of
DHA were chosen first to be close to nutritional conditions
(recommended intake for human: 0.1% of energy [13]) and secondly
to levels reported in the literature [14]. Moreover, to avoid oxidation
of oil mixtures, preparations were performed under nitrogen,
aliquoted into 3 mL cryotubes, corresponding to daily doses of
gavage and stored in the dark at 280uC until use. After 20 weeks of
feeding, mice were anaesthetized (40 mg pentobarbital/kg body
weight), blood was drawn into sodium EDTA (200 mM) and plasma
was rapidly collected and stored at 280uC until further utilization.
After rapid washing with sterilized PBS, liver and aorta samples were
immediately frozen into liquid nitrogen and stored at 280uC.
Blood Pressure and Heart rateSystolic blood (sBP) and diastolic blood pressures (dBP) as well
as heart rate were measured in conscious mice using the indirect
tail-cuff method (BP 2000, Visitech System, Apex, North Carolina,
USA). Measurements were performed at the beginning and at the
end of the experimental period.
Quantification of Atherosclerotic LesionsAtherosclerotic lesions were assessed by measuring lipid deposit
in the aortic sinus as previously described [15]. Briefly, four
sections of 10 mm thickness were harvested/slide and 28 slides/
mouse were prepared and stained with Oil red O (Merck,
Darmstadt, Germany) and counterstained with hematoxylin
(Diapath, Martinengo, Italy). Each section was evaluated for Oil
red O staining area under microscope. Image analysis was carried
out using the ImageJ free software (http://rsb.info.nih.gov/ij/) to
quantify the cross-section surface areas of the lesions and the cross-
section surface area of the aorta. The lesion area was calculated by
dividing the surface of the lesion by the surface of the vessel and
expressed as a percentage. This approach allows correcting for
errors caused by oblique sections that may lead to overestimation
of the surface area occupied by a lesion.
Plasma and Liver LipidsPlasma total cholesterol and TG concentrations were deter-
mined as previously described [16]. Liver samples were homog-
enized in NaCl (9 g.l21) with a Polytron homogeniser PT-
MR2100 (Kinermatica AG, Littau/Luzern, Switzerland) and
lipids were extracted by chloroform–methanol (2:1, v/v) under
overnight agitation. The chloroform phase was recovered after
centrifugation and evaporated under dry air. TAGs from the lipid
residue were saponified with 0.5 M KOH–ethanol at 70uC for 30
min followed by the addition of 0.15 M MgSO4 to neutralize the
mixture. After centrifugation (2,0006g; 5 min), glycerol from TAG
in the supernatant was quantified by an enzymatic assay (TG PAP
150 kits, BioMerieux, Marcy-l’Etoile, France). Cholesterol in the
lipid residue was dissolved with isopropanol and measured using
enzymatic commercial kit (Cholesterol RTUTM, BioMerieux,
Marcy-l’Etoile, France).
Plasma Fatty Acids and OxylipinsEsterified plasma lipids were quantified by mass spectrometry
after total lipid extraction in the presence of fatty acid,
cholesterylester, triglyceride, and phospholipid surrogates. Extracts
were split for the independent quantification of esterified fatty
acids and alkali stable oxylipins. Esterified fatty acids were
transformed to fatty acid methyl esters and quantified by GC-
MS. Fractions for oxylipin analyses were enriched with isotopically
labeled oxylipin fatty acids, subjected to base hydrolysis, and the
Lipid Mediators and Atherosclerosis Prevention
PLOS ONE | www.plosone.org 2 February 2014 | Volume 9 | Issue 2 | e89393

resulting free oxylipins were isolated by solid phase extraction
(SPE) and quantified by LC-MS/MS.
Specifically, plasma aliquots (100 mL) were enriched with 5 mL
0.2 mg/ml butylated hydroxytoluene/EDTA in 1:1 methanol:-
water, and a suite of extraction surrogates, which included
deuterated-tri-palmitoyl glycerol (d31-16:0-TG; CDN Isotopes,
Pointe-Claire, Quebec, Canada), deuterated distearoylphosphoti-
dylcholine (d35-18:0-PC; Avanti Polar Lipids, Alabaster, Ala-
bama), dodeca-(9E)-enoyl cholesterylesters (22:1n9-CE; NuChek
Prep, Elysian MN) and dodecatrienoic acid (22:3n3; NuChek
Prep). Lipids were then extracted with 10:8: 11 cylcohexane: 2-
propanol:ammonium acetate as described by Smedes [17]. Briefly,
enriched samples were mixed with cyclopropane/2-propanol,
phases were split with ammonium acetate, the organic phase was
isolated and the aqueous phase was re-extracted with cyclohexane.
The combined organic total lipid extract was reduced to dryness
and reconstituted in 100 mL of 1:1 methanol/toluene.
A sub-aliquot of the total lipid extract was used to quantify
plasma fatty acids as methyl esters by gas chromatography-mass
spectrometry (GC-MS). Extract aliquots (10 mL) were spiked with
15:1n5 free acid to track methylation efficiency and brought to a
final volume of 200 mL with 90:10 methanol/toluene (v/v) and
incubated at 60uC for 1hr with 100 mL 0.5 M sodium methoxide,
followed by 1 hr with 100 mL 0.5 M methanolic HCl. Solutions
were then neutralized with 400 mL 0.25M KHCO3/0.5M K2CO3
and fatty acid methyl esters (FAMEs) were extracted into 400 mL
hexane, and extracts were washed with 400 mL saturated saline. A
60 mL extract aliquot was enriched with 10 mL of 44 mM
tricosanoate methyl ester (23:0; NuChek Prep). A 1 mL injection
was analyzed by GC-MS on an Agilent 6890/5973N with electron
impact ionization and in simultaneous selected ion monitoring/full
scan mode. Analytes were separated on a
30 m60.25 mm60.25 mm DB-225 ms as previously described
[18].
Total alkali stable plasma oxylipins were quantified in total lipid
extracts by UPLC-MS/MS after the isolation of saponified
oxylipins by SPE. Total lipid extract sub-aliquots (40 mL 1:1
methanol/toluene) were enriched with a suite of 12 deuterated
prostanoids, eicosanoids, and octadecanoid free acid surrogates
(Table S1 in File S1), in 5 mL methanol. Enriched aliquots were
incubated at 60uC for 1 hr with 100 mL 0.5 M sodium methoxide,
followed by 1 hr after the addition of 100 mL of water to hydrolyze
methyl esters. Hydrolysis of methyl esters in 1:1 MeOH/water has
been previously shown to efficiently liberate alkali stable methyl
esters [19,20,21] and trans-esterification followed by hydrolysis has
been found to increase yields for lipids with low water solubility
(e.g. CE and TG, data not shown). Oasis HLB SPE columns
(10 mg61cc; Waters Corporation, Milford, MA, USA) were
washed with 1 mL ethyl acetate, 2 mL MeOH, and conditioned
with 2 mL 5% MeOH/0.1% acetic acid SPE prior to sample
extraction. Hydrolyzed samples were up-diluted with 0.5 mL 5%
MeOH/0.1% acetic acid SPE, neutralized with 10 mL 20% glacial
acetic acid, and transferred to SPE reservoirs along with a second
0.5 mL 5% MeOH/0.1% acetic acid rinsate, for a 16% final
organic content by volume. Samples were allowed to extract by
gravity, sorbent phase was washed with 1 mL of 20% MeOH/
0.1% acetic acid and air dried for 30 min at 225 psi. Columns
were then wetted with 0.5 mL MeOH/1% acetic acid and
residues eluted with 1.5 mL of ethyl acetate into 2 mL vials
containing a solution of 6 mL 30% glycerol in methanol. Residues
were brought to glycerol residue under vacuum and reconstituted
with 50 mL MeOH containing 100 nM each of 1-cyclohexylurea-
3-dodecanoic acid (Sigma-Aldrich, St. Louis, MO) and 1-
phenylurea-3-hexanoic acid, as internal standards. The sample
extract was filtered by centrifugation for 3 min at 8uC using
0.1 mm Amicon Ultrafree-135 MC Durapore PVDF filters
(Millipore, Billerica, MA). Five mL of filtered extract was analyzed,
and analytes of interest were separated by reverse phase ultra-
performance liquid chromatograph with a 1.7 mm Acquity BEH
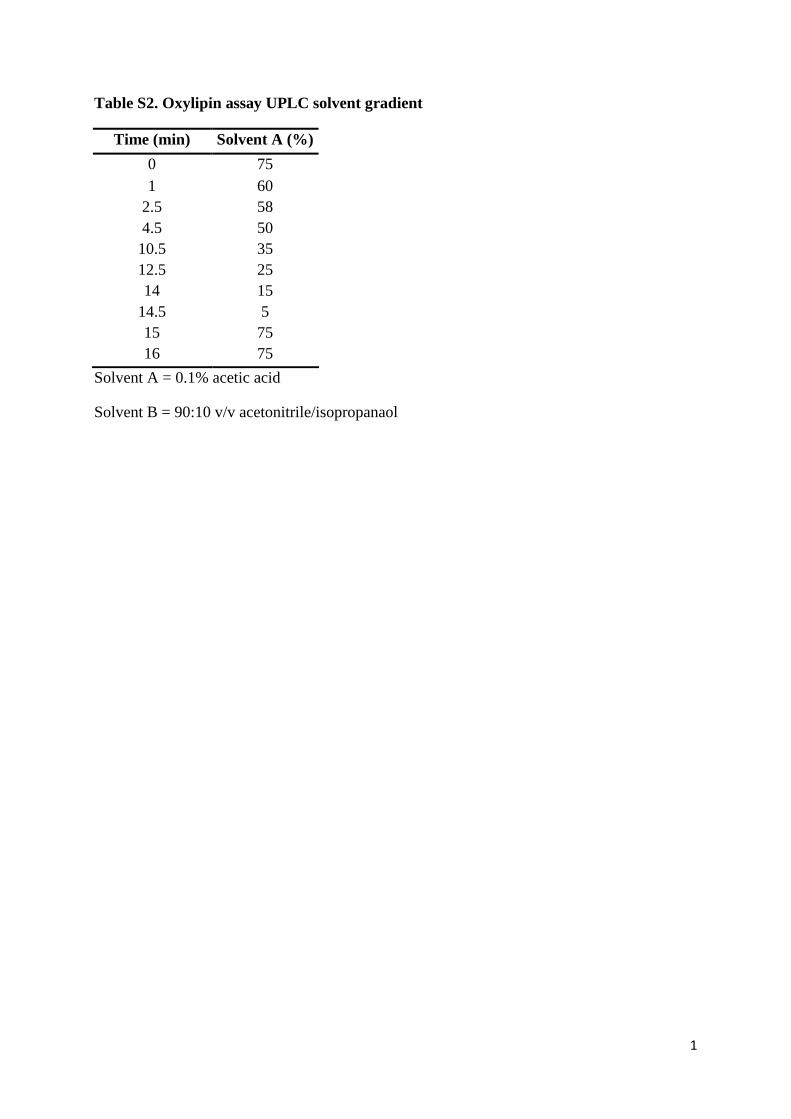
column (Waters, Milford, MA) using a 16 min gradient (Solvent
A = 0.1% acetic acid; Solvent B = 90:10 v/v acetonitrile/isopro-
panol; see Table S2 in File S1 for details). It should be noted, as
showed in Table S1 in File S1, that the apparent surrogate
recoveries were lower than typically observed with these methods,
particularly for the epoxy fatty acids, which may reduce the
accuracy in the final data. However, as replicate precision was
high, the reported data is considered valid for the determination of
the treatment effect investigated in the present study.
Oxylipins were detected on an API 4000 QTrap (AB Sciex,
Framingham, MA, USA) by multiple reaction monitoring (MRM)
after negative mode electrospray ionization, and quantified against
6pt calibration curves using internal standard methodologies.
Analyte retention times, mass transitions, mass spectral parameters
and surrogate/internal standard associations, and estimated
detection limits are presented in Table S3 in File S1. Our
analytical criteria for reporting are as follows: data .3:1 signal to
noise; the relative contribution of background from method blanks
is ,25% of signal; values are within the calibrated range.
It should be noted that alkaline conditions destroy the b-
hydroxy-keto prostanoids (e.g. PGEs, PGDs) and thromboxanes,
as well as cystienyl leukotrienes and ketones (Tables S8, S9, and
S10 in File S1) but not the b-hydroxy-alcohol PGFs [22] or other
oxylipin classes analyzed here (see Table S1 in File S1). While
plasma deuterated PGF2a showed good recoveries and F2-
isoprostanes were detected in ,70% of samples, concentrations
were uniformly low, ,46 the average blank values, and are not
reported here. To provide readers an estimate of the lowest
detectable concentration, the lowest detectable calibrated concen-
tration has been transformed to a plasma equivalent concentration
for each analyte and included in Table S8 in File S1. Finally,
whereas artificial formation of oxylipins during saponification
cannot be completely excluded, the use of EDTA to chelate free
metals which can catalyze auto-oxidative degradation of lipids and
the use of butylated hydroxyl toluene as an anti-oxidant should
have limited this process. Moreover, as shown in Figure S6 in File
S1, the auto-oxidative markers F2-isoprostanes and 9-HETE levels
were low and did not co-vary. Finally, while some oxylipins were
strongly covariant with 9-HETE levels in the samples, others were
not. Importantly, while 9-HETE was correlated with 11-HETE
and 15-HETE concentrations, 12-HETE and plasma epoxide
concentrations were not (Figure S7 in File S1). Taken together
these factors suggest that oxylipins were not formed during sample
processing.
Liver Fatty AcidsTotal lipids were extracted from liver samples following a the
choloroform:methanol procedures of Folch et al. as previously
described [23], and fatty acid methyl esters were prepared for
analysis by gas chromatography-flame ionization detection.
Briefly, after drying with anhydrous sodium sulfate, the organic
extract was evaporated under nitrogen and total lipids dissolved
with toluene/methanol (1/2, v/v). FAMEs were obtained after
trans-esterification followed by acid trans-esterification. GC
analysis of FAMEs was performed using a GC Trace (Thermo
Fischer Scientific, Courtaboeuf, France), equipped with a fused
silica CP-Sil 88 capillary column (100% cyanopropyl-polysiloxane,
100 m60.25 mm60.20 mm; Varian S.A, Les Ulis, France). The
identities of sample methyl esters were determined by comparing
Lipid Mediators and Atherosclerosis Prevention
PLOS ONE | www.plosone.org 3 February 2014 | Volume 9 | Issue 2 | e89393

their relative retention times with those of external FAME
standards (Supelco 37 Component Fatty Acid Methyl Esters Mix
and Menhaden Oil; Sigma Aldrich, St Quentin Fallavier, France).
Other standard FAME mixtures were obtained from Nu-Chek-
Prep (Elysian, MN, USA).
Liver HydroxyalkenalsHepatic levels of the hydroxyalkenals thioether protein adducts
(hydroxynonenal or HNE-P and hydroxyhexenal or HHE-P from
n-6 and n-3 PUFA respectively) were measured by GC-MS/MS as
previously described [23]. Briefly, 100 mg of liver tissue were
processed and immediately treated with NaB2H4 to reduce
aldehydes into their chemically stable 2H labeled alcohol
derivatives. Then, proteins were precipitated and resuspended
into 8 mM guanidine buffer. The mixture was spiked with the
labeled internal standard ([2H11] 4-HNE, 0.25 nmol) and incu-
bated with Raney nickel (overnight, 55uC) to cleave the thioether
linkages and reduce the C–C bonds. The free saturated derivatives
were then extracted and derivatized with N-methyl-N-(t-butyldi-
methylsylyl)-trifluoroacetamide (2 hr, 80uC). Samples were ana-
lyzed by GC-MS/MS on a Agilent 6890N GC (Agilent
Technologies, Palo Alto, CA, USA) equipped the a Quattro
Micro tandem mass spectrometer (Waters Corporation, Manche-
ster, UK), as previously described. The system was run in positive
mode with MRM. The collision energies were adjusted to
optimize the signal for the most abundant product (daughter)
ions: m/z 390.258 for [2H]DHN (dihydroxynonene as reduced
HNE), m/z 348.216 for [2H]DHH (dihydroxyhexene as reduced
HHE), and m/z 400.268 for the internal standard [2H11]DHN
using argon as collision gas. Quantification was performed using
calibration curves with external standards. Quantities of HNE-P
and HHE-P adducts reported in this study represent averages of
duplicate sample injections.
Liver F4-neuroprostanesSample preparation was adapted from Musiek et al. (2004) [24].
Briefly samples of liver tissue (10 mg) were homogenized in 2.5 ml
of ice-cold chloroform/methanol (2/1, v/v) containing butylated
hydroxyl toluene (0.004%) and 50 mL of the labeled internal
standard ([2H4]4-F4t, 40 ng/mL). Esterified F4-NeuroPs were
isolated and hydrolyzed by adding 2 ml of 1 M aqueous potassium
hydroxide. The samples were acidified to pH 3 with 1 mL of 1 M
HCl and diluted with 2 mL of 0.1 M formate buffer (pH 3.0). F4-
NeuroPs were then purified by solid phase extraction using an
Oasis HLB extraction cartridge (Waters Corp) as previously
described [25]. Briefly, the cartridge was preconditioned with
methanol and 0.1 M formate buffer (pH 3.0), and washed with
acetonitrile:water (15:85, v:v) followed by heptane. F4-NeuroPs
were eluted by with 2 mL of hexane:ethyl acetate:propan-2-ol
(30:65: 5, v:v:v). Purified F4-NeuroPs were converted to penta-
fluorobenzyl ester/TMS ether derivatives before GC/MS analysis
using the Agilent/Waters GC-MS/MS described above, operating
in negative chemical ionization mode using isobutane as reagent
gas. Injections (2 mL) were performed at 250uC in splitless mode.
The carrier gas was high-purity helium at a constant flow rate of
1 mL/min. Chromatographic separation was performed using an
50 m60.32 mm i.d, 0.25 mm OV-1701 (Ohio Valley Specialty
Co; Marietta, OH, USA) capillary column under the following
conditions: 90uC for 1 min, increased by 40uC/min until 290uC.
The final temperature was held at 290uC for 6 min. MS
parameters were optimized using standard solutions. Maximum
sensitivity was obtained for an ion source temperature set at
120uC, an electron energy at 90 eV and an emission current at
300 mA.
The data were acquired using MRM. The collision energies of
15 eV yielded optimal product ions intensity from the fragmen-
tation of the carboxylate anions: m/z 593.341 for F4-NeuroPs,
and m/z 573.303 for the internal standard [2H4]4-F4t-NeuroP
using argon as collision gas. Quantification was performed using
calibration curves with external standards. The internal standard
[2H4]4-F4t-NeuroP was synthesized according to a recent
published procedure [26,27].
Statistical AnalysesAll data are presented as means 6 SEM. Data following a
Gaussian distribution (test of Kolmogorov & Smirnov) and having
no significant difference between SD (Bartlett’s test) were analyzed
by one-way ANOVA followed by a Tukey-Kramer post-hoc
analysis using GraphPad InStat version 3.06 (GraphPad Software,
San Diego California USA, www.graphpad.com). The other data
were analysed using a non-parametric test (Kruskal Wallis’s test).
Differences were considered significant at p,0.05.
The cumulative results were also subjected to a suite of
multivariate analyses including hierarchical cluster analysis and
PLS-DA. Data treatment prior to multivariate analysis included
missing value imputation, and normality transformation, and
autoscaled i.e. each variable was mean centred and scaled to unit
variance [28]. Where variable data sets were greater than 90%
complete, missing values were computationally imputed using a
probabilistic principal components analysis [29,30]. Data was
transformed to normality using the procedures of Box and Cox
[31]. Differences in means were determined using 2-tailed t-tests or
Mann-Whitney U-tests if normality was not achieved. Data
transformations, multivariate analyses and non-parametric statis-
tics were performed using the Excel Add-In imDEV [32], which
provides a graphical user interface to the R Statistical Computing
Environment. Hierarchical clusters were based on a Minkowski
distance matrix agglomerated using Ward’s minimum variance
method. PLS-DA was performed using the SIMPLS algorithm
with leave one out cross-validation, and predictive models were
iteratively compared (n = 100) to those built with data randomly
assigned to discriminate class data. Predictive models were
constructed to either classify animals based on relative dietary n-
3 content [discriminate classes: 0 = Control; 1 = DHA1;
10 = DHA2; 20 = DHA3] or atherosclerotic plaque area modeled
as a continuous variable. Model variable selection with correlation,
ANOVA, entropy minimization, and chi square filtering were
compared between 10 independent training/test set selections.
Correlation based filtering provided the model set with the lowest
variance in the root mean squared error of prediction.
Results
Effects of DHA Supplementation on Cardiovascular RiskParameters and Atherosclerosis
The dose-response effects of DHA supplementation were
evaluated on several cardiovascular risk factors (i.e. plasma and
hepatic lipids, sBP) and atherosclerosis as shown in Figure 1. The
doses of DHA given to the LDLR2/2 mice (0, 0.1, 1 and 2% of
energy as DHA) were negatively correlated with plasma TG and
TC (R2 = 0.97, p = 0.01 and R2 = 0.96, p,0.01 respectively) as
well as with liver contents of TG and TC (R2 = 0.89, p = 0.06 and
R2 = 0.93, p = 0.03) (Figure 1A). There was also a strong negative
correlation with atherosclerotic plaque area (R2 = 0.97, p = 0.02;
Figure 1B). With sBP, the correlation did not reach significance
(R2 = 0.84, p = 0.08; Figure 1B). The effects of DHA on
cardiovascular risk parameters and atherosclerosis were especially
strong in the DHA3 group (Table S4 in File S1) in which plasma
Lipid Mediators and Atherosclerosis Prevention
PLOS ONE | www.plosone.org 4 February 2014 | Volume 9 | Issue 2 | e89393

levels of TG and TC were reduced (p,0.05) by 37 and 28%
respectively, while liver concentrations of TG and TC were
decreased (p,0.05) by 56 and 47% respectively. Concerning
atherosclerotic plaque extent (Figure 2) and sBP (Table S5 in File
S1), the reductions induced by DHA supplementation were also
especially pronounced in the DHA3 group (235 and 216%, p,
0.05 respectively).
Impact of DHA Supplementation on the Profiles of FattyAcids in Plasma and Liver
As expected, DHA supplementation produced a substantial
enrichment of n-3 PUFAs in both plasma and liver (Figure 3).
These changes were dose-dependent in both plasma (R2 = 0.95,
p,0.01) and liver (R2 = 0.99, p,0.01) (Figures S1 & S4 in File S1).
Similar changes were observed for plasma and liver levels of DHA
(R2 = 0.94, p,0.01 and R2 = 0.99, p,0.01 respectively, Table S6
and Figures S1 & S4 in File S1) which represents the major n-3
PUFAs in both biological compartments. EPA levels (Table S6
and Figures S1 & S4 in File S1) were also increased in a dose-
dependent manner (R2 = 0.96, p,0.01 and R2 = 0.99, p,0.01). In
plasma, n-3 PUFA increases were partially reflected in decreases in
n-6 PUFAs, while liver n-6 PUFA composition remained constant.
Finally, in both plasma and liver, the MUFA relative abundance
was significantly decreased, with the DHA3 group showing the
greatest change (216%, p,0.05 and 231%, p,0.05 respectively)
in comparison with the Control group.
Impact of DHA Supplementation on the Profiles ofPlasma Oxylipins and Liver Peroxidized Metabolites
Plasma and liver profiles of the main oxygenated metabolites
originating from the enzymatic and non-enzymatic oxidation of n-
6 and n-3 PUFAs are represented in Figure 4 and in Table S7 in
File S1. These graphs highlight that DHA supplementation not
only modified fatty acids profiles but also influenced the profiles of
oxygenated metabolites.
Regarding plasma oxylipins, all families (i.e. AA’s, EPA’s and
DHA’s oxylipins, Figure 4A) and sub-families (predominantly
represented by epoxides and secondarily by alcohols and diols,
Table S7 in File S1) were affected by DHA supplementation. It is
interesting to emphasize that the dose-responses differed by
oxylipin family leading to different levels of correlations between
the plasma content of the parent fatty acids (i.e. AA, EPA and
DHA) and their corresponding oxylipins (Figure S1 in File S1).
Indeed, the increase of EPA-derived oxylipins in plasma was
directly proportional to the dose of DHA and was positively
correlated with the plasma level of EPA (R2 = 0.99, p,0.01). This
latter effect was observed for each individual EPA-derived oxylipin
analyzed (i.e. 17(18)-EpETE, 14(15)-EpETE, 17,18-DiHETE,
14,15-DiHETE, 15-HEPE, 12-HEPE, 5-HEPE) (Figure S2 in
File S1). The correlation was much weaker between the plasma
level of DHA and the DHA-derived oxylipins (R2 = 0.74, ns)
(Figure S1 in File S1). However, when looking at the individual
DHA-derived oxylipins (i.e. 19(20)-EpDPE, 16(17)-EpDPE, 19,20-
DiHDPA,17-HDoHE respectively), it should be noticed that the
diol and alcohol species (i.e. 19,20-DiHDPA and 17-HDoHE)
were actually significantly correlated with plasma DHA concen-
tration (R2 = 0.99, p,0.01) (Figure S3 in File S1).
Concerning free radical-mediated peroxidation metabolites, the
liver levels of DHA-derived F4-NeuroPs were particularly affected
by DHA supplementation with concentrations being 2-fold (ns), 6-
fold (p,0.05) and 11-fold (p,0.05) increased in the DHA1,
DHA2 and DHA3 groups respectively (Figure 4B). This leads to
strong positive correlations between F4-NeuroPs and liver DHA
(Figure S4 in File S1, R2 = 0.99, p,0.01). However, the hepatic
concentrations of HHE-P, a hydroxyalkenal originating from all n-
3 PUFAs, were not significantly different between the groups and
correlation between levels of HHE-P and of n-3 PUFAs was not
significant (R2 = 0.76, ns). Finally, concentrations of HNE-P were
reduced in response to DHA supplementation and correlation
between liver levels of HNE-P and of n-6 PUFAs was not
significant (R2 = 0.52, ns). It should be noted that an additional
systemic oxidative stress parameter (i.e. oxygen radical absorbance
capacity or ORAC) was measured in plasma and no difference
appeared between groups (data not shown).
Predictive Variables of Plaque Area ReductionCorrelation analyses were used to assess the association of the
measured variables with changes in atherosclerotic plaque area.
Among the 131 variables assessed, the 30 most significantly
correlated with plaque area at p,0.001 are represented in
Figure 5. Positive correlations were seen with liver TG and TC,
the diet-induced change in sBP and the initial dBP as well as
plasma fatty acid and oxylipin levels including several n-6 PUFAs
and 5-hydroxyeicosatetraenoic acid (5-HETE), a putative pro-
inflammatory mediator derived from 5-lipoxygenase metabolism
of AA. Surprisingly, plasma TC and TG did not belong to the 30
most significantly correlated variables. Negative correlations with
plaque area first included the liver concentrations of the DHA-
derived F4-NeuroPs which was also the variable most negatively
correlated with plasma TC, a major cardiovascular risk factor
(data not shown). It should be noted that the hepatic concentration
of F4-NeuroPs was also negatively correlated with other cardio-
vascular risk factors (i.e. liver TC and TG, change in sBP).
Interestingly, none of the DHA-derived oxylipins in plasma
appeared in the list of the 9 variables most negatively correlated
with plaque area. In contrast, liver EPA and two plasma EPA-
derived oxylipins (15-HEPE, 14,15-DiHETE) belong to this list.
Finally, other variables negatively correlated with plaque area at
p,0.001 included the arachidonic acid derived 15-deoxyprosta-
glandin J2 (15-deoxyPGJ2) as well as the saturated fatty acid
stearate (C18:0).
To determine the covariant behavior of the measured variables,
a hierarchical cluster analysis and a PLS-DA (Figure 6) were
performed to identify variables which best discriminate plaque
area or dietary groups (Figure S5 in File S1). Variables were
separated into 7 unique variable clusters (Figure 6A). Clusters 1
and 2 were dominated by plasma and liver n-3 PUFAs and n-3
oxylipins, but also contained liver saturated fat, with cluster 2
containing 13 of 15 variables able to segregate the relative dose of
the diet groups (see * symbol in Figure 6A). In contrast, clusters 2,
4, 5 and 6 each contained variables responsible for plaque size
prediction (see # symbol in Figure 6A). It should be noted that the
liver F4-NeuroPs concentrations appear in both lists of discrim-
inant variables. The PLS discrimination of mice according to their
plaque area (Figure 6B) clearly shows the multi-dimensional
overlap of the Control and DHA-1 mice, as well as those from the
Control and DHA-2 groups, in accordance with the results shown
in Figure 2. Moreover, as shown in Figure 6C, groups were
discriminated using only 12 of the 152 variables collected,
representing 3 variable clusters. Of these, liver F4-NeuroPs and
the plasma 14,15-diol metabolite of EPA (14,15-DiHETE) were
the strongest negative predictors of plaque size, while plasma
MUFAs and liver TC were the best positive predictors of plaque
size in this LDLR2/2 model.
Lipid Mediators and Atherosclerosis Prevention
PLOS ONE | www.plosone.org 5 February 2014 | Volume 9 | Issue 2 | e89393

Figure 1. Correlations between the doses of DHA and the cardiovascular parameters (i.e. plasma TG and TC, liver TG and TC, sBP,and plaque area). LDLR2/2 mice were given by daily oral gavages (20 weeks) either oleic acid rich sunflower oil (Control group) or a mixture ofoleic acid rich sunflower oil and DHA rich tuna oil providing 0.1%, 1% or 2% of energy as DHA (DHA1, DHA2, and DHA3 groups respectively).doi:10.1371/journal.pone.0089393.g001
Lipid Mediators and Atherosclerosis Prevention
PLOS ONE | www.plosone.org 6 February 2014 | Volume 9 | Issue 2 | e89393

Discussion
The present study aimed to determine the impact of DHA
supplementation on the profiles of PUFA oxygenated metabolites
and to investigate their contribution to atherosclerosis prevention.
The major findings are as follows: 1) the profiles of both DHA and
EPA enzymatic and non-enzymatic metabolites were dose-
dependently modified in response to DHA supplementation; 2)
F4-NeuroPs issued from the free radical-mediated peroxidation of
DHA appeared to be a major source of oxygenated metabolites of
Figure 2. Quantification of atherosclerotic lesions. (A) Sections of aortic sinus (at 500 mm from the cusps) stained with oil red O. The arrowsindicate lipid deposit. (B) Atherosclerotic lesion severity is expressed as percent changes of lesion area in total cross-sectional area. Data representmeans 6 SEM (n = 20/group). a,b,c Mean values with unlike letters were significantly different (p,0.05).doi:10.1371/journal.pone.0089393.g002
Lipid Mediators and Atherosclerosis Prevention
PLOS ONE | www.plosone.org 7 February 2014 | Volume 9 | Issue 2 | e89393

Lipid Mediators and Atherosclerosis Prevention
PLOS ONE | www.plosone.org 8 February 2014 | Volume 9 | Issue 2 | e89393

DHA in the liver during atherogenesis, 3) Hepatic levels of F4-
NeuroPs were identified as major predictive variables of athero-
sclerosis prevention.
DHA Dose-dependently Decreases AtherosclerosisThe dose-response design of the present study not only
confirmed the atheroprotective effect of LC n-3 PUFAs previously
demonstrated in similar animal models [14,33,34] but also showed
a strong dose-dependent relationships between the dose of DHA
consumed, the atherosclerotic plaque extent, and lipemia. Indeed,
more than 90% of the reduction of these cardiovascular risk
parameters could be explained by the increased consumption of
DHA. Surprisingly, when looking at the Spearman’s correlation
heatmap (Figure 5) reporting the 30 most significantly correlated
variables with arteriosclerotic plaque, it should be noted that
plasma TG and TC do not belong to the list. This suggests that the
atheroprotective effects of DHA were in part independent of the
reduction of lipemia. This is consistent with results of several
animal studies showing that LC n-3 PUFAs can interfere at the
vascular level to prevent plaque inception, progression and
instability notably by reducing inflammatory processes [34,35].
Despite the dose-dependent relationships established between the
intake of DHA and the reduction of atherosclerotic plaque, the
nutritional dose (DHA1 group) showed no effect. This finding is
consistent with those of Wang et al. [36] which is, to the best of our
knowledge, the only other study investigating atheroprotective
effects of a nutritional dose of LC n-3 PUFAs in a murine model of
atherosclerosis. However, these findings in mice are inconsistent
with several human clinical trials showing that modest consump-
tion of fish (i.e., 1–2 servings/wk) reduces significantly coronary
death rate and progression of coronary artery atherosclerosis
[4,37].
DHA Supplementation Strongly Modifies PUFAsOxygenated Metabolite Profiles
DHA supplementation dose-dependently increased the propor-
tion of LC n-3 PUFAs at the expense of MUFAs and n-6 PUFAs
in plasma while in liver only MUFA proportions were reduced.
The increases of LC n-3 PUFAs levels were logically allocated to
DHA but also to EPA suggesting that retroconversion occurred
since no EPA was provided by the diet. Retroconversion of DHA
into EPA is a well-described metabolic process which was initially
Figure 3. Plasma (A) and liver (B) fatty acid profiles (% total FA). The 4 families of fatty acid (i.e. saturated fatty acids (SFA), monounsaturatedfatty acids (MUFA), n-6 PUFA and n-3 PUFA) are represented with different grey shades from black to light grey. Data represent means 6 SEM (n = 10/group).doi:10.1371/journal.pone.0089393.g003
Figure 4. Profiles of PUFAs’s oxygenated metabolites. (A) Plasma concentrations of oxylipins originating from AA (20:4 n-6), EPA (20:5 n-3),and DHA (22:6 n-3). (B) Liver contents of peroxidation metabolites originating from n-6 PUFAs (4-HNE-P), n-3 PUFAs (4-HHE-P) and DHA (F4-NeuroPs).Data represent means 6 SEM (n = 10/group). a,b,c Mean values with unlike letters were significantly different (p,0.05).doi:10.1371/journal.pone.0089393.g004
Lipid Mediators and Atherosclerosis Prevention
PLOS ONE | www.plosone.org 9 February 2014 | Volume 9 | Issue 2 | e89393

studied in rat hepatocytes and has been reported in several
experimental models as well as in humans [38]. Overall, the
modifications of plasma and liver fatty acid profiles reported here
are consistent with findings in both hypercholesterolemic rabbits
[23] and Sprague-Dawley rats [39] given similar dietary levels of
DHA. Our experimental design did not allow determining the
fatty acid profiles of aorta. However, increased levels of DHA and
EPA in aorta [40], heart [39] or macrophages [36] have been
reported in rodents given n-3 PUFA doses similar to the present
study. Therefore, n-3 PUFA levels in the aorta have probably been
enhanced in our model too and the atheroprotective effects
obtained are probably in part due to the local action of n-3
PUFAs.
Beside their incorporation into cellular lipids, n-3 PUFAs are
susceptible to oxidation by enzymatic or non-enzymatic reactions
leading to a large array of metabolites. Enzymatic pathways
involve cyclooxygenase and lipooxygenases but also cytochrome
P450 epoxygenase and epoxide hydrolase which produce various
alcohols, epoxides and diols [7] referred to here as oxylipins. Some
of these molecules, namely the alcohols and diols, and additional
oxygenated metabolites can arise from the non-enzymatic
oxidation of PUFAs by reactive oxygen species and notably
Figure 5. A Spearman’s correlation heatmap. Variables rank from the most positive to most negative correlation with arteriosclerotic plaquearea. The displayed variables are the 30 most significantly correlated with arteriosclerotic plaque area at p,0.001 with orange indicating positive andblue indicating negative correlations.doi:10.1371/journal.pone.0089393.g005
Lipid Mediators and Atherosclerosis Prevention
PLOS ONE | www.plosone.org 10 February 2014 | Volume 9 | Issue 2 | e89393

Figure 6. Hierarchical cluster and Partial Least Squares Discrimination Analysis (PLS-DA). (A) Complete data sets (n = 10/group) weresegregated into 7 unique clusters of variables (C1–C7) by hierarchical cluster analysis. Clusters were assigned unique colors and used to highlightvariables in PLS-DA. Plasma and liver variables are indicated by yellow triangles and orange inverted triangles, respectively. Dominant variables forfeeding group discrimination are identified by asterisks (*). Dominant variables for plaque area discrimination are identified by open circles (#). (B)Animals eating each dietary mixture with complete data sets (n = 10/group) were partially segregated by PLS-DA. Mice from DHA1 group wereindistinguishable from Controls (p,0.05), while DHA2 (p,0.0001) and DHA3 (p,1.5E-07) were significantly different in this model. (C) Plasma (yellowtriangle) and liver (orange triangle) metabolites belonging to clusters C2, C4, and C6 as identified in (A) were included in this model. Predictivevariables are labeled with their point size, indicating relative selection frequency of 20–80% in 10 models constructed using a Pearson’s-correlationvariable selection filter which out performed other filters in terms of the minimum root mean squared error of prediction (RMSEP = 3.461). Analytesappearing in $30% of models were retained for the final predictive model construction.doi:10.1371/journal.pone.0089393.g006
Lipid Mediators and Atherosclerosis Prevention
PLOS ONE | www.plosone.org 11 February 2014 | Volume 9 | Issue 2 | e89393

include hydroxyalkenals (HNE and HHE from n-6 and n-3
PUFAs respectively) and F2-IsoPs/F4-NeuroPs (from AA and
DHA respectively) [9,10,11]. Little is known about the impact of
n-3 PUFA supplementation on the profiles of their specific
oxygenated metabolites. Moreover, to the best of our knowledge,
no study has reported so far the profile of enzymatic and non-
enzymatic oxygenated metabolites of n-3 PUFAs in a model of
atherosclerosis. Though, this could be particularly relevant since
both the enzymatic and non-enzymatic pathways are known to be
enhanced during atherogenesis [12,41] and high oxylipins levels
have been reported in ApoE-/2 mice [42]. Concerning the
enzymatic metabolites, DHA supplementation induced substantial
modifications of their plasma profiles with a reduction of the AA
oxylipins and increases of EPA and DHA oxylipins. Interestingly,
the impact on EPA oxylipins was higher than on DHA oxylipins
probably because of the higher change in their precursor fatty
acids. In healthy humans given EPA+DHA supplement (,1.4%
daily energy intake, i.e. close to DHA2 group) for 4 weeks [7],
similar modifications of the oxylipins profiles were reported, but to
a lesser extent than ours, especially for the effects on AA and EPA
oxylipins. Inter-individual variability within the study cohort likely
reduced the average efficacy reported in this human intervention
study [43]. Concerning the dose-response relationships, it should
be emphasized that the present data reveal different levels of
correlation between EPA and DHA with their corresponding
oxylipins. Indeed, the plasma levels of EPA oxylipins were strongly
and positively correlated with plasma EPA concentration as
previously shown in human [44]. This effect that was less
pronounced for DHA and its corresponding oxylipins when
considering the entire family of oxylipins. However, when looking
at the individual DHA-derived oxylipins, correlations were much
stronger with diol and alcohol species (i.e. 19,20-DiHDPA and 17-
HDoHE) which are actually produced both by enzymatic and
non-enzymatic pathways. Plasma DHA also showed strong
positive correlations with liver F4-NeuroP levels suggesting that
DHA was readily peroxidized. This is consistent with previous
findings in LDLR2/2 mice [33] exposed to LC n-3 PUFAs (34 mg
of EPA +23 mg of DHA/day/mice, i.e. ,3% daily energy intake)
for 12 weeks, which showed 5-fold and 3-fold increased F4-
NeuroPs levels in the liver and heart respectively. This suggests
that a proportion of DHA incorporated in tissue lipids is readily
peroxidized and F4-NeuroPs is likely to be a relevant biomarker of
this non-enzymatic oxidation pathway. In this study, we reported a
maximal liver F4-NeuroP increase of 11-fold with the highest dose
(35.5 mg/day/mice) DHA3 group vs. Control. These results
together with other studies [33] thus demonstrate that DHA
supplementation of atherosclerotic mice induces a dose-dependent
increase of F4-NeuroPs in peripheral tissues, and/or cell types that
accumulate DHA such as aorta [40] and immune cells [36].
F4-NeuroPs as a Major Predictive Variable ofAtherosclerosis Prevention
The analyses of the relationships between plaque extent and the
other variables measured using correlation analyses, hierarchical
cluster and PLS-DA indicated that among the ,131 variables
measured, the liver content of DHA-derived F4-NeuroPs was the
most negatively correlated variable with plaque extent. Moreover,
when a correlation strength filter was used for variable selection in
predictive model production, the F4-NeuroPs was one of just two
predictive variables needed to predict atherosclerosis prevention.
This strongly reinforces the initial hypothesis suggesting that
peroxidized metabolites of DHA could contribute to its ather-
oprotective effects and suggests that F4-NeuroPs could be relevant
candidates. However, it must be emphasized that these are
correlative associations, and causal linkage remains to be further
assessed. Moreover, it cannot be excluded that other lipid
mediators could have contributed to the reduction of atheroscle-
rosis. For instance, human atherosclerotic lesions have been shown
to over express 12- and 15-lipoxygenases [45] and DHA-
dependent impacts on cardiovascular disease are influenced by
the activity of these enzymes [46]. It should also be emphasized
that despite an absence of EPA intake, the current results revealed
that the levels of EPA and its corresponding oxylipins were
substantially increased by DHA supplementation. Moreover, the
level of 14,15-DiHETE, a stable metabolite of the EPA and a
cytochrome P450 product, showed a negative correlation with
plaque size. All together, these data suggest that F4-NeuroPs are
putative contributors of atherosclerosis prevention in coordination
with other lipid mediators.
The present study is to the best of our knowledge, the first one to
establish in vivo an inverse dose-dependent relationship between
the productions of DHA-derived peroxidized metabolites and
atherosclerosis development. Nevertheless, our results are consis-
tent with several lines of evidence demonstrated in vitro. Indeed,
the group of Sethi et al. [47] demonstrated that oxidized EPA and
DHA (obtained by ex-vivo oxidation of the native fatty acids with
CuSO4 and ascorbic acid) were able to reduce adhesion of U937
monocyte cells to endothelial cells and decrease the expression of
adhesion molecules whereas native EPA and DHA had no effect.
The bioactive oxygenated metabolites issued from EPA and DHA
were not identified but the authors clearly showed that the non-
enzymatic oxidation of EPA and DHA was a mandatory
prerequisite to make them bioactive on endothelial cells. The
reduction of adhesion molecules expression was achieved through
the inhibition of NFkB binding activity and was latter associated
with a PPARc dependent mechanism [48]. Equally, it has been
nicely shown that peroxidation of DHA was responsible for its
effects on transient outward current and steady-state outward
current in rat ventricular myocytes [49]. The group of Morrow
and Roberts, pioneers in the in vivo identification of IsoP/NeuroPs
[10,50] substantially contributed to this field of research by
demonstrating that cyclopentenone A4/J4-NeuroPs issued from
the peroxidation of DHA were anti-inflammatory mediators in the
RAW267.4 murine macrophage cell line [51]. Similar results were
reported recently with 15-A3t-IsoPs [52], a specific peroxidized
metabolite of EPA. These two studies confirmed the inhibition of
the NFkB pathway as a major mechanism of action of EPA and
DHA peroxidized metabolites. Finally, even though the in vivo
study published by Saraswathi et al. [33] did not investigate the
relationship between the production of F4-NeuroPs and athero-
sclerosis regression, the authors did speculate that the F4-NeuroPs
could play a role in the prevention of atherosclerosis. All together,
these results challenge the long standing paradigm suggesting that
peroxidized metabolites of PUFAs might only be cytotoxic
molecules.
In conclusion, the present study showed that supplementation
with DHA during atherogenesis is associated with the production
of an array of oxygenated metabolites in association with reduced
atherosclerosis progression. Among them, the F4-NeuroPs arising
from the peroxidation of DHA were found to be a new potentially
relevant biomarker of DHA exposure and one of the best
predictive variables of atherosclerosis prevention in the LDLR2/
2 mouse. Further investigations are needed to determine if F4-
Neuroprostanes can contribute to the anti-atherogenic effects of
DHA and decipher their molecular mechanisms of action. This
will help to elucidate novel interactions between lipid peroxidation
metabolites and atherosclerosis.
Lipid Mediators and Atherosclerosis Prevention
PLOS ONE | www.plosone.org 12 February 2014 | Volume 9 | Issue 2 | e89393

Supporting Information
File S1 Figure S1, Correlations between doses of DHAgiven to LDLR-/- mice and plasma levels of PUFA and ofAA, EPA, and DHA and their corresponding oxylipins.Figure S2, Correlations between plasma levels of EPA,and their corresponding specific oxylipins. Figure S3,Correlations between plasma levels of DHA, and theircorresponding specific oxylipins. Figure S4, Correla-tions between doses of DHA given to LDLR-/- mice andliver levels of PUFA and plasma levels of n-6 PUFA, n-3PUFA and DHA and their corresponding peroxidizedmetabolites. Figure S5, Partial least squares discrimi-nation analysis of dietary groups in LDLR-/- given bydaily oral gavages increasing doses of DHA. (A) Animals
eating each dietary mixture with complete data sets (n = 10/group)
were segregated by PLS analyses. (B) Group segregation was
driven by plasma (yellow triangle) and liver (orange triangle)
metabolites belonging to clusters C2, C3, and C4 as identified in
Figure 7. The plasma EPA metabolite, 17,18-dihydroxyeicosaote-
traenoic acid (17,18-DiHETE) and the liver DHA metabolite
group F4-neuroprostanes (F4-NeuroPs) were the most frequently
selected variables occurring in 80% and 60% of models,
respectively. Figure S6, Correlation between plasma F2-isoprostanes and 9-HETE levels. Figure S7, Correlationsbetween plasma oxylipins and plasma 9-HETE levels.
Table S1, Surrogates recoveries. Table S2, Oxylipinassay UPLC solvent gradient. Table S3, UPLC/MS-MSparameters of metabolites measured in plasma. TableS4, Concentrations of plasma* and liver{ triglycerides(TG) and total cholesterol (TC). Table S5, Changes insystolic and diastolic blood pressures (sBP and dBP),and heart rate (HR). Table S6, Plasma and liver levels ofmajor polyunsaturated fatty acids (PUFA). LDLR-/- mice
were given by daily oral gavages (20 weeks) either oleic acid rich
sunflower oil (Control group) or a mixture of oleic acid rich
sunflower oil and DHA rich tuna oil providing 0.1%, 1% or 2% of
energy as DHA (DHA1, DHA2, and DHA3 groups respectively).
Table S7, Plasma levels of PUFAs-derived oxylipins.LDLR-/- mice were given by daily oral gavages (20 weeks) either
oleic acid rich sunflower oil (Control group) or a mixture of oleic
acid rich sunflower oil and DHA rich tuna oil providing 0.1%, 1%
or 2% of energy as DHA (DHA1, DHA2, and DHA3 groups
respectively). Table S8, Thromboxane and prostaglandinstability through sample processing. Table S9, Fatty acidtriol stability through sample processing. Table S10,Fatty acid diol stability through sample processing.
(DOCX)
Acknowledgments
All authors were involved in the project and participated either to the
design of the study, the analysis of the biological samples or the
interpretation of the results. The authors acknowledge Christophe
Del’Homme, Anne Terisse-Lottier, Alexandre Teynie and Jean-Paul
Rigaudiere for their excellent assistance during the animal experiment.
We also thank Catherine Besson, Dominique Bayle and Severine Thien for
their important contribution during samples collection and the analyses of
biochemical biomarkers. We are also grateful to Charlotte Joly and
Georges Da Silva for their involvement in the analyses of lipid peroxidation
biomarkers and their dedication in the method developments. Finally,
thanks to Brigitte Laillet and Jean-Paul Rigaudiere for the fatty acid
analyses of liver samples and William Keyes for technical support in plasma
fatty acid analyses.
Author Contributions
Conceived and designed the experiments: CG BC AM. Performed the
experiments: CG JWN TD TLP JMG CD OB EPG. Analyzed the data:
CG JWN TD TLP AM BC. Contributed reagents/materials/analysis
tools: JWN TLP TD JMG CD OB EPG. Wrote the paper: CG JWN TD
AM BC.
References
1. Miles EA, Calder PC (2012) Influence of marine n-3 polyunsaturated fatty acids
on immune function and a systematic review of their effects on clinical outcomes
in rheumatoid arthritis. Br J Nutr 107 Suppl 2: S171–184.
2. Calder PC (2012) The role of marine omega-3 (n-3) fatty acids in inflammatory
processes, atherosclerosis and plaque stability. Mol Nutr Food Res 56: 1073–
1080.
3. Brown AL, Zhu X, Rong S, Shewale S, Seo J, et al. (2012) Omega-3 fatty acids
ameliorate atherosclerosis by favorably altering monocyte subsets and limiting
monocyte recruitment to aortic lesions. Arterioscler Thromb Vasc Biol 32:
2122–2130.
4. Erkkila AT, Lichtenstein AH, Mozaffarian D, Herrington DM (2004) Fish intake
is associated with a reduced progression of coronary artery atherosclerosis in
postmenopausal women with coronary artery disease. Am J Clin Nutr 80: 626–
632.
5. De Caterina R, Zampolli A (2001) n-3 fatty acids: antiatherosclerotic effects.
Lipids 36 Suppl: S69–78.
6. Serhan CN, Krishnamoorthy S, Recchiuti A, Chiang N (2011) Novel anti-
inflammatory–pro-resolving mediators and their receptors. Curr Top Med
Chem 11: 629–647.
7. Shearer GC, Harris WS, Pedersen TL, Newman JW (2010) Detection of omega-
3 oxylipins in human plasma and response to treatment with omega-3 acid ethyl
esters. J Lipid Res 51: 2074–2081.
8. Cosgrove JP, Church DF, Pryor WA (1987) The kinetics of the autoxidation of
polyunsaturated fatty acids. Lipids 22: 299–304.
9. Jahn U, Galano J, Durand T (2008) Beyond prostaglandins - Chemistry and
biology of cyclic oxygenated metabolites fromed by free-radical pathways from
polyunsaturated fatty acids. Angew Chem Int Ed 47: 5894–5955.
10. Roberts LJ 2nd, Montine TJ, Markesbery WR, Tapper AR, Hardy P, et al.
(1998) Formation of isoprostane-like compounds (neuroprostanes) in vivo from
docosahexaenoic acid. J Biol Chem 273: 13605–13612.
11. Milne GL, Yin H, Hardy KD, Davies SS, Roberts LJ 2nd (2011) Isoprostane
generation and function. Chem Rev 111: 5973–5996.
12. Stocker R, Keaney JF Jr (2005) New insights on oxidative stress in the artery
wall. J Thromb Haemost 3: 1825–1834.
13. Simopoulos AP, Leaf A, Salem N Jr (2000) Workshop statement on the
essentiality of and recommended dietary intakes for Omega-6 and Omega-3
fatty acids. Prostaglandins Leukot Essent Fatty Acids 63: 119–121.
14. Zampolli A, Bysted A, Leth T, Mortensen A, De Caterina R, et al. (2006)Contrasting effect of fish oil supplementation on the development of
atherosclerosis in murine models. Atherosclerosis 184: 78–85.
15. Nicoletti A, Kaveri S, Caligiuri G, Bariety J, Hansson GK (1998) Immuno-
globulin treatment reduces atherosclerosis in apo E knockout mice. J Clin Invest102: 910–918.
16. Mazur A, Remesy C, Gueux E, Levrat MA, Demigne C (1990) Effects of diets
rich in fermentable carbohydrates on plasma lipoprotein levels and on
lipoprotein catabolism in rats. J Nutr 120: 1037–1045.
17. Smedes F (1999) Determination of total lipid using non-chlorinated solvents.Analyst 124: 1711–1718.
18. Psychogios N, Hau DD, Peng J, Guo AC, Mandal R, et al. (2011) The human
serum metabolome. PLoS One 6: e16957.
19. Newman JW, Watanabe T, Hammock BD (2002) The simultaneous
quantification of cytochrome P450 dependent linoleate and arachidonatemetabolites in urine by HPLC-MS/MS. J Lipid Res 43: 1563–1578.
20. Newman JW, Kaysen GA, Hammock BD, Shearer GC (2007) Proteinuriaincreases oxylipid concentrations in VLDL and HDL but not LDL particles in
the rat. J Lipid Res 48: 1792–1800.
21. Shearer GC, Newman JW (2008) Lipoprotein lipase releases esterified oxylipinsfrom very low-density lipoproteins. Prostaglandins Leukot Essent Fatty Acids 79:
215–222.
22. Perera SK, Fedor LR (1979) Acid-catalyzed and base-catalyzed dehydration of
prostaglandin-e2 to prostaglandin-a2 and general-base-catalyzed isomerizationof prostaglandin-a2 to prostaglandin-b2. Journal of the American Chemical
Society 101: 7390–7393.
23. Gladine C, Roy NC, Rigaudiere JP, Laillet B, Da Silva G, et al. (2011)
Increasing intake of long-chain n-3 PUFA enhances lipoperoxidation andmodulates hepatic gene expression in a dose-dependent manner. Br J Nutr: 1–
20.
24. Musiek ES, Cha JK, Yin H, Zackert WE, Terry ES, et al. (2004) Quantification
of F-ring isoprostane-like compounds (F4-neuroprostanes) derived from
Lipid Mediators and Atherosclerosis Prevention
PLOS ONE | www.plosone.org 13 February 2014 | Volume 9 | Issue 2 | e89393

docosahexaenoic acid in vivo in humans by a stable isotope dilution mass
spectrometric assay. J Chromatogr B Analyt Technol Biomed Life Sci 799: 95–102.
25. Zhao Z, Hjelm NM, Lam CW, Ho CS (2001) One-step solid-phase extraction
procedure for F(2)-isoprostanes. Clin Chem 47: 1306–1308.26. Oger C, Brinkmann Y, Bouazzaoui S, Durand T, Galano JM (2008)
Stereocontrolled access to isoprostanes via a bicyclo[3.3.0]octene framework.Org Lett 10: 5087–5090.
27. Oger C, Bultel-Ponce V, Guy A, Balas L, Rossi JC, et al. (2010) The handy use
of Brown’s P2-Ni catalyst for a skipped diyne deuteration: application to thesynthesis of a [D4]-labeled F4t-neuroprostane. Chemistry 16: 13976–13980.
28. van den Berg RA, Hoefsloot HC, Westerhuis JA, Smilde AK, van der Werf MJ(2006) Centering, scaling, and transformations: improving the biological
information content of metabolomics data. BMC Genomics 7: 142.29. Qu L, Li L, Zhang Y, Hu J (2009) PPCA-Based Missing Data Imputation for
Traffic Flow Volume: A Systematical Approach. IEEE Transactions on
intelligent transportation systems 10: 512–521.30. Wang C, Wang W (2006) Links between PPCA and subspace methods for
complete Gaussian density estimation. IEEE Trans Neural Netw 17: 789–792.31. Box GEP, Cox DR (1964) An analysis of transformations. Journal of the Royal
Statisistical Society 26: 211–252.
32. Grapov D, Newman JW (2012) imDEV: a Graphical User Interface to RMultivariate Analysis Tools in Microsoft Excel. Bioinformatics.
33. Saraswathi V, Gao L, Morrow JD, Chait A, Niswender KD, et al. (2007) Fish oilincreases cholesterol storage in white adipose tissue with concomitant decreases
in inflammation, hepatic steatosis, and atherosclerosis in mice. J Nutr 137: 1776–1782.
34. Matsumoto M, Sata M, Fukuda D, Tanaka K, Soma M, et al. (2008) Orally
administered eicosapentaenoic acid reduces and stabilizes atherosclerotic lesionsin ApoE-deficient mice. Atherosclerosis 197: 524–533.
35. Nakajima K, Yamashita T, Kita T, Takeda M, Sasaki N, et al. (2011) Orallyadministered eicosapentaenoic acid induces rapid regression of atherosclerosis
via modulating the phenotype of dendritic cells in LDL receptor-deficient mice.
Arterioscler Thromb Vasc Biol 31: 1963–1972.36. Wang S, Wu D, Matthan NR, Lamon-Fava S, Lecker JL, et al. (2009) Reduction
in dietary omega-6 polyunsaturated fatty acids: eicosapentaenoic acid plusdocosahexaenoic acid ratio minimizes atherosclerotic lesion formation and
inflammatory response in the LDL receptor null mouse. Atherosclerosis 204:147–155.
37. Mozaffarian D, Rimm EB (2006) Fish intake, contaminants, and human health:
evaluating the risks and the benefits. JAMA 296: 1885–1899.38. Brossard N, Croset M, Pachiaudi C, Riou JP, Tayot JL, et al. (1996)
Retroconversion and metabolism of [13C]22: 6n-3 in humans and rats afterintake of a single dose of [13C]22: 6n-3-triacylglycerols. Am J Clin Nutr 64:
577–586.
39. Saito M, Ueno M, Kubo K, Yamaguchi M (1998) Dose-Response Effect of
Dietary Docosahexaenoic Acid on Fatty Acid Profiles of Serum and Tissue
Lipids in Rats. J Agric Food Chem 46: 184–193.
40. Adan Y, Shibata K, Sato M, Ikeda I, Imaizumi K (1999) Effects of
docosahexaenoic and eicosapentaenoic acid on lipid metabolism, eicosanoid
production, platelet aggregation and atherosclerosis in hypercholesterolemic
rats. Biosci Biotechnol Biochem 63: 111–119.
41. Vila L (2004) Cyclooxygenase and 5-lipoxygenase pathways in the vessel wall:
role in atherosclerosis. Med Res Rev 24: 399–424.
42. Ulu A, Davis BB, Tsai HJ, Kim IH, Morisseau C, et al. (2008) Soluble epoxide
hydrolase inhibitors reduce the development of atherosclerosis in apolipoprotein
e-knockout mouse model. J Cardiovasc Pharmacol 52: 314–323.
43. Keenan AH, Pedersen TL, Fillaus K, Larson MK, Shearer GC, et al. (2012)
Basal omega-3 fatty acid status affects fatty acid and oxylipin responses to high-
dose n3-HUFA in healthy volunteers. J Lipid Res 53: 1662–1669.
44. Schuchardt JP, Schmidt S, Kressel G, Dong H, Willenberg I, et al. (2013)
Comparison of free serum oxylipin concentrations in hyper- vs. normolipidemic
men. Prostaglandins Leukot Essent Fatty Acids 89: 19–29.
45. Gertow K, Nobili E, Folkersen L, Newman JW, Pedersen TL, et al. (2011) 12-
and 15-lipoxygenases in human carotid atherosclerotic lesions: associations with
cerebrovascular symptoms. Atherosclerosis 215: 411–416.
46. Stephensen CB, Armstrong P, Newman JW, Pedersen TL, Legault J, et al.
(2011) ALOX5 gene variants affect eicosanoid production and response to fish
oil supplementation. J Lipid Res 52: 991–1003.
47. Sethi S, Eastman AY, Eaton JW (1996) Inhibition of phagocyte-endothelium
interactions by oxidized fatty acids: a natural anti-inflammatory mechanism?
J Lab Clin Med 128: 27–38.
48. Sethi S, Ziouzenkova O, Ni H, Wagner DD, Plutzky J, et al. (2002) Oxidized
omega-3 fatty acids in fish oil inhibit leukocyte-endothelial interactions through
activation of PPAR alpha. Blood 100: 1340–1346.
49. Jude S, Bedut S, Roger S, Pinault M, Champeroux P, et al. (2003) Peroxidation
of docosahexaenoic acid is responsible for its effects on I TO and I SS in rat
ventricular myocytes. Br J Pharmacol 139: 816–822.
50. Brooks JD, Milne GL, Yin H, Sanchez SC, Porter NA, et al. (2008) Formation of
highly reactive cyclopentenone isoprostane compounds (A3/J3-isoprostanes)
in vivo from eicosapentaenoic acid. J Biol Chem 283: 12043–12055.
51. Musiek ES, Brooks JD, Joo M, Brunoldi E, Porta A, et al. (2008) Electrophilic
cyclopentenone neuroprostanes are anti-inflammatory mediators formed from
the peroxidation of the omega-3 polyunsaturated fatty acid docosahexaenoic
acid. J Biol Chem 283: 19927–19935.
52. Brooks JD, Musiek ES, Koestner TR, Stankowski JN, Howard JR, et al. (2011)
The fatty acid oxidation product 15-A3t-isoprostane is a potent inhibitor of
NFkappaB transcription and macrophage transformation. J Neurochem 119:
604–616.
Lipid Mediators and Atherosclerosis Prevention
PLOS ONE | www.plosone.org 14 February 2014 | Volume 9 | Issue 2 | e89393

1
Table S1. Surrogates recoveries
Compound Recoveries
(%) Methylation Efficiency
15:1n5 80.4 ± 12%
Extraction and GC-MS Analysis Surrogates
d31-16:0-TG 75.1 ± 17% d35-18:0-PC 75.1 ± 15% 22:1n9-CE 75.5 ± 17%
22:3n3 75.5 ± 13%
Hydrolysis Control, SPE Isolation & LC-MS/MS Analysis Surrogates
d4-6-keto-PGF1a 62.1 ± 6.2 d4-TXB2 ND d4-PGF2a 55.1 ± 6.9 d4-PGD2 ND d3-LTE4 ND d4-LTB4 87.5 ± 13
d11-14,15-DiHETrE 91.2 ± 12
d6-20-HETE 48.7 ± 15 d4-9-HODE 75.1 ± 13 d8-12-HETE 59.1 ± 8.9 d8-5-HETE 90.8 ± 24
d4-12(13)-EpOME 35.4 ± 10
1
Table S2. Oxylipin assay UPLC solvent gradient
Time (min) Solvent A (%)
0 75 1 60
2.5 58 4.5 50 10.5 35 12.5 25 14 15
14.5 5 15 75 16 75
Solvent A = 0.1% acetic acid
Solvent B = 90:10 v/v acetonitrile/isopropanaol

1
Table S3. UPLC/MS-MS parameters of metabolites measured in plasma
Compound tR (min)
Acquisition Period
Precursor (m/z)
Product (m/z)
Dwell Time (msec)
DCP (V)
CE (V)
IS/ Surrogate IDLa (nM)
PHAU 3.34 1 249.2 130.1 10 -45 -20 IS
20-carboxy-LTB4 3.58 1 365.3 347.2 10 -70 -25 d4 6-keto PGF1a 3.54 Resolvin E1 3.71 1 349.3 195.2 50 -70 -25 d4 6-keto PGF1a 0.195
6-keto-PGF1a 3.71 1 369.3 163.1 10 -70 -40 d4 6-keto PGF1a 0.692 d4 6-keto PGF1a 3.71 1 373.3 167.1 10 -60 -40 PHAU IS
20-hydroxy-LTB4 3.8 1 351.3 195.2 10 -65 -25 d4 6-keto PGF1a 0.58 PGE3 4.53 2 349.3 269.2 10 -45 -22 d4-PGD2a ---
d4-TXB2 4.52 2 373.3 173.1 10 -50 -25 PHAU IS, --- TXB2 4.54 2 369.3 169.1 10 -50 -25 d4-TXB2 ---
9,12,13-TriHOME 5 2 329.2 211.2 10 -70 -32 d4-PGF2a 0.704 d4-PGF2a 5.06 2 357.3 197.2 10 -65 -35 PHAU IS
PGF2a / F2-IsoPs 5.07 2 353.3 193.2 10 -65 -35 d4-PGF2a 0.749 9,10,13-TriHOME 5.11 2 329.2 171.1 10 -70 -30 d4-PGF2a 0.903
PGE2 5.28 2 351.3 271.2 10 -35 -25 d4-PGD2a --- PGE1 5.36 2 353.3 317.2 10 -50 -22 d4-PGD2a ---
d4-PGD2 5.49 2 355.3 275.2 10 -45 -26 PHAU IS, --- PGD2 5.62 2 351.3 271.2 10 -35 -25 d4-PGD2a ---
Resolvin D1 6.12 3 375.3 121.1 50 -50 -40 d4-PGF2a 0.301 11,12,15 THET 6.03 3 353.3 167.1 50 -60 -30 d4-PGF2a 0.0848
Lipoxin A4 6.22 3 351.3 217.2 50 -50 -26 d4-PGF2a 0.335 a IDL = Lowest detectable level in plasma nM equivalents; Alkali unstable (---); uncalibrated data collection (UnCal); Internal Standards (IS)

2
Table S3. UPLC/MS-MS parameters of metabolites measured in plasma (continued)
Compound tR (min)
Acquisition Period
Precursor (m/z)
Product (m/z)
Dwell Time (msec)
DCP (V)
CE (V)
IS/ Surrogate IDLa (nM)
PGJ2/ δ 12-PGJ2 7.13 4 333.2 233.2 5 -52 -14 d4-PGF2a --- PGB2 7.11 4 333.3 235.2/175.1 5 -74 -28 d4-PGF2a --- LTB5 7.35 4 333.3 195.2 5 -70 -20 d4-PGF2a 0.505
DiHETHF 7.41 4 353.3 127.1 30 -55 -35 d11-14,15-DiHETrE --- 15,16-DiHODE 7.69 5 311.2 235.2 10 -65 -22 d11-14,15-DiHETrE 1.68 12,13-DiHODE 7.79 5 311.2 183.2 10 -70 -30 d11-14,15-DiHETrE 1.69 8,15-DiHETE 7.8 5 335.3 235.2 10 -65 -22 d11-14,15-DiHETrE 0.994 Hepoxilin A3 7.81 5 335.2 171.1 50 -85 -20 d11-14,15-DiHETrE --- 9,10-DiHODE 7.83 5 311.2 201.2 10 -65 -30 d11-14,15-DiHETrE 1.42
d3-LTE4 7.88 5 441.4 336.3 50 -80 -30 CUDA IS, --- LTE4 7.91 5 438.4 333.3 50 -60 -25 d3-LTE4 ---
17,18-DiHETE 8.08 5 335.3 247.2 10 -60 -25 d11-14,15-DiHETrE 0.377 5,15-DiHETE 8.15 5 335.3 173.1 10 -45 -21 d11-14,15-DiHETrE 0.304 6-trans-LTB4 8.26 5 335.3 195.2 20 -70 -21 d4-LTB4 0.601
14,15-DiHETE 8.42 5 335.3 207.2 10 -55 -25 d11-14,15-DiHETrE 0.322 CUDA 8.47 5 339.4 214.2 10 -65 -35 IS
d4-LTB4 8.49 5 339.3 163.1 20 -70 -38 CUDA IS LTB4 8.6 5 335.3 195.2 10 -70 -21 d4-LTB4 0.654
12,13-DiHOME 8.81 6 313.3 183.2 5 -70 -30 d11-14,15-DiHETrE 1.69 10,11-DHHep 8.9 6 301.2 283.2 10 -70 -30 CUDA IS 9,10-DiHOME 9.23 6 313.3 201.2 5 -70 -30 d11-14,15-DiHETrE 1.01
d11-14,15-DiHETrE 9.39 6 348.4 207.2 10 -64 -28 CUDA IS LTD4 9.41 6 495.45 177.1 50 -70 -25 d3-LTE4 ---
a IDL = Lowest detectable level in plasma nM equivalents; Alkali unstable (---); uncalibrated data collection (UnCal); Internal Standards (IS)

3
Table S3. UPLC/MS-MS parameters of metabolites measured in plasma (continued)
Compound tR (min)
Acquisition Period
Precursor (m/z)
Product (m/z)
Dwell Time (msec)
DCP (V)
CE (V)
IS/ Surrogate IDLa (nM)
19,20-DiHDoPE 9.44 6 361.3 273.2 10 -74 -24 d11-14,15-DiHETrE 1.22 14,15-DiHETrE 9.48 6 337.3 207.2 10 -65 -25 d11-14,15-DiHETrE 0.737 11,12-DiHETrE 10.06 7 337.3 167.1 10 -60 -27 d11-14,15-DiHETrE 0.753
9-HOTE 10.32 7 293.2 171.1 10 -65 -22 d4-9-HODE 0.245 12(13)-Ep-9-KODE 10.33 7 309.2 291.2 10 -65 -20 d4-9-HODE 0.261
13-HOTE 10.44 7 293.2 195.2 10 -65 -25 d4-9-HODE 0.416 8,9-DiHETrE 10.61 7 337.3 127.1 10 -55 -30 d11-14,15-DiHETrE 0.659
15-deoxy PGJ2 10.68 7 315.2 271.2 10 -60 -20 d11-14,15-DiHETrE 0.211 d6-20-HETE 10.86 7 325.3 281.2 10 -70 -25 CUDA IS
15-HEPE 10.88 7 317.2 219.2 10 -60 -20 d8-12-HETE 1.79 20-HETE 10.91 7 319.2 275.2 10 -65 -24 d6-20-HETE 1.22 12-HEPE 11.23 7 317.2 179.1 10 -60 -20 d8-12-HETE 1.83
5,6-DiHETrE 11.38 7 337.3 145.1 10 -70 -25 d11-14,15-DiHETrE 0.633 13-HODE 11.84 8 295.2 195.2 30 -65 -25 d4-9-HODE 3.43 5-HEPE 11.84 8 317.2 115.1 10 -60 -20 d8-5-HETE 1.19
d4-9-HODE 11.89 8 299.2 172.1 10 -70 -26 CUDA IS 9-HODE 11.95 8 295.2 171.1 10 -60 -25 d4-9-HODE 2.17
15(16)-EpODE 12.02 8 293.2 275.2 50 -60 -20 d4-12(13)-EpOME 0.505 17(18)-EpETE 12.11 8 317.2 259.2 30 -55 -15 d4-12(13)-EpOME 0.688
15-HETE 12.13 8 319.2 219.2 50 -70 -16 d8-12-HETE 0.313 13-KODE 12.21 8 293.2 179.1 10 -70 -26 d4-9-HODE 0.554 15-HpETE 12.21 8 335.2 113.1 10 -58 -20 d8-12-HETE UnCal
9(10)-EpODE 12.22 8 293.2 275.2 10 -60 -20 d4-12(13)-EpOME 0.164 17-HDoHE 12.22 8 343.3 281.2 10 -45 -20 d8-12-HETE 0.871 13-HpODE 12.41 8 311.2 179.1 10 -40 -20 d4-9-HODE UnCal
a IDL = Lowest detectable level in plasma nM equivalents; Alkali unstable (---); uncalibrated data collection (UnCal); Internal Standards (IS)

4
Table S3. UPLC/MS-MS parameters of metabolites measured in plasma (continued)
Compound tR (min)
Acquisition Period
Precursor (m/z)
Product (m/z)
Dwell Time (msec)
DCP (V)
CE (V)
IS/ Surrogate IDLa (nM)
12(13)-EpODE 12.42 8 293.2 183.2 10 -60 -25 d4-12(13)-EpOME 0.373 15-KETE 12.48 8 317.2 273.2 10 -65 -20 d8-12-HETE 4.98 11-HETE 12.57 8 319.2 167.1 30 -55 -15 d8-12-HETE 1.08
14(15)-EpETE 12.59 8 317.2 247.2 30 -45 -15 d4-12(13)-EpOME 0.493 9-KODE 12.66 8 293.2 185.2 10 -70 -30 d4-9-HODE 3.74
d8-12-HETE 12.71 8 327.2 184.2 10 -60 -21 CUDA IS 9-HpODE 12.79 8 311.2 185.2 10 -40 -20 d4-9-HODE UnCal 12-HETE 12.82 8 319.2 179.1 10 -60 -21 d8-12-HETE 2.01 8-HETE 12.96 8 319.2 155.1 10 -55 -21 d8-12-HETE 1.94
12-HpETE 12.98 8 335.2 153.1 10 -58 -20 d8-12-HETE UnCal 15-HETrE 13.02 8 321.2 221.2 10 -65 -24 d8-12-HETE 0.712 12-KETE 13.07 8 317.2 273.2 10 -65 -20 d8-12-HETE UnCal 9-HETE 13.16 8 319.2 167.1 30 -55 -15 d8-12-HETE 1.94
d8-5-HETE 13.4 8 327.2 116.1 10 -55 -22 CUDA IS 19(20)-EpDoPE 13.46 8 343.3 281.2 10 -45 -20 d4-12(13)-EpOME 1.67
5-HETE 13.5 8 319.2 257.2 / 115.1 10 -50 -20 d8-5-HETE 1.78 d4-12(13)-EpOME 13.57 8 299.2 198.1 10 -65 -25 CUDA IS
12(13)-EpOME 13.65 8 295.2 195.1 10 -65 -25 d4-12(13)-EpOME 0.375 14(15)-EpETrE 13.73 8 319.2 219.2 10 -70 -16 d4-12(13)-EpOME 4.61 16(17)-EpDoPE 13.84 8 343.5 273.5 30 -55 -15 d4-12(13)-EpOME 1.4 9(10)-EpOME 13.88 8 295.2 171.1 10 -60 -25 d4-12(13)-EpOME 0.359
5-HpETE 14.06 8 335.2 155.1 10 -58 -20 d8-12-HETE UnCal 5-KETE 14.16 8 317.2 203.2 50 -70 -25 d8-5-HETE 0.433
11(12)-EpETrE 14.2 8 319.2 167.1 30 -55 -15 d4-12(13)-EpOME 3.91 8(9)-EpETrE 14.4 8 319.2 155.1/ 167.1 10 -55 -15 d4-12(13)-EpOME 4.54
a IDL = Lowest detectable level in plasma nM equivalents; Alkali unstable (---); uncalibrated data collection (UnCal); Internal Standards (IS)

5
Table S4. Concentrations of plasma* and liver† triglycerides (TG) and total cholesterol (TC).
Lipid Parameters Control DHA1 DHA2 DHA3 P value
Plasma TG (mM) 1.11 ± 0.12 a 1.10 ± 0.12 ab 0.84 ± 0.09 ab 0.70 ± 0.07 b 0.015
Plasma TC (mM) 13.20 ± 0.54 ab 13.85 ± 0.47 a 11.16 ± 0.56 bc 9.45 ± 0.30 c <0.001
Liver TG (µg/mg) 102.62 ± 14.63 a 91.09 ± 11.53 a 55.18 ± 5.10 ab 45.61 ± 6.60 b 0.002
Liver TC (µg/mg) 7.15 ± 0.60 a 7.98 ± 0.57 a 5.21 ± 0.49 ab 3.80 ± 0.20 b <0.001
All data are represented as mean ± SEM, *: n=30/group for plasma TG and TC; † n=10/group for liver TG and TC. a,b,c Mean values with unlike letters were significantly different (p < 0.05).

6
Table S5. Changes in systolic and diastolic blood pressures (sBP and dBP), and heart rate (HR).
Control DHA1 DHA2 DHA3 P value*
Before After Before After Before After Before After
Change in sBP (mmHg) 98 ± 2 97 ± 2 a 100 ± 3 99 ± 2 a 99 ± 2 96 ± 2 a 101 ± 2 85 ± 2 b 0.002
Change in dBP (mmHg) 67 ± 2 72 ± 2 68 ± 4 73 ± 2 66 ± 2 72± 1 67 ± 3 62 ± 2 0.181
Change in HR (bpm) 551 ± 10 642 ± 9 560 ± 8 654 ± 8 558 ± 11 639 ± 9 543 ± 6 628 ± 10 0.965
All data are represented as mean ± SEM, n=12/group. *: p value of the ANOVA realized on changes between the beginning and the end of the experimental period. a,b Mean values with unlike letters were significantly different (p < 0.05).

7
Table S6. Plasma and liver levels of major polyunsaturated fatty acids (PUFA). LDLR-/- mice were given by
daily oral gavages (20 weeks) either oleic acid rich sunflower oil (Control group) or a mixture of oleic acid rich
sunflower oil and DHA rich tuna oil providing 0.1%, 1% or 2% of energy as DHA (DHA1, DHA2, and DHA3
groups respectively).
Control DHA1 DHA2 DHA3 P value
Plasma PUFA (% total FA)
18:2 n-6 10.79 ± 0.18 a 11.22 ± 0.36 ac 12.99 ± 0.30 bc 12.44 ± 0.16 c <0.001
18:3 n-3 0.16 ± 0.01 a 0.22 ± 0.01 b 0.25 ± 0.01 bc 0.26 ± 0.01 c <0.001
20:4 n-6 (AA) 15.84 ± 0.68 a 10.35 ± 0.62 ab 5.05 ± 0.23 bc 4.21 ± 0.11 c <0.001
20:5 n-3 (EPA) 0.30 ± 0.02 a 0.86 ± 0.08 ab 5.08 ± 0.40 bc 7.03 ± 0.36 c <0.001
22:6 n-3 (DHA) 3.57 ± 0.10 a 5.35 ± 0.30 ab 9.28 ± 0.51 bc 11.56 ± 0.75 c <0.001
Liver PUFA(% total FA)
18:2 n-6 7.29 ± 0.42 a 8.28 ± 0.41 ab 9.52 ± 0.50 bc 10.39 ± 0.42 c <0.001
18:3 n-3 0.33 ± 0.03 0.39 ± 0.04 0.38 ± 0.04 0.37 ± 0.05 ns

8
20:4 n-6 (AA) 3.09 ± 0.37 3.19 ± 0.71 1.98 ± 0.19 2.37 ± 0.28 ns
20:5 n-3 (EPA) 0.06 ± 0.01 a 0.27 ± 0.05 ab 1.83 ± 0.24 bc 2.94 ± 0.18 c <0.001
22:6 n-3 (DHA) 1.06 ± 0.17 a 2.23 ± 0.57 ab 5.37 ± 0.82 bc 8.97 ± 1.01 c <0.001
All data are represented as mean ± SEM, n=10/group. a,b,c Mean values with unlike letters were significantly different (p < 0.05).

9
Table S7. Plasma levels of PUFAs-derived oxylipins. LDLR-/- mice were given by daily oral gavages (20 weeks) either oleic acid rich
sunflower oil (Control group) or a mixture of oleic acid rich sunflower oil and DHA rich tuna oil providing 0.1%, 1% or 2% of energy as
DHA (DHA1, DHA2, and DHA3 groups respectively).
Control DHA1 DHA2 DHA3 P value
Plasma oxylipins (nM)
20:4 n-6 Epoxides 1761.20 ± 280.00 a 2230.11 ± 494.61 ab 762.87 ± 124.97 bc 694.79 ± 105.79 c <0.001
14(15)-EpETrE 783.00 ± 150.26 1123.97 ± 278.67 376.41 ± 69.31 372.99 ± 69.43 0.018
11(12)-EpETrE 751.40 ± 107.89 a 860.78 ± 172.11 a 302.14 ± 46.04 b 245.00 ± 30.74 b <0.001
8(9)-EpETrE 226.80 ± 24.46 a 245.67 ± 46.09 a 84.32 ± 11.69 b 76.80 ± 7.98 b <0.001
20:4 n-6 Diols 69.17 ± 3.48 a 62.05 ± 3.32 a 29.33 ± 4.70 b 23.16 ± 1.89 b <0.001
14,15-DiHETrE 1.62 ± 0.09 a 1.05 ± 0.07 ab 0.55 ± 0.04 bc 0.52 ± 0.03 c <0.001
11,12- DiHETrE 1.93 ± 0.10 a 1.30 ± 0.11 ab 0.70 ± 0.06 bc 0.56 ± 0.04 c <0.001
8,9- DiHETrE 6.69 ± 0.44 a 5.22 ± 0.47 ab 2.66 ± 0.22 bc 1.79 ± 0.14 c <0.001
5,6-DiHETrE 58.93 ± 3.55 a 54.48 ± 2.82 ab 25.43 ± 4.43 bc 20.29 ± 1.75 c <0.001

10
20:4 n-6 Alcohols 543.15 ± 72.52 a 457.30 ± 78.81 a 185.34 ± 17.30 b 165.04 ± 19.12 b <0.001
20-HETE 56.84 ± 4.23 a 39.58 ± 4.51 a 18.06 ± 2.79 b 12.29 ± 1.00 b <0.001
15- HETE 57.60 ± 7.65 a 42.18 ± 5.51 a 14.73 ± 2.24 b 10.33 ± 2.43 b <0.001
12- HETE 139.58 ± 42.36 162.04 ± 55.60 51.73 ± 8.81 66.94 ± 15.01 0.208
11- HETE 40.20 ± 4.21 a 30.67 ± 3.58 a 14.04 ± 1.30 b 10.98 ± 1.77 b <0.001
8-HETE 51.63 ± 4.25 a 38.58 ± 3.54 ab 16.53 ± 2.18 bc 10.80 ± 1.53 c <0.001
9- HETE 41.40 ± 4.71 a 31.11 ± 4.25 ab 17.43 ± 1.13 bc 15.22 ± 1.84 c <0.001
5- HETE 155.90 ± 13.91 a 113.14 ± 10.37 ab 52.82 ± 5.21 bc 38.48 ± 3.86 c <0.001
20:5 n-3 Epoxides 44.15 ± 8.81 a 253.83 ± 67.56 ab 782.00 ± 112.46 bc 1149.90 ± 187.19 c <0.001
17(18)-EpETE 25.99 ± 5.47 a 144.88 ± 36.74 ab 466.40 ± 65.88 bc 677.00 ± 107.74 c <0.001
14(15)-EpETE 18.15 ± 3.39 a 108.96 ± 30.90 ab 315.60 ± 47.09 bc 472.90 ± 80.04 c <0.001
20:5 n-3 Diols 4.09 ± 0.37 a 5.56 ± 0.49 ab 17.06 ± 0.86 bc 22.76 ± 1.55 c <0.001
17,18-DiHETE 2.68 ± 0.24 a 3.78 ± 0.46 ab 12.38 ± 0.65 bc 17.51 ± 1.29 c <0.001
14,15-DiHETE 1.42 ± 0.16 a 1.78 ± 0.18 a 4.68 ± 0.32 b 5.25 ± 0.39 b <0.001
20:5 n-3 Alcohols 11.25 ± 1.87 a 26.50 ± 5.13 ab 118.15 ± 13.40 bc 188.01 ± 17.28 c <0.001
15-HEPE 1.10 ± 0.20 a 2.88 ± 0.57 a 11.63 ± 1.52 b 13.43 ± 1.37 b <0.001

11
12-HEPE 6.07 ± 1.51 a 15.75 ± 3.83 ab 66.61 ± 10.98 bc 136.27 ± 17.76 c <0.001
5-HEPE 4.08 ± 0.62 a 7.86 ± 1.14 a 39.91 ± 4.82 b 38.31 ± 4.55 b <0.001
22:6 n-3 Epoxides 904.94 ± 129.08 a 2129.44 ± 433.65 ab 2030.90 ± 264.35 ab 2796.80 ± 363.25 b 0.002
19(20)-EpDPE 678.70 ± 100.07 a 1564.44 ± 293.96 a 1452.30 ± 199.17 a 2041.90 ± 240.45 b 0.002
16(17)-EpDPE 226.24 ± 31.23 a 565.00 ± 140.51 a 578.60 ± 75.60 b 754.90 ± 125.58 b 0.004
22:6 n-3 Diol (19,20-DiHDPA) 5.77 ± 0.33 a 9.24 ± 0.72 ab 13.73 ± 0.66 bc 16.85 ± 0.96 c <0.001
22:6 n-3 Alcohol (17-HDoHE) 21.48 ± 2.74 a 37.80 ± 5.46 a 58.91 ± 5.17 b 69.55 ± 6.45 b <0.001
20:3 n-6-Derived oxylipins 5.96 ± 2 a 6.73 ± 1.5 a 4.2 ± 1.6 ab 3.59 ± 1.6 b <0.001
18:2 n-6-Derived oxylipins
12(13)-EpOME 283 ± 110 453 ± 260 378 ± 140 321 ± 110 ns
9(10)-EpOME 285 ± 110 435 ± 230 373 ± 150 301 ± 97 ns
12,13-DiHOME 4.11 ± 0.77 3.94 ± 1.1 3.43 ± 0.93 3.71 ± 0.49 ns
9,10-DiHOME 33.4 ± 5.7 a 30.6 ± 7.2 a 23.6 ± 4.3 b 21.8 ± 4.5 b <0.001
13-HODE 344 ± 98 400 ± 140 337 ± 73 324 ± 110 ns
9-HODE 71.4 ± 19 73.6 ± 21 72.1 ± 13 62.5 ± 24 ns
18:3 n-3-Derived oxylipins

12
15(16)-EpODE 30.4 ± 11 54.6 ± 30 44.8 ± 20 37.3 ± 16 ns
12(13)-EpODE 3.04 ± 0.95 6.73 ± 4 5.62 ± 2.6 5.47 ± 1.9 <0.05
9(10)-EpODE 21.7 ± 11 41.6 ± 23 33.6 ± 13 28.6 ± 13 ns
9-HOTE 2.05 ± 0.69 2.27 ± 0.82 2.2 ± 0.57 1.89 ± 0.51 ns
13-HOTE 3.78 ± 1.6 3.61 ± 1.3 3.6 ± 1 4.06 ± 1 ns
All data are represented as mean ± SEM, n=10/group. a,b,c Mean values with unlike letters were significantly different (p < 0.05).

1
Table S8: Thromboxane and prostaglandin stability through sample processing a
Hydrolysis + SPE SPE Standards SSTD
TXB2 b 24.5 ± 6.4 % 101 ± 1.5 % 101 ± 0.77 % d4-TXB2
6-keto PGF1a 101 ± 0.92 % 102 ± 1.2 % 102 ± 0.61 % d4-6-keto PGF1a
PGE1 b ND 106 ± 3.6 % 101 ± 0.53 % d4-PGD2
PGE2 b ND 103 ± 1.6 % 99.5 ± 2 % “”
PGE3 b ND 100 ± 2.9 % 101 ± 0.92 % “”
PGD2 b ND 101 ± 1.6 % 99.2 ± 0.31 % “”
15-deoxy PGJ2 b ND 115 ± 6.2 % 96.1 ± 0.4 % “”
PGJ2/ δ 12-PGJ2 b ND 96.1 ± 2.7 % 98 ± 0.5 % “”
PGF2a / F2-IsoP 108 ± 0.81 % 105 ± 1.1 % 105 ± 1.1 % d4-PGF2a
a - A high level calibration standard was subjected to solid phase extraction with or without prior
exposure to base hydrolysis procedures and compared to triplicate analyses of calibration standards.
Results are means ± SD relative to theoretical concentrations with adjustment for surrogate recoveries.
b - As previously reported, the thromboxanes and beta-hydroxy-keto prostanoids are unstable under
alkali conditions.

1
Table S9: Fatty acid triol stability through sample processing a
Hydrolysis + SPE SPE Standards SSTD
20-hydroxy-LTB4 95.4 ± 1.3 % 93.8 ± 1.5 % 100 ± 0.93 % d4 6-keto PGF1a
9,12,13-TriHOME 116 ± 3.5 % 112 ± 3.9 % 98.7 ± 1.1 % d4-6-keto PGF1a
9,10,13-TriHOME 122 ± 1.7 % 119 ± 8 % 102 ± 2.7 % d4-6-keto PGF1a
11,12,15-THET 106 ± 2.5 % 92.6 ± 1.4 % 101 ± 1.3 % d4-PGF2a
Resolvin E1 92.1 ± 2.4 % 90.7 ± 0.28 % 101 ± 0.58 % d4-6-keto PGF1a
Resolvin D1 b 74.3 ± 7.4 % 52.5 ± 1.8 % 103 ± 1.2 % d4-PGF2a
Lipoxin A4 b 78.8 ± 2.9 % 61.5 ± 2 % 104 ± 1.3 % d4-PGF2a
a - A high level calibration standard was subjected to solid phase extraction with or without prior
exposure to base hydrolysis procedures and compared to triplicate analyses of calibration standards.
Results are means ± SD relative to theoretical concentrations with adjustment for surrogate recoveries.
b - Poor analyte recoveries suggest a reduced accuracy in results for these analytes using the current
surrogate spiking/tagging regimen. However, high precision suggests that treatment effects within the
study cohort should be robustly detectable.

6
Table S10: Fatty acid diol stability through sample processing a
Hydrolysis + SPE SPE Standards SSTD
20-carboxy-LTB4 82.2 ± 1.6 % 73.3 ± 1.4 % 97.4 ± 1.3 % d4 6-keto PGF1a
LTB4 92.8 ± 6.4 % 97.7 ± 13 % 92.2 ± 4.3 % d4-LTB4
6-trans-LTB4 88.3 ± 8.1 % 88.5 ± 9.9 % 94 ± 6.8 % d4-LTB4
LTB5 94.1 ± 6.9 % 103 ± 14 % 94.1 ± 5.7 % d4-PGF2a
8,15-DiHETE 99.6 ± 5.5 % 102 ± 4.9 % 95.4 ± 2.1 % d11-14,15-DiHETrE
5,15-DiHETE b 37.7 ± 1.7 % 107 ± 1.7 % 95.8 ± 0.33 % d11-14,15-DiHETrE
12,13-DiHOME 112 ± 12 % 135 ± 7.5 % 93.4 ± 0.53 % d11-14,15-DiHETrE
9,10-DiHOME 117 ± 10 % 134 ± 4.7 % 96.6 ± 1.2 % d11-14,15-DiHETrE
15,16-DiHODE 116 ± 9.6 % 133 ± 5.2 % 100 ± 0.1 % d11-14,15-DiHETrE
12,13-DiHODE 111 ± 9.7 % 131 ± 4.4 % 96.2 ± 0.56 % d11-14,15-DiHETrE
9,10-DiHODE 111 ± 11 % 132 ± 5.1 % 96.8 ± 0.92 % d11-14,15-DiHETrE
14,15-DiHETrE 95.1 ± 2.4 % 96.3 ± 0.92 % 94.9 ± 1.1 % d11-14,15-DiHETrE
11,12-DiHETrE 93.3 ± 2.9 % 93.1 ± 0.92 % 97.9 ± 2.7 % d11-14,15-DiHETrE
8,9-DiHETrE 103 ± 8.4 % 99.4 ± 0.31 % 110 ± 2.7 % d11-14,15-DiHETrE
5,6-DiHETrE 127 ± 2.3 % 78.4 ± 1.3 % 98.1 ± 0.31 % d11-14,15-DiHETrE
17,18-DiHETE 122 ± 1.6 % 111 ± 4.5 % 99 ± 5.4 % d11-14,15-DiHETrE
14,15-DiHETE 119 ± 5.5 % 108 ± 1.7 % 105 ± 2.3 % d11-14,15-DiHETrE
19,20-DiHDoPA 83.2 ± 4.3 % 72.2 ± 2.7 % 100 ± 0.23 % d11-14,15-DiHETrE
a - A high level calibration standard was subjected to solid phase extraction with or without prior
exposure to base hydrolysis procedures and compared to triplicate analyses of calibration standards.
Results are means ± SD relative to theoretical concentrations with adjustment for surrogate recoveries.
b - Poor analyte recoveries suggest a reduced accuracy in results for these analytes using the current
surrogate spiking/tagging regimen. However, high precision suggests that treatment effects within the
study cohort should be robustly detectable.

7
Figure S1. Correlations between doses of DHA given to LDLR-/- mice and plasma levels
of PUFA and of AA, EPA, and DHA and their corresponding oxylipins.
y = -4.5458x + 25.551
R² = 0.7609, ns
0
5
10
15
20
25
30
35
0.00 0.50 1.00 1.50 2.00
n-6
PU
FA
(%
to
tal
FA
)
Dose of DHA (% daily energy intake)
Plasma n-6 PUFA= f (dose of DHA)
y = -4.9714x + 12.713
R² = 0.7406, ns
0
2
4
6
8
10
12
14
16
18
0.00 0.50 1.00 1.50 2.00
AA
(%
to
tal F
A)
Dose of DHA (% daily energy intake)
Plasma 20:4 n-6 (AA) = f (dose of DHA)
y = 3.4297x + 0.6589
R² = 0.9575, p<0.01
0
1
2
3
4
5
6
7
8
0.00 0.50 1.00 1.50 2.00
EP
A (
% t
ota
l F
A)
Dose of DHA (% daily energy intake)
Plasma 20:5 n-3 (EPA) = f (dose of DHA)
y = 180.62x + 56.687
R² = 0.9882, p<0.01
0
200
400
600
800
1000
1200
1400
1600
1800
0.00 2.00 4.00 6.00 8.00
EP
A's
ox
yli
pin
s (n
M)
Plasma EPA (% total FA)
Plasma EPA's oxylipins = f (plasma EPA)
y = 191.29x + 600.84
R² = 0.7412, ns
0
500
1000
1500
2000
2500
3000
3500
0.00 2.00 4.00 6.00 8.00 10.00 12.00 14.00
DH
A's
ox
yli
pin
s (n
M)
Plasma DHA (% total FA)
Plasma DHA's oxylipins = f (plasma DHA)
y = 7.3529x + 5.5647
R² = 0.9523, p<0.01
0
5
10
15
20
25
0.00 0.50 1.00 1.50 2.00
n-3
PU
FA (
% t
ota
l FA
)
Dose of DHA (% daily energy intake)
Plasma n-3 PUFA= f (dose of DHA)
y = 3.7845x + 4.5061
R² = 0.9408, p<0.01
0
2
4
6
8
10
12
14
0.00 0.50 1.00 1.50 2.00D
HA
(%
to
tal
FA
)Dose of DHA (% daily energy intake)
Plasma 22:6 n-3 (DHA) = f (dose of DHA)
y = 202.48x + 424.3
R² = 0.7931, p<0.05
0
500
1000
1500
2000
2500
3000
3500
4000
4500
0.00 5.00 10.00 15.00 20.00
AA
's o
xyli
pin
s (n
M)
Plasma AA (% total FA)
Plasma AA's oxylipins = f (plasma AA)

8
Figure S2. Correlations between plasma levels of EPA, and their corresponding specific
oxylipins.
y = 90.559x + 28.184
R² = 0.9887
0.00
100.00
200.00
300.00
400.00
500.00
600.00
700.00
800.00
0.00 1.00 2.00 3.00 4.00 5.00 6.00 7.00 8.00
17
(18
)-E
pE
TE
(n
M)
Plasma [EPA] (% total FA)
Plasma 17(18)-EpETE= f (plasma EPA)
y = 62.103x + 22.909
R² = 0.9816
0.00
50.00
100.00
150.00
200.00
250.00
300.00
350.00
400.00
450.00
500.00
0.00 1.00 2.00 3.00 4.00 5.00 6.00 7.00 8.00
14
(15
)-E
pE
TE
(n
M)
Plasma [EPA] (% total FA)
Plasma 14(15)-EpETE= f (plasma EPA)
y = 2.1685x + 1.8945
R² = 0.9971
0.00
2.00
4.00
6.00
8.00
10.00
12.00
14.00
16.00
18.00
20.00
0.00 1.00 2.00 3.00 4.00 5.00 6.00 7.00 8.00
17
,18
-DiH
ET
E (
nM
)
Plasma [EPA] (% total FA)
Plasma 17,18-DiHETE= f (plasma EPA)
y = 0.5957x + 1.3044
R² = 0.9834
0.00
1.00
2.00
3.00
4.00
5.00
6.00
0.00 1.00 2.00 3.00 4.00 5.00 6.00 7.00 8.00
14
,15
-DiH
ET
E (
nM
)
Plasma [EPA] (% total FA)
Plasma 14,15-DiHETE= f (plasma EPA)
y = 1.8709x + 1.0548
R² = 0.9817
0.00
2.00
4.00
6.00
8.00
10.00
12.00
14.00
16.00
0.00 1.00 2.00 3.00 4.00 5.00 6.00 7.00 8.00
15
-HE
PE
(n
M)
Plasma [EPA] (% total FA)
Plasma 15-HEPE= f (plasma EPA)
y = 17.681x - 2.4713
R² = 0.9386
0.00
20.00
40.00
60.00
80.00
100.00
120.00
140.00
160.00
0.00 1.00 2.00 3.00 4.00 5.00 6.00 7.00 8.001
2-H
EP
E (
nM
)
Plasma [EPA] (% total FA)
Plasma 12-HEPE= f (plasma EPA)
y = 5.6468x + 3.8112
R² = 0.9231
0.00
5.00
10.00
15.00
20.00
25.00
30.00
35.00
40.00
45.00
50.00
0.00 1.00 2.00 3.00 4.00 5.00 6.00 7.00 8.00
5-H
EP
E (
nM
)
Plasma [EPA] (% total FA)
Plasma 5-HEPE= f (plasma EPA)

9
Figure S3. Correlations between plasma levels of DHA, and their corresponding specific
oxylipins.
y = 130.72x + 461.92
R² = 0.7085
0.00
500.00
1000.00
1500.00
2000.00
2500.00
0.00 2.00 4.00 6.00 8.00 10.00 12.00 14.00
19
(20
)-E
pD
PE
(nM
)
Plasma [DHA] (% total FA)
Plasma 19(20)-EpDPE = f (plasma DHA)
y = 53.372x + 134.15
R² = 0.7722
0.00
100.00
200.00
300.00
400.00
500.00
600.00
700.00
800.00
0.00 2.00 4.00 6.00 8.00 10.00 12.00 14.00
16
(17
)-Ep
DP
E (n
M)
Plasma [DHA] (% total FA)
Plasma 16(17)-EpDPE = f (plasma DHA)
y = 1.3357x + 1.4626
R² = 0.9912
0.00
2.00
4.00
6.00
8.00
10.00
12.00
14.00
16.00
18.00
0.00 2.00 4.00 6.00 8.00 10.00 12.00 14.00
19
,20
-DiH
PD
A (
nM
)
Plasma [DHA] (% total FA)
Plasma 19,20-DiHDPA = f (plasma DHA)
y = 5.8646x + 3.3083
R² = 0.9849
0.00
10.00
20.00
30.00
40.00
50.00
60.00
70.00
80.00
0.00 2.00 4.00 6.00 8.00 10.00 12.00 14.00
19
,20
-DiH
PD
A (
nM
)
Plasma [DHA] (% total FA)
Plasma 17-HDoHE = f (plasma DHA)

10
Figure S4. Correlations between doses of DHA given to LDLR-/- mice and liver levels of
PUFA and plasma levels of n-6 PUFA, n-3 PUFA and DHA and their corresponding
peroxidized metabolites.
y = 0.7571x + 11.599
R² = 0.6526, ns
0
2
4
6
8
10
12
14
16
0.000 0.500 1.000 1.500 2.000
n-6
PU
FA
(%
to
tal
FA
)
Dose of DHA (% daily energy intake)
Liver n-6 PUFA= f (dose of DHA)
y = 5.4246x + 2.0757
R² = 0.9909, p<0.01
0
2
4
6
8
10
12
14
16
0.000 0.500 1.000 1.500 2.000
n-3
PU
FA
(%
to
tal
FA
)
Dose of DHA (% daily energy intake)
Liver n-3 PUFA= f (dose of DHA)
y = -0.4578x + 3.0118
R² = 0.5421, ns
0
1
1
2
2
3
3
4
4
5
0.000 0.500 1.000 1.500 2.000
AA
(%
to
tal
FA
)
Dose of DHA (% daily energy intake)
Liver 20:4 n-6 (AA) = f (dose of DHA)
y = 1.4484x + 0.1528
R² = 0.9866, p<0.01
0
1
1
2
2
3
3
4
0.000 0.500 1.000 1.500 2.000
EP
A (
% t
ota
l F
A)
Dose of DHA (% daily energy intake)
Liver 20:5 n-3 (EPA) = f (dose of DHA)
y = 3.7809x + 1.4768
R² = 0.9912, p<0.01
0
2
4
6
8
10
12
0.000 0.500 1.000 1.500 2.000
DH
A (
% t
ota
l F
A)
Dose of DHA (% daily energy intake)
Liver 22:6 n-3 (DHA) = f (dose of DHA)
y = -4.731x + 75.323
R² = 0.5232, ns
0
5
10
15
20
25
30
35
11.00 11.50 12.00 12.50 13.00 13.50
HN
E (
pm
ole
/m
g p
rote
in)
Liver n-6 PUFA (% total FA)
Liver HNE = f (liver n-6 PUFA)
y = 0.2492x + 5.5607
R² = 0.7579, ns
0
1
2
3
4
5
6
7
8
9
10
0.00 2.00 4.00 6.00 8.00 10.00 12.00 14.00
HH
E (
pm
ole
/m
g p
rote
in)
Liver n-3 PUFA (% total FA)
Liver HHE = f (liver n-3 PUFA)
y = 0.1715x - 0.0991
R² = 0.9946, p<0.01
0
0
0
1
1
1
1
1
2
2
0.00 2.00 4.00 6.00 8.00 10.00
F4
-NP
(p
mo
le/
mg
pro
tein
)
Liver DHA (% total FA)
Liver F4-Neuroprostanes = f (liver DHA)

11
Figure S5. Partial least squares discrimination analysis of dietary groups in LDLR-/-
given by daily oral gavages increasing doses of DHA. A) Animals eating each dietary
mixture with complete data sets (n=10/group) were segregated by PLS analyses. B) Group
segregation was driven by plasma (yellow triangle) and liver (orange triangle) metabolites
belonging to clusters C2, C3, and C4 as identified in Figure 7. The plasma EPA metabolite,
17,18-dihydroxyeicosaotetraenoic acid (17,18-DiHETE) and the liver DHA metabolite group
F4-neuroprostanes (F4-NeuroPs) were the most frequently selected variables occurring in
80% and 60% of models, respectively.

6
Figure S6. Correlation between plasma F2-isoprostanes and 9-HETE levels.
y = 0.0022x + 0.1237R2 = 0.0236
0
0.1
0.2
0.3
0.4
0.5
0.6
0 10 20 30 40 50 60
9-HETE
PG
F2A
/F2-
Iso
Ps
PGF2a / (isoprostanes)

6
Figure S7. Correlations between plasma oxylipins and plasma 9-HETE levels.
y = 4.33x - 12.20
R2 = 0.33
y = 1.57x - 10.24
R2 = 0.87
y = 11.03x + 359.94
R2 = 0.09
y = 0.03x + 0.17
R2 = 0.67
y = 1.00x - 2.22
R2 = 0.94
0
500
1000
1500
2000
2500
0 20 40 60 80
Plasma 9-HETE (nM)
Pla
sma
Oxy
lipin
s (n
M)
11-HETE
12-HETE
15-HETE
14(15)-EpETrE
14,15-DiHETrE
Copyright © 2022 FDOKUMEN