Links among resting-state default-mode network, salience network, and symptomatology in...
21
1 Links among resting-state default-mode network, salience network, and symptomatology in schizophrenia François Orliac *,b , Mickael Naveau c , Marc Joliot c , Nicolas Delcroix d , Annick Razafimandimby b , Perrine Brazo a,b , Sonia Dollfus a,b , Pascal Delamillieure a,b . a CHU de Caen, Department of Psychiatry, Caen, F-14000, France. b Université de Caen Basse-Normandie, UFR de Médecine, UMR 6301 ISTCT, ISTS group, Caen, F-14000, France. c GIN, UMR 5296 CNRS CEA Université Bordeaux Segalen, Bordeaux, F-33000, France. d GIP CYCERON, UMS 3408, Caen, F-14000, France. * To whom correspondence should be addressed ; UMR 6301 ISTCT, ISTS group, GIP CYCERON, Bd Henri Becquerel, BP5229, F-14074 Caen cedex, France ; tel: +33 (0) 2 31 47 01 57, fax: +33 (0) 2 31 47 02 22, e-mail: [email protected] CHU de Caen, Department of Psychiatry, Caen, F-14000, France ; Université de Caen Basse- Normandie, UFR de Médecine, UMR 6301 ISTCT, ISTS group, Caen, F-14000, France. *Manuscript Click here to view linked References
-
Upload
independent -
Category
Documents
-
view
0 -
download
0
Transcript of Links among resting-state default-mode network, salience network, and symptomatology in...
1
Links among resting-state default-mode network, salience network, and symptomatology in
schizophrenia
François Orliac*,b
, Mickael Naveauc, Marc Joliot
c, Nicolas Delcroix
d, Annick
Razafimandimbyb, Perrine Brazo
a,b, Sonia Dollfus
a,b, Pascal Delamillieure
a,b.
a CHU de Caen, Department of Psychiatry, Caen, F-14000, France.
b Université de Caen Basse-Normandie, UFR de Médecine, UMR 6301 ISTCT, ISTS group,
Caen, F-14000, France.
c GIN, UMR 5296 CNRS CEA Université Bordeaux Segalen, Bordeaux, F-33000, France.
d GIP CYCERON, UMS 3408, Caen, F-14000, France.
* To whom correspondence should be addressed ; UMR 6301 ISTCT, ISTS group, GIP
CYCERON, Bd Henri Becquerel, BP5229, F-14074 Caen cedex, France ; tel: +33 (0) 2 31 47
01 57, fax: +33 (0) 2 31 47 02 22, e-mail: [email protected]
CHU de Caen, Department of Psychiatry, Caen, F-14000, France ; Université de Caen Basse-
Normandie, UFR de Médecine, UMR 6301 ISTCT, ISTS group, Caen, F-14000, France.
*Manuscript
Click here to view linked References

2
Abstract
Neuroimaging data support the idea that schizophrenia is a brain disorder with altered brain
structure and function. New resting-state functional connectivity techniques allow us to
highlight synchronization of large-scale networks, such as the default-mode network (DMN)
and salience network (SN). A large body of work suggests that disruption of these networks
could give rise to specific schizophrenia symptoms. We examined the intra-network
connectivity strength and grey matter content (GMC) of DMN and SN in 26 schizophrenia
patients using resting-state functional magnetic resonance imaging and voxel-based
morphometry. Resting-state data were analyzed with independent component analysis and
dual-regression techniques. We reported reduced functional connectivity within both DMN
and SN in patients with schizophrenia. Concerning the DMN, patients showed weaker
connectivity in a cluster located in the right paracingulate cortex. Moreover, patients showed
decreased GMC in this cluster. With regard to the SN, patients showed reduced connectivity
in the left and right striatum. Decreased connectivity in the paracingulate cortex was
correlated with difficulties in abstract thinking. The connectivity decrease in the left striatum
was correlated with delusion and depression scores. Correlation between the connectivity of
DMN frontal regions and difficulties in abstract thinking emphasizes the link between
negative symptoms and the likely alteration of the frontal medial cortex in schizophrenia.
Correlation between the connectivity of SN striatal regions and delusions supports the
aberrant salience hypothesis. This work provides new insights into dysfunctional brain
organization in schizophrenia and its contribution to specific schizophrenia symptoms.
Key words: psychosis, rest, dysconnectivity, cingulate, striatum.

3
1. Introduction
Neuroimaging data support the idea that schizophrenia is a brain disorder with altered brain
structure and function (Brown and Thompson, 2010 ; Shenton et al., 2001). The
dysconnectivity theory of schizophrenia proposes that schizophrenic symptoms arise from
abnormalities in neuronal connectivity (Bullmore et al., 1997), and the existence of a
widespread anatomical disconnection is now well established for the condition (Stephan et al.,
2006). Several meta-analyses have documented widespread grey matter (GM) changes in the
brain in patients with schizophrenia (Ellison-Wright et al., 2008 ; Honea et al., 2005), and the
most affected loci were anterior cingulate cortex, medial temporal structures, superior
temporal and inferior frontal gyri. One way of assessing brain connectivity is to study how
multiple brain regions functionally interact while a subject is not engaged in a specific task,
i.e., using resting-state blood oxygen level–dependent (BOLD) functional connectivity
(Rogers et al., 2007). Resting-state functional connectivity is an interesting approach because
it allows partitioning of the brain into functional networks (Damoiseaux et al., 2006 ; Naveau
et al., 2012). Furthermore, resting-state networks have been proposed to overlap the networks
subtending the brain in action (Smith et al., 2009). In other words, functional networks seem
to be continuously and dynamically “active” even when the brain is “at rest.” Disruptions of
these networks may contribute to specific patterns of cognitive and behavioral impairments,
providing new insights into aberrant brain organization in several psychiatric and neurological
disorders (Menon, 2011). Regarding schizophrenia, dysfunction of two networks seems to
play a prominent role: the default mode network (DMN) and the salience network (SN)
(Menon, 2011 ; Palaniyappan et al., 2011 ; Palaniyappan and Liddle, 2012 ; Woodward et al.,
2011).

4
DMN is a well-known entity, initially described in late 1990s positron emission
tomography studies as a set of brain regions where activity is more important during resting-
state than during a cognitive task (Mazoyer et al., 2001 ; Shulman et al., 1997). Subsequent
work stressed the link between DMN activity and stimulus-independent thoughts, i.e., mind-
wandering (McKiernan et al., 2006). Some authors argue that this network underlies the
construction of complex self-referential simulations, such as mental time travel, perspective-
taking, and theory of mind (Buckner and Carroll, 2007 ; Molnar-Szakacs and Arzy, 2009).
The interaction among these processes would, according to this idea, lead to the construction
of a unique, integrated representation: the Self (Molnar-Szakacs and Arzy, 2009). Several
functional connectivity studies have reported DMN abnormality in schizophrenia, but the
results are mixed: connectivity increase (Mannell et al., 2010 ; Skudlarski et al., 2010 ;
Whitfield-Gabrieli et al., 2009 ; Zhou et al., 2007), connectivity decrease (Bluhm et al., 2007 ;
Bluhm et al., 2009 ; Camchong et al., 2011 ; Jang et al., 2011 ; Rotarska-Jagiela et al., 2010),
or both (Mingoia et al., 2012 ; Ongur et al., 2010). Moreover, one study has found no
significant difference between patients and controls (Wolf et al., 2011). A DMN alteration has
been associated with negative symptoms (Camchong et al., 2011 ; Mingoia et al., 2012),
positive symptoms (Camchong et al., 2011 ; Whitfield-Gabrieli et al., 2009),
attention/concentration deficits (Camchong et al., 2011), and disorganization symptoms
(Rotarska-Jagiela et al., 2010). According to Salgado-Pineda et al. (2011), GM alterations
could constitute a neuroanatomical underpinning of disturbed DMN function in
schizophrenia.
The SN is a network responsible for the integration of sensations, internally generated
thoughts and information about goals and plans to update expectations about the internal and
external environment. If a salient stimulus is presented, SN would allow allocation of
attention, stimulus processing, and initiation of an action (Palaniyappan and Liddle, 2012).

5
Indeed, this network would have a key role in switching among the DMN, the executive
control network, and external attention networks (Doucet et al., 2011 ; Sridharan et al., 2008).
Yet only a few studies have examined SN functional connectivity in schizophrenia: Two
reported no differences between schizophrenia patients and healthy controls (Repovs and
Barch, 2012 ; Woodward et al., 2011), and two others reported a functional connectivity
decrease in schizophrenia patients (Tu et al., 2012 ; White et al., 2010). SN alteration has been
linked to delusions, disorganization symptoms, and psychomotor poverty syndrome
(Palaniyappan and Liddle, 2012 ; Yuan et al., 2012). No study, to our knowledge, has
explored the relation between SN function and GM alteration in schizophrenia, but Schultz et
al. (2012) reported that a disturbed neuronal activation of the dorsal anterior cingulate cortex
(a key region of the SN) during a working memory task was linked to decreased prefrontal
GM thickness.
The inconsistency of findings in schizophrenia patients, especially concerning DMN
connectivity, can be striking. Part of the problem may be different analysis techniques: seed-
based analysis and independent component analysis (ICA). Moreover, results of seed-based
analysis rely on the a priori selection of the seed voxel or region, which differs from one study
to another. Concerning ICA, results rely largely on the reference maps obtained for DMN and
SN, which are based on data from a small number of subjects. As a consequence, reference
maps are also quite variable from one study to another.
To avoid such a bias, here we used reference maps from an ICA analysis on a large
dataset (resting-state functional magnetic resonance imaging [fMRI] from 282 healthy
volunteers). In this way, we were able to reliably explore the functional connectivity of DMN
and SN in schizophrenia patients and its relationships to schizophrenia symptoms. When a
functional connectivity alteration was found, a structural analysis was carried out to determine
whether this functional alteration was linked to a structural (GM) alteration.
6
2. Materials and methods.
2.1. Participants.
Twenty-six patients with schizophrenia (SP group) attending at the Department of Psychiatry
of Caen University Hospital and twenty-six matched healthy controls (HC group) were
included in the study. All participants spoke French as their mother tongue. The patient and
control groups were matched for age, sex, handedness, and educational level on a one-to-one
basis. All participants had to be between 18 and 60 years of age. All were screened for
magnetic resonance imaging (MRI) contraindications, and participants with a history of a
major medical condition, neurological disease, or substance abuse were excluded from the
study.
SP group participants were diagnosed by an experienced clinician using the Mini
International Neuropsychiatric Interview (MINIplus v.4.5). They were required to have been
stable on antipsychotic medication for at least four months prior to the study. The Positive and
Negative Syndrome Scale (PANSS) (Kay et al., 1987) was used to assess positive (PANSS-
P), negative (PANSS-N), and general psychopathology (PANSS-G) symptoms. Daily
antipsychotic medication dosage was converted to chlorpromazine equivalents (mg/d).
The local ethics committee (CPP de Basse-Normandie, France) approved the study. All
participants gave written informed consent.
2.2. Imaging procedure.
2.2.1. Data acquisition.
Data acquisition was performed on a 3 T Philips Achieva MRI scanner. Structural data were
acquired using a high-resolution, three-dimensional T1-weighted volume (repetition time
(TR) = 20 ms; echo time (TE) = 4.6 ms; flip angle = 10°; inversion time = 800 ms; turbo field

7
echo factor = 65; sense factor = 2; field of view = 256 × 256 × 180 mm; 1 × 1 × 1 mm3
isotropic voxel size), and a T2*-weighted, multi-slice acquisition (T2*-weighted fast-field
echo; TR = 3500 ms; TE = 35 ms; flip angle = 90°; sense factor = 2; 70 axial slices; 2 × 2 × 2
mm3 isotropic voxel size). Spontaneous brain activity was monitored using BOLD fMRI
while the participants performed a resting-state condition for 8 min (T2*-echo planar
imaging; 240 volumes; TR = 2 s; TE = 35 ms; flip angle = 80°; 31 axial slices; 3.75 × 3.75 ×
3.75 mm3 isotropic voxel size). Immediately before fMRI scanning, participants were
instructed to “keep their eyes closed, to relax, to refrain from moving, to stay awake, and to
let their thoughts come and go.”
2.2.2. Functional data.
2.2.2.1. Pre-processing.
Pre-processing of the functional data was based on the methods described in Naveau et al.
(2012). Briefly, it included motion correction, slice-timing correction, band-pass filtering
(0.01 Hz < f < 0.1 Hz), co-registration to structural scan, spatial normalization to the Montreal
Neurological Institute template, and spatial smoothing (6 mm Gaussian kernel). Each
subject’s structural scan was segmented into grey matter, white matter, and cerebrospinal
fluid using the unified segmentation approach implemented in Statistical Parametric Mapping
5 (SPM5; Wellcome Department of Neurology, London, UK; www.fil.ion.ucl.ac.uk/spm5).
2.2.2.2. Reference maps for DMN and SN.
Reference maps for DMN and SN were estimated on a large dataset (resting-state fMRI from
282 healthy volunteers) using a novel group ICA approach based on multi-scale individual
component clustering (MICCA), see Naveau et al. (2012) for more demographic and
methodological considerations. Within the 34 resting-state networks identified by the MICCA
analysis, we retained without ambiguity the two ICA components (i.e., networks)

8
corresponding to the DMN and SN descriptions (Beckmann et al., 2005 ; Sridharan et al.,
2008). Reference maps for DMN and SN are presented in Figure 1. The DMN consists of
eight clusters: a large medial frontal cluster extending up to the superior frontal gyrus; a
posteromedial cluster including the precuneus and part of the posterior cingulate; the angular
gyrus bilaterally; a large part of the middle temporal gyrus bilaterally; and a medial temporal
cluster bilaterally. The SN map is composed of five main clusters: a large medial cluster
located in the anterior cingulate and supplementary motor areas; the middle frontal gyrus
bilaterally; and an insular cluster broadening to striatum bilaterally.
Figure 1. Reference maps for default-mode network and salience network identified by a
multi-scale individual component clustering analysis on resting-state fMRI data from 282
healthy volunteers.
9
2.2.2.3. Dual regression.
We used the dual regression approach (Filippini et al., 2009) to build the individual-level
components corresponding with the reference DMN and SN components. In the first
regression equation, the reference maps were used as spatial predictors of the individual fMRI
volumes, resulting in individual time series. These time series were then used as temporal
predictors for the individual functional connectivity map in the second regression equation. At
the end of this process, we obtained one functional connectivity spatial map of DMN and SN
for each individual. Each voxel value of these maps is a Z-normalized regression beta
coefficient, interpreted as a measure of the strength of the association between this voxel time
series and the whole network time series, i.e., functional connectivity within this network.
Dual regression analysis was carried out using FSL tools (www.fmrib.ox.ac.uk/fsl).
2.3. Structural data.
Pre-processing of the structural data was based on the methods described in Michael et al.
(2010), a recent study exploring GM structure-function interactions. Briefly, we applied
optimized Voxel Based Morphometry in SPM5, using unified segmentation approach
(Ashburner and Friston, 2005) and unmodulated normalized parameters with default settings.
The brain was segmented into white matter, GM, and cerebral spinal fluid probabilistic maps.
At any given voxel the GM map indicates the percentage of GM content (GMC) at that voxel.
After segmentation, GM images were smoothed with a Gaussian kernel of 8mm.
2.4. Data analysis.
2.4.1. Group comparison.
10
We retained the clusters within which functional connectivity was significantly different
between the two groups using voxel-wise two-sample t-tests (SPM5): height threshold, p <
0.001 uncorrected; extent threshold k > 100 voxels. Anatomical locations were assessed using
the Harvard–Oxford cortical atlas implemented in FSLView
(www.fmrib.ox.ac.uk/fsl/fslview). Mean GMC inside these clusters of interest was calculated
and compared between the two groups using a two sample t-test (JMP9 statistics software;
www.jmp.com/software/jmp9/).
2.4.2. Correlation with clinical variables.
Mean z-score inside each of these clusters was correlated with PANSS-P, PANSS-N, and
PANSS-G scores in the SP group using linear regression (JMP9). When a significant
correlation (p < 0.05 uncorrected) or a trend toward a correlation (p < 0.1) was highlighted
between mean z-score and a subscale, post-hoc regression analysis was carried out using the
individual items of this subscale (p < 0.05, Bonferroni corrected). When a significant
difference in GMC (p < 0.05 uncorrected) between the groups was found inside a cluster of
interest, GMC was correlated with PANSS subscales in the same way as for z-scores. Mean z-
score and GMC were also correlated with antipsychotic medication dosage. Regression
analyses involving PANSS subscales and items or antipsychotic medication dosage were
conducted using Spearman’s nonparametric correlation.
3. Results.
3.1. Clinical data.
Table 1 provides detailed demographic and clinical data. None of the matching criteria were
statistically different between the groups. Mean total PANSS score was 50.4 ± 10.3 (mean ±
11
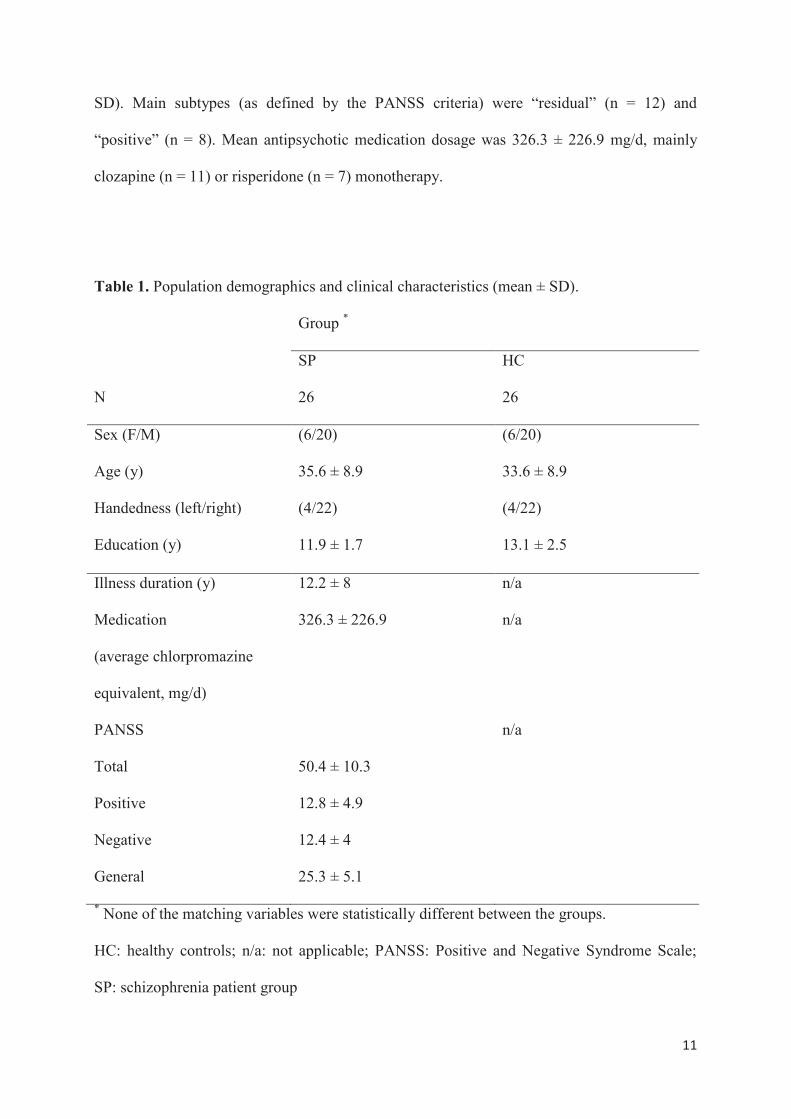
SD). Main subtypes (as defined by the PANSS criteria) were “residual” (n = 12) and
“positive” (n = 8). Mean antipsychotic medication dosage was 326.3 ± 226.9 mg/d, mainly
clozapine (n = 11) or risperidone (n = 7) monotherapy.
Table 1. Population demographics and clinical characteristics (mean ± SD).
Group *
SP HC
N 26 26
Sex (F/M) (6/20) (6/20)
Age (y) 35.6 ± 8.9 33.6 ± 8.9
Handedness (left/right) (4/22) (4/22)
Education (y) 11.9 ± 1.7 13.1 ± 2.5
Illness duration (y) 12.2 ± 8 n/a
Medication
(average chlorpromazine
equivalent, mg/d)
326.3 ± 226.9 n/a
PANSS n/a
Total 50.4 ± 10.3
Positive 12.8 ± 4.9
Negative 12.4 ± 4
General 25.3 ± 5.1
* None of the matching variables were statistically different between the groups.
HC: healthy controls; n/a: not applicable; PANSS: Positive and Negative Syndrome Scale;
SP: schizophrenia patient group
12
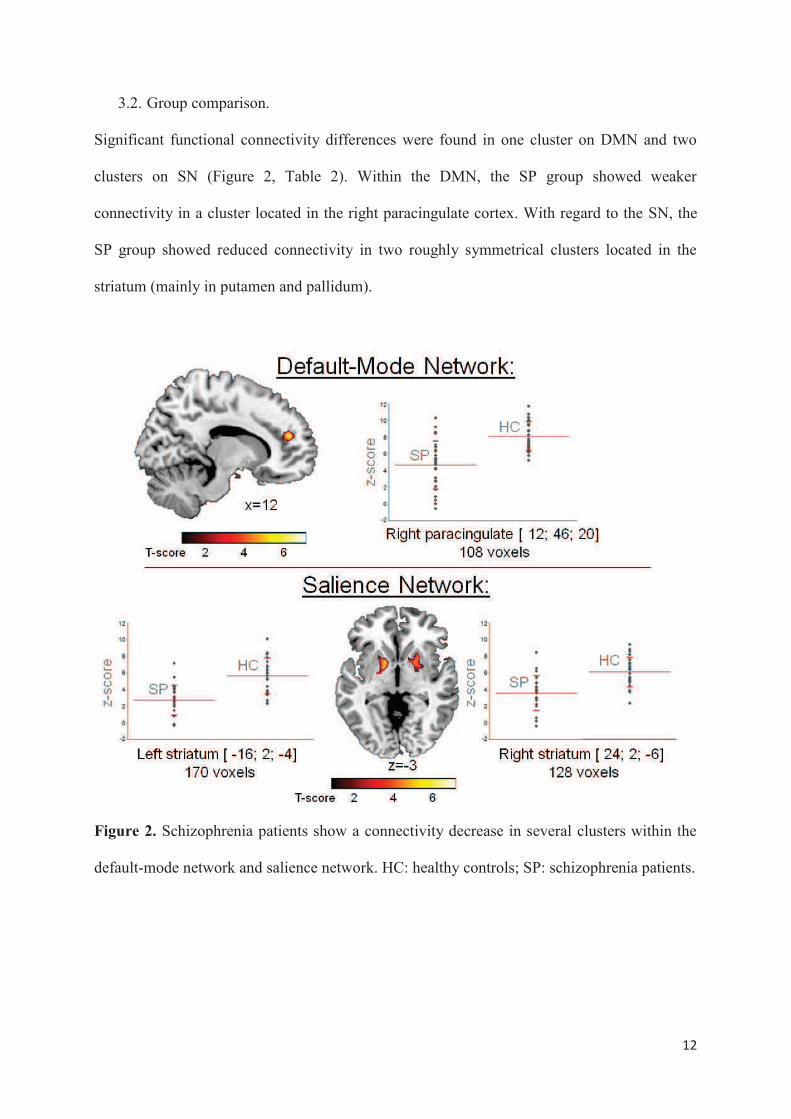
3.2. Group comparison.
Significant functional connectivity differences were found in one cluster on DMN and two
clusters on SN (Figure 2, Table 2). Within the DMN, the SP group showed weaker
connectivity in a cluster located in the right paracingulate cortex. With regard to the SN, the
SP group showed reduced connectivity in two roughly symmetrical clusters located in the
striatum (mainly in putamen and pallidum).
Figure 2. Schizophrenia patients show a connectivity decrease in several clusters within the
default-mode network and salience network. HC: healthy controls; SP: schizophrenia patients.

13
Table 2. Functional connectivity decrease in schizophrenia patients.
Anatomical region
Side BA Peak coordinates
(mm)
Cluster size
(voxels)
T-
value
p value
x y z
DMN
Paracingulate cortex R 32 12 46 20 108 5.50 <0.001*
SN
Striatum L n/a -16 2 -4 170 5.48 <0.001*
Striatum R n/a 24 2 -6 128 4.54 <0.001*
* Statistical significance.
BA: Brodmann area; DMN: default mode network; L: left; n/a: not applicable; R: right; SN:
salience network.
Concerning structural data, SP group showed lower GMC in the paracingulate cluster, but no
correlation was found between mean functional connectivity and mean GMC in this cluster.
No GMC difference was found in striatal clusters (Figure 1 Supplementary data).
3.3. Correlation with clinical variables
Functional connectivity within these clusters of interest was correlated with several clinical
variables. Concerning the DMN (Figure 3), functional connectivity of the paracingulate
cluster showed a trend toward a negative correlation with PANSS-N score (p = 0.09). Post-
hoc analysis revealed that this negative correlation was significant with only one item of the
scale, N5, which refers to “difficulty in abstract thinking” (p = 0.006). Functional connectivity

14
of this cluster showed a negative correlation (p = 0.03) with antipsychotic medication dosage.
Post-hoc analyses were carried out to disentangle possible effects of medication dosage on
PANSS-N items: no correlation was found between N5 score and medication dosage, and the
correlation between functional connectivity of paracingulate cluster and N5 score remained
significant (p = 0.005) after adding medication dosage as a covariate.
Figure 3. Correlations between functional connectivity and clinical variables within the
default-mode network and salience network. Post-hoc analyses are displayed in boxes.
PANSS: Positive and Negative Syndrome Scale; PANSS-G: general psychopathology
subscale of the PANSS; PANSS-N: negative syndrome subscale of the PANSS; PANSS-P:
positive syndrome subscale of the PANSS.
With regard to the SN, functional connectivity of the left striatum cluster (Figure 3) showed a
negative correlation with PANSS-P (p = 0.03) and a trend toward a negative correlation with
PANSS-G (p = 0.07) score. Post-hoc analysis with PANSS-P items revealed that this
correlation was significant with only one item, P1, which refers to “delusions” (p = 0.005).

15
The same analysis with PANSS-G items revealed that the negative correlation was found only
with the G6 item “depression” (p = 0.0006). No correlation was identified between functional
connectivity of the right striatum cluster and PANSS subscales. No correlation was identified
between striatal functional connectivity and antipsychotic medication dosage. Concerning
structural data, no correlation was found between GMC of the paracingulate cluster and
PANSS subscales. No correlation was identified between GMC and antipsychotic medication
dosage in any of the clusters of interest.
4. Discussion.
The study results highlight a reduced functional connectivity within both DMN and SN in the
SP group. Concerning the DMN, this reduction was located in the right anterior paracingulate
cortex. Our results are consistent with those of four other studies reporting a loss of functional
connectivity in the frontal medial cluster of the DMN (Camchong et al., 2011 ; Jang et al.,
2011 ; Mingoia et al., 2012 ; Ongur et al., 2010). One study reported a functional connectivity
increase in this region (Whitfield-Gabrieli et al., 2009). This inconsistency may be mainly
attributable to the type of resting data collected: rest only during the whole duration of the
scan (Camchong et al., 2011 ; Jang et al., 2011 ; Mingoia et al., 2012 ; Ongur et al., 2010) or
maintained visual fixation during smaller blocks of time in between task performance
(Whitfield-Gabrieli et al., 2009). In our study, medial frontal reduction in functional
connectivity was correlated with difficulties in abstract thinking, i.e., difficulties in forming
generalizations and proceeding beyond egocentric thinking. This region does not seem to be
engaged in abstract concept processing (Wang et al., 2010) but seems to be specifically
involved in self-referential processing (Gusnard et al., 2001). An altered pattern of interaction
between the whole DMN and this region could lead to a difficulty in disengaging from self-
focus when it is appropriate to do so. Of interest, such a relationship between the connectivity

16
of this region within the DMN and dysfunctional self-focused thinking has already been
stressed in depressed patients (Zhu et al., 2012). Moreover, SP group showed lower GMC in
this region. The early alteration of the medial frontal cortex in schizophrenia is well
documented (Fornito et al., 2009 ; Pantelis et al., 2005), but this structural alteration doesn’t
seem to drive the functional abnormalities in our study. Moreover, recent data suggest that
GM structural-functional coupling may be decreased in schizophrenia (Michael et al., 2010).
Concerning the SN, we highlighted a reduced functional connectivity located in the
striata, thus replicating the results of Tu et al. (2012). White et al. (2010) reported a functional
connectivity decrease between the dorsal anterior cingulate and insula in an SP group during a
somatosensory stimulus processing task, but the basal ganglia were not included in their
analysis. In our study, the connectivity decrease in the left striatum was correlated with
delusion scores. These results are in line with those of previous work. Indeed, structural
(Brandt and Bonelli, 2008) and functional (Heinz and Schlagenhauf, 2010) basal ganglia
abnormalities are well documented in patients with schizophrenia. Moreover, schizophrenia-
like delusive symptoms have been reported following left putaminal infarction (Farid and
Mahadun, 2009). According to the aberrant salience hypothesis of schizophrenia (Heinz and
Schlagenhauf, 2010 ; Kapur, 2003), altered cortico-striatal-thalamic neurocircuitry is
responsible for chaotic firing of dopaminergic neurons in the striatum, leading to aberrant
assignment of salience to innocuous stimuli. Delusions in this framework are seen as a “top-
down” cognitive explanation that the individual imposes on these experiences of aberrant
salience in an effort to make sense of them (Kapur, 2003). It is noteworthy that our SN
reference map obtained from ICA on a large dataset included subcortical regions, bridging the
gap between the striatal “aberrant salience” hypothesis (Heinz and Schlagenhauf, 2010 ;
Kapur, 2003) and the cingulo-opercular “proximal salience” hypothesis (Palaniyappan and
Liddle, 2012) of positive symptoms in patients with schizophrenia. In our study, the
17
connectivity decrease in the left striatum was also correlated with depression score. As
stressed by a recent functional imaging study in an SP group (Simon et al., 2010),
dysfunctional activity of the striatum can alter the neural coding of rewarding outcomes,
contributing to the neurobiological origin of depression in SP.
This study had several limitations. Although reference maps derived from a large dataset
were used, the sample size for each group was modest. Moreover, we must consider the fact
that patients were on antipsychotic medication, suspension of which would not have been
justified on ethical grounds. In our study, antipsychotic medication dosage was negatively
correlated with DMN medial frontal functional connectivity. Interestingly, Sambataro et al.
(2010) reported that, in previously unmedicated SP, a four weeks treatment with olanzapine
was associated with increases in DMN connectivity with the ventromedial prefrontal cortex
during a working memory task. This discrepancy suggests differential effects of antipsychotic
medication on DMN connectivity according to the paradigm of the study: resting state versus
explicit task.
In conclusion, this study highlighted connectivity decreases within two key functional
networks in SP, the DMN and SN. These results are in line with the dysconnectivity theory of
schizophrenia. Loss of connectivity within DMN frontal regions was correlated with
difficulties in abstract thinking, stressing the link between negative symptoms and the likely
alteration of the frontal medial cortex in the SP group. Loss of connectivity within striatal
regions of the SN was correlated with delusions and depressive symptoms, supporting the
aberrant salience hypothesis. Thus, this work provides new insights into the dysfunctional
brain organization in schizophrenia and its contribution to specific schizophrenia symptoms.

18
References
Ashburner, J. and Friston, K.J., 2005. Unified segmentation. Neuroimage. 26 (3) 839-851.
Beckmann, C.F., DeLuca, M., Devlin, J.T. and Smith, S.M., 2005. Investigations into resting-
state connectivity using independent component analysis. Philos Trans R Soc Lond B
Biol Sci. 360 (1457) 1001-1013.
Bluhm, R.L., Miller, J., Lanius, R.A., Osuch, E.A., Boksman, K., Neufeld, R.W., Theberge,
J., Schaefer, B. and Williamson, P., 2007. Spontaneous low-frequency fluctuations in
the BOLD signal in schizophrenic patients: anomalies in the default network.
Schizophr Bull. 33 (4) 1004-1012.
Bluhm, R.L., Miller, J., Lanius, R.A., Osuch, E.A., Boksman, K., Neufeld, R.W., Theberge,
J., Schaefer, B. and Williamson, P.C., 2009. Retrosplenial cortex connectivity in
schizophrenia. Psychiatry Res. 174 (1) 17-23.
Brandt, G.N. and Bonelli, R.M., 2008. Structural neuroimaging of the basal ganglia in
schizophrenic patients: a review. Wien Med Wochenschr. 158 (3-4) 84-90.
Brown, G.G. and Thompson, W.K., 2010. Functional brain imaging in schizophrenia: selected
results and methods. Curr Top Behav Neurosci. 4 181-214.
Buckner, R.L. and Carroll, D.C., 2007. Self-projection and the brain. Trends Cogn Sci. 11 (2)
49-57.

19
Bullmore, E.T., Frangou, S. and Murray, R.M., 1997. The dysplastic net hypothesis: an
integration of developmental and dysconnectivity theories of schizophrenia. Schizophr
Res. 28 (2-3) 143-156.
Camchong, J., MacDonald, A.W. 3rd, Bell, C., Mueller, B.A. and Lim, K.O., 2011. Altered
functional and anatomical connectivity in schizophrenia. Schizophr Bull. 37 (3) 640-
650.
Cole, D.M., Oei, N.Y., Soeter, R.P., Both, S., van Gerven, J.M., Rombouts, S.A. and
Beckmann, C.F., 2012. Dopamine-Dependent Architecture of Cortico-Subcortical
Network Connectivity. Cereb Cortex. [in press] doi: 10.1093/cercor/bhs136.
Damoiseaux, J.S., Rombouts, S.A., Barkhof, F., Scheltens, P., Stam, C.J., Smith, S.M. and
Beckmann, C.F., 2006. Consistent resting-state networks across healthy subjects. Proc
Natl Acad Sci U S A. 103 (37) 13848-13853.
Doucet, G., Naveau, M., Petit, L., Delcroix, N., Zago, L., Crivello, F., Jobard, G., Tzourio-
Mazoyer, N., Mazoyer, B., Mellet, E. and Joliot, M., 2011. Brain activity at rest: a
multiscale hierarchical functional organization. J Neurophysiol. 105 (6) 2753-2763.
Ellison-Wright, I., Glahn, D.C., Laird, A.R., Thelen, S.M. and Bullmore, E., 2008. The
anatomy of first-episode and chronic schizophrenia: an anatomical likelihood
estimation meta-analysis. Am J Psychiatry. 165 (8) 1015-1023.
Farid, F. and Mahadun, P., 2009. Schizophrenia-like psychosis following left putamen infarct:
a case report. J Med Case Rep. 3 7337.
20
Filippini, N., MacIntosh, B.J., Hough, M.G., Goodwin, G.M., Frisoni, G.B., Smith, S.M.,
Matthews, P.M., Beckmann, C.F. and Mackay, C.E., 2009. Distinct patterns of brain
activity in young carriers of the APOE-epsilon4 allele. Proc Natl Acad Sci U S A. 106
(17) 7209-7214.
Fornito, A., Yucel, M., Dean, B., Wood, S.J. and Pantelis, C., 2009. Anatomical abnormalities
of the anterior cingulate cortex in schizophrenia: bridging the gap between
neuroimaging and neuropathology. Schizophr Bull. 35 (5) 973-993.
Gusnard, D.A., Akbudak, E., Shulman, G.L. and Raichle, M.E., 2001. Medial prefrontal
cortex and self-referential mental activity: relation to a default mode of brain function.
Proc Natl Acad Sci U S A. 98 (7) 4259-4264.
Heinz, A. and Schlagenhauf, F., 2010. Dopaminergic dysfunction in schizophrenia: salience
attribution revisited. Schizophr Bull. 36 (3) 472-485.
Honea, R., Crow, T.J., Passingham, D. and Mackay, C.E., 2005. Regional deficits in brain
volume in schizophrenia: a meta-analysis of voxel-based morphometry studies. Am J
Psychiatry. 162 (12) 2233-2245.
Jang, J.H., Jung, W.H., Choi, J.S., Choi, C.H., Kang, D.H., Shin, N.Y., Hong, K.S. and Kwon,
J.S., 2011. Reduced prefrontal functional connectivity in the default mode network is
related to greater psychopathology in subjects with high genetic loading for
schizophrenia. Schizophr Res. 127 (1-3) 58-65.

21
Kapur, S., 2003. Psychosis as a state of aberrant salience: a framework linking biology,
phenomenology, and pharmacology in schizophrenia. Am J Psychiatry. 160 (1) 13-23.
Kay, S.R., Fiszbein, A. and Opler, L.A., 1987. The positive and negative syndrome scale
(PANSS) for schizophrenia. Schizophr Bull. 13 (2) 261-276.
Mannell, M.V., Franco, A.R., Calhoun, V.D., Canive, J.M., Thoma, R.J. and Mayer, A.R.,
2010. Resting state and task-induced deactivation: A methodological comparison in
patients with schizophrenia and healthy controls. Hum Brain Mapp. 31 (3) 424-437.
Mazoyer, B., Zago, L., Mellet, E., Bricogne, S., Etard, O., Houde, O., Crivello, F., Joliot, M.,
Petit, L. and Tzourio-Mazoyer, N., 2001. Cortical networks for working memory and
executive functions sustain the conscious resting state in man. Brain Res Bull. 54 (3)
287-298.
McKiernan, K.A., D'Angelo, B.R., Kaufman, J.N. and Binder, J.R., 2006. Interrupting the
"stream of consciousness": an fMRI investigation. Neuroimage. 29 (4) 1185-1191.
Menon, V., 2011. Large-scale brain networks and psychopathology: a unifying triple network
model. Trends Cogn Sci. 15 (10) 483-506.
Michael, A.M., Baum, S.A., White, T., Demirci, O., Andreasen, N.C., Segall, J.M., Jung,
R.E., Pearlson, G., Clark, V.P., Gollub, R.L., Schulz, S.C., Roffman, J.L., Lim, K.O.,
Ho, B.C., Bockholt, H.J. and Calhoun, V.D., 2010. Does function follow form?:
methods to fuse structural and functional brain images show decreased linkage in
schizophrenia. Neuroimage. 49 (3) 2626-2637.