Linking Loneliness and Use of Social Media - CORE
79
Linking Loneliness and Use of Social Media Huishan Guo University of Helsinki Faculty of Social Sciences Media and Global Communication Master’s Thesis April 2018 brought to you by CORE View metadata, citation and similar papers at core.ac.uk provided by Helsingin yliopiston digitaalinen arkisto
-
Upload
khangminh22 -
Category
Documents
-
view
1 -
download
0
Transcript of Linking Loneliness and Use of Social Media - CORE

Linking Loneliness and Use of Social Media
Huishan Guo
University of Helsinki
Faculty of Social Sciences
Media and Global Communication
Master’s Thesis
April 2018
brought to you by COREView metadata, citation and similar papers at core.ac.uk
provided by Helsingin yliopiston digitaalinen arkisto

Abstract
Currently, Internet based social media have an increased influence on society,
and the use of social media has penetrated into every aspect of life. Because of
online use of social media, individuals are connected through screen virtually,
but isolated from each other physically. Previous conventional offline social life is
decreasing and new psychological problem arises: loneliness. Empirical studies
found that despite the fact that this generation has more devices and
technologies that help people to stay connected, the feeling of loneliness in 21st
century is the highest of all times so far.
This thesis will combine past empirical studies of relevant field with the theory of
use and gratification, aiming to identify the relationship between use of social
media and loneliness. This exploratory study was carried out in University of
Helsinki through online survey, Facebook was chosen as an example of social
media that is widely used among university students, and 112 valid survey
samples were collected. Through quantitative research method, four major
findings are found: (1) Loneliness is positively correlated with Facebook
motivation, which can be interpreted as loneliness motivates people to use
Facebook; (2) Loneliness is negatively correlated with the number of Facebook
friends, which indicates that a larger social network size can combat loneliness;
(3) Females use Facebook more intensively than males than people who prefer
not to say their gender; (4) Asian/Pacific islander ethnicity group shows the
highest motivation to use Facebook, followed by white ethnicity and then others.

Table of contents
1. Introduction…………………………………………………………………1
1.1 Research question………………………………………………………...5
1.2 Structire of the study………………………………………………………7
2. Literature review……………………………………………………………8
2.1 Social media……………………………………………….……………….8
2.2 Social media addiction………………………………...………………… 10
2.3 Loneliness…………………………………………………….……………11
2.4 Use and gratification theory………………………………………………12
2.5 Social media and loneliness: empirical studies……………………...…15
2.6 Description of Facebook…………………………………………….……18
3. Methodology………………………………………………………….………19
3.1 Research design………………………………………………..…………19
3.2 Survey design…………………………………………………………...…21
3.3 Measurements…………………………………………………..…………21
3.3.1 Loneliness measurement scale………………………………21
3.3.2 Usage pattern of social media………………………..………23
3.4 Data collection………………………………………………..……………27
3.5 Factor analysis……………………………………………….……………27
3.6 Correlation analysis……………………………………………….………28
3.7 Analysis of variance/ANOVA…………………………………….………29
4. Analysis………………………………………………………………………..29
4.1 Factor analysis results………………………….…………………………29
4.1.1 Loneliness factors………………………………………………30
4.1.2 Facebook intensity factors……………………………….……40
4.1.3 Facebook motivation factors………………………..…………44
4.2 Correlation analysis……………………………………………..…………48
4.3 Analysis of variance/ANOVA………………………………..……………51
5. Conclusion……………………………………………………………….……55
6. Discussion……………………………………………………………..………56
6.1 Loneliness motivates Facebook use……………….…………………56

6.2 More popular, less lonely……………………………………..…………58
6.3 Evaluation of the study………………………………………..…………59
7. List of references………………………………………………………….……60
8. List of figures……………………………………………………………………67
9. Appendix: Survey………………………………………………………………69

1
1. Introduction
With the technology development and media transformation, media have
entered people’s everyday life and the involvement deepened with time.
McLuhan proposed a metaphor that “medium is the extension of human’s body
and senses” (McLuhan, 1965). The appearance of social media enables people
to participate in social interactions without taking part in real-life social activities.
Social media is changing the lifestyle and daily routine of people, as well as
reshaping the well being and spiritual fulfillment of individuals. Social media’s
function flourished with the increase of users. It is not only a tool for social
interactions, but also a platform for public opinions, a channel for information
dissemination.
In the information age, social media gain popularity rapidly, especially among the
young adults (Pempek, Yermolayeva & Calvert, 2009). People use social media
to create and sustain relationships with others (Ellison, 2007). The use of social
media becomes an important part of students’ everyday life, and the high
engagement of social media blurs the online and offline life. However,
international students are faced with the situation of being far away from home
countries and trying to adapt into the host culture. Therefore, international
students tend to use more of social media to integrate into the new environment
and culture (Sawyer & Chen, 2012). In this circumstance, international students
need to communicate with both new and old friends. Social media sites make it
easier to keep up with whom they haven’t seen for a while by observing the
posts and activities, and in the same time reconnecting with new and old friends
by making interactions through internet (Quan-Haase & Young, 2010). Facebook
enables people to communicate with multiple social capitals at once (Sponcil &
Citimu, 2013). Therefore, to communicate and adapt to the new environment as
foreigners, Facebook is the primary social media where international students
deepen friendship and establish contacts.

2
People use the social media platforms to communication with peers, publish
their opinions, and organize events. According to emerging adulthood theory
(Arnett, 2000), the late teens around 18-25 years old, are in the stage of
emerging adulthood when they form self-identity and worldviews. And university
students are mostly around the age of emerging adulthood; therefore, university
is a place where students form their characteristics, values, worldview, and
outlook on life. Social media satisfy the cognitive and affective needs of
university students in multiple ways: web browsing, information acquisition,
engagement in interpersonal communication and socialization (Utista et al.,
2009).
According to statistic data1 that is released in January 2018, Facebook took the
lead in social media industry as the first one to surpass 1 billion registered users,
and 2.2 billion monthly active users.
1 https://www.statista.com/statistics/272014/global-social-networks-ranked-by-number-of-users/

3
Figure 1: Rank of active users in leading social media, source:
https://www.statista.com/statistics/272014/global-social-networks-ranked-by-nu
mber-of-users/

4
Facebook took the lead in user engagement not only in quantity of how many
registered users, but also by quality. According to the data from Statistic Brain1,
the average time spending on Facebook per visit is 18 minutes, 48% of 18-34
year olds check Facebook when they wake up and 28% of this demographics
check Facebook before they get out of bed. The Statistic Brain data also
revealed that the average number of external social activities (groups, events,
pages) that a user is linked to is 80. Villi, Matikainen, Khaldarova (2015) found
out that audience are more active in Facebook while the news media are more
active in Twitter. In the research (Villi, Matikainen, Khaldarova, 2015), the
scholars concluded that Twitter was closer to the natures of mass media where
the contents could flow to irrelative audience; Facebook formed a semi-closed
interpersonal community where contents distributed within the strong ties and
weak ties realm. Though there are other social media that students use in their
daily life, but they differ a lot according to their nationalities. Each national has
his or her own frequently used social media of their home countries, such as
Wechat for Chinese nationals and Line for South Korean nationals. Foehr et al.
(2005) carried out a survey research and found out that media have a ubiquitous
influence in youth development, and using social media becomes the daily
activity of most young adults (Ellison, Steinfield, & Lampe, 2007). In the
environment of international students, globally widely adopted social media like
Facebook serve as the common platform to connect individuals of all nationals.
Facebook is a representative social network site that is used by many, online
interactions in Facebook may influence on social relations and psychological
development of international university students (Pempek, et al., 2007).
Ed Diener (2009) proposed the definition of subjective well being as the
cognitive and affective evaluation of his or her life. The cognitive and affective
evaluations are mainly composed of two parts, the satisfaction of life and the
pleasant level of emotions. Subjective well being defines how people experience
the quality of their lives. This study focuses on the social media usage and the
consequent impact on psychological level of university students’ perception of
life.
5
Perlman and Peplau (1981, p.31) defined loneliness as “the unpleasant
experience that occurs when a person’s network of social relations is deficient in
some important way, either quantitatively or qualitatively”. Perlman and Peplau
(1982, p.5) later added that loneliness could be regarded as a result from
individual’s perceived discrepancy between the desired level and the achieved
level of social contacts.
Subjective well-being and loneliness are important indexes to evaluate the
psychological status and life quality of international students. Media usage
exerts an important backdrop for the social, emotional, and cognitive
development of youth, considering the large proportion of time spent (Roberts,
Foehr, & Rideout, 2005). Deducting the time for sleep, a person has almost fixed
amount of time to conduct various daily activities if not sacrifice the time for sleep
that is very important for health and well being. To get something done means to
leave something else undone. The excessive time spent in social media will
replace the time to cultivate active social, intellectual, or athletic engagement
(Heponiemi, Elovainio, al., 2006). In addition, Eggermont and Van den Bulck
(2006) discovered that proper amount of time for sleep is important for emotional
development, and the excessive media exposure often occurs at night, which
can replace the time for sleep. And this may lead to cognitive distortion that is
associated with depression (Lakdavalla, Hankin & Mermelstein, 2007).
In social media, people can communicate and interact with friends, generating
their own content. However, much of the time is spent in viewing information
without direct interaction, and this is called online lurking (Pempek et al., 2009).
1.1 Research Questions
The research problem is whether the use of social media causes loneliness. To
examine the research problem, a set of research questions are formed to serve
as sub questions to explain the major research problem from different

6
perspectives with with details.
Q1: (Q1a) How do international students perceive loneliness? (Q1b) How do
international students use social media?
This research question is composed of three-questions that are linked to factor
analysis. The questions can be specified by:
1. What are the loneliness factors that are perceived by international students in
University of Helsinki? (Q1a)
2. What are the Facebook activity factors that are mostly used by international
students in University of Helsinki? (Q1b)
3. What are the motivation factors when international students in University of
Helsinki use Facebook? (Q1b)
Through questionnaire, we can have an overview of international students’
behaviours and motivations on social media and their perception of loneliness.
Social media usage here is divided into two major parts: Facebook intensity
which consists of all kinds of Facebook activities that are used by people today,
and the intensity of how often people use each of the function. Facebook
motivation that consists of all kinds of motivations that one uses Facebook, and
the level of motivation for each purpose. Operational definitions for Facebook
intensity, Facebook motivation, and loneliness will be introduced according to
theories and empirical studies. Adequate observable items will quantitatively
define each term. Factor analysis will be applied to explore the underlying
phenomenon. After extracting factors, new variables will be formed and
descriptive analysis will be added to present the general condition among the
population.
Q2: Is there correlation between loneliness and the use of social media? If there
is, it is positive or negative?
This question aims to solve the puzzle whether social media influence the
7
psychological loneliness of international students. In the introduction part, the
potential influence of social media was discussed. Inevitably, the use of social
media will directly or indirectly exert influence on people’s experience of
loneliness. The influence could be positive, negative. By using Spearman
correlation analysis (Bolboaca & Jäntschi, 2006) of the survey data, this
research question will be answered.
Q3: Do demographically different students use Facebook differently?
Analysis of variance will be applied in this question. I want to find out whether
age, gender, ethnicity and other personal backgrounds change how students
use Facebook.
1.2 Structure of the Study
The thesis will start by providing and analysing the present studies on social
media area that have featured the influence social media exert on the behaviour
and characteristics of the users. On the other hand, the present and previous
researches on loneliness will also be introduced in the thesis.
To examine the subjective perception of loneliness, scientific and
comprehensive tools will be introduced. Russell et al., (1980) have developed
the commonly used tool called Revised UCLA Loneliness Scale for the
measurement of loneliness, and it has achieved common agreement in the field
of social psychology. The scale has 20 statements to examine the loneliness
level of the respondents. The measure of social media will base on the previous
quantitative studies on social media usage. In addition, being an international
student in University of Helsinki myself, I will also add my own understanding,
experience and observations of the international students in University of
Helsinki. The measurements of social media usage pattern mainly consist of the
intensity, effects, social circle, and social media disclosure. These
measurements will be discussed detailedly in the methodology chapter.

8
Based on the theoretical backgrounds, a convincing measure of independent
and dependent variables, the survey will be conducted among the international
students in the University of Helsinki. After obtaining the responses, SPSS will
be applied as the quantitative analysis software. Factor analysis, spearman
correlation and analysis of variance (ANOVA) will be used to examine the three
research questions respectively. The following chapters will further discuss the
findings of the data analyses according to the theories, and try to draw
conclusions and discussions.
2. Literature Review 2.1 Social Media “Social media are computer-mediated technologies that allow the creating and
sharing of information, ideas, career interests and other forms of expression via
virtual communities and networks” . Christensson (2013) defined social media as
collective Internet-based communities where users interact with each other
online. This consists of various platforms that have different features, such as
web forums, wikis, and user generated content sites. In social media, users can
create their own profile, post contents, share videos, react to others’ posts, and
comments. In the 21st century, the rapid growth of the popularity of social media
and users proved the dramatic development of social media technology and the
decentralization. It is no longer high-tech that is owned by few elites like in the
beginning of social media era, but a common tool for whoever has Internet
access and communication devices. The popularization of social media means
the change of lifestyle for all hierarchies of society.

9
Correa, Hinsley and Zuniga (2010, p.247-248) defined social media as digital
mechanism which enables users to “connect, communicate and interact” with
friends or strangers. And this mechanism could be practiced through instant
message or through social networking sites. According to Correa et.al (2010,
p.248), most of the researches on the use of social media have been sorely
focused on social networking sites. Raacke and Bonds-Raacke (2008, p.169)
clarified that social networking sites were virtual collections of audiences’ profiles,
which could be viewed and shared by other users, in order to forster
interpersonal communication, or simply keep in touch. This virtual collection of
profiles creates a list of friends for each SNS registered users, and the users
included on this list have access to his or her virtual profile. This list indicates the
user’s virtual connections with others.
Survey showed that college students used social media to maintain friendships
with offline acquaintances by online interactions, rather than to make new
friends with strangers (Ellison et al., 2007; Sheldon, 2008). In the survey (Ellison
et al., 2007), they also found out that using Facebook had a strong and positive
influence on strengthening social capital.
Baker & Oswald (2010) discovered that online social media created a
comfortable environment to interact with others without face-to-face interaction
for shy people who frequently experienced less social communication and lack
of social support due to the shyness. Using Facebook improves relationship
quality because it is easier and more accessible to communicate online; it
creates comfortable zone for people who are lack of social skills; users spend
more time in interaction via social media so that they know each other better and
feel more social support (Baker & Oswald, 2010). Social support received via
online interaction helps to maintain existing relationships and also improves the
quality of life for college students (Lui & Larose, 2008). The benefit of social
media takes place not only by direct interactions such as sending out direct
messages to someone, but also by indirect interactions such as broadcasting
and receiving comments and likes.

10
2.2 Social Media Addiction Hawi & Samaha (2017, p.2) perceived social media addiction as the compulsive
use of social media that reflected behavioral addictive symptoms. Griffiths (2005)
earlier pointed out these behavioral symptoms contain the following six aspects:
“salience, tolerance, conflict, withdrawal, relapse and mood modification”
(Griffiths, 2005). Andreassen, et al. (2012, p.502) reviewed recently published
researches on social media addiction and indicated that social media were
mostly used for maintaining offline networks that were previously established in
real life. It corresponded to the findings of Kesici & Sahin (2009) that addicted
Internet users use the social functions more than the non-addicted Internet users.
Facebook use, or in other words, social media use, are linked to personality
traits. People who have a higher degree of narcissism tend to use social media
more actively than others, because social media provides a platform to present
their ideal selves in a desired way (Buffardi & Campbell, 2008, p.1310). In
another research, the different purpose of social media use was identified
between extroverts and introverts. Kuss & Griffiths (2011) uncovered that
extroverts use social media for enhancement, meaningly enhancing offline
relationships; whereas introverts use social media for compensation, meaningly
compensating the deficiency of offline social network by online social activities.
Many studies were carried out to examine the link between self-esteem and use
of social media (Denti et al., 2012; Gonzales & Hancock, 2011; Steinfield, Ellison,
& Lampe, 2008). And these studies found out that there was a significant
correlation between self-esteem and the use of social media, more specifically,
people who have low self-esteem tend to use more social media to improve their
self-esteem, self-image and self-identity. Other empirical studies found out that
technological addictions, including social media addiction, led to the negative
psychological experience, such as stress, anxiety and depression; On the other
hand, this addiction led to bad academic performance and satisfaction of life
(Hawi & Samaha, 2016; Kuss, Griffiths, Karila, & Billieux, 2014; Lepp, Barkley, &
Karpinski, 2014).

11
2.3 Loneliness The studies of loneliness flourished in the 1970s. The publication of Weiss (1973)
of Loneliness: The experience of emotional and social isolation was an important
milestone in the history of loneliness studies (Peplau & Perlman, 1982), and this
book provided guidances for the empirical researches in loneliness. Based on
Weiss’s perspectives, the UCLA Loneliness Scale (Russel et al., 1978) was
fostered, and it has been widely recognized instrument to assess loneliness
scientifically and systematically.
Weiss (1973 p.17) defined loneliness as a response to the absence of certain
particular type of relationship, or relational provision. And loneliness is an
unpleasant emotion due to self assessment of individual’s own social network.
Weiss (1973) argued that staying with human being from infancy throughout life
there is a universal need for intimacy. Perlman and Peplau (1981, p.31) defined
loneliness as “the unpleasant experience that occurs when a person’s network
of social relations is deficient in some important way, either quantitatively or
qualitatively”. Perlman and Peplau (1982 p.5) later added that loneliness could
be regarded as a result from individual’s perceived discrepancy between the
desired level and the achieved level of social contacts. According to this
definition raised by Peplau and Perlman, it is essential to recognise the
significance of individual’s social needs or desire. Because the feeling of
loneliness is caused by the discrepancy between desired and achieved level of
social contacts. Therefore, different people have very varied perception of being
lonely, and one person can have different thresholds of being lonely throughout
the whole life. “ Personal and situational changes may also affect people’s
needs or desires for companionship and intimacy” (Peplau & Perlman, 1982).
Peplau and Perlman (1982) pointed out three collective agreements in
loneliness studies. Firstly, it is a result of deficiencies in an individual’s social
relationships. Secondly, it is a subjective experience rather than an objective
social isolation, which means that being in a crowd or being alone does not
determine whether a person feels lonely or not. Thirdly, the experience of

12
loneliness is unpleasant and distressing, rather than cheerful or peaceful.
Personal characteristics and situational factors can influence individual’s
vulnerability to loneliness (Peplau & Perlman, 1982). They identified a series of
personal characteristics that were closely connected to loneliness, such as
shyness, introvert, less willing to take risks in social activities, self-deprecation,
low self-esteem, inadequate social skills stemming from childhood, etc.
2.4 Social Media and Loneliness: Empirical Studies Olds and Schwartz (2009) claimed that, despite the fact that this generation has
more devices and technologies that help people to stay connected, the feeling of
loneliness in 21st century America is the highest of all times so far. Do virtual
connectivities contribute to combating loneliness? Empirical studies have
produced mixed findings of the link between social media and loneliness. Some
studies found out that online communication through social media potentially
enhanced the social support and self-esteem that users may perceive, and
reduced loneliness and depression (Shaw & Gant, 2002). However, some other
studies argued that online communication potentially isolated individual users in
real life and gave rise to low well being (Kim, Larose, & Peng, 2009).
Pittman and Reich (2016, p.162-163) carried out a quantitative research among
over two hundred undergraduate students of journalism major and business
major in a university in the United States. They discovered that people who used
Facebook were significantly less happy than the people who didn’t use
Facebook. Pittman and Reich (2016, p.163) speculated that Facebook use
would give rise to loneliness and decrease the satisfaction with life and feeling of
happiness. In opposition, Ryan and Xenos (2011, p.1663) conducted a survey
among over one thousand university students in Australia, and they concluded
that people who use Facebook have higher degree of family loneliness than
non-users. And they found out that lonely people spend more time on Facebook
than people who don’t feel lonely, and the purpose for the lonely people to use
Facebook is not to strengthen their social capital, but to browsing online

13
contents from other users.
Is loneliness the cause of heavy social media usage, or is loneliness the result of
heavy social media usage? Morahan-Martin and Schumacher (2001, p.25)
stated online communication was easier and less embarrassing than
face-to-face communication for lonely and depressed people, social media
helped to combat their desire for social interaction, in results it led to higher
preference of using social media for communication. Social media and online
communication appealed to their need of socializing and avoided their
personality shortcomings, in results some of them devoted excessive time on the
Internet, which potentially led to behavioral symptom called “compulsive use”
(Caplan, 2005, p.725). As a result, the compulsive use of social media would
replace with time of offline social engagement. Lonely people are dissatisfied
with their offline relations due to deficient social skills; they turn to use more of
online communication for compensation (Kim, LaRose, & Peng, 2009, p.452).
Kim et al.(2009, p.452-454) conducted a survey among over six hundred
university students in the United States, they found the malicious cycle of
loneliness and Internet use. Lonely people who find maintaining offline
interactions difficult, tend to use Internet (including social media) excessively,
which lead to additional problems such as bad academic performance, missing
class or work, and depression, etc. These additional problems motivate their
desire to escape from real life problems to the Internet, which isolate them more
and lead to increased loneliness. However, this research tested not only the
social media, but Internet use as a whole. According to the same research, the
top three most frequently used Internet functions are: downloading,
entertainment applications, and social media. Downloading significantly led to
loneliness, entertainment applications led to low wellbeing, and regulated use of
social media were harmless. In other words, among all the Internet uses, it is not
social media that significantly causes loneliness.
In a comparison study, Burke, Marlow and Lento (2010) uncovered the contrary
effects of using social media by differentiating active use and passive use.

14
Actively using social media refers to that users use social media in active ways,
such as posting status updates and sending messages to other users, which can
be regarded as generating contents. Passively using social media refers to that
users use social media in passive activities, such as browsing information and
viewing others’ posts, which can be regarded as intaking contents. Burke et al.
(2010, p.1912) concluded that active use of social media decrease loneliness
and increase social capital, whereas passive use of social media increase
loneliness and decrease social capital.
The aforementioned studies were all based on survey results, which relied on
participants’ subjective self-report. Deters and Mehl (2013) did an experiment
among university students to find out whether posting Facebook status updates
caused loneliness or relieved loneliness. By comparing the experimental group
and controlled group, a significant difference was identified: posting more status
updates on Facebook would reduce loneliness, and such effect lied in the fact
that frequent posts makes users feel stronger daily social connection with their
friends.
Social comparison orientation is the mental activity to compare someone’s own
achievements, experiences and situations with those of others (Buunk &
Gibbons, 2006, p.16). This kind of social comparison uses other people’s status
as objective criteria for self-assessment (Festinger, 1954). Wood (1989) defined
social comparison into two categories: upwards and downwards. Upwards social
comparison is to compare oneself with someone who is better than him or her, in
order to improve oneself; downwards social comparison is to compare oneself
with someone with who is worse than him or her, in order to feel better of oneself.
Social media provide rich contents for interior social comparison activities, users
mostly post positive self-image (Yang & Brown, 2016), it would make the users
engage more in the upwards social comparison, which potentially leads to envy
and low self esteem (Lim & Yang, 2015).
The use of social media is beneficial for social interactions, but it might also
15
cause social comparison (Yang, 2016, p.2). Yang (2016, p.4) found out that
social comparison orientation is the moderator between use of social media (i.e.
Instagram) and loneliness. For people of higher tendency of social comparison,
Instagram use does not help to reduce loneliness, whereas for people of lower
tendency of social comparison, Instagram use helps to reduce loneliness.
2.5 Use and Gratification Theory Use and gratification theory was firstly used to examine the patterns and
motivations of audiences of the traditional media such as newspaper,
broadcasting and television (Katz & Blumer & Gurevitch, 1974). Therefore, the
patterns can be explained as how people use media, and the motivations can be
explained as why people use media. According to use and gratification theory,
audiences/users differ in the gratifications they expect from the mass media.
With the rapid growing speed of social media and their interactive feature, there
is an emerging trend that researchers apply the use and gratification theory to
the use of social media (Flanagin, 2005). This theory accesses media in a
psychological perspective that is greatly different from the traditional approach,
which regards individuals as passive recipients (Urista & Dong & Day, 2009).
However, use and gratification theory emphasizes on what people do in media,
how people use media, and why people use media, rather than the consequent
influence that media have on individuals (Katz, et al., 1974).
Wilbur Schramm (1949) introduced the concepts of immediate rewards and
delayed rewards in the theory of news reading. According to Schramm (1949),
the basic assumption is that news reading must be rewarding in either way. This
corresponds with Freud’s (1958) concepts of the pleasure principle and reality
principle (Pietilä, 1968). Some news items provide immediate reward (pleasure
principle), which means the reading offers immediate pleasure for the audience.
This can be a decrease of tension or discomfort, or an increase of joy or
satisfaction. On the other hand, some news items provide delayed reward
(reality principle), which means the reward will be gained sometime later. This
can be learning the realistic incidents to help prevent future danger and harm.

16
Schramm’s news reading theory is earlier interpretation of use and gratification
theory.
The use and gratification approach determines media by a set of different
evaluations: “people’s needs and motives of communication, the psychological
and social environment, the mass media, the functional alternatives to media
use, communication behavior, and the consequences of such behavior” (Rubin,
1994, p.419). Kayahara and Wellman (2007) have generalized two categories of
media gratification: process and content. Process refers to the gratifications that
people gained during the conduct of the activities, such as browsing or
generating contents. By contrast, content refers to the gratification that
individuals obtain from the acquisition of information. Starkman (2007, p.211)
generalized the motivations for using the Internet mainly as “relaxation, fun,
encouragement and status”. Cho (2007, p.341) had a similar view, that he
demonstrated the motivations as “interpersonal relations, information, and
entertainment”. Sheldon (2008) discovered the gender differences when it
comes to the motives for the use of Facebook. She concluded that women used
Facebook mainly to maintain offline relations, pass-time, and entertainment. By
contrast, men tended to use to Facebook to develop new relations and meet
new people. Donath and Boyd (2004) proposed that social media enabled the
reinforcement of weak ties within a community, because Internet as a tool
helped to maintain weak ties cheaply and easily.
Empirical studies revealed the gratifications of using social media, which is a
combination of process and content (Song, Larose & Eastin, 2004, p.386). The
forms of social media are various and each kind of media facilitates unique
communication needs, which provides biased rewards and social consequences
for its users (McLuhan & Powers, 1989). Quan-Haase & Young (2010) applied
the use and gratification theory in social media by a comparison study of
Facebook and instant messaging. They discovered that online lurking
contributed to gratification, because the social information obtained from
Facebook helped users to feel they were part of a peer network. In the same

17
time, receiving comments and timeline posts from others through social media
contributes to better self-image that people have on themselves (Urista et al.,
2009). This is because timely and sufficient responses and reactions from others
make individuals feel they attract attention, which improves the gratification of
personal and interpersonal desires (Urista et al, 2009).
Scholars have criticized the use and gratification for the narrow focus on
individual users (Elliot, 1974). This criticism schools held that use and
gratification theory failed to interpret why people used a certain kind of medium
and how a certain gratification was achieved by using this medium. Moreover,
many central concepts of use and gratification theory remained unclear
(Swanson, 1977). In response to the critiques, Wenner & Rayburn (1980)
developed the theory with two distinct kinds of gratification within the use and
gratification theory: gratification obtained and gratification sought. Gratifications
obtained refer to the gratifications that audiences or users actually experience
during the use of a certain kind of medium. On the other hand, gratifications
sought refer to the gratifications that audiences or users expect to obtain from
the medium in prior to the actual use, which is also considered as the
motivations for using a certain medium. The gratifications obtained and
gratifications sought are likely to be different. When the gratifications obtained
equals or surpasses the gratifications sought during the use of a certain medium,
the persistent use of the medium is very likely to happen (Palmgreen & Payburn,
1979). Researchers have discovered that gratifications obtained are strong
predictors that explain the media exposure than the gratifications sought
(Sheldon, 2008). Most researches in use and gratification theory only were
focused merely on the obtained gratifications, which ignored the analysis of
expected gratifications that individuals sought for initially.
Overall, use and gratification theory has provided an advanced theoretical
approach in the initial stage of all communication media, from traditional media
to new media (Ruggiero, 2000). Lin (1996, p.574) concluded that the major
strength of the use and gratification theory was the ability and potential to allow

18
researchers to investigate “mediated communication situations via a single or
multiple sets of psychological needs, psychological motives, communication
channels, communication content, and psychological gratifications within a
particular or cross-cultural context”.
2.6 Description of Facebook Facebook is a leading online social media and social networking site founded by
Mark Zuckerberg in 2004. In the initial stage, Facebook was only limited to
Harvard students. Gradually with the influence and quick popularity, Facebook
developed to other higher education institutions and various American
universities. At first, Facebook membership has various requirements such as
age, and later on, it gradually abandoned the limitations and was open to
everybody who has a valid email address, and it is now all over the world except
blocking countries.
Users can access Facebook from a variety of devices with Internet connection,
including desktop, laptop, tablet, and mobile phones. Users can create their own
profile that includes personal information such as name, date of birth, occupation,
education, professional skills, hometown, city of residence, status of relationship,
family members, favourite motto, interests, and so on (Facebook for IOS,
version 68.0). Members can add friends, post status, send messages, upload
photos and videos, share links, post in other friends’ timeline, comment or react
to other’s posts, join groups, create and promote event, create pages, and so on.
Facebook allows users to control the list of friends of their own account, they can
send friend request; and when they receive a friend request from others, they
can accept or ignore. The users also can control who, can view how much
information, by editing the privacy settings. Users can tag themselves or be
tagged by others in a picture or a post, and they can choose to accept the tag or
remove the tag. When accepting the tag, the post or photo will be shown also to
the tagged person’s timeline.
19
3. Methodology Initially, literature analyses were applied to collect, sort and review the primary
and secondary documents. Based on the existing documents and relevant
indicators, I quantified the core concepts and research questions of this study;
therefore, outlined the design of questionnaire elements.
The following are the steps and purposes of literature analysis used in this study.
Firstly, determining the scope of the literature. By narrowing the scope of the
study, several keywords such as social media, loneliness, use and gratification
were used to search for manageable sizes of literatures that were to be analysed.
Secondly, collecting relevant documents. After determing the scope of literatures,
quickly review the abstracts of each article, and collect relevant literatures and
put them into categories by topic. Thirdly, analysing useful information.
According to the topical categories, read and identify relevant information and
establish the frames of survey. Forthly, excavating the content of the literature.
Dig into the contents during the process of reviewing the literatures, compare it
with the research topic nd revise the perspectives of the research.
In this chapter, I will explain the methods that are used in this thesis in order to
examine and analyse the research problems and research questions. By
applying specific quantitative measurements for abstract terms, I will provide the
survey design and analyse approach.
3.1 Research Design Corresponding to the research problem, a set of specific analytical questions are
introduced in this flowchart, which makes it clear of what is needed to be
examined and with which statistical method respectively.
20
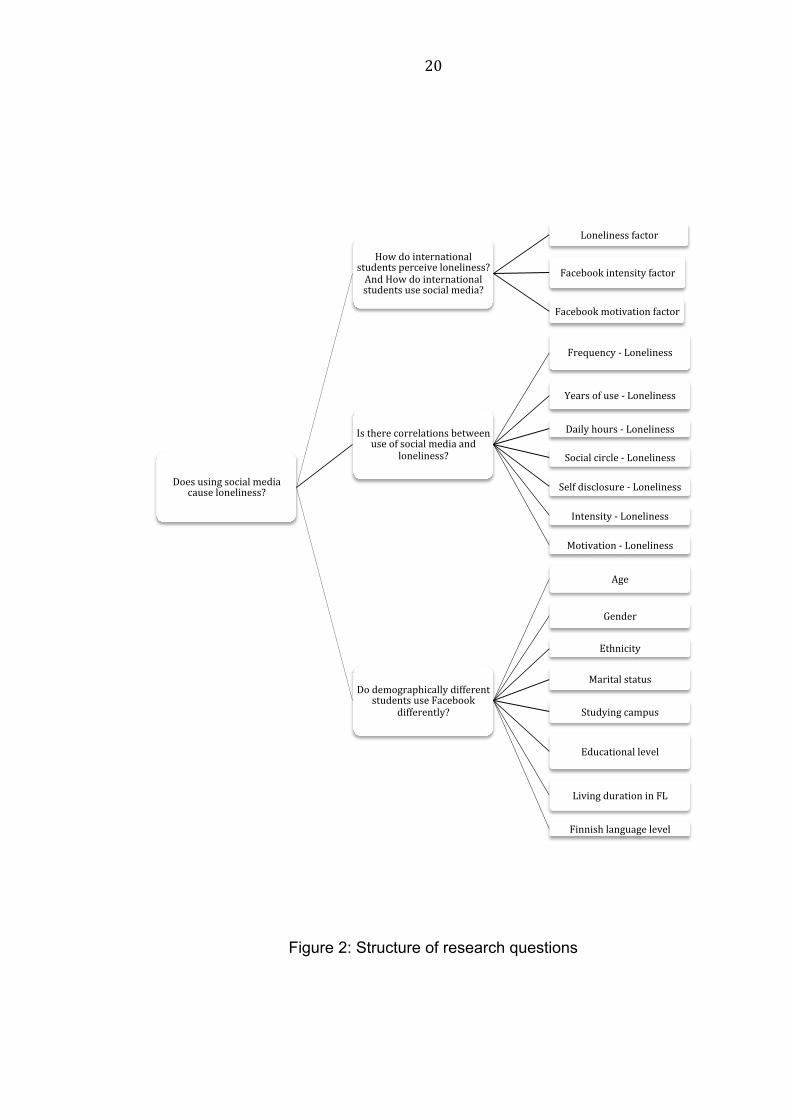
Figure 2: Structure of research questions
Doesusingsocialmediacauseloneliness?
Howdointernationalstudentsperceiveloneliness?AndHowdointernationalstudentsusesocialmedia?
Lonelinessfactor
Facebookintensityfactor
Facebookmotivationfactor
Istherecorrelationsbetweenuseofsocialmediaand
loneliness?
Frequency-Loneliness
Yearsofuse-Loneliness
Dailyhours-Loneliness
Socialcircle-Loneliness
Selfdisclosure-Loneliness
Intensity-Loneliness
Motivation-Loneliness
DodemographicallydifferentstudentsuseFacebook
differently?
Age
Gender
Ethnicity
Maritalstatus
Studyingcampus
Educationallevel
LivingdurationinFL
Finnishlanguagelevel
21
3.2 Survey Design
Questionnaire is a research method that collects information by asking
questions in paper. The researcher compiles the questions that are to be studied
into questionnaires, and get the answers by post, face to face or follow-up visits.
Nowadays online survey is quite common and convenient. The key to the use of
questionnaires is the preparation of questionnaires, selection of subjects, and
analysis of the results.
As shown in the graph, in order to solve the research problems, the original data
that can be obtained through questionnaire should contain the information of
three parts: loneliness, social media and demographic background. Therefore,
the survey is designed accordingly. A short description of the purpose of the
study, information of anonymity and handling of the data is endorsed in the
beginning of the survey. Part one contains demographic information such as age,
gender, ethnicity, marital status; and also other background information which
could potentially cause different perception of loneliness and different habit of
social media due to cultural adaptation, these are studying campus, educational
level, living years in Finland, and Finnish language level. Part two contains the
adjusted UCLA loneliness scale, which contains 20 observable items linked to
loneliness. Part three contains social media usage patterns, these include
frequency, using years, weekly average hours, number of Facebook friends,
self-disclosure degree, activity intensity and motivation. In part three,
self-disclosure degree, intensity and motivation are composed of 6, 28, 24
observable items respectively.
3.3 Measurements 3.3.1 Loneliness Measurement Scale Russell et al., (1980) have developed the commonly used tool called Revised
UCLA Loneliness Scale for the measurement of loneliness, and it has achieved
common agreement in the field of social psychology. The scale has 20
statements to examine the loneliness level of the respondents.

22
Instructions: Indicate how often you feel the way described in each of the following
statements. Circle one number for each.
Never Rarely Sometimes Often
*1. I feel in tune with the people around me 1 2 3 4
2. I lack companionship 1 2 3 4
3. There is no one I can turn to 1 2 3 4
*4. I do not feel alone 1 2 3 4
*5. I feel part of a group of friends 1 2 3 4
*6. I have a lot in common with the people
around me
1 2 3 4
7. I am no longer close to anyone 1 2 3 4
8. My interests and ideas are not shared by
those around me
1 2 3 4
*9. I am an outgoing person 1 2 3 4
*10. There are people I feel close to 1 2 3 4
11. I feel left out 1 2 3 4
12. My social relationship are superficial 1 2 3 4
13. No one really knows me well 1 2 3 4
14. I feel isolated from others 1 2 3 4
*15. I can find companionship when I want it 1 2 3 4

23
*16. There are people who really understand
me
1 2 3 4
17. I am unhappy being so withdrawn 1 2 3 4
18. People are around me but not with me 1 2 3 4
*19. There are people I can talk to 1 2 3 4
*20. There are people I can turn to 1 2 3 4
Figure 3: The Revised UCLA Loneliness Scale, by Russell et al, 1980
The score should calculate the items with asterisks reversely. In this thesis, I will
slightly adjust the Revised UCLA Loneliness Scale so as to simplify the analysis
process. More specifically, the adjustment is to replace the reverse items in the
normative tense like the other items. This makes the calculation easier and can
simply sum up a score of loneliness.
3.3.2 Usage patterns of social media Facebook is chosen as the example of social media; most of the questions are
developed according to the systematic features of Facebook. However, some
other questions about general social media use are included in the survey.
Social media frequency question is conducted via self-report basis, by rating
from one to five. Facebook duration means how long has someone been using
Facebook, which is ordinal year numbers. Daily hours spent on Facebook is
self-measured by ordinal hours. Social circle in this case, can be referred to as
number of Facebook friends, which is also ordinal number.
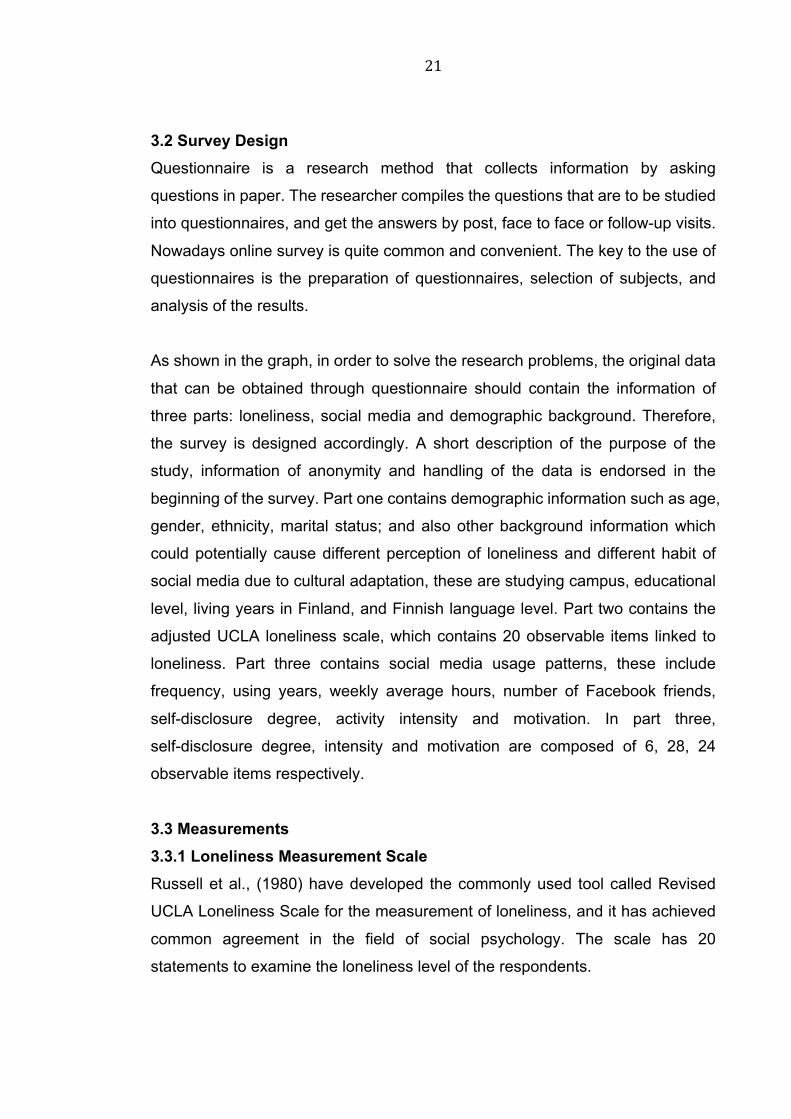
There are three other questions that consist of Likert scale with multiple items.
Facebook self-disclosure, which consists of six aspects of information that one
discloses in Facebook. These six items are extracted from Facebook profile
information list.
24
(1=strongly disagree, 3=neutral, 5=strongly agree)
Figure 4: Self-disclosure Measurement.
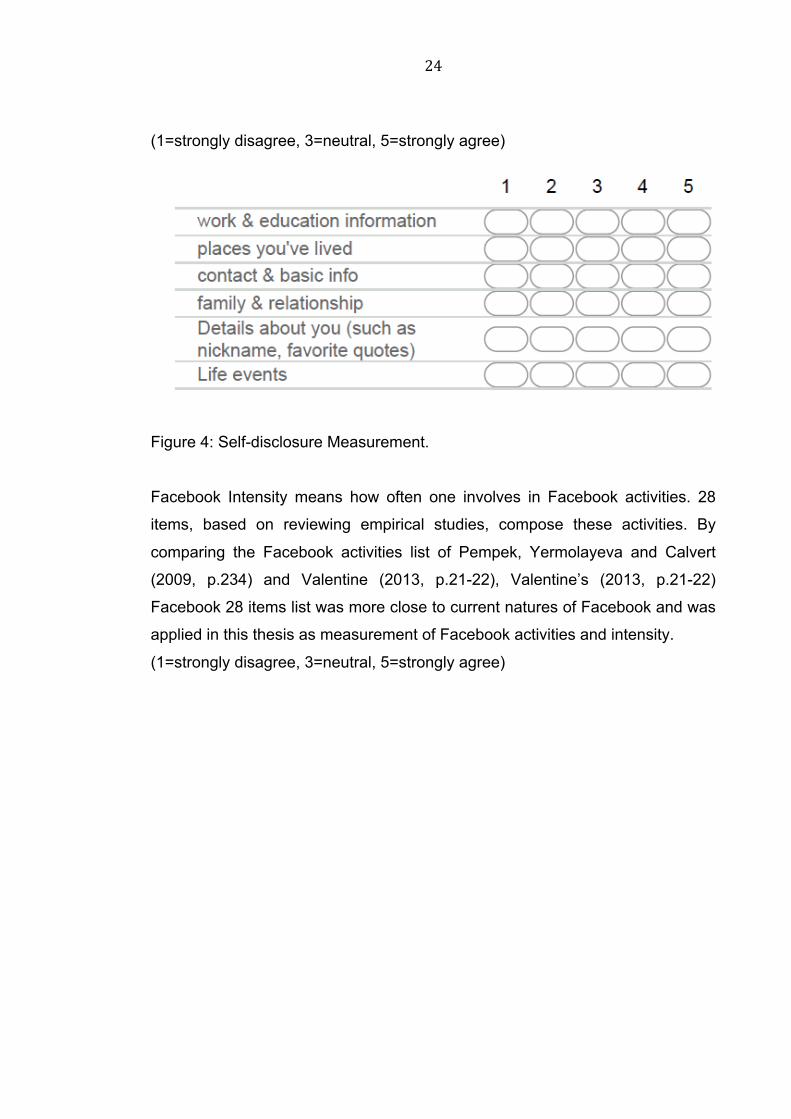
Facebook Intensity means how often one involves in Facebook activities. 28
items, based on reviewing empirical studies, compose these activities. By
comparing the Facebook activities list of Pempek, Yermolayeva and Calvert
(2009, p.234) and Valentine (2013, p.21-22), Valentine’s (2013, p.21-22)
Facebook 28 items list was more close to current natures of Facebook and was
applied in this thesis as measurement of Facebook activities and intensity.
(1=strongly disagree, 3=neutral, 5=strongly agree)
25
Figure 5: Facebook Intensity Measurement, referred to Valentine (2013,
p.21-22).

26
Another preexisting measurement of motivations for using Facebook was
adopted in this research. Leung (2001) developed the Instant Messaging
Motivation Scale according to the traditional theory of use and gratification by
Rubin (1979), and tested multiple times. Quan-Haase & Young (2010) adopted
Leung’s motivation scale and used in the examination of Facebook motivation.
(1=strongly disagree, 3=neutral, 5=strongly agree)

27
Figure 6: Facebook Motivation Measurement, referred to Quan-Haase & Young
(2010)
3.4 Data Collection The survey was conducted through google forms1 online. There were two
methods of obtaining the survey answers: one method is to post the survey in
International student groups in University of Helsinki in Facebook, and the other
method is to send email of survey link by membership email list through the
International student organization of University of Helsinki. Both email and
Facebook group contain not only the survey questionnaire, but also a brief
introduction of the purpose of the study, information about use of the data,
information about confidentiality and incentives. Survey samples were collected
randomly via the Facebook groups and emails, and participants filled the survey
voluntarily. The incentives are conducted by random lottery draw among all
participants who have submitted their contact information through a separate
link after completing the survey. A separate link is to ensure that all of the survey
questions remain anonymous and will not connect with the contact information.
The incentives are introduced in the survey process in order to obtain a
satisfactory amount of sample for the quantitative analysis.
In total, 112 international students filled in the survey, no missing data, which
makes the data of all the respondents valid for the research. Likert (1932) scale
is a commonly recognized tool to measure attitude in the field of social science.
In this study, the survey design applied Likert scale in the measurement of
subjective concepts. SPSS (version 22.0) will be applied as the quantitative
analysis software. Factor analysis, analysis of variance, and correlation analysis
are chosen as analytical tools in this thesis.
3.5 Factor Analysis Field (2013, p.666) mentioned that factor analysis was used to identify the
1 https://docs.google.com/forms/
28
clusters of variables, which served in three aspects: to measure things that could
not be directly measured, in order to discover the structure of a group of
variables; to reduce the variable sets while reflecting the original information as
much as possible; to establish a set of questionnaires to measure an abstract
variable.
The aim of factor analysis is to reduce dimensionality, when the operational
measurements and observable variables share a common variance but cannot
be observed directly (Bartholomew, Knotts, & Moustaki, 2011). Factor analysis
helps to identify the underlying common factors. The entire group of variables
can be differentiated into different groups of factors, which are ideally
uncorrelated with the other factors. Three factor analyses will be applied for
loneliness, Facebook intensity, and Facebook motivation, in other words
“gratification sought”. In each of these three abstract concepts, over 20
observable variables were included for the purpose of operational definition.
Factor analysis is the method of dimensionality reduction, after the process of
factor analysis; a few uncorrelated common factors could be identified to explain
the major influential factors of each concept.
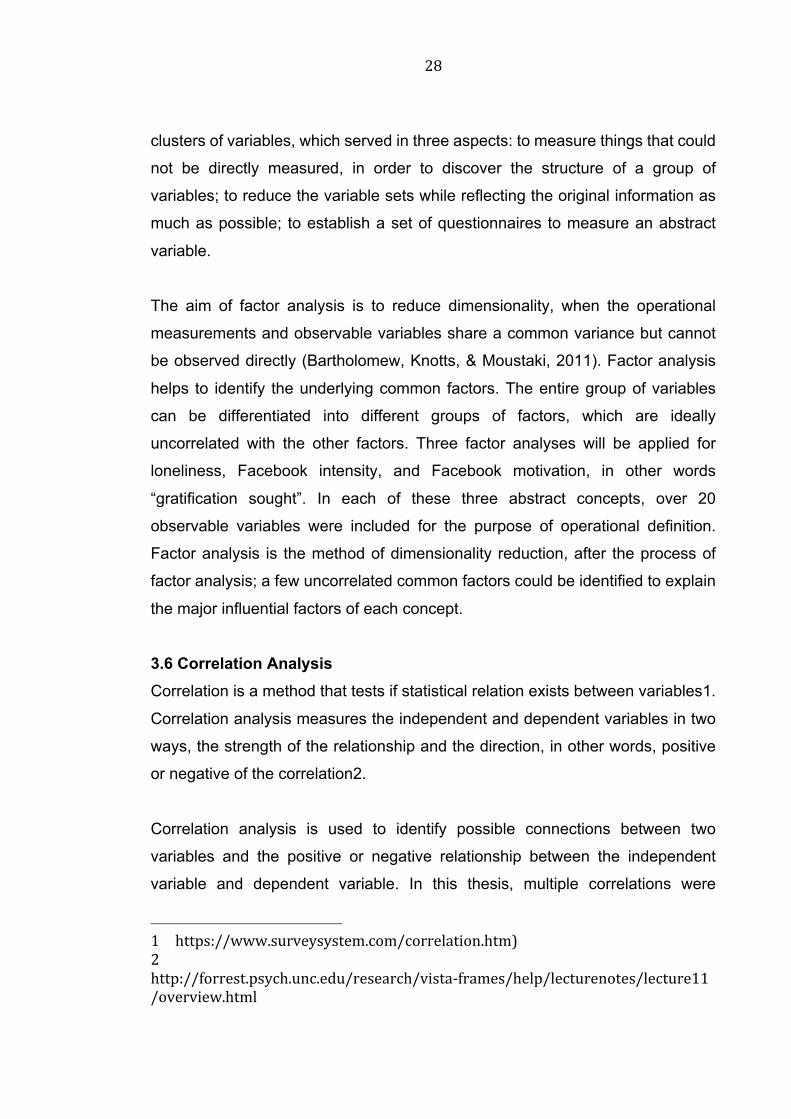
3.6 Correlation Analysis Correlation is a method that tests if statistical relation exists between variables1.
Correlation analysis measures the independent and dependent variables in two
ways, the strength of the relationship and the direction, in other words, positive
or negative of the correlation2.
Correlation analysis is used to identify possible connections between two
variables and the positive or negative relationship between the independent
variable and dependent variable. In this thesis, multiple correlations were
1 https://www.surveysystem.com/correlation.htm)2 http://forrest.psych.unc.edu/research/vista-frames/help/lecturenotes/lecture11/overview.html

29
applied in order to identify the possible causal relationship between variables. In
the correlation analysis, Loneliness scale that contains 20 variables on a scale
of 1-4 is calculated as a sum that represents the loneliness level of each
individual. Similarly, Facebook self-disclosure which contains of 6 variables on a
scale of 1-5 is calculated as a sum which represents the Facebook
self-disclosure level of each individual; Facebook Intensity which consists of 28
variables on a scale of 1-5 is calculated as a sum which represents the how
intensive each participant use Facebook; Facebook motivation which consists of
24 variables on a scale of 1-5 is calculated as a sum which represents how
strong the motivation is for each respondent to use Facebook. Loneliness as
dependent variable, several social media usage patterns as independent
variables, correlations are tested between each of them in order to identify
whether social media usage cause loneliness and in which specific way.
3.7 Analysis of Variance/ANOVA Analysis of Variance is also called ANOVA, which is the method to compare the
difference of means when there are more than two groups in a linear model
(Field, 2013, p.430).
It is a statistical method to examine the statistical differences among the mean
value of different groups. In this thesis, I would like to examine whether different
demographic groups have different media habit. The demographic independent
variables are: age, gender, ethnicity, marital status, studying campus,
educational level, living duration in Finland, and Finnish language level. The
dependent variables are Facebook Intensity and Facebook motivation.
4. Analysis 4.1 Factor Analysis results In this chapter, three factor analyses are carried out with SPSS (version 22.0):
the loneliness factor, the Facebook intensity factor, and the Facebook motivation
factor. This chapter corresponds to the research question Q1, and the factor

30
results will answer to Q1. Such data analysis consists of many statistical graphs.
However, to maintain a clear and understandable layout, SPSS output graphs
are only fully demonstrated in 4.2.1 as an example to show how the analysis is
processed. The other two factor analyses are conducted in a same way with
same set of graphs which only differs in result numbers, therefore, the less
relevant graphs will not be shown in the main text but only the one rotated
component matrix and the results. At the end of each factor analysis, a short
descriptive analysis will be included to present the general loneliness/Facebook
intensity/Facebook motivation level of the sample, which also refelcts the
population.
4.1.1 Loneliness factors In this chapter, I will present five tables for the factor analysis process in order to
present how the factor analysis is done. And statistical explaination will be
added at the end of each table.
1. The precondition for factor analysis
Figure 7: KMO and Bartlett's Test
Kaiser-Meyer-Olkin Measure of
Sampling Adequacy.
.925
Bartlett's Test
of Sphericity
Approx.
Chi-Square
1280.88
6
Df 190
Sig. .000
Explanation: Normally, when the KMO>0.7, it indicates that factor analysis
model suits the data and the examination effect is good. In this case, the KMO
value for this model is 0.925, which means the model test works well. In addition,
the Sig. value of the spherical test is .000, which passed the significance test.

31
Factor analysis can be applied.
2. Indicator variables communalities
Figure 8: Communalities
Initial
Extractio
n
VAR1 1.000 .633
VAR2 1.000 .416
VAR3 1.000 .714
VAR4 1.000 .617
VAR5 1.000 .457
VAR6 1.000 .551
VAR7 1.000 .688
VAR8 1.000 .560
VAR9 1.000 .479
VAR10 1.000 .671
VAR11 1.000 .639
VAR12 1.000 .671
VAR13 1.000 .610
VAR14 1.000 .471

32
VAR15 1.000 .598
VAR16 1.000 .672
VAR17 1.000 .601
VAR18 1.000 .686
VAR19 1.000 .715
VAR20 1.000 .731
Extraction Method: Principal
Component Analysis.
Explanation: VAR 1- 20 are the 20 tems that defines loneliness according to
theory and empirical study, which can be refered to in the methodology chapter.
The extraction column mainly represents the common degree of variables when
the feature roots are extracted according to the specified conditions, and reflects
the explanation proportion of the common factor to the variance of each variable.
The above table shows that only the variables of 2,5,9,14, “I have nobody to
talk to”, “nobody really understands me”, “my interests and ideas are not shared
by others”, “I am starved for company” have a lower degree of commonality.
Other variables are all above 50%. This can basically reflect the information of
original data, that is to say, the original variable information can basically explain
the extracted factors.
3. Common factors interpretation of principal components
Figure 9: Total Variance Explained
Comp
onent Initial Eigenvalues
Extraction Sums of
Squared Loadings
Rotation Sums of
Squared Loadings

33
Tot
al
% of
Varia
nce
Cumul
ative
%
Tot
al
% of
Varia
nce
Cumul
ative
%
Tot
al
% of
Varia
nce
Cumul
ative
%
1 9.3
86
46.9
30
46.930 9.3
86
46.9
30
46.930 4.8
13
24.0
66
24.066
2 1.4
78
7.39
2
54.322 1.4
78
7.39
2
54.322 3.7
68
18.8
40
42.906
3 1.3
16
6.57
9
60.902 1.3
16
6.57
9
60.902 3.5
99
17.9
96
60.902
4 .98
6
4.93
0
65.831
5 .84
6
4.23
0
70.062
6 .72
3
3.61
4
73.676
7 .65
2
3.25
9
76.935
8 .57
9
2.89
4
79.829
9 .54
5
2.72
4
82.553
10 .49
3
2.46
5
85.018
11 .44
7
2.23
6
87.254

34
12 .43
8
2.19
0
89.444
13 .35
7
1.78
6
91.229
14 .32
0
1.60
1
92.831
15 .30
3
1.51
5
94.345
16 .28
7
1.43
4
95.779
17 .23
7
1.18
6
96.965
18 .22
4
1.12
2
98.086
19 .20
0
1.00
1
99.088
20 .18
2
.912 100.00
0
Extraction Method: Principal Component Analysis.
Explanation: Three factors with eigenvalues greater than 1 were obtained. In the
initial factor solution, the first factor has a characteristic root value of 9.386, and
the variance contribution rate is 46.930%; the second factor has a characteristic
root value of 1.478, and the variance contribution rate is 7.392%; the third
factor's characteristic root value is 1.316, the variance contribution rate is
6.579%, and the cumulative variance contribution rate is 60.902%. This
indicates that the first three factors could account for more than 60% of the total

35
variance of the original variables. Although 60% is not high, it is a common result
in actual research projects. Generally speaking, in the actual project of market
research or social science research, if there is a rigorous research design and
previous qualitative research, if the variance analysis of factor analysis is over
50%, it can be accepted. After rotation changing the variance contribution rate of
each factor, the gap between the variance contribution rates of the first three
factors is significantly reduced. Therefore, the first three factors can well reflect
the information of the original variables, while the other factors have smaller
characteristic roots and have less contribution to interpreting the original
variables and can be discarded. In summary, here hree factors are extracted.
4. Factor naming and interpretation
Component matrix
Figure 10: Component Matrixa
Component
1 2 3
VAR1 .604 -.266 .445
VAR2 .598 -.174 .168
VAR3 .630 .414 .381
VAR4 .613 -.192 .452
VAR5 .653 .021 .172
VAR6 .618 -.384 .148
VAR7 .728 -.129 .375

36
VAR8 .738 .115 .052
VAR9 .640 -.076 -.252
VAR10 .720 -.319 -.225
VAR11 .722 .278 -.201
VAR12 .742 .272 -.217
VAR13 .737 -.242 -.093
VAR14 .671 .086 .117
VAR15 .728 -.101 -.241
VAR16 .790 .012 -.220
VAR17 .710 .311 -.017
VAR18 .661 -.302 -.398
VAR19 .812 .054 -.232
VAR20 .512 .682 .058
Extraction Method: Principal
Component Analysis.
a. 3 components extracted.
Rotated component matrix
Figure 11: Rotated Component Matrix 1
Component
1 2 3

37
VAR9 0.616
VAR10 0.731
VAR13 0.628
VAR15 0.674
VAR16 0.664
VAR18 0.803
VAR19 0.672
VAR1 0.764
VAR2 0.521
VAR4 0.744
VAR5 0.475
VAR6 0.603
VAR7 0.726
VAR3 0.711
VAR8 0.485
VAR11 0.593
VAR12 0.598
VAR14 0.431
VAR17 0.631
VAR20 0.851
Extraction Method: Principal Component
Analysis.
Rotation Method: Varimax with Kaiser
Normalization.
1. Rotation converged in 7 iterations.
Explanation: When the factor load is rotated orthogonally, the higher the
variable's loading on the factor, the more information the variable contains. After
the rotation, the factor loading matrix shows that factor 1 has a larger loading on
“my interests and ideas are not shared by others”, “I feel left out”, “superficial
social relationships”, “nobody really knows me well”, “feel isolated from

38
others”“difficulty to make friends”, and “feel shut out and excluded”. These seven
items are related to be isolated and named as “social isolation” factor; factor 2
has a larger loading on “unhappy doing so many things alone”, “nobody to talk”,
“lack companionship”, “nobody really understands me”, “there is no one I can
turn to”, “waiting for people to call or write” these six items are related to lack of
social support, named as “lack social support”factors; factor 3 has a larger
loading on “cannot tolerate being so alone”, “not close to anyone”, “feel
completely alone”, “unable to reach out and communicate with others”, “starve
for company”, “unhappy being so withdrawn”, “people are around me but not
with me”. These seven items can be grouped as “lack sense of belonging” factor.
In conclusion, three underlying factors of loneliness are social isolation, lack
social support, and lack sense of belonging. The main factors and their original
items can be displayed as the following table.
Loneliness Factors
Social isolation Lack social support Lack sense of belonging
My interests and ideas are
not shared by those around
me;
I feel left out;
superficial social
relationships
No one really knows me
well;
I feel isolated from others;
It is difficult for me to make
friends;
I feel shut out and excluded
by others;
I am unhappy doing so
many things alone;
I have nobody to talk to;
I lack companionship;
I feel nobody really
understands me;
I find myself waiting for
people to call or write;
There is no one I can turn
to.
I cannot tolerate being so
alone;
I am no longer close to
anyone;
I feel completely alone;
I am unable to reach out
and communicate with
those around me;
I feel starve for company;
I am unhappy being so
withdrawn;
People are around me not
with me
Figure 12: Loneliness factor result

39
Descriptive analysis of Loneliness factors After the extracting and renaming the factors, the original loneliness items are
recoded into three new variables. The Likert scale sticks to the original scale,
namely, on a scale of one to four. 1= I never feel this way, 2= I rarely feel this
way, 3= I sometimes feel this way, 4= I often feel this way.
Statistics
Social
isolation Lack social
support Lack sense of belonging
N Valid 112 112 112
Missing 0 0 0 Mean 2.0268 2.0060 1.9936 Median 2.0000 2.0000 2.0000 Mode 2.00 1.67a 1.00 Minimum 1.00 1.00 1.00 Maximum 3.71 3.83 3.86
a. Multiple modes exist. The smallest value is shown Figure 13: Loneliness factor descriptives
As shown in the table, the mean value of social isolation is 2.0268; median value
is 2; mode is 2; minimum value is 1 and maximum is 3.71. Therefore, we can
conclude that international students in UH averagely (Mean) and mostly (Mode)
rarely feel social isolation. However, there is big variance among the population,
some never (Minimum) feel social isolation while some often (Maximum) feel it.
Similarly, international students in UH averagely and mostly rarely feel lack of
social support. However, a big variance exists among the population, some
never feel lack of social support while some often feel it. For the feeling of lack
sense of belonging, averagely they rarely feel that way and mostly never feel it.
Big variance also exists; some never feel lack sense of belonging while some
often feel it.

40
4.1.2 Facebook intensity factors
Similarly, eight factors are identified in Facebook intensity: browsing, initiating
interaction, updating the status, online communication, online to offline,
semi-public interaction, public information, and choose friends. The main factors
and their original items can be displayed as the following table.
Figure 14: Rotated Component Matrix 2
Component
1 2 3 4 5 6 7 8
VAR1 0.695
VAR2 0.836
VAR3 0.718
VAR5 0.742
VAR9 0.446
VAR13 0.635
VAR19 0.531
VAR4 0.561
VAR6 0.809
VAR12 0.655
VAR15 0.673
VAR18 0.705
VAR26 0.618
VAR28 0.609
VAR21 0.713
VAR22 0.627
VAR23 0.797
VAR24 0.501
VAR7 0.877
VAR8 0.855
VAR10 0.459

41
VAR17 0.834
VAR20 0.624
VAR14 0.476
VAR16 0.599
VAR25 0.765
VAR27 0.8
VAR11 0.622
Extraction Method: Principal Component Analysis.
Rotation Method: Varimax with Kaiser Normalization.
a. Rotation converged in 16 iterations.
Explanation: When the factor load is rotated orthogonally, the higher the
variable's loading on the factor, the more information the variable contains.
After the rotation, the factor loading matrix shows that factor 1 has a larger
loading on “looking at/reading other people’s profile”, “looking at photos”,
“reading/responding to news feeds”, “reading posts on others’ walls”, “looking
at groups”, “looking at video links”, “getting information from others”. These
seven items are related to browsing information on Facebook and can be
named as “browsing” factor; factor 2 has a larger loading on “reading my own
wall posts”, “posting on others’ wall”, “updating current status or news feeds”,
“adding or removing groups”, “creating groups”, “Interacting with applications,
quizzes or games”, “interacting with the company or organization pages”,
these seven items are related to “initiating interaction” factor; factor 3 has a
larger loading on “posting videos or links to videos”, “posting photos”, “posting
links to other websites”, “updating or editing profile”, these four items can be
grouped as “updating the status” factor; factor 4 has a larger loading on
“reading private messages from others”, “sending private messages”, “looking
at groups”, these three items are all related with online communication and
can be named as “online communication” factor; factor 5 has a larger
loading on “creating events and sending invitations” and “interacting with
groups”, and these two items are related with initiating contact with online to

42
offline activities and can be named as “online to offline”; factor 6 has a
larger loading on “tagging or untagging photos”, “commenting on photos”,
“interacting with the live chat function” and these three items can be named as
“semi-public interaction” ;factor 7 has a larger loading on “deading private
messages from others” “browsing company or organization pages” and can be
named as “public information” factor; factor 8 has a larger loading on
“adding or removing friends” and can be named as “choose friends” factor.
Intensity
factors
Browsing Looking at/reading other people’s profile;
Looking at photos;
Reading/responding to news feeds;
Reading posts on others’ walls;
Looking at groups;
Looking at video links;
Getting information from others;
Initiating
interaction
Reading my own wall posts;
Posting on others’ wall;
Updating current status or news feeds;
Adding or removing groups;
Creating groups;
Interacting with applications, quizzes or games;
Interacting with the company or organization
pages;
Updating the
status
Posting videos or links to videos;
Posting photos;
Posting links to other websites;
Updating or editing profile;
Online
communication
Reading private messages from others;
Sending private messages;
Looking at groups;
Online to offline Creating events and sending invitations;

43
Interacting with groups;
Semi-public
interaction
Tagging or untagging photos;
Commenting on photos;
Interacting with the live chat function;
Public information Reading private messages from others;
Browsing company or organization pages;
Choose friends Adding or removing friends;
Figure 15: Facebook activity intensity factor result
Descriptive analysis of Facebook motivation factors After the extracting and renaming the factors, the original Facebook intensity
factors are recoded into eight new variables. The Likert scale sticks to the
original scale, namely, on a scale of one to five. 1= never, 2= occasionally, 3=
monthly, 4= weekly, 5= daily.
Statistics
Browsi
ng
Initiating interacti
on
Updating the status
Online communic
ation
Online to
offline
Semi-public
interaction
Public information
Choose friends
N Valid 112 112 112 112 112 112 112 112
Missing
0 0 0 0 0 0 0 0
Mean 3.0548 2.1862 1.9933 3.6101 2.1429 2.0357 2.3661 2.3125 Median 3.0000 2.0000 2.0000 3.6667 2.0000 2.0000 2.0000 2.0000 Mode 3.00 2.00 2.00 3.67 1.50a 2.00 2.00 2.00 Min 1.00 1.00 1.00 1.33 1.00 1.00 1.00 1.00 Max 5.00 4.14 4.00 5.00 4.50 4.33 5.00 4.00 a. Multiple modes exist. The smallest value is shown Figure 16: Facebook activity intensity factor descriptives
As shown in the table, we can see out of the eight extracted factors, online
communication have the highest mean value (3.6101), medium (3.6667) and
mode (3.67). This result indicates that international students in UH use

44
Facebook mostly for online communication. After online communication factor,
browsing factor takes the second position, with mean (3.0548), median (3.0000)
and mode (3.00). This indicates that browsing is the second most frequent
activity that international students use on Facebook. All the other six extracted
factors have similar results on mean, median and mode, which are all around
2.000, this indicate that international students occasionally use Facebook for
initiating interaction, updating status, online to off, semi-public interaction, public
information, choosing friends. However, by looking at the min and max value, all
of the variables have a big variance among the population. This indicates that
international students in UH use all the Facebook activities with very different
intensity from person to person, some never do it and some do it on a daily
basis.
4.1.3 Facebook motivation factors
Similarly, seven factors are identified in Facebook motivation: relax and
entertainment, emotional connection diverts and relieves real-life pressure,
maintains ideal self-image, share problems, socialbility. The main factors and
their original items can be displayed as the following table.
Figure 17: Rotated Component Matrix 3
Component
1 2 3 4 5 6
VAR2 0.78
VAR3 0.887
VAR4 0.887
VAR5 0.859
VAR6 0.693
VAR10 0.811
VAR11 0.888
VAR12 0.816
VAR13 0.797

45
VAR14 0.706
VAR1 0.656
VAR7 0.854
VAR8 0.872
VAR9 0.787
VAR15 0.914
VAR16 0.919
VAR17 0.761
VAR22 0.54
VAR18 0.76
VAR19 0.765
VAR20 0.689
VAR24 0.423
VAR21 0.635
VAR23 0.829
Extraction Method: Principal Component Analysis.
Rotation Method: Varimax with Kaiser Normalization.
a. Rotation converged in 6 iterations.
Explanation: When the factor load is rotated orthogonally, the higher the
variable's loading on the factor, the more information the variable contains. After
the rotation, the factor loading matrix shows that factor 1 has a larger loading on
“because it is entertaining”, “because I enjoy it”, “because it is fun”, “because it is
a pleasant rest”, “because it relaxes me”,this five items are all related to the
entertainment aspect of using social media and can be named as “relax and
entertainment” factor; factor 2 has a larger loading on “to thank people”, “to let
people know I care about them”, “to show others encouragement”, “to help
others”, “to show others that I am concerned about them”, this five items are all
about showing emotional support for others and can be named as “interpersonal
emotional connection”; factor 3 has a larger loading on “to kill time”, “to get away
from pressures and responsibilities”, “to get away from what I am doing”, “to put

46
off something I should be doing”, these four items are closely connected with
relieving pressure and get away from real life problems, so that this factor can be
named as “divert and relieve real-life pressure”; factor 4 has a larger loading on
“to not look old-fashion”, “to look stylish”, “to look fashionable”, “to be less
inhibited chatting with strangers”, these four items are connected with showing
the ideal self and can be named as “maintain ideal self image” factor; factor 5
has a larger loading on “because I need someone to talk to or be with”, “because
I just need to talk about my problems sometimes”, “to forget about my problems”,
“to feel involved with what's going on with other people”, these four items are
connected with emotional support therefore can be named as “share problems”
factor; factor 6 has a larger loading on “to make friends of opposite sex”, “to
meet people (new acquaintances)”, these two items are related with establishing
new relationships and can be named as “sociability” factor.
Motivation
Factors
Relax and entertainment Because it is entertaining;
Because I enjoy it;
Because it is fun;
Because it is a pleasant rest;
Because it relaxes me;
Emotional connection To thank people;
To let people know I care about them;
To show others encouragement;
To help others;
Divert and relieve
real-life pressure
To kill time;
To get away from pressures and
responsibilities;
To get away from what I am doing;
To put off something I should be
doing;
Maintain ideal self
image
To not look old-fashion;
To look stylish;

47
To look fashionable;
To be less inhibited chatting with
strangers;
Share problems Because I need someone to talk to or
be with;
Because I just need to talk about my
problems sometimes;
To forget about my problems;
To feel involved with what's going on
with other people;
Sociability To make friends of opposite sex;
To meet people (new acquaintances);
Figure 18: Facebook motivation factor result
Descriptive analysis of Facebook motivation factors After the extracting and renaming the factors, the original Facebook motivation
factors are recoded into six new variables. The Likert scale sticks to the original
scale, namely, on a scale of one to five. 1= strongly disagree, 2= somewhat
disagree, 3= neutral, 4= somewhat agree, 5= strongly agree.
Statistics
Relax and entertainment
Emotional connection
Divert and relieve real-life pressure
Maintain ideal self image
Share problems Sociability
N Valid 112 112 112 112 112 112
Missing 0 0 0 0 0 0 Mean 2.9036 2.6625 3.3214 1.8304 2.3237 1.8571 Median 3.0000 2.7000 3.2500 1.5000 2.2500 1.5000 Mode 3.00 2.60 3.00 1.00 1.50 1.00 Minimum 1.00 1.00 1.00 1.00 1.00 1.00 Maximum 5.00 5.00 5.00 4.75 5.00 5.00
Figure 19: Facebook motivation descriptives

48
As shown in the table, we can see out of the six extracted factors, “divert and
relieve real-life pressure” has the highest mean (3.3214), median (3.2500) and
mode (3.00) value, which indicates that international students in UH are mostly
motivated by “divert and relieve real-life pressure”when they use Facebook.
Following up, “relax and entertainment” has the second highest score of mean
(2.9036), median (3.0000) and mode (3.00) value. This indicates that
international students in UH also use Facebook quite much for “relax and
entertainment”. Unlike the other two factor analyses that have around the same
score of the rest of the factors, this factor analysis shows varied scores. The
lowest scores are “maintain ideal self” factor and “sociability” factor, with mean
and median and mode lower than 2.0000. This tells that international students
use Facebook barely for the purpose of “maintain ideal self” or “sociability”.
4.2 Correlation Analysis Multiple social media usage patterns as independent variables, loneliness as
dependent variable. Multiple correlations are carried out to examine the
correlation between loneliness (variable 10) and social media usage frequency
(variable 11), between loneliness and social media usage duration (variable 13),
between loneliness and recent social media average hours per day (variable 14),
between loneliness and social circle (variable 15), between loneliness and
online self-disclosure (variable 17), between loneliness and Facebook intensity
(variable 18), between loneliness and Facebook motivation (variable 19). Here is
the correlation graph for all the aforementioned tests. And this chapter of
correlation analysis corresponds to research question Q2, the correlation results
will answer to Q2.
Figure 20: Correlations
VA
R10
VA
R1
VA
R1
VA
R1
VA
R1
VA
R1
VA
R1
VA
R11
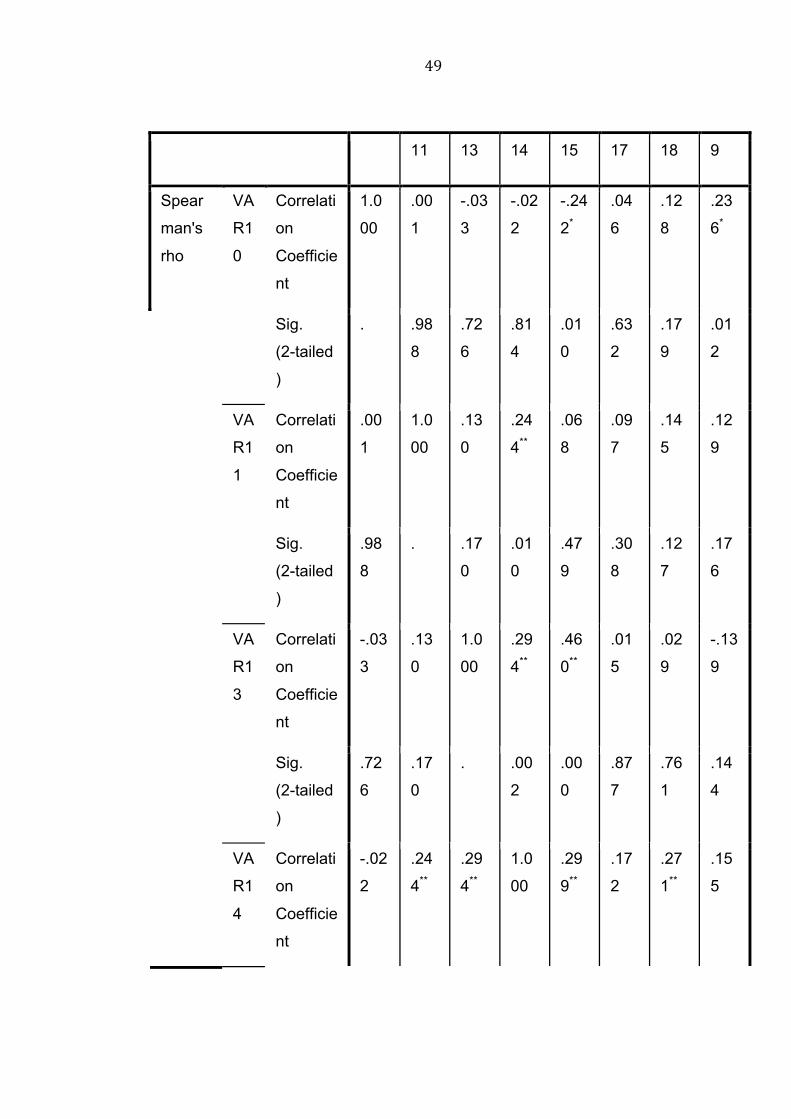
49
11 13 14 15 17 18 9
Spear
man's
rho
VA
R1
0
Correlati
on
Coefficie
nt
1.0
00
.00
1
-.03
3
-.02
2
-.24
2*
.04
6
.12
8
.23
6*
Sig.
(2-tailed
)
. .98
8
.72
6
.81
4
.01
0
.63
2
.17
9
.01
2
VA
R1
1
Correlati
on
Coefficie
nt
.00
1
1.0
00
.13
0
.24
4**
.06
8
.09
7
.14
5
.12
9
Sig.
(2-tailed
)
.98
8
. .17
0
.01
0
.47
9
.30
8
.12
7
.17
6
VA
R1
3
Correlati
on
Coefficie
nt
-.03
3
.13
0
1.0
00
.29
4**
.46
0**
.01
5
.02
9
-.13
9
Sig.
(2-tailed
)
.72
6
.17
0
. .00
2
.00
0
.87
7
.76
1
.14
4
VA
R1
4
Correlati
on
Coefficie
nt
-.02
2
.24
4**
.29
4**
1.0
00
.29
9**
.17
2
.27
1**
.15
5
50
Sig.
(2-tailed
)
.81
4
.01
0
.00
2
. .00
1
.07
0
.00
4
.10
3
VA
R1
5
Correlati
on
Coefficie
nt
-.24
2*
.06
8
.46
0**
.29
9**
1.0
00
.26
0**
.22
4*
.00
6
Sig.
(2-tailed
)
.01
0
.47
9
.00
0
.00
1
. .00
6
.01
8
.94
9
N 112 112 112 112 112 112 112 112
VA
R1
7
Correlati
on
Coefficie
nt
.04
6
.09
7
.01
5
.17
2
.26
0**
1.0
00
.44
6**
.31
7**
Sig.
(2-tailed
)
.63
2
.30
8
.87
7
.07
0
.00
6
. .00
0
.00
1
VA
R1
8
Correlati
on
Coefficie
nt
.12
8
.14
5
.02
9
.27
1**
.22
4*
.44
6**
1.0
00
.60
1**
Sig.
(2-tailed
)
.17
9
.12
7
.76
1
.00
4
.01
8
.00
0
. .00
0
VA
R1
Correlati
on
.23
6*
.12
9
-.13
9
.15
5
.00
6
.31
7**
.60
1**
1.0
00

51
9 Coefficie
nt
Sig.
(2-tailed
)
.01
2
.17
6
.14
4
.10
3
.94
9
.00
1
.00
0
.
*. Correlation is significant at the 0.05 level (2-tailed).
**. Correlation is significant at the 0.01 level (2-tailed).
Explanation: Out of the seven correlation tests, only two show statistical
significance. The above table shows that the P value of the correlation between
loneliness and the social circle (number of Facebook friends) is 0.010, which is
less than 0.05. The significance test shows that there is a significant difference
between loneliness and the number of Facebook friends; In addition, the
coefficient is negative, indicating a negative correlation between the number of
Facebook friends and loneliness, that is, as the number of Facebook friends increases, the feeling of loneliness will be significantly reduced. The P
value of the correlation test between loneliness and Facebook motivation is
0.012, which is less than 0.05. The significance test shows that there is a
significant correlation between loneliness and Facebook motivation; the
correlation coefficient is positive, indicating there a positive correlation between
Facebook motivation and loneliness, that is, as the Facebook motivation improves, feeling of loneliness will increase significantly. However, there is
no significant correlation between Facebook intensity and loneliness, so we
cannot conclude whether using Facebook a lot contributes to the loneliness.
4.3 Analysis of Variance/ANOVA This chapter of ANOVA analysis corresponds to research question Q3, and the
results will answer to Q3.
F-test 1: demographics matters when it comes to Facebook intensity?

52
Figure 21: Tests of Between-Subjects Effects
Dependent Variable: VAR18 (Facebook intensity score)
Source
Type III
Sum of
Squares df
Mean
Square F Sig.
Corrected
Model
11.066a 37 .299 1.175 .274
Intercept 14.528 1 14.528 57.079 .000
VAR1 1.260 3 .420 1.650 .185
VAR2 2.456 3 .819 3.217 .028
VAR3 .038 1 .038 .149 .701
VAR4 2.340 7 .334 1.313 .256
VAR5 .076 2 .038 .149 .862
VAR6 .859 2 .429 1.687 .192
VAR7 1.088 3 .363 1.425 .242
VAR8 1.521 7 .217 .854 .547
VAR9 1.977 8 .247 .971 .465
Error 18.834 74 .255
Total 741.195 112

53
Corrected
Total
29.900 111
a. R Squared = .370 (Adjusted R Squared = .055)
Explanation: According to F-test, there is no significant difference in the following
demographic items: age, from where, ethnicity, marital status, studying campus,
level of education, living duration in Finland, Finnish language level.
However, Facebook intensity is significantly different on gender, with a variance
value of 3.217. For the specific performance of Facebook intensity on gender, I
also performed a comparison of grouped means. I found that the mean of
gender's three options in the Facebook intensity was 2.524 for female, 2.499 for
male, and prefer not to say is 2.250. This means that the female use Facebook
more intensively than male and people with unknown gender.
F-test 2: demographics matters when it comes to Facebook motivation?
Figure 22: Tests of Between-Subjects Effects
Dependent Variable: VAR19 (Facebook motivation score)
Source
Type III
Sum of
Squares df
Mean
Square F Sig.
Corrected
Model
14.883a 37 .402 1.177 .272
Intercept 15.809 1 15.809 46.273 .000
VAR1 2.282 3 .761 2.227 .092
VAR2 .133 3 .044 .129 .942
VAR3 .285 1 .285 .834 .364

54
VAR4 5.071 7 .724 2.120 .049
VAR5 .588 2 .294 .861 .427
VAR6 1.214 2 .607 1.776 .176
VAR7 1.042 3 .347 1.017 .390
VAR8 1.718 7 .245 .718 .657
VAR9 .750 8 .094 .274 .972
Error 25.282 74 .342
Total 774.694 112
Corrected
Total
40.165 111
a. R Squared = .371 (Adjusted R Squared = .056)
Explanation: According to F-test, there is no significant difference in the following
demographic items: age, gender, from where, marital status, studying campus,
level of education, living duration in Finland, Finnish language level.
However, Facebook motivation is significantly different on ethnicity, with a
variance value of 2.120. I also made a comparison of group means and found
that the means for Facebook motivation on ethnicity were 2.526 for White, 2.483
for Hispanic or Latino, 2.083 for Black or African American, and 2.044 for Native
American or American Indian, Asian/Pacific islander is 2.707, Other is 2.125.
That means the motivation of using social networking tools ranks from high to
low as: Asian/Pacific islander, White, Hispanic or Latino, others, Black or African
American and Native American or American Indian.
55
5. Conclusion Answering to Q1 Three factors are extracted from loneliness: social isolation, lack social support,
lack sense of belonging; Eight factors are extracted from Facebook activity
intensity: browsing, initiating interaction, updating the status, online
communication, online to offline, semi-public interaction, public information,
choose friends. Six factors are extracted from Facebook motivation: relax and
entertainment, interpersonal emotional connection, divert and relieve real-life
pressure, maintain ideal self-image, share problem, sociability.
The descriptive analysis results present the general condition of how
international students in University of Helsinki perceive each loneliness factors,
the intensity of how they use each Facebook activity factors, and the motivation
level of each Facebook motivation factor. Some meaningful results are as
follows: averagely students occasionally feel lonely, which shows international
students in UH are generally having a healthy psycological status, namely, the
perceived loneliness level is enough low; Online communication and browsing
randomly on Facebook are the two major activities that international students in
UH do when they use Facebook; they use Facebook quite much for the purpose
of “divert and relieve real-life pressure” and “relax and entertainment”, and not
much for the purpose of “maintain ideal self” or “socialbility”. In addition, big
variances are observed, which indicates that international students of UH form a
very heterogenous population that individuals are very varied and different from
each other.
Answering to Q2 Out of the seven correlation tests between different aspects of social media
usage pattern and loneliness, only two of them showed a statistical significance.
Frequency, years of use, daily average hours, self-disclosure, and intensity have
no significant correlation with the feeling of loneliness. That is to say, these
aspects of social media usage patterns do not influence the perception of
loneliness among international students in University of Helsinki. However, there

56
is a negative correlation between the number of Facebook friend and loneliness.
This means, as the number of Facebook friends increases, the feeling of
loneliness decreases. There is a positive correlation between Facebook
motivation and loneliness. This means, as Facebook motivation increases, the
feeling of loneliness will increase too. However, according to use and
gratification theory, it is more likely that loneliness is the cause of higher
motivation of Facebook use. This will be discussed more in the discussion
chapter later.
Answering to Q3 The ANOVA analyses showed differences in age, country of origin, ethnicity,
marital status, studying campus, level of education, living duration in Finland,
Finnish language level made no difference when it came to individual’s
Facebook Intensity. There is only gender difference in Facebook intensity, more
specifically; females use Facebook more intensively than males than unknown
gender. At the same time, there is no significant correlation between Facebook
motivation and age, gender, marital status, studying campus, educational level,
living duration in Finland, Finnish language level. That is to say, these aspects of
backgrounds make no difference when it comes to the intensity of Facebook use
and the motivation of Facebook use. However, ethnicity makes a difference
when it comes to Facebook motivation. Motivation of using Facebook ranks from
high to low as: Asian/Pacific islander, White, Hispanic or Latino, others, Black or
African American and Native American or American Indian.
6. Discussion 6.1 Loneliness motivates Facebook use In this research, there is no statistically significant correlation between use
intensity of Facebook and loneliness. This answers to the research problem,
among the sample group of this study, the use of social media does not
necessarily cause loneliness. However, another correlation was identified, which
led the research to another possible explanation. The data analysis results
showed that among the questionnaire participants, there was a positive causal

57
relationship between the motivation of using Facebook and the feeling of
loneliness. Previous relevant studies showed that excessive use of Internet led
to loneliness (Kim, Larose, & Peng, 2009; Pittman & Reich, 2016; Caplan, 2005;
Kim et al., 2009). Such loneliness is due to the neglection of offline social
network. Lonely people usually have deficient social skills and therefore lack of
confidence when it comes to sociability. This makes them reluctant to make
more social contacts offline with others. As excessive Internet use causes
loneliness, and loneliness will cause failure in offline social activities and social
relationships. In other words, will loneliness drive people to have stronger
motivation for using social media. Spitzberg and Canary (1993) also proved that
the intensive feeling of loneliness would make one negative and withdrawn in
social activities. Bessiere et al. (2008) proposed the social augmentation
hypothesis that explained online social communication provided alternative
social resources for interaction. This theory supported the inference that lonely
people had stronger motivation to use online platform to interact with people,
and use Facebook to augment their social world.
According to use and gratification theory, people use social media which meet
up with their need of gratification sought, and media consumption must be
rewarding in one way or another, either immediate or delayed (Schramm, 1949).
Facebook serves as a social tool that fulfills the needs of lonely individuals. Song
et al. (2014) conducted a Meta analysis to find the causal relationship between
Facebook use and loneliness. They used the Meta model to test the causal
relationship in both directions: Facebook use causes loneliness and loneliness
causes Facebook use. Their model proved that it is loneliness that causes
Facebook use. More specifically, shyness and lack of social support lead to
loneliness, and loneliness leads to Facebook use. According to the studies
above, this inference may exist. It is difficult and complicated to determine a
causal relationship between behaviour and psychological status. According to
the use and gratification research that Finn and Gorr (1988) did, they discovered
that heavy loneliness media users are mostly very passive and have a tendency
of compulsory use, but they can hardly feel gratification from media use. This

58
compulsory use corresponds to the literature reviews of social media addiction
that reflects behavioral addictive symptoms. However, we can combine with the
previous studies and claim that excessive Facebook use will lead to loneliness.
In fact, it is most likely that social media use cause loneliness, and drives people
to use social media to make social interactions online in order to relieve
loneliness. For Internet use, perhaps “use” is the cause, and “loneliness” is the
result. However, for social media, perhaps “loneliness” is the cause, and “use” is
the result. Amichai and Ben (2003) also mentioned about this possibility (i.e.
loneliness causes social media use), and tested the hypothesis via complicated
methods.
6.2 More popular, less lonely As shown in the literature review, students use social media with the purpose of
maintaining offline friendship by online interaction, instead of building new
relationship with strangers online (Ellison stal, 2007; Sheldon, 2008). Having
more friends on Facebook indicates a larger social capital or social circle of
individuals. As Facebook is mainly a place for maintaining offline relationship,
one who has more friends on Facebook is likely to have more friends offline.
This also indicates stronger social skills in order to develop such relationships
offline in the first place. Kleck et al. (2007) carried out an experimental research
to support the inference that the more friends one had in Facebook, the more
positive judgement from sociability point of view one would get, and people
prefer to socialize with attractive ones. Tong, Van Der Heide, and Langwell
(2008) said in their research that having a lot of friends on Facebook is positively
associated with being popular and attractive. Hence, people use the number of
friends on Facebook to infer social attractiveness.
Studies showed that attractiveness was connected with social acceptance,
which further connected with popularity among people (Berry & Miller, 2001;
Eagly et al., 1991). In associate with the data analysis result of this thesis, it can
be concluded that having more Facebook friends reveals a stronger social
popularity, which reduces the feeling of loneliness.

59
6.3 Evaluation of the study
This study is my own thoughts on the basis of many empirical studies on
relevant issues. However, with the limitation of knowledge, time and effort, this
thesis is only about the relationship between social media use and the loneliness
of university students. It is an exploratory, preliminary, and rough discussion
through one typical social network site in the current global communication
sphere. There are still many possibilities for improvement and exploration in the
depth and breadth of the research. In all, this study has the following three major
shortcomings that have room for improvement.
First of all, in this survey, the representative sample can be improved. The study
would have been more meaningful if it can reflect a wider population. However,
considering the practical possibility, inadequacies of time, effort, funding and so
on, it is difficult to have a holistic survey of international students in Finland. The
understanding and investigation are mainly based on the author's own personal
connections, and the sample is not random or large enough.
Secondly, this study selects Facebook, which only represents partly of the social
media that are used by international students. Nowadays, more and more social
media have emerged and become popular, affecting the social life and
psychological status of users. Apart from Facebook, which is selected in this
study, there are many other influential social media that are worth focusing on,
such as Instagram and Snapchat. A comparison study between different social
media can be meaningful to explore how different type of social media influence
people and in what ways. The conclusions are only based on the results of
selected sample and design questionnaires. We have reason to believe that the
impact of social media usage on the loneliness perception of university students
is more complex and diverse.
Thirdly, this research is just an exploratory study in this field. There is still much
room for improvement in research design and research method. Although there

60
were some studies that had begun to explore this field, the research in this area
was relatively deficient. Few documents are available for reference, and some of
them are quite old. Since social media field is a field where things change fastly,
and out of date reference may not well reflect the current situation. There may
be a lack of relevant and up-to-date reference when designing research
methods including questionnaires and measurements.
In summary, this thesis can be improved in survey sample and size, comparison
study of representative social media, more up-to-date research methods and
measurements.
7. List of References Amichai-Hamburger, Y., & Ben-Artzi, E. (2003). Loneliness and Internet use.
Computers in human behavior, 19(1), 71-80.
Andreassen, C. S., Torsheim, T., Brunborg, G. S., & Pallesen, S. (2012).
Development of a Facebook addiction scale. Psychological reports, 110(2),
501-517.
Arnett, J. J. (2000). Emerging adulthood: A theory of development from the late
teens through the twenties. American psychologist, 55(5), 469.
Baker, L. R., & Oswald, D. L. (2010). Shyness and online social networking
services. Journal of Social and Personal Relationships, 27(7), 873-889.
Bartholomew, D. J., Knott, M., & Moustaki, I. (2011). Latent variable models and
factor analysis: A unified approach (Vol. 904). John Wiley & Sons.
Berry, D. S., & Miller, K. M. (2001). When boy meets girl: Attractiveness and the
five-factor model in opposite-sex interactions. Journal of Research in Personality,
35(1), 62-77.
Bessiere, K., Kiesler, S., Kraut, R., & Boneva, B. S. (2008). Effects of Internet
use and social resources on changes in depression. Information, Community &
Society, 11(1), 47-70.
Bolboaca, S. D., & Jäntschi, L. (2006). Pearson versus Spearman, Kendall’s Tau
correlation analysis on structure-activity relationships of biologic active
compounds. Leonardo Journal of Sciences, 5(9), 179-200.

61
Buffardi, L. E., & Campbell, W. K. (2008). Narcissism and social networking web
sites. Personality and social psychology bulletin, 34(10), 1303-1314.
Burke, M., Marlow, C., & Lento, T. (2010, April). Social network activity and
social well-being. In Proceedings of the SIGCHI conference on human factors in
computing systems (pp. 1909-1912). ACM.
Canary, D. J., & Spitzberg, B. H. (1993). Loneliness and media gratifications.
Communication research, 20(6), 800-821.
Caplan, S. E. (2005). A social skill account of problematic Internet use. Journal
of communication, 55(4), 721-736.
Cho, S. H. (2007). Effects of motivations and gender on adolescents'
self-disclosure in online chatting. CyberPsychology & Behavior, 10(3), 339-345.
Christensson, P. (2013, August 7). Social Media Definition. Retrieved 2016, Oct
17, from http://techterms.com
Correa, T., Hinsley, A. W., & De Zuniga, H. G. (2010). Who interacts on the
Web?: The intersection of users’ personality and social media use. Computers in
Human Behavior, 26(2), 247-253.
Denti, L., Barbopuolos, I., Nilsson, I., Holmberg, L., Thulin, M., Wendeblad, M., ...
& Davidsson, E. (2012). Sweden's largest Facebook study.
Deters, F. G., & Mehl, M. R. (2013). Does posting Facebook status updates
increase or decrease loneliness? An online social networking experiment. Social
psychological and personality science, 4(5), 579-586.
Diener, E., Emmons, R. A., Larsen, R. J., & Griffin, S. (1985). The Satisfaction
with Life Scale.Journal of PersoCorrea, T., Hinsley, A. W., & De Zuniga, H. G.
(2010). Who interacts on the Web?: The intersection of users’ personality and
social media use. Computers in Human Behavior, 26(2), 247-253.nality
Assessment, 49, 71-75.
Diener, E., & Suh, E. (1997). Measuring quality of life: Economic, social, and
subjective indicators. Social indicators research, 40(1-2), 189-216.
Diener, E. (2009). Subjective well-being. In The science of well-being (pp. 11-58).
Springer Netherlands.
Donath, J., & Boyd, D. (2004). Public displays of connection. bt technology
Journal, 22(4), 71-82.

62
Eagly, A. H., Ashmore, R. D., Makhijani, M. G., & Longo, L. C. (1991). What is
beautiful is good, but…: A meta-analytic review of research on the physical
attractiveness stereotype. Psychological bulletin, 110(1), 109.
Eggermont, S., & Van den Bulck, J. (2006). Nodding off or switching off? The
use of popular media as a sleep aid in secondary-school children. Journal of
paediatrics and child health, 42(7-8), 428-433.
Elliott, P. (1974). Uses and gratifications research: A critique and a sociological
alternative. The uses of mass communications: Current perspectives on
gratifications research, 3, 249-268.
Ellison, N. B. (2007). Social network sites: Definition, history, and scholarship.
Journal of Computer-Mediated Communication, 13(1), 210-230.
Ellison, N. B., Steinfield, C., & Lampe, C. (2007). The benefits of Facebook
“friends:” Social capital and college students’ use of online social network sites.
Journal of Computer-Mediated Communication, 12(4), 1143-1168.
Festinger, L. (1954). A theory of social comparison processes. Human relations,
7(2), 117-140.
Field, A. (2013). Discovering statistics using IBM SPSS statistics. sage.
Finn, S., & Gorr, M. B. (1988). Social isolation and social support as correlates of
television viewing motivations. Communication research, 15(2), 135-158.
Flanagin, A. (2005). IM online: Instant messaging use among college students.
Communication Research, 22, 175-187.
Foehr, U. G., Rideout, V., & Roberts, D. F. (2005). Generation M: Media in the
lives of 8-18 year-olds.
Freud, S. (1958). Formulations on the two principles of mental functioning. In
The Standard Edition of the Complete Psychological Works of Sigmund Freud,
Volume XII (1911-1913): The Case of Schreber, Papers on Technique and
Other Works (pp. 213-226).
Gonzales, A. L., & Hancock, J. T. (2011). Mirror, mirror on my Facebook wall:
Effects of exposure to Facebook on self-esteem. Cyberpsychology, Behavior,

63
and Social Networking, 14(1-2), 79-83.
Griffiths, M. (2005). A ‘components’ model of addiction within a biopsychosocial
framework. Journal of Substance use, 10(4), 191-197.
Hawi, N. S., & Samaha, M. (2016). To excel or not to excel: Strong evidence on
the adverse effect of smartphone addiction on academic performance.
Computers & Education, 98, 81-89.
Hawi, N. S., & Samaha, M. (2017). The relations among social media addiction,
self-esteem, and life satisfaction in university students. Social Science Computer
Review, 35(5), 576-586.
Heponiemi, T., Elovainio, M., Kivimäki, M., Pulkki, L., Puttonen, S., &
Keltikangas-Järvinen, L. (2006). The longitudinal effects of social support and
hostility on depressive tendencies. Social Science & Medicine, 63(5),
1374-1382.
Ivković, A. F., Ham, M., & Mijoč, J. (2014). Measuring objective well-being and
sustainable development management. Journal of Knowledge Management,
Economics and Information Technology, 4(2), 1-29.
Kayahara, J., & Wellman, B. (2007). Searching for culture—high and low.
Journal of Computer-Mediated Communication, 12(3), 824-845.
Katz, E., Blumler, J. G., & Gurevitch, M. (2003). Utilization of mass
communication by the individual. Critical Readings: Media and Audiences, 35.
Kesici, Ş., & Şahin, İ. (2009). A comparative study of uses of the internet among
college students with and without internet addiction. Psychological Reports,
105(3_suppl), 1103-1112.
Kim, J., LaRose, R., & Peng, W. (2009). Loneliness as the cause and the effect
of problematic Internet use: The relationship between Internet use and
psychological well-being. CyberPsychology & Behavior, 12(4), 451-455.
Kleck, C. A., Reese, C. A., Behnken, D. Z., & Sundar, S. S. (2007, May). The
company you keep and the image you project: Putting your best face forward in
online social networks. In Annual meeting of the international communication
association, San Francisco (pp. 172756-1).
Kuss, D. J., & Griffiths, M. D. (2011). Addiction to social networks on the internet:

64
A literature review of empirical research. International Journal of Environment
and Public Health, 8(9), 3528-3552.
J Kuss, D., D Griffiths, M., Karila, L., & Billieux, J. (2014). Internet addiction: a
systematic review of epidemiological research for the last decade. Current
pharmaceutical design, 20(25), 4026-4052.
Lakdawalla, Z., Hankin, B. L., & Mermelstein, R. (2007). Cognitive theories of
depression in children and adolescents: A conceptual and quantitative review.
Clinical child and family psychology review, 10(1), 1-24.
Lepp, A., Barkley, J. E., & Karpinski, A. C. (2014). The relationship between cell
phone use, academic performance, anxiety, and satisfaction with life in college
students. Computers in Human Behavior, 31, 343-350.
Leung, L. (2001). College student motives for chatting on ICQ. New media &
society, 3(4), 483-500.
Likert, R. (1932). A technique for the measurement of attitudes. Archives of
psychology.
Lim, M., & Yang, Y. (2015). Effects of users’ envy and shame on social
comparison that occurs on social network services. Computers in Human
Behavior, 51, 300-311.
Liu, X., & LaRose, R. (2008). Does using the Internet make people more
satisfied with their lives? The effects of the Internet on college students' school
life satisfaction. CyberPsychology & Behavior, 11(3), 310-320.
Lin, C. A. (1996). Standpoint: Looking back: The contribution of Blumler and
Katz's uses of mass communication to communication research.
McLuhan, M. (1965). Understanding Media: The Extensions of Man.
McLuhan, M., & Powers, B. R. (1989). The global village: Transformations in
world life and media in the 21st century. Oxford University Press, USA.
Olds, J., & Schwartz, R. S. (2009). The lonely america.
Morahan-Martin, J., & Schumacher, P. (2000). Incidence and correlates of
pathological Internet use among college students☆. Computers in human
behavior, 16(1), 13-29.
Palmgreen, P., & Rayburn, J. D. (1979). Uses and gratifications and exposure to
public television: A discrepancy approach. Communication Research, 6,
65
155-180.
Palmgreen, P., Wenner, L. A., & Rayburn, J. D. (1980). Relations Between
Gratifications Sought and Obtained A Study of Television News. Communication
Research, 7(2), 161-192.
Perlman, D., & Peplau, L. A. (1981). Toward a social psychology of loneliness.
Personal relationships, 3, 31-56.
Pempek, T. A., Yermolayeva, Y. A., & Calvert, S. L. (2009). College students'
social networking experiences on Facebook. Journal of applied developmental
psychology, 30(3), 227-238.
Peplau, L. A., & Perlman, D. (1982). Perspectives on loneliness. In L. A. Peplau,
& D. Perlman (Eds.), Loneliness: A sourcebook of current theory, research and
therapy (pp. 1-18). Wiley New York.
Pietilä, V. (1969). Immediate versus delayed reward in newspaper reading. Acta
Sociologica, 199-208.
Pittman, M., & Reich, B. (2016). Social media and loneliness: Why an Instagram
picture may be worth more than a thousand Twitter words. Computers in Human
Behavior, 62, 155-167.
Quan-Haase, A., & Young, A. L. (2010). Uses and gratifications of social media:
A comparison of Facebook and instant messaging. Bulletin of Science,
Technology & Society, 30(5), 350-361.
Raacke, J., & Bonds-Raacke, J. (2008). MySpace and Facebook: Applying the
uses and gratifications theory to exploring friend-networking sites.
Cyberpsychology & behavior, 11(2), 169-174.
Rubin, A. M. (1979). Television use by children and adolescents. Human
communication research, 5(2), 109-120.
Rubin, A. M. (1994). Media uses and effects: A uses-and-gratifications
perspective.
Ruggiero, T. E. (2000). Uses and gratifications theory in the 21st century. Mass
communication & society, 3(1), 3-37.
Russell, D., Peplau, L. A., & Ferguson, M. L. (1978). Developing a measure of
loneliness. Journal of personality assessment, 42(3), 290-294.
Russell, D., Peplau, L. A., & Cutrona, C. E. (1980). The revised UCLA

66
Loneliness Scale: concurrent and discriminant validity evidence. Journal of
Personality and Social Psychology, 39, 472–480.
Ryan, T., & Xenos, S. (2011). Who uses Facebook? An investigation into the
relationship between the Big Five, shyness, narcissism, loneliness, and
Facebook usage. Computers in human behavior, 27(5), 1658-1664.
Sawyer, R., & Chen, G. M. (2012). The impact of social media on intercultural
adaptation.
Schramm, W. (1949). The Nature of News. Journalism and Mass
Communication Quarterly, 26(3), 259.
Sponcil, M., & Gitimu, P. (2013). Use of social media by college students:
Relationship to communication and self-concept. Journal of Technology
Research, 4, 1.
Shaw, L. H., & Gant, L. M. (2002). In defense of the Internet: The relationship
between Internet communication and depression, loneliness, self-esteem, and
perceived social support. Cyberpsychology & behavior, 5(2), 157-171.
Sheldon, P. (2008). Student favorite: Facebook and motives for its use.
Southwestern Mass Communication Journal, 23(2), 39-53.
Song, I., Larose, R., Eastin, M. S., & Lin, C. A. (2004). Internet gratifications and
Internet addiction: On the uses and abuses of new media. CyberPsychology &
Behavior, 7(4), 384-394.
Song, H., Zmyslinski-Seelig, A., Kim, J., Drent, A., Victor, A., Omori, K., & Allen,
M. (2014). Does Facebook make you lonely?: A meta analysis. Computers in
Human Behavior, 36, 446-452.
Steinfield, C., Ellison, N. B., & Lampe, C. (2008). Social capital, self-esteem, and
use of online social network sites: A longitudinal analysis. Journal of Applied
Developmental Psychology, 29(6), 434-445.
Swanson, D. L. (1977). THE USES AND MISUSES OF USES AND
GRATIFICATIONS1. Human communication research, 3(3), 214-221.
Tong, S. T., Van Der Heide, B., Langwell, L., & Walther, J. B. (2008). Too much
of a good thing? The relationship between number of friends and interpersonal
impressions on Facebook. Journal of Computer-Mediated Communication, 13(3),
67
531-549.
Urista, M. A., Dong, Q., & Day, K. D. (2009). Explaining why young adults use
MySpace and Facebook through uses and gratifications theory. Human
Communication, 12(2), 215-229.
Valentine, O. A. (2013). Uses and gratifications of Facebook members 35 years
and older. In The Social Media Industries(pp. 188-212). Routledge.
Villi, M., Matikainen, J., & Khaldarova, I. (2016). Recommend, tweet, share:
User-distributed content (UDC) and the convergence of news media and social
networks. In Media Convergence Handbook-Vol. 1 (pp. 289-306). Springer
Berlin Heidelberg.
Weiss, R. S. (1973). Loneliness: The experience of emotional and social
isolation.
Wood, J. V. (1989). Theory and research concerning social comparisons of
personal attributes. Psychological bulletin, 106(2), 231.
Yang, C. C. (2016). Instagram use, loneliness, and social comparison orientation:
interact and browse on social media, but don't compare. Cyberpsychology,
Behavior, and Social Networking, 19(12), 703-708.
Yang, C. C., & Brown, B. B. (2016). Online self-presentation on Facebook and
self development during the college transition. Journal of youth and adolescence,
45(2), 402-416.
8. List of tables Figure 1: Rank of active users in leading social media
Figure 2: Structure of research questions
Figure 3: The revised UCLA loneliness scare
Figure 4: Self-disclosure measurement
Figure 5: Facebook intensity measurement
Figure 6: Facebook motivation measurement
Figure 7: KMO and Bartlett's Test
Figure 8: Communalities
Figure 9: Total Variance Explained

68
Figure 10: Component Matrixa
Figure 11: Rotated Component Matrix 1
Figure 12: Loneliness factor result
Figure 13: Loneliness factor descriptives
Figure 14: Rotated Component Matrix 2
Figure 15: Facebook activity intensity factor result
Figure 16: Facebook activity intensity factor descriptives
Figure 17: Rotated Component Matrix 3
Figure 18: Facebook motivation factor result
Figure 19: Facebook motivation factor descriptives
Figure 20: Correlations
Figure 21: Tests of Between-Subjects Effects
Figure 22: Tests of Between-Subjects Effects
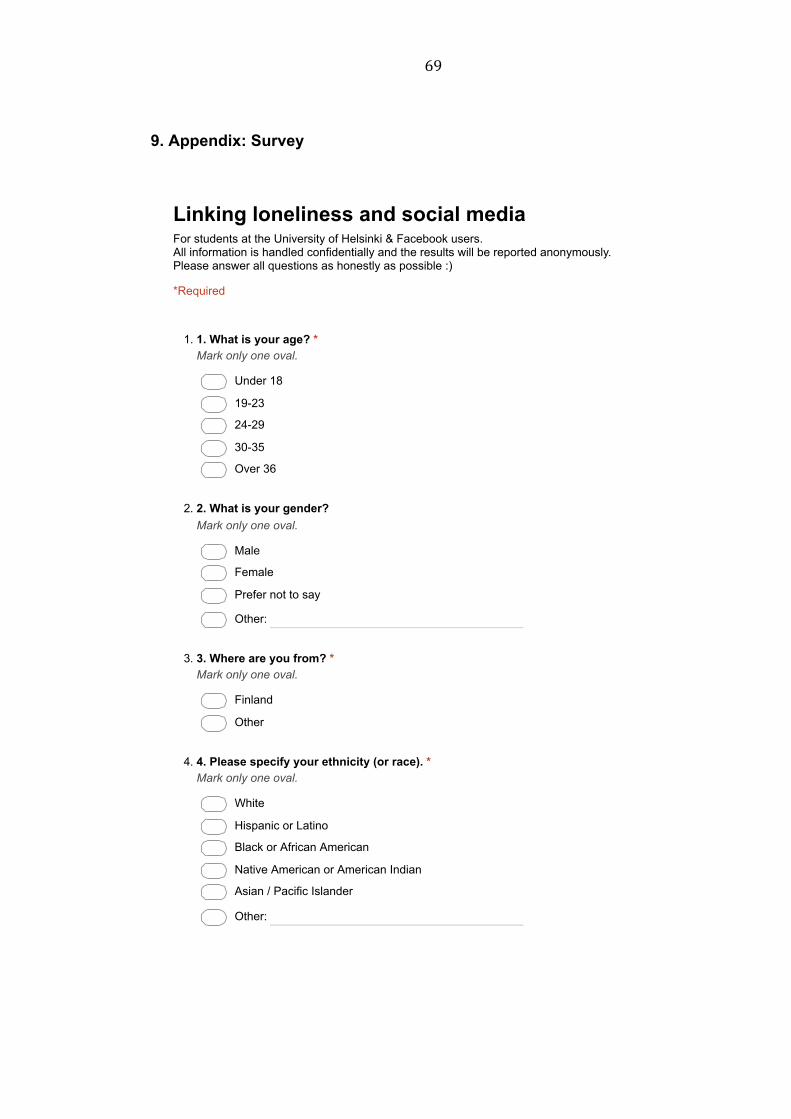
69
9. Appendix: Survey
Linking loneliness and social mediaFor students at the University of Helsinki & Facebook users. All information is handled confidentially and the results will be reported anonymously. Please answer all questions as honestly as possible :)
*Required
1. 1. What is your age? *
Mark only one oval.
Under 18
1923
2429
3035
Over 36
2. 2. What is your gender?
Mark only one oval.
Male
Female
Prefer not to say
Other:
3. 3. Where are you from? *
Mark only one oval.
Finland
Other
4. 4. Please specify your ethnicity (or race). *Mark only one oval.
White
Hispanic or Latino
Black or African American
Native American or American Indian
Asian / Pacific Islander
Other:

70
5. 5. What is your marital status? *
Mark only one oval.
Single, never married
Married or domestic partnership
Widowed
Divorced
Separated
6. 6. Which campus do you belong to? *
Mark only one oval.
City Center
Viikki
Kumpula
Meilahti
7. 7. What is your level of study in University of Helsinki? *
Mark only one oval.
Bachelor's degree
Master's degree
PhD degree
Exchange
Other:
8. 8. How long have you been in Finland? *Mark only one oval.
Less than 1 year
13 years
35 years
Over 5 years
Other:
9. 9. What is your Finnish language level? *
Mark only one oval.
I can't speak Finnish at all
Beginner A1
Elementary (A2)
Intermediate (B1)
Upper Intermediate (B2)
Native or bilingual
Part II LonelinessRead carefully and Indicate how often you feel the way described in each of the following statements. Choose one number for each. There are 20 statements in this section. 1 indicates “I never feel this way” 2 indicates “I rarely feel this way”

71
3 indicates “I sometimes feel this way” 4 indicates “I often feel this way”
10. Please evaluate on a scale from 1 to 4, how often you feel the way described in each of the
following statements. (1=never, 2=rarely, 3=sometimes, 4=often) *
NOTE FOR MOBILE USER: To see all the answer options, you may have to scroll left. It is alsohelpful to turn the phone in a horizontal position.Mark only one oval per row.
1 2 3 4
I am unhappy doing so manythings aloneI have nobody to talk toI CANNOT tolerate being so aloneI lack companionshipI feel as if nobody reallyunderstands meI find myself waiting for people tocall or writeThere is no one I can turn toI am no longer close to anyoneMy interests and ideas are NOTshared by those around meI feel left outI feel completely aloneI am unable to reach out andcommunicate with those aroundmeMy social relationships aresuperficialI feel starved for companyNo one really knows me wellI feel isolated from othersI am unhappy being so withdrawnIt is difficult for me to make friendsI feel shut out and excluded byothersPeople are around me but NOTwith me
Part III: Social media usage
11. 1. How often do you use social media *
1=Never, 2=Yearly, 3=Monthly, 4=Weekly, 5=DailyMark only one oval.
1 2 3 4 5
Never Daily

72
12. 2. What social media do you usually use? (multiple) *
Tick all that apply.
Facebook messenger
Snapchat
Tinder
Viber
Tumblr
LINE
Kakaotalk
Other:
13. 3. How long have you been using Facebook? *Mark only one oval.
Less than one year
13 years
35 years
Over 5 years
14. 4. In the past week, approximately how many hours did you averagely spend in Facebook
PER DAY? *
Mark only one oval.
Less than 1 hour
13 hours
35 hours
Over 5 hours
15. 5. How many Facebook friends do you have? *
Mark only one oval.
Less than 100
101299
300499
500699
Over 700

73
16. 6. Why are you on Facebook? (Multiple) *
Tick all that apply.
Friend suggested it
Everyone I know is on Facebook
Help others keep in touch with me
Find classmates
Received a promotional email of Facebook
Get to know more people
Network in general
Find course infomation
Find dates
Find people with mutual interests
Find jobs
17. 7. How much do you disclose yourself about the following information on Facebook?
(1=very little, 5=very much) *
NOTE FOR MOBILE USER: To see all the answer options, you may have to scroll left. It is alsohelpful to turn the phone in a horizontal position.Mark only one oval per row.
1 2 3 4 5
work & education informationplaces you've livedcontact & basic infofamily & relationshipDetails about you (such asnickname, favorite quotes)Life events

74
18. 8. Facebook Intensity: Indicate how often you engage in the following Facebook activities.(1=never, 2=occasionally, 3=monthly, 4=weekly, 5=daily) *
NOTE FOR MOBILE USER: To see all the answer options, you may have to scroll left. It is alsohelpful to turn the phone in a horizontal position.Mark only one oval per row.
1 2 3 4 5
Looking at/reading other people'sprofilesLooking at photosReading/responding to newsfeedsReading my own wall postsReading posts on others' wallsPosting on others' wallsReading private messages fromothersSending private messagesLooking at groupsResponding to/reviewing events orinvitationsAdding or removing friendsUpdating current status or newsfeedsLooking at video linksTagging or untagging photosAdding or removing groupsCommenting on photosCreating events and sendinginvitationsCreating groupsGetting information from othersInteracting with groupsPosting videos or links to videosPosting photosPosting links to other websitesUpdating or editing profileInteracting with the live chatfunctionInteracting with applications,quizzes or gamesBrowsing company or organizationpagesInteracting with the company ororganization pages

75
Powered by
19. 9. I use Facebook to......(1=strongly disagree, 3=neutral, 5=strongly agree) Evaluation on ascale from 1 to 5, how much do you agree with the following statements *
NOTE FOR MOBILE USER: To see all the answer options, you may have to scroll left. It is alsohelpful to turn the phone in a horizontal position.Mark only one oval per row.
1 2 3 4 5
To kill timeBecause it is entertainingBecause I enjoy itBecause it is funBecause it is a pleasant restBecause it relaxes meTo get away from pressures andresponsibilitiesTo get away from what I am doingTo put off something I should bedoingTo thank peopleTo let people know I care aboutthemTo show others encouragementTo help othersTo show others that I amconcerned about themTo not look oldfashionedTo look stylishTo look fashionableBecause I need someone to talkto or be withBecause I just need to talk aboutmy problems sometimesTo forget about my problemsTo make friends of the oppositesexTo be less inhibited chatting withstrangersTo meet people (newacquaintances)To feel involved with what’s goingon with other people