Changes in Older Adult Loneliness : Results From a Seven-Year Longitudinal Study
23
10.1177/0164027505279712 ARTICLE RESEARCH ON AGING Dykstra et al. / CHANGES IN LONELINESS Changes in Older Adult Loneliness Results From a Seven-Year Longitudinal Study PEARL A. DYKSTRA Netherlands Interdisciplinary Demographic Institute, The Hague THEO G. VAN TILBURG Vrije Universiteit, Amsterdam JENNY DE JONG GIERVELD Netherlands Interdisciplinary Demographic Institute, The Hague This study examines loneliness and its correlates—health, residential care, partner status, and network size—over a seven-year period among adults born between 1908 and 1937. The four waves of data are from the Dutch “Living Arrangements and Social Networks of Older Adults” and the “Longitudinal Aging Study of Amsterdam” programs. Data from at least two waves are available for 2,925 respondents. Results show that older adults generally become lonelier as time passes. The increase is greater for the oldest, the partnered, and those with a better functional capacity at baseline. Older adults who lose their partner by death show the greatest increase in loneliness. Not all older adults become more lonely: Improvement in functional capacity and network expansion lead to less loneliness. Entry into residential care does not affect loneliness. The longitudinal design provides new insights into factors that protect against loneliness compared to cross-sectional studies. Keywords: loneliness; longitudinal; protective factors; aging The image of the elderly in the general public is that of an overwhelm- ingly lonely group (Revenson 1986; Victor et al. 2002). In a U.S. sur- vey, for example, 38% of those younger than 65 named loneliness as a 725 AUTHORS’ NOTE: This study is based on data collected in the context of the “Living Ar- rangements and Social Networks of Older Adults” (NESTOR-LSN) and “Longitudinal Aging Study Amsterdam” (LASA) research programs. These programs are conducted at the Vrije Universiteit in Amsterdam and the Netherlands Interdisciplinary Demographic Institute in The Hague and are supported by the Netherlands Program for Research on Ageing (NESTOR) and the Ministry of Health, Welfare and Sports. Address correspondenceto Pearl A. Dykstra, Nether- lands Interdisciplinary Demographic Institute, Postbox 11650, 2502 AR The Hague, Nether- lands; phone: +31 (70) 356-5252; e-mail: [email protected]. RESEARCH ON AGING, Vol. 27 No. 6, November 2005 725-747 DOI: 10.1177/0164027505279712 © 2005 Sage Publications
-
Upload
independent -
Category
Documents
-
view
5 -
download
0
Transcript of Changes in Older Adult Loneliness : Results From a Seven-Year Longitudinal Study

10.1177/0164027505279712ARTICLERESEARCH ON AGINGDykstra et al. / CHANGES IN LONELINESS
Changes in Older Adult LonelinessResults From a Seven-Year Longitudinal Study
PEARL A. DYKSTRANetherlands Interdisciplinary Demographic Institute, The Hague
THEO G. VAN TILBURGVrije Universiteit, Amsterdam
JENNY DE JONG GIERVELDNetherlands Interdisciplinary Demographic Institute, The Hague
This study examines loneliness and its correlates—health, residential care, partnerstatus, and network size—over a seven-year period among adults born between 1908and 1937. The four waves of data are from the Dutch “Living Arrangements andSocial Networks of Older Adults” and the “Longitudinal Aging Study of Amsterdam”programs. Data from at least two waves are available for 2,925 respondents. Resultsshow that older adults generally become lonelier as time passes. The increase isgreater for the oldest, the partnered, and those with a better functional capacity atbaseline. Older adults who lose their partner by death show the greatest increase inloneliness. Not all older adults become more lonely: Improvement in functionalcapacity and network expansion lead to less loneliness. Entry into residential caredoes not affect loneliness. The longitudinal design provides new insights into factorsthat protect against loneliness compared to cross-sectional studies.
Keywords: loneliness; longitudinal; protective factors; aging
The image of the elderly in the general public is that of an overwhelm-ingly lonely group (Revenson 1986; Victor et al. 2002). In a U.S. sur-vey, for example, 38% of those younger than 65 named loneliness as a
725
AUTHORS’ NOTE: This study is based on data collected in the context of the “Living Ar-rangements and Social Networks of Older Adults” (NESTOR-LSN) and “Longitudinal AgingStudy Amsterdam” (LASA) research programs. These programs are conducted at the VrijeUniversiteit in Amsterdam and the Netherlands Interdisciplinary Demographic Institute in TheHague and are supported by the Netherlands Program for Research on Ageing (NESTOR) andthe Ministry of Health, Welfare and Sports. Address correspondence to Pearl A. Dykstra, Nether-lands Interdisciplinary Demographic Institute, Postbox 11650, 2502 AR The Hague, Nether-lands; phone: +31 (70) 356-5252; e-mail: [email protected].
RESEARCH ON AGING, Vol. 27 No. 6, November 2005 725-747DOI: 10.1177/0164027505279712© 2005 Sage Publications

very serious problem for older adults (National Council on the Aging2000). Becoming old is often equated with becoming lonely. Howmuch evidence is there for this belief? Do people become lonelier asthey get older? Results from cross-sectional studies suggest that lone-liness is common only among the very old (de Jong Gierveld 1998;Perlman 1984; Pinquart and Sörensen 2001). Between 20% and 30%(depending on the survey) of middle-aged and young-old respondentsreport moderate or serious loneliness. However, at advanced ages, theprevalence of loneliness increases. Of those aged 80 and older, 40% to50% characterize their situation as one of moderate or serious loneliness.
Loneliness is the unpleasant experience that occurs when a per-son’s network of relationships is deficient in some important way (deJong Gierveld 1987; Peplau and Perlman 1982). An often-used defini-tion of loneliness is that it involves an unwanted discrepancy betweenthe relationships one has and the ones one would like to have (Perlmanand Peplau 1981). Loneliness is more strongly associated with quali-tative than with quantitative characteristics of relationships (de JongGierveld 1998; Hughes et al. 2004).
Whether aging actually leads to an increase in loneliness cannot bedetermined on the basis of a single measurement in time. Longitudinaldata are required. Unfortunately, few longitudinal studies of loneli-ness have been carried out. Those that have been conducted involvesmall samples (Samuelsson, Andersson, and Hagberg 1998; Wengerand Burholt 2004) and focus on specific groups within the populationsuch as college students (Cutrona 1982; Jones and Moore 1989;Shaver, Furman, and Buhrmester 1985), AIDS patients (Nokes andKendrew 1990), alcoholics (Akerlind and Hornquist 1989), widowsand widowers (Lund, Caserta, and Dimond 1993; van Baarsen et al.1999), and older men (Tijhuis et al. 1999). Jylhä’s (2004) population-based prospective longitudinal study of loneliness is an exception, buther study included no information on corresponding changes inrespondents’ life circumstances.
This study uses loneliness data from a large nationally representa-tive sample of the Dutch older adult population, collected at fourpoints in time over a seven-year period. A previous analysis of datafrom the same group of respondents for two measurement pointsshowed a decrease in loneliness over a one-year period (de JongGierveld and Dykstra 1996). Now we can find out what happens overa period of seven years. The following questions are addressed: What
726 RESEARCH ON AGING
is the general trend across time in loneliness among older adults? Ifchanges in loneliness occur, how can they be explained? Finally, dothe changes over time differ for different categories of older adults?
Why Might Loneliness Change Over Time?
The definition of loneliness as an unwanted discrepancy betweenthe relationships one has and the ones one would like served as thebackdrop for identifying ways in which aging might affect loneliness.This definition has two central components: existing relationships anddesired relationships. These two components have structured ourideas about changes in loneliness as people age.
AGING AND EXISTING RELATIONSHIPS
Demographic reality tells us that the older people become, the morelikely they are to experience the loss of age peers. Widowhood comeswith old age, an event that of course is more likely to occur to womenthan men. The loss of the spouse has been found to be a major risk fac-tor for loneliness in late life (de Jong Gierveld and van Tilburg 1987;Pinquart 2003; Stroebe and Stroebe 1987; Victor et al. 2005). Atadvanced ages, people are also increasingly likely to outlive friendsand siblings, situations that have been found to contribute to loneli-ness (Gold 1987; Mullins and Mushel 1992).
Old age may not only bring a loss of ties but also a reduction insocial activity. Incapacity of network members, but also of olderadults themselves, imposes difficulties on maintaining contact. Notsurprisingly, studies tend to show a negative association betweenhealth and loneliness (de Jong Gierveld and van Tilburg 1995; Jones,Victor, and Vetter 1985; Jylhä 2004).
One should be cautious not to equate aging with social losses.There are also relationship gains in late life, and they may lead to adecline in loneliness. New partnerships after widowhood or divorceare one example. Older adults’ social networks may expand in otherways: Retirement enables people to engage in new commitments, andthe birth of grandchildren may bring increased interactions with chil-dren. Research indicates that older adults continue to make newacquaintances or to renew long-existing slumbering ties, even at
Dykstra et al. / CHANGES IN LONELINESS 727

advanced ages (Bowling, Grundy, and Farquhar 1995; Lang 2000; vanTilburg 1998). Although poor health might reduce possibilities formaintaining relationships, increased demands may mobilize helpersand increase the support received (Miller and McFall 1991; Stollerand Pugliesi 1988).
AGING AND DESIRED RELATIONSHIPS
One source of insight into the question of how aging might affectolder adults’ relationship desires comes from disengagement theory(Cumming and Henry 1961). A withdrawal from social involvementsis considered to be an integral part of aging. To become old is tobecome increasingly self-focused. Presumably, such a process ofwithdrawal means that older adults start attaching less importance tosocial ties and find increasing gains in solitude.
Perlman (1988) has two explanations for why older adults are notas lonely a group as stereotypes suggest. The first is that the desiredlevels of contact might drop as rapidly as the actual level of contact.The second is that older adults might have higher ratings of the qualityof their relationships. In line with these explanations, we would like topoint to the possible role of social comparison processes (Festinger1954) in late life loneliness. Older adults might be less lonely becausethey feel their social circumstances compare favorably in terms of ear-lier expectations or relative to peers.
The next perspective centers on changing needs for support. Atadvanced ages, people’s functional capacities tend to decline, bring-ing reduced means of managing independently. Help cannot alwaysbe mobilized successfully. Unmet needs, linked with an unwanteddependency and feelings of disappointment, may give rise to feelingsof loneliness.
AGING AND LONELINESS
The previous considerations are not equivocal regarding the rela-tionship of aging and loneliness. The “loss,” “reduction in socialactivity,” and “increased needs” perspectives suggest an increase inloneliness over time, whereas the “gains,” “disengagement,” and“positive social comparison” perspectives suggest a decrease overtime. In what follows, we describe that way in which insights from the
728 RESEARCH ON AGING

various perspectives were incorporated in the present study. Weselected variables (from a data set that was not developed specificallyfor research on changes in loneliness) that approximate the previouslydescribed theoretical concepts as closely as possible. Unfortunately,we had no measures for disengagement or positive social comparison.
Design of the Study
RESPONDENTS
The Time 1 (T1) data are from 3,805 face-to-face interviews con-ducted in 1992 with respondents born between 1908 and 1937 whoparticipated in the “Living Arrangements and Social Networks ofOlder Adults’ (NESTOR-LSN) research program (Knipscheer et al.1995). The oldest individuals, and in particular the oldest men, wereoverrepresented in the stratified random sample. The response ratewas 62%. The Time 2 (T2; 1992-1993), Time 3 (T3; 1995-1996), andTime 4 (T4; 1998-1999) data are from follow-up interviews1 con-ducted in the context of the Longitudinal Aging Study Amsterdam(LASA; Deeg and Westendorp-de Serière 1994).
The interval between T1 and T2 averaged .86 years (SD = .18);between T2 and T3, 3.06 years (SD = .16); between T3 and T4, 2.99years (SD = .21); and between T1 and T4, 6.91 years (SD = .24). Com-plete loneliness data from four waves were available for 1,701 respon-dents, from at least three waves for 2,251 respondents (not necessarilythe first three; respondents might have missed an interview in between),and from at least two waves for 2,925 respondents.
Using multivariate logistic regression, we examined differenceswith regard to gender, age, functional capacity, educational level,income, and household composition, all measured at T1, betweenrespondents for whom we had longitudinal data (from two, three, orfour waves) and (1) those who had died or could not participate in thestudy because of severe physical and/or mental problems, and (2)those who refused to participate in the follow-up. Compared withrespondents who had died or who had severe physical and/or mentalproblems, respondents for whom we had longitudinal data were morelikely to be female, young, living independently, and well educatedand to have a good functional capacity. Compared to refusers, respon-
Dykstra et al. / CHANGES IN LONELINESS 729

dents for whom we had longitudinal data had a higher income. Inother words, the study sample is a survivor sample. Furthermore, thesample is characterized by a relatively high socioeconomic status.Nevertheless, the stratified sampling frame and the sample size guar-anteed the inclusion of sufficient men, respondents of advanced age,respondents with physical problems and chronic ailments, and respon-dents with a low socioeconomic status.
MEASUREMENTS
Loneliness. The same 11-item Loneliness Scale was used at thefour points in time. The scale meets the criteria of a Rasch model andconsists of five positive and six negative items (de Jong Gierveld andKamphuis 1985). To meet the goodness-of-fit tests of a Rasch model,item difficulties must be invariant if a respondent sample is divided onthe basis of characteristics such as age, race, gender, or test-score pro-files. The positive items assess feelings of belongingness (e.g., “I canrely on my friends whenever I need them”). The negative items applyto aspects of missing relationships (e.g., “I experience a sense of emp-tiness around me”). Response categories were no, more or less, andyes. Responses to the positive items were reversed. To improve scalehomogeneity, the answers were dichotomized, assigning the middlecategory to the value indicating loneliness. The rationale for using the“more or less” answer as an indicator of loneliness is that respondentsare reluctant to admit to items describing social network deficits (or toagree with items describing gratifying relationships), given the stigmaassociated with loneliness. Scale scores range from 0 (not lonely) to11 (extremely lonely). The scale has been used in several Dutch sur-veys and has proven to be a reliable and valid instrument that is robustto different data collection modalities (van Tilburg and de Leeuw1991). The homogeneity (Loevingers’s H ≥ .33) and reliability (ρ ≥.81) of the scale were sufficient for each of the observations.
Health. Both the “reduction in social activity” and the “increasedneeds” perspectives are based on deteriorations in health with age. Forthat reason, two health measures were included in the analyses. Thefirst is a measure of functional capacity: a sum score of six itemsassessing difficulties in self-care, mobility, and carrying out house-hold activities (e.g., dressing and undressing, walking up and down
730 RESEARCH ON AGING

stairs, and doing the laundry and regularly cleaning the house). Thefive possible answers were not at all, only with help, with a great dealof difficulty, with some difficulty, and without difficulty. Scale scoresrange from 6 (no functional capacity) to 30 (full functional capacity).The six items constituted hierarchically homogeneous scales at thefour observations (Loevinger’s H ≥ .59), which were reliably mea-sured (ρ ≥ .83). The second health measure is a subjective rating,namely, the response to the question, “How is your health in general?”Self-rated health is widely recognized as a comprehensive indicator ofhealth (Deeg and Bath 2003). Answer categories range from 1 (poor)to 5 (very good). A deterioration in health should lead to greater lone-liness, whereas an improvement should lead to less loneliness. Ifhealth conditions remain the same, there should be no change inloneliness.
Residential care. The “increased needs” perspective requires infor-mation on the extent to which needs for support are actually fulfilled.Although there is no direct measure of need fulfillment, we do haveinformation on residential care. For the four moments in time, weknow whether the older adult is still living independently or hasentered an institution. A comparison of two groups of older adultsmatched on gender, age, partner status, and health, one living inde-pendently the other institutionalized, revealed lower levels of loneli-ness among those who had been admitted to residential care (de JongGierveld and Kamphuis 1986). The authors concluded that the entryinto residential care brought an end to the older adults’anxieties aboutcoping on their own and subsequently made them feel less lonely.Russell et al. (1997) have also suggested that for extremely lonelyolder adults, nursing home admission might be a strategy to gainsocial contact with others. In this study, we expect a decrease in loneli-ness among those who enter residential care and no change amongthose who remain in their own homes.
Partner status. The “loss” and “gains” perspectives assume infor-mation on network members. The presence or absence of a partner inthe household was assessed at the four points in time. In more than95% of the cases, the partner was a spouse; consensual unions wererelatively infrequent. A change in partner status between measure-ments pertains either to having lost a partner or to having become
Dykstra et al. / CHANGES IN LONELINESS 731

involved in a new partner relationship. The expectation is that the lossof a partner leads to an increase, whereas a new partnership is accom-panied by a decrease in loneliness. If there is no change in partner sta-tus, there should be no change in loneliness.
Network size. The same network delineation procedure (see vanTilburg 1995 for details) was used for the four observations. Sevenrelationship domains were specified: household members, childrenand their partners, other kin, neighbors, colleagues, organizationalcontacts, and others. For each domain, respondents were requested tospecify the names of those with whom they were in touch regularlyand who were important to them. The definitions of these conceptswere left to the respondents. The size of the social networks rangedfrom 0 to 77. For reasons of parsimony, the analysis does not look atthe loss or gain of specific types of relationships but rather at the totalsize of the network. We expect a decrease in network size to lead togreater loneliness, whereas an increase in network size should lead toa reduction in loneliness. The loneliness scores of respondents whosenetworks do not change in size should remain unchanged.
PROCEDURE
The usual strategy for analyzing changes over time if one has morethan two measurement points is to apply MANOVA for repeated mea-surements. A drawback of MANOVA, however, is that it is restrictedto cases with data from all four waves and that it assumes equal obser-vation intervals for all respondents. As described earlier, our study hasdifferent conditions. We have data from only two or three observa-tions for a considerable portion of our respondents, and there is a rela-tively large variation in the individual observation intervals (the T1-T4
time interval ranges between 5.89 and 7.75 years). Multilevel analysiscan deal with these limitations (Snijders 1996). It does not requiredata for a fixed number of observations for all respondents. Moreover,the time between measurement points can be modeled explicitly;there is no need to assume equal follow-up intervals.
Preliminary analyses indicated that the variation in the sample wasretained by not restricting the study of change to respondents forwhom data from four observations were available. Respondents withdata from two or three observations were a less select group than those
732 RESEARCH ON AGING

with four observations. They were less select in the sense that theywere less often female (47% vs. 55%), were older at T1 (73.1 vs. 67.0years), had lower levels of education (8.4 vs. 9.1 years), were lesslikely to be living with a partner (64% vs. 73%), and had a poorerfunctional capacity (28.6 vs. 27.2).
The models in our analysis had two levels: the level of the respon-dent and the level of the observations. Data from the observationswere nested within respondents. The models were analyzed usingMlwiN (Rashbash et al. 2000), a computer program for multilevelanalysis. We applied the forward modeling approach, starting with anempty model (containing only a constant) and adding explanatoryvariables as fixed effects at subsequent steps. The parameter estimatesof the fixed effects and their standard errors can be read in the sameway as unstandardized coefficients in linear regression models. Amethod for evaluating the compatibility of a model is to look at thereduction of deviance (measured as the –2*log-likelihood). The devi-ance is the lack of correspondence between the model and the data.The difference in deviance of successive models has a chi-square dis-tribution with the number of added explanatory variables as degrees offreedom.
The multilevel analysis followed a stepwise procedure. The firstaim was to determine the trend over time in feelings of loneliness: Isthere an increase in loneliness, a decrease, or is there no change? Timeis the number of years since the first point of measurement. Second,we wanted to find out whether initial conditions (T1 characteristics)predicted differences in loneliness. They were age, gender, living inresidential care, functional capacity, self-reported health, partner sta-tus, and network size. Given the large body of research suggesting thatthe benefits of marriage differ between men and women (e.g., Antonucci1994; Dykstra and de Jong Gierveld 2004; Umberson 1992), we alsoincluded an interaction between gender and partner status. The vari-ables for time, age, network size, functional capacity, and self-reported health were centered on the mean to avoid multicollinearity,following Cronbach’s (1987) recommendation. Third, we examinedwhether the changes in loneliness differed for different categories ofolder adults. We did so by testing interactions between T1 characteris-tics and time. Finally, we examined the impact on loneliness ofchanges in the initial characteristics, taking into account baseline lev-els. Change was computed as the difference in relation to the T1 score.
Dykstra et al. / CHANGES IN LONELINESS 733

In summary, our analysis unraveled (a) effects of the initial condi-tions, (b) differential effects of the initial conditions over time, and (c)effects of changes in the initial conditions over time.
Results
DESCRIPTIVE ANALYSIS
Table 1 shows the means for the four points in time for loneliness,age, the proportion in residential care, functional capacity, self-reported health, the presence of a partner in the household, and net-work size. Note that the means in Table 1 are based on respondentswho participated in all four waves of the study. Thus, they reflect thecircumstances of survivors and, specifically, those within that groupwho are relatively fit. Another limitation is that the table shows aggre-gate change only. Variability within the sample is glossed over.
The mean loneliness scores show a decrease in loneliness betweenT1 and T2 and a subsequent increase between T2 and T3 and between T3
and T4. Across time, a consistent decrease in functional capacity canbe observed. There is also a steady decrease in the subjective healthratings. The percentage living in residential care shows an increaseacross time, whereas the percentage with a partner shows a decreaseover time. Between T1 and T2, there is a decrease in mean network size,an increase between T2 and T3, and a decrease between T3 and T4.
Table 2 provides additional information on changes in lonelinessscores between T1 and T2, T2 and T3, and T3 and T4. Here the analyseswere not restricted to respondents who participated in all four waves.The Edwards-Nunnally method (Speer 1992), which takes into accountmeasurement errors and regression toward the mean, was applied todetermine whether individual change was significant. This method isapplied in mental health research to determine the practical impor-tance of statistical effects found in clinical trials. It is a means of pre-venting change rates from being artificially inflated by regressiontoward the mean (Jacobson et al. 1999). From one measure to the next,the loneliness scores of more than 70% of the respondents remainedunchanged, whereas a decrease in loneliness was observed for between10% and 13%, and an increase in loneliness was observed for between11% and 18% of the respondents.
734 RESEARCH ON AGING

735
TAB
LE
1
Des
crip
tive
Dat
a fo
r R
espo
nden
ts W
ho P
artic
ipat
ed in
All
Four
Wav
es (
N=
1,7
01)
Tim
e 1
Tim
e 2
Tim
e 3
Tim
e 4
MSD
MSD
MSD
MSD
Lon
elin
ess
1.9
2.5
1.8
2.4
2.0
2.5
2.3
2.7
Gen
der
(% m
ale)
45.4
Age
(55
+)
66.9
8.1
67.8
8.1
70.9
8.1
73.8
8.1
Res
iden
tial c
are
(% y
es)
0.9
1.3
3.6
5.2
Func
tiona
l cap
acity
(6-
30)
28.0
2.6
28.2
3.6
27.7
4.1
26.6
5.1
Self
-rep
orte
d he
alth
(1-
5)3.
80.
83.
70.
93.
70.
93.
60.
9Pa
rtne
r (%
yes
)70
.068
.463
.157
.8N
etw
ork
size
(0-
77)
15.6
10.3
14.8
8.6
15.2
8.7
14.8
8.8

MULTILEVEL ANALYSIS2
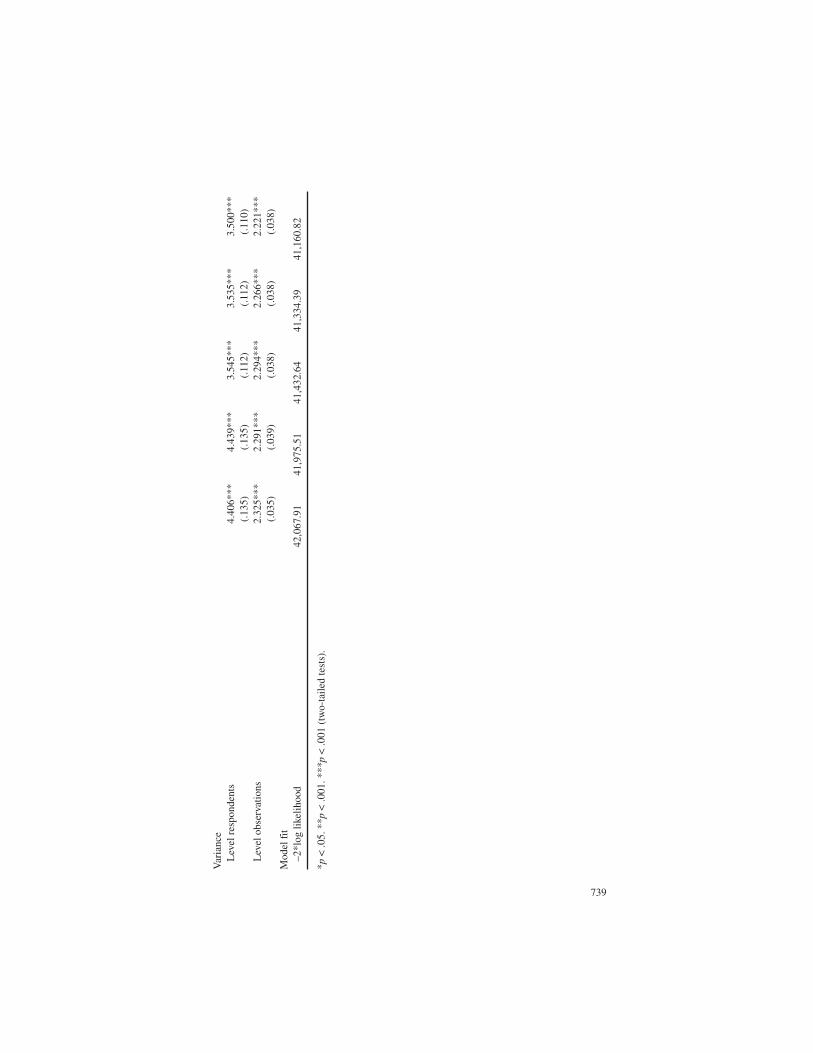
Table 3 shows the results of the multilevel analysis. Model 1 is a so-called empty model, specifying only a constant. Its parameter esti-mate is the mean loneliness score of 2.21 for the sample of 2,925respondents who participated in at least two waves. The variance atthe respondent level (4.406) is more than twice as large as that at thelevel of individual observations (2.325), indicating that the variationin loneliness scores between respondents is considerably larger thanthe variation across time for individual respondents. It is also an indi-cation of a relatively high degree of stability in loneliness across time.
Time is introduced in Model 2. Its parameter estimate indicates anincrease of 0.06 points on the Loneliness Scale with each year thatpasses. The introduction of time does not lead to a reduction of thevariance in loneliness at the respondent level, as expected, but doesresult in a reduction of the variance at the level of observations. Thelatter finding indicates that there is significant variation betweenobservations attributable to linear changes over time.
Model 3 tests whether T1 characteristics are associated with differ-ences in loneliness. The results show a positive association betweenage and loneliness: The older tend to be lonelier than the younger. Dif-
736 RESEARCH ON AGING
TABLE 2
Change in Loneliness Scores (Edwards-Nunnallymethod of significance of individual change)
Time 1 Time 2 Time 3Time 2 Time 3 Time 4
n % n % n %
Decrease p < .001 79 2.7 52 2.3 37 2.1Decrease p < .01 93 3.2 39 1.7 35 2.0Decrease p < .05 68 2.4 46 2.0 29 1.6Decrease p < .10 147 5.1 92 4.1 80 4.5No change 2,201 76.1 1,613 71.8 1,286 72.5Increase p < .10 58 2.0 88 3.9 55 3.1Increase p < .05 86 3.0 95 4.2 85 4.8Increase p < .01 64 2.2 63 2.8 58 3.3Increase p < .001 95 3.3 160 7.1 108 6.1Total 2,891 100 2,248 100 1,773 100
(text continues on p. 740)

737
TAB
LE
3
Mul
tilev
el A
naly
sis
of C
hang
es in
Lon
elin
ess
(2,9
25 r
espo
nden
ts, 9
,858
obs
erva
tions
)
Mod
el 1
Mod
el 2
Mod
el 3
Mod
el 4
Mod
el 5
Con
stan
t2.
212*
**2.
079*
**2.
918*
**3.
029*
**3.
000*
**(.
042)
(.04
4)(.
291)
(.30
4)(.
290)
Tim
e0.
060*
**0.
065*
**0.
022
0.00
9(.
006)
(.00
6)(.
066)
(.01
1)T
ime
1 ch
arac
teri
stic
sG
ende
r (1
= m
ale)
0.61
1***
0.60
3***
0.62
2***
(.14
6)(.
145)
(.14
5)A
ge (
55-8
4)0.
027*
**0.
012*
0.01
1*(.
005)
(.00
5)(.
005)
Res
iden
tial c
are
(1 =
yes
)–0
.196
–0.2
05–0
.188
(.28
6)(.
300)
(.28
4)A
DL
-cap
acity
(6-
30)
–0.0
24–0
.033
*–0
.034
*(.
013)
(.01
4)*
(.01
4)Se
lf-r
epor
ted
heal
th (
1-5)
–0.5
27**
*–0
.539
***
–0.5
58**
*(.
049)
(.05
2)(.
050)
Part
ner
(1 =
yes
)–0
.935
***
–1.1
42**
*–1
.180
***
(.11
1)(.
115)
(.11
5)G
ende
r×
Part
ner
–0.7
93**
*–0
.776
***
–0.7
41**
*(.
175)
(.17
4)(.
173)
Net
wor
k si
ze (
0-70
)–0
.002
*–0
.005
*–0
.003
**(.
001)
(.00
2)(.
001)
Tim
e 1
Cha
ract
eris
tics
×T
ime
Age
×T
ime
0.00
7***
0.00
5***
(.00
1)(.
001)
(con
tinu
ed)

738
Res
iden
tial C
are
×T
ime
–0.0
01(.
067)
Func
tiona
l Cap
acity
×T
ime
0.00
5*0.
005*
(.00
2)(.
002)
Self
-Rep
orte
d H
ealth
×T
ime
0.00
4(.
008)
Part
ner
×T
ime
0.09
5***
0.08
2***
(.01
4)(.
014)
Net
wor
k Si
ze×
Tim
e0.
001
(.00
1)C
hang
es a
t Tim
e 2,
Tim
e 3,
or
Tim
e 4
Cha
nge
resi
dent
ial c
are
0.09
5(.
167)
Los
s pa
rtne
r1.
130*
**(.
104)
New
par
tner
–0.6
11(.
352)
Cha
nge
func
tiona
l cap
acity
(–2
3-14
)–0
.019
**(.
007)
Cha
nge
subj
ectiv
e he
alth
(–4
-4)
–0.1
25**
*(.
028)
Cha
nge
netw
ork
size
(–6
5-60
)–0
.016
***
(.00
3)
TAB
LE
3 (
cont
inue
d)
Mod
el 1
Mod
el 2
Mod
el 3
Mod
el 4
Mod
el 5
739
Var
ianc
eL
evel
res
pond
ents
4.40
6***
4.43
9***
3.54
5***
3.53
5***
3.50
0***
(.13
5)(.
135)
(.11
2)(.
112)
(.11
0)L
evel
obs
erva
tions
2.32
5***
2.29
1***
2.29
4***
2.26
6***
2.22
1***
(.03
5)(.
039)
(.03
8)(.
038)
(.03
8)M
odel
fit
–2*l
og li
kelih
ood
42,0
67.9
141
,975
.51
41,4
32.6
441
,334
.39
41,1
60.8
2
*p<
.05.
**p
< .0
01. *
**p
< .0
01 (
two-
taile
d te
sts)
.

ferences in loneliness between those living in residential care andthose living in their own homes are not observed.3 Self-reported healthat T1 is inversely associated with loneliness, but differences in func-tional capacity do not account for significant differences in loneliness.The gender and partner main effects and their interaction should beinterpreted as follows. Older adults with a partner tend to be leastlonely, and the difference between partnered men and women is negli-gible. In comparison, the loneliness estimate is about 1.0 points higherfor unpartnered women and about 1.6 points higher for unpartneredmen. Finally, the Model 3 results show that network size is inverselyrelated to loneliness. The consideration of T1 characteristics results ina decrease in the variation in loneliness at the level of the respondentbut leaves the variation at the level of observations unchanged.
Model 4 introduces interactions between the T1 characteristics andtime. The results show that the increase in loneliness is greater forolder than for younger respondents, for those with a better functionalcapacity than for those with poorer functional status, and for olderadults with a partner compared to those who are single. The interac-tions of time with residential care status, self-reported health, and net-work size at T1 do not reach levels of significance. For reasons of par-simony, these interactions were dropped in the subsequent and finalmodel. The consideration of the interactions with time is not associ-ated with a drop in the variance in loneliness at the level of respon-dents, but there is a significant reduction in variance in loneliness atthe level of observations.
In Model 5, the effects on loneliness of changes after T1 in residen-tial care status, functional capacity, self-reported health, partner sta-tus, and network size are taken into account. As the last column ofTable 3 shows, changes in residential care status are not linked withchanges in loneliness. The estimates for changes in functional capac-ity should be considered jointly with those for functional capacity atT1 and the interaction with time. Respondents who report declines infunctional capacity show an increase in loneliness, and this is particu-larly so for those with a relatively high functional capacity at T1.Respondents who report better functional capacity over time tend tobecome less lonely, but the effect on loneliness of improvements infunctional capacity are not as marked as that for declines in functionalcapacity. For example, the level of loneliness of older adults with afunctional score of 30 at T1 and a score of 6 at T4 increases 1.5 points,
740 RESEARCH ON AGING

whereas respondents with a functional score of 6 at T1 and a score of30 at T4 show a decrease of 0.2 points. The pattern of results forchanges in self-reported health parallels that for changes in functionalcapacity. Model 5 also shows that the loss of a partner leads to higherlevels of loneliness, but a new partnership is not accompanied by a sig-nificant decrease in loneliness. The joint consideration of the esti-mates for partner status at T1, the interaction of T1 partner status withtime, and the change in partner status shows that the loneliness scoreof older adults who were partnered at T1 but single at a later observa-tion increases by 1.9 points, whereas that for respondents who weresingle at T1 but partnered at a later observation decreases by 0.5 points.Finally, there is a significant effect of changes in network size. Anexpansion of network size results in less loneliness, whereas a reduc-tion in the number of network members leads to greater loneliness.The introduction of the change variables leads to a reduction invariance in loneliness scores both at the respondent level and at thelevel of individual observations.
Conclusion
In this study, we looked at loneliness and its correlates over a seven-year period. Our first aim was to find the general trend in lonelinessover time. The results provide a clear picture: as time passes, olderadults become lonelier. These findings contradict earlier results (deJong Gierveld and Dykstra 1996) showing a decrease in lonelinessover time. The earlier study, although based on the same sample ofrespondents, used only two measurements separated by the relativelyshort time span of one year. In the 1996 article, the authors suggestedthat the decrease in loneliness might be a methodological artifact. Pre-sumably, participation in the survey had occasioned the respondentsto carefully consider their social ties, leading to more positive evalua-tions. The more complex patterns emerging from the analysis pre-sented in this article demonstrate the danger of projecting patterns ofchange from just two data points.
The present study also shows, however, that the increase in loneli-ness is not the same for all categories of older adults. First, the increasein loneliness is highest for the oldest respondents. Earlier studiesusing cross-sectional loneliness data suggested such a pattern: little
Dykstra et al. / CHANGES IN LONELINESS 741

change in loneliness for the “younger” old and a strong increase forthe “older” old. The longitudinal data provide an important empiricalconfirmation of a pattern of findings that so far has only been based onan examination of age differences in loneliness using data collected atone point in time.
Second, the increase over time in loneliness varies according to thepartner status at T1. Notwithstanding the generally lower levels ofloneliness among those with a partner than among those who are sin-gle, over time, those living with a partner show a stronger increase inloneliness than do those who remain single. This finding suggests thatthe partner relationship might not offer the same kind of protectionagainst loneliness at advanced ages as it does earlier in the life course.For example, the relationship undergoes substantial changes as one orboth of the partners are confronted with increasing frailty (Nieboer1997). The person who previously was a major source of support mayhave become the target of intensive caregiving. Anxiety over the part-ner’s health, the loss of partner support, together with the demands ofcaregiving may contribute to significant increases in loneliness. Note,however, that those who lose their partner by death show the greatestincrease in loneliness. Qualitative changes in partner relationships atadvanced ages have received little attention in the literature. In ourview, they form an interesting line of research for the future.
Third, the increase over time in loneliness varies with respondents’health status at T1. Those who start in good health and subsequentlyexperience declines show the greatest increase in loneliness. How-ever, substantial increases in loneliness are also observed among thosewith continuing good health. Although older adults with better healthtend to be less lonely than those with poorer health, the differencebetween the two groups diminishes over time. Apparently, healthbecomes a weaker predictor of loneliness as time passes. It is notentirely clear how to account for this finding. In our view, the interpre-tation should be sought in processes of accommodation wherebyolder adults strive to achieve a match between their personal aspira-tions and the demands of their circumstances (Brandstädter andRenner 1992). In our view, a qualitative follow-up of a subsamplefocusing on accommodation processes is needed to shed light on thefindings.
The finding that the protective effects on loneliness of having apartner and of being in good physical health decline over time is an
742 RESEARCH ON AGING

insight that could only be gained from using data from multiplewaves. The longitudinal design has advanced our knowledge into fac-tors that provide protection against loneliness compared to what hasbeen reported on the basis of cross-sectional studies. Note that thedecline in protective effect does not hold for all predictors: The pro-tective effect of being involved in a network of relationships does notchange across successive waves.
Contrary to our prediction that the entry into a residential care facil-ity would be accompanied by a decrease in loneliness feelings, therewere no changes in loneliness associated with this transition. Theabsence of an effect is possibly attributable to the small number ofrespondents entering residential care. The shift in the function of resi-dential care facilities (van Solinge 1995), with a greater emphasis oncare and a diminishing importance of the institution as a livingarrangement, might also play a role.
Although the general trend over time is an increase in loneliness,the findings also indicate that certain categories of older adultsbecome less rather than more lonely over time. For example, thosewho experience an improvement in health report lower levels of lone-liness over time. Unfortunately, the dominant focus in research andpolicy is on older adults whose health declines. As our study shows,the rewards of a recovery from disease or an improvement in healthare clear: Older adults experiencing such a change become less lonely.The social losses that tend to accompany old age also receive greaterattention in research and policy than do social gains. Our longitudinaldata show that older adults do not only lose ties; they also make newones. Levels of loneliness drop among those with networks thatincrease in size over time. Nevertheless, our findings show that thedeclines in loneliness that come with improvements in health and anew partner are smaller than the increases in loneliness that arebrought about by health deterioration and the loss of a partner.
NOTES
1. At Time 2, to reduce nonresponse, loneliness data were collected by means of a writtenquestionnaire for 170 respondents with missing values on this variable. The data from theserespondents are excluded from the present analysis because earlier methodological analyseshave indicated that the mode of data collection (telephone interview, face-to-face interview,
Dykstra et al. / CHANGES IN LONELINESS 743

written questionnaire) has an effect on reports of loneliness feelings (van Tilburg and de Leeuw1991). When loneliness data are collected by means of a written questionnaire, loneliness levelstend to be higher than when collected by either a telephone or a face-to-face interview.
2. The distribution of loneliness scores was heavily skewed. For that reason, the multilevelanalysis was also carried out using the natural logarithm of the scores. The pattern of results washighly similar for the two kinds of measures. For simplicity of interpretation, results based on thenontransformed scores are presented.
3. There is no effect for residential care because health differences have been taken intoaccount. If functional capacity is excluded from the analysis, for example, we do find higher lev-els of loneliness among older adults in residential care than among those living at home.
REFERENCES
Akerlind, Ingemar and Jan Olof Hörnquist. 1989. “Stability and Change in Feelings of Loneli-ness: A Two-Year Prospective Longitudinal Study of Advanced Alcohol Abusers.” Scandi-navian Journal of Psychology 30:102-12.
Antonucci, Toni C. 1994. “A Life-Span View of Women’s Social Relations.” Pp. 239-69 inWomen Growing Older: Psychological Perspectives, edited by B. F. Turner and L. Troll. Lon-don: Sage.
Bowling, Ann, Emily Grundy, and Morag Farquhar. 1995. “Changes in Network CompositionAmong the Very Old Living in Inner London.” Journal of Cross-Cultural Gerontology10:331-47.
Brandstädter, Jochen and Gerolf Renner. 1992. “Coping With Discrepancies Between Aspira-tions and Achievements in Adult Development: A Dual-Process Model.” Pp. 301-19 in LifeCrises and Experiences of Loss in Adulthood, edited by L. Montada, S.-H. Filipp, and R. M.Lerner. Hillsdale, NJ: Lawrence Erlbaum.
Cronbach, Lee J. 1987. “Statistical Tests for Moderator Variables: Flaws in Analyses RecentlyProposed.” Psychological Bulletin 102:414-17.
Cumming, Elaine and William H. Henry. 1961. Growing Old: The Process of Disengagement.New York: Basic Books.
Cutrona, Carolyn E. 1982. “Transition to College: Loneliness and the Process of Social Adjust-ment.” Pp. 291-309 in Loneliness: A Sourcebook of Current, Theory and Therapy, edited byL. A. Peplau and D. Perlman. New York: John Wiley.
Deeg, Dorly J. H. and Peter A. Bath. 2003. “Self-Rated Health, Gender and Mortality in OlderPersons: Introduction to a Special Section.” The Gerontologist 43:369-71.
Deeg, Dorly J. H. and Mariëtte Westendorp-de Serière, eds. 1994. Autonomy and Well-being inthe Aging Population I: Report from the Longitudinal Aging Study Amsterdam 1992-1993.Amsterdam: VU University Press.
de Jong Gierveld, Jenny. 1987. “Developing and Testing a Model of Loneliness.” Journal of Per-sonality & Social Psychology 53:119-28.
. 1998. “A Review of Loneliness: Concepts and Definitions, Determinants and Conse-quences.” Reviews in Clinical Gerontology 8:73-80.
de Jong Gierveld, Jenny and Pearl A. Dykstra. 1996. “Eenzaamheid Komt en Gaat met de Tijd:Effecten van Veranderingen in het Sociale Netwerk en in Gezondheid van 55-Plussers op hunMate van Eenzaamheid” (Loneliness Comes and Goes: Unraveling the Impact on Lonelinessof Changes in the Network of Social Relationships and Changes in the Health of OlderAdults). Mens en Maatschappij 70:189-208.
744 RESEARCH ON AGING

de Jong Gierveld, Jenny and Frans Kamphuis. 1985. “The Development of a Rasch-Type Loneli-ness Scale.” Applied Psychological Measurement 9:289-99.
. 1986. “Opname in een Verzorgingstehuis: Een Oplossing voor Eenzame Ouderen?”(Admission Into a Nursing Home: A Solution for Lonely Elderly?). Tijdschrift voorGerontologie en Geriatrie 17:147-56.
de Jong Gierveld, Jenny and Theo G. van Tilburg. 1987. “The Partner as Source of Social Supportin Problem and Non-Problem Situations.” Journal of Social Behavior and Personality 2:191-200.
. 1995. “Social Relationships, Integration, and Loneliness.” Pp. 155-72 in Living Arrange-ments and Social Networks of Older Adults, edited by C. P. M. Knipscheer, J. de JongGierveld, T. G. van Tilburg, and P. A. Dykstra. Amsterdam: VU University Press.
Dykstra, Pearl A. and Jenny de Jong Gierveld. 2004. “Gender and Marital-History Differences inEmotional and Social Loneliness Among Dutch Older Adults.” Canadian Journal on Aging/La revue canadienne du vieillissement 23:141-55.
Festinger, Leon. 1954. “A Theory of Social Comparison Processes.” Human Relations 7:117-40.Gold, Deborah T. 1987. “Siblings in Old Age: Something Special.” Canadian Journal on Aging
6:199-215.Hughes, Mary E., Linda J. Waite, Louise C. Hawkley, and John T. Cacioppo. 2004. “A Short
Scale for Measuring Loneliness in Large Surveys: Results From Two Population-BasedStudies.” Research on Aging 26:655-72.
Jacobson, Neil S., Lisa J. Roberts, Sara B. Berns, and Joseph B. McGlinchey. 1999. “Methods forDefining and Determining the Clinical Significance of Treatment Effects: Description,Application and Alternatives.” Journal of Consulting and Clinical Psychology 67:300-307.
Jones, Dorothy A., Christina R. Victor, and Norman J. Vetter. 1985. “The Problem of Lonelinessin the Elderly in the Community: Characteristics of Those Who Are Lonely and the FactorsRelated to Loneliness.” Journal of the Royal College of General Practitioners 35:136-39.
Jones, Warren H. and Teri L. Moore. 1989. “Loneliness and Social Support.” Pp. 145-56 in Lone-liness, Theory, Research and Applications, edited by M. Hojat and R. Crandall. London:Sage.
Jylhä, Marja. 2004. “Old Age and Loneliness: Cross-Sectional and Longitudinal Analyses in theTampere Longitudinal Study on Aging.” Canadian Journal on Aging/La revue canadiennedu vieillissement 23:157-68.
Knipscheer, Cornelis P. M., Jenny de Jong Gierveld, Theo G. van Tilburg, and Pearl A. Dykstra,eds. 1995. Living Arrangements and Social Networks of Older Adults. Amsterdam: VU Uni-versity Press.
Lang, Frieder R. 2000. “Endings and Continuity of Social Relationships: Maximizing IntrinsicBenefits Within Personal Networks When Feeling Near to Death.” Journal of Social and Per-sonal Relationships 17:155-82.
Lund, Dale A., Michael S. Caserta, and Margaret F. Dimond. 1993. “The Course of Bereavementin Later Life.” Pp. 240-54 in Handbook of Bereavement: Theory, Research, and Intervention,edited by M. S. Stroebe, W. Stroebe, and R. O. Hansson. Cambridge, UK: Cambridge Uni-versity Press.
Miller, Baila and Stephanie McFall. 1991. “Stability and Change in the Informal Task SocialSupport Network of Frail Older Persons.” The Gerontologist 31:735-45.
Mullins, Larry C. and Mary Mushel. 1992. “The Existence and Emotional Closeness of Relation-ships With Children, Friends and Spouses: The Effect on Loneliness Among Older Persons.”Research on Aging 14:448-70.
National Council on the Aging. 2000. American Perceptions of Aging in the 21st Century. Chartbook in the Myths and Realities of Aging series. Washington, DC: National Council on theAging.
Dykstra et al. / CHANGES IN LONELINESS 745

Nieboer, Anna P. 1997. “Life-Events and Well-being: A Prospective Study on Changes in Well-Being of Elderly People due to a Serious Illness Event or Death of the Spouse.” Ph.D. thesis,University of Groningen, the Netherlands.
Nokes, Kathleen M. and Joan Kendrew. 1990. “Loneliness in Veterans With AIDS and Its Rela-tionship to the Development of Infections.” Archives of Psychiatric Nursing 4:271-77.
Peplau, Letitia A. and Daniel Perlman. 1982. “Perspectives on Loneliness.” Pp. 1-18 in Loneli-ness: A Sourcebook of Current Theory, Research and Therapy, edited by L. A. Peplau and D.Perlman. New York: John Wiley.
Perlman, Daniel. 1988. “Loneliness: A Life-Span, Family Perspective.” Pp. 190-220 in Familiesand Social Networks, edited by R. M. Milardo. London: Sage.
Perlman, Daniel and L. Anne Peplau. 1981. “Toward a Social Psychology of Loneliness.” Pp. 31-56 in Personal Relationships 3: Personal Relationships in Disorder, edited by R. Gilmourand S. Duck. London: Academic Press.
. 1984. “Loneliness Research: A Survey of Empirical Findings.” Pp. 13-46 in Preventingthe Harmful Consequences of Severe and Persistent Loneliness, edited by L. A. Peplau andS. E. Goldston. DHHS publication no. ADM 84-112. Washington, DC: Government PrintingOffice.
Pinquart, Martin. 2003. “Loneliness in Married, Widowed, Divorced and Never-Married OlderAdults.” Journal of Social and Personal Relationships 20:31-53.
Pinquart, Martin and Silvia Sörensen. 2001. “Influence on Loneliness in Older Adults: A Meta-Analysis.” Basic and Applied Social Psychology 23:245-66.
Rashbash, Jon, William Browne, Harvey Goldstein, Min Yang, Ian Plewis, Michael Healy, et al.2000. A User’s Guide to MlwiN. London: Multilevel Models Project, Institute of Education,University of London.
Revenson, Tracey A. 1986. “Debunking the Myth of Loneliness in Late Life.” Pp. 115-35 inRedefining Social Problems, edited by E. Seidman and J. Rappaport. New York: Plenum.
Russell, Daniel, W., Carolyn E. Cutrona, Robert B. Wallace and Arlene de la Mora. 1997. “Lone-liness and Nursing Home Admission Among Rural Older Adults.” Psychology and Aging12:574-89.
Samuelsson, Gillis, Lars Andersson, and Bo Hagberg. 1998. “Loneliness in Relation to Social,Psychological and Medical Variables Over a 13-Year Period: A Study of the Elderly in aSwedish Rural District.” Journal of Mental Health and Aging 4:361-78.
Shaver, Phil, Wyndal Furman, and Duane Buhrmester. 1985. “Transition to College: NetworkChanges, Social Skills and Loneliness.” Pp. 193-219 in Understanding Personal Relation-ships: An Interdisciplinary Approach, edited by S. Duck and D. Perlman. London: Sage.
Snijders, Tom. 1996. “Analysis of Longitudinal Data Using the Hierarchical Linear Model.”Quality and Quantity 30:405-26.
Speer, David C. 1992. “Clinically Significant Change: Jacobson and Truax (1991) Revisited.”Journal of Consulting and Clinical Psychology 60:402-8.
Stoller, Eleanor P. and Karen L. Pugliesi. 1988. “Informal Networks of Community-BasedElderly: Changes in Composition Over Time.” Research on Aging 10:499-516.
Stroebe, Wolfgang and Margaret Stroebe. 1987. Bereavement and Health: The Psychologicaland Physical Consequences of Partner Loss. New York: Cambridge University Press.
Tijhuis, Marja A. R., Jenny de Jong Gierveld, Edith J. M. Feskens, and Daan Kromhout. 1999.“Changes in and Factors Related to Loneliness in Older Men: The Zutphen Elderly Study.”Age and Ageing 28:491-95.
Umberson, Debra. 1992. “Gender, Marital Status and the Social Control of Health Behavior.”Social Science and Medicine 34:907-17.
van Baarsen, Brenda, Johannes H. Smit, Tom A. B. Snijders, and Kees P. M. Knipscheer. 1999.“Do Personal Conditions and Circumstances Surrounding Partner Loss Explain Lonelinessin Newly Bereaved Older Adults?” Ageing and Society 19:441-69.
746 RESEARCH ON AGING

van Solinge, Hanna. 1995. “Het Veranderende Imago van het Bejaardenoord” (The ChangingImage of Residential Care Facilities for the Elderly). Demos 11:1-3.
van Tilburg, Theo G. 1995. “Delineation of the Network and Differences in Network Size.” Pp.83-96 in Living Arrangements and Social Networks of Older Adults, edited by C. P. M.Knipscheer, J. de Jong Gierveld, T. G. van Tilburg, and P. A. Dykstra. Amsterdam: VU Uni-versity Press.
. 1998. “Losing and Gaining in Old Age: Changes in Personal Network Size and SocialSupport in a Four-Year Longitudinal Study.” Journal of Gerontology: Social Sciences53B:S313-23.
van Tilburg, Theo G. and Edith D. de Leeuw. 1991. “Stability of Scale Quality Under DifferentData Collection Procedures: A Mode Comparison on the ‘De Jong Gierveld LonelinessScale.’” International Journal of Public Opinion Research 3:69-85.
Victor, Christina, R., Sasha J. Scrambler, Ann Bowling, and John Bond. 2005. “The Prevalenceof, and Risk Factors for, Loneliness in Later Life: A Survey of Older People in Great Britain.”Ageing & Society 25:357-75.
Victor, Christina, R., Sasha J. Scrambler, Sunil Shah, Derek G. Cook, Tess Harris, ElizabethRink, et al. 2002. “Has Loneliness Amongst Older People Increased? An Investigation IntoVariations Between Cohorts.” Ageing & Society 22:585-97.
Wenger, G. Clare and Vanessa Burholt. 2004. “Changes in Levels of Social Isolation and Loneli-ness Among Older People in a Rural Area: A Twenty-Year Longitudinal Study.” CanadianJournal on Aging/la revue canadienne du vieillissement 23:115-27.
Pearl A. Dykstra is a senior researcher at the Netherlands Interdisciplinary Demo-graphic Institute (NIDI), The Hague and has a chair in family demography at UtrechtUniversity. Her publications focus on late life families, aging and the life course,social networks, and loneliness. At present, she also is the director of the NetherlandsKinship Panel Study (NKPS).
Theo G. van Tilburg is a professor of social gerontology at the Vrije Universiteit inAmsterdam. He is director of the research program “Social context of aging.” His re-search interests include the effects of personal network characteristics and socialsupport on well-being and life-course developments in personal networks, related todeteriorating health and role loss.
Jenny de Jong Gierveld is a professor emeritus in the Department of Sociology andSocial Gerontology at the Vrije Universiteit in Amsterdam and Honorary Fellow atthe Netherlands Interdisciplinary Demographic Institute (NIDI), The Hague. She haspublished in the areas of social research methodology, loneliness, and living arrange-ments and social networks of older adults.
Dykstra et al. / CHANGES IN LONELINESS 747