Linking Italy and the Balkans. A Y-chromosome perspective from the Arbereshe of Calabria
10
ORIGINAL ARTICLE Linking Italy and the Balkans. A Y-chromosome perspective from the Arbereshe of Calabria Alessio Boattini 1 , Donata Luiselli 1 , Marco Sazzini 1 , Antonella Useli 1 , Giuseppe Tagarelli 2 & Davide Pettener 1 1 Dipartimento di Biologia E.S., Area di Antropologia, Universita ` di Bologna, Bologna, Italy, and 2 Istituto di Scienze Neurologiche – CNR, Mangone, Cosenza, Italy Background: The Arbereshe are an Albanian-speaking ethno-linguistic minority who settled in Calabria (southern Italy) about five centuries ago. Aim: This study aims to clarify the genetic relationships between Italy and the Balkans through analysis of Y- chromosome variability in a peculiar case study, the Arbereshe. Subject and methods: Founder surnames were used as a means to identify a sample of individuals that might trace back to the Albanians at the time of their establishment in Italy. These results were compared with data of more than 1000 individuals from Italy and the Balkans. Results: The distributions of haplogroups (defined using 31 UEPs) and haplotypes (12 STRs) show that the Italian and Balkan populations are clearly divergent from each other. Within this genetic landscape, the Arbereshe are characterized by two peculiarities: (a) they are a clear outlier in the Italian genetic background, showing a strong genetic affinity with southern Balkans populations; and (b) they retain a high degree of genetic diversity. Conclusion: These results support the hypothesis that the surname-chosen Arbereshe are representative of the Y- chromosome genetic variability of the Albanian founder population. Accordingly, the Arbereshe genetic structure can contribute to the interpretation of the recent biological history of the southern Balkans. Intra-haplogroup analyses suggest that this area may have experienced important changes in the last five centuries, resulting in a marked increase in the frequency of haplogroups I2a and J2. Keywords: UEPs, STRs, linguistic minorities, sampling strategies, surnames INTRODUCTION Although Italy and the Balkans show a high degree of cultural and linguistic complexity, their genetic landscape, as seen from a continental point of view, is homogeneous and often characterized by wide clinal trends (Cavalli-Sforza et al. 1994; Rosser et al. 2000; Semino et al. 2000; Gusmao et al. 2003; Xiao et al. 2004; Currat and Excoffier 2005). Nevertheless, genetic studies based on a regional scale and a more detailed sampling grid have revealed more distinct patterns, in which the continental clines are less evident or even cancelled by events related to local history and geography (Di Giacomo et al. 2003) or interrupted by zones of abrupt gene frequency change (Stefan et al. 2001). The Arbereshe are one of the largest linguistic minorities in Italy. They are the result of complicated movements of Albanians around the end of the 15 th and beginning of the 16 th century, often linked to the invasion of the Balkans by the Ottoman Empire. Despite that, it is generally agreed that most of the immigrants started moving from the south of Albania (Toskeria), with, very often, intermediate steps in Greece, particularly in the Peloponnese (Zangari 1941). Further evidence is provided by linguistic research, according to which Arberisht, the language spoken by Arbereshe, is part of the Tosk dialect group of Albanian, a language originally spoken in Toskeria (Babiniotis 1998). The Arbereshe of Calabria are a most important and interesting nucleus, due to their abundance and exceptional resilience in preserving a distinct cultural identity, charac- terized by the language (Arberisht), the Greek Orthodox religion and a common mytho-history (Fiorini et al. 2007). The investigated population is scattered around the Mount Pollino massif, near the Basilicata– Calabria border, and interspersed among Italian communities that share the same territory. Historically, the population has been very isolated, in an environment poor in natural resources. The economy was based on sheep breeding and the cultivation of cereals and forage. This age-old situation only changed during the second half of the 20 th century, as a consequence of events Correspondence: Professor Davide Pettener, Dipartimento di Biologia E.S., Area di Antropologia, Via Selmi 3, 40126, Bologna, Italy. E-mail: [email protected] ( Received 14 January 2010; accepted 28 April 2010) Annals of Human Biology, January – February 2011; 38(1): 59–68 Copyright q Informa UK, Ltd. ISSN 0301-4460 print/ISSN 1464-5033 online DOI: 10.3109/03014460.2010.491837 59 Ann Hum Biol Downloaded from informahealthcare.com by D S Diffusioni Scientifiche - Unical on 01/13/11 For personal use only.
Transcript of Linking Italy and the Balkans. A Y-chromosome perspective from the Arbereshe of Calabria
ORIGINAL ARTICLE
Linking Italy and the Balkans. A Y-chromosome perspective from theArbereshe of Calabria
Alessio Boattini1, Donata Luiselli1, Marco Sazzini1, Antonella Useli1, Giuseppe Tagarelli2 &Davide Pettener1
1Dipartimento di Biologia E.S., Area di Antropologia, Universita di Bologna, Bologna, Italy, and 2Istituto di ScienzeNeurologiche–CNR, Mangone, Cosenza, Italy
Background: The Arbereshe are an Albanian-speaking
ethno-linguistic minority who settled in Calabria (southern
Italy) about five centuries ago.
Aim: This study aims to clarify the genetic relationships
between Italy and the Balkans through analysis of Y-
chromosome variability in a peculiar case study, the Arbereshe.
Subject and methods: Founder surnames were used as a means
to identify a sample of individuals that might trace back to the
Albanians at the time of their establishment in Italy. These
results were compared with data of more than 1000
individuals from Italy and the Balkans.
Results: The distributions of haplogroups (defined using 31
UEPs) and haplotypes (12 STRs) show that the Italian and
Balkan populations are clearly divergent from each other.
Within this genetic landscape, the Arbereshe are characterized
by two peculiarities: (a) they are a clear outlier in the Italian
genetic background, showing a strong genetic affinity with
southern Balkans populations; and (b) they retain a high
degree of genetic diversity.
Conclusion: These results support the hypothesis that the
surname-chosen Arbereshe are representative of the Y-
chromosome genetic variability of the Albanian founder
population. Accordingly, the Arbereshe genetic structure can
contribute to the interpretation of the recent biological history
of the southern Balkans. Intra-haplogroup analyses suggest
that this area may have experienced important changes in the
last five centuries, resulting in a marked increase in the
frequency of haplogroups I2a and J2.
Keywords: UEPs, STRs, linguistic minorities, sampling strategies,
surnames
INTRODUCTION
Although Italy and the Balkans show a high degree ofcultural and linguistic complexity, their genetic landscape,
as seen from a continental point of view, is homogeneousand often characterized by wide clinal trends (Cavalli-Sforzaet al. 1994; Rosser et al. 2000; Semino et al. 2000; Gusmaoet al. 2003; Xiao et al. 2004; Currat and Excoffier 2005).Nevertheless, genetic studies based on a regional scale and amore detailed sampling grid have revealed more distinctpatterns, in which the continental clines are less evident oreven cancelled by events related to local history andgeography (Di Giacomo et al. 2003) or interrupted by zonesof abrupt gene frequency change (Stefan et al. 2001).
The Arbereshe are one of the largest linguistic minoritiesin Italy. They are the result of complicated movements ofAlbanians around the end of the 15th and beginning of the16th century, often linked to the invasion of the Balkans bythe Ottoman Empire. Despite that, it is generally agreed thatmost of the immigrants started moving from the south ofAlbania (Toskeria), with, very often, intermediate steps inGreece, particularly in the Peloponnese (Zangari 1941).Further evidence is provided by linguistic research,according to which Arberisht, the language spoken byArbereshe, is part of the Tosk dialect group of Albanian, alanguage originally spoken in Toskeria (Babiniotis 1998).
The Arbereshe of Calabria are a most important andinteresting nucleus, due to their abundance and exceptionalresilience in preserving a distinct cultural identity, charac-terized by the language (Arberisht), the Greek Orthodoxreligion and a common mytho-history (Fiorini et al. 2007).The investigated population is scattered around the MountPollino massif, near the Basilicata–Calabria border, andinterspersed among Italian communities that share the sameterritory. Historically, the population has been very isolated,in an environment poor in natural resources. The economywas based on sheep breeding and the cultivation of cerealsand forage. This age-old situation only changed during thesecond half of the 20th century, as a consequence of events
Correspondence: Professor Davide Pettener, Dipartimento di Biologia E.S., Area di Antropologia, Via Selmi 3, 40126, Bologna, Italy.
E-mail: [email protected]
(Received 14 January 2010; accepted 28 April 2010)
Annals of Human Biology, January–February 2011; 38(1): 59–68Copyright q Informa UK, Ltd.ISSN 0301-4460 print/ISSN 1464-5033 onlineDOI: 10.3109/03014460.2010.491837
59
Ann
Hum
Bio
l Dow
nloa
ded
from
info
rmah
ealth
care
.com
by
D S
Dif
fusi
oni S
cien
tific
he -
Uni
cal o
n 01
/13/
11Fo
r pe
rson
al u
se o
nly.
related to the ‘economic miracle’ that transformed Italy froma rural country to an industrialized one in a few decades.These changes caused abandonment of the agriculturalsector, much emigration and, finally, a partial loss of originalcultural traits. The Arbereshe have received much attentionfrom cultural anthropologists (Resta 1991) and theirbiological structure has been analysed in recent biodemo-graphic studies (Fiorini et al. 2007; Tagarelli et al. 2007).These studies have shown that the Arbereshe preserved theirisolated population structure, characterized by remarkablyhigh values of village endogamy and inbreeding and markeddifferentiation between single villages, up to the first half ofthe 20th century.
For all these reasons, the Arbereshe represent an ideal linkbetween Italy and the Balkans. Investigating their geneticstructure necessarily implies the adoption of an intermedi-ate approach between a regional and a microgeographicstudy, for which purpose Y-chromosome analysis isparticularly suited.
The Arbereshe Y-chromosome variation was investigatedby sampling individuals from different villages of the Pollinoarea (Calabria) who bear one of the founding surnames ofthe population. The genotyping was performed using 12microsatellites (STRs) and 31 unique event polymorphisms(UEPs), defining, respectively, haplotypes and haplogroups.The Italian and Balkan genetic backgrounds were exploredusing the large amount of data provided by recentY-chromosome studies in the two peninsulas and byliterature data on STRs from forensic research.
The main purpose of this study was to unravel theY-chromosome structure of the Arbereshe and to exploretheir Balkan ancestral genetic background. Moreover,information on Arbereshe Y-chromosome variabilitycontributes to the understanding of the recent genetichistory of the Balkans and Italy.
MATERIALS AND METHODS
DNA samplesFor this study an Arbereshe sample composed of 40individuals was collected. The adopted sampling strategy wasbased on the link between patrilineal surnames andthe genetic markers of the non-recombining region of theY-chromosome (Jobling 2001; Manni et al. 2005; King et al.2006; Bowden et al. 2008; King and Jobling 2009). In fact, theselection of modern samples based on surnames known toexist in the Arbereshe founding population might allow us toget as near as possible to the Y-chromosomal diversity ofthose first immigrants. Accordingly, we compiled a list offounding surnames from fiscal censuses of the Arbereshevillages drawn up in 1543–1545 (Supplemental Table A;online version only), only a very few years after the mainfounding event (Zangari 1941). Arbereshe people wereusually given different fiscal treatment from Italians, thusArbereshe families and surnames may be clearly identified.Occasional resemblances between Italian and Arbereshesurnames are due to Italian officers ‘Italianizing’ ortranslating the original Albanian names, or to rare shifts to
Italian nicknames/names. Admittedly, this circumstance maycause some confusion with Italian lineages bearing surnamesthat are similar/identical to those in the list. This is the case,for example, with surnames like Russo, Ferraro, Cavallo, thatare widespread in Southern Italy. We tried to minimize thatrisk by choosing, in most cases, rare surnames; when this wasnot possible, we considered surnames that: (1) areuncommon among the Italian populations of the samearea (e.g. Cavallo) and (2) are available in census data up tothe 16th century in the very same village in which the samplewas taken. At that time, ethnic exogamy and immigration ofItalian families in Arbereshe villages was extremely rare(Pettener 1990). Beyond the possession of a foundersurname, samples were collected on the basis of self-declaredaffiliation to the Arbereshe people and patrilineal residencein an Arbereshe village. Duplicate surnames were avoided inorder to: (1) maximize the number of Y-chromosomelineages compared to the sample size; and (2) minimize theeffects of genetic drift, that might have changed the relativefrequencies of surnames through time. Of course, thedrawback of the above procedure is an increased probabilityto sample rare surnames/Y-chromosomes, possibly leadingto slight over-estimates of Y-chromosome diversity. Biode-mographic research (Fiorini et al. 2007; Tagarelli et al. 2007)has demonstrated that one characteristic trait of theArbereshe historic biological structure was a high degree ofsub-division and genetic differentiation between commu-nities. In order to avoid the effects of genetic drift in singlevillages, individuals were sampled in 13 different Arbereshehamlets scattered in the province of Cosenza, namely:Acquaformosa, Cerzeto, Civita, Firmo, Frascineto, Lungro,Plataci, S. Basile, S. Cosmo Albanese, S. Demetrio Corone,S. Giorgio Albanese, S. Sofia d’Epiro and Spezzano Albanese.In summary, the collected sample represents 40 differentfounding Arbereshe paternal lineages.
Sampling was performed using buccal swabs. DNA wasextracted by standard procedures.
Our data were integrated and compared with literaturedata covering Italy and the Balkans. Data on UEPs and STRswere taken from papers by Capelli et al. (2007) for Italy; Boschet al. (2006) and Marjanovic et al. (2005) (UEPs only) for theBalkans. Further information on STRs was included for thefollowing countries: Bosnia-Herzegovina (Klaric et al. 2005),Serbia (Lauc et al. 2005), Western Croatia (Lovrecic et al.2005), Kosovo (Pericic et al. 2004), Macedonia (Pericic et al.2005a,b), Albania (Robino et al. 2002) and continentalGreece (Robino et al. 2004). A full list of the consideredsamples is reported in Table I and their geographic location isrepresented in Figure 1.
All the UEPs data were standardized to the followinghaplogroup scheme: DE*(xE1b1b1a)-YAP, E1b1b1a-M78(formerly E3b1), F*(xG,I,J,K)-M89, G-M201, I-M170,J*(xJ2)-12f2, J2-M172, K*(xP)-M9, R1*(xR1a1)-M173,R1a1-M17 (Y Chromosome Consortium 2002; Karafet et al.2008). Likewise, the following STRs were selected: DYS19,DYS385a, DYS385b, DYS389I, DYS389II, DYS390, DYS391,DYS392 and DYS393.
60 A. BOATTINI ET AL.
Annals of Human Biology
Ann
Hum
Bio
l Dow
nloa
ded
from
info
rmah
ealth
care
.com
by
D S
Dif
fusi
oni S
cien
tific
he -
Uni
cal o
n 01
/13/
11Fo
r pe
rson
al u
se o
nly.
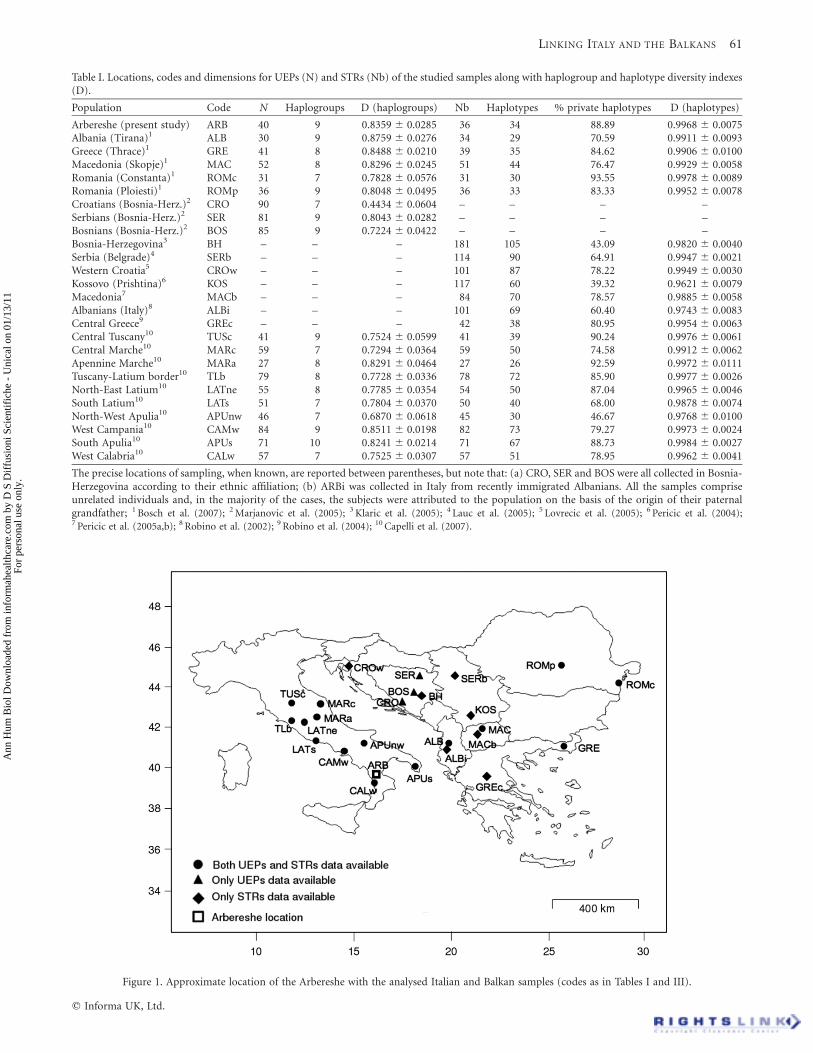
Table I. Locations, codes and dimensions for UEPs (N) and STRs (Nb) of the studied samples along with haplogroup and haplotype diversity indexes(D).
Population Code N Haplogroups D (haplogroups) Nb Haplotypes % private haplotypes D (haplotypes)
Arbereshe (present study) ARB 40 9 0.8359 ^ 0.0285 36 34 88.89 0.9968 ^ 0.0075Albania (Tirana)1 ALB 30 9 0.8759 ^ 0.0276 34 29 70.59 0.9911 ^ 0.0093Greece (Thrace)1 GRE 41 8 0.8488 ^ 0.0210 39 35 84.62 0.9906 ^ 0.0100Macedonia (Skopje)1 MAC 52 8 0.8296 ^ 0.0245 51 44 76.47 0.9929 ^ 0.0058Romania (Constanta)1 ROMc 31 7 0.7828 ^ 0.0576 31 30 93.55 0.9978 ^ 0.0089Romania (Ploiesti)1 ROMp 36 9 0.8048 ^ 0.0495 36 33 83.33 0.9952 ^ 0.0078Croatians (Bosnia-Herz.)2 CRO 90 7 0.4434 ^ 0.0604 – – – –Serbians (Bosnia-Herz.)2 SER 81 9 0.8043 ^ 0.0282 – – – –Bosnians (Bosnia-Herz.)2 BOS 85 9 0.7224 ^ 0.0422 – – – –Bosnia-Herzegovina3 BH – – – 181 105 43.09 0.9820 ^ 0.0040Serbia (Belgrade)4 SERb – – – 114 90 64.91 0.9947 ^ 0.0021Western Croatia5 CROw – – – 101 87 78.22 0.9949 ^ 0.0030Kossovo (Prishtina)6 KOS – – – 117 60 39.32 0.9621 ^ 0.0079Macedonia7 MACb – – – 84 70 78.57 0.9885 ^ 0.0058Albanians (Italy)8 ALBi – – – 101 69 60.40 0.9743 ^ 0.0083Central Greece9 GREc – – – 42 38 80.95 0.9954 ^ 0.0063Central Tuscany10 TUSc 41 9 0.7524 ^ 0.0599 41 39 90.24 0.9976 ^ 0.0061Central Marche10 MARc 59 7 0.7294 ^ 0.0364 59 50 74.58 0.9912 ^ 0.0062Apennine Marche10 MARa 27 8 0.8291 ^ 0.0464 27 26 92.59 0.9972 ^ 0.0111Tuscany-Latium border10 TLb 79 8 0.7728 ^ 0.0336 78 72 85.90 0.9977 ^ 0.0026North-East Latium10 LATne 55 8 0.7785 ^ 0.0354 54 50 87.04 0.9965 ^ 0.0046South Latium10 LATs 51 7 0.7804 ^ 0.0370 50 40 68.00 0.9878 ^ 0.0074North-West Apulia10 APUnw 46 7 0.6870 ^ 0.0618 45 30 46.67 0.9768 ^ 0.0100West Campania10 CAMw 84 9 0.8511 ^ 0.0198 82 73 79.27 0.9973 ^ 0.0024South Apulia10 APUs 71 10 0.8241 ^ 0.0214 71 67 88.73 0.9984 ^ 0.0027West Calabria10 CALw 57 7 0.7525 ^ 0.0307 57 51 78.95 0.9962 ^ 0.0041
The precise locations of sampling, when known, are reported between parentheses, but note that: (a) CRO, SER and BOS were all collected in Bosnia-Herzegovina according to their ethnic affiliation; (b) ARBi was collected in Italy from recently immigrated Albanians. All the samples compriseunrelated individuals and, in the majority of the cases, the subjects were attributed to the population on the basis of the origin of their paternalgrandfather; 1 Bosch et al. (2007); 2 Marjanovic et al. (2005); 3 Klaric et al. (2005); 4 Lauc et al. (2005); 5 Lovrecic et al. (2005); 6 Pericic et al. (2004);7 Pericic et al. (2005a,b); 8 Robino et al. (2002); 9 Robino et al. (2004); 10 Capelli et al. (2007).
Figure 1. Approximate location of the Arbereshe with the analysed Italian and Balkan samples (codes as in Tables I and III).
LINKING ITALY AND THE BALKANS 61
q Informa UK, Ltd.
Ann
Hum
Bio
l Dow
nloa
ded
from
info
rmah
ealth
care
.com
by
D S
Dif
fusi
oni S
cien
tific
he -
Uni
cal o
n 01
/13/
11Fo
r pe
rson
al u
se o
nly.

GenotypingAll samples were analysed for the presence of 31 Y-UEPs,following a hierarchical approach based on the updated YChromosome Consortium phylogeny (Karafet et al. 2008).Two UEPs (M9 and the insertion polymorphism YAP) weredetected by Restriction Fragment Length Polymorphism(RFLP) analysis according to previously described methods(Rosser et al. 2000; Underhill et al. 2000). 29 UEPs (M170,M62, M172, M26, M201, TAT, M22, P25, SRY10831,92R7/M45, M173, M70, M213, 12f2, M34, M81, M78, M35,M96, M123, M167, M17, M153, M18, M37, M126, M73,M65, M160) were typed using the SNaPshot minisequencingmethod (Brion et al. 2005).
To estimate haplotype variation within the haplogroupsdefined by UEPs, all samples were additionally typed for 12Y-chromosome STR loci (DYS19, DYS389I, DYS389II,DYS385a, DYS385b, DYS390, DYS391, DYS392, DYS393,DYS437, DYS438 and DYS439) using the PowerPlex YSystem (Promega Corporation, WI, USA), following therecommendations of the manufacturer.
Data analysisHaplogroup and haplotype diversity were computed usingNei’s standard method (Nei and Kumar 2000) asimplemented in Arlequin 3.10 (Excoffier et al. 2005). Thatprogram was also used to calculate an RST distance matrixbased on the STR haplotypes. A synthetic representation ofinter-population similarities based on haplogroup frequencieswas obtained with correspondence analysis using the Rsoftware (function corresp, library MASS) (R DevelopmentCore Team 2008). The RST distance matrix was used toperform a cluster analysis using Ward’s algorithm asimplemented in the R software (function hclust, library stats).
Haplogroup specific median joining networks (Bandeltet al. 1999) were constructed using the program Network4.201 (www.fluxus-technology.com). Each STR was given aspecific weight calculated as the nearest integer to 10 Vm/Vi,where Vm is the mean variance of all STRs and Vi is thevariance of the ith STR. Calculations were repeated for eachhaplogroup. To allow maximal resolution DYS385 wasincluded in the networks as two separate loci; however, sincethe networks were built within haplogroups, it may be lesslikely that apparently identical DYS385 configurations wereactually two different genotypes. DYS385 was also includedin the diversity calculations, which may have caused slightunder-estimates; biases should nevertheless be negligible,especially in samples with high gene diversity (Balaresqueet al. 2007). Individuals with occasional duplications atother STR loci were excluded from the calculations. Balkandescent clusters within networks were identified, defining acore of .2 identical Balkan haplotypes and including allone-step neighbours and one-step-neighbours of one-step-neighbours; two step neighbours were excluded (King andJobling 2009).
Analysis of Molecular Variance (AMOVA) was performedusing the function amova within the R add-on package ade4(Excoffier et al. 1992; Dray and Dufour 2007). Admixture
coefficients were estimated using the software ADMIX 2.0 (Dupanloup and Excoffier 2001).
RESULTS
Haplogroup and haplotype distributionUEPs genotyping yielded reliable results for all 40 sampledindividuals (Table I). The haplogroup structure of theArbereshe is characterized by high frequencies of E1b1b1a(28%), I (23%), R1*(xR1a1) (18%), R1a1 (13%) and G(10%). As expected, Nei’s estimator of diversity (D) shows aconsiderably high value: D ¼ 0.8359 ^ 0.0285.
STRs genotyping yielded reliable results for 36 (out of 40)individuals (Table I). The Arbereshe sample showed highdiversity levels and high percentages of private haplotypes(a complete list of the Arbereshe haplotypes is reported inSupplemental Table B; online version only).
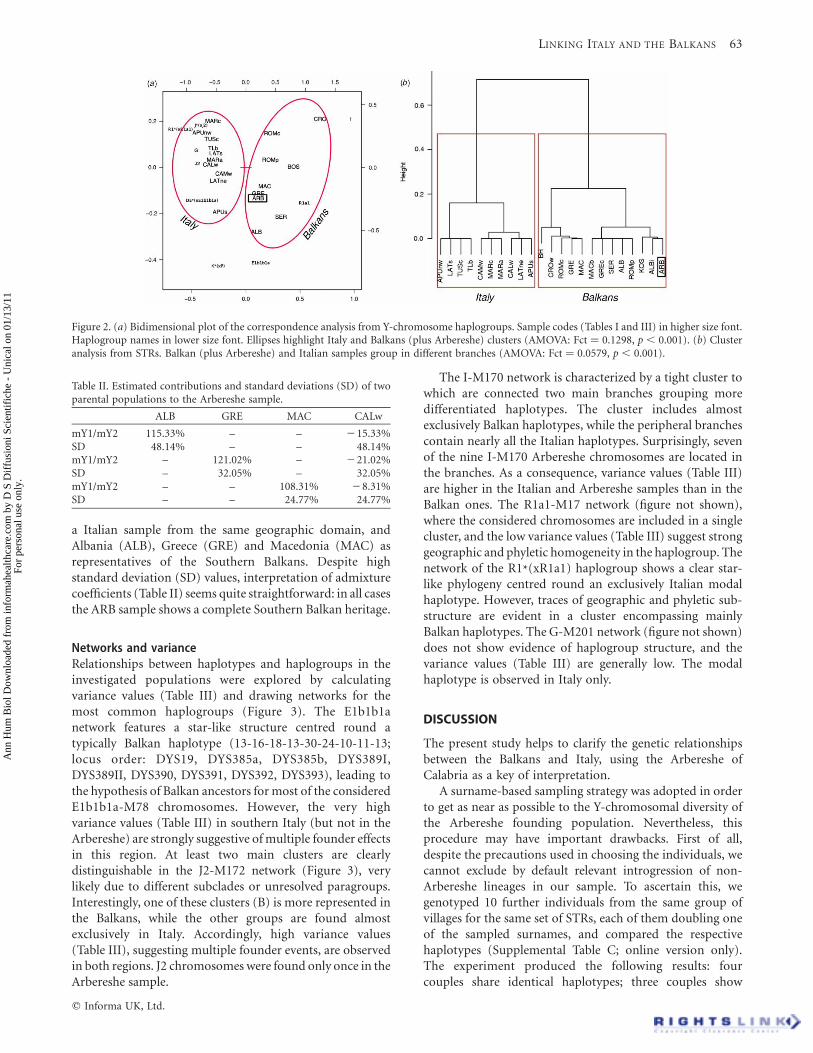
Correspondence analysisHaplogroup frequencies were used to visualize therelationships among the investigated populations bymeans of correspondence analysis. The results (Figure 2(a))show that Italian and Balkan samples tend to cluster in twodifferent groups separated along the first dimension of thegraphic. The distribution of the samples along the seconddimension is loosely related to their latitude, but there areno significant correlations (Balkans: r ¼ 0.62, p ¼ 0.1150;Italy: r ¼ 0.18, p ¼ 0.5857). Interestingly, the ARB samplefalls within the Balkan cluster, in particular among thesouthern samples. To these results are associated high andsignificant Fct values from AMOVA analysis applied to thefollowing groups: (a) Italian populations, (b) Balkanpopulations and Arbereshe (Fct ¼ 0.1298; Fsc ¼ 0.0282;Fst ¼ 0.1544, p , 0.001 in all cases); the differences betweenclusters explain 12.99% of total variation; variationsbetween samples within clusters 2.45%; variations withinsamples 84.56%. Alternative clusterings (e.g. the inclusion ofthe Arbereshe sample in the Italian cluster, its placement in aseparated group, etc.) caused a slight reduction of the Fctvalue (results not shown).
Cluster analysisThe RST distance matrix was used to perform a clusteranalysis (Figure 2(b)). The results confirm that: (a) theBalkan and Italian samples cluster in clearly separatedgroups; and (b) the Arbereshe are included in the Balkangroup, showing the highest affinity with other Albanian-speaking populations (ALBi and KOS). Again, these groups(Figure 2(b)) are supported by high Fct AMOVA values; indetail: Fct ¼ 0.0579; Fsc ¼ 0.0340; Fst ¼ 0.0899 ( p , 0.001in all cases), to which 5.79%, 3.20% and 91.01% of the totalvariation, respectively, correspond, while different groupsreturn lower Fct values (results not shown).
AdmixtureThe admixture proportions in the Arbereshe sample wereestimated starting from haplogroup frequencies andconsidering as parental populations West Calabria (CALw),
62 A. BOATTINI ET AL.
Annals of Human Biology
Ann
Hum
Bio
l Dow
nloa
ded
from
info
rmah
ealth
care
.com
by
D S
Dif
fusi
oni S
cien
tific
he -
Uni
cal o
n 01
/13/
11Fo
r pe
rson
al u
se o
nly.
a Italian sample from the same geographic domain, andAlbania (ALB), Greece (GRE) and Macedonia (MAC) asrepresentatives of the Southern Balkans. Despite highstandard deviation (SD) values, interpretation of admixturecoefficients (Table II) seems quite straightforward: in all casesthe ARB sample shows a complete Southern Balkan heritage.
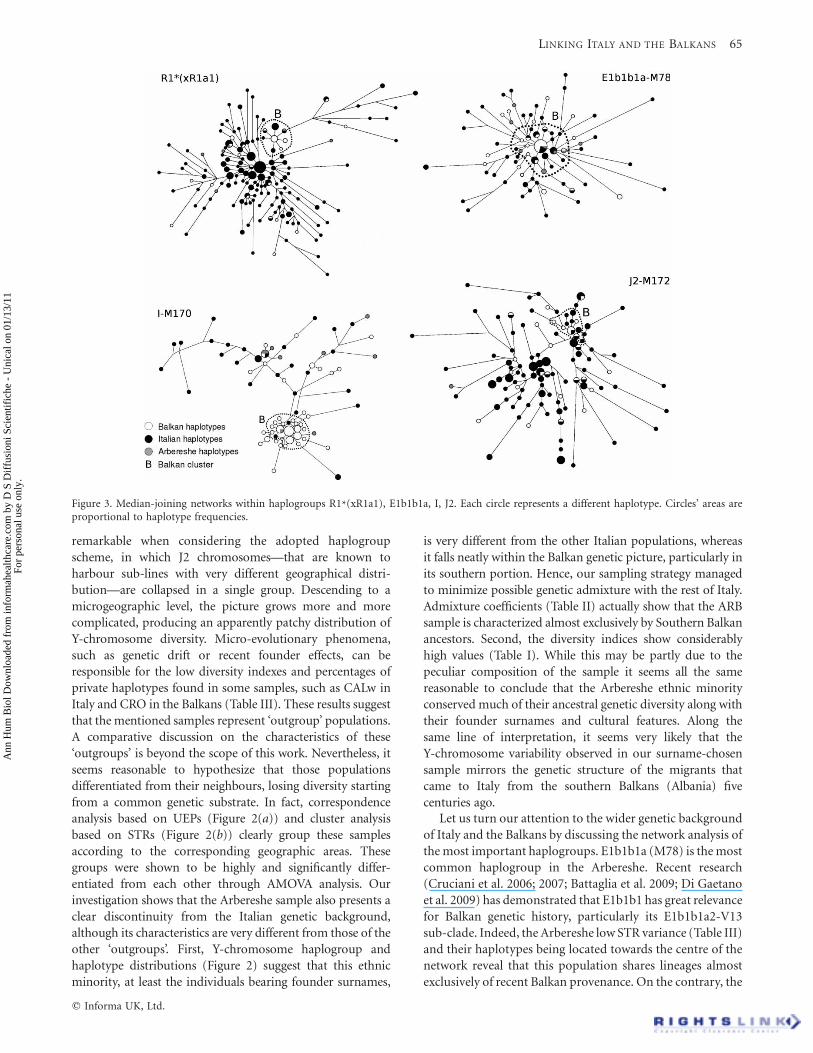
Networks and varianceRelationships between haplotypes and haplogroups in theinvestigated populations were explored by calculatingvariance values (Table III) and drawing networks for themost common haplogroups (Figure 3). The E1b1b1anetwork features a star-like structure centred round atypically Balkan haplotype (13-16-18-13-30-24-10-11-13;locus order: DYS19, DYS385a, DYS385b, DYS389I,DYS389II, DYS390, DYS391, DYS392, DYS393), leading tothe hypothesis of Balkan ancestors for most of the consideredE1b1b1a-M78 chromosomes. However, the very highvariance values (Table III) in southern Italy (but not in theArbereshe) are strongly suggestive of multiple founder effectsin this region. At least two main clusters are clearlydistinguishable in the J2-M172 network (Figure 3), verylikely due to different subclades or unresolved paragroups.Interestingly, one of these clusters (B) is more represented inthe Balkans, while the other groups are found almostexclusively in Italy. Accordingly, high variance values(Table III), suggesting multiple founder events, are observedin both regions. J2 chromosomes were found only once in theArbereshe sample.
The I-M170 network is characterized by a tight cluster towhich are connected two main branches grouping moredifferentiated haplotypes. The cluster includes almostexclusively Balkan haplotypes, while the peripheral branchescontain nearly all the Italian haplotypes. Surprisingly, sevenof the nine I-M170 Arbereshe chromosomes are located inthe branches. As a consequence, variance values (Table III)are higher in the Italian and Arbereshe samples than in theBalkan ones. The R1a1-M17 network (figure not shown),where the considered chromosomes are included in a singlecluster, and the low variance values (Table III) suggest stronggeographic and phyletic homogeneity in the haplogroup. Thenetwork of the R1*(xR1a1) haplogroup shows a clear star-like phylogeny centred round an exclusively Italian modalhaplotype. However, traces of geographic and phyletic sub-structure are evident in a cluster encompassing mainlyBalkan haplotypes. The G-M201 network (figure not shown)does not show evidence of haplogroup structure, and thevariance values (Table III) are generally low. The modalhaplotype is observed in Italy only.
DISCUSSION
The present study helps to clarify the genetic relationshipsbetween the Balkans and Italy, using the Arbereshe ofCalabria as a key of interpretation.
A surname-based sampling strategy was adopted in orderto get as near as possible to the Y-chromosomal diversity ofthe Arbereshe founding population. Nevertheless, thisprocedure may have important drawbacks. First of all,despite the precautions used in choosing the individuals, wecannot exclude by default relevant introgression of non-Arbereshe lineages in our sample. To ascertain this, wegenotyped 10 further individuals from the same group ofvillages for the same set of STRs, each of them doubling oneof the sampled surnames, and compared the respectivehaplotypes (Supplemental Table C; online version only).The experiment produced the following results: fourcouples share identical haplotypes; three couples show
Figure 2. (a) Bidimensional plot of the correspondence analysis from Y-chromosome haplogroups. Sample codes (Tables I and III) in higher size font.Haplogroup names in lower size font. Ellipses highlight Italy and Balkans (plus Arbereshe) clusters (AMOVA: Fct ¼ 0.1298, p , 0.001). (b) Clusteranalysis from STRs. Balkan (plus Arbereshe) and Italian samples group in different branches (AMOVA: Fct ¼ 0.0579, p , 0.001).
Table II. Estimated contributions and standard deviations (SD) of twoparental populations to the Arbereshe sample.
ALB GRE MAC CALw
mY1/mY2 115.33% – – 215.33%SD 48.14% – – 48.14%mY1/mY2 – 121.02% – 221.02%SD – 32.05% – 32.05%mY1/mY2 – – 108.31% 28.31%SD – – 24.77% 24.77%
LINKING ITALY AND THE BALKANS 63
q Informa UK, Ltd.
Ann
Hum
Bio
l Dow
nloa
ded
from
info
rmah
ealth
care
.com
by
D S
Dif
fusi
oni S
cien
tific
he -
Uni
cal o
n 01
/13/
11Fo
r pe
rson
al u
se o
nly.
one-step neighbour haplotypes; one couple show two-step (at different loci) neighbour haplotypes; and twocouples show very different haplotypes. One of these last twocases is related to a very rare surname, thus it is easilyexplainable as a case of non-paternity. Summing up, onlyone out of 10 surnames could be suspected of introgression,thus, we are reasonably confident that the sampling strategydoes not favour the inclusion of non-Arbereshe Y-chromosomes.
As a second point, our sample is too small to be used tovalidate the strong differentiation among villages thatemerged from previous biodemographic analyses (Fioriniet al. 2007); nevertheless, the overall high diversity values ofthe Arbereshe are perfectly in line with the high inter-villagediversity, and may be considered as an indirect proof ofinternal population sub-division. Finally, some caution hasto be observed when comparing our data with samples fromliterature, given that these were collected by differentcriteria. While this could in principle introduce some biasinto the results, we observe that comparing data fromdifferently designed studies is a widespread and very often
necessary procedure in human genetics research (Chaix et al.2007, and Poloni et al. 2009, are only two from a vastgroup of examples), and does not seem to affect significantlythe phyletic relationships between populations.
From a regional point of view, our results are in agreementwith the ‘European genetic continuum’ identified for manymarkers: the most evident cases are the E1b1b1 north-to-south cline and the decreasing gradient of R1*(xR1a1) fromnorth-west to south-east. Nevertheless, the Adriatic Sea could,to a certain extent, be a genetic barrier between the twoinvestigated regions. Indeed, Italian and Balkan populationsare clearly distinguishable on the basis of the frequencies oftheir haplogroups (Figure 2): the most commonhaplogroup in Italy as a whole and in each Italian sample(except for West Calabria) is R1*(xR1a1) (36%), followed byJ2 (23%), G (11%) and E1b1b1a (11%); the most commonhaplogroup in the Balkans as a whole and in each Balkansample (except for Albania) is I (43%), followed by E1b1b1a(15%), R1a1 (13%) and J2 (10%). Italy and Balkans wereshown to be highly and significantly differentiated from eachother through AMOVA analysis. These results are even more
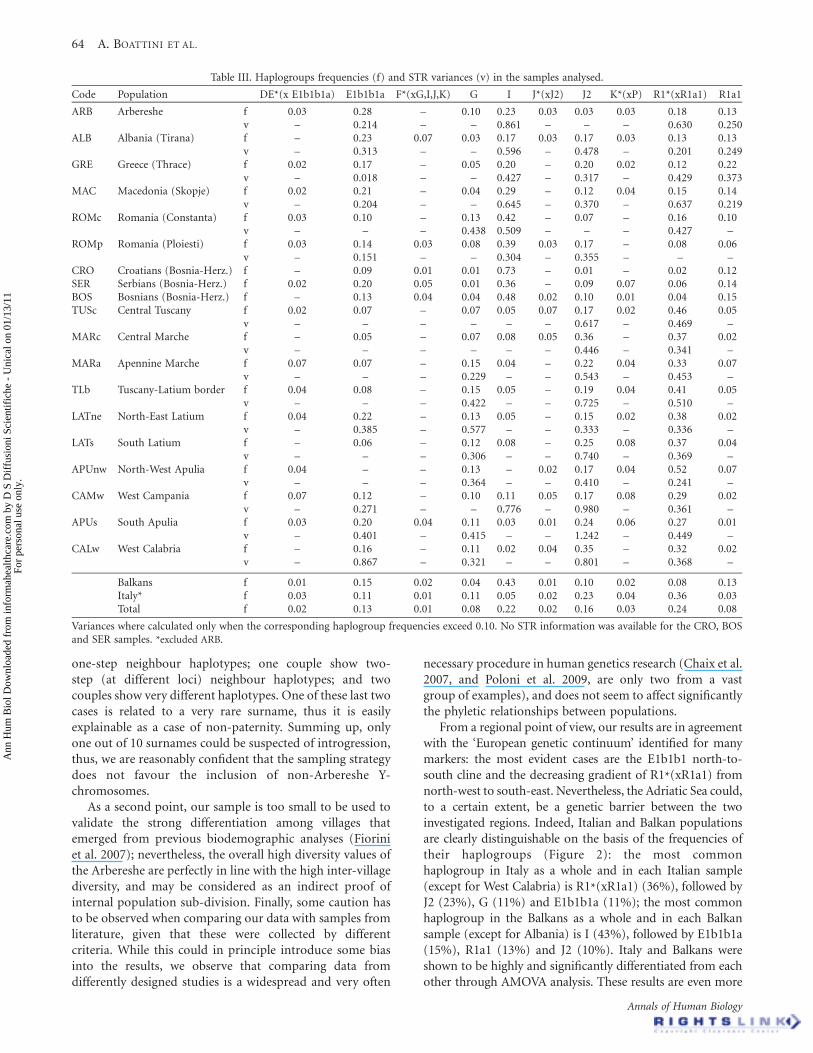
Table III. Haplogroups frequencies (f) and STR variances (v) in the samples analysed.
Code Population DE*(x E1b1b1a) E1b1b1a F*(xG,I,J,K) G I J*(xJ2) J2 K*(xP) R1*(xR1a1) R1a1
ARB Arbereshe f 0.03 0.28 – 0.10 0.23 0.03 0.03 0.03 0.18 0.13v – 0.214 – – 0.861 – – – 0.630 0.250
ALB Albania (Tirana) f – 0.23 0.07 0.03 0.17 0.03 0.17 0.03 0.13 0.13v – 0.313 – – 0.596 – 0.478 – 0.201 0.249
GRE Greece (Thrace) f 0.02 0.17 – 0.05 0.20 – 0.20 0.02 0.12 0.22v – 0.018 – – 0.427 – 0.317 – 0.429 0.373
MAC Macedonia (Skopje) f 0.02 0.21 – 0.04 0.29 – 0.12 0.04 0.15 0.14v – 0.204 – – 0.645 – 0.370 – 0.637 0.219
ROMc Romania (Constanta) f 0.03 0.10 – 0.13 0.42 – 0.07 – 0.16 0.10v – – – 0.438 0.509 – – – 0.427 –
ROMp Romania (Ploiesti) f 0.03 0.14 0.03 0.08 0.39 0.03 0.17 – 0.08 0.06v – 0.151 – – 0.304 – 0.355 – – –
CRO Croatians (Bosnia-Herz.) f – 0.09 0.01 0.01 0.73 – 0.01 – 0.02 0.12SER Serbians (Bosnia-Herz.) f 0.02 0.20 0.05 0.01 0.36 – 0.09 0.07 0.06 0.14BOS Bosnians (Bosnia-Herz.) f – 0.13 0.04 0.04 0.48 0.02 0.10 0.01 0.04 0.15TUSc Central Tuscany f 0.02 0.07 – 0.07 0.05 0.07 0.17 0.02 0.46 0.05
v – – – – – – 0.617 – 0.469 –MARc Central Marche f – 0.05 – 0.07 0.08 0.05 0.36 – 0.37 0.02
v – – – – – – 0.446 – 0.341 –MARa Apennine Marche f 0.07 0.07 – 0.15 0.04 – 0.22 0.04 0.33 0.07
v – – – 0.229 – – 0.543 – 0.453 –TLb Tuscany-Latium border f 0.04 0.08 – 0.15 0.05 – 0.19 0.04 0.41 0.05
v – – – 0.422 – – 0.725 – 0.510 –LATne North-East Latium f 0.04 0.22 – 0.13 0.05 – 0.15 0.02 0.38 0.02
v – 0.385 – 0.577 – – 0.333 – 0.336 –LATs South Latium f – 0.06 – 0.12 0.08 – 0.25 0.08 0.37 0.04
v – – – 0.306 – – 0.740 – 0.369 –APUnw North-West Apulia f 0.04 – – 0.13 – 0.02 0.17 0.04 0.52 0.07
v – – – 0.364 – – 0.410 – 0.241 –CAMw West Campania f 0.07 0.12 – 0.10 0.11 0.05 0.17 0.08 0.29 0.02
v – 0.271 – – 0.776 – 0.980 – 0.361 –APUs South Apulia f 0.03 0.20 0.04 0.11 0.03 0.01 0.24 0.06 0.27 0.01
v – 0.401 – 0.415 – – 1.242 – 0.449 –CALw West Calabria f – 0.16 – 0.11 0.02 0.04 0.35 – 0.32 0.02
v – 0.867 – 0.321 – – 0.801 – 0.368 –
Balkans f 0.01 0.15 0.02 0.04 0.43 0.01 0.10 0.02 0.08 0.13Italy* f 0.03 0.11 0.01 0.11 0.05 0.02 0.23 0.04 0.36 0.03Total f 0.02 0.13 0.01 0.08 0.22 0.02 0.16 0.03 0.24 0.08
Variances where calculated only when the corresponding haplogroup frequencies exceed 0.10. No STR information was available for the CRO, BOSand SER samples. *excluded ARB.
64 A. BOATTINI ET AL.
Annals of Human Biology
Ann
Hum
Bio
l Dow
nloa
ded
from
info
rmah
ealth
care
.com
by
D S
Dif
fusi
oni S
cien
tific
he -
Uni
cal o
n 01
/13/
11Fo
r pe
rson
al u
se o
nly.
remarkable when considering the adopted haplogroupscheme, in which J2 chromosomes—that are known toharbour sub-lines with very different geographical distri-bution—are collapsed in a single group. Descending to amicrogeographic level, the picture grows more and morecomplicated, producing an apparently patchy distribution ofY-chromosome diversity. Micro-evolutionary phenomena,such as genetic drift or recent founder effects, can beresponsible for the low diversity indexes and percentages ofprivate haplotypes found in some samples, such as CALw inItaly and CRO in the Balkans (Table III). These results suggestthat the mentioned samples represent ‘outgroup’ populations.A comparative discussion on the characteristics of these‘outgroups’ is beyond the scope of this work. Nevertheless, itseems reasonable to hypothesize that those populationsdifferentiated from their neighbours, losing diversity startingfrom a common genetic substrate. In fact, correspondenceanalysis based on UEPs (Figure 2(a)) and cluster analysisbased on STRs (Figure 2(b)) clearly group these samplesaccording to the corresponding geographic areas. Thesegroups were shown to be highly and significantly differ-entiated from each other through AMOVA analysis. Ourinvestigation shows that the Arbereshe sample also presents aclear discontinuity from the Italian genetic background,although its characteristics are very different from those of theother ‘outgroups’. First, Y-chromosome haplogroup andhaplotype distributions (Figure 2) suggest that this ethnicminority, at least the individuals bearing founder surnames,
is very different from the other Italian populations, whereasit falls neatly within the Balkan genetic picture, particularly inits southern portion. Hence, our sampling strategy managedto minimize possible genetic admixture with the rest of Italy.Admixture coefficients (Table II) actually show that the ARBsample is characterized almost exclusively by Southern Balkanancestors. Second, the diversity indices show considerablyhigh values (Table I). While this may be partly due to thepeculiar composition of the sample it seems all the samereasonable to conclude that the Arbereshe ethnic minorityconserved much of their ancestral genetic diversity along withtheir founder surnames and cultural features. Along thesame line of interpretation, it seems very likely that theY-chromosome variability observed in our surname-chosensample mirrors the genetic structure of the migrants thatcame to Italy from the southern Balkans (Albania) fivecenturies ago.
Let us turn our attention to the wider genetic backgroundof Italy and the Balkans by discussing the network analysis ofthe most important haplogroups. E1b1b1a (M78) is the mostcommon haplogroup in the Arbereshe. Recent research(Cruciani et al. 2006; 2007; Battaglia et al. 2009; Di Gaetanoet al. 2009) has demonstrated that E1b1b1 has great relevancefor Balkan genetic history, particularly its E1b1b1a2-V13sub-clade. Indeed, the Arbereshe low STR variance (Table III)and their haplotypes being located towards the centre of thenetwork reveal that this population shares lineages almostexclusively of recent Balkan provenance. On the contrary, the
Figure 3. Median-joining networks within haplogroups R1*(xR1a1), E1b1b1a, I, J2. Each circle represents a different haplotype. Circles’ areas areproportional to haplotype frequencies.
LINKING ITALY AND THE BALKANS 65
q Informa UK, Ltd.
Ann
Hum
Bio
l Dow
nloa
ded
from
info
rmah
ealth
care
.com
by
D S
Dif
fusi
oni S
cien
tific
he -
Uni
cal o
n 01
/13/
11Fo
r pe
rson
al u
se o
nly.
high variance values reported for Southern Italy (Table III)support the ingression of other E1b1b1a sub-lineages (e.g.E1b1b1a1-V12, E1b1b1a3-V22, E1b1b1a4-V65), very likelyfrom North Africa (multiple founder events), as recentlydemonstrated for Sicily (Di Gaetano et al. 2009).
The presence of the R1*(xR1a1) haplogroup (the mostcommon in Italy) in the Arbereshe should not come as asurprise. In fact, this clade is not uncommon in the southernBalkans, and network analysis revealed a cluster in whichmany Balkan and Arbereshe chromosomes are grouped(Figure 3). The core haplotype (14-11-11-13-29-24-11-13-13; locus order as above) of this cluster is consistent with themodal haplotype of the p49a,f-Ht35 sub-clade identified byCinnioglu et al. (2004) and interpreted as an Asia Minorvariant of R1*(xR1a1). Interestingly, information from theYhrd database (www.yhrd.org) shows that the described corehaplotype has its maximum diffusion in Albania (10/101).The high frequency of the R1a1 haplogroup (Table III) isanother clear link between the Arbereshe and the Balkans,where it is very common, particularly in the north.
I-M170 is the most common Balkan haplogroup (Pericicet al. 2005a,b) and the second most frequent Arberesheclade. Nevertheless, analysis of its network revealsunexpected results: most of the Arbereshe I-M170haplotypes are not included in the Balkan cluster(Figure 3), but are located in the long branches containingmainly Italian chromosomes. Comparisons with literaturedata (Semino et al. 2000; Barac et al. 2003, Rootsi et al. 2004)show that the core haplotype of the Balkan cluster (16-14-15-13-31-24-11-11-13; locus order as above) is consistentwith the almost Balkan exclusive I2a (formerly I1b) clade.The proposed interpretation of the Arbereshe as a proxy ofthe founder Albanian population leads us to hypothesizethat the I2a clade was less common in the southern Balkans500 years ago than nowadays. The very tight shape of the I2acluster in the network suggests a very recent expansion ofthis haplogroup in the southern Balkans. Furthermore, I2a isstill rare in mountain populations such as the Albanians ofKosovo (Pericic et al. 2005a,b) and in a randomly selectedArbereshe sample from Rootsi et al. (2004).
The scarcity of J2 chromosomes in the Arbereshe sample(1/40) is very difficult to explain, given that they are verycommon in both the Italian peninsula and the southernBalkans. Literature data on J2 indicate that most of thehaplotypes included in the Balkan (B) cluster of the network(Figure 3) have an STR configuration consistent with the J2-M12 sub-clade (Di Giacomo et al. 2004; Semino et al. 2004;Cruciani et al. 2007). In contrast, most of the haplotypes inthe other clusters agree with the STR configuration given forthe J2-M67 clade, with its sub-clade J2-M92 (Di Giacomoet al. 2004). It is unconvincing to attribute the rarity of J2 inthe Arbereshe to random sampling or to the effect of geneticdrift. Furthermore, the Arbereshe sample analysed by Seminoet al. (2004) also completely lacks the typically Balkan J2-M12chromosomes. If we interpret our Arbereshe sample asrepresentative of the founding Albanian population, we mayhypothesize that the J2 haplogroup was considerably lessdiffuse in the southern Balkans five centuries ago than today.
In conclusion, the surname-sampled Arbereshe appear tobe a typical Balkan population, sharing a common ancestrywith the modern southern Balkans people. The results of thisstudy, together with the most recent biodemographicresearch (Fiorini et al. 2007; Tagarelli et al. 2007), suggestthat the individuals with Arbereshe founder surnames werenot subjected to appreciable admixture with Italians.Obviously, this does not imply that the whole Arbereshepopulation has not experienced some degree of admixture,especially during the last century: our sample was expresslydesigned to exclude recent admixture. The high diversityvalues calculated for both UEPs and STRs lead us tohypothesize that the surname-chosen Arbereshe may mirrorthe Y-chromosome genetic variability of the Albanianfounder population. In other words, the genetic structure ofthe Arbereshe becomes a source of information on the recentbiological history of the southern Balkans population. Ourresults suggest that this area has undergone markedpopulation changes in the last five centuries. In particular,these changes led to a strong increase in the frequencies ofsome haplogroups (I and J2). It seems very likely that thedriving forces behind these transformations were linked tothe same historic events that caused the Albanian wave ofmigrations to Southern Italy, that is the Turkish invasion ofthe Balkans. It is also important to point out that historicvariations of the Y-chromosome structure did not cancel theBalkan genetic background: it generally remained homo-geneous and clearly distinguishable from that of Italy.Finally, both the Balkans and Italy share some commonlineages due to co-ancestry and/or migrations that pre-datedthe time of the Arbereshe establishment in Calabria, and theycan be interpreted in the framework of the European geneticcontinuum. The next step of our research will consider adetailed biodemography-based sampling strategy, which willfocus on not only the Arbereshe people but also on theneighbouring Italian villages and the descendants of theArbereshe founder population currently living in Albania.
ACKNOWLEDGEMENTS
Thanks are due to Anna Piro and Antonio Tagarelli, whohelped us in defining the sampling procedure.
Declaration of interest: This study was supported in part bythe Italian Ministry of University PRIN 2007 grant and bythe ‘Strategic Project 2006-2009’ grant of the University ofBologna to D.P. The authors report no conflicts of interest.The authors alone are responsible for the content andwriting of the paper.
REFERENCES
Babiniotis G. 1998. Lejiko th6 N1a6 Ellhnikh6 Glvssa6. Athens:Kentro Lexikologias.
Balaresque P, Sibert A, Heyer E, Crouau-Roy B. 2007. Unbiasedinterpretation of haplotypes at duplicated microsatellites. Ann HumGen 71:209–219.
Bandelt HJ, Forster P, Rohl A. 1999. Median-joining networks forinferring intraspecific phylogenies. Mol Biol Evol 16:37–48.
66 A. BOATTINI ET AL.
Annals of Human Biology
Ann
Hum
Bio
l Dow
nloa
ded
from
info
rmah
ealth
care
.com
by
D S
Dif
fusi
oni S
cien
tific
he -
Uni
cal o
n 01
/13/
11Fo
r pe
rson
al u
se o
nly.
Barac L, Pericic M, Klaric IM, Rootsi S, Janicijevic B, Kivisild T, Parik J,Rudan I, Villems R, Rudan P. 2003. Y chromosomal heritage ofCroatian population and its island isolates. Eur J Hum Genet 11:535–542, Erratum. 2004. Eur J Hum Genet 12:83.
Battaglia V, Fornarino S, Al-Zahery N, Olivieri A, Pala M, Myres NM,King RJ, Rootsi S, Marjanovic D, Primorac D, Hadziselimovic R,Vidovic S, Drobnic K, Durmishi N, Torroni A, Santachiara-Benerecetti AS, Underhill PA, Semino O. 2009. Y-chromosomalevidence of the cultural diffusion of agriculture in Southeast Europe.Eur J Hum Genet 17:820–830.
Bosch E, Calafell F, Gonzalez-Neira A, Flaiz C, Mateu E, Scheil HG,Huckenbeck W, Efremovska L, Mikerezi I, Xirotiris N, Grasa C,Schmidt H, Comas D. 2006. Paternal and maternal lineages in theBalkans show a homogeneous landscape over linguistic barriers,except for the isolated Aromuns. Ann Hum Genet 70:459–487.
Bowden GR, Balaresque P, King TE, Hansen Z, Lee AC, Pergl-Wilson G,Hurley E, Roberts SJ, Waite P, Jesch J, Jones AL, Thomas MG,Harding SE, Jobling MA. 2008. Excavating past populationstructures by surname-based sampling: The genetic legacy of theVikings in northwest England. Mol Biol Evol 25:301–309.
Brion M, Sanchez JJ, Balogh K, Thacker C, Blanco-Verea A, Børsting C,Stradmann-Bellinghausen B, Bogus M, Syndercombe-Court D,Schneider PM, Carracedo A, Morling N. 2005. Introduction of asingle nucleodite polymorphism-based ‘Major Y-chromosomehaplogroup typing kit’ suitable for predicting the geographicalorigin of male lineages. Electrophoresis 26:4411–4420.
Capelli C, Brisighelli F, Scarnicci F, Arredi B, Caglia A, Vetrugno G,Tofanelli S, Onofri V, Tagliabracci A, Paoli G, Pascali VL. 2007.Y chromosome genetic variation in the Italian peninsula is clinaland supports an admixture model for the Mesolithic-Neolithicencounter. Mol Phylogenet Evol 44:228–239.
Cavalli-Sforza LL, Menozzi P, Piazza A. 1994. The history andgeography of human genes. Princeton: Princeton University Press.
Chaix R, Quintana-Murci L, Hegay T, Hammer MF, Mobasher Z,Austerlitz F, Heyer E. 2007. From social to genetic structures incentral Asia. Curr Biol 17:43–48.
Cinnioglu C, King R, Kivisild T, Kalfoglu E, Atasoy S, Cavalleri GL,Lillie AS, Roseman CC, Lin AA, Prince K, Oefner PJ, Shen P,Semino O, Cavalli-Sforza LL, Underhill PA. 2004. ExcavatingY-chromosome haplotype strata in Anatolia. Hum Genet 114:127–148.
Cruciani F, La Fratta R, Torroni A, Underhill PA, Scozzari R. 2006.Molecular dissection of the Y chromosome haplogroup E-M78(E3b1a): A posteriori evaluation of a microsatellite-network-basedapproach through six new biallelic markers. Hum Mutat 27:831–832.
Cruciani F, La Fratta R, Trombetta B, Santolamazza P, Sellitto D,Colomb EB, Dugoujon JM, Crivellaro F, Benincasa T, Pascone R,Moral P, Watson E, Melegh B, Barbujani G, Fuselli S, Vona G,Zagradisnik B, Assum G, Brdicka R, Kozlov AI, Efremov GD,Coppa A, Novelletto A, Scozzari R. 2007. Tracing past human malemovements in northern/eastern Africa and western Eurasia:New clues from Y-chromosomal haplogroups E-M78 and J-M12.Mol Biol Evol 24:1300–1311.
Currat M, Excoffier L. 2005. The effect of the Neolithic expansion onEuropean molecular diversity. Proc Biol Sci 272:679–688.
Di Gaetano C, Cerutti N, Crobu F, Robino C, Inturri S, Gino S,Guarrera S, Underhill PA, King RJ, Romano V, Cali F, Gasparini M,Matullo G, Salerno A, Torre C, Piazza A. 2009. Differential Greekand northern African migrations to Sicily are supported by geneticevidence from the Y chromosome. Eur J Hum Genet 17:91–99.
Di Giacomo F, Luca F, Anagnou N, Ciavarella G, Corbo RM, Cresta M,Cucci F, Di Stasi L, Agostiano V, Giparaki M, Loutradis A, Mammı C,Michalodimitrakis EN, Papola F, Pedicini G, Plata E, Terrenato L,Tofanelli S, Malaspina P, Novelletto A. 2003. Clinal patterns ofhuman Y chromosomal diversity in continental Italy and Greece aredominated by drift and founder effects. Mol Phylogenet Evol 28:387–395.
Di Giacomo F, Luca F, Popa LO, Akar N, Anagnou N, Banyko J,Brdicka R, Barbujani G, Papola F, Ciavarella G, Cucci F, Di Stasi L,Gavrila L, Kerimova MG, Kovatchev D, Kozlov AI, Loutradis A,Mandarino V, Mammi’ C, Michalodimitrakis EN, Paoli G, Pappa KI,Pedicini G, Terrenato L, Tofanelli S, Malaspina P, Novelletto A. 2004.Y chromosomal haplogroup J as a signature of the post-neolithiccolonization of Europe. Hum Genet 115:357–371.
Dray S, Dufour AB. 2007. The ade4 package: Implementing the dualitydiagram for ecologists. J Stat Software 22:1–20.
Dupanloup I, Bertorelle G. 2001. Inferring admixture proportionsfrom molecular data: Extension to any number of parentalpopulations. Mol Biol Evol 18:672–675.
Excoffier L, Smouse PE, Quattro JM. 1992. Analysis of molecularvariance inferred from metric distances among DNA haplotypes:Application to human mitochondrial DNA restriction data.Genetics 131:479–491.
Excoffier L, Laval G, Schneider S. 2005. Arlequin ver. 3.0: An integratedsoftware package for population genetics data analysis. Evol BioinfOnline 1:47–50.
Fiorini S, Tagarelli G, Boattini A, Luiselli D, Piro A, Tagarelli A,Pettener D. 2007. Ethnicity and evolution of the biodemographicstructure of Arbereshe and Italian populations of the Pollino area,Southern Italy (1820–1984). Amer Anthropol 109:735–746.
Gusmao L, Sanchez-Diz P, Alves C, Beleza S, Lopes A, Carracedo A,Amorim A. 2003. Grouping of Y-STR haplotypes discloses Europeangeographic clines. Forensic Sci Int 134:172–179.
Jobling MA. 2001. In the name of the father: Surnames and genetics.Trends Genet 17:353–357.
Karafet TM, Mendez FL, Meilerman MB, Underhill PA, Zegura SL,Hammer MF. 2008. New binary polymorphisms reshape andincrease resolution of the human Y chromosomal haplogroup tree.Genome Res 18:830–838.
King TE, Ballereau SJ, Schurer KE, Jobling MA. 2006. Geneticsignatures of coancestry within surnames. Curr Biol 16:384–388.
King TE, Jobling MA. 2009. Founders, drift and infidelity: Therelationship between Y chromosome diversity and patrilinealsurnames. Mol Biol Evol 26:1093–1102.
Klaric IM, Lauc LB, Pericic M, Janicijevic B, Terzic R, Colak I, Kvesic A,Rudan P. 2005. Evaluation of Y-STR variation in Bosnian andHerzegovinian population. Forensic Sci Int 54:252–256.
Lauc LB, Pericic M, Klaric IM, Sijacki A, Popovic D, Janicijevic B,Rudan P. 2005. Y chromosome STR polymorphisms in a Serbianpopulation sample. Forensic Sci Int 150:97–101.
Lovrecic L, Ristic S, Brajenovic B, Kapovic M, Peterlin B. 2005.Human Y-specific STR haplotypes in the Western Croatianpopulation sample. Forensic Sci Int 149:257–261.
Manni F, Toupance B, Sabbagh A, Heyer E. 2005. New method forsurname studies of ancient patrilineal population structures, andpossible application to improvement of Y-chromosome sampling.Am J Phys Anthropol 126:214–228.
Marjanovic D, Fornarino S, Montagna S, Primorac D,Hadziselimovic R, Vidovic S, Pojskic N, Battaglia V, Achilli A,Drobnic K, Andjelinovic S, Torroni A, Santachiara-Benerecetti AS,Semino O. 2005. The Peopling of Modern Bosnia-Herzegovina:Y-chromosome Haplogroups in the three main ethnic groups.Ann Hum Genet 69:757–763.
Nei M, Kumar S. 2000. Molecular Evolution and Phylogenetics.New York: Oxford University Press.
Pericic M, Lauc LB, Klaric IM, Janicijevic B, Behluli I, Rudan P. 2004.Y chromosome haplotypes in Albanian population from Kosovo.Forensic Sci Int 146:61–64.
Pericic M, Klaric IM, Lauc LB, Janicijevic B, Dordevic D, Efremovska L,Rudan P. 2005a. Population genetics of 8 Y chromosome STR loci inMacedonians and Macedonian Romani (Gypsy). Forensic Sci Int154:257–261.
Pericic M, Lauc LB, Klaric IM, Rootsi S, Janicijevic B, Rudan I, Terzic R,Colak I, Kvesic A, Popovic D, Sijacki A, Behluli I, Dordevic D,Efremovska L, Bajec DD, Stefanovic BD, Villems R, Rudan P. 2005b.High-resolution phylogenetic analysis of southeastern Europe traces
LINKING ITALY AND THE BALKANS 67
q Informa UK, Ltd.
Ann
Hum
Bio
l Dow
nloa
ded
from
info
rmah
ealth
care
.com
by
D S
Dif
fusi
oni S
cien
tific
he -
Uni
cal o
n 01
/13/
11Fo
r pe
rson
al u
se o
nly.
major episodes of paternal gene flow among Slavic populations.Mol Biol Evol 22:1964–1975.
Pettener D. 1990. Temporal trends in marital structure and isonymy inS. Paolo Albanese, Italy. Hum Biol 62:837–851.
Poloni ES, Naciri Y, Bucho R, Niba R, Kervaire B, Excoffier L,Langaney A, Sanchez-Mazas A. 2009. Genetic evidence forcomplexity in ethnic differentiation and history in East Africa.Ann Hum Genet 73:582–600.
R Development Core Team. 2008. R: A language and environment forstatistical computing. Vienna: R Foundation for StatisticalComputing. URL. Available online at: http://www.r-project.org.(Accessed February 2009).
Resta P. 1991. Parentela ed Identita Etnica: Consanguineita e ScambiMatrimoniali in Una Comunita’ Italo-Albanese. Milano: FrancoAngeli.
Robino C, Gino S, Ricci U, Grignani P, Previdere C, Torre C. 2002.Y-chromosomal STR haplotypes in an Albanian population sample.Forensic Sci Int 129:128–130.
Robino C, Varacalli S, Gino S, Chatzikyriakidou A, Kouvatsi A,Triantaphyllidis C, Di Gaetano C, Crobu F, Matullo G, Piazza A,Torre C. 2004. Y- chromosomal STR haplotypes in a populationsample from continental Greece, and the islands of Crete and Chios.Forensic Sci Int 145:61–64.
Rootsi S, Magri C, Kivisild T, Benuzzi G, Help H, Bermisheva M,Kutuev I, Barac L, Pericic M, Balanovsky O, Pshenichnov A, Dion D,Grobei M, Zhivotovsky LA, Battaglia V, Achilli A, Al-Zahery N,Parik J, King R, Cinnioglu C, Khusnutdinova E, Rudan P,Balanovska E, Scheffrahn W, Simonescu M, Brehm A,Goncalves R, Rosa A, Moisan JP, Chaventre A, Ferak V, Furedi S,Oefner PJ, Shen P, Beckman L, Mikerezi I, Terzic R, Primorac D,Cambon-Thomsen A, Krumina A, Torroni A, Underhill PA,Santachiara-Benerecetti AS, Villems R, Semino O. 2004. Phylogeo-graphy of Y-chromosome haplogroup I reveals distinct domains ofprehistoric gene flow in Europe. Am J Hum Genet 75:128–137.
Rosser ZH, Zerjal T, Hurles ME, Adojaan M, Alavantic D, Amorim A,Amos W, Armenteros M, Arroyo E, Barbujani G, Beckman G,Beckman L, Bertranpetit J, Bosch E, Bradley DG, Brede G, Cooper G,Corte-Real HB, de Knijff P, Decorte R, Dubrova YE, Evgrafov O,Gilissen A, Glisic S, Golge M, Hill EW, Jeziorowska A, Kalaydjieva L,Kayser M, Kivisild T, Kravchenko SA, Krumina A, Kucinskas V,Lavinha J, Livshits LA, Malaspina P, Maria S, McElreavey K,Meitinger TA, Mikelsaar AV, Mitchell RJ, Nafa K, Nicholson J,
Nørby S, Pandya A, Parik J, Patsalis PC, Pereira L, Peterlin B, PielbergG, Prata MJ, Previdere C, Roewer L, Rootsi S, Rubinsztein DC,Saillard J, Santos FR, Stefanescu G, Sykes BC, Tolun A, Villems R,Tyler-Smith C, Jobling MA. 2000. Y-chromosomal diversity inEurope is clinal and influenced primarily by geography, rather thanby language Am J Hum Genet 67:1526–1543.
Semino O, Passarino G, Oefner PJ, Lin AA, Arbuzova S, Beckman LE,De Benedictis G, Francalacci P, Kouvatsi A, Limborska S,Marcikiae M, Mika A, Mika B, Primorac D, Santachiara-BenerecettiAS, Cavalli-Sforza LL, Underhill PA. 2000. The genetic legacy ofPaleolithic Homo sapiens sapiens in extant Europeans: A Ychromosome perspective. Science 290:1155–1159.
Semino O, Magri C, Benuzzi G, Lin AA, Al-Zahery N, Battaglia V,Maccioni L, Triantaphyllidis C, Shen P, Oefner PJ, Zhivotovsky LA,King R, Torroni A, Cavalli-Sforza LL, Underhill PA, Santachiara-Benerecetti AS. 2004. Origin, diffusion, and differentiation ofY-chromosome haplogroups E and J: Inferences on the neolithiza-tion of Europe and later migratory events in the Mediterranean area.Am J Hum Genet 74:1023–1034.
Stefan M, Stefanescu G, Gavrila L, Terrenato L, Jobling MA,Malaspina P, Novelletto A. 2001. Y chromosome analysis reveals asharp genetic boundary in the Carpathian region. Eur J Hum Genet9:27–33.
Tagarelli G, Fiorini S, Piro A, Luiselli D, Tagarelli A, Pettener D. 2007.Ethnicity and biodemographic structure in the Arbereshe ofthe province of Cosenza, southern Italy, in the XIX century.Coll Antropol 31:331–338.
Underhill PA, Shen P, Lin AA, Jin L, Passarino G, Yang WH,Kauffman E, Bonne-Tamir B, Bertranpetit J, Francalacci P,Ibrahim M, Jenkins T, Kidd JR, Mehdi SQ, Seielstad MT, Wells RS,Piazza A, Davis RW, Feldman MW, Cavalli-Sforza LL, Oefner PJ.2000. Y chromosome sequence variation and the history of humanpopulations. Nat Genet 26:358–361.
Xiao FX, Yotova V, Zietkiewicz E, Lovell A, Gehl D, Bourgeois S,Moreau C, Spanaki C, Plaitakis A, Moisan JP, Labuda D. 2004.Human X-chromosomal lineages in Europe reveal Middle Easternand Asiatic contacts. Eur J Hum Genet 12:301–311.
Y Chromosome Consortium. 2002. A nomenclature system for the treeof human Y-chromosomal binary haplogroups. Genome Res 12:339–348.
Zangari D. 1941. Le colonie italo-albanesi di Calabria. Naples: EditoreCasella.
68 A. BOATTINI ET AL.
Annals of Human Biology
Ann
Hum
Bio
l Dow
nloa
ded
from
info
rmah
ealth
care
.com
by
D S
Dif
fusi
oni S
cien
tific
he -
Uni
cal o
n 01
/13/
11Fo
r pe
rson
al u
se o
nly.