Linear and Nonlinear Optical Properties of - Deep Blue ...
336
From Small Molecules to Polymers: Linear and Nonlinear Optical Properties of Organic Conjugated Systems for Solar Applications by Bradley Austin Keller A dissertation submitted in partial fulfillment of the requirements for the degree of Doctor of Philosophy (Macromolecular Science and Engineering) in the University of Michigan 2018 Doctoral Committee: Professor Theodore G. Goodson III, Chair Professor Jinsang Kim Associate Professor Dominika Zgid Assistant Professor Paul M. Zimmerman
-
Upload
khangminh22 -
Category
Documents
-
view
1 -
download
0
Transcript of Linear and Nonlinear Optical Properties of - Deep Blue ...

From Small Molecules to Polymers: Linear and Nonlinear Optical Properties of
Organic Conjugated Systems for Solar Applications
by
Bradley Austin Keller
A dissertation submitted in partial fulfillment
of the requirements for the degree of
Doctor of Philosophy
(Macromolecular Science and Engineering)
in the University of Michigan
2018
Doctoral Committee:
Professor Theodore G. Goodson III, Chair
Professor Jinsang Kim
Associate Professor Dominika Zgid
Assistant Professor Paul M. Zimmerman

ii
DEDICATION
This dissertation is dedicated to all of those that have helped me along the way.

iii
TABLE OF CONTENTS DEDICATION ........................................................................................................................... ii
LIST OF FIGURES .................................................................................................................. vi
LIST OF TABLES ................................................................................................................... xv
LIST OF APPENDICES ........................................................................................................ xvii
ABSTRACT ..........................................................................................................................xviii
Chapter 1 Introduction and Background ........................................................................ 1
1.1 Energy Sources of the World Background .................................................. 1
1.2 Solar Energy Harvesting Principles ............................................................ 7
1.3 Silcon Solar Cells ...................................................................................... 13
1.4 Non-Silicon Inorganic Solar Cells ............................................................. 17
1.5 Organic Solar Cell Properties .................................................................... 18
1.6 Organic Solar Cells Advantages and Disadvantages ................................. 21
1.7 Organic Solar Cell Architecture................................................................. 24
1.8 Different Types of Organic Light Harvesting Materials for Solar Cells .. 25
1.8.1 Organic Dye Solar Cells ............................................................. 25
1.8.2 Macromolecules: Homopolymers ............................................... 26
1.8.3 Conjugated Donor-Acceptor Polymers ....................................... 29
1.8.4 Donor Subunits in Donor-Acceptor Polymers ............................ 32
1.8.5 Acceptor Subunits in Donor-Acceptor Polymers ....................... 34
1.8.6 Acceptor Materials for Organic Solar Cells ............................... 35
1.9 Dissertation Outline .................................................................................. 37
Chapter 2 Experimental Theory and Techniques ......................................................... 54
2.1 Overview .................................................................................................... 54
2.2 Steady-State Spectroscopy ......................................................................... 54
2.3 Time-resolved fluorescence upconversion ................................................ 59
2.4 Two-photon Absorption Spectroscopy ...................................................... 62
2.5 Transient absorption spectroscopy ............................................................. 65
2.6 Computational methods ............................................................................ 69

iv
Chapter 3 Ultrafast Spectroscopic Study of Donor-Acceptor Benzodithiophene Light
Harvesting Organic Conjugated Polymers ............................................................................... 74
3.1 Abstract ...................................................................................................... 74
3.2 Introduction ................................................................................................ 75
3.3 Experimental .............................................................................................. 78
3.3.1 Steady State UV-Vis and Emission Measurements ................... 78
3.3.2 Fluorescence Lifetime Measurements ........................................ 78
3.3.3 Two-Photon Absorption Measurements ..................................... 79
3.4 Results ........................................................................................................ 80
3.4.1 Synthesis ..................................................................................... 80
3.5 Molecular Weight Determination .............................................................. 82
3.6 Linear Absoprtion ...................................................................................... 83
3.7 Fluorescence Spectra ................................................................................. 85
3.8 Two-Photon Absorption Measurements .................................................... 87
3.9 Fluorescence Upconversion Dynamics ...................................................... 88
3.10 Discussion ................................................................................................ 93
3.11 Conclusions .............................................................................................. 96
Chapter 4 The Role of Donor Conjugation Length on the Optical Properties of Donor-
Acceptor Light Harvesting Conjugated Polymers: An Investigation of Thiophene Additions
to s-Indacene Donors with Diketopyrrolopyrrole, Isoindigo, and Thienothiophene Acceptors
................................................................................................................................................ 101
4.1 Abstract .................................................................................................... 101
4.2 Introduction .............................................................................................. 102
4.3 Experimental ............................................................................................ 108
4.3.1 Steady State UV-Vis and Emission Measurements ............... 108
4.3.2 Two-Photon Absorption (TPA) Experiments ....................... 109
4.3.3 Fluorescence Upconversion Experiments ............................. 110
4.3.4 Transient Absorption Experiments ....................................... 110
4.4 Molecular Structures and Molecular Properties ...................................... 111
4.5 Steady State .............................................................................................. 113
4.5.1 Absorption................................................................................. 113
4.5.2 Fluorescence ............................................................................. 116
4.6 Quantum-Mechanical Calculations .......................................................... 120
4.6.1 Basis Set and Level of Theory .................................................. 120
4.6.2 Computation .............................................................................. 121
4.6.3 Molecular Orbital Energies of Monomers ................................ 121
4.7 Polymerization Effects on Molecular Orbital and Electronic Structure
Calculations ............................................................................................................... 124
4.7.1 Polymerization Effect on Bandgap ........................................... 124

v
4.7.2 Polymerization Effects on Electronic Structure Calculations .. 125
4.7.3 Polymer Electronic Structure Absorption Calculations ............ 126
4.8 Two-photon absorption ............................................................................ 138
4.9 Time Resolved Fluorescence ................................................................... 140
4.10 Ultrafast Transient Absorption .............................................................. 143
4.11 Nanosecond Transient Absorption ......................................................... 151
4.12 Conclusion ............................................................................................. 154
Chapter 5 Nanosecond Two-Photon Excitation Fluorescence Design of Experiment
and Preliminary Data ............................................................................................................. 163
5.1 Introduction .............................................................................................. 163
5.2 Experimental ............................................................................................ 163
5.3 Preliminary Data ...................................................................................... 183
5.4 Conclusion ............................................................................................... 187
Chapter 6 Nanosecond Transient Absorption Experiment and Preliminary Data ..... 188
6.1 Introduction .............................................................................................. 188
6.2 Experimental ............................................................................................ 188
6.3 Preliminary Data ...................................................................................... 200
6.4 Conclusion ............................................................................................... 202
Chapter 7 Overall Summary and Future Direction .................................................... 203
7.1 Overall Summary ..................................................................................... 203
7.2 Future Directions ..................................................................................... 206
Appendices ................................................................................................................. 209

vi
LIST OF FIGURES Figure 1.1.1 World energy consumption by energy source ...................................................... 2
Figure 1.1.2 Energy Consumption 1991-2016 ........................................................................... 2
Figure 1.1.3. Normalized Spectral at AM 1.5 ............................................................................ 5
Figure 1.1.4. Major advances of Photovoltaics ........................................................................ 6
Figure 1.2.1. Solar harvesting schematic: 1 absorption, 2 exciton formation and diffusion, 3
charge dissociation, 4 charge carrier diffusion, and 5 charge collection. .................................. 8
Figure 1.2.2. Solar cell diagram ................................................................................................. 9
Figure 1.2.3. Fill Factor ........................................................................................................... 12
Figure 1.2.4. Solar Cell Efficiency ......................................................................................... 13
Figure 1.3.1. Electronic energy level diagram of metals, semiconductors, and insulators ...... 14
Figure 1.3.2. Silicon Solar Cell ............................................................................................... 16
Figure 1.4.1 CdTe Typical Solar Cell ..................................................................................... 17
Figure 1.5.1. Electronic state diagram of organic solar cell .................................................. 20
Figure 1.5.2. Electronic state diagram of photon absorption of electron from HOMO to
LUMO in Organic System ....................................................................................................... 21
Figure 1.7.1. Organic solar cell architecture ............................................................................ 25
Figure 1.8.1.1. Typical dye sensitized solar cell .................................................................... 26
Figure 1.8.2.1. Energy level modulation via increasing polymerization ............................... 28
Figure 1.8.3.1. Energy level modulation in donor-acceptor polymer .................................... 30
Figure 2.2.1. Agilent 8453 UV-Vis spectrophotometer schematic ........................................ 57

vii
Figure 2.2.2. Fluoromax-2 schematic ..................................................................................... 59
Figure 2.3.1. Fluorescence upconversion setup ....................................................................... 61
Figure 2.4.1. Ultrafast TPEF Setup ........................................................................................ 65
Figure 2.5.1. Pump-probe concept used in transient absorption spectroscopy. A is excited
state absorption, B is a bleach state, and C is stimulated emission. ........................................ 66
Figure 2.5.2. Ultrafast transient absorption setup. .................................................................. 69
Figure 3.4.1. Investigated polymers. For PTB7, R1=2-ethylhexyl. For the other polymers,
R1=2-ethylhexyl, and R2=4-octylphenyl. ................................................................................. 80
Figure 3.6.1. Absorption spectra of PBTCT, PBT8PT, PBTT17T, PBTFDO, and PTB7. The
absorption spectra are normalized ........................................................................................... 85
Figure 3.7.1. Emission(PBTCT, PBT8PT, PBTT17T: Excitation wavelength: 400nm.
PBTFDO: Excitation wavelength: 450nm. PTB7: Excitation wavelength: 517 nm). Emission
intensities are normalized. ....................................................................................................... 87
Figure 3.9.1. Fluorescence Upconversion of PBTCT(top left) at 400nm excitation and
600nm emission., PBT8PT(top right) at 400nm excitation and 650nm emission.,
PBTT17T(bottom left) at 400nm excitation and 650nm emission., and PBTFDO(bottom
right) at 400nm excitation and 700nm emission. ..................................................................... 90
Figure 3.9.2. Fluorescence Upconversion of PTB7 at 400nm excitation and 700nm emission.
.................................................................................................................................................. 91
Figure 3.9.3. Anisotropic measurements. PBTCT (top left). PBT8PT (top right). PBTT17T
(bottom left). PBTFDO (bottom right) ................................................................................... 93
Figure 4.4.1. Polymer Structures (blue portion is the donor and red portion is the acceptor).
................................................................................................................................................ 113
Figure 4.5.1.1. Normalized steady state absorption of more conjugated donor polymer series
P1-P3(left) and less conjugated polymer series P4-P6(right). ............................................... 116
Figure 4.5.2.1. Normalized steady state fluorescence of P1-P3(Left) and P4-P6(Right) at 430
nm excitation for donor excitation (solid line) and >600 nm excitation for acceptor
excitation(dashed line). .......................................................................................................... 119
Figure 4.6.3.1. Molecular orbital energy diagram of monomers of polymers P1-P6 using
B3LYP functional. ................................................................................................................. 122
Figure 4.6.3.2. Molecular orbital energy diagram of monomers of polymers P1-P6 using
wB97x-D functional............................................................................................................... 123

viii
Figure 4.7.1.1. Bandgap of monomer, dimer, trimer, and tetramer of P1-P6 using wB97x-D
functional. .............................................................................................................................. 124
Figure 4.7.2.1. Electronic geometries for donor-acceptor monomers. ................................. 126
Figure 4.7.3.1. The electronic structure calculations for the trimers for P1-P6. .................... 128
Figure 4.7.3.2. Electronic structure for the ground state (left) and excited state (right) that
contribute to the low energy S0 to S1 transition for P1 (a.) and P4 (b.). The red arrows
represent the qualitative magnitudes of the electron density change. .................................... 130
Figure 4.7.3.3. Electronic structure for the ground state (left) and excited state (right) that
contribute to the high energy transition for P1 (a.) and P4 (b.). The red arrows represent the
qualitative magnitudes of the electron density change. ......................................................... 132
Figure 4.7.3.4. Electronic structure for the ground state (left) and excited state (right) that
contribute to the low energy S0 to S1 transition for P2 (a.) and P5 (b.). The red arrows
represent the qualitative magnitudes of the electron density change. .................................... 133
Figure 4.7.3.5. Electronic structure for the ground state (left) and excited state (right) that
contribute to the high energy S0 to S22 transition for P2 (a.) and P5 (b.). The red arrows
represent the qualitative magnitudes of the electron density change. .................................... 135
Figure 4.7.3.6. Electronic structure for the ground state (left) and excited state (right) that
contribute to the low energy S0 to S1 transition for P3 (a.) and P6 (b.). The red arrows
represent the qualitative magnitudes of the electron density change. .................................... 136
Figure 4.7.3.7. Electronic structure for the ground state (left) and excited state (right) that
contribute to the high energy S0 to S9 transition for P3 (a.) and P6 (b.). The red arrows
represent the qualitative magnitudes of the electron density change. .................................... 137
Figure 4.8.1. Logarithmic plot of the quadratic dependence(counts per second vs power) for
standards styryl 9m, zn-tetra-tert-butyl-pc, and the investigated polymers. 1300 nm
excitation was used for P1, P2, P4, P5, and styryl 9m. 1250 nm excitation was used for P3
and P6(not shown), and zn-tetra-tert-butyl-pc. All have a slope ~2 and R2>0.99. ............... 140
Figure 4.9.1. Fluorescence upconversion of P1 (top left),P4 (top right), P3 (bottom left), and
P6 (bottom right) at 400 nm excitation and 680 nm emission. .............................................. 143
Figure 4.10.1. Transient absorption spectra and kinetic fits of P1 (a.) and P4 (b.). ............ 145
Figure 4.10.2. Energy level diagrams of transient absorption processes for P1 (left) and P4
(right). ................................................................................................................................... 146
Figure 4.10.3. Transient absorption spectra and kinetic fits of P2 (a.) and P5 (b.). ............. 147
Figure 4.10.4. Energy level diagrams of transient absorption processes for P2 (left) and P5
(right). ................................................................................................................................... 148

ix
Figure 4.10.5. Transient absorption spectra and kinetic fits of P3 (a.) and P6 (b.). ............. 150
Figure 4.10.6. Energy level diagrams of transient absorption processes for P3 (left) and P6
(right). ................................................................................................................................... 151
Figure 4.11.1. Ultrafast transient absorption spectra (top) for P1 (left) and P4 (right).
Nanosecond transient absorption spectra (bottom) for P1 (left) and P4 (right). .................... 152
Figure 4.11.2. Ultrafast transient absorption spectra (top) for P2 (left) and P5 (right).
Nanosecond transient absorption spectra (bottom) for P2 (left) and P5 (right).. ................... 153
Figure 4.11.3. Ultrafast transient absorption spectra (top) for P3 (left) and P6 (right).
Nanosecond transient absorption spectra (bottom) for P3 (left) and P6 (right). .................... 154
Figure 5.2.1. Quanta-Ray Laser System ............................................................................... 167
Figure 5.2.2. Schematic setup of OPO VersaScan ............................................................... 170
Figure 5.2.3. Desktop location for ScanMaster SHG ........................................................... 171
Figure 5.2.4. Location of the calibration wizard ................................................................... 172
Figure 5.2.5. Base calibration selection ................................................................................ 172
Figure 5.2.6. Crystal configuration selection window .......................................................... 173
Figure 5.2.7. Calibration wizard window ............................................................................. 174
Figure 5.2.8. Nanosecond TPA Setup ................................................................................... 177
Figure 5.2.9. SRS 250 gated integrator ................................................................................. 178
Figure 5.2.10. Block diagram of initialization of custom data collection program .............. 179
Figure 5.2.11. Block diagram data collection for first for loop ............................................ 180
Figure 5.2.12. Block diagram for sequence that creates a user interface for scan breaks ... 180
Figure 5.2.13. Block diagram for sequence that plots and saves the data to a file ............... 181
Figure 5.2.14. User interface for the TPEF collection program. .......................................... 181
Figure 5.2.15. User parameters inputted before turning on SRS 250 ................................... 182
Figure 5.3. Two-photon absorption results from 750 nm to 1100 nm for Rhodamine B ..... 186
Figure 5.3.2. Two-photon absorption results from 850 nm for Acridine Orange ................. 186
Figure 6.1. Nanosecond transient absorption setup ............................................................. 189

x
Figure 6.2. LP980 setup ....................................................................................................... 190
Figure 6.3. Kinetic Absorption Setup window. .................................................................... 191
Figure 6.4. Oscilloscope tab ................................................................................................. 192
Figure 6.5. Measurement tab ................................................................................................ 193
Figure 6.6. Background tab ................................................................................................... 193
Figure 6.7. Wavelength selection window ............................................................................ 195
Figure 6.8. Data slicing window ........................................................................................... 195
Figure 6.9. Kinetic absorption setup for RuBPY .................................................................. 196
Figure 6.10. Laser mode window .......................................................................................... 197
Figure 6.11. Prism compartment for adjusting laser alignment to the sample ..................... 198
Figure 6.12. Sample compartment with iris .......................................................................... 198
Figure 6.13. Lamp housing chamber .................................................................................... 198
Figure 6.14. Configuration for Lamp alignment .................................................................... 199
Figure 6.15. Mirror screws for adjustments .......................................................................... 200
Figure 6.16. Nanosecond transient absorption of Ru(BPY)3 .... 224 Figure 6.6. Background tab
................................................................................................................................................ 201
Figure A.3.1. Jablonski diagram for the states of intramolecular singlet fission, 1ET, and 2ET
with chemical structures of QOT2/AQ ................................................................................. 211
Figure A.3.2. Optimized structure of QOT2/AQ before ET (top panel; QOT2 TT/AQ), after
1ET (middle panel; QOT2+ TD/AQ-), and after 2ET (bottom panel; QOT22+ DD/AQ2-)
described by CDFT. Color scheme: hydrogen atom, white; carbon atom, cyan; nitrogen atom,
blue; oxygen atom, red; sulfur atom, yellow ......................................................................... 212
Figure A.3.3. Absorption spectra predicted by XMS-CASPT2 and Spin-Flip RAS for (top)
QOT2 21Ag state, and (middle and bottom) its oxidized forms, QOT2+ 12Bg and QOT22+
11Bu states ............................................................................................................................ 214
Figure A.3.4. Transmission profile of pure acetonitrile (Blank, black line), QOT2 (yellow
square), and QOT2/AQ (blue circle) for the probe light of 880 nm as the function of the
pump power at 440 nm ......................................................................................................... 215

xi
Figure A.3.5. Transient absorption spectrum of QOT2/AQ at selected decaying time as the
function of probe wavelength. The characteristic bands of QOT2 (GSB and ESA I) are
marked with yellow arrows, and newly arising features (ESA II, III, and IV) are indicated
with blue arrows ..................................................................................................................... 216
Figure AS1: (A) QOT2 chromophore. (B) Model of QOT2 with the β,β’ substituents
removed ................................................................................................................................. 220
Figure AS2: UV-Vis absorption of QOT2, AQ, and QOT2/AQ in AN. ............................... 224
Figure AS3: Fluorescence emission of QOT2, AQ, and QOT2/AQ in AN. The spectrum of
AQ is enlarged in the inset .................................................................................................... 225
Figure AS4: Relative energy levels of QOT2, AQ, and their relavant ET products ............. 225
Figure AS5: Position of localized positive (negative) charge on the isolated QOT2 (AQ)
molecule ................................................................................................................................ 226
Figure AS6: Position of localized charges on the ground state QOT2/AQ complex ........... 227
Figure AS7: CDFT Becke population analysis of QOT2/AQ after 2ET ............................... 228
Figure AS8: Distortion of carbonyl group from planarity in AQ as the result of maximizing
Coulomb interaction............................................................................................................... 228
Figure AS9: Time-resolved fluorescence anisotropy measurement of QOT2 and QOT2/AQ
................................................................................................................................................ 229
Figure AS10: Transient absorption spectrum of QOT2 at selected decaying time as the
function of probe wavelength. The characteristic bands of QOT2 (GSB and ESA I) are
marked with yellow arrows .................................................................................................... 230
Figure AS11: Yield of two-electron transfer and charge carrier extraction as the function of
yield of one-electron transfer ................................................................................................ 236
Figure B.4.1. Normalized absorption and emission spectra of C1 in solvents of different
polarity .................................................................................................................................. 250
Figure B.4.2. Normalized absorption and emission spectra of C2 in solvents of different
polarity .................................................................................................................................. 251
Figure B.4.3. Normalized absorption and emission spectra of C1 and C2 in DCM and EtOH
................................................................................................................................................ 252
Figure B.5.1. Frontier molecular orbitals of C1 and C2 at the optimized S0 geometry (H
means here HOMO and L means LUMO) ............................................................................. 257

xii
Figure B.5.2. Frontier molecular orbitals of C1 and C2 at the optimized S1 geometry
(LSOMO is the lowest singly occupied molecular orbital; HSOMO is the highest singly
occupied molecular orbital) ................................................................................................... 258
Figure B.5.3. Difference of electron density between states for the S0 → S1 and S1 → S0
transitions of compounds C1 and C2 in DCM (in the figures the colours violet and cyan
correspond to an increase and a decrease in electron density, respectively) ......................... 259
Figure B.6.1. Pump−probe absorption of C1 in CHCl3 (λexc=400 nm): A) contour plot of the
experimental data, B) time resolved absorption spectra recorded at different delays after the
laser pulse. Insets: decay kinetics recorded at meaningful wavelengths together with the
corresponding fitting traces and C) Species Associated Spectra (SAS) of the decay
components obtained by Target Analysis .............................................................................. 265
Figure B.6.2. Pump−probe absorption of C1 in MeOH (λexc=400 nm): A) contour plot of the
experimental data, B) time resolved absorption spectra recorded at different delays after the
laser pulse. Insets: decay kinetics recorded at meaningful wavelengths together with the
corresponding fitting traces and C) Species Associated Spectra (SAS) of the decay
components obtained by Target Analysis .............................................................................. 265
Figure B.6.3. Pump−probe absorption of C2 in CHCl3 (λexc=400 nm): A) contour plot of the
experimental data, B) time resolved absorption spectra recorded at different delays after the
laser pulse. Insets: decay kinetics recorded at meaningful wavelengths together with the
corresponding fitting traces and C) Species Associated Spectra (SAS) of the decay
components obtained by Target Analysis ............................................................................. 266
Figure B.6.4. Pump−probe absorption of C2 in MeOH (λexc=400 nm): A) contour plot of the
experimental data, B) time resolved absorption spectra recorded at different delays after the
laser pulse. Insets: decay kinetics recorded at meaningful wavelengths together with the
corresponding fitting traces and C) Species Associated Spectra (SAS) of the decay
components obtained by Target Analysis ............................................................................. 266
Figure B.6.5. Fluorescence up−conversion kinetics (λexc=400 nm) of C1 and C2 in MeOH
and EtOH (dots) together with the best fittings (full lines) obtained by use of
poly−exponential functions (see Table 4) ............................................................................. 267
Figure B.7.1. Logarithmic plot of the quadratic dependence (counts vs. power) for: Styryl 9M
in EtOH (black line), C1 in DCM (blue line) and C2 in DCM (red line) .............................. 268
Figure BS1. Normalized absorption spectra of concentrated and diluted solution of C1 in
DCM and 2-PrOH ................................................................................................................. 275
Figure BS2. Normalized absorption spectra of concentrated and diluted solution of C2 in
DCM and MeOH.................................................................................................................... 276
Figure BS3. Pump−probe absorption of C1 in DCM (λexc=400 nm): A) contour plot of the
experimental data, B) time resolved absorption spectra recorded at different delays after the
laser pulse. Insets: decay kinetics recorded at meaningful wavelengths together with the
corresponding fitting traces and C) Species Associated Spectra (SAS) of the decay
components obtained by Target Analysis .............................................................................. 278

xiii
Figure BS4. Pump−probe absorption of C1 in EtOH (λexc=400 nm): A) contour plot of the
experimental data, B) time resolved absorption spectra recorded at different delays after the
laser pulse. Insets: decay kinetics recorded at meaningful wavelengths together with the
corresponding fitting traces and C) Species Associated Spectra (SAS) of the decay
components obtained by Target Analysis .............................................................................. 278
Figure BS5. Pump−probe absorption of C2 in DCM (λexc=400 nm): A) contour plot of the
experimental data, B) time resolved absorption spectra recorded at different delays after the
laser pulse. Insets: decay kinetics recorded at meaningful wavelengths together with the
corresponding fitting traces and C) Species Associated Spectra (SAS) of the decay
components obtained by Target Analysis .............................................................................. 279
Figure BS6. Pump−probe absorption of C2 in EtOH (λexc=400 nm): A) contour plot of the
experimental data, B) time resolved absorption spectra recorded at different delays after the
laser pulse. Insets: decay kinetics recorded at meaningful wavelengths together with the
corresponding fitting traces and C) Species Associated Spectra (SAS) of the decay
components obtained by Target Analysis .............................................................................. 279
Figure C.3.1. NMR spectra of fused and non-fused compounds. .......................................... 294
Figure C.3.1.2. (a) Absorption spectra of ladder molecules; (b) CV of ladder molecules in
CHCl3 .................................................................................................................................... 295
Figure C.3.2. (a) Emission spectra of ladder molecules; (b) Fluorescence decay dynamic of
ladder molecules at ~ 600 nm emission ................................................................................ 296
Figure C.3.3. (a) Two photon emission spectra of ladder molecules; (b) Power dependence of
the two-photon-excited emission of ladder molecules at ~ 720 nm ..................................... 297
Figure CS1. TGA curves (left) of all compounds: heating rate: 10 oC /min. from 70 oC to 550
oC under nitrogen atmosphere. Thermogravimetric analysis (TGA) reveals that both non-
fused ring and fused ring molecules are thermally stable up to 400 °C. DSC measurements
(right) were also performed on a DSC 2920 instrument. Samples (~5 mg) were annealed by
heating to 300 oC at 20 oC/min, cooled to 0 oC at 20 oC/min, and then analyzed while being
heated to 300 oC at 20 oC/min. No obvious melting peak was shown in the temperature
window ................................................................................................................................... 311
Figure CS2. Variable temperature 1H NMR spectra of 3r showing the split of proton a result
from hindered rotation of the asymmetry ethylhexyl groups................................................. 311
Figure CS3. COSY (up) and NOESY (down) spectra of 3r in 353 K in C2D2Cl4 ............... 312
Figure CS4. NOESY spectra of C3r (up) and C5r (down) in 353 K in C2D2Cl4 .................. 313
Figure CS5. Optimized geometry of ladder type molecules. To facilitate the calculation, the
heptylhexyl chains in PDI were replaced with a methyl group, while the ethylhexyl groups in
heteroacenes were replaced by isobutyl to avoid missing the steric hindrance effect ........... 189
Figure CS6. HOMO and LUMO molecular orbital distribution and the energy levels of ladder
type molecules. Isovalue was 0.02 for printing both HOMO and LUMO orbitals ............... 314

xiv
Figure CS7. CV of ladder type molecules in CHCl3 ............................................................. 314
Figure CS8. (a) Absorption spectra of thienoacenes and PDI unit; (b) Fluorescence spectra of
thienoacenes and PDI unit; (c) Absorption spectra of non-fused ring compounds; (d)
Molecular structures of thienoacenes and PDI unit ............................................................... 314
Figure CS9. Energy rising component of the C3r at 600 emission wavelength .................... 315
Figure CS10. Power dependence of the two-photon-excited emission of all molecules at ~
440-460 nm ............................................................................................................................ 315

xv
LIST OF TABLES Table 3.5.1. Molecular weight and steady state properties of studied polymers ................... 82
Table 3.8.1. TPA properties of studied polymers .................................................................... 87
Table 3.9.1. Fluorescence lifetime of polymer samples ......................................................... 91
Table 3.10.1. Anisotropy and Power Conversion Efficiency. ................................................ 95
Table 4.4.1. Molecular Properties .......................................................................................... 112
Table 4.5.1.1. Steady state absorption properties(Molar absorptivities: Ɛ/104 L mol
-1 cm
-1)
................................................................................................................................................ 116
Table 4.5.2.1. Steady state fluorescence properties ............................................................... 120
Table 4.6.3.1. HOMO, LUMO and Bandgap energies for monomers of polymers P1-P6
using B3LYP functional ........................................................................................................ 122
Table 4.6.3.2. HOMO, LUMO and Bandgap energies for monomers of polymers P1-P6
using wB97x-D functional. .................................................................................................... 124
Table 4.7.1.1. Bandgap of monomer, dimer, trimer, and tetramer of polymers P1-P6 using
wB97x-D functional in eV ..................................................................................................... 125
Table 4.8.1. TPA cross-section ............................................................................................. 140
Table 4.9.1. Fluorescence decay dynamics ........................................................................... 142
Table 4.10.1. Transient absorption kinetic fits at selected wavelengths for P1 and P4 ........ 145
Table 4.10.2. Transient absorption kinetic fits at selected wavelengths for P2 and P5 ........ 148
Table 4.10.3. Transient absorption kinetic fits at selected wavelengths for P3 and P6 ........ 150
Table A.3.1. Assignment of Characteristic Bands Present in the Transient Absorption Spectra
Depending on One- or Two-Electron Transfer ...................................................................... 217
Table AS1. Characterization of diabatic states of the QOT2/AQ complex investigated in this
study using charge and spin ................................................................................................... 221
Table AS2 Coulomb interaction between four point charges in QOT2/AQ complex ........... 227

xvi
Table AS3 Population of QOT2 TT, and ionized QOT2 TT ................................................ 229
Table AS4 Lifetime excited singlet state of QOT2 and QOT2/AQ using time-resolved
fluorescence anisotropy ......................................................................................................... 230
Table AS5 Assignment of ESA II, III, and IV with the position of peak and oscillator strength
................................................................................................................................................ 237
Table B.4.1. Spectral properties and fluorescence quantum yields of C1 and C2 in several
solvents of different polarity f(ε,n2)=[(ε−1)/(2ε+1)]−[(n2−1)/(2n2+1)] ............................... 251
Table B.5.1. Dipole moments of the ground state (S0), the Frank−Condon first excited singlet
state (S1,FC) and the relaxed first excited singlet state (S1,opt) of compounds C1 and C2 in
DCM obtained by the B3LYP/6−31G(d) model followed by QTAIM: total modulus (μTot.)
and Cartesian components (μx, μy and μz) ............................................................................ 254
Table B.6.1. Spectral and kinetic properties of the transients of C1 and C2 in solvents of
different polarity (obtained by femtosecond transient absorption measurements upon
excitation at 400 nm). ............................................................................................................ 264
Table B.6.2. Decay components of C1 and C2 obtained by the decay kinetics of the
up−conversion fluorescence recorded at 688 nm ((exc = 400 nm) ....................................... 267
Table B.7.1. TPA cross sections determined for C1 and C2 in DCM by exciting at 1300 nm
together with that of the reference compound (Styryl 9M) in EtOH. The parameters used for
the calculations by equation 2 are also reported ....... 125 Table 4.7.1.1. Bandgap of monomer,
dimer, trimer, and tetramer of polymers P1-P6 using wB97x-D functional in eV ................ 269
Table B.7.2. Wavelengths (), cross sections (δ) and polarization ratios (R) computed for the
lowest excited singlet states of C1 and C2 in DCM (PCM) by B3LYP/6−31G(d)
(Dalton2016.1) ....................................................................................................................... 271
Table BS1. Full Width at Half Maximum (FWHM) of the absorption and emission bands of
C1 and C2 in different solvents ............................................................................................. 276
Table BS2. Transition energy, nature and oscillator strength of the lowest excited singlet
states of C1 in DCM calculated by TD-DFT B3LYP/6-31G(d), together with the
experimental absorption and emission maxima (λexp) in the same solvent ............................ 277
Table BS3 Two photon transition tensor (a.u.; 1 a.u.= 1.896788×1050
cm4 s photon
1) of C1
and C2 in DCM (PCM) computed by B3LYP/6-31G* (Dalton2016.1). ............................... 280
Table C.3.1 Energy levels and photophysical properties ...................................................... 294

xvii
LIST OF APPENDICES A. Enacting Two-Electron Transfer from a Single-Photon-Excited Chromophores ...... 209
A.1 Abstract ................................................................................................... 209
A.2 Introduction ............................................................................................. 210
A.3 Results and Discussion............................................................................ 211
A.4 Conclusions ............................................................................................. 217
B. Two−Photon Absorption Enhancement Parallels Intramolecular Charge Transfer
Efficiency in Quadrupolar Versus Dipolar Cationic Chromophores ......................... 239
B.1 Abstract ................................................................................................... 239
B.2 Introduction ............................................................................................. 240
B.3 Experimental ........................................................................................... 243
B.4 Results and Discussion ............................................................................ 247
B.5 Quantum-Mechanical Calculations ......................................................... 252
B.6 Femtosecond Transient Absorption and Fluorescence Up−Conversion 259
B.7 Two Photon Excited Fluorescence Measurements ................................. 268
B.8 Conclusions ............................................................................................. 273
C. Two Photon Absorption Study of Low-Bandgap, Fully Conjugated Perylene Diimide
Thienoacene Perylene Diimide Ladder-Type Molecules ......................................... 289
C.1 Abstract ................................................................................................... 289
C.2 Introduction ............................................................................................. 290
C.3 Results and Discussion ............................................................................ 291
C.4 Conclusions ............................................................................................. 298
C.5 Experimental Section .............................................................................. 299

xviii
ABSTRACT
The world is seeing rapid population growth and with this growth, energy
demands have soared. Traditionally, fossil fuels have been used to meet these demands, but
extraction of fossil fuels is detrimental to the environment, burning of fossil fuels contributes
significantly to adding pollutants to the environment, and have directly resulted in climate
change. This has spurred the public and scientists to search for energy sources that are more
environmentally friendly and are renewable. The sun is the largest energy source in the solar
system. If materials and devices can be designed to collect even a fraction of the sun’s
energy, humanity’s energy needs will be me many times over. One of the most promising
light harvesting materials is organic light harvesting materials because of their ease of
processing, lightweight, high absorption capabilities, and flexibility.
In this thesis, the optical properties of conjugated organic light harvesting materials
were investigated. In order to improve the efficiency of these devices, the fundamental
optical properties need to be understood. In the first study, the optical properties of light
harvesting donor-acceptor polymers with the same donor monomer with different strength
acceptors were investigated. Stronger acceptors donor-acceptor polymers had enhanced
charge transfer characteristics, lower quantum yields, and shorter fluorescence lifetimes
compared to weaker acceptor polymers. In the second study, the effect of donor conjugation
length on the optical properties of donor-acceptor light harvesting polymers was investigated
with ultrafast spectroscopic techniques. Polymers with longer donor conjugation lengths had
higher extinction coefficients, higher charge transfer characteristics, and transient absorption
experiments revealed additional species in the excited state. Computations studies related the
electronic structures to the optical properties of the investigated polymers. Two new

xix
experiments were designed and installed for unprecedented wavelength selection and
unprecedented long timescale investigations. An overview of a new nanosecond system that
I have installed and two-photon absorption experiment that I have designed is presented. The
experimental procedure and design is described. Preliminary results are presented
demonstrating the success of this new system and experimental design. A new nanosecond
transient experiment was installed. The experimental procedure for the nanosecond transient
experiment is described. Preliminary results are presented demonstrating the successful
implementation and operation of this new system.

1
Chapter 1
Introduction and Background
1.1 Energy Sources of the World Background
The current world population is approximately 7.5 billion with an annual growth rate of
over 1 percent, with projections of 10 billion people by the year 2056.1
Such rapid population
growth has put significant stress on natural resources, water security, environment, and energy
security.2-5
In particular, energy security has presented significant challenges for the future of
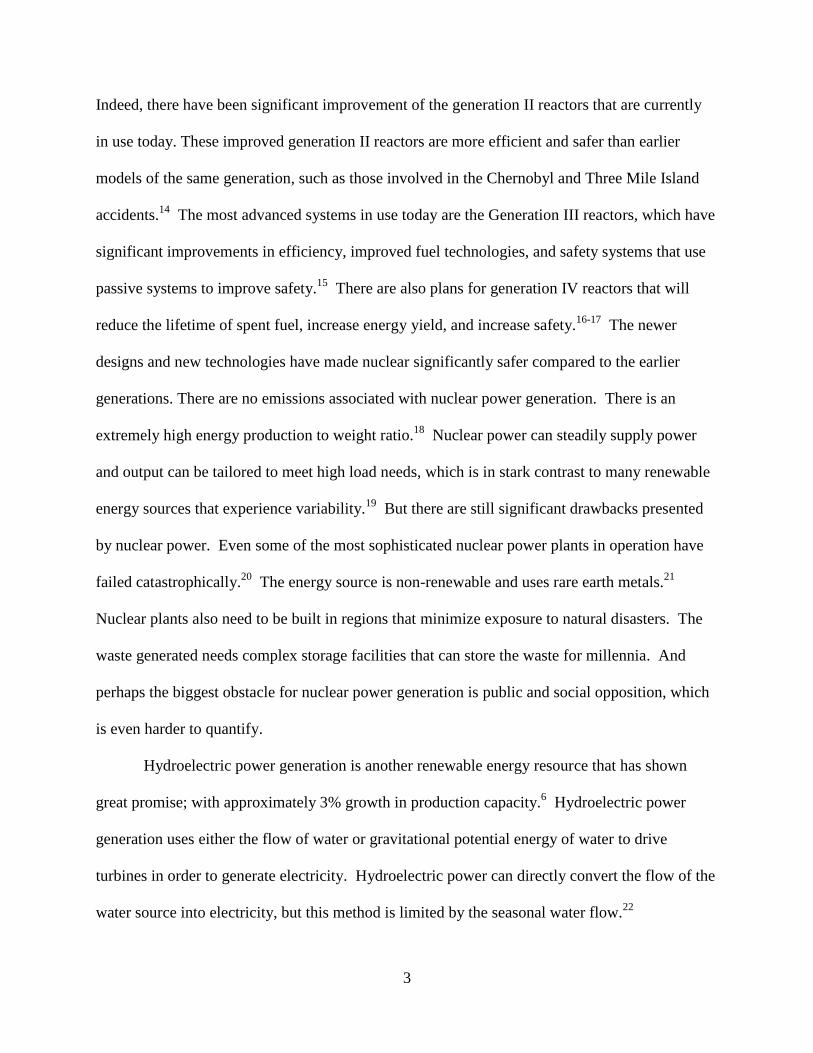
humanity, with energy demand increasing by approximately 1% in 2016 with projections of
energy consumption increasing 28% by 2040 as seen in Figure 1.1.1.6-7
The predominant
energy source for the global consumption are fossil fuels, such as coal, oil, and natural gas,
which supply over 80% of energy demand as seen in Figure 1.1.2.8 But using fossil fuels as
humanity’s major energy source has significant obstacles. Fossil fuels were formed by the
gradual decomposition of flora and fauna over millions of years at high pressures and
temperatures, thus they are non-replenishable for current energy demands and impractical as
long term energy sources since it is non-renewable over human timescales.9 The extraction of
fossil fuels involve significant damage to the local environment.10
And one of the biggest issues
for fossil fuels is that they are major source of harmful emissions.11
The combustion of fossils
results in the significant release of sulfur dioxides which are responsible for environmental
destruction due to acid rain, and nitrous oxides and carbon oxides which are responsible for
devastating climate change.12
These significant drawbacks have led to intense investigation into
new energy sources, technologies, materials, methods, and policies. In particular, there has been

2
significant attention given to alternative energy sources such as nuclear and renewable
energy sources such as geothermal, hydroelectric, wind, and solar.
Figure 1.1.1 World energy consumption by energy source
7
Figure 1.1.2 Energy Consumption 1991-2016
6
Nuclear power is a controversial alternative energy source but has seen production
capacity growth.6 Nuclear power uses the heat generated by nuclear fission of radioactive nuclei
to heat up water that is then used to generate steam to turn turbines. Nuclear power has come a
long way from generation I, prototype proof, of concept reactors from the 1950’s to 1960’s.13
3
Indeed, there have been significant improvement of the generation II reactors that are currently
in use today. These improved generation II reactors are more efficient and safer than earlier
models of the same generation, such as those involved in the Chernobyl and Three Mile Island
accidents.14
The most advanced systems in use today are the Generation III reactors, which have
significant improvements in efficiency, improved fuel technologies, and safety systems that use
passive systems to improve safety.15
There are also plans for generation IV reactors that will
reduce the lifetime of spent fuel, increase energy yield, and increase safety.16-17
The newer
designs and new technologies have made nuclear significantly safer compared to the earlier
generations. There are no emissions associated with nuclear power generation. There is an
extremely high energy production to weight ratio.18
Nuclear power can steadily supply power
and output can be tailored to meet high load needs, which is in stark contrast to many renewable
energy sources that experience variability.19
But there are still significant drawbacks presented
by nuclear power. Even some of the most sophisticated nuclear power plants in operation have
failed catastrophically.20
The energy source is non-renewable and uses rare earth metals.21
Nuclear plants also need to be built in regions that minimize exposure to natural disasters. The
waste generated needs complex storage facilities that can store the waste for millennia. And
perhaps the biggest obstacle for nuclear power generation is public and social opposition, which
is even harder to quantify.
Hydroelectric power generation is another renewable energy resource that has shown
great promise; with approximately 3% growth in production capacity.6 Hydroelectric power
generation uses either the flow of water or gravitational potential energy of water to drive
turbines in order to generate electricity. Hydroelectric power can directly convert the flow of the
water source into electricity, but this method is limited by the seasonal water flow.22

4
Hydroelectric power can use manmade storage dams, which negates seasonal flow changes, but
is limited by the volume of water stored, and by the height that is responsible for gravitational
potential energy difference between the source and outflow.23
Since none of these hydroelectric
power generation systems consume fuel, there are no emissions which is a significant advantage
over fossil fuels. Unfortunately, all hydroelectric power generation is limited to areas with large
flowing water sources. It also disrupts wildlife and can significantly affect downstream
ecosystems.24
Wind energy has seen the largest increase in production capacity and has represented the
largest increase in renewable use.6 Wind power generation uses the wind to drive large rotating
blades that drive turbines for electricity generation. Wind has the advantage of being able to be
installed in remote areas due to the fact that it does not rely upon large facilities for fuel storage
or power generation. It has the advantage over other alternative energy sources because it does
not need additional resources in order to generate power, such as water sources that are needed
for geothermal and nuclear, and hydroelectric. Since wind is powered by local air currents, there
is no need for external fuels which results in no emissions. However, wind power is variable
because it relies on the variability of the wind which makes it a poor choice for primary energy
source.25
It has to be used in areas with stable wind patterns and cannot be used in areas that
experience high winds because of the structural risks.26
There are also concerns how turbines
affect wildlife.27
The two biggest problems with wind power, even if the wind conditions are
ideal, are energy storage and transmission.28
Since wind is intermittent, energy that is not used
during demand must be stored, which makes this renewable energy reliant on storage
technologies.29

5
One of the most promising energy sources is the Sun. The Sun is the most powerful
energy source in our entire solar system. It produces 3.828x 1026
J of energy every second, to
put that into perspective, the Sun releases more energy in one second than 1 million times the
annual global energy consumption.30
Of course, all of that energy does not reach the earth, 4.5x
1024
J of energy reaches the earth per year in the form of electromagnetic radiation, as seen in
Figure 1.1.3, which is 100 times the annual global energy consumption.7 The Sun is the largest
energy source that is available to humanity, yet, it is one of the most neglected energy sources in
terms of power generation because of a significant knowledge gap that existed for harvesting that
energy.
Figure 1.1.3. Normalized Spectral at AM 1.5
31
Harvesting solar photons and converting these into usable electrical energy is no easy
task. It was not until the 1800s that the photovoltaic effect was even observed32
. And in the late
1800s, the photoelectric effect was scientifically investigated.33
Then it was not until 1905 that

6
the photoelectric effect was described by quantum mechanics by Albert Einstein.34
Then in
1954, more 60 years before this dissertation was written, the first practical silicon solar cell was
constructed by Bell Labs with 6% conversion efficiency.35
From this point forward, solar energy
harvesting became a reality for humanity as seen in Figure 1.1.4.
Figure 1.1.4. Major advances of Photovoltaics7, 36-38
Initially, commercialization was very limited because of the high cost of manufacturing
of the silicon and because of the expensive materials used in the fabrication of the solar cell, and
because the low cost of fossil fuels.38
Early implementation began in specialized applications
where other energy sources could not be used, such as satellites and space applications. But with
rapid advances in materials engineering, fabrication techniques, and technology;
commercialization and mass implementation became a reality.38
We now can harvest the energy
from the Sun. Solar energy harvesting can produce energy without generating harmful emissions
that contribute to climate change. Solar cells can be placed in remote areas, on buildings, on

7
roads, on cars; it can be used anywhere there is sunlight. There are no moving parts, which are
traditionally failure points that increase costs due to down time and due to manufacturing costs.
But there are drawbacks for solar energy harvesting. Solar cells must be placed in areas that get
adequate sunlight, for regions that are frequently cloudy or experience significant periods
without sunlight, this technology will not be viable. Even for regions that get adequate sunlight,
the sun is not in a fixed place in the sky.
1.2 Solar Energy Harvesting Principles
Currently the most common form of solar energy harvesting uses semiconducting
materials that converts light into usable electricity by utilizing the photoelectric effect, which is
called photovoltaics. The first step of solar energy harvesting involves the absorption of light.
The solar harvesting material must have strong absorption in the visible portion of the
electromagnetic and preferably be able to absorb photons in the high solar flux region of the
solar spectrum. The second step is the formation of charge carriers. Once the energy has been
absorbed, an electron hole pair is formed. The third step is the dissociation of the charges. If
the negative electron attraction to the positive hole is too strong, they will recombine and no
electricity can be generated. The fourth step is the diffusion of the charge carriers. The charges
need to be able to diffuse through absorbing material. If there are inhomogeneities in the
material or if the distance is too great for the charge to migrate, the hole or electron will become
trapped or recombine and no usable electricity will be generated. The fifth and final step is the
collection of the charge carriers with the holes diffusing to the anode and the electrons diffusing
to the cathode. The biggest obstacle for the last step is ensuring that carriers are not lost at the
interface between the absorbing active material and the cathode and anode. The schematic of
this process can be seen in Figure 1.2.1.

8
Figure 1.2.1. Solar harvesting schematic: 1 absorption, 2 exciton formation and diffusion, 3
charge dissociation, 4 charge carrier diffusion, and 5 charge collection.
The typical solar cell consists of antireflection coating, transparent cathode, active
absorbing material, and finally an anode. The antireflection coating is extremely important in
order to ensure that photons are not lost at the surface air boundary.39
The cathode must be
transparent in order to allow the photons to reach the absorbing material and must have good
electron conductivity in order to collect electrons from the active material.40
The active material
must have strong absorption in the visible region of the electromagnetic spectrum, have good
carrier transport properties, stable to illumination over long time periods, easily obtained source
materials, and be easily fabricated.41-45
And the anode must have good hole collection properties
and must interface well with the active material.46
All of these properties must be taken into
account for all types of solar cells, regardless if they are constructed of organic materials,
inorganic materials, or hybrid materials. A typical solar cell can be seen in Figure 1.2.2.

9
Figure 1.2.2. Solar cell diagram
A few parameters are used in order to characterize the efficiency of different types of
solar cells. Quantum efficiency (QE) is a key parameter that measures the conversion of the
incident photons into current. The quantum efficiency can be broken down into two parts:
external quantum efficiency (EQE) and internal quantum efficiency (IQE). The external
quantum efficiency is the ratio of the number charge carriers collected by the solar cell to the
number of incident photons on the solar cell. Some of the photons that are incident upon the
solar cell are not collected because of reflection losses and transmission losses. The generated
charge carriers can also recombine which results in no charge carrier collection. External
quantum efficiency is a good measure of these losses. Thus, the external quantum efficiency
depends on the absorption properties of the active material and on the ability to separate the
charge carriers in order for them to travel to their respective terminals. The internal quantum
efficiency is the ratio of number of charge carriers collected by the solar cell to the number of

10
absorbed photons. Thus the internal quantum efficiency is a good measure of the carrier
transport properties of the material. Since not all of the incident photons are absorbed, the
external quantum efficiency is typically less than the internal quantum efficiency.
Device efficiency is often characterized by considering the open-circuit voltage. The
open-circuit voltage is the maximum voltage that can be obtained from the solar cell and occurs
when there is no net current through the device. The open-circuit voltage is defined in Equation
1.2.1, where T is temperature in Kelvin, n is an ideality factor which accounts for recombination
mechanisms, k is Boltzmann’s constant in C/K, q is the absolute value of the charge in
Coulombs, I0 is the dark saturation current which is the maximum current that can be generated
without being illuminated, and IL is the photogenerated current. Thus the open-circuit voltage is
determined by the thermal voltage, nkT/q, the maximum current that can be generated, I0, and
the observed current generated by illumination, IL.
Another parameter that is used for solar cell efficiency characterization of solar cells is
the short-circuit current (JSC). The short-circuit current is the current that is generated by the
generation and collection of the light-generated carriers and occurs when the voltage across the
cell is zero. The short-circuit current is equivalent to the IL with moderate loss mechanisms.
Thus, the short-circuit current is the maximum current that can be obtained from the device.
The short-circuit current depends on a few factors. Since the short-circuit current is dependent
on generating the charge carriers, the short-circuit current is limited by the absorption properties
of the material. Photons that are reflected, are converted to heat, are not absorbed, or do not go
towards charge carriers are wasted. The short-circuit current is also limited by the diffusion
Equation 1.2.1.

11
characteristics of the charge carriers and their ability to be collected thus they will be limited by
the mobility of the carriers and their recombination rates.
The short-circuit current is the maximum current that can be generated from the solar
cell, but it occurs at 0 voltage so no useable power is available. Likewise, the open-circuit
voltage is the maximum voltage that can be obtained from the solar cell, but it occurs at 0
current, so again, no useable power is available. Thus, the maximum theoretical power at
simultaneous maximum voltage and maximum current is not obtainable, but it is helpful to
consider the maximum power that can generated compared realizable power. This is represented
by the fill factor (FF) parameter which compares the maximum power of the solar cell to the
product of the short-circuit current and the open-circuit voltage. Determining the FF can be
accomplished by integrating the area with the boundary created by voltage (Vmp) that creates the
maximum power and the current that creates the maximum power (Imp), and dividing that area by
the area created by the product of the open-circuit voltage and short-circuit current which is seen
in Figure 1.2.3.
The FF is reduced by two main factors: series resistance and shunt resistance. In series
resistance the voltage difference between the voltage of the active material and the voltage of the
terminal becomes smaller for the same current, which then reduces the overall power of the solar
cell by reducing the fill factor. Series resistance is due to the movement of the current through
the active material of the solar cell, the resistance between the active material and the terminal
contacts, and intrinsic resistance of the terminals. Since the series resistance is dependent on the
movement of the current through the active material, the series resistance is higher at high
illuminations. Shunt resistance is caused by alternative pathways for light-generated current to
travel which is often due to defects due to manufacturing or due to material defects. This lowers

12
the overall current of the solar cell which results in a lower FF and lower power. Shunt
resistance has a higher impact at lower illumination because shunt resistance is dependent on the
light-generated current.
Figure 1.2.3. Fill Factor
The most important metric used to describe the device efficiency is the power conversion
efficiency (PCE). The power conversion efficiency is the percentage of the incident photon
energy that is converted into electrical energy. Ideally the power conversion efficiency would
be 100%, the power output would be the same as the input power, but with all energy sources
today, ideality has not been obtained. For photovoltaics, PCE is limited by losses due to the
material deficiencies, morphology deficiencies, and device deficiencies. Thus, although ideality
may not be feasible currently, or may never be possible, there is still room for improvement for
better power conversion efficiencies.47
In order to compare the many various types of solar cells,
the power conversion efficiency is generally performed at standard conditions at a temperature of

13
25°C, irradiance of 1000 W/m2 and an air mass 1.5 (AM 1.5) spectrum. The PCE can be related
to the fill factor, open-circuit voltage, and short-circuit current as seen in Figure 1.2.4.
Figure 1.2.4. Solar Cell Efficiency
48
1.3 Silicon Solar Cells
Silicon is one of the most abundant elements on earth, making up 25% of the Earth’s
crust. Silicon is non-toxic which makes it an ideal material to work with and be used in
manufacturing. Silicon is mildly conductive in its pure state but a marked increase in its
conductivity can be accomplished by doping.49
Silicon has four valence electrons that are fixed
to the silicon atom, but when a Group III element with its 3 valence electrons is introduced to the
silicon, called doping, conductivity is increased in the crystal because there is now a vacant
orbital that can hold an electron. This type of doping is called p-type doping because there is a
deficiency of electrons in the lattice, causing there to be a positive site called a hole. In p-type
silicon, the hole is the major charge carrier in conduction with electrons being the minority
carrier. Silicon can also be doped with Group V elements which have 5 valence electrons, which
introduces an excess of electrons in the lattice. This type of doping is called n-type doping
because of the excess electrons that are part of the crystal lattice. In n-type silicon, the electron
is the major charge carrier responsible for conduction with holes being the minority carrier.
Both types of doping add an excess of a charge carrier that increases the conductivity of the

14
silicon. This doping creates a valence band and conduction band that has a small energy gap that
is smaller than an insulator but does not overlap like metals, seen in Figure 1.3.1. Silicon also
has good absorption in the visible spectrum, making it a good candidate for use in the active
layer of solar cells. Silicon solar cells are also stable under long periods of illumination.
Figure 1.3.1. Electronic energy level diagram of metals, semiconductors, and insulators
The typical active layer of a silicon solar cell consists of a p-n junction. The p-n junction
is composed of a grown negatively doped (n-doped) crystalline silicon layer and a grown
positively doped (p-doped) silicon layer that are combined to form a p-n junction. The electrons
in the n-type silicon migrate to the holes in the p-type silicon and recombine, while forming
positive holes where the electrons have left. The holes in the p-type silicon also diffuse to the n-
type silicon and recombine, leaving behind electrons that form a negative region. This causes a
positive region in the n-type silicon and a negative region in the p-type silicon, which creates an
electric field that eventually provides an opposing force that stops diffusion of the holes and

15
electrons, creating a depleted zone. A photon with enough energy can be absorbed by the
silicon, which will dissociate an electron from a hole. Since there is an electric field in the
depletion zone, the electrons will travel to the n-type layer and the holes will travel to the p type
layer. If the n-type layer is connected to the p-type layer by a wire, the electrons will travel
from the n-type layer to the p-type layer by crossing the depletion zone, then go through the wire
back to the n-type layer, creating electricity flow. The typical active layer of a silicon solar cell
can be seen in Figure 1.3.2.
The first silicon solar cell was a crystalline melt-grown pn-junction developed by Ohl,
but had a power conversion efficiency of less than one percent.51
A big breakthrough occurred
in the 1950s when Bell Labs created its first p-type silicon that had an efficiency around 4%.52
The first commercially viable solar cell was a crystalline silicon solar cell that was constructed
by Bell Labs with a 6% conversion efficiency in 1954.52
This achievement began the explosion
in photovoltaic research. By the 1980s, silicon solar cells had achieved efficiencies of around
20%.53
Currently, the highest efficiency achieved for silicon solar cells is 26%, which is near the
maximum theoretical efficiency of 29%.54
Although, crystalline silicon solar cells have high efficiencies, they are reaching their
theoretical maximum efficiency. Crystalline silicon solar cells must be made from extremely
pure silica, because small impurities in the material will drastically reduce the efficiency.55
They
must be grown which is a time intensive and expensive process.56
Crystalline silicon is also
brittle, which limits the applications it can be used in. Because crystalline silicon is an indirect
band gap semiconductor, the minimum energy of the conduction band and the maximum energy
in the valence band do not occur at the same crystal momentum, which means the excitation of
an electron from the valence band to the conduction band requires a photon with energy higher

16
than the band gap or a photon with energy equal to the band gap with additional energy supplied
by a phonon. Thus, the transition is less probable, so a thicker material is needed in order to
ensure absorption which increases the cost of the solar cell compared to thin cell technologies.57
Figure 1.3.2. Silicon Solar Cell50
The limitations of crystalline silicon have led to the investigation of amorphous silicon
for use as an active material. Amorphous silicon does not exhibit long range order that is seen in
crystalline silicon, instead it forms a continuous random network which leads to unique
properties such a pronounced flexibility.58
Amorphous silicon solar cells have distinct
advantages over crystalline silicon. One clear advantage of amorphous silicon is its flexibility
which has potential use in more diverse applications such as flexible solar cells or where
lightweight solar cells are needed suited.59
Amorphous silicon solar cells can be made into
lightweight thin films that can be rolled onto surfaces such as plastics, metals, or glasses, or be
used as a solar absorbing coating.60
Amorphous silicon solar cells have exhibited efficiencies
that are almost 14%, although this is much lower than efficiencies achieved by crystalline silicon
solar cells.61
Amorphous silicon also has slower deposition rates which leads to more expensive
manufacturing costs.62

17
1.4 Non-Silicon Inorganic Solar Cells
Crystalline silicon is the leading material used for the active material of solar cells, but it
has significant limitations, which has led to investigation in other inorganic active materials.
One promising non-silicon inorganic solar cell material is Cadmium telluride (CdTe). CdTe is a
direct band gap semiconductor, which can be made into thin films.63
CdTe has a band gap of
~1.5 eV which is ideal for absorbing photons in the high solar flux region of the solar
spectrum.64
CdTe has also shown efficiencies of around 20%.65
The CdTe solar cell has a
similar construction as the crystalline silicon solar cell, p-n junction of a p-layer of CdTe and an
n-layer of CdS sandwiched between a two conducting layers, seen in Figure 1.4.1, but has the
added benefit of being thinner and flexible which can help with cost effectiveness. CdTe could
be as cost effective as crystalline silicon, but it has two significant draw backs. Cadmium is a
toxic heavy metal which makes mining and manufacturing dangerous.66
Tellurium is a rare and
mildly toxic metalloid which also makes manufacturing and mining dangerous.67
This also
makes CdTe solar cell disposal problematic.
Figure 1.4.1 CdTe Typical Solar Cell
68

18
Another promising active material is copper indium gallium selenide (CIGS). Similar to
CdTe, CIGS can be used in thin film technologies allowing them to be used in flexible
applications. CIGS has high absorption in the visible spectrum, with absorptivities of up to
105/cm and a band gap that is tunable from 1.0 eV to 1.7 eV.
69 CIGS solar cells have also shown
efficiencies of greater than 20%.70
Although CIGS solar cells shown promise, they have yet to
reach wide scale adoption.
Gallium arsenide (GaAs) is another solar active material that has seen a lot of research
interest. GaAs has a low temperature coefficient, which allows it to operate at higher
temperatures than crystalline silicon with lower efficiency losses.71
It has a small band gap and
few crystalline defects, which results in less leakage current.72-74
Like CIGS and CdTe, it is
flexible and lightweight which makes it ideal for thin film applications.75
The biggest advantage
of GaAs is that it has the highest efficiency, with of efficiencies greater than 25%.76
The greatest
disadvantage of GaAs is that is made with arsenic which is toxic to humans and it is an
environmental hazard.77
Gallium is rare which also limits its availability to byproducts of other
mineral extraction industries.78
1.5 Organic Solar Cell Properties
Organic solar cells use conductive small organic molecules or organic polymers for light
absorption and charge transport for electricity production from absorbing solar photons.79-81
In
general the solar organic materials are composed of large extended conjugated systems, where a
system of p orbitals overlap resulting in a delocalization of electrons across the molecule leading
to the conductive nature of solar organic materials.82,83
But the use of organic materials for solar
harvesting is a relatively surprising light harvesting material for photovoltaics. Traditionally,
organic materials have been viewed as insulators and have been implemented as insulators for

19
conductors and semiconductors. In fact, the photoconductivity of organic materials was not
observed until the early 1900s when Pochettino and Volmer observed the photoconductivity of
anthracene, an organic molecule consisting of three fused benzene rings.84
The first organic
solar cell was developed by Kallmann and Pope in 1959, but only had a power conversion
efficiency below 0.1%.85
The next breakthrough in organic solar cells did not even occur almost
30 years later, when in 1986, Tang used a p-type copper phthalocyanine and n-type
bisbenzimidazo[2,1-a:2',1'-a']anthra[2,1,9-def:6,5,10-d'e'f']diisoquinoline-10,21-dione bilayer
cell to reach an efficiency of ~1%, which still paled in comparison to silicon solar cell
efficiencies that were developed 30 years earlier.86
The biggest breakthrough occurred in the
1990s when bulk heterojunctions (BHJ) were introduced, where power conversion of efficiencies
of ~3% were obtained.87
Since that breakthrough, efficiencies of over 10% have been
achieved.88
Organic solar cells operate under similar principles as inorganic solar cell. A solar
photon is absorbed, charge carriers are formed with an electron hole pair, the electron and hole
dissociate from each other, the charge carriers diffuse, and then they are collected at the anode
and cathode, , seen in Figure 1.5.1.89
But unlike inorganic solar semiconductor materials,
instead of forming a conduction and valence band by introducing impurities to cause
conductivity, conductivity is accomplished via molecular orbital delocalization for organic solar
harvesting materials. Atoms have electrons in atomic orbitals, which are regions that surround
the nucleus of the atom where there are high probabilities of encountering the atoms electrons.
Electrons in the outermost orbitals that are unpaired are responsible for bonding between atoms
and overlap forming the bond. In molecules, the atomic orbitals can hybridize forming
molecular orbitals, where the electrons are shared within the molecule and resulting in lower

20
energy orbitals. The molecular orbitals form ζ bonds where the electrons are considered
localized between two atoms, and π bonds that are delocalized across the molecule. In the
molecular orbital system, the molecular orbitals that have the highest probability of finding the
electron are the highest occupied molecular orbitals (HOMO) and the orbitals with the lowest
probability of finding the electron are the lowest occupied molecular orbitals (LUMO). The
HOMO is the equivalent of the valence band of inorganic light harvesting materials and the
LUMO is the equivalent of the conduction band of inorganic light harvesting materials.90
The
energy difference between the HOMO and the LUMO is the band gap and the absorption of an
electron that matches the band gap will promote and electron from the HOMO to the LUMO,
similar to the promotion of an electron in the valence band to the conduction band in inorganic
systems.91
Figure 1.5.1. Electronic state diagram of organic solar cell89

21
Figure 1.5.2. Electronic state diagram of photon absorption of electron from HOMO to LUMO
in Organic System91
1.6 Organic Solar Cells Advantages and Disadvantages
Inorganic solar active materials have shown great promise but they have significant
limitations and drawbacks, which has spurred interest in organic light harvesting materials. The
precursors to the organic solar harvesting materials are quite abundant, similar to their organic
counterparts but do not require the high level of purity that is needed for their inorganic
counterparts. Organic active materials have much higher absorption coefficients compared to
their inorganic counterparts.92
Processing of organic materials is much easier compared to their
inorganic counterparts. They are readily soluble in solvents which allow them to be dissolved
and then solution processed by roll to roll processing, printed, or spin coating into a film to be
used for fabricating organic solar cells, which drastically reduces the manufacturing costs
compared to inorganic solar active materials.93-97
Because they have high absorption, are
22
flexible, and are readily solution processed, the active materials can be made into thin films,
which are less than 100 nm compared to their inorganic counterparts which are on the order of
1µm to 100µm, which drastically decreases the material needed to form the active layer and
reduces the weight and cost.98-102
The morphology can be easily be modified with additives,
annealing, or mechanical processing which can control orientation, long range ordering,
crystallinity, optical properties, and electrical properties.103-107
One of the great benefits of
organic active materials is that the small molecules or polymers that make up the active layer can
be easily made by well-defined synthetic pathways. The synthesis of small molecules and
polymers is greener than inorganic solar cell fabrication because it does not involve toxic heavy
metals, although the use of organic solvents still proves to be problematic for a completely green
process.108
One of the greatest advantages of organic active solar materials is their ease of
tunability of their optical and electrical properties.109
Slight modifications of molecular
structures can lead to pronounced changes in their optical and electrical properties. The organic
materials electrical and optical properties can be modified by augmenting the aromaticity,
stiffness, planarity, electron donating strength, electron withdrawing strength, and steric
hindrance.110-116
The absorption properties of organic materials, which are much higher than
inorganic active solar materials, can be enhanced or modified. The absorption extinction
coefficient can be enhanced; the peak absorption wavelength can be modified; the band gap can
be easily tuned; and the spectral range can be modified.117-118
The electronic properties can be
modified by augmenting electron mobilities, hole mobilities, and exciton diffusion properties.119-
120
Although, organic solar cell materials do still have significant barriers to overcome in
order to overtake their inorganic counterparts. Organic solar cells require rare transition metals

23
for catalytic synthesis of the active organic materials. Rare transition metal catalysts are
expensive, owing to their low abundance of rare transition metals, are not stable under mild
conditions, and are limited by their catalytic lifetime before being poisoned, thus greater
improvements are needed in order to decrease the costs of synthesis of organic solar harvesting
materials.121-124
The longevity of the organic active layer is another concern for the successful
implementation of organic solar cell technologies. The organic active layer can be easily
oxidized by oxygen if the organic active layer has a high reducing potential.125
The organic
active layer is also susceptible to UV damage and must be adequately protected.126
As discussed
earlier, although there is no net carbon emission from energy production, making it greener than
other forms of energy production methods, the extensive use of organic solvents is a workplace
hazard and environmental hazard.
Organic light harvesting materials also have significant optical and electrical limitations.
Although organic light harvesting materials have very good absorption properties, they have
poorer electrical properties than inorganic light harvesting materials. The dissociation of
electron from the hole in organic light harvesting materials requires a much higher energy than
their inorganic counterparts.127
Organic light harvesting materials are relatively disordered
compared to their well-ordered and crystalline inorganic counterparts, which results in slower
charge mobilities with increases charge recombination and lower power conversion
efficiencies.128
The biggest obstacle to organic light harvesting materials is they have much
lower power conversion efficiencies than their inorganic counterparts, with the maximum
efficiencies that are half the efficiencies obtained by their inorganic counterparts.129
In order for
organic light harvesting materials to be competitive with inorganic light harvesting materials,
their power conversion efficiencies must be improved. Thus it is imperative to investigate the

24
fundamental properties, such as structure optical property relationships of organic light
harvesting materials in order to improve the power efficiencies of organic light harvesting
materials.
1.7 Organic Solar Cell Architecture
Unlike in inorganic solar materials, charge carriers in organic systems have much shorter
life times.130-131
This has led to an evolution of architectures of organic solar cells. If a thin film
of the organic active material was used in a single layer between the anode and cathode, the hole
and electron would be drawn to their respective electrodes, but the attraction between the hole
and electron is still high and there is a high probability of hole and electron recombining.132
This
led to the investigation of bilayer structures similar to inorganic solar cell architectures, where
there is an electron deficient organic layer and an electron rich organic layer. This motif has the
benefit of having a stronger driving force to separate the hole and the electron in the exciton.133
But similar to the single layer, recombination probability is also high. The diffusion length of an
exciton in organic materials is ~10 nm, whereas the thickness of the each layer in the bilayer is
~100 nm.134
Thus the majority of excitons are prevented from reaching the bilayer interface,
which severely limits the number of charge carriers that can be generated. To overcome the
intrinsically shorter lifetimes of the charge carriers of organic light harvesting materials, the bulk
heterojunction organic photovoltaic has been implemented in order to increase charge carrier
generation and subsequently increase power conversion efficiency.135
In a bulk heterojunction,
the electron deficient organic material is mixed with the electron rich organic material which
allows for interpenetrating networks of the electron deficient organic material with the electron
rich organic material. This creates smaller domains which allow for greater surface area for the
exciton to move to the interface for electron hole separation with subsequently greater charge

25
carrier generation which results in higher power conversion efficiency.136
Because there is a
better chance for charge carrier generation, this design is the most common design used when
constructing organic solar cells. Representations of each type of architecture can be seen in
Figure 1.7.1.
Figure 1.7.1. Organic solar cell architecture
137
1.8 Different Types of Organic Light Harvesting Materials for Solar Cells
1.8.1 Organic Dye Solar Cells
Dye-sensitized solar cells (DSSC) are an organic-inorganic hybrid thin film solar cell
technology. In the 1960s, experiments showed illuminating organic dyes could lead to
photoconductivity when near oxide electrodes.138
In the early 1990s, Gratzel et al were able to
demonstrate low-cost and high efficiency solar DSSCs.139
This led to a boom in research into
DSSCs. In a DSSC solar cell, a layer of highly porous titanium dioxide (TiO2) nanoparticle is
impregnated with light absorbing organic dyes. The nanoparticles are then immersed in an
electrolyte solution and sandwiched between two electrodes. Photons excite the organic dyes,
and electrons flow from the organic dyes into the TiO2 nanoparticles. The electrons then flow to
an electrode where the electricity is generated to power a load. The electron then travels to
counter electrode. Then the electron is shuttled back to the organic dye by the liquid redox
electrolyte which regenerates the dye. This schematic can be seen in Figure 1.8.1.1. This type
of solar cell has shown great promise, with efficiencies near 10%.140
Although there have been
rapid advancements in DSSC technologies, there are significant drawbacks. Similar to other

26
organic solar cell materials, DSSC is susceptible to UV damage and oxidation. The use of rare
metals such as platinum and ruthenium increases the cost of DSSCs, and so far alternatives have
not been found to reduce that cost.141
The biggest drawback of DSSCs are the use of liquid
electrolytes.142
Great care must be taken to ensure that liquid electrolyte is adequately contained,
any physical damage to the containment will result in the loss of the electrolyte and complete
loss solar conversion. The electrolyte also uses organic solvents which can pose workplace
hazards and environmental hazards. Since it is liquid, it must survive a wide array of weather
conditions from freezing temperatures in cold climates to high temperatures that can cause
evaporation of the liquid electrolyte in order for DSSCS to be a practical replacement for
conventional solar cells. Indeed, much research has been dedicated to replacing liquid
electrolytes with solid state electrolytes, with high efficiencies of 15% being achieved.143
But
even the solid state electrolytes have suffered high degradation during its operational lifetime.
Figure 1.8.1.1. Typical dye sensitized solar cell144
1.8.2 Macromolecules: Homopolymers
The evolution of humans has seen evolution in technologies that humans have used; from
the Stone Age, to the Bronze Age, and to the Iron Age. Currently, we are in the “Polymer Age”.
Polymers are large molecules, macromolecules, that are made up of repeating molecular

27
subunits. Polymers are used extensively in our daily life, from cell phones, to clothes, to
construction materials, to lights, to furniture, to transportation, to photovoltaic materials, and
even people are composed of biopolymers. Polymers can be insulating or semiconducting.
Polymers are flexible, lightweight, chemical resistant, exhibit high strength, and are easily
modified.145-147
A special type of polymer can be used as light harvesting material for solar cells.
Conjugated polymers composed of the same repeat unit, homopolymers, can be used as the light
harvesting material in solar cells and serve as the donor of electron density. As discussed earlier,
the formation of a molecule is due to the hybridization of atomic orbitals forming molecular
orbitals. These orbitals form LUMO and HOMO energy levels for the molecular system.
Similar to how functional groups can modify the energy levels, polymerization leads to
modulation of LUMO and HOMO energy levels, eventually leading to conduction and valence
band-like energy levels as seen in Figure 1.8.2.1. This allows for the polymer to take on a
semiconductor-like behavior and become photoconductive, thus being able to act as the light
harvesting material in organic solar cells. The electron rich homopolymer can serve as the
photon absorbing material and electron donor, and it can be mixed with an electron deficient
acceptor material in order to promote charge separation to increase power conversion efficiency
of the organic solar cell.

28
Figure 1.8.2.1. Energy level modulation via increasing polymerization
148
One of the most studied light harvesting homopolymers is poly(3-hexylthiophene)
(P3HT). P3HT is considered the model light harvesting homopolymer and is one of the most
used homopolymers in organic solar cells.149
It has a broad absorption spectrum, ranging from
350 nm to 650 nm, allowing the polymer to absorb the high and low energy photons of solar
radiation.150
P3HT has high charge carrier mobilities which is one of the disadvantages that
organic solar harvesting materials often face.151
It is relatively easy to synthesize and the
regioregularity can be easily controlled. Regioregularity is important for the absorption and
charge carrier mobilities. More regioregular structures lead to more planar structures which
enhances conjugation along the polymer backbone which promotes better absorption and better
charge carrier mobilities.152
Although, higher crystallinity can lead to aggregation of P3HT and
phase separation from the acceptor material resulting in lower power conversion efficiencies.
Higher molecular weight polymers have shown to have better hole mobilities.153
Unfortunately,
P3HT has a high band gap of ~1.9 eV which limits its ability to absorb photons in the near-
infrared region and infrared region.154
It also has a high HOMO level, -5.19 eV, which makes it
susceptible to oxidation and limits the open circuit voltage.155

29
Due to limitations of P3HT, much research has focused on trying to find homopolymers
that exhibit low band gaps, high short circuit currents, and open-circuit voltages. Homopolymers
that contain benzodithiophene (BDT) have shown great promise. Benzodithiophene unit is a
promising donor material because its fused structure prevents intramolecular rotation which
maximizes the π overlap between monomer units.156
The planar structure promotes π stacking in
devices which improves charge transport through intermolecular hopping.157
The planarity of
the BDT unit is important for lowering the band gap and improving the absorption range, as well
as enhancing the molar absorptivity. One particular BDT homopolymer, poly(4,8-bis(5-(2-
ethylhexyl)thiophen-2-yl)benzo[1,2-b:4,5-b’]dithiophene) (PBDTT), has shown great optical and
electrical properties. PBDTT has a power conversion efficiency of 6.12%, high open circuit
voltage of 0.93 and short circuit current of 11.95 mA cm−2
.158
These remarkable values have
also been achieved without solvent additives or thermal annealing, which would reduce the cost
of commercial manufacturing. It also reduces the complexity of fabrication because it removes
the step of removing high-boiling point additives. The stability of solar cell is also improved
since residual solvent will not cause phase separation of the donor and acceptor, and the solar
cells uniformity from batch to batch can be achieved. Unfortunately, PBDTT has poor
absorption in the near-infrared and infrared region which limits the efficiency of these types of
solar cells.
1.8.3 Conjugated Donor-Acceptor Polymers
The most promising organic solar active materials are conjugated donor-acceptor
polymers. The donor-acceptor material serves as the photon absorbing material and donates
electrons to an electron deficient acceptor material in polymer organic solar cells. Donor-
acceptor polymers benefit from energy modulation due to polymerization which is also seen in

30
homopolymers, but they have distinct advantages that are only offered by the donor-acceptor
motif. A donor-acceptor polymer is composed of electron rich donor monomer covalently linked
to an electron deficient monomer in an alternating motif. This motif results in a hybridization of
the energy levels of the donor monomer and the acceptor monomer, with the HOMO of the new
polymer closely resembling the HOMO of the donor monomer and the LUMO closely
resembling the LUMO of the acceptor monomer as seen in Figure 1.8.3.1.159
This results in
decreasing the band gap which broadens the absorption which lowers the short-circuit current of
the organic polymer solar cell. The energy level of the LUMO of the donor-acceptor polymer
can be modulated in order to ensure that there is an adequate mismatch between the LUMO of
the acceptor material in order to overcome the exciton binding energy, which is typically in the
range of 0.1 to 0.5 eV.160
The alternating donor acceptor motif introduces an electropotential
gradient which increases charge separation and increases charge mobilities.161
The energy level
of HOMO can be modulated to optimize the energy difference between the HOMO of the
polymer with the LUMO energy of the acceptor to maximize the open-circuit voltage.162
Figure 1.8.3.1. Energy level modulation in donor-acceptor polymer159

31
The electron-donating and electron-accepting properties of the monomers can be easily
tuned. The donating strength of the donor can be modified by introducing different strength
donating functional groups or electron-withdrawing strength of the acceptor can be modified by
introducing different strengths of electron-withdrawing functional groups. This allows for the
optical band gap to be precisely tuned and for the absorption range to be broadened. It can
promote higher charge separation, higher charge mobilities, more energy transfer, and can
decrease undesirable photovoltaic pathways.163-164
But great care must be taken in order to
enhance desirable properties and not introduce undesirable properties. If the electron-donating
strength is too high, the donor can be easily be oxidized which can destroy the light-harvesting
ability of the donor-acceptor polymer.165
If the electron-withdrawing strength is too high, the
electron can be trapped resulting in low conductivities resulting in poor solar cell performance.166
The addition of functional groups can also be used to modify other polymeric properties
of the donor-acceptor polymer. Large bulky side groups can be added in order to relieve steric
hindrance between monomer subunits which allows more a more planar backbone to promote
better charge mobilities.167
Side-chains can also introduce steric hindrance between monomer
subunits which causes backbone twisting which can disrupt π-π interaction along the backbone
which affects the electrical and optical properties.168
It can also disrupt intermolecular stacking
between polymer chains, but the twisting can lead to better phase-mixing between the donor
polymer and organic acceptor.169
Side-chains can also improve the stability of polymer organic
solar cells.170
One of the most important functions of side-chains is to improve solubility of the
donor-acceptor polymer in solvents. Without solubility side-chains, these macromolecules are
insoluble in solvents or marginally soluble. This makes industrial roll to roll processing, ink-jet

32
processing, spinning coating, or any other wet processing impossible. This would increase
manufacturing costs and could make cost-effective organic alternatives impossible.
Besides modifying the polymer periphery, the polymer backbone can be easily modified
to modulate the optical and electrical properties. Heavy atoms can be introduced in the polymer
backbone in order to produce high molecular weights, strong absorption, narrow band gaps, and
high charge-carrier mobilities.171
Heteroatoms can replace carbon atoms within the polymer
backbones which can modulate the photophysical properties, conformational, and molecular
packing properties of donor-acceptor conjugated polymers.172-173
The conjugation of each
subunit in the donor-acceptor polymer can affect the effective conjugation length, the number of
repeat units that form the optical unit of the donor-acceptor polymer.174
The conjugation of the
donor and acceptor subunits can also affect the interaction between the donor-acceptor interface
along the polymer backbone. The oscillator strength, the quantity that describes the probability
of an absorption or emission of photons, can be modified by fusing the subunits in the polymer
backbone or introducing aromatic subunits to increase the stiffness of the polymer backbone.10
1.8.4 Donor Subunits in Donor-Acceptor Polymers
The optical and electrical properties of donor-acceptor polymers are the sum of its
individual parts, the donor and acceptor subunits. The donor should have low HOMO energy
level, be electron rich, be strong enough to donate an electron to the acceptor but not too strong
to where the donor is easily oxidized by its environment.175
The donor subunit should also have
high hole mobilities in order to ensure efficient electron and hole separation.176
One of the most popular donor subunits is 3,4-ethylenedioxythiophene (EDOT). EDOT
has good redox potential, good stability, and good conductive properties.177
The alkylenedioxy
bridge across the 3- and 4- positions on the thiophene subunit increases the electron density to

33
the aromatic ring from the donating properties of the oxygens. This reduces the oxidation
potential of both the donor monomer and the polymer as a whole. This results in the stabilization
of the charge transfer state. Donor-acceptor polymers containing EDOT donor subunits have
shown band gaps from 1.91 ev to 1.13 eV, high short circuit currents of up to 15 mA cm-2
, open
circuit voltage of up to 0.91 V, and power efficiencies of up to 2.5%.178
Although, EDOT donor
monomers have shown promise for incorporation in donor-acceptor polymers, power conversion
efficiencies of 2.5% are on the lower end of efficiencies for donor-acceptor polymers.
Another promising donor monomer is fluorene. Fluorene is a polycyclic aromatic
monomer, where two benzenes are fused via a cyclopentane. It traditionally used for its
photoluminescence properties because of ease of tunability of its fluorescence wavelength and
high quantum yields, but incorporation of fluorene in donor-acceptor polymers has also been
successful due to the ease of tuning the absorption properties and electronic energy levels.179
This has allowed the absorption spectrum of the donor-acceptor polymer to be adjusted to
coincide with the maximum photon flux region of the solar spectrum.180
Also, the stiffness of
the fluorene monomer increases the oscillator strength which increases the absorption properties
of the donor-acceptor polymer. Indeed, donor-acceptor polymer incorporating fluorene donors
have shown efficiencies of 6.2% with a high fill factor of 0.70.181
Benzodithiophene (BDT) monomers have also shown great promise as donors in donor-
acceptor polymers. BDT based monomers have a large planar conjugated structure and
introduces little steric hindrance when incorporated in donor-acceptor polymers.182
The large
planar conjugated structure maximizes the π-orbital overlap by restricting intramolecular rotation
in the polymer backbone. The BDT unit makes the polymer backbone more rigid which
broadens the absorption spectrum of the donor-acceptor polymer. The more planar and rigid

34
backbone can lead to better stacking between adjacent polymers in the organic solar cell,
promoting intermolecular charge transfer.157, 183
Donor-acceptor polymers that have incorporated
BDT donor units have reached high power conversion efficiencies of over 10%.184
1.8.5 Acceptor Subunits in Donor-Acceptor Polymers
As important as the donor subunit is, the acceptor subunit is as important if not more
important in the donor-acceptor polymer. The acceptor monomer must have strong electron-
withdrawing characteristics in order to promote charge transfer and charge separation. Although,
too strong of an acceptor can lead to the electron being trapped which lowers charge mobility
which limits device performance. Since the LUMO of the polymer is best represented by the
LUMO of the acceptor, the LUMO of the acceptor must be matched appropriately with the
acceptor material in order to ensure efficient electron transfer to the acceptor material.185
One of the most promising acceptors is the diketopyrrolopyrole (DPP) monomer. DPP is
a strong electron accepting fused bicyclic monomer. It has a fused planar structure that improves
conjugation along the polymer backbone and the planar structure can promote intermolecular π-π
stacking in solar devices.186
The lactam groups on the rings are strong electron-withdrawing
groups that facilitate large intramolecular charge transfer.187
DPP also exhibits excellent
photochemical, mechanical and thermal stability which is important for the stability of DPP-
based donor-acceptor polymers.188
Polymers that have incorporated DPP acceptors have shown
power conversion efficiencies of over 10%.189
Isoindigo (II) acceptor monomers have also drawn attention for incorporation into donor-
acceptor polymers. II is an isomer of indigo; it is composed of two pyrrolidine rings connected
by a double bond with two fused benzene rings on the periphery of each pyrrolidine ring. The II
acceptor is relatively planar which provides excellent electronic communication of the phenyl
35
and the ketopyrrole carbonyl π-electrons.190
Similar to DPP, the ketopyrrole is responsible for
the strong electron-withdrawing effects of the acceptor unit. Isoindigo based donor-acceptor
based polymers show weak fluorescence which is ideal for high efficiency light harvesting
donor-acceptor polymers. Isoindigo acceptors have also shown great photostability. Isoindigo
based donor-acceptor polymers have exhibited power conversion efficiencies of over 6%.191
One of the most studied and maybe highest potential acceptor monomers have been
thiophene based acceptors. Thiophene based acceptors can be easily modified. The conjugation
length can be readily increased by fusing other conjugated aromatic rings. Other thiophene rings
can be attached in a variety of different ways from fusing rings together to covalently linking
thiophenes by single bonds. The electron-withdrawing properties are easily modulated by
attaching electron-withdrawing functional groups to the thiophene acceptor. One of the early
best performing donor-acceptor polymers, PTB7, used a thiophene acceptor.192
Polymers using
thiophene acceptors have shown power conversion efficiencies of over 10%.193
1.8.6 Acceptor Materials for Organic Solar Cells
In organic solar cell, solar energy to electrical power conversion is accomplished by
photo-induced electron transfer process between an organic electron donating material and an
electron-accepting material. A lot of focus has been on the photon absorbing materials that are
responsible for donating an electron that is used in the electricity generation, but the organic
electron accepting material is equally important. The acceptor material accepts the excited
electron from the LUMO of donor, so the LUMO of the acceptor most be low-lying in order to
successfully dissociate the electron from the exciton on the donor material. The acceptor
material can also be photoexcited in order to generate an exciton that can migrate to the donor-
acceptor interface of the organic solar cell. The hole can migrate to the donor material and the

36
electron can migrate from the acceptor material to the electrode to generate electricity. Thus the
acceptor must be strong enough to dissociate the electron from the organic donor material as well
as have high electron mobilities to allow the electron to reach the electrode.194
By far the most popular organic accepting materials are fullerene based acceptors. Since
their introduction in organic bulk heterojunctions in the 1990s, they have continued to one of the
most popular acceptor materials.87
Fullerenes have low-lying LUMO level, in the range of −3.5
eV to~−4.5 eV, which provides excellent electron-accepting properties.195-196
Fullerenes have
fast charge transfer rates and low charge separation energy barriers.197
Recently, photo-physical
investigation and theoretical calculation showed evidences on the unique fast charge transfer
rate.198
Fullerenes have been utilized as the organic acceptor in many of the highest performing
organic solar cells, but it has significant drawbacks. Fullerene based acceptors are expensive
materials to synthesize due to their complexity and 3-dimensonial structure, which has attracted
interest in investigated cheaper synthetic methods.199
Fullerene based acceptors also have poor
absorption properties in the visible spectrum, which means one half of the donor-acceptor active
material is not involved in absorbing photons to be used in electricity generation.200
The drawbacks of fullerene based acceptor materials have led to intense research into
alternative organic electron accepting materials. Non-fullerene acceptors can have tunable
absorption properties, tunable electron mobility, solubility can be modified to enhance phase
mixing between the donor and acceptor material, the morphology can easily be modified, and
they have lower production costs.201-204
One such non-fullerene acceptor material is naphthalene
diimide (NDI) oligomers with donor-acceptor motifs. NDI based acceptors have tunable optical
band gaps and they can be tuned from 2.1 eV to 1.4 eV.205
This is a marked improvement in
absorption properties compared to fullerene based acceptors. The planarity and extended π-

37
conjugation lends itself to π- π stacking which can promote intermolecular photoinduced charge
transfer from the donor material to the acceptor material. Open-circuit voltages of up to 0.81 V
and short-circuit currents of up to 18.18 mA cm-2
with power conversion efficiencies of up to 8%
have been achieved.206
One of the most promising non-fullerene acceptors are perylene diimide (PDI) acceptors.
PDI is similar to NDI, with the naphthalene subunit replaced by a perylene subunit. The large
relatively planar structure can promote π- π stacking with donor material which can promote
intermolecular charge transfer from between the donor material to the acceptor material. It can
also promote crystallinity to improve charge mobilities. PDI acceptors show broad and strong
absorption in the region of 300−700 nm with a maximum extinction coefficient of 3.21 × 10⁴ L
mol−1
cm−1
at 349 nm.207
Highly efficient solar cells have produced power conversion
efficiencies of almost 8%.208
1.9 Dissertation Outline
So far in this dissertation, energy generation technologies have briefly been introduced,
photoharvesting material technologies have been discussed, the various organic solar harvesting
materials have been discussed, and device architectures discussed. There have been extensive
improvements in the understanding of synthetic methods to develop organic photovoltaic
materials. There have been extensive investigations of device fabrication. But there still is much
to learn about the optoelectronic properties of these light harvesting materials.
In the rest of this thesis, steady-state spectroscopy, ultrafast time-resolved fluorescence
spectroscopy, ultrafast two-photon absorption spectroscopy, nanosecond two-photon absorption
spectroscopy, ultrafast transient absorption spectroscopy, and nanosecond transient absorption
spectroscopy; as well as quantum mechanical calculations were used to investigate the optical

38
and electric properties of organic light harvesting materials. With the hopes of giving insight
into the property structural relationships of organic light harvesting materials, so that new and
improved organic light harvesting materials can be developed. Steady-state spectroscopy gives
insight into the steady-state absorption and steady-state fluorescence properties. Two-photon
absorption spectroscopy gives insight into the two-photon absorption cross-section which is
proportional to the transition dipole moment which is proportional to the charge transfer
character of the organic light harvesting materials. The ultrafast time-resolved fluorescence
spectroscopy gives insight into the fluorescence dynamics of exciton decay and energy transfer.
The nanosecond time-resolved fluorescence spectroscopy gives insight in to long timescale
fluorescence decay processes. The ultrafast transient absorption spectroscopy can give insight
into the excited state dynamics. The nanosecond transient absorption spectroscopy can give
insight in the long-lived excited state dynamics. The quantum mechanical calculations can give
insight into the molecular structures responsible for the experimental results.
In chapter 2, the experimental techniques used to investigate the organic light harvesting
will be discussed. The theory of each technique will be discussed as well as the practical aspects
will be discussed.
In chapter 3, the optical and electronic properties of light harvesting donor-acceptor
polymer with various electron-withdrawing strengths was investigated. The influence of the
electron-withdrawing strength on the optical properties of the donor-acceptor polymers was
investigated. The exciton lifetime was investigated in respect to acceptor strength.
In chapter 4, the optical and electronic properties of light harvesting donor-acceptor
polymers with various donor conjugation lengths were investigated. The effect of donor
conjugation length on optical properties was investigated. Quantum mechanical calculations
39
were used to offer further insight into the electronic structures responsible for the optical
properties.
In chapter 5, a new nanosecond laser experiment for two-photon excitation fluorescence
was designed. The design of experiment is described and the description for operation is
provided. A new SRS 250 gated integrator was incorporated for data collection. A new program
was coded to handle the data collection and to save the data for manipulation.
In chapter 6, a new nanosecond transient absorption experiment was installed and
aligned. The design of the experiment is described and the description for operation is provided.
A new LP980 system was installed for data collection and electronic control of the probe source.
In chapter 7, a summary is provided with the future directions for organic light-harvesting
materials.
References
(1) United Nations, Department of Economic and Social Affairs, Population Division.
https://esa.un.org/unpd/wpp/Graphs/Probabilistic/POP/TOT.
(2) Speidel, J. J.; Weiss, D. C.; Ethelston, S. A.; Gilbert, S. M. Population Policies,
Programmes and the Environment. Phil. Trans. R. Soc. B. 2009, 364, 3049-3065.
(3) Vorosmarty, C. J.; McIntyre, P. B.; Gessner, M. O.; Dudgeon, D.; Prusevich A.; Green,
P.; Glidden, S.; Bunn, S. E.; Sullivan, C. A.; Liermann C. R.; Davies P. M. Global
Threats to Human Water Security and River Biodiversity. Nature. 2009, 467, 555-561.
(4) Karp, A.; Richter, G. M. Meeting the Challenge of Food and Energy Security. J. Exp.
Bot. 2011, 62, 3263-3271.
(5) Jacobson, M. Z. Review of Solutions to Global Warming, Air Pollution, and Energy
Security. Energy Eviron. Sci. 2009, 2, 148-173.
(6) BP Statistical Review of World Energy June 2017.
https://www.bp.com/content/dam/bp/en/corporate/pdf/energy-economics/statistical-
review-2017/bp-statistical-review-of-world-energy-2017-full-report.pdf.
(7) U.S. Energy Information Administration. International Energy Outlook.
https://www.eia.gov/pressroom/presentations/mead_91417.pdf.
(8) World Energy Council. World Energy Resources 2016.
https://www.worldenergy.org/wp-content/uploads/2016/10/World-Energy-
Resources_SummaryReport_2016.10.03.pdf.

40
(9) Pimentel, D.; Patzek, T. Green Plants, Fossil Fuels, and Now Biofuels. BioScience.
2006, 56, 875.
(10) Butt, N.; Beyer, H. L.; Bennett, J.R.; Biggs, D.; Maggini, R.; 1 Mills, M.; Renwick,
A.R.; Seabrook, L. M.; Possingham, H. P. Biodiversity Risks from Fossil Fuel
Extraction. Science. 2013, 342, 425-426.
(11) Hook, M.; Tang, X. Depletion of Fossil Fuels and Anthropogenic Climate Change-A
Review. Energy Policy. 2013, 52, 797-809.
(12) Likens, G. E.; Bormann, H. F. Acid Rain: A Serious Regional Enviromental Problem.
Science. 1974, 184, 1176-1179.
(13) Pioro, I.; Duffey, R. Nuclear Power as a Basis for Future Electricity Generation. J.
Nuclear Rad. Sci. 2015, 1, 1-19.
(14) Goldberg, S. M.; Rosner, R. Nuclear Reactors: Generation to Generation. Am. Acad.
Arts. Sci. 2011, 1-25.
(15) Dragunov, A.; Saltanov, E.; Pioro, I.; Kirillov, P.; Duffey, R. Power Cycles of
Generation III and III+ Nuclear Power Plants. J. Nuclear Rad. Sci. 2015, 1, 1-10.
(16) Moir, R. W.; Teller, E. Thorium-Fueled Underground Power Plant Based on Molten
Salt Technology. Nucl. Tech. 2005, 151, 334-340.
(17) Abu-Khader, M. M. Recent Advances in Nuclear Power: A Review. P. Nucl. Energy.
2009, 51, 225-235.
(18) Hippel, F. The Uncertain Future of Nuclear Energy. International Panel on Fissile
Materials. 2010, 1-108. http://fissilematerials.org/library/rr09.pdf
(19) Khajavi, M. N.; Menhaj, M. B.; Suratgar, A. A. A Neural Network Controller for Load
Following Operation of Nuclear Reactors. Annals Nucl. Energy. 2002, 29, 751-760.
(20) Chino, M.; Nakayama, H.; Nagai, H.; Terada, H.; Katata, G.; Yamazawa, H. Preliminary
Estimation of Release Amounts of 131
I and 137
Cs Accidentally Discharged from the
Fukushima Daiichi Nuclear Power Plant into the Atmosphere. J. Nucl. Sci. Technol.
2012, 48, 1129-1134.
(21) Hileman, B. Nuclear Waste Disposal. Environ. Sci. Technol. 1982, 16, 271A–275A.
(22) Paish, O. Small Hydro Power: Technology and Current Status. Renew. Sus. Energy
Reviews. 2002, 6, 537-556.
(23) Anagnostopoulos, J. S.; Papantonis, D. E. Pumping Station Design for a Pumped-
Storage Wind-Hydro Power Plant. Energy Conv. Mang. 2007, 48, 3009-3017.
(24) Bilotta, G. S.; Burnside, N. G.; Gray, J. C.; Orr, H. G. The Effects of Run-of-River
Hydroelectric Power Schemes on Fish Community Composition in Temperate Streams
and Rivers. PLoS One. 2016, 11, 1-15.
(25) Paatero, J. V.; Lund, P. D. Effect of Energy Storage on Variations in Wind Power.
Wind Energ. 2005, 8, 421-441.
(26) Rose, S.; Jaramillo, P.; Small, M. J.; Grosmann, I.; Apt, J. Quantifying the Hurricane
Risk to Offshore Wind Turbines. Proc. Natl. Acad. Sci. 2012, 109, 3247-3252.

41
(27) Kunz, T. H.; Arnett, E. B.; Erickson, W. P.; Hoar, A. R.; Johnson, G. D.; Larkin, R. P.;
Strickland, D. M.; Thresher, R. W.; Tuttle, M. D. Ecological Impacts of Wind Energy
Development on Bats: Questions, Research Needs, and Hypotheses. Front. Ecol.
Environ. 2007, 5, 315-324.
(28) Richardson, D. R.; McNearney, G. M. Wind Energy Systems. Proc. IEEE. 1993, 81,
378-389.
(29) Abbey, C.; Joos, G.; Supercapacitor Energy Storage for Wind Energy Applications.
IEEE Trans. Indust. App. 2007, 43, 769-776.
(30) Zhu, X. G.; Long, S. P.; Ort, D. R. What is the Maximum Efficiency with which
Photosynthesis can Convert Solar Energy into Biomass?. Curr. Op. Biotech. 2008, 19,
153-159.
(31) ASTM International. Standard Test Method for Electrical Performance of Photovoltaic
Cells Using Reference Cells Under Simulated Sunlight.
(32) Becquerel, A. E. Recherches sur les effets de la radiation chimique de la lumiere solaire
au moyen des courants electriques. Comptes Rendus de L´Academie des Sciences. 1839,
9, 145-149.
(33) Adams, W. G.; Day, R. E. The Action of Light on Selenium. Proc. R. Soc. London, Ser.
A. 1877, A25, 113-117.
(34) Einstein, A. Concerning an Heuristic Point of View Toward the Emission and
Transformation of Light. Annalen der Physik. 1905, 17, 132-148.
(35) Chapin, D.; Fuller, C.; Pearson, G. A new silicon p–n junction photocell for converting
solar radiation into electrical power. J Appl Phys. 1954, 25, 676-677.
(36) Fritts, C. On the Fritts Selenium Cell and Batteries. Van Nostrands Eng. Mag. 1885, 32,
388-395.
(37) U.S. Department of Energy. Energy Efficiency and Renewable Energy. The History of
Solar. https://www1.eere.energy.gov/solar/pdfs/solar_timeline.pdf
(38) Green, M. A. Silicon Photovoltaic Modules: A Brief History of the First 50 Years.
Prog. Photovolt: Res. Appl. 2005, 13, 447-455.
(39) Ha, D.; Fang, Z.; Hu, L.; Munday, J. N. Paper-Based Anti-Reflection Coatings for
Photovoltaics. Adv. Energy Mater. 2014, 4, 1-5.
(40) Jung, G. H.; Hong, K.; Dong, W. J.; Kim, S.; Lee, J-L. BCP/Ag/MoO3 Transparent
Cathodes for Organic Photovoltaics. Adv. Energy Mater. 2011, 7, 1023-1028.
(41) Tang, Z.; Tress, W.; Inganas, O. Light Trapping in Thin Film Organic Solar Cells.
Mater. Today. 2014, 17, 389-396.
(42) Gao, J.; Jeong, S.; Lin, F.; Erslev, P. T.; Semonin, O. E.; Luther, J. M.; Beard, M. C.
Improvements in Carrier Transport Properties by Mild Thermal of PBS Quantum Dot
Solar Cells. Appl. Phys. Lett. 2013, 102, 1-5.
(43) Yang, S.; Fu, W.; Zhang, Z.; Chen, H.; Li, C-Z. Recent Advances in Perovskite Solar
Cells: Efficiency, Stability, and Lead-Free Perovskite. J. Mater. Chem. A. 2017, 5,
11462-11482.

42
(44) Kalapathy, U.; Proctor, A.; Shultz, J. A Simple Method for Production of Pure Silica
from Rice Hull Ash. Biores. Tech. 2000, 73, 257-262.
(45) Saga, T. Advances in Crystalline Silicon Solar Cell Technology for Industrial Mass
Production. NPG Asia Mater. 2010, 2, 96-102.
(46) Yin, Z.; Wei, J.; Zheng, Q. Interfacial Materials for Organic Solar Cells: Recent
Advances and Perspectives. Adv. Sci. 2016, 3, 1-37.
(47) Forrest, S. R. The Limits to Organic Photovoltaic Cell Efficiency. MRS Bull. 2005, 30,
28-32.
(48) Xu, T.; Yu, L. How to Design Low Bandgap Polymers for Highly Efficient Organic
Solar Cells. Mater. Today. 2014, 17, 11–15.
(49) Pearson, G. L.; Bardeen, J. Electrical Properties of Pure Silicon and Silicon Alloys
Containing Boron and Phosphorus. Phys. Rev. 1949, 75, 865-883.
(50) Osueke, C. O.; Onyekachi, E. M.; Nwabueze, I. O. Combating Problems with Solar
Power: A Cost Effective Improvement on the Conversion Efficiency of Solar Panels.
Inter. J. Sci. & Eng. Res. 2011, 2, 1-9.
(51) Ohl, R. S. Light-Sensitive Electric Device. U.S. Patent. 1914, 2, 402, 602.
(52) Chapin, D. M.; Fuller, C. S., and Pearson, G. L. A New Silicon P-N Junction Photocell
for Converting Solar Radiation into Electrical Power. J. Appl. Phys. 1954, 25, 676-677.
(53) Blakers, A. W.; Green, M. A. 20% Efficiency Silicon Solar Cells. Appl. Phys. Lett.
1986, 48, 215-217.
(54) Yoshikawa, K.; Kawasaki, H.; Yoshida, W.; Irie, T.; Konishi, K.; Nakano, K.; Uto, T.;
Adachi, D.; Kanematsu, M.; Uzu, H.; Yamamoto, K. Silicon heterojunction solar cell
with interdigitated back contacts for a photoconversion efficiency over 26%. Nature Energy 2017, 2, 1-8.
(55) Davis, J. R.; Rohatgi, A.; Hopkins, R. H.; Blais, P. D.; Rai-Choudhury, P.; McCormick,
J. R.; MollenKopF, H. C. Impurities in Silicon Solar Cells. IEEE Trans. Elec. Dev.
1980, 27, 677-687.
(56) Fujiwara, K.; Pan, W.; Usami,N.; Sawada, K.; Tokairin, M.; Nose, Y.; Nomura, A.;
Shishido, T.; Nakajima, K. Growth of Structure-Controlled Polycrystalline Silicon Ingots
for Solar Cells by Casting. Acta Mater. 2006, 54, 3191-3197.
(57) Guo, Y.; Wang, Q.; Kawazoe, Y.; Jena, P. A New Silicon Phase with Direct Band Gap
and Novel Optoelectronic Properties. Sci. Rep. 2015, 5, 1-7.
(58) Sokolov, A. P.; Shebanin, A. P., Golikova, O. A.; Mezdrogina, M. M. Structural Order
in Amorphous Silicon and Its Alloys: Ramen Spectra and Optical Gap. J. Non-Cryst.
Solids. 2017, 471, 490-495.
(59) Schubert, M. B.; Werner, J. H. Flexible Solar Cells for Clothing. Mater. Today. 2006,
9, 42-50.
(60) Rech, B.; Wagner, H. Potential of Amorphous Silicon for Solar Cells. Appl. Phys. A.
1999, 69, 155-167.

43
(61) Sai, H.; Matsui, T.; Koida, T.; Matsubara, K.; Kondo, M.; Sugiyama, S.; Katayama, H.;
Takeuchi, Y.; Yoshida, I. Triple-Junction Thin-Film Silicon Solar Cell Fabricated on
Periodically Textured Substrate with a Stabilized Efficiency of 13.6%. Appl. Phys. Lett.
2015, 106, 1-4.
(62) Meillaud, F.; Coccard, M.; Bugnon, M.; Despeisse, M.; Hanni, S.; Haug, F.-J.; Persoz,
J.; Schuttauf, J-W.; Stuckelberger, M.; Ballif, C. Recent Advances and Remaining
Challenges in Thin-Film Silicon Photovoltaic Technology. Mater. Today. 2015, 18¸
378-384.
(63) Lalitha, S.; Karazhanov, S. Z.; Ravindran, P.; Senthilarasu, S.; Sathyamoorthy, R.;
Janabergenov, J. Electronic Structure, Structural and Optical Properties of Thermally
Evaporated CdTe Thin Films. Phys. B: Condens. Matter. 2007, 387, 227-238.
(64) Fonthal, G.; Tirado-Mejia, L.; Marin-Hurtado, J. I.; Ariza-Calderon, H.; Mendoza-
Alvarez, J. G. Termperature Dependence of the Band Gap Energy of Crystalline CdTe.
J. Phys. Chem. Solids. 2000, 61, 579-583.
(65) Gloeckler, M.; Sankin, I.; Zhao, Z. CdTe Solar Cells at the Threshold to 20%
Efficiency. IEEE J. Photovolt. 2013, 3, 1389-1393.
(66) Godt, J.; Scheidig, F.; Grosse-Siestrup, C.; Esche, V.; Brandenburg, P.; Reich, A.;
Groneberg, D. A. The Toxicity of Cadmium and Resulting Hazards for Human Health.
J. Occ. Med. Toxicol. 2006, 1, 1-6.
(67) Vij, P.; Hardej, D. Evaluation of Tellurium Toxicity in Transformed and Non-
Transformed Human Colon Cells. Eviron. Toxicol. Pharmacol. 2012, 34, 768-782.
(68) Mohamed, H. A. Dependence of Efficiency of Thin-Film CdS/CdTe Solar Cell on
Optical and Recombination Losses. J. Appl. Phys. 2013, 113, 1-6.
(69) Ramanujam, J.; Singh, U. P. Coper Indium Gallium Selenide Based Solar Cells- A
Review. Energy Environ. Sci. 2017, 10, 1306-1319.
(70) Jackson, P.; Hariskos, D.; Wuerz, R.; Kiowski, O.; Bauer, A.; Friedlmeier, T.; Powalla,
M. Properities of Cu(In,Ga)Se2 Solar Cells with New Record Efficiencies up to 21.7%.
Phys. Status Solidi RRL. 2015, 1, 28-31.
(71) Singh, P.; Ravindra, N. M. Temperature Dependence of Solar Cell Performance-An
Analysis. Sol. Energy Mater. Sol. Cells. 2012, 101, 36-45.
(72) Chiang, S. Y.; Pearson, G. L. Properties of Vacancy defects in GaAs Single Crystals. J.
Appl. Phys. 1975, 46, 2986-2991.
(73) Wang, X.; Khan, M. R.; Gray, J. L.; Alam, A.; Lundstrom, M. S. Design of GaAs Solar
Cells Operating Close to the Shockley-Queisser Limit. IEEE J. Photovolt. 2013, 3, 737-
744.
(74) Kurtz, S. R.; Allerman, A. A.; Jones, E. D.; Gee, J. M.; Banas, J. J.; Hammons, B. E.
InGaAsN Solar Cells with 1.0 eV Band Gap, Lattice Matched to GaAs. Appl. Phys. Lett.
1999, 74, 729-731.
(75) Moon, S.; Kim, K.; Kim, Y.; Heo, J.; Lee, J. Highly Efficient Single-Junction GaAs
Thin-Film Solar Cell on Flexible Substrate. Sci. Rep. 2016, 6, 1-6.

44
(76) Bauhuis, G. J.; Mulder, P.; Haverkamp, E. J.; Huijben, J. C. C. M.; Schermer, J. J.
26.1% Thin-Film GaAs Solar Cell using Epitaxial Lift-Off. Sol. Energy Mater. Sol.
Cells. 2009, 93, 1488-1491.
(77) Ratnaike, R. Acute and Chronic Arsenic Toxicity. Postgrad Med. J. 2003, 79, 391-
396.
(78) Burton, J. D.; Culkin, F.; Riley, J. P. The Abundances of Gallium and Germanium in
Terestrial Materials. Geochim. Cosmochim. Acta. 1959, 16, 151-180.
(79) Chamberlain, G. A. Organic Solar Cells: A Review. Sol. Cells. 1983, 8, 47-83.
(80) Scharber, M. C.; Sariciftci, N. S. Effiency of Bulk-Heterojunction Organic Solar Cells.
Prog. Poly. Sci. 2013, 38, 1929-1940.
(81) Yeh, N.; Yeh, P. Organic Solar Cells: Their Developments and Potentials. Renew. Sust.
Energ. Rev. 2013, 21, 421-431.
(82) Qin, P.; Yang, X.; Chen, R.; Sun, L. Influence of π-Conjugation Units in Organic Dyes
for Dye-Sensitized Solar Cells. J. Phys. Chem. C. 2007, 111, 1853-1860.
(83) Facchetti, A. π-Conjugated Polymers for Organic Electronics and Photovoltaic Cell
Applications. Chem. Mater. 2011, 23, 733-758.
(84) Spanggaard, H.; Krebs, F. C. A Brief History of the Development of Organic and
Polymeric Photovoltaics. Sol. Energy Mater. Sol. Cells. 2004, 83, 125-146.
(85) Kallmann, H.; Pope, M. Photovoltaic Effect in Organic Crystals. J. Chem. Phys.
1959, 30, 585-586.
(86) C. W. Tang. 1986. Two‐layer organic photovoltaic cell. Appl. Phys. Lett. 1986, 48,
183-185.
(87) Yu, G.; Gao, J.; Hummelen, J. C.; Wudl, F.; Heeger A. J. Polymer Photovoltaic Cells:
Enhanced Efficiencies via a Network of Internal Donor-Acceptor Heterojunctions.
Science. 1995, 270, 1789-1791.
(88) Chen, J.-D.; Cui, C.; Li, Y.-Q.; Zhuo, L.; Ou, Q.-D.; Li, C.; Li, Y.; Tang, J.-X. Single
Junction Polymer Solar Cells Exceeding 10% Power Conversion Efficiency. Adv.
Mater. 2015, 27, 1035-1041.
(89) Bredas, J.-L.; Norton, J. E.; Cornil, J.; Coropceanu, V. Molecular Understanding of
Organic Solar Cells: The Challenges. Acc. Chem. Res. 2009, 42, 1691-1699.
(90) Jana, B.; Ghosh, A.; Patra, A. Photon Harvesting in Conjugated Polymer-Based
Functional Nanoparticles. J. Phys. Chem. Lett. 2017, 8, 4608-4620.
(91) Durrant, J. R. Molecular Approaches to Solar Energy Conversion: The Energetic Cost of
Charge Separation from Molecular-Excited States. Philios. Trans. R. Soc. London, Ser.
A. 2013, 371, 1-10.
(92) Neher, D.; Kniepert, J.; Elimelech, A.; Koster, L. J. A. A New Figure of Merit for
Organic Solar Cells with Transport-Limited Photocurrents. Sci. Rep. 2016, 6, 1-9.

45
(93) Van Franeker, J. J.; Voorthuijzen, W. P.; Gorter, H.; Hendriks, K. H.; Janssen, R. A. J.;
Hadipour, A.; Andriessen, R.; Galagan, Y. All-Solution-Processed Organic Solar Cells
with Conventional Architecture. Sol. Energy Mater. Sol. Cells. 2013, 117, 267-272.
(94) Sondergaard, R.; Hoel, M.; Angmo, D.; Larsen-Olsen, T. T.; Krebs, F. C. Roll-to-Roll
Fabrication of Polymer Solar Cells. Mater. Today. 2012, 1, 36-49.
(95) Hoth, C. N.; Schilinsky, P.; Choulis, S. A.; Brabec, C. J. Printing Highly Efficient
Organic Solar Cells. Nano Lett. 2008, 8, 2806-2813.
(96) He, C.; He, Q.; He, Y.; Li, Y.; Bai, F.; Yang, C.; Ding, Y.; Wang L.; Ye, J. Organic
Solar Cells Based on the Spin-Coated Blend Films of TPA-th-TPA and PCBM. Sol.
Energy Mater. Sol. Cells. 2006, 90, 1815-1827.
(97) Kalowekamo, J.; Baker, E. Estimating the Manufacturing Cost of Purely Organic Solar
Cells. Sol. Energy. 2009, 8, 1224-1231.
(98) Apaydin, D. H.; Yildiz, D. E.; Cirpan, A.; Toppare, L. Optimizing the Organic Solar
Cell Efficiency: Role of the Active Layer Thickness. Sol. Energy Mater. Sol. Cells.
2013, 113, 100-105.
(99) Nam, Y. M.; Huh, J.; Jo, W. H. Optimization of Thickness and Morphology of Active
Layer for High Performanc of Bulk-Heterojunction Organic Solar Cells. Sol. Energy
Mater. Sol. Cells. 2010, 94, 1118-1124.
(100) Kirchartz, T.; Agostinelli, T.; Campoy-Quiles, M.; Gong, W.; Nelson, J.
Understanding the Thickness-Dependent Performance of Organic Bulk Heterojunction
Solar Cells: The Influence of Mobility, Lifetime, and Space Charge. J. Phys. Chem. Lett.
2012, 3, 3470-3475.
(101) Sah, C-T.; Yamakawa, K. A.; Lutwack, R. Effect of Thickness on Silicon Solar Cell
Efficiency. IEEE Trans. Electron Devices. 1982, 29, 903-908.
(102) Zaki, A. A.; El-Amin, A. A. Effect of Cell Thickness on the Electrical and Optical
Properties of Thin Film Silicon Solar Cell. Opt. Laser Tech. 2017, 97, 71-76.
(103) Liao, H-C.; Ho, C-C.; Chang, C-Y.; Jao, M-H.; Darling, S. B.; Su, W-F. Additives for
Morphology Control in High-Efficiency Organic Solar Cells. Mater. Today. 2013, 16,
326-336.
(104) Kim, Y.; Choulis, S. A.; Nelson, J.; Bradley, D. D. C. Device Annealing Effect in
Organic Solar Cells with Blends of Regioregular Poly(3-heylthiophene) and Soluble
Fullerene. Appl. Phys. Lett. 2005, 86, 1-3.
(105) Tamai, Y.; Fan, Y.; Kim, V. O.; Ziabrev, K.; Rao, A.; Barlow, S.; Marder, S. R.;
Friend, R. H.; Menke, M. S. Ultrafast Long-Range Charge Separation in Nonfullerene
Organic Solar Cells. ACS Nano. 2017, 11, 12473-12481.
(106) Gu, K. L.; Zhou, Y.; Gu, X.; Yan, H.; Diao, Y.; Kurosawa, T.; Ganapathysubramanian,
B.; Toney, M. F.; Bao, Z. Tuning Domain Size and Crystallinity in Isoindigo/PCBM
Organic Solar Cells via Solution Shearing. J. Org. Elec. 2017, 40, 79-87.
(107) Huang, Z.; Cheng, L.; Wu, B.; Wu, X. The Study of Optical and Electrical Properties
of Solar Cells with Oblique Incidence. IEEE Phot. Tech. Lett. 2016, 28, 2047-2049.

46
(108) Zhang, S.; Ye, L.; Zhang, H.; Hou, J. Green-Solvent-Processable Organic Solar Cells.
Mater. Today. 2016, 19, 533-543.
(109) Zeigler, D. F.; Chen, K-S.; Yip, H-Y.; Zhang, Y.; Jen, A. K.-Y. Tunable Light-
Harvesting Polymers Containing Embedded Dipolar Chromophores for Polymer Solar
Cell Applications. J. Poly. Sci. A. 2012, 50, 1362-1373.
(110) Tang, A.; Zhan, C.; Yao, J. Comparative Study of Effects of Terminal Non-Alkyl
Aromatic and Alkyl Groups on Small-Molecule Solar Cell Performance. Adv. Energ.
Mater. 2015, 5, 1-9.
(111) Xu, T.; Yu, L. How to Design Low Bandgap Polymers for Highly Efficient Organic
Solar Cells. Mater. Today. 2014, 17, 11-15.
(112) Kim, J-S.; Kim, J-H.; Lee, W.; Yu, H.; Kim, H. J.; Song, I.; Shin, M.; Oh, J. H.; Jeong,
U.; Kim, T-S.; Kim, B. J. Tuning Mechanical and Optoelectronical Properties of Poly(3-
hexylthiophene) through Systematic Regioregularity Control. Macromolecules. 2015, 48,
4339-4346.
(113) Goldey, M. B.; Reid, D.; Pablo, J.; Galli, G. Planarity and Multiple Components
Promote Organic Photovoltaic Efficiency by Improving Electronic Transport. Phys.
Chem. Chem. Phys. 2016, 18, 31388-31399.
(114) Lu, H-I.; Lu, C-W.; Lee, Y-C.; Lin, H-W.; Lin, L-Y.; Lin, F.; Chang, J-H.; Wu, C-I.;
Wong, K-T. New Molecular Donors with Dithienopyrrole as the Electron-Donating
Group for Efficient Small-Molecule Organic Solar Cells. Chem. Mater. 2014, 26, 4361-
4367.
(115) Crossley, D. L.; Cade, I. A.; Clark, E. R.; Escande, A.; Humphries, M. J.; King, S. M.;
Vitorica-Yrezabel, I.; Ingleson, M. J.; Turner, M. L. Enhancing Electron Affinity and
Tuning Band Gap in Donor-Acceptor Organic Semiconductors by Benzothiadiazole
Directed C-H Borylation. Chem. Sci. 2015, 6, 5144-5151.
(116) Zhou, Y.; Yan, Q.; Zheng, Y-Q.; Wang, J-Y.; Zhao, D.; Pei, J. New Polymer
Acceptors for Organic Solar Cells: The Effect of Regio-Regularity and Device
Configuration. J. Mater. Chem. A. 2013, 1, 6609-6613.
(117) Vezie, M. S.; Few, S.; Meager, I.; Pieridou, G.; Dorling, B.; Ashraf, R.; Goni, A. R.;
Bronstein, H.; McCulloch, I.; Hayes S. C.; Campoy-Quiles, M.; Nelson, J. Exploring the
Origin of High Optical Absorption in Conjugated Polymers. Nature Mater. 2016, 15,
746-753.
(118) Varotto, A.; Nam, C-Y.; Radivojevic, I.; Tome, J. P. C.; Cavaleiro, J. A. S.; Black, C.
T.; Drain, C. M. Phthalocyanine Blends Improve Bulk Heterojunction Solar Cells. J.
Am. Chem. Soc. 2010, 132, 2552-2554.
(119) Ebenhoch, B.; Thomson, S. A. J.; Genevicius, K.; Juska, G.; Samuel, I. D. W. Charge
Carrier Mobility of the Organic Photovoltaic Materials PTB7 and PC71BM and its
Influence on Device Performance. Org. Elec. 2015, 22, 62-68.
(120) Tamai, Y.; Ohkita, H.; Benten, H.; Ito, S.; Exciton Diffusion in Conjugated Polymers:
From Fundamental Understanding to Improvement in Photovoltaic Conversion
Efficiency. J. Phys. Chem. Lett. 2015, 6, 3417-3428.

47
(121) Kim, S. H.; Somorjai, G. A.; Surface Science of Single-Site Heterogeneous Olefin
Polymerization Catalysts. Proc. Nat. Acad. Sci. USA. 2006, 103, 15289-15294.
(122) Bryan, Z. J.; McNeil, A. J. Conjugated Polymer Synthesis via Catalyst-Transfer
Polycondensation (CTP): Mechanism, Scope, and Applications. Macromolecules. 2013,
46, 8395-8405.
(123) Tsai, C-H.; Fortney, A.; Qiu, Y.; Gil, R. R.; Yaron, D.; Kowalewski, T.; Noonan, K. J.
T. Conjugated Polymers with Repeated Sequences of Group 16 Heterocycles
Synthesized Through Catalyst-Transfer Polycondensation. J. Am. Chem. Soc. 2016, 138,
6798-6804.
(124) Sontag, S. K.; Marshall, N.; Locklin, J. Formation of Conjugated Polymer Brushes by
Surface-Initiated Catalyst-Transfer Polycondensation. Chem. Comm. 2009, 23, 3354-
3356.
(125) Cheng, P.; Zhan, X. Stability of Organic Solar Cells: Challenges and Strategies.
Chem. Soc. Rev. 2016, 45, 2544-2582.
(126) Turkovic, V.; Engmann, S.; Tsierkezos, N.; Hoppe, H; Madsen, M.; Rubahn, H-G.;
Ritter, U.; Gobsch, G. Long-Term Stabilization of Organic Solar Cells Using UV
Absorbers. J. Phys. D: Appl. Phys. 2016, 49, 1-7.
(127) Leblebici, S. Y.; Chen, T. L.; Olalde-Velasco, P.; Yang, W.; Ma, B. Reducing Exciton
Binding Energy by Increasing Thin Film Permittivity: An Effective Approach to Enhance
Exciton Separation Efficiency in Organic Solar Cells. ACS Appl. Energy Interfaces.
2013, 5, 10105-10110.
(128) Wagenpfahl, A. Mobility Dependent Recombination Models for Organic Solar Cells.
J. Phys.: Condens. Matter. 2017, 29, 1-21.
(129) Bagher, A. M. Comparison of Organic Solar Cells and Inorganic Solar Cells. Int. J.
Renew. Sus. Energy. 2014, 3, 53-58.
(130) Proctor, C. M.; Kuik, M.; Nguyen, T-Q. Charge Carrier Recombination in Organic
Solar Cells. Prog. Poly. Sci. 2013, 38, 1941-1960.
(131) Stegemann, B.; Kegel, J.; Mews, M.; Conrad, E.; Korte, L.; Sturzebecher, Uta.;
Angermann, H. Evolution of the Charge Carrier Lifetime Characteristics in Crystalline
Silicon Wafers During Processing of Heterojunction Solar Cells. Energy Procedia.
2014, 55, 219-228.
(132) Jain, V.; Rajbongshi, B. K.; Mallajosyula, A. T.; Bhattacharjya, G.; Lyer, S. S. K.;
Ramanthan, G. Photovoltaic Effect in Single-Layer Organic Solar Cell Devices
Fabricated with Two New Imidazolin-5-one Molecules. Sol. EnergyMater. Sol. Cells.
2008, 92, 1043-1046.
(133) Gommans, H. H. P.; Cheyns, D.; Aernouts, T.; Girotto, C.; Poortmans, J.; Heremans,
P. Electro-Optical Study of Subphthalocyanine in a Bilayer Organic Solar Cell. Adv.
Func. Mater. 2007, 17, 2653-2658.
(134) Rim, S-B. Effect of Molecular Packing on the Exciton Diffusion Length in Organic
Solar Cells. Appl. Phys. Lett. 2007, 91, 1-3.
48
(135) Cuiffi, J.; Benanti, T.; Nam, W. J.; Fonash, S. Modeling of Bulk and Bilayer Organic
Heterojunction Solar Cells. Appl. Phys. Lett. 2010, 96, 1-3.
(136) Nelson, J. Polymer:Fullerene Bulk Heterojunction Solar Cells. Mater. Today. 2011,
14, 462-470.
(137) Eftaiha, A. F.; Sun, J-P.; Hill, I. G.; Welch, G. C. Recent Advances of Non-Fullerene,
Small Molecular Acceptors for Solution Proessed Bulk Heterojunction Solar Cells. J.
Mater. Chem. A. 2014, 2, 1201-1213.
(138) Gerischer, H.; Michel-Beyerle, M.; Rebentrost, E.; Tributsch, H. (1968). Sensitization
of Charge-Injection into Semiconductors with Large Band Gap. Electrochim. Acta.
1968, 13, 1509–1515.
(139) O'Regan, B.; Grätzel, M. A low-cost, high-efficiency solar cell based on dye-
sensitized colloidal TiO2 films. Nature. 1991, 353, 737–740.
(140) Bai, Y.; Cao, Y.; Zhang, J.; Wang, M.; Li, R.; Wang, P.; Zakeeruddin, S. M.; Grätzel,
M. High-performance dye-sensitized solar cells based on solvent-free electrolytes
produced from eutectic melts. Nature Materials. 2008, 7, 626–630.
(141) Briscoe, J.; Dunn, S. Dye-Sensitized Solar Cells: The Future of Using Earth-Abundant
Elements in Counter Electrodes Dye-Sensitized Solar Cells. Adv. Mater. 2016, 28,
3802-3813.
(142) Wu, J.; Lan, Z.; Lin, J.; Huang, M.; Huang, Y.; Fan, L.; Luo, G. Electrolytes in Dye-
Sensitized Solar Cells. Chem. Rev. 2015, 115, 2136-2173.
(143) Burschka, J.; Pellet, N.; Moon, S.J.; Humphry-Baker, R.; Gao, P.; Nazeeruddin, M. K.;
Gratzel, M. Sequential deposition as a route to high-performance perovskite-sensitized
solar cells. Nature. 2013, 499, 316-319.
(144) Ninsonti, H.; Chomkitichai, W.; Baba, A.; Wetchakun, N.; Kangwansupamonkon, W.;
Phanichphant, S.; Kazunari, S.; Kato, K.; Kaneko, F. Au-Loaded Titanium Dioxide
Nanoparticles Synthesized by Modified Sol-Gel/Impregnation Methods and Their
Application to Dye-Sensitized Solar Cells. Int. J. Photoenergy. 2014, 1, 1-8.
(145) Choi, M-C.; Kim, Y.; Ha, C-S. Polymers for Flexible Displays: From Material
Selection to Device Applications. Prog. Poly. Sci. 2008, 33, 581-630.
(146) Neville, R. G.; Mahoney, J. W.; MacDowall, K. R. Novel Thermally Stable and
Chemically Resistant Epoxy Polymers derived from Phenylene Oxides. Appl. Poly. Sci.
1968, 12, 607-618.
(147) Clark, E. S.; Scott, L. S. Superdrawn Crystalline Polmers: A New Class of High-
Strength Fiber. Poly. Eng. Sci. 1974, 14, 682-686.
(148) Mullekom, H. A. M.; Vekemans, J. A. J. M.; Havinga, E. E.; Meijer, E. W.
Developments in the Chemistry and Band Gap Engineering of Donor-Acceptor
Substituted Conjugated Polymers. Mater. Sci. Eng. R. 2001, 32, 1-40.
(149) Kleinschmidt, A.; Root, S. E.; Lipomi, D. J. Poly(3-hexylthiophene) (P3HT): Fruit Fly
or Outlier in Organic Solar Cell Research. J. Mater. Chem. A. 2017, 5, 11396-11400.

49
(150) Rahimi, K.; Botiz, I.; Agumba, J. O.; Motamen, S.; Stingelin, N.; Reiter, G. Light
Absorption of poly(3-hexylthiophene) Single Crystals. Roy. Soc. Chem. Adv. 2014, 4,
11121-11123.
(151) Geiser, A.; Fan, B.; Benmansour, H.; Castro, F.; Heier, J.; Keller, B.; Mayerhofer, K.
E.; Nuesch, F.; Hany, R. Poly(3-hexylthiophene)/C60 heterojunction solar cells:
Implication of Morphology on Performance and Ambipoler Charge Collection. Sol.
Energy Mater. Sol. Cells. 2008, 92, 464-473.
(152) Woo, C. H.; Thompson, B. C.; Kim, B. J.; Toney, M. F.; Frechet, J. M. J. The
Influence of Poly(3-hexylthiophene) Regioregularity on Fullerene-Composite Solar Cell
Performance. J. Am. Chem. Soc. 2008, 130, 16324-16329.
(153) Zhang, Y.; Cao, K.; Zhu, X.; Li, X.; Qiao, X.; Tu, G.; Zhang, B.; Huang, D.; Shen, Y.;
Wang, M.; Effect of the Molecular Weight of Poly(3-hexylthiophene) on the
Performance of Solid-State Dye-Sensitized Solar Cells. Roy. Soc. Chem. Adv. 2013, 3,
14037-14043.
(154) Dkhissi, A.; Ouhib, F.; Chaalane, A.; Hiorns, R. C.; Dagron-Lartigau, C.; Iratcabal, P.;
Desbrieres, J.; Pouchan, C. Theoretical and Experimental Study of Low Band Gap
Polymers for Organic Solar Cells. Phys. Chem. Chem. Phys. 2012, 14, 5613-5619.
(155) Acevedo-Pena, P.; Baray-Calderon, A.; Hu, H.; Gonzalez, I.; Ugalde-Saldivar, V. M.
Measurements of HOMO-LUMO Levels of Poly(3-hexylthiophene) Thin Films by a
Simple Electrochemical Method. J. Sol. State Electrochem. 2017, 21, 2407-2414.
(156) Laquindanum, J. G.; Katz, H. E.; Lovinger, A. J.; Dodabalapur, A. Benzodithiophene
Rings as Semiconductor Building Blocks. Adv. Mater. Com. 1997, 9, 36-39.
(157) Chuang, H-Y.; Hsu, S. L-C.; Le, P-I.; Lee, J-F.; Huang, S-Y.; Lin, S-W.; Lin, P-Y.
Synthesis and Properties of a New Conjugated Polymer Containing Benzodithiophene for
Polymer Solar Cells. Poly. Bull. 2014, 71, 1117-1130.
(158) Jang, S.-Y.; Kim, I-B.; Kim, J.; Khim, D.; Jung, E.; Kang, B.; Lim, B.; Kim, Y-A.;
Jang, Y-H.; Cho, K.; Kim, D-Y. New Donor-Donor Type Copolymers with Rigid and
Coplanar Structures for High-Mobility Organic Field-Effect Transistors. Chem. Mater.
Comm. 2014, 26, 6907-6910.
(159) Brabec, C. J.; Heeney, M.; McCulloch, I.; Nelson, J. Influence of Blend
Microstructure on Bulk Heterojunction Organic Photovoltaic Performance. Chem. Soc.
Rev. 2011, 40, 1185-1199.
(160) Lu, L.; Yu, L. Understanding Low Bandgap Polymer PTB7 and Optimizing Polymer
Solar Cells Based on it. Adv. Mater. 2014, 26, 4413-4430.
(161) Liu, X.; Shen, W.; He, R.; Luo, Y.; Li, M. Strategy to Modulate the Electron-Rich
Units in Donor-Acceptor Copolymers for Improvements of Organic Photovoltaics. J.
Phys. Chem. C. 2014, 118, 17266-17278.
(162) Chen, H-Y.; Hou, J.; Zhang, S.; Liang, Y.; Yang, G.; Yang, Y.; Yu, Y.; Wu, Y.; Li, G.
Polymer Solar Cells with Enhanced Open-Circuit Voltage and Efficiency. Nature
Photonics. 2009, 3, 649-653.

50
(163) Li, Y.; Cui, J.; Zhao, J.; Liu, J.; Song, P.; Ma, F.; Effect of Electronic Acceptor
Segments on Photophysical Properties of Low-Band-Gap Ambipolar Polymers. Sci.
World. J. 2013, 1, 1-8.
(164) Sendur, M.; Balan, A.; Baran, D.; Karabay, B.; Toppare, L. Combination of Donor
Characters in a Donor-Acceptor-Donor (DAD) Type Polymer Containing
Benzothiadiazole as the Acceptor Unit. Org. Elec. 2010, 11, 1877-1885.
(165) Golovnin, L.; Bakulin, A. A.; Zapunidy, S. A.; Nechvolodova, E. M.; Paraschuk, D. Y.
Dramatic Enhancement of Photo-Oxidation Stability of a Conjugated Polymer in Blends
with Organic Acceptor. Appl. Phys. Lett. 2008, 92, 1-3.
(166) Schubet, M.; Preis, E.; Blakesley, J. C.; Pingel, P.; Scherf, U.; Neher, D. Mobility
Relaxation and Electron Trapping in a Donor/Acceptor Copolymer. Phys. Rev. B. 2013,
87, 1-12.
(167) Wu, F.; Chen, S.; Chen, L.; Chen, Y. Tuning Joint Sequence for Donor-Acceptor
Polymers Based on Fluorinated Benzothiadiazole with Thiophene/Furan Bridecakes.
Polymer. 2015, 78, 154-160.
(168) Lee, C-H.; Lai, Y-Y.; Hsu, J-Y.; Huang, P-K.; Cheng, Y-C. Side-Chain Modulation of
Dithienofluorene-Based Copolymers to Achieve High Field-Effect Mobilities. Chem.
Sci. 2017, 2942-2951.
(169) Li, Y.; Fu, Y.; Tong, H.; Xie, Z.; Wang, L. Effect of Side-Chain Positions on
Morphology and Photovoltaic Properties of Phenazine-Based Donor-Acceptor
Copolymers. J. Polym. Sci. A. 2013, 51, 2910-2918.
(170) Morse, G. E.; Tournebize, A.; Rivaton, A.; Chasse, T.; Taviot-Gueho, C.; Blouin, N.;
Lozman, O. R.; Tierney, S. The effect of Polymer Solubilizing Side-Chains on Solar Cell
Stability. Phys. Chem. Chem. Phys. 2015, 17, 11884-11897.
(171) Gibson, G. L.; Seferos, D. S. “Heavy-Atom” Donor-Acceptor Conjugated Polymers.
Chem. Phys. 2014, 215, 811-823.
(172) Vazquez, R. J.; Kim, H.; Kobilka, B. M.; Hale, B. J.; Jeffries-EL, M.; Zimmerman, P.;
Goodson, T. Evaluating the Efect of Heteroatoms on the Photophysical Properties of
Donor-Acceptor Conjugated Polymers Based on 2,6-Di(thiophen-2-yl)benzo[1,2-b:4,5-
b’]difuran: Two-Photon Cross-Section and Ultrafast Time-Resolved Spectroscopy. J.
Phys. Chem. C. 2017, 121, 14382-14392.
(173) Wood, S.; Kim, J-H.; Wade, J.; Park, J. B.; Hwang, D-H.; Kim, J-S. Systematic
Control of Heteroatoms in Donor-Acceptor Copolymers and its Effects on Molecular
Conformation and Photovoltaic Performance. J. Mater. Chem. C. 2016, 4, 7966-7978.
(174) Cansu-Ergun, E. G.; Akbayrak, M.; Akdag, A.; Onal, A. M. Effect of Thiophene Units
on the Properties of Donor Acceptor Type Monomers and Polymers Bearing Thiophene-
Benzothiadiazole-Scaffolds. J. Electrochem. Soc. 2016, 163, 153-158.
(175) Zhou, H.; Yang, L.; Stoneking, S.; You, W. A Weak Donor-Strong Acceptor Strategy
to Design Ideal Polymers for Organic Solar Cells. ACS Appl. Mater. Interfaces. 2010,
2, 1377-1383.

51
(176) Biniek, L.; Schroeder, B. C.; Nielsen, C. B.; McCulloch, I. Recent Advances in High
Mobility Donor-Acceptor Semiconducting Polymers. J. Mater. Chem. 2012, 22, 14803-
14813.
(177) Zong, K.; Reynolds, J. R. 3,4-Alkylenedioxypyrroles: Functionalized Derivatives as
Monomers for New Electron-Rich Conducting and Electroactive Polymers. J. Org.
Chem. 2001, 66, 6873-6882.
(178) Wang, C.; Mueller, C. J.; Gann, E.; Liu, A. C. Y.; Thelakkat, M.; McNeill, C. R.
EDOT-diketopyrrolopyrrole Copolymers for Polymer Solar Cells. J. Mater. Chem. A.
2016, 4, 3477-3486.
(179) Bundgaard, E.; Krebs, F. C. Low band gap polymers for organic photovoltaics. Sol.
Energy Mater. Sol. Cells. 2007, 91, 954-985.
(180) Dennler, G.; Scharber, M. C.; Brabec, C. J. Polymer-Fullerene Bulk-Heterojunction
Solar Cells. Adv. Mater. 2009, 21, 1-16.
(181) Du, C.; Li, C.; Li, W.; Chen, X.; Bo, Z.; Veit, C.; Ma, Z.; Wuerfel, U.; Zhu, H.; Hu,
W.; Zhang, F. 9-Alkylidene-9H-Fluorene-Containing Polymer for High-Efficiency
Polymer Solar Cells. Macromolecules. 2011, 44, 7617-7624.
(182) Kang, T. E.; Kim, T.; Wang, C.; Yoo, S.; Kim, B. J. Poly(benzodithiophene)
Homopolymer for High-Performance Polymer Solar Cells with Open-Circuit Voltage of
Near 1 V: A Superior Candidate to Substitute for Poly(3-hexylthiophene) as Wide
Bandgap Polymer. Chem. Mater. 2015, 27, 2653-258.
(183) Kastinen, T.; Niskanen, M.; Risko, C.; Cramariuc, O.; Hukka, T. I. Intrinsic Properties
of Two Benzodithiophene-Based Donor-Acceptor Copolymers Used in Organic Solar
Cells: A Quantum-Chemical Approach. J. Phys. Chem. A. 2016, 120, 1051-1064.
(184) Holliday, S.; Li, Y.; Luscombe, C. K. Recent Advances in High Performance Donor-
Acceptor Polymers for Organic Photovoltaics. Prog. Poly. Sci. 2017, 70, 34-51.
(185) Mola, G. T.; Abera, N. Correlation between LUMO offset of Donor/Acceptor
Molecules to an Open Circuit Voltage in Bulk Heterojunction Solar Cell. Phys. B:
Condens. Matter. 2014, 445, 56-59.
(186) Yuen, J. D.; Fan, J.; Seifter, J.; Lim, B.; Hufschmid, R.; Heeger, A. J.; Wudl, F. High
Performance Weak Donor-Acceptor Polymers in Thin Film Transistors: Effect of the
Acceptor on Electronic Properties, Ambipolar Conductivity, Mobility, and Thermal
Stability. J. Am. Chem. Soc. 2011, 133, 20799-20807.
(187) Lin, H-W.; Lee, W-Y.; Chen, W-C. Selenophene-DPP Donor-Acceptor Conjugatd
Polymer for High Performance Ambipolar Field Effect Transistor and Nonvolatile
Memory Applications. J. Am. Chem. Soc. 2012, 22, 2120-2128.
(188) Sonar, P.; Ng, G-M.; Lin, T. T.; Dodabalapur, A.; Chen, Z-K. Solution Processable
Low Bandgap Diketopyrrolopyrrole (DPP) Based Derivatives: Novel Acceptors for
Organic Solar Cells. J. Mater. Chem. 2010, 20, 3626-3636.
(189) Li, W.; Hendriks, K. H.; Wienk, M. M.; Janssen, R. A. J. Diketopyrrolopyrrole
Polymers for Organic Solar Cells. Acc. Chem. Res. 2016, 49, 78-85.

52
(190) Stalder, R.; Mei, J.; Graham, K. R.; Estrada, L. A.; Reynolds, J. R. Isoindigo, a
Versatile Electron-Deficient Unit for High-Performance Organic Electronics. Chem.
Mater. 2014, 26, 664-678.
(191) Wang, C.; Zhao, B.; Cao, Z.; Shen, P.; Tan, Z.; Li, X.; Tan, S. Enhanced Power
Conversion Power Conversion Efficiencies in Bulk Heterojunction Solar Cells Based on
Conjugated Polymer with Isoindigo Side Chain. Chem. Commun. 2013, 49, 3857-3859.
(192) Liang, Y.; Xu, Z.; Xia, J.; Tsai, S. T.; Wu, Y.; Li, G.; Ray, C.; Yu, L. For the Bright
Future-Bulk Heterojunction Polmer Solar Cells with Power Conversion Efficiency of
7.4%. Adv. Energy. Mater. Comm. 2010, 22, 135-138.
(193) Liu, J.; Li, X.; Zhang, S.; Ren, X.; Cheng, J.; Zhu, L.; Zhang, D.; Huo, L.; Hou, J.;
Choy, W. C. H. Synergic effects of randomly aligned SWCNT mesh and self-assembled
molecule layer for high-performance, low-bandgap, polymer solar cells with fast charge
extraction. Adv. Mater. Interfaces. 2015, 2, 1–9.
(194) Speller, E. M. The Signficance of Fullerene Electron Acceptors in Organic Solar Cell
Photo-Oxidation. Mater. Sci. Tech. 2017, 33, 924-933.
(195) Larson, B. W.; Witaker, J. B.; Wang, X-B.; Popov, A. A.; Rumbles, G.; Kopidakis, N.;
Strauss, S. H.; Boltalina. Electron Affinity of Phenyl-C61-Butyric Acid Methyl Ester
(PCBM). J. Phys. Chem. C. 2013, 117, 14958-14964.
(196) Ryan, J. W.; Matsuo, Y. Increased Efficiency in Small Molecule Organic Solar Cells
Through the Use of a 56-π Electron Acceptor- Methano Indene Fullerene. Sci. Rep.
2015, 5, 1-5.
(197) Pensack, R. D.; Guo, C.; Vakhshouri, K.; Gomez, E. D.; Asbury, J. B. Influence of
Acceptor Structure on Barriers to Charge Separation in Organic Photovoltaic Materials.
J. Phys. Chem. C. 2012, 116, 4824–4831.
(198) Liu, T.; Troisi, A. What Makes Fullerene Acceptors Special as Electron Acceptors in
Organic Solar Cells and How to Replace Them. Adv. Mater. 2013, 25, 1038–1041.
(199) Choutoulesi, E.; Mitzithra, C.; Hamilakis, S.; Kordatos, K.; Kollia, C.; Loizos, Z.
Low-Cost Synthesis of Fullerene Derivatives. Syn. Commun. 2011, 43, 2042-2049.
(200) Pavlovich, V. S.; Shpilevsky, E. M. Absorption and Fluorescence Spectra of C60
Fullerene Concentrated Solutions in Hexane and Polystyrene at 77-300 K. J. Appl. Spec.
2010, 77, 335-342.
(201) Wang, W.; Yan, C.; Lau, T-K.; Wang, J.; Liu, K.; Fan, Y.; Lu, X.; Zhang, X. Fused
Hexacyclic Nonfullerene Acceptor with Strong Near-Infrared Absorption for
Semitransparent Organic Solar Cells with 9.77% Efficiency. Adv. Mater. Comm. 2017,
29, 1-7.
(202) Zhang, L.; Lin, B.; Ke, Z.; Chen, J.; Li, W.; Zhang, M.; Ma, W. A Universal Approach
to Improve Electron Mobility without Significant Enlarging Phase Separation in IDT-
based Non-Fullerene Acceptor Organic Solar Cells. Nano Energy. 2017, 41, 609-617.
(203) Zhang, Z.; Li, M.; Liu, Y.; Zhang, J.; Feng, S.; Xu, X.; Song, J.; Bo, Z. Simultaneous
Enhancement of the Molecular Planarity and the Solubility of Non-Fullerene Acceptors:

53
Effect of Aliphatic Side-Chain Substitution on the Photovoltaic Performance. J. Mater.
Chem. A. 2017, 5, 7776-7783.
(204) Liu, X.; Ye, L.; Zhao, W.; Zhang, S.; Li, S.; Su, G. M.; Wang, C.; Ade, H.; Hou, J.
Morphology Control Enables Thickness-Insensitive Efficient Nonfullerene Polymer Solar
Cells. Mater. Chem. Front. 2017, 1, 2057-2064.
(205) Ahmed, E.; Ren, G.; Kim, F. S.; Hollenbeck, E. C.; Jenekhe, S. A. Design of New
Electron Acceptor Materials for Organic Photovoltaics: Synthesis, Electron Transport,
Photophysics, and Photovoltaic Properties of Oligothiophene-Functionalized
Naphthalene Diimides. Chem. Mater. 2011, 23, 4563-4577.
(206) Wang, Y.-J.; Courtright, B. A.; Ferreira, A. S.; Tolbert, S. H.; Jenekhe, S. A. 7.7%
Efficient All-Polymer Solar Cells. Adv. Mater. 2015, 27, 4578−84.
(207) Yang, J.; Xiao, B.; Tajima, K.; Nakano, M.; Takimiya, K.; Tan, A.; Zhou, E.
Comparison Among Perylene Diimide (PDI), Napthalene Diimide (NDI), and
Napthodithiophene Diimide (NDTI) Based n-Type Polymers for All-Polymer Solar Cells
Application. Macromolecules. 2017, 50, 3179-3185.
(208) Guo, Y.; Li, Y.; Awartani, O.; Zhao, J.; Han, H.; Ade, H.; Zhao, D.; Yan, H. A
Vinylene-Bridged Perylenediimide-Based Polymeric Acceptor Enabling Efficient All-
Polymer Solar Cells Processed under Ambient Conditions. Adv. Mater. 2016, 28,
8483−8489.

54
Chapter 2
Experimental Theory and Techniques
2.1 Overview
The experimental theory and techniques used in this dissertation will be discussed. The
experimental methods and experimental setups will be discussed. These techniques were used to
investigate the linear and nonlinear properties of the organic light harvesting compounds. The
understanding of these techniques will help in the elucidation and better understanding of the
optical properties of the investigated compounds. Computational methods were utilized to
complement the experimental techniques to better understand the underlying quantum
mechanical properties responsible for the experimental results.
2.2 Steady-State Spectroscopy
Two steady-state techniques were used in these studies in order to investigate the
fundamental linear spectroscopic properties of the light harvesting organic materials. The
steady-state absorption was investigated with UV-VIS spectrophotometer and the steady-state
emission was investigated with a fluorometer. Steady-state spectroscopy investigates the linear
response of the light-matter interaction of materials. Steady-state spectroscopy investigates the
long timescale averaged linear response of a material when irradiated with photons of the
electromagnetic spectrum. The samples’ steady-state spectroscopic properties were investigated
with UV and visible light.
In UV-Vis absorption spectroscopy, the sample is irradiated with UV and visible light
and the intensity of absorbed radiation by the sample is recorded as function of wavelength.1

55
The samples in this study were investigated in the solution phase. The samples were dissolved in
organic solvents. By dissolving the samples in organic solvent, the concentration of the solute
can be uniformly controlled avoiding aggregation. The morphological properties and thickness
of the solid state will not affect the intrinsic spectroscopic response of the sample.2-3
The solvent
does not have a response to visible light and the UV response of the solvent can be subtracted
from the sample-solvent response to give the response of the sample. Although steady-state
absorption is “steady-state”, the steady-state absorption measures the transition from the ground
state to the excited state by measuring how much light and which frequencies provide enough
energy to promote an electron from the ground state of the molecule to excited state of the
molecule.4 The absorption process is fast, it occurs over a few hundred femtoseconds, which is
much faster than the detector can resolve.5-6
Thus, the detector response is an independent path
function and only measures the absolute intensity change of the transmitted light without any
time resolution.
The absorption process is dependent on the path length the light travels through the
sample, the molar absorptivity coefficient, and the concentration of the sample in a given path
length. These parameters are used to show the absorption per molecule. These parameters are
described by the Beer-Lambert law which mathematically relates the absorption of light at a
given wavelength, which is directly proportional to the concentration within the given path
length, given in Equation 2.2.1.7
(
)
Where A is the absorption, I0 is the initial intensity, I is the final intensity that reaches the
detector after passing through the sample, is the molar absorptivity (M-1
cm-1
) which is the
intrinsic property of how strongly a molecule absorbs light at a given wavelength, l is the path
Equation 2.2.1
56
length (cm) that the light travels through the sample, and c is the concentration (mol/l) within the
path length. The concentration within the path length is considered the same concentration as the
concentration of the solution due to uniform dispersion of the sample throughout the solution.
The molar absorptivity coefficient is a critical parameter for describing the absorption
characteristics of organic light harvesting materials because it represents the absorbing strength
of a molecule at a given wavelength.8 With typical molar absorptivity coefficients for
conjugated light harvesting organic molecules are between 103 to 10
6 M
-1cm
-1.9-11
The absorption per molecule can be represented with the one-photon absorption cross
section, seen in Equation 2.2.2.12-13
Where α is the Napierian absorption coefficient which is equal to ln(10), Ɛ is the molar extinction
coefficient (molar absorptivity coefficient), c is the concentration (mol/l), and n is the number of
absorbing molecules per centimeter cubed. An analogous term will be used to describe two-
photon absorption cross-section in later sections.
The absorption was measured with an Agilent 8453 UV-visible spectrophotometer. The
absorption data was collected with Agilent Chemstation software that was connected to the
spectrophotometer. The spectrophotometer uses a deuterium-discharge lamp and tungsten lamp
to irradiate the sample. The two lamp system provides light from ultraviolet wavelengths of the
electromagnetic spectrum to infrared wavelengths of the electromagnetic spectrum (190 nm -
1100 nm). The light from the lamps is collimated by a source lens. The collimated light passes
through the shutter or stray light filter into the sample located in the sample holder. 1 cm path
length Starna Quartz cuvettes were used to hold the samples. Transmitted light is then
Equation 2.2.2

57
collimated by the spectrograph lens. The light then passes through a slit. The light is then
dispersed onto the diode array via a holographic grating. This system can be seen in Figure
2.2.1.
Figure 2.2.1. Agilent 8453 UV-Vis spectrophotometer schematic14
Ideally, all of the absorbed photons in light-harvesting would go into electricity
generation, but this is not the case for most molecules because the energy from photons can be
lost to other quantum processes like fluorescence. Steady-state emission spectroscopy is used to
investigate the ratio of absorbed photons to emitted photons and the emitted photon’s wavelength
can give insight into other photophysical processes that may be taking place.15-17
The
fluorescence intensity is given by Equation 2.2.3.
Where Iflu is the fluorescence intensity, I0 is the incident light intensity, ɸ is the quantum yield
which will be discussed shortly, l is the path length (cm), Ɛ is the molar absorptivity (M-1
cm-1
),
and c is concentration in (M=mol/L). Most organic molecules have fluorescence lifetimes from
femtoseconds to nanoseconds. Since absorption is much faster than fluorescence, the
fluorescence steady state is reached almost instantly. Thus the steady-state fluorescence is
proportional to the fluorescence lifetime of the molecule.
Equation 2.2.3.

58
As discussed earlier, the absorption of a photon can lead to many different photophysical
processes, which are accounted for by the quantum yield term in the fluorescence equation. The
quantum yield is the ratio of the emitted photos to absorbed photons. The quantum yield can be
described by Equation 2.2.4.
Where kf is the fluorescence rate constant, ki is the intersystem rate constant, kec is the external
conversion rate constant, kic is the internal conversion rate, kpd is the predissociation rate
constant, and kd is the dissociation rate constant. Thus the quantum yield is a critical parameter
that can give insight of other photophysical processes.18-20
The fluorescence quantum yields for the investigated compounds were determined by
comparative methods. A standard with a well-known quantum yield and absorbs and emits in
the same region as the sample being analyzed is chosen to determine quantum yield of the
sample.21
The fluorescence quantum yield is calculated by Equation 2.2.5.
(
) (
)
Where sam denotes the sample, std denotes the standard, ɸ is the quantum yield, Grad is the
gradient of the integrated fluorescence intensity versus the absorption, and η is the refractive
index which accounts for of the solvent effects of the solvent used to make the solution.
` The fluorescence spectrum measurement was done by Spex FluoroMax-2
fluorometer. The diagram can be seen in Figure 2.2.2. The data is recorded using DataMax
software using a computer. The excitation source is a 150W continuous xenon lamp that is
mounted vertically that produces light from 190 nm to 2000 nm. The light beam from the xenon
lamp is focused on the entrance slit of an excitation spectrometer with an elliptical mirror. The
Equation 2.2.4.
Equation 2.2.5.

59
slit width is adjustable in order to avoid damaging the sample. Diffraction gratings in the
excitation spectrometer allow single wavelength excitation of samples. A sample holder holds 1
cm path length Starna Quartz cuvettes. Fluorescence is measured by a photomultiplier tube
(PMT) detector perpendicular to the excitation beam to eliminate scattering and signal from the
excitation beam. The fluorescence from the samples enters the slits to an emission spectrometer.
The slits can control how fluorescence reaches the detector in order to prevent saturating the
detector or damaging the detector from strongly emissive species. Gratings in the emission
spectrometer placed in front of the detector ensure efficient collection of each emission
wavelength. The signal is then amplified by a photon counting amplifier which is then recorded
by a computer.
Figure 2.2.2. Fluoromax-2 schematic22
2.3 Time-resolved fluorescence upconversion
The fluorescence lifetime of a molecule is the amount of time a molecule spends in the
excited state before returning to the ground state and emitting a photon. The molecules in a
solution are in the electronic ground state but in various rotational and vibrational energy states

60
which results in all of the molecules in a Boltzmann distribution of ground states.5 Thus the
fluorescence lifetime constant represents when (1/e) (36.8%) of the molecules have returned to
the ground state.23
Organic molecules have fluorescence lifetimes from picoseconds to
nanoseconds.23
In order to investigate these fast lifetimes, a technique called fluorescence
upconversion is used.
The time-resolved fluorescence experiments were performed using a fluorescence setup
shown in Figure 2.3.1. The time-resolved fluorescence upconversion uses a diode pumped
neodymium-doped yttrium vanadate (Nd:YVO4) Millennia (Spectra Physics) continuous laser to
generate a 532 nm beam of up to 5 W of power. The Millennia (Spectra Physics) pumps a Ti-
sapphire Tsunami (Spectra Physics) which produces laser pulses of 110 fs between 790 to 810
nm of up to 800 mW at a repetition rate of 80 MHz. The Tsunami (Spectra Physics) generates
the ultrafast pulses through a technique called passive mode-locking. The experiments used in
these studies used an 800 nm beam. The 800 nm beam is directed into a FOG-100 (CDP inc)
which is upconverted by a beta-barium borate (crystal) to produce a 400 nm beam. A beam
splitter passes the fundamental 800 nm to an optical delay line and serves as an optical gate, and
the 400 nm beam is reflected towards the sample in order to provide the excitation source. The
sample is placed in a rotating sample holder with a path length of 1 mm containing two quartz
lenses to prevent photodegradation. The fluorescence from the sample is then collected by
focusing the emission and the residual 800 nm from the optical delay line on another BBO
crystal, overlapping the two beams temporally and spatially and producing a sum frequency of
the two beams. The sum frequency of the two beams is between 300 nm to 400 nm is then
focused and directed into a monochromator where it is detected by a photomultiplier tube (PMT)
(Hamamatsu R152P). The delay line can produce step sizes of ~6.25 femtoseconds resolution.

61
The experimental range of the delay line is allows the fluorescence dynamics between 220 fs to 1
nanosecond to be resolved.
Figure 2.3.1. Fluorescence upconversion setup
The fluorescence upconversion setup can also be used to measure the fluorescence
anisotropy of the investigated materials. Fluorescence anisotropy can give details on the
rotational properties of a molecule or exciton dynamics in macromolecules.24-25
To conduct
anisotropy measurements, a Berek compensator is used to control the polarization of the 400 nm
beam that is used as the excitation source. The polarization of the 400 nm can be parallel
polarized (I//) or perpendicular polarized (I⊥). In solution, the molecules are randomly
orientated, so when excitation source is polarized in one direction, only molecules with
absorption transition dipole parallel to the electric vector of the excitation source are excited.
The anisotropy is calculated by Equation 2.3.1.
Equation 2.3.1.

62
Where r(t) is the fluorescence anisotropy at time t, I// is the parallel polarized light in respect to
the laser polarization , I⊥ is the perpendicular polarized light in respect to the laser polarization,
and g is the g factor which is used to correct for detector sensitivity of parallel polarized and
perpendicular light.26
The maximum initial anisotropy value that can be achieved for a two level system for a
one-photon process is 0.4.27
This happens when no depolarization from the excitation to the
emission dipoles occurs. The initial anisotropy is calculated by Equation 2.3.2.
(
)
Where r is the initial anisotropy, θ is the angle between the absorption and emission transition
dipoles, and the constant of 2/5 accounts for the transition probability.
2.4 Two-photon Absorption Spectroscopy
Two-photon absorption (TPA) is the simultaneous absorption of two photons with the
same energy in order to excite a molecule from the ground state to the excited state. It is
analogous to one photon absorption where a high energy photon is used to excite a molecule
from the ground state to the excited state, whereas in two-photon absorption, two lower energy
photons are used to excite a molecule from the ground state to the excited state.28
Due to the
simultaneous absorption of two photons, two-photon absorption quadratically is dependent on
the intensity of the incident photon, whereas in one-photon absorption, a single photon is used to
excite the molecule resulting in a linear dependence.29
One of the benefits of TPA is that only a
small portion of the sample is excited, at the focus of the beam. The phenomenon of TPA was
theorized by Maria Goeppert-Mayer in 1931, but the experimental validation of TPA theory did
not occur until the invention of high intensity lasers thirty years later.30-31
Two different types of
laser setups were used for these studies, one using a pulsed femtosecond laser and the other using
Equation 2.3.2.

63
a pulsed nanosecond laser. Both laser setups used the TPEF method, which will be described
later, to determine the TPA properties of the investigated materials.
In order to determine the TPA properties for the investigated compounds the TPEF
method was utilized. The TPA cross-section can be determined by using the TPEF method by
Equation 2.4.1.32
[ ]
⟨ ⟩
Where F(t) is the fluorescence photons collected per second, η is quantum yield, δ is the TPA
cross-section for the sample, [c] is the concentration, n is the refractive index of the solvent, gp is
the shape factor of the pulsed laser (0.66 for Gaussian shape), f is the frequency of the laser, λ is
the excitation wavelength, τ is the pulse durations, ϕ is the collection efficiency, and ⟨ ⟩ is the
input intensity. Since the same laser system is used for each sample in each study, the laser
parameters can be neglected. The collection efficiency can be neglected if a standard is used that
has known TPA cross-section and quantum yield. The logarithm of both sides can be taken to
give Equation 2.4.2.
[ ] [⟨ ⟩] *
[ ]
+
The last term will be a constant. Therefore, the logarithm plot of the fluorescence
intensity is proportional to 2 times the power plus a term that takes into account the experimental
parameters. The values for the standard and sample can be substituted in the above equation to
obtain Equation 2.4.3.
[ ] [ ] *
[ ]
+
Equation 2.4.1.
Equation 2.4.2.
Equation 2.4.3.

64
The relationship between the standard and sample can be established. It is important to note the b
in Equation 2.4.3 can be ascribed to the y-intercept. Equation 2.4.3 is further manipulated to
give Equation 2.4.4.
[ ] [ ]
With a little more manipulation the above equation can be used to solve for the two-photon
absorption cross-section of the sample to give Equation 2.4.5.
( ) [ ]
[ ]
Where the quantum yields of the sample and standard, concentrations of the samples and
standard, and refractive index of the solvents can easily be determined. The y-intercept or b
value is determined by plotting the log-log plot of the fluorescence intensity versus power.
The ultrafast TPEF setup consists of diode-pumped Mai Tai (Spectra Physics) mode-
locked pulsed Ti:sapphire laser that produces 100 fs pulses from 700nm- 980 nm of up to 2W at
a repetition rate of 80 MHz. This can be used as the excitation source for the TPA experiments
or the wavelength output from the Mai Tai can be extended by pumping a synchronously
pumped parametric oscillator (OPO) (OPAL) with the output beam from Mai-Tai. The OPAL is
capable of delivering tunable femtosecond pulses from 1100 nm to 1400 nm of 130 fs with up to
600 mw power. The beam is directed through a variable neutral density wheel that controls the
power of the excitation beam for the experiment. An optical glass is used to direct about 10% of
the incident beam into a high-speed silicon photodiode connected to a multimeter which gives
connects to the computer interface in order for the intensity to be recorded as a function of
voltage which can be calibrated to power in milliwatts. The beam is directed and focused onto a
sample. The fluorescence is collected at a right angle to the excitation beam to avoid
interference from the excitation beam. The monochromator is placed in front of a PMT to select
Equation 2.4.4.
Equation 2.4.5.

65
the fluorescence wavelength of interest which is then detected by a photomultiplier tube (R152P,
Hamamatsu) connected to a computer via a photon-counting unit. The schematic can be seen in
Figure 2.4.1.
Figure 2.4.1. Ultrafast TPEF Setup
2.5 Transient absorption spectroscopy
Transient absorption (TA) spectroscopy is one of the most powerful spectroscopic
techniques. TA spectroscopy is a pump-probe technique that investigates the chemical excited
state dynamics. Steady-state spectroscopy can give information on the final state or initial state
of the molecule, but does not give any information on intermediate processes. Fluorescence
upconversion spectroscopy can give information on the fluorescence decay dynamics, but no
information on the absorption process. TPA spectroscopy gives insight on the transition dipoles,
but it is also a steady state technique as well. TA spectroscopy can give great insight on the
excited state of the investigated materials. It can give insight into the absorption and emission
properties, dark states, chemical species involved in transitions, vibrational cooling, bleach
recovery, and singlet to triplet conversion.33

66
TA spectroscopy uses a monochromatic ultrafast pulse (~120fs) to excite the molecule
(pump), and a pulsed white light continuum from 450-750 nm is used to probe the excited state.
The white light continuum probe is time-delayed with respect to the pump pulse. The absorption
measured by the probe is subtracted from the steady state absorption spectrum which produces a
spectrum of the change in absorption ΔA versus time and wavelength. The pump excites the
sample from the S0 ground state to the first excited S1 state, after a time delay the probe beams
excites the molecule while it is in its S1 state to Sn state, seen in Figure 2.5.1.
Figure 2.5.1. Pump-probe concept used in transient absorption spectroscopy. A is excited state
absorption, B is a bleach state, and C is stimulated emission.
Upon excitation by the pump beam, the molecule can be excited to other higher excited
states, which is called an Excited State Absorption (ESA) represented by a positive signal in the
ΔA. Upon excitation by the pump beam, the ground state is partially depopulated and some of
the molecules are promoted to the excited state. The ground state absorption signal disappears
because there are fewer molecules in the ground state to excite to the excited state. This is called
a ground state bleach (GSB) and signal becomes negative (-ΔA). When the interaction of the

67
probe pulse with the excited molecule stimulates the repopulation of the ground state via
emission of a photon, Stimulated Emission (SE) occurs, and the signal becomes negative (-ΔA).
The photons emitted by the molecules have exactly the same polarization, direction and
wavelength as the photons that caused the molecules to drop from the excited to the ground state,
thus it appears as a negative signal
The TA system uses diode pumped neodymium-doped yttrium vanadate (Nd:YVO4)
Millennia (Spectra Physics) continuous laser to generate a 532 nm beam of up to 5 W of power.
The Millennia (Spectra Physics) pumps a Ti-sapphire Tsunami (Spectra Physics) which produces
laser pulses of 20 fs between 790 to 810 nm of up to 300 mW at a repetition rate of 100 MHz.
The Tsunami (Spectra Physics) generates the ultrafast pulses through a technique called passive
mode-locking. The experiments used in these studies used an 800 nm beam as a seed beam. The
pulse energy of the seed beam is a few nanoJoules. The seed pulses are amplified inside a
regenerative amplifier (Spitfire Pro, Spectra Physics) in three stages. The first stage stretches the
seed pulse. A retroreflecting mirror assembly slows the shorter end (blue) of the spectral pulse
relative to the longer part of the spectral pulse (red). This results in a negative Group Velocity
Dispersion (GVD) stretching the pulse temporally. Then the temporally stretched pulse is
regenerative amplified. A Ti:Sapphire crystal is pumped by a 532 nm Nd: YLF laser (Empower,
Spectra Physics) at 7.5W. This causes a population inversion of the gain medium. The stretched
seed pulse then is injected into resonator via a Pockels cell. After a single pass through the
crystal, the pulse energy of the seed is amplified by a factor of 3 to 4. But in order to get
sufficient gain for the stretched pulse, the pulse is passed multiple times through the gain before
the pulse energy level is high enough to eliminate the population inversion of the gain medium.
Another Pockels cell allows the amplified stretched pulse to exit the resonator. The final step is

68
pulse compression. A retroreflecting mirror assembly slows the long end (red) of the spectral
pulse relative to the shorter part of the spectral pulse (blue). Compressing the pulse back into a
130 fs pulse. The resulting output from the amplifier is at 800nm, 1 kHz, and ~100 fs pulse
width with an average power of 800 mW. With a pulse energy on the order of microJoules.
The amplified output is split by a beam splitter. 20% of the pulse is directed into the
Helios (Ultrafast systems) for white light generation probe beam, while 80% of the beam is
directed into the Optical Parametric Amplifier (OPA, Spectra Physics). The OPA output is used
as the pump beam for the experiment. The OPA uses various nonlinear frequency conversion
processes to achieve a spectral range from 350 nm to 2000 nm. Inside the OPA, the beam from
the amplifier is further split into two separate beams. One beam is used for white light generation
and the other is used for optical parametric generation (preamp). The white light is generated by
a Ti:Sapphire plate and is focused onto the main BBO Crystal (BBO1). Optical parametric
generation (OPG) is used to amplify a specific wavelength of the white light inside BBO1. The
preamp beam passes through a delay stage before arriving at BBO1. The pre-amp beam spatial
and temporally overlaps the white light on BBO1 which produces a signal and idler beam. The
signal is removed using dichroic mirrors and the returning idler beam is overlapped spatially and
temporally with remaining 85% of the original 800 nm beam resulting in amplification of the
idler beam. The residual 800 nm beam is dumped using a dichroic mirror. The idler beam is
then passed through BBO2 and BBO3, where a spectral range of 300 nm to 2000 nm is generated
by controlling the angles of BBOs.
The Helios unit, which generates the white light continuum probe, uses the output beam
from the amplifier and directed into the optical delay line. The pulse is focused onto a
Ti:Sapphire plate after the delay line to generate the white light continuum (450 nm to 750 nm)
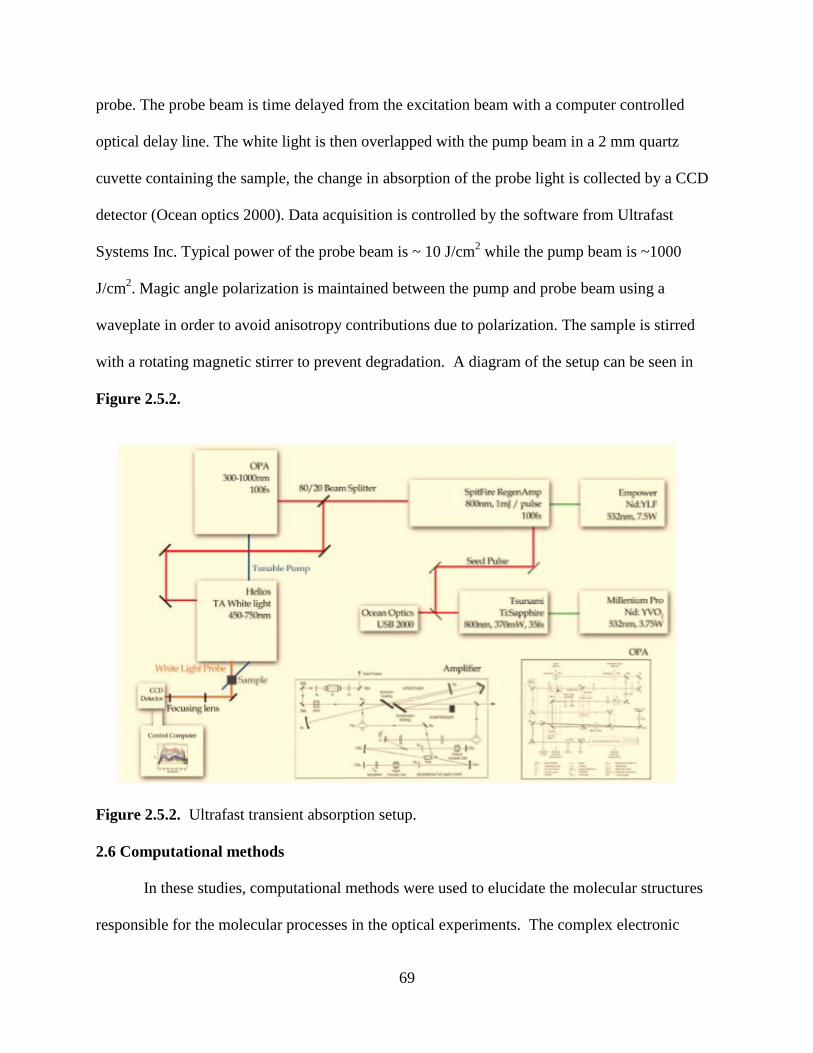
69
probe. The probe beam is time delayed from the excitation beam with a computer controlled
optical delay line. The white light is then overlapped with the pump beam in a 2 mm quartz
cuvette containing the sample, the change in absorption of the probe light is collected by a CCD
detector (Ocean optics 2000). Data acquisition is controlled by the software from Ultrafast
Systems Inc. Typical power of the probe beam is ~ 10 J/cm2 while the pump beam is ~1000
J/cm2. Magic angle polarization is maintained between the pump and probe beam using a
waveplate in order to avoid anisotropy contributions due to polarization. The sample is stirred
with a rotating magnetic stirrer to prevent degradation. A diagram of the setup can be seen in
Figure 2.5.2.
Figure 2.5.2. Ultrafast transient absorption setup.
2.6 Computational methods
In these studies, computational methods were used to elucidate the molecular structures
responsible for the molecular processes in the optical experiments. The complex electronic

70
structures are too complex to find a closed form solution, so numerical methods must be used in
order to determine the molecular orbitals that are reasonable for the molecular structures and
optical properties.34
Computational methods are rapidly becoming coming more popular and
solving more complex problems because of rapid development in the computational theory and
technology. Computer memory, speed, multiprocessing, threading, and improvements in
computer theory have all led to this popularity. Computational methods were used to investigate
the electronic structures, energy levels, excited state structures, ground state structures, and
effects of polymerization. Although, there have been massive improvements in computational
methods, it has still been difficult to perform accurate computations for large macromolecules.35
For the large structures in these studies, the monomer and oligomers electronic structures were
calculated and the extrapolated to the polymer case.
A computational investigation into the structural and electronic properties of the
investigated polymers were carried out using Density Functional Theory (DFT) and Time
Dependent Density Functional Theory (TDDFT) using GAMESS suite of programs. The
B3LYP level of theory was used to calculate the geometry and orbital energy levels of monomer,
dimer, trimer, and tetramer in order to approximate the geometry and orbital energy levels for the
investigated conjugated polymers. B3LYP is a hybrid functional that uses Becke's 3
parameter(B3) exchange correlation functional which uses 3 parameters to mix in the exact
Hartree-Fock exchange correlation and the Lee Yang and Parr(LYP) correlation functional that
recovers dynamic electron correlation.36
B3LYP has been used extensively in computational
chemistry to describe geometry and orbital energy levels and has produced comparable orbital
energy levels to experimentally obtained orbital energy levels.37
It is particularly useful for
donor acceptor polymers because of its ability to describe conjugation effects. Another hybrid
71
functional was also employed, wB97x-D, to compare the two levels of theory with split valence
6-31G(d) basis set. wB97x-D is a meta-GGA DFT functional that includes the second derivative
of the electron density and contains empirical dispersion terms and long-range corrections to
approximate the geometry and orbital energy levels.38
Frequency calculations were also
performed in order to ensure the minimum of the potential energy surface for the optimized
ground state geometry at the same level of theory. Then excited state geometries and orbital
energy levels were then performed by using TDDFT using the same level of theory. Absorption,
emission, and TPA cross sections were then calculated using the same level of theory. The two
levels of theory were then compared to orbital energy levels determined by cyclic voltammetry
(CV).
References
(1) Aljamali, N. M. Review in (NMR and UV-Vis) Spectra. Int. J. Med. Res. Pharm. Sci.
2015, 2, 28-36.
(2) Gaudin, O. P. M.; Samuel, I. D. W.; Amriou, S.; Burn, P. L. Thickness Dependent
Absorption Spectra in Conjugated Polymers: Morphology or Interference. Appl. Phys.
Lett. 2010, 96, 1-3.
(3) Amrutha, S. R.; Jayakannan, M. Probing the π-Stacking Induced Molecular Aggregation
in π-Conjugated Polymers, Oligomers, and Their Blends of p-Phenylenevinylenes. J.
Phys. Chem. B. 2008, 112, 1119-1129.
(4) Kuhn, H. A Quantum-Mechanical Theory of Light Absorption of Organic Dyes and
Similar Compounds. J. Chem. Phys. 1949, 17, 1198-1212.
(5) Strickler, S. J.; Berg, R. A. Relationship between Absorption Intensity and Fluorescence
Lifetime of Molecules. J. Chem. Phys. 1962, 37, 814-822.
(6) Chen, Q.; Yang, J. W.; Osinsky, A.; Gangopadhyaya, S.; Lim, B.; Anwar, M. Z.; Khan,
M. A.; Kusenkov, D.; Temkin, H. Schottky Barrier Detectors on GaN for Visible-Blind
Ultraviolet Detection. Appl. Phys. Lett. 1997, 70, 2277-2279.
(7) Swinehart, D. F. The Beer-Lambert Law. J. Chem. Educ. 1962, 39, 333-335.
(8) Shalhoub, G. M. Visible Spectra Conjugated Dyes: Integrating Quantum Chemical
Concepts with Experimental Data. J. Chem. Educ. 1997, 74, 1317-1319.
(9) Lee, Y.; Jo, A.; Park, S. B. Rational Improvement of Molar Absorptivity Guided by
Oscillator Strength: A Case Study with Furoindolizine-Based Core Skeleton. Angew.
Chem. 2015, 127, 15915-15919.

72
(10) Liu, X.; Xu, Z.; Cole, J. M. Molecular Design of UV-vis Absorption and Emission
Properties in Organic Fluorophores: Toward Larger Bathochromic Shifts, Enhanced
Molar Extinction Coefficients, and Greater Stokes Shifts. J. Phys. Chem. C. 2013, 117,
16584-16595.
(11) Vezie, M. S.; Few, S.; Meager, I.; Pieridou, G.; Dorling, B.; Ashraf, R.; Goni, A. R.;
Bronstein, H.; McCulloch, I.; Hayes S. C.; Campoy-Quiles, M.; Nelson, J. Exploring the
Origin of High Optical Absorption in Conjugated Polymers. Nature Mater. 2016, 15,
746-753.
(12) Day, P. N.; Nguyen, K. A.; Pachter, R.; Calculation of One-Photon and Two-Photon
Absorption Spectra of Porphyrins Using Time-Dependent Density Functional Theory. J.
Chem. Theory Comput. 2008, 4, 1094-1106.
(13) Gagliardi, S.; Falconieri, M. Experimental Determination of the Light-Trapping-
Induced Absorption Enhancement Factor in DSSC Photoanodes. J. Nanotechnol. 2015,
6, 886-892.
(14) Agilent 8453 UV-visible Spectroscopy System Service Manual.
(15) Hedley, G. J.; Ruseckas, A.; Samuel, D. W. Light Harvesting for Organic
Photovoltaics. Chem. Rev. 2017, 117, 796-837.
(16) Birks, J. B.; Dyson, D. J. The Relations between the Fluorescence and Absorption
Properties of Organic Molecules. Proc. R. Soc. A. 1963, 275, 135-148.
(17) Ware, W. R.; Baldwin, B. A. Absorption Intensity and Fluorescence Lifetimes of
Molecules. J. Chem. Phys. 1964, 40, 1703-1705.
(18) Resch-Genger, U.; Rurack, K. Determination of the Photoluminescence Quantum Yield
of Dilute Dye Solutions (IUPAC Technical Report). Pure Appl. Chem. 2013, 85, 2005-
2026.
(19) Birks, J. B. Fluorescence Quantum Yield Measurements. J. Res. Natl. Bur. Stand.
1976, 80, 389-399.
(20) Ni, T.; Melton, L. A. Two-Dimensional Gas-Phase Temperature Measuremetns Using
Fluorescence Lifetime Imaging. Appl. Spectrosc. 1996, 50, 1112-1116.
(21) Parker, C. A.; Rees, W. T. Correction of Fluorescence Spectra and Measurement of
Fluorescence Quantum Efficiency. Analyst. 1960, 85, 587-600.
(22) FluoroMax-2 Manual.
(23) Berezin, M. Y.; Achilefu, S. Fluorescence Lifetime Measurements and Biological
Imaging. Cehm. Rev. 2010, 110, 2641-2684.
(24) Montilla, F.; Frutos, L. M.; Mateo, C. R.; Mallavia, R. Fluorescence Emission
Anisotropy Coupled ot an Electrochemical System: Study of Exciton Dynamics in
Conjugated Polymers. J. Phys. Chem. C. 2007, 111, 18405-18410.
(25) Rusinova, E.; Tretyachenko-Ladokhina, V.; Vele, E. O.; Senear, D. F.; Ross, J. B. A.
Alexa and Oregon Green Dyes as Fluorescence Anisotropy Probes for Measuring
Protein-Protein and Protein-Nucleic Acid Interactions. Anal. Biochem. 2002, 308, 18-
25.

73
(26) Canet, D.; Doering, K.; Dobson, C. M.; Dupont, Y. High-Sensitivity Fluorescence
Anisotropy Detection of Protein-Folding Events: Application to α-Lactalbumin. Biophys.
J. 2001, 80, 1996-2003.
(27) Siegel, J.; Suhling, K.; Leveque-Fort, S.; Webb, S. E. D.; Davis, D. M.; Phillips, D.;
Sabharwal, Y.; French, P. M. W. Wide-Field Time-Resolved Fluorescence Anisotropy
Imaging (TR-FAIM): Imaging the Rotation Mobility of a Fluorophore. Rev. Sci. Instrum.
2003, 74, 182-192.
(28) Svoboda, K.; Yasuda, R. Principles of Two-Photon Excitation Microscopy and Its
Applications to Neuroscience. Neuron. 2006, 50, 823-839.
(29) Rumi, M.; Perry, J. W. Two-Photon Absorption: An Overview of Measurements and
Principles. Adv. Opt. Photonics. 2010, 2, 451-518.
(30) Goppert-Mayer, von M. Uber Elementarakte Mit Xwei Quantensprungen. 1931, 114.
(31) Kaiser, W.; Garrett, C. G. B. Two-Photon Excitation in CaF2:Eu2+. Phys. Rev. Lett.
1961, 7, 229–232.
(32) Xu, C.; Webb, W. W. Measurement of Two−Photon Excitation Cross Sections of
Molecular Fluorophores with Data From 690 to 1050 nm. J. Opt. Soc. Am. B. 1996, 13,
481− 491.
(33) Berera, R.; van Grondelle, R.; Kennis, J. T. M. Utrafast Transient Absorption
Spectroscopy: Principles and Application to Photosynthetic Systems. Photosynth. Res.
2009, 101, 105-118.
(34) Saad, Y.; Chelikowsky, J. R.; Shontz, S. Numerical Methods for Electronic Structure
Calclations of Materials. SIAM Rev. 2010, 52, 3-54.
(35) Hofer, T. S. From Macromolecules to Electrons-Grand Challenges in Theoretical and
Computational Chemistry. Front. Chem. 2013, 1, 1-4.
(36) Peverati, R.; Truhlar, D. G. Quest for a Universal Density Functional: The Accuracy of
Density Functionals across a Broad Spectrum of Databases in Chemistry and Physics.
Phil. Trans. R. Soc. A. 2014, 372, 1-52.
(37) Tirado-Rives, J.; Jorgensen, W. L. Performance of B3LYP Density Functional Methods
for a Large Set of Organic Molecules. J. Chem. Theory Comput. 2008, 4, 297-306.
(38) Salzner, U.; Aydin, A. Improved Prediction of Properties of π-Conjugated Oligomers
with Range-Separated Hybrid Density Functionals. J. Chem. Theory Comput. 2011, 7,
2568-2583.

74
Chapter 3
Ultrafast Spectroscopic Study of Donor-Acceptor Benzodithiophene Light Harvesting
Organic Conjugated Polymers
The work in this chapter was accepted in the Journal of Physical Chemistry C (JPC) with the
title:
“Ultrafast Spectroscopic Study of Donor-Acceptor Benzodithiophene Light Harvesting Organic
Conjugated Polymers”
Bradley Keller, Alan McLean, Bong-Gi Kim, Kyeongwoon Chung, Jinsang Kim, Theodore
Goodson III
Modifications were made to the manuscript to adapt it to the style of this dissertation. References
and supporting information of the manuscript are included in this chapter.
3.1 Abstract
New light harvesting organic conjugated polymers containing 4,8-bis(2-
ethylhexyloxy)benzo[1,2-b;3,4-b’]dithiophene(BDT) donor groups and thiophene with various
electron-withdrawing acceptor groups were investigated. Also investigated was poly[[4,8-bis[(2-
ethylhexyl)oxy]benzo[1,2-b:4,5-bʹ]dithiophene-2,6-diyl][3-fluoro-2-[(2-
ethylhexyl)carbonyl]thieno[3,4-b]thiophenediyl]] (PTB7), which is one of the most efficient
photovoltaic conjugated polymers. In this study, the steady state absorption, steady state
emission, ultrafast fluorescent decay dynamics and nonlinear optical properties of these light
harvesting conjugated polymers were probed in solution. All of the conjugated polymers
investigated have significant absorption over much of the visible spectrum due to small bandgaps

75
due to low lying LUMO energies created by the electron-withdrawing groups.
Fluorescence upconversion studies on the conjugated polymers showed short decay dynamics for
conjugated polymers with strong electron-withdrawing groups. Two-photon absorption
spectroscopy showed large two-photon absorption cross-sections for the conjugated polymers
with strong electron-withdrawing acceptors. Fluorescence decay anisotropy studies also showed
short exciton migrations for the conjugated polymers with stronger electron-withdrawing
acceptors.
3.2 Introduction
Increasing energy costs due to increasing globalization and energy consumption has led
to the economic viability of alternative energy sources.1–4
Solar energy harvesting has become an
increasingly more viable method for power generation due to rising fossil fuel prices.5–7
Solar
energy harvesting is cleaner, greener, and renewable, unlike fossil fuels which are traditionally
used for power generation.8–10
With 43% of the power of sunlight in the visible region, it is
advantageous to design photovoltaic materials that absorb photons in this region for maximum
power generation.11,12
A significant portion of that power reaches the surface of the earth as
visible light, with a maximum photon flux around 700 nm.13
Thus, it is imperative to develop
efficient photovoltaic materials that can convert solar energy into useable energy.
Conjugated polymers have garnered great interest for applications in organic photovoltaic (OPV)
materials. OPV materials are flexible, light weight, easily processed, low cost in processing, and
an abundance of raw materials make them ideal candidates for solar energy conversion compared
to their inorganic counterparts.14–16
OPVs have high thermal stability and are readily formed into
thin films, making them ideal for many photovoltaic applications.17,18
Unfortunately, OPV
devices reported so far have low power conversion efficiency compared to their inorganic

76
counterparts.19
Current OPVs have only reached slightly over 10.5% power conversion
efficiency(PCE) in tandem solar cells of P3HT:CBAPDTP-PC61BM, but the PCE of OPVs are
rapidly improving.20,21
One particular promising class of OPVs is donor-acceptor(DA) polymers. These
conjugated polymers are composed of an electron rich donor subunit and an electron deficient
acceptor subunit covalently linked. The design of these conjugated polymers focuses on tuning
the optical bandgap of the conjugated polymer in order to maximize the collection of solar
photons.22
Tuning of the bandgap is accomplished by orbital mixing of the electron rich donor
subunit and the electron deficient subunit maximizes the open-circuit voltage for devices.
Modulation of the energy levels can be accomplished by attaching electron-withdrawing groups
to the acceptor subunit or attaching electron-donating groups to the donor subunit.23
The donor
and acceptor motif can also result in higher conjugation length, which allows the polymer to
adopt a more planar structure, which leads to higher electron delocalization along the conjugated
polymer backbone.22
Current interest is focused on DA polymers that use thieno[3,4-b]thiophene(TT) electron-
withdrawing subunits and benzodithiophene(BDT) electron-donating subunits. Thiophene based
polymers have shown to efficiently generate charge carriers.24
Thiophene based oligiomers
absorb near 400 nm and there is a shift in absorption with increasing conjugation and increasing
strength of electron-withdrawing groups.25
Thiophene based dendrimers have also shown
interesting spectroscopic properties such as high two-photon absorption cross-sections indicating
good charge transfer characteristics.26–28
The HOMO and LUMO levels of the polymers can be
modulated by introducing electron-withdrawing groups on the acceptor TT subunit and electron-
donating groups on the BDT donating subunit which has been shown in other conjugated

77
systems.29
One of the leading BDT-TT D-A polymer, poly[[4,8-bis[(2-benzo[2-
ethylhexyl)oxy]benzo[1,2-b:4,5-b’]dithiophene-2,6-diyl][3-fluoro-2-[(2-
ethylhexyl)carbonyl]thioeno[3,4-b]thiophenediyl]] (PTB7), has a PCE of 9.2% which is a
significant increase compared to P3HT devices and gets much closer to commercial viability.30
The high PCE of PTB7 can be attributed to the low-lying HOMO and LUMO levels, good
absorption in the visible spectrum, small bandgap, and good interfacial interaction with
PC61BM.30
The increase in PCE is also attributed to the electron-withdrawing effect of the ester
and fluorine group on the TT subunit, which enhances the dipole moment of PTB7.31
The
increased dipole moment results in an increase in charge transfer in PTB7.
The donor monomers in D-A polymers also influence the properties of the D-A polymer.
The HOMO level of the D-A is close to the HOMO level of the donor acceptor group.22
Designing strong electron-donating monomers is important for charge dissociation, although too
strong of a donor can result in low ionization potentials which can lead to oxidative doping and
decreased efficiency.32
Donor monomers also must have great hole mobility in order to have
efficient charge separation and to prevent hole-electron annihilation.33
Increasing the
conjugation of the donor system has also shown to increase PCE for benzodithiophenes based
donor systems.34
Increasing the conjugation of the donor system allows the hole to delocalize
which lowers the local charge density which decreases the Coulombic attraction between the
electron and the hole of the conjugated polymer. Benzodithophenes are also good choice for
donor systems because they adopt conjugated planar structures and small steric hindrance
between adjacent repeating units which is important for charge carrier mobility.34–36
In this work, we present the results of a spectroscopic study of PBTCT, PBT8PT,
PBTT17T, and PBTFDO donor acceptor polymers in solution. These conjugated donor acceptor

78
polymers have a BDT donor and thiophene acceptor with various electron-withdrawing groups.
The results of the spectroscopic studies of these new conjugated polymers are compared to those
of PTB7, which is one of the most efficient BDT-TT conjugated donor acceptor polymers.
These polymers were designed to find a reliable strategy for achieving specific HOMO and
LUMO energy level modulation via alternating donor-acceptor monomer units in order to
increase PCE.22
In order to understand the photophysical properties for efficient power
generation in these donor acceptor polymers, the steady state fluorescence, steady state
absorption, fluorescence anisotropy, two-photon absorption cross-section, and fluorescence
decay excited state dynamics have been investigated in solution.
3.3 Experimental
3.3.1 Steady State UV-Vis and Emission Measurements
The steady state measurements and time resolved measurements of the samples were
performed at room temperature in the solution state. Polymers were dissolved in 1,2-
dichlorobenzene. Concentrations of 1.5x10⁻⁷
M to 3.0x10⁻⁵
were used for the measurements.
The samples were placed in 4 mm quartz cuvettes. Steady state absorbance spectra were
measured using an Agilent 8432 UV-visible absorption spectrophotometer. Steady state
emission spectrum measurements were carried out with a Fluoromax-2 spectrophotometer.
Absolute quantum yield of polymer films was measured by using QuantaMasterTM
spectrofluorometer equipped with an integrating sphere.
3.3.2 Fluorescence Lifetime Measurements
The time-resolved fluorescence experiments were carried out using an ultrafast
fluorescence set-up that has been previously described.37–40
A mode-locked Ti-sapphire
femtosecond laser (Spectra-Physics Tsunami) was used to generate 80-fs pulses at 800 nm

79
wavelength with a repetition rate of 80 MHz. The Tsunami is pumped by a 532 nm continuous
wave output laser (Spectra-Physics Millennia), which has neodymium-doped yttrium vanadate
(Nd:YVO4) gain medium. An excitation pulse of 400 nm was generated by accessing the second
harmonic of a β-barium borate crystal and the residual 800 nm beam was made to pass through a
computer-controlled motorized optical delay line. The polarization of the excitation beam was
controlled by a berek compensator. The power of the excitation beam was 20 mW. The
fluorescence emission by the sample was up-converted by a non-linear crystal of β-barium borate
by using the residual 800 nm beam which had been delayed by the optical delay line with a gate
step size of 6.25 fs giving temporal resolution. A monochromator is used to select the
wavelength of the up-converted emission of interest and the selected emission is detected by a
photomultiplier tube (R152P, Hamamatsu, Hamamatsu City, Japan). The photomultiplier tube
converts the detected photons into photon counts by a voltage cascade which is read by a
computer. Coumarin 153 and Cresyl violet dyes were used for aligning the laser. The
instrument response function(IRF) has been determined from the Raman signal of water to have
a pulse width at half max of 110 fs.39
Lifetimes of fluorescence decay were obtained by fitting
the fluorescence decay with multi-exponential decay functions convoluted with the IRF in
MATLAB and Origin 8.
3.3.3 Two-Photon Absorption Measurements
Two-photon spectroscopy was performed using a mode-locked Ti:sapphire laser
delivering 110 fs output pulses at a repetition rate of 80 MHz. Emission scans were performed at
800 nm excitation while scanning 525-700 nm emission. Two-photon spectroscopy was also
performed using a mode-locked Ti:sapphire laser delivering 110 fs output pulses at a repetition
rate of 80 MHz which pumps an Opal optical parametric oscillator(OPO) lithium borate(LBO)

80
crystal which allows for 1.3 µm and 1.5 µm output excitations. Emission scans were performed
at 1300 nm excitation while scanning 600-900 nm emission. Two-photon power-dependent
fluorescence intensity was utilized to determine two-photon absorption cross-section through the
Two-photon emission fluorescence(TPEF) method.41,42
The TPEF setup utilized a Spectra-Physics
Mai-Tai Diode-pumped Mode-Locked Ti:Sapphire laser which is tunable from 700 to 980 nm. A
femtosecond synchronously pumped parametric oscillator (OPAL) laser was used in conjunction
with the Mai-Tai laser in order to generate the 1300 nm excitation. The output pulses were less than
130 femtoseconds with a repetition rate of 80 MHz and an output power of 200 mW. Input power
from the laser was varied using a variable neutral density filter. The emission detection
wavelength during the power dependence scan was selected by the emission wavelength that
produced the highest number of counts at 800 nm and 1300 nm excitation.
3.4 Results
3.4.1 Synthesis.
Figure 3.4.1. Investigated polymers. For PTB7, R1=2-ethylhexyl. For the other polymers,
R1=2-ethylhexyl, and R2=4-octylphenyl.
All starting materials were purchased from commercial supplier (Aldrich and Fisher Sci).22

81
Scheme 3.4.1. Detailed synthetic scheme of PBTT17T. R indicates 2-ethylhexyl group, i) Pd(0),
THF, reflux, 12 hours, ii) NBS, DMF, iii) Pd2(dba)3, P(o-tolyl)3 , toluene, 110 oC, 48 hours.
Compound 2. Under Ar condition, compound 1 (1 g, 1.82 mmol) and 2-tributylstannyl thiophene
(1.36 g, 3.0 eq) were dissolved into anhydrous THF. After adding
tetrakis(triphenylphosphine)palladium(0) (5 mol%), the mixture was heated up to 80 ºC for 16
hours. Then, the mixture was poured into water and extracted with chloroform. The organic layer
was dried with MgSO4, and target compound (56 %) was obtained from column chromatography
after elution with dichlromethane/n-hexane (1/2). 1H-NMR (400MHz, CDCl3) δ 8.09 (s, 2H),
7.46 (s, 2H), 7.18 (s, 2H), 4.22 (s, 1H), 2.14 (m, 2H), 1.58 (m, 4H), 1.30 (m, 16H), 0.86 (m, 12H)
and m/z EIMS 556.
Compound 3. Under dark condition, compound 2 (1 g, 1.80 mmol) was dissolved into
chloroform, and 2.3 equivalent of NBS (0.74 g, 4.14 mmol) was slowly added under ice bath.
Then, the mixture was warmed up to room temperature and stirred for 6 hours. After adding
water to the mixture, the organic layer was separated and dried with MgSO4. Compound 3 (88
%) was obtained from column chromatography after elution of dichloromethane/n-hexane. 1H-
NMR (400MHz, CDCl3) δ 7.68 (s, 2H), 7.08 (d, 2H), 4.38 (m, 1H), 2.08 (m, 2H), 1.58 (m, 4H),
1.30 (m, 16H), 0.86 (m, 12H) and m/z EIMS 714.

82
Polymerization of PBTT17T. Under inert conditions (Ar), compound 4 was dissolved into
anhydrous toluene, and the equivalent amount of corresponding monomer (compound 3) was
mixed. After adding Pd2(dba)3 (5 mol% to monomer) and P(o-toyl)3 (3.5 eq to Pd(0)) to the
mixture, it was stirred for 48 hours at 110 ºC. Then, 2-tributylstannyl thiophene (39.5 μl) and 2-
bromothiophene (12.5 μl) were added 3 hours intervals, one after the other, both for the
termination of polymerization and chain end modification. The final polymer was collected via
reprecipitation into methanol, and the solid was collected through 0.45 μm nylon filter. After
washing the collected solid with methanol and acetone in a soxhlet apparatus, to remove the
oligomers and catalyst residue, soluble part to chloroform was only obtained for next
characterization. Then, the polymer solution was eluted through a column packed with
Cellite/Florosil, and the obtained solution was reprecipitated from methanol after concentration
in vacuo. Mn (17800), Mw (63720), and PDI (3.58)
3.5 Molecular Weight Determination.
Table 3.5.1. Molecular weight and steady state properties of studied polymers. Mw is the
molecular weight of the polymers, PDI is the polydispersity index, Nmonomer is the number of
repeat units, λ(abs)(nm) is the absorption peak wavelength, λ(em)(nm) is the emission
wavelength, Φ is quantum yield of the polymer samples
The molecular weight of the conjugated polymers used in this study was determined by
gel permeation chromatography and is shown in Table 3.5.1, PTB7 had the highest weight
Polymers Mw(kDa) PDI N
monomer λ
(abs)(nm) λ
(em)(nm) Φ
PTB7 146.0 2.4 92 628, 671 736 0.0086
PBTCT 27.9 2.1 19 515, 552 600, 660 0.0910
PBT8PT 59.8 2.6 29 449, 551,
628
663, 717 0.0360
PBTT17T 63.7 3.58 19 536 600, 660 0.0490
PBTFDO 22.0 1.9 18 649, 703 780 0.0043

83
average molecular weight with 92 monomers per polymer chain. PBTCT had the third lowest
weight average molecular weight with 19 monomers per polymer chain. PBT8PT had the third
highest weight average molecular weight with 29 monomers per polymer chain. PBTT17T had
the second highest weight average molecular weight, but had the broadest PDI and 19 monomers
per polymer chain. PBTFDO had the lowest weight average molecular weight with 18
monomers per polymer chain.
3.6 Linear Absorption Spectra
Shown in Figure 3.6.1 is the absorption spectra for the investigated polymers. A
summary of the steady state properties of the polymers is provided in Table 3.5.1. All of the
polymers studied have significant absorbance over much of the visible spectrum. The absorption
maximum for PTB7 is at 14,800 cm-1
which is attributed to the π-π* transition between the
thienothiophene (TT) and benzodithiophene (BDT) monomers and the small peak at 25,250 cm-1
can be attributed to a S0 → S1 transition in the TT monomer.23
PTB7 has a high extinction
coefficient between 12,500 cm-1
-17,700 cm-1
which is ideal for absorbing photons in the high
solar flux region, this may contribute to PTB7’s high power conversion efficiency.43
PBTFDO
and PBT8PT also had absorption maxima near 20,000 cm-1
, with the bathochromic shift and
greater absorption of low energy photons of PBTFDO attributed to the much stronger electron-
withdrawing strength of its acceptor. PBTFDO and PTB7 have a strong electron-withdrawing
fluorine atom and electron-withdrawing ester group on the acceptor monomer modulates the
HOMO-LUMO energy gap, which results in narrowing of the optical bandgap compared to
PBTCT and PBTT17T.22,44
PBTCT and PBTT17T both are unable to utilize the lower energy photons of the high
solar flux region, but for differing reasons. PBTCT fails at absorbing low energy photons in the

84
near IR region of the visible spectrum. PBTCT had the weakest electron-withdrawing acceptor
of the investigated polymers leading to a large HOMO-LUMO energy gap resulting in no
absorption in the near IR region of the visible spectrum. PBTT17T and PBT8PT had the same
electron-withdrawing group on the acceptor, but PBT8PT was able to absorb lower energy
photons. The poor absorption of low energy photons by PBTT17T is attributed to poor
interaction between the donor and acceptor due to the additional thiophene linker resulting in a
large HOMO-LUMO energy gap. This underlines the importance of the direct intramolecular
interaction between the donor and acceptor for intramolecular charge transfer. The absorption
spectra for the studied polymers illustrated that with increasing electron-withdrawing strength of
the acceptor, there is a bathochromic shift of the maximum and leading edge of the absorption
due to the lowering of LUMO energy level within the D-A polymer. The trailing edge of the
absorption remained fairly unchanged along the series, which is due to the fact all of the D-A
polymers having the same donor unit and thus similar HOMO energy levels.22
This modulation
of the energy gap is due to the HOMO in the polymer corresponding to the donor group and the
LUMO level corresponds with the acceptor group, thus the band gap is narrowed by introducing
more electron-withdrawing groups that lower the LUMO which also correlates well with the
DFT calculations conducted by Kim et al.22
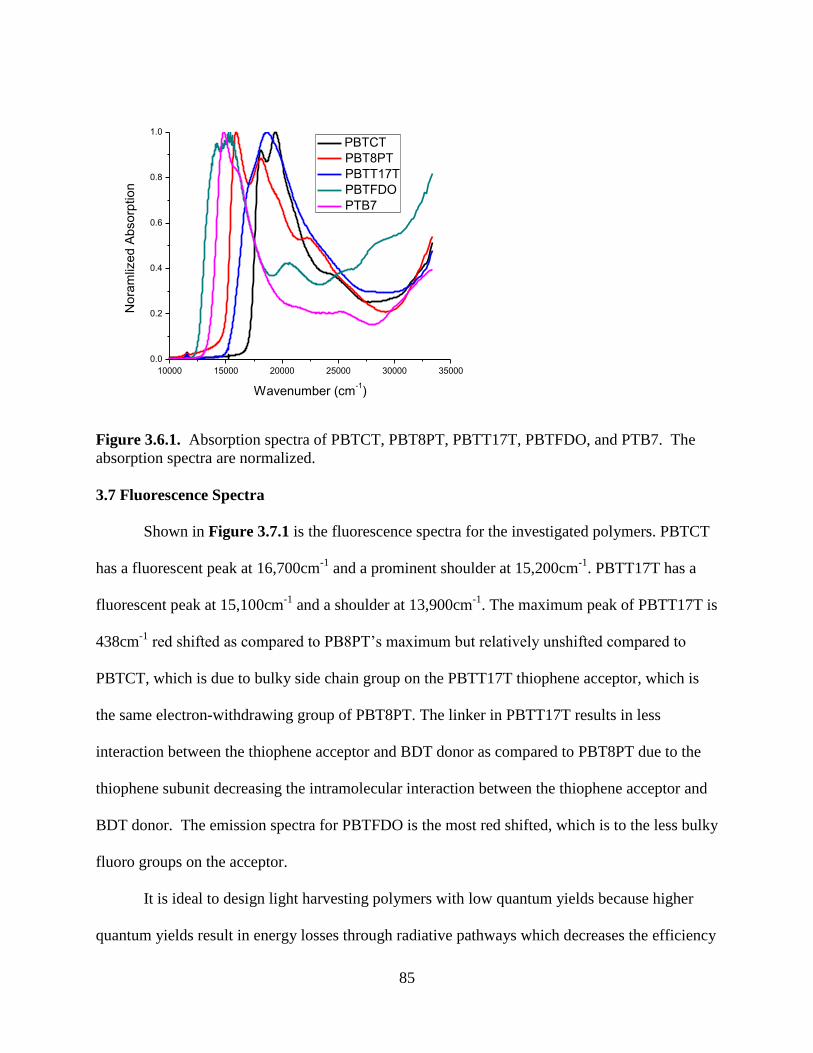
85
10000 15000 20000 25000 30000 35000
0.0
0.2
0.4
0.6
0.8
1.0N
ora
mliz
ed
Abso
rptio
n
Wavenumber (cm-1)
PBTCT
PBT8PT
PBTT17T
PBTFDO
PTB7
Figure 3.6.1. Absorption spectra of PBTCT, PBT8PT, PBTT17T, PBTFDO, and PTB7. The
absorption spectra are normalized.
3.7 Fluorescence Spectra
Shown in Figure 3.7.1 is the fluorescence spectra for the investigated polymers. PBTCT
has a fluorescent peak at 16,700cm-1
and a prominent shoulder at 15,200cm-1
. PBTT17T has a
fluorescent peak at 15,100cm-1
and a shoulder at 13,900cm-1
. The maximum peak of PBTT17T is
438cm-1
red shifted as compared to PB8PT’s maximum but relatively unshifted compared to
PBTCT, which is due to bulky side chain group on the PBTT17T thiophene acceptor, which is
the same electron-withdrawing group of PBT8PT. The linker in PBTT17T results in less
interaction between the thiophene acceptor and BDT donor as compared to PBT8PT due to the
thiophene subunit decreasing the intramolecular interaction between the thiophene acceptor and
BDT donor. The emission spectra for PBTFDO is the most red shifted, which is to the less bulky
fluoro groups on the acceptor.
It is ideal to design light harvesting polymers with low quantum yields because higher
quantum yields result in energy losses through radiative pathways which decreases the efficiency

86
of converting sunlight to electrical power in solar cell devices, although lower quantum yields
may result in an increase non-radiative energy loss, thus other factors must be taken into
consideration, such as emission decay dynamics, anisotropy, and two-photon absorption
properties. The quantum yields for the investigated polymers is shown in Table 3.5.1. The
studied polymers with the stronger electron-withdrawing groups had the lowest quantum yields.
The stronger electron-withdrawing groups are able to activate non-radiative intramolecular
photoinduced electron transfer(PET).45
This causes the excited electron to be transferred to the
acceptor more efficiently, which directly competes with electron hole pair annihilation which is
responsible for fluorescence, resulting in a lower quantum yield. The low quantum yield of
PBFTDO and PTB7 can be explained by the electron-withdrawing effect of fluorine, which is
not only responsible for PET, but results in the changing of the redox potential and the excitation
energy of the emitting subunit, which further changes the electron-accepting ability of the
acceptor. Zhang46
et al found that halogenation increases the rate constant of intramolecular PET
according to Marcus electron transfer theory, which is consistent with the results of the studied
polymers.46
Thus, the low quantum yields of PBTFDO and PTB7 are quite desirable because of
the reduced loss of energy through radiative pathways.

87
14000 16000 18000 20000 22000 24000
0.0
0.2
0.4
0.6
0.8
1.0N
orm
aliz
ed
In
ten
sity
Wavenumbers (cm-1)
PBTCT
PBTT17T
PBTFDO
PBT8PT
Figure 3.7.1. Emission(PBTCT, PBT8PT, PBTT17T: Excitation wavelength: 400nm.
PBTFDO: Excitation wavelength: 450nm. PTB7: Excitation wavelength: 517 nm). Emission
intensities are normalized.
3.8 Two-Photon Absorption Measurements
Table 3.8.1. TPA properties of studied polymers
The two-photon cross section indicates the charge transfer character of the light-
harvesting polymer.47
For example, the repeating D-A units of the investigated polymers
introduce nonlinearity that not only increases the two-photon absorption cross-section, but also
increases charge transfer potential. As further elaboration, nonlinearity introduces asymmetry
along the backbone, allowing for a distortion of the electron density along the backbone to
provide a gradient for charge transfer to occur.
Sample δ (GM) δ (GM)/monomer
PTB7 96,000 1044
PBTCT 3020 160
PBT8PT 87.2 3.0
PBTT17T 739 39
PBTFDO 3970 220

88
The two-photon excited fluorescence method was used to measure the two-photon
absorption cross section, as shown in Table 3.8.1. The two-photon cross-section measures a
standardized rate of bi-photon absorption. Hence, assuming equivalent efficiency, polymers with
a higher two-photon cross-section are usually more ideal applied materials. An increase two-
photon cross section was seen for the polymers that had strong electron-withdrawing groups on
the acceptor. For example, PTB7 has a fluorine and ester group on its acceptor and PBTFDO has
fluorine groups and dione groups. This suggests that strong electron-withdrawing groups can be
used to increase two-photon cross section in order to promote charge transfer characteristics.
Although there is a drop in two-photon cross-section per monomer for PBTFDO, which had the
strongest electron withdrawing group, this drop per monomer has been seen in other polymers
with extremely high dipole moments, which was attributed to electron trapping or recombination
by Lu et al.44,48
Next, comparing PBTT17T and PBT8PT, there was a 10-fold increase in two-photon
absorption of the former, with the only difference in structure being a thiophene linker. Adding
the linker added separation between the donor and acceptor to the polymer, which resulted in
greater charge separation and is why the two-photon absorption cross-section increases.
However, PBTT17T exemplifies that while adding a thiophene linker can provide circumstantial
benefits, adding the linker does not necessarily create the better light-harvesting polymer or
extend the conjugation, as PBTT17T has higher quantum yield (more loss due to radiation), and
narrower one-photon absorption(less absorption of other wavelengths).
3.9 Fluorescence Upconversion Dynamics
The fluorescence decay dynamics were fitted to a multi-exponential decay functions.
The decay dynamics for the investigated polymers are shown in Figure 3.9.1 and Figure 3.9.2.

89
As seen in Table 3.9.1, the fluorescence lifetime measurements of the polymers indicate that the
fluorescence lifetime is related to the electron-withdrawing strength of the acceptor. The
investigated polymers with strong electron-withdrawing groups had short fluorescence lifetimes.
The short total fluorescence lifetimes can be attributed to fluorescence quenching by the acceptor
for PBTFDO and PTB7 resulting in quenching of the intermediate decay, whereas the weaker
electron-withdrawing polymers PBTCT, PTB8PT, and PBTT17T do not quench the intermediate
state leading to triexponential decay. This also was correlated with the smaller quantum yields
exhibited by the investigated polymers with strong electron-withdrawing groups. The short
component and long component of the decay dynamics of PTB7 and PBTFDO were quite similar
which suggests similar relaxation processes. PBTT17T, PBTCT, PBT8PT had the longest
decays of the investigated polymers which is attributed to the weaker electron-withdrawing
strength of the acceptors in these polymers which suggests similar relaxation processes.

90
Figure 3.9.1. Fluorescence Upconversion of PBTCT(top left) at 400nm excitation and 600nm
emission., PBT8PT(top right) at 400nm excitation and 650nm emission., PBTT17T(bottom left)
at 400nm excitation and 650nm emission., and PBTFDO(bottom right) at 400nm excitation and
700nm emission.
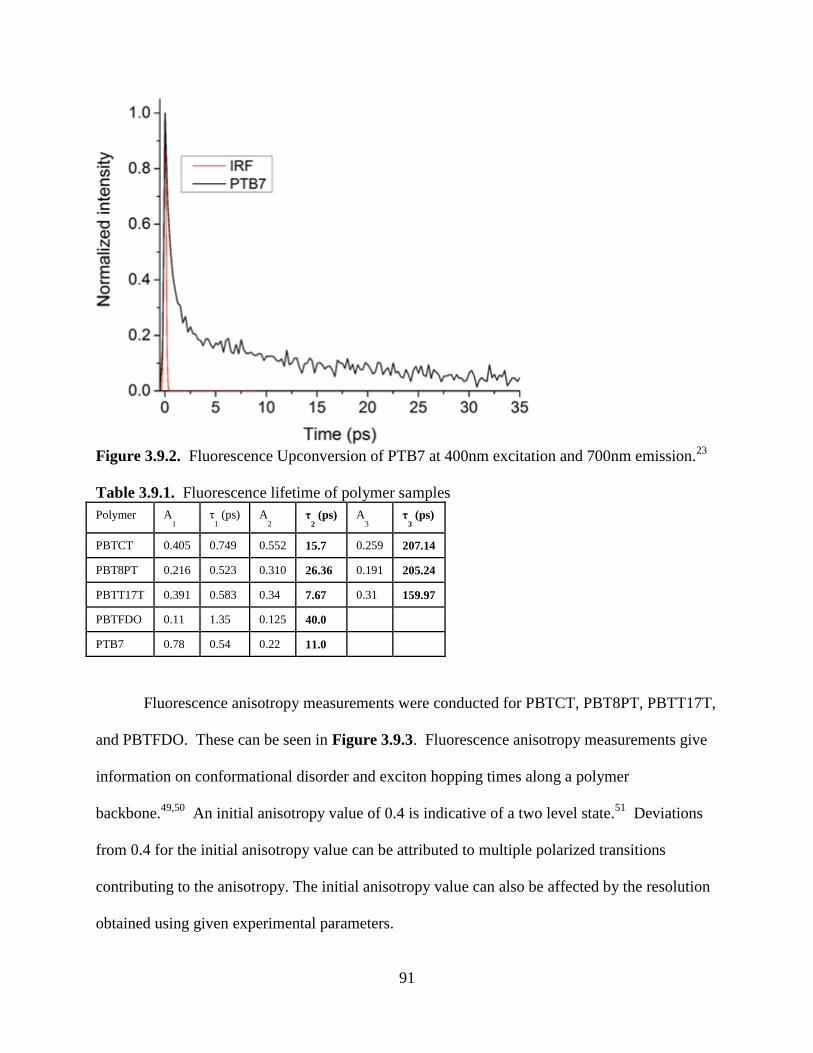
91
Figure 3.9.2. Fluorescence Upconversion of PTB7 at 400nm excitation and 700nm emission.
23
Table 3.9.1. Fluorescence lifetime of polymer samples
Polymer A1 η
1 (ps) A
2 τ
2 (ps) A
3 τ
3 (ps)
PBTCT 0.405 0.749 0.552 15.7 0.259 207.14
PBT8PT 0.216 0.523 0.310 26.36 0.191 205.24
PBTT17T 0.391 0.583 0.34 7.67 0.31 159.97
PBTFDO 0.11 1.35 0.125 40.0
PTB7 0.78 0.54 0.22 11.0
Fluorescence anisotropy measurements were conducted for PBTCT, PBT8PT, PBTT17T,
and PBTFDO. These can be seen in Figure 3.9.3. Fluorescence anisotropy measurements give
information on conformational disorder and exciton hopping times along a polymer
backbone.49,50
An initial anisotropy value of 0.4 is indicative of a two level state.51
Deviations
from 0.4 for the initial anisotropy value can be attributed to multiple polarized transitions
contributing to the anisotropy. The initial anisotropy value can also be affected by the resolution
obtained using given experimental parameters.

92
Cho et al52
has found that PTB7 has an initial anisotropy of 0.4 and decay of 30 ps in
toluene.52
The results found in this study for PTB7 in chloroform were an initial anisotropy of
0.09 with a decay of 48 ps which is comparable to the results found by Cho et al.52
The
discrepancy between the results in this study and those found by Cho may be due to different
conformations of PTB7 in different solvents, as well as the strong influence of excited state
absorption seen for transient absorption anisotropy.
The initial anisotropy of the other investigated polymers were much lower than the 0.4
initial anisotropy expected of a two level system. The lower initial anisotropy values can be
attributed to vibrionic cooling that occurs faster than the resolution of the upconversion system.
The anisotropic decay times for PTB7 and PBTFDO were 48ps and 8 ps, respectively. This fast
decay can be associated with quick Förster energy transfer. PBTCT and PBT8PT had relatively
long anisotropic decays of 130ps and 320ps, respectively, which is attributed to a much longer
coherent energy transfer. Interestingly, PBTT17T, which has a linker separating the donor and
acceptor, has an extremely short anisotropic decay of 0.08ps. Such a short decay can be
attributed to Dexter-type energy transfer, unfortunately such a fast process is much faster than
the resolution of the upconversion system.
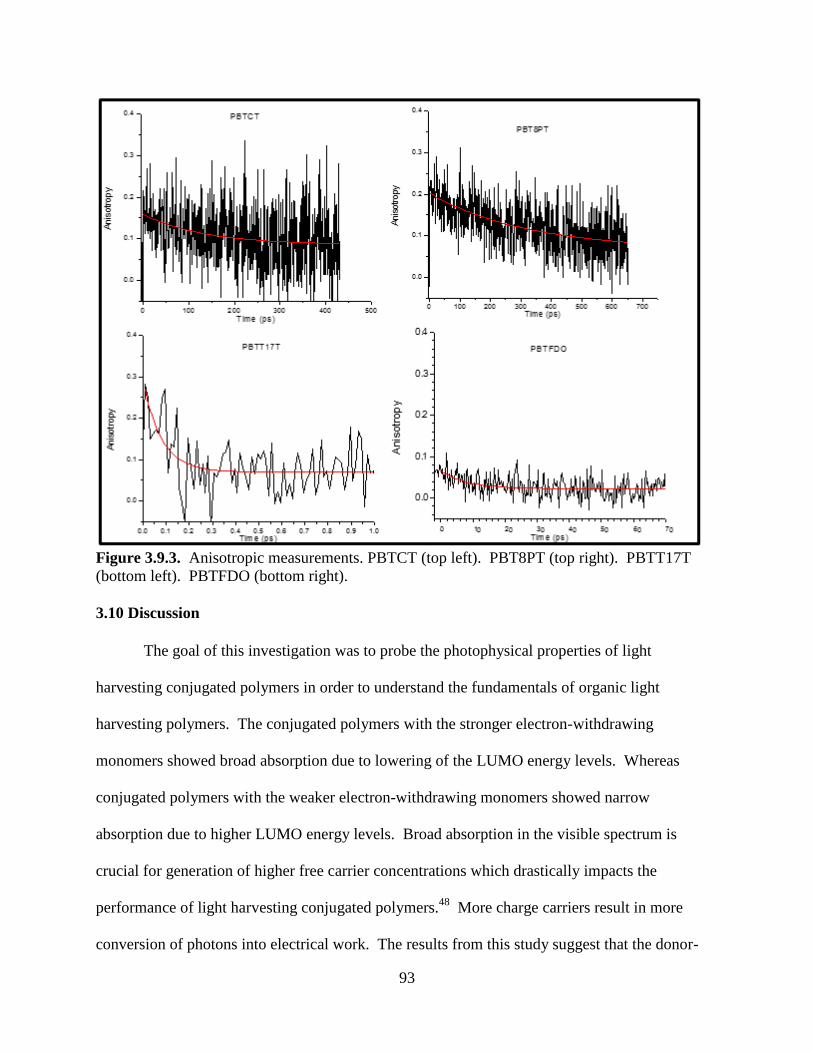
93
Figure 3.9.3. Anisotropic measurements. PBTCT (top left). PBT8PT (top right). PBTT17T
(bottom left). PBTFDO (bottom right).
3.10 Discussion
The goal of this investigation was to probe the photophysical properties of light
harvesting conjugated polymers in order to understand the fundamentals of organic light
harvesting polymers. The conjugated polymers with the stronger electron-withdrawing
monomers showed broad absorption due to lowering of the LUMO energy levels. Whereas
conjugated polymers with the weaker electron-withdrawing monomers showed narrow
absorption due to higher LUMO energy levels. Broad absorption in the visible spectrum is
crucial for generation of higher free carrier concentrations which drastically impacts the
performance of light harvesting conjugated polymers.48
More charge carriers result in more
conversion of photons into electrical work. The results from this study suggest that the donor-

94
acceptor conjugated polymers with the stronger electron-withdrawing monomers will be able to
harvest a wide spectrum of photons which will result in more charge carrier generation which
will increase the efficiency of the solar cell. The results show that conjugated polymers with
strong electron-withdrawing monomers had low quantum yields due to fluorescent quenching
which is desirable for efficient energy transfer along the polymer backbone. The excitation of
the conjugated polymer results in a hole and electron pair that are attracted to each other by
columbic force, forming a quasiparticle exciton. Overcoming the columbic attraction is
imperative for OPV efficiency. If the donor-acceptor polymer cannot dissociate the electron-
hole pair, electron-hole pair recombination will occur resulting in decreased efficiency and
higher quantum yields.53
The low quantum yields of the conjugated polymers in this study with
strong electron-withdrawing monomers are indicative of sufficient exciton dissociation and
reduction of charge recombination.
The conjugated polymers with strong electron-withdrawing monomers had large two-
photon absorption cross-sections due to large transition dipoles. Conjugated polymers with weak
electron-withdrawing monomers had much smaller two-photon absorption cross-sections. High
two-photon absorption cross-sections are attributed to the repeating donor-acceptor units
introducing nonlinearity which increases the transition dipole moment which increases the
potential for charge transfer.23
The two-photon absorption results further demonstrate the effect
that strong electron-withdrawing monomers have on charge transfer.
The fluorescent dynamics showed that the polymers with strong electron-withdrawing
monomers had very fast decay dynamics. Whereas polymers with weak electron-withdrawing
monomers had much longer decay dynamics. The fast decay dynamics can be attributed to the
strong electron-withdrawing effects, which creates a strong pull that results in a quick

95
delocalization and relaxation.23
The longer decay dynamics for the weaker electron-withdrawing
monomers maybe be a result of an absence of a pathway for energy to be delocalized and less
driving force for the relaxation due to the weaker electron-withdrawing strength.54
The fast
decay dynamics are important for preventing charge recombination and allowing for efficient
energy transfer.
Fluorescence anisotropic measurements were used to investigate energy transfer along
the polymer backbone. 50,55
The anisotropic decay times can be used to measure the time scales
of the energy transfer.49
Anisotropic decay times of <650 fs correspond to strong electronic
coupling resulting in Dexter-type energy transfer. For longer time anisotropic decay times, over
>650 fs, the migration can be described as incoherent hopping(~1-50ps), and coherent energy
mechanisms that can last a few nanoseconds.56
The anisotropic decay can be seen in Table
3.10.1. Augmenting the electron-withdrawing strength resulted in different relaxation processes
to be activated for energy transfer. Strong electron-withdrawing acceptors had anisotropic decay
times that were consistent with Förster energy transfer, whereas weaker withdrawing acceptors
showed anisotropic decay times that were consistent with coherent energy transfer. Placing a
linker between the donor and acceptor resulted in a very fast anisotropic decay which is
consistent with Dexter-type energy transfer.
Table 3.10.1. Anisotropy and Power Conversion Efficiency.
Polymer Initial Anisotropy Value Anisotropic Decay Time (ps) Power Conversion Efficiency (%)
PTB7 0.09 48 7.40
PBTCT 0.163 130 1.13
PBT8PT 0.22 320 6.78
PBTT17T 0.27 0.08 Not recorded
PBTFDO 0.07 8 0.27

96
3.11 Conclusions
The photophysical results from this study underline the complex nature of photon
harvesting for electricity generation. In general, polymer designs that have low quantum yields,
fast decay dynamics, reasonably large dipole moments, large two-photon absorption cross-
sections, and efficient energy transfer, will produce photon harvesting devices that will have
good PCE. These properties were augmented in this study by the addition of various electron
withdrawing groups on the acceptor. The photophysical experiments on these polymers give
insight into the complex mechanisms that are responsible for efficient light harvesting which can
be useful for further improvement of PCE of light harvesting conjugated polymers.
Acknowledgement
This material is based upon work supported by the U.S. Department of Energy, Office of
Science, Office of Basic Energy Sciences, Photochemistry, via Grant DE-SC0012482.
References
(1) Snaith, H. J. Estimating the Maximum Attainable Efficiency in Dye-Sensitized Solar
Cells. Adv. Funct. Mater. 2010, 20, 13-19.
(2) Pelc, R.; Fujita, R. M. Renewable Energy from the Ocean. Mar. Policy 2002, 26, 471-479.
(3) McKendry, P. Energy Production from Biomass (Part 1): Overview of Biomass.
Bioresour. Technol. 2002, 83, 37-46.
(4) Turner, J. A Realizable Renewable Energy Future. Science 1999, 285, 687-689.
(5) Lewis, N. S.; Nocera, D. G. Powering the Planet: Chemical Challenges in Solar Energy
Utilization. Proc. Natl. Acad. Sci. 2006, 104, 15729-15735.
(6) Guter, W.; Schöne, J.; Philipps, S. P.; Steiner, M.; Siefer, G.; Wekkeli, A.; Welser, E.;
Oliva, E.; Bett, A. W.; Dimroth, F. Current-Matched Triple-Junction Solar Cell Reaching
41.1% Conversion Efficiency under Concentrated Sunlight. Appl. Phys. Lett. 2009, 94, 1-
3.
(7) Liu, M.; Johnston, M. B.; Snaith, H. J. Efficient Planar Heterojunction Perovskite Solar
Cells By Vapour Deposition. Nature 2013, 501, 395-398.

97
(8) Glaser, P. E. Power From the Sun: Its Future. Science 1968, 162, 857-861.
(9) Dresselhaus, M. S.; Thomas, I. L. Alternative Energy Technologies. Nature 2001, 414,
332-337.
(10) Panwar, N. L.; Kaushik, S. C.; Kothari, S. Role of Renewable Energy Sources in
Environmental Protection: A Review. Renew. Sustain. Energy Rev. 2011, 15, 1513-1523.
(11) Thekaekara, M. P. Solar Energy Outside the Earth's Atmosphere. Sol. Energy 1973, 14,
109-127.
(12) Gueymard, C.A. The Sun's Total and Spectral Irradiance for Solar Energy Applications
and Solar Radiation Models. Sol. Energy 2004, 76, 423-453.
(13) Kim, B.-G.; Chung, K.; Kim, J. Molecular Design Principle of All-organic Dyes For Dye-
Sensitized Solar Cells. Chemistry 2013, 19, 5220-5230.
(14) Lewis, N. S. Toward Cost-Effective Solar Energy Use. Science 2008, 315, 798-801.
(15) Brabec, C. J.; Hauch, J. A.; Schilinsky, P.; Waldauf, C. Production Aspects of Organic
Photovoltaics and Their Impact on the Commercialization of Devices. MRS Bull. 2005,
30, 50-52
(16) Kim, B.-G.; Jeong, E. J.; Chung, J. W.; Seo, S.; Koo, B.; Kim, J. A Molecular Design
Principle of Lyotropic Liquid-Crystalline Conjugated Polymers with Directed Alignment
Capability For Plastic Electronics. Nat. Mater. 2013, 12, 659-664.
(17) Jørgensen, M.; Norrman, K.; Krebs, F. C. Stability/Degradation of Polymer Solar Cells.
Sol. Energy Mater. Sol. Cells 2008, 92, 686-714
(18) Krebs, F. C. Fabrication and Processing of Polymer Solar Cells: A Review of Printing and
Coating Techniques. Sol. Energy Mater. Sol. Cells 2009, 93, 687-702.
(19) Green, M. A.; Emery, K.; Hishikawa, Y.; Warta, W.; Dunlop, E. D. Solar Cell Efficiency
Tables (Version 45). Prog. Photovoltaics Res. Appl. 2015, 23, 1-9.
(20) You, J.; Dou, L.; Yoshimura, K.; Kato, T.; Ohya, K.; Moriarty, T.; Emery, K.; Chen, C.-
C.; Gao, J.; Li, G.; Yang, Y. A Polymer Tandem Solar Cell with 10.6% Power Conversion
Efficiency. Nat. Commun. 2013, 4, 1-10.
(21) Liu, Y.; Zhao, J.; Li, Z.; Mu, C.; Ma, W.; Hu, H.; Jiang, K.; Lin, H.; Ade, H.; Yan, H.
Aggregation and Morphology Control Enables Multiple Cases of High-Efficiency
Polymer Solar Cells. Nat. Commun. 2014, 5, 1-8.
(22) Kim, B. G.; Ma, X.; Chen, C.; Ie, Y.; Coir, E. W.; Hashemi, H.; Aso, Y.; Green, P. F.;
Kieffer, J.; Kim, J. Energy Level Modulation of HOMO, LUMO, and Band-Gap in
Conjugated Polymers for Organic Photovoltaic Applications. Adv. Funct. Mater. 2013, 23,
439-445.

98
(23) Adegoke, O. O.; Jung, I. H.; Orr, M.; Yu, L.; Goodson III, T. G. Effect of Acceptor
Strength on Optical and Electronic Properties in Conjugated Polymers for Solar
Applications. J. Am. Chem. Soc. 2015, 5759-5769.
(24) Reid, O. G.; Pensack, R. D.; Song, Y.; Scholes, G. D.; Rumbles, G. Charge
Photogeneration in Neat Conjugated Polymers. Chem. Mater. 2014, 26, 561-575.
(25) Oliva, M. M.; Casado, J.; Navarrete, J. T. L.; Patchkovskii, S.; Goodson, T.; Harpham, M.
R.; Seixas De Melo, J. S.; Amir, E.; Rozen, S. Do [all]- S, S′-dioxide Oligothiophenes
Show Electronic and Optical Properties of Oligoenes and/or of Oligothiophenes. J. Am.
Chem. Soc. 2010, 132, 6231-6242.
(26) Harpham, M. R.; Süzer, Ö.; Ma, C. Q.; Bäuerle, P.; Goodson, T. Thiophene Dendrimers as
Entangled Photon Sensor Materials. J. Am. Chem. Soc. 2009, 131, 973-979.
(27) Ramakrishna, G.; Bhaskar, A.; Bauerle, P.; Goodson, T. Oligothiophene Dendrimers as
New Building Blocks for Optical Applications. J. Phys. Chem. A 2008, 112, 2018-2026.
(28) Bhaskar, A.; Ramakrishna, G.; Hagedorn, K.; Varnavski, O.; Mena-Osteritz, E.; Bäuerle,
P.; Goodson, T. Enhancement of Two-Photon Absorption Cross-Section in Macrocyclic
Thiophenes with Cavities in the Nanometer Regime. J. Phys. Chem. B 2007, 111, 946-
954.
(29) Jung, I. H.; Lo, W.; Jang, J.; Chen, W.; Landry, E. S.; Lu, L.; Talapin, D. V; Yu, L.; Zhao,
D. Synthesis and Search for Design Principles of New Electron Accepting Polymers for
All-Polymer Solar Cells. Chem. Mater. 2014, 26, 3450-3459.
(30) He, Z.; Zhong, C.; Su, S.; Xu, M.; Wu, H.; Cao, Y. Enhanced Power-Conversion
Efficiency in Polymer Solar Cells Using an Inverted Device Structure. Nat. Photonics
2012, 6, 593-597.
(31) Carsten, B.; Szarko, J. M.; Son, H. J.; Wang, W.; Lu, L.; He, F.; Rolczynski, B. S.; Lou, S.
J.; Chen, L. X.; Yu, L. Examining the Effect of the Dipole Moment on Charge Separation
in Donor-Acceptor Polymers for Organic Photovoltaic Applications. J Am Chem Soc
2011, 133, 20468-20475.
(32) Zhang, X.; Shim, J. W.; Tiwari, S. P.; Zhang, Q.; Norton, J. E.; Wu, P.-T.; Barlow, S.;
Jenekhe, S. A.; Kippelen, B.; Brédas, J.-L.; Marder, S. R. Dithienopyrrole–
Quinoxaline/Pyridopyrazine Donor–Acceptor Polymers: Synthesis and Electrochemical,
Optical, Charge-Transport, and Photovoltaic Properties. J. Mater. Chem. 2011, 21, 4971-
4982.
(33) Gedefaw, D.; Tessarolo, M.; Zhuang, W.; Kroon, R.; Wang, E.; Bolognesi, M.; Seri, M.;
Muccini, M.; Andersson, M. R. Conjugated Polymers Based on Benzodithiophene and
Fluorinated Quinoxaline for Bulk Heterojunction Solar Cells: Thiophene Versus
Thieno[3,2-b]thiophene as π-Conjugated Spacers. Polym. Chem. 2014, 5, 2083-2093.
(34) Son, H. J.; Lu, L.; Chen, W.; Xu, T.; Zheng, T.; Carsten, B.; Strzalka, J.; Darling, S. B.;

99
Chen, L. X.; Yu, L. Synthesis and Photovoltaic Effect in Dithieno[2,3-d:2',3'-
d']Benzo[1,2-b:4,5-b']dithiophene-Based Conjugated Polymers. Adv. Mater. 2013, 25,
838-843.
(35) Zhou, H.; Yang, L.; You, W. Rational Design of High Performance Conjugated Polymers
for Organic Solar Cells. Macromolecules 2012, 45, 607-632.
(36) Hou, J.; Park, M.-H.; Zhang, S.; Yao, Y.; Chen, L.-M.; Li, J.-H.; Yang, Y. Bandgap and
Molecular Energy Level Control of Conjugated Polymer Photovoltaic Materials Based on
Benzo[1,2-b:4,5-b']dithiophene Macromolecules 2008, 41, 6012-6018.
(37) Varnavski, O.; Yan, X.; Mongin, O.; Blanchard-Desce, M.; Goodson, T. Strongly
Interacting Organic Conjugated Dendrimers with Enhanced Two-Photon Absorption. J.
Phys. Chem. C 2007, 111, 149-162.
(38) Varnavski, O.; Leanov, A.; Liu, L.; Takacs, J.; Goodson III, T. Large Nonlinear
Refraction and Higher Order Nonlinear Optical Effects in a Novel Organic Dendrimer. J.
Phys. Chem. B 2000, 104, 179-188.
(39) Flynn, D. C.; Ramakrishna, G.; Yang, H.; Northrop, B. H.; Stang, P. J.; Goodson, T.
Ultrafast Optical Excitation in Supramolecular Metallacycles with Charge Transfer
Properties. J Am Chem Soc 2010, 132, 1348-1358.
(40) Xu, C.; Webb, W. W. Measurement of Two-Photon Excitation Cross Sections of
Molecular Fluorophores with Data from 690 to 1050 nm. J. Opt. Soc. Am. B 1996, 13,
481-491.
(41) Clark, T. B.; Orr, M. E.; Flynn, D. C.; Goodson, T. Synthesis and Optical Properties of
Two-Photon Absorbing GFP-Type Probes. J. Phys. Chem. C 2011, 115, 7331-7338.
(42) Furgal, J. C.; Jung, J. H.; Goodson, T.; Laine, R. M. Analyzing Structure − Photophysical
Property Relationships for Isolated T 8 , T 10 , and T 12 Stilbenevinylsilsesquioxanes. J
Am Chem Soc 2013, 135, 12259-12269.
(43) Liang, Y.; Xu, Z.; Xia, J.; Tsai, S. T.; Wu, Y.; Li, G.; Ray, C.; Yu, L. For the Bright
Future-Bulk Heterojunction Polymer Solar Cells with Power Conversion Efficiency of
7.4%. Adv. Mater. 2010, 22, 135-138.
(44) Lu, L.; Yu, L. Understanding Low Bandgap Polymer PTB7 and Optimizing Polymer Solar
Cells Based on it. Adv. Mater. 2014, 26, 4413-4430.
(45) Zhang, X.-F. The Effect of Phenyl Substitution on the Fluorescence Characteristics of
Fluorescein Derivatives via Intramolecular Photoinduced Electron Transfer. Photochem.
Photobiol. Sci. 2010, 9, 1261-1268.
(46) Zhang, X.-F.; Zhang, I.; Liu, L. Photophysics of Halogenated Fluoresceins: Involvement
of Both Intramolecular Electron Transfer and Heavy Atom Effect in the Deactivation of
Excited States. Photochem. Photobiol. 2010, 86, 492-498.

100
(47) Norman, P.; Luo, Y.; Ågren, H. Large Two-Photon Absorption Cross Sections in Two-
Dimensional, Charge-Transfer, Cumulene-Containing Aromatic Molecules. J. Chem.
Phys. 1999, 111, 7758-7765.
(48) Son, S. K.; Kim, Y.-S.; Son, H. J.; Ko, M. J.; Kim, H.; Lee, D.-K.; Kim, J. Y.; Choi, D.
H.; Kim, K.; Kim, B. Correlation between Polymer Structure and Polymer:Fullerene
Blend Morphology and Its Implications for High Performance Polymer Solar Cells. J.
Phys. Chem. C 2014, 118, 2237-2244.
(49) Grage, M. M. L.; Pullerits, T.; Ruseckas, A.; Theander, M.; Inganäs, O.; Sundström, V.
Conformational Disorder of a Substituted Polythiophene in Solution Revealed by
Excitation Transfer. Chem. Phys. Lett. 2001, 339, 96-102.
(50) Grage, M. M. L.; Wood, P. W.; Ruseckas, A.; Pullerits, T.; Mitchell, W.; Burn, P. L.;
Samuel, I. D. W.; Sundström, V. Conformational Disorder and Energy Migration in MEH-
PPV with Partially Broken Conjugation. J. Chem. Phys. 2003, 118, 7644-7650.
(51) Martinsson, P.; Sundström, V.; Åkesson, E. An Ultrafast Time-Resolved Anisotropy
Study of Bacteriochlorophyll a in Pyridine. FEBS Lett. 2000, 465, 107-109.
(52) Cho, S.; Rolczynski, B. S.; Xu, T.; Yu, L.; Chen, L. X. Solution Phase Exciton Diffusion
Dynamics of a Charge-Transfer Copolymer PTB7 and a Homopolymer P3HT. J. Phys.
Chem. B 2015, 119, 7447-4756.
(53) Lemaur, V.; Steel, M.; Beljonne, D.; Brédas, J. L.; Cornil, J. Photoinduced Charge
Generation and Recombination Dynamics in Model Donor/Acceptor Pairs for Organic
Solar Cell Applications: A full Quantum-Chemical Treatment. J. Am. Chem. Soc. 2005,
127, 6077-6086.
(54) Lahankar, S. A.; West, R.; Varnavski, O.; Xie, X.; Goodson, T.; Sukhomlinova, L.;
Twieg, R. Electronic Interactions in a Branched Chromophore Investigated by Nonlinear
Optical and Time-Resolved Spectroscopy. J. Chem. Phys. 2004, 120, 337-344.
(55) Westenhoff, S.; Daniel, C.; Friend, R. H.; Silva, C.; Sundström, V.; Yartsev, A. Exciton
Migration in a Polythiophene: Probing the Spatial and Energy Domain by Line-Dipole
Förster-Type Energy Transfer. J. Chem. Phys. 2005, 122, 1-8.
(56) Grage, M.; Zaushitsyn, Y.; Yartsev, A.; Chachisvilis, M.; Sundström, V.; Pullerits, T.
Ultrafast Excitation Transfer and Trapping in a Thin Polymer Film Phys. Rev. B 2003, 67,
1-5.

101
Chapter 4
The Role of Donor Conjugation Length on the Optical Properties of Donor-Acceptor Light
Harvesting Conjugated Polymers: An Investigation of Thiophene Additions to s-Indacene
Donors with Diketopyrrolopyrrole, Isoindigo, and Thienothiophene Acceptors
Bradley Keller, Hyungjun Kim, Zhengxu Cai, Audrey Eshun, Luping Yu, Theodore Goodson III
4.1 Abstract
New donor-acceptor light harvesting polymers with either a 4,4,9,9-tetrakis(4-
hexylphenyl)-4,9-dihydro-s-indaceno[1,2-b:5,6-b']dithiophene (IDT) or a 4,4,9,9-tetrakis(4-
hexylphenyl)-4,9-dihydro-s-indaceno[1,2-b:5,6-b']dithienothiophene (IDTT) donor subunit with
either a 2-(nonadecan-9-yl)-5-(2-octyldodecyl)-3,6-di(thiophen-2-yl)-2,5-dihydropyrrolo[3,4-
c]pyrrole-1,4-dione (DPP), (E)-1,1'-bis(2-octyldodecyl)-[3,3'-biindolinylidene]-2,2'-dione (II),
or 3-ethyl-1-(thieno[3,4-b]thiophen-2-yl)heptan-1-one (TT) acceptor were synthesized. In this
study the effects of donor conjugation length and donor-acceptor combination on the optical
properties were investigated with ultrafast spectroscopic techniques and computational methods.
The polymers with the extended conjugated donor had significantly enhanced absorption near
400 nm. Fluorescence upconversion experiments revealed that the donor conjugation length
increased the fluorescence lifetimes for the extended conjugated polymers. Two-Photon
Absorption (TPA) experiments and computational methods showed that the extended conjugated
donor polymers exhibited enhanced charge transfer characteristics. Transient Absorption (TA)
investigations revealed new optical species for the extended donor polymers. This study has
shown the considerable effect that donor conjugation has on the optical properties of donor-

102
acceptor light-harvesting conjugated polymers. The results from this work can be used in
the design and synthesis of new donor-acceptor polymers for organic photovoltaics.
4.2 Introduction
Global population has seen rapid growth and with this growth, there has been a growth in
energy demand and consumption.1,2
With this increase in consumption, there has been an
increase in climate change due to the pollution that is attributed to the burning of fossil fuels for
energy generation.3 This has led to interest in cleaner, renewable, and greener sources of energy,
such as solar energy harvesting.4 Indeed, solar energy harvesting systems have seen an average
annual growth in global photovoltaic capacity of 40%.5 The most prominent solar harvesting
systems are solar cells. Solar cells consist of electron rich and electron poor active material that
absorb sunlight, converting photonic energy into electron and hole charge carriers that are
responsible for electricity generation.6 Traditionally, solar cell absorbing active materials have
used inorganic semiconductors for light harvesting, but these materials are brittle, inflexible,
have low optical absorption coefficients in the visible region of electromagnetic spectrum,
require high temperature and pressures for manufacturing, or contain toxic elements.7–10
This
has limited the number of applications that these materials can be used in and contribute to the
overall cost of using these technologies.
This has led to interest in organic light harvesting materials that can improve upon the
drawbacks of their inorganic counterparts. Organic solar harvesting materials have high optical
absorption coefficients, flexible, lightweight, easily tunable band gaps, and are readably solution
processable.11–14
In organic solar cells an absorbing organic layer is sandwiched between two
conducting electrodes, typically a conducting glass on the top and a metallic electrode on the
bottom. Light is absorbed by the absorbing organic layer forming a tightly bound exciton, an

103
electron-hole pair. Another organic layer is used to overcome the binding energy of the exciton
to dissociate the electron from the hole, forming free charge carriers that then flow to the
electrodes, with the electrons flowing to the cathode and the holes flowing to the anode. The
most promising organic solar harvesting devices have incorporated low band gap organic donor-
acceptor (D-A) conjugated polymers that serve as the photon absorbing material and hole
transporting material, and an organic acceptor material that has high electron affinity in order for
charge separation and electron transport.15
Donor-acceptor polymers have a relatively simple motif, but finding suitable donor and
acceptor monomers that lead to high power conversion efficiencies is no easy task. There have
been a few promising donor monomers that have been incorporated in light harvesting D-A
polymers that have resulted in high efficiencies. Benzodithiophene (BDT) has shown great
promise as the electron rich donor subunit in D-A polymers. BDT is a planar conjugated
monomer composed of a central benzene and a fused thiophene unit on both ends of the central
benzene unit. It is relatively easy to synthesize and easily modified.16
The planar conjugated
backbone of the BDT unit is excellent for device π-π stacking and high hole mobilities.17
Donor-
acceptor polymers that have incorporated BDT units have shown high power conversion
efficiencies.18,19
Another promising donor monomer is carbazole. Carbazole has a central
pyrrolidine unit with a benzene fused on each side. The nitrogen atom of the pyrrolidine is easily
functionalized to increase solubility and the lone pairs increase the donating ability of the donor
monomer, and the benzene rings can be functionalized to augment the solubility or donating
ability of the monomer.20,21
D-A Polymers that have incorporated carbazole donors have also
shown high power conversion efficiencies.22
One of the most promising donor subunit is the
indacenodithiophene donor monomer. Indacenodithiophene aromatic fused-ring system provides

104
a rigid structure that promotes planarity for extended conjugation, and restricts twisting and out
of plane rotation due to steric hindrance.23
The IDT structure provides great tunability with
modification of the bridging atom, introduction of electronic influencing groups, and
introduction of side groups. IDT polymers have shown high hole mobilities.24
DA polymers
that have incorporated IDT have shown high power conversion efficiencies (PCE) of more than
12%.25
As important as the donor monomer is to the D-A polymer, the acceptor monomer is as
equally as important and much research has been devoted to designing electron-withdrawing
acceptors. One promising acceptor monomer is diketopyrrolopyrole (DPP). DPP is a strong
electron withdrawing acceptor that has demonstrated high electron and hole mobilities.26,27
The
introduction of thiophene subunits on both ends of DPP connects the DPP to the donor monomer
as well as creates a Donor-Acceptor-Donor motif between the electron deficient DPP and
electron rich thiophenes.28
D-A polymers that have incorporated DPP have seen high PCEs of
up to 10%.29
Another promising acceptor monomer is isoindigo. Isoindigo consists of two
oxindole rings centrosymmetrically conjugated to each other at their 3-carbons by a central
double bond that binds two electron-withdrawing carbonyls and two electron-rich benzene rings
in trans confirmation. It has good electron-withdrawing properties, two amides that are readily
functionalized, the phenyl rings have sites for conjugation elongation, high hole mobilities,
planar backbone, and strong interchain interactions due to the rigidity of the isoindigo core.30,31
Isoindigo also has the advantage of large scale availability from natural sources which leads to a
greener overall synthetic pathway.32
Polymers that have incorporated isoindigo as acceptor units
have seen efficiencies of up to 8%.33
One of the most studied and most commonly incorporated
acceptor monomer is thienothiophene.18,34
Thienothiophene is composed of two thiophene rings

105
fused to each other. The fused ring promotes planarity and enhances conjugation along the
monomer backbone. Thienothiophene has four isomers: thieno[2,3-b]thiophene, thieno[3,4-c]
thiophene, thieno[3,2-b]thiophene, and thieno[3,4-b]thiophene; with thieno[3,4-b]thiophene
proving to be the most successfully incorporated isomer as an acceptor in donor-acceptor
polymers because it introduces an anisotropic charge distribution that is good for charge
transport.35,36
The doubly unsaturated cyclopentadiene does not show aromaticity, but
aromaticity is achieved by substituting the central carbon when a heteroatom with a lone pair that
contributes to the π resonancy. When incorporating sulfur as the heteroatom, the highest
resonance energy is achieved of 29 kcal mol-1
compared other heteroatom unsaturated
pentacyclics which is important for charge transport characteristics.34
One of the best aspects of
the thienothiophene is its ease of functionalization. The conjugation length can be extended or
electron-withdrawing groups can be attached to the monomer to impart optical and electronic
changes to the structure.37,38
D-A polymers that have incorporated thienothiophene acceptors
have achieved high power conversion efficiencies, in fact the seminal work of Liang et al
demonstrated the great potential these acceptors can have on the optoelectronic properties of D-
A polymers.19
Much research has focused on synthesizing new donor materials and acceptor materials,
device architectures, morphologies, optical properties of devices, electrical properties of devices,
but limited attention has been on the dynamic fundamental optical properties of the D-A
conjugated polymers light absorbing materials.39–43
In fact, there is still much debate on the
mechanisms that lead to the optoelectronic properties of these materials.44–46
Numerous studies
have investigated the optoelectronic properties of bulk heterojunction donor-acceptor systems,
but a deeper understanding of the dynamic optical properties of D-A conjugated polymers that

106
are used as the donating materials in organic solar cells will go a long way in unraveling the
mysteries responsible for high power conversion efficiency organic solar cells.47–49
There have been many studies that have focused on the effects that the acceptor monomer
has on the optical properties of donor-acceptor polymers. The electron-withdrawing strength of
the acceptor has significant influence on the electronic and optical properties of the donor-
acceptor polymer. From electrochemical studies and computations, it is known that the LUMO
of the acceptor closely matches the LUMO of the donor-acceptor polymer.50,51
By introducing
electron-withdrawing groups to the acceptor monomer, the band gap of the donor-acceptor
polymer can be easily tuned.52
Acceptor strength has also had profound effects on the optical
properties of light-harvesting D-A polymers. D-A Polymers with strong acceptors have seen an
enhancement of light absorbing capabilities in the high solar flux regions of the visible
spectrum,53
greater charge transfer, and quenched fluorescence. This has led to high power
conversion efficient donor-acceptor polymers such as PTB7.54
But effects of acceptor strength
on optoelectronic properties are not so clear cut, D-A polymers with strong acceptors with great
charge transfer characteristics, quenched fluorescence, and good absorption properties have also
produced low power conversion efficiencies due to local exciton trapping preventing efficient
transfer along the polymer backbone.55
Thus more investigation is needed in order to get a better
understanding of the influence of acceptors on the fundamental optoelectronic properties of light
harvesting donor-acceptor polymers.
Studies that focus on the donor influence on the optical properties of light harvesting
donor-acceptor polymers are relatively sparse. Electron-rich donors with strong acceptors are
imperative in promoting charge transfer along the polymer backbone. The HOMO of donor
significantly influences the HOMO of the polymer, and the polymer HOMO and acceptor

107
material LUMO offset determine the open circuit voltage.56
Strong donors have lower onset
oxidation potentials and contribute to lower band gaps.57
But too strong of a donor results in
poor charge carrier extraction due to poor energy level mismatch in the device. Attempts have
been made to enhance the donating ability of donor monomer increase the power efficiency of
donor-acceptor devices. One method has focused on increasing the donor conjugation, but too
large of a conjugated donor system results in out of plane twisting of the donor in respect to the
acceptor resulting in poorer power efficiencies.58
Donating groups have also been added to the
donor monomer to increase the donating ability, but often times the donating groups can also
increase steric hindrance between donor and the acceptor decreasing the conjugation length
along the polymer backbone.59–61
Thus designing donor monomers is no easy task as well.
In this study, six donor-acceptor polymers were synthesized and their optical properties
were investigated. Each polymer had a 4,4,9,9-tetrakis(4-hexylphenyl)-4,9-dihydro-s-
indaceno[1,2-b:5,6-b']dithiophene (IDT) or a 4,4,9,9-tetrakis(4-hexylphenyl)-4,9-dihydro-s-
indaceno[1,2-b:5,6-b']dithienothiophene (IDTT) donor with either a 2-(nonadecan-9-yl)-5-(2-
octyldodecyl)-3,6-di(thiophen-2-yl)-2,5-dihydropyrrolo[3,4-c]pyrrole-1,4-dione (DPP), (E)-1,1'-
bis(2-octyldodecyl)-[3,3'-biindolinylidene]-2,2'-dione (II), or 3-ethyl-1-(thieno[3,4-b]thiophen-2-
yl)heptan-1-one (TT) acceptor. The extended conjugation of the donor should promote a more
planar, linear, and rigid structure while not introducing steric hindrance between the donor and
acceptor unit. The introduction of different strength and size acceptors will give a better insight
into the interaction between the donor and acceptor and its effect on the optical properties.
Optical properties were investigated using steady state spectroscopy. All of D-A polymers
exhibited a high and low energy absorption. The conjugation extension had little effect on peak
absorption maximum, but there was a significant increase in molar absorptivity for wavelengths

108
<500 nm. Polymers with stronger acceptors had red-shifted absorption maxima. Polymers with
extended donor system had higher quantum yields (QY). The optical and nonlinear properties
were investigated using ultrafast spectroscopic techniques. Ultrafast fluorescence upconversion
technique was used to investigate the fluorescence lifetime of the D-A polymers. D-A polymers
with the extended conjugation show longer fluorescence lifetimes indicating longer lived
excitonic states. Two-photon absorption (TPA) properties were investigated utilizing ultrafast
Two-Photon Excitation Fluorescence (TPEF) method in order to investigate the charge transfer
characteristics of the polymers. The polymers with stronger acceptors had the highest TPA
cross-sections compared to their corresponding analogue indicating improved charge transfer
characteristics. Ultrafast transient absorption experiments were employed to investigate the
excited state dynamics of the investigated polymers. Transient absorption experiments revealed
significant changes in the excited state dynamics. In particular, new species are seen for the
extended conjugated donors with additional bleached or ESA states in the transient spectra.
Computational methods were used to investigate the effect that polymerization and donor
conjugation length had on the optical properties of the investigated polymers. These experiments
have shown the profound impact that donor conjugation length has on the optical properties of
the investigated polymers.
4.3 Experimental
4.3.1 Steady State UV-Vis and Emission Measurements
The investigated polymers were dissolved in chloroform for all steady state experiments.
Concentrations of 3.0 X 10⁻⁶
M were used for all steady state experiments and concentrations of
3.0 X 10⁻⁶
M or lower were used for quantum yield experiments. Steady state absorption spectra
were measured using an Agilent 8432 UV-visible absorption spectrophotometer. Steady state

109
emission spectrum measurements were carried out with a Fluoromax-2 spectrophotometer.
Styryl 9m (ɸ = 0.54) in chloroform was used as the fluorimetric standard for the calculation of
the fluorescence quantum yield for P2 and P5 using the well-known comparative method.62,63
Zinc phthalocyanine (ɸ = 0.30) in pyridine was used as the fluorimetric standard for quantum
yield determination of P1, P3, P4, and P6.64
The quantum yields were measured at 430 nm
excitation.
4.3.2 Two-Photon Absorption (TPA) Experiments
The two-photon-absorption (TPA) cross sections were measured using the two-photon
excited fluorescence (TPEF) method.65
The setup employs a mode-locked Spectra-Physics
femtosecond Mai Tai laser, which is tunable from 700 to 900 nm, to generate 110-fs pulses. For
the experiments in this study, the Spectra-Physics Mai Tai laser generated a 775 nm with 110-fs
pulsewidth to pump a Spectra-Physics femtosecond synchronously pumped optical parametric
oscillator (OPAL), which produced 1250 nm(for P3 and P6 excitation) or 1300 nm( for P1, P2,
P4, and P5 excitation) with 150-fs excitation pulses. The beam was directed into a solution in a
sample cell (quartz cuvette, 1 cm path length), and the resultant fluorescence was collected in a
direction perpendicular to the incident beam. A lens was used to direct the collected fluorescence
into a monochromator. The output from the monochromator was directed into a photomultiplier
tube (PMT), and the photons were converted into counts by a photon counting unit. The
photomultiplier tube was connected to the computer through a photon counting unit
(Hamamatsu) for signal recording. Zn 2,9,16,23-tetra-tert-butyl-29H,31H-phthalocyanine and
Styryl 9m have known TPA cross-sections and were used as standards for comparative method
determination of TPA cross-sections.66

110
4.3.3 Fluorescence Upconversion Experiments
The time-resolved fluorescence experiments were performed using a fluorescence setup
that had previously been described.67
A femtosecond Mode-locked Ti-sapphire pulsed laser
(Spectra Physics Tsunami) was used to generate 80 fs pulses at 800 nm wavelength with a
repetition rate of 82 MHz. The Tsunami was pumped by a 532 nm continuous wave Millennia
(Spectra Physics) laser. An excitation pulse of 400 nm was generated by a second harmonic BBO
crystal, and the residual 800 nm beam was used as an optical gate by a computer-controlled
motorized optical delay line. The polarization of the excitation beam was controlled by a berek
compensator. The fluorescence signal of the sample was up-converted by a BBO crystal by using
the residual 800 nm beam, which is delayed by the optical delay line with a gate step size of 6.25
fs. This allows the fluorescence decay dynamics to be measured temporally. A monochromator is
used to select the wavelength of the up-converted signal which is detected by a photomultiplier
tube (R152P, Hamamatsu). The instrument response function (IRF) has been determined from
the Raman signal of water to have a width of 110 fs.
4.3.4 Transient Absorption Experiments
The femtosecond transient absorption experiment setup has been described previously.68
The femtosecond transient absorption investigations were carried out using ultrafast pump-probe
techniques with detection in the visible region. The laser system produces 1-mJ, 100-fs pulses at
800 nm with a repetition rate of 1 kHz that were obtained from a Nd:YLF(Spectra Physics
Empower)-pumped Ti:Sapphire regenerative amplifier (Spectra Physics Spitfire) with the input
from a continuous wave Nd:YVO4 (Spectra Physics Millennia)-pumped Ti:Sapphire oscillator
(Spectra Physics Tsunami). The output of laser beam was split to generate pump and probe beam
pulses with a beam splitter (85% and 15%, respectively). The pump beam was generated by an
111
optical parametric amplifier (Spectra Physics OPA-800). The 400 nm pump beam was produced
from the second harmonic of the idler beam using a BBO. The white light continuum probe
beam was generated from the amplified beam by a Helios system (Ultrafast Systems Inc). The
probe beam was generated by a 2 mm sapphire plate generating a white light continuum from
450 nm to 750 nm. The time delay between the pump and probe was controlled with a
computer-controlled motion controller. The white light and the pump beam were overlapped in a
2 mm quartz cuvette containing the sample with a magnetic stirrer. The typical energy probe
beam is < 0.1 µJ, while the pump beam energy is ~1 – 2 µJ per pulse. Magic angle polarization
is kept consistent between the pump and probe using a polarizer. The change in absorbance as a
function of time for the signal was collected by a CCD detector (Ocean Optics). Data acquisition
was controlled by software from Ultrafast Systems Inc.
4.4 Molecular Structures and Molecular Properties
The molecular properties of the investigated properties can be seen in Table 4.4.1 and the
molecular structures can be seen in Figure 4.4.1. All of the polymers had a polydispersity (PDI)
near 2 except for P3, which had a slightly higher PDI of 2.61. The average number molecular
weight (Mn) for all the polymers was between 20 kDa and 40 kDa. The weight average
molecular weight (Mw) was between 40 kDa to 90 kDa. The number of repeat units varied from
13 repeat units (RPU) to 24 RPU. The number of repeat units was fairly close between polymers
with the same acceptor type, except for P2 and P5, where P2 has two times the number of repeat
units in P5. The two polymers are still comparable because the persistence length of conjugated
light harvesting polymers are much smaller than the length of the polymer, and optical properties
can be normalized to the number of repeat units.

112
Table 4.4.1. Molecular Properties
Polymer Mn
(Da)
Mw
(Da)
PDI RPU
P1 25900 48200 1.86 14
P2 42500 88400 2.08 23
P3 22600 59100 2.61 17
P4 34100 62800 1.84 19
P5 22600 42800 1.90 13
P6 28300 55500 1.96 24

113
Figure 4.4.1. Polymer Structures (blue portion is the donor and red portion is the acceptor).
4.5 Steady State
4.5.1 Absorption
The steady state absorption spectra of the investigated polymers were performed in
chloroform solutions at concentrations of 3 X 10⁻⁶
M. This concentration was chosen in order to
minimize internal sample reabsorption while maximizing signal to noise ratio. The normalized
steady state absorption spectra for all of the investigated polymers can be seen in Figure 4.5.1.1.
All of the investigated polymers have broad absorption in the visible spectral region with distinct
absorption peaks in the 400-500 nm region and absorption maxima in the 600-800 nm region.
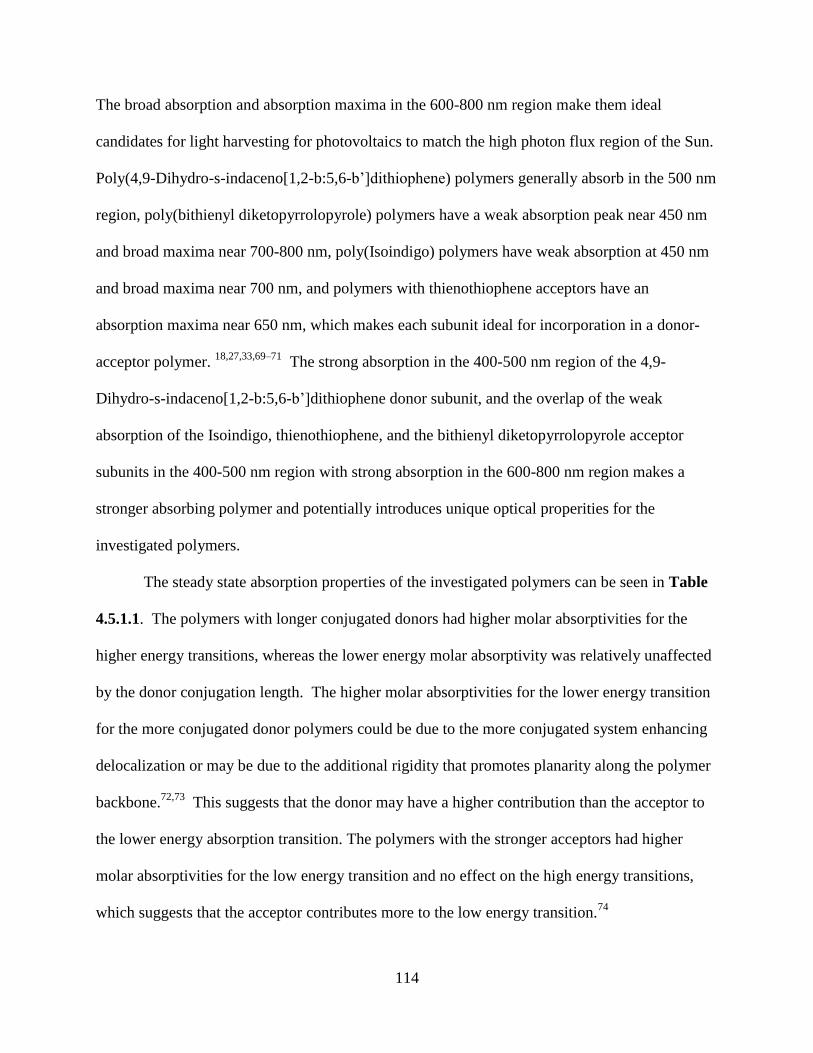
114
The broad absorption and absorption maxima in the 600-800 nm region make them ideal
candidates for light harvesting for photovoltaics to match the high photon flux region of the Sun.
Poly(4,9-Dihydro-s-indaceno[1,2-b:5,6-b’]dithiophene) polymers generally absorb in the 500 nm
region, poly(bithienyl diketopyrrolopyrole) polymers have a weak absorption peak near 450 nm
and broad maxima near 700-800 nm, poly(Isoindigo) polymers have weak absorption at 450 nm
and broad maxima near 700 nm, and polymers with thienothiophene acceptors have an
absorption maxima near 650 nm, which makes each subunit ideal for incorporation in a donor-
acceptor polymer. 18,27,33,69–71
The strong absorption in the 400-500 nm region of the 4,9-
Dihydro-s-indaceno[1,2-b:5,6-b’]dithiophene donor subunit, and the overlap of the weak
absorption of the Isoindigo, thienothiophene, and the bithienyl diketopyrrolopyrole acceptor
subunits in the 400-500 nm region with strong absorption in the 600-800 nm region makes a
stronger absorbing polymer and potentially introduces unique optical properities for the
investigated polymers.
The steady state absorption properties of the investigated polymers can be seen in Table
4.5.1.1. The polymers with longer conjugated donors had higher molar absorptivities for the
higher energy transitions, whereas the lower energy molar absorptivity was relatively unaffected
by the donor conjugation length. The higher molar absorptivities for the lower energy transition
for the more conjugated donor polymers could be due to the more conjugated system enhancing
delocalization or may be due to the additional rigidity that promotes planarity along the polymer
backbone.72,73
This suggests that the donor may have a higher contribution than the acceptor to
the lower energy absorption transition. The polymers with the stronger acceptors had higher
molar absorptivities for the low energy transition and no effect on the high energy transitions,
which suggests that the acceptor contributes more to the low energy transition.74

115
The polymers with the bithienyl diketopyrrolopyrrole and isoindigo acceptor moieties
showed distinct absorption peaks, whereas the polymers with the thienothiophene acceptor
moiety had an overlap of the lower energy and higher energy absorption peaks, regardless of
donor subunit conjugation length. For both polymer series P1-P3 and P4-P6, a bathochromic
shift of the lower energy absorption peak is seen with increasing strength of the acceptor, which
is typically seen for polymers with stronger acceptors.55
With about 20-30 nm bathochromic
shift of the low energy absorption of the polymers with the BTDPP acceptor compared to the
polymers with II acceptor, and 70-100 nm bathochromic shift of the low energy absorption of
polymers with BTDPP acceptor compared to the polymers with the TT acceptor. The higher
energy absorption peak is less affected by the acceptor strength, with red shifts of 30-40 nm for
the peak absorption for the more conjugated donor polymers with stronger acceptors and up to
~60 nm bathochromic shift for the less conjugated donor polymers with stronger acceptors. This
suggests that the acceptor strength has more influence on the lower energy absorption than the
higher energy absorption.
The donor conjugation length had a modest effect on the peak absorption wavelength for
the high energy transition. The polymers with the longer donor conjugation had 10-20 nm red
shift of the high energy absorption peak maxima. This result as well as the increase in molar
absorptivity of the higher energy transitions agrees with a greater contribution of the donor in
this transition. The donor conjugation length had a small effect on the peak absorption
wavelength for the low energy transition with a red shift of ~10 nm blue shift of the low energy
absorption peak maxima. Interestingly, for P1 and P6, there was a drastic change in the low
energy absorption peak maxima of a ~40 nm blue shift for the longer conjugated donor polymer.
This may be due to steric hindrance introduced by the additional thiophene units of the donor

116
that is alleviated in the smaller donor polymer. This pronounced effect is not seen in the other
series of polymers because the acceptor monomers in those polymers are more bulky then the TT
acceptors, which results in structures that relieve the steric hindrance in both the longer
conjugated donor and the less conjugated donor of the same series of acceptors..
400 500 600 700 800
0.0
0.2
0.4
0.6
0.8
1.0
No
rma
lize
d A
bso
rptio
n
Wavelength (nm)
P1
P2
P3
400 500 600 700 800
0.0
0.2
0.4
0.6
0.8
1.0
No
rma
lize
d A
bso
rptio
n
Wavelength (nm)
P4
P5
P6
Figure 4.5.1.1. Normalized steady state absorption of more conjugated donor polymer series P1-
P3(left) and less conjugated polymer series P4-P6(right).
Table 4.5.1.1. Steady state absorption properties(Molar absorptivities: Ɛ/104 L mol
-1 cm
-1)
4.5.2 Fluorescence
The steady state fluorescence spectra of the investigated polymers were performed in
chloroform solutions at the same concentrations that were used for the steady state absorption
Polymer High
Energy
Absorption
(nm)
Ɛ
Low Energy
Absorption
(nm)
Ɛ
P1 436 5.970 715 17.285
P2 424 7.605 692 10.115
P3 470 5.150 620 6.960
P4 429 4.345 725 17.670
P5 404 5.160 696 10.130
P6 461 4.375 657 6.690

117
experiments. The normalized steady state fluorescence spectra for all of polymers were excited
using 430 nm excitation and >600 nm excitation, which can be seen in Figure 4.5.2.1. In order
to establish that we are not selectively exciting a specific emission maxima, the polymers were
excited using 430 nm and >600 nm excitation to target the donor monomer and acceptor
monomer of the polymer, respectively. The emission maxima are independent of the excitation
wavelength, which is congruent with Kasha’s rule.75
The fluorescence spectra are narrower than
the absorption spectra for the investigated polymers. This is attributed to different absorption
units that occur in polymers due to bending or twisting that cause different conjugation absorbing
segments of the polymer. Whereas the emission is attributed to longer conjugated segments,
with excitons migrating from the higher energy shorter segments to the lower energy longer
conjugated segments that serve as the major emitters.76
All of the polymers exhibit steady state fluorescence maxima in the near-infrared region
of the electromagnetic spectra, ~700 nm – 800 nm, with minor peaks near 500 nm for P2 and P5,
and a minor peak near 550nm for P6. The emission maxima can be attributed to the relaxation of
the lower energy transition of the polymer. The minor peaks near 500 nm and 550 nm can be
attributed to the relaxation of high energy states from hot excitons that recombine during
relaxation before the energy can migrate to the lower energy transition to be emitted. P1 and P4
only had one emission peak near 740 nm, lacking the 500 nm emission seen in the other series of
polymers. This suggests that this donor-acceptor motif, regardless of the donor conjugation
length, can suppress other fluorescence pathways that are seen in the other investigated
polymers. The 500 nm emission is more pronounced in P2 than in P5, which suggests that the
longer conjugation donor of P2 promotes other radiative pathways. The 550 nm emission for P6
is attributed to the promotion of the higher energy transition state.

118
The emission maxima for polymers with comparative donors were relatively unaffected
by the increase in donor length conjugation, with the largest shifts amounting to only ~10 nm
shift suggesting that the donor conjugation length does not have significant influence on the
lower energy fluorescence transition. The polymers with stronger acceptors had emissions that
more red shifted, which is typical for donor-acceptor polymers due to the narrowing of the
bandgap which is often dominated by the acceptor strength.53,55
The Stokes shifts for
comparative donor analogues were also relatively unaffected by the increase in donor length
conjugation, although P3 did have larger Stokes shifts compared to P6 which is due to better
planarity of polymer backbone of P3 due to the longer conjugated donor system.
Since the polymer’s followed Kasha’s rule, 430 nm excitation was used for the Quantum
Yield(QY) determination. This wavelength is useful for exploring the direct excitation of the
higher energy transition as well as investigating the lower energy major emission maxima, thus
the contribution of the lower energy emission can be analyzed, if present, to the overall emission
behavior. The steady state fluorescence properties are summarized in Table 4.5.2.1.
There were significant differences between the polymer donor analogues in terms of their
QYs. Studies have investigated the effect of donor conjugation length on the optical properties
of organic donor acceptor systems. Yamaguchi et al found that longer conjugated systems and
longer conjugated donor-acceptor systems of the same type had an increase in both QY and
emission maximum.77
Whereas, Kurowska et al found in small molecule donor-acceptor
systems, that the QY decreased and the emission maximum increased with an increase in donor
ratio.78
Surprisingly, there has not been much investigation of conjugation length of the donor in
donor-acceptor polymers with tailored donor and acceptor subunits. The polymers in this study
with longer donor conjugation lengths had higher QYs than their corresponding shorter donor

119
polymer analogues. This suggests that the two additional fused thiophenes promotes radiation
relaxation pathways compared to their less conjugated donor polymers. The emission maxima
for the polymers increased with increasing acceptor strength due to the narrowing of the optical
bandgap, which is typically seen with polymers with strong acceptors.79
Interestingly, quenching
of the fluorescence was not seen with increasing acceptor strength for the investigated polymers,
which is also typically seen with polymers with strong acceptors.80
This suggests that the
acceptors are strong enough to promote exciton formation, but too strong where the exciton is
trapped and then quenched. In order to have efficient solar harvesting polymers, the exciton
must be able to survive long enough to eventually get to the donor polymer and acceptor
interface for the exciton dissociation. The optical lifetimes will be thoroughly discussed in the
time resolved experiments sections of this paper.
500 600 700 800 900
0.0
0.2
0.4
0.6
0.8
1.0
No
rma
lize
d F
luro
esce
nce
Wavelength
P1(Excited at 430 nm)
P1(Excited at 650 nm)
P2(Excited at 430 nm)
P2(Excited at 650 nm)
P3(Excited at 430 nm)
P3(Excited at 625 nm)
500 600 700 800 900
0.0
0.2
0.4
0.6
0.8
1.0
No
rma
lize
d F
luo
rescen
ce
Wavelength (nm)
P4(Excited at 430 nm)
P4(Excited at 660 nm)
P5(Excited at 430 nm)
P5(Excited at 660 nm)
P6(Excited at 430 nm)
P6(Excited at 650 nm)
Figure 4.5.2.1. Normalized steady state fluorescence of P1-P3(Left) and P4-P6(Right) at 430 nm
excitation for donor excitation (solid line) and >600 nm excitation for acceptor excitation(dashed
line)

120
Table 4.5.2.1. Steady state fluorescence properties
Polymer Max
Fluorescence(nm)
QY Stokes Shift
(nm)
P1 738 0.82+0.05 23
P2 780 0.19+0.08 88
P3 695 0.44+0.08 75
P4 749 0.65+0.12 24
P5 772 0.14+0.04 76
P6 709 0.13+0.03 52
4.6 Quantum-Mechanical Calculations
4.6.1 Basis Set and Level of Theory
A computational investigation into the structural and electronic properties of the
investigated polymers in chloroform were carried out using Density Functional Theory (DFT)
and Time Dependent Density Functional Theory (TDDFT) using GAMESS suite of programs.
The B3LYP level of theory was used to calculate the geometry and orbital energy levels of
monomer, dimer, trimer, and tetramer in order to approximate the geometry and orbital energy
levels of the investigated conjugated polymers. B3LYP is a hybrid functional that uses Becke's 3
paramater(B3) exchange correlation functional which uses 3 parameters to mix in the exact
Hartree-Fock exchange correlation and the Lee Yang and Parr(LYP) correlation functional that
recovers dynamic electron correlation. B3LYP has been used extensively in computational
chemistry to describe geometry and orbital energy levels for conjugated polymers and has
produced comparable orbital energy levels to experimentally obtained orbital energy levels. It is
particularly useful for donor acceptor polymers because of its ability to describe conjugation
effects.81
Another hybrid functional was also used, wB97x-D, to compare the two levels of
theory with split valence 6-31G(d) basis set. wB97x-D is a meta-GGA DFT functional that

121
includes the second derivative of the electron density and contains empirical dispersion terms
and long-range corrections to approximate the geometry and orbital energy levels. Frequency
calculations were also performed in order to ensure the minimum of the potential energy surface
for the optimized ground state geometry at the same level of theory. Then excited state
geometries and orbital energy levels were then performed by using TDDFT using the same level
of theory. Absorption, emission, and TPA cross sections were then calculated using the same
level of theory. The two levels of theory used to investigate the effects of structure property
relationships, as well as the effect of polymerization on the molecular orbital energy levels.
4.6.2 Computation
The linear and branched alkyl solubility side chains were replaced with methyl groups to
reduce computational time as well as to maintain conformational constraints introduced by the
side chains, this is a reasonable modification because it has been shown that the side chains do
not contribute to the polymer backbone electronic properties.
4.6.3 Molecular Orbital Energies of Monomers
B3LYP was used to determine the molecular orbital energies for the monomers of the
investigated polymers. B3LYP is one of the most commonly used functionals to investigate the
molecular orbital energy levels of donor-acceptor polymers.82
Because of the vast computational
costs of simulating the energy levels for large macromolecules, often times a repeat unit or a few
repeat units are used to model the electronic system. This a reasonable compromise when the
electronic properties are due to small number of repeat units, but fails for electronic systems that
are due to many repeat units or have significant energy level modulation due to polymerization.
The molecular orbital diagram for the monomers of the investigated polymers can be seen in
Figure 4.6.3.1. All of the polymers had low lying HOMO energy levels with high lying LUMO

122
energy levels. The polymers with longer conjugated donors had slightly higher HOMO and
LUMO energy levels ~0.05 eV, with larger discrepancies seen for the HOMO energy levels
which are more correlated with donor subunit HOMO. The polymers with the more electron-
withdrawing acceptors had deeper lying LUMOs which resulted in smaller bandgaps. The
HOMO, LUMO, and bandgaps can be seen in Table 4.6.3.1.
1 2 3 4 5 6
-5.0
-4.5
-4.0
-3.5
-3.0
-2.5
-2.0
HOMO
LUMO
En
erg
y (
eV
)
Polymer
Figure 4.6.3.1. Molecular orbital energy diagram of monomers of polymers P1-P6 using
B3LYP functional.
Table 4.6.3.1. HOMO, LUMO and Bandgap energies for monomers of polymers P1-P6 using
B3LYP functional Polymer HOMO (eV) LUMO (eV) Bandgap (eV)
P1 -4.87 -2.64 -2.23
P2 -4.95 -2.80 -2.15
P3 -4.87 -2.10 -2.78
P4 -4.90 -2.61 -2.29
P5 -5.03 -2.78 -2.26
P6 -4.95 -2.01 -2.94
Unfortunately, the calculated bandgaps were not well correlated with the optical
bandgaps determined from experiments. This may be due to the failure of B3LYP to account for
dispersive forces and charge transfer character, or could be due to the monomeric unit not being

123
a good representation of the electronic system. To account for dispersive forces and charge
transfer, wB97x-D was used to calculate the molecular orbital energies of the monomer, which
can be seen in Figure 4.6.3.2. The HOMO and LUMO energies follow similar trends as those
calculated by B3LYP. The HOMO energy levels calculated by wB97x-D are close to the HOMO
energy levels calculated by B3LYP, with the largest discrepancy of 0.04 eV. However, the
LUMO energy levels calculated by wB97x-D are much lower than the LUMO energy levels
calculated by B3LYP, with discrepancies of up to 0.24 eV. As a result the bandgap, as seen in
Table 4.6.3.2, is much closer to the experimentally obtained bandgap. Although there is still a
large discrepancy between the calculated and experimentally obtained bandgaps, which suggests
dispersive forces and charge transfer do not fully account for the electronic properties of the
system.
1 2 3 4 5 6
-5.0
-4.5
-4.0
-3.5
-3.0
-2.5
-2.0
HOMO
LUMO
En
erg
y (
eV
)
Polymer
Figure 4.6.3.2. Molecular orbital energy diagram of monomers of polymers P1-P6 using
wB97x-D functional.

124
Table 4.6.3.2. HOMO, LUMO and Bandgap energies for monomers of polymers P1-P6 using
wB97x-D functional. Polymer HOMO (eV) LUMO (eV) Bandgap (eV)
P1 -4.85 -2.72 -2.13
P2 -4.95 -2.93 -2.02
P3 -4.88 -2.27 -2.61
P4 -4.86 -2.66 -2.20
P5 -5.03 -2.93 -2.10
P6 -4.99 -2.25 -2.74
4.7 Polymerization Effects on Molecular Orbital and Electronic Structure Calculations
4.7.1 Polymerization Effect on Bandgap
WB97-D was better able to estimate the optical bandgap compared to B3LYP, but still
failed to accurately account for the effects that polymerization has on energy level modulation.
In order to study the effects of polymerization on the energy levels, the molecular energy levels
for the monomer, dimer, trimer, and tetramer were calculated. As seen in Figure 4.7.1.1, the
bandgap rapidly decreases from the monomer to the tetramer, with small change in bandgap
from the trimer to the tetramer. Indeed, the calculated bandgaps are similar to the experimentally
determined bandgaps, seen in Table 4.7.1.1.
1 2 3 4
1.8
2.0
2.2
2.4
2.6
2.8
En
erg
y (
eV
)
Number of Repeat Units
P1
P2
P3
P4
P5
P6
Figure 4.7.1.1. Bandgap of monomer, dimer, trimer, and tetramer of P1-P6 using wB97x-D
functional.

125
Table 4.7.1.1. Bandgap of monomer, dimer, trimer, and tetramer of polymers P1-P6 using
wB97x-D functional in eV
Monomer Dimer Trimer Tetramer Elec(CV) Opt
p1 2.13 1.90 1.77 1.77 1.90 1.64
p2 2.02 1.84 1.80 1.79 2.01 1.62
p3 2.61 2.13 2.04 1.96 2.16 1.74
p4 2.20 1.90 1.81 1.80 2.01 1.61
p5 2.10 1.90 1.82 1.81 1.99 1.61
p6 2.74 2.20 2.00 1.96 2.03 1.71
4.7.2 Polymerization Effects on Electronic Structure Calculations
The HOMO, LUMO, HOMO-1, and LUMO+1 geometries for the monomers were
calculated and can be seen in Figure 4.7.2.1. The HOMO for P1 is concentrated on the acceptor
subunit with little electron density distributed on the donor. The little electron density that is
distributed on the donor is concentrated on the two fused thiophene units of the donor nearest to
the acceptor, with even less electron density on the rest of the donor. The LUMO for P1 is also
concentrated on the acceptor and is similar to how the electron density is distributed for the
HOMO, except there is almost no electron density on the rest of the donor subunit with the two
periphery thiophene units having no contribution to the HOMO. The HOMO-1 is delocalized
across both the donor and acceptor subunit, with small electron density on the periphery
thiophene linker of the acceptor. The LUMO+1 electron density is also delocalized across the
polymer, including the periphery thiophene linker of the acceptor. For P4, a similar trend is seen
for HOMO, LUMO, HOMO-1, and LUMO+1. Although, with two fewer thiophenes in the
donor subunit, more electron density is delocalized across the whole donor subunit which is not
the case for the two periphery thiophene in the donor subunit for P1, a trend seen for all of the
more conjugated donor analogues.
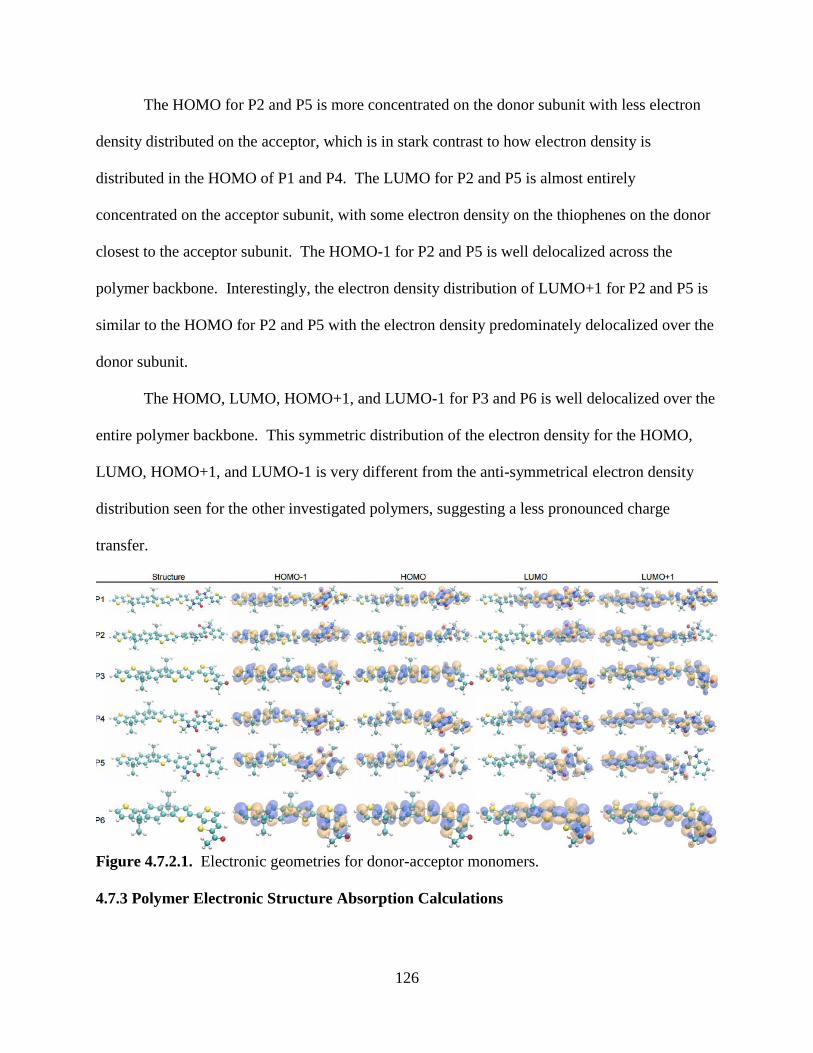
126
The HOMO for P2 and P5 is more concentrated on the donor subunit with less electron
density distributed on the acceptor, which is in stark contrast to how electron density is
distributed in the HOMO of P1 and P4. The LUMO for P2 and P5 is almost entirely
concentrated on the acceptor subunit, with some electron density on the thiophenes on the donor
closest to the acceptor subunit. The HOMO-1 for P2 and P5 is well delocalized across the
polymer backbone. Interestingly, the electron density distribution of LUMO+1 for P2 and P5 is
similar to the HOMO for P2 and P5 with the electron density predominately delocalized over the
donor subunit.
The HOMO, LUMO, HOMO+1, and LUMO-1 for P3 and P6 is well delocalized over the
entire polymer backbone. This symmetric distribution of the electron density for the HOMO,
LUMO, HOMO+1, and LUMO-1 is very different from the anti-symmetrical electron density
distribution seen for the other investigated polymers, suggesting a less pronounced charge
transfer.
Figure 4.7.2.1. Electronic geometries for donor-acceptor monomers.
4.7.3 Polymer Electronic Structure Absorption Calculations

127
The electronic structure calculations for the trimers for P1-P6 were calculated seen in
Figure 4.7.3.1. P1, P2, P4, and P5 series of trimers have linear backbones while P3 and P6 are
bent. Since the difference between the trimer and the tetramer energies for P1-P6 are small, and
due to computational limits, the trimer electronic structure calculations were used to represent
the polymer electronic structures for P1-P6.
P1
P4
P2
P5

128
P3
P6
Figure 4.7.3.1. The electronic structure calculations for the trimers for P1-P6.
The low energy absorption from S0 to S1 involves different electronic redistributions for
P1 and P4. For P1, the low energy absorption from S0 to S1 for P1 involves two major electronic
structure contributions. The first electronic structure contributes 85% to the transition. This
electronic structure has the electron density delocalized across two donor-acceptor subunits in
the ground state. In the excited state the electron density is still delocalized across two donor-
acceptor subunits but there is significantly more electron density localized on two acceptors.
The second electronic structure contributes 12% to the transition. This electronic structure has
the electron density on two alternating donor-acceptor subunits with little to no density on a third

129
donor monomer that separates the electron density from the two alternating donor-acceptor
subunits and a third acceptor that separates the electron density on another two alternating donor-
acceptor subunits in the ground state. In the excited state, the electron density is primarily
localized on the two acceptors that had electron density in the ground state, but still no electron
density between the two acceptor monomers. Whereas, for P4, the low energy absorption from
S0 to S1 for P4 involves one major electronic structure contribution, which contrasts with P1
which had two major electronic structures contributing to the low energy transition. This
electronic structure contributes 88% to the transition. This electronic structure has the electron
density delocalized across two donor-acceptor subunits with little electron density on the third
donor-acceptor subunits in the ground state. In the excited state, the electron density is primarily
delocalized across two donor-acceptor subunits.
The difference in electronic structures for P1 and P4 for the low energy absorption from
S0 to S1 is attributed to the effect of the two additional thiophene units fused to the donor in P1.
The two additional thiophene units fused to the donor not only promotes a more planar donor
structure, but it also promotes a more planar polymer backbone. P1 has a more planar polymer
backbone compared to P4 and as a result, the electronic transition from the ground state to the
excited state involves a transition from a delocalized state to a more localized state with most of
the electron density on two acceptor units in P1 whereas for P4, there is still significant electron
density on the donor subunit between the two acceptor units which can be seen in Figure 4.7.3.2.

130
Figure 4.7.3.2. Electronic structure for the ground state (left) and excited state (right) that
contribute to the low energy S0 to S1 transition for P1 (a.) and P4 (b.). The red arrows represent
the qualitative magnitudes of the electron density change.
The high energy absorption involves different electronic states for P1 and P4. The high
energy absorption for P1 involves a transition from S0 to S24, whereas the high energy absorption
for P4 involves a transition from S0 to S22. The higher energy absorption transition from S0 to
S24 for P1 involves four major electronic contributions. The first electronic structure contributes
39% to the transition. This electronic structure has the electron density delocalized on two
adjacent donor-acceptor subunits with most of the electron density on the donor monomers with
little electron density on the two acceptors in the ground state. In the excited state, the electron
density is delocalized across one donor-acceptor subunit with some additional electron density
on a portion of a second donor-acceptor unit with little electron density shared between the two.
The second electronic structure contributes 34% to the transition. This electronic structure has
the electron density delocalized across one donor-acceptor subunit with additional electron
density on a periphery donor in the ground state. In the excited state, the electron density is
delocalized across one donor-acceptor subunit and on an adjacent acceptor with most of the
density localized on one acceptor. The third electronic structure contributes 11% to the
transition. This electronic structure has the electron density delocalized across two alternating

131
donor-acceptor subunits in the ground state with little to no electron density shared between the
two in the ground state. In the excited state the electron density is transferred to the other half of
the trimer with the electron density delocalized across two donor-acceptor subunits. The fourth
electronic structure contributes 10% to the transition. The electron density is delocalized most of
the trimer with significant density localized on one donor-acceptor subunit in the ground state.
In the excited state the electron density is localized on one donor-acceptor subunit with a little
electron density located on a periphery acceptor. The higher energy absorption transition from
S0 to S22 for P4 was also different from the lower energy absorption transition for P4. The higher
energy absorption involves 2 major electronic contributions. The first electronic structure
contributes 71% to the transition. This electronic structure has the electron density localized on
one donor-acceptor subunit and a little electron density on a second acceptor monomer in the
ground state. In the excited state, the electron density is delocalized across two donor-acceptor
subunits. The second electronic structure contributes 12% to the transition. This electronic
structure has the electron density delocalized across one donor-acceptor subunit and on an
adjacent acceptor. In the excited state, the electron density is localized on two acceptor
monomers.
The high energy absorption transitions for P1 and P4 are quite different. For P1, the
electron density is localized in alternating segments in the ground state and are delocalized
across one continuous segment in the excited state. Whereas for P4, the main transition is
localized mainly on one donor-acceptor unit in the ground state and delocalized in the excited
state and the minor transition is localized on half of the trimer with localization on two acceptors
in the excited state. Taken as a whole, the P1 high energy absorption transition is composed of a
dispersed electron density across the trimer in the ground state followed by localization on

132
continuous segment of the trimer, whereas P4 is primarily composed of delocalization of the
electron density with some localization on two acceptors in the trimer in the excited state. The
additional conjugation of the donor in P1 results in delocalization of the ground state across the
polymer backbone, whereas P4 has most of the electron density localized on two acceptors in the
ground state which can be seen in Figure 4.7.3.3.
Figure 4.7.3.3. Electronic structure for the ground state (left) and excited state (right) that
contribute to the high energy transition for P1 (a.) and P4 (b.). The red arrows represent the
qualitative magnitudes of the electron density change.
The low energy absorption for P2 and P5 involves a transition from S0 to S1 for both
trimers. The low energy absorption transition for both P2 and P5 are quite similar with the
electron density delocalized across two donor monomers in the ground state and the electron
density localized on two adjacent acceptors in the excited state seen in Figure 4.7.3.4. The
longer conjugated donor of P2 does not have a pronounced effect on the electronic structures like
what was seen for P1 and P4, which may be due to bulky II acceptor having similar interaction
with both donor types due to the steric hindrance introduced by II acceptor that is not seen with
the less bulky DPP acceptor.
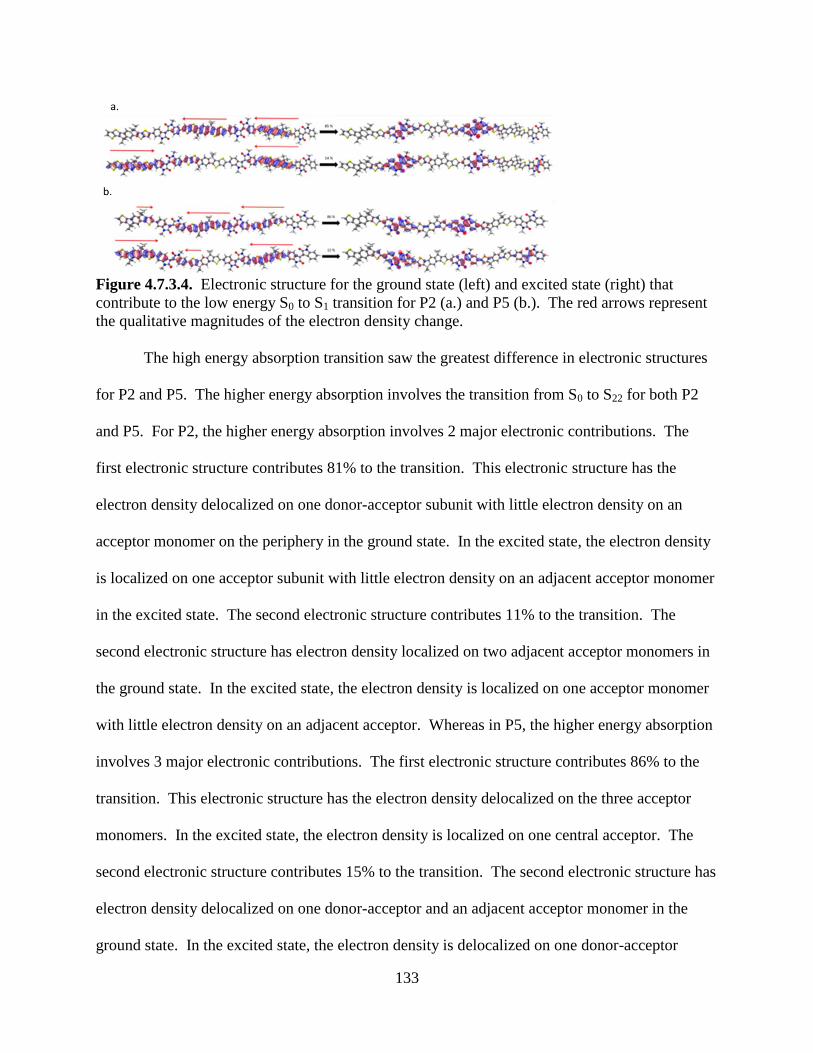
133
Figure 4.7.3.4. Electronic structure for the ground state (left) and excited state (right) that
contribute to the low energy S0 to S1 transition for P2 (a.) and P5 (b.). The red arrows represent
the qualitative magnitudes of the electron density change.
The high energy absorption transition saw the greatest difference in electronic structures
for P2 and P5. The higher energy absorption involves the transition from S0 to S22 for both P2
and P5. For P2, the higher energy absorption involves 2 major electronic contributions. The
first electronic structure contributes 81% to the transition. This electronic structure has the
electron density delocalized on one donor-acceptor subunit with little electron density on an
acceptor monomer on the periphery in the ground state. In the excited state, the electron density
is localized on one acceptor subunit with little electron density on an adjacent acceptor monomer
in the excited state. The second electronic structure contributes 11% to the transition. The
second electronic structure has electron density localized on two adjacent acceptor monomers in
the ground state. In the excited state, the electron density is localized on one acceptor monomer
with little electron density on an adjacent acceptor. Whereas in P5, the higher energy absorption
involves 3 major electronic contributions. The first electronic structure contributes 86% to the
transition. This electronic structure has the electron density delocalized on the three acceptor
monomers. In the excited state, the electron density is localized on one central acceptor. The
second electronic structure contributes 15% to the transition. The second electronic structure has
electron density delocalized on one donor-acceptor and an adjacent acceptor monomer in the
ground state. In the excited state, the electron density is delocalized on one donor-acceptor

134
subunit with more electron density on the acceptor monomer. The third electronic structure
contributes 13% to the transition. The third electronic structure has the electron density
delocalized on one donor-acceptor subunit and an adjacent acceptor monomer. In the excited
state, the electron density is delocalized across one donor-acceptor monomer with most of the
electron density on the donor monomer.
The influence of the extended conjugation donor on the electronic structures for P2 and
P5 can easily been seen for the ground state and excited state structures for the high energy
absorption. For P2, with the extended conjugated donor, much of the electron density is
localized on the donor in the ground state of the major contributor with the minor contributor
having the electron density localized on two acceptors in the ground state. In the excited state
for P2, the electron density is localized on one accepter. Whereas, the dominate electronic
structure for P5 has the electron density localized on the three acceptors in the ground state and
the minor contributors having the electron density delocalized across a donor-acceptor unit and
an additional acceptor in the ground state. The excited state structure has much of the electron
density localized on one acceptor but it also has two minor contributors with delocalization
across a donor-acceptor unit. Thus the donor has a greater influence in the ground state for P2
and the acceptor in the excited state, whereas the acceptor has greater influence in the ground
state for P5 and the donor in the excited state for the high energy absorption which can be seen in
Figure 4.7.3.5.

135
Figure 4.7.3.5. Electronic structure for the ground state (left) and excited state (right) that
contribute to the high energy S0 to S22 transition for P2 (a.) and P5 (b.). The red arrows represent
the qualitative magnitudes of the electron density change.
The low energy absorption from S0 to S1 for P3 and P6 had different electron densities
distributed across the trimer backbone. The low energy absorption from S0 to S1 for P3 involves
one major electronic structure contribution. This electronic structure contributes 91% to the
transition. This electronic structure has the electron density delocalized across two donor-
acceptor subunits. In the excited state, the electron density is delocalized on one donor-acceptor
subunit and an adjacent acceptor. Whereas, the low energy absorption from S0 to S1 for P6
involves one major electronic structure contribution. This electronic structure contributes 93%
to the transition. This electronic structure has the electron density delocalized across three
donor-acceptor subunits. In the excited state, the electron density is delocalized on two donor-
acceptor subunits.
Both ground state electronic structures for the S0 to S1 transition for P3 and P6 have the
electronic density delocalized across the timer backbone, but in P3 the electronic density is more
delocalized across the polymer than it is for P6. This suggests that the longer conjugation of the
donor for P3 does not increase the orbital overlap along the backbone. The excited state

136
electronic structures are quite similar for P3 and P6 with the electron density delocalized over
two donor-acceptor units seen in Figure 4.7.3.6.
Figure 4.7.3.6. Electronic structure for the ground state (left) and excited state (right) that
contribute to the low energy S0 to S1 transition for P3 (a.) and P6 (b.). The red arrows represent
the qualitative magnitudes of the electron density change.
The high energy absorption from S0 to S9 for P3 and P6 had markedly different electronic
structures in the ground and excited state. The high energy absorption from S0 to S9 for P3
involves one major electronic structure contribution. This electronic structure contributes 86%
to the transition. This electronic structure has the electron density delocalized across two donor-
acceptor subunits in the ground state. In the excited state, the electron density is delocalized on
one donor-acceptor subunit. Whereas the higher energy absorption for P6 involves two major
electronic contributions. The first electronic structure contributes 65% to the transition. This
electronic structure has the electron density delocalized on two donor-acceptor subunits in the
ground state. In the excited state, the electron density is delocalized on two donor-acceptor
subunits with most of the density localized on the acceptor monomers. The second electronic
structure contributes 23% to the transition. The second electronic structure has electron density
localized on three donor-acceptor subunits with little electron density on two of the acceptors
monomers in the ground state. In the excited state, the electron density is localized on two
acceptor monomers that had little electron density in the ground state.

137
The high energy absorption from S0 to S9 for P3 had the electron density delocalized over
fewer donor-acceptor units compared to the ground state electronic structure of P6. Again, the
extended conjugation of the donor of P3 fails to increase the orbital mixing across the entire
trimer that is seen in P6 for the high energy absorption. While in the excited state, the electron
density is localized on one donor-acceptor subunit for P3 whereas the electron density is more
localized on the two acceptors with some electron density located on the donor subunits. This
demonstrates the different influence that the extended conjugation has on the excited and ground
state high energy absorption which can be seen in Figure 4.7.3.7.
Figure 4.7.3.7. Electronic structure for the ground state (left) and excited state (right) that
contribute to the high energy S0 to S9 transition for P3 (a.) and P6 (b.). The red arrows represent
the qualitative magnitudes of the electron density change.
The acceptor strength did not have an effect on the electron distribution in the ground
state for comparative donor analogue trimers for the low energy absorption transition. Whereas
the ground state electronic structures had majority of the electron density localized on the
donors, in the excited state for the low energy absorption, the electron density is primarily

138
localized on the acceptors. Indeed, the stronger acceptor polymers had the localization on the
acceptors in the excited state, but the weaker electron acceptor polymer had electron density
delocalized across a donor-acceptor unit, demonstrating the effect the acceptor strength has on
the excited state electron density distribution for the low energy absorption transition. The
acceptor strength did not have a discernible pattern for the high energy absorption transition, the
ground states were delocalized and the excited states were localized with no apparent trend.
4.8 Two-Photon Absorption
Although electronic structures calculations can give great insight charge transfer within
the polymer backbone, two-photon absorption spectroscopy can be used to quantify the charge
characteristics of the donor-acceptor polymers.83
The TPA cross sections were determined by
using the TPEF method as discussed in the experimental section. An excitation wavelength of
1300 nm was used for P1, P2, P4, P5, and styryl 9m; and emission was collected at 740 nm. The
excitation wavelength was chosen for these polymers because they exhibit one photon absorption
maxima near 650 nm, and emission was collected at 740 nm after performing wavescans and
identifying the emission maxima, which can be blue or red shifted from the one photon emission
maxima. An excitation wavelength of 1250 nm was used for P3, P6, and zn-tetra-tert-pc; and the
emission was collected at 695 nm. The excitation wavelength was chosen for these polymers
because they exhibit one photon absorption maxima near 625 nm, and emission was collected at
695 nm.
The two-photon excited fluorescence as a function of power for the TPA standards and
investigated polymers can be seen in Figure 4.8.1. The two-photon cross-sections calculated
using the comparative method can be seen in Table 4.8.1. P1, P2, P4, and P5, the polymers with
diketopyrrolopyrrole and isoindigo acceptors, had the highest two photon cross sections as well
as the highest two-photon cross-section per repeat unit compared to P3 and P6 with the weaker

139
acceptors, which is consistent with the trend seen with the calculated TPA cross-sections
calculated with BHHLYP, seen in Table 4.8.1, and with other reports for strong acceptor donor-
acceptor organic conjugated molecules.84
Whereas P3, which has a weaker dithiophene
acceptor, had the lowest TPA cross-section and TPA per repeat unit. The TPA cross-section
could not be determined for P6 due to a likely smaller TPA cross-section and smaller QY of P6.
Calculations showed that P6 would have the lowest TPA cross-section, and if P6 follows the
same trend seen for P1, P2, and P3; it is likely that the P6 would have an even lower TPA cross-
section than P3.
The effect of donor conjugation on the TPA cross-section was not so obvious.
Calculations have indicated that the extended conjugated donor polymers should have a higher
TPA cross-section than their corresponding analogues. Indeed, P1 has a larger TPA cross-
section than P3 and presumably P4 has a higher cross-section than P6, according to calculations.
But this trend is not seen for P2 and P5. The discrepancy is most likely due to two factors. The
emission maxima for P2 and P5 are much further in the NIR, which means the emission
collection for the TPEF is collected at the tail of the emission which affects the accuracy of the
TPA determination. The efficiency of the PMT also decreases as detection wavelength shifts
towards the red, which makes collection difficult. Thus the effects of donor conjugation on the
TPA cross section are not clear.

140
1.6 1.7 1.8 1.9 2.0 2.1 2.2
2.4
2.6
2.8
3.0
3.2
3.4
3.6
3.8
4.0
4.2
4.4
4.6
4.8
5.0
styryl 9m
Zn-tetra-tert-butyl-pc
P1
P2
P3
P4
P5
Lo
g(c
ps)
Log(mW)
Figure 4.8.1. Logarithmic plot of the quadratic dependence(counts per second vs power) for
standards styryl 9m, zn-tetra-tert-butyl-pc, and the investigated polymers. 1300 nm excitation
was used for P1, P2, P4, P5, and styryl 9m. 1250 nm excitation was used for P3 and P6(not
shown), and zn-tetra-tert-butyl-pc. All have a slope ~2 and R2>0.99.
Table 4.8.1. TPA cross-section
Sample TPA
cross-section (GM)
BHHLYP TPA
cross-section
TPA/RPU
P1 549 52.9 37.2
P2 132 14.9 5.73
P3 0.07 1.0 0.0041
P4 518 42.3 27.2
P5 367 11.4 28.2
P6 - 0.2 -
4.9 Time Resolved Fluorescence
Fluorescence decay dynamics of the investigated polymers were performed in chloroform
solutions at the same concentrations that were used for the steady state experiments. The
samples were excited at 400 nm and the fluorescence decay dynamics were investigated at 680
nm. The decay dynamics were investigated at 680 nm in order to investigate the polymer’s
emission maxima as well as avoid the upconverting of the 800 nm gate signal which interferes

141
with collection at longer sample emission wavelengths due to the upconverting crystal angle.
The donor fluorescence decay dynamics were also investigated between 500 nm – 550 nm, but
the emission was too weak for the upconverting and collection process. Thus, our study focused
on the major emission decay dynamics. Unfortunately, the decay dynamics for P2 and P5 were
not able to be investigated due to low quantum yields and their emission maxima were too far
into the near-infrared where the gate upconversion signal made it impossible to investigate. To
rule out emissive irregularities due to degradation of the sample, steady state absorptions were
taken before and after the upconversion experiment. No change in intensity or spectral changes
were seen between the steady state absorptions before and after the upconversion experiment,
thus no degradation was observed. The decay dynamics can be seen in Figure 4.9.1.
The fluorescence decay dynamics were fitted using biexponential functions, the decay
times can be seen in Table 4.9.1. The investigated polymers had a short initial decay (<3ps) and
a longer second decay component. P1 and P4 had the longest long-lived decay components
compared to polymers with weaker acceptors, 745 ps and 37 ps, respectively. P3 and P6, which
had the weakest acceptors of the investigated polymers, had the shortest long-lived decay
components within their respective donor series, 129 ps and 19 ps, respectively. The short initial
decay was relatively unaffected by the donor conjugation length and acceptor strength. The
short decay component has been attributed to relaxation of the hot excited singlet state and
conformational relaxation, and the longer decay component has been attributed to the relaxation
of the charge transfer state.55,85–88
The polymers with the longer donor conjugation all had
significantly longer long-lived decay components compared to their corresponding analogue,
about an order of magnitude larger. This is consistent with what others have reported, where the
fluorescence rate increases for longer conjugated systems of the same type.89
The longer long-

142
lived decay can be explained by the charge separation that occurs in the excited state and has
been seen for other conjugated donor-acceptor systems.90
In the excited state, the charge transfer
states localize on specific segments, so the probability of recombining for emission is lower for
states that are more separated, which occurs when the longer conjugated donor is taken into
account resulting in longer fluorescence decay lifetimes.
The importance of the acceptor strength cannot be understated. Too strong of an acceptor
can result in electron trapping and exciton trapping.55,91–93
Too weak of an acceptor, the exciton
lifetime will be too short for the exciton dissociation by an organic accepting material.94,95
The
polymers with stronger acceptors within the same donor series showed longer exciton life-times
than their weaker acceptor counterparts. The DPP acceptor is strong enough to sufficiently
promote the charge transfer along the polymer, while not being too strong where the charge is
not able to migrate along the polymer backbone before recombining. The TT acceptor is also
able to promote the charge transfer, but not to the extent that is seen with the DPP acceptor. This
is consistent with the results of the two-photon absorption spectroscopy and electronic structure
calculations, with larger charge transfer seen with the polymers with the stronger acceptors.
Table 4.9.1. Fluorescence decay dynamics.
Polymer η1 (ps) η
2 (ps)
P1 0.79 745
P3 1.27 129
P4 0.64 37
P6 2.04 19

143
Figure 4.9.1. Fluorescence upconversion of P1 (top left),P4 (top right), P3 (bottom left), and P6
(bottom right) at 400 nm excitation and 680 nm emission.
4.10 Ultrafast Transient Absorption
Ultrafast transient absorption experiments were performed in chloroform solutions at the
same concentrations that were used for the steady state experiments. Experiments were carried
out by exciting the polymer samples with 400 nm femtosecond pulses and probing the excited
state with a white light continuum at different delays, giving insight into the ultrafast excited-
state dynamics of the investigated polymers. The transient absorption spectra for P1 and P4 can
be seen in Figure 4.10.1 and the fitted lifetimes can be seen Table 4.10.1. The transient
absorption spectra for P1 and P4 are quite similar, with a ground state bleach(GSB) near 650 nm
and a stimulated emission (SE) near 730 nm with overlap between the two bands. This matches
well with the steady state absorption and steady state fluorescence for both polymers. The GSB
at ~650 nm for both polymers exhibited a biexponential decay and the SE at ~730nm for both

144
polymers exhibited a biexponential decay. The intial decay component of the GSB for both
polymers was ~20 ps and is attributed to a hot relaxation to the S1 state. This was followed by a
~500 ps relaxation from S1 state to the charge transfer state. This is followed by a <100 ps
relaxation from a hot charge transfer state, CT1, to a relaxed charge transfer state, CT0 via SE.
This was followed by a relaxation of the charge transfer state to the ground state via SE. The
energy level diagrams for the overall photophysical processes for P1 and P4 can be seen in
Figure 4.10.2. The ground state recovery for the GSB near 650 nm for both polymers was ~500
ps, suggesting that extended conjugation of the donor of P1 had a marginal effect on the ground
state recovery. The fast emission process has been attributed to structural relaxation of the
polymers, before a slow decay of the charge transfer state back to the ground state.96
The SE
lifetime of P4 was more than two times longer than the SE of P1, suggesting a greater influence
of the donor on the SE dynamics. Interestingly, P1 had a fast GSB with a monoexponential
decay at 453 nm of 69 ps, whereas no such process exists for P4, suggesting that the GSB is a
result of the extension of the conjugation donor unit changes the relaxation process for the
polymer.

145
Figure 4.10.1. Transient absorption spectra and kinetic fits of P1 (a.) and P4 (b.).
Table 4.10.1. Transient absorption kinetic fits at selected wavelengths for P1 and P4
P1 Wavelength
Nm
η1 (ps) η2 (ps) P4 Wavelength
(nm)
η1 (ps) η2 (ps)
453
69 - 453 - -
649 20 658 653 19 488
729 22 435 737 65 1028

146
Figure 4.10.2. Energy level diagrams of transient absorption processes for P1 (left) and P4
(right).
The transient absorption spectra for P2 and P5 can be seen in Figure 4.10.3 and the fitted
lifetimes can be seen Table 4.10.2. P2 and P5 had a ground state bleach(GSB) near 435 nm and
620 nm and a stimulated emission (SE) near 700 nm with overlap between the later GSB and SE
emission peaks. This matches well with the steady state absorption and steady state fluorescence
for both polymers. Both polymers also had an ESA at 779 nm that overlaps with the fluorescence
seen in the steady state emission spectra. P2 also had an ESA near 500 nm that was not seen for
P5. The high energy GSB lifetimes for both polymers were fitted to exponential to
monoexponential decays of 531 ps and 644 nm, respectively. The high energy GSB lifetimes
were 3 times longer than the lower energy GSB, suggesting two different recovery mechanisms.
Both low energy GSB lifetimes exhibited monoexponential decays of approximately 200 ps.
The SE for both polymers had a decay time of 200 ps, with a monoexponential decay for P2 and
a biexponential decay for P5. The biexponential decay of P5 has a short component of 41 ps that
can be attributed to a hot relaxation in the excited state. Interestingly, both polymers had a
biexponential ESA at 779 nm of 6ps and ~200 ps, which is the same wavelength that these
polymers had fluorescence in the steady state. The energy level diagrams for the overall
photophysical processes for P1 and P4 can be seen in Figure 4.10.4. The lack of SE at this

147
wavelength, and strong ESA indicates that excited state absorption cross-section must be larger
than the emission cross section at the same wavelength. The changes in the transient absorption
spectra of P2 and P5 compared to the other investigated polymers demonstrate the effect that the
conjugation of the donor has on the optical properties of these polymers, but also how donor and
acceptor interaction can produce major changes to the optical properties.
Figure 4.10.3. Transient absorption spectra and kinetic fits of P2 (a.) and P5 (b.).

148
Table 4.10.2. Transient absorption kinetic fits at selected wavelengths for P2 and P5
P2 Wavelength
Nm
η1 (ps) η2 (ps) P5 Wavelength
(nm)
η1 (ps) η2 (ps)
438
531 - 435 644 -
504 45 - 504 - -
622 184 - 625 212 -
694 210 - 719 41 243
779 6 222 779 6 193
Figure 4.10.4. Energy level diagrams of transient absorption processes for P2 (left) and P5
(right).
The transient absorption spectra for P3 and P6 can be seen in Figure 4.10.5 and the fitted
lifetimes can be seen Table 4.10.3. The transient absorption spectra for P3 and P6 are quite
similar, with a ground state bleach(GSB) near 460 nm and a GSB near 600 nm with overlap
between the two bands, which matches the steady state absorption. There is a weak tail at ~700

149
nm for P6 that may be stimulated emission, which would match well with the steady state
fluorescence, but it is not well resolved due to the strength of the GSB, which is also the case for
P3 where the SE, if present, is masked by the strong GSB. The GSB at ~460 nm and ~600 nm
for both polymers exhibited a biexponential decay and the SE at ~700 nm for P6 exhibited a
biexponential decay. For both GSBs and for both Polymers, the first decay component is ~150
ps and is attributed to the relaxation of the hot excited state to the first excited state, followed by
a long decay to the charge transfer state that is longer than the experimental window of this
experimental set up. The energy level diagrams for the overall photophysical processes for P3
and P6 can be seen in Figure 4.10.6. This is followed by a decay of the hot charge transfer state
to a relaxed charge transfer state, which then relaxes to the ground state. The biexponential
nature and similar time constants of the GSB at ~460 nm and ~600 nm for both polymers
suggests that the extended conjugation of the donor of P3 does not have an effect on the
relaxation dynamics. This is a striking finding compared to the stronger acceptor polymers
where the extend conjugation donors had other relaxation pathways compared to their less
conjugated counterparts. This may be due to the weaker acceptor strength of P3 and P6 as well
as the less bulky acceptor compared to polymers with the stronger acceptors. The more bulky
acceptor polymers are more constrained due to steric hindrance, whereas the smaller TT
acceptors are not impinged by the extended conjugation of the larger donors.

150
Figure 4.10.5. Transient absorption spectra and kinetic fits of P3 (a.) and P6 (b.).
Table 4.10.3. Transient absorption kinetic fits at selected wavelengths for P3 and P6
P3 Wavelength
Nm
η1 (ps) η2 (ps) P6 Wavelength
(nm)
η1 (ps) η2 (ps)
470
151 inf 460 173 inf
615 159 inf 614 172 inf
693 - - 713 150 inf

151
Figure 4.10.6. Energy level diagrams of transient absorption processes for P3 (left) and P6
(right).
4.11 Nanosecond Transient Absorption
As important as the ultrafast photophysical properties are to photovoltaic properties of
light harvesting polymers, longer lived excited species also contribute to the overall
photophysical properties. Nanosecond transient absorption experiments were conducted in
chloroform solution using a LP980 (Edinburgh) system using a Spectra Physics QuantaRay
Nd:YAG nanosecond pulsed laser and a GWU Optical Parametric Oscillator (OPO) tunable from
250 nm to 2600 nm. For this investigation 415 nm excitation beam was used as a pump and
pulsed xenon lamp white light continuum was used for the probe.
The ultrafast and nanosecond transient absorption spectra for P1 and P4 can be seen in
Figure 4.11.1. No additional excited states are seen from the ultrafast regime to the longer
nanosecond to microsecond regime. This suggests that the larger donor system for this donor-
acceptor motif does not result contribute to other excited species at longer timescales in the
visible region, although there may be charge separated states or evidence of polaron changes at
wavelengths longer than 870 nm, the limitation of the detector.
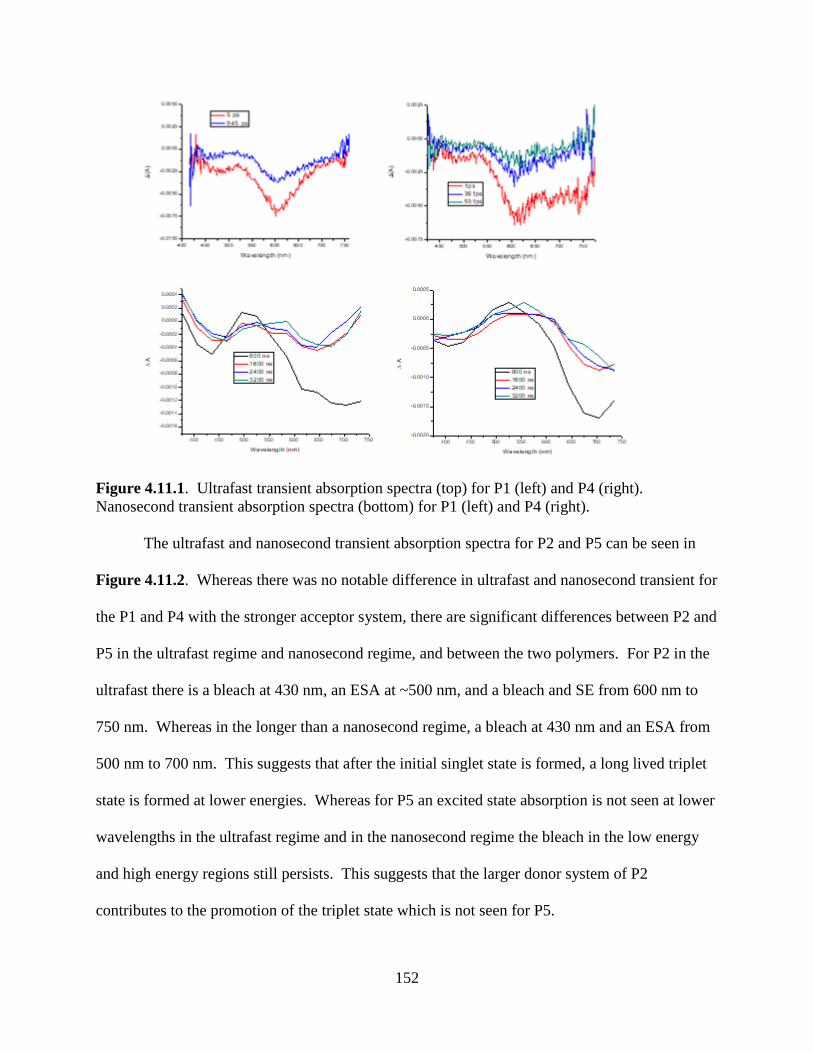
152
Figure 4.11.1. Ultrafast transient absorption spectra (top) for P1 (left) and P4 (right).
Nanosecond transient absorption spectra (bottom) for P1 (left) and P4 (right).
The ultrafast and nanosecond transient absorption spectra for P2 and P5 can be seen in
Figure 4.11.2. Whereas there was no notable difference in ultrafast and nanosecond transient for
the P1 and P4 with the stronger acceptor system, there are significant differences between P2 and
P5 in the ultrafast regime and nanosecond regime, and between the two polymers. For P2 in the
ultrafast there is a bleach at 430 nm, an ESA at ~500 nm, and a bleach and SE from 600 nm to
750 nm. Whereas in the longer than a nanosecond regime, a bleach at 430 nm and an ESA from
500 nm to 700 nm. This suggests that after the initial singlet state is formed, a long lived triplet
state is formed at lower energies. Whereas for P5 an excited state absorption is not seen at lower
wavelengths in the ultrafast regime and in the nanosecond regime the bleach in the low energy
and high energy regions still persists. This suggests that the larger donor system of P2
contributes to the promotion of the triplet state which is not seen for P5.

153
Figure 4.11.2. Ultrafast transient absorption spectra (top) for P2 (left) and P5 (right).
Nanosecond transient absorption spectra (bottom) for P2 (left) and P5 (right).
The ultrafast and nanosecond transient absorption spectra for P3 and P6 can be seen in
Figure 4.11.3. There are significant differences between P3 and P6 in the nanosecond regime,
whereas the dynamics are quite similar in the ultrafast regime. In the ultrafast regime, there is a
bleach in the 430 nm region and 630 nm region for both polymers. In the nanosecond transient
absorption spectra, P3 has a bleach from 400 nm to 650 nm, but there is an excited state
absorption near 700 nm, whereas for P6 there is only a bleach from 400 nm to 800 nm. This
suggests that the larger donor of P3 also contributes to triplet state which is not seen for P6. This
is similar to the results obtained for P2, suggesting that the donor system has more influence on
the triplet state for weaker acceptor systems.
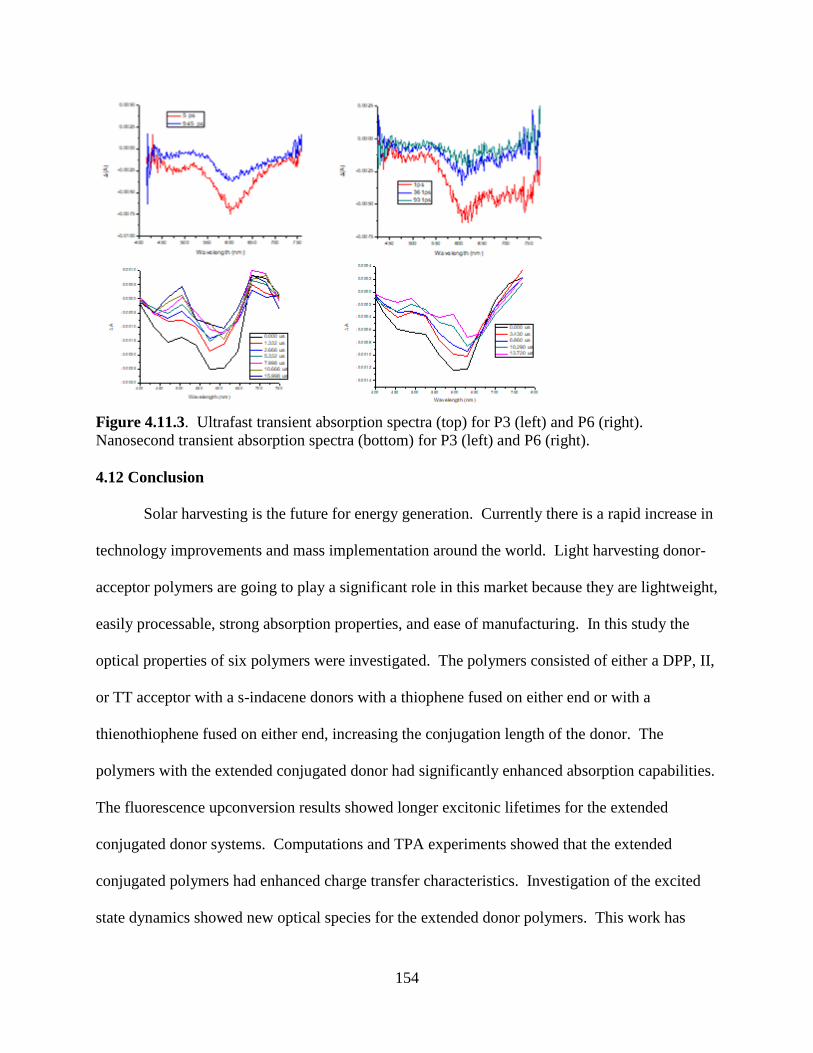
154
Figure 4.11.3. Ultrafast transient absorption spectra (top) for P3 (left) and P6 (right).
Nanosecond transient absorption spectra (bottom) for P3 (left) and P6 (right).
4.12 Conclusion
Solar harvesting is the future for energy generation. Currently there is a rapid increase in
technology improvements and mass implementation around the world. Light harvesting donor-
acceptor polymers are going to play a significant role in this market because they are lightweight,
easily processable, strong absorption properties, and ease of manufacturing. In this study the
optical properties of six polymers were investigated. The polymers consisted of either a DPP, II,
or TT acceptor with a s-indacene donors with a thiophene fused on either end or with a
thienothiophene fused on either end, increasing the conjugation length of the donor. The
polymers with the extended conjugated donor had significantly enhanced absorption capabilities.
The fluorescence upconversion results showed longer excitonic lifetimes for the extended
conjugated donor systems. Computations and TPA experiments showed that the extended
conjugated polymers had enhanced charge transfer characteristics. Investigation of the excited
state dynamics showed new optical species for the extended donor polymers. This work has

155
shown the pronounce effect that donor conjugation has on the optical properties of donor-
acceptor light-harvesting conjugated polymers, which will help in the design and synthesis of
new donor-acceptor polymers for organic photovoltaics.
References
(1) Wolfram, C.; Shelef, O.; Gertler, P. How Will Energy Demand Develop in the Developing
World? J. Econ. Perspect. 2012, 26 (1), 119–138.
(2) Walker, R. J. Population Growth and Its Implications for Global Security. Am. J. Econ.
Sociol. 2016, 75 (4), 980–1004.
(3) Withagen, C. Pollution and Exhaustibility of Fossil Fuels. Resour. Energy Econ. 1994, 16,
235–242.
(4) Gibson, L.; Wilman, E. N.; Laurance, F. How Green Is “ Green ” Energy ? Trends Ecol.
Evol. 2017, 32 (12), 922–935.
(5) Ragoussi, M.-E.; Torres, T. New Generation Solar Cells Concepts, Trends. Chem.
Commun. 2015, 51, 3957–3972.
(6) Miles, R. W.; Hynes, K. M.; Forbes, I. Photovoltaic Solar Cells : An Overview of State-
of-the-Art Cell Development and Environmental Issues. Prog. Cryst. Growth Charact.
Mater. 2005, 51, 1–42.
(7) Paggi, M.; Berardone, I.; Infuso, A.; Corrado, M. Fatigue Degradation and Electric
Recovery in Silicon Solar Cells Embedded in Photovoltaic Modules. Sci. Rep. 2014, 4, 1–
7.
(8) Shi, G.; Kioupakis, E. Electronic and Optical Properties of Nanoporous Silicon for Solar-
Cell Applications. ACS Photonics 2015, 2 (2), 208–215.
(9) Deligiannis, D.; Vasudevan, R.; Smets, A. H. M.; van Swaaij, R. A. C. M. M.; Zeman, M.
Surface Passivation of c-Si for Silicon Heterojunction Solar Cells Using High-Pressure
Hydrogen Diluted Plasmas. AIP Adv. 2015, 5 (9), 1–8.
(10) Babayigit, A.; Ethirajan, A.; Muller, M.; Conings, B. Toxicity of Organometal Halide
Perovskite Solar Cells. Nat. Mater. 2016, 15 (3), 247–251.
(11) Günes, S.; Neugebauer, H.; Sariciftci, N. S. Conjugated Polymer-Based Organic Solar
Cells. Chem. Rev. 2007, 107 (4), 1324–1338.
(12) Vezie, M. S.; Few, S.; Meager, I.; Pieridou, G.; Dörling, B.; Ashraf, R. S.; Goñi, A. R.;
Bronstein, H.; Mcculloch, I.; Hayes, S. C.; et al. Exploring the Origin of High Optical
Absorption in Conjugated Polymers. Nat. Mater. 2016, 15, 746–753.
(13) Seo, J. H.; Um, H. D.; Shukla, A.; Hwang, I.; Park, J.; Kang, Y. C.; Kim, C. S.; Song, M.;
Seo, K. Low-Temperature Solution-Processed Flexible Organic Solar Cells with
PFN/AgNWs Cathode. Nano Energy 2015, 16, 122–129.
(14) Zhong, H.; Li, Z.; Buchaca-Domingo, E.; Rossbauer, S.; Watkins, S. E.; Stingelin, N.;
Anthopoulos, T. D.; Heeney, M. Low Band Gap Dithienogermolodithiophene Copolymers

156
with Tunable Acceptors and Side-Chains for Organic Solar Cells. J. Mater. Chem. A 2013,
1 (47), 14973–14981.
(15) Huang, H.; Yang, L.; Sharma, B. Recent Advances in Organic Ternary Solar Cells. J.
Mater. Chem. A 2017, 5 (23), 11501–11517.
(16) Zhang, Z. G.; Wang, J. Structures and Properties of Conjugated Donor – Acceptor
Copolymers for Solar Cell Applications. J. Mater. Chem 2012, 22, 4178–4187.
(17) Pai, R. K.; T. N., A.; B., H. Rational Design of Benzodithiophene Based Conjugated
Polymers for Better Solar Cell Performance. RSC Adv. 2016, 6 (28), 23760–23774.
(18) Homyak, P. D.; Tinkham, J.; Lahti, P. M.; Coughlin, E. B. Thieno [ 3 , 4 ‑ B ] Thiophene
Acceptors with Alkyl , Aryl , Perfluoroalkyl , and Perfluorophenyl Pendants for Donor −
Acceptor Low Bandgap Polymers. Macromolecules 2013, 46, 8873–8881.
(19) Liang, Y.; Xu, Z.; Xia, J.; Tsai, S. T.; Wu, Y.; Li, G.; Ray, C.; Yu, L. For the Bright
Future-Bulk Heterojunction Polymer Solar Cells with Power Conversion Efficiency of
7.4%. Adv. Mater. 2010, 22, 135–138.
(20) Akbayrak, M.; Önal, A. M. Synthesis and Electrochemical Polymerization of
Diketopyrrolopyrrole Based Donor–acceptor–donor Monomers Containing 3,6- and 2,7-
Linked Carbazoles. Polym. Chem. 2016, 7 (39), 6110–6119.
(21) Xie, H.; Zhang, K.; Duan, C.; Liu, S.; Huang, F.; Cao, Y. New Acceptor-Pended
Conjugated Polymers Based on 3,6- and 2,7-Carbazole for Polymer Solar Cells. Polymer
(Guildf). 2012, 53 (25), 5675–5683.
(22) Jiaoli, Li, Andrew C., G. Carbazole-Based Polymers for Organic Photovoltaic Devices.
Chem. Soc. Rev. 2010, 39 (7), 2399–2410.
(23) Li, Y.; Gu, M.; Pan, Z.; Zhang, B.; Yang, X. Indacenodithiophene : A Promising Building
Block for High Performance Polymer Solar Cells. J. Mater. Chem. A Mater. energy
Sustain. 2017, 5, 10798–10814.
(24) Zhang, X.; Bronstein, H.; Kronemeijer, A. J.; Smith, J.; Kim, Y.; Kline, R. J.; Richter, L.
J.; Anthopoulos, T. D.; Sirringhaus, H.; Song, K.; et al. Molecular Origin of High Field-
Effect Mobility in an Indacenodithiophene- Benzothiadiazole Copolymer. Nat. Commun.
2013, 4, 1–9.
(25) Zhao, W.; Qian, D.; Zhang, S.; Li, S.; Inganäs, O.; Gao, F. Fullerene-Free Polymer Solar
Cells with over 11 % Effi Ciency and Excellent Thermal Stability. Adv. Mater. 2016,
4734–4739.
(26) Falzon, M.-F.; Zoombelt, A. P.; Wienk, M. M.; Janssen, R. A. J. R. a J.
Diketopyrrolopyrrole-Based Acceptor Polymers for Photovoltaic Application. Phys.
Chem. Chem. Phys. 2011, 13 (19), 8931–8939.
(27) Turbiez, M.; Leeuw, D. M. De; Janssen, A. J. Poly ( Diketopyrrolopyrrole - Terthiophene
) for Ambipolar Logic and Photovoltaics. J am chem Soc Commun. 2009, 131, 16616–
16617.
(28) Mori, H.; Suetsugu, M.; Nishinaga, S.; Chang, N.; Nonobe, H.; Okuda, Y.; Nishihara, Y.
Synthesis, Characterization, and Solar Cell and Transistor Applications of phenanthro[1,2-

157
B :8,7- B ′]dithiophene-Diketopyrrolopyrrole Semiconducting Polymers. J. Polym. Sci.
Part A Polym. Chem. 2015, 53 (5), 709–718.
(29) Li, W.; Hendriks, K. H.; Wienk, M. M.; Janssen, R. A. J. Diketopyrrolopyrrole Polymers
for Organic Solar Cells. Acc. Chem. Res. 2016, 49, 78–85.
(30) Grand, C.; Baek, S.; Lai, T. H.; Deb, N.; Zajaczkowski, W.; Stalder, R.; Müllen, K.;
Pisula, W.; Bucknall, D. G.; So, F.; et al. Structure-Property Relationships Directing
Transport and Charge Separation in Isoindigo Polymers. Macromolecules 2016, 49 (11),
4008–4022.
(31) Estrada, L. A.; Stalder, R.; Abboud, K. A.; Risko, C.; Brédas, J. L.; Reynolds, J. R.
Understanding the Electronic Structure of Isoindigo in Conjugated Systems: A Combined
Theoretical and Experimental Approach. Macromolecules 2013, 46 (22), 8832–8844.
(32) Duan, C.; Huang, F.; Cao, Y. Recent Development of Push–pull Conjugated Polymers for
Bulk-Heterojunction Photovoltaics: Rational Design and Fine Tailoring of Molecular
Structures. J. Mater. Chem. 2012, 22 (21), 10416–10434.
(33) Stalder, R.; Mei, J.; Graham, K. R.; Estrada, L. A.; Reynolds, J. R. Isoindigo , a Versatile
Electron-Deficient Unit For High-Performance Organic Electronics. Chem. Mater. 2014,
26, 664–678.
(34) Cinar, M. E.; Ozturk, T. Thienothiophenes , Dithienothiophenes , and Thienoacenes :
Syntheses , Oligomers , Polymers , and Properties. Chem. Rev. 2015, 115, 3096–3140.
(35) Deka, B. C.; Purkayastha, S. K.; Sharma, H.; Bhattacharyya, P. K. Ground and Excited
States of Neutral and Cationic thieno[3,2-B]thiophene: A DFT Study. Comput. Theor.
Chem. 2016, 1091, 41–48.
(36) Singh, R.; Pagona, G.; Gregoriou, V. G.; Tagmatarchis, N.; Toliopoulos, D.; Han, Y.; Fei,
Z.; Katsouras, A.; Avgeropoulos, A.; Anthopoulos, T. D.; et al. The Impact of
Thienothiophene Isomeric Structures on the Optoelectronic Properties and Photovoltaic
Performance in Quinoxaline Based Donor–acceptor Copolymers. Polym. Chem. 2015, 6
(16), 3098–3109.
(37) Výprachtický, D.; Demirtas, I.; Dzhabarov, V.; Pokorná, V.; Ertas, E.; Ozturk, T.;
Cimrová, V. New Copolymers with thieno[3,2-B]thiophene or dithieno[3,2-b:2′,3′-
D]thiophene Units Possessing Electron-Withdrawing 4-Cyanophenyl Groups: Synthesis
and Photophysical, Electrochemical, and Electroluminescent Properties. J. Polym. Sci.
Part A Polym. Chem. 2017, 55 (16), 2629–2638.
(38) Niimi, K.; Shinamura, S.; Osaka, I.; Miyazaki, E.; Takimiya, K. Dianthra[2,3- b:2′,3′- F
]thieno[3,2- B ]Thiophene (DATT): Synthesis, Characterization, and FET Characteristics
of New π-Extended Heteroarene with Eight Fused Aromatic Rings. J. Am. Chem. Soc.
2011, 133 (22), 8732–8739.
(39) Chochos, C. L.; Kalogirou, A. S.; Ye, T.; Tatsi, E.; Katsouras, A.; Zissimou, G. A.;
Gregoriou, V. G.; Avgeropoulos, A.; Koutentis, P. A. 4H-1,2,6-Thiadiazine-Containing
Donor-Acceptor Conjugated Polymers: Synthesis, Optoelectronic Characterization and
Use in Organic Solar Cells. J. Mater. Chem. C 2017, 1–10.
(40) Nagarjuna, P.; Bagui, A.; Garg, A.; Gupta, V.; Singh, S. P. One-Step Synthesis of New

158
Electron Acceptor for High Efficiency Solution Processable Organic Solar Cells. J. Phys.
Chem. C 2017, 121, 26615–26621.
(41) Adam, G.; Munkhbat, B.; Denk, P.; Ulbricht, C.; Hrelescu, C.; Scharber, M. C. Different
Device Architectures for Bulk-Heterojunction Solar Cells. Front. Mater. 2016, 3, 1–10.
(42) Ltaief, A.; Davenas, J.; Bouazizi, A.; Chaâbane, R. Ben; Alcouffe, P.; Ouada, H. Ben.
Film Morphology Effects on the Electrical and Optical Properties of Bulk Heterojunction
Organic Solar Cells Based on MEH-PPV/C60 Composite. Mater. Sci. Eng. C 2005, 25
(1), 67–75.
(43) Erb, T.; Zhokhavets, U.; Gobsch, G.; Raleva, S.; Stühn, B.; Schilinsky, P.; Waldauf, C.;
Brabec, C. J. Correlation between Structural and Optical Properties of Composite
Polymer/fullerene Films for Organic Solar Cells. Adv. Funct. Mater. 2005, 15 (7), 1193–
1196.
(44) Trukhanov, V. A.; Bruevich, V. V.; Paraschuk, D. Y. Fill Factor in Organic Solar Cells
Can Exceed the Shockley-Queisser Limit. Sci. Rep. 2015, 5, 1–10.
(45) Street, R. A. Carrier Mobility, Structural Order, and Solar Cell Efficiency of Organic
Heterojunction Devices. Appl. Phys. Lett. 2008, 93 (13), 1–3.
(46) Kupijai, A. J.; Behringer, K. M.; Schaeble, F. G.; Galfe, N. E.; Corazza, M.; Gevorgyan,
S. A.; Krebs, F. C.; Stutzmann, M.; Brandt, M. S. Bipolar Polaron Pair Recombination in
Polymer/fullerene Solar Cells. Phys. Rev. B - Condens. Matter Mater. Phys. 2015, 92 (24),
1–8.
(47) Street, R. A. Electronic Structure and Properties of Organic Bulk-Heterojunction
Interfaces. Adv. Mater. 2016, 28 (20), 3814–3830.
(48) Larson, B. W.; Reid, O. G.; Coffey, D. C.; Avdoshenko, S. M.; Popov, A. A.; Boltalina,
O. V.; Strauss, S. H.; Kopidakis, N.; Rumbles, G. Inter-Fullerene Electronic Coupling
Controls the Efficiency of Photoinduced Charge Generation in Organic Bulk
Heterojunctions. Adv. Energy Mater. 2016, 6 (24), 1–11.
(49) Serbenta, A.; Kozlov, O. V.; Portale, G.; Van Loosdrecht, P. H. M.; Pshenichnikov, M. S.
Bulk Heterojunction Morphology of Polymer:fullerene Blends Revealed by Ultrafast
Spectroscopy. Sci. Rep. 2016, 6, 1–11.
(50) Kose, M. E. Evaluation of Acceptor Strength in Thiophene Coupled Donor − Acceptor
Chromophores for Optimal Design of Organic Photovoltaic Materials. J. Phys. Chem. A
2012, 116, 11503–12509.
(51) Creamer, A.; Casey, A.; Marsh, A. V.; Shahid, M.; Gao, M.; Heeney, M. Systematic
Tuning of 2,1,3-Benzothiadiazole Acceptor Strength by Monofunctionalization with
Alkylamine, Thioalkyl, or Alkoxy Groups in Carbazole Donor-Acceptor Polymers.
Macromolecules 2017, 50 (7), 2736–2746.
(52) Kim, B. G.; Ma, X.; Chen, C.; Ie, Y.; Coir, E. W.; Hashemi, H.; Aso, Y.; Green, P. F.;
Kieffer, J.; Kim, J. Energy Level Modulation of HOMO, LUMO, and Band-Gap in
Conjugated Polymers for Organic Photovoltaic Applications. Adv. Funct. Mater. 2013, 23
(4), 439–445.
(53) Adegoke, O. O.; Jung, I. H.; Orr, M.; Yu, L.; Goodson III, T. G. Investigations of the

159
Effect of the Acceptor Strength on the Optical and Electronic Properties in Conjugated
Polymers for Solar Applications. J. Am. Chem. Soc. 2015, 150407115828001.
(54) Wan, Q.; Guo, X.; Wang, Z.; Li, W.; Guo, B.; Ma, W.; Zhang, M.; Li, Y. 10.8%
Efficiency Polymer Solar Cells Based on PTB7-Th and PC71BM via Binary Solvent
Additives Treatment. Adv. Funct. Mater. 2016, 26 (36), 6635–6640.
(55) Keller, B.; McLean, A.; Kim, B.-G.; Chung, K.; Kim, J.; Goodson, T. Ultrafast
Spectroscopic Study of Donor–Acceptor Benzodithiophene Light Harvesting Organic
Conjugated Polymers. J. Phys. Chem. C 2016, acs.jpcc.6b01727.
(56) Cravino, A. Origin of the Open Circuit Voltage of Donor-Acceptor Solar Cells: Do
Polaronic Energy Levels Play a Role? Appl. Phys. Lett. 2007, 91 (24), 1–4.
(57) Chen, S.; Zhang, D.; Wang, M.; Kong, L.; Zhao, J. Donor–acceptor Type Polymers
Containing the 2,3-bis(2-Pyridyl)-5,8-Dibromoquinoxaline Acceptor and Different
Thiophene Donors: Electrochemical, Spectroelectrochemistry and Electrochromic
Properties. New J. Chem. 2016, 40 (3), 2178–2188.
(58) Osaka, I.; Abe, T.; Shimawaki, M.; Koganezawa, T.; Takimiya, K. Naphthodithiophene-
Based Donor-Acceptor Polymers: Versatile Semiconductors for OFETs and OPVs. ACS
Macro Lett. 2012, 1 (4), 437–440.
(59) Beaujuge, P. M.; Subbiah, J.; Choudhury, K. R.; Ellinger, S.; McCarley, T. D.; So, F.;
Reynolds, J. R. Green Dioxythiophene-Benzothiadiazole Donor-Acceptor Copolymers for
Photovoltaic Device Applications. Chem. Mater. 2010, 22 (6), 2093–2106.
(60) Gokce, G.; Karabay, B.; Cihaner, A.; Icli Ozkut, M. [1,2,5]thiadiazolo[3,4-G]quinoxaline
Acceptor-Based Donor–acceptor–donor-Type Polymers: Effect of Strength and Size of
Donors on the Band Gap. J. Polym. Sci. Part A Polym. Chem. 2017, 55 (20), 3483–3493.
(61) Zhao, D.; Li, L.; Lo, W.; Zhang, N.; Goodson, T.; Yu, L. Two Photon Absorption Study
of Low-Bandgap, Fully Conjugated Perylene Diimide-Thienoacene-Perylene Diimide
Ladder-Type Molecules. Chem. Mater. 2017, 29, 6726–6732.
(62) Berezin, M. Y.; Zhan, C.; Lee, H.; Joo, C.; Akers, W. J.; Yazdanfar, S.; Achilefu, S. Two-
Photon Optical Properties of near-Infrared Dyes at 1.55 Μm Excitation. J. Phys. Chem. B
2011, 115 (39), 11530–11535.
(63) Williams, A. T. R.; Winfield, S. A.; Miller, J. N. Relative Fluorescence Quantum Yields
Using a Computer-Controlled Luminescence Spectrometer. Analyst 1983, 108, 1067–
1071.
(64) Seybold, P. G.; Gouterman, M. Porphyrins. J. Mol. Spectrosc. 1969, 31, 1–13.
(65) McLean, A. M.; Socher, E.; Varnavski, O.; Clark, T. B.; Imperiali, B.; Goodson, T. Two-
Photon Fluorescence Spectroscopy and Imaging of 4-Dimethylaminonaphthalimide
Peptide and Protein Conjugates. J. Phys. Chem. B 2013, 117 (50), 15935–15942.
(66) Makarov, N. S.; Drobizhev, M.; Rebane, A. Two-Photon Absorption Standards in the 550-
1600 Nm Excitation Wavelength Range. Opt. Express 2008, 16 (6), 4029–4047.
(67) Adegoke, O. O.; Ince, M.; Mishra, A.; Green, A.; Varnavski, O.; Martínez-Díaz, M. V.;
Bäuerle, P.; Torres, T.; Goodson, T. Synthesis and Ultrafast Time Resolved Spectroscopy

160
of Peripherally Functionalized Zinc Phthalocyanine Bearing Oligothienylene-Ethynylene
Subunits. J. Phys. Chem. C 2013, 117, 20912–20918.
(68) Flynn, D. C.; Ramakrishna, G.; Yang, H.; Northrop, B. H.; Stang, P. J.; Iii, T. G. Ultrafast
Optical Excitation in Supramolecular Metallacycles with Charge Transfer Properties. J.
Am. Chem. Soc. 2010, No. 14, 1348–1358.
(69) Shin, N.; Yun, H.; Yoon, Y.; Son, H. J.; Ju, S.; Kwon, S.; Kim, B.; Kim, Y. Highly Stable
Polymer Solar Cells Based on Poly ( Dithienobenzodithiophene- Co -Thienothiophene ).
Macromolecules 2015, 48, 3890–3899.
(70) Teng, W.; Ye, Q.; Ting, T.; Jin, S.; Xu, J. 4,9-Dihydro-S-indaceno[1,2-b:5,6-
B’]dithiophene-Embedded Electrochromic Conjugated Polymers with High Coloration
Efficiency and Fast Coloration Time. Sol. Energy Mater. Sol. Cells 2015, 136, 92–99.
(71) Schneider, J. A.; Dadvand, A.; Wen, W.; Perepichka, D. F. Tuning the Electronic
Properties of Poly(thienothiophene Vinylene)s via Alkylsulfanyl and Alkylsulfonyl
Substituents. 2013.
(72) Gettinger, C. L.; Heeger, A. J.; Drake, J. M.; Pine, D. J. THE EFFECT OF INTRINSIC
RIGIDITY ON THE OPTICAL PROPERTIES OF PPV. Mol. Cryst. Liq. Cyst. 1994, 256,
507–512.
(73) Nijegorodov, D. The Influence of Planarity and Rigidity on the Absorption and
Fluorescence Parameters and Intersystem Crossing Rate Constant in Aromatic Molecules.
J. Phys. Chem. B 1994, 98, 5639–5643.
(74) Salzner, U. Effect of Donor − Acceptor Substitution on Optoelectronic Properties of
Conducting Organic Polymers. J. Chem. Theory Comput. 2014, 10, 4921–4937.
(75) Demchenko, A. P.; Tomin, V. I.; Chou, P. Breaking the Kasha Rule for More Efficient
Photochemistry. Chem. Rev. 2017, 117, 13353–13381.
(76) Lim, T.; Hsiang, J.; White, J. D.; Hsu, J. H.; Fan, Y. L.; Lin, K. F.; Fann, W. S. Single
Short-Chain Conjugated Polymer Studied with Optical Spectroscopy : A Donor-Accepter
System. Phys. Rev. B 2007, 75, 1–9.
(77) Yamaguchi, Y.; Matsubara, Y.; Ochi, T.; Wakamiya, T.; Yoshida, Z. How the π
Conjugation Length Affects the Fluorescence Emission Efficiency. J am chem Soc
Commun. 2008, 130, 13867–13869.
(78) Zheleznova, Y.; Andryukhova, K. V; Fisyuk, A. S. Effect of Donor to Acceptor Ratio on
Electrochemical and Spectroscopic Properties of Oligoalkylthiophene 1,3,4-Oxadiazole
Derivatives. Phys. Chem. Chem. Phys. 2017, 19, 30261–30276.
(79) Mi, S.; Wu, J.; Liu, J.; Zheng, J.; Xu, C. Donor – P -Bridge – Acceptor Fluorescent
Polymers Based on Thiophene and Triphenylamine Derivatives as Solution Processable
Electrochromic Materials. Org. Electron. 2015, 23, 116–123.
(80) Khetubol, A.; Van Snick, S.; Clark, M. L.; Fron, E.; Couti??o-Gonz??lez, E.; Cloet, A.;
Kennes, K.; Firdaus, Y.; Vlasselaer, M.; Leen, V.; et al. Improved Spectral Coverage and
Fluorescence Quenching in Donor-Acceptor Systems Involving indolo[3-2-B]carbazole
and Boron-Dipyrromethene or Diketopyrrolopyrrole. Photochem. Photobiol. 2015, 91 (3),
637–653.

161
(81) Mccormick, T. M.; Bridges, C. R.; Carrera, E. I.; Dicarmine, P. M.; Gibson, G. L.;
Hollinger, J.; Kozycz, L. M.; Seferos, D. S. Conjugated Polymers: Evaluating DFT
Methods for More Accurate Orbital Energy Modeling. Macromolecules 2013, 46, 3879–
3886.
(82) Casey, A.; Dimitrov, S. D.; Shakya-tuladhar, P.; Fei, Z.; Nguyen, M.; Han, Y.;
Anthopoulos, T. D.; Durrant, J. R.; Heeney, M. Effect of Systematically Tuning
Conjugated Donor Polymer Lowest Unoccupied Molecular Orbital Levels via Cyano
Substitution on Organic Photovoltaic Device Performance. Chem. Mater. 2016, 28, 5110–
5120.
(83) Huang, X.; Shi, Q.; Chen, W.; Zhu, C.; Zhou, W.; Zhao, Z. Low-Bandgap Conjugated
Donor - Acceptor Copolymers Based on Porphyrin with Strong Two-Photon Absorption.
2010, 9620–9626.
(84) Boujtita, M.; Zales, R.; Vivas, M. G.; Silva, D. L.; Bartkowiak, W.; Canuto, S.; Boni, L.
De; Mendonca, C. R. Molecular Structure – Optical Property Relationships for a Series of
Non-Centrosymmetric Two-Photon Absorbing Push-Pull Triarylamine Molecules. Sci.
Rep. 2014, 4, 1–11.
(85) Scarongella, M.; Laktionov, A.; Rothlisberger, U.; Banerji, N. Charge Transfer Relaxation
in Donor-Acceptor Type Conjugated Materials. J. Mater. Chem. C 2013, 1 (12), 2308–
2319.
(86) Banerji, N.; Angulo, G.; Barabanov, I.; Vauthey, E. Intramolecular Charge-Transfer
Dynamics in Covalently Linked Perylene - Dimethylaniline and Cyanoperylene -
Dimethylaniline. J. Phys. Chem. A 2008, 112, 9665–9674.
(87) Pigliucci, A.; Duvanel, G.; Daku, L. M. L.; Vauthey, E. Investigation of the Influence of
Solute−Solvent Interactions on the Vibrational Energy Relaxation Dynamics of Large
Molecules in Liquids. J. Phys. Chem. A 2007, 111 (28), 6135–6145.
(88) Hu, Z.; Willard, A. P.; Ono, R. J.; Bielawski, C. W.; Rossky, P. J.; Bout, D. A. Vanden.
An Insight into Non-Emissive Excited States in Conjugated Polymers. Nat. Commun.
2015, 6, 1–9.
(89) Bixon, M.; Jortner, J.; Heitele, H. Energy Gap Law for Nonradiative and Radiative Charge
Transfer in Isolated and in Solvated. J. Mater. Chem. 1994, 98, 7289–7299.
(90) Jiang, J.; Alsam, A.; Wang, S.; Aly, S. M.; Pan, Z.; Mohammed, O. F.; Schanze, K. S.
Effect of Conjugation Length on Photoinduced Charge Transfer in π ‑ Conjugated
Oligomer-Acceptor Dyads. J. Mater. Chem. A 2017, 121, 4891–4901.
(91) Mikhnenko, O. V; Kuik, M.; Lin, J.; Kaap, N. Van Der; Nguyen, T.; Blom, P. W. M.
Trap-Limited Exciton Diffusion in Organic Semiconductors. Adv. Mater. 2014, 26, 1912–
1917.
(92) Collado-fregoso, E.; Bou, P.; Fei, Z.; Gann, E.; Ashraf, S.; Li, Z.; Mcneill, C. R.; Durrant,
J. R.; Heeney, M. Increased Exciton Dipole Moment Translates into Charge-Transfer
Excitons in Thiophene-Fluorinated Low-Bandgap Polymers for Organic Photovoltaic
Applications. Chem. Mater. 2015, 27, 7934–7944.
(93) Revoju, S.; Biswas, S.; Eliasson, B.; Sharma, G. D. Effect of Acceptor Strength on

162
Optical, Electrochemical and Photovoltaic Properties of Phenothiazine-Based Small
Molecule for Bulk Heterojunction Organic Solar Cells. Dye. Pigment. 2018, 149, 830–
842.
(94) Lim, S. H.; Zhou, Y.; Su, H.; Ong, S. A Stable Solution-Processed Polymer
Semiconductor with Record High-Mobility for Printed Transistors. Sci. Rep. 2012, 2, 1–9.
(95) Carsten, B.; Szarko, J. M.; Son, H. J.; Wang, W.; Lu, L.; He, F.; Rolczynski, B. S.; Lou, S.
J.; Chen, L. X.; Yu, L. Examining the Effect of the Dipole Moment on Charge Separation
in Donor À Acceptor Polymers for Organic Photovoltaic Applications. 2011, 20468–
20475.
(96) Matsuzaki, H.; Furube, A.; Katoh, R.; Singh, S. P.; Sonar, P. Excited-State Dynamics in
Diketopyrrolopyrrole-Based Copolymer for Organic Photovoltaics Investigated by
Transient Optical Spectroscopy Excited-State Dynamics in Diketopyrrolopyrrole-Based
Copolymer for Organic Photovoltaics Investigated by Transient Opti. Jpn. J. Appl. Phys.
2014, 53, 1–5.

163
Chapter 5
Nanosecond Two-Photon Excitation Fluorescence Design of Experiment and
Preliminary Data
5.1 Introduction
The ease of wavelength tunability and broad wavelength selection from ~410 nm to
~1200 nm revolutionizes the TPEF capabilities for the Goodson Group. To utilize the full
potential of this system, I have designed and created a new experimental system and procedure
for the TPEF experiments. The Quanta-Ray and GWU OPO is used for the excitation source. A
Hamamatsu R928 PMT is used to collect the fluorescence. A SRS 250 gated integrator is used
to record the fluorescence response from the PMT. I coded a custom program using the Labview
environment to record the signal output from gated integrator and for digitalization via computer.
The saved data and program are stored on the computer that is connected to the SRS 250 via
GPIB. The TPEF method then can be used to determine the two-photon properties of the
investigated materials.
5.2 Experimental
A new nanosecond laser system has been installed and new experimental system and
procedure were developed in order to investigate TPA properties of compounds using
nanosecond pulses. A Lab Series 170 neodymium-doped yttrium aluminium garnet (Nd:YAG)
Quanta-Ray (Spectra Physics) laser that can produce 10 ns pulses of 1064 nm beam with a power
of 850 mW, 532 nm beam with a power of 450 mW, and 355 nm with 220 mW of power at a
repetition rate of 10 Hz was used as a pump. The Quanta-Ray (Spectra Physics) generates a

164
1064 nm beam by using a pump chamber assembly with two xenon flash lamps that
pump Nd:YAG rods that are water cooled by an internal water reservoir that uses a heat
exchanger with an external water source to ensure that rods do not overheat. The external water
supply is supplied by the building. The supply water source is hooked up to the chiller using a
grey garden hose via the heat exchanger to provide the water that is used to exchange the heat
from the internal water reservoir. A grey return garden hose is connected to heat exchanger and
the water is returned to the return line of the building. The pressure differential between the two
lines is approximately 10 PSI, but is determined by the overall building water usage and cannot
be augmented by the user. When the internal water temperature reaches 31°C, a ceramic valve
opens in the heat exchanger that allows heat from the internal water supply to exchange across
tubing to the external water in the heat exchanger. Both the internal water supply and the
external water supply are isolated from each other. This prevents any contaminates or possible
debris from the building water from mixingwith the distilled water in the internal reservoir,
ensuring the longevity of the cooling system. It should be noted that when Spectra Physics first
installed the system, the ceramic valve failed. When this occurred the water temperature would
exceed 31°C. This was replaced by Spectra Physics and no further issues have been observed.
A standing wave condition is achieved with a high reflector and an output coupler mirror
at the end of the pump chamber, creating a laser resonator. The high reflector reflects photons
that are emitted parallel to the optical axis of the cavity, which get reflected by the output
coupler. This causes the number of photons to be geometrically increased inside of the
resonator. The output coupler reflects most of photons, but a small fraction of the photons are
transmitted, resulting in the escaping photons to become the output beam of the laser. The flash
lamps pump the Nd:YAG in the red and near infrared absorption bands. The excited electrons of

165
Nd:YAG quickly drop to the upper lasing transition, where they remain for approximately 230
µs before falling to the lower lasing transition, which emits a photon at 1064 nm. There are also
other lasing transitions from the same upper lasing state, 1319, 1338, and 946 nm but the gain for
these wavelengths are much smaller and the emission cross section for these wavelengths are
much lower resulting in the selection of 1064 nm for the oscillations. An external nitrogen
supply is used in order to ensure the hygroscopic Nd:YAG rods do not absorb water which
would reduce the efficiency of the gain medium.
In order to obtain short pulses, a Q-switch at the end of pump chamber is used in order to
generate the 10 ns pulses. A Q-switch is composed of a polarizer, a quarter-wave plate, and a
Pockels cell. If the laser was just composed of the gain medium and resonator, the laser pulse
would be on the same order of magnitude of the flash lamp, resulting in a long pulse duration
and a low peak power. Thus a Q-switch is added to the resonator to shorten the pulse duration
and increase the peak power. In normal mode, a Q-switch delay circuit fires a fixed delay which
triggers the Marx bank. The Marx bank is a circuit that generates a high-voltage pulse from a
DC voltage source. It accomplishes the high-voltage pulse by charging a number of capacitors in
parallel, then quickly connecting them in series after they are fully charged. The capacitors are
charged in parallel by the supply voltage through a resistor for each capacitor. A spark gap
between each capacitor is used to connect each capacitor in series. The spark gaps have a
breakdown voltage that is higher than the supply voltage and are open while the capacitors are
charging. When the capacitors are charged, the lowest spark gap breaks down, which increases
the voltage across the next spark gap, thus connecting the first two capacitors in series and
triggering the next spark gap, which continues until all the capacitors are connected in series to
the load. When all the spark gaps are broken down, the impedance is low, which causes all the

166
capacitors to discharge a high voltage pulse when connected to the load that is equal to the
voltage times the number of the capacitors. After the capacitors discharge, the spark gaps stop
being conductive, and the capacitors begin to charge again.
The high voltage pulse is used to trigger a Pockels cell to generate the short laser pulses.
The Pockels cell is an electro-optical crystal that controls light propagation through it by
controlling the phase delay of the crystal by applying a variable voltage. The Pockels cell
introduces high loss into the laser resonator in order to generate high peak power pulses. The
high cavity loss prevents oscillation while the population inversion builds. Then the Pockels cell
is switched to a low loss state, which allows a high peak power pulse to be generated. When no
voltage is applied to the Pockels cell, the polarizer horizontally polarizes the light entering the Q-
switch and the quarter-wave plate converts the polarization to circular polarization. The
circularly polarized reflects off of the high reflector and the quarter-wave plate converts the
circularly polarized light to vertically polarized light. The polarizer only allows horizontally
polarized light to be transmitted, thus the vertically polarized light is reflected out of the
resonator, resulting in high cavity loss. When the high voltage pulse triggers the Pockels cell,
the polarization of the Pockels cell changes, cancelling the polarization retardation of the quarter-
wave plate, allowing horizontally polarization light to exit the Q-switch, resulting in the high
peak power pulse of tens of megawatts of <10 ns.
The high peak power pulse of the 1064 nm fundamental beam from the Nd:YAG is used
to pump a harmonic generator. The harmonic generator at the output of the pump chamber uses
potassium dideuterium phosphate (KD*P) crystals with nonlinear susceptibility to generate the
355 nm and 532 nm beams while passing 1064 nm as well. The 1064 nm beam excites the
atomic dipoles of the crystal. At low intensities the polarization change is linearly dependent on

167
the electric field of the incident light and it is proportional to the magnitude of the electric field
of the incident light. While at high intensities, the polarization change is nonlinearly dependent
on intensity of the incident light. This polarization contains an oscillation term at twice the
frequency of the incident light, resulting in the frequency doubling of the 1064 nm fundamental.
The 355 nm beam is generated by sum-frequency mixing of the 1064 nm fundamental with the
532 nm second harmonic beam. The setup for the Quanta-Ray (Spectra Physics) can be seen in
Figure 5.2.1.
Figure 5.2.1. Quanta-Ray Laser System1
To ensure efficient and consistent operation of the Quanta-Ray, I have developed a
Standard Operating Procedure (SOP) for the laser system. This SOP will ensure consistent day
to day operation as well as the overall longevity of the laser system. The SOP is as follows:
NS Laser SOP
Start Up Procedure
1. Turn on water flow to chiller by turning the red handles of the building water main
perpendicular to the floor.

168
2. Increase nitrogen flow to the laser from 0.2 to 0.5 on the nitrogen control apparatus on
the laser table.
3. Press the enable button on the controller for the Quanta Ray,
4. Watch for the simmer lights to blink a few times and then turn off, and then the oscillator
simmer indicator glows orange.
5. Then wait for water temperature to increase from ~22°C to 25-27°C, ~30 minutes for the
water to circulate in the chiller. I have installed a remote thermometer in the water
reservoir to monitor the temperature at all times. This ensures that there smaller
temperature changes when the flash lamp is turned on.
6. Make sure that the single shot is selected on the controller and the laser is in long pulse
mode. The single shot/rep switch sets the laser to one pulse at a time when it is switched
to single shot. In long pulse mode, the voltage is applied to the Pockels cell as soon as
the flash lamp fires, and the Q-switch is held open the entire lamp firing. This results in a
train of pulses of about 200 µs long, with a separation of 2 to 4 µs between individual
pulses. This results in the total energy of the pulse train to be similar to that of a single
Q-switched pulse. This ensures that that the laser pulse energies are low while the system
is warming up.
7. The flash lamps are then turned on by turning the OSC knob to the 9 o’clock position and
wait ~10 minutes for the temperature to stabilize.
8. Then turn the OSC knob to 12 o’clock position and wait for the temperature of the chiller
to reach 31°C.
9. Then turn OSC knob to start to turn off the flash lamps and then turn the Mode knob to
Q-switch and hit the button to switch from single shot to Rep mode, then turn OSC knob

169
back to 9 o’clock position. Wait 10 minutes. The first few pulses in this mode are high
energy, following this procedure prevents initial surges from damaging anything
downstream.
10. Then turn the OSC knob to the 12 o’clock position. Wait 10 minutes.
11. Then turn the OSC knob to the 3 o’clock position. You should start to see the green flash
of the signal coming through the middle output of the OPO.
12. Allow the laser to warm up for 60 minutes.
13. There is defocusing of the KD*P from the 355 nm that reflects back from the OPO that
affects the power. The two black knobs on the Harmonic Generator (HG) can be used to
increase the power after warm up.
Shut Down is accomplished by:
Shutdown Procedure
1. Turn OSC knob to start.
2. Press Rep button to single shot.
3. Turn Mode Knob to LP.
4. Let the chiller run for 10 minutes, then hit the stop button.
5. Decrease the nitrogen flow to 0.2.
6. Shutoff the water mains by turning the red handles parallel to the floor.
The Quanta-Ray (Spectra Physics) is used to a pump a Beta Barium Borate (BBO) crystal
in an Optical Parametric Oscillator (OPO) (GWU versascan). The 532 nm and 1064 nm beams
are dumped into beam dumps within the GWU versascan and the 355 nm beam is used to pump
the BBO crystal of the OPO. For optical parametric oscillation, the pump photon in the
nonlinear BBO crystal splits into two lower-energy photons that add up to the energy of the

170
pump photon. The pump photon is polarized in the direction of the optical axis, extraordinary,
and the resulting low-energy photons are polarized perpendicular to the optic axis, ordinary. The
BBO crystal is a birefringent, which means the index of refraction of an extraordinary wave
varies with the direction of propagation, negative uniaxial crystal, which means the index of
refraction decreases continuously from that equal to the ordinary wave in the propagation
direction along the optical axis to a minimum value in the orthogonal direction. Thus, as the
BBO crystal is rotated, the index of refraction changes, resulting in unique frequency output of
the two low energy photons, resulting in a signal photon and an idler photon. The BBO crystal is
in a resonator cavity where standing wave conditions are achieved in order to produce a signal
beam (412 nm – 709 nm) and idler beam (710 nm – 3300 nm) of laser pulses of 5 ns – 9 ns of up
to 600 mw of power. The beam dumps can also be removed and the 532 nm and 1064 nm beams
can be used in experiments for excitation sources. A diagram of the OPO can be seen in Figure
5.2.2.2
Figure 5.2.2. Schematic setup of OPO VersaScan2
To get the desired signal or idler wavelength output, the angle of the BBO crystal is tuned
via an electric motor via computer using Spectra Physics supplied software. The electric motor
position must be calibrated to produce the correct angle to produce the desired wavelength. The
calibration is accomplished by the following procedure:

171
Electric Motor Calibration
1. The calibration can be accessed by opening the ScanMaster SHG GWU program on the
desktop. Seen in Figure 5.2.3.
Figure 5.2.3. Desktop location for ScanMaster SHG
2. Then click on Config then open the calibration wizard. Seen in Figure 5.2.4.

172
Figure 5.2.4. Location of the calibration wizard
3. After clicking on calibration, the base calibration window opens with a drop down menu
for selecting which calibrations will be modified. To modify the calibration for the OPO,
2018_257_354 calibration file should be selected then click OK. Seen in Figure 5.2.5.
Figure 5.2.5. Base calibration selection

173
4. This then opens the window for crystal configuration. To calibrate the motor positions
for signal beam (409 nm – 708 nm) and idler beam (710 nm – 1200 nm), UV-L crystal
configuration for stage 1 must be selected and then click OK. Seen in Figure 5.2.6.
Figure 5.2.6. Crystal configuration selection window
5. This finally opens the calibration wizard to calibrate the electric motor position for
electronic control of the signal and idler wavelengths of the OPO. Seen in Figure 5.2.7.

174
Figure 5.2.7. Calibration wizard window
6. To begin calibration, a five point calibration table is constructed.
7. For the first position, a wavelength is selected that is in the middle of the range of the
crystal, in this case 550 nm. Then click Go to. This will roughly move the motor
position to a wavelength of 550 nm. The wavelength is monitored by measuring a weak
reflection of the output beam using a fiber with cosine corrector with an optical diffuser
connected to an Ocean Optics spectrometer and recorded via OceanView software via
computer. The power is monitored with a Coherent J-50MB-YAG: ENERGYMAX
SENSOR with a Coherent LabMax-TOP energy meter.
8. The power is maximized by clicking the moving in and moving out buttons, the speed of
motor position search is controlled by the sliding bar under the moving in and moving out
buttons. When the maximum power is obtained, the exact output wavelength is recorded
from the OceanView software. This is inputted in the wavelength window for the first
position. This position is saved by clicking on Get position from adjust button.

175
9. For the second position, a wavelength is selected that is the start of the range of the
crystal, in this case 410 nm. Then click Go to. This will roughly move the motor
position to a wavelength of 410 nm. The procedure that was used to get the first position
is then followed to obtain the second motor position for 410 nm.
10. For the third position, a wavelength is selected that is roughly the middle of 410 nm and
550 nm, in this case 480 nm. The third motor position was obtained by similar procedure
used for first and second position.
11. For the fourth position, a wavelength is selected that is roughly the middle of 550 nm and
709 nm, in this case 630 nm. The fourth motor position was obtained by similar
procedure used for the other motor positions.
12. For the fifth position, a wavelength is selected that is the end of the range of the crystal,
in this case 709 nm. The fifth motor position was obtained by similar procedure used for
the other motor positions.
13. Then click next. Then the similar procedure is used for the SHG crystal positions and
prism positions for second harmonic generation, these wavelengths can be used for future
experiments but are not used for TPA experiments.
14. Then to save the calibration, click finish.
The experimental setup for the nanosecond TPEF can be seen in Figure 5.2.8. The OPO
output beam is passed through an iris to maintain a consistent beam diameter for all wavelengths.
The signal and idler is then passed through an optical glass that reflects 10% of the beam to a
Thorlabs silicon photodiode that is protected by a 2.5 OD and 0.4 OD neutral density filters. The
photodiode is used to trigger the SRS 250 gated integrator, which will be discussed shortly. A
beam dump is placed behind the reflecting glass to collect back reflection from the reflecting

176
glass. The remaining signal and idler beam is passed through a beam attenuator that can
attenuate wavelengths >1000 nm. Two beam dumps are placed on either side of the beam
attenuator to collect residual beams that are perpendicular to the propagating beam that result
from the attenuation of the propagating beam. Finally the signal or idler is selected by placing
either a GWU Vis filter option is used to get idler beam only, or 700 nm lowpass filters to block
idler wavelengths for signal use. A reflecting mirror is used to direct the excitation beam into the
sample. A neutral density wheel is used to control the power of the excitation beam. A focusing
lens after the neutral density wheel is used to focus the beam onto the sample. A beam dump is
placed behind the sample to collect the residual excitation beam. The fluorescence from the
sample is collected perpendicular to the excitation beam. A focusing beam is used to collimate
the fluorescence onto the PMT. A series of filters are used to block scattering from the
excitation beam. The PMT fluorescence response output is connected to the SRS 250 gated
integrator. The SRS 250 is connected to a computer via a GPIB where a custom program is used
to record the data.

177
Figure 5.2.8. Nanosecond TPA Setup. 1: Photodiode for trigger. 2: 2.5 OD ND filter. 3: 0.4
OD ND filter. 4: Iris. 5: Reflecting glass. 6, 7, 9, 15: Beam dumps. 8: Beam attenuator(for
wavelengths >1000nm). 10: Filter(GWU Vis filter option used to get Idler only, or 700 nm
lowpass filters to block Idler wavelengths for Signal use). 12: ND wheel. 13, 16: Focusing lens.
14: Sample holder. 17-20: PMT filters (975 nm Lowpass filters for excitation wavelengths >975
nm, or 700 nm cut-off filters for excitation wavelengths <975 nm). 21: PMT. Solid blue lines
are laser beams. Dashed blue lines are reflected laser beams. Solid orange line is fluorescence.
Solid black lines are wires.
The SRS 250 gated integrator is the key component for the TPEF data collection. The
SRS 250 consists of a gate generator and a fast gated integrator. The gate generator is triggered
externally by the Thorlabs silicon photodiode. The gate generator generates a gate that is
adjustably delayed from a few nanoseconds to 100 milliseconds, generating a continuously
adjustable gate of 2 nanoseconds to 15 microseconds. The fast gated integrator integrates the
input signal from the PMT during the gate. The output from the integrator is then normalized by
the gate width to provide a voltage that is proportional to the average of the input signal during
the sampling gate. The SRS 250 gated integrator can be seen in Figure 5.2.9.

178
Figure 5.2.9. SRS 250 gated integrator
The gated integrator analyzes an input analogue signal and produces an analogue output
signal, which is not convenient for data analysis. To make data collection easier and easily
manipulated, I coded a custom program to record and collect the TPEF signal. The first part of
my program initializes the SRS 250 and prepares it to receive commands from my program. It
sets the address that the SRS 250 and the computer will interact through, in this case the two are
connected by GPIB with address 3. It also designates which front input will be reporting the data
to the computer. A wait function is then employed to ensure that the ports and addresses are set
before the data collection portion of the code is ran. This can be seen in Figure 5.2.10.

179
Figure 5.2.10. Block diagram of initialization of custom data collection program
The second part of my program is responsible for the data collection. It consists of two
for loops. The inner for loop is responsible for setting how many samples will be recorded. The
inner loop requests the voltage value from the SRS 250 after the fluorescence signal has been
integrated and then it waits 100 ms for the next pulse to collect the fluorescence signal again.
This is repeated for how many times the program is set to record. It then adds all of the signals
together and divides it by the number of samples that were recorded. This can be seen in Figure
5.2.11.

180
Figure 5.2.11. Block diagram data collection for first for loop
The outer for loop is used to set the number of scans and to create a break between scans
so the user can change the power for the next scan. This can be seen in Figure 5.2.11. and
Figure 5.2.12.
Figure 5.2.12. Block diagram for sequence that creates a user interface for scan s
The last part of the program plots the collected data and then creates a file with the values
stored. Seen in Figure 5.2.13.
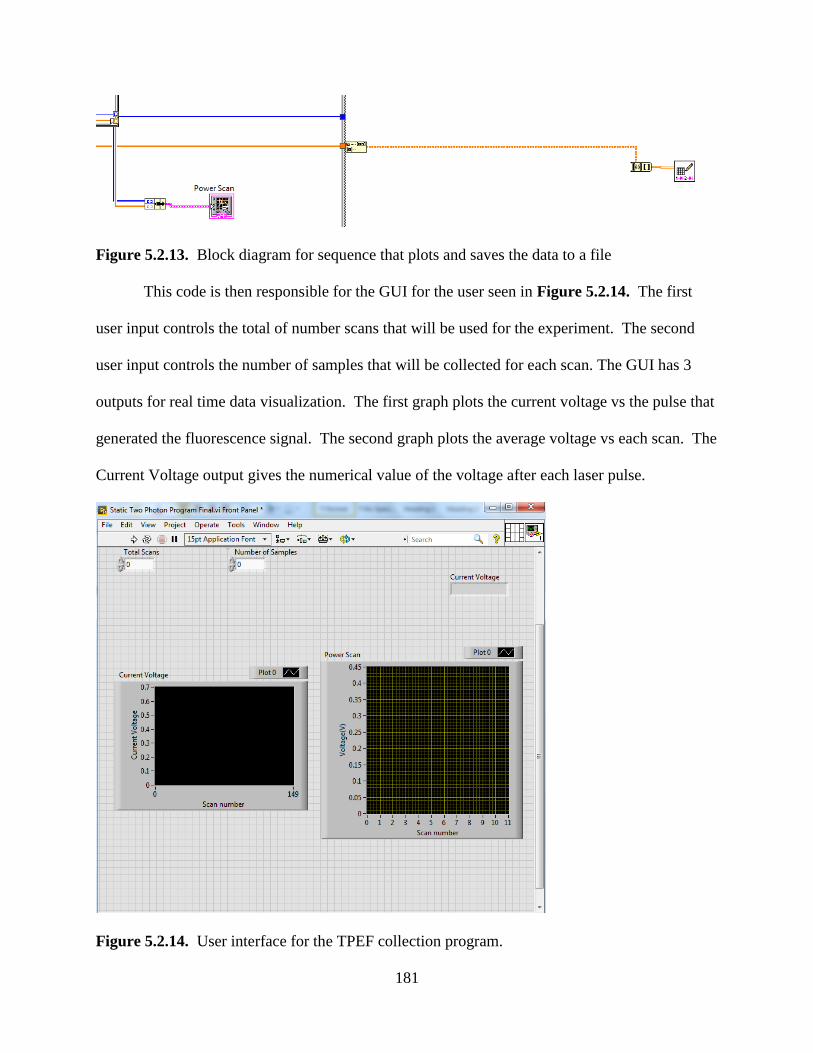
181
Figure 5.2.13. Block diagram for sequence that plots and saves the data to a file
This code is then responsible for the GUI for the user seen in Figure 5.2.14. The first
user input controls the total of number scans that will be used for the experiment. The second
user input controls the number of samples that will be collected for each scan. The GUI has 3
outputs for real time data visualization. The first graph plots the current voltage vs the pulse that
generated the fluorescence signal. The second graph plots the average voltage vs each scan. The
Current Voltage output gives the numerical value of the voltage after each laser pulse.
Figure 5.2.14. User interface for the TPEF collection program.

182
For accurate data collection, the collection program must be turned on before the SRS
250 is turned on. The user parameters must be inputted before the SRS 250 is turned on. As
seen in Figure 5.2.15, where 14 scans of 600 pulses each will be conducted. Then the power
can be turned on for the SRS 250. This prevents the GPIB write and read from timing out due to
conflicts between the SRS 250 and the data collection program. Then the PMT can be turned on.
To avoid drift of the background, which is intrinsic to the SRS 250, allow the whole collecting
system to warm up for 60 mins. After this, experiments can be carried out.
Figure 5.2.15. User parameters inputted before turning on SRS 250.

183
5.3 Preliminary Data
In order to verify that the experimental design is viable and that custom program is
working, TPEF experiments were carried out using excitation wavelengths from 800 nm to 1100
nm using well studied two-photon absorbing dyes. Acridine Orange is a well-known two-photon
absorbing dye. It was used to verify TPEF using 850 nm excitation. Rhodamine B is also a
well-known two-photon absorbing dye. It was used to verify TPEF for 750 nm-1100 nm
excitation, using 50 nm increments to confirm the TPEF at each wavelength.
The operation and experimental procedure described in 5.2 above was used.
Additionally, a few more details are necessary to carry out these experiments. The optical
density of dye solutions were kept below 0.1 OD. This was necessary to prevent fluorescence re-
absorption. It also prevented saturation of the PMT. The dyes used in these experiments have
large two-photon absorption cross-sections and high quantum yields which can easily produce
high fluorescence intensities that can saturate the PMT, which will interfere with the TPEF
experiments. The excitation powers were also kept below 2 mW. Higher powers would not only
lead to saturation of the PMT but it would also lead to optical limiting conditions that would
prevent two-photon absorption identification. Also, high responses from the PMT would
saturate the integrating circuit in the gated integrator. Thus the concentration and the powers
were kept low.
Experiments were carried out using 14 scans and 600 samples per scan. Two background
scans were taken at the beginning of each experiment in order to establish the background level
of the experiments. Two additional background scans were taken at the end of the experiment in
order to monitor any drift of the background over the course of the experiment. The power level
was controlled by the neutral density wheel. Scans were carried out from 0.2 mW to 2.0 mW

184
using increments of 0.2 mW. 600 samples were taken per scan in order to obtain the
fluorescence as well as avoiding excessive exposure of the sample to the excitation beam which
can lead to degradation. The experimental results from 750 nm to 1100 nm for Rhodamine B
can be seen in Figure 5.3.1 and the experimental results at 850 nm for Acridine Orange can be
seen in Figure 5.3.2.
-0.10 -0.05 0.00 0.05 0.10 0.15 0.20 0.25 0.30 0.35
-1.3
-1.2
-1.1
-1.0
-0.9
-0.8
-0.7
-0.6
-0.5
Rhod B 750 nm
Linear Fit
Lo
g(v
olta
ge
)
Log(power)
Log(V) vs Log(mW) for Rhod B at 750 nm Excitation
Trial 1
y= 2.0123x - 1.1192
-0.4 -0.3 -0.2 -0.1 0.0 0.1 0.2 0.3 0.4
-2.0
-1.8
-1.6
-1.4
-1.2
-1.0
-0.8
-0.6
-0.4
Rhod B 750 nm
Linear FitL
og
(vo
lta
ge
)
Log(power)
Log(V) vs Log(mW) for Rhod B at 750 nm Excitation
Trial 2
y= 2.0149x - 1.048
-0.10 -0.05 0.00 0.05 0.10 0.15 0.20 0.25 0.30
-0.5
-0.4
-0.3
-0.2
-0.1
0.0
0.1
0.2
0.3
Rhod B 800 nm
Linear Fit
Lo
g(v
olta
ge
)
Log(power)
Log(V) vs Log(mW) for Rhod B at 800 nm Excitation
Trial 1
y = 1.999x-0.2507
-0.4 -0.3 -0.2 -0.1 0.0 0.1 0.2 0.3 0.4
-1.0
-0.8
-0.6
-0.4
-0.2
0.0
0.2
0.4
Rhod B 800 nm
Linear Fit
Lo
g(v
olta
ge
)
Log(power)
Log(V) vs Log(mW) for Rhod B at 800 nm Excitation
Trial 2
y = 1.993x - 0.262
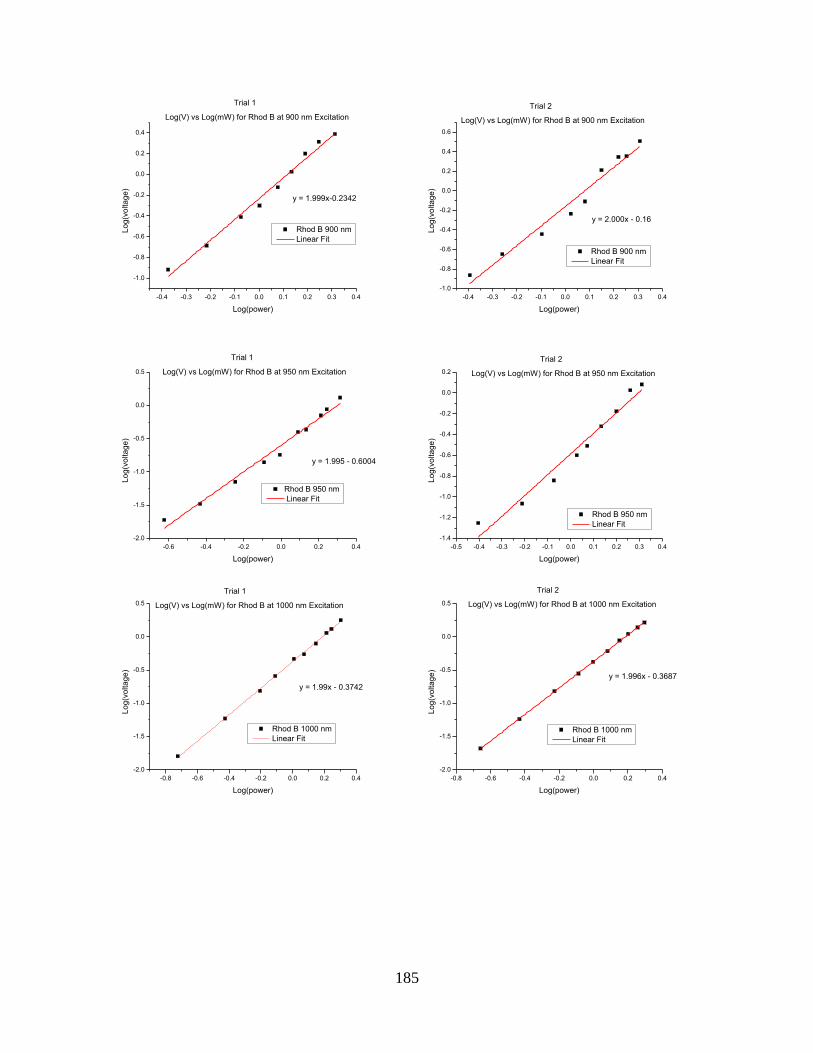
185
-0.4 -0.3 -0.2 -0.1 0.0 0.1 0.2 0.3 0.4
-1.0
-0.8
-0.6
-0.4
-0.2
0.0
0.2
0.4
Rhod B 900 nm
Linear Fit
Lo
g(v
olta
ge
)
Log(power)
Log(V) vs Log(mW) for Rhod B at 900 nm Excitation
Trial 1
y = 1.999x-0.2342
-0.4 -0.3 -0.2 -0.1 0.0 0.1 0.2 0.3 0.4
-1.0
-0.8
-0.6
-0.4
-0.2
0.0
0.2
0.4
0.6
Rhod B 900 nm
Linear Fit
Lo
g(v
olta
ge
)
Log(power)
y = 2.000x - 0.16
Log(V) vs Log(mW) for Rhod B at 900 nm Excitation
Trial 2
-0.6 -0.4 -0.2 0.0 0.2 0.4
-2.0
-1.5
-1.0
-0.5
0.0
0.5
Rhod B 950 nm
Linear Fit
Lo
g(v
olta
ge
)
Log(power)
Log(V) vs Log(mW) for Rhod B at 950 nm Excitation
Trial 1
y = 1.995 - 0.6004
-0.5 -0.4 -0.3 -0.2 -0.1 0.0 0.1 0.2 0.3 0.4
-1.4
-1.2
-1.0
-0.8
-0.6
-0.4
-0.2
0.0
0.2
Rhod B 950 nm
Linear Fit
Lo
g(v
olta
ge
)
Log(power)
Log(V) vs Log(mW) for Rhod B at 950 nm Excitation
Trial 2
-0.8 -0.6 -0.4 -0.2 0.0 0.2 0.4
-2.0
-1.5
-1.0
-0.5
0.0
0.5
Rhod B 1000 nm
Linear Fit
Lo
g(v
olta
ge
)
Log(power)
Log(V) vs Log(mW) for Rhod B at 1000 nm Excitation
Trial 1
y = 1.99x - 0.3742
-0.8 -0.6 -0.4 -0.2 0.0 0.2 0.4
-2.0
-1.5
-1.0
-0.5
0.0
0.5
Rhod B 1000 nm
Linear Fit
Lo
g(v
olta
ge
)
Log(power)
Log(V) vs Log(mW) for Rhod B at 1000 nm Excitation
Trial 2
y = 1.996x - 0.3687

186
-0.3 -0.2 -0.1 0.0 0.1 0.2 0.3
-2.0
-1.8
-1.6
-1.4
-1.2
-1.0
-0.8
-0.6
Rhod B 1064 nm
Linear Fit
Lo
g(v
olta
ge
)
Log(power)
Log(V) vs Log(mW) for Rhod B at 1064 nm Excitation
Trial 1
-0.4 -0.3 -0.2 -0.1 0.0 0.1 0.2 0.3 0.4
-2.2
-2.0
-1.8
-1.6
-1.4
-1.2
-1.0
-0.8
-0.6
Rhod B 1064 nm
Fit Linear
Lo
g(v
olta
ge
)
Log(power)
Log(V) vs Log(mW) for Rhod B at 1064 nm Excitation
Trial 2
y = 2.006x-1.2894
-0.1 0.0 0.1 0.2 0.3
-1.8
-1.6
-1.4
-1.2
-1.0
-0.8
Rhod B 1100 nm
Linear Fit
Lo
g(v
olta
ge
)
Log(power)
Log(V) vs Log(mW) for Rhod B at 1100 nm Excitation
Trial 1
y = 1.9961x - 1.4979
-0.10 -0.05 0.00 0.05 0.10 0.15 0.20 0.25 0.30 0.35
-1.7
-1.6
-1.5
-1.4
-1.3
-1.2
-1.1
-1.0
-0.9
-0.8
Rhod B 1100 nm
Linear Fit
Lo
g(v
olta
ge
)
Log(power)
Log(V) vs Log(mW) for Rhod B at 1100 nm Excitation
Trial 2
y = 1.9894x - 1.4624
Figure 5.3.1 Two-photon absorption results from 750 nm to 1100 nm for Rhodamine B
-0.5 -0.4 -0.3 -0.2 -0.1 0.0 0.1 0.2 0.3
-0.8
-0.6
-0.4
-0.2
0.0
0.2
0.4
0.6
0.8
AO 850 nm
Linear Fit
Lo
g(v
olta
ge
)
Log(power)
Log(V) vs Log(mW) for AO at 850 nm Excitation
Trial 1
y = 2.002 x + 0.0548
-0.4 -0.3 -0.2 -0.1 0.0 0.1 0.2 0.3
-0.8
-0.6
-0.4
-0.2
0.0
0.2
0.4
0.6
0.8
AO 850 nm
Linear Fit
Lo
g(v
olta
ge
)
Log(power)
Log(V) vs Log(mW) for AO at 850 nm Excitation
Trial 2
y = 2.001x + 0.0658
Figure 5.3.2 Two-photon absorption results from 850 nm for Acridine Orange

187
5.4 Conclusion
A new nanosecond laser has been introduced and described. The principles and standard
operating procedures have been discussed. A new nanosecond laser system has been
successfully installed that has a wide bandwidth of tunability. A new two-photon absorption
system has been designed and tested. A PMT with a gated integrator with a custom program is
used to collect the signal. Preliminary results of two-photon absorbing dyes have shown the
successful operation of this new experimental system. There is still room for improvement for
this system. The results using excitations above 900 nm had less scattering than the results from
700 nm – 900 nm. The PMT has high quantum efficiencies in the 700 nm - 900 nm range, thus
longer wavelength scattering will not contribute to experimental error as much. Filters have
been placed in front of the PMT to decrease the scattering from the excitation beam, but the two-
photon results have shown that there is still scattering influencing the data. Although, good
results have been obtained, the scattering does add some error to the TPA cross-section
determinations. Additional filters can be added to the experimental setup to decrease the
scattering even more, and an iris can be placed in front of the PMT aperture to cut down on the
scattering.
References
(1) Quanta-Ray Lab-Series: Pulsed Nd:YAG Lasers User’s Manual.
(2) GWU VersaScan. Beta-Barium Borate. Optical Parametric Oscillator User Manual.
188
Chapter 6
Nanosecond Transient Absorption Experiment and Preliminary Data
6.1 Introduction
The new nanosecond laser, described in Chapter 5, has also opened new and exciting
opportunities for the investigation of long timescale photophysical processes. The new
nanosecond laser can provide excitations of 250 nm to 2600 nm, providing a breadth of
wavelengths to excite molecules of interest. A new fully automated spectrometer (LP980,
Edinburgh) has been installed in order to record nanosecond transient absorption spectra and
kinetics. The LP980 provides a pulsed probe beam that produces a continuous excitation from
190 to 2600 nm. Using the new nanosecond laser as a pump source and the LP980 probe source
and using complex electronics and software, transient species can be investigated from 10s of
nanoseconds to 100s of second, bringing a new era of exploration to the Goodson Group.
6.2 Experimental
The nanosecond transient absorption setup consists of an excitation laser used as the
pump source and the LP980 spectrometer as the data collection device and probe source. The
experimental setup can be seen in Figure 6.1. The operation and detailed description of the new
nanosecond laser (QuantaRay, Spectra Physics, and OPO, GWU) is described in a previous
chapter. For the nanosecond transient absorption experiment, the sample is excited from the
ground state to an excited state by the nanosecond pulsed laser and a xenon lamp within the
LP980 is used as a broadband light source to probe the excited state as depicted in Figure 6.2.
The 150 W ozone-free, xenon arc lamp produces 6 ms pulses of a continuous spectrum from 190

189
nm to 2600 nm. The probe pulse excites the sample perpendicular to the laser excitation
which maximizes the change in absorption while minimizing scattering and fluorescence.
Transient species only occur in the overlapped region which reduces triplet-triplet annihilation
and photodegradation. After passing through the sample at a right angle to the excitation beam,
the light is directed to a monochromator. The light is then measured by a PMT (Hamamatsu
R928) with a spectral range from 185 to 870 nm. The transmission response of the sample
before, during, and after the excitation pulse is converted by the PMT into electrical signals that
are measured by a TDS3052B Model oscilloscope. The Edinburgh supplied software converts
the electrical signal into change of optical density.
Figure 6.1. Nanosecond transient absorption setup. 1: Iris. 2: Filters (optional). 3-6: Prisms for
directing the beam.

190
Figure 6.2. LP980 setup
To ensure efficient and consistent operation of the LP980 system and the nanosecond
transient absorption experiment, I have developed a Standard Operating Procedure (SOP) for the
system. This SOP will ensure consistent day to day operation as well as the overall longevity of
the system. The SOP is as follows:
Nanosecond Transient Absorption SOP
Start Up Procedure
1. Warm up the QuantaRay and OPO using same procedure described in the nanosecond
TPA chapter.
2. Turn on the computer that has the LP980 software and Turn on the Oscilloscope. Then
turn on the Power Hub (PH1). Wait for the Probe Control on the LP980 to display “ready
to start”, then press the silver button.
3. Open the L900 software on the computer. Allow the lamp to warm up for a half an hour
for stable probe light.
4. Wait for the laser and lamp to warm up.

191
Sample Measurement and System Operation
5. Turn the Osc knob to Start on the QuantaRay controller. Turn the Source knob to
External and Mode knob to External. Then turn the Osc to 9/10 power. This allows for
full control of the laser system by the LP980 software.
6. In the L900 software window go to Setup → Kinetic Abs Setup or click on in the tool
bar and select Setup. The Kinetic Absorption Setup window can be seen in Figure 6.3. In
order to conduct experiments, laser, laser shutter, and probe shutter need to be in timed
configuration. Then ensure that the probe is in pulsed mode. Select the wavelength of
interest under the detector monochromator tab and start with a bandwidth of 1 nm. Select
“Apply” then press “Start”. Observe the probe background then press “Stop”. Adjust the
bandwidth until the probe background is over 500 mV but less than 600 mV.
Figure 6.3. Kinetic Absorption Setup window

192
7. In the Kinetic Absorption Setup window, click on the Oscilloscope tab, seen in Figure
6.4, and set time range approximately 10 times longer than the sample’s expected
lifetime. If the sample’s lifetime is unknown, set the time range to 4000 ns. Set the shift
at 10% and start with the voltage range (under the PMT channel (Ch1) range tab) at 400
mV. Click on “Apply” and “Start”, and then stop the scan once the signal appears.
Optimize the slit, voltage, and time range in order to make sure the signal does not
exceed 600 mV.
Figure 6.4. Oscilloscope tab
8. When the maximum possible signal is obtained, press “Apply” and then press “Close” on
the Kinetic Abs Setup window. Click and select Multiple for kinetic data at selected
wavelength. Select desired number of averages per measurement under the Measurement

193
tab, seen in Figure 6.5. Select the number of laser shots to be discarded at 3. Select the
background tabs and select the appropriate background subtraction, seen in Figure 6.6.
Select probe background for measurements longer than 20 microseconds, and select
fluorescence background when the sample has fluorescence at the monitoring wavelength
to remove it. Click on “Apply” and “Start”.
Figure 6.5. Measurement tab
Figure 6.6. Background tab

194
9. To save the data, click on “File” and “Save”. This will save the data as files that can be
read by the software. The data also must be saved by exporting to ASCII for data that
can be read by excel and Origin 8. To export the the data in ASCII format by click “File”
and “Export Data”.
10. To fit a negative Multi OD data go to Data in the toolbar and select scale and put -1 in the
scale. This inverts the data so that the software can fit the kinetics. This inversion is not
necessary for positive Multi OD data. Then click on “Data” and “exponential fit” and
“Tail Fit”. Then save raw data and the fitted data can and export the fitted data using
ASCII format.
11. To get kinetic data at multiple wavelengths, use Map measurements. Click and select
Setup and Kinetic Abs Setup. Under the controller tab, set the wavelength at 500 nm
(where the lamp signal is most intense) and, if applicable, at a wavelength where the
sample’s emission is maximum and then vary the slit width to get about 500 mV signal.
Under the oscilloscope tab, use the same time and shift that was used for multiple in step
8, and then use voltage range at 160 mV. Once the voltage level of 500 mV is reached,
set the wavelength (under detector monochromator tab) to the start wavelength that will
be used as the initial wavelength for the map measurement. Click “Apply” and “Start”.
Click “Stop” once the software has found the baseline at the start wavelength. Close the
window.
12. Then click and select Map. Under the measurement tab set your wavelength range for
the map, seen in Figure 6.7, and set number of scans per each wavelength. The
maximum possible wavelength range for map measurements is 300 nm to 860 nm. Select
steps (interval) that give good resolution while avoiding sample degradation, avoid

195
mapping at laser excitation wavelength. Under the background tab set background as
needed as discussed above. Click “Apply” and “Start”.
Figure 6.7. Wavelength selection window
13. Once data acquisition is complete, save both raw as well as the ΔOD data. Export the
data in ASCII format. Move the cursor to the starting point of the signal in the ΔOD data,
right click and set to time zero.
14. To get kinetic data at each wavelength, click “Data” and “Data Slicing”. Start the slicing
range at zero and stop the slicing where the kinetic is complete. Select the desired number
of slices that give a good representation of the kinetic decay, seen in Figure 6.8. Save
data and export in ASCII format as previously described.
Figure 6.8. Data slicing window

196
Laser Alignment
15. Tris(bipyridine)ruthenium(II) chloride (RuBPY) is used to align the laser. Place the
RuBPY (Standard) in the sample holder. Click on “kinetic abs setup”. Under the
Controller tab select Open under the Laser shutter tab and hit “Apply”, as seen in Figure
6.9. Check that the beam is level with the prism outside the sample chamber and that is
level with sample chamber. The beam height should be approx. 17 cm at the prism
outside the sample chamber. The ideal beam diameter is approx. 7 mm. The Laser power
should be below 5mJ just before the sample. This can be controlled by the Osc knob on
the QuantaRay controller. Alignment is achieved when fluorescence is observed from the
sample and the laser passes through the hole in the sample holder.
Figure 6.9. Kinetic absorption setup for RuBPY

197
16. Turn the Osc knob to Start on the QuantaRay controller. Turn the Source knob to
External and Mode knob to External. Then turn the Osc to 9/10 power. This allows for
full control of the laser system by the LP980 software.
17. Click laser icon in the L900 software to ensure the Laser setting is set to Mode1 (1 Hz) as
seen in Figure 6.10.
Figure 6.10. Laser mode window
18. Click and select Setup. Under the Controller window keep laser-timed, Laser shutter-
timed, Probe-pulsed, Probe shutter-timed.
19. Under the Controller tab, set the wavelength at the transient absorption wavelength (370
nm) of the standard. Keep the bandwidth between 1 to 2 nm, click “Apply” and “Start”.
20. Under the Oscilloscope tab, set the time to 4000ns, the shift to 10%, and the voltage
range to 400 mV.
21. Two people are needed in order to override the interlocks of the laser compartment in the
LP980 spectrometer seen in Figure 6.11. Small adjustments can be made using the
tuning screws of the last prism before the sample to maximize the transient signal.

198
Figure 6.11. Prism compartment for adjusting laser alignment to the sample
Lamp Alignment
22. For lamp alignment, remove all samples. Set the iris next to the sample chamber in the
vertical position seen in Figure 6.12. The lamp can be accessed by removing the lamp
housing lid seen in Figure 6.13.
Figure 6.12. Sample compartment with iris
Figure 6.13. Lamp housing chamber

199
23. For lamp alignment, go to kinetic abs setup in the software. Under the Controller tab, set
the laser to timed, laser shutter to closed, the probe pulse to CW, and the probe shutter to
timed mode as seen in Figure 6.14. Set the wavelength to 500 nm, and the bandwidth to
1nm. Under the Oscilloscope tab, set the time range to 4000 ns, the shift at 10%, and the
voltage range to 160 mV. Then press “Apply” and then “start”.
Figure 6.14. Configuration for Lamp alignment
24. With two people, override the interlocks. Unlock the mirror screws in the back of the
mirror seen in Figure 6.15. Then use the alignment screws to achieve the highest
voltage; this will be approx. 40 mV at peak. Then, carefully re-lock the screws on the
mirror to “finger tight” and close the lid. After the lamp alignment repeat final laser
alignment procedure.

200
Figure 6.15. Mirror screws for adjustments
Shut Down SOP
25. Close all the active windows in the software.
26. Close the L900 software.
27. Turn off the Oscilloscope.
28. Click the silver button on the Probe Lamp Indicator. Wait for the indicator to read “ready
to start”, then turn off PH1.
29. Turn the Osc knob to start, source knob to fixed and mode to LP.
30. Then press off button on QuantaRay controller.
31. If the system is not going to be used for a while (weeks or months) turn off LP1 and then
turn off the switch at the backside of the instrument.
Preliminary Data
In order to verify the successful alignment and operation of the new nanosecond transient
absorption system, Ru(BPY)3 was used as a standard. Ru(BPY)3 is a well-studied metal-
organic dye that has long-lived excited states. Ru(BPY)3 has a d to d transition at 370 nm of up
to 650 ns, a metal to ligand charge transfer (MLCT) at 450 nm up to 358 ns, and a singlet

201
emission at 620 nm.1 Ru(BPY)3 was excited using 415 nm beam and probed from 325 nm to
700 nm.
The operation and experimental procedure described above was used for mapping for
Ru(BPY)3. The optical density of the solution was kept at 0.4 OD. Experiments were carried out
using increments of 20 nm from 325 to 700 nm. The excitation power was 4.2 mJ. The
experimental results for Ru(BPY)3 can be seen in Figure 6.16.
Figure 6.16. Nanosecond transient absorption of Ru(BPY)3
The obtained results for Ru(BPY)3 match well with the literature values. The obtained
results exhibited a transition at 370 nm with a time constant of 381.51 ns, which is comparable to
up to 650 ns found in literature, a transition at 450 nm with a time constant of 354.53 ns, which
is comparable to 358 ns found in literature, and a singlet emission seen at 620 nm.1 These results
confirm the successful installation and operation of the new nanosecond transient absorption
system.

202
Conclusion
A new nanosecond transient absorption experiment has been introduced and described.
The principles and standard operating procedures have been discussed. Preliminary results of
Ru(BPY)3 dye have shown the successful operation of this new experimental system. There is
still room for improvement for this system. An additional R5108 PMT unit that has spectral
range from 400 nm to 1200 nm can be used instead of the RP928. This will allow for optical
processes in the IR region to be studied. Maximizing the signal while avoiding sample
degradation is of upmost importance. A stir bar can be placed in the sample cuvette and an
external stirrer can be used to reduce degradation. A flow cell can also be implemented to
reduce sample degradation. Purging the sample with Argon can and then using a flow cell can
reduce the deactivation of the excited state by singlet oxygen. For samples that have temperature
dependent transitions, a cryostat can be used to investigate these processes. This new
nanosecond transient absorption system has given access to timescales and processes that are
unprecedented in the Goodson Group. This will help in the understanding of electronic
processes of the studied compounds.
References
1. Kalyanasundaram, K. Photophysics, photochemistry and solar energy conversion with
tris(bipyridyl)ruthenium(II) and its analogues. Coord. Chem. Reviews, 1982, 46, 159–
244.

203
Chapter 7
Overall Summary and Future Direction
7.1 Overall Summary
The world is rapidly growing and changing, and with this growth and change we have
seen greater energy consumption. Currently, the main methods of energy generation combust
some sort of fossil fuel to produce heat that is then used for electricity generation. These
methods have many drawbacks. On a purely thermodynamics standpoint, much of the heat that
is generated is lost and does not go towards electricity generation. The extraction and processing
pose environmental hazards and risk. Fossil fuels are a finite resource. There is a financial
limitation on how much oil or natural gas that can be extracted. Disregarding the financial
limitation, there is also a practical limitation. They are being depleted at a rate that is much
faster than what realistically could be ever be replenished. And the biggest issue with fossil fuels
is harmful pollutants it releases into the atmosphere causing climate change.
This has led politicians, world leaders, corporations, and scientists to investigate
alternative methods of energy production to meet these greater needs using various policies and
technologies to satisfy these demands as well as providing a secure and practical source of
energy that is less harmful to the envirnoment. To this end, scientists have investigated different
methods, materials, processes, technologies, designs, and theories to address these energy
demands. One method of energy generation that has garnered a lot of interest, is solar energy
harvesting. Solar energy has the benefit of being infinite, as long as the sun exists, and does not
produce pollutants in order to generate energy. Much research has focused on this method of

204
energy generation from inventing new materials to improving device designs in order to become
cost competitive with fossil fuels.
One of the most promising solar harvesting materials is organic light harvesting
materials. Organic light harvesting materials are easily synthesized, the precursors can be easily
obtained, processing and manufacturing is cheaper and less complex than other solar harvesting
materials, flexible, have molar absorptivities, and can be made from renewable resources.
Researchers have focused on designing organic materials that have good light absorption and
high charge carrier mobilities. Researchers have also focused on synthesizing organic materials
that promote charge separation and high electron mobilities. There has also been much research
in device designs. In this work, the optical properties of organic light harvesting materials were
investigated. Understanding the fundamental structure property relationships are key in
designing efficient organic light harvesting materials.Chapter 1 of this dissertation introduced the
motivations for my research and provided the background needed to understand the importance
of my research. An overview of the current and future trends for energy production and energy
consumption was discussed. The history of solar harvesting was discussed. Then the principles
of solar harvesting were discussed in order to lay a base for understanding how light harvesting
devices work. The earliest and most adapted type of light harvesting material was introduced.
The benefits and drawbacks of inorganic materials were discussed. New inorganic light
harvesting materials were introduced and discussed. Then organic light harvesting material
properties were introduced. The advantages and disadvantages were presented. Device
architectures were described to give an ideal how the materials are used in order to generate
electricity. Various organic light harvesting materials were discussed. Then conjugated donor-
acceptor polymers were introduced and each component of the donor-acceptor system was

205
discussed. Then organic acceptors were introduced and discussed. Chapter 2 explained the
theory behind the techniques that were used to investigate the light harvesting materials. The
experimental methods were presented and discussed.
In Chapter 3, the ultrafast optical properties of donor-acceptor polymers with
benzodithiophene donors and different strength acceptors were investigated. The steady state
absorption, steady state emission, ultrafast fluorescent decay dynamics and nonlinear optical
properties of these light harvesting conjugated polymers were investigated in solution state. All
of the conjugated polymers investigated ahd broad absorption in the visible spectrum due to
small bandgaps due to the low lying LUMO energies created by the electron-withdrawing
groups. Fluorescence upconversion studies on the conjugated polymers showed short decay
dynamics for conjugated polymers with the stronger electron-withdrawing groups. Two-photon
absorption spectroscopy showed large two-photon absorption cross-sections for polymers with
the stronger electron-withdrawing acceptors. Fluorescence decay anisotropy studies also
indicated the polymers with the stronger electron-withdrawing acceptors had shorter exciton
migrations.
In Chapter 4, the influence of the donor conjugation length on the optical properties of
new donor-acceptor polymers was investigated. Six new donor-acceptor polymers were
synthesized. The polymers consisted of either a DPP, II, or TT acceptor with a s-indacene donors
with a thiophene fused on either end or with a thienothiophene fused on either end, increasing
the conjugation length of the donor. The polymers with the extended conjugated donor had
higher molar absorptivities. The fluorescence upconversion results showed longer fluorescence
lifetimes for the extended conjugated donor systems. Computations and TPA experiments
showed that the extended conjugated polymers had enhanced charge transfer characteristics

206
compared to their shorter conjugated counterparts. Investigation of the excited state dynamics
showed new ESA and bleached state at higher eneries for the extended donor polymers.
In Chapter 5, a new nanosecond laser system was installed and a new nonlinear
experiment was designed. This new system generates nanosecond pulses, which is the first for
the Goodson Group. This new system is tunable from 400 nm to 2600 nm, which open ups the
possibility to measure different photophysical processes that are not offered by many of the
ultrafast systems in the Goodson Group. A new two-photon absorption experiment was designed
implementing a SRS 250 gated integrator to record the two-photon excited fluorescence response
of a PMT. TPA experiments were conducted from 750 nm to 1100 nm using samples with
known TPA cross-sections. Prelimnary results demonstrated the successful design of this new
experimental setup.
In Chapter 6, the new nanosecond laser system was installed and a new nanosecond
transient absorption experiment was designed. This new system generates nanosecond pulses,
which is the first for the Goodson Group. This new system is tunable from 400 nm to 2600 nm,
which open ups the possibility to measure different photophysical processes that are not offered
by many of the ultrafast systems in the Goodson Group. A new two-photon absorption
experiment was designed implementing a SRS 250 gated integrator to record the two-photon
excited fluorescence response of a PMT. TPA experiments were conducted from 750 nm to
1100 nm using samples with known TPA cross-sections. Prelimnary results demonstrated the
successful design of this new experimental setup.
7.2 Future Directions
All of the experiments in this dissertation were conducted in the solution phase. This is
quite important because the experiments give a better understanding of the fundamental

207
properties of the investigated organic materials, whereas in the solid state, the influence of
packing, morphology, processing, and additives can all affect the observed behavior of the
organic materials. Also different types of solvents can be used to see solvation effects on the
organic materials. Knowing the fundamentals is important in predicting device characteristics,
but it cannot account for properties that affect device performance such as morphology and
packing behavior. Thus, it is important to investigate the optical properties of these materials in
the solid state, because at the end of the day the organic materials are in the solid state in devices.
The various organic components can be investigated in the solid state, then mixtures of the
components can be investigated in order to investigate the effect of different compositions have
on the photophysical properties.
Computations methods are invaluable for investigating these new materials. There have
been rapid development in computational methods, theories, and technology that has made
computations even more powerful tools for discovering new processes and new organic
materials. But there are significant limitations to computational methods. Computations are
unable to account for the various differences in local enviroment that these materials have in the
solution and solid state. Computations also have trouble with systems that have many atoms in a
molecule. Indeed, in this study smaller oligiomers were used as model systems for the
investigated polymers because the polymers were too large to investigate with current methods
because the memory required, computational time required, and expense. New techniques,
technology, methods, and theories are needed in order to investigate these larger systems.
All of the time resolved experiments in this disseration were conducted at ultrafast
timescales of less than a nanosecond, but charge separation, charge transport, and charge
collection occur at much longer timescales from 100s of nanoseconds to microseconds. The new

208
nanosecond system I have installed and designed is going to be a game changer in the Goodson
Group. With this new system, all of these longer processes can be investigated. The Gated
Integrator can be used to longer timescale optical processes such as thermally activated delayed
fluorescence, phosphorescnece, and chemiluminescence. Longer fluorescence dynamics can
now be investigated with the naonsecond laser and Gated Integrator. Installation of a new
nanosecond transient absorption experiment can be used to investigate long lived states such as
triplet states. Triplet-triplet annihilation can be investigated. Two-photon absorption properties
can already be investigated with the new system. Microwave spectroscopy in conjunction with
nanosecond laser excitation can be used to investigate the charge carrier mobilities. This system
is going to allow much deeper understanding of the optical properties of these materials and will
give a better picture of the whole optical processes involved in light harvesting materials.

209
Appendices
Appendix A. Enacting Two-Electron Transfer from a Single-Photon-Excited Chromophore I conducted femtosecond transient absorption experiments in order to investigate two-electron
transfer from QOT2 to anthraquinone. New photoproducts were identified and related to
calculations conducted by Hyungjun Kim and compared to literature.
The work in this chapter was accepted in Journal of American Chemical Society communication
(JACS) with the title:
“Enacting Two-Electron Transfer from a Single-Photon-Excited Chromophore”
Hyungjun Kim, Bradley Keller, Rosina H. Wu, Neranga Abeyasinhe, Ricardo J. Vázquez,
Theodore Goodson III, Paul M. Zimmerman
Modifications were made to the manuscript to adapt it to the style of this dissertation. References
and supporting information of the manuscript are included in this chapter.
A.1 Abstract
A simulation-led strategy enacts two-electron transfer between a single-photon-excited
chro-mophore (tetracyanobithiopehene) and multi-electron acceptor (anthraquinone). The
thermodynamic plausibility of electron transfer and the absorption spectra of electron transfer
products are predicted using quantum chemical simulation. These predictions are consistent with
experimental observations of reduced lifetimes in time-resolved fluorescence spectroscopy,
decreased transmission, and appearance of new absorption bands in transient absorption
spectroscopy, all of which are consistent with multi-electron transfer. A maximum internal
quantum efficiency of 137 % is estimated.

210
A.2 Introduction
Singlet fission (SF) produces two excited electrons from a single photon.1–3
In materials
that enable SF, the multi-electron excited state can be conceived as an entangled double-triplet4–7
and thus denoted TT, which eventually evolves into separated triplets, 2T1. Although SF may
well be used to generate triplets for individual extraction in solar harvesting materials, the
correlation between the two triplets makes TT a unique state that is not identical in character to
2T1.8,9
Towards the goals of understanding TT states in more detail and achieving efficient solar
energy harvesting, we considered whether the excited electrons of TT could be transferred in a
bimolecular, 2-electron process.
SF materials, mostly films,10
crystals,11
and covalently linked dimers,12
have been studied
extensively in recent years. While multi-electron extraction per photon has been demonstrated in
intermolecular SF chromophores (xSF),11,13–15
attaining high charge extraction yields remains
difficult. Intramolecular SF (iSF) offers several advantages over xSF such as a high degree of
tunability of molecular and electronic structure, and relative independence from molecular
packing arrangements.16–18

211
A.3 Results and Discussion
Figure A.3.1. Jablonski diagram for the states of intramolecular singlet fission, 1ET, and 2ET
with chemical structures of QOT2/AQ.
While most iSF materials are based on acenes, our groups have revealed that monomers
of tetracyanomethylene quinoidal bithiophene (QOT2) have characteristics that closely relate to
a key SF intermediate, the TT state.17
This quinoidal molecule (Figure A.3.1, see SI) has a large
one-photon absorption cross-section, a low-lying T1 state, and a multiply excited state with TT
character that can be generated via single-photon absorption.4,17
As a monomer with a single,
tightly coupled system, QOT2 is highly unusual among iSF chromophores because its triplets
cannot separate into 2T1. While such confinement of the TT state has not been possible in
related SF materials, this special property is advantageous because it provides an opportunity to
trap the double triplet and achieve simultaneous multi-electron extraction.13
In principle, two-
electron transfer (2ET) from an entangled TT state may be advantageous for efficient energy
harvesting, as competing relaxation channels will be outcompeted. Herein, the possibility of
multi-electron transfer in iSF will be realized by a detailed quantum chemical study of the photo-
electrochemical properties of the QOT2 TT state, and its coupling to a suitable acceptor for the
two electrons.
0.0
20.0
40.0
60.0
80.0
100.0
120.0
140.0
160.0
Ele
ctro
nic
ener
gy [
kca
l/m
ol]
1ET 2ET
QOT2(TT)/AQ(GS)
130.8
QOT2(GS)/AQ(GS)
0.0
QOT2+(GS)/AQ-(GS)
34.6
QOT2+(TD)/AQ-(GS)
133.4QOT22+(DD)/AQ2-(GS)
121.4
QOT22+(GS)/AQ2-(GS)92.9
O
O
S
S
CN
CN
NC
NC
QOT2 model
AQ Simultaneous 2ET
1st sequential 1ET
2nd sequential 1ET
GS
TT
TD
DD
ET
: Ground state
: Double triplet state
: Triplet doublet state
: Double doublet state
: Electron transfer
Internal conversion

212
The search for suitable acceptor molecule centered on anthraquinones, a plausible energy
storage unit with 2e- redox properties.
19–22 Our prior study of a variety of these materials
indicated that 9,10-anthraquinone (AQ) has a 2-electron affinity of 5.99 eV,23
which is within
range of acceptance of electrons from the QOT2 TT state. Chien et al. reported that the QOT2 TT
state is dominated by double triplet character, with some contribution from triplet coupling
components.4 Ionization of QOT2 TT state will likely produce QOT2
+ TD and QOT2
2+ DD states
with +1 charge localized on each half of QOT2, where D represents a local doublet. Based on
this model of QOT2 ionization, a four-point charge approximation gives the thermodynamic
driving force as ∑ ∑ , where DIP and DEA indicate
double ionization potential and double electron affinity, respectively, and the last two terms are
Coulomb attraction and repulsion.24
Quantum chemical simulations give 10.27 eV as an estimate
of QOT2 TT state double IP. This analysis predicts 2ET from the QOT2 TT state is
thermodynamically viable ( eV), but unfavorable from the ground state QOT2
( eV, see SI).
Figure A.3.2. Optimized structure of QOT2/AQ before ET (top panel; QOT2 TT/AQ), after 1ET
(middle panel; QOT2+ TD/AQ
-), and after 2ET (bottom panel; QOT2
2+ DD/AQ
2-) described by
CDFT. Color scheme: hydrogen atom, white; carbon atom, cyan; nitrogen atom, blue; oxygen
atom, red; sulfur atom, yellow.

213
Atomistic simulations were employed to examine the mechanistic feasibility of 2ET. For
the key ET step, constrained density functional theory25
(CDFT) was used to estimate the
plausibility of this reaction. The molecular structures before ET (QOT2 TT/AQ), after 1ET
(QOT2+ TD/AQ
-), and after 2ET (QOT2
2+ DD/AQ
2-), are described in Figure A.3.2. QOT2/AQ
complex forms - stacking structures as expected. 1ET, with nearly thermoneutral driving force
( kcal/mol), is followed by thermodynamically favorable second ET (
kcal/mol) and results in two total electrons transferred. Each ET is considered to ionize one of
the two triplets in the TT state, leading to a TD state after the first ET, and a DD assignment after
2ET. Ionization of triplets to doublet states in CDFT allows the system to avoid the Marcus
inversion region of large driving force (see oxidized QOT2(GS) species in Figure A.3.1). This
result implies that 2ET can be achieved via two sequential 1ET steps (blue and orange lines in
Figure A.3.1) and/or one simultaneous 2ET step (green line in Figure A.3.1). After 2ET,
electrostatic attractions caused by the multi-electron transfer dominate over van der Waals
interaction, and side-on binding to maximize Coulombic interaction is predicted (Figure A.3.2).
(see SI)
Having evidence from simulation that 2ET from QOT2 to AQ has plausible pathways,
the absorption spectra of ET products were also examined. The spectra of reduced AQ are
available from the literature.26
The absorption spectra of oxidized QOT2 TT, however, is not
trivial to obtain. From quantum chemical simulations using XMS-CASPT2 and Spin-Flip RAS
methods, the electronic state of neutral QOT2 TT, and singly and doubly oxidized QOT2 TT, are
assigned to have 21Ag, 1
2Bg, and 1
1Bu symmetries, respectively (see SI). Starting from these
states, transition wavelengths and dipole moments were computed (Figure A.3.3) to provide a
baseline for subsequent spectroscopic experiments. Due to the wide range of wavelengths that

214
characterize these intermediates, multiple spectroscopic techniques were needed to identify these
signatures.
Figure A.3.3. Absorption spectra predicted by XMS-CASPT2 and Spin-Flip RAS for (top)
QOT2 21Ag state, and (middle and bottom) its oxidized forms, QOT2
+ 1
2Bg and QOT2
2+ 1
1Bu
states.
With these spectra peaks from simulation in hand, time-resolved fluorescence anisotropy
was used to monitor the lifetime of the QOT2 singlet excited state in QOT2/AQ mixture (Figure
S). In the mixture, the short and long fluorescence timescales decreased to 66% and 23%
compared to pure QOT2, respectively (Table S). The faster decay of the mixture indicates the
appearance of non-radiative sink that can consume exciton population, with ET being a possible
cause.27
The initial dynamics (< 25 ps), however, are similar in the QOT2 solution with or
without AQ, indicating that the initial ultrafast formation of the TT state is unperturbed.
To support these initial indications, transmission measurements quantified the yield of TT
using QOT2’s excited state absorption (ESA) from 21Ag at 880 nm.
17 Significant reduction of
transmitted power is observed at high power, giving transmission of 0.47 in QOT2 sample
(Figure A.3.4). Using a procedure established in a prior study of QOT2,17
a yield for the TT state
(αTT) is measured to be 84 % for QOT2 without AQ present, indicating 0.84 TT states per

215
absorbed photon. (see SI) In the mixture, ET will change the transmission profile due to the
formation of QOT2+ 1
2Bg and QOT2
2+ 1
1Bu, which have different absorption spectra compared
to the QOT2 TT state. In the QOT2/AQ mixture, the transmitted power is significantly reduced,
by ~0.1mW. To explain this change, Figure A.3.3 shows that QOT22+
11Bu has absorption peak
near the probe wavelength with a large oscillator strength, almost double that of neutral QOT2
TT state. In contrast, singly ionized QOT2 (QOT2+ 1
2Bg) is predicted to be less likely to absorb
at the probe wavelength. The reduction in transmission with AQ present is therefore consistent
with 2ET through the formation of the QOT22+
11Bu state.
Figure A.3.4. Transmission profile of pure acetonitrile (Blank, black line), QOT2 (yellow
square), and QOT2/AQ (blue circle) for the probe light of 880 nm as the function of the pump
power at 440 nm.
Transient absorption spectroscopy (TAS) was performed to provide evidence of multi-
electron transfer beyond the fluorescence and transmission experiments. Within its available
spectral window of 450 – 700 nm, TAS provides a detailed viewpoint of the electronic structure
of excited states as they evolve, and provides evidence for ET by detecting the photoactive ET
products. TAS of QOT2 exhibits two characteristic bands: ground state bleach (GSB) at 450 –
560 nm and ESA I at 560 – 700 nm, in good agreement with previous studies17
(Figure S).
0.0
0.2
0.4
0.6
0.8
1.0
1.2
1.4
0.0 5.0 10.0 15.0 20.0 25.0 30.0 35.0 40.0 45.0
Tra
nsm
itte
d p
ow
er [
mW
]
Incident power [mW]
Blank
QOT2
QOT2/AQ
Absorption
QOT22+ 11Bu

216
Characteristic bands of neutral QOT2 decay smoothly and disappear after 20 ps. In addition to
these features, three new ESA bands arise when AQ is added to the mixture: ESA II at ~ 488 nm,
ESA III at ~ 528 nm, and ESA IV at ~ 569 nm (Figure A.3.5).
Figure A.3.5. Transient absorption spectrum of QOT2/AQ at selected decaying time as the
function of probe wavelength. The characteristic bands of QOT2 (GSB and ESA I) are marked
with yellow arrows, and newly arising features (ESA II, III, and IV) are indicated with blue
arrows.
The assignment of new signals is made using the simulated absorption peaks (vide supra)
for the oxidized QOT2 TT species alongside experimental signals for AQ anions26
(Table A.3.1).
The occurrence of ESA II can be understood by formation of QOT2+ 1
2Bg and/or doubly reduced
AQ ion, which are close to the observed absorption peak near 488 nm. According to simulation,
QOT22+
11Bu absorbs light at 529 nm, which overlaps with ESA III. The last feature, ESA IV, is
centered at 569 nm and assigned to the single ET product, AQ-, which is known to absorb at 550
nm. These results indicate the presence of mixture of species arising from 1ET and 2ET. TAS
therefore supports the theoretical predictions of ET from QOT2 TT to AQ, and suggests that 2ET
-10
-5
0
5
10
15
450 500 550 600 650 700
ΔA
(×1
0-3
)[a
.u.]
Wavelength [nm]
0.2 1.0 1.8
2.6 3.4 4.6
5.8 7.8 17.8
282.8
ESA IV
ESA I
ESA IIIESA II
GSB
in ps

217
is facile. Additional bands from ion-ion interactions are not detectable in the current transient
window, since these likely exist only in the IR region.28
Table A.3.1. Assignment of Characteristic Bands Present in the Transient Absorption Spectra
Depending on One- or Two-Electron Transfer
Bands Wavelengtha 1ET 2ET
GSB 450 – 560 QOT2 GSB
ESA I 560 – 700 QOT2 ESA
ESA II ~ 488 QOT2+ 1
2Bg
(498)
AQ2-
(470)
ESA III ~ 528 – QOT22+
11Bu
(529)
ESA IV ~ 569 AQ- (550) –
a) The position of absorption peak is given in nm unit.
The yield of charge carrier extraction from the TT state (βCE) defined as 1×(yield of 1ET at
TT)+2×(yield of 2ET at TT), is estimated using the transmission profile and predicted molar
extinction coefficient (see SI). This quantity is expressed as the function of the yield of 1ET,
since the available spectroscopies cannot measure the yield of 1ET products directly. This
analysis gives βCE,max to be as high as 163 %, where all TT states are involved in ET (37 % of
TT states via 1ET and 63 % of TT states via 2ET pathways). The maximum internal quantum
efficiency (IQE) given as αTT×βCE,max is therefore approximately 137 %, ~1.4 electrons per
photon absorbed. This IQE suggests that constructing molecules with tightly coupled TT states
may be a strong design principle to overcome the Shockley-Queisser limit and create highly
efficient, easily processable solar cells.29
A.4 Conclusion
In summary, this study demonstrates the first theoretically designed molecular system
that can harvest multi electrons from strongly correlated TT states. Instrumental to this

218
development were the characterization of QOT2’s TT state4 and screening of 2e
- redox
acceptors23
, which paved the way for the present study. Future studies will examine the
mechanism of 2ET in more detail, in order to provide useful, robust guidelines for designing
molecular species for multi-electron transfer.
ASSOCIATED CONTENT
Experimental and computational details. The Supporting Information is available free of charge
on the ACS Publications website.
AUTHOR INFORMATION
Corresponding Author
References
(1) Smith, M. B.; Michl, J. Chem. Rev. 2010, 110 (11), 6891.
(2) Zimmerman, P. M.; Zhang, Z.; Musgrave, C. B. Nat. Chem. 2010, 2 (8), 648.
(3) Stern, H. L.; Musser, A. J.; Gelinas, S.; Parkinson, P.; Herz, L. M.; Bruzek, M. J.;
Anthony, J.; Friend, R. H.; Walker, B. J. Proc. Natl. Acad. Sci. 2015, 112 (25), 7656.
(4) Chien, A. D.; Molina, A. R.; Abeyasinghe, N.; Varnavski, O. P.; Goodson, T.;
Zimmerman, P. M. J. Phys. Chem. C 2015, 119 (51), 28258.
(5) Piland, G. B.; Burdett, J. J.; Dillon, R. J.; Bardeen, C. J. J. Phys. Chem. Lett. 2014, 5 (13),
2312.
(6) Weiss, L. R.; Bayliss, S. L.; Kraffert, F.; Thorley, K. J.; Anthony, J. E.; Bittl, R.; Friend,
R. H.; Rao, A.; Greenham, N. C.; Behrends, J. Nat. Phys. 2016, 13 (2), 176.
(7) Yong, C. K.; Musser, A. J.; Bayliss, S. L.; Lukman, S.; Tamura, H.; Bubnova, O.; Hallani,
R. K.; Meneau, A.; Resel, R.; Maruyama, M.; Hotta, S.; Herz, L. M.; Beljonne, D.;
Anthony, J. E.; Clark, J.; Sirringhaus, H. Nat. Commun. 2017, 8 (May).
(8) Chien, A. D.; Zimmerman, P. M. J. Chem. Phys. 2017, 146 (1).
(9) Rao, A.; Friend, R. H. Nat. Rev. Mater. 2017, 2, 17063.
(10) Le, A. K.; Bender, J. A.; Roberts, S. T. J. Phys. Chem. Lett. 2016, 7, 4922.
(11) Congreve, D. N.; Lee, J.; Thompson, N. J.; Hontz, E.; Yost, S. R.; Reusswig, P. D.;
Bahlke, M. E.; Reineke, S.; Voorhis, T.; Baldo, M. A. Science (80-. ). 2013, 340 (6130),
334.
(12) Sanders, S. N.; Kumarasamy, E.; Pun, A. B.; Steigerwald, M. L.; Sfeir, M. Y.; Campos, L.
M. Angew. Chemie Int. Ed. 2016, 55 (10), 3373.

219
(13) Chan, W.-L.; Ligges, M.; Jailaubekov, A.; Kaake, L.; Miaja-Avila, L.; Zhu, X.-Y. Science
(80-. ). 2011, 334 (December), 1541.
(14) Chan, W. L.; Tritsch, J. R.; Zhu, X. Y. J. Am. Chem. Soc. 2012, 134 (44), 18295.
(15) Thompson, N. J.; Congreve, D. N.; Goldberg, D.; Menon, V. M.; Baldo, M. A. Appl.
Phys. Lett. 2013, 103 (26), 263302.
(16) Pun, A. B.; Sanders, S. N.; Kumarasamy, E.; Sfeir, M. Y.; Congreve, D. N.; Campos, L.
M. Adv. Mater. 2017, 1701416, 1701416.
(17) Varnavski, O.; Abeyasinghe, N.; Aragó, J.; Serrano-Pérez, J. J.; Ortí, E.; López Navarrete,
J. T.; Takimiya, K.; Casanova, D.; Casado, J.; Goodson, T. J. Phys. Chem. Lett. 2015, 6
(8), 1375.
(18) Low, J. Z.; Sanders, S. N.; Campos, L. M. Chem. Mater. 2015, 27 (16), 5453.
(19) Orazietti, M.; Kuss-Petermann, M.; Hamm, P.; Wenger, O. S. Angew. Chemie - Int. Ed.
2016, 55 (32), 9407.
(20) Kuss-Petermann, M.; Orazietti, M.; Neuburger, M.; Hamm, P.; Wenger, O. S. J. Am.
Chem. Soc. 2017, 139 (14), 5225.
(21) Huskinson, B.; Marshak, M. P.; Suh, C.; Er, S.; Gerhardt, M. R.; Galvin, C. J.; Chen, X.;
Aspuru-Guzik, A.; Gordon, R. G.; Aziz, M. J. Nature 2014, 505 (7482), 195.
(22) Er, S.; Suh, C.; Marshak, M. P.; Aspuru-Guzik, A. Chem. Sci. 2015, 6 (2), 885.
(23) Kim, H.; Goodson, T.; Zimmerman, P. M. J. Phys. Chem. C 2016, 120 (39), 22235.
(24) Dreuw, A.; Weisman, J. L.; Head-Gordon, M. J. Chem. Phys. 2003, 119 (6), 2943.
(25) Kaduk, B.; Kowalczyk, T.; Van Voorhis, T. Chem. Rev. 2012, 112 (1), 321.
(26) Babaei, A.; Connor, P. A.; McQuillan, A. J.; Umapathy, S. J. Chem. Educ. 1997, 74 (10),
1200.
(27) Lee, S.; Hwang, D.; Jung, S. Il; Kim, D. J. Phys. Chem. Lett. 2017, 8 (4), 884.
(28) Dereka, B.; Koch, M.; Vauthey, E. Acc. Chem. Res. 2017, 50 (2), 426.
(29) Lee, J.; Jadhav, P.; Reusswig, P. D.; Yost, S. R.; Thompson, N. J.; Congreve, D. N.;
Hontz, E.; Van Voorhis, T.; Baldo, M. A. Acc. Chem. Res. 2013, 46 (6), 1300.

220
A.5 Supporting Information
A.5.1 QOT2 Structure
Figure AS1: (A) QOT2 chromophore. (B) Model of QOT2 with the β,β’ substituents removed.
A.5.2 Computational Details
A.5.2.1 Thermodynamic Driving Force
Constrained density functional theory (CDFT) is the approach which can diabatize
electronic states by imposing the charge and spin constraints on specific regions of molecules.1
B3LYP functional with empirical dispersion correction of Grimme2 (B3LYP-D) and 6-31G* is
used to optimize the QOT2/AQ structures. The scaling factor (s6) of 1.05 for dispersion energy
calculation is used as recommended for B3LYP-D. Single point energy is refined by M06-HF-
Dfunctional3 with s6 value of 1.00. M06-HF incorporates full Hartree-Fock (HF) exchange for
all interelectronic distances to give improved asymptotic Coulomb interaction, and this
functional is known to perform well for charge-transfer reactions.4 Detailed charge and spin
localization information can be found in Table S1. All CDFT calculations are performed using
Q-Chem version 4.0.5

221
Table AS1: Characterization of diabatic states of the QOT2/AQ complex investigated in this
study using charge and spin
A.5.2.2 Theoretical Absorption Spectra
Absorption spectra of QOT2 TT, QOT2+ TD, and QOT22+
DD (QOT2 21Ag, QOT2
+
12Bg, and QOT2
2+1
1Bu) are predicted to analyze the experimental results. (See Section S8 for
symmetry assignment) C2h symmetry is imposed on the QOT2 molecule, and active space
consisting of 10 electrons in 8 π orbitals (10e,8o) is selected. Singly and doubly ionized QOT2
TT is described using the active space of (9e,8o) and (8e,8o), respectively, without any changes
in the molecular orbitals. All the geometries are optimized using XMS-CASPT2 method6 and 6-
31G* basis sets with level shift of 0.20. XMS-CASPT2 has been known for better description of
energetics than plane CASPT2 near conical intersection.7 Also,the XMS-CASPT2 calculation
has proven its ability to predict the absorption of neutral QOT2 TT state successfully.8 Refined
single point energy has been obtained using valence triple-zeta plus polarization basis sets,
TZVPP. In addition to level shift, IPEA shift of 0.10 has been applied in single point energy
calculations to avoid intruder states.9 All XMS-CASPT2 calculations are carried out using
MOLPRO version 2012.1.10
Transition dipole moments (TDM) is necessary to evaluate oscillator strength, but XMS-
CASPT2 TDM is not available yet in MOLPRO version 2012.1. CASSCF TDM with relatively
small active space gives inconsistent results due to the lack of dynamic correlation.8 As an
alternative approach, Spin-Flip RAS TDM which has larger amount of dynamic correlation than

222
CASSCF is implemented by Chien et al. in a development version of Q-Chem 4.0. All TDM
value are this work is calculated using Spin-Flip RAS with 6-31G* based on the XMS-CASPT2
geometries.
A.5.3. Experimental Details
A.5.3.1. Chemical Species
AQ is commercially available and used without further purification. QOT2 is prepared by
Takahashi et al.11
Acetonitrile (AN) is selected as solvent owing to high solubility of QOT2/AQ
mixture. All experiments are performed in AN.
A.5.3.2. Steady-State UV-Vis Absorption and Fluorescence Emission
Steady-state absorption and fluorescence emission property of QOT2 andAQ have been
measured in AN with the concentration of 25 µM for both molecules. Mixture of QOT2 and AQ
is prepared to have 1:1 molar concentration ratio. The concentration of each chemical is same as
the one in their pure form. UV-Vis absorption spectrum were recorded with an Agilent
Technologies 8453 spectrophotometer, and fluorescence emission were measured using a
Fluomax-2 fluorometer.
A.5.3.3. Time-Resolved Fluorescence Anisotropy
Femto-second upconversion spectroscopy is employed to resolve temporally the
polarized fluorescence. The optical arrangement for our upconversion experiments are same that
reported in the previous works.12,13
The sample solution was exposed to a frequency-doubled
light from a modelocked Ti-sapphire laser (Tsunami, Spectra Physics). This setup produces a
trained pulse of light with wavelength of 400 nm. The sample was placed in the rotating cuvette
to avoid any possible degradation and accumulation effect. The horizontally polarized
fluorescence emitted from the sample was upconverted in a nonlinear crystal of β-Ba borate

223
using a pump beam at abou 800 nm that was first passed through a variable delay line. This
system acts as an optical gate and enables the fluorescence to be resolved temporally with a time
resolution of ∼200 fs. Spectral resolution was achieved by dispersing the upconverted light in a
monochromator and detecting it by using a photo multiplier tube (Hamamatsu R1527P). The
excitation average power was kept at a level below 0.5 mW.
A.5.3.4. Transient Absorption Spectroscopy
The output of an amplified laser beam was split to generate pump and probe beam pulses
with a beam splitter (85 % and 15 %). The pump beam was produced by an optical parametric
amplifier (OPA-800c). The pump beam used in this study was obtained from either the second-
or fourth harmonic generation of the signal beam and this was focused on the sample cuvette.
The probe beam was delayed with a computer controlled motion controller and then focused on
to a 2 mm sapphire plate to generate a white light continuum. The white light was then
overlapped with the pump beam in a 1.5 mm quartz cuvette containing the sample and the
change in absorbance for the signal was collected by a CCD detector (Ocean Optics). Data
acquisition was controlled by software from Ultrafast System Inc. Typical power of probe beam
was < 0.1 µJ, while the pump beam ranged from 0.1 to 0.4 µJ per pulse. The pulse duration was
obtained by fitting the solvent response, which was determined as ∼ 130 fs. The sample was
stirred with a rotating magnetic stirrer.
A.5.3.5. Transmission Profile
For transmission profile, we have investigated the excited state absorption of QOT2 at
880nm (1.41 eV) with a femtosecond pulse trained at 440 nm (2.82 eV). The light with
wavelength of 880 nm plays a role of probe beam, produced by tunable MaiTai laser system
(SpectraPhysics) giving 130 fs pulses with a repetition rate of 80 MHz. Second harmonic of the

224
probe beam with wavelength of 440 nm has been produced in BBO crystal and this is a pump
laser. The selected wavelength region is reasonable since there is negligible steady-state
absorption. A variable neutral density filter is placed to cut down the excitation power. The
position of focusing lens is adjusted to place focusing point on the sample. Blank AN solvent
gives a reference line. A calibrated photodiode was used to measure the incident power. The
transmitted power has been measured with a wide aperture power meter which is free of any
thermal lensing effect.
A.5.4. Steady-State UV-Vis Absorption
Figure AS2: UV-Vis absorption of QOT2, AQ, and QOT2/AQ in AN.

225
A.5.5. Steady-State Fluorescence Emission
Figure AS3: Fluorescence emission of QOT2, AQ, and QOT2/AQ in AN. The spectrum of AQ
is enlarged in the inset.
A.5.6. Four-point Charge Approximation
Figure AS4: Relative energy levels of QOT2, AQ, and their relavant ET products

226
Level of Theory
for GS: ωB97X-D/G3Large/PCM(AN)//ωB97X-D/6-31G*
for QOT2 (TT), QOT2+ (TD) and QOT22+ (DD):
C(ωB97X-D)/G3Large/PCM(AN)//C(ωB97X-D)/6-31G*
C(ωB97X-D): Constrained ωB97X-D
for ES: TD-(ωB97X-D)/G3Large/PCM(AN)//ωB97X-D/6-31G*
DIP for ground state QOT2
DIPQOT2 GS = EQOT22+
(GS) −EQOT2 (GS) = 14.35 eV
DIPQOT2 TT = EQOT22+
(DD) −EQOT2 (TT) = 10.27 eV
DEA for ground state AQ
DEAAQ = EAQ −EAQ2-
= −5.99 eV
Position of Localized Charge
The position of localized charge is determined as the center of mass for the subunit of each
molecule.
Figure AS5: Position of localized positive (negative) charge on the isolated QOT2 (AQ)
molecule

227
Figure AS6: Position of localized charges on the ground state QOT2/AQ complex
Table AS2: Coulomb interaction between four point charges in QOT2/AQ complex
a) Index in Figure S6
Thermodynamic Driving Force of 2ET
∆E =DIPQOT2 + DEAAQ + Coulomb Interaction
for QOT2 GS: ∆E = 14.35 − 5.99 − 4.97 = 3.39 eV
for QOT2 TT: ∆E = 10.27 − 5.99 − 4.97 = −0.69 eV
A.5.7. CDFT Becke Population Analysis

228
Figure AS7: CDFT Becke population analysis of QOT2/AQ after 2ET
Figure AS8: Distortion of carbonyl group from planarity in AQ as the result of maximizing
Coulomb interaction

229
A.5.8. Natural Orbital Occupancy
Table AS3: Population of QOT2 TT, and ionized QOT2 TT.
a) The geometry is optimized using XMS-CASPT2/6-31G* with the active space of (10e,8o). b)
The same level of theory used for QOT2 TT is applied with different active spaces, (9e,8o) and
(8e,8o) for QOT2+ TD and QOT22+ DD , respectively.
A.5.9. Time-Resolved Fluorescence Anisotropy
Figure AS9: Time-resolved fluorescence anisotropy measurement of QOT2 and QOT2/AQ

230
Table AS4: Lifetime excited singlet state of QOT2 and QOT2/AQ using time-resolved
fluorescence anisotropy.a
a) Normalized fluorescence intensity is fitted to y = A1e−t/η1
+ A2e−t/η2
b) η1 and η2 are the lifetime of short and long component, respectively.
c) ηn ratio =
( n = 1 or 2 )
A.5.10. Transient Absorption Spectrum of QOT2
Figure AS10: Transient absorption spectrum of QOT2 at selected decaying time as the function
of probe wavelength. The characteristic bands of QOT2 (GSB and ESA I) are marked with
yellow arrows
A.5.11. Yield of the QOT2 TT State
Parameter Full power (Pump + Probe) = 44.88 + 1.87 = 46.75 mW

231
Pump power (440 nm) = 44.88 mW (96 % of full power)
Probe power (880 nm) = 1.87 mW (4 % of full power)
Laser pulse repetition rate (r) = 8×10⁷ pulse/s
Energy per pump pulse (Ep) =
=
= 0.56 nJ/pulse
Pulse duration (dt) = 130 fs = 1.3×10⁻¹³
s
Laser beam divergence (full angle)≤1 mrad (Mai-Tai specs) = 10−3
rad
Focus of the focusing lens = 12.0 cm
Waist diameter of focal beam (D) = 12.0×10⁻³
cm = 1.20×10⁻²
cm
Focal waist area (A) = π×(
)
2 = 1.13×10
−4 cm = 1.20×10
-2 cm
Cell length (L) = 1 cm
Excitation volume (V) = A×L = 1.13×10−4
×1 = 1.13×10⁻⁴
cm3
Energy of a pump photon (e) = hν =
=
= 4.52×10
−19 J/photon
Constant
Avogadro constant (NA) = 6.02×10²³
Planck constant (h) = 6.626×10⁻³⁴
J·s
Speed of light (c) = 3×10⁸ m/s
A.5.11.1. The Number of Singlet Exciton (Ns*)
Optical density of the sample at 440 nm = 0.14 from UV-Vis absorption
Number of absorbed photon per pulse (Nabs) = Iin − Iout = Iin×(1−10−0.14
) = Iin×(1−0.724) =
0.276×Iin
Iin =
=
= 1.24×10
9 photons
Nabs = 0.276×1.24×109 = 3.42×10
8 photons

232
The number of molecules in the excited singlet state will be same as the number of absorbed
photons: Ns∗ = Nabs = 3.42×10⁸ photons
A.5.11.2. The Number of TT States (NTT,total)
Probe power after blank (pure AN) = 1.36 mW
Probe power after QOT2 solution = 0.64 mW
Probe beam attenuation observed under pump of 44.88 mW is
= 0.471
No focal mismatch is suggested in this version of calculations.
In order to create this attenuation for the matching part of the probe beam, the concentration of
the QOT2 TT states which is responsible for attenuation can be obtained:
= 0.471 = 10×−ϵTT×L×MTT (ϵTT: Molar extinction coefficient of a QOT2 TT state, MTT:
Concentration of a QOT2 TT state)
log(0.471) = −0.327 = −ϵTT ×L×MTT
MTT =
= 0.192×10
−4 M
ϵTT = 1.7×10⁴ M
-1cm
-1, the molar extinction coefficient for absorption ofQOT2 TT estimated
using following equations and calculated numerical values.
f =
×∆E ×|TDM|
2
f = 4.39×10−9
×1.06× ϵTT×∆ν0.5
ϵTT =
Transition = 21Ag →3
1Bu
Energy difference (∆E)= 1.347eV from XMS-CASPT2/TZVPP(IPEA=0.10)//XMS-
CASPT2/631G* with (10e,8o)

233
Transition dipole moments (TDM) = 2.15 from Spin-Flip RAS/6-31G* with (10e,8o) with a
heptet reference state
Oscillator strength (f) = 0.153
Line width (∆ν0.5) = 1886 cm-1
(That of the 570 nm absorption)
This molar concentration corresponds to the TT population density, nTT:
nTT =
×MTT =
×0.192×10
−4 = 1.16×10
16 triplets/cm
3
Total number of TT states in the excitation volume (V) is:
NTT, total = nTT ×V = 1.16×1016
×1.13×10−4
= 1.31×10¹²
molecules
A.5.11.3. Yield of the TT state (αTT)
Lifetime of TT state of QOT2 (ηTT) = 57 µs
Each pulse creates 3.42×10⁸ molecules in the singlet state (Ns*)
The number of TT states created by each pulse (NTT,p) = αTT×Ns* = αTT ×3.42×10⁸ molecules in
the TT state in the excitation volume
Now the TT state accumulation at relatively high pulse repetition rate should be taken into
account:
NTT,total = NTT,p ×ηTT ×r
NTT,total = (αTT ×3.42×108)×(57×10
−6)×(8×10
7)
The total number of TT states in the excitation volume should be equal to the number of
accumulated TT states.
1.31×1012
= αTT ×3.42×108 ×57×10
−6 ×8×10
7

234
A.5.12. Yield of Charge Carrier Extraction from the TT state(βCE)
Probe power after blank (pure AN solution) = 1.36 mW
Probe power after QOT2/AQ solution = 0.54 mW
Probe beam attenuation by QOT2/AQ under pump of 44.88 mW is
= 0.397
Absorption at 880nm
Figure A.3.3 in the main text indicates that absorbance at 880 nm can be given as the sum of
QOT2 TT and QOT22+
DD.
Atotal = AQOT2 TT + AQOT22+
DD = ϵTT ×L×MTT + ϵDD ×L×MDD
Mass balance for QOT2 without QOT2 degradation
MQOT2 = MTT + MTD + MDD = 0.192×10⁻⁴
M
MTT = 0.192×10⁻⁴
−MTD −MDD
ϵDD = 3.4×10⁴ M
-1cm
-1, the molar extinction coefficient for absorption of QOT2
2+ DD estimated
using following equations and calculated numerical values.
f =
×∆E ×|TDM|
2
f = 4.39×10−9
×1.06× ϵDD ×∆ν0.5
ϵDD =
Transition = 11Bu →4
1Ag

235
Energy difference (∆E)= 1.353eVfromXMS-CASPT2/TZVPP(IPEA=0.10)//XMS-
CASPT2/631G* with (8e,8o)
Transition dipole moments (TDM) = 3.01 from Spin-Flip RAS/6-31G* with (8e,8o) with a
heptet reference state
Oscillator strength (f) = 0.300
Line width (∆ν0.5) = 1886 cm-1
(That of the 570 nm absorption)
= 0.397 = 10
−Atotal = 10
− ϵTT
×L×MTT
− ϵDD
×L×MDD
As explained in the main text, the available spectroscopies cannot measure the yield of 1ET
products directly. Therefore, we have two equations (absorption at 880nm, and mass balance for
QOT2) with three unknowns. (MTT, MTD, and MDD) This situation implies that the charge carrier
extraction calculation can be expressed with the fixed amount of one-electron transfer.

236
Figure AS11: Yield of two-electron transfer and charge carrier extraction as the function of yield
of one-electron transfer.
The 1ET produces the species that are less likely to absorb probe light (Figure A.3.3). To
explain observed decrease in transmission, 1ET should be accompanied by 2ET which creates
better absorbing-probe species, QOT22+
11Bu to compensate the loss of QOT2 TT.
Quantitatively, the oscillator strength of QOT22+
11Bu is twice of QOT2 2
1Ag. Therefore, 1 %p
increase in 1ET yield indicates 1 %p increase of 2ET yield. Therefore, 1 %p increase of 1ET
results in 3 %p increase in the yield of total charge carrier extraction. (Slope of the yellow line)
This graph indicates that the maximum yield of charge carrier extraction (βCE,max) is 163 %
where all TT states play a role of charge carrier: 37 % of TT undergo 1ET and the rest TT state

237
(67 %) via 2ET. With the numerical value of αTT and βCE, we can calculate the internal quantum
efficiency (IQE) of the QOT2/AQ system.
αTT βCE
This relation enables the computation of IQE as the multiplication of two terms, αTT and βCE.
Therefore, the maximum IQE of the QOT2/AQ is therefore approximately 137 % (0.84 × 1.63).
This analysis implies that we can harvest∼1.4 electrons per phton absorbed
A.4.13. Oscillator Strength of Reduced AQ Anions
For reduced AQs (AQ− and AQ
2−), we have used time-dependent DFT (TDDFT)
simulation, PBE0/6-311++G**/PCM. The chemical species responsible for specific ESA and
estimated oscillator strength are listed below. XMS-CASPT2 and Spin-Flip RAS results for
QOT2+
TD and QOT22+
DD are also included.
Table AS5: Assignment of ESA II, III, and IV with the position of peak and oscillator strengtha.
a) The wavelength of corresponding transition and predicted oscillator strength are given in the
parenthesis.
References
(1) Kaduk, B.; Tsuchimochi, T.; Van Voorhis, T. J. Chem. Phys. 2014, 140, 18A503.
(2) Grimme, S. J. Comput. Chem. 2006, 27, 1787–1799.
(3) Zhao, Y.; Truhlar, D. G. J. Phys. Chem. A 2006, 110, 13126–13130.

238
(4) Zhao, Y.; Truhlar, D. G. Acc. Chem. Res. 2008, 41, 157–167.
(5) Shao, Y. et al. Mol. Phys. 2015, 113, 184–215.
(6) Shiozaki, T.; Gyroffy, W.; Celani, P.; Werner, H. J. J. Chem. Phys. 2011, 135.
(7) Wang, Z.; Kobayashi, T. New J. Phys.s 2008, 10.
(8) Chien, A. D.; Molina, A. R.; Abeyasinghe, N.; Varnavski, O. P.; Goodson, T.; Zimmerman,
P. M. J. Phys. Chem. C 2015, 119, 28258–28268.
(9) Ghigo, G.; Roos, B. O.; Malmqvist, P.- A. Chem. Phys. Lett. 2004, 396, 142–149.
(10) Werner, H.-J.; Knowles, P. J.; Knizia, G.; Manby, F. R.; Schutz, M. Wiley Interdiscip. Rev.:
Comput. Mol. Sci. 2012, 2, 242–253.
(11) Takahashi, T.; Matsuoka, K.-i.; Takimiya, K.; Otsubo, T.; Aso, Y. J. Am. Chem. Soc. 2005,
127, 8928–8929.
(12) Varnavski, O.; Leanov, a.; Liu, L.; Takacs, J.; Goodson, T. Phys. Rev. B 2000, 61, 12732–
12738.
(13) Varnavski, O.; Ispasoiu, R. G.; Balogh, L.; Tomalia, D.; Goodson, T. J. Chem. Phys. 2001,
114, 1962–1965.

239
Appendix B. Two−Photon Absorption Enhancement Parallels Intramolecular Charge
Transfer Efficiency in Quadrupolar Versus Dipolar Cationic Chromophores
I conducted femtosecond two-photon excitation fluorescence experiments in order to investigate
TPA properties for a quadrupolar and dipolar cationic chromophore. This was in collaboration
with the Spalletti group.
The work in this chapter was accepted in Journal of Physical Chemistry C (JPC) with the title:
“Two−Photon Absorption Enhancement Parallels Intramolecular Charge Transfer Efficiency in
Quadrupolar Versus Dipolar Cationic Chromophores ”
Federica Ricci, Benedetta Carlotti, Bradley Keller, Carmela Bonaccorso, Cosimo G. Fortuna,
Theodore Goodson III, Fausto Elisei, and Anna Spalletti
Modifications were made to the manuscript to adapt it to the style of this dissertation. References
and supporting information of the manuscript are included in this chapter.
B.1 Abstract
State−of−the−art femtosecond spectroscopies and quantum−chemical methods were used
to investigate the excited state dynamics of a D−π−A+ (C1) and a D−π−A
+−π−D (C2)
methyl−pyridinium (acceptor unit, A) derivatives bearing dibutylamino groups as strong electron
donors (D) and bithiophenes as highly effective π−rich spacers. The absorption spectra of C1 and
C2 are broad and are shifted to the red side of the visible spectral range. A significant negative
solvatochromism has been observed for the absorption bands of the investigated salts upon
increasing the solvent polarity, which have been rationalized in terms of electron density change
upon excitation. The absorption spectra of C2 are red–shifted with respect to those of C1
whereas the emission bands of the two compounds overlap suggesting a localization of the

240
excitation on just one branch of the quadrupolar compound, which becomes the fluorescent
portion. This is in agreement with our quantum mechanical calculations which predict that the
symmetry of C2 is broken in the relaxed S1 geometry. The excited state symmetry breaking is
observed in all of the investigated solvents regardless of their polarity. Femtosecond transient
absorption and fluorescence up−conversion measurements have revealed that the excited state
dynamics of C1 is essentially dominated by solvent relaxation, while in the case of C2 two
distinct excited singlet states have been detected in polar solvents, where an intramolecular
charge transfer (ICT) state is efficiently produced. The main photoinduced decay pathway of
both the compounds is internal conversion in all the investigated media. High values of Two–
Photon Absorption cross sections of 500 and 1400 GM for C1 and C2, respectively, have been
obtained by means of femtosecond resolved Two–Photon Excited Fluorescence measurements,
thus demonstrating the enhancement in the Nonlinear Optical properties of the quadrupolar
compound over its dipolar counterpart, in agreement with the more efficient ICT observed in the
case of C2.
B.2 Introduction
Organic molecules that can simultaneously absorb two photons to be promoted to their
excited states have recently been the subject of much research due to the growing interest in their
advanced photonic applications.1−5
Two photon absorbing organic compounds may be
successfully employed in different fields: in the optoelectronic/photonic field6−9
as low cost
materials for nonlinear optics (NLO), and in the medical field10
as chromophores for imaging,
and photodynamic therapy due to the increased penetration depth of the infrared radiation in the
tissues, and also due to their ability to form complexes with DNA.11−13

241
An intense effort has been devoted to the design of organic materials with large TPA
cross sections.1 Several efficient strategies have been put forward to develop conjugated
molecules with improved NLO responses: dipolar type with a donor−bridge−acceptor (D−π−A)
motif and quadrupolar type with the D−π−A−π−D structure, the latter having been highlighted
for its excellent properties.14−16
Indeed, symmetrical quadrupolar compounds have
experimentally and theoretically demonstrated enhanced TPA with respect to the dipolar
analogues.4,17−19
The observed TPA cross sections of dipolar and quadrupolar structures are in
accordance with the fact that the donor−π−acceptor molecules with increase in dimensionality
possess higher NLO and TPA properties. TPA enhancement for the quadrupolar compounds is
attributed to more effective electronic delocalization. 20−22,10
A deep understanding of the
solvatochromic and TPA properties of such quadrupolar chromophores23−26
has been often
reached by invoking the occurrence of symmetry breaking phenomena.18,19,27−33
Several works
have unambiguously shown that TPA is strongly influenced by the photoinduced intramolecular
charge transfer occurring in these systems containing electron donor and electron acceptor
groups.4,34
Cationic chromophores (such as methyl pyridinium and methyl quinolinium) have
shown to be promising as electron deficient moieties, not only for their significant electron
withdrawing ability but also for their water solubility which is very appealing for their possible
biological and medical applications.35−37
As for the electron donors, dialkyl−amino substituents
have shown higher NLO response if employed in molecular structures to replace the well−known
and largely used dimethylamino group.38,39
In fact, the TPA cross sections are enhanced upon
lengthening of the alkyl chain. Moreover, both the ICT and the optical non−linearity have been
found to improve in elongated and more conjugated push−pull polyenes with π−linkers of
increasing length.40−42

242
Among the numerous classes of π−conjugated organic materials, oligothiophenes have
attracted widespread interest in the last few years due to their high thermal and chemical
stability, relative ease of synthesis and good charge transport ability.43
In particular, push−pull
oligothiophenes have been largely described in the literature for their applications in organic
solar cells,44,45
because organic photovoltaic materials are flexible, lightweight, easily processed,
and low cost compared to their inorganic counterparts.46
However, only scarce examples of
oligothiophene derivatives have been reported for two−photon excited applications up to now. In
recent works, thiophene based π−conjugating spacers have proven effective in greatly increasing
the TPA cross−sections.47−50
In our latest works, cationic push−pull D−π−A+ and D−π−A
+−π−D chromophores
bearing a methylpyridinium as electron acceptor and dimethylamino or diphenylamino groups as
electron donors have been extensively studied in terms of their excited state dynamics.51−54
These
compounds have shown a peculiar negative solvatochromic behaviour, rarely observed for
dipolar and particularly for quadrupolar systems.18
A more efficient photoinduced intramolecular
charge transfer has been observed in the quadrupolar molecules with respect to their dipolar
analogues. Moreover, an excited state symmetry breaking phenomenon has been revealed by a
joint experimental and theoretical study for the highly symmetrical quadrupolar structures.53,54
These striking results have pushed us to extend the investigation, which employs
state−of−the−art femtosecond spectroscopies and quantum−chemical methods, to structurally
similar D−π−A+ and D−π−A
+−π−D methyl−pyridinium derivatives bearing dibutylamino groups
as strong electron donors and bithiophene as highly effective π−rich spacers (see Chart B.2.1).

243
Chart B.2.1. Molecular structures of compounds C1 and C2.
B.3 Experimental
The investigated compounds (shown in Chart B.2.1) have been synthesized as iodide
salts at the Catania Laboratory following the procedure previously described.55,56
Measurements
were performed in various solvents: chloroform (CHCl3), dichloromethane (DCM),
1,2−dichloroethane (DCE), acetone (Ac), acetonitrile (MeCN), 2−propanol (2−PrOH), ethanol
(EtOH), methanol (MeOH) and water (W).
A Perkin−Elmer Lambda 800 spectrophotometer was used for the absorption
measurements. Experimental error on the measured molar absorption coefficients is 2−3%. The
fluorescence spectra were measured by a FluoroMax®
−4P spectrofluorimeter of HORIBA
Scientific operated by FluorEssenceTM
. Tetracene (F = 0.17 in aerated cyclohexane)57
was used
as fluorimetric standard to calculate the fluorescence quantum yield. Estimated error on the
fluorescence quantum yield values is approximately 10%. For photochemical measurements, a
xenon lamp coupled with an interferential filter (exc = 436 nm) and potassium ferrioxalate in 0.1
N sulphuric acid as actinometer were used. The photoreaction (solute concentration 10−4
M)
was monitored by HPLC using a Waters apparatus equipped with a Phenomenex Jupiter

244
C18−300Å (4.6 250 mm; 5 m) column and a UV detector. W/MeCN mixtures with 0.1%
trifluoroacetic acid were used as eluent.
Triplet formation quantum yields and lifetimes (T and τT) were measured by a
nanosecond laser flash photolysis setup (Nd:YAG Continuum, Surelite II, second and third
harmonics, λexc = 532 and 355 nm, pulse width ca. 7 ns and energy ≤ 1mJ pulse−1
). The transient
kinetics were obtained by monitoring the change of absorbance over the 300–900 nm range and
averaging at least 10 decays at each wavelength. The setup was calibrated by an optically
matched solution of benzophenone (T = 1 and εT = 6500 M−1
cm−1
at the corresponding
absorption maximum, λmax=525 nm) in MeCN.58
Triplet–triplet absorption coefficients (εT) were
determined by energy transfer from benzophenone in MeCN.59
The experimental errors were
estimated to be about ±10% for τT and ±15% for εT and T. The quenching constants of the
triplets by molecular oxygen were evaluated by the slope of the linear plots of the triplet lifetime
vs. oxygen concentration. All the ns−transient absorption measurements were carried out at room
temperature; the solutions were deaerated by bubbling with nitrogen.
The experimental setups for femtosecond transient absorption and fluorescence
up−conversion measurements have been widely described elsewhere.60−62
The 400 nm excitation
pulses of ca. 40 fs were generated by an amplified Ti:Sapphire laser system (Spectra Physics).
The transient absorption set up (Helios, Ultrafast Systems) is characterized by temporal
resolution of ca. 150 fs and spectral resolution of 1.5 nm. Probe pulses were produced in the
475−750 nm range by passing a small portion of 800 nm light through an optical delay line (with
a time window of 3200 ps) and focusing it into a 2 mm thick Sapphire window to generate a
white−light continuum. In the up−conversion set−up (Halcyone, Ultrafast Systems) the 400 nm
pulses excite the sample and the remaining fundamental laser beam plays the role of the “optical

245
gate” after passing through a delay line. The fluorescence of the sample is collected and focused
onto a BBO crystal together with the delayed fundamental laser beam. The up−converted
fluorescence beam is focused into the entrance of a monochromator by a lens, and it is then
detected by a photomultiplier connected to a photon counter. The temporal resolution of the
up−conversion equipment is about 250 fs, whereas the spectral resolution is 5 nm. The ultrafast
spectroscopic data were fitted by Target Analysis assuming several successive steps and
resulting in the Species Associated Spectra (SAS)63
using the software Glotaran.64
Statistical
error on the lifetimes resulting from the global fitting is about 10%.
Quantum−mechanical calculations were carried out on molecular structures where the
butyl groups were replaced by methyl ones using Gaussian 09 package.65
Density functional
theory (DFT) based on the B3LYP method was used to optimize the geometry and to obtain the
properties of the substrates in the ground state while the lowest excited singlet states were
characterized by time dependent (TD) DFT B3LYP excited−state calculations.66
In both cases a
6−31G(d) basis set was employed. DCM solvation effects were included in the calculations by
means of the Conductor−like Polarizable Continuum Model (CPCM).67
Atomic charges and
dipole moments were obtained by use of the quantum theory of atoms in molecules (QTAIM).68
In order to measure the Two Photon Absorption (TPA) cross sections, a
Two Photon Excited Fluorescence (TPEF) setup was used. The setup employs a mode−locked
Spectra−Physics femtosecond Mai Tai laser, which is tunable from 700 to 1000 nm to generate
110−fs pulses. For the present study the Spectra−Physics Mai Tai generated a 775 nm, 110−fs
pulse to pump a Spectra−Physics Femtosecond Synchronously Pumped Optical Parametric
Oscillator (OPAL), which produced 1300 nm, 150 fs excitation pulses. The 1300 nm beam was
directed into a solution in a sample cell (quartz cuvette, 0.4 cm path length) and the resultant

246
fluorescence was collected in a direction perpendicular to the incident beam. A 1 inch focal
length plano−convex lens was used to direct the collected fluorescence into a monochromator.
The output from the monochromator was coupled to a PhotoMultiplier Tube (PMT) and
the photons were converted into counts by a photon counting unit. The photomultiplier tube is
connected to the computer via a photo−counting unit (Hamamatsu) that interfaces the detected
signal. A solution of
2−(6−(4−Dimethylaminophenyl)−2,4−neopentylene−1,3,5−hexatrienyl)−3−methylbenzothiazoli
um Perchlorate (Styryl 9M) in EtOH (10−5
M), characterized by a TPA cross section of 580 GM
at 1300 nm excitation wavelength and by a fluorescence quantum yield of 0.07,69
was used as
reference. The experimental uncertainty on the TPA cross sections amounts to ca. ±10%.
Two Photon Absorption transition tensors and cross sections of C1 and C2 in DCM
(PCM solvation model) were computed by use of the B3LYP/6−31G(d) method, Dalton2016.1
package,70,71
according to the formulas given by McClain et al.72,73
The TPA cross−section is
usually expressed in terms of Göppert Mayer (GM) unit, where 1 GM is 10−50
cm4 s photon
−1.
The relation between the macroscopic TPA cross section in GM (δGM) and the immediate
computation output in atomic unit (δau) is given by the following:74
dGM =8p 2aa0
5w f
2
cGdau
(1)
where α is the fine structure constant, a0 is the Bohr radius, c is the speed of light in vacuum, Γ
is the line−shape function, and ωf is the excitation energy for the 0→f transition. Estimated error
on the computed TPA cross sections is approximately ±20%.

247
B.4 Results and Discussion
B.4.1 Absorption and Fluorescence Properties
The absorption and fluorescence spectral properties of both the dipolar and quadrupolar
compounds C1 and C2 are significantly affected by the solvent polarity (see Figures B.4.1 and
B.4.2). In particular, the absorption bands of C1 and C2, placed in the far−red portion of the
visible spectral range, are noticeably blue−shifted on going from low polar (λmax=660 nm for C1
and 678 nm for C2 in DCM) to highly polar solvents (λmax=556 nm for C1 and 566 nm for C2 in
W/EtOH 70/30 mixture). Several solvents have been considered, belonging to three different
classes: low polarity chlorinated media, polar protic, and polar non−protic solvents (Table
B.4.1). A clear correlation of the absorption maximum position with solvent polarity can be seen
when solvents of the same class are taken into account and also when alkane chloride and protic
solvents are considered together, as reported in the literature for other methyl−pyridinium
derivatives.51−54,75
The observed negative solvatochromism is in agreement with the substantial
decrease of the dipole moment on going from the ground state to the Frank−Condon excited
singlet state foreseen in the case of C1 by the quantum mechanical calculations (see below),
whereas in the case of C2 it is probably related to a bis−dipolar contribution. Even though the
molecule is practically nonpolar as a whole (its electric dipole moment is close to zero in the
ground state because of the high molecular symmetry), a C2v symmetric V−shaped chromophore
such as C2 can be considered as a charge centered bis−dipole, where two well defined equal and
quasi opposite dipoles sharing the positive pole are present.76,77
An analogous negatively
solvatochromic behavior was observed for structurally similar methyl pyridinium dipolar and
quadrupolar compounds bearing strong electron donor groups (such as dimethyl amino and
diphenyl amino).51−54
However, the presence of the thiophene spacers peculiar to C1 and C2 is
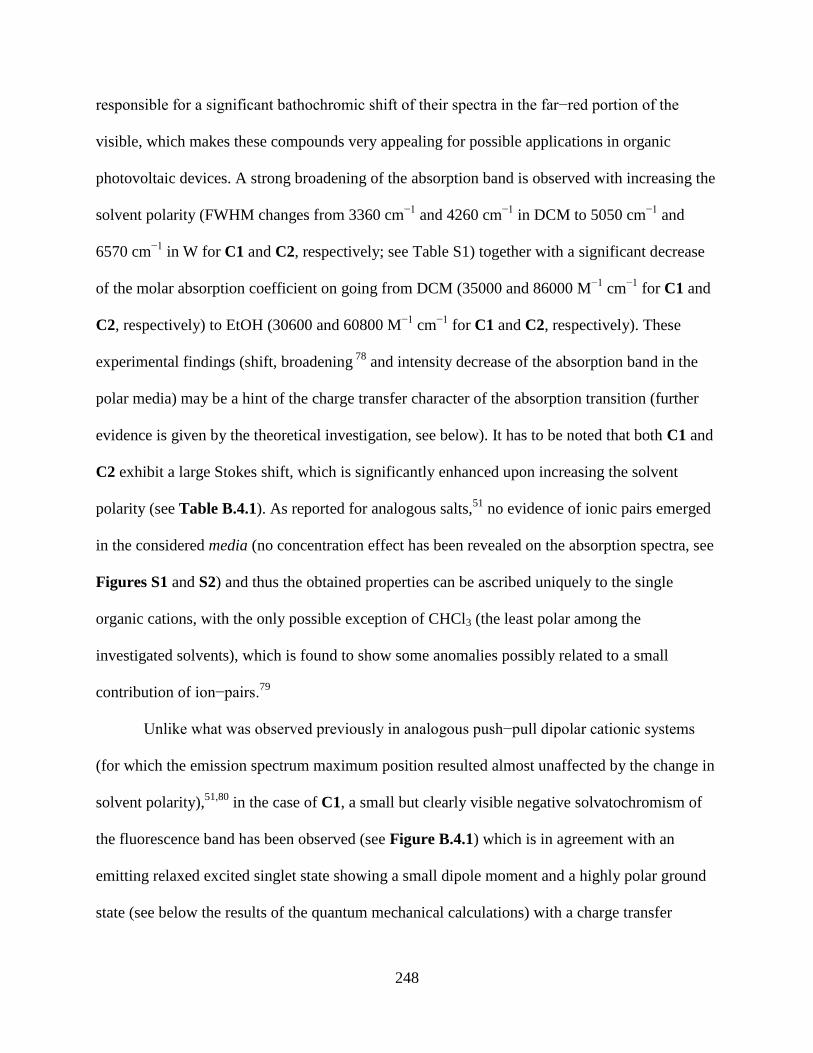
248
responsible for a significant bathochromic shift of their spectra in the far−red portion of the
visible, which makes these compounds very appealing for possible applications in organic
photovoltaic devices. A strong broadening of the absorption band is observed with increasing the
solvent polarity (FWHM changes from 3360 cm−1
and 4260 cm−1
in DCM to 5050 cm−1
and
6570 cm−1
in W for C1 and C2, respectively; see Table S1) together with a significant decrease
of the molar absorption coefficient on going from DCM (35000 and 86000 M−1
cm−1
for C1 and
C2, respectively) to EtOH (30600 and 60800 M−1
cm−1
for C1 and C2, respectively). These
experimental findings (shift, broadening 78
and intensity decrease of the absorption band in the
polar media) may be a hint of the charge transfer character of the absorption transition (further
evidence is given by the theoretical investigation, see below). It has to be noted that both C1 and
C2 exhibit a large Stokes shift, which is significantly enhanced upon increasing the solvent
polarity (see Table B.4.1). As reported for analogous salts,51
no evidence of ionic pairs emerged
in the considered media (no concentration effect has been revealed on the absorption spectra, see
Figures S1 and S2) and thus the obtained properties can be ascribed uniquely to the single
organic cations, with the only possible exception of CHCl3 (the least polar among the
investigated solvents), which is found to show some anomalies possibly related to a small
contribution of ion−pairs.79
Unlike what was observed previously in analogous push−pull dipolar cationic systems
(for which the emission spectrum maximum position resulted almost unaffected by the change in
solvent polarity),51,80
in the case of C1, a small but clearly visible negative solvatochromism of
the fluorescence band has been observed (see Figure B.4.1) which is in agreement with an
emitting relaxed excited singlet state showing a small dipole moment and a highly polar ground
state (see below the results of the quantum mechanical calculations) with a charge transfer

249
character of the emission transition. A substantial broadening of the fluorescence band has been
indeed revealed for C1 upon increasing the solvent polarity (FWHM from 1470 cm−1
in DCM to
2040 cm−1
in W; see Table S1). A similar solvatochromic behaviour has also been observed for
the emission spectrum of the quadrupolar derivative C2. Indeed, when the normalized absorption
and emission spectra of C1 and C2 are considered together (Figure B.4.3) it can be seen that,
whereas the absorption bands of C2 are red−shifted with respect to those of C1, in agreement
with a longer conjugated system, the emission bands of the two compounds roughly overlap.
This peculiar emissive behaviour of the quadrupolar system has already been observed
previously for a structurally similar dimethylamino pyridinium two−branched derivative in
highly polar aqueous solution53
but here it is surprisingly observed in all the investigated
solvents, characterized by both low and high polarity, as in the case of an analogous
diphenylamino quadrupolar system.54
The solvent effect has also been investigated on the photophysical properties of both C1
and C2, in particular on the fluorescence efficiency (see Table B.4.1). The fluorescence quantum
yields are very low for both compounds, scarcely affected (just slightly decreased) by the
increase in solvent polarity and lower in the case of the quadrupolar with respect to the dipolar
system (ϕF of the order of 10−3
for C1 and 10−4
for C2). A scarce solvent effect on the emission
intensity is observed here for the bithiophene derivatives C1 and C2; on the contrary, a
significant fluorescence quenching upon increasing the solvent polarity was found during
previous investigations of analogous styryl containing mono− and two− branched systems.51−54
The occurrence of trans→cis photoisomerization of C1 and (trans,trans)→(trans,cis)
photoisomerization of C2 has been monitored in two solvents characterized by different polarity
(CHCl3 and MeCN) and in all cases it has been found to be negligible. Triplet production by
250
intersystem crossing (ISC) of C1 and C2 in DCM was investigated by nanosecond
flash−photolysis measurements. A transient signal attributed to the triplet was detected around
760 nm in the case of C1 under a 532 nm laser excitation, characterized by a lifetime of 8.0±0.8
μs and an oxygen quenching rate constant of 1.8×10⁹ M
−1s−1
. Moreover, this triplet state could be
successfully produced by sensitization (energy transfer) with benzophenone in MeCN upon
irradiation at 355 nm. The obtained triplet absorption coefficient (εT) was of 18000±3000
M−1
cm−1
and the ISC quantum yield for C1 in DCM (ϕT) was found to be of 0.020±0.003. No
signal related to the triplet absorption was detected for C2, suggesting a less efficient ISC in this
case. These results are in agreement with the femtosecond transient absorption measurements
where just a small Rest absorption assignable to the triplet was retrieved by global fitting of the
data indicating that, even though not completely negligible, the ISC should play a minor role in
the excited state deactivation of the studied systems (see below). Therefore, internal conversion
(IC) to the ground state is expected to be the most significant photoinduced decay pathway for
both C1 and C2 in all the investigated solvents.
400 500 600 700 800 900
Flu
ore
scen
ce I
nte
nsi
ty
/ nm
CHCl3
DCM
DCE
MeCN
2-PrOH
EtOH
MeOH
W/EtOH 70/30
Abso
rban
ce
Figure B.4.1. Normalized absorption and emission spectra of C1 in solvents of different
polarity.

251
400 500 600 700 800 900
Flu
ore
scen
ce I
nte
nsi
ty
/ nm
CHCl3
DCM
DCE
MeCN
2-PrOH
EtOH
MeOH
W/EtOH 70/30
Abso
rban
ce
Figure B.4.2. Normalized absorption and emission spectra of C2 in solvents of different
polarity.
Table B.4.1. Spectral properties and fluorescence quantum yields of C1 and C2 in several
solvents of different polarity f(ε,n2)=[(ε−1)/(2ε+1)]−[(n
2−1)/(2n
2+1)].
solvent f (ε,n2) /nm /nm / cm−1 /M−1 cm−1
C1 C2 C1 C2 C1 C2 C1 C2 C1 C2
CHCl3 0.148 627 654 750 760 2616 2133 0.008 0.002
DCM 0.218 660 678 785 782 2413 1962 35000 86000 0.005 0.0005
DCE 0.223 646 671 788 785 2790 2164 0.008 0.0008
2−PrOH 0.276 584 614 765 763 4051 3180 0.011 0.0022
Ac 0.285 564 596 785 777 4992 3909 0.002 0.0002
EtOH 0.289 578 610 770 770 4314 3406 30600 60800 0.006 0.0006
MeCN 0.305 561 592 785 754 5086 3629 0.002 0.0003
MeOH 0.309 570 602 775 770 4641 3624 0.004 0.0002
W/EtOH 70/30 0.314 556 566 768 770 4965 4681 0.004 0.0003
In italics non protic and polar solvents. Experimental error on the measured molar absorption coefficients
is 2−3%. Estimated error on the fluorescence quantum yield values is approximately 10%.

252
300 400 500 600 700 800 900
Inte
nsi
ty
/ nm
C1
C2
EtOH Emission
Emission
Absorption
AbsorptionDCM
Figure B.4.3. Normalized absorption and emission spectra of C1 and C2 in DCM and EtOH.
B.5 Quantum−Mechanical Calculations
A comprehensive computational investigation was carried out about the structural and
electronic properties of C1 and C2 in DCM by methods rooted into the Density Functional
Theory (DFT) and its time dependent (TD−DFT) extension.
The cations of these salts are dipolar or quadrupolar (A+−π− D or D−π−A
+−π−D)
systems, where the pyridinium unit (A+) is the strong acceptor and the dibuthylamino group (D)
the strong donor. Obviously the dipole moment for an ion is undefined since it depends on the
choice of the coordinate origin. It is usually convenient to setup a “working definition” based on
the mass centre of the system.81
Thus, the dipole moment of the cation can be defined just like
that of conventional polar molecules. The dipole moments shown in Table B.5.1 were computed
for the ground, excited Frank−Condon and relaxed S1 in DCM.
High values (μS0 = 10.2 D, see Table B.5.1) were found for the dipole moment of the
most stable ground state conformer of C1 due to the positive charge largely localized on the

253
pyridinium group. The absorption transition leads to an electron transfer toward the pyridinium
group, which reduces the polar character of the FC excited state (μS1,FC = 2.3 D). This variation
in the dipole moment upon excitation (Δμ= 7.9 D) is significant, even more than that predicted
for the analogous dimethylamino−styrene−pyridinium (Δμ= 4.8 D)82
and
diphenylamino−stryrene−pyridinium (Δμ= 7.0 D)54
dipolar systems. The dipole moment does
not change significantly in the relaxed S1 state (μS1,opt = 1.7 D) pointing to a relaxation that does
not involve a charge transfer in the excited state. Both the ground state and the relaxed excited
singlet state show a quasi−planar geometry in DCM. The theoretical results about the dipole
moments furnish an explanation to the negative solvatochromism observed in the absorption and
in the emission spectra of C1. The fact that the relaxed singlet excited state is characterized by a
low dipole moment and by a quasi−planar optimized geometry (probably determined by the
presence of the ortho connected thiophene rings in the molecular structure of C1)83
may give a
possible explanation for the experimentally calculated fluorescence quantum yield almost
independent of the solvent polarity. In fact, in previous works on analogous dipolar
compounds51,80
the strong solvent dependence of the fluorescence efficiency was found to be
dependent on the significant Twisted Intramolecular Charge Transfer (TICT) character of the
emitting state. Charge displacements in the excited state are indeed usually helped by
conformational rearrangements; these might be inhibited by the rigid bithiophene motif in the C1
molecular structure in comparison to more flexible dimethylamino and diphenylamino styryl
containing D−π−A+ systems.
51,80
In the case of C2 a small electric dipole moment in the ground state resulted from the
calculations (μS0 =0.51 D, Table 4.5.1); nonzero values are obtained because of the bent structure
of compound C2, which actually is not a pure quadrupole. A small increase of the electric dipole

254
moment with no orientation change is foreseen when going from S0 to the FC S1 state (μS1,FC =
2.2 D). Surprisingly, the dipole moment of the relaxed S1 state shows a very high value (μS1,opt =
37.9 D). The geometry of the ground state calculated in DCM has a C2v symmetry and is almost
planar. The symmetry of the system is completely broken in the relaxed S1 geometry. In this
case, one of the arms is co−planar with the pyridinium (dihedral angle around 180 degrees)
whereas the other is bent (dihedral angle about 40 degrees). For this reason a very high dipole
moment value is calculated for the relaxed S1.
Table B.5.1. Dipole moments of the ground state (S0), the Frank−Condon first excited singlet
state (S1,FC) and the relaxed first excited singlet state (S1,opt) of compounds C1 and C2 in DCM
obtained by the B3LYP/6−31G(d) model followed by QTAIM: total modulus (μTot.) and
Cartesian components (μx, μy and μz).
comp.d State µ / D
µx µy µz µTot.
C1
S0 10.07 1.58 0.28 10.19
S1,FC 1.32 1.90 0.31 2.34
S1,opt −0.04 1.65 0.24 1.68
S0@S1opt 9.91 1.63 0.18 10.07
C2
S0 −0.16 −0.28 −0.41 0.51
S1,FC −0.51 −2.14 −0.09 2.19
S1,opt −37.71 −4.17 0.69 37.95
S0@S1opt 3.86 −0.58 0.13 3.91
The computational predictions of the spectra and the investigation of the singlet excited
state nature have been performed for C1 and C2 in DCM after S0 geometry optimization (see the

255
results collected in Table S2). The theoretically predicted absorption spectra are in good
agreement with their experimental counterparts.
The electronic properties of C1 and C2 were calculated considering both the S0 and the
S1 optimized geometries in DCM: the plots of the frontier molecular orbitals (MOs) are shown in
Figures B.5.1 and B.5.2. In particular, the lowest excited singlet state S1 is mainly described by
the HOMO − LUMO configuration of π,π* nature in all cases. When considering the ground
state optimized geometry, the HOMO → LUMO transition implies a charge transfer toward the
methyl pyridinium in the case of C1 and a symmetrical charge displacement from the lateral
electron rich dialkylamino groups toward the central electron deficient methyl−pyridinium in the
case of C2 (see Figure B.5.1). The solvatochromic effect observed for C2 is then related to this
charge transfer taking place during the absorption transition in each of the two dipolar branches
of the quadrupolar structure (see Figure B.5.1). When the geometry is optimized for the S1 state,
the molecular orbitals are very similar for C1. The emitting species is therefore characterized by
a quasi−planar geometry and is described by molecular orbitals distributed on the whole
molecular structure. In the case of C2, S1 looks like a symmetry−broken state where a very
significant charge displacement occurs from one branch to the other of the molecular structure.
Moreover, the findings issuing from the quantum mechanical calculations provide a possible
explanation for the emission spectrum of C2, which overlaps that of C1. In fact, the molecular
orbitals involved in the emission transition (LUMO−HOMO) of C2 are both localized on one
branch of the quadrupolar system, which in this case becomes the fluorescent portion of the
system, being similar to that involved in the emission of the single−arm C1 molecule. The
charge transfer character of the radiative deactivation (see Figure B.4.3) is then increased; this
result coupled to the twisted excited state geometry predicted for C2 gives an explanation for the

256
reduced quantum efficiency of C2 as compared with that of C1.53
The excited state symmetry
breaking, resulting from the calculations (Figure B.5.2), is able to explain the experimentally
observed overlap of the emission bands of C1 and C2 (Figure B.4.3) in all the considered
solvents, even in those characterized by low polarity. This phenomenon was previously revealed
for a dimethylamino pyridinium quadrupolar derivative, structurally similar to C2, only in highly
polar media.51
Therefore, a more efficient photoinduced symmetry breaking intramolecular
charge transfer occurs in the quadrupolar compound of this work, probably caused by the
enhanced electron donor strength of the substituents placed at its lateral ends (dibutylamino
groups coupled with electron rich thiophene rings), similarly to what observed for a
diphenylamino substituted system.54

257
Figure B.5.1. Frontier molecular orbitals of C1 and C2 at the optimized S0 geometry (H means
here HOMO and L means LUMO).

258
Figure B.5.2. Frontier molecular orbitals of C1 and C2 at the optimized S1 geometry (LSOMO
is the lowest singly occupied molecular orbital; HSOMO is the highest singly occupied
molecular orbital).

259
S0→S1 transition S1→S0 transition
C1
C2
Figure B.5.3. Difference of electron density between states for the S0 → S1 and S1 → S0
transitions of compounds C1 and C2 in DCM (in the figures the colours violet and cyan
correspond to an increase and a decrease in electron density, respectively).
B.6 Femtosecond Transient Absorption and Fluorescence Up−Conversion
To gain insight into the excited state dynamics of C1 and C2, femtosecond resolved
transient absorption measurements were carried out in solvents of different polarity. Figures
7−10 show a contour plot of the experimental data (panel A), the main time−resolved absorption
spectra and kinetics recorded at significant wavelengths (panel B), together with the spectral and
kinetic properties of the main components obtained by Singular Value Decomposition and Target
Analysis (panel C) for C1 and C2 in CHCl3 and MeOH. Table B.6.1 summarizes the results
obtained for the two compounds in four solvents of increasing polarity (CHCl3, DCM, EtOH,
MeOH), the lifetime (η) and the Species Associated Spectrum (SAS) of each detected transient.
In the case of compound C1 (Figures B.6.1 and B.6.2) the time−resolved spectra show
the ground state bleaching negative signal (around 650 nm), a stimulated emission band
significantly red−shifting in time (around 700−750 nm) and a positive transient absorption signal

260
centered around 590 nm, which slightly blue shifts and decays during the measurement (an
additional small excited state absorption band is observed around 680 nm in polar solvents). The
Target Analysis revealed the presence of three/four components with lifetimes of 0.20, 5.3, 115
ps in CHCl3 and 0.22, 1.0, 5.1 and 41 ps in MeOH together with a last component not decaying
in the investigated time window (Rest). The bathochromic shift of the stimulated emission in
time and the values of the two/three shorter lifetimes are a signature of the occurrence of solvent
relaxation following the excitation of C1 in CHCl3 and MeOH, respectively. In fact, solvation is
known to show a time−dependence which is at least biexponential concerning both the inertial
and diffusive component of the response.84
The lifetimes 0.23/5.3 ps in CHCl3 and 0.22/1.0/5.1
ps in MeOH obtained from the global fitting can be therefore assigned to solvation. The longer
living component of 115 ps in CHCl3 and 41 ps in MeOH can be associated to the relaxed lowest
excited singlet state (S1) and the Rest component to the lowest excited triplet state (T1). Similar
results, in terms of time resolved spectra and revealed transients, have been obtained in DCM
and EtOH (see Figures S3−S4 and Table B.6.1). However, a certain dependence of the S1
lifetime upon solvent polarity (its value decreases by a factor of three on going from CHCl3 to
MeOH) is observed, probably due to its charge transfer character. The small solvent effect
observed for C1 on the lowest excited singlet state lifetime (the fluorescence lifetime) parallels
the small effect of solvent polarity observed on the fluorescence quantum yield (see Table
B.6.1). These experimental results obtained for the emitting state are in agreement with the low
dipole moment and planar geometry predicted for this state by the quantum−mechanical
calculations. This behavior is different from that revealed for analogous dipolar push−pull
dimethylamino/diphenylamino−styrene−pyridinium systems, for which a significant solvent
effect has been observed on both the fluorescence efficiency and the lifetime of the highly polar

261
TICT lowest excited singlet state.51,80
Moreover, for these salts previously studied by our
group51,80
the population of an intramolecular charge transfer state from the locally excited state
reached by light absorption was clearly observed during the excited state dynamics studied by
ultrafast spectroscopies. This is very different from what revealed in the case of C1 for which no
significant charge rearrangement is found to take place by the ultrafast pump−probe
measurements, in agreement with what predicted by the calculations.
In the case of compound C2 in CHCl3 (Figure B.6.2) the time resolved spectra look very
similar to those recorded for C1 showing a main positive absorption band at 600 nm and a
second lower intense band at 725 nm, together with a stimulated emission negative signal
between 660 and 750 nm clearly visible at short delays from the excitation. The Target Analysis
revealed that after the occurrence of solvation dynamics (reflected by the component of 2.9 ps)
only one transient assignable to an excited singlet state is present. This transient is characterized
by a lifetime of 24 ps and by a spectrum composed of two absorption bands at 600 and 725 nm,
which resembles the spectrum of the S1 state of C1 in agreement with the excited state symmetry
breaking predicted for the quadrupolar system by the theoretical calculations. Figure B.6.3
shows the transient spectra recorded for C2 in MeOH. A narrow band centered around 605 nm,
produced right after the laser excitation, decays during the first 2 ps. In the same time scale a
broad band at 700 nm is formed and this latter shows a subsequent slower decay within 30 ps.
This spectral behavior indicates that a precursor−successor dynamics is operative during the
excited state deactivation of C2 in this solvent: the species absorbing at 605 nm is the precursor
of the species absorbing at 700 nm. The global fitting of the ultrafast spectroscopic data of C2 in
MeOH revealed the presence of three exponential components together with a Rest. The first
component is characterized by a lifetime of 0.27 ps and a spectrum showing an excited state

262
absorption at 605 nm, being the most intense recorded signal in the transient absorption spectrum
obtained for C2. This transient can be assigned to the S1 state of C2. The second component of
3.2 ps is probably related to solvation in MeOH. The third component of 4.2 ps shows an
absorption band broader than that of the first transient and centered at 700 nm. It is probably
assignable to an intramolecular charge transfer state (1ICT*) efficiently produced as a separate
species only for the quadrupolar compound in polar solvents. The same components describe the
excited state dynamics of C2 also in EtOH (Figure S6 and Table B.6.1). In DCM the time
resolved spectra (see Figure S5) are complicated by the presence of a region of negative signal
due to the ground state bleaching (being the steady−state absorption of C2 red−shifted in low
polar media). In summary, in the low polar solvents (CHCl3 and DCM) the production of an
intramolecular charge transfer state is not so efficient to be able to generate a separate species
and the S1 SAS is characterized by two bands which are placed in correspondence of the
absorption signals of the two distinct singlet states (the locally excited S1 and the 1ICT
* state)
detected in the more polar EtOH and MeOH media. Significantly shortened excited state
lifetimes are observed for C2 with respect to C1, in analogy with its decreased fluorescence
quantum yield and in agreement with the symmetry breaking and the stronger ICT character of
the quadrupolar compound.85,4
Similarly to C1, also in the case of C2 the small Rest component
observed in all the investigated solvents is assigned to the lowest excited triplet state.
Fluorescence up−conversion kinetics have been acquired for C1 and C2 in EtOH and
MeOH (Figure B.6.4) by exciting the samples at 400 nm and collecting the up−converted
fluorescence at 370 nm which corresponds to the emission of the investigated compounds at 688
nm. This spectral position corresponds to the blue portion of the C1 and C2 fluorescence bands
(see Figure B.4.1 and B.4.2) but unfortunately it was not possible to acquire the fluorescence

263
kinetics at lower energies because this is the limit of our experimental set−up. For this reason,
the collected decays are dominated by the fast occurrence of solvation dynamics, and the
exponential components corresponding to the deactivation of the lowest excited singlet states
show a low amplitude. In any case, the best fittings have been obtained by using time constants
comparable to those obtained by the transient absorption experiments (see Table B.6.2), except
for the Rest component which was absent in the up−conversion decays, pointing to the fact that
in the up−conversion investigation we are indeed following the S1 relaxation and deactivation
dynamics. Indeed, even though the 400 nm excitation employed for the ultrafast spectroscopic
investigation implies that higher excited singlet states are initially populated by light absorption,
mainly in the case of C2 (see Table S2), the Sn−S1 internal conversion should occur very fast86
and therefore should take place together with the inertial solvation in all the investigated
solvents. It has to be noted that the results of the fluorescence up−conversion analysis are in full
agreement with the assignments of the transient species revealed by Excited State Absorption
measurements.

264
Table B.6.1. Spectral and kinetic properties of the transients of C1 and C2 in solvents of
different polarity (obtained by femtosecond transient absorption measurements upon excitation at
400 nm).
Solvent η / ps# λ / nm
* assignment
compound C1
CHCl3
0.20
5.3
115
Rest
740(+)
615(+), 730(−)
605(+), 740(−)
600(+)
Solvation
Solvation
S1
T1
DCM
0.17
2.5
90
Rest
670 (+)
595(+)
590(+), 650(−)
590(+)
Solvation
Solvation
S1
T1
1.8 605(+), 720(−) Solvation
EtOH 7.0 600(+), 680(−) Solvation
29 590(+), 630(−), 685(+) Solvation
88 585(+), 625(−), 685(+) S1
Rest 540(+) T1
0.22 740(+) Solvation
MeOH 1.0 600(+), 735(−) Solvation
5.1 595(+), 685(+) Solvation
41 585(+), 700(+) S1
Rest 530(+) T1
compound C2
CHCl3
2.9
24
Rest
610(+), >740(−)
600(+), 655(−), 725(+)
565(+), 710(+)
Solvation
S1
T1
DCM
1.4
2.2
Rest
605(+), 705(−)
575(+), 675(−), >740(+)
595(+)
Solvation
S1
T1
EtOH
1.0
3.1
605(+), 735(−)
600(+), 705(+)
Solvation+S1
Solvation
16 685(+) S1 (ICT)
Rest 590(+), 670(+) T1
MeOH
0.27
3.2
605(+), 740(−)
600(+), 705(+)
Solvation+S1
Solvation
4.2 680(+) S1 (ICT)
Rest 590(+), 670(+) T1
#Statistical error on the lifetimes is about 10%.
*Species Associated Spectra (SAS) obtained by
Target Analysis.

265
Figure B.6.1. Pump−probe absorption of C1 in CHCl3 (λexc=400 nm): A) contour plot of the
experimental data, B) time resolved absorption spectra recorded at different delays after the laser
pulse. Insets: decay kinetics recorded at meaningful wavelengths together with the corresponding
fitting traces and C) Species Associated Spectra (SAS) of the decay components obtained by
Target Analysis.
Figure B.6.2. Pump−probe absorption of C1 in MeOH (λexc=400 nm): A) contour plot of the
experimental data, B) time resolved absorption spectra recorded at different delays after the laser
pulse. Insets: decay kinetics recorded at meaningful wavelengths together with the corresponding
fitting traces and C) Species Associated Spectra (SAS) of the decay components obtained by
Target Analysis.

266
Figure B.6.3. Pump−probe absorption of C2 in CHCl3 (λexc=400 nm): A) contour plot of the
experimental data, B) time resolved absorption spectra recorded at different delays after the laser
pulse. Insets: decay kinetics recorded at meaningful wavelengths together with the corresponding
fitting traces and C) Species Associated Spectra (SAS) of the decay components obtained by
Target Analysis.
Figure B.6.4. Pump−probe absorption of C2 in MeOH (λexc=400 nm): A) contour plot of the
experimental data, B) time resolved absorption spectra recorded at different delays after the laser
pulse. Insets: decay kinetics recorded at meaningful wavelengths together with the corresponding
fitting traces and C) Species Associated Spectra (SAS) of the decay components obtained by
Target Analysis.

267
-1 0 1 10 100
0
200
400
obsd
= 688 nm
Counts
time (ps)
C1 in EtOH
C1 in MeOH
C2 in EtOH
C2 in MeOH
Figure B.6.5. Fluorescence up−conversion kinetics (λexc=400 nm) of C1 and C2 in MeOH and
EtOH (dots) together with the best fittings (full lines) obtained by use of poly−exponential
functions (see Table 4).
Table B.6.2. Decay components of C1 and C2 obtained by the decay kinetics of the
up−conversion fluorescence recorded at 688 nm (exc = 400 nm). Compound Solvent / ps
#
C1 EtOH 0.53
1.5
9.2
30
93
MeOH 0.30
1.2
4.8
45
C2 EtOH 0.75
3.0
15
MeOH 0.30
3.0
4.5
#Statistical error on the lifetimes is about 10%.

268
B.7 Two Photon Excited Fluorescence Measurements
The TPA cross sections were estimated using the TPEF method.87
Excitation wavelength
of 1300 nm was used because both the compounds show a maximum one photon absorption at
650 nm in DCM and emission wavelength of 800 nm was considered to detect the maximum
fluorescence peak.
2−(6−(4−Dimethylaminophenyl)−2,4−neopentylene−1,3,5−hexatrienyl)−3−methylbenzothiazoli
um Perchlorate (Styryl 9M) dissolved in EtOH was used as the TPA reference to obtain the TPA
cross sections.69
The intensity of the TPEF signal increases with the square of the intensity: it is important
to check this quadratic power dependence, to avoid overestimating the TPA cross section value
because of fluorescence contributions from one photon absorption.
2.3 2.4 2.5 2.6
3.2
3.4
3.6
3.8
4.0
4.2
4.4
4.6
y = 2.03x-1.25 r = 0.9966
y = 2.01x-1.37 r= 0.9999
C2_DCM
C1_DCM
y = 1.92x-0.57 r = 0.9998
Standard: Styryl 9M_EtOH
log
(cp
s)
log(mW)
Figure B.7.1. Logarithmic plot of the quadratic dependence (counts vs. power) for: Styryl 9M in
EtOH (black line), C1 in DCM (blue line) and C2 in DCM (red line).
A quadratic dependence was found between the emission counts and the laser pulse
power; therefore, a slope of about 2 was found in the plot log (counts) vs. log (power), indicating
allowed two−photon excitation (Figure B.7.1). The intercepts may be taken directly from the

269
intensity−power log−log plots provided that the standard and sample slopes are very close to the
same value of 2.
The following equation was employed to compute the TPA cross sections (δ) for the two
compounds under investigation (samples) with respect to the reference compound Styryl 9M
(std):
(2)
where F is the fluorescence quantum yield, [c] is the solution concentration, b is the intercept
in the quadratic plot and n is the refractive index of the solvent.
Table B.7.1. TPA cross sections determined for C1 and C2 in DCM by exciting at 1300 nm
together with that of the reference compound (Styryl 9M) in EtOH. The parameters used for the
calculations by equation 2 are also reported.
a from ref. 69;
b from Table 1.
High values of the TPA cross sections, δ, have been obtained (see Table B.7.1): 500 GM
(C1) and 1400 GM (C2). Comparing the results, the quadrupolar C2 shows a TPA cross section
approximately three times higher than the dipolar C1. These results indicate that C2 has better
NLO properties compared to C1, meaning that dipolar systems seem to give weaker TPA than
symmetric dyes of the same complexity. Preliminary TPEF measurements on structurally similar
dipolar and quadrupolar dimethylamino−styrene−methylpyridinium derivatives showed lower
TPA cross sections for the mono and two branched systems, respectively (unpublished results).
These findings suggest that the presence of the bithiophene spacers has a positive impact on the
TPA response, with the increased conjugation and molecular dimensionality being crucial in
d sample =10
bsample-bstdfFstdd std[c]stdnstdfFsample[c]samplensample
ϕF [c] /M n δ /GM
Styryl 9M EtOHa 0.07 1.81 × 10
−6 1.33
1.42
1.42
580
C1 DCM 0.005b 1.52 × 10
−6 500±50
C2 DCM 0.0005b 5.42 × 10
−5 1400±100

270
determining enhanced NLO properties. The obtained results are thus of great interest because the
observed cross section for C2 is of the same order of magnitude (thousands of GM) as the
highest reported TPA cross sections for quadrupolar structures,1,18
similar or enhanced compared
to other thiophene containing NLO organic chromophores47−50
and increased with respect to
structurally analogous dimethylamino−styrene−methylpyridinium derivatives. In particular,
neutral quadrupolar chromophores bearing lateral dibutylamino phenyls as electron donors and
ethylene spacers showed TPA cross sections of 640 and 1700 GM in the presence of a central
phenyl or dicyano substituted phenyl, as reported in reference 1. Additionally, a cationic
quadrupolar dye bearing methylpyridinium as electron deficient portion showed a TPA cross
section of 119 GM (see reference 88).
Two Photon Absorption transition tensors and cross sections of C1 and C2 in DCM were
computed by use of the Dalton package (see Tables B.7.2 and S3). The energy of the excited
states obtained by Dalton are slightly underestimated, particularly in the case of C2; the
difference between the transition energies calculated by Gaussian may be due to the different
solvation model used by the two programs. It is evident that the computed probability of
biphotonic absorption is strictly linked with the dipolar/quadrupolar nature of the investigated
substrates. Indeed, in the case of the dipolar C1 the S1 and S2 states show a δ value of several
hundreds of GM whereas in the case of the quadrupolar C2 the state S1 is forbidden and S2
becomes much more intense (ca. 1.9×10⁴ GM) because of its high molecular symmetry. The δ
values predicted by the calculations are in substantial agreement with those obtained
experimentally by exciting at 1300 nm in the case of C1. It is possible that the cross section
computed for the S0→S2 transition of the most stable and highly symmetrical conformer of C2 is
quite large and not satisfactorily confirmed by the experiment because of the possible

271
contribution to the observed real TPA of other low energy and not symmetrical ground state
conformations of C2 exhibiting a reduced TPA cross section for this transition.31
Table B.7.2. Wavelengths (), cross sections (δ) and polarization ratios (R) computed for the
lowest excited singlet states of C1 and C2 in DCM (PCM) by B3LYP/6−31G(d) (Dalton2016.1). comp.nd State OPA /nm TPA /nm δ / GM R
C1 S1 678 1356 780 0.67
S2 432 864 970 0.67
S3 391 782 197 0.68
C2 S1 761 1522 95.4 1.49
S2 636 1273 18700 0.66
S3 577 1154 597 0.76
S4 551 1103 47.8 1.41
Estimated error on the computed TPA cross sections is approximately ±20%.
In the cationic chromophores of the present study (C1 and C2), contrary from what is
typically observed in the neutral push−pull systems, the absorption transition shows a strong
charge transfer character as clearly evidenced theoretically from the HOMO and LUMO
molecular orbitals (Figure B.5.1) and experimentally from their strong negative
solvatochromism. This charge transfer character of their absorption is in agreement with the high
magnitude TPA observed for both C1 and C2. The higher TPA cross section found in C2 is in
agreement with the more significant ICT character of its excited states as previously discussed.
In fact, the lower quantum efficiencies (C1: 0.005 and C2: 0.0005 in DCM) and the shorter
decay lifetime (C1: 45 ps and C2: 4.5 ps in DCM) of C2 are in agreement with the ultrafast
intramolecular charge transfer and localization taking place in the quadrupolar compound.89
Experimental evidence has shown that an increase in intramolecular charge transfer
results in an enhanced TPA cross section. 90
The TPA process is an instantaneous process and it
is mainly influenced by the Franck−Condon (FC) excited state. Even though it is not easy to
monitor the FC state, it is possible to trace back its characteristics by following the nature of the
ICT relaxed state. Thus, the obtained results suggest that there is a higher amount of charge

272
transfer in the FC configuration for C2 with respect to C1, which might contribute to the
enhanced TPA cross section.
Furthermore, the presence of intramolecular charge transfer character is supported by the
Density Functional Theory (DFT) and time dependent DFT (TD−DFT) theoretical calculations
that predicted a high dipole moment in the ground state for C1, which is decreased in the excited
state. In the case of C2, the theoretical investigation revealed a symmetry breaking in the
optimized geometry and in the molecular orbitals describing the relaxed excited S1 state. The
quantum−mechanical calculations showed that in the quadrupolar compound the dipole moment
calculated in the ground state is very low because of the molecular symmetry, but the one
calculated for the relaxed S1 is found to be very high pointing to significant excited state ICT
character. In the case of C2 the symmetry of the system is completely broken in the relaxed S1
geometry and this gives a possible explanation for the high dipole moment calculated for the
relaxed S1.
However, the details of the excited state formation in symmetrical donor−acceptor
systems are not clearly understood. A considerable fundamental interest arises from the fact that
such systems possess a charge−transfer character of the excited state, which may be
accompanied by a stabilization of the excitation at one branch and breaking of the molecular
symmetry.91
The obtained results are very interesting and demonstrate the enhancement in the NLO
properties of the quadrupolar compound (two branched system) compared to its dipolar
counterpart (mono branched system), in agreement with the more efficient ICT and the charge
localization clearly observed in the electronic structure predicted by the calculations in the case
of C2. This suggests that multi−branched systems can be used to increase the TPA cross section

273
in order to promote charge transfer characteristic, as stated in previous works on similar organic
compounds.53
B.8 Conclusions
A comprehensive experimental and quantum−mechanical study has allowed us to obtain
information about the solvent effect on the spectral and photophysical properties of two cationic
pyridinium derivatives: a dipolar, one–branched (C1: D–π–A+) system and a quadrupolar, two–
branched (C2: D–π–A+–π–D) compound, bearing a dibuthylamino as electron donor group (D), a
methyl−pyridinium as electron acceptor portion (A) and an ethylene linked with electron rich
thiophene rings as π−spacers. The absorption spectra of C1 and C2 are broad and shifted to the
red side of the visible spectral range with this peculiarity which is due to the presence of the
bithiophene bridges largely increasing molecular conjugation and dimensionality. A significant
negative solvatochromism has been observed for the absorption bands of the investigated salts
together with a lower magnitude blue shift of the emission spectra upon increasing the solvent
polarity, which have been rationalized by considering the results of the theoretical investigation.
In fact, the dipole moment for C1 is predicted to be high in the ground state and to be
significantly decreased in the Frank−Condon excited state reached by light absorption, whereas
no significant change in the dipole moment is obtained during the relaxation of S1. These
theoretical results are in agreement with the solvent effect on the absorption and emission
transitions, which both show a significant charge transfer character, whereas no significant
charge rearrangement is predicted to occur during the excited state dynamics. This behaviour of
C1 is very different from that exhibited by analogous structures bearing a styryl π−spacer and
thus characterized by increased flexibility, for which a highly polar TICT relaxed excited state
was predicted by the theoretical investigation. Femtosecond transient absorption and

274
fluorescence up−conversion measurements have indeed revealed that the excited state dynamics
of C1 are essentially dominated by simple solvent relaxation phenomena of the S1 state, whose
lifetime shows a little dependence upon the solvent polarity. Also the low fluorescence quantum
yields of C1 (ca. 10−3
) are scarcely affected by the solvent and the main photoinduced decay
pathway is internal conversion in all the investigated media.
The absorption spectra of C2 are red–shifted with respect to those of C1 whereas the
emission bands of the two compounds overlap in both low polarity and high polarity solvents
suggesting a localization of the excitation on just one branch of the quadrupolar compound,
which becomes the fluorescent portion. In fact, in the case of C2 the quantum–mechanical
calculations have shown that the symmetry of the system is broken in the relaxed S1 geometry
and that a very significant charge displacement in the LUMO–HOMO molecular orbitals occurs
from one branch to the other of the quadrupolar system. The excited state symmetry breaking,
the first time revealed for an analogous dimethylamino derivative only in highly polar media,48
is
here observed in all the investigated solvents regardless of their polarity as previously observed
in a diphenylamino−analogue.49
The ultrafast spectroscopic investigation has pointed out that in
the case of the quadrupolar compound, two distinct excited singlet states are detected in polar
solvents, where an intramolecular charge transfer (ICT) state is efficiently produced as a separate
species. These findings are in line with the decreased fluorescence efficiency of the quadrupolar
system with respect to the dipolar analogue (ϕF ca. 10−4
) and with the strong TICT character
foreseen for the relaxed excited S1 state of C2 by the theoretical calculations.
High values of Two–Photon Absorption cross sections have been obtained by means of
femtosecond excited Two–Photon Excited Fluorescence measurements: 500 and 1400 GM for
C1 and C2, respectively. These results are very interesting and demonstrate the strong

275
enhancement in the Nonlinear Optical properties of the quadrupolar compound over its dipolar
counterpart. The present investigation revealed that an ultrafast localization on one of the
branches to give an ICT state takes place after photoexcitation in C2; a higher charge transfer
character in the FC configuration for C2 with respect to C1 could thus be speculated, which
might contribute to the increased TPA cross section of the quadrupolar system. TPA cross
section was enhanced by the presence of the bithiophene π−bridges motif, compared to that
exhibited by structurally similar styryl containing compounds. Thus, the highly two–photon
absorbing C2 is a promising candidate for potential applications in the medical and
optoelectronic fields. Moreover, since the absorption spectra of C1 and C2 are broad and on the
red side of the visible spectral range, these compounds may be promising for a possible use as
photosensitizers in organic photovoltaic solar cells.
B.9 Supporting Information. The Supporting Information file contains additional data
concerning: the concentration effect on the absorption spectra, the femtosecond transient
absorption measurements and the quantum chemical calculations.
300 400 500 600 700 800
Abso
rban
ce
nm
[C1]=4.3x10⁻⁵ M
[C1]=4.3x10⁻⁶ M
DCM
300 400 500 600 700 800
[C1]=2.4x10⁻⁵ M
[C1]=4.9x10⁻⁶ M
Abso
rban
ce
/ nm
2-PrOH
Figure BS1. Normalized absorption spectra of concentrated and diluted solution of C1 in DCM
and 2-PrOH.

276
300 400 500 600 700 800
[C2]=2.6x10⁻⁵ M
[C2]=1.7x10⁻⁶ M
DCM
Abso
rban
ce
/ nm
300 400 500 600 700 800
MeOH
Abso
rban
ce
/ nm
[C2]=1.2x10⁻⁵ M
[C2]=2.7x10⁻⁶ M
Figure BS2. Normalized absorption spectra of concentrated and diluted solution of C2 in DCM
and MeOH.
Table BS1. Full Width at Half Maximum (FWHM) of the absorption and emission bands of C1
and C2 in different solvents.
Solvent
FWHMabs / cm−1
FWHMem / cm−1
C1 C2 C1 C2
CHCl3 3570 5110 1630 1920
DCM 3360 4360 1470 1570
DCE 3450 4490 1510 1690
2-PrOH 4280 5580 2080 2890
Ac 4450 5560 1860 2690
EtOH 4440 5600 2000 2450
MeCN 4510 5710 1840 1850
MeOH 4490 5650 1960 2780
W/EtOH 70/30 5050 6570 2040 2450

277
Table BS2. Transition energy, nature and oscillator strength of the lowest excited singlet states
of C1 in DCM calculated by TD-DFT B3LYP/6-31G(d), together with the experimental
absorption and emission maxima (λexp) in the same solvent. comp.d transition nature % λcalc / nm f λexp / nm
C1
S0T1 πH πL* 96 1098 0.000
S0S1 πH πL* 100 618 1.509 663
S0T2 πH-1 πL* 48 532 0.000
S0S2 πH πL+1* 97 437 0.074
S0S3 πH-1 πL* 73 387 0.233
S0S4 πH πL+2* 69 338 0.009
S0S5 πH-2 πL* 91 322 0.013
S0S6 πH-3 πL* 95 309 0.026
C2
S0T1 πH πL* 79 1031 0.000
S0T2 πH πL+1* 50 969 0.000
S0S1 πH πL* 99 724a 2.094 677
S0S2 πH-1 πL* 82 625 0.010
S0S3 πH-1 πL+1* 98 544 0.729
S0S4 πH πL+1* 82 541 0.138
S0S5 πH-2 πL* 80 409 0.316
S0S6 πH πL+2* 82 381 0.081
a The absorption maximum of the calculated spectrum is ca. 700 nm

278
Figure BS3. Pump−probe absorption of C1 in DCM (λexc=400 nm): A) contour plot of the
experimental data, B) time resolved absorption spectra recorded at different delays after the laser
pulse. Insets: decay kinetics recorded at meaningful wavelengths together with the corresponding
fitting traces and C) Species Associated Spectra (SAS) of the decay components obtained by
Target Analysis.
Figure BS4. Pump−probe absorption of C1 in EtOH (λexc=400 nm): A) contour plot of the
experimental data, B) time resolved absorption spectra recorded at different delays after the laser
pulse. Insets: decay kinetics recorded at meaningful wavelengths together with the corresponding
fitting traces and C) Species Associated Spectra (SAS) of the decay components obtained by
Target Analysis.

279
Figure BS5. Pump−probe absorption of C2 in DCM (λexc=400 nm): A) contour plot of the
experimental data, B) time resolved absorption spectra recorded at different delays after the laser
pulse. Insets: decay kinetics recorded at meaningful wavelengths together with the corresponding
fitting traces and C) Species Associated Spectra (SAS) of the decay components obtained by
Target Analysis.
Figure BS6. Pump−probe absorption of C2 in EtOH (λexc=400 nm): A) contour plot of the
experimental data, B) time resolved absorption spectra recorded at different delays after the laser
pulse. Insets: decay kinetics recorded at meaningful wavelengths together with the corresponding
fitting traces and C) Species Associated Spectra (SAS) of the decay components obtained by
Target Analysis.

280
Table BS3. Two photon transition tensor (a.u.; 1 a.u.= 1.896788×1050
cm4 s photon
1) of C1
and C2 in DCM (PCM) computed by B3LYP/6-31G* (Dalton2016.1). Comp.nd State Energy (eV) SXX SYY SZZ SXY SXZ SYZ
C1 S1 1.83 1182.7 70.9 0.1 -305.6 -25.7 6.4
S2 2.84 -821.5 -82.1 -0.5 264.8 14.3 -4.9
S3 3.17 357.3 5.8 -0.4 -59.8 5.7 -2.1
S4 3.54 26489.4 1940.7 12.1 -7179.0 -584.0 158.3
C2 S1 1.63 38.7 0.3 0.4 -418.0 92.7 -0.6
S2 1.95 -5794.8 -50.2 -2.5 -2.3 -3.1 16.2
S3 2.15 -959.6 70.2 2.7 -7.1 6.9 -21.0
S4 2.25 83.7 0.0 0.4 -201.9 45.7 -0.6
AUTHOR INFORMATION
Corresponding Author
Author Contributions
The manuscript was written through equal contributions of all authors. All authors have given
approval to the final version of the manuscript.
ACKNOWLEDGMENT
The authors acknowledge support from the Italian “Ministero per l’Università e la
Ricerca Scientifica e Tecnologica”, MIUR (Rome, Italy) under the FIRB “Futuro in Ricerca”
2013, no. RBFR13PSB6; ACS International Research Experience for Undergraduates (IREU)
Program 2014 and “Programmi di mobilità e Scambi Culturali di Studenti nell’ambito di accordi

281
quadro” 2016. Dr. Mirco Natali and Prof. Maria Teresa Indelli are kindly acknowledged for their
help with the nanosecond flash photolysis measurements.
References
(1) Pawlicki, M.; Collins, H. A.; Denning, R. G.; Anderson, H. L. Two−Photon Absorption
and the Design of Two−Photon Dyes. Angew. Chem. Int. Ed. 2009, 48, 3244−3266.
(2) Terenziani, F.; Katan, C.; Badaeva, E.; Tretiak, S.; Blanchard−Desce, M. Enhanced
Two−Photon Absorption of Organic Chromophores: Theoretical and Experimental
Assessments. Adv. Mater. 2008, 20, 4641−4678.
(3) Gallavardin, T.; Maurin, M.; Marotte, S.; Simon, T.; Gabudean, A.; Bretonniere, Y.;
Lindgren, M.; Lerouge, F.; Baldeck, P. L.; Stephan, O. et al. Photodynamic Therapy
and Two−Photon Bio−Imaging Applications of Hydrophobic Chromophores Through
Amphiphilic Polymer Delivery. Photochem. Photobiol. Sci. 2011, 10, 1216−1225.
(4) Ramakrishna G.; Goodson III, T. Excited−State Deactivation of Branched Two−Photon
Absorbing Chromophores: A Femtosecond Transient Absorption Investigation. J.
Phys. Chem. A 2007, 111, 993−1000.
(5) Varnavski, O.; Yan, X.; Mongin, O.; Blanchard−Desce, M.; Goodson, III, T. Strongly
Interacting Organic Conjugated Dendrimers with Enhanced Two−Photon Absorption.
J. Phys. Chem. C 2007, 111, 149−162.
(6) Adegoke, O. O.; Ince, M.; Mishra, A.; Green, A.; Varnavski, O.; Mart nez−D az, M.;
B uerle, P.; Torres, T.; Goodson, III, T. Synthesis and Ultrafast Time Resolved
Spectroscopy of Peripherally Functionalized Zinc Phthalocyanine Bearing
Oligothienylene−ethynylene Subunits. J. Phys. Chem. C, 2013, 117, 20912−20918.
(7) Harpham, M. R.; Suzer, O.; Ma, C.; Bauerle, P.; Goodson III, T. Thiophene Dendrimers
as Entangled Photon Sensor Materials. J. Am. Chem. Soc. 2009, 131, 973−979.
(8) Lahankar, S. A.; West, R.; Varnavski, O.; Xie, X.; Goodson III, T.; Sukhomlinova, L.;
Twieg, R. Electronic Interactions in a Branched Chromophore Investigated by
Nonlinear Optical and Time−Resolved Spectroscopy. J. Chem. Phys. 2004, 120,
337−344.
(9) Ranasinghe, M. I.; Hager, M. W.; Gorman, C. B.; Goodson III, T. Time−Resolved
Fluorescence Investigation of Energy Transfer in Compact Phenylacetylene
Dendrimers. J. Phys. Chem. B 2004, 108, 8543−8549.
(10) Goodson III, T. Time−Resolved Spectroscopy of Organic Dendrimers and Branched
Chromophores. Annu. Rev. Phys. Chem. 2005, 56, 581−603.
(11) Mazzoli, A.; Carlotti, B.; Fortuna, C. G.; Spalletti, A. Photobehaviour and DNA
Interaction of Styrylquinolinium Salts Bearing Thiophene Substituents. Photochem.
Photobiol. Sci., 2011, 10, 973−979.
(12) Mazzoli, A.; Carlotti, B.; Consiglio, G.; Fortuna, C. G.; Miolo, G.; Spalletti, A.
Photobehaviour of Methyl−Pyridinium and Quinolinium Iodide Derivatives, Free and

282
Complexed with DNA. A Case of Bisintercalation. Photochem. Photobiol. Sci. 2014,
13, 939−950.
(13) Doan, P. H.; Pitter, D. R. G.; Kocher, A.; Wilson, J. N.; Goodson III, T. Two−Photon
Spectroscopy as a New Sensitive Method for Determining the DNA Binding Mode of
Fluorescent Nuclear Dyes. J. Am. Chem. Soc. 2015, 137, 9198−9201.
(14) Huang, T.; Wang, Y.; Kang, Z.; Yao, J.; Lu, R.; Zhang, H. Investigation on
Photophysical Properties of D–π–A–π–D−Type Fluorenone−Based Linear Conjugated
Oligomers by Using Femtosecond Transient Absorption Spectroscopy. Photochem.
Photobiol. 2014, 90, 29−34.
(15) Lavanya Devi, C.; Yesudas, K.; Makarov, N. S.; Jayathirtha Rao, V.; Bhanuprakash,
K.; Perry, J. W. Combined Experimental and Theoretical Study of One− and
Two−Photon Absorption Properties of D–π–A–π–D Type
Bis(Carbazolylfluorenylethynyl) Arene Derivatives: Influence of Aromatic Acceptor
Bridge. Dyes and Pigments 2015, 113, 682−691.
(16) Breukers, R. D.; Janssens, S.; Raymond, S. G.; Bhuiyan, M. D. H.; Kay, A. J.
Synthesis and Characterization of Strongly Two Photon Absorbing and
Photoswitchable Azo Molecules. Dyes and Pigments 2015, 112, 17−23.
(17) Wang, X.; Wang, D.; Zhou, G.; Yu, W.; Zhou, Y.; Fang, Q.; Jiang, M. Symmetric and
Asymmetric Charge Transfer Process of Two−Photon Absorbing Chromophores:
Bis−Donor Substituted Stilbenes, and Substituted Styrylquinolinium and
Styrylpyridinium Derivatives. J. Mater. Chem. 2001, 11, 1600−1605.
(18) Terenziani, F.; Painelli, A.; Katan, C.; Charlot, M.; Blanchard−Desce, M. Charge
Instability in Quadrupolar Chromophores: Symmetry Breaking and Solvatochromism.
J. Am. Chem. Soc. 2006, 128, 15742−15755.
(19) Katan, C.; Terenziani, F.; Mongin, O.; Werts, M. H. V.; Porres, L.; Pons, T.; Mertz, J.;
Tretiak, S.; Blanchard−Desce, M. Effects of (Multi)branching of Dipolar
Chromophores on Photophysical Properties and Two−Photon Absorption. J. Phys.
Chem. A 2005, 109, 3024−3037.
(20) Ramakrishna, G.; Bhaskar, A.; Goodson, III T. Ultrafast Excited State Relaxation
Dynamics of Branched Donor−π−Acceptor Chromophore: Evidence of a
Charge−Delocalized State. J. Phys. Chem. B 2006, 110, 20872−20878.
(21) Bhaskar, A.; Ramakrishna, G.; Lu, Z.; Twieg, R.; Hales, J. M.; Hagan, D. J.; Stryland,
E.; Goodson III, T. Investigation of Two−Photon Absorption Properties in Branched
Alkene and Alkyne Chromophores. J. Am. Chem. Soc. 2006, 128, 11840−11849.
(22) Wang, Y.; He, G. S.; Prasad, P. N.; Goodson III, T. Ultrafast Dynamics in
Multibranched Structures with Enhanced Two−Photon Absorption. J. Am. Chem. Soc.
2005, 127, 10128−10129.
(23) Correa, D. S.; Oliveira, S. L.; Misoguti, L.; Zilio, S. C.; Aroca, R. F.; Constantino, C.
J. L.; Mendonca, C. R. Investigation oft he Two−Photon Absorption Cross−Section in
Perylene Tetracarboxylic Derivatives: Nonlinear Spectra and Molecular Structure. J.
Phys. Chem. A 2006, 110, 6433−6438.

283
(24) Rogers, J. E.; Slagle, J. E.; McLean, D. G.; Sutherland, R. L.; Brant, M. C.; Heinrichs,
J.; Jakubiak, R.; Kannan, R.; Tan, L.; Fleitz, P. A. Insight into the Nonlinear
Absorbance of Two Related Series of Two−Photon Absorbing Chromophores. J. Phys.
Chem. A 2007, 111, 1899−1906.
(25) Padilha, L. A.; Webster, S.; Przhonska, O. V.; Hu, H.; Peceli, D.; Ensley, T. R.;
Bondar, M. V.; Gerasov, A. O.; Kovtun, Y. P.; Shandura, M. P. et al. Efficient
Two−Photon Absorbing Acceptor−π−Acceptor Polymethine Dyes. J. Phys. Chem. A
2010, 114, 6493−6501.
(26) Yan, L.; Chen, X.; He, Q.; Wang, Y.; Wang, X.; Guo, Q.; Bai, F.; Xia, A. Localized
Emitting State and Energy Transfer Properties of Quadrupolar Chromophores and
(Multi)Branched Derivatives. J. Phys. Chem. A 2012, 116, 8693−8705.
(27) Terenziani, F.; Sissa, C.; Painelli, A. Symmetry Breaking in Octupolar Chromophores:
Solvatochromism and Electroabsorption. J. Phys. Chem. B 2008, 112, 5079−5087.
(28) Terenziani, F. Przhonska, O. V.; Webster, S.; Padilha, L. A.; Slominsky, Y. L.;
Davydenko, I. G.; Gerasov, A. O.; Kovtun, Y. P.; Shandura, M. P.; Kachkovski, A. D.
et al. Essential−State Model for Polymethine Dyes: Symmetry Breaking and Optical
Spectra. J. Phys. Chem. Lett. 2010, 1, 1800−1804.
(29) Hu, H.; Przhonska, O. V.; Terenziani, F.; Painelli, A.; Fishman, D.; Ensley, T. R.;
Reichert, M.; Webster, S.; Bricks, J. L.; Kachkovski, A. D.; Hagan, D. J. et al.
Two−Photon Absorption Spectra of a Near Infrared 2−Azaazulene Polymethine Dye:
Solvation and Ground−State Symmetry Breaking. Phys. Chem. Chem. Phys. 2013, 15,
7666−7678.
(30) Gutierrez−Arzaluz, L.; Guarin, C. A.; Rodriguez−Cordoba, W.; Peon, J. Dynamics oft
he Formation of a Charge Transfer State in 1,2−Bis(9−anthryl)acetylene in Polar
Solvents: Symmetry Reduction with the Partecipation of an Intramolecular Torsional
Coordinate. J. Phys. Chem. B 2013, 117, 12175−12183.
(31) Rebane, A.; Drobizhev, M.; Makarov, N. S.; Wicks, G.; Wnuk, P.; Stepanenko, Y.;
Haley, J. E.; Krein, D. M.; Fore, J. L.; Burke et al. Symmetry Breaking in Platinum
Acetylide Chromophores Studied by Femtosecond Two−Photon Absorption
Spectroscopy. J. Phys. Chem. A 2014, 118, 3749−3759.
(32) Trinh, C.; Kirkikovali, K.; Das, S.; Ener, M. E.; Gray, H. B.; Djurovich, P.; Bradforth,
S. E.; Thompson, M. E. Symmetry Breaking Charge Transfer of Visible Light
Absorbing Systems: Zinc Dipyrrins. J. Phys. Chem. C 2014, 118, 21834−21845.
(33) Kim, W.; Sung, J.; Grzybowski, M.; Gryko, D. T.; Kim, D. Modulation of
Symmetry−Breaking Intramolecular Charge Transfer Dynamics Assisted by Pendant
Side Chains in π−Linkers in Quadrupolar Diketopyrrolopyrrole Derivatives. J. Phys.
Chem. Lett. 2016, 7, 3060−3066.
(34) Wang, X.; Wang, C.; Yu, W.; Zhou, Y.; Fang, Q.; Jiang, M. Two−Photon Absorption
of Styryl−Quinolinium, −Pyridinium, and −Barbituric Acid Derivatives, and
Intramolecular Charge Transfer. Can. J. Chem. 2001, 79, 174−182.
(35) Zhu, Y.; Xiao, L.; Zhao, M.; Zhou, J.; Zhang, Q.; Wang, H.; Li, S.; Zhou, H.; Wu, J.;
Tian, Y. A Series of Imidazole Derivatives: Synthesis, Two−Photon Absorption, and

284
Application for Bioimaging. BioMed Research International 2015, Article ID 965386,
1−8.
(36) Zheng, Y. C.; Zheng, M. L.; Chen, S.; Zhao, Z. S.; Duan, X. M.
Biscarbazolylmethane−Based Cyanine: A Two−Photon Excited Fluorescent Probe for
DNA and Selective Cell Imaging. J. Mater. Chem. B 2014, 2, 2301−2310.
(37) Miao, F.; Zhang, W.; Sun, Y.; Zhang, R.; Liu, Y.; Guo, F.; Song, G.; Tian, M.; Yu, X.
Novel Fluorescent Probes for Highly Selective Two−Photon Imaging of Mitochondria
in Living Cells. Biosensors and Bioelectronics 2014, 55, 423−429.
(38) Hrobarik, P.; Hrobarikova, V.; Semak, V.; Kasak, P.; Rakovsky, E.; Polyzos, I.; Fakis,
M.; Persephonis, P. Quadrupolar Benzobisthiazole−Cored Arylamines as Highly
Efficient Two−Photon Absorbing Fluorophores. Org. Lett. 2014, 16, 6358−6361.
(39) Hao, F.; Zhu, D.; Ma, J.; Chai, L. Synthesis and Nonlinear Optical Properties in the
Near−IR Range of Stilbazolium Dyes. Spectrochimica Acta A: Mol. Biomol. Spectr.
2014, 123, 46−53.
(40) Blanchard−Desce, M.; Wortmann, R.; Lebus, S.; Lehn, J. M.; Kramer P.
Intramolecular Charge Transfer in Elongated Donor−Acceptor Conjugated Polyenes.
Chem. Phys. Letts. 1995, 243, 526−532.
(41) Blanchard−Desce, M.; Alain, V.; Midrier, L.; Wortmann, R.; Lebus, S.; Glania, C.;
Kramer, P.; Fort, A.; Muller, J.; Barzoukas, M. Intramolecular Charge Transfer and
Enhanced Quadratic Optical Non−Linearities in Push Pull Polyenes. J. Photochem.
Photobiol. A: Chem. 1997, 105, 115−121.
(42) Alain, V.; Redoglia, S.; Blanchard−Desce, M.; Lebus, S.; Lukaszuk, K.; Wortmann,
R.; Gubler, U.; Bosshard, C.; Gunter, P. Elongated Push–Pull Diphenylpolyenes for
Nonlinear Optics: Molecular Engineering of Quadratic and Cubic Optical
Nonlinearities Via Tuning of Intramolecular Charge Transfer. Chem. Phys. 1999, 245,
51−71.
(43) Barbarella, G.; Melucci, M.; Sotgiu, G. The Versatile Thiophene: An Overview of
Recent Research on Thiophene−Based Materials. Adv. Mater. 2005, 17, 1581−1593.
(44) Zhang, F.; Wu, D.; Xu, Y.; Feng, X. Thiophene−Based Conjugated Oligomers for
Organic Solar Cells. J. Mater. Chem. 2011, 21, 17590−17600.
(45) Mallet, C.; Savitha, G.; Allain, M.; Kozmik, V.; Svoboda, J.; Frere, P.; Roncali, J.
Synthesis and Electronic Properties of D–A–D Triads Based on
3−Alkoxy−4−cyanothiophene and Benzothienothiophene Blocks. J. Org. Chem. 2012,
77, 2041−2046.
(46) Keller, B.; McLean, A.; Kim, B.; Chung, K.; Kim, J.; Goodson III, T. Ultrafast
Spectroscopic Study of Donor–Acceptor Benzodithiophene Light Harvesting Organic
Conjugated Polymers. J. Phys Chem. C 2016, 120, 9088−9096.
(47) Genin, E.; Hugues, V.; Clermont, G.; Herbivo, C.; Castro, M. C. R.; Comel, A.;
Raposo, M. M. M.; Blanchard−Desce, M. Fluorescence and Two−Photon Absorption
of Push–Pull Aryl(Bi)Thiophenes: Structure–Property Relationships. Photochem.
Photobiol. Sci. 2012, 11, 1756−1766.

285
(48) Chen, D.; Zhong, C.; Dong, X.; Liu, Z.; Qin, J. A New Building Block, Bis(Thiophene
Vinyl)−Pyrimidine, for Constructing Excellent Two−Photon Absorption Materials:
Synthesis, Crystal Structure and Properties. J. Mater. Chem. 2012, 22, 4343−4348.
(49) Zhou, H.; Zhou, F.; Tang, S.; Wu, P.; Chen, Y.; Tu, Y.; Wu, J.; Tian, Y. Two−Photon
Absorption Dyes with Thiophene as π Electron Bridge: Synthesis, Photophysical
Properties and Optical Data Storage. Dyes and Pigments 2011, 92, 633−641.
(50) Chow, C. Two−Photon Induced Emissive Thiophene Donor–Acceptor Systems as
Molecular Probes for In Vitro Bio−Imaging: Synthesis, Crystal Structure, and
Spectroscopic Properties. RSC Advances 2013, 3, 18835−18843.
(51) Carlotti, B.; Elisei, F.; Fortuna, C. G.; Mazzucato, U.; Spalletti, A. Intramolecular
Charge Transfer of Push–Pull Pyridinium Salts in the Singlet Manifold. J. Phys. Chem.
A 2014, 118, 3580−3592.
(52) Carlotti, B.; Cesaretti, A.; Fortuna, C. G.; Spalletti, A.; Elisei, F. Experimental
Evidence of Dual Emission in a Negatively Solvatochromic Push–Pull Pyridinium
Derivative. Phys. Chem. Chem. Phys. 2015, 17, 1877−1882.
(53) Carlotti, B.; Benassi, E.; Spalletti, A.; Fortuna, C. G.; Elisei, F. Photoinduced
Symmetry−Breaking Intramolecular Charge Transfer in a Quadrupolar Pyridinium
Derivative. Phys. Chem. Chem. Phys. 2014, 16, 13984−13994.
(54) Carlotti, B.; Benassi, E.; Fortuna, C. G.; Barone, V.; Spalletti, A.; Elisei, F. Efficient
Excited−State Symmetry Breaking in a Cationic Quadrupolar System Bearing
Diphenylamino Donors. ChemPhysChem 2016, 17, 136−146.
(55) Fortuna, C. G.; Bonaccorso, C.; Qamar, F.; Anu, A.; Ledoux, I.; Musumarra, G.
Synthesis and NLO Properties of New Trans2−(Thiophen−2−Yl) Vinyl Heteroaromatic
Iodides. Org. Biomol. Chem. 2011, 9, 1608−1613.
(56) Fortuna, C. G.; Barresi, V.; Bonaccorso, C.; Consiglio, G.; Failla, S.;
Trovato−Salinaro, A.; Musumarra, G. Design, Synthesis and In Vitro Antitumour
Activity of New Heteroaryl Ethylenes. European Journal of Medicinal Chemistry 2012,
47, 221−227.
(57) Birks, J. B. Photophysics of Aromatic Molecules, Wiley−Interscience, London, 1970,
p.123.
(58) Romani, A.; Elisei, F.; Masetti, F.; Favaro, G. pH−Induced Effects on the
Photophysics of Dipyridyl Ketones. J. Chem. Soc., Faraday Trans. 1992, 88,
2147−2154.
(59) Carmichael, I.; Hug, G. L. Triplet–Triplet Absorption Spectra of Organic Molecules in
Condensed Phases. J. Phys. Chem. Ref. Data 1986, 15, 1–204.
(60) Barbafina, A.; Latterini, L.; Carlotti, B.; Elisei, F. Characterization of Excited States
of Quinones and Identification of Their Deactivation Pathways. J. Phys. Chem. A 2010,
114, 5980−5984.
(61) Del Giacco, T.; Carlotti, B.; De Solis, S.; Barbafina, A.; Elisei, F. Photophysics of
Aromatic Thiourea Derivatives and Their Complexes with Anions. Fast and Ultrafast
Spectroscopic Investigations. Phys. Chem. Chem. Phys. 2010, 12, 8062−8071.

286
(62) Cesaretti, A.; Carlotti, B.; Gentili, P. L.; Clementi, C.; Germani, R.; Elisei, F.
Spectroscopic Investigation of the pH Controlled Inclusion of Doxycycline and
Oxytetracycline Antibiotics in Cationic Micelles and Their Magnesium Driven Release.
J. Phys. Chem. B 2014, 118, 8601−8613.
(63) van Stokkum, I. H. M.; Larsen, D. S.; van Grondelle, R. Global and Target Analysis of
Time−Resolved Spectra. Biochim. Biophys. Acta 2004, 1657, 82−104.
(64) Snellenburg, J. J.; Laptenok, S.; Seger, R.; Mullen, K. M.; van Stokkum, I. H. M.
Glotaran: A Java−Based Graphical User Interface for the R Package TIMP. J. Stat.
Soft. 2012, 49, 1−23.
(65) Frisch, M. J.; Trucks, G. W.; Schlegel, H. B.; Scuseria, G. E.; Robb, M. A.;
Cheeseman, J. R.; Scalmani, G.; Barone, V.; Mennucci, B.; Petersson, G. A. et al.
Gaussian 09, Revision B.01, Gaussian, Inc., Wallingford CT, 2010.
(66) Becke, A. D. Density‐Functional Thermochemistry. III. The Role of Exact Exchange.
J. Chem. Phys. 1993, 98, 5648−5652.
(67) Barone, V.; Cossi, M. Quantum Calculation of Molecular Energies and Energy
Gradients in Solution by a Conductor Solvent Model. J. Phys. Chem. A 1998, 102,
1995−2001.
(68) Keith, T.A. AIMAll (Version 16.08.17), TK Gristmill Software, Overland Park KS,
USA, 2016 (aim.tkgristmill.com).
(69) Makarov, N. S.; Drobizhev, M.; Rebane, A. Two−Photon Absorption Standards in the
550–1600 nm Excitation Wavelength Range. Optics Express 2008, 16, 4029−4047.
(70) Aidas, K.; Angeli, C.; Bak, K. L.; Bakken, V.; Bast, R.; Boman, L.; Christiansen, O.;
Cimiraglia, R.; Coriani, S.; Dahle, P. et al. The Dalton Quantum Chemistry Program
System. Comput. Mol. Sci. 2014, 269−284.
(71) Dalton, a Molecular Electronic Structure Program, Release Dalton2016.1, 2016, see
http://daltonprogram.org.
(72) Monson, P.R.; McClain, W.M. Polarization Dependence of the Two‐Photon
Absorption of Tumbling Molecules with Application to Liquid 1‐Chloronaphthalene
and Benzene. J. Chem. Phys. 1970, 53, 29−37.
(73) McClain, W.M. Excited State Symmetry Assignment Through Polarized Two‐Photon
Absorption Studies of Fluids. J. Chem. Phys., 1971, 55, 2789−2796.
(74) Murugan, N. A.; Kongsted, J.; Rinkevicius, Z.; Aidas, K.; Mikkelsen, K. V.; Ågren,
H. Hybrid Density Functional Theory/Molecular Mechanics Calculations of
Two−Photon Absorption of Dimethylamino Nitro Stilbene in Solution. Phys. Chem.
Chem. Phys. 2011, 13, 12506−12516.
(75) Zhang, C. L.; Wang, D. Y. Nonlinear Dependence of Solvent Polarity Effects on
Twisted Intramolecular Charge−Transfer States and Linear Relation for Electronic
Spectra in a Stilbazolium−Like Dye. J. Photochem. Photobiol. A: Chem. 2002, 147,
93−101.

287
(76) Pascal, S.; Haefele, A.; Monnereau, C.; Charaf−Eddin, A.; Jacquemin, D.; Le
Guennic, B.; Andraud, C.; Maury, O. Expanding the Polymethine Paradigm: Evidence
for the Contribution of a Bis−Dipolar Electronic Structure. J. Phys. Chem. A 2014, 118,
4038−4047.
(77) Ghoneim, N.; Suppan, P. Solvatochromic Shifts of Non−Dipolar Molecules in Polar
Solvents. Spectrochim. Acta, 1995 51A, 1043−1050.
(78) Grabowski, Z. R.; Rotkiewicz, K.; Rettig, W. Structural Changes Accompanying
Intramolecular Electron Transfer: Focus on Twisted Intramolecular Charge−Transfer
States and Structures. Chem. Rev. 2003, 103, 3899−4032.
(79) G rner, H. Charge Transfer Fluorescence of trans−Styrylpyridinium Iodides. J.
Photochem. Photobiol. A: Chem. 2011, 218, 199−203.
(80) Carlotti, B.; Benassi, E.; Barone, V.; Consiglio, G.; Elisei, F.; Mazzoli, A.; Spalletti,
A. Effect of the π Bridge and Acceptor on Intramolecular Charge Transfer in Push–Pull
Cationic Chromophores: An Ultrafast Spectroscopic and TD−DFT Computational
Study. ChemPhysChem 2015, 16, 1440−1450.
(81) Daudel, R.; Lefebvre, R.; Moser, C. Quantum Chemistry. Methods and Applications,
Interscience Publishers Inc., New York, 1959, Cap. IX.
(82) E. Benassi, B. Carlotti, M. Segado, A. Cesaretti, A. Spalletti, F. Elisei and V. Barone,
“Presence of Two Emissive Minima in the Lowest Excited State of a Push–Pull
Cationic Dye Unequivocally Proved by Femtosecond Up−Conversion Spectroscopy
and Vibronic Quantum−Mechanical Computations”, J. Phys. Chem. B, 2015, 119 (19),
6035−6040.
(83) Bartocci, G.; Spalletti, A.; Becker, R. S.; Elisei, F.; Floridi, S.; Mazzucato, U.
Excited−State Behavior of Some All−Trans−,−Dithienylpolyenes. J. Am. Chem.
Soc. 1999, 121, 1065−1075.
(84) Horng, M. L.; Gardecki, J. A.; Papazyan, A.; Maroncelli, M. Subpicosecond
Measurements of Polar Solvation Dynamics: Coumarin 153 Revisited. J. Phys. Chem.
1995, 99, 17311−17337.
(85) Bhaskar, A.; Ramakrishna, G.; Lu, Z.; Twieg, R.; Hales, J. M.; Hagan, D. J.; Van
Stryland, E.; Goodson III, T. Investigation of Two−Photon Absorption Properties in
Branched Alkene and Alkyne Chromophores. J. Am. Chem. Soc. 2006, 128,
11840−11849.
(86) Wang, H.; Zhang, H.; Rettig, W.; Tolmachev, A. I.; Glasbeek, M. Femtosecond
Dynamics of the S2 And S1 Fluorescence of Ionic Styryl Dyes in Polar Solvents. Phys.
Chem. Chem. Phys. 2004, 6, 3437−3446.
(87) Xu, C.; Webb, W. W. Measurement of Two−Photon Excitation Cross Sections of
Molecular Fluorophores with Data From 690 to 1050 nm. J. Opt. Soc. Am. B. 1996, 13,
481− 491.
(88) Abbotto, A.; Beverina, L.; Bozio, R. ; Facchetti, A.; Ferrante, C.; Pagani, G. A.;
Pedron, D.; Signorini, R. Novel heteroaromatic-based multi-branched dyes with
enhanced two-photon absorption activity. Chem. Commun. 2003, 2144−2145.

288
(89) Strehmel, B.; Sarker, A. M.; Detert , H. The Influence of ζ and π Acceptors on
Two−Photon Absorption and Solvatochromism of Dipolar and Quadrupolar
Unsaturated Organic Compounds. ChemPhysChem 2003, 4, 249−259.
(90) Adegoke, O. O.; Jung, I. H.; Orr, M.; Yu, L.; Goodson III, T. Effect of Acceptor
Strength on Optical and Electronic Properties in Conjugated Polymers for Solar
Applications. J. Am. Chem. Soc. 2015, 137, 5759−5769.
(91) Varnavski, O.; Goodson III, T. Ultrafast Exciton Dynamics in a Branched Molecule
Investigated by Time−Resolved Fluorescence, Transient Absorption, and Three−Pulse
Photon Echo Peak Shift Measurements. J. Phys. Chem. B 2004, 108, 10484−10492.

289
Appendix C. Two Photon Absorption Study of Low-Bandgap, Fully Conjugated Perylene
Diimide Thienoacene Perylene Diimide Ladder-Type Molecules
I conducted femtosecond fluorescence upconversion experiments in order to investigate
fluorescence decay dynamics of ladder-type molecules. This was in collaboration with the Yu
group.
The work in this chapter was accepted in Chemistry Materials (Chem. Mater.) with the title:
“Two Photon Absorption Study of Low-Bandgap, Fully Conjugated Perylene Diimide
Thienoacene Perylene Diimide Ladder-Type Molecules”
Zhengxu Cai, Ricardo J Vázquez, Donglin Zhao, Lianwei Li, Wai-yip Lo, Na Zhang, Qinghe
Wu, Bradley Keller, Audrey Eshun, Neranga Abeyasinghe, Halley Banaszak-Holl, Theodore
Goodson, III, and Luping Yu
Modifications were made to the manuscript to adapt it to the style of this dissertation.
References and supporting information of the manuscript are included in this chapter.
C.1 Abstract
A new series of donor-acceptor ladder-type molecules were synthesized via Scholl
reaction. These molecules contain up to 25-fused rings but still show good air stability and good
solubility. We found that the ring-fusing reaction is sensitive to the nature of the side-chain in
donor units. The molecular conformations were investigated by 2D NMR and DFT calculations.
The photo-physical properties were investigated and an intense intramolecular charge-transfer
was observed. All of the molecules exhibited two-photon absorption (TPA) activity and their

290
TPA cross-section shows a linear relationship with increasing conjugation length of the
thienoacene-PDI derivatives.
C.2 Introduction
The nature of excited states in organic molecules is what determines their numerous
optical properties such as energy transfer, electron transfer, light emission, photovoltaic effect,
two-photon absorption (TPA), singlet fission, and so on.1−6
However, rational design of organic
materials to achieve an excited state with tailored optical properties is still a significant
challenge.7,8
The control in the degree of electron delocalization on π-orbitals is an effective
approach to the modification of physical and optical properties of organic conjugated
molecules.9,10
In the past few decades, ladder-type materials have been continuously investigated
for their potential applications in organic electronics.11−13
Different types of structures have been
developed, ranging from all hydrocarbon polyacenes to systems containing heterocyclic aromatic
rings.14,15
In the past years, different polyacenes have been reported, but their stability, solubility,
and processability are major issues that prevent them from extensive exploration for
applications.16,17
Recently, we reported a novel method to synthesize conjugated heteroacenes
with excellent solubility in organic solvents due to the side chain modification. These molecules
were investigated via nonlinear optical techniques and were shown to exhibit a sizable TPA
cross-section.18−20
However, these materials are rather electron-rich and can be slowly oxidized
due to high HOMO energy level caused by fused thienyl units. The TPA cross-section was only
moderate because of their rather uniform structures that lack functionality necessary for
enhanced optical nonlinearity.21
In order to address these issues, we designed new molecules that
incorporated an electron withdrawing unit to the heteroacene cores. Recent studies also suggest
that the intra- and intermolecular interactions of the donor and acceptor moieties can modulate

291
the excited state properties.22−25
The D−A ladder-type structures lock the π systems into a planar
conformation that minimizes the bond twisting observed in linear conjugated structures, which
can offer an effective way to improve properties.26−32
In this paper, we report the synthesis,
characterization, electrochemical, and photophysical properties of these new ladder-type
oligomers. The compounds consisted of thienoacene derivatives (Dn) as the donor and perylene
diimide (PDI) as the acceptor. The PDI motif was introduced in order to further extend the
conjugation, stabilize the molecular structures due to its strong electron withdrawing property,
and modulate the optical and electronic properties. 2D NMR measurements and density
functional theory (DFT) calculation were used to investigate molecular structure and
conformation and the relationship between the structure and optical/electrical properties.
C.3 Results and discussion
C.3.1 Synthesis and characterization of the ladder-type molecules
A strategy was developed to synthesize the compounds (Scheme C.3.1). First, the Stille
coupling reaction was used to connect the heteroacenes derivative with the PDI units.
Photochemical reaction was attempted to form the cyclized product and failed. It was found that
Scholl reaction using ferric chloride can efficiently cyclize the heteroacenes derivatives with the
PDI units. The desired annulated compounds were obtained in high yields (>90%), if the side
chain was an alkyl group (Scheme C.3.2). Quinonoidal structure was formed with the same ring
fusing method for the compounds with alkoxy substituent (Scheme C.3.2).33
It was noted that
the electron rich substituent favors oxidative cyclodehydrogenation.34-35
Thus, the successful
cyclodehydrogenation of these fused-ring com-pounds with electron deficient PDI to the desired
product is an attractive outcome.

292
Scheme C.3.1. Synthetic route of fused ring molecules. (i) Pd2(dba)3, P(o-MePh)3; (ii) FeCl3.
Scheme C.3.2. Synthetic strategies of conjugated molecules.
NMR spectroscopic techniques were used to elucidate the molecular conformations of the
resulting compounds. Both 1D and 2D NMR experiments were carried out for the non-fused

293
systems for the sake of comparison and elucidation of the fully conjugated materials. It was
found that the non-fused ring compounds (3r, 5r and 9r in Scheme C.3.1) shows similar
chemical shifts in the aryl region (Figure C.3.1). The proton signal in benzodithiophene unit (e
in Figure C.3.1) and aryl gulf-facing protons (b) disappeared for the fused ring compounds,
while the other four gulf-facing protons (a and c) in PDI were down-shifted to ~10 ppm.26-28
All aryl protons in C3r and C9r experience a diatropic shift to low field after cyclization. The
chemical shifts of proton peaks d in C5r showed only a minor change compared with the
uncyclized version. NOESY spectra of C3r and C5r were obtained to explain these differences
(C9r showed strong tendency to form aggregation and a very weak 2D NMR signal). We found
that the NOESY spectra of C3r showed the Nuclear Overhauser Effect (NOE) between the CH2
in 2-ethylhexyl group (proton f) and proton a in the PDI core (Figure S4), indicating that two
proton nuclei are spatially close. A strong steric hindrance between the alkyl chains in
benzodithiophene (BDT) and the PDI cores causes twisted conformation for the C3r molecule
and the PDI moiety. The lateral hydrogen (proton d) in PDI thus shifted to low field, as observed
in other twisted structures.26,28,35
The C5r molecule showed only the cross peaks in that region in
NOESY spectrum (Figure S4), indicating the lack of sterically hindered interaction in the
molecule. As shown by density functional theory calculation, the molecule is highly planar, so
the and lateral hydrogen (proton d) and in PDI exhibited minimum change after cyclization, with
a dihedral angle of only 2.0o (Table C.3.1).

294
Figure C.3.1. NMR spectra of fused and non-fused compounds.
Density functional theory (DFT) calculations offer further confirmation that the fused
ring compounds C3r and C9r are twisted because the strong steric hindrance between the alkyl
chain in heteroacenes and PDI core. These results are in consistence with the NMR result
discussed above. A pictorial presentation of molecular structures and the LUMO and HOMO are
shown in Figure S5 and S6, respectively. The resulting energy levels are summarized in Table
C.3.1. It was found that the HOMO orbitals are mainly localized on thienoacene parts, while the
LUMO orbitals are localized on the PDI units (Figure S6). Both the HOMO and LUMO orbital,
to some degree, extend to the whole molecules in the fused ring system due to ring-fusing effect.
HOMOa
(eV)
LUMOa
(eV)
Bandgapb
(optb/cv
a/cal
c)
Dihedrald
QY.
(%) 1
(ps)
2
(ps)
TPA (GM)
440-460 nm 700-720
nm
C3r -5.90 -3.84 2.03/2.06/2.48 23.9o 13.5
18.
5 n/a
e 0.02 1.2
C5r -5.69 -3.82 1.86/1.87/2.22 2.0o 5.0 3.3 121.8 0.08 29.8
C9r -5.51 -3.78 1.77/1.73/2.02 28.6o 0.2 0.9 9.5 6.04 124.6
a Energy levels were calculated based on the respective onset oxidation and reduction potentials
of the ladder molecules with the following equations: LUMO = − (Eonset red – Eonset Fc + 4.8) eV,
HOMO = − (Eonset ox – Eonset Fc + 4.8) eV, Ferrocene (Fc) was used as inner reference which the
HOMO energy level was considered as -4.8 eV; b Based on the absorption spectra data;
c Based
on DFT calculations dDihedral angles between the PDI plane and adjacent thienoacene parts
based on DFT calculations; e
C9r
C5r
C3r
3r
5r
9r
a
a
a
a
c
d
d
d
b
b
c
c
e
e
d d
f
f

295
C3r shows mono-exponential decay behavior with an energy rising time of 120 fs.
Figure C.3.1.2. (a) Absorption spectra of ladder molecules; (b) CV of ladder molecules in
CHCl3.
C.3.2 Optical and electrical properties of the ladder type molecules
The absorption spectra of all molecules were shown in Figure C.3.1.2a. As expected, the
molar extinction coefficient increased as the conjugation of the BDT derivative units increased in
the region of 300-450 nm (Figure S8a). The peaks around 525 nm attributed to the PDI unit
gradually became weaker as the conjugation length increased. The absorption peak at 600-650
nm range was attributed to the charge transfer state between thienoacenes and PDI units. The
spectra of the fused ring series in this region exhibit higher intensity than the non-fused system,
suggesting a stronger intramolecular charge transfer in fused ring compounds (Figure. S7c).35, 36
Both the HOMO and LUMO energy levels were determined by cyclic voltammetry (vs. Fc/Fc+)
(Figure. C.3.1.2b), and the HOMO energy levels show an increase and LUMO a slightly
increase as the donor length increase because the large conjugation enhances the electron
donating abilities, resulting in narrowed bandgaps. All these trends are in agreement with those
obtained from theoretical calculation and optical measurements.
300 450 600 750
0
20
40
60
/1
03 L
mo
l-1 c
m-1
Wavelength(nm)
C3r
C5r
C9r
a
-2 -1 0 1 2
b
-1.50 -0.75 0.00 0.75 1.50
-30
0
30
60
Cu
rren
t(
A)
Voltage(V)
Cu
rren
t
Voltage(V)
C3r
C5r
C9r

296
The emission spectra of three ladder molecules were shown in Figure C.3.2a, in which
some of the emission peaks observed in thienoacenes and PDI were retained (Figure S8b). A
marked difference is that both the C3r and C9r showed emission peaks between 450 nm to 550
nm, while C5r showed no emission in that region. These emissions observed from the
thienoacene and PDI unit can be attributed to the twisted structures of the C3r and C9r and C3r
and C5r molecules retain the localized emission peaks observed in PDI. The main emission
peaks are red-shifted when the length of the thienoacene cores is extended. The emission peaks
at 600-700 nm are new and not observed in the emission spectra of thienoacenes alone nor in the
emission spectra of the PDI monomer (Figure S8b). Thus, the fluorescence decay dynamics at
600 nm can be attributed to the electronically coupled PDI and thienoacene charge transfer state.
Figure C.3.2. (a) Emission spectra of ladder molecules; (b) Fluorescence decay dynamic of
ladder molecules at ~ 600 nm emission.
In order to investigate this effect of extending the conjugation length of the thienoacene
core on the fluorescence decay dynamics, studies in time-resolved fluorescence up-conversion
was carried out.37-39
The dynamics of the C3r exhibited a rise time (Figure S9) of 120 fs before a
slower relaxation of the fluorescence at 18.5 ps, suggesting energy transfer from the BDT core to
the charge transfer state.40
Interestingly, the C3r molecule demonstrates the longest-lived mono-
0.0 1.5 3.0 4.5 6.0
0.0
0.3
0.6
0.9 b
No
rma
lize
d I
nte
nsi
ty
Time (ps)
C3r
C5r
C9r
IRF
400 500 600 700 800 900
0.0
0.3
0.6
0.9
1.2
No
rmali
zed
In
ten
sity
Wavelength (nm)
C3r
C5r
C9r
a

297
exponential emission (t1) while the lifetimes are gradually decreased (Table C.3.1) with
increasing of the conjugation length. The C5r shows a very long lifetime, t2 (Table C.3.1). This
can be attributed to the increased conjugation length and planar structure in the C5r system,
which will make the excited state more delocalized, thus increasing the t2 lifetime.41
From C3r to
C9r, the conjugation length is increased, allowing an expanding excitation.From C3r to C9r, the
conjugation length is increased, allowing the excitation delocalization to occur throughout the
molecular system. This opens up many possible non-radiative relaxation channels causing the
quantum yield to gradually drop as the conjugation length is increased. The charge transfer from
the thienoacene core to the PDI core may quench the fluorescence of the molecule as the electron
donating abilities increase.42
The trend in the lifetimes is consistent with the observed trend in
the quantum yield values for the three fused ring systems with the quantum yield of the C3r
being 13.5% and that of C9r approaching <0.2% (Table C.3.1).
Figure C.3.3. (a) Two photon emission spectra of ladder molecules; (b) Power dependence of
the two-photon-excited emission of ladder molecules at ~ 720 nm.
Efficient charge delocalization and charge transfer due to increase in conjugation have
been previously documented and can be investigated using the TPA technique.43
Specifically, a
proportional relationship between the TPA cross-section and increasing the conjugation length
(π-orbitals) of the thienoacenes core has been reported.18
However, the TPA properties will
450 525 600 675 7500.0
0.3
0.6
0.9
1.2
C3r
C5r
C9r
No
rma
lize
d I
nte
nsi
ty
Wavelength (nm)
a
0.4 0.8 1.2 1.6 2.0
1.5
3.0
4.5
6.0 C3r
C5r
C9r
Coumarin 307
Lo
g (
Em
issi
on
In
ten
sity
)
LogP (mW)
b

298
significantly be changed in these molecules with electron deficient PDI units fused. The minor
440-460 nm two-photon emission band is attributed to the respective emissive relaxation process
from the thienoacenes core while the 700-720 nm two photon emission is attributed to the
thienoacene-PDI charge transfer state. As expected, the compounds showed an enhancement in
the TPA cross-section proportional to the length of the thienoacene-PDI cores (Table C.3.1). It
has been also documented that a TPA cross-section enhancement can be achieved by the
incorporation of an electron withdrawing groups such as a trivalent boron group.44-45
The data
suggest that both the extension in the conjugation length of the thienoacene and the addition of
an electron withdrawing group can enhance the TPA cross-section. However, it is clear that
enhancing the delocalization in the thienoacene units exhibited more profound effect in the TPA
cross-section than merely adding the acceptor unit. The TPA cross-section is strongly associated
with the charge transfer character of the material.18
A large internal polarization of a molecule
suggest a better optical nonlinearity, thus larger TPA effect.
C.4 Conclusions
A series of A-D-A conjugated molecules based on heteroacenes were designed,
synthesized, and characterized. To avoid dealkylation/oxidation reaction, the Scholl reaction
using ferric chloride as oxidant was used to the synthesis of annulated compounds. Optical and
electrochemical characterization of these ladder-type molecules indicated intramolecular charge
transfer states between the donor and the acceptor units, which was corroborated with the ultra-
fast optical measurements. All of the materials exhibited good TPA activity. The results indicate
that the ladder type A-D-A structures can enhance the TPA cross-section of the heteroacene
derivatives. These molecules are of interest for further exploration in electrical and optical

299
properties, such as their applications in photovoltaic devices due to their internal charge transfer
properties.
C.5 Experimental Section
C.5.1 Materials and Characterization Techniques
All of the chemicals were purchased from Aldrich. All reagents purchased commercially
were used without further purification except for toluene and tetrahydrofuran (THF), which were
dried over sodium/benzophenone. 1H NMR and 13C NMR spectra were recorded on a Bruker
DRX-400 spectrometer and Bruker DRX-500 spectrometer with tetramethylsilane as an internal
reference. High Resolution MALDI-TOF spectra were recorded on Bruker Solarix 9.4T.
Compound 2-4 (Scheme S1) were synthesized according to the procedures developed in our
lab18-20
.
Synthesis of Compound 3r: To a round-bottom flask equipped with a condenser was added 1
(530 mg, 0.64 mmol), 2 (215 mg, 0.29 mmol), Pd2(dba)3 (26 mg, 0.03 mmol) and P(o-MePh)3
(43 mg, 0.12 mmol). The system was evacuated and refilled with N2 three times, then charged
with toluene (50 ml). The reaction mixture was refluxed under N2 for 16 hours. After cooling to
room temperature, the reaction mixture was concentrated under reduced pressure. The residue
was purified by column chromatography with hexane and CH2Cl2 (1:1, v/v) as the eluent.
Compound 3r was obtained as a red solid (422 mg, 75.8% yield). 1H NMR (CD2Cl4 353K
ppm): δ 8.86 (s, 2H), 8.77-8.67 (m, 8H), 8.42 (d, J = 10, 2H), 8.25 (d, J = 10, 2H), 7.72 (s, 2H),
5.24-5.15 (m, 4H), 3.22-3.09 (m 4H), 2.30-2.22 (m, 8H), 2.01-1.92 (m, 10H), 1.40-1.28 (m,
80H), 0.92-0.86 (m, 30H), 0.77 (t, J = 7.5, 6H). 13C NMR (CDCl3, ppm): δ 164.7, 164.3, 163.7,
163.5, 144.4, 139.5, 139.01, 139.4, 137.9, 137.8, 136.9, 136.1, 135.0, 134.2, 131.8, 131.5, 131.1,
130.8, 130.1, 130.0, 129.2, 129.1, 128.1, 127.5, 124.1, 123.7, 123.4, 123.0, 122.7, 122.2, 122.0,

300
54.9, 54.7, 40.3, 38.4, 32.4, 31.8, 31.8, 29.3, 29.2, 28.8, 27.0, 26.9, 23.0, 22.6, 22.6, 14.1, 14.1,
14.0, 11.1. High Resolution MALDI-TOF: calcd for [C126H158N4O8S2]-, 1919.15266, found,
1919.15098. Elemental analysis: calcd. for C126H158N4O8S2: C, 78.79; H, 8.29, N, 2.92, S,
3.34; found: C, 78.66; H, 8.38, N, 2.97, S, 3.14.
Synthesis of Compound 5r: To a round-bottom flask equipped with a condenser was added 1
(462 mg, 0.55 mmol), 3 (215 mg, 0.25 mmol), Pd2(dba)3 (26 mg, 0.03 mmol) and P(o-MePh)3
(43 mg, 0.12 mmol). The system was evacuated and refilled with N2 three times, then charged
with toluene (40 ml). The reaction mixture was refluxed under N2 for 16 hours. After cooling to
room temperature, the reaction mixture was concentrated under reduced pressure. The residue
was purified by column chromatography with hexane and CH2Cl2 (1:1, v/v) as the eluent.
Compound 5r was obtained as a red solid (403 mg, 78.4% yield). 1H NMR (CD2Cl4 353K
ppm): δ 8.82 (s, 2H), 8.76-8.66 (m, 8H), 843 (d, J = 8.5, 2H), 8.27 (d, J = 8.5, 2H), 7.67 (s, 2H),
5.22 (m, 2H), 5.15 (m, 2H), 3.30 (m, 4H), 2.31-2.22 (m, 10H), 1.97-.90 (m, 8H), 1.50-1.20 (m,
80H), 0.92-0.87 (m, 30H), 0.76 (t, J = 11, 6H). 13C NMR (CDCl3, ppm): δ 164.7, 164.5, 163.6,
163.3, 147.0, 141.8, 139.0, 137.1, 136.3, 135.1, 135.0, 134.1, 133.8, 133.1, 131.8, 131.5, 130.8,
130.1, 129.9, 129.1, 129.0, 128.7, 127.5, 124.1, 123.7, 123.4, 122.9, 122.7, 122.3, 119.9, 54.9,
54.7, 39.1, 39.0, 32.8, 32.4, 31.8, 31.8, 29.7, 29.2, 28.7, 27.0, 23.0 22.6, 22.6, 14.1, 14.0, 13.9,
11.2. High Resolution MALDI-TOF: calcd for [C130H158N4O8S4]-, 2031.09680, found,
2031.09616. Elemental analysis: calcd. for C130H158N4O8S4: C, 76.81, H, 7.83, N, 2.76, S,
6.31; found: C, 77.00; H, 7.90, N, 2.80, S, 6.13.
Synthesis of Compound 9r: To a round-bottom flask equipped with a condenser was added 1
(240 mg, 0.29 mmol), 4 (198 mg, 0.13 mmol), Pd2(dba)3 (12 mg, 0.01 mmol) and P(o-MePh)3
(14 mg, 0.04 mmol). The system was evacuated and refilled with N2 three times, then charged

301
with toluene (40 ml). The reaction mixture was refluxed under N2 for 16 hours. After cooling to
room temperature, the reaction mixture was concentrated under reduced pressure. The residue
was purified by column chromatography with hexane and CH2Cl2 (1:1, v/v) as the eluent.
Compound 9r was obtained as a solid (323 mg, 91.7% yield). 1H NMR (CDCl3 ppm): δ 8.87 (s,
2H), 8.72 (m, 8H), 8.39 (s, 2H), 8.20 (d, J = 7.5, 2H), 7.76 (s, 2H), 5.23 (s, 2H), 5.15 (s, 2H),
3.60-3.27 (m, 12H), 2.47 (s, 2H), 2.38 (s, 2H), 2.30 (s, 4H), 2.24 (s, 4H), 2.13 (s, 2H), 1.98 (s,
4H), 1.90 (s, 4H), 1.73-1.33 (m, 108H), 1.08-0.89 (m, 64H). 13C NMR (CDCl3, ppm): δ 164.7,
163.7, 144.0, 142.1, 141.5, 140.1, 137.6, 136.8, 136.1, 135.0, 134.0, 133.8, 132.3, 131.8, 130.6,
130.3, 129.9, 129.1, 128.8, 128.5, 128.1, 127.3, 123.7, 123.4, 122.9, 122.0, 54.9, 54.7, 40.1, 39.8,
39.4, 38.8, 37.9, 31.8, 29.2, 27.0, 23.2, 22.6, 22.6, 14.1, 14.1, 11.2, 11.0. High Resolution
MALDI-TOF: calcd for [C174H226N4O8S6]+, 2091.57195, found, 2091.57202. Elemental
analysis: calcd. for C174H226N4O8S6: C, 77.57; H, 8.46, N, 2.08, S, 7.14; found: C, 77.72; H,
8.51, N, 2.09, S, 6.95.
Synthesis of Compound C3r: A solution of FeCl3 (676 mg, 4.17 mmol) in 2 ml nitromethane
was added dropwise to a stirred solution of compound 3r (400 mg, 0.21 mmol) in 10 ml CH2Cl2.
The reaction was stirred with argon. After stirring for 10 h at room temperature, 1 ml methanol
was added to the solution. The solvent was evaporated under reduced pressure, and the crude
product was filtered with silica gel with a large amount of CHCl3 to yield the solid product (367
mg, 92%).1H NMR (C2D2Cl4, ppm, 353 K): δ 10.01 (s, 2H), 9.84 (s, 2H), 9.42 (s , 4H), 9.13 (s,
4H), 5.50 (s, 4H), 4.11 (s, 4H), 2.38 (s, 8H), 2.01 (br, 10H), 1.45-1.14 (m, 78H), 0.93-0.72 (m,
38H). 13C NMR (CDCl3, ppm): δ 165.4, 164.1, 141.6, 140.1, 134.9, 133.7, 133.3, 131.9, 131.4,
129.4, 128.7, 127.7, 126.6, 125.7, 124.6, 124.4, 123.5, 122.9, 122.3, 122.0, 55.1, 39.6, 39.1, 32.6,
32.2, 31.8, 29.7, 29.3, 27.1, 22.6, 14.1, 10.8. High Resolution MALDI-TOF: calcd for

302
[C126H154N4O8S2]+, 1915.12026, found, 1915.12064. Elemental analysis: calcd. for
C126H154N4O8S2: C, 78.95; H, 8.10, N, 2.92, S, 3.35; found: C, 78.65; H, 8.11, N, 2.95, S,
3.51. Elemental analysis: calcd. for C130H154N4O8S4: C, 76.96, H, 7.65, N, 2.76, S, 6.32;
found: C, 77.12; H, 7.73, N, 2.80, S, 6.46.
Synthesis of Compound C5r: A solution of FeCl3 (319 mg, 1.97 mmol) in 2 ml nitromethane
was added dropwise to a stirred solution of compound 5r (200 mg, 0.10 mmol) in 8 ml CH2Cl2.
The reaction was stirred with argon. After stirring for 10 h at room temperature, 1 ml methanol
was added to the solution. The solvent was evaporated under reduced pressure, and the crude
product was filtered with silica gel with a large amount of CHCl3 to yield the solid product (180
mg, 90%).1H NMR (C2D2Cl4 ppm, 353 K): δ 9.88 (s, 2H), 8.82-8,70 (br, 10H), 5.51 (s 2H),
5.32 (s 2H), 3.76 (s, 4H), 2.61-2.21 (m, 18H), 1.55-1.42 (m, 82H), 1.09-0.86 (m, 34H). 13C
NMR (CDCl3, ppm): δ 164.6, 163.6, 142.6, 141.6, 134.2, 134.0, 131.7, 129.7, 129.1, 128.8,
128.7, 128.5, 128.0, 126.7, 125.8, 124.8, 124.4, 123.7, 123.2, 122.7, 122.2, 121.1, 55.7, 33.4,
32.4, 32.3, 32.2, 31.9, 30.3, 30.1, 29.7, 29.3, 29.1, 27.7, 27.2, 23.1, 23.0, 22.6, 14.4, 14.1. High
Resolution MALDI-TOF: calcd for [C130H154N4O8S4]+, 2027.06440, found, 2027.06477.
Elemental analysis: calcd. for C130H154N4O8S4: C, 76.96, H, 7.65, N, 2.76, S, 6.32; found: C,
77.12; H, 7.73, N, 2.80, S, 6.46.
Synthesis of Compound C9r: A solution of FeCl3 (240 mg, 1.48 mmol) in 2 ml nitromethane
was added dropwise to a stirred solution of compound 9r (200 mg, 0.07 mmol) in 8 ml CH2Cl2.
The reaction was stirred with argon. After stirring for 10 h at room temperature, 1 ml methanol
was added to the solution. The solvent was evaporated under reduced pressure, and the crude
product was filtered with silica gel with a large amount of CHCl3 to yield the solid product (187
mg, 94%). 1H NMR (C2D4Cl4, 353K, ppm): δ 10.22 (br, 2H), 9.83 (s, 2H), 9.42 (s, 4H), 9.16 (s,

303
4H), 5.46 (s, 4H), 3.99 (br, 12H), 2.10 (br, 12H), 1.84 (br, 10H), 1.48-0.92 (m, 172H). 13C NMR
(CDCl3, ppm): δ 165.5, 164.4, 131.9, 131.5, 129.2, 128.0, 127.6, 126.7, 124.6, 123.5, 122.5,
121.9, 55.0, 39.6, 39.4, 32.6, 32.2, 32.0, 31.9, 29.7, 29.3, 27.4, 27.1, 22.8, 22.7, 14.2, 14.1. High
Resolution MALDI-TOF: calcd for [C174H222N4O8S6]+, 2687.54684, found, 2687.54150.
Elemental analysis: calcd. for C174H222N4O8S6: C, 77.69, H, 8.32, N, 2.08, S, 7.15; found: C,
76.67, H, 8.42, N, 2.05, S, 6.97.
ASSOCIATED CONTENT
Supporting Information. Structural information for the com-pounds, TGA and DSC
measurements, NOESY and COSY NMR spectra, DFT calculation results, experimental details
for the pho-tophysical studies. This material is available free of charge via the Internet at
http://pubs.acs.org.
ACKNOWLEDGMENT
This work was mainly supported by NSF (DMR-1503852) and partially by NSF (DMR-
1263006). This work also benefited from NSF MRSEC at the University of Chicago.
AUTHOR INFORMATION
Corresponding Author
AUTHOR CONTRIBUTIONS
Z. Cai and R. Vázquez contributed equally to this work
References
(1) Demchenko, A. P.; Tang, K.-C.; Chou, P.-T. Excited-state proton coupled charge transfer
modulated by molecular structure and media polarization. Chem. Soc. Rev. 2013, 42, 1379-1408.

304
(2) Ito, A.; Shimizu, A.; Kishida, N.; Kawanaka, Y.; Kosumi, D.; Hashimoto, H.; Teki, Y.
Excited-state dynamics of pentacene derivatives with stable radical substituents. Angew. Chem.
Int. Ed. 2014, 53, 6715-6719.
(3) Goushi, K.; Yoshida, K.; Sato K.; Adachi, C. Organic light-emitting diodes employing
efficient reverse intersystem crossing for triplet-to-singlet state conversion. Nat. Photon. 2012, 6,
253-258.
(4) Zhao, D.; Wu, Q.; Cai, Z.; Zheng, T.; Chen, W.; Lu J.; Yu, L. Electron acceptors based on α-
substituted perylene diimide (PDI) for organic solar cells. Chem. Mater. 2016, 28, 1139-1146.
(5) Harpham, M. R.; Süzer, Ö.; Ma, C.-Q.; Bäuerle P.; Goodson, T. Thiophene dendrimers as
entangled photon sensor materials. J. Am. Chem. Soc. 2009, 131, 973-979.
(6) Sanders, S. N.; Kumarasamy, E.; Pun, A. B.; Steigerwald, M. L.; Sfeir, M. Y.; Campos, L. M.
Intramolecular singlet fission in oligoacene heterodimers. Angew. Chem. Int. Ed. 2016, 55,
3373-3377.
(7) Rosenberg, M.; Dahlstrand, C.; Kilså K.; Ottosson, H. Excited state aromaticity and
antiaromaticity: opportunities for photophysical and photochemical rationalizations. Chem. Rev.
2014, 114, 5379-5425.
(8) Würthner, F.; Saha-Mӧller, C. R.; Fimmel, B.; Ogi, S.; Leowanawat, P.; Schmidt, D.
Perylene bisimide dye assem-blies as archetype functional supramolecular materials. Chem. Rev.
2016, 116, 962-1052.
(9) Kang, H.; Kim, G.; Kim, J.; Kwon, S.; Kim, H.; Lee, K. Bulk-heterojunction organic solar
cells: five core technologies for their commercialization. Adv. Mater. 2016, 28, 7821-7861.
(10) Wu, J.-S.; Cheng, S.-W.; Cheng, Y.-J.; Hsu, C.-S. Donor–acceptor conjugated polymers
based on multifused ladder-type arenes for organic solar cells. Chem. Soc. Rev. 2015, 44, 1113-
1154.
(11) Liu, J.; Narita, A.; Osella, S.; Zhang, W.; Schollmeyer, D.; Beljonne, D.; Feng, X.; Müllen,
K. Unexpected scholl reaction of 6,7,13,14-tetraarylbenzo[k]tetraphene: selective formation of
five-membered rings in polycyclic aromatic hydrocarbons. J. Am. Chem. Soc. 2016, 138, 2602-
2608.
(12) Ip, H.-W.; Ng, C.-F.; Chow, H.-F.; Kuck, D. Three-fold scholl-type cycloheptatriene ring
formation around a tribenzotriquinacene core: toward warped graphenes. J. Am. Chem. Soc.
2016, 138, 13778-13781.
(13) Cai, Z.; Zhang, H.; Geng, H.; Liu, Z.; Yang, S.; Luo, H.; Jiang, L.; Peng, Q.; Zhang, G.;
Chen, J.; Yi, Y.; Hu, W.; Zhang, D. Thiepin-fused heteroacenes: simple synthesis, unusual
structure, and semiconductors with less anisotropic behavior. Chem. Eur. J. 2013, 19, 14573-
14580.
(14) Bunz, U. H. F. The larger linear N-heteroacenes. Acc. Chem. Res. 2015, 48, 1676-1686.
(15) Stępień, M.; Gońka, E.; Żyła, M.; Sprutta, N. Heterocyclic nanographenes and other
polycyclic heteroaromatic compounds: synthetic routes, properties, and applications. Chem. Rev.
2016, 117, 3479-3716.

305
(16) Narita, A.; Wang, X.-Y.; Feng, X.; Müllen, K. New ad-vances in nanographene chemistry.
Chem. Soc. Rev. 2015, 44, 6616-6643.
(17) Hammer, B. A. G.; Müllen, K. Dimensional evolution of polyphenylenes: expanding in all
directions. Chem. Rev. 2016, 116, 2103-2140.
(18) Zheng, T.; Cai, Z.; Ho-Wu, R.; Yau, S. H.; Shaparov, V.; Goodson, T.; Yu, L. Synthesis of
ladder-type thienoacenes and their electronic and optical properties. J. Am. Chem. Soc. 2016,
138, 868-875.
(19) Cai, Z.; Lo, W.-Y.; Zheng, T.; Li, L.; Zhang, N.; Hu, Y.; Yu, L. Exceptional single-
molecule transport properties of ladder-type heteroacene molecular wires. J. Am. Chem. Soc.
2016, 138, 10630-10635.
(20) Zheng, T.; Lu, L.; Jackson, N. E.; Lou, S. J.; Chen, L. X.; Yu, L. Roles of quinoidal
character and regioregularity in determining the optoelectronic and photovoltaic properties of
conjugated copolymers. Macromolecules 2014, 47, 6252-6259.
(21) Usta, H.; Risko, C.; Wang, Z.; Huang, H.; Deliomeroglu, M. K.; Zhukhovitskiy, A.;
Facchetti, A.; Marks, T. J. Design, synthesis, and characterization of ladder-type molecules and
polymers. air-stable, solution-processable n-channel and ambipolar semiconductors for thin-film
transistors via experiment and theory. J. Am. Chem. Soc. 2009, 131, 5586-5608.
(22) Cai, Z.; Guo, Y.; Yang, S.; Peng, Q.; Luo, H.; Liu, Z.; Zhang, G.; Liu, Y.; Zhang, D. New
donor–acceptor–donor molecules with Pechmann dye as the core moiety for solution-processed
good-performance organic field-effect transistors. Chem. Mater. 2013, 25, 471-478.
(23) Cai, Z.; Luo, H.; Chen, X.; Zhang, G.; Liu, Z.; Zhang, D. Extended conjugated donor–
acceptor molecules with E-(1,2-difluorovinyl) and diketopyrrolopyrrole (DPP) moieties toward
high-performance ambipolar organic semiconductors. Chem. Asian J. 2014, 9, 1068-1075.
(24) Cai, Z.; Luo, H.; Qi, P.; Wang, J.; Zhang, G.; Liu, Z.; Zhang, D. Alternating conjugated
electron donor–acceptor polymers entailing Pechmann dye framework as the electron acceptor
moieties for high performance organic semiconductors with tunable characteristics.
Macromolecules 2014, 47, 2899-2906.
(25) Sekita, M.; Ballesteros, B.; Diederich, F.; Guldi, D. M.; Bottari, G.; Torres, T. Intense
ground-state charge-transfer interactions in low-bandgap, panchromatic phthalocyanine-
tetracyanobuta-1,3-diene conjugates. Angew. Chem. Int. Ed. 2016, 55, 5560-5564.
(26) Zhong, Y.; Kumar, B.; Oh, S.; Trinh, M. T.; Wu, Y.; Elbert, K.; Li, P.; Zhu, X.; Xiao, S.;
Ng, F.; Steigerwald, M. L.; Nuckolls, C. Helical ribbons for molecular electronics. J. Am. Chem.
Soc. 2014, 136, 8122-8130.
(27) Chiu, C.-Y.; Kim, B.; Gorodetsky, A. A.; Sattler, W.; Wei, S.; Sattler, A.; Steigerwald, M.;
Nuckolls, C. Shape-shifting in contorted dibenzotetrathienocoronenes. Chem. Sci. 2011, 2, 1480-
1486.
(28) Nagarajan, K.; Mallia, A. R.; Muraleedharan, K.; Hari-haran, M. Enhanced intersystem
crossing in core-twisted aromatics. Chem. Sci. 2017, 8, 1776-1782.
(29) Yuan, Z.; Lee, S.-L.; Chen, L. Li, C.; Mali, K. S.; De Feyter, S.; Müllen, K. Processable
rylene diimide dyes up to 4 nm in length: synthesis and STM visualization. Chem. Eur. J. 2013,
19, 11842-11846.

306
(30) Yuan, Z.; Xiao, Y.; Yang, Y.; Xiong, T. Soluble ladder conjugated polymer composed of
perylenediimides and thieno[3,2-b]thiophene (LCPT): a highly efficient synthesis via
photocyclization with the sunlight. Macromolecules 2011, 44, 1788-1791.
(31) Kass, K.-J.; Forster, M.; Scherf. U. Incorporating an alternating donor-acceptor structure
into a ladder polymer backbone. Angew.Chem. Int. Ed. 2016, 55,7816-7820.
(32) Lee, J.; Kalin, A. J.; Yuan, T.; Al-Hashimi, M.; Fang, L. Fully conjugated ladder polymers.
Chem. Sci., 2017, 8, 2503-2521. (33) Both the fused and non-fused structures were observed in
the ring fusing process, the major product is non-fused ring product, details see supporting
information.
(34) Hilton, C. L.; Crowfoot, J. M.; Rempala, P.; King, B. T. 18,18′-
Dihexyl[9,9′]biphenanthro[9,10-b]triphenylene: construction and consequences of a profoundly
hindered aryl−aryl single bond. J. Am. Chem. Soc. 2008, 130, 13392-13399.
(35) Zhong, H.; Wu, C.-H.; Li, C.-Z.; Carpenter, J.; Chueh, C.-C.; Chen, J.-Y.; Ade, H.; Jen, A.
K.-Y. Rigidifying non-planar perylene diimides by ring fusion toward geometry-tunable
acceptors for high-performance fullerene-free solar cells. Adv. Mater. 2016, 28, 951-958.
(36) Yu, Y. W.; Li, Y. J.; Qin, Z. H.; Jiang, R. S.; Liu, H. B.; Li, Y. L. Designed synthesis and
supramolecular architectures of furan-substituted perylene diimide. J. Colloid Interface Sci.
2013, 399, 13-18.
(37) Badaeva, E.; Harpham, M. R.; Guda, R.; Süzer, Ö.; Ma, C.-Q.; Bäuerle, P.; Goodson, T.;
Tretiak, S. Excited-state structure of oligothiophene dendrimers: computational and experimental
study. J. Phys. Chem. B 2010, 114, 15808-15817.
(38) Furgal, J. C.; Jung, J. H.; Goodson, T.; Laine, R. M. Analyzing structure–photophysical
property relationships for isolated T8, T10, and T12 stilbenevinylsilsesquioxanes. J. Am. Chem.
Soc. 2013, 135, 12259-12269.
(39) Guo, M.; Yan, X.; Goodson, T. Electron mobility in a novel hyper-branched phthalocyanine
dendrimer. Adv. Mater. 2008, 20, 4167-4171.
(40) Yuan, M.; Durban, M. M.; Kazarinoff, P. D.; Zeigler, D. F.; Rice, A. H.; Segawa, Y.;
Luscombe, C. K. Synthesis and characterization of fused-thiophene containing naphthalene
diimide n-type copolymers for organic thin film transistor and all-polymer solar cell applications.
J. Polym. Sci., Part A: Polym. Chem. 2013, 51, 4061-4069.
(41) Ramakrishna, G.; Bhaskar, A.; Goodson, T. Ultrafast excited state relaxation dynamics of
branched donor-π-acceptor chromophore: evidence of a charge-delocalized state. J. Phys. Chem.
B 2006, 110, 20872-20878.
(42) Irie, M.; Sakemura, K.; Okinaka, M.; Uchida, K. Photochromism of dithienylethenes with
electron-donating substituents. J. Org. Chem. 1995, 60, 8305-8309.
(43) Bhaskar, A.; Ramakrishna, G.; Lu, Z.; Twieg, R.; Hales, J. M.; Hagan, D. J.; Van Stryland,
E.; Goodson, T. Investigation of two-photon absorption properties in branched alkene and alkyne
chromophores. J. Am. Chem. Soc. 2006, 128, 11840-11849.
(44) Alam, M. M.; Chattopadhyaya, M.; Chakrabarti, S.; Ruud, K. Chemical control of channel
interference in two-photon absorption processes. Acc. Chem. Res. 2014, 47, 1604-1612.
307
(45) Guo, L.; Wong, M. S. Multiphoton excited fluorescent materials for frequency upconversion
emission and fluorescent probes. Adv. Mater. 2014, 26, 5400-5428.
C.6 Supporting Information
C.6.1 Materials and Charcterization Techniques
1.
Their DFT calculation were performed at the level of B3LYP /6-31G** by using
Gaussian 09 in vacuum model. To facilitate the calculation, the heptylhexyl chains in PDI were
replaced with a methyl group, while the ethylhexyl groups in heteroacenes were replaced by
isobutyl to avoid missing the steric hindrance effect. Isovalue for printing the frontier molecular
orbitals was 0.02. Thermogravimetric analysis (TGA) (SDT Q600 TGA/DSC) measurements
were performed under a nitrogen atmosphere at a heating rate of 10 °C/min.
Cyclic voltammetry was used to study the electrochemical properties of these
compounds. They were measured as 10-3
M solutions in anhydrous CHCl3 containing 0.1 M
Bu4NPF6 as the electrolyte with Pt as the working electrode, Ag/Ag+ as the reference electrode,
and a Pt wire as the contrast electrode at a scan rate of 50 mV/s. For calibration, the redox
potential of ferrocene/ ferrocenium (Fc/Fc+) was measured under the same conditions and it was
located at 0.15 V vs Ag/Ag+. It was assumed that the redox potential of Fc/Fc
+ has an absolute
energy level of -4.80 eV relative to vacuum. Energy levels were calculated based on the
respective onset oxidation and reduction potentials of A-D-A molecules and their fused-ring
compounds with the following equations: LUMO = - (Eonset red - Eonset Fc + 4.8) eV, HOMO = -
(Eonset ox - Eonset Fc + 4.8) eV.
Steady-state absorbance spectra were measured using an Agilent 8432 UV−visible
absorption spectrophotometer in chloroform solutions. The emission spectrum measurements
were performed with a Fluoromax-2 spectrophotometer. Absorption spectra measurements were
308
taken before and after each measurement to ensure that there was no appreciable photo-
degradation during the fluorescence lifetime measurements or two-photon absorption. The
fluorescence quantum yields of the samples were calculated using a known procedure,1-2
and
Zinc Phthalocyanine in toluene (ϕ = 0.074) were used as the standard.3
The time-resolved fluorescence experiments were performed using a ultrafast
fluorescence Up-Conversion setup that had previously been described.4 Mode-locked Ti-sapphire
femtosecond laser (Spectra Physics Tsunami) was used to generate 80 fs pulses at 800 nm
wavelength with a repetition rate of 82 MHz. This mode-locked laser was pumped by a 532 nm
continuous light output from another laser (Spectra Physics Millennia), which has a gain medium
of neodymium-doped yttrium vanadate (Nd:YVO4). An excitation pulse of 400 nm was
generated by a second harmonic β- barium borate crystal, and the residual 800 nm beam was
made to pass through a computer-controlled motorized optical delay line. The polarization of the
excitation beam was controlled by a berek compensator. The power of the excitation beam varied
between 17 and 20 mW. The fluorescence emitted by the sample was up-converted by a
nonlinear crystal of β-barium borate by using the residual 800 nm beam, which had been delayed
by the optical delay line with a gate step of 6.25 fs. This procedure enabled the fluorescence to
be measured temporally. The monochromator is used to select the wavelength of the up-
converted beam of interest, and the selected beam is detected by a photomultiplier tube (R152P,
Hamamatsu, Hamamatsu City, Japan). The photomultiplier tube converts the detected beam into
photon counts, which can be read from a computer. Coumarin 30 and Cresyl violet dyes were
used for calibrating the laser. The instrument response function (IRF) has been determined from
the Raman signal of water to have a width of 110 fs.5 Lifetimes of fluorescence decay were

309
obtained by fitting the fluorescence decay profile with multi-exponential decay functions
convoluted with IRF in MATLAB and Origin 8.
Two-photon spectroscopy was performed using a mode-locked Ti : Sapphire laser which
is tunable from 700 to 900 nm delivering 110 fs output pulses at a repetition rate of 80 MHz
which pumps an OPAL optical parametric oscillator (OPO) lithium borate (LBO) crystal which
allows for 1.3 and 1.5 μm output excitations with output power of 200 mW. Emission scans were
performed at 800 nm excitation while scanning 415-760 nm emission, but the exact emission
detection wavelength during the power dependence scan was selected by the emission
wavelength that produced the highest number of counts at ~450 nm and ~715 nm. Coumarin 307
was used as the standard. Input power from the laser was varied using a variable neutral density
filter. Two-photon power-dependent fluorescence intensity was utilized to determine the two-
photon absorption cross section through the two-photon emission fluorescence (TPEF) method.6
Scheme CS1. Synthetic routes of quinoidal structure.
Synthesis of Compound 5: To a round-bottom flask equipped with a condenser was added 1 (177
mg, 0.21 mmol), 7 (75 mg, 0.09 mmol), Pd2(dba)3 (13 mg, 0.02 mmol) and P(o-MePh)3 (16 mg,

310
0.05 mmol). The system was evacuated and refilled with N2 three times, then charged with
toluene (40 ml). The reaction mixture was refluxed under N2 for 16 hours. After cooling to room
temperature, the reaction mixture was concentrated under reduced pressure. The residue was
purified by column chromatography with hexane and CH2Cl2 (1:1, v/v) as the eluent. Compound
5 was obtained as a red solid (152 mg, 86.9% yield). 1H NMR (CDCl3 ppm): δ 8.83-8.66 (m,
10H), 8.40 (d, J = 8 Hz, 2H), 8.27 (br, 2H), 7.56 (s, 2H), 5.25-5.17 (br, 4H), 4.30 (s, 4H), 2.28-
2.22 (br, 8H), 1.89-1.86 (br, 10H), 1.35-1.22 (m, 80H), 0.89-0.83 (m, 30H), 0.77 (t, J = 7 Hz,
6H). 13
C NMR (CDCl3, ppm): δ 164.8, 164.3, 163.7, 163.2, 147.9, 144.1, 138.4, 134.2, 133.5,
133.4, 131.3, 129.8, 129.2, 129.1, 128.1, 127.5, 125.8, 123.8, 122.9, 119.7, 129.0, 128.7, 127.5,
124.1, 123.7, 123.4, 122.9, 122.7, 122.3, 119.9, 76.1, 54.9, 54.7, 40.6, 32.4, 31.8, 31.8, 30.2,
29.2, 29.0, 26.9, 23.5, 23.0, 22.6, 14.1, 14.1, 14.0, 11.2. MALDI-TOF: calcd for
[C130H158N4O10S4], 2063.1, found, 2063.7.
Synthesis of Compound 6 and 8: A solution of FeCl3 (75 mg, 0.46 mmol) in 2 ml nitromethane
was added dropwise to a stirred solution of compound 5 (98 mg, 0.05 mmol) in 8 ml CH2Cl2.
The reaction was stirred with N2. After stirring for 10 h at room temperature, 1 ml methanol was
added to the solution. The solvent was evaporated under reduced pressure, and the residue was
purified by column chromatography with hexane and CH2Cl2 (1:3, v/v) as the eluent to obtain 6
(58 mg, 67%), then further with CH2Cl2 and MeOH (20:1, v/v) to obtain 8 (6 mg, 7%).
Compound 6: 1H NMR (CDCl3 ppm): δ 8.70-8.69 (m, 10H), 8.27 (d, J = 8.5 Hz, 4H), 7.66 (s
2H), 5.24-5.15 (br 4H), 2.29-2.22 (br, 8H), 1.89-1.85 (br, 8H), 1.36-1.24 (m, 64H), 0.86 (m,
24H). 13
C NMR (CDCl3, ppm): δ 173.7, 164.6, 164.3, 163.5, 163.2, 154.1, 145.1, 144.5, 138.3,
135.8, 135.0, 134.0, 133.9, 133.5, 132.0, 131.7, 131.4, 130.9, 130.0, 129.3, 129.1, 128.0, 127.3,
124.2, 123.9, 123.7, 123.4, 123.2, 54.9, 54.8, 31.8, 31.7, 29.2, 29.2, 26.9, 22.6, 14.1, 14.1.

311
MALDI-TOF: calcd for [C114H124N4O10S4], 1836.8, found, 1837.1. Compound 8: MALDI-TOF:
calcd for [C114H120N4O10S4], 1832.8, found, 1833.0.1H NMR was also measured in CD2Cl4 in
353 K, very weak signal was shown in aromatic region due to the poor solubility.
1. TGA analysis
0 200 400 600
0.0
0.3
0.6
0.9
1.2
Wei
gh
t
Temperature (oC)
C3r
C5r
C9r
0 100 200 300
C3r
C5r
C9r
Ex
oth
erm
Temperature (oC)
Figure CS1. TGA curves (left) of all compounds: heating rate: 10 oC /min. from 70
oC to 550
oC
under nitrogen atmosphere. Thermogravimetric analysis (TGA) reveals that both non-fused ring
and fused ring molecules are thermally stable up to 400 °C. DSC measurements (right) were also
performed on a DSC 2920 instrument. Samples (~5 mg) were annealed by heating to 300 oC at
20 oC/min, cooled to 0
oC at 20
oC/min, and then analyzed while being heated to 300
oC at 20
oC/min. No obvious melting peak was shown in the temperature window.
2. NMR spectra.
Figure CS2. Variable temperature 1H NMR spectra of 3r showing the split of proton a result
from hindered rotation of the asymmetry ethylhexyl groups

312
Figure CS3. COSY (up) and NOESY (down) spectra of 3r in 353 K in C2D2Cl4
C3r noesy

313
Figure CS4. NOESY spectra of C3r (up) and C5r (down) in 353 K in C2D2Cl4
3. DFT calculation
C3r
C5r
C9r
Figure CS5. Optimized geometry of ladder type molecules. To facilitate the calculation, the
heptylhexyl chains in PDI were replaced with a methyl group, while the ethylhexyl groups in
heteroacenes were replaced by isobutyl to avoid missing the steric hindrance effect.
HOMO LUMO
C3r
-5.87 eV -3.39 eV
C5r
-5.59 eV -3.37 eV
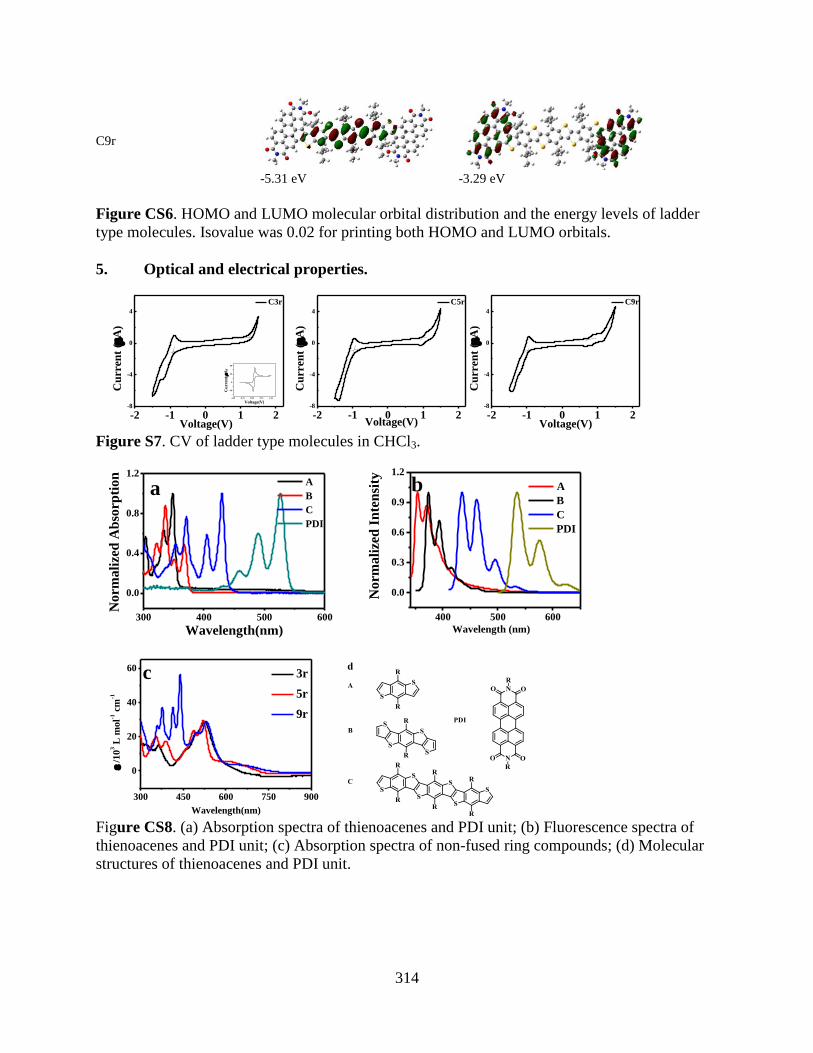
314
C9r
-5.31 eV -3.29 eV
Figure CS6. HOMO and LUMO molecular orbital distribution and the energy levels of ladder
type molecules. Isovalue was 0.02 for printing both HOMO and LUMO orbitals.
5. Optical and electrical properties.
Figure S7. CV of ladder type molecules in CHCl3.
300 400 500 600
0.0
0.4
0.8
1.2 A
B
C
PDI
No
rma
lize
d A
bso
rpti
on
Wavelength(nm)
a
400 500 600
0.0
0.3
0.6
0.9
1.2
A
B
C
PDI
No
rma
lize
d I
nte
nsi
ty
Wavelength (nm)
b
300 450 600 750 900
0
20
40
60
/1
03 L
mo
l-1 c
m-1
Wavelength(nm)
3r
5r
9r
c
Figure CS8. (a) Absorption spectra of thienoacenes and PDI unit; (b) Fluorescence spectra of
thienoacenes and PDI unit; (c) Absorption spectra of non-fused ring compounds; (d) Molecular
structures of thienoacenes and PDI unit.
-2 -1 0 1 2-8
-4
0
4
-1.50 -0.75 0.00 0.75 1.50
-30
0
30
60
Cu
rren
t(
A)
Voltage(V)
Cu
rren
t (
A)
Voltage(V)
C3r
-2 -1 0 1 2-8
-4
0
4
Cu
rren
t (
A)
Voltage(V)
C5r
-2 -1 0 1 2-8
-4
0
4
Cu
rren
t (
A)
Voltage(V)
C9r

315
Figure CS9. Energy rising component of the C3r at 600 emission wavelength.
C3r
C5r
C9r
Coumarin 307
0.4 0.8 1.2 1.6 2.00
1
2
3
4
5
Lo
g (
Em
issi
on
In
ten
sity
)
Log P (mW)
Figure CS10. Power dependence of the two-photon-excited emission of all molecules at ~ 440-
460 nm.
References
(1) Furgal, J. C., Jung, J. H., Goodson III, T. and Laine, R.M. Analyzing Structure–
Photophysical Property Relationships for Isolated T8, T10, and T12
Stilbenevinylsilsesquioxanes. Journal of the American Chemical Society. 2013, 135, 12259-
12269.
(2) Maciejewski, A. and Steer, R. P. Spectral and photophysical properties of 9, 10-
diphenylanthracene in perfluoro-n-hexane: the influence of solute—solvent interactions. Journal
of photochemistry. 1986, 35, 59-69.
(3) Adegoke, O. O., Ince, M., Mishra, A., Green, A., Varnavski, O., Martínez-Díaz, M. V.,
B uerle, P., Torres, T. and Goodson III, T. Synthesis and Ultrafast Time Resolved Spectroscopy
of Peripherally Functionalized Zinc Phthalocyanine Bearing Oligothienylene-ethynylene
Subunits. The Journal of Physical Chemistry C. 2013, 117, 20912-20918.
(4) Varnavski, O., Samuel, I. D. W., Pålsson, L. O., Beavington, R., Burn, P. L. and Goodson III,
T. Investigations of excitation energy transfer and intramolecular interactions in a nitrogen
corded distrylbenzene dendrimer system. The Journal of chemical physics. 2002, 116, 8893-
8903.
-0.5 0.0 0.5 1.0 1.5 2.0
0.0
0.2
0.4
0.6
0.8
1.0
No
rmal
ized
In
ten
sity
Time (ps)
C3r
IRF
Rising

316
(5) Flynn, D. C., Ramakrishna, G., Yang, H. B., Northrop, B. H., Stang, P. J. and Goodson III, T.
Ultrafast optical excitations in supramolecular metallacycles with charge transfer properties.
Journal of the American Chemical Society. 2010, 132, 1348-1358.
(6) Chi, C. Y., Chen, M. C., Liaw, D. J., Wu, H. Y., Huang, Y. C. and Tai, Y. A bifunctional
copolymer additive to utilize photoenergy transfer and to improve hole mobility for organic
ternary bulk-heterojunction solar cell. ACS applied materials & interfaces. 2014, 6, 12119-
12125.