How Distributed Instructional Leadership (DIL) Im - Deep Blue ...
264
Developing a Gini Coefficient for Distributed Instructional Leadership (GDIL): How Distributed Instructional Leadership (DIL) Impacts Instructional Reform Implementation and Professional Community in Elementary Schools by Sisi Chen A dissertation submitted in partial fulfillment of the requirements for the degree of Doctor of Philosophy (Educational Studies) in the University of Michigan 2016 Doctoral Committee: Professor Brian P. Rowan, Chair Associate Professor David M. Mayer Professor Carla O’Connor Associate Professor Donald Peurach
-
Upload
khangminh22 -
Category
Documents
-
view
3 -
download
0
Transcript of How Distributed Instructional Leadership (DIL) Im - Deep Blue ...

Developing a Gini Coefficient for Distributed Instructional Leadership (GDIL): How Distributed Instructional Leadership (DIL) Impacts Instructional Reform
Implementation and Professional Community in Elementary Schools
by
Sisi Chen
A dissertation submitted in partial fulfillment of the requirements for the degree of
Doctor of Philosophy (Educational Studies)
in the University of Michigan 2016
Doctoral Committee:
Professor Brian P. Rowan, Chair Associate Professor David M. Mayer Professor Carla O’Connor Associate Professor Donald Peurach

ii
DEDICATION
This dissertation is dedicated to my parents, Wendy Li and Xingsheng Chen.

iii
ACKNOWLEDGEMENTS
This dissertation is the culmination of the efforts and support of many people. I
would first like to express my special thanks to Professor Brian Rowan, my academic
advisor and mentor, without whom I would never have been able to accomplish all
these achievements. He not only served as an excellent guide who always inspired
intellectual curiosity and rigorous methodology, but also set a good example of what
is right with research in education. His enlightenment, support and patience guided
me throughout my entire graduate experience to the completion of this dissertation. I
also extend my gratitude to other members of my committee: Professor Carla
O’Connor, Professor David Mayer, and Professor Donald Peurach for their support
and guidance while I was completing my dissertation. Lastly, I would like to thank
my parents for their unconditional love and support. Without them I would never have
been able to survive the ups and downs of life.

iv
TABLE OF CONTENTS
DEDICATION .............................................................................................................. ii
ACKNOWLEDGEMENTS ...................................................................................... iii
LIST OF TABLES ..................................................................................................... viii
LIST OF FIGURES...................................................................................................... xi
LIST OF APPENDICES .......................................................................................... xiii
ABSTRACT ................................................................................................................ xv
CHAPTERS
I. INTRODUCTION................................................................................................. 1
Background ................................................................................................................ 1
Distributed Instructional Leadership (DIL)........................................................... 1
Comprehensive School Reform (CSR) ................................................................... 4
Problem ...................................................................................................................... 7
Purpose ..................................................................................................................... 10
Research Questions .................................................................................................. 13
Organization of Dissertation .................................................................................... 13
Significance of the Study ......................................................................................... 15

v
II. CONCEPTUALIZATON OF DISTRIBUTED INSTRUCTIONAL
LEADERSHIP (DIL) .......................................................................................... 17
Conceptualization of Distributed Leadership .......................................................... 18
Four Conceptions of Distributed Leadership: Definition, Measurement, and Effect
.............................................................................................................................. 18
Focus of My Study: Distribution of Leadership Functions .................................. 33
Conceptualization of Instructional Leadership Functions ....................................... 35
Integration: Distribution of Instructional Leadership Functions ............................. 37
III. MEASUREMENT OF DISTRIBUTED INSTRUCTIONAL
LEADERSHIP (DIL) .......................................................................................... 39
Measurement of Distributed Leadership .................................................................. 40
Average Leadership ............................................................................................. 41
Dispersed Leadership .......................................................................................... 45
Focus of My Study: Dispersed Leadership .......................................................... 54
Measurement of Instructional Leadership Functions ............................................... 55
Integration: Gini Coefficient for Distributed Instructional Leadership (GDIL) ...... 58
Estimation and Properties of Gini Coefficient (G) .............................................. 59
Unadjusted and Adjusted GDIL ........................................................................... 69
Application of GDIL to Leadership Functions .................................................... 76
IV. TOWARD A THEORY OF DISTRIBUTED INSTRUCTIONAL
LEADERSHIP (DIL) .......................................................................................... 80
Two Important Mediators between DIL and Instructional Improvement ................ 81

vi
Goal-Oriented Outcome: “Fidelity” to Instructional Regime ............................. 82
Organization-Oriented Outcome: Professional Community ............................... 85
Summary .............................................................................................................. 88
Theoretical Framework: Contingency Theory ......................................................... 88
DIL, Four School Contingencies and Two Outcomes ............................................. 91
Conceptual Model ................................................................................................ 91
Moderating Effect of Average Instructional Leadership (AIL) ............................ 94
Moderating Effect of Task .................................................................................... 97
Moderating Effect of Leader-Leader and Leader-Teacher Interaction ............. 102
V. DATA AND METHODS ................................................................................... 112
Data and Sample .................................................................................................... 112
Data Source: Study of Instructional Improvement (SII) .................................... 113
Instruments and Samples ................................................................................... 114
Measures ................................................................................................................ 121
Primary Variable of Interest: GDIL ................................................................... 121
Dependent Variables .......................................................................................... 127
Moderating Variables......................................................................................... 133
Other School- and Teacher-Level Covariates .................................................... 140
Methods and Models .............................................................................................. 142
“Fidelity” to Instructional Regime: Two-Level Hierarchical Generalized Linear
Models (HGLMs) ............................................................................................... 142
Professional Community: Three-Level Hierarchical Linear Models (HLMs) ... 148
Missing Data Analysis ........................................................................................... 154

vii
VI. RESULTS AND DISCUSSION ........................................................................ 160
Descriptive Characteristics of Schools and Teachers ............................................ 161
Correlations ............................................................................................................ 165
Conditional Effect of GDIL on “Fidelity” to Instructional Regime ...................... 166
Variance Decomposition .................................................................................... 166
Moderating Effect of Four Contingent Variables .............................................. 167
Summary of Results for “Fidelity” to Instructional Regime ............................. 179
Conditional Effect of GDIL on Professional Community ..................................... 180
Variance Decomposition .................................................................................... 180
Moderating Effect of Four Contingent Variables .............................................. 181
Summary of Results for Professional Community .............................................. 192
VII. CONCLUSIONS ............................................................................................... 193
Review of Results .................................................................................................. 193
Theoretical Contributions ...................................................................................... 196
Practical Implications ............................................................................................. 199
Limitations and Future Research ........................................................................... 200
Conclusions ............................................................................................................ 203
APPENDICES .......................................................................................................... 205
REFERENCES ......................................................................................................... 229

viii
LIST OF TABLES
TABLE
2.1 Definition, Measurement and Outcome of Distributed Leadership Theorized
in Four Ways ................................................................................................ 32
3.1 Comparison of Three Approaches to Measuring “Dispersed Leadership” .... 53
3.2 Comparison of Four Approaches to Calculating Gini Coefficient (G) .......... 67
5.1 Number of Logs Focusing on Comprehension and Writing across Grades . 120
5.2 Comparison of Means between Original Sample and Study Sample on
Teacher Demographic Characteristics ....................................................... 157
5.3 Comparison of Teacher Demographic Characteristics between Raw Data and
Imputed data............................................................................................... 159
6.1 Descriptive Statistics for School-Level Variables ....................................... 163
6.2 Descriptive Statistics for Teacher-Level Variables ..................................... 164
6.3 Two-Level HGLM Variance Decompositions for the Log Odds of Teachers
Being Classified Correctly ......................................................................... 167

ix
6.4 Between-School Model from HGLM Estimate of the Log Odds of Teachers
Being Classified Correctly as a Function of GDIL, Four Moderating
Variables and Other School and Teacher Characteristics ........................... 170
6.5 Three-Level HLM Variance Decompositions for Professional Community
.................................................................................................................... 181
6.6 Three-Level HLM Estimate of Professional Community as a Function of
GDIL, Four Moderating Variables and Other School and Teacher
Characteristics ............................................................................................ 185
7.1 Summary of Results of Analyses ................................................................. 196
B.1 Comparison of Leader Sample between Leader Protocol and School Leader
Questionnaire in Four Years ....................................................................... 208
D.1 Number of Schools by Leader Sample Size in Four Years ......................... 211
TD.2 Comparison of Descriptive Statistics between Unadjusted and Adjusted
GDIL .......................................................................................................... 212
D.3 Two-Level HLM Estimate of the Unadjusted and Adjusted GDIL as a
Function of Number of Leaders and Other School-Level Variables in Four
Years (N=109) ............................................................................................ 213
D.4 Comparison of Model Results between Unadjusted and Adjusted GDIL .. 214
F.1 Eigenvalues for Discriminant Functional Analysis ..................................... 217
F.2 Standardized Canonical Discriminant Function Coefficients Relating 21
Instructional Variables to Group Membership .......................................... 218

x
F.3 Functions at Group Gentroids ...................................................................... 218
K.1 Bivariate Correlation Matrix for School-Level Variables Included in the
HLM/HGLM Analysis ............................................................................... 225
L.1 Bivariate Correlation Matrix for Teacher-Level Variables Included in the
HLM/HGLM Analysis ............................................................................. 227

xi
LIST OF FIGURES
FIGURE
3.1 Control Graph ................................................................................................ 50
3.2 Lorenz Curve Indicating Gini Coefficient (G) ............................................... 61
4.1 Conceptual Model of the Relationship between “Equality” of DIL, Four
School Contingencies and Two School Outcomes ...................................... 93
4.1a Conceptual Model of the Relationship between “Equality” of DIL, Average
Instructional Leadership (AIL) and Two School Outcomes ........................ 97
4.1b Conceptual Model of the Relationship between “Equality” of DIL,
Organizational Task and Two School Outcomes ....................................... 102
4.1c Conceptual Model of the Relationship between “Equality” of DIL,
Leader-Leader Interaction and Two School Outcomes .............................. 107
4.1d Conceptual Model of the Relationship between “Equality” of DIL,
Leader-Teacher Interaction and Two School Outcomes ............................ 111
6.1 GDIL and AIL Predicting the Probability of Teachers Being Classified
Correctly .................................................................................................... 173
6.2 GDIL and Tasks Predicting the Probability of Teachers Being Classified
Correctly .................................................................................................... 176

xii
6.3 GDIL and Leader-Leader Interaction Predicting the Probability of Teachers
Being Classified Correctly ......................................................................... 178
6.4 GDIL and AIL Predicting Professional Community .................................... 188
6.5 GDIL and Leader-Teacher Interaction Predicting Professional Community
.................................................................................................................... 191

xiii
LIST OF APPENDIXES
APPENDIX
A. Study of Instructional Improvement Protocol for School Leader
Questionnaire: List of Positions ................................................................... 206
B. Comparison on Leader Sample between Leader Protocol and School Leader
Questionnaire ............................................................................................... 207
C. Variables for Measure of Instructional Leadership Functions ..................... 209
D. Comparison between Unadjusted and Adjusted GDIL in SII Data ............. 211
E. Instructional Variables for Measure of “Fidelity” to Instructional Regime in
Language Arts Teacher Logs ........................................................................ 215
F. Results for Discriminant Functional Analyses ............................................. 217
G. Professional Community Factor Scales ....................................................... 219
H. Leader-Leader and Leader-Teacher Interaction Factor Scales ..................... 221
I. School-Level Covariates .............................................................................. 222
J. Teacher-Level Covariates ............................................................................ 224

xiv
K. Correlation among School-Level Covariates ............................................... 225
L. Correlation among Teacher-Level Covariates ............................................. 227

xv
ABSTRACT
This dissertation examines the notion of school distributed instructional
leadership (DIL). Most discussions about distributed leadership focus on the “average
leadership” exercised by multiple roles or individuals to conceptualize and measure
the construct. However, scant attention has been paid to “dispersed leadership,” which
estimates the degree to which leadership is equalized (or decentralized) across
multiple roles or individuals. Nor does previous research provide a robust theory or
empirical evidence regarding the effects of “dispersed leadership,” either on
instructional improvement directly or conditional on certain features of school
context.
To address these gaps, I developed a quantitative measure for the “dispersed
leadership” of DIL — the Gini Coefficient for Distributed Instructional Leadership
(GDIL). The GDIL measures the degree of “equality” to which instructional
leadership functions are distributed across multiple roles or individuals. Then, using
contingency theory as a guiding framework, I developed a theory about the effects of
DIL on two school outcomes (i.e. “fidelity” to instructional regime and strength of
professional community), contingent upon four features of school context: average
instructional leadership [AIL], task, leader-leader interaction, and leader-teacher
interaction. Finally, I tested the theory empirically in a series of longitudinal,
multilevel models. My empirical inquiry regarding DIL was based on four-year
longitudinal data on 109 elementary schools that adopted one of three Comprehensive

xvi
School Reform (CSR) programs (i.e. America’s Choice [AC], Successful For All
[SFA] or the Accelerated Schools Project [ASP]). The findings indicated that the
influences of DIL on the two outcomes were conditional on the four school
contingencies. However, the conditional effects of DIL not only varied across the four
contingencies but also varied between the two outcomes.

1
CHAPTER I
INTRODUCTION
This dissertation examines the notion of school distributed instructional
leadership (DIL). The basic idea of distributed leadership is that leadership is
exercised by multiple actors at multiple levels of organization. My definition of DIL
is embedded in organizational functions designated to leaders (e.g., setting goals,
monitoring instruction, or developing staff). However, rather than covering a wide
range of leadership functions, I focus on those that are directly related to instruction.
Distributed leadership involved in instructional activities helps foster instructional
improvement (Spillane, Halverson, & Diamond, 2004) and maintain a school
environment conducive to instructional improvement (Leithwood, Patten, & Jantzi,
2010; Robinson, Lloyd, & Rowe, 2008). This is especially true for schools
undergoing large-scale improvements, in which multiple leaders provide multiple
sources of expertise and resources to support the implementation of instructional
innovations (Penuel, Frank, & Krause, 2010).
In this chapter, I first describe the background of my study on DIL. I then
provide a detailed discussion of the research focus of this dissertation, my specific
research questions, and the organization of the remainder of this dissertation. Finally,
I conclude with the significance of this dissertation

1
Background
In the following section, I discuss the background of my study on DIL. I first
provide a detailed account of the historical development of DIL in the leadership
literature. I then situate my discussion of DIL in the context of three widely-adopted
Comprehensive School Reform (CSR) programs, highlighting their focus on
distributed leadership to leverage planned instructional changes.
Distributed Instructional Leadership (DIL)
The rise of distributed leadership signifies a shift of attention in the leadership
literature from a singular actor to multiple actors to exercise leadership (Camburn et
al., 2003; Gronn, 2000; Harris & Spillane, 2008; Leithwood, Mascall, & Strauss,
2009). Past research on school leadership had focused exclusively on principals to
influence instruction. The contemporary notion, however, views leadership as an
emergent property distributed among multiple actors and across all hierarchical levels
in order to benefit organizations (Harris, 2013). The core idea of distributed
leadership is the exercise of leadership by multiple roles or individuals so that diverse
expertise and resources are drawn on to leverage instructional changes. However,
whether or not distributed leadership promotes instructional improvement is an open
empirical question yet to be addressed through context-specific inquiry.

2
The research has seen a long history of interest in the ability and practice at the
organizational apex to influence organizations. This perception was influenced by
theories of transformational and charismatic leadership (e.g., Bass, 1985; Conger &
Kanungo, 1998). These theories focus narrowly on the function of top leaders to
influence followers to do more work or perform better (Yukl, 2008). Similarly, the
study of educational leadership was dominated by the institutional theory of
loose-coupling, in which schools are perceived as fragmented and ineffective because
they lack bureaucratic or professional controls (Bidwell, 1965; Meyer & Rowan, 1978;
Weick, 1976). These theorists believed that one possible solution to the fragmentation
and ineffectiveness is strong leadership by principals. Thus the school leadership
literature was marked by an exclusive focus on the personal traits and behaviors of
school principals and how these could impact instructional improvement (e.g., Blasé
& Blasé, 1999a; Fink & Resnick, 2001; Hallinger, 2005; Marks & Printy, 2003; Riehl,
2000). It centered on the principal’s role as an instructional leader for a school’s
success (e.g., Bossert, Dwyer, Rowan, & Lee, 1982; Hallinger & Murphy, 1985;
Leithwood & Montgomery, 1982). As an instructional leader, the principal was
expected to focus on instruction-related activities such as defining instructional goals,
managing instructional programs, or promoting a positive learning climate (Heck &
Hallinger, 2005).
However, beginning in the mid-1980s, studies on school leadership showed a
shift of gaze from an individualist view of leadership to a more distributed one
(Camburn et al., 2003; Gronn, 2009; Heck & Hallinger, 2009; Spillane, 2006). This
approach advocated that other agents in schools, in addition to the principal, should be
included in the exercise of instructional leadership. This occurred primarily for two

3
reasons. First, with the rise of educational reforms such as site-based management,
teacher career ladders, and mentor teacher programs, more attention had been paid to
how teacher leaders, external agents, and other school administrators could influence
instructional improvement (Camburn et al., 2003). Second, the evidence showed that
strong principal instructional leadership was in short supply in most schools (Marks &
Printy, 2003). School principals faced numerous environmental, social, and
organizational distracters, resulting in a fragmented focus on instruction. The
expertise and resources of principals alone were severely limited in generating and
sustaining instructional improvement (Elmore, 2000; Gronn, 2002; Leithwood et al.,
2009; Spillane, Halverson, & Diamond, 2001).
The appeal of distributed leadership can be attributed to its effective response to
school complexities, which draw diverse expertise and resources from both formal
and informal dimensions of the school to leverage instructional changes (Leithwood
et al., 2009). Empirical evidence, though limited and sporadic, has shown that
distributed leadership promotes teacher commitment (Devos, Tuytens, & Hulpia,
2014; Hulpia, Devos, & Keer, 2009; Pounder, Ogawa, & Adams, 1995), teacher
capacity and motivation (Leithwood & Mascall, 2008), and professional communities
in schools (Leithwood et al., 2010). It also indicates the potential of distributed
leadership to improve student academic achievement (e.g., Friedkin & Slater, 1994;
Heck & Hallinger, 2009; Leithwood et al., 2010).
Despite some empirical efforts, few have focused on how school contexts
influence the effects of distributed leadership on instructional improvement. Whether
or not distributed leadership promotes instructional improvement is an open empirical
question yet to be addressed through context-specific inquiry. Distributed leadership

4
requires the facilitation and creation of the internal conditions in which it can thrive.
For example, if a school’s structure is bureaucratic and the culture is resistant to the
adoption of new forms of leadership, distributed leadership can hardly survive and
flourish. Alternatively, if the school’s structure is flexible and the culture is supportive
of new practices and ways of working, the effect of distributed leadership on school
changes might be stronger. The existing research, however, provides little insight into
what school contexts are the most appropriate for distributed leadership and what
practices strengthen its influence on instructional improvement. Thus a robust and
context-based theory about the effects of distributed leadership on instructional
improvement, anchored in large-scale empirical substantiation, needs to be
established (Harris, 2007).
Comprehensive School Reform (CSR)
In this dissertation, I base my investigation of DIL in the context of three
widely-adopted Comprehensive School Reform (CSR) interventions developed
between the late 1980s and mid 2000s (i.e. Accelerated Schools Project (ASP),
America’s Choice (AC) and Success for All (SFA)).1 The primary reason for my
focus on the three CSR models is that they use a common strategy — distributed
1 The proliferation of CSR models from the late 1990s to early 2000s occurred at an unprecedented rate, as evidenced by more than 600 CSR models enacted in the American school system (Rowan & Miller, 2007). In general, the CSR models intend to restructure school organizations and classroom instruction by employing a strategy of “improvement by design” (Cohen et al., 2013, p. 7). They bear two features: first, the models target the entire school rather than any particular populations within the school, and they are not restricted to any particular subjects, programs, or instructional methods (Desimone, 2002); second, sufficient support is provided for designing and implementing school change, which is “not [in] the form of distant legislative mandates,” but rather, “tangible and accessible support for school change rooted in research and literally packaged and delivered to each school” (Borman et al., 2003, p. 126).

5
leadership to generate school-wide changes, regardless of the variations in scope and
focus. However, studies on CSR programs have rarely focused on school distributed
leadership. Also, empirical evidence is scarce regarding how the CSR contexts affect
the influence of distributed leadership on planned instructional changes.
The design of CSR models is intended to improve America’s lowest-performing
elementary schools through research-based innovation strategies. These strategies are
developed by external reform design teams, often affiliated with universities,
nonprofit organizations, or companies (Borman, Hewes, Overman, & Brown, 2003;
Datnow, 2005). Although differing subtly in purposes, the three programs (i.e. ASP,
AC and SFA) were all “designed to foster synchronized, coordinated whole-school
changes based on a single, integrated package.” (Cohen, Peurach, Glazer, Gates, &
Goldin, 2013, p. 11)
The research on CSR programs has seen a shift of attention from principal
leadership to distributed leadership to facilitate the adoption and implementation of
CSR models. Past research has put an exclusive emphasis on the principal alone to
foster the implementation of CSR models (e.g., Leithwood & Montgomery, 1982;
Smith et al., 1998). However, recent evidence shows the importance of multiple
leaders to strengthen and sustain efforts toward instructional improvement in CSR
schools (e.g. Camburn et al., 2003; Datnow, 2005; Rowan, Camburn, & Barnes, 2004).
Multiple leaders share the management burdens of the principal so that the principal
can focus on the “core” technology of instruction. More importantly, multiple leaders
provide multiple sources of expertise and resources, which are essential to develop
and deliver the norms of the program to teachers and students, monitor
implementation processes, and provide professional development at all levels (Cohen

6
et al., 2013; Elmore, 2000; Harris, 2008; Smylie & Denny, 1990).
Thus many CSR models mandate the creation of new leadership roles. Multiple
leaders are then involved to exercise instructional leadership functions (Barnes et al.,
2004). For instance, in schools affiliated with the AC program, two more leadership
positions are added: a design coach and a literacy coordinator. The main tasks of the
design coach are to help the principal plan, organize and develop instructional
activities. The literacy coordinator focuses exclusively on assisting teachers with the
implementation of the early grades literacy curriculums. ASP programs designate one
or more ASP coaches, whose role is to guide, support, and facilitate the practice of
ASP principles and philosophy. In schools adopting the SFA program, the
newly-appointed reading facilitator is expected to monitor, evaluate and manage
instructional and administrative activities, and to provide professional assistance to
teachers (Camburn et al., 2003). Overall, in schools adopting any of the three
programs, leadership of instructional activities is distributed among a group of
formally-designated leaders including the principal, assistant principal, CSR coach
and other non-CSR affiliated instructional leaders (for details, see Camburn et al.,
2003)
However, empirical efforts to study CSR models have rarely focused on the
effects of distributed leadership on instructional improvement, let alone the manner in
which these effects are influenced by particular CSR school contexts. The CSR
contexts, in which school-wide structural and cultural changes happen, can have
significant effects on leadership practice. For instance, schools adopting the SFA
program highlight bureaucratic management controls under which teaching practices
strictly follow scripted instructional routines (Rowan et al., 2004). In this case,

7
distributed leadership might be less likely to occur and thrive. Conversely, distributed
leadership might be more likely to prosper in schools affiliated with the ASP program,
which allows for more flexible school cultures and climates. Moreover, AC schools
tend to place the most importance on a group of professional leaders to convey
standards and coach teachers on routines (Rowan & Miller, 2007). Distributed
leadership might be most likely to happen and flourish in AC schools. Therefore,
schools adopting varied CSR models are characterized by varied school contexts,
which can have varied influences on distributed leadership.
Based on the CSR contexts, I will develop a context-based theory on the effects
of distributed leadership on instructional improvement, and test the theory in a
large-scale empirical inquiry. I will investigate how the effects of distributed
leadership on school improvement are contingent upon the school contexts
characterized by varied CSR models.
Problem
Despite the substantial interest in distributed leadership in educational research,
confusion and inconsistency remain in several areas: 1) the definition of distributed
leadership; 2) the approach by which it is measured; and 3) the effect of distributed
leadership on instructional improvement. Rather than having a clear understanding of
distributed leadership, there are contending and sometimes contradictory perceptions
of what constitutes the construct and how it affects instructional improvement (Harris,
2007; Spillane & Diamond, 2007).
First, a singular and overarching definition of distributed leadership does not

8
exist. There are four primary conceptions of distributed leadership. 1) Distribution of
organizational control/influence across multiple individuals or levels in an
organization (e.g., Leithwood & Jantzi ,1998; Pounder et al., 1995). 2) Structure of
instrumental ties (e.g., advice-seeking ties) among social actors. This conception
focuses on whether and how social actors are more or less tied to others in an advice
network (e.g., Friedkin & Slater, 1994; Pitts & Spillane, 2009). 3) Distribution of
expertise across individuals or groups (e.g., Elmore, 2000; Youngs, 2009). “Expertise”
refers to the knowledge required to address the problems of instructional
improvement (e.g., pedagogy, curriculum, or evaluation). 4) Distribution of
organizational functions designated to leaders (e.g., setting goals, monitoring
instruction, or developing staff) across multiple individuals or levels (e.g., Camburn et
al., 2003; Hulpia et al., 2009a). Different conceptions of distributed leadership
highlight different dimensions of leadership (i.e. organizational influence,
instrumental ties, expertise, or leadership functions). However, the inconsistency in
definition has rendered the meaning of distributed leadership opaque (Harris, 2005). It
has also resulted in inconsistent findings on the effectiveness of distributed leadership
for instructional improvement. Thus distributed leadership needs to be more clearly
defined.
Additionally, the existing research lacks a strong measure of distributed
leadership in terms of “dispersed leadership.” In general, there are two primary
approaches to measuring the construct (i.e. “average leadership” vs. “dispersed
leadership”). “Average leadership” is the simple average of the leadership exercised
by multiple individuals or roles on the group level. “Dispersed leadership” measures
the degree to which leadership is equalized (or decentralized) across multiple

9
individuals or roles within the group. “Average leadership” estimates whether a group
displays a widely distributed pattern of leadership among multiple leaders. However,
“dispersed leadership” addresses what the pattern of leadership distribution is. While
the former focuses on the group’s overall strength of leadership, the latter highlights
the differentiation of leadership across roles or individuals within the group. Although
both approaches are important to understand distributed leadership, most empirical
efforts have given primary attention to “average leadership.” The current research
lacks a robust measure of “dispersed leadership.” Such a measure needs to be
developed so that distributed leadership can be examined in terms of both “strength”
and “dispersion.”
Finally, there is a paucity of research that has explored the manner in which
school contexts influence the effects of distributed leadership on instructional
improvement. As discussed earlier, the school contexts in which distributed leadership
is shaped either facilitate or inhibit the effectiveness of distributed leadership. Several
researchers have noted the importance of school contexts in the study of distributed
leadership (e.g., Conger & Kanungo, 1998; Harris, 2008; Mayrowetz, 2008; Woods,
2004). Nevertheless, none of them have developed a coherent theory about the effects
of school contexts on distributed leadership or attempted to empirically test the theory.
Whether distributed leadership promotes instructional improvement is still an open
empirical question to be addressed through context-specific inquiry. If distributed
leadership is to have any explanatory or predictive force, a strong and context-based
theory about the effects of distributed leadership, anchored in large-scale empirical
substantiation, needs to be established (Harris, 2007).
In summary, three problems need to be addressed for a better understanding of

10
distributed leadership. First, distributed leadership needs to be clearly defined. Second,
distributed leadership needs to be explored in terms of both the “strength” and
“dispersion” of leadership across multiple individuals or roles in order to draw
compelling conclusions about its effects on instructional improvement. That is to say,
we should not only be concerned about whether leadership has been widely spread
across multiple roles or individuals, but also about how equally it is dispersed across
them. Finally, we need a strong theory and empirical evidence regarding the effects of
distributed leadership on instructional improvement that also account for the ways in
which such effects are conditional on certain features of school context.
Purpose
This dissertation has three purposes:
1. To clarify the definition of DIL. I define DIL as distribution of an array of
leadership functions embedded in instructional leadership, which are exercised by
multiple roles or individuals. The concept of DIL emerges from the study of
instructional leadership. However, I expand it by integrating a distributed perspective
on leadership. The instructional leadership literature provides important insights into
the leadership functions that are essential to leverage instructional improvement (e.g.,
setting goals, monitoring instruction, or developing staff). However, the perception of
distributed leadership expands the idea by highlighting the importance of multiple
individuals or roles in performing these instructional leadership functions. Thus the
concept of DIL integrates both the instructional and distributed perspectives of
leadership.

11
2. To develop a quantitative measure of DIL in terms of “dispersed
Leadership.” I combine approaches to measuring both instructional leadership and
distributed leadership in order to create a measure of DIL. I identify four broad
instructional leadership functions (i.e. setting goals, monitoring improvement,
coordinating curriculums, and developing staff). These are expected to be distributed
across multiple individuals or roles. I measure the distribution of these four leadership
functions across multiple leaders based on the “dispersed leadership” approach. As
discussed earlier, existing research focuses primarily on “average leadership” to
measure the construct, while scant attention has been paid to “dispersed leadership.” I
fill this gap by developing a quantitative measure for “dispersed leadership” — the
Gini Coefficient for Distributed Instructional Leadership (GDIL). It is derived from
the idea of the Gini Coefficient (G), the best known measure for income and welfare
inequality (or equality) in economics (Hao & Naiman, 2010). GDIL estimates the
degree to which the four broad instructional leadership functions are “equally”
distributed across multiple leaders. While I focus on “dispersed leadership,” I include
both the “average” and “dispersed” perspectives in my empirical inquiry into DIL.
3. To develop a theory about the effects of DIL on two school
outcomes conditional on four features of school context; and to test the theory
empirically in a series of longitudinal multilevel models. I focus my inquiry into DIL
on two mediators that have long been found to link leadership practice to student
outcomes: “fidelity” to instructional regime and strength of professional community.
They are contrasting strategies to improve instruction. The former is a goal-oriented,
“programmed” approach that changes instruction by promoting conformity to a
well-defined set of instructional regimes, while the latter is a more

12
organization-oriented, “adaptive” approach that changes instruction by promoting
organizational health (Rowan & Miller, 2007, p. 254).
I hypothesize that DIL influences both approaches to instructional improvement.
However, its influence is contingent on the school contexts in which DIL is embedded.
Broad contingency theory provides the theoretical rationale for my study.
Contingency theorists believe that how an organization works is contingent upon its
task and environmental conditions, and that organizational design is effective to the
extent that it is appropriately “fit” to its task and environmental circumstances (e.g.,
Burns & Stalker, 1961; Simpson, 1985; Thompson, 1967). I used contingency theory
to identify four important school contingent factors: 1) average instructional
leadership (AIL) (i.e. school average instructional leadership functions excised by
multiple leaders); 2) the nature of a task (i.e. routine vs. non-routine); 3) the frequency
of interaction among leaders; and 4) the frequency of interaction between leaders and
teachers. I presuppose that the effectiveness of DIL for the two outcomes (i.e. “fidelity”
to instructional regime, and strength of professional community) is conditional on the
four school contingencies. My central hypothesis is that DIL has stronger positive
effects on these two outcomes in schools characterized by higher levels of AIL,
non-routine tasks, and more frequent leader-leader and leader-teacher interaction. By
contrast, DIL is less likely to contribute to the two outcomes in schools in which
modest AIL is exercised, routine tasks are undertaken, and leaders do not interact
frequently with other school members.

13
Research Questions
Based on a four-year longitudinal study of 109 elementary schools adopting one
of three leading Comprehensive School Reform (CSR) programs―the Accelerated
Schools Project (ASP), America’s Choice (AC) and Success for All (SFA), this
dissertation is anchored in the following two research questions:
1. Does the “equality” of DIL influence “fidelity” to planned instructional
regimes and strength of professional community in schools?
2. How are the influences of the “equality” of DIL conditional on four school
contingencies: 1) average instructional leadership (AIL); 2) the nature of
tasks; 3) the frequency of leader-leader interaction; and 4) the frequency of
leader-teacher interaction?
Organization of Dissertation
The dissertation unfolds as follows. In Chapter 2, I develop the concept of DIL.
I review the literature on the conceptualization of the distributed and instructional
perspectivea on leadership, respectively. I review and compare four different
conceptions of distributed leadership, but focus on one (i.e. distribution of leadership
functions) for my conceptualization of DIL. Finally, I integrate both the distributed
and instructional perspectives on leadership to develop the concept of DIL.
In Chapter 3, I create a quantitative measure of DIL. I review the literature on
measurement of the distributed and instructional perspective on leadership,
respectively. I identify two alternative approaches to measuring distribued leadership,
but focus on one (“dispersed leadership”) for my empirical inquiry regarding DIL. I

14
then discuss the four primary constructs of instructional leadership based on the
functional definition of it. Finally, I integrate the measurements of both perspectives
of leadership to develop a new quantitative measure for DIL (i.e. GDIL). This
measure estimates the degree to which instructional leadership functions are “equality”
dispersed across multiple roles or individuals.
In Chapter 4, I develop a theory about the effects of DIL on instructional
improvement. Following the “mediated-effect” model of leadership effects (Hallinger,
2008), I focus my investigation on two important “mediators” that have long been
found to link leadership practices to student outcomes (i.e. “fidelity” to instructional
regime and strength of professional community). I hypothesize that the school
contexts in which DIL is embedded impact its effectiveness for the two outcomes. I
then develop a list of hypotheses regarding how the effects of DIL are conditional on
four school contingencies (i.e. AIL, task, leader-leader interaction, and leader-teacher
interaction).
In Chapter 5, I describe the empirical study I conducted to address my research
questions and test my hypotheses. I provide a detailed account of the data sources and
the sample used in the study, followed by a discussion of the selection, construction,
and properties of the measures used in the research models. Finally, I conclude with a
detailed description of the research methods and statistical models applied for each
particular analysis used to explore my research questions.
In Chapter 6, I present the results of the analyses of my empirical study on DIL.
I report the findings separately for the two outcome variables. For each outcome, I
report separate results of the analyses for the four school contingencies regarding their
moderating effects on DIL.

15
Finally, in Chapter 7, I provide a conclusion to this dissertation. I articulate the
central findings, the high-level limitations and strengths of this study, and its
implications for school leadership theory and practice.
Significance of the Study
This dissertation has both theoretical interests and practical implications. It
integrates in a single study a broad array of theories. This includes those pertaining to
educational reform and improvement movements, economic inequality (equality)
concepts, organizational theories, and business policies and management strategies.
The multidisciplinary approach opens up multiple perspectives to illuminate school
leadership. It also provides fresh insights using methodologies from disciplines other
than education to explore the consequences of school distributed leadership. The
findings will have important implications for policy and practice.
This dissertation contributes to a better understanding of distributed leadership
both methodologically and theoretically. It adds a new perspective to the sparse
quantitative literature on “dispersed leadership” to approach distributed leadership. I
develop a new measure for “dispersed leadership” — not through mere borrowing,
but through careful transformation of an economic “inequality” (“equality”) index to
fit particular school contexts. More importantly, I develop a theory about the effects of
distributed leadership, anchored in large-scale empirical substantiation. Distributed
leadership is conceptualized for the first time as not only the “strength” but also the
“dispersion” of a wide array of leadership functions across multiple roles or
individuals. More importantly, it is conceptualized as situationally dependent. The

16
findings will be of interest to the ongoing concerns about how school conditions
strengthen or thwart the effectiveness of distributed leadership for instructional
improvement.
In addition to these scholarly contributions, the findings will advance the
understanding of policymakers and practitioners in their efforts to improve current
designs for instructional intervention or to promote a school culture/climate. The
study will also serve as a warning to reformers who intend to rely on distributed
leadership as a lever for instructional improvement that distributed leadership alone is
not sufficient to foster instructional or school improvement. The ability to capitalize
on its potential is contingent on the school contexts in which distributed leadership is
shaped. While reformers attempt to seek more equal distribution of leadership, they
must also be cautious about the contexts which may/may not provide the ground for it
to flourish. However, at the same time, they should be cautious regarding the
variations in features of school context and the targets of change they intend to foster.
Finding a good “match” between leadership practice, school context and the target of
change enhances the chances that leadership will successfully improve schools;
otherwise, the anticipated effects might be null or even counterproductive.

17
CHAPTER II
CONCEPTUALIZATON OF DISTRIBUTED INSTRUCTIONAL
LEADERSHIP (DIL)
The concept of distributed instructional leadership (DIL) emerges from the
study of instructional leadership. However, I expand it by integrating a distributed
perspective into it. I define DIL as distribution of an array of leadership functions
embedded in instructional leadership, which are exercised by multiple role or
individuals. The instructional leadership literature sheds light on the leadership
functions essential to foster instructional improvement (e.g., setting goals, monitoring
improvement, or developing staff). However, the integration of the distributed
perspective on leadership highlights the importance of multiple individuals or roles to
exercise these instructional leadership functions.
As DIL is a synthesis of the concepts of both instructional and distributed
perspectives on leadership, in this chapter, I provide separate discussions on these two
perspectives. I provide detailed analyses of the definition, measurements and
empirical findings for both distributed leadership and instructional leadership. I start
with a review and comparison of four existing conceptions of distributed leadership,
but focus on one (i.e. distribution of leadership functions) to define distributed
leadership. I then provide a detailed discussion on instructional leadership. Finally, I
integrate both perspectives on leadership to develop the concept of DIL.

18
Conceptualization of Distributed Leadership
Distributed leadership is a complex construct that has been conceptualized in
four ways. However, I focus on one to develop the concept of DIL. I first discuss the
definition, measurements and empirical findings of distributed leadership theorized in
four alternative ways. I then focus on the last conception, that is, the organizational
functions designated to leaders (e.g., setting goals, monitoring instruction, building
management) to conceptualize distributed leadership. I argue that in comparison to the
other three approaches, anchoring leadership in broad and diverse leadership
functions better captures the nature of leadership. This approach differentiates the
contents and purposes of leadership.
Four Conceptions of Distributed Leadership: Definition, Measurement, and
Effect
Leadership has been conceptualized in many different ways, resulting in
different conceptions of distributed leadership. In a review of a broad range of
literature, I identify four primary conceptions of leadership: organizational
control/influence, instrumental ties (e.g., advice-seeking ties) among social actors,
expertise, and leadership functions. Distributed leadership has been conceptualized
variously as the structure of instrumental ties among social actors, distribution of
organizational control/influence, distribution of expertise, or distribution of
leadership functions across multiple roles or individuals. In the following section, I
discuss the definition, measurements and empirical findings regarding distributed
leadership conceptualized in four ways (for details, see Table 2.1)

19
1. Distribution of control/influence
In this perspective, distributed leadership is conceptualized as the distribution
of interpersonal influence across multiple individuals or levels (Ogawa & Bossert,
1995; Pounder et al., 1995). The construct is often measured as the average (or total)
influence exercised by multiple individuals or levels at the group level. Empirical
evidence on school distributed influence shows inconsistent findings regarding its
effects on school outcomes.
Although nuanced differences exist between control and leadership,2
organizational control is often viewed as a feature of leadership (Hollander &
Offerman, 1990). The most widely-known interpretation of control is based on the
“human relations” approach, in which organizational control is conceptualized as
interpersonal influence in a variety of organizational activities (Tannebaum, 1968).3
The most common approach to measuring distribution of control/influence is the
average (or total) amount of interpersonal influence of multiple sources within an
organization or its sub-unit (e.g., Leithwood & Mascall, 2008; Pounder et al., 1995;
Tannenbaum, 1968). The measure reflects the degree to which influence is widely
spread across multiple individuals or levels. Typically, the measure is drawn from
questionnaires asking respondents about the amount of influence they (or other agents)
have exercised either in a general sense or over a variety of organizational activities.
Levels of control in the questionnaire range from zero to a great deal of influence
(e.g., on a scale of 1 to 5). The responses are averaged (or summed up) at the group or
organizational level (Tannenbaum, 1968).
2 While some researchers equate organizational control to influence or power (e.g., Etzioni, 1965; Ouchi, 1979), others argue that these concepts are subtly different (Hollander & Offerman, 1990). 3 For detailed discussions on how organizational control is manifested by influence, see e.g., Yukl, Falbe, & Youn, 1993; Yukl, Kim, & Chaves,1999; Yukl, Kim, & Falbe, 1996.

20
Studies have investigated the effects of “distributed influence” on school
improvement. However, they indicate inconsistent findings. While some have
discovered that average influence of multiple individuals or groups contributed to
instructional improvement, others have presented a less promising outlook. For
example, Pounder et al. (1995) measured distributed leadership based on the
organizational control graph approach (Tannenbaum, 1968). Using a Likert-type scale,
the instrument asked each respondent to rate the amount of influence various
individuals or groups (i.e. school administrators, teachers, secretaries, and parents)
had in a school. The average values across all items represented distributed influence.
The study revealed that the average influence exerted by the principal and teachers
was positively associated with organizational commitment, which then enhanced
student learning outcomes. Leithwood and Mascall (2008) used similar approach to
measuring distributed leadership. They surveyed 2,570 teachers from 90 elementary
and secondary schools. Their findings indicate that the average influence of the
principal, teachers and other school members promoted student achievement
indirectly by enhancing teacher capacity, teacher motivation and the school learning
environment.
However, a less rosy outlook is presented by Leithwood and Jantzi (1998), who
surveyed more than 2,700 teachers and 9,000 students in 110 elementary and
secondary schools in one large Ontario school district. The researchers found a
negative association between the average influence of all sources of leadership (e.g.,
principal, vice principal, department heads, teacher leaders, parents, and etc.) and
student engagement. They argue that such a negative association might be explained
by the complexity of communication and ambiguity of mission, resulting from

21
distribution of influence across multiple levels of school agents (Leithwood & Jantzi,
2000).
2. Structure of advice ties
Based on the social network theory, the second approach takes a relational or
social-environmental perspective to study leadership (for details, see Daly, 2010). In
this perspective, advice-seeking ties among social actors are the key levers for
distributed leadership. Leaders are conceptualized as key advice givers in the network.
Two primary concepts and tools are applicable to measure the structure of advice ties.
However, empirical studies are rare regarding how the structure of advice ties among
social actors influences school improvement.
A hallmark of the social network approach to understanding distributed
leadership is its emphasis on the structure of “ties” among social actors (e.g., Friedkin
& Slater, 1994; Mehra et al., 2006; Pastor & Mayo, 2002). According to social
network theory, social actors are connected via various types of ties to form a network
(e.g., friendship or contracts). The structure of the ties (i.e. shape of the network, and
the position of the actor within the network) is the key factor in determining actor
outcomes (Borgatti & Brandon, 2010). This social network perspective on distributed
leadership is concerned about whether and how social actors are more or less tied to
others in the network. The unit of analysis is each pair of actors who have ties (or
relationships) with each other in the network.
What are the ties? The ties can be any kind of dyadic relationships among social
actors, either directional or unidirectional. Borgatti and Brandon (2010) classified ties
into five specific types: 1) similarities (e.g., spatial/temporal proximity,

22
gender/ethnicity similarity); 2) social relationships (e.g., kinship, friendship); 3)
mental relationships (e.g., liking/disliking someone); 4) interaction (e.g., exchanging
emails), and 5) flow (e.g., ideas or resources transmitted through communication). In
most cases, researchers measured ties by asking questions on a presence/absence scale,
as in “who do you seek for advice.” Also, some measured the strengths of ties, as in
“how much do you like this person, on a 1 to 5 scale.” For interactions, frequencies
may be solicited, as in “how often did you turn to the person for advice, on a 1 to 5
scale?”
However, the key question is what ties best capture the nature of leadership. In
other words, in the study of distributed leadership, which ties should be counted as
leadership? The most common ties that have been identified to examine school
leadership are the advice-seeking ties (e.g., Friedkin & Slater, 1994; Spillane, Healey,
& Kim, 2003). Generally, researchers identified school leaders (formal or informal)
by whether or not they were key advice givers. They asked respondents “whom do
you seek for advice about…?” The advice ties among school members are key levers
for knowledge development as they facilitate the flow of instructional information
throughout the school (Daly, 2010). In this perspective, both the formally-designated
leadership roles and school members who are sought out for advice are considered
leaders (Spillane, Healey, & Kim, 2003).
Although the social network field is marked by many sophisticated concepts
and tools, two primary ones have been used to describe and distinguish the structure
of advice ties: density and centrality (or centralization).While the former is based on
an “ego” network, the latter is embedded in a “full” network (for details, see Balkundi

23
& Kilduff, 2006).4 Density is a group-level variable defining the proportion of all
dyads that have an advice tie. It is generally computed by the number of direct ties
divided by the total number of possible ties in the school (the total number of direct
ties is equal to n (n-1), where n is the number of individuals in the network) (e.g.,
Friedkin & Slater, 1994). It is seen as a measure of the cohesion of a network
(Borgatti & Brandon, 2010).
Another important measure is centrality or centralization. While centrality
captures an individual’s position at the sub-group network, centralization is an
estimate of the variability and dispersion of individual centrality on the group level.
Numerous measures have been developed to depict an individual’s centrality in an
advice network: i.e. degree, closeness, and betweenness centrality (for details, see e.g.,
Pastor & Mayo, 2002).5 For example, Spillane and his colleagues (2010) examined
how an individual’s position in the advice network in a subgroup affected the practice
of distributed leadership. They developed a measure of the degree centrality to
identify if a school member was a leader. Degree centrality was a count of the total
number of school members an individual had been sought out for advice (in-degree
ties). The researchers conceptualized leaders as those who had two or more advice ties
identified by their coworkers.
Centralization describes the shape of the distribution of advice-seeking ties in
the group (Borgatti, 2005). It captures the variability and dispersion of individuals’
centrality on the group level. It is generally measured based on the difference between
4 The ego network approach only selects a sample of focal groups, while the full network approach requires studying complete populations rather than samples (Borgatti & Brandon, 2010). 5 When using reciprocal ties, it is important to distinguish between out-degree ties (i.e. ties reported by the focal individual) and in-degree ties (i.e. ties reported by other group members about the focal individual).

24
one or a few highly central individuals and the others in the network. Complete
centralization is the case in which a single individual/subgroup in the center is
connected to every other individual/subgroup, and all the others have ties only to the
center. The opposite is true in a decentralized network, representing a wider spread of
direct ties (e.g., Pastor & Mayo, 2002; Zohar & Tenne, 2008). Centralization is often
calculated based on degree centrality. It is drawn from the differences in number of
ties (identified by others) between one or a few highly central individuals and the
others in the network. It is calculated by the sum of the differences between each
individual’s ties and the highest number of ties, divided by the maximum possible
sum of such differences, equaling (n – 1) (n – 2), where n is the number of individuals
in a network (e.g., Pastor & Mayo, 2002; Zohar & Tenne, 2008).
Empirical evidence is rare regarding how the structure of ties embedded in
leadership affects school outcomes. A study by Friedkin and Slater (1994) on
principal leadership is one example. The researchers found that both the principals’
centrality in advice networks and the density of teacher ties were associated with
improved student outcomes. However, the study was based on a small sample of 17
elementary schools. Such a small sample size raises a concern about the statistical
power of significance. A study by Spillane and his colleagues (2010) focused on
school distributed leadership. It provided important insights into school leadership
and management arrangements, especially the roles both formal and informal leaders
play in school changes. However, it did not probe further into how such leadership
arrangements affected instructional improvement. Thus the existing research lacks
strong empirical evidence regarding how distributed leadership embedded in social
ties influences instructional improvement.

25
3. Distribution of expertise
The third perspective takes an expertise-based approach to evaluate how
distributed leadership occurs (e.g., Elmore, 2000; Friedrich, Vessey, Schuelke, Ruark,
& Mumford, 2009). Distributed leadership is defined as the distribution of expertise
across multiple individuals or roles so that human capacity is maximized within a
group or organization. Multiple individuals who provide multiple sources of expertise
required for instructional improvement are considered to be leaders (Penuel, Frank, &
Krause, 2010). However, how “distributed expertise” can be measured and how it
affects school outcomes is largely unexplored.
In this perspective, school leadership is embedded in the bundled expertise
required for instructional improvement (e.g., pedagogy, mentoring, or staff
development). The key message is that sources of expertise, rather than role, are the
sources of school leadership (Youngs, 2009). The roles and activities of leadership
emerge from the expertise required for instructional improvement. Distributed
leadership is then a dynamic process in which the “selective use of expertise” is the
foundation (Friedrich et al., 2009). Thus leadership is only distributed to those who
hold expertise. In addition, individuals are selected to exercise leadership roles only
when their expertise is needed by the school on certain occasions and at certain points
in time (Friedrich et al., 2009).
Distribution of expertise is important to address the problems of instructional
improvement. Problems are diverse, including those pertaining to pedagogy and
curriculums, networking, mentoring, staff development, and etc. (Copland, 2003;
Duignan & Bezzina, 2006; Wenger, 2000). Thus a diverse set of expertise and skills is
needed to address different problems. This is especially true for large-scale

26
instructional improvements, in which instructional goals and tasks are complicated.
Distributing leadership to school members who possess different areas of expertise to
provide guidance and direction helps resolve these complications (Elmore, 2000).
The discussions on distributed leadership in the expertise definition are still
descriptive in nature. Analytical studies anchored in the knowledge of the effects of
distributed leadership are rare. In effect, I am unaware of any study that has created a
measure for distribution of expertise, or any empirical evaluation of its effects on
instructional improvement. More importantly, no research has explored how school
contexts affect the effectiveness of “distributed expertise.” However, researchers
caution that the potential of “distributed expertise” to leverage instructional
improvement is contingent upon many contextual factors. For example, “distributed
expertise” works better when people have more appreciation and trust of the expertise
of different roles (Elmore, 2000). It is also more effective in organizations with better
communication and network channels to access and exchange expertise (Friedrich et
al., 2009). Thus a mutually trusting and supportive school culture might help initiate
and maintain distribution of expertise, and vice versa (Bennett et al., 2003;
Mayrowetz, 2008; Woods, 2004). However, researchers have provided little empirical
evidence regarding how these contextual factors affect the effectiveness of
“distributed expertise.”
4. Distribution of leadership functions
In the final line of research, leadership is manifested in the performance of a set
of organizational functions designated to leaders (e.g., Devos et al., 2014; Heck &
Hallinger, 2009; 2010; Hulpia et al., 2009a; Leithwood et al., 2010). Distributed

27
leadership is then conceptualized as the distribution of an array of leadership
functions across multiple individuals or roles. The construct is often measured as the
average (or total) score of leadership functions exercised by multiple leaders at the
group level. Reserach has shown the potential of distributed leadership functions to
promote school conditions that are conducive to instructional improvement. However,
researchers caution that distributed leadership needs to be distinguished by types of
leadership functions (Hulpia et al., 2009a, 2009c).
School leadership functions are broad and diverse. Based on the seminal model
of Firestone and colleagues (for details, see Firestone, 1989; Firestone & Corbett,
1988; Heller & Firestone, 1995), Camburn et al. (2003) further categorized school
leadership functions into three broad areas: instructional leadership, building
management (e.g., dealing with discipline issues, or supervision of staff), and
boundary spanning (e.g., acquisition of resources, attendance in board meetings).
Leadership functions pertaining to management and boundary spanning can indirectly
contribute to instructional improvement. However, leadership functions embedded in
instructional leadership are most directly related to instruction (Marks & Printy, 2003).
These include framing and communicating the school’s goals, coordinating the
curriculum, monitoring instruction, developing staff, and etc. (Hallinger & Murphy,
1985).
The most common approach to measuring distributed leadership functions is
calculating the average (or total) score of leadership functions exercised by multiple
individuals or groups in the school. The measure estimates the degree to which
leadership functions are widely spread across multiple roles or individuals. Generally,
researchers draw responses from questionnaires asking respondents the extent to

28
which leadership functions are exercised either by themselves or by other school
agents over a range of school activities. For example, a study by Camburn and his
colleagues (2003) targeted the schools’ formally-designated leaders as respondents.
Leaders were asked about “how much priority and/or amount of time” they devoted to
specific leadership functions (e.g., communicating goals, monitoring progress, and
developing staff). The items were rated on a 5-point Likert-type scale (0 = never to 5
=always). Other studies have focused on teacher perceptions of leadership functions
exercised by multiple school leaders (e.g., the principal, teacher leaders, and school
improvement leaders). Teachers were asked to rate (on a Likert-type scale) the
individual leadership functions of each source of leadership. Exampled questions
include, “To what extent does leadership make collaborative decisions…;” and
“Leaders provide quality staff development opportunities…,” (Heck & Hallinger,
2009; Leithwood et al., 2010). Finally, responses were averaged (or summed) at the
group or school level.
Most empirical evidence shows that distributed leadership functions improve
learning outcomes indirectly by promoting better school conditions. This is consistent
with the findings of most studies on leadership effects on student learning, which are
found to be indirect, often mediated by people, structures, and processes in the school
(Hallinger, 2008; Hallinger & Heck, 1996; Heck & Hallinger, 2009). For instance, in
a four-year longitudinal study, Heck and Hallinger (2009) examined the impact of
distributed leadership functions on school improvement and student learning in 195
elementary schools in a Western state. They measured distributed leadership in the
average leadership (perceived by teachers) exercised by principals, teacher leaders
and other leaders leading improvement over a range of leadership functions (e.g.,

29
promoting collaborative decision makings, or shared accountability). Using multilevel
latent change analysis, they found significant direct effects of distributed leadership
on improvement of schools’ teaching environments (e.g., emphasis on standards,
sustained actions on improvement). In addition, distributed leadership indirectly
promoted students’ growth in math, mediated by improvement in the teaching
environment. Leithwood et al. (2010) used a similar approach to measuring
distributed leadership, surveying 1,445 teachers in 199 schools in a Canadian
province. By means of path modeling analyses, they found that distributed leadership
functions improved student math learning indirectly by contributing to professional
communities in schools.
However, the effects of distributed leadership were also found to vary by type
of leadership functions. Hulpia and his colleagues (2009a, 2009c) surveyed more than
1500 teachers in 46 secondary schools in Belgium. Distributed leadership was
measured as the average of leadership (perceived by teachers) exercised by principals,
assistant principals and teacher leaders in terms of supportive and supervisory
leadership functions. The researchers found mixed results: distributed leadership
functions relevant to providing vision and support to teachers promoted organizational
commitment; however, leadership functions embedded in monitoring and supervising
teacher activities jeopardized organizational commitment.
The findings of these studies illuminate our understanding of distributed
leadership. However, the emphasis on the overall strength of school leadership
functions ignores how leadership is differentiated across different roles or individuals
within the school. The measure of the distributed leadership construct is the
aggregated whole of leadership functions exercised at the group level. This approach

30
does not allow the results to provide direct insights into how leadership functions
should be distributed across different roles. Moreover, the effects of school conditions
on distributed leadership functions are unexplored. For example, the findings of Heck
and Hallinger’s (2009) study showed that distributed leadership and school conditions
had reciprocal effects on each other; they were mutually reinforcing. Thus we should
focus not only on the effectiveness of distributed leadership for school conditions, but
also on how school conditions are advantageous to the effectiveness of distributed
leadership.
Summary
As summarized in Table 2.1 below, there are four primary conceptual
frameworks for distributed leadership. Different conceptions of distributed leadership
focus on different dimensions of leadership. In the control/influence perspective,
leadership is equated to interpersonal influence among school members. Structure of
advice ties is based on the socio-environment dimension of leadership, while
distribution of expertise emphasizes the cognitive dimension of leadership. The
distributed leadership functions perspective differentiates the tasks or activities of
leadership by anchoring leadership in a set of organizational functions designated to
leaders.
Although there are several ways to measure distributed leadership, one similar
approach shared across most frameworks is to calculate “average leadership” (i.e.
total influence/leadership functions divided by the number of people, or total number
of direct ties divided by the total number of possible ties). “Average leadership”
estimates the degree to which leadership is widely spread across multiple individuals

31
or levels. The only exception to this pattern is distribution of expertise, and I am
unaware of any empirical study producing either measures of this construct or
information on its effects.
Empirical studies on distributed leadership illuminate how it indirectly affects
instructional improvement, mediated by supportive school conditions. However, two
questions remain: how does differentiation of leadership (i.e. equality) across different
roles and individuals influence school outcomes, and how are its influences
contingent upon school contexts?

32
Table 2.1 Definition, Measurement and Outcome of Distributed Leadership Theorized in Four Ways
Definition Author Measurement Outcome
Student achievement
Student engagement
Teacher commitment
Teacher capacity
Teacher motivation
School teaching environment
Distribution of influence
Pounder et al., 1995 Average influence Positive (indirect)
Positive
Leithwood & Mascall, 2008
Average influence Positive (indirect)
Positive Positive Positive
Leithwood & Jantzi, 1998, 2000
Average influence Negative
Structure of advice ties
Friedkin & Slater, 1994
Centrality of the principal & density of teacher ties
Positive (direct)
Spillane et al., 2010 Centrality (i.e. degree and betweeness)
Distribution of expertise
Elmore, 2000; Friedrich et al., 2009
None known as yet
Distribution of leadership functions
Heck & Hallinger, 2009, 2010
Average leadership functions
Positive (indirect)
Positive
Leithwood et al., 2010 Average leadership functions
Positive (indirect)
Positive
Hulpia et al., 2009a 2009c
Average leadership functions
Mixed (varied by types of leadership functions)

33
Focus of My Study: Distribution of Leadership Functions
Defining distributed leadership in terms of influence, advice ties or expertise
opens up opportunities for mapping multiple sources of leadership and integrating
both formal and informal constituents of an organization. However, drawbacks also
exist. In this study, I focus on the leadership-function definition to conceptualize DIL.
The primary drawback to perceiving leadership as influence is the possible
failure of influence to be counted as leadership. In reality, there is hardly any
individual who does not have some influence with others; yet, not all influence
necessarily constitutes leadership (Robinson, 2008). It is hard to distinguish particular
types of influence that count as leadership. Nor it is easy to distinguish influence from
other forms of relationships such as force, coercion and manipulation. As a result,
respondents at different hierarchical levels might have different interpretations of
influence, which can be difficult to distinguish when measuring qualitative differences
in respondents’ perceptions of influence (Gundelach & Tetzschner, 1976).
Similarly, the key question for the study of ties is which types of ties should be
counted as leadership. In leadership research, ties are usually measured by
instrumental ties (e.g., “seeking advice from”) (e.g., Spillane et al., 2008). However,
advice relations do not represent the entire range of leadership. The perspective
overlooks dimensions of leadership that are exercised indirectly. For instance, school
leadership often changes teacher practice by creating conditions that enable teachers
to think and act differently. The practice of this dimension of leadership might not
require direct interpersonal interaction/ties. Defining ties that capture the nature of
leadership is important in the measurement of ties. More precise conceptualizations

34
will allow for more precise measurement of ties, adding rigor and strength to the
methodology.
For distribution of expertise, the problem is more methodological than
theoretical. Inventing a measure for distribution of expertise is not an easy task. As
discussed earlier, distribution of expertise is not a fixed process. It is a dynamic
process in which the specialized expertise of individuals is selectively utilized.
Whether or not an individual will be selected as a leader depends on whether his/her
expertise is needed by the organization on certain occasions at certain points in time.
However, it is hard to know what expertise is needed for what task and on what
occasions. Given that it is unclear when and in what situation such needs emerge,
measurement will be quite complex and may involve assessing residual or post-hoc
indicators that distributed leadership has occurred. For example, we might need
measurements over time of how an individual is perceived as a leader in different
situations (Friedrich et al., 2009).
Overall, while the above three frameworks provide important insights into our
understanding of distributed leadership, they fail to capture the inherent nature and
distinguish the varying functions/tasks of leadership. In this study, I base my
exploration of distributed leadership on a set of organizational functions designated to
leaders, rather than on influence, advice ties or expertise. Anchoring leadership in
organizational functions differentiates the content and purposes of leadership. In my
attempt to forge a link between distributed leadership and instructional improvement,
it allows for a great deal more detail regarding how variation in tasks/activities makes
a difference.

35
Conceptualization of Instructional Leadership Functions
While school leadership functions are broad and diverse (e.g., instruction,
management, and boundary spanning), I focus on those that are embedded in
instructional leadership. The core idea of instructional leadership is that instructional
improvement is the priority for all school efforts and the foundation of all school
activities. Thus instructional leadership functions are narrowly defined as leadership
functions that are directly related to teaching and learning (Marks & Printy, 2003).6
Strong instructional leadership functions foster instructional changes and promote
better school environments. However, previous research focuses primarily on the
instructional leadership of principals. More research is needed on the broad exercise
of instructional leadership functions by multiple leaders.
The literature documents a number of notable models of instructional leadership
and a breadth of instructional leadership functions (e.g., Bossert et al., 1982; Camburn
et al., 2003; Hallinger, 2008; Hallinger & Murphy, 1985; Leithwood et al., 2006;
Leithwood & Montgomery, 1982; Robinson et al., 2008; Spillane, Halverson, &
Diamond, 2004).7 However different these models might be, they agree with the
fundamental elements of Hallinger and Murphy’s (1985) seminal model. Their model
includes three broad areas of instructional leadership functions: 1) defining the
school’s mission (i.e. framing the school’s goals and communicating the school’s
6 A broader view of instructional leadership functions also includes leadership functions that indirectly contribute to student learning (e.g., managerial behaviors) (Donmoyer & Wagstaff, 1990; Murphy, 1988). However, I take a narrow view and focus only on leadership functions that are directly related to instructional activities. 7 The concept of “instructional leadership” gained momentum in the 1980s, with the predominant attention on principal leadership to leverage instructional improvement (Bossert et al., 1982; Hallinger & Murphy, 1985; Leithwood & Montgomery, 1982). However, since the early 1990s there has been growing interest in other sources of instructional leadership, especially teacher leaders (Blasé & Blasé, 1999; Marks & Printy, 2003; Rowan, 1990).

36
goals); 2) managing the instructional program (i.e. coordinating the curriculum,
supervising and evaluating instruction, and monitoring student progress); and 3)
promoting a positive school learning climate (i.e. protecting instructional time,
providing incentives for teachers, providing incentives for learning, and promoting
professional development).
These instructional leadership functions are important forces to promote the
implementation of large-scale instructional changes. For instance, the faithful
implementation of CSR programs depends largely on the “specificity” of the
programs designed and delivered to teachers and students (Desimone, 2002; Rowan &
Miller, 2007). Research has shown that “specificity” is strengthened when
instructional leaders play important roles in clarifying the instructional goals to
teachers and students. Leaders’ monitoring and supervision of program
implementation also promotes “specificity” (e.g., Miller & Rowan, 2007). Moreover,
empirical evidence shows that instructional leaders who provide professional
development opportunities to teachers help update teachers’ knowledge of the change
process (Haynes, 1998) and address their specific problems in implementing changes
within their classrooms (Borman et al., 2003).
Additionally, these instructional leadership functions are found to develop a
school environment that is supportive of teaching and learning. For instance,
instructional leaders are found to initiate and facilitate professional community, which
is widely recognized as a valuable quality of school context to foster instructional
improvement (Marks & Louis, 1997; Smylie, 1994; Talbert, McLaughlin, & Rowan,
1993). Professional community highlights students’ academic success and teachers’
professional development as the central forces of all school activities (Louis & Marks,

37
1998; Stoll & Louis, 2007). Research shows that the instructional leadership of
principals has significant positive influence on components of schools’ professional
communities, such as teacher reflection and professional growth (Blasé & Blasé, 2000;
Youngs & King, 2002). Research also indicates that instructional leadership functions
spread widely among multiple leaders help build and sustain professional community
(e.g., McLaughlin & Talbert, 2007; Mulford & Silins, 2003; Stoll & Louis, 2007).
Nevertheless, researchers generally argue that valid and reliable empirical
evidence on the effect of instructional leadership on school outcomes is still limited
and sporadic (Heck & Hallinger, 2009). While previous studies on instructional
leadership have focused exclusively on principals, research on the broad exercise of
instructional leadership functions by multiple leaders is sparse (Camburn et al., 2003).
More importantly, what school contexts are needed to sustain effective instructional
leadership functions remains largely unexplored (Blasé & Blasé, 1999a).
Integration: Distribution of Instructional Leadership Functions
Having discussed both instructional and distributed perspectives on leadership,
I now integrate these ideas to develop the concept of DIL. I define distributed
instructional leadership (DIL) as distribution of leadership functions embedded in
instructional leadership, which are exercised by multiple individuals or roles.
Three things should be noted about my definition of DIL. First, leadership is
anchored in diverse and broad organizational functions designated to leaders, rather
than in influence, ties or expertise. Second, as the “core” technology of schools is
instruction, I focus exclusively on leadership functions involved in instructional

38
leadership. While I agree that other leadership functions pertaining to administration
and management can indirectly improve instruction, I define instructional leadership
narrowly and focus only on leadership that is directly related to teaching and learning.
Finally, while I admit that the boundary of distributed leadership is broad,8 in this
dissertation I focus narrowly on formally-designated leadership roles/positions. These
include principals, assistant principals, CSR coaches and other instructional
professionals whose roles are not associated with a CSR program (program and
curricular area coordinators and mentor teachers) (for details, see Camburn et al.,
2003).
8 For detailed discussions on the unit of analysis for distributed leadership, see e.g., Woods, 2004 and Harris, 2008.

39
CHAPTER III
MEASUREMENT OF DISTRIBUTED INSTRUCTIONAL
LEADERSHIP (DIL)
In chapter 3, I integrate the measures of instructional leadership and distributed
leadership to develop a new measure for DIL. I begin with a review of the two
primary approaches to measuring distributed leadership construct (i.e. “average
leadership” vs. “dispersed leadership”). “Average leadership” is the simple average of
leadership exercised by multiple roles or individuals, whereas “dispersed leadership”
measures the degree to which leadership is “equally” distributed across multiple roles
or individuals. While I focus my discussions on “dispersed leadership” in this chapter,
I will include both approaches for my empirical inquiry into DIL.
Then, I provide a detailed discussion of the main constructs of instructional
leadership based on the functional definition of it, which are comparatively consistent
throughout the literature. Finally, I integrate the measures of distributed leadership
and instructional leadership by developing a methodological tool for DIL (Gini
Coefficient for Distributed Instructional Leadership [GDIL]). The measure estimates
the degree to which instructional leadership function are “equally” distributed across
multiple school leaders. I discuss not only the theoretical properties and basic
mathematics of the GDIL, but also its applications in the school context.

40
Measurement of Distributed Leadership
In a review of a broad spectrum of industrial, business, management and
organizational research, I found only a modicum of efforts to measure distributed
leadership or relevant concepts. In general, the literature has followed two lines of
research (i.e. “average leadership” vs. and “dispersed leadership”). “Average
leadership” is the simple average of leadership exercised by multiple roles or
individuals. “Dispersed leadership” measures the degree to which leadership is
equalized (or decentralized) across multiple roles or individuals. “Average leadership”
examines whether a school displays a widely distributed pattern of leadership among
multiple roles and individuals. However, “dispersed leadership” addresses what the
pattern of leadership distribution is. While the former focuses on the overall strength
of leadership of the group, the latter highlights the differentiation of leadership across
roles or individuals within the group.
Whereas both approaches are important to understand distributed leadership,
most empirical efforts have given primacy to “average leadership”. One area that
warrants more empirical attention is “dispersed leadership”. The current research
lacks not only a robust measure of “dispersed leadership”, but also empirical evidence
on its effectiveness for instructional improvement. While I focus my discussions on
“dispersed leadership” in this chapter, I will include both the average and dispersed
approaches in my empirical inquiry into DIL.

41
Average Leadership
As discussed in Chapter 2, one common approach to measuring distributed
leadership is the average of leadership exercised by multiple individuals or levels (i.e.
total leadership divided by the number of people or ties). “Average leadership”
measures the degree to which leadership is spread widely across multiple individuals
or levels.
“Average leadership” has its origins in the control graph theory, which is
representative of the human relations approach to studying organizational
effectiveness (Tannenbaum, 1968). Engrained in the hierarchical superior-subordinate
relationship of controls, a control graph depicts the amount of influence at each
hierarchical level on a graph using plotted points. The points are computed as the
average influence each hierarchical level exerts over others (see Figure 3.1). Total
control is then obtained by adding the average amount of influence exercised by all
hierarchical groups. The concept of total control has an embedded assumption that
distributed leadership is not a zero-sum-game. The total amount of leadership is
“variable rather than fixed” (Sorensen & Baum, 1977, p. 62). Leadership increases in
one level will not necessarily result in a decrease of leadership in another. Rather, the
amount of leadership can be increased or reduced in response to changes of either
internal management strategies or the external environment (Sorensen & Baum, 1977;
Tannenbaum, 1968).
As discussed in Chapter 2, this approach is widely used in the study of school
distributed leadership either in terms of leadership functions, influence, or advice ties.
Specifically, in the study of distributed influence, researchers have typically asked

42
respondents to rate the amount of influence various individuals or groups (e.g., school
administrators, teachers, and parents) have exercised over a variety of school
activities. The total control ranges from zero to a great deal of influence (on a
Likert-type scale of 1 to 5). Then the values of all items are averaged to represent
distributed influence (e.g., Leithwood & Mascall, 2008; Pounder et al., 1995).
Similarly, distribution of leadership functions is often measured as the average
strength of leadership functions exercised by multiple leaders. The respondents are
asked questions such as “to what extent does leadership provide staff development, on
a 1 to 5 scale” (e.g., Heck & Hallinger, 2009; Leithwood et al., 2010). Frequencies
may also be obtained, as in “how much time did you spent on staff development (0 =
never to 5 =always)” (e.g., Camburn et al., 2003). Finally, responses were averaged at
the group level.
Slightly different, density of advice-seeking ties is often measured by the
proportion of all dyads that include an advice tie. Researchers obtain data about
advice ties by asking questions on a presence/absence scale, as in “who do you seek
for advice.” Frequencies may also be solicited, as in “how often did you turn to the
person for advice.” Then, density is calculated by number of direct advice ties divided
by the total number of possible ties in the school (e.g., Friedkin & Slater, 1994).
In general, studies have shown inconsistent findings on the overall strength of
leadership exercised by multiple individuals or groups to leverage instructional
improvement (for details, see Table 2.1 in Chapter 2). While some show that stronger
average leadership improved student learning indirectly by promoting better school
conditions, others provide a less promising outlook. Empirical evidence shows that
strong average leadership enhanced student learning indirectly by promoting teacher

43
commitment (Pounder et al., 1995), teacher capacity and motivation (Leithwood &
Mascall, 2008), and school teaching and learning environment (Heck & Hallinger,
2009; Leithwood et al., 2010). However, others found that spreading leadership
widely across multiple school agents resulted in complexity of communication and
ambiguity of mission (Leithwood & Jantzi, 2000), which were negatively associated
with student engagement (Leithwood & Jantzi, 1998). In addition, the effects of
distributed leadership were found to vary by type of leadership function. Hulpia and
his colleagues (2009a) revealed that distributed leadership functions in providing
vision and support promoted organizational commitment. However, those embedded
in monitoring and supervision jeopardized organizational commitment.
The “average leadership” approach presents a promising avenue for scholars to
move beyond an exclusive focus on the principal in thinking about the exercise of
instructional leadership functions. It provides important insights into whether a school
displays a widely distributed pattern of leadership across multiple roles and
individuals. Findings also suggest that greater average leadership exercised by
multiple leaders better leverages school improvement. However, this is only the first
step towards capturing the complexities of school distributed leadership. Two primary
problems should be noted. First, the approach assumes that an organization with a
high level of average leadership is one in which all levels have a high degree of
leadership and in which all members are deeply involved in their organizational roles
(Tannenbaum, 1968). However, this is not necessarily true. It is highly possible that
when leadership is highly concentrated in one single individual or hierarchical level,
the group average leadership is still high. Alternatively, even if the leadership
exercised by each member is equal, the average strength of leadership may still be

44
low on the group level. For example, let us see the two cases below:
School A School B
Members Leadership score Members Leadership score Person 1 1 Person 5 5 Person 2 1 Person 6 0 Person 3 1 Person 7 0 Person 4 1 Person 8 0
As shown above, leadership is spread widely among all members in school A,
yet in school B it is highly centralized in person 5. However, the average leadership
exercised by all members in school B (1.25) is higher than that in school A (1).
Although the average leadership score of school B is higher than that of school A,
distribution of leadership does not actually occur in school B. In this sense, the
“average leadership” approach fails to correctly capture the actual leadership
distribution in School B.
Additionally, “average leadership” focuses on the overall “strength” rather than
the “dispersion” of leadership across roles or individuals. The measure is concerned
with whether a school displays a widely distributed pattern of leadership across roles
and individuals. However, it fails to capture the degree of differentiation of leadership
exercised by different roles (e.g., equality or decentralization). While “average
leadership” is important to illuminate our understanding of distributed leadership, we
also need a measure that is able to evaluate the degree of differentiation of leadership
across different roles or individuals.

45
Dispersed Leadership
The second approach to measuring distributed leadership is “dispersed
leadership.” This emerges from the research on decentralization of organizational
power or control and is embedded in the concept of “decentralization”
(“centralization”) or “equality” (“inequality”). Its measures estimate the degree of
differentiation of leadership across multiple individuals or levels.
In the following discussion, I review the three most notable measures of
“dispersed leadership” (i.e. span of control, slope of control curve in control graph,
and centralization of advice ties). While the first two focus only on hierarchical levels,
the last one includes both hierarchical and non-hierarchical levels of leadership (for
details, see Table 3.1). The three measures are widely seen in industrial, business,
management and organizational research. Although they have important implications
for school distributed leadership, concerns will also be noted.
1. Span of control
Span of control is the simplest approach to measuring organizational
control/influence in the literature on classical organizational theory (Whisler, et al.,
1967). It structures relations between leaders and their subordinates in an organization.
Despite a variety of interpretations of span of control, it can be simply understood as
the proportion of subordinates to superiors in an organization (Meier & Bohte, 2003;
Ouchi & Dowling, 1974). Leaders’ span is defined in terms of the total number of
subordinates over whom they have some control (Ouchi & Dowling, 1974). Research
on the span of control has focused on the optimal span, its determinants, and how it
affects organizational performance.

46
Span of control has significant implications for decentralization vs.
centralization of organizational controls. It is argued that a wide span of control (a
high subordinate-to-superior ratio) indicates a high degree of decentralization, and a
narrow span of control indicates a high degree of centralization (Janger, 1960; Meier
& Bohte, 2003). A wide span of control exists when a leader supervises many
subordinates. The leader has to broaden the span by granting the subordinates more
discretion and control. Thus, increasing the span of control reduces the relative
control of the superiors and increases the distribution of control to subordinates.
Alternatively, a narrow span of control exists when a leader supervises fewer
subordinates. The subordinates are given less discretion and control, resulting in less
distribution of leadership to informal leaders (Whisler, et al., 1967).
The most common approach to measuring the span of control is the number of
subordinates divided by the number of superiors. The relations between the
subordinates and superiors are defined as “reporting to,” “being supervised directly,”
or “having regular contact,” and etc. However, researchers also argue that the raw,
unadjusted span of control is an inappropriate operational measure. For example,
Ouchi and Dowling (1974) propose that the measure needs to be converted to
full-time equivalents. They argue that span of control should be adjusted to reflect
only the portion of time a supervisor devotes to supervision of or contact with
subordinates. It is highly possible that in an organization a wide span of control exists
(i.e. a high percentage of subordinates per superior), but the supervisors actually
devote little time to supervision of or contact with their subordinates. In this case,
control has not been activated and supervision has not happened. Ouchi and Dowling
(1974) measured span of control by the number of subordinates divided by: the

47
number of superiors × percentage of time they spent on supervision of or contact with
their subordinates.
However, the implication of span of control for school distributed leadership
poses two primary problems. First, it is difficult to define superiors and subordinates
in schools. Span of control is rooted in hierarchical assumptions about leadership
relationships, but school leadership relationships are not necessarily hierarchical. For
instance, the relationship between the school site board and teaching faculty cannot
easily be identified as hierarchical. Thus a question remains regarding who should be
defined as the superiors and who should be counted as the subordinates. Second, span
of control is not a convenient measure to examine leadership distribution across
multiple groups or levels. Span of control handles only two hierarchical levels of
individuals at once. In this case, separate spans of control need to be developed if
multiple levels are to be examined (e.g., teacher – administrator ratio, teacher –
teacher-leader ratio, teacher-leader – administrator ratio). Having multiple spans of
control for multiple groups or levels also causes complications for between-school
comparisons.
2. Control graph: slope of control curve
The control graph is the most widely-known approach to measuring the
distribution of organizational control. Similar to span of control, it focuses on vertical
superior-subordinate relationships. The control graph theory, developed by
Tannenbaum and his colleagues (1968), is representative of the human relations
approach to studying organizational effectiveness. It has been widely seen in
organizational research, though it appears less frequently in recent studies (Markham,

48
Bonjean, & Corder, 1984).
The control graph is one of few approaches that have integrated both the
aggregated (average or total) and dispersed perspectives to study the distribution of
organizational control. A control graph depicts the amount of influence at each
hierarchical level on a graph using plotted points, which are computed as the average
influence of each hierarchical level (see Figure 3.1). Based on the graph, two concepts
and measures are developed. One is total control. As discussed in a prior section, this
is the sum of the average amount of influence exercised by all hierarchical groups.
However, another important concept is the slope of control curve. This is the average
of the algebraic differences between the amounts of influence exercised by successive
hierarchical levels. While total control measures the overall strength of leadership of a
group, the slope of control curve estimates the degree of differentiation of leadership
across roles within the group.
Figure 3.1 presents a control graph. The x-axis represents the hierarchical levels,
from the highest to the lowest (1=highest, 5=lowest). The y-axis represents the
average amount of influence exercised by each hierarchical level. The slope of the
curve varies, with positive ones indicating decentralization and negative ones
indicating centralization. When the slope is equal to zero, organizational control is
equally distributed across all hierarchical levels. The slope of control curve bears a
multitude of advantages as a quantitative technique for measuring “dispersed
leadership.” This is especially true when it is used to compare control structures
across different organizations (Sorensen & Baum, 1977). Unlike span of control,
which handles only two hierarchical groups at once, the slope of control curve is able
to address multiple levels of individuals simultaneously. This makes the slope readily
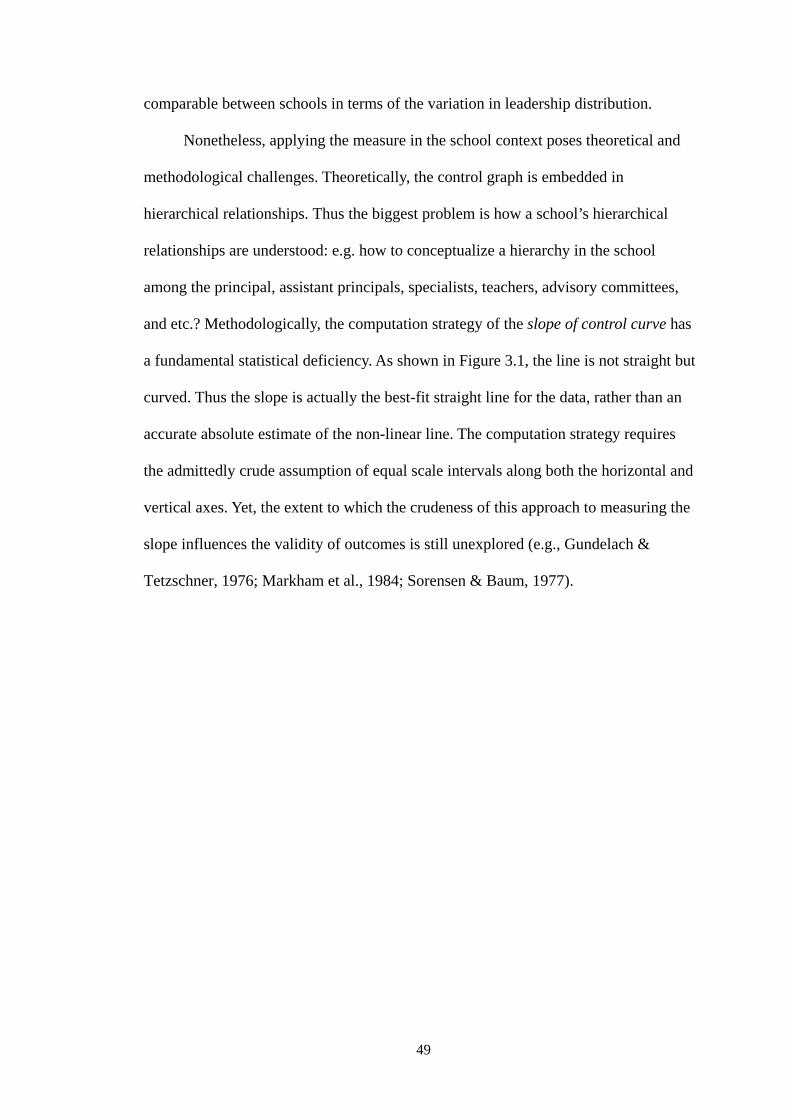
49
comparable between schools in terms of the variation in leadership distribution.
Nonetheless, applying the measure in the school context poses theoretical and
methodological challenges. Theoretically, the control graph is embedded in
hierarchical relationships. Thus the biggest problem is how a school’s hierarchical
relationships are understood: e.g. how to conceptualize a hierarchy in the school
among the principal, assistant principals, specialists, teachers, advisory committees,
and etc.? Methodologically, the computation strategy of the slope of control curve has
a fundamental statistical deficiency. As shown in Figure 3.1, the line is not straight but
curved. Thus the slope is actually the best-fit straight line for the data, rather than an
accurate absolute estimate of the non-linear line. The computation strategy requires
the admittedly crude assumption of equal scale intervals along both the horizontal and
vertical axes. Yet, the extent to which the crudeness of this approach to measuring the
slope influences the validity of outcomes is still unexplored (e.g., Gundelach &
Tetzschner, 1976; Markham et al., 1984; Sorensen & Baum, 1977).

50
Figure 3.1 Control Graph
3. Centrality and centralization of advice ties
As discussed in Chapter 2, the social network approach to school leadership
offers a variety of concepts and tools on both the individual (e.g., centrality) and
group levels (e.g., density, centralization). One important measure applicable to
school distributed leadership is centrality or centralization. While centrality captures
an individual’s position in sub-group advice network, centralization is an estimate of
the degree to which all individuals or subgroups are equally central in an advice
networks.
The most common ties used by researchers to identify leadership roles are
advice-seeking ties. In this sense, school leaders are conceptualized as key advice
givers. In general, researchers survey respondents regarding “whom do you seek for
0
1
2
3
4
5
0 1 2 3 4 5
Am
ount
of I
nfue
nce
Organizational Hierarchical Levels
Decentralization
Equality
Centralization

51
advice or information about…” (Friedkin & Slater, 1994; Spillane et al., 2010). Then,
measures of centrality can be developed (i.e. degree, closeness, and betweenness).
Researchers have used degree centrality to identify if an individual is a leader. Degree
centrality is simply a count of the total number of school members who had been
sought out for instructional advice (identified by others). For example, Spillane et al.
(2010) identified informal school leaders as those who had two or more advice ties
recognized by their coworkers.9
Based on the individual-level measure of centrality, the group-level measure of
centralization is then developed. Centralization describes the distribution of advice
ties in the school and captures the variability and dispersion of individuals’ centrality
in the school. It is often calculated based on the degree centrality value of each person.
Such analysis requires separation between out-degrees (ties indentified by the focal
actor) and in-degrees (ties identified by other actors). The first step is to identify the
highest number of in-degree advice ties in the network and then calculate the
difference between every individual’s in-degree and the highest in-degree ties. Then
all differences are summed up and divided by the maximum possible distance,
equaling (n – 1) (n – 2), where n is the number of individuals in a network. The index
varies from 0 to 1, with 0 indicating equally distributed leadership and 1 indicating a
centralized leadership structure. Thus complete centralization is the case in which a
single individual/subgroup in the center is connected to every other
9 The other two measures of centrality are closeness and betweeness. Closeness centrality refers to the sum of the shortest paths from a given individual to all others. It measures the extent to which an individual is close to others so that he/she receives information or resource flows through the network early and without too much distortion. Betweeness centrality measures the extent to which an individual lies between other actors in the network. It is usually calculated as the proportion of all shortest paths in the network that pass through the individual (i.e. the total number of all shortest path between all other actors that include this individual, divided by the number of paths using this individual) (Borgatti & Brandon, 2010).

52
individual/subgroup, and all the others have ties only to the center. The opposite is
true in a decentralized network, representing a wider spread of direct ties (e.g., Pastor
& Mayo, 2002; Zohar & Tenne, 2008).
The major difficulty of using the social network approach to school distributed
leadership lies in the definition of ties that capture the nature of leadership. In other
words, which ties should be counted as leadership? In the leadership research, ties are
usually conceptualized and measured by instrumental ties (e.g., “seeking advice from”)
(e.g., Spillane et al., 2008). However, advice relations do not represent all aspects of
leadership. Thus we need more precise definitions of ties that capture the nature of
leadership. A more precise conceptualization of ties would allow for more precise
measurement of those ties, adding rigor and strength to the methodology.
Summary
The “dispersed leadership” approach to distributed leadership measures the
degree of differentiation of leadership across roles or individuals. It is embedded in
the concept of “decentralization” (“centralization”) or “equality” (“inequality”). I
identified three primary measures of “dispersed leadership” in the literature. While
they have important implications for understanding school distributed leadership,
problems have yet to be addressed.
The three measures differ in several ways (see Table 3.1): 1) they vary in terms
of the nature of leadership they are embedded in. While the span of control focuses on
the formal subordinate-superior structure, the slope of control curve focuses on
interpersonal influence among hierarchical levels of individuals. However, the
centrality/centralization of ties is based on instrumental ties (e.g., advice ties) among

53
social actors. 2) The first two address only hierarchical relationships, yet the last one
includes both hierarchical and non-hierarchical levels of leadership. 3) While span of
control defines a two-level relationship only, the slope of control curve is able to
handle multiple hierarchical levels simultaneously. 4) Both the slope of control curve
and the centrality/centralization of advice ties have clear criteria for “equality,” but
this is not the case for the span of control.
However, it is not easy to apply the three measures to school distributed
leadership. The main barrier for span of control and the slope of control curve is the
difficulty of capturing the hierarchical relationships in schools: e.g. among the
principal, assistant principals, specialists, teachers, advisory committees, and etc. For
centrality/centralization of ties, the major problem is creating more precise definitions
of ties that accurately and adequately capture the nature of leadership (Borgatti &
Brandon, 2010). Although advice relations capture a certain aspect of leadership, they
do not represent the entire leadership.
Table 3.1 Comparison of Three Approaches to Measuring “Dispersed Leadership”
Span of control Slope of control curve
Centrality/ centralization of ties
Nature of leadership
Subordinate-superior relation structure
Influence Instrumental ties (e.g., advice-seeking ties)
Nature of relationships
Hierarchical only
Hierarchical only
Both hierarchical and non-hierarchical
Criterion for “equality”
None ‘0’=total equality ‘0’=total equality; ‘1’=total inequality
Measurements Subordinate- superior ratio
Slope of control curve
Centrality (i.e. degree, closeness, betweeness) Centralization (i.e. variance of individuals’ centrality)

54
Focus of My Study: Dispersed Leadership
Among the two approaches to measuring distributed leadership (i.e. “average
leadership” vs. “dispersed leadership”), the latter has received scant attention. Thus in
this study I will focus on “dispersed leadership” to develop a new measure of
distributed leadership. While “dispersed leadership” is my primary interest, I will
include both approaches in my empirical inquiry into distributed instructional
leadership (DIL).
Both approaches are important for understanding distributed leadership.
“Average leadership” is the simple average of leadership exercised by multiple leaders.
It provides important insights into whether a school displays a widely distributed
pattern of leadership across multiple roles or individuals. However, it fails to address
how leadership is distributed (or differentiated) across roles or individuals. Thus, a
“dispersed” perspective is needed. While “average leadership” focuses on the overall
strength of leadership of a group, “dispersed leadership” examines the degree of
differentiation (e.g. equality) of leadership across multiple leaders within the group.
However, empirical studies focus primarily on “average leadership”; measures
for “dispersed leadership”, embedded in the concept of “equality” (“inequality”),
remain largely unexplored. Thus, it is still unknown how “dispersed leadership”
impacts school improvement. As discussed earlier, the existing measures (i.e. span of
control, slope of control curve, centrality/centralization of advice ties) have
fundamental drawbacks when applied to school distributed leadership. Thus we need
a more robust measure for “dispersed leadership” in the school context. This measure
should not only be able to describe and distinguish the leadership exercised by
multiple roles or individuals, but also account for broad organizational functions or

55
tasks designated to leaders. Specifically, the measure should estimates the degree to
which leadership functions are “equally” (“unequally”) dispersed across multiple
individuals or levels. It should satisfy the five basic criteria below:
1. It handles both hierarchical and non-hierarchical leadership relationships;
2. It deals with multiple, rather than only two individuals or hierarchical
groups;
3. It is accounts for descriptions of disctinct leadership functions/tasks, rather
than generic perceptions of “equality” (“inequality”) of distributed
leadership;
4. It has a clear criterion for “equality” (“inequality”);
5. It is able to address zero values as a leader might exercise few or negligible
leadership functions.
Measurement of Instructional Leadership Functions
As my definition of distributed leadership is embedded in instructional
leadership functions, it is important to identify the constructs of instructional
leadership functions. There is a breadth of similar and complementary constructs for
instructional leadership functions. However, I focus on the model developed by
Camburn and his colleagues (2003). In alignment with the seminal model of Hallinger
and Murphy (1985), Camburn and his colleagues went further by taking note of the
particular school conditions in which planned CSR instructional reforms are
implemented. They identified four broad constructs of instructional leadership
functions, as presented below:

56
Setting instructional goals. Instructional goals include both broad and specific
ones. They specify what students are expected to learn and be able to do in order to
make instructional improvements. Successful implementation of CSR instructional
innovations depends largely on how well instructional leaders frame and articulate a
coherent vision of instruction to teachers and students. It also depends on how
consistently the goals are understood and implemented throughout all classrooms
(Barnes et al., 2004). Studies have shown that clearly-formulated and -conveyed goals
foster instructional changes and improve learning outcomes (e.g., Hallinger & Heck,
1998; Leithwood, 1994; Leithwood, Jantzi, & Steinbach, 1998; Timperley, 2005),
especially during times of rapid changes (Barnes et al., 2004; Mayronwetz &
Weinstein, 1999).
Monitoring improvement. In order to align teachers’ practice with the schools’
improvement goals and routines, leaders need to monitor and supervise the
implementation of improvement efforts. This is achieved through continuous
examination of students’ work and teachers’ instructional practice. Leaders observe
teachers using new instructional practices or new curricular materials. Also, by
evaluating teachers using established standards and criteria, leaders help teachers
understand and focus on specific procedures synonymous with the program designs
(Desimone, 2002). Research has shown that monitoring and supervision by leaders
strengthens the specificity of program designs, which has been substantiated as a key
factor in faithful implementation of instructional innovations (e.g., Rowan & Miller,
2007).
Coordinating curriculums. The measure of coordinating curriculums describes
how well school leaders prioritize the school-level synchronization of curriculum and

57
instruction. Leaders perform this leadership function by promoting integration and
alignment of instruction between content, standards and grade levels. By coordinating
curriculums, leaders promote consistency in teacher practices and reduce the
likelihood that they will contradict or undermine one another’s efforts. A high degree
of alignment among instructional goals, curricular materials and assessments used to
evaluate the school's instructional program and classroom instructional practices
promote the faithful implementation of CSR programs (Camburn et al., 2003).
Developing instructional capacity. Leaders need to provide continuing and
extensive professional development opportunities for teachers and foster a school
culture/climate conducive to professional learning (Louis, Kruse, & Bryk, 1995; Stoll,
Bolam, McMahon, Wallace, & Thomas, 2006). Professional development
opportunities have long been endorsed as an important lever for school changes
(Darling- Hammond, 1995; Lieberman, 1995; Little, 1990; Louis & Marks, 1996;
Rowan, 1990; Smylie & Denny, 1990; Starratt, 2003). They support the understanding
and practice of the CSR instructional regimes, and ameliorate difficulties that emerge
in the reform process (Desimone, 2002). Empirical evidence has shown that
high-quality and ongoing professional development opportunities help update teacher
knowledge of the change process (Haynes, 1998), address specific problems within
their classrooms (Borman et al., 2003), and improve their classroom teaching practice
(Correnti, 2007).
The four core instructional leadership functions are important forces for school
improvement. They are believed to strengthen and sustain the implementation of CSR
programs (Barnes et al., 2004; Desimone, 2002). In addition, they help foster
professional communities in schools (e.g., McLaughlin & Talbert, 2007; Mulford &

58
Silins, 2003; Stoll & Louis, 2007). However, previous studies on instructional
leadership have focused exclusively on leadership by principals. Research on the
broad exercise of instructional leadership functions by multiple leaders is sparse
(Camburn et al., 2003). Therefore we need more studies on the manner in which
instructional leadership functions are distributed across different roles, and how this
affects school outcomes.
Integration: Gini Coefficient for Distributed Instructional Leadership (GDIL)
Having discussed the measurements of both distributed leadership and
instructional leadership, I now integrate them to develop a new measure of DIL. This
measure estimates the degree to which instructional leadership functions are equally
distributed among school members.
I develop a new methodological tool for DIL — the Gini Coefficient for
Distributed Instructional Leadership (GDIL). GDIL is derived from the idea of the
Gini Coefficient (G), the measure most commonly used in economics to assess
income and wealth distribution. In general, the GDIL fulfills the above-mentioned
five fundamental criteria for a strong “dispersed leadership” measure. In the following
section, I first analyze and compare the theoretical properties and basic mathematics
of the Gini Coefficient (G) based on four alternative approaches. I then develop the
GDIL by applying the G in the school context. Finally, I present the methodological
advantages of the GDIL as a quantitative measure for DIL.

59
Estimation and Properties of Gini Coefficient (G)
A substantial number of attempts have been made to create indices of “equality”
(“inequality”). The best known and most commonly-used is the Gini Coefficient (G)
(Hao & Naiman, 2010; Ray & Singer, 1973; Taagepera & Ray, 1977). Interest in the
G pivots mostly around its application in the field of economics to measure income
and wealth distributions (Hao & Naiman, 2010). However, it has also been widely
used in other fields, such as political science, sociology, business, public health,
chemistry, biology, engineering, and linguistics.10
There is an overwhelming variety of formulas for the G in the literature.
However, most of them, in essence, are mathematically equivalent or transformable. I
synthesized a large body of literature and generalized four primary ways to calculate
the G, depending on the elements involved: 1) Lorenz curve; 2) absolute values; 3)
integral of cumulative distributions; and 4) covariance (see Table 3.2 below).
1. Lorenz curve
The Gini Coefficient (G) can be directly interpreted and geometrically depicted
by the Lorenz curve (Lorenz, 1905). The Lorenz curve provides a common basis for
10 The Gini Coefficient has been used in political science to examine the distribution of power in societies (e.g., Mansfield, 1992), legislative bodies (e.g., Browning & King, 1987; Frederickson & Cho, 1974), and the international system (Ray & Singer, 1973). In sociology, it has been used to examine the diversity of races, ethnic groups, or classes (e.g., Biemann & Kearney, 2010; Deaton, 1997; Lieberson, 1969; Martin & Gray, 1971). Research has also seen a wider application of the G in other fields, such as business, public health, chemistry, biology, engineering and education: e.g., industry concentration, centralization of control in company (e.g., Harrison & Klein, 2007; Hart & Prais, 1956; Whisler, Meyer, Baum, & Sorensen, 1967), heath inequality (e.g., Bleichrodt & Doorslaer , 2006; Regidor, 2004; Stafford, Cummins, Macintyre, Ellaway, & Marmot, 2005), selectivity of chemical compounds (e.g., Graczyk, 2007; Pankhurst, Pierret, Hawke, & Kirby, 2002), size hierarchies in plant populations (e.g., Chakraborty, 2001; Weiner & Solbrig, 1984; White, 2007), distribution of electricity (e.g., Dai, Wang, Wang, & Qi, 2008), inequality of educational attainment (e.g., Thomas, Wang, & Fan, 2001), and linguistic diversity (e.g., Greenberg, 1965; Lieberson, 1964).

60
not only the Gini, but also other scale-invariant inequality measures (Hao & Naiman,
2010). It represents the proportion of the total amount of resources (e.g., income) held
by individuals whose values are lower and equal to the pth quintile in the distribution.
Figure 3.2 shows the Lorenz curve. The cumulative proportion of a population
is plotted on the x-axis. The cumulative proportion of total resource possessed by the
corresponding cumulative proportion of the population is on the y-axis. The Lorenz
curve for the case of complete equality is represented by the diagonal. A Lorenz curve
that lies below the diagonal indicates deviation from perfect equality. While greater
deviation of the Lorenz curve from the line of perfect equality signifies a greater
degree of inequality, smaller deviation indicates a greater degree of equality.
As shown in Figure 3.2, the G is calculated as the ratio of the area enclosed by
the Lorenz curve and the perfect equality line (Area A, representing the deviation
from equality), to the total area below that line (Areas A+B). To simplify, the G sums
for each individual in the population the difference between where the individual is on
the Lorenz curve and where he/she is expected to be in the case of complete equality
(Alker, 1965).The G is calculated as:
G=A / (A+B) (3.2)
G=A / (1/2) (3.3)
G=2A (3.4)
G=1-2B (3.5)
B is the area below the Lorenz curve and if we let L (p) represent the
mathematical function generating the Lorenz curve, the G can be calculated as:

61
B=∫ L(𝑝𝑝)𝑑𝑑𝑝𝑝1
0 (3.6) G=1-2∫ L(𝑝𝑝)𝑑𝑑𝑝𝑝1
0 (3.7)
Figure 3.2 Lorenz Curve Indicating Gini Coefficient (G)
In general, the most unequal case (assuming no negative values) will be one in
which a single person receives 100% of the total resources and the remaining people
receive none (G = 1−1/ N). The most equal case will be one in which each individual
receives the same amount (G = 0). Thus in an infinite population, the G ranges from 0

62
(complete equality) to 1(complete inequality).11 A higher coefficient indicates a more
unequal distribution and a lower coefficient shows a more equal distribution.
2. Absolute values
The G can also be calculated without direct reference to the Lorenz curve. One
of the most popular ways to calculate the G is based on absolute values. In this
approach, the G is calculated as “one half of the relative mean difference between all
pairs of data in the population” (Dalton, 1920; Sen & Foster 1997, p. 30). The number
of possible pairs in the comparison equals n2. The appeal of this method is that it is “a
very direct measure of distribution, taking note of the difference between every pair of
comparison” (Sen & Foster 1997, p. 31).
The research has seen a breadth of varying, yet mathematically equivalent
formulas based on the “relative mean difference.” The most widely-used equation is
presented in 3.8 below (see e.g., Dalton, 1920; Deaton, 1997; Hart & Prais, 1956; Sen,
1973; Sen & Foster, 1997, p. 31):
G = ∑ ∑ |𝑦𝑦𝑗𝑗– 𝑦𝑦𝑖𝑖𝑛𝑛
𝑗𝑗 | 𝑛𝑛𝑖𝑖
2𝑛𝑛2𝜇𝜇(𝑦𝑦) (3.8)
Where,
i and j are the members being compared;
yj is the data of member j; and yi is the data of member i;
|yj - yi| is the absolute difference in data between member j and i;
11 It is important to note that the upper bound of the G is 1 only if the population size is infinite. In a population of size N, the upper bound is equal to 1−1/ N (For detailed derivations, see Equation 3.18). Also, to be validly computed, no negative resource can be distributed. Thus if the G is used to describe resource (i.e. income) inequality, then no population can have a negative value.

63
n is the number of observations in the data; and
𝜇𝜇(𝑦𝑦) is the mean value of all observations in the data.
As n𝜇𝜇(𝑦𝑦)= ∑ 𝑦𝑦𝑗𝑗𝑛𝑛𝑗𝑗 , the above equation is sometimes transformed to Equation 3.9
(e.g., Pyatt, 1976), shown as below:12
G = ∑ ∑ |𝑦𝑦𝑗𝑗– 𝑦𝑦𝑖𝑖𝑛𝑛
𝑗𝑗 | 𝑛𝑛𝑖𝑖
2𝑛𝑛 ∑ 𝑦𝑦𝑗𝑗𝑛𝑛𝑖𝑖
(3.9)
Where,
i and j are the members being compared;
yj is the data of member j; and yi is the data of member i;
|yj - yi| is the absolute difference in data between member j and i;
n is the number of observations in the data; and
𝜇𝜇(𝑦𝑦) is the mean value of all observations in the data.
In the above equations, the pair-wise comparisons include the comparison of j’s
data with itself. By contrast, other researchers calculate the mean difference without
repetition (e.g., Deaton, 1997; Glasser, 1962; Hao & Naiman, 2010). This gives a
variant of (3.9):
12 Other equivalent, yet more mathematically manageable and computationally easy equations are
also available. For example: G = ∑ (2𝑗𝑗−𝑛𝑛−1)𝑦𝑦𝑗𝑗𝑛𝑛𝑗𝑗
𝑛𝑛2μ(𝑦𝑦) (Glasser, 1962); G = 1+ 1
n – 2
𝑛𝑛2μ(𝑦𝑦)∑ (𝑛𝑛 − 𝑗𝑗 +n
j=1
1)𝑦𝑦𝑗𝑗 (Sen, 1973, p. 31; Thon, 1982); G = 2∑ 𝑗𝑗 |𝑦𝑦𝑗𝑗−μ(𝑦𝑦)𝑛𝑛
𝑗𝑗 |
𝑛𝑛2μ(𝑦𝑦) (Chen, Tsaur, & Rhai, 1982); G
= 2 �∑ 𝑗𝑗𝑦𝑦𝑗𝑗−
𝑛𝑛+1𝑛𝑛
𝑛𝑛𝑗𝑗 �
𝑛𝑛2μ(𝑦𝑦) (Allison, 1978)

64
G = ∑ ∑ |𝑦𝑦𝑗𝑗– 𝑦𝑦𝑖𝑖𝑛𝑛
𝑗𝑗 | 𝑛𝑛𝑖𝑖
𝑛𝑛(𝑛𝑛−1)μ(𝑦𝑦) (3.10)
Where,
i and j are the members being compared;
yj is the data of member j; and yi is the data of member i;
|yj - yi| is the absolute difference in data between member j and i;
n is the number of observations in the data; and
𝜇𝜇(𝑦𝑦) is the mean value of all observations in the data.
In this case, the number of pairs in the comparison is n (n-1), which excludes
the pairs of an individual's own data. However, the distinction in the G between the
mean difference with and without repetition is negligible if n is large (Thon, 1982).
3. Integrals of cumulative distribution
The third way to calculate the G is based on integrals of cumulative distribution.
Formulas can be derived either from the Lorenz curve or “the relative mean difference”
(Dorfman, 1979). In the equation below, F (𝑦𝑦) is the cumulative distribution of the
resource. The higher dispersion of F(y) indicates a higher upper limit of the G. This
approach applies to “both discrete and continuous distributions of income and will be
well-defined and valid whether or not there is a finite upper limit to the income that
can be received by anyone, provided the mean of the distribution is finite” (Dorfman,
1979, p. 146).13
13 See Dorfman (1979) for a detailed mathematical demonstration of how Equation 3.11 was derived from the Lorenz curve and absolute values, as shown in Equation 3.8 above.

65
G = 1 − ∫ [1−F(𝑦𝑦)]2𝑑𝑑𝑦𝑦𝑏𝑏
𝑎𝑎μ(𝑦𝑦)
(3.11)
Where,
F(𝑦𝑦) is the cumulative distribution of data;
a and b denote the lowest and the upper bound of the data, respectively; and
𝜇𝜇(𝑦𝑦) is the mean value of all observations in the data.
An equivalent variant of the above equation is (see e.g., Ogwang, 2000):
G = ∫F(𝑦𝑦)[1−F(𝑦𝑦)]𝑑𝑑𝑦𝑦𝑏𝑏
𝑎𝑎μ(𝑦𝑦)
(3.12)
Where,
F(𝑦𝑦) is the cumulative distribution of data;
a and b denote the lowest and the upper bound of the data, respectively; and
𝜇𝜇(𝑦𝑦) is the mean value of all observations in the data.
4. Covariance
The final strain of research uses the covariance between the data and
cumulative distribution of the data to calculate the G (e.g., Annad, 1983; Lerman &
Yitzhaki, 1984; Shalit, 1985). This approach simplifies the calculation of the G
tremendously by using widely available ordinary least squares (OLS) regression
software packages. The equation is shown as below:
G = 2cov (𝑦𝑦 ,𝐹𝐹(𝑦𝑦))𝜇𝜇 (𝑦𝑦)
(3.13)

66
Where,
F(𝑦𝑦) is the cumulative distribution of data;
a and b denote the lowest and the upper bound of the data, respectively; and
𝜇𝜇(𝑦𝑦) is the mean value of all observations in the data.
In the approach of Pyatt, Chen and Fei (1980), the only information needed to
calculate the G its mean (μ(y)), the sample size (n), and the covariance between the
data (y) and the rank of the data, 𝑟𝑟𝑦𝑦 , from the lowest (𝑟𝑟𝑦𝑦 = 1) to the highest (𝑟𝑟𝑦𝑦 = 𝑛𝑛):
G = 2cov (𝑦𝑦 ,𝑟𝑟𝑦𝑦 )𝑛𝑛𝜇𝜇 (𝑦𝑦)
(3.14)
Based on the above equation, Milanovic (1997) proposed an even simpler
approach:
G = 2𝜎𝜎𝑦𝑦√n2−1 𝜌𝜌 (𝑦𝑦 ,𝑟𝑟𝑦𝑦 )
√12𝑛𝑛𝜇𝜇 (𝑦𝑦) (3.15)
Or,
G = 1√3
𝜎𝜎𝑦𝑦𝜇𝜇 (𝑦𝑦)
𝜌𝜌(𝑦𝑦, 𝑟𝑟𝑦𝑦) �𝑛𝑛2−1𝑛𝑛 (3.16)
Where, 𝜎𝜎𝑦𝑦 is the standard deviation of data; 𝜌𝜌�𝑦𝑦, 𝑟𝑟𝑦𝑦� denotes the correlation
coefficient between y and its rank, 𝑟𝑟𝑦𝑦 . The G, therefore, is the product of a constant,
the coefficient of variation of the data, and the correlation coefficient between the data
and its rank in the population.

67
Table 3.2 Comparison of Four Approaches to Calculating the Gini Coefficient (G)
Category Author Formula Pros Cons Lorenz curve
Fellman, 2012; Lorenz, 1905
G=A/(A+B)
=A/(1/2)
=2A
=1-2B
G=1-2∫ L(𝑝𝑝)𝑑𝑑𝑝𝑝10
Graphically interpretable: visually presents information in terms of areas of flatness or sharpness of the data (Kelly, 2012)
Impossible for decomposition of the G for subgroups in the population (Kelly, 2012).
Absolute values
Dalton, 1920; Deaton, 1997; Hart & Prais, 1956; Pyatt, 1976; Sen, 1973; Sen & Foster, 1997
G = ( 1𝑛𝑛2 ) ∑ ∑ |𝑦𝑦𝑗𝑗 – 𝑦𝑦𝑖𝑖𝑛𝑛
𝑗𝑗 | 𝑛𝑛𝑖𝑖
2μ(𝑦𝑦)
= ∑ ∑ |𝑦𝑦𝑗𝑗 – 𝑦𝑦𝑖𝑖𝑛𝑛
𝑗𝑗 | 𝑛𝑛𝑖𝑖
2𝑛𝑛2μ(𝑦𝑦)
= ∑ ∑ |𝑦𝑦𝑗𝑗 – 𝑦𝑦𝑖𝑖𝑛𝑛
𝑗𝑗 | 𝑛𝑛𝑖𝑖
2𝑛𝑛 ∑ 𝑦𝑦𝑗𝑗𝑛𝑛𝑖𝑖
Emphasis in original: taking note of differences between every pair of comparisons (Sen & Foster 1997, p. 31)
Impossible for decomposition of the G for subgroups in the population (Kelly, 2012).
Allison, 1978; Chen, Tsaur & Rhai, 1982; Glasser, 1962; Thon, 1982
G=1+ 1n
– 2𝑛𝑛2μ(𝑦𝑦)
∑ (𝑛𝑛 − 𝑗𝑗 + 1)𝑦𝑦𝑗𝑗nj=1
= 2∑ 𝑗𝑗 |𝑦𝑦𝑗𝑗−μ(𝑦𝑦)𝑛𝑛
𝑗𝑗 |
𝑛𝑛2μ(𝑦𝑦) =
2 �∑ 𝑗𝑗𝑦𝑦𝑗𝑗−𝑛𝑛+1𝑛𝑛
𝑛𝑛𝑗𝑗 �
𝑛𝑛2μ(𝑦𝑦)
= ∑ (2𝑗𝑗−𝑛𝑛−1)𝑦𝑦𝑗𝑗𝑛𝑛𝑗𝑗
𝑛𝑛2μ(𝑦𝑦)
Deaton, 1997; Glasser, 1962; Hao & Naiman, 2010
G = ∑ ∑ |𝑦𝑦𝑗𝑗 – 𝑦𝑦𝑖𝑖𝑛𝑛
𝑗𝑗 | 𝑛𝑛𝑖𝑖
𝑛𝑛(𝑛𝑛−1)μ(𝑦𝑦)
= ∑ (2𝑗𝑗−𝑛𝑛−1)𝑦𝑦𝑗𝑗𝑛𝑛𝑗𝑗
𝑛𝑛(𝑛𝑛−1)μ(𝑦𝑦)
← 1 →

68
← 2→
Table 3.2 Continued Category Author Formula Pros Cons
Integrals of cumulative distribution
Dorfman, 1979 G = 1−∫
[1−F(𝑦𝑦)]2𝑑𝑑𝑦𝑦𝑏𝑏𝑎𝑎
μ(𝑦𝑦)
Unrestricted on the distribution of data and valid whether or not there is a finite upper limit (Dorfman, 1979; Yitzhaki, 1998).
Computationally complicated; and impossible for decomposition of the G for subgroups in the population (Kelly, 2012).
Lerman &Yitzhaki, 1984; Ogwang, 2000 G = ∫
F(𝑦𝑦)[1−F(𝑦𝑦)]𝑑𝑑𝑦𝑦𝑏𝑏𝑎𝑎
μ(𝑦𝑦)
Covariance Annad, 1983; Lerman & Yitzhaki, 1984; Shalit, 1985
G = 2cov (𝑦𝑦 ,𝐹𝐹(𝑦𝑦))𝜇𝜇 (𝑦𝑦)
Computationally simple and ready for decomposition of the G into subgroups (Yitzhaki, 1998).
Assumptions difficult to test, e.g., in OLS regression, it is hard to test whether the independent variable and the error term are uncorrelated (Yitzhaki, 1998).
Pyatt, Chen, & Fei, 1980 G = 2cov (𝑦𝑦 ,𝑟𝑟𝑦𝑦 )𝑛𝑛𝜇𝜇 (𝑦𝑦)
Milanovic, 1997 G =
2𝜎𝜎𝑦𝑦√n2−1 𝜌𝜌 �𝑦𝑦 ,𝑟𝑟𝑦𝑦 �√12𝑛𝑛𝜇𝜇 (𝑦𝑦)
= 1√3
𝜎𝜎𝑦𝑦𝜇𝜇 (𝑦𝑦) 𝜌𝜌 �𝑦𝑦, 𝑟𝑟𝑦𝑦� √𝑛𝑛
2−1𝑛𝑛

69
Unadjusted and Adjusted GDIL
Based on the idea of the Gini Coefficient (G), I develop the Gini Coefficient for
Distributed Instructional Leadership (GDIL). GDIL measures the degree to which
instructional leadership functions are equally distributed to school members. I first
created the raw, unadjusted GDIL based on one calculation strategy for the G (i.e.
absolute values). Then, I adjusted the GDIL in order to resolve the small-sample bias
and reflect the concept of “equality.”
Unadjusted GDIL
I computed the GDIL by utilizing the most widely-used method to calculate the
G, the absolute values (see e.g., Dalton, 1920; Deaton, 1997; Hart & Prais, 1956; Sen,
1973; Pyatt, 1976). As shown in Equation 3.8 above, the Gini coefficient is calculated
by one half of the relative mean difference between all pairs of data in the population.
I calculated the GDIL for a school as one half of the relative mean difference between
all pairs of leaders in terms of the instructional leadership functions they had
exercised. The instructional leadership score for each leader was averaged across all
items of the construct (See Appendix C).
As noted above, the majority of the equations, grounded in any of the four
alternative approaches for the G, are mathematically equivalent. Here, I used the
absolute values approach instead of any others for two primary reasons. First, this
approach is a direct measure of “equality.” It takes note of the difference in amount of
leadership functions between every pair of leaders in the school. Second, I used the
built-in command ineqdec0 in the statistic software package STATA, which simplified

70
the computational complication by yielding the GDIL values directly.
Based on Equation 3.8, I developed the following equation for the GDIL:
GDIL= ∑ ∑ |𝑦𝑦𝑗𝑗– 𝑦𝑦𝑖𝑖𝑛𝑛
𝑗𝑗 | 𝑛𝑛𝑖𝑖
2𝑛𝑛2𝜇𝜇(𝑦𝑦) (3.17)
Where,
j and i are the leaders being compared in a school;
yj is the average instructional leadership score of leader j; and yi is the average
instructional leadership score of leader i;
|yj - yi| is the absolute difference in the average instructional leadership scores
between leader j and i;
μ(y) is the average instructional leadership score for each school; and
n is the number of leaders identified within a school; in the SII data in this study,
n=2 to 18.
Then I used the built-in command ineqdec014 in STATA to compute the GDIL
for each school. Ineqdec0 estimates a range of “inequality” and related indices
commonly used by economists.15 The command is also able to decompose
“inequality” by subpopulation groups and can be used with bootstrap to obtain
standard errors and confidence intervals (for details, see Jenkins, 1999).16
14 Another similar command is ineqdeco, which excludes the zero value for the variable of interest from the calculations. By contrast, calculations using ineqdec0 do not exclude these observations. Values less than or equal to zero are treated as valid by the command. In this study, as the values of instructional leadership contain zero, I used the command ineqdec0 instead of ineqdeco. 15 In addition to the Gini Coefficient, the command ineqdec0 is also able to estimate other inequality indices: e.g., Generalized Entropy class (for details, see e.g., Cowell, 2000), the Sen welfare index (Sen, 1973), and etc. However, these indices estimated by ineqdeco are not defined for zero and negative values. 16 Bootstrapped standard errors for the estimates of the indices can be derived using the command

71
Adjusted GDIL
Having developed the raw GDIL, I now adjust it in order to resolve the
small-sample bias and reflect the idea of “equality.” While the raw GDIL is a measure
for “inequality,” the final adjusted GDIL measures the degree of “equality” with
which instructional leadership functions are distributed to school leaders.
Adjusted GDIL to reduce the small-sample bias
One problem with the GDIL is the small-sample bias. In most studies of income
distribution, sample sizes are large enough to ignore any small-sample effects.
However, the samples for school leadership are far smaller. While the bias for a large
sample size is almost negligible, ignoring small-sample bias can result in spurious
results and unreliable conclusions (Biemann & Kearney, 2010; Deltas, 2003; Dixon,
Weiner, Mitchell-Olds, & Woodley, 1987; Ray & Singer, 1973; Taagepera & Ray,
1977; Thomas, Wang, & Fan, 2001; Weiner & Solbrig, 1984).
Taking a closer look at the geometric components of the GDIL (or G)
disentangles this sample-size bias. As discussed earlier, the GDIL has a minimum of 0
and maximum of 1. However, the upper bound of it equals 1 only in populations of
infinite size; in a finite sample size of N, the GDIL cannot be 1. Noted in Equation
3.17, the GDIL is calculated from the differences in instructional leadership between
each pair of leaders in the school. Let us imagine a case in which one single leader
exercised all the leadership (denoted by y), while all others exercised none. Then the
sum of the relative differences of leadership between all pairs of leaders (∑ ∑ |𝑦𝑦𝑗𝑗– 𝑦𝑦𝑖𝑖𝑛𝑛𝑗𝑗 |𝑛𝑛
𝑖𝑖 )
is equal to 2y (n-1). And the mean leadership score for the school (𝜇𝜇(𝑦𝑦)) is equal to y/n. bootstrap. Standard errors derived using linearization methods can be calculated for the Gini using the command svylorenz.

72
Thus Equation 3.17 would yield the following in Equation 3.18:17
GDIL = ∑ ∑ |𝑦𝑦𝑗𝑗– 𝑦𝑦𝑖𝑖𝑛𝑛
𝑗𝑗 | 𝑛𝑛𝑖𝑖
2𝑛𝑛2𝜇𝜇(𝑦𝑦) (3.17)
= 2𝑦𝑦(𝑛𝑛−1)2𝑛𝑛2𝜇𝜇(𝑦𝑦)
= 2 𝑦𝑦(𝑛𝑛−1)2𝑛𝑛2×𝑦𝑦
𝑛𝑛
= 𝑛𝑛−1𝑛𝑛
(3.18)
Where,
j and i are the leaders being compared in a school;
yj is the average instructional leadership score of leader j; and yi is the average
instructional leadership score of leader i;
|yj - yi| is the absolute difference in the average instructional leadership scores
between leader j and i;
μ(y) is the average instructional leadership score for each school; and
n is the number of leaders identified within a school; in the SII data in this study,
n=2 to 18.
Equation 3.18 indicates that in a population of size N, the GDIL has an upper
bound of (n-1)/n. In this case, the value of the GDIL is highly constrained by N when
N is small. Thus the GDIL statistic is biased-downward in small sample: a reduction 17 See Kelly (2012) for a detailed mathematical derivation from Equation 3.17 to 3.18.

73
in the sample size leads to a reduction in “inequality.” For example, a distribution
between a two-member entity might receive a much lower GDIL than a distribution
among a five-member entity for the simple reason that the upper limit of the
coefficient is 0.5 in the first case, but 0.8 in the second case. It could be that for the
two-member entity leadership is concentrated in one single leader, which should yield
a GDIL of 1, representing perfect “inequality” of leadership distribution. However,
the GDIL calculated is absolutely less than 0.5: in this case, the GDIL is
underestimated compared to the true value.
Thus if one compares distributions with small numbers of components, this
upper bound can exert a distorting effect on the values of the GDIL. Deltas (2003) has
noted that the size of the small-sample bias is larger than the standard error of the G.
And the relatively high variance on sample sizes that are small can make the bias even
larger (Biemann & Kearney, 2010). Efforts have been made to correct this bias by
obtaining reasonable error estimates (confidence intervals) for the G in the population
(e.g., Davidson, 2009; Dixon el al., 1987; Ogwang, 2004; Weiner & Solbrig, 1984).
“Bootstrapping” procedures have been employed to obtain confidence intervals for
the G based on the examination of the distribution among numerous repeatedly drawn
samples created from the sample of the raw data. However, the asymptotic
distribution of the G is important only when the number of individuals sampled is
large (Deltas, 2003). Dixon el al. (1987) found that only when sample sizes are larger
than 100 would reasonably good confidence intervals be obtained by bootstrapping.
When the sample size is small the confidence intervals generated are unacceptably
narrow.
As the sample sizes for school leaders are rather small (as in the SII data,

74
ranging from 2 to18), I corrected this small-sample bias of the GDIL in order to
obtain relatively unbiased estimates of the true population. As the upper bound for the
GDIL is (n-1)/n, I used an upward-adjusted strategy by multiplying the GDIL by the
correction factor n/(n-1) (for details, see e.g., Biemann & Kearney, 2010; Deltas, 2003;
Kelly, 2012; Weiner & Solbrig, 1984). This yields a bias-corrected GDIL, shown in
Equation3.19 below. This linearly bias-corrected GDIL, while not unbiased itself, has
been shown to reduce the bias (Deltas, 2003). Appendix D provides a detailed
comparison between the adjusted and unadjusted GDIL in the SII data.18
GDIL = ∑ ∑ |𝑦𝑦𝑗𝑗– 𝑦𝑦𝑖𝑖𝑛𝑛
𝑗𝑗 | 𝑛𝑛𝑖𝑖
2𝑛𝑛2𝜇𝜇(𝑦𝑦) × 𝑛𝑛
𝑛𝑛−1
= ∑ ∑ |𝑦𝑦𝑗𝑗– 𝑦𝑦𝑖𝑖𝑛𝑛
𝑗𝑗 | 𝑛𝑛𝑖𝑖
2μ(𝑦𝑦)𝑛𝑛 (𝑛𝑛−1) (3.19)
Where,
j and i are the leaders being compared in a school;
yj is the average instructional leadership score of leader j; and yi is the average
instructional leadership score of leader i;
|yj - yi| is the absolute difference in the average instructional leadership scores
between leader j and i;
μ(y) is the average instructional leadership score for each school; and
n is the number of leaders identified within a school; in the SII data in this study,
18 Some researchers have used the “mean difference” without repetitions to calculate the G (e.g., Deaton, 1997; Glasser, 1962; Hao & Naiman, 2010), which defined the G in a way that is equivalent to Equation 3.19. However, they did not note the inconsistency with the geometric definition or any implications of this inconsistency. Although their approaches to computing the G (such as Equation 3.10) incorporate the small-sample adjustment, they are not equal to twice the area above the Lorenz curve.

75
n=2 to 18.
Adjusted GDIL to reflect “equality”
GDIL is a concept of “inequality.” However, for the convenience of analysis
and interpretation, I multiplied the GDIL by (-1) in order to reflect the concept of
“equality” instead of “inequality.” Thus, Equation 3.19 is transformed to Equation
3.20 below:
GDIL = ∑ ∑ |𝑦𝑦𝑗𝑗– 𝑦𝑦𝑖𝑖𝑛𝑛
𝑗𝑗 | 𝑛𝑛𝑖𝑖
2𝜇𝜇 (𝑦𝑦)𝑛𝑛 (𝑛𝑛−1) × (−1)
= − ∑ ∑ |𝑦𝑦𝑗𝑗– 𝑦𝑦𝑖𝑖𝑛𝑛
𝑗𝑗 | 𝑛𝑛𝑖𝑖
2μ(𝑦𝑦)𝑛𝑛 (𝑛𝑛−1) (3.20)
Where,
j and i are the leaders being compared in a school;
yj is the average instructional leadership score of leader j; and yi is the average
instructional leadership score of leader i;
|yj - yi| is the absolute difference in the average instructional leadership scores
between leader j and i;
μ(y) is the average instructional leadership score for each school; and
n is the number of leaders identified within a school; in the SII data in this study,
n=2 to 18.
Thus the final adjusted GDIL measures the degree of “equality” to which
instructional leadership functions are distributed across multiple school leaders. The
GDIL now has a minimum of -1 and a maximum of 0. The higher coefficient

76
indicates more equal distribution of leadership, while the lower coefficient indicates
less equal distribution of leadership. While -1 represents complete “inequality”, 0
represents complete “equality.” Also, the small-sample bias for the GDIL is turned
upward: a decrease in sample sizes would be associated with an increase in “equality”
(For details, see Table D.3 in Appendix D).
Application of GDIL to Leadership Functions
I this section, I provide detailed discussions on the application of the GDIL to
examine the distribution of leadership functions among multiple school leaders. As
noted earlier, there are five basic criteria for a robust “dispersed leadership” measure.
I present how the GDIL fulfills these five criteria. Let us see the following examples
of data from two schools:
School A School B
Members Instructional leadership function score
Members Instructional leadership function score
Leader 1 1.0 Leader 5 5.0 Leader 2 1.0 Leader 6 1.0 Leader 3 1.0 Leader 7 0.0 Leader 4 1.1 Leader 8 0.0
It is evident that leadership functions are more equally distributed in School A
than in School B. According to Equation 3.20 above, the estimated GDIL for School
A is -0.1 and for School B is -0.3. As the GDIL reflects the “equality” of leadership
distributed across the members, School A has greater “equality” than School B. The
results show that the GDIL correctly reflects the leadership structure in the two
schools. It also shows that the GDIL fulfills the five basic criteria for a robust measure

77
of “dispersed leadership”:
1. The GDIL addresses both hierarchical and non-hierarchical leadership
relationships. Unlike the span of control or slope of control curve, which reflect
deeply seated hierarchical assumptions about relationships, the GDIL is not concerned
about the nature of relationships. This is important because it is hard to conceptualize
a hierarchy in a school: e.g., among the principal, assistant principal, specialists,
teachers, advisory committees, and etc. As the above two cases show, the GDIL is
primarily concerned with relative the difference betweeen each pair of school leaders
in terms of their leadership scores, whether their relationships are hierarchical or
non-hierarchical. The measure does not require the identification of superiors and
subordinates in schools.
2. The measure is able to deal with multiple roles or individuals
simultaneously. As the above example shows, the GDIL handles four individuals at
once in both School A and School B. It is actually not constrained by the number of
roles or individuals involved in a leadership distribution. This simplifies group
comparisons of distributed leadership among more than two individuals or groups.
For example, the span of control handles only two hierarchical levels of individuals at
once. Separate spans of control need to be developed if multiple levels are to be
examined (e.g., teacher – administrator ratio, teacher – teacher-leader ratio,
teacher-leader – administrator ratio). However, the GDIL is a one single measure that
addresses multiple groups or individuals simultaneously. This makes the GDIL readily
comparable between School A and School B in terms of the variations in leadership
distribution.
3. The GDIL is embedded in descriptions of distinct instructional

78
leadership functions, rather than generic perceptions of “equality” (“inequality”). The
GDIL calculated for the above two schools is based on the leadership functions
reported by the leaders. A few studies have examined the “equality” concept in school
distributed leadership; however, they are based on respondents’ perceptions of
“equality.” For example, Heck and Hallinger (2009a) asked teachers to rate the degree
to which leadership functions are equally distributed among school leaders (on a scale
of 0 to 6). The ratings provided teachers’ generic evaluations of “equality.” The GDIL,
nevertheless, stems from the respondents’ descriptions of the leadership functions
exercised by themselves and other school agents. The estimation of “equality” is
based on the time and/or priority they devoted to a variety of distinct leadership
functions.
4. The GDIL has a clear criterion for “equality” (“inequality”). It has a
minimum of -1 and a maximum of 0. The higher coefficient indicates more equal
distribution, and the lower coefficient indicates less equal distribution of leadership.
While -1 represents complete “inequality,” 0 represents complete “equality.” As the
above example shows, School A has a GDIL of -0.1 and School B has a GDIL of -0.3.
It is therefore easy to compare the levels of “equality” between the two schools.
5. The GDIL is able to handle zero values of leadership functions. This makes
the GDIL excel over several other “equality” (“inequality”) measures.19 In School B,
two leaders report zero scores for leadership functions. Most other “equality”
19 Economists, sociologists, political scientists and statistical physicians have devised numerous inequality or concentration indices. The most popular ones include the Schutz Coefficient (Schutz, 1951), Atkinson’s (1970) indices, the Theil index (Theil, 1979) and the Sen (1973) index for income or welfare distribution; the Herfindahl-Hirschman (HH) index (Herfindahl, 1950) for industrial concentration; Blau’s (1977) index and Teachman’s (1980) index for population diversity; as well as the generalized entropy (GE) family of measures (Cowell, 2000).

79
(“inequality”) measures treat income or other resources as containing no negative or
zero values, and in empirical work cases with negative or zero values will be deleted.
However, the GDIL (or G) is one of the few measures that can be used to examine
zero and negative values (Hao & Naiman, 2010; Ray & Singer, 1973). Similar to the
above example, in some cases school leaders reported in the SII data that they
exercised zero or negligible leadership functions, thus we need a measure which does
not exclude cases with values of zero.

80
CHAPTER IV
TOWARD A THEORY OF DISTRIBUTED INSTRUCTIONAL LEADERSHIP (DIL)
In the previous two chapters I provide an improved conceptualization and
measurement of DIL. In this chapter, I develop a theory about the effects of DIL on
instructional improvement. I focus my inquiry into DIL on two school outcomes (i.e.
“fidelity” to instructional regime and strength of professional community), which
serve as two important “mediators” between school leadership and student learning
outcomes. Based on contingency theory, I believe that DIL influences both outcomes,
yet the influences are contingent upon the school contexts in which DIL is shaped.
Thus I argue that examination of DIL should be embedded in the school contexts. I
identify four school contingencies that are hypothesized to moderate the influences of
DIL on the two outcomes (i.e. average instructional leadership (AIL), task,
leader-leader interaction, and leader-teacher interaction).
In the following discussion, I first review the literature on the two outcomes. I
then review the underlying assumptions of contingency theory, which provides the
theoretical rationale for this dissertation. Finally, I provide a detailed discussion on the
conceptual framework of the relationships between DIL, four school contingencies
and two outcomes, followed by a list of the hypotheses guiding the analytic models
tested in this study.

81
Two Important Mediators between DIL and Instructional Improvement
The bulk of empirical research that attempts to link school leadership to student
learning outcomes found the association not only complex but also indirect (Hallinger
& Heck, 1996; Leithwood et al., 2010). Robinson (2008) has noted that the
complexity lies in the confounding effects of other variables. In most cases, leadership
effects on learning outcomes are “brought about indirectly through their impact on
people, structures, and processes in the school over time” (Heck & Hallinger, 2009, p.
663). Therefore scholars have labeled the leadership effect a “mediated-effect” model
(for details, see Heck & Hallinger, 2009).
Most empirical evidence on distributed leadership also relates to this
“mediated-effect” model. As discussed in Chapter 2, the research shows that
distributed leadership enhances student learning, but is often mediated by
improvement in supportive school conditions. These include teacher commitment
(e.g., Pounder et al., 1995), teacher capacity (e.g., Leithwood & Mascall, 2008),
professional community (e.g., Leithwood et al., 2010), and supportive teaching
environments (e.g., Heck & Hallinger, 2009).
However, the challenge is to identify the mediating variables that are
“susceptible to influence by leaders that are, in turn, powerful enough to have
significant effects on students” (Leithwood & Mascall, 2008, p. 556). Reviewing a
breadth of literature on school improvement, I found two primary strands of research
that suggest two school outcomes as important mediators between school leadership
and student outcomes: “fidelity” to planned instructional regime and school
professional community. The two mediators feature two contrasting strategies to

82
improve instruction. Promoting “fidelity” to implementation of instructional
innovations is a “programmed” approach that changes instruction by promoting
alignment to a well-defined set of instructional regimes so that planned instructional
changes are faithfully implemented. Fostering professional communities in schools is
an “adaptive” approach that changes instruction by encouraging instructional
innovation and autonomy so that commitment to making instructional changes is
enhanced (Rowan & Miller, 2007, p. 254). Whereas the former features a
goal-oriented approach that focuses on conformity to instructional goals, the latter
reflects an organization-oriented approach that focuses on organizational health.
Goal-Oriented Outcome: “Fidelity” to Instructional Regime
The first strand of evidence on school leadership is found in the literature on
school improvements and reforms, where there is prior evidence of the impact of
reforms on student achievement. The general belief is that data-driven whole-school
reform interventions (e.g., CSR programs) improve student academic achievement.
However, the improvement depends largely on schools’ “fidelity” to implementation
of the designed instructional changes (Borman et al., 2003; Rowan & Miller, 2009).
Researchers have noted the importance of distributed leadership to strengthening
implementation “fidelity.” However, they focus on “average leadership,” and dismiss
the “dispersed leadership” perspective when studying the influences of distributed
leadership.
What is “fidelity”? Rowan and Miller (2009) label the degree of
implementation as “fidelity” — “the extent to which those charged with putting a

83
policy or program into operation end up enacting the intentions of
policymakers/program designers” (p. 48). Studies on CSR models show that the
simple adoption of an external reform model will not guarantee the successful
utilization of that model in schools, nor positive school outcomes. There are not only
great challenges to the faithful implementing of these models, but also variations in
implementation outcomes at different locations and under different circumstances
(Datnow, 2005; Rowan et al., 2004). Thus, we should give primacy to measuring the
degree of program implementation before assessing outcomes. Without knowing the
extent to which the designed program is implemented, any attempt to attribute
instructional changes or learning outcomes to a specific program would be invalid and
unreliable (Desimone, 2002).
Although the designers of external models have developed their own
benchmarks for “fidelity,” there is an increasing interest among researchers in
developing post-hoc methods based on empirical data (Desimone, 2002). For example,
Rowan and his associates (2007) measured “fidelity” based on comparisons of
teaching practices between schools affiliated with CSR interventions and schools
characterized by normative teaching practices. “Fidelity” is measured by the degree to
which teaching practices in the CSR schools diverge from those in schools
characterized by normative teaching practices, and the degree to which they comply
with program-endorsed teaching practices in terms of materials, content, strategies
and tasks designed by the specific CSR model (p. 268).
Why is “fidelity” important? The advantages of “fidelity,” especially during
early implementation, have been described by Peurach and Glazer (2012) in the
following way:

84
“ Fidelity affords multiple advantages: mitigating against initially weak
capabilities in outlets; exploiting knowledge already generated and problems
already solved; establishing conventional practices among outlets; developing
understandings of routines and their interdependencies through repetition and
reflection; and avoiding the creation of site-specific problems that outlets are
initially unprepared to manage” (p. 168).
Thus promoting “fidelity” is believed to improve instruction by promoting
conformity to a well-defined set of instructional routines so that planned instructional
changes are faithfully implemented (Rowan & Miller, 2007, p. 254). Borman and his
colleagues (2003), after reviewing more than 230 empirical studies on CSR programs,
revealed that the overall effects of CSR on student achievements were promising.
Specifically, they found an overall effect size of d = .12 for the most widely- used,
nationally-disseminated, and externally-developed CSR models on student
achievements. More importantly, they found that schools that were more committed
to the implementation process generally achieved better student outcomes than those
that were less committed.
Researchers maintain that distributed leadership strengthens and sustains the
implementation of instructional innovations (for a review, see Desimone, 2000).
Although studies have not focused directly on implementation “fidelity,” they have
examined the impact of distributed leadership on the process of implementing
instructional innovations. However, most have focused on the “average leadership”
approach. In general, they have found that “average leadership” exercised by multiple

85
school leaders improved program implementation by strengthening clarity of goals,
promoting monitoring processes (e.g., Correnti & Rowan, 2007) and improving
teacher professional development (e.g. Leithwood & Jantzi, 2010).
However, there are few studies that have taken a “dispersed leadership”
perspective to explore the influences of distributed leadership on “fidelity”, or the
manner in which school contexts affect such influences. In fact, I am unaware of any
study of this sort. However, the implementation of instructional interventions (e.g.,
CSR programs) requires school-wide structural and cultural changes. Changes in
school contexts can have significant effects on leadership practice. For instance,
schools adopting the AC program generally give primacy to the professional
knowledge and skills of a group of professional leaders to convey the standards and
coach the routines to teachers (Rowan & Miller, 2007). In such school contexts,
dispersed leadership might be more likely to contribute to implementation “fidelity.”
Thus more studies are needed to explore the relationship between “dispersed
leadership,” school contexts and implementation “fidelity.”
Organization-Oriented Outcome: Professional Community
The second strand of evidence on school leadership is shown in the literature on
school professional community, where there is prior evidence of school leadership’s
impact on instructional improvement. While promoting “fidelity” to an instructional
regime is a “programmed” approach to improving instruction that focuses on
conformity to instructional goals, fostering professional communities reflects an
“adaptive” approach that focuses on organizational health. Similar to the research on

86
implementation “fidelity,” existing empirical efforts illuminate our understanding of
how “average leadership” fosters school professional community. However, the
effectiveness of “dispersed leadership” is still unknown.
Undoubtedly, promoting conformity to well-defined instructional routines is an
effective strategy for improving instruction. However, rigid stringency in an
instructional regime can also be a source of inertia and inflexibility. It constrains
teacher autonomy and innovation and harms teachers’ motivation to foster changes
(Feldman & Pentland, 2003; Rowan & Miller, 2007). Thus we see a more “adaptive”
approach to instructional improvement. This approach focuses on organizational
health. It seeks to change instruction by fostering professional communities in schools
in which innovation and commitment are highly stimulated (Rowan & Miller, 2007, p.
254).
What is “professional community”? The general idea of professional
community implies a changing view of school structures away from bureaucratic
control to collective professionalism and human capacity. In such a professional
community, responsibility for student academic success is the central guiding force
and teachers’ professional development is an integral component of the community
(Louis & Marks, 1998; Stoll & Louis, 2007). In the most-widely cited model of Louis
and her associates, “professional community” includes five constructs: shared norms
and values, reflective dialogue, academic emphasis, teacher collaboration, and
collective responsibility (for details, see e.g., Louis et al., 1995; Marks & Louis, 1997;
Stoll & Louis, 2007).
Why is “professional community” important? Professional community has been
widely recognized as a valuable quality of school context that helps initiate and

87
facilitate instructional improvement (e.g., Little, 1990; Marks & Louis, 1997; Smylie,
1994; Talbert et al., 1993). It is known as an important lever for promoting and
sustaining professional learning and development (e.g., Bryk et al., 1994;
Darling-Hammond, 1995; Smylie, 1994; Stoll & Louis, 2007). It has also been found
to promote organizational commitment (Liberman, 1995; Mathieu & Zajac, 1990; Dee
et al., 2006). More importantly, it is revealed to directly influence student learning
outcomes. For instance, Louis and Marks (1998) found that the presence of
professional community accounted for 85% of the variance in student achievement
across the schools in their study. In addition, Lee and his colleagues (1995) concluded
from a study on 11,000 students in 820 secondary schools across the US that in
schools characterized by professional communities students had greater academic
gains in math, science, history and reading than students in traditional schools.
Studies have shown that leadership functions spread widely across multiple
leaders help build and sustain professional communities (e.g., Heck & Hallinger, 2009;
Leithwood et al., 2010; Mulford & Silins, 2003). However, these studies used the
“average leadership” to approach distributed leadership. There are few studies that
have taken a “dispersed leadership” perspective to explore the influences of
distributed leadership on professional communities, or the manner in which school
contexts affect such influences. In fact, I am unaware of any study of this sort. Thus
more studies are needed to explore the relationship between “dispersed leadership,”
school contexts, and professional communities in schools.

88
Summary
Following these two strands of research, I focus my inquiry into DIL on two
mediators that are important to forging links between school leadership and student
outcomes: “fidelity” to instructional regime and strength of professional community.
These two mediators feature two contrasting strategies to instructional improvement.
While the former signals a goal-oriented “programmed” approach that focuses on
conformity to instructional goals, the latter reflects an organization-oriented “adaptive”
approach that focuses on organizational health (Rowan & Miller, 2007, p. 254).
However, existing research on the effects of distributed leadership on these two
outcomes lacks a “dispersed leadership” perspective. Additionally, it has not taken
into account the school contexts in which distributed leadership is embedded. Thus,
more studies are needed to explore the relationships between “dispersed leadership,”
school contexts, and two outcomes.
Theoretical Framework: Contingency Theory
In this dissertation, I base my quest for DIL on a widely-known organizational
theory: contingency theory. I argue that the effects of DIL on both the “programmed”
and “adaptive” approaches to improving instruction are situationally contingent. As
Harris (2008) has noted: “The key to success for distributed leadership is the
conditions in which leadership is facilitated, orchestrated and supported” (p. 173).
Thus, when we seek “equality” of DIL to benefit instructional improvement, we
should also be attentive to the ground on which distributed leadership is spawned and

89
flourishes.
Formulated in the 1960s, contingency theory is concerned with the relationship
between organizational structure, work task and environment. Contingency theorists
perceive organizations to be rational, yet constrained by various contingent factors
(Simpson, 1985, p. 416). The literature has seen numerous complicated contingency
models (e.g., Burns & Stalker, 1961; Lawrence & Lorch, 1986; Mintzberg, 1980;
Perrow, 1967; Peterson, 1984; Scott, 1995; Simpson, 1985; Terreberry, 1968;
Thompson, 1967; Woodword, 1965). However, the core idea across these models is
consistent: how an organization works is contingent upon its task and environmental
conditions. Varying patterns of organizational structure and processes are effective
under varying task and environmental conditions. And organizational design is
effective to the extent that it is appropriately “fit” to its task and environmental
circumstances.
There are also a number of evolved contingency models of leadership. In these
models, leadership effectiveness is generally viewed as “a joint function of leader
qualities and situational demands as contingencies interacting to make leader qualities
variously appropriate to the task at hand” (Hollander & Offerman, 1990, p. 180).
These models identify some important contingency factors that facilitate or impede
the effectiveness of various types of leadership (e.g., autocratic vs. group leadership,
goal-oriented vs. relation-oriented leadership). The most critical contingent factor
identified for organizational structure and leadership practice is the organizational
task (e.g., routine vs. non-routine) (Fiedler, 1967; House, 1971; House & Mitchell,
1974; Peterson, 1984; Tosi, 1991; Vroom & Yetton, 1973). For instance, in the
normative model of Vroom and Yetton (1973), group leadership is believed to be more

90
effective in organizations in which non-routine tasks are performed, while autocratic
leadership is expected to be more effective in organizations in which routine-tasks are
undertaken. Other contingent factors identified include leaders’ influence/power over
others (e.g., the amount of leadership exercised by leaders), and the social ambience
that exists among leaders and members (e.g., leader-member relations, leader-leader
relations) (Fiedler, 1976; Tosi, 1991). These and other contingent factors are found to
affect leadership effectiveness for organizational performance.
Therefore, in light of broad contingency theory, I argue that the effects of
distributed leadership are situationally dependent. Whether distributed leadership is
effective at generating desired school outcomes depends on the nature of task (e.g.,
routine vs. non-routine) and the environmental demands of the school. Organizational
task has been identified by numerous contingency models as one of the most critical
contingent factors that influence organizational structure and leadership practice (e.g.,
Woodward, 1965; Perrow, 1967). I believe the nature of teaching tasks undertaken by
a school influences the effectiveness of distributed leadership for school outcomes.
However, I also identify three other environmental factors: average instructional
leadership (AIL), leader-leader interaction, and leader-teacher interaction. I
hypothesize that the influences of DIL on “fidelity” to instructional regime and
strength of professional community are contingent upon these four school
contingencies.

91
DIL, Four School Contingencies and Two Outcomes
Based on contingency theory, in this section, I provide a detailed discussion on
the relationships between DIL, four school contingencies and two outcomes. My
central hypothesis is that the direct influences of DIL on the two outcomes are not
significant. Rather, the influences are conditional on the four school contingencies.
Conceptual Model
Figure 4.1 below presents the conceptual model for this dissertation. The
conceptual model depicts the relationships between DIL, four school contingencies
and two outcomes. I focus my inquiry into DIL on two mediators that have long been
found to link leadership practice to student outcomes: “fidelity” to instructional
regime and strength of professional community. The two outcome variables feature
two contrasting strategies for improving instruction. Whereas the former features a
goal-oriented approach that focuses on conformity to instructional goals, the latter
reflects an organization-oriented approach that focuses on organizational health.
With contingency theory as a guiding framework, I believe that the
investigation of DIL should be anchored in school contexts. I identify four contingent
school factors that are hypothesized to influence the two outcomes (See Figure 4.1:
path 1). 1) Average instructional leadership (AIL). AIL refers to the average
instructional leadership functions excised by multiple school leaders. Higher levels of
AIL are hypothesized to promote both implementation “fidelity” and professional
community. 2) The nature of tasks (i.e. routine vs. non-routine). Teaching tasks that

92
are more routine are hypothesized to lead to higher levels of “fidelity” but lower
levels of professional community. Conversely, teaching tasks that are more
non-routine will lead to lower levels of “fidelity” but higher levels of professional
community. 3) The frequency of interaction within the formal leader team. 4) The
frequency of interaction between leaders and teachers. More frequent interaction
between leaders and between leaders and teachers is anticipated to lead to higher
levels of both implementation “fidelity” and professional community.
While I examine the influences of the four contingencies on the two school
outcomes, my primary interests center on the manner in which they moderate the
influences of DIL on the two outcomes. In Figure 4.1, the dark arrow from the four
school contingencies to the relationships between DIL and the two outcomes suggests
that the four contingent variables are expected to moderate the influences of DIL on
the outcomes (Figure 4.1: path 2). I highlight this arrow in order to emphasize my
focus on these moderating effects. Based on contingency theory, I conjecture that the
effects of DIL on the two outcomes are situationally contingent. My central
hypothesis is that the four school contingencies reinforce the positive influences of
DIL on the two school outcomes. Specifically, DIL has stronger positive effects on the
two outcomes in schools characterized by higher levels of AIL, non-routine tasks, and
more frequent leader-leader and leader-teacher interaction. By contrast, DIL is less
likely to contribute to the two outcomes in schools in which low AIL is exercised,
tasks undertaken are routine, and leaders do not interact frequently with other leaders
or with teachers.

93
In the following sections, I provide separate discussions on how each of the
four contingent variables moderates the influences of DIL on the two outcomes. I also
develop a list of hypotheses guiding the analytic models tested in this study.
Figure 4.1 Conceptual Model of the Relationship between “Equality” of DIL, Four
School Contingencies and Two School Outcomes

94
Moderating Effect of Average Instructional Leadership (AIL)
The first contingent variable for DIL is the average instructional leadership
(AIL) exercised by multiple roles or individuals in the school. As discussed in Chapter
3, both the “dispersed” and “average” perspectives are important to understand
distributed leadership. While DIL focuses on “dispersed leadership” (equality), I
include both perspectives in my empirical inquiry into DIL. Here, instead of
perceiving “average leadership” as a measure of DIL, I view it as a contingent factor
of “dispersed leadership” to benefit school improvement.
Strong AIL exercised by multiple school leaders is associated with higher levels
of implementation “fidelity” to large-scale instructional changes. The design of CSR
models (e.g., AC, ASP, or SFA) mandates a strong focus on instructional leadership
for both existing leaders and newly-designated leaders (Barnes et al., 2004). Empirical
evidence shows that the exercise of strong instructional leadership strengthens the
implementation of CSR programs. For instance, strong instructional leadership
exercised by principals has facilitated the adoption and implementation of CSR
models (e.g., Leithwood & Montgomery, 1982; Rowan et al., 2004; Smith et al.,
1998). Also, studies on multiple leaders found that higher levels of group “average
leadership” improved program implementation by promoting clarity of goals,
monitoring processes (e.g., Correnti & Rowan, 2007), teacher professional knowledge
(e.g., Haynes, 1998; Leithwood & Jantzi, 2010), and problem solving within
classrooms (Borman et al., 2003).
Also, strong AIL leads to high levels of professional community in schools.
Waters, Marzano and McNulty (2003), by reviewing thirty-years of research on

95
school leadership, found an average effect size of 0.29 of school instructional
leadership on professional community. Empirical evidence shows that strong
instructional leadership spread widely among multiple leaders helps build and sustain
professional community (e.g., Leithwood et al., 2010; McLaughlin & Talbert, 2007;
Mulford & Silins, 2003; Stoll & Louis, 2007). It is also found to contribute to the
important components of a professional community. These include teacher reflective
practice and professional growth (Blasé & Blasé, 2000), teacher commitment (e.g.,
Devos et al., 2014; Hulpia et al., 2009a; Pounder et al., 1995), teacher motivation (e.g.,
Leithwood & Mascall, 2008), and school learning environments (Heck & Hallinger,
2009, 2010).
While I examine the effects of AIL on the two school outcomes, my primary
hypothese focus on the manner in which AIL moderates the influences of DIL on the
two outcomes. I hypothesize that the effectiveness of DIL for the two outcomes is
contingent upon levels of AIL. DIL is conceptualized and measured by “dispersed
leadership,” which addresses the differentiation (e.g., equality) of leadership across
roles or individuals within the group. It does not focus on the overall strength of
leadership excised by the entire group of leaders. Instead, “average leadership”
addresses this problem. “Average leadership” measures whether a group displays a
widely distributed pattern of leadership across multiple roles and individuals. The two
perspectives should be combined to explore the effects of DIL on school outcomes.
When we seek more equal distribution of instructional leadership across roles or
individuals within a group, we cannot overlook the actual amount of instructional
leadership exercised by the group.
In other words, distributed leadership should be concerned not only about the

96
“equality,” but also about the “strength” of leadership. Equally distributed
instructional leadership is contributive to school outcomes only when school members
exercise strong instructional leadership functions. If no or weak instructional
leadership functions are actually exercised, the performance of schools is unlikely to
benefit from “equality.” In schools in which leadership is equally distributed, those
with strong leadership exercised by school members are expected to have high levels
of implementation “fidelity” and professional community. Conversely, schools with
weak leadership will have low levels of “fidelity” and professional community. Thus,
even when there is a high “equality” of leadership being distributed across multiple
roles or individuals, if school members do not exercise leadership schools are unlikely
to benefit from the “equality.” Comparing the two cases (i.e. equal with strong
leadership vs. equal with weak leadership), we can infer that leadership practice is
more effective when leadership is not only equally distributed, but also has high
overall strength.
Thus I hypothesize that strong school AIL is an important contingent factor for
DIL to benefit the two outcomes. The “equality” of DIL has stronger positive effects
on “fidelity” and professional community in schools in which the leaders to which
leadership is distributed exercise higher levels of AIL. Alternatively, it has weaker
effects on the two outcomes in schools in which lower levels of AIL exist.
Hypothesis 1: Average instructional leadership (AIL) is an important
moderating variable for “equality” of DIL (see Figure 4.1a).
Hypothesis 1.1: “Equality” of DIL has stronger positive effects on “fidelity” to
instructional regime in schools with higher levels of AIL.

97
Hypothesis 1.2: “Equality” of DIL has stronger positive effects on
professional community in schools with higher levels of AIL.
Figure 4.1a Conceptual Model of the Relationship between “Equality” of DIL,
Average Instructional Leadership (AIL) and Two School Outcomes
Moderating Effect of Task
According to contingency theory, organizational task (or technology) is one of
the most critical contingent factors that explain the variation in the structures and
effectiveness of rational organizations (Daft, 2009; Perrow, 1967; Thompson, 1967;
Woodward, 1965).20 The nature of tasks influences the effectiveness of organizational
20 Technology is defined by Daft (2009) as the tools, techniques, machines, and actions used by an

98
structures, in which distributed leadership is favored or not. Therefore, I hypothesize
that the effectiveness of distributed leadership for the two school outcomes is
contingent upon the tasks (i.e. routine vs. non-routine) involved.
Tasks can be understood as the unique tools, techniques, machines and actions
used by specific work units or particular organizational processes within an
organization (Perrow, 1967). In schools, while the “core” technology is instruction,
the tasks of instruction vary across sub-units or particular processes within schools
and across different school contexts. The most popular theoretical framework of
organizational task is that of Perrow (1967).21 He argues that when a task process is
routine, the problems are predictable and the tasks can be reduced to mechanical steps.
However, when a task process is less routine the work is unpredictable and problem
solving relies largely on participants’ expertise and ability, rather than on readily
available procedures.22
In schools, the task of instruction is a strong predictor of both implementation
“fidelity” to instructional regimes and strength of professional community. On the one
hand, routine tasks are important levers for instructional changes. Whether or not
actors will faithfully implement new instructional practices largely depends on
organization to transform organizational inputs (materials, information, ideas) into outputs (products and services). While organizations are distinguished by their “core” technology (Thompson, 1967), the specific work units or particular organizational processes within an organization have their own unique technology, which is often referred to as task (Perrow, 1967). 21 Perrow (1967) identified “analyzability of exceptions” for understanding organizational tasks. The term refers to the viability of analyzing task variability (the frequency of unexpected events) and processes. 22 Perrow’ s (1967) notion of “analyzability of exceptions” is echoed in other concepts, such as uncertainty (March & Simon, 1958; Hickson, Hinings, Lee, Schneck, & Pennings, 1971), predictability (Comstock & Scott, 1977), complexity (Duncan, 1972; Rowan, 1994), variety (Rowan, 2002), uniformity (Litwak, 1961), and routine (Becker, 2004; Feldman & Pentland, 2003). Based on Perrow’s theoretical framework, researchers have developed several components of task, including frequency of repetition, possibility of guidance, specificity of the sequence of steps and procedures of practices, among others (Withy, Daft, & Cooper, 1983).

99
multiple forms of knowledge-based “routines” (Peurach & Glazer, 2012). Routine
tasks provide stability, cognitive efficiency and organizational learning, which are the
fundamental conditions for generating changes (Becker, 2004; Feldman & Pentland,
2003). In contrast, uncertainty of tasks has resulted in unsuccessful implementation of
some locally-developed CSR programs (Desimone, 2000).
On the other hand, researchers caution that routine tasks jeopardize professional
communities in schools. The general concern is that “routines” can be sources of
inertia and inflexibility (Feldman & Pentland, 2003). Teachers’ autonomy in
classrooms and initiative in innovation is often inhibited by the standardized
procedures and repetitive steps in instruction. Also, “routines” reduce the need for
reflective dialogues and interaction among teachers concerning issues of curriculum,
pedagogy, student development, problem solving, student evaluation, and etc. This
will eventually result in decreased teacher trust, collaboration, and sense of
appreciation for expertise, which are important components for a cooperative
professional community in a school. Thus, teaching tasks that are more routine lead to
higher levels of “fidelity” to instructional regime but lower levels of professional
community. Alternatively, teaching tasks that are non- routine result in lower levels of
“fidelity” but higher levels of professional community.
While I examine the effects of tasks on the two school outcomes, my primary
interest lies in how the nature of tasks affects the effectiveness of DIL for the two
outcomes. I believe that distributed leadership is required by certain organizational
structures, the effectiveness of which is conditioned by the nature of tasks. The
contingent model of Burns and Stalker (1961) identifies two basic contrasting types of
organizational structure — “mechanistic” and “organic.” The implication of this

100
categorization for distributed leadership is that each type of organizational structure
contributes to a unique organizational context that facilitates or inhibits distributed
leadership. Mechanistic forms of organization are characterized by emphasis on rules,
top-down hierarchy, formalization, and tight coupling (i.e., the degree of
interdependence between operating units). It can be inferred that in such forms of
organization, distributed leadership is unlikely to happen. However, organic forms of
organizations are featured by loosely coupled and less rule-bound management and
subordinate empowerment in decision making. Schools within organic structures
require distributed leadership.
The nature of tasks influences the effectiveness of organizational structures, in
which distributed leadership is required or not. The general proposition advanced in a
number of contingent models is that the mechanistic form of organization is most
effective in organizations in which tasks are routine and predictable. However, the
organic form of organization is most effective in organizations in which tasks are
non-routine and unpredictable (Burns & Stalker, 1961; Lawrence & Lorsh, 1967;
Perrow, 1967; Woodward, 1965). Thus, distributed leadership, which is often seen in
organic forms of organization, is best suited for the performance of non-routine tasks.
However, inhibited by mechanistic forms of management, distributed leadership is
less effective in organizations in which routine tasks are undertaken. This argument
finds support in research on relationships between tasks and more specific forms of
organizational structure. For instance, Jones and his colleagues (1997) provide a
theory on the network structure of governance among multiple leaders. They argue
that when tasks are non-routine and uncertain, the network structure of governance
has advantages over hierarchical forms of governance. Likewise, Hickson and his

101
colleagues (1971) maintain that greater distribution of organizational controls is more
effective when a subunit copes with more uncertain tasks.
Therefore, I hypothesize that organizational task is an important moderating
variable for DIL. The “equality” of DIL is more effective in schools in which teaching
tasks are more non-routine and uncertain, but is less effective in schools in which
teaching tasks are more routine and certain.
Hypothesis 2: Organizational task is an important moderating variable for
“equality” of DIL (see Figure 4.1b)
Hypothesis 2.1: “Equality” of DIL has stronger positive effects on “fidelity” to
instructional regime in schools in which tasks are more non-routine and
uncertain.
Hypothesis 2.2: “Equality” of DIL has stronger positive effects on
professional community in schools in which tasks are more non-routine and
uncertain.

102
Figure 4.1b Conceptual Model of the Relationship between “Equality” of DIL,
Organizational Task and Two School Outcomes
Moderating Effect of Leader-Leader and Leader-Teacher Interaction
The final two contingent variables for DIL are leader-leader interaction and
leader-teacher interaction. Leadership is a system of relationships embedded in
constraints as well as opportunities (Stewart, 1982). Many types of organizational
influence depend on frequent interaction of leaders with each other and with their
subordinates. Such influences include organizational loyalties, advice from superiors,
training and socialization, and etc. (Crowson & Morris, 1985). Frequent leader
interaction with other organizational members is likely to influence the effectiveness
of leadership practice for organizational outcomes. However, researchers have noted
critically that most studies on leadership “ignore leader relations with superiors, peers
and other constituencies” (Ammeter, Douglas, Gardner, Hochwarter, & Ferris, 2002,

103
p. 752).
Despite a lack of systematic theory and empirical evidence, some researchers
have pointed out the importance of frequent interpersonal interaction within a school
in theories of distributed leadership (e.g., Cronn, 2002; Pearce & Conger, 2003;
Spillane et al., 2001; Woods, 2004; Yukl, 2008). For example, Woods’ (2004)
structure-agency perspective on distributed leadership highlights collaborative actions
of school members in addition to the structural distribution of leadership. This idea is
also expressed by Gronn (2002), who conceptualizes distributed leadership as the
concertive action of informal networks and the social aspect of leadership activity,
together with the formal distribution of leadership through the division of labor.
However, these theories have not been substantiated by empirical inquiries.
Moderating effect of leader-leader interaction
An interactive leader team is characterized by frequent leader-leader interaction
in instructional activities. School leaders interact with each other frequently in both
formal and informal meetings. They work together closely to lead the school, express
professional views and values freely, create opportunities for meaningful participation,
and seek integrative solutions to decision making (Devos et al., 2014; Hulpia &
Devos, 2010). I believe that frequent leader-leader interaction contributes to school
improvement. More importantly, it is an important contingent factor for distributed
leadership to influence school improvement.
Studies have demonstrated the significant potential of frequent leader-leader
interaction to bring about faithful implementation of instructional innovations. For
instance, Leithwood and Montgomery (1982) reviewed the research on principal

104
leadership and implementation of instructional innovations. They concluded that
principals who interacted frequently with either school or district leaders promoted
the implementation of instructional innovations. Orr and his colleagues (2008)
examined the school improvement experiences of four persistently low-performing
schools. They found that leaders not having frequent interaction in instructional
activities led to failed progress of program implementation. Also, in a longitudinal
study of elementary schools in New Zealand, Timperley (2005) discovered that
frequent interaction between principals and informal teacher leaders during various
kinds of meetings facilitated teachers’ instructional changes.
Empirical evidence also indicates the contributing role of frequent leader-leader
interaction in fostering professional communities in schools. For instance, Harrison
(2005) found that frequent leader-leader interaction at regular faculty meetings,
committee meetings and grade-level teaching team meetings allowed for a
professional community in which teacher collaboration had been improved. Barnett
and McCormick (2003) concluded from a qualitative study that leader-leader
interaction through frequent communication and participation strengthened a shared
purpose among teaching members. Also, Hulpia and his colleagues (2009a) found in a
quantitative study that the presence of an interactive leader team (i.e. one with group
cohesion, role clarity, and goal orientedness) had a significant positive impact on
teachers’ organizational commitment.
More importantly, I believe that frequent leader-leader interaction strengthens
the positive effects of DIL on the two outcomes. There are two primary reasons. First,
frequent leader-leader interaction mitigates against the possible incoherence and
fragmentation resulting from distributed leadership. Bryk (1999) has warned that one

105
potential problem resulting from distributed leadership is school incoherence and
fragmentation. Frequent leader-leader interaction, however, helps maintain coherence
of core missions and task routines both within leader team and across the entire school.
Multiple leaders to which leadership is distributed might have different
understandings of goals and possess different sets of expertise and skills required to
solve the problems of instructional improvement (e.g., curriculum, pedagogy, or
networking). These differences might lead to incoherence and discrepancy when they
communicate the goals and coach the routines to teachers. Frequent leader-leader
interaction and communication strengthens the shared understanding of goals and
tasks, which helps maintain coherence both within the leader team and across the
entire school.
Second, frequent leader-leader interaction contributes to integrative solutions to
resistance and conflicts among leaders, so that both formal and informal dimensions
and all levels of leadership can be better involved in leadership distribution. For
instance, when an informal actor who possesses specialized expertise and skills starts
to perform leadership functions spontaneously, his or her role assignments might be
poorly defined (Leithwood & Jantzi, 2000). Ambiguity in leadership role can lead to
resistance and conflicts with other formal leaders who feel that an informal leader is
taking their jobs. Also, when major changes are initiated by top-level leaders, they
often meet with strong resistance by middle- and lower-level leaders (Yukl, 2008).
This is because top-down changes can harm their sense of security, which derives
largely from the stability of the social environment (Harris, 2008; Melnick, 1982). In
these cases, leaders need to express their feelings and ideas through open
communication channels (e.g., formal and informal meetings) in order to clarify role

106
assignments and seek integrative solutions to decision making.
Therefore, frequent leader-leader interaction helps maintain school coherence
and fight resistance, making distributed leadership possible in both formal and
informal dimensions and at all levels. Accordingly, I develop the following
hypotheses:
Hypothesis 3: Leader-leader interaction is an important moderating variable for
“equality” of DIL (see Figure 4.1c).
Hypothesis 3.1: “Equality” of DIL has stronger positive effects on “fidelity” to
instructional regime in schools with more frequent leader-leader interaction.
Hypothesis 3.2: “Equality” of DIL has stronger positive effects on
professional community in schools with more frequent leader-leader
interaction.

107
Figure 4.1c Conceptual Model of the Relationship between “Equality” of DIL,
Leader-Leader Interaction and Two School Outcomes
Moderating effect of leader-teacher interaction
In addition to leader-leader interaction, leader-teacher interaction is also an
important moderating variable for DIL to influence the two outcomes. Leader-teacher
interaction refers to the frequency of instructional leaders observing teachers teaching,
modeling instruction for teachers, studying their students’ work, and giving teachers
feedback about their teaching techniques, use of curriculum materials, and learning of
subject matter. The importance of frequent leader-teacher interaction is noted by early
organizational theories.23 I hypothesize that frequent leader-teacher interaction leads
23 The most widely-known is the general social network theory, which highlights the ties (relationships) embedded in interactions among social actors to benefit organizational performance (Wasserman & Faust, 1994). The importance of specific subordinate-supervisor interaction is implied in the leader-member exchange (LMX) theory (or leader-teacher dyad linkage (VDL) model) (Dansereau, Graen, & Haga, 1975; Graen & Cashman, 1975) and

108
to improved implementation “fidelity” and professional community. More
importantly, DIL contributes better to the two outcomes in schools in which leaders
interact with teachers frequently.
Frequent leader-teacher interaction promotes the implementation of
instructional innovations. Through frequent interactions with teachers, school leaders
are better able to mobilize and guide teachers to foster instructional changes (Spillane
et al., 2001). In schools affiliated with the CSR models, teachers who reported more
frequent interaction with leaders perceived greater clarity in goals and were more
committed to reform efforts (Barnes et al., 2004). It has also been found that frequent
leader-teacher interaction improved teachers’ understanding of new instructional
practices and increased their emphasis on problems of practice. Moreover, frequent
leader-teacher interaction leads to improved professional knowledge and skills of
teachers, essential for making instructional changes (for a review, see Desimone,
2002).
Several lines of research have also demonstrated a great deal of potential
brought about by frequent leader-teacher interaction to foster schoo professional
community. For instance, decades of research on leader behavior shows that leaders’
relation-oriented behaviors (i.e. behaviors focusing on improving human resources
and relationships) promote job satisfaction and build mutual trust (e.g., Blake &
Mouton, 1982; Fleishman, 1953; Yukl, 2008). Also, evidence on supportive leaders
transactional leadership theory (e.g., Howell & Avolio, 1993). The general proposition advanced in these theories is that leader-follower relationships, based on a series of dynamic exchanges or bargains, are important for organizational performance (Howell & Avolio, 1993; Yukl, 1989). Subordinates who report higher levels of leader-member exchanges with their supervisors assume more job responsibility, have higher levels of work satisfaction and are more productive than those with lower-quality relationships (Graen, Novak, & Sommerkamp, 1982; Liden & Graen, 1980).

109
shows that leadership support for teachers reinforces an amicable climate (House,
1971) and promotes teacher commitment (e.g., Fiedler & Garcia, 1987; Ingersoll,
2001; Singh & Billingsley, 1998). Literature on leader mentoring and modeling
indicates that frequent leader-follower interaction through mentoring and modeling
not only improves the followers’ communication and innovations (e.g., Bandura, 1986,
Drory & Romm, 1990; Little, 1990; Smylie & Denny; 1990; Starratt, 2003; Stoll et al.,
2006), but also facilitates the mentoring leaders’ professional learning and
development (e.g., Manz & Sims, 1986; Rowan, 1990; Tellez, 1992; Wasley, 1991).
More importantly, I hypothesize that frequent leader-teacher interaction
moderates the influences of DIL on the two outcomes. This presupposition is based on
two reasons. First, the exercise of leadership functions (e.g., goal setting, monitoring,
and staff development) that are distributed among multiple leaders will not actually
improve teachers’ practice if leaders do not interact with teachers frequently. Leaders
are expected to promote teachers’ teaching practice by performing various
instructional leadership functions. For example, one critical function of instructional
leaders is delivering shared goals and task routines to teachers. However, teachers’
accurate understanding of goals and faithful accomplishment of tasks requires
frequent discussions with instructional leaders about instructional issues, on-site
observation of leaders’ practice, and feedback from leaders about their practice. Thus
the excise of leadership functions is beneficial only if it actually influences teachers’
classroom teaching, and such influence requires frequent interaction between leaders
and teachers.
Second, frequent leader-teacher interaction improves teachers’ acceptance of
distributed leadership, which will influence the eventual effectiveness of distributed

110
leadership. Contingency models of leadership imply that whether or not subordinates
accept leadership practice facilitates or inhibits leadership effects on organizational
performance (e.g., Fiedler, 1967; House, 1971; Tosi, 1991; Vroom & Yetton, 1973).
Distributed leadership requires the restructuring of leadership and reconfiguration of
management. This can harm teachers’ sense of security and raise anxiety, which will
eventually culminate in their resistance to distributed leadership (Harris, 2008). For
example, in some CSR models which mandate the appointment of new leader roles
(i.e. CSR coaches and coordinators), some teachers feel that the imposed top-down
addition of new leaders mitigates against their individual autonomy and initiatives for
innovation (Barnes et al., 2004). Instead, frequent leader-teacher interaction through
extensive communication and coordination has been found to increase teachers’ trust
in leaders (Wasley, 1991; Yukl, 2008; Morgeson et al., 2010), ease their anxiety and
boost their commitment to changes (Ingersoll, 2001; Stoll et. al, 2006). This leads to
improved teacher acceptance of leaders to whom leadership is distributed.
Accordingly, the following hypotheses are developed:
Hypothesis 4: Leader-teacher interaction is an important moderating variable
for “equality” of DIL (see Figure 4.1d).
Hypothesis 4.1: “Equality” of DIL has stronger positive effects on “fidelity” to
instructional regime in schools with more frequent leader-teacher interaction.
Hypothesis 4.2: “Equality” of DIL has stronger positive effects on
professional community in schools with more frequent leader-teacher
interaction.

111
Figure 4.1d Conceptual Model of the Relationship between “Equality” of DIL,
Leader-Teacher Interaction and Two School Outcomes

112
CHAPTER V
DATA AND METHODS
In Chapter 5, I describe the research procedures used to examine the
relationship between DIL, four school contingencies and two school outcomes. I
begin with a description of the data sources and the sample used in the study. This is
followed by a discussion of the selection, construction, and properties of the measures
used in the research models. Finally, I conclude with a detailed description of the
statistical models applied to each particular analysis conducted to answer the research
questions and test the hypotheses developed earlier in the study.
Data and Sample
In order to address my research questions and test my hypotheses, I needed a
sample of schools undergoing school improvement. I needed data that provided
adequate information on the measures of the two outcome variables: “fidelity” to
instructional regime and professional community. Also, the measures of GDIL and
leadership functions were required. To get these data, I used Study of Instructional
Improvement (SII) data in which important information on schools, leaders, teachers,
and instructional practices was provided.

113
Data Source: Study of Instructional Improvement (SII)
In this study I used the four-year (academic year 2000-2001 through 2003-1004)
longitudinal data from the Study of Instructional Improvement (SII). The SII study
was conducted by the University of Michigan, in cooperation with the Consortium for
Policy Research in Education (CPRE). It was a large scale, multi-level,
quasi-experimental study that explored the design, implementation and instructional
outcomes of three of the most widely-adopted Comprehensive School Reform (CSR)
programs in the United States: the Accelerated Schools Project (ASP), America’s
Choice (AC), and Successful For All (SFA). The SII study provided the following
data that allowed me to address my research questions:
1) measures of the two outcome variables. The Teacher Logs provided
instructional measures essential to estimating teachers’ “fidelity” to instructional
regimes. Also, the measures of professional community were drawn from the Teacher
Questionnaire (TQ).
2) a comprehensive list of leadership functions. Measures of instructional
leadership functions were drawn from the School Leader Questionnaire (SLQ), based
on which the measures of the GDIL and AIL were developed.
3) respondents from leader who fulfilled a variety of leadership roles (i.e.
principal, assistant principal, CSR coach, other instructional leaders). Information on
different leadership roles allowed for an examination of variations in leadership
exercised by multiple roles or individuals.
4) multilevel analyses in which teachers were nested within schools, allowing
for a study on DIL controlling for both teacher and school characteristics.

114
Instruments and Samples
In this section I discuss the instruments and samples used in the study. The
instruments included the School Characteristics Inventory (SCI), School Leader
Questionnaire (SLQ), Teacher Questionnaire (TQ), and Language Arts Teacher Logs
(LALOGS).24 The SCI provided information on school tasks and other school
characteristics. The SLQ provided data on leadership functions, leadership roles, and
leader-leader interaction. The TQ collected data on teacher perceptions of school
professional community, leader-teacher interaction and other teacher characteristics.
Instructional measures used to assess the implementation “fidelity” of CSR models
were drawn from the LALOGS.
Schools
The School Characteristics Inventory (SCI) provided important information on
school characteristics, including school tasks, school size, disadvantage levels,
percentage of leadership roles, and average academic levels (for details, See Appendix
I).
The final sample in this study included a total of 109 elementary schools
serving K-5 students. These schools were located in 45 different school districts
spanning 17 different metropolitan areas and in 15 different states.25 The sample was
composed of 31 schools implementing the AC program, 28 schools implementing the
24 The survey instruments used in this study can be found on the study’s website at www.sii.soe.umich.edu. 25 The original sample included a total of 114 schools surveyed. However, in order to have a valid GDIL both conceptually and methodologically, at least two leader respondents had to be present in a school. There were five schools in which only one leader respondent was present. Thus these schools were deleted from the sample, resulting in a final sample of 109 schools.

115
SFA program, 28 schools implementing the ASP program, and 22 comparison schools
which had not adopted any of these interventions at the beginning of the study.26 By
design, however, the SII study intended to explore instructional improvement in
high-poverty settings. Thus socio-economically disadvantaged schools were
overrepresented in the sample, which had a greater percentage of high-poverty
students than would be expected in a representative sample of U.S schools.
Leaders
School leaders in the SII were expected to complete the School Leader
Questionnaires (SLQ) for all four years of the survey. The SLQ provided data on
leadership functions performed by multiple school leaders in the CSR context.
Specifically, a set of questions surveyed the school leaders on their assessment of
what leadership functions they exercised, how they prioritized these leadership
functions, and how they practiced these leadership functions (for details, see
Appendix C). Based on the leader-level measures of leadership functions, school-level
measures of the GDIL and AIL were then developed.
It should be noted that the SII was particularly interested in school leaders who
served in formally-designated leadership positions. The SII used a standard protocol
to identify all individuals on a list of formally-designated leadership positions in each
school (see Appendix A, for the leader list). In addition to normal administrators 26 The sample of schools in this study was obtained in four steps. First, a complete list was compiled of all U.S. public elementary schools that had begun their implementation of AC, ASP, or SFA interventions in the 1998-1999, 1999-2000, or 2000-2001 academic years. Second, 17 geographic regions were selected from which to sample schools. Then intervention schools from these regions were selected. Finally, a set of “comparison” schools was chosen to match the selected intervention program schools in terms of the geographic areas and neighborhood features (e.g., household poverty, unemployment). The selection of schools was intended to balance the sample in terms of geographic location, schools’ demographic characteristics, and years working with the CSR programs.
116
(principal and assistant principal) and other leadership roles (subject area coordinator,
special program coordinator, or master/mentor teacher), some of the interventions
created new leadership positions (CSR program coordinator or coach). Thus in the SII
research, the school leaders surveyed included not only principals, assistant principals
and subject area coaches, but also CSR program coordinators and coaches.
The final sample included 690 school leaders who fit into the four
formally-designated leader positions: principal, assistant principal, CSR coach (ASP
coach/internal facilitator, AC coach and literacy coordinator, SFA reading or math
facilitator), and other instructional leaders whose roles were not associated with a
CSR program (subject area coordinator, special program coordinator, or
master/mentor teacher). Specifically, the formally-designated leader team included
164 principals, 122 assistant principals, 196 CSR coaches, and 208 other instructional
leaders over the four years of research. On average, there were 6.3 instructional
leaders present per school, with a range of two to 18 (see Appendix B, for a detailed
discussion on how leader samples were drawn for four years of survey).
Among the total 690 leaders who should have responded to the SLQ, some
failed to do so. There were 80 leaders who had an established presence in the school
but did not respond to any of the four years’ SLQs. The 80 missing cases included 20
principals out of the 164 identified, 15 assistant principals out of the 122 identified, 15
CSR coaches out of the 196 identified, and 30 other instructional leaders out of the
208 identified (for details, see Appendix B).
These 690 individual scores on instructional leadership functions were used to
create the school-level measures of the GDIL and AIL for a total of 109 schools for
four years of the survey. The GDIL measured the degree to which instructional

117
leadership functions were “equally” distributed across all school leaders who fit into
the four leadership roles defined above. AIL measured the average score of
instructional leadership functions exercised by all the school leaders who fit into the
four leadership roles. Finally, I aggregated each school’s GDIL and AIL across
multiple years of observations, after controlling for the 80 missing leadership roles. A
detailed discussion about this will be provided later.
Teachers
In the SII study, teachers of all grades (K-5) and of all subjects and assignments
were asked to complete the Teacher Questionnaire (TQ) for four years. Data from the
TQ were drawn to create measures of professional community, measures of
leader-teacher interaction, and other teacher demographic characteristics. The TQ
asked teachers about their perceptions of their school and its faculty, their experiences
with school improvement efforts, professional development opportunities,
demographic information, and their professional background. The final sample
included a total of 5533 teachers in the 109 schools, which yielded an average of 51
teachers per school.27
Instructional measures
Instructional measures were drawn from the Logs for Language Arts (LALOGS)
27 The response rate for the TQ increased from the lowest response rate of 63% among eligible teacher participants in first year of the study to 86% by the final year of the survey’s administration. Specifically, the response rate in year one was 1,806 teacher respondents out of 2874 teachers, or 63%; in year two it was 2,969 teacher respondents out of 4,043 teachers, or 73%; in year three it was 2,861teacher respondents out of 3751 teachers, or 76%; and in year four it was 3,119 teacher respondents out of 3,650 teachers, or 86%.

118
in order to create measures of “fidelity” to instructional regime.28 The LALOGS,
administered to all teachers of cohort students provided data on teacher literacy
instruction.29
Data on two cohorts of students were collected as they passed through the
targeted schools. In each school in the study, samples of eight students from each
kindergarten and third-grade classroom were randomly selected and tracked as they
passed from Grades K-2 and from Grades 3-5.30 On a given day during the Fall,
Winter and Spring periods of each academic year, teachers spent an average of about
five minutes per day completing a log reporting on the reading instruction received by
a single student (randomly sampled from the eight) in their class. Teachers in the first
and third grades completed logs in Year 1, in the second and fourth grades they
completed logs in Year 2, and in the third and fifth grades they completed logs in
Year 3 of the study.
Each LALOGS recorded information about single-day’s literacy instruction for
a single student. In each log, teachers were first asked to note the amount of time they
spent on the target student in terms of reading and language arts instruction on that
day. Also, they provided data on the amount of emphasis they placed on the target
student’s instruction in terms of each of the following topics: word analyses, concepts
of print, oral or reading comprehension, vocabulary, writing, grammar, spelling and
research strategies. Then, if the teachers identified word analyses, comprehension or 28 Copies of the complete logs can be obtained at http://www.sii.soe.umich.edu/instruments.html. 29 Data on mathematical instruction was also gathered from Logs for Math (MATHLOGS). However, in this dissertation, I focused only on the reading and language arts logs because literacy instruction was the sole target of change of the AC and SFA models and a shared target of change for all other schools in the sample. 30 The problem of high student mobility existed. In order to address this problem students who left the school each year were replaced in the sample by a random sample of new students entering the school. This strategy not only maintained the number of eight target students in each classroom but also the representativeness of student samples for each year in each school.

119
writing as an emphasis for a student on a given day, they answered further questions
about the specific content, methods, and the tasks and materials used for the target
student on that day. In contrast to once-a-year surveys of teaching practices, daily log
data are considered to have more reliability and predictive validity since teachers were
asked to respond over a shorter time period and responded immediately after
instruction occurred.31
Log sample
Overall, a total of 88,507 daily logs were collected from teachers from Grades 1
to 5.32 Thus the teachers provided an average of roughly 31 daily logs (SD = 25 logs)
over the course of the study, usually spread evenly across the school year. However,
on some of the sampled days, teachers indicated that the school was not in session,
target students were absent, assemblies or field trips were held, and etc. Also, there
were cases for which some logical inconsistencies occurred in teacher responses.
Inclusion of these cases would result in unreliable assumptions about teachers’
literacy teaching practices in their classrooms. Thus the logs were filtered, leaving a
total of 80,524 daily logs for 2,556 teachers concerning their daily teaching practice in
language arts.33
31 Research has shown that instructional measures drawn from the SII log data present sufficient reliability and predictive validity. For empirical substantiations, see e.g., Camburn & Barnes, 2004 and Rowan et al., 2004 32 Overall, 89% of teachers who were asked to log did so, and they completed 90% of the logs administered to them. 33 The filtering of the log sample was needed for two primary reasons. First, on some of the sampled days teachers indicated that the school was not in session. Since I was only concerned with days when instruction was actually given to students, 6,184 daily logs were eliminated from the analysis, leaving 82,323 days on which the school was reported to be in session. Second, there were cases for which some logical inconsistencies occurred in teachers’ reports on their instruction. For example, teachers were only supposed to fill out the full ensemble of comprehension (or writing) items if comprehension (or writing) was either a major focus or a

120
Table 5.1 presents the final log sample across grades. It shows that across
80,524 daily logs, 15,855 were collected from teachers of 1st grade students, 16,115
from teachers of 2nd grade students, 16,907 from teachers of 3rd grade students, 16,763
from teachers of 4th grade students, and 14,884 from teachers of 5th grade students.
The logs were therefore relatively evenly distributed across these grades. The full
80,524 logs were used in the first set of analyses to examine the difference in literacy
topic coverage. However, for the second set of analyses I examined the teaching of
particular strategies in comprehension and writing when each topic was a focus of the
day’s instruction.34 This required a different baseline number of lessons. In all, across
the 80,524 lessons, there were 35,139 lessons in which a teacher indicated that
comprehension was a focus and 25,621 lessons in which a teacher indicated that
writing was a focus.
Table 5.1 Number of Logs Focusing on Comprehension and Writing across Grades
Grade Comprehension Writing Total
1st grade 6,289 5,617 15,855
2nd grade 7,301 5,288 16,115
3rd grade 7,601 5,211 16,907
4th grade 7,437 5,183 16,763
5th grade 6,511 4,322 14,884
Total 35,139 25,621 80,524
minor focus of their instruction. On some occasions, teachers checked comprehension (or writing) items but failed to indicate whether the topic was either a major or a minor focus. Alternatively, teachers indicated that a topic was a focus but failed to fill in any of the detailed items about their instruction. There were 1,046 logically inconsistent cases for teachers’ reports on comprehension and 918 cases on writing. These daily logs were also eliminated from the analyses. 34 Although the log data covered three broad areas as emphasis of instruction-word analyses, comprehension, and writing-I excluded word analyses and focused only on comprehension and writing for analysis in this dissertation primarily because word analysis was highly concentrated in grades 1 and 2.

121
Logging teacher sample
In all, 2556 teachers completed at least one log for a target student. Information
on teacher demographics and their interactive experiences with school leaders
(leader-leader interaction) was obtained from the Teacher Questionnaire (TQ). Over 6%
of the logging teachers (154) had not completed a TQ,35 leaving a total of 2,402
logging teachers who had completed at least one teacher questionnaire and
contributed to at least one log for a target student. The logging teacher sample was
used to examine my hypotheses on implementation “fidelity” to instructional regime.
Measures
In this section, I describe the selection, construction, and properties of the
measures used in the research. I begin with the estimation and properties of the
measures of my primary variable of interest: the GDIL. I then provide a detailed
account of how the two dependent variables were estimated, followed by a description
of the measures of the four moderating variables. Finally, I present other school- and
teacher-level covariates that I controlled for in the analyses.
Primary Variable of Interest: The GDIL
The development of the school-level GDIL followed three procedures. First, I
created measures of instructional leadership functions for each school leader per year.
The measures were drawn from data on a total of 690 leaders (including 80 missing
35 The most likely reason for the non-response of logging teachers on the TQ was the high mobility rate of teachers in the highly disadvantaged schools that were sampled.

122
leaders) in 109 schools over four years of the survey. Second, based on each leader’s
instructional leadership score per year, I created the GDIL for each school per year.
The GDIL estimated the degree to which instructional leadership functions were
“equally” distributed across school leaders who fit into the four leadership roles in a
school (i.e. principal, assistant principal, CSR coach, other leaders). Finally, I utilized
an aggregation strategy that aggregated each school’s GDIL across four years of
observations and addressed the missing leader roles simultaneously.
Instructional leadership functions
Based on the instructional leadership model of Camburn and his colleagues
(2003), I first developed leader-level measures of instructional leadership functions
from the School Leader Questionnaire (SLQ) for four years of the survey. In each of
the four years’ SLQ, leaders provided responses (ranging from 0 to 5) regarding the
amount of time they spent on or the priority they gave to four broad instructional
leadership functions: setting instructional goals, monitoring improvement,
coordinating curriculum, and developing instructional capacity (see Appendix C). The
final instructional leadership function score for each leader per year was an average
across all items.
Setting instructional goals was measured as the mean score of six survey items
that examined leaders’ prioritization of planning and conveying the schools’
instructional goals. The items covered the priority leaders gave to framing and
communicating schools’ broad goals, explicit timelines, students’ academic standards
for instructional improvement, and the teaching of specific curricular units or
objectives, the priority leaders gave to using the schools' standardized or

123
curriculum-referenced test results to plan instructional changes, and the priority they
gave to examining the schools' overall progress towards their improvement goals.
Monitoring improvement was measured as the mean score of five items
regarding the frequency with which leaders participated in instructional activities
relevant to administrating and supervising the implementation of improvement efforts
in their schools. The items covered leaders’ observations of teachers who were trying
new instructional practices or using new curricular materials, observations in
classrooms in order to examine what students were learning, monitoring of classroom
instructional practices, monitoring of the curriculum used in classrooms to see if it
reflected improvement efforts, and evaluation of teachers using criteria directly
related to schools' improvement efforts.
Coordinating curriculum was measured as the mean score of four items
describing the degree to which leaders prioritized school-level synchronization of
curriculum and instruction. The items covered promoting instructional coordination
across grade levels, promoting instructional coordination across regular and
compensatory/special education programs, promoting alignment between the
assessments used to evaluate the school's instructional program and what was taught
in classrooms, and promoting integration of the school's curriculum (e.g.,
mathematics and science, or reading/ language arts and social studies).
Developing instructional capacity was measured as the mean score of six items
regarding the frequency with which leaders provided guidance and support to teachers
with their instruction. The items covered sharing information or advice about
classroom practices with a teacher, examining and discussing what students were
working on during a teacher's lesson, demonstrating instructional practices and/or the

124
use of curricular materials in a classroom, examining and discussing the standardized
non-referenced or curriculum-referenced test results of students in a teacher's class,
examining and discussing exemplars of students' academic work, and personally
providing staff development.
Finally, the instructional leadership function score for each leader per year was
measured as the average score of all items discussed above. Thus, each leader had an
instructional leadership function score for each of the four years. In total, there were
690 leaders (including 80 missing leaders) who should have had at least one
instructional leadership function score in 109 schools in four years.
The GDIL
Having created the instructional leadership score for each leader per year, I then
developed the school-level GDIL. I first created each school’s GDIL per year, and
then aggregated it across four years of observations and addressed the missing data
problem simultaneously. Specifically, I developed the GDIL for each school using the
following three steps:
As discussed in Chapter 3, I first created the raw, unadjusted GDIL using the
widely-used absolute value approach for the Gini Coefficient (G). The school-level
raw GDIL per year was developed using the built-in command ineqdec0 in the
statistical software STATA.
Then, I created the adjusted GDIL for each school per year by correcting the
small-sample bias and multiplying it by (-1) in order to reflect the concept of
“equality”. The adjusted GDIL estimated the degree to which instructional leadership
functions were “equally” distributed across all school leaders who fit into the four

125
leadership roles (i.e. principal, assistant principal, CSR coach, other instructional
leaders). (See Appendix D, for a comparison between the unadjusted and adjusted
GDIL in SII data).
According to Equation 3.20 in Chapter 3, the final adjusted GDIL was
computed as:
GDIL = − ∑ ∑ |𝑦𝑦𝑗𝑗– 𝑦𝑦𝑖𝑖n
j | ni
2𝜇𝜇 (𝑦𝑦)𝑛𝑛 (𝑛𝑛−1) (3.20)
Where,
j and i are the leaders being compared in a school;
yj is the average instructional leadership score of leader j; and yi is the average
instructional leadership score of leader i;
|yj - yi| is the absolute difference in the average instructional leadership scores
between leader j and i;
μ(y) is the average instructional leadership score for each school; and
n is the number of leaders identified within a school; in the SII data in this study,
n=2 to 18.
Finally, two problems needed to be addressed in order to provide a better
estimate of the GDIL for each school: a) it should be noted that the above adjusted
GDIL for each school per year did not take into account the missing leaders who
failed to respond in any of the four years’ SLQ. Missing data on instructional
leadership functions needed to be addressed in order to provide an effective census of
leaders in each school; b) each school’s GDIL needed to be aggregated across
multiple years of observations in order to be better included in the analytical models

126
tested in this study. Thus, in the final step, I utilized an aggregation strategy that
served both purposes simultaneously.
As discussed earlier, among a total of 690 leaders who had been identified in
the leader protocol (see Appendix A, for the leader list) as fitting into one of four
leadership positions, 80 of them had an established presence but failed to respond to
any of the four years’ SLQs (see Table B.1 in Appendix B). However, the leadership
roles/positions to which these missing leaders were designated were expected to
influence the score of instructional leadership functions they exercised (for details, see
Camburn et al., 2003). Thus I estimated each school’s GDIL by adjusting for the
leadership roles these 80 missing leaders were appointed to in the four years of the
survey (i.e. principal, assistant principal, CSR coach, or other instructional leaders).
Using the statistical program HLM 7.0 (Raudenbush, Bryk, Cheong, Congdon,
& Toit, 2011), I developed a two-level hierarchical linear model (HLM) in which the
each school’s GDIL on a given survey year was nested within schools (for details on
HLM, see Raudenbush & Bryk, 2002). At level 1, I included four predictors
indicating whether or not the school had any missing principals, assistant principals,
CSR coaches, and other instructional leaders for each year (1=yes; 0=no). At level 2,
I used a simple random-intercept model where the intercept parameter was allowed to
vary randomly, yet the random effects for each of the slope parameters were fixed
(Raudenbush & Bryk, 2002). After estimating this model, I retrieved the school-level
empirical Bayes (EB) intercepts of the GDIL for each school (as computed by the
HLM program). These were the shrinkage estimators of a given school’s average
GDIL, aggregated across four years of observations, after controlling for the missing
leadership roles.

127
Dependent Variables
The two dependent variables examined in this study are: “fidelity” to
instructional regime and strength of professional community in schools. “Fidelity”
was based on instructional measures drawn from the Language Arts Teacher Logs
(LALOGS). It was dichotomously scored as whether or not a teacher was correctly
classified in his/her actual group (AC, ASP, SFA, or comparison) (1=yes; 0=no). In
other words, the measure estimated whether or not a teacher’s teaching practices
complied with the teaching practices endorsed by his/her actual group. Professional
community was developed from the Teaching Questionnaires (TQ). It was measured
as a composite factor scale of six constructs for four years of observation.
“Fidelity” to instructional regime
Based on Rowan and Miller’s (2007) approach, I developed the measure of
“fidelity” to instructional regime based on the instructional measures from the
Language Arts Teacher Logs (LALOGS). As noted above, a total of 80,524 daily
literacy logs were administered to all teachers of cohort students reporting on the
reading instruction received by a single student in their class. Rowan and Miller (2007)
measured “fidelity” as the extent to which the teaching practices in schools working
with different types of instructional regimes in the study complied with
regime-preferred teaching practice (p. 268). More compliance indicated higher levels
of “fidelity.”
Their approach to measuring “fidelity” excels over others for two primary
reasons. First, instead of relying on teacher responses for their teaching practices in
general, their approach is based on daily teaching logs of literacy instruction received

128
by sampled students in a teacher’s class, the validity of which has been proven to be
higher than once-a-year surveys of teaching practices (for details, see Camburn &
Barnes, 2004; Rowan et al., 2004). Second, rather than focusing on generic
instructional practice, the approach covers a broad range of specific contents in
reading and comprehension. The development of the measures of implementation
“fidelity” followed the three steps:
I first created instructional measures in three broad areas of language arts
teaching, using items from the log. The items are discussed below (for details, see
Appendix E):
Frequency of literacy topic coverage. Based on data from all lessons in the
sample,36 this measure was composed of a set of seven items. These covered the
average number of minutes per day a teacher spent teaching reading or language arts
across all lessons, and the proportion of all lessons during which a teacher reported
teaching six broad topics in the literacy curriculum: reading comprehension, writing,
reading fluency, vocabulary, grammar, and sight words.
How reading comprehension was taught. Another set of seven measures was
developed to measure teacher reports on how reading comprehension was taught. The
measures were based on data from lessons in which reading comprehension was
checked as a focus of their teaching.37 They included the percentage of reading
comprehension lessons that also covered writing, the extent to which teachers had
students provide brief answers to comprehension questions, reading lessons in which
students discussed texts, the percentage of lessons in reading comprehension in which
36 As noted above, there were a total of 80,524 daily logs responded to by 2,556 teachers concerning their daily literacy teaching practices. 37 As noted above, of the total of 80,524 lessons, there were 35,139 lessons for which teachers indicated that comprehension was a focus of their literacy instruction.

129
a teacher engaged in teacher-directed instruction, the number of writing strategies
integrated into reading lessons, the number of reading comprehension strategies
taught, and the difficulty of reading comprehension.
How writing was taught. A final set of seven measures concerning how writing
was taught was developed. These measures were constructed from the sample of
lessons in which writing was the focus of teachers’ teaching practice.38 They
included the percentage of writing lessons in which reading comprehension was also
covered, the percentage of lessons which covered genre study, the percentage of
writing lessons in which a teacher had students revise writing, the percentage of
writing lessons in which a teacher had students share their writing with other students,
the number of reading strategies integrated in teaching writing lessons, the number of
writing strategies taught, and the difficulty of the text that were written.
I then conducted discriminant analyses which gave a new classification for
each teacher’s group membership (AC, ASP, SFA, or comparison), given his/her
profile of teaching practice (see Appendix F). After aggregating teachers’ daily
responses into a yearly average for each measure, I conducted discriminant functional
analyses using the STATA (Version12.0) CANDISC statistical routine. The
discriminant analyses modeled a teacher’s actual group membership (AC, ASP, SFA,
or comparison) as a function of the three linear combinations of the instructional
measures discussed above. The CANDISC routine calculated the probability that a
teacher was classified into each of the four groups, given his/her discriminant scores,
the conditional probability of being in a group given those scores, and a Bayesian
prior (assuming that teachers were distributed evenly across the four groups) (for 38 As noted above, of the total of 80,524 lessons, there were 25,621 lessons for which teachers indicated that writing was a focus of their literacy instruction.

130
detailed discussions on discriminant functional analyses, see Rowan and Miller, 2007).
The analyses gave a new classification for each teacher’s group membership for
which his or her discriminant functions yielded the highest probability.
Finally, based on the predicted group membership and the actual group
membership of a teacher, I developed teacher-level measures of “fidelity” to
instructional regime. “Fidelity” was dichotomously scored as whether or not a teacher
was correctly classified (1=yes; 0=no). Specifically, if a teacher’s predicted group
membership matched his/her actual group membership, the “fidelity” was scored as 1.
However, if a teacher was misclassified, “fidelity” was scored as 0. Teachers who
were classified correctly into their actual groups showed instructional practices that
conformed more to the program than did teachers who were not correctly classified
into their actual groups.
Professional community
A set of scales was developed from the Teacher Questionnaire (TQ) to measure
the strength of professional community in schools for each of the four years. Based on
the most widely-cited model of Louis and her associates,39 I identified six essential
constructs of professional community that also fit into the particular school conditions
in which CSR programs were implemented.40 I first created factor scales for each of
39 For details, see e.g., Louis, Kruse & Bryk, 1995; Louis & Marks, 1998; Marks & Louis, 1997; Stoll & Louis, 2007. 40 In addition to the four constructs of professional community identified by Louis and her associates-reflective dialogue, academic emphasis, teacher collaboration, and collective responsibility-I added two essential features of professional community: teacher respect and trust and innovative climate. These two constructs were incorporated because they were widely recognized as important factors to sustain any school changes, as in the case of schools implementing school-wide CSR programs. However, the construct of shared norms and values was not included primarily due to the limitation of the SII data utilized in this study.

131
the six constructs per year. Then, the six constructs were combined to form a factor
score for professional community per year (see Appendix G, for factor loadings of
each scale by year). I created factor scores for professional community for four years,
which were used as the dependent variables for my inquiry into GDIL. Specifically,
the six constructs are shown below:
Trust and respect among teachers was measured as a four-item factor scale
regarding the degree to which teachers trusted and respected each other. The items
included teacher respect for colleagues who were experts in their craft, respect for
other teachers who took the lead in school improvement, trust of each other, and
concern about each other. The items were derived from a 4-point Likert-type scale,
strongly disagree to strong agree, and produced an average alpha reliability of 0.86
across four years of observations.
Innovative climate was a three-item factor scale estimating the degree to which
teachers were willing to generate new knowledge and practice. These items covered
teachers’ wiliness to continually learn and seek out new ideas, to experiment in their
classrooms, and to take risks to improve their teaching experiment. The items were
presented on a 4-point Likert-type scale, strongly disagree to strong agree, and
produced an average alpha reliability of 0.80 across four years of observations.
Reflective dialogue was measured as a factor scale of three survey items on the
degree to which teachers reflected on and discussed their teaching practice. The items
included teachers’ open expression of their professional views at meetings,
willingness to question one another’s views, and talking through views, opinions, and
values. The items were presented on a 4-point Likert-type scale, strongly disagree to
strong agree, and produced an average alpha reliability of 0.78 across four years of

132
observation.
Academic emphasis was a four-item factor scale of the degree to which teachers
focused on the pursuit of academic excellence. The items covered expecting students
to complete every assignment, setting high expectations for academic work, thinking
that it was important for students to do well, and encouraging students to keep trying
even when the work was challenging. The items were derived from a 4-point
Likert-type scale, strongly disagree to strong agree, and produced an average alpha
reliability of 0.84 across four years of observations.
Collective responsibility was measured as a factor scale of three survey items
estimating the number of teachers who were held accountable for the academic
achievement of students. The items covered taking responsibility for helping one
another do well, taking responsibility for improving the overall quality of teaching in
the school, and maintaining positive student behavior in the entire school. The items
were presented on a 5-point Likert-type scale, none to nearly all, and produced an
average alpha reliability of 0.86 across four years of observations.
Teacher collaboration was a six-item factor scale of the frequency with which
teachers collaborated with each other in instructional activities. The items covered
teacher collaboration in: clarifying standards for student learning, developing thematic
units, integrating instruction across curricular areas, examining/changing the
scope/sequence of specific curricular topics, learning how to set up and use particular
instructional grouping strategies, and examining the alignment of curricular materials
and student assessments. The items were presented on a 5-point Likert-type scale,
never to more than 10 times, and produced an average alpha reliability of 0.88 across
four years of surveys.

133
Finally, the six measures were combined to form the factor scores of
professional community for multiple years (with an average alpha reliability of 0.83
across four years of surveys). The factor scores of professional community for four
years were used as the dependent variables for my empirical inquiry into GDIL. In
order to address the repeated observations in multiple years, my analyses of
professional community were based on a series of three-level hierarchical linear
models (HLM). In the HLMs, teachers’ scale scores on professional community for a
given survey year (level 1) were nested within teachers (level 2), who were then
nested within schools (level 3) (for details on HLM, see Raudenbush & Bryk, 2002).
This treatment of multiple observations as nested allowed for the variance of the
number and spacing of time points across cases.41
Moderating Variables
The four school contingencies that were hypothesized to moderate the
influences of GDIL on the two outcomes are: average instructional leadership (AIL),
task, leader-leader interaction, and leader-teacher interaction. In this section, I discuss
the instruments from which the measures of the four moderating variables were drawn
and the procedures through which the measures were developed.
41 My three-level HLM statistical models were slightly different from the standard three-level HLM growth model discussed in Raudenbush and Bryk (2002). Unlike the standard three-level HLM growth model, the time parameter at level 1 in the models was omitted. In effect, I have examined models estimating time trends in teachers’ responses on all of the professional community scales, no such trends were found. As a result, variation across time points in teachers’ responses on scales of professional community was treated as measurement error in the models.

134
Average instructional leadership (AIL)
Developed from the School Leader Questionnaire (SLQ), average instructional
leadership (AIL) was the estimated mean score of instructional leadership functions
for each school, aggregated across four years of observations, after controlling for
missing leadership roles.
First, I estimated the instructional leadership function score for each leader per
year. As discussed earlier in the estimate of GDIL, in each of the four years’ SLQ,
leaders provided responses (ranging from 0 to 5) regarding the amount of time they
spent on or the priority they gave to four broad instructional leadership functions:
setting instructional goals, monitoring improvement, coordinating curriculum, and
developing instructional capacity (see Appendix C). The final instructional leadership
function score for each leader per year was an average across all items.
Similar to the estimate of GDIL, two problems needed to be addressed in order
to provide a better estimate of AIL for each school: a) the missing data on
instructional leadership for the 80 leaders who failed to respond in any of the four
years’ SLQ needed to be addressed in order to provide an effective census of leaders
in each school; b) the leader-level instructional leadership score needed to be
aggregated to the school level and across all years, the relevant unit of analysis for
this study. Thus, my next step in the measurement analyses was to utilize an
aggregation strategy that served both purposes simultaneously.
As discussed earlier, among a total of 690 leaders who had been identified in
the leader protocol (see Appendix A for the leader list) as fitting into one of four
leadership positions, 80 had an established presence but failed to respond in any of the
four years’ SLQs (see Table B.1 in Appendix B). However, the leadership roles

135
designated to these missing leaders were expected to influence the amount of
instructional leadership they exercised (for details, see Camburn et al., 2003). Thus I
estimated each school’s AIL by adjusting for the leadership roles these 80 missing
leaders were assigned to in the four years of surveys (i.e. principal, assistant principal,
CSR coach, or other instructional leaders).
Using the statistical program HLM 7.0 (Raudenbush, et al., 2011), I developed
a three-level hierarchical linear model (HLM) in which each leader’s instructional
leadership score for a given survey year was nested within leaders, who were in turn
nested within schools (for details on HLM, see Raudenbush & Bryk, 2002). At level 1,
I included four predictors indicating whether or not the school had any missing
principals, assistant principals, CSR coaches, and other instructional leaders for each
year (1=yes; 0=no). At both level 2 and level 3, I used a simple random-intercept
model where the intercept parameter was allowed to vary randomly, yet the effects for
each of the slope parameters were fixed (Raudenbush & Bryk, 2002). After
estimating this model, I retrieved the school-level empirical Bayes (EB) intercepts of
AIL for each school (as computed by the HLM program). These were the shrinkage
estimators of a given school’s AIL, averaged across all leaders in the school and all
years of observation, after controlling for the missing leadership roles.
Task
The second contingent variable for DIL is the school task. CSR programs are
viewed as systems of controlling tasks within schools (Rowan et al., 2004). However,
the nature of instructional tasks varies by different CSR models. Based on the

136
conceptual scheme of Rowan and his colleagues (2007),42 instructional tasks of the
ASP, SFA and AC models vary by the degree to which they are specified and
standardized by design. In general, the ASP models are characterized by tasks that are
very non-routine and uncertain. In contrast, tasks for the SFA models are highly
scripted. For the AC models, tasks are more routine than in the ASP models but not as
scripted as in the SFA models.
Thus I label the ASP school as operating with “discretional” tasks, the SFA
schools as operating with “scripted” tasks, and the AC schools as operating with
“routine” tasks. In this study, “discretional” task was measured as a school-level
dichotomous variable indicating that a school performed ASP tasks, “scripted” task
was measured as a school-level dichotomous variable indicating that a school
implemented SFA tasks, and “routine” task was measured as a school-level
dichotomous variable indicating that a school exercised AC tasks (see Appendix I).
The instructional tasks designed by the ASP program are “discretional” in
nature. They do not target any particular subject, nor do they provide teachers any
detailed instructional guidance or professional support regarding the standards and
strategies of instruction. Rather, ASP tasks are embedded in a cultural norm of
“powerful learning,” which highlights an “authentic, learner-centered, and interactive
form of instruction” (Rowan & Miller, 2007, p. 259). The completion of tasks
depends on the teachers’ discretion, innovations and coordination, rather than on
monitoring and supervision from instructional leaders.43
42 For detailed discussions, see e.g., Correnti & Rowan, 2007; Rowan et al., 2004; and Rowan & Miller, 2007. 43 Although ASP schools have designated one or more ASP coaches to guide, support, and facilitate the practice of ASP principles and philosophy (Camburn et al., 2003; Rowan et al., 2004), researchers found that adding these leader positions made little difference in the total number of

137
By contrast, instructional tasks in SFA schools are highly “scripted.” They are
characterized by a set of instructional scripts managed by a system of “procedure
control” (Rowan & Miller, 2007). The completion of tasks requires rigid conformity
to standardized practices and mechanical steps, which allows for little teacher
autonomy, risk taking or innovation (Barnes et al., 2004). In addition, the entire
teaching process is closely monitored and supervised for implementation “fidelity” by
a group of instructional leaders. In general, SFA tasks are embedded in scripted
instructional procedures, constrained teacher autonomy, and bureaucratic management
controls (Rowan et al., 2004).
Although the instructional tasks in AC schools are not as “scripted” as those in
SFA schools, they are more “routine” than those in ASP schools. AC tasks are
designed to be ambitious and complex. They not only set high standards for time
spent on teaching, but also require complex changes in teaching practice. In order to
accomplish such ambitious tasks, AC schools rely on a set of clearly-defined
standards and professionally-endorsed instructional routines. They place the most
importance on the professional knowledge and skills of a group of professional
leaders to convey the standards and coach the routines to teachers (Rowan & Miller,
2007). Instructional leaders in AC schools report higher probability than in ASP (but
not SFA) schools of observing, monitoring and coaching teachers’ teaching (Barnes et
al., 2004).
According to Hypotheses 2.1 and 2.2, advanced in Chapter 4, task is an
important moderating variable for DIL. Specifically, DIL works more effectively in
leaders compared to schools not affiliated with any CSR models, nor did these leaders perform as much instructional leadership as those in schools that adopted AC or ASP models (Camburn et al., 2003).

138
schools in which tasks are more non-routine and uncertain, but less effectively in
schools in which tasks are more routine and predictable. Thus DIL is hypothesized to
have the strongest positive effects on “fidelity” and professional community in ASP
schools, which are characterized by “discretional” tasks, than in either AC or SFA
schools. However, in SFA schools in which tasks are most “scripted,” the positive
effects of DIL on the two outcomes are hypothesized to be less strong than in ASP and
AC schools.
Leader-leader interaction
The factor scale for leader-leader interaction was first developed on the leader
level for multiple years, and then aggregated to the school level and adjusted across
all years of observation. Leader-leader interaction was a six-item factor scale
developed from the School Leader Questionnaire (SLQ). It measured the leaders’
perceptions of the frequency with which leaders interacted with each other within
formal leader teams (see Appendix H). The items covered the frequency of interaction
within leader teams in formally scheduled meetings and informal meetings, the
frequency with which members of the leader team worked together closely to lead the
school, openly expressed their professional views, talked through views, opinions, and
values, and sought consensus in decision making processes.
I first created the leader-leader interaction factor scale for each leader per year
based on the factor loadings of each item (with an average alpha reliability of 0.90
across four years of surveys). Then, I aggregated the leader-level scale scores to the
school level and adjusted them across all years of observations. Using the statistical
program HLM 7.0 (Raudenbush, et al., 2011), I developed a three-level hierarchical

139
linear model (HLM) in which leaders’ scale scores for a given survey year (level 1)
were nested within leaders (level 2), who were in turn nested within schools (level 3)
(for details on HLM, see Raudenbush & Bryk, 2002). With no predictor included at
any level, I estimated this model and then retrieved the school-level empirical Bayes
(EB) intercepts of leader-leader interaction for each school (as computed by the HLM
program). These were the shrinkage estimators of a given school’s average score on
leader-leader interaction, aggregated across all leaders, and averaged across four years
of observation.
Leader-teacher interaction
Developed from the Teacher Questionnaire (TQ), the factor scale for
leader-teacher interaction was first developed on the teacher level per year, and then
aggregated to the school level and adjusted across all years of observations.
Leader-teacher interaction was a four-item factor scale of teachers’ perceptions of the
frequency with which teachers interacted with formal school leaders on instructional
improvement activities (see Appendix H). The items covered the frequency of
teachers watching an instructional leader (e.g., coach, coordinator, or facilitator)
model instruction, and the frequency of an instructional leader observing teachers
teaching, giving feedback about improving teachers’ teaching techniques, giving
feedback about teachers’ use of curriculum materials, and studying students’ work and
commenting on ways teachers could improve students’ learning of subject matter.
After creating the leader-teacher interaction factor scale for each teacher per
year, I aggregated the teacher-level scale score to the school level and adjusted it
across all years of observations. Using the statistical program HLM 7.0 (Raudenbush,

140
et al., 2011), I developed a three-level hierarchical linear model (HLM) in which
teachers’ scale scores for a given survey year (level 1) were nested within teachers
(level 2), who were in turn nested within schools (level 3) (for details on HLM, see
Raudenbush & Bryk, 2002). With no predictor included at any level, I estimated this
model and then retrieved the school-level empirical Bayes (EB) intercepts of
leader-teacher interaction for each school (as computed by the HLM program). These
were the shrinkage estimators of a given school’s average score on leader-teacher
interaction, aggregated across all leaders, and averaged across four years’ observation.
Other School- and Teacher-Level Covariates
Having discussed the measures of GDIL, two outcome variables and four
moderating variables I now describe the measures of other school-level and
teacher-level covariates. Although they were not the primary focus of this study, I
controlled for them in order to test alternative hypotheses and to control for other
reasonable explanations of variations in the two outcomes.
School level covariates
School level covariates included school size, disadvantage index, and
percentage of full-time equivalent (FTE) leaders (see Appendix I). School size was
measured by the number of students enrolled at the school in the year under study.
School disadvantage index was a factor composite of schools’ minority percentages,
free and reduced lunch percentages and community disadvantage index (CDI). The
final set of covariates was the percentages of school leaders measured in terms of

141
full-time equivalent (FTE) staff positions. These were measured as the ratio of the
number of leaders (i.e. principals, assistant principals, CSR coaches, or other
instructional leaders) to the total number of leadership staff measured in terms of
full-time equivalent (FTE) staff positions, such that a principal who worked five day
per week in the school would be coded as 1 FTE; and a CSR coach who worked one
day per week would be coded as 0.2 FTE. Percentages of FTE leaders were controlled
in the models because the exercise of instructional leadership functions for a leader
was influenced by the FTE positions the leader was designated to.
Teacher level covariates
Teacher covariates included gender, race, educational and teaching background,
as well as teaching assignments (see Appendix L). Teacher teaching and educational
background variables included years of teaching, post-secondary training,
professional development experience, whether the teacher had a master’s degree, and
whether he/she was permanently certified. Teaching assignment variables included
the grade the teacher taught (1-5 grades), whether the teacher was a regular classroom
teacher or a specialist, whether the teacher was an English Language Arts (ELA)
specialist or not, whether the teacher taught a scope subject of reading/language arts
and math or not, and whether the teacher instructed students at multiple grade levels
or not. Differences in teacher demographics, division of labor and complexity of tasks
were anticipated to influence their “fidelity” to instructional regime and professional
community in schools.

142
Methods and Models
In this section, I provide a detailed description of the statistical models applied
to each particular analysis conducted to answer the research questions and test the
hypotheses developed in Chapter 4. I provide separate discussions on the methods and
models used for the two outcomes. Using the statistical program HLM 7.0
(Raudenbush et al., 2011), I analyzed data within the framework of a series of
two-level hierarchical generalized linear models (HGLM) to examine “fidelity” to
instructional regime. My exploration of professional community was based on a series
of three-level hierarchical linear models (HLM). For each outcome, I first produced
fully unconditional HLM analyses of variance components at each level. I then added
predictors at each level in conditional models. For the school-level analyses, I
estimated models for each of the four moderating variables separately.
“Fidelity” to Instructional Regime: Two-Level Hierarchical Generalized Linear
Models (HGLMs)
As discussed earlier, “fidelity” to instructional regime was a dichotomous
variable indexing whether or not a teacher was classified correctly in his/her actual
group (1=yes; 0=no). I developed a series of two-level hierarchical generalized linear
models (HGLM) in which teachers were nested within schools. In these models, the
level 1 sampling model for the outcome variable was a Bernoulli trial, and the level 1
link function was the log link (for details on HGLM, see Raudenbush & Bryk, 2002).
The models explained the degree of “fidelity” as a function of GDIL and the four
school contingencies while controlling for other school and teacher characteristics.

143
Fully unconditional model
To gauge the magnitude of variation between schools in correct teacher
classification, I first estimated a two-level fully unconditional model with no
predictors at either level. In the analyses, the level-1 model was a standard logistic
regression model for a Bernoulli outcome with random effects. Here, Yij was an
indicator taking on a value of 1 if teacher i in school j was correctly classified, and
was 0 otherwise. In this model, φij denoted the probability that Yij=1, where this
probability was assumed to vary randomly across schools. Therefore, when
conditioning on this probability, the level 1 model was:
Yij|φij ~Bernoulli;
E(Yij|φij) =φij, and Var(Yij|φij) =φij(1–φij). (5.1)
Because this was a standard logistic regression, we could express this probability
in log-odds (ŋij). This definition had the advantage of making the level 1 statistical
model linear in form by making the dependent variable in the estimation routines ŋij,
where:
ŋij = log � 𝜑𝜑𝑖𝑖𝑗𝑗1−𝜑𝜑𝑖𝑖𝑗𝑗
� (5.2)

144
The level-2 model was:
β0j = γ00+u0j u0j ~ N (0, τ00) (5.3)
Where,
i is the individual i teacher; and j is the school j;
ŋij is the log odds of teacher i being classified correctly;
φij is the probability of teacher i being classified correctly;
β0j is the average log odds of teachers being classified correctly for school j;
γ00 is the average log odds of teachers being classified correctly across all
schools;
τ00 is the between-school variance in school-average log-odds of teachers being
classified correctly; and
u0j is a random error assumed to be normally distributed with a mean of 0 and
variance of τ00.
The key point of these analyses was to provide information about the magnitude
of between-school variation in correct teacher classification in the sample. The
estimated variance component (τ00) described the variation in correct teacher
classification existing between schools. However, it did not tell how large such
variation was. Data on variance components were also used to estimate how reliably
we could discriminate patterns of correct teacher classification across schools: β0j
(estimated) = τ00/ [τ00 + (σ2/ nij)], where nij is sample size for school j, and σ2/ nij is the
measurement error for the school-level variance τ00.

145
Conditional models
Then, I developed a series of two-level HGLM conditional models in order to
estimate the effects of school- and teacher-level variables on the measure of “fidelity”.
My set of analyses required four separate two-level HGLM models: one for each of
the four moderating variables. The equations for these models are detailed below.
Teacher-level models
At level 1, I included in the model the teachers’ demographic characteristics.
The teacher-level model was consistent across analyses on all moderating variables.
Specifically, the level-1 model was:
ŋij = log � 𝜑𝜑𝑖𝑖𝑗𝑗1−𝜑𝜑𝑖𝑖𝑗𝑗
�
=β0j+β1j (grade)ij+β2j (male)ij+β3j (Hispanic)ij+β4j (black)ij
+β5j (Asian)ij+β6j (other races)ij+β7j (ELA specialist)ij
+β8j (special education teacher)ij+β9j (have a master’s degree)ij
+β10j (permanently certified)ij+β11j (teaching experience)ij
+β12j (ELA courses)ij+β13j (PD courses)ij (5.4)
Where,
i is the individual i teacher; and j is the school j;
ŋij is the log odds of teacher i being classified correctly, adjusting for the teacher
demographic characteristics;
φ ij is the probability of teacher i being classified correctly, adjusting for the
teacher demographic characteristics;
β0j is the average log odds of teachers being classified correctly for school j,

146
adjusting for the teacher demographic characteristics;
β1j ~β13j are the corresponding slope coefficients that indicate the direction and
strength of association between the demographic characteristics of
teacher i and the log odds of him/her being classified correctly.
School-level models
The level-2 model in these analyses accounted for variation among schools in
correct teacher classification. Four separate models were estimated for each of the
four moderating variables. In each model, I modeled the intercept (β0j) as a function
of the school-level predictors, but viewed the other level-1 coefficients (β1j ~β13j) as
fixed. The intercept (β0j) was predicted by GDIL, four contingent factors, the
interaction between GDIL and each of the four contingent factors, respectively, as
well as other school demographic characteristics, as in:
β0j = γ00+γ01 (school size) j+γ02 (disadvantage index)j+γ03 (% of FTE assistant
principals)j +γ04 (% of FTE CSR coaches)j+γ05 (% of FTE other
leaders)j+γ06 (discretional task)j +γ07 (routine task)j+γ08 (normative task)j
+γ09 (AIL)j +γ010 (leader-leader interaction)j +γ011 (leader-teacher
interaction)j+γ012 (GDIL)j+γ013 (GDIL×contingent variable)j +u0j
u0j ~ N (0, τ00)
β1j = γ10
…
β13j = γ130 (5.5)

147
Where,
β0j is the average log odds of teachers being classified correctly for school j
adjusting for the school characteristics;
γ00 is the average log odds of teachers in SFA schools who were classified
correctly, adjusting for the school characteristics;
γ01~γ05 are the corresponding slope coefficients that indicate the direction and
strength of association between the school demographic characteristics
and the log odds of teachers being classified correctly for school j;
γ06~γ08 are the corresponding slope coefficients that indicate the effect of school
task (routine, discretional, or normative vs. scripted) on the log odds of
teachers being classified correctly for school j;
γ09~γ011 are the corresponding slope coefficients that indicate the direction and
strength of association between each of the other three contingent
variables (i.e. AIL, leader-leader interaction, or leader-teacher interaction)
and the log odds of teachers being classified correctly for school j;
γ012 is the corresponding slope coefficient that indicates the direction and
strength of association between GDIL and the log odds of teachers being
classified correctly for school j;
γ013 is the corresponding slope coefficient that indicates the direction and
strength of association between the interaction of GDIL and each of
the four contingent variables (i.e. AIL, task, leader-leader interaction, or
leader-teacher interaction) and the log odds of teachers being classified
correctly for school j. This occurs in four separate models and one
interaction is tested at a time;

148
τ00 is the between-school variance component in school-average log-odds of
teachers being classified correctly; and
u0j is a random error assumed to be normally distributed with a mean of 0 and
variance of τ00.
Professional Community: Three-Level Hierarchical Linear Models (HLMs)
The second outcome variable, professional community, was estimated by a
series of three-level hierarchical linear models (HLM). In the HLMs, each teacher’s
scale score on his/her sense of professional community for a given survey year (level
1) was nested within the teachers (level 2), who were in turn nested within schools
(level 3).
Fully unconditional model
I first developed a three-level fully unconditional model which decomposed the
variance in the teacher-level outcome of professional community into three separate
components: a repeated-observations component (level 1), teacher-level component
(level 2) and school-level component (level 3). The model, which specified no
predictors at any level, partitioned the total variance of professional community into
within-teacher, between-teacher and between-school variance. I examined whether
there was significant within- and between-school variance in terms of professional
community and what the total amount of variance within each level was.
This decomposition was represented in three equations. In the first equation,
each teacher’s reported professional community for a given survey year was nested

149
within teachers. In this sense, multiple observations on each individual teacher were
nested within the teacher. The level-1 model was specified as:
Ytij = π0ij+etij etij ~ N (0, σ2) (5.6)
Where, t represents the year that the teacher responded, i represents the
individual i teacher, and j represents the school j. Ytij represents the professional
community in year t reported by teacher i in school j. The intercept parameter, π0ij,
represents the mean professional community across all time points for teacher i in
school j. And etij is the specific deviation from the mean professional community for
teacher i for year t. One might note that this statistical model was slightly different
from the standard three-level HLM growth model discussed in Raudenbush and Bryk
(2002). Unlike the standard three-level HLM growth model, the time parameter at
level 1 in this model was omitted. Variation across time points in teachers’ responses
on scales was treated as measurement error in this model.
At level 2, the teacher-level model examined the impact of individual teacher
characteristics on professional community. At this level, the intercept parameter, π0ij,
was allowed to vary at level 2 as a function of teacher characteristics. The model was
formulated as:
π0ij =β00j + r0ij r0ij ~ N (0, τπ) (5.7)
Where, π0ij represents the mean professional community across all time points
for teacher i in school j. β00j represents the grand mean of professional community for

150
school j. r0ij represents a random “teacher effect,” that is, the deviation of mean
professional community for teacher i in school j from that of the school mean β00j.
These effects were assumed to be normally distributed with a mean of 0 and variance
of τπ. This basic equation showed that the mean professional community for each
teacher in each school (π0ij) varied randomly around the school grand mean score (β00j)
with a variance of τπ. Within each of the j schools, the variability among individual
teachers was assumed to be the same.
The level-3 model represented the variability among schools. The school mean,
β00j, was viewed as varying randomly around the grand mean of all sampled schools
γ000. At this level, the between-school equation was specified as:
β00j = γ000+u00j u00j ~ N (0, τβ) (5.8)
In this model, β00j, the adjusted school mean, was modeled as a function of the
school grand mean γ000 and random school variation u00j. u00j was the random “school
effect,” that is, the deviation of school j’s mean from the grand mean. Here, the basic
model showed that the school mean of professional community (β00j) varied randomly
around the grand mean of all sampled schools (γ000) with a variance of τβ.
Using the decomposition variance component for within-teacher variance (σ2),
within-school variance (τπ), and between-school variance (τβ), one can determine the
percentage of variance in an individual level (teacher) variable that lay within an
individual, between individuals, and among schools that individuals belonged to by
dividing the appropriate variance component by the total variance (σ2+τπ+τβ). In the
next chapter, I report these estimates, which show sufficient between- and

151
within-school variance to proceed with conditional models that include both school-
and teacher-level variables.
Conditional models
The conditional models estimate the effects of school- and teacher-level
variables on professional community. My set of analyses required four separate
three-level HLM models: one for each of the contingent factors that were
hypothesized to influence the effects of GDIL on professional community. The
equations for these models are presented below.
Repeated-observations model
I begin at level 1 with a repeated-observations model of the professional
community at time t of teacher i in school j:
Ytij = π0ij+etij etij ~ N (0, σ2) (5.9)
Where,
Ytij is the professional community score for teacher i in school j for year t;
π0ij is the mean professional community across all time points for teacher i in
school j; and
etij is the specific deviation from the mean professional community for teacher i
in school j for year t. These effects are assumed to be normally distributed
with a mean of 0 and variance of σ2.

152
Teacher-level model
At level 2, I modeled the teacher intercept (π0ij) as a function of teacher-level
predictors plus a random teacher-level error, as in:
π0ij =β00j+β01j (male) ij+β02j (non-white)ij+β03j (specialist)ij
+β04j (teach the scope subjects)ij+β05j (teach multiple grades)ij
+β06j (have a master’s degree)ij+β07j (permanently certified)ij
+β08j (teaching experience)ij +β09j (instructional PD days)
+β010j (postsecondary courses in literacy and math)ij+r0ij r0ij ~ N (0, τπ)
(5.10)
Where,
π0ij is the mean professional community across all time points for teacher i in
school j, adjusting for the teacher characteristics;
β00j is the grand mean of professional community for school j, adjusting for the
teacher characteristics;
β01j ~β010j are the corresponding slope coefficients that indicate the direction and
strength of association between the demographic characteristics of
teacher i in school j and professional community, and
r0ij is a random “teacher effect” that represents the deviation of the mean
professional community for teacher i in school j from that of the
school grand mean β00j. These residual teacher effects are assumed to be
normally distributed with a mean of 0 and variance of τπ.

153
School-level models
I utilized simple random-intercept models where the intercept parameter β00j
was allowed to vary randomly, and the effects for each of the slope parameters (β01j
~β010j) were fixed. I estimated four separate school-level models for each of the four
contingent variables, respectively, as presented below:
β00j = γ000+γ001 (school size) j+γ002 (disadvantage index)j+γ003 (% of FTE
assistant principals)j +γ004 (% of FTE CSR coaches)j+γ005 (% of FTE
other leaders)j +γ006 (discretional task)j +γ007 (routine task)j +γ008
(normative task)j +γ009 (AIL)j +γ0010 (leader-leader interaction)j+γ0011
(leader-teacher interaction)j +γ0012 (GDIL)j+γ0013 (GDIL×contingent
variable)j +u00j u00j ~ N (0, τβ)
β01j = γ010
…
β010j = γ0100 (5.11)
Where,
β00j is the grand mean of professional community for school j;
γ000 is the grand mean of professional community across all schools;
γ001~γ005 are the corresponding slope coefficients that indicate the direction and
strength of association between the school demographic characteristics
and professional community for school j;
γ006~γ008 are the corresponding slope coefficients that indicate the effect of

154
school task (discretional, routine or normative vs. scripted) on
professional community for school j;
γ009~γ0011 are the corresponding slope coefficients that indicate the direction and
strength of association between each of other three contingent variables
(i.e. AIL, leader-leader interaction, or leader-teacher interaction) and
professional community for school j;
γ0010 is the slope coefficient for GDIL that indicates the direction and strength of
association between GDIL and professional community for school j;
γ0013 is the slope coefficient that indicates the direction and strength of the
interaction between GDIL and each of the four contingent variables (i.e.
AIL, task, leader-leader interaction, or leader-teacher interaction) and
professional community for school j. This occurs in four separate models
and one interaction is tested at a time);
u00j is the random “school effect,” that is, the deviation of school j’s mean from
the grand mean. These residual school effects are assumed to be normally
distributed with a mean of 0 and variance of τβ.
Missing Data Analysis
Data on teacher characteristics were missing. This caused problems as the
analyses in this study accounted for the nested nature of the data by using hierarchical
models (HLM/HGLM). While HLM/HGLM can deal with incomplete data at level 1,
cases with incomplete higher level (teacher or school level) covariates are eliminated
from analyses. In this study, in the model analyses of professional community, a total

155
of 5533 teachers (level 2) were reduced to a sample size of 3644, omitting 1889 cases.
This listwise deletion would not only result in a substantial decrease in the sample
size, but also potentially engender erroneous inferences if the discarded cases differed
systematically from the rest. Even when the data are missing completely at random
(MCAR), there is a loss in statistical power using this approach.
Given the substantial reduction in sample size, missing data analyses were
needed. I conducted the analyses in two steps. First, I compared the means of the
retained teachers on demographic characteristics with the corresponding means for the
missing teachers. Then, I compared the retained study sample with the original study
sample to check if the omitted teachers significantly altered the overall teacher
demographic characteristics.
Table 5.2 displays the means of teacher variables in the original sample in
comparison to the data relating to both the missing group and the retained sample
mean. Also, Table 5.2 reports the t-test results of these comparisons.44 It shows that
the significance of the mean difference for teachers’ demographic characteristics
between the original sample and the retained samples was an issue for concern.
Compared to the retained sample, the missing teachers were more likely to be
non-white and male teachers. They were less likely to teach the scope subjects and
were more likely to be specialists. However, the percentage of special education
teachers was lower among the missing teachers. Also, compared to teachers in the
retained sample, the missing teachers on average had lower levels of education,
postsecondary training in literacy and mathematics courses and professional
44 For the dichotomous or dummy-coded variables listed, the means of those variables can be interpreted as proportions (e.g., male, racial composition, specialist, English Language Arts specialist, special education teacher, teach the scope subjects, teach multiple grades, have a master’s degree, and permanently certified).

156
development, and were less likely to be permanently certified.
Likewise, the t-test results showed that the data restrictions significantly altered
the composition of teachers in the retained samples compared to the original sample.
The retained teachers showed composition characteristics of teachers that were
generally smaller in size in terms of postsecondary training in literacy and
mathematics courses, professional development levels in instruction, educational
levels, and teaching certification. Also, they were more likely to be male and
specialists, and less likely to teach the scope subjects.
Thus it is important to note that the overall sample reduction significantly
altered the composition of the study sample, resulting in important sampling
distortions between the samples remaining for HLM analyses and the primary source
samples. As a result, I sought strategies to deal with the missing data problem on the
teacher level in order to maintain the teacher characteristics of the original sample.

157
Table 5.2 Comparison of Means between Original Sample and Study Sample on Teacher
Demographic Characteristics
Mean Retained Sample
Mean Missing Respond-ence
T-test Sig. p-value (2-tailed)
Mean Retained Sample
Mean Original Sample
T-test Sig. p-value (2-tailed)
N=3644 N=1889
N=3644 N=5533 Male 0.109 0.180 0.000 0.109 0.133 0.001
White 0.590 0.549 0.005 0.590 0.577 0.216
Non-white 0.414 0.456 0.004 0.414 0.427 0.204
Hispanic 0.095 0.097 0.828 0.095 0.096 0.924
Black 0.231 0.270 0.002 0.231 0.243 0.169
Asian 0.051 0.049 0.767 0.051 0.051 0.897
Other (race) 0.045 0.047 0.699 0.045 0.045 0.865
Specialist 0.345 0.677 0.000 0.345 0.447 0.000
ELA specialist 0.039 0.029 0.066 0.039 0.036 0.439
Special education teacher 0.119 0.091 0.003 0.119 0.111 0.204
Teach scope subjects 0.754 0.365 0.000 0.754 0.634 0.000
Teach multiple grades 0.264 0.266 0.918 0.264 0.264 0.973
Postsecondary training in
literacy and math 0.099 -0.388 0.000 0.099 -0.039 0.000
ELA courses 0.079 -0.321 0.000 0.079 -0.039 0.000
Days for instructional PD 0.053 -0.231 0.000 0.053 -0.022 0.000
Have a master’s degree 0.800 0.715 0.000 0.800 0.774 0.004
Permanently certified 0.790 0.694 0.000 0.790 0.759 0.001
Teaching experience 12.418 12.501 0.780 12.418 12.444 0.903
To combat this problem, I employed the multiple imputation (MI) strategy,
based on the STATA command ICE (for details, see Patrick, 2004) to impute missing
values for the teacher level variables. The MI approach to missing data is preferable
than listwise deletion because the latter is robust only when one assumes that data are
missing completely at random. However, the MI procedure used in this study only

158
assumes that data are missing at random. Although the MI procedure also assumes
that data are multivariate normal, it is often robust to failures of this latter assumption
(Peugh & Enders, 2004)
In this study, multiple imputations generated an additional form of error based
on variation in the parameter estimates across the imputations. Uncertainty was
handled by creating different versions of the missing data and observing the
variability between imputed datasets. The command ICE in STATA generated
multiple datasets in which the missing values were replaced by m>1 (in my case, m=5)
plausible values drawn from the observed values of all variables and the underlying
covariance matrix. Standard statistical analyses were carried out on each imputed
dataset, and multiple analyses results were produced. Finally, estimates from the
imputed datasets were pooled to generate a single set of estimates, allowing me to
account for the uncertainty in the imputed data (for details, see Peugh & Enders,
2004). In this analysis, I used more than 60 teacher-level variables in the imputation
process. The wealth of available data increased the robustness of inferences to
violations of the missing-at-random assumption.
Table 5.3 provides a comparison of descriptive statistics on the raw and
imputed data for all of the teacher-level variables presented in subsequent analyses. It
is important to note that the statistical software package HLM 7 (Raudenbush et al.,
2011) automatically calculated the average estimates of effect of independent
variables on dependent variables across multiple datasets. In addition, the HLM
program also produced standard errors that accounted for the variance in parameter
estimates within datasets and the variance in the parameter estimates between the
datasets.

159
Table 5.3 Comparison of Teacher Demographic Characteristics between Raw Data and Imputed data
Raw Data Imputed Dataa
N Mean SD N Mean SD
Male 5,473 0.133 0.339 5,533 0.134 0.341
White 5,364 0.577 0.494 5,533 0.561 0.496
Non-white 5,364 0.427 0.495 5,533 0.439 0.496 Hispanic 5,364 0.096 0.294 5,533 0.112 0.315
Black 5,364 0.243 0.429 5,533 0.241 0.428 Asian 5,364 0.051 0.219 5,533 0.052 0.221 Other (race) 5,364 0.045 0.208 5,533 0.044 0.206
Specialist 5,261 0.447 0.497 5,533 0.462 0.499
ELA specialist 5,277 0.036 0.186 5,533 0.040 0.195
Special education teacher 5,277 0.111 0.314 5,533 0.120 0.325
Teach scope subjects 5,277 0.634 0.482 5,533 0.626 0.484
Teach multiple grades 4,536 0.264 0.441 5,533 0.278 0.448 Postsecondary training in literacy & math 5,075 -0.039 0.928 5,533 0.000 1.000
ELA courses 5,164 -0.039 0.934 5,533 0.000 1.000
Days for instructional PD 4,955 -0.022 0.920 5,533 0.000 1.000
Have a master’s degree 5,214 0.774 0.417 5,533 0.777 0.416 Permanently certified 5,341 0.759 0.427 5,533 0.768 0.422 Teaching experience 5,332 12.444 10.081 5,533 12.369 10.024 a. The means and standard deviations reported here for the imputed data were averaged across all five multiply imputed datasets for each year, and then averaged across the data for four years.

160
CHAPTER VI
RESULTS AND DISCUSSION
This chapter presents the results of the analyses conducted in this study. I begin
with a brief presentation of the descriptive statistics for all variables included in the
data analyses. I next discuss the correlations among selected variables in the study as
they provide useful information about the relationships among the independent
variables. Finally, the results of the analyses are presented separately for the two
outcome variables — “fidelity” to instructional regime and professional community in
schools.
Using the computer program HLM7.0 (Raudenbush et al., 2011), each outcome
variable was operationalized in each of the four separate analyses in order to explore
the moderating effects of the four contingencies (average instructional leadership
[AIL], task, leader-leader and leader-teacher interaction), respectively, on the
relationship between the GDIL and the two outcomes. Specifically, I begin with
variance decomposition results. Then, based on the hypotheses advanced in Chapter 4,
I report the results of the four moderated models for each outcome variable,
respectively.

161
Descriptive Characteristics of Schools and Teachers
Table 6.1 and 6.2 present the basic descriptive statistics for a total sample of
5533 teachers in 109 schools.45 While Table 6.1 shows the descriptive statistics for
school-level variables in this study, Table 6.2 shows the descriptive statistics for
teacher-level variables.46
The GDIL represented the degree to which instructional leadership functions
were equally distributed among leaders. A greater GDIL indicated a higher level of
“equality” and a smaller GDIL indicated a lower level of “equality.” As shown in
Table 6.1, the average value of the GDIL was -0.11, with a range of -0.20 to 0.07.
Routine-task (AC) schools showed the highest average level of GDIL (M= -0.100),
followed by scripted-task (SFA) schools (M= -0.114), and then comparison schools
with normative tasks (M= -0.117). The discretional-task (ASP) schools had the lowest
average level of GDIL (M= -0.119).
The AIL showed a similar pattern across schools undertaking different types of
tasks. The average AIL reported in 109 schools was 3.13. Routine-task (AC) schools
had the highest level of AIL (M=3.23), followed by scripted-task (SFA) schools
(M=3.15), and then comparison schools with normative tasks (M=3.09). Again,
discretional-task (ASP) schools had the lowest level of AIL (M=3.03).
Table 6.1 also presents the frequency levels of leader-leader interaction and
leader-teacher interaction. The variation of leader-leader interaction across schools
characterized by different types of tasks was not statistically significant (F (4, 109) =
45 The means and standard deviations presented in both tables are the statistics before standardization to allow for a more precise interpretation of the data. 46 The first two columns of Table 6.2 are the same as the last two columns of Table 5.3.

162
2.51, p=0.06). Rather, the one-way ANOVA, which tested differences in means
across groups of schools revealed significant mean differences in leader-teacher
interaction (F (4, 109) = 5.67, p<0.001). Routine-task (AC) schools had the highest
level of leader-teacher interaction (M=0.37), followed by scripted-task (SFA) schools
(M=0.21) and then discretional-task (ASP) schools (M= -0.27). Comparison schools
had the lowest level of leader-teacher interaction (M= -0.48).
Table 6.2 presents the descriptive statistics for teachers. It is also important to
examine the descriptive statistics of the outcome variables. The one-way ANOVA
conducted indicated significant between-group differences in the reported levels of
professional community (F (4, 109) = 1.38, p<0.01). On average, teachers in
discretional-task (ASP) schools reported the highest level of professional community,
followed by teachers in comparison schools performing normative tasks, then teachers
in scripted-task (SFA) schools, and finally those in routine-task (AC)schools.
In a sample of 2402 teachers used to examine the implementation “fidelity,”
more than 60% were classified correctly based on their daily teaching practices in
literacy. Significant sub-group differences were also found in the percentage of
teachers being classified correctly (F (4, 109) =86.12, p<0.001). Teachers in
normative-task (comparison) schools were least likely to be classified correctly in
their actual groups, while teachers in scripted-task (SFA) schools had the highest
probability of being classified correctly, followed by those in routine-task (AC)
schools, and finally those in discretional-task (ASP) schools.

163
Table 6.1 Descriptive Statistics for School-Level Variables
Total (N=109) Routine Task Discretional Task Scripted Task Normative Task AC(N=31) ASP (N=28) SFA(N=28) COMP(N=22)
Mean SD Mean SD Mean SD Mean SD Mean SD
School size 480.043 181.218 539.029 174.951 459.852 227.614 417.062 117.598 502.779 171.069 Disadvantage index 0.000 1.000 0.255 0.771 -0.420 1.059 0.105 0.981 0.073 1.213
% of FTE principal 0.317 0.257 0.248 0.146 0.429 0.258 0.314 0.137 0.275 0.417 % of FTE assistant principal
0.125 0.260 0.140 0.133 0.159 0.183 0.092 0.149 0.101 0.496
% of FTE CSR coach 0.360 0.274 0.454 0.191 0.195 0.174 0.432 0.157 0.348 0.454 % of FTE other leaders 0.209 0.491 0.163 0.344 0.229 0.255 0.164 0.353 0.307 0.902
GDIL -0.112 0.029 -0.100 0.020 -0.119 0.029 -0.114 0.036 -0.117 0.025 AIL 3.134 0.391 3.233 0.244 3.034 0.345 3.150 0.047 3.093 0.481 Leader-leader interaction -0.003 1.014 0.143 1.008 0.249 0.952 -0.424 1.056 -0.015 0.948 Leader-teacher interaction -0.008 0.978 0.366 0.736 -0.269 0.967 0.210 1.003 -0.478 1.026 Note. Both continuous and interval variables were standardized before entry into the model so that the mean=0 and SD=1; dichotomous variables remained coded as 0 and 1.

164
Table 6.2 Descriptive Statistics for Teacher-Level Variables
Total (n=5533) Routine Task Discretional Task Scripted Task Normative Task
AC(n=1729) ASP (n=1340) SFA(n=1345) COMP(n=1119) Mean SD Mean SD Mean SD Mean SD Mean SD Male 0.134 0.341 0.158 0.365 0.110 0.314 0.135 0.342 0.122 0.328 White 0.561 0.496 0.437 0.496 0.701 0.458 0.565 0.496 0.579 0.494 Non-white 0.439 0.496 0.563 0.496 0.299 0.458 0.434 0.496 0.420 0.494 Hispanic 0.112 0.315 0.085 0.279 0.099 0.299 0.122 0.327 0.155 0.363 Black 0.241 0.428 0.363 0.481 0.159 0.366 0.213 0.410 0.183 0.387 Asian 0.052 0.221 0.070 0.255 0.013 0.115 0.065 0.247 0.053 0.224 Other (race) 0.044 0.206 0.056 0.229 0.034 0.182 0.046 0.210 0.037 0.188 Specialist 0.462 0.499 0.481 0.500 0.468 0.499 0.456 0.498 0.433 0.496 ELA specialist 0.040 0.195 0.057 0.232 0.035 0.184 0.026 0.159 0.035 0.183 Special education teacher 0.120 0.325 0.135 0.342 0.110 0.314 0.123 0.328 0.105 0.306 Teach the scope subjects 0.626 0.484 0.637 0.481 0.617 0.486 0.598 0.491 0.653 0.476 Teach multiple grades 0.278 0.448 0.108 0.311 0.156 0.363 0.714 0.452 0.164 0.370 Postsecondary training in literacy & math
0.000 1.000 -0.026 1.012 -0.074 0.954 -0.055 0.965 0.195 1.051
Postsecondary ELA courses 0.000 1.000 -0.057 1.002 -0.041 0.972 -0.048 0.972 0.195 1.041 Days for instructional PD 0.000 1.000 0.249 1.020 -0.077 0.988 -0.256 0.930 0.016 0.974 Have a master’s degree 0.777 0.416 0.758 0.429 0.782 0.413 0.764 0.425 0.818 0.386 Permanently certified 0.768 0.422 0.753 0.431 0.822 0.382 0.741 0.439 0.758 0.429 Teaching experience 12.369 10.024 11.682 10.148 12.262 9.713 11.784 9.791 14.259 10.251 Professional community 0.000 1.000 -0.147 1.031 -0.072 0.975 0.171 1.003 0.084 0.940 Being classified correctly 0.603 0.489 0.612 0.488 0.491 0.500 0.762 0.426 0.369 0.483
Note. Both continuous and interval variables were standardized before entry into the model so that the mean=0 and SD=1; dichotomous variables remained coded as 0 and 1.

165
Correlations
The correlation matrix representing all the teachers in all the schools sampled is
presented in Appendix K and Appendix L. The correlation matrix included the
complete list of variables used in the study, but the following discussions are limited
to a select set of measures. While Table K.1 in Appendix K shows the bivariate
correlations among all variables included in this study on the school level, Table L.1
in Appendix L presents the correlation matrix of variables on the teacher level. These
correlations were a preliminary form of analysis providing an estimate of expected
associations and strength of relationships.
As shown in Table L.1 in Appendix L, there appeared to be no instances of high
correlation for the teacher-level covariates. On the school level, one common problem
in modeling an interaction term was the high correlation between the constituent
variables and the interaction term. This problem was resolved by centering the
constituent variables prior to creating interaction terms (for details, see Aiken & West,
1991). As shown in Table K.1 in Appendix K, the GDIL was correlated with AIL at
0.45 (p<0.001), and with the interaction term of the two measures at -0.36 (p<0.001).
Among the four different types of tasks, routine tasks had the highest correlation with
the GDIL at 0.26 (p<0.001). Additionally, the GDIL showed a correlation with the
interaction terms of the four tasks (r=0.39 to 0.51, p<0.001). It was also correlated
with leader-leader interaction at 0.29 (p<0.01), and with the interaction term of the
two measures at -0.35 (p<0.001). The correlation results indicated that each of these
measures and their interaction terms were correlated, but not to an extent that the
meant multi-collinearity issues would arise in the advanced data analyses.

166
Conditional Effect of the GDIL on “Fidelity” to Instructional Regime
As discussed in Chapter 5, “fidelity” to instructional regime was a dichotomous
variable indexing whether or not a teacher was classified correctly in his/her actual
group (1=yes; 0=no). I analyzed the data within the framework of a series of
two-level hierarchical generalized linear models (HGLM) in which teachers were
nested within schools. In these models, the level 1 sampling model for the outcome
variable was a Bernoulli trial, and the level 1 link function was the log link (for details
on HGLM, see Raudenbush & Bryk, 2002). I estimated separate models for each of
the four moderating variables, respectively (see Table 6.4).
Variance Decomposition
I first estimated a two-level fully unconditional model with no predictors at
either level. As shown in Table 6.3, the estimated variance component (τ00) was 1.00.
It described the variation in correct teacher classification existing between schools,
but it did not tell how large such variation was. Data on variance components were
used to estimate how reliably we can discriminate across schools in patterns of correct
teacher classification. The reliability of the school intercept was calculated by τ00/ [τ00
+ (σ2/ nij)], where nij is the sample size for school j, and σ2/ nij is the measurement error
for the school-level variance τ00. This was an overall or average reliability for each
teacher-level coefficient across all schools. Table 6.1 shows that the reliability of the
school intercept was 0.78, indicating that we could distinguish reliably among schools
in terms of the probabilities of correct teacher classification. The table also shows that
approximately 60% of the teachers were classified correctly in their actual groups

167
based on their reported daily teaching practices in literacy.
Table 6.3 Two-Level HGLM Variance Decompositions for the Log Odds of Teachers
Being Classified Correctly (Teacher=2402; School=109)
Moderating Effect of Four Contingent Variables
Table 6.4 below presents the results of HGLM analyses of implementation
“fidelity” as a function of the GDIL, four moderating variables, and other school and
teacher characteristics. As shown in Table 6.4, five separate two-level HGLMs were
estimated. Model 1 presents the result of analyses of the direct influences of the GDIL
and four moderating variables on the log odds of teachers being classified correctly,
while controlling for other school and teacher characteristics. In Model 2a-2d, I
incorporated the interaction terms of the GDIL and each of the four moderating
variables, respectively. I scrutinized how the effect of a school’s GDIL on the log odds
of teachers being classified correctly was contingent upon each of the four moderating
variables, respectively.
As shown in Model 1, in line with my central hypothesis, the direct effect of the
GDIL on “fidelity” was not statistically significant. The GDIL was not found to exert
Being classified correctly
Estimated probability 0.597
Reliability of school mean 0.779
Between-school variance component 1.002 a The estimates shown here were based on the unit-specific model, where coefficients were converted to probabilities using the following equation:1/(1+e-(coef.)).
168
any significant effect on the log odds of teachers being classified correctly. Also,
Model 1 presents the results of analyses for the direct influences of the four
contingent factors on the “fidelity.” Task variations showed significant effects on the
log odds of teachers being classified correctly. Scripted tasks (SFA) were on average
associated with higher levels of “fidelity” than schools performing the other three
types of tasks. Teachers in scripted-task (SFA) schools on average had a significantly
higher probability than teachers in discretional-task (ASP) schools of being correctly
classified (log odds= -1.45; p<0.001). They had an even higher probability than
teachers in comparison schools, who exercised normative tasks of being classified
correctly (log odds= -1.78; p<0.001). Additionally, teachers in routine-task (AC)
schools on average had a significantly higher probability of being classified correctly
than teachers in discretional-task (ASP) schools (log odds= 0.92; p<0.01) and
normative-task (comparison) schools (log odds= 1.25, p<0.001).47 Thus the results
substantiated my anticipation that tasks that were more routine would lead to higher
levels of “fidelity”. Additionally, frequent leader-leader interaction had a significant
positive effect on “fidelity.” More frequent leader-leader interaction was on average
associated with a higher probability of teachers being classified correctly (log
odds=0.30; p<0.01). However, the schools’ AIL and leader-teacher interaction did not
show any significant effect on the log odds of teachers being classified correctly.
Models 2a-2d present the results of analyses for the moderating effect of each
of the four school contingencies, respectively, on the relationship between GDIL and
implementation “fidelity.” Specifically, in Model 2a I tested Hypothesis 1.1 by
incorporating the interaction term (GDIL × AIL) along with measures of both GDIL 47 The results were drawn by testing a similar model to Model 1 in Table 6.4 in which discretional-task (ASP) schools were used as the comparison group.

169
and AIL. In Model 2b I examined Hypothesis 2.1 by incorporating the interaction
terms of the three types of tasks and the GDIL (GDIL× routine task, GDIL×
discretional task, and GDIL× normative task) along with the measures of both the
GDIL and tasks (in comparison to scripted task). While in Model 2c I examined
Hypothesis 3.1 by adding the interaction of the GDIL and leader-leader interaction
(GDIL × leader-leader interaction), in Model 2d I tested Hypothesis 4.1 by adding the
interaction of the GDIL and leader-teacher interaction (GDIL × leader-teacher
interaction). I present the results of the four moderated models separately below.

170
Table 6.4 Between-School Model from HGLM Estimate of the Log Odds of Teachers Being Classified Correctly as a Function of the GDIL, Four Moderating Variables and Other School and Teacher Characteristics
(Teacher=2402, School=109)
Model 1 Model 2a Model 2b Model 2c Model 2d
Log Odds SE Log Odds SE Log Odds SE Log Odds SE Log Odds SE Intercept 1.302*** 0.172 1.163** 0.175 1.328*** 0.160 1.119*** 0.173 1.304*** 0.173 School Level Predictors a School size -0.193* 0.077 -0.182* 0.073 -0.192* 0.074 -0.203** 0.072 -0.194* 0.077 Disadvantage index -0.263** 0.091 -0.258 ** 0.089 -0.221* 0.094 -0.218* 0.088 -0.265** 0.091 % of FTE assistant principal 1.015+ 0.582 0.937+ 0.565 1.202* 0.525 1.048* 0.525 1.023+ 0.588 % of FTE CSR coach 0.460* 0.204 0.460* 0.198 0.513** 0.184 0.522** 0.187 0.464* 0.208 % of other leader 0.994+ 0.612 0.964 0.593 1.184* 0.547 1.076+ 0.552 1.001 0.620 Routine task (vs. scripted task) -0.521+ 0.285 0.491+ 0.277 -0.769** 0.268 -0.392 0.279 -0.519+ 0.286 Discretional task (vs. scripted task) -1.448*** 0.225 -1.335*** 0.225 -1.447*** 0.209 -1.221*** 0.222 -1.453*** 0.229 Normative task (vs. scripted task) -1.780*** 0.247 -1.730*** 0.248 -1.837*** 0.239 -1.616*** 0.246 -1.777*** 0.251 AIL -0.013 0.119 0.058 0.115 -0.046 0.114 -0.068 0.112 -0.014 0.121 Leader-leader interaction 0.295** 0.087 0.292** 0.085 0.363*** 0.081 0.321*** 0.075 0.295** 0.087 Leader-teacher interaction -0.045 0.107 -0.034 0.102 -0.051 0.111 -0.047 0.100 -0.042 0.107 GDIL 0.004 0.097 0.113 0.099 -0.117 0.113 0.148 0.094 0.005 0.098 GDIL× AIL 0.204** 0.065 GDIL× routine task 0.970*** 0.250 GDIL× discretional task 0.489** 0.169 GDIL× normative task 0.289 0.254 GDIL× leader-leader interaction 0.228*** 0.048 GDIL× leader-teacher interaction -0.012 0.073
← 1 →

171
← 2 → Table 6.4 Continued
Model 1 Model 2a Model 2b Model 2c Model 2d
Summary Statistics: Reliability of school mean 0.641 0.631 0.609 0.607 0.645 Between-school variance component 0.533 0.512 0.466 0.457 0.544
Proportion of between-school variance explained 0.467 0.488 0.534 0.543 0.456
Note. Both continuous and interval variables were standardized before being entered into the model so that the mean=0 and SD=1; dichotomous variables remained coded as 0 and 1. I also tested the models of the unadjusted GDIL (for details, see Table D.4 in Appendix D). The results showed similar results for the direct effect of the unadjusted GDIL on the outcome variable (log odds=0.106, se=0.085). In general, the interaction terms of the four contingent variables and the unadjusted GDIL had smaller coefficients, but larger standard errors compared to the interaction terms presented in Table 6.4. Thus, the conditional effects of the unadjusted GDIL were in the same direction but with less strength in comparison to those of bias-adjusted GDIL. a In these models I also controlled for teacher-level predictors, including grade, gender, race, English Language Arts specialist or not, number of postsecondary English Language Arts courses, days of professional development in instruction, special educational teacher or not, having a master’s degree or not, having a permanent certification or not and years of teaching experience. However, none of these predictors were found to have any statistically significant effect on the outcome variable. Thus the results of these teacher predictors were not displayed in the table. +p<0.1, *p<0.05, **p<0.01, ***p<0.001.

172
a. AIL
I first examined how the effect of the GDIL on the measure of “fidelity” was
moderated by the schools’ AIL. As illustrated in Model 2a in Table 6.4 above, the
results confirmed Hypothesis 1.1 that AIL had a significant moderating effect on the
relationship between the GDIL and the log odds of teachers being classified correctly.
The interaction term (GDIL×AIL) showed a significant positive effect on the log odds
of teachers being classified correctly (log odds=0.20; p<0.01). That is to say, in
schools with higher levels of AIL, the GDIL had stronger positive effects on teachers’
conformity to the regime-preferred teaching practices.
To delve into the interaction effect (GDIL×AIL) further, I then employed the
interaction-evaluation methods developed by Preacher and his colleagues (for details,
see Preacher, Curran, & Bauer, 2006).48 Preacher’s on-line tool was used to obtain
significance tests for simple slopes and to plot the conditional relations across the
range of the moderators in HLM/HGLM contexts.49 The strategy probed how schools
with different levels of AIL differed in terms of the relationship between the GDIL
and “fidelity” to the instructional regime.
The significance tests for the slopes of AIL showed that the interaction effect
(GDIL×AIL) was constant for all low AIL, but significantly positive for average and
high AIL. Specifically, a significant positive association was found between the GDIL 48 Preacher and his colleagues developed a unified collection of online resources at: http://www.quantpsy.org, in which six interactive Web pages were designed to facilitate the probing of two-way and three way interactions in MLR, HLM and LCA. 49 After estimating the HGLM models, I obtained variance-covariance matrices (as computed by the HLM program) in which values of coefficients, coefficient variances, coefficient covariances for the GDIL, the moderator, and the interaction between GDIL and the moderator were obtained. Then, using Preacher’s on-line interaction tools, I entered these values into the utility to assess the effect of schools’ GDILs on the log odds of teachers being classified correctly at specific conditional values of the moderator: the mean, one SD below the mean and one SD above the mean (Preacher, Curran, & Bauer, 2006).

173
and “fidelity” in schools with high (1 SD above the mean) (log odds=0.42; p<0.01)
and average levels (log odds=0.20; p<0.05) of AIL. However, no such statistically
significant relationship was found in schools with low levels (1 SD below the mean)
of AIL. The conditional relations between the GDIL and “fidelity” across levels of
AIL were plotted in Figure 6.1. The figure shows that in schools with high and
average levels of AIL GDIL had stronger positive effects on “fidelity”. These results
suggest that a school’s AIL is as an important moderating variable for the GDIL’s
influence on teachers’ “fidelity” to instructional regimes.
Figure 6.1 GDIL and AIL Predicting the Probability of Teachers Being Classified
Correctly
0
0.125
0.25
0.375
0.5
0.625
0.75
0.875
1
-3.06 -1.91 -0.76 0.39 1.54
Prob
abili
ty o
f bei
ng C
lass
ified
C
orre
ctly
GDIL
High Avg AILAvg Avg AILLow Avg AIL

174
a. Task
Model 2b in Table 6.4 above tested how task variations moderated the influence
of the GDIL on implementation “fidelity”. The results showed that the GDIL had a
weaker positive effect on scripted-task (SFA) schools than on other types of schools.
The interaction effect of GDIL and routine task (vs. scripted task) was statistically
significant (log odds=0.97; p<0.001), indicating that the GDIL had a significantly
stronger positive effect on the log odds of teachers being classified correctly in
routine-task (AC) schools than in scripted-task (SFA) schools. Also, the interaction
effect of the GDIL and discretional task (vs. scripted task) was statistically significant
(log odds=0.49; p<0.01), indicating that the GDIL had a significantly stronger
positive effect on the log odds of teachers being classified correctly in
discretional-task (APS) schools than in scripted-task (SFA) schools.
However, the GDIL showed a stronger positive effect on the measure of
“fidelity” in routine-task (AC) schools than in discretional-task (ASP) schools (log
odds=0.46; p<0.1).50 According to Hypothesis 2.1, the GDIL was presupposed to
have a stronger positive effect in ASP schools in which tasks were more non-routine
than in AC schools in which tasks were more routine. Thus, these results were only
partially consistent with Hypothesis 2.1. Although the GDIL had the least strong
positive effect on schools with scripted tasks (as in SFA schools), it did not show the
strongest positive effect in schools with non-routine/discretional tasks (as in ASP
schools).
Furthermore, I conducted post-hoc separate analyses on schools performing
50 The results were drawn by testing a similar model to Model 2b in Table 6.4 in which discretional-task (ASP) schools were used as the comparison group.

175
different teaching tasks. I intended to parcel out the significance and degree of the
effects of the GDIL on “fidelity” in schools characterized by different tasks. I used the
interaction-evaluation methods developed by Preacher and his colleagues to obtain
significance tests for simple slopes and to plot the conditional relations across tasks
(for details, see Preacher, Curran, & Bauer, 2006). In Figure 6.2, I plotted the simple
slopes of the regression of the probability of teachers being classified correctly on the
GDIL in schools characterized by the four different tasks. The results showed that in
AC schools in which routine tasks were carried out, a greater GDIL was on average
associated with a significantly higher probability of exercising the program-endorsed
teaching practices (log odds=0.74; p<0.01). Also, in ASP schools performing
discretional tasks, the GDIL appeared to have a stronger positive effect on “fidelity,”
but it was not statistically significant. In contrast, in SFA schools in which scripted
tasks were undertaken, a greater GDIL was on average associated with a significantly
lower probability of performing the program-preferred teaching practices (log odds=
-0.40; p<0.01). That is, in scripted-task (SFA) schools, a more equal distribution of
instructional leadership was on average associated with a significantly lower level of
“fidelity.” Thus scripted tasks had a significantly negative moderating effect on the
positive relationship between the GDIL and “fidelity.” Overall, the results were
partially consistent with Hypothesis 2.1. The GDIL had the strongest positive effect in
routine-task schools (and not in discretional-task schools) and the weakest positive
effect in scripted-task schools.

176
Figure 6.2 GDIL and Tasks Predicting the Probability of Teachers Being Classified
Correctly
b. Leader-Leader Interaction
The results of the analyses of frequent leader-teacher interaction are displayed
in Model 2c in Table 6.4 above. I incorporated the interaction term (GDIL×
leader-leader interaction) along with measures of both the GDIL and leader-leader
interaction to examine if schools’ frequency of leader-leader interaction had any
moderating impact on the relationship between the GDIL and “fidelity” (Hypothesis
3.1).
As shown in Model 2c in Table 6.4, the interaction term (GDIL × leader-leader
0
0.125
0.25
0.375
0.5
0.625
0.75
0.875
1
-3.06 -1.91 -0.76 0.39 1.54
Prob
abili
ty o
f bei
ng C
lass
ified
C
orre
ctly
GDIL
Routine Task (AC)Scripted Task (SFA)Discretional Task (ASP)Normative Task (Comp)

177
interaction) had a statistically significant positive effect on the log odds of teachers
being classified correctly (log odds=0.23; p<0.001). The results showed that equally
distributed instructional leadership had stronger positive effects on “fidelity” in
schools in which more frequent leader-leader interaction existed. Thus Hypothesis 3.1
was confirmed.
Again, I conducted post-hoc separate analyses on schools characterized by
different levels of leader-leader interaction. I examined the significance and degree of
the effects of GDIL on “fidelity” in schools with different levels of leader-leader
interaction. Based on the interaction-evaluation methods developed by Preacher and
his colleagues (Preacher et al., 2006), I obtained the significance tests for simple
slopes and plotted the conditional relations across levels of leader-leader interaction.
The results of the significance tests showed a significant positive effect of GDIL on
the probability of teachers being classified correctly in schools with high levels (1 SD
above the mean) of leader-leader interaction (log odds=0.34; p<0.01). However, no
statistically significant association was found between the GDIL and the outcome
measure in schools with average (mean) or low levels (1 SD below the mean) of
leader-leader interaction. The conditional relations across levels of leader-leader
interaction were plotted in Figure 6.3 below. The results substantiated Hypothesis 3.1,
which presupposed that frequent leader-teacher interaction was an important
moderating variable for the GDIL to exert any positive influence on implementation
“fidelity”. In schools with more frequent leader-leader interaction, more equal
distribution of instructional leadership is more advantageous to the faithful
implementation of instructional innovations.

178
0
0.125
0.25
0.375
0.5
0.625
0.75
0.875
1
-3.06 -1.91 -0.76 0.39 1.54Prob
abili
ty o
f Bei
ng C
lass
ified
Cor
rect
ly
GDIL
High Avg Ldr-Ldr InterAvg Avg Ldr-Ldr InterLow Avg Ldr-Ldr Inter
Figure 6.3 GDIL and Leader-Leader Interaction Predicting the Probability of
Teachers Being Classified Correctly
c. Leader-Teacher Interaction
A similar approach was used to test Hypothesis 4.1 regarding the moderating
effect of the frequency of leader-teacher interaction on the relationship between GDIL
and implementation “fidelity.” I incorporated the interaction term (GDIL×
leader-teacher interaction) along with measures of both the GDIL and leader-teacher
interaction. The results of the analyses are displayed in Model 2d in Table 6.4 above.
They indicate that the moderating effect of frequent leader-teacher interaction on the

179
relationship between the GDIL and the outcome measure was not statistically
significant. Thus Hypothesis 4.1 was rejected.
Summary of Results for “Fidelity” to Instructional Regime
In general, the evidence supported my central premise that the direct influence
of the GDIL on “fidelity” to an instructional regime was not statistically significant.
Rather, the influence was contingent upon certain features of school context.
However, my hypotheses were only partially supported. Consistent with my
hypotheses (Hypothesis 1.1 & Hypothesis 3.1), schools’ average instructional
leadership and leader-leader interaction were found to both positively influence
“fidelity” and reinforce the positive effects of the GDIL on “fidelity.” For school tasks,
however, although my analyses did show that they had significant moderating effects
on the GDIL, they did not strictly follow my hypothesis (Hypothesis 2.1). The GDIL
showed the strongest positive effects in routine-task schools, and not in
discretional-task schools. While the results showed that leaders needed to be aligned
in their views to promote “fidelity” and that without such alignment the GDIL had
little effect on “fidelity” (Hypothesis 3.1), leader-teacher interaction was not found to
be a powerful way to promote “fidelity.” Contrary to Hypothesis 4.1, leader-teacher
interaction did not have any direct effect on “fidelity,” nor did it enhance the effects of
GDIL on “fidelity.”

180
Conditional Effect of GDIL on Professional Community
The analyses of the relationship between GDIL, four school contingencies and
professional community in schools were developed within the framework of a series
of three-level hierarchical linear models (HLMs). In the HLMs, teachers’ scale scores
on their reported professional community for a given survey year (level 1) were
nested within the teachers (level 2), who were in turn nested within schools (level 3).
The analyses were conducted separately for the four moderating variables (see Table
6.6).
Variance Decomposition
I began with the estimates of a fully unconditional model (FUM) for
professional community. Fitting a model with no predictors at each level provided a
useful diagnostic of the amount of variation available to be predicted at each level.
Table 6.5 displays the results of the FUM. The FUM yielded a reliability of school
intercept of 0.91 and a reliability of teacher intercept of 0.63, indicating that the
outcome variable was reliably estimated. Also, the model results revealed that
approximately 16% of the total variance in professional community lay between
schools, 43% of the variance occurred between teachers, and individual teachers
accounted for 42% of the variance. Thus the between- and within-school variances
were sufficient to proceed with conditional models that included both school-and
teacher-level predictors.

181
Table 6.5 Three-level HLM Variance Decompositions for Professional Community (Teacher=5333; School=109)
Moderating Effect of Four Contingent Variables
Table 6.6 below presents the results of HLM analyses of professional
community as a function of the GDIL, four contingent variables, and other school and
teacher characteristics. As shown in Table 6.6 below, five separate three-level HLMs
were estimated. Model 1 presents the results of analyses of the direct influences of the
GDIL and four moderating variables on professional community, while controlling for
other school and teacher characteristics. In Model 2a-2d, I incorporated the interaction
term of the GDIL and each of the four moderating variables, respectively. I
scrutinized how the effect of schools’ GDIL on professional community was
conditional on each of the four moderating variables, respectively.
As shown in Model 1, in line with my central hypothesis, the direct effect of the
GDIL on school professional community was not statistically significant. Also, Model
1 presents the results of analyses for the direct influences of the four contingent
factors on professional community. The results indicate that task variations had
Professional community Reliability of school mean 0.911 Reliability of teacher mean 0.630 Between school variance component 0.158 Within school variance component 0.434 Within teacher variance component 0.426 Proportion of variance among schools 15.6% Proportion of variance among teacher 42.6% Proportion of variance within teachers 41.8%

182
significant effects on professional community. Scripted-task (SFA) schools did not
differ significantly from either routine-task (AC) or normative-task (comparison)
schools in terms of the strength of professional community. However,
discretional-task (ASP) schools had significantly greater professional community than
both scripted-task (SFA) and routine-task (AC) schools. While holding other variables
constant, discretional-task (ASP) schools had an average of 0.26 SD greater
professional community than scripted-task (SFA) schools (p<0.05) and an average of
0.44 SD greater professional community than routine-task (AC) schools (p<0.01).51
Generally, the results were consistent with my proposition that teaching tasks that
were more non-routine would be associated with higher levels of professional
community. Additionally, frequent leader-leader interaction was a statistically
significant predictor of professional community (SD =0.14; p<0.001). A one SD
increase in the frequency of leader-leader interaction was on average associated with a
0.14 SD increase in professional community while holding other variables constant.
However, AIL and frequent leader-teacher interaction did not have any significant
effect on professional community.
It was also interesting to examine the impact of other school- and teacher-level
predictors on professional community, though they were not the focus of this study.
For example, schools that were more disadvantaged on average had lower levels of
professional community (SD= -0.11; p<0.01). Also, greater percentages of FTE
instructional leaders were on average associated with lower levels of professional
community. Specifically, while controlling for other variables, a one SD increase in
the percentage of FTE assistant principals was on average associated with a 0.68 SD 51 The results were drawn by testing a similar model to Model 2b in Table 6.6 in which discretional-task (ASP) schools were used as the comparison group.

183
decrease in professional community (p<0.01); a one SD increase in the percentage of
FTE CSR coaches was on average associated with a 0.30 SD decrease in professional
community (p<0.001); and a one SD increase in the percentage of FTE other
instructional leaders was on average associated with a 0.69 SD decrease in
professional community (p<0.01).
As for the teacher level predictors, female (SD=0.08, p<0.01) and non-white
(SD=0.13, p<0.001) teachers reported higher average levels of professional
community than male and white teachers. Also, days of professional development in
instruction was a statistically significant predictor of professional community: a one
SD increase in professional development days was on average associated with a 0.20
SD increase in professional community while controlling for other covariates
(p<0.001). Teaching experience also had a significant positive effect on professional
community: a one SD increase in years of teaching was on average associated with a
0.04 SD increase in professional community (p<0.05). However, compared to
teachers without a master’s degree, those who had a master’s degree reported an
average of 0.09 SD lower professional community (p<0.01).
Models 2a-2d present the results of analyses for the moderating effect of each
of the four school contingencies, respectively, on the relationship between the GDIL
and professional community. Specifically, in Model 2a I tested Hypothesis 1.2 by
incorporating the interaction term (GDIL × AIL) along with the measures of both the
GDIL and AIL. In Model 2b I examined Hypothesis 2.2 by incorporating the
interaction terms of three types of tasks and the GDIL (GDIL× routine task, GDIL×
discretional task, and GDIL× normative task) along with the measures of both the
GDIL and tasks (in comparison to the scripted task). While in Model 2c I examined

184
Hypothesis 3.2 by adding the interaction of the GDIL and frequent leader-leader
interaction (GDIL × leader-leader interaction), in Model 2d I tested Hypothesis 4.2 by
adding the interaction of the GDIL and frequent leader-teacher interaction (GDIL ×
leader-teacher interaction). I discuss the results of the four moderated models
separately below.

185
Table 6.6 Three-Level HLM Estimate of Professional Community as a Function of GDIL, Four Moderating Variables and Other School and Teacher Characteristics (Teacher=5533, School=109)
Model 1 Model 2a Model 2b Model 2c Model 2d
Coef. SE Coef. SE Coef. SE Coef. SE Coef. SE Intercept 0.145* 0.062 0.139* 0.058 0.153** 0.056 -0.005 0.077 -0.029 0.069 School Level Predictors School size -0.023 0.030 -0.021 0.031 -0.021 0.032 -0.023 0.030 -0.023 0.030 Disadvantage index -0.114** 0.035 -0.113** 0.035 -0.114** 0.037 -0.117** 0.036 -0.107** 0.036 % of FTE assistant principal -0.680** 0.196 -0.693** 0.199 -0.688** 0.192 -0.679** 0.194 -0.731*** 0.192 % of FTE CSR coach -0.301*** 0.071 -0.299*** 0.072 -0.307*** 0.069 -0.304*** 0.071 -0.333*** 0.069 % of other leader -0.694** 0.204 -0.696** 0.208 -0.705** 0.200 -0.697** 0.203 -0.756*** 0.199 Routine task (vs. scripted task) -0.176 0.090 -0.168 0.089 -0.170 0.098 -0.182 0.098 -0.181 0.096 Discretional task (vs. scripted task) 0.258* 0.097 0.193* 0.096 0.171+ 0.096 0.148 0.103 0.196* 0.095 Normative task (vs. scripted task) 0.158 0.099 0.177 0.098 0.157 0.098 0.150 0.100 0.136 0.096 AIL 0.039 0.053 0.032 0.053 0.041 0.053 0.041 0.055 0.052 0.050 Leader-leader interaction 0.137*** 0.028 0.136*** 0.028 0.132*** 0.029 0.137*** 0.028 0.137*** 0.028 Leader-teacher interaction 0.031 0.042 0.034 0.040 0.039 0.042 0.031 0.042 0.010 0.040 GDIL -0.084 0.052 -0.061 0.046 -0.070 0.055 -0.091 0.048 -0.091 0.046 GDIL× AIL 0.066* 0.030 GDIL× routine task -0.030 0.093 GDIL× discretional task 0.009 0.093 GDIL× normative task -0.079 0.073 GDIL× leader-leader interaction -0.010 0.025 GDIL× leader-teacher interaction 0.085** 0.026
Teacher Level Predictors Male -0.078* 0.038 -0.078* 0.038 -0.078* 0.038 -0.078* 0.038 -0.078* 0.038
← 1 →

186
← 2 → Table 6.6 Continued
Model 1 Model 2a Model 2b Model 2c Model 2d
Coef. SE Coef. SE Coef. Coef. SE Coef. SE Coef. Nonwhite 0.132*** 0.031 0.132*** 0.031 0.132*** 0.031 0.132*** 0.031 0.132*** 0.031 Specialist 0.008 0.030 0.008 0.030 0.008 0.030 0.008 0.030 0.009 0.030 Postsecondary training -0.008 0.013 -0.008 0.013 -0.008 0.013 -0.008 0.030 -0.008 0.030 Instructional PD days 0.204*** 0.013 0.204*** 0.013 0.205*** 0.013 0.205*** 0.013 0.205*** 0.013 Teach the scope subjects -0.017 0.034 -0.017 0.034 -0.017 0.034 -0.017 0.034 -0.017 0.034 Teach multiple grades -0.044 0.034 -0.045 0.034 -0.044 0.034 -0.044 0.034 -0.045 0.034 Have a master’s degree -0.089** 0.028 -0.088** 0.028 -0.089** 0.028 -0.089** 0.028 -0.089** 0.028 Permanently certified -0.074* 0.029 -0.074* 0.029 -0.075* 0.029 -0.075* 0.029 -0.075* 0.029 Teaching experience 0.037* 0.014 0.038* 0.014 0.038* 0.014 0.038* 0.014 0.038* 0.014 Summary Statistics: Reliability
Teacher mean 0.608 0.608 0.608 0.608 0.608 School mean 0.843 0.838 0.841 0.842 0.831
Residual variance components Teacher level 0.394 0.394 0.394 0.394 0.394 School level 0.077 0.075 0.076 0.076 0.071 Proportion of variance explained Teacher level 0.075 0.075 0.075 0.075 0.075
School level 0.500 0.512 0.506 0.506 0.539 Note. Both continuous and interval variables were standardized before being entered into the model so that the mean=0 and SD=1; dichotomous variables remained coded as 0 and 1. I also tested models of the unadjusted GDIL (for details, see Table D.4 in Appendix D). The results showed similar results for the direct effect of the adjusted GDIL on the outcome variable (SD = -0.001; se=0.034). In general, the interaction terms of the four contingent variables and the unadjusted GDIL had smaller coefficients, but larger standard errors compared to the interaction terms presented in Table 6.6. Thus, the conditional effects of the unadjusted GDIL were in the same direction but with less strength in comparison to those of bias-adjusted GDIL. +p<0.1, *p<0.05, **p<0.01, ***p<0.001

187
a. AIL
Model 2a in Table 6.6 above tested Hypothesis 1.2 which predicted that the
GDIL would have a stronger positive effect on professional community in schools
with higher levels of AIL. The result showed that Hypothesis 1.2 received substantial
support. The interaction term (GDIL×AIL) showed a significant positive effect on
professional community (SD= 0.07; p<0.05), indicating that AIL had a statistically
significant moderating effect on the relationship between the GDIL and professional
community
The post-hoc analyses based on Preacher’s online tool provided a clearer
picture of the interaction effect of the GDIL and AIL (GDIL× AIL) (Preacher, Curran,
& Bauer, 2006). The tool was used to obtain significance tests for simple slopes and
to plot the conditional relations across the range of the moderators in HLM contexts.
This approach facilitated in-depth analyses of how schools with different average
levels of AIL differed in terms of the influence of the GDIL on professional
community.
The results of the significance tests showed a significant negative association
between the GDIL and professional community in schools with low levels (1 SD
above the mean) of AIL (SD=0.11; p<0.05). Specifically, in schools with low levels (1
SD below the mean) of AIL, one SD increase in the GDIL was on average associated
with a 0.11 SD decrease in professional community (p<0.05). A negative association
was also found in schools with average levels (mean) of AIL, but this was not
statistically significant (SD= -0.04, se=0.05). In contrast, in schools with high levels
(1 SD above the mean) of AIL, the GDIL had a positive effect on professional

188
community, although the effect was also not statistically significant (SD=0.03,
se=0.07). The conditional relations between the GDIL and professional community
across levels of AIL were plotted in Figure 6.4 below.
The results suggest that the schools’ AIL was an important moderating
variable for the GDIL to exert any negative effect on professional community (rather
than a positive effect, as predicted by Hypothesis 1.2). That is to say, in a school with
many “weak” instructional leaders, the effect of distributed instructional leadership on
the school’s professional community was negative. It was only when instructional
leadership functions that were distributed among multiple leaders were exercised that
the GDIL has positive effect on the school’s professional community.
Figure 6.4 GDIL and AIL Predicting Professional Community
-0.1
0
0.1
0.2
0.3
0.4
0.5
-3.06 -1.91 -0.76 0.39 1.54
Prof
essi
onal
Com
mun
ity
GDIL
High Avg AILAvg Avg AILLow Avg AIL

189
b. Task
Model 2b in Table 6.6 above summarizes the results of analyses for the second
moderating variable — task. In Model 2b, I examined whether school task was a
moderating variable for the GDIL to influence schools’ professional community
(Hypothesis 2.2). However, the results showed that the interaction effects of tasks and
the GDIL on schools’ professional community were not statistically significant. Thus
Hypothesis 2.2 was rejected.52
c. Leader-Leader Interaction
The results of analyses of frequent leader-leader interaction are displayed in
Model 2c in Table 6.6 above. I incorporated the interaction term (GDIL× leader-leader
interaction) in order to examine if schools’ frequent leader-leader interaction had any
moderating impact on the relationship between GDIL and professional community
(Hypothesis 3.2). However, as shown in Model 2c, the interaction term (GDIL ×
leader-leader interaction) was not shown to be a statistically significant predictor of
professional community. Thus, Hypotheses 3.2, which anticipated frequent
leader-leader interaction as a moderating variable for the GDIL was rejected.
52 I also conducted post-hoc analyses estimating the direction and size of the effects of GDIL on professional community in schools characterized by different types of tasks. The results of those analyses showed that the GDIL did not have a statistically significant effect on professional community in any of the four types of schools (scripted-task, routine-task, discretional-task, or normative-task).

190
d. Leader-Teacher Interaction
A similar approach was used to test hypothesis 4.2 regarding the moderating
effect of schools’ frequent leader-teacher interaction on the linkage between GDIL and
professional community. Model 2d in Table 6.6 above presents the results of the
analyses. As indicated in Model 2d, the interaction term (GDIL × leader-teacher
interaction) had a statistically significant effect on professional community (SD=0.09;
p<0.01).
Again, I conducted post-hoc separate analyses on schools characterized by
different levels of leader-teacher interaction. I intended to reveal the significance and
degree of the effects of GDIL on professional community in schools with different
levels of leader-teacher interaction. Based on the interaction-evaluation methods
developed by Preacher and his colleagues (Preacher et al., 2006), I obtained the
significance tests for simple slopes and plotted the conditional relations across the
levels of leader-teacher interaction.
The results of the significance tests showed a significant negative effect of
GDIL on professional community in schools with low levels (1 SD below the mean)
of leader-teacher interaction (SD= -0.11; p<0.05). Specifically, in schools with low
levels (1 SD below the mean) of leader-teacher interaction, one SD increase in the
GDIL was on average associated with a 0.11 SD decrease in professional community
while holding other variables constant. In schools with average levels (mean) of
leader-teacher interaction, the GDIL had a negative but insignificant effect on
professional community (SD= -0.02, se=0.03). In contrast, in schools with high levels
(1 SD above the mean) of leader-teacher interaction, the GDIL had a positive but still

191
insignificant effect on professional community in schools (SD=0.06, se=0.04). The
conditional relations across levels of leader-teacher interaction were plotted in Figure
6.5 below.
The results suggest that the schools’ frequent leader-teacher interaction is an
important moderating variable for the GDIL to exert any negative effect on
professional community (rather than a positive effect, as predicted by Hypothesis 4.2).
In a school in which leaders did not interact with teachers frequently, the effect of
distributed instructional leadership on the school’s professional community was
negative. It was only when leaders interacted with teachers frequently that the GDIL
became positive to the school’s professional community.
Figure 6.5 GDIL and Leader-Teacher Interaction Predicting Professional Community
-0.1
0
0.1
0.2
0.3
0.4
0.5
-3.06 -1.91 -0.76 0.39 1.54
Prof
essi
onal
Com
mun
ity
GDIL
High Avg ldr-Ttr InterAvg Avg Ldr-Ttr InterLow Avg Ldr-Ttr Inter

192
Summary of Results for Professional Community
In general, the evidence supported my central premise that the direct influence
of the GDIL on schools’ professional community would not be statistically significant.
Rather, the effectiveness of the GDIL for improving professional community was
contingent upon certain features of school context.
However, my hypotheses were only partially supported. Although the results of
the analyses for AIL and leader-teacher interaction substantiated my hypotheses, the
effects were not precisely in the direction predicted in the hypotheses (Hypothesis 1.2
& Hypothesis 4.2). Both AIL and leader-teacher interaction had no direct effect on
professional community. However, they reinforced the effects of the GDIL on
professional community. Specifically, in a school in which many “weak” leaders
existed or leaders did not interact with teachers frequently, the effects of the GDIL on
the school’s professional community were negative. It was only when leaders actually
exercised leadership functions or interacted with teachers frequently that the GDIL
became positive to professional community. In addition, the results showed that
although school task and leader-leader interaction had direct effects on professional
community, they did not significantly enhance the effects of GDIL on professional
community (Hypothesis 2.2 & Hypothesis 3.2).

193
CHAPTER VII
CONCLUSIONS
This dissertation explored the effects of distributed leadership on school
outcomes, contingent on certain features of school contexts. It contributes to the
sparse quantitative literature on the “dispersed leadership” to approach distributed
leadership. With contingency theory as a guiding framework, I explored whether the
“equality” of DIL influenced “fidelity” to instructional regimes and the strength of
professional community in schools (Question 1), and how these influences were
contingent upon four school conditions (Question 2). The study was conducted using
large-scale, longitudinal quasi-experimental data that provided comprehensive
measures for DIL and the necessary school and teacher information.
In Chapter 6, the findings for the two school outcomes exploring the
conditional effects of the GDIL were described in some detail. In this final chapter, I
briefly summarize the research findings, articulate the limitations and outline the
implications of the study for future research.
Review of Results
Overall, the results of the analyses supported my central premise that the direct
influences of the GDIL on schools’ “fidelity” to instructional regime and professional

194
community were not statistically significant. Rather, the evidence substantiated my
primary assertions about the predictive value of contingency theory in estimating the
effects of GDIL on school outcomes. The effects of GDIL on the two outcomes were
contingent upon certain features of school context. However, the moderating effects
not only varied across the four identified school contingencies, but also varied
between the two outcomes.
The average instructional leadership (AIL) exercised by multiple leaders in a
school was shown to enhance the effects of GDIL on both school’s “fidelity” to
instructional regime and professional community. That is to say, the GDIL had
stronger positive effects on the two outcomes in schools in which many “strong”
instructional leaders existed.
Organizational task is believed in contingency theory to be one of the most
critical contingent factors that explain variation in the structure and effectiveness of a
rational organization (Perrow, 1967; Thompson, 1967; Woodward, 1965). Thus, I
hypothesized that the influences of the GDIL on the two outcomes were contingent
upon the nature of schools’ tasks (routine vs. non-routine). The GDIL was predicted
to have weaker positive effects on the two outcomes in schools in which tasks were
more routine. The evidence showed that school task was a significant moderating
variable for the GDIL’s influence on implementation “fidelity,” but not on
professional community. The GDIL had stronger positive effects on “fidelity” in
routine-task (AC) and discretional-task (ASP) schools than in scripted-task (SFA)
schools. However, moderating effects of task variations on the GDIL’s influence on
schools’ professional community were not found.
Frequent leader-leader interaction and leader-teacher interaction are the two

195
contingent variables representing leader relationships with school members. The
interaction term of the GDIL with leader-leader interaction was positive for one
outcome but not the other. The same was true for leader-teacher interaction. Across
the analyses, it appeared that leader-leader interaction enhanced the effects of GDIL
on “fidelity”, but leader-teacher interaction enhanced the effects of GDIL on
professional community. These effects make sense and are consistent with the overall
logic of contingency theory. For “fidelity,” the GDIL has a positive effect when
leaders are consistent, — and consistency arises from frequent leader-leader
interaction. For professional community, the GDIL works when leaders interact
frequently with teachers.
In general, school contingencies contributed to the GDIL to promote both
implementation “fidelity” and professional community. The effects of GDIL on
“fidelity” were greater when there was more average leadership, when the task was
routine (but not discretional), and when leaders interacted more frequently. The
effects of GDIL on professional community were greater when there was more
average leadership and when leaders interacted with teachers more frequently. The
results were consistent with the overall ideas of contingency theory about mechanistic
and organic designs in which distributed leadership is more or less likely to occur
(Burns & Stalker, 1961).

196
Table 7.1 Summary of Results of Analyses
“Fidelity” to Instructional Regime
Professional Community
Summary Hyp. Findings Hyp. Findings
GDIL 0.00 (0.10) -0.08 (0.05)
AIL -0.01 (0.12) 0.04 (0.05)
GDIL× AIL H1.1 0.20** (0.06) H1.2 0.07* (0.03)
Task Routine task (vs. scripted) -0.52 (0.29) -0.18 (0.09) Discretional task (vs. scripted) -1.45*** (0.23) 0.26* (0.20) Routine task (vs. discretional) 0.92** (0.25) -0.44*** (0.08)
GDIL× task H2.1 H2.2 GDIL× routine task (vs. scripted)
0.97*** (0.25)
-0.03 (0.09)
GDIL× discretional task (vs. scripted)
0.49** (0.17) 0.01 (0.09)
GDIL× routine task (vs. discretional)
0.46+ (0.27) -0.03 (0.12)
Leader-leader interaction 0.29** (0.09) 0.14*** (0.03)
GDIL× leader-leader interaction H3.1 0.23*** (0.05) H3.2 -0.01 (0.03)
Leader-teacher interaction -0.05 (0.11) 0.03 (0.04)
GDIL× leader-teacher interaction H4.1 -0.01 (0.07) H4.2 0.09** (0.03)
Note. Standard errors are shown in parentheses. +p<0.1, *p<0.05, **p<0.01, ***p<0.001

197
Theoretical Contributions
In this section, I summarize the major contributions of this dissertation to
organizational theory and school leadership.
By attending to both the programmed and adaptive approaches to school
improvement, this dissertation provides a comparatively comprehensive portrait of the
effects of distributed leadership on school improvement outcomes. While both
programmed and adaptive approaches are important approaches to school
improvement, they feature two contrasting strategies for improving instruction. In a
sample of instructional interventions, promoting “fidelity” to instructional regimes is
a goal-oriented “programmed” approach that seeks to change instruction by
promoting alignment of teacher practice to a planned instructional regime. Fostering
professional communities in schools is an organization-oriented “adaptive” approach
that intends to change instruction by promoting organizational health so that
commitment to the implementation process is enhanced (Rowan & Miller, 2007, p.
254). Findings regarding the varied effects of distributed leadership on varied
outcomes will inform ongoing discussions about the inconsistent consequences of
distributed leadership for school improvement outcomes.
Additionally, this dissertation contributes theories about the effects of
distributed leadership on school improvement outcomes. Previous research lacks a
strong theory and empirical evidence on the effects of distributed leadership, both on
instructional improvement directly and conditional on certain features of school
context. This study is the first to address this gap. Distributed leadership is
conceptualized for the first time not only as “equality” of dispersion of a variety of
leadership functions, but also as situationally dependent. With broad contingency

198
theory as the guiding framework, I used in large-scale, longitudinal
quasi-experimental data to examine how the four identified school contingencies
moderated the effects of distributed leadership. Thus the study contributes to
leadership theory by illuminating how school contingencies shape the effectiveness of
distributed leadership for school improvement.
Moreover, this study is the first to attempt to develop a quantitative measure for
distributed leadership based on the “dispersed leadership” approach. Empirical efforts
on distributed leadership have focused primarily on “average leadership;” they
dismiss the “dispersed leadership” perspective. I filled this gap by developing a
quantitative measure for distributed instructional leadership — the Gini Coefficient
for Distributed Instructional Leadership (GDIL). The GDIL estimates the degree to
which instructional leadership is “equally” distributed across multiple roles or
individuals. Although my corrections of the measure did not resolve the entire
small-sample bias of the GDIL, I posited new ways to conceptualize and measure the
distributed leadership construct.
However, the results of my analyses indicate that the emphasis on “dispersed
leadership” should not obscure the importance of “average leadership.” While I
focused on “dispersed leadership,” I integrated both perspectives in my empirical
inquiry into distributed leadership. I conceptualized distributed leadership in terms of
both “equality” and “strength.” The results suggest that when we seek more “equality,”
we cannot overlook the actual “strength” of leadership exercised by multiple roles or
individuals. The two perspectives on distributed leadership interact to benefit
instructional improvement. In schools in which leadership is equally distributed, those
with strong leadership exercised by school members are expected to have high levels

199
of implementation “fidelity” and high levels of professional community. Conversely,
schools with weak leadership exercised by multiple leaders will have low levels of
“fidelity” and low levels of professional community. Comparing the two cases (i.e.
equality with strong leadership vs. equality with weak leadership), we can infer that
distributed leadership is more effective when leadership is not only equally distributed,
but also strong overall.
Practical Implications
In addition to making scholarly contributions, the findings will advance the
understanding of policymakers and practitioners in their efforts either to improve
current designs for instructional intervention or to promote better school
cultures/climates.
The study shows that reformers who intend to encourage more equal
distribution of leadership as a lever for school improvement, should also seek to
develop a correspondingly supportive school environment in which distributed
leadership can flourish. For example, as the results of this study show, distributing
leadership equally across multiple leaders is beneficial only when school leaders
actually exercise leadership functions, and interact frequently with each other or with
teachers.
However, at the same time, reformers should be attentive to variations in targets
of change (school outcomes) and features of school context (school contingencies).
The results of this study showed that the moderated effects of distributed leadership
not only varied across different targets of change, but also across different school

200
contingencies. Thus, the possibility of capitalizing on the potential of distributed
leadership to improve instruction is affected by variations in targets of change and
contextual factors. Reformers and practitioners should seek a good “match” between
distributed leadership, school context and target of change in their efforts to improve
schools. This will enhance the chances that distributed leadership successfully
improves schools; otherwise, the anticipated effects might be null or even
counterproductive.
Limitations and Future Research
Of course, all of the findings discussed here should be advanced tentatively, for
the current study is not without limitations. The study also suggests some important
initiatives for future research.
Following the “mediated-effect” model of leadership effects (Heck & Hallinger,
2009), I identified two contrasting approaches to improving instruction (i.e.
“programmed” vs. “adaptive”) and hypothesized that the effects of distributed
instructional leadership on the two approaches were conditional on four school
contingencies. Whereas I did find such conditional effects, the results were not always
consistent with my theory, which challenged both my theory and theory of distributed
leadership in general. Thus future research needs to develop a theory that is more
conceptually and empirically consistent. It should take into account the following
specifics.
First, we need a better measure for “equality” of distributed leadership. This
study is the first to conceptualize distributed leadership in terms of “equality”
201
(“dispersed leadership”) in addition to “strength” (“average leadership”). However the
concept of “equality” was difficult to measure in terms of the GDIL in the school
context primarily due to small-sample bias. Albeit that the upward-adjusted strategy I
utilized has been shown to reduce the bias to a large extent, the linearly bias-corrected
GDIL was still far from obtaining completely unbiased estimates of the true
population. Previous empirical evidence has shown that this strategy can reduce the
small-sample bias significantly (for details, see e.g., Deltas, 2003). However, when
the sample is too small, as in the case of this study (an average of six leaders per
school, ranging from two to 18), the upper-bound problem could not be resolved
entirely.
Thus there is a need to address small-sample biases, either by more thoroughly
establishing the validity of the measure or by creating an improved one. Future
research can either probe more deeply into alternative approaches to calculating the
Gini Coefficient or explore other equality (or inequality) measures aside from the Gini
Coefficient. A considerable number of inequality or concentration indices have been
devised by economists, sociologists, political scientists and statistical physicians.
These include the Schutz Coefficient (Schutz, 1951), Atkinson’s (1970) indices, the
Theil index (Theil, 1979), and the Sen (1973) index for income or welfare distribution.
Measures used in other fields include the Herfindahl-Hirschman (HH) index
(Herfindahl, 1950) for industrial concentration, Blau’s (1977) index and Teachman’s
(1980) index for population diversity, and the generalized entropy (GE) family of
measures (Cowell, 2000). Future research can focus on improved methodological
tools for distributed leadership based on these other inequality (or equality) indices.
Also, constrained by such small samples, I was unable to examine

202
between-group “equality;” instead, I focused only on within-group “equality” in a
school. In other words, my estimate of the GDIL focused on distributed leadership
among all individuals in a school, regardless of the leadership roles/positions they
were designated to. For example, I estimated a GDIL among 18 individuals in a
school. However, these 18 individuals took four different leadership roles, e.g.,
principal, assistant principal, CSR coach, and other leaders. It would be also
interesting to explore the “equality” of distribution between groups in the school (e.g.,
CSR coach vs. other leaders). This analysis would require a more complicated
measure for “equality”— a “decomposed” equality, in which the measure is
partitioned into between-group and within-group “equality” in a school (for details,
see e.g., Hao & Naiman, 2010). Future research in which these analyses are conducted
should be based on data with larger samples, which would potentially be
decomposable to calculate both within- and between-group “equality.”
Moreover, future research should seek to develop a more compelling theory of
distributed leadership which can better identify the “contingencies” that contribute to
the effectiveness of distributed leadership. This study attended to both the goals and
organizational dimensions of school changes and identified four school contingencies
that were expected to strengthen the positive effects of distributed leadership.
However, the evidence showed inconsistent results between the two outcomes and
across the four school contingencies. This was largely due to the challenge of
contingency theory which provided a guiding perspective, yet not a tight theory about
the effects of distributed leadership. This led to the problem of identifying the
appropriate “contingencies” that contribute to the effectiveness of distributed
leadership. The research reported here is unable to address this issue, but it lies at the

203
heart of any sound research agenda on school leadership and warrants attention in
future studies.
Last, constrained by the data, this study was conducted within restricted
boundaries and dimensions of distributed leadership. My investigation was embedded
exclusively in instructional leadership and focused solely on formally-appointed
leader roles. Future research should seek to extend the boundary and dimensions of
leadership in order to develop a more compelling theory of distributed leadership. For
example, informal leaders, such as teaching professionals who have specialized
expertise, should be included in analyses of distributed leadership. Also, future
research can compare distributed leadership in terms of instructional leadership with
other dimensions of leadership functions, such as those relating to management and
boundary spanning.
Conclusions
By providing an improved conceptualization and measurement for distributed
leadership, I developed a context-based theory on the effects of distributed leadership
and tested the theory empirically using a series of longitudinal, multi-level models.
Overall, the results of my analyses supported my central hypothesis that the direct
influences of distributed leadership on school outcomes were not statistically
significant. Rather, such effects were conditional on certain school contingencies.
Whereas I did find conditional effects of distributed leadership on the two contrasting
approaches to improving instruction, the results were not always consistent with my
theory. Future research should seek to develop an improved measure for “equality” of

204
distributed leadership, or to develop a more robust theory that can better identify the
appropriate “contingencies” that contribute to distributed leadership.
These issues notwithstanding, I view the conceptual framework and empirical
findings as contributing to research and practice on how to organize schools to
promote instructional changes. For researchers, this study not only opens up
opportunities for new methodological tools for distributed leadership, but also draws
attention to school contingencies that shape the potential benefits of distributed
leadership. For practitioners, the evidence suggests the wisdom of pursuing a “match”
between distributed leadership, school context, and the target of change in order to
capitalize on the potential of distributed leadership to benefit school improvement.

205
APPENDICES

206
APPENDIX A
Study of Instructional Improvement Protocol for School Leader Questionnaire: List of Positions
The School Leader Questionnaire will be distributed to professional staff who are: (a) not logging teachers (either during the fall or spring terms); (b) paid by the school or the school reform program; and (c) provide specific, identified leadership roles. Use the SAQ checklist below to identify who should complete this questionnaire. Please include all persons who meet ALL three criteria listed below. This includes parents and part-time employees, as long as they are paid by the school. Note that they may not actually get paid for providing the leadership function, and that individuals who may only be serving non-elementary (i.e. 6th grade and above) classes are included.
Not a logging teacher during the 2001-2002 school year Paid staff (no volunteers) Fulfills AT LEAST ONE (1) of the roles specified below:
Principal Assistant Principal Accelerated School Coach (ASP Only) America’s Choice Design Coach (AC Only) America’s Choice Literacy Coordinator (AC Only) America’s Choice Community Outreach Coordinator (AC Only) Success for All Reading Facilitator (SFA Only) Success for All Mathematics Facilitator (SFA Only) Success for All Family Support Coordinator (SFA Only) School Improvement Program Coordinator (also includes
reform programs other than ASP, AC or SFA) Special Program Coordinator (e.g., Title1) Reading/literacy program coordinator Math program coordinator Other subject area program coordinator Master/mentor teacher Teacher consultant

207
APPENDIX B
Comparison of Leader Sample between Leader Protocol and School Leader Questionnaire
As shown in Table B.1, a total of 974 school leaders had been identified in the
leader protocol as formally-designated leaders during four years of research. However, only 841 out of 974 leaders had responded in the School Leader Questionnaire (SLQ), yielding a response rate of more than 86%. Table B.1 shows the leader samples over four years of surveys. The survey response rate among school leaders was 74% at the first year of questionnaire administration and improved to 90% by the final year of the study. Specifically, the response rate for the SLQ in year one was 326 leader respondents out of 441 identified leaders, or 74%; in year two it was 407 leader respondents out of 725 identified leaders, or 77%,; in year three it was 380 leader respondents out of 447 identified leaders, or 85%; and in year four it was 391 leader respondents out of 440 identified leaders, or 90%.
Of the total of 841 leaders surveyed, 231 of them either did not report a valid leader role on the SLQ or reported a role that did not fit into the defined four formally- assigned instructional leader roles. After deleting these 231 leaders, the final response rates for the SLQ in four years of surveys changed. Specifically, the final response rate in year one was 204 leader respondent out of the 277 identified leaders, or 74%; in year two it was 310 leader respondents out of the 381 identified leaders, or 81%; in year three it was 316 leader respondents out of the 364 identified leaders, or 87%; and in year four it was 337 leader respondents out of the 378 identified leaders, or 90%.
As a result, there were 610 leaders who fit into my defined four formally-designated leader roles. Thus, the final response rate for the instructional leaders that fit into the four formally assigned leader positions was 610 respondent leaders (in the SLQ) out of the 690 identified leaders (in the leader protocol), or 88%. Specifically, the final leader team included 164 principals, 122 assistant principals, 196 CSR coaches and 208 other instructional leaders (in comparison to 144 principals, 107 assistant principals, 181 CSR coaches and 178 other instructional leaders who responded in the SLQ) (see Table B.1). On average, there were 6.3 instructional leaders per school, with a range of two to 18.
It is important to note that of the total of 690 leaders who should have responded in the SLQ, some failed to do so. There were 80 leaders who had an established presence in the school but had not responded in any of four years’ SLQs. The 80 missing cases included 20 principals out of the 164 identified, 15 assistant principals out of the 122 identified, 15 CSR coaches out of the 196 identified, and 30 other instructional leaders out of the 208 identified.

208
Table B.1 Comparison of Leader Sample between Leader Protocol and School Leader Questionnaire in Four Years
Total Year1 Year2 Year3 Year4
Leader Protocol Total 974 441 527 447 440 Not fitting into the 4 leader roles 284 164 146 83 62 Fitting into the 4 leader roles 690 277 381 364 378
Principal 164 84 114 106 107 Assistant principal 122 43 68 71 69 CSR coach 196 82 118 96 92 Other leaders 208 68 81 91 110
School Leader Questionnaire
Total 841(133) 326 (115) 407(120) 380(67) 391(49) Not fitting into the 4 leader roles 231(53) 122(44) 97(49) 64(19) 54(8) Fitting into the 4 leader roles 610(80) 204(73) 310(71) 316(48) 337(41)
Principal 144(20) 52(32) 100(14) 96(10) 93(14) Assistant principal 107(15) 29(14) 49(19) 57(14) 59(10) CSR coach 181(15) 70(12) 103(15) 89(7) 85(7) Other leader 178(30) 53(15) 58(23) 74(17) 100(10)
Note. Values in parentheses indicate the number differences from the leaders in the protocol.

209
APPENDIX C
Variables for Measure of Instructional Leadership Functions
Items for Instructional Leadership Functions
Instructional Leadership Functions Mean Rating Scale Setting Instructional Goals mean rating scale. Developing Instructional Capacity mean rating scale. Coordinating Curriculum mean rating scale. Monitoring Improvement mean rating scale.
Setting Instructional Goals In your work during the current school year, how much priority did you give to each of the following issues? Setting explicit timelines for instructional improvement.
Examining the school's overall progress towards its school improvement goals. Clarifying expectations or standards for students' academic performance. Using the school's standardized, norm- or curriculum-referenced test results to plan instructional changes. Framing and communicating broad goals for instructional improvement. Working on plans to improve the teaching of specific curricular units or objectives.
Developing Instructional Capacity When working directly with teachers this year how often did you do any of the following? Share information or advice about classroom practices with a teacher.
Examine and discuss what students were working on during a teacher's lesson. Demonstrate instructional practices and/or the use of curricular materials in a classroom. Examine and discuss the standardized non-referenced or curriculum-referenced test results of students in a teacher's class.
In your work during the current school year, how much priority did you give to each of the following issues?
Examining and discussing exemplars of students' academic work. Personally providing staff development.
Coordinating Curriculum In your work during the current school year, how much priority did you give to each of the following issues? Promoting instructional coordination across grade levels in the school. Promoting instructional coordination across regular and compensatory/special
education programs in the school. Promoting alignment between the assessments used to evaluate the school's instructional program and what is taught in classrooms. Promoting integration of the school's curriculum (e.g., mathematics and science, or reading/ language arts and social studies).

210
Items for Instructional Leadership Functions
Monitoring Improvement When working directly with teachers this year how often did you do any of the following? Observe a teacher who was trying new instructional practices or using new
curricular materials. How often do you engage in the following activities as part of your regular duties?
I monitor classroom instructional practices to see that they reflect the school's improvement efforts. As part of improvement efforts in this school, I observe in classrooms in order to examine what students are learning. I monitor the curriculum used in classrooms to see that it reflects improvement efforts. I evaluate teachers using criteria directly related to the school's improvement efforts.

211
APPENDIX D
Comparison between the Unadjusted and Adjusted GDIL in SII Data
I applied the unadjusted and bias-adjusted GDIL in SII data to examine
empirically how they were affected by sample size, how important to correct small-sample bias, and how different results of analyses were yielded by the unadjusted and adjusted GDIL.
Table D.1 shows the school sample for four years of surveys by leader sample size in SII data. Table D.2 presents a comparison of descriptive statistics between the unadjusted and adjusted GDIL. Table D.3 illustrates how both the unadjusted and adjusted GDIL were predicted by leader sample sizes and other school characteristics. Table D.4 presents a comparison of the results of the analytic models tested in this study between the unadjusted and adjusted GDIL.
Table D.1 shows the number of schools in four years of study by leader sample size. The leader sample in the data ranged from two to 18, with an average of 6.3. Across four years of surveys, the majority of the schools had an instructional leader team of 2 to 5. With such small sample sizes, the bias of the GDIL was expected to be very substantial and vary significantly across schools with different sample sizes.
Table D.1 Number of Schools by Leader Sample Size in Four Years
Year1 Year2 Year3 Year4 (N=56) (N=97) (N=95) (N=96) n=2 12 24 32 25 n=3 14 30 20 31 n=4 10 22 21 14 n=5 11 8 9 13 n=6 4 9 6 6 n=7 4 1 4 2 n=8 0 0 1 2 n=9 0 2 1 1 n=10 0 1 0 1 n=13 1 0 0 0 n=17 0 0 0 1 n=18 0 0 1 0
Table D.2 presents a comparison of descriptive statistics between the unadjusted and bias-adjusted GDIL. When adjusting for missing leader roles that were anticipated to affect the school-level GDIL, the bias-correction strategy decreased the mean from -0.07 (unadjusted) to -0.11 (adjusted). The bias-adjusted GDIL had smaller average “equality” than the unadjusted, raw GDIL. As the decrease in the unadjusted GDIL results in an increase in “equality”, the adjusted GDIL ameliorates the upward-bias of small sample size. The adjusted GDIL, on general, increases the upper bound so that it is less constrained by sample sizes.

212
Table D.2 Comparison of Descriptive Statistics between the Unadjusted and Adjusted GDIL
Mean SD Min Max Unadjusted
GDIL Adjusted for missing leader roles across 4 years (n=109)
-0.073 0.021 -.154 -.0042
Year1(n=56) -0.087 0.058 -0.235 -0.006 Year2(n=97) -0.070 0.052 -0.245 -0.004 Year3(n=95) -0.073 0.049 -0.206 -0.001 Year4(n=96) -0.072 0.049 -0.234 -0.001
Adjusted GDIL
Adjusted for missing leader roles across 4 years (n=109)
-0.112 0.029 -0.200 -0.067
Year1(n=56) -0.131 0.089 -0.471 -0.011 Year2(n=97) -0.112 0.086 -0.490 -0.007 Year3(n=95) -0.110 0.073 -0.319 -0.001 Year4(n=96) -0.105 0.068 -0.351 -0.002
In Table D.3, I present the results of analyses of how the “equality” of DIL was explained by a list of exogenous factors and the leader samples. In effect, I investigated whether, controlling for a list of school characteristics, the “equality” of DIL was independent of the number of school leaders. I utilized two-level Hierarchical Linear Models (HLM) in which each school’s GDIL scores for a given survey year (level 1) was nested within schools (level 2). The models decomposed the variance in school-level GDIL into a repeated-observations component (level 1) and school-level component (level 2) (for details, on hierarchical linear models (HLM), see Chapter 5).
The results in Table D.3 illustrate the importance of adjusting for the small-sample bias of the GDIL. The two-level HLM analyses used the unadjusted and bias-adjusted GDIL as dependent variables, respectively, but were otherwise identical. The estimates suggest that the sample size is significantly negatively associated with both the unadjusted and adjusted GDIL. Specifically, while holding other school-level variables constant, one SD increase in the number of leaders was on average associated with a 0.28 SD decrease in “equality”. However, this result is spurious. The association was largely due to the small-sample bias of the GDIL statistic. When the adjusted GDIL was used as a measure of the number of leaders, the coefficient of the leader sample size, though still statistically significant, had a magnitude more than twice smaller than that for the raw GDIL. Specifically, one SD increase in the number of leaders was on average associated with a 0.12 SD decrease in “equality”.
It is also noted that the numbers of CSR coaches and other instructional leaders who should have responded but failed to were significantly positively associated with the value of GDIL. Specifically, one SD increase in the number of missing CSR coaches resulted in a 0.55 SD increases in the value of the raw GDIL, and one SD increase in the number of missing other leaders resulted in a 0.33 SD increase in the value of the raw GDIL. However, when I adjusted for the small-sample bias, the

213
number of missing CSR coaches and other instructional leaders no longer showed any statistically significant effect on the value of the adjusted GDIL. Overall, the small-sample bias effect was so strong that it accounted for a large percentage of the level-1 variation of the model. The percentage of variation explained by level-1 predictors dropped from 0.11 to 0.01 by correcting the small-sample bias.
Table D.3 Two-Level HLM Estimate of the Unadjusted and Adjusted GDIL as a Function of Number of Leaders and Other School-Level Variables in Four Years
(N=109)
Unadjusted GDIL Adjusted GDIL Coef. SE Coef. SE Intercept 0.396*** 0.095 0.334** 0.100 Within School Predictors a Year 0.076 0.051 0.101+ 0.055 Number of leaders -0.276*** 0.044 -0.120** 0.036 Miss principal 0.220 0.216 0.046 0.267 Miss assistant principal 0.229 0.221 0.038 0.222 Miss CSR coach 0.546** 0.197 0.322 0.199
Miss other leader 0.330* 0.178 0.137 0.175 School size 0.103 0.067 0.093 0.072 Disadvantage index 0.023 0.059 0.024 0.069 % of FTE assistant principal 0.115 0.190 0.176 0.198 % of FTE CSR coach 0.127 0.175 0.164 0.183 % of FTE other leader 0.164 0.261 0.243 0.279 Between-School Predictors ASP (vs. AC) -0.545** 0.160 -0.515** 0.175
SFA (vs. AC) -0.422* 0.199 -0.428* 0.197 Comp (vs. AC) -0.495** 0.143 -0.512** 0.165 Summary Statistics: Fully unconditional model Reliability 0.563 0.505 Variance components Level 1 (within schools) 0.677 0.731 Level 2 (between schools) 0.323 0.269 Prediction model Reliability 0.501 0.444 Residual variance components Level 1 (within schools) 0.601 0.729 Level 2 (between schools) 0.215 0.211
Proportion of variance explained Level 1 (within schools) 0.114 0.005 Level 2 (between schools) 0.115 0.132
Note. Both continuous and interval variables were standardized so that the mean=0 and SD=1; dichotomous variables remained coded as 1 and 0. +p<0.1, *p<0.05, **p<0.01, ***p<0.001.

214
In Chapter 6, I described the findings for my research questions and hypotheses
on the bias-adjusted GDIL. However, I also tested the similar statistical models with the raw, unadjusted GDIL as the primary variable of interest. Table D.4 presents a comparison on results of the analytic models tested in this study between unadjusted and adjusted GDIL. In general, the results of the moderated models showed that the interaction effects of the four school contingencies and the unadjusted GDIL were in the same direction but with less strength in comparison with those of the bias-adjusted GDIL. For both outcomes, the interaction terms for the unadjusted GDIL and contingent variables generally had smaller coefficients, but larger standard errors than those of the bias-adjusted GDIL. Thus, the conditional effects of “equality” on the two school outcomes were more statistically significant when the “equality” was measured by the adjusted GDIL than being measured as the raw, unadjusted GDIL.
Table D.4 Comparison of Model Results between Unadjusted and Adjusted GDIL
Being classified correctly Professional community
Adjusted GDIL
Unadjusted GDIL
Adjusted GDIL
Unadjusted GDIL
Coef. SE Coef. SE Coef. SE Coef. SE GDIL 0.004 0.097 0.106 0.085 -0.084 0.052 -0.001 0.034 GDIL×AIL 0.204 ** 0.065 0.158* 0.073 0.066* 0.030 -0.010 0.032 GDIL×routine task (vs. scripted)
0.970*** 0.250 0.721** 0.261 -0.030 0.093 -0.042 0.096
GDIL×discretional task (vs. scripted)
0.489** 0.169 0.218 0.177 0.009 0.093 -0.069 0.085
GDIL×normative task (vs. scripted)
0.289 0.254 -0.024 0.268 -0.079 0.073 -0.063 0.072
GDIL×leader-leader interaction
0.228*** 0.048 0.190** 0.053 -0.010 0.025 -0.011 0.021
GDIL×leader-teacher interaction
-0.012 0.073 -0.004 0.099 0.085** 0.026 0.080* 0.035
Note. Both continuous and interval variables were standardized so that the mean=0 and SD=1; dichotomous variables remained coded as 1 and 0. +p<0.1, *p<0.05, **p<0.01, ***p<0.001.

215
APPENDIX E
Instructional Variables for Measure of “Fidelity” to Instructional Regime in Language Arts Teacher Logs
Measure Components Log Item Frequency of Topic Coverage (All Log Days)
Time spent on reading/language arts Average number of minutes spent on language arts across all lessons 1 Days focused on comprehension lessons where comprehension was a focus 4a Days focused on writing lessons where writing was a focus 4b Days focused on vocabulary lessons where vocabulary was a focus 4f Days focused on grammar lessons where grammar was a focus 4g Days focused on reading fluency lessons where reading fluency was a focus 4e Days focused on sight words lessons where word recognition and sight words were focus C1K
How Reading Comprehension was Taught (Reading Lessons Only)
Reading lessons that focused also on writing Percentage of reading comprehension lessons where writing was also a focus
4b
Reading lessons with brief answers Answered brief oral questions A3a Answered multiple choice questions A3e Completed sentences filling in blanks A3f Wrote brief answers to questions A3h
Reading lessons when students discussed text Discussed test with peers A3b Did a think-aloud or explained how they applied a skill or a strategy A3c Generated questions about text A3d
Reading lessons with teacher-directed instruction
Teacher demonstrated or explained a skill A4a Teacher demonstrated or explained how to use a reading strategy A4b Teacher explained why or when to use a reading strategy A4c
Reading lessons that integrated writing Examined literary techniques or author's style A1s Wrote literature extension project A1t
Examined literary techniques or author's style in writing B1c Teacher explained how to write, organize ideas, revise or edit using a
published author's writing B3c

216
Table Continued
Measure Components Log Item Density of reading comprehension instruction Count of activate knowledge, literal comprehension, story structure,
analyze/synthesize, brief answers, students discuss text, extended answers, teacher-directed instruction, integrate writing
Summary of comprehension text difficulty 0=if no text indicated; 1=if used controlled vocabulary or patterned language; 2=if used literature-based short selection; 3=if used chapter book or other or if used informational text and other; 4=if used chapter book only or used informational text only
A2a A2b A2c A2d A2e
How Writing was Taught (Writing Lessons Only)
Writing lessons that focused also on reading comprehension
Percentage of writing lessons where writing was also a focus 4a
Writing lessons with Literary techniques/genre study
Literary techniques or author’s style B1c
Writing forms or genres (e.g., letter, drama, editorial, haiku) B1d Writing lessons that revised writing Revision of writing—elaboration B1f
Revision of writing—refining or reorganizing B1g Writing lessons that shared writing Shared writing with others B1j
Writing lessons that integrated reading comprehension
Examined literary techniques or author's style A1s Wrote literature extension project A1t
Wrote extensive answers to questions A3i Worked on a literature extension project A3j
Density of writing instruction Count of prewriting, writing practice, revise, edit, share, genre/literary techniques, teacher-led writing; teacher comments on writing
Summary of writing text difficulty 0=no text, 1=if letter strings or words only, 2=if letter strings or words and sentences, 3=if sentences only, 4= if paragraph and sentences, 5=if paragraph only or sentences and connected paragraphs, 6=if paragraph and connected paragraphs, 7=if connected paragraphs only
B2a B2b B2c B2d

217
APPENDIX F
Results for Discriminant Functional Analyses
Based on the approach of Rowan and Miller (2007, 2009), I performed
discriminant functional analyses to identify if the teaching practice of a teacher conformed to the teaching practices of his/her actual group (ASP, AC or SFA). The discriminnant analyses calculated the probability that a teacher was classified into each of the four groups, given his/her discriminant scores, the conditional probability of being in a group given those scores, and a Bayesian prior (assuming that teachers were distributed evenly across the four groups). The analyses examined what made literacy instruction in one group distinctive from any other groups and which identified instructional regime any given teacher was most likely to be implemented, given his/her profile of teaching activities.
The results for discriminant analyses of “fidelity” to instructional regimes are presented in Tables F.1 to F.3. As indicated in Tables F.2 and F.3, Teachers in SFA schools had the highest mean scores on the first discriminant function, where reading items were heavily loaded, reflecting the emphasis of the SFA program on reading instruction. By contrast, teachers in AC schools had the highest mean scores on the second discriminant function in the analyses, where writing items were heavily loaded, reflecting the emphasis of the AC program on writing instruction. Comparison group teachers had the highest mean on the third discriminant function, which suggests an apparent distinctiveness of this group in the area of support teaching (i.e., an emphasis on teaching grammar, spelling, and vocabulary). However, ASP teachers were notable for having the lowest means on all three functions.
Also, the analyses gave a new classification of each teacher as a “predicted” member of the group for which his/her discriminant functions yielded the highest probability. Then, based on the new classification by discriminant analyses, I developed the teacher-level measure of implementation “fidelity.” The “fidelity” was dichotomously scored as whether or not a teacher was correctly classified (1=yes; 0=no). The variable evaluated the extent to which teachers conformed to the program-endorsed practices.
Table F.1 Eigenvalues for Discriminant Functional Analysis
Function Eigenvalue % of Variance
Cumulative %
Canonical Correlation
1 .813 81.4 81.4 .670 2 .157 15.7 97.0 .368 3 .030 3.0 100.0 .170

218
Table F.2 Standardized Canonical Discriminant Function Coefficients Relating 21 Instructional Variables to Group Membership
Measure Function
1 2 3
Frequency of Topic Coverage (All Log Days)
Time spent on reading/language arts -0.071 0.145 0.058 Days focused on comprehension 0.349 0.167 0.332 Days focused on writing 0.030 -0.018 -0.150 Days focused on vocabulary 0.299 -0.215 0.271 Days focused on grammar -0.352 -0.223 0.342 Days focused on reading fluency -0.117 -0.154 0.052 Days focused on sight words 0.110 -0.080 -0.128
How Reading Comprehension was Taught (Reading Lessons Only)
Reading lessons that focused also on writing -0.340 0.347 -0.183
Reading lessons with brief answers 0.311 0.147 0.281 Reading lessons when students discussed text 0.585 0.041 -0.598
Reading lessons with teacher-directed instruction 0.029 0.454 0.469
Reading lessons that integrated writing -0.259 0.478 0.016 Density of reading comprehension instruction -0.015 -0.342 0.064
Summary of comprehension text difficulty -0.091 -0.319 -0.164
How Writing was Taught (Writing Lessons Only)
Writing lessons that focused also on reading comprehension 0.096 0.140 0.106
Writing lessons with Literary techniques/genre study -0.271 0.045 0.207
Writing lessons that revised writing -0.016 -0.286 0.001 Writing lessons that shared writing 0.022 0.389 -0.183 Writing lessons that integrated reading comprehension 0.269 -0.101 -0.179
Density of writing instruction -0.030 0.109 -0.040 Summary of writing text difficulty -0.163 0.108 0.193
Table F.3 Functions at Group Gentroids
School Type Function a
1 2 3 AC -0.980 0.653 -0.024 SFA 1.068 0.067 -0.011 ASP -0.674 -0.484 -0.255 Comparison -0.563 -0.344 0.296
a Unstandardized canonical discriminant functions evaluated at group means

219
APPENDIX G
Professional Community Factor Scales
Measure/Item (Cronbach’s Apha in parentheses were averaged across four years of survey)
Factor Loadings
Year 1 Year 2 Year 3 Year 4 Professional Community Factor Scale (α = .83) Trust and Respect among Faculty factor scale 0.77 0.76 0.80 0.80 Reflective Dialogue factor scale 0.77 0.78 0.80 0.80 Innovative Climate factor scale 0.73 0.74 0.75 0.74 Academic Emphasis factor scale 0.73 0.74 0.73 0.74 Collective Responsibility factor scale 0.79 0.79 0.77 0.77 Teacher Collaboration on Instruction factor scale 0.71 0.71 0.73 0.74 Trust and Respect among Faculty (α = .86) Please indicate the extent to which you agree or disagree with the following statements about the school in which you work?
Teachers respect colleagues who are expert in their craft. Teachers in this school trust each other. Teachers in this school really care about each other. Teachers respect other teachers who take lead school improvement.
Reflective Dialogue(α = .78) Please indicate the extent to which you agree or disagree with the following statements about the school in which you work?
Many teachers openly express professional views at meetings. Teachers are willing to question one another’s views. We do a good job of talking through views, opinions, and values.
Innovative Climate(α = .80) Please indicate the extent to which you agree or disagree with the following statements about the school in which you work?
Teachers expected to continually learn and seek out new ideas. Teachers are encouraged to experiment in their classrooms. Teachers are encouraged to take risks to improve their teaching.
Academic Emphasis(α = .84) Please indicate the extent to which you agree or disagree with the following statements about the school in which you work?
Teachers in this school expect students to complete every assignment. Teachers set high expectations for academic work. Teachers think it is important that all students do well in their classes. Teachers in this school encourage students to keep trying even when the work is challenging.

220
Measure/Item (Cronbach’s Apha in parentheses were averaged across four years of survey)
Collective Responsibility (α = .86) How many teachers in this school:
take responsibility for helping one another do well. take responsibility for improving the overall quality of teaching in the school. help maintain positive student behavior in the entire school.
Teacher Collaboration on Instruction(α = .88) How often did you work with faculty on:
clarifying standards for student learning. developing thematic units. integrating instruction across curricular areas. examining/changing the scope/sequence of specific curricular topics. learning how to set up and use particular instructional grouping strategies. examining the alignment of curricular materials and student assessments at this school.

221
APPENDIX H
Leader-Leader and Leader-Teacher Interaction Factor Scales
Measure/Item (Cronbach’s Apha in parentheses were averaged across four years of survey) Leader-Leader Interaction (a = .90) Please indicate the extent to which you agree or disagree with the following statements about the leader team in your school:
Members of team work together closely to lead this school. The team usually tries to consensus when making decisions. We do a good job of talking through views, opinions, and values. Members of the leadership team openly express their professional views during meetings.
How often do you interact with other members of the leadership team in the following settings? Formally scheduled meetings. Informal meetings (for example, stopping by each other’s classroom or catching each other in the hallway between classes).
Leader-Teacher Interaction (a = .89) This school year, how often did the following things occur?
I watched an instructional leader (e.g., coach, coordinator, or facilitator) model instruction. An instructional leader observed me teach and gave me feedback about improving my teaching techniques. An instructional leader (e.g., coach, coordinator, or facilitator) observed me teach and gave me feedback about my use of curriculum materials. An instructional leader studied my students’ work and commented on ways I could improve their learning of subject matter.

222
APPENDIX I
School-Level Covariates
Variable Name (Cronbach’s Alpha in parentheses were averaged across four years of survey)
Descriptive
Discretional task Dichotomous, 1=ASP school; 0=other three types of school
Routine task Dichotomous, 1=AC school; 0=other three types of school Scripted task Dichotomous, 1=SFA school; 0=other three types of
school Normative task Dichotomous, 1=comparison school; 0=other three types
of school School size The number of students enrolled at the school. Community Disadvantage Index (CDI)
Describes the 1990 census tract in which the school was located in terms of proportion of individuals with less than a high school education, the proportion of working-age adults who are unemployed, the median household income, and the proportions of households with income below the poverty line, receiving public assistance income, and containing children that are headed by a single parent. A three category version of this variable was used to set the school sampling targets. The CDI was created for all public elementary schools in the U.S. The three categories were defined by the points in the index that marked 25th, 50th, and 75th percentiles on the national distribution of the disadvantage index. Thus schools in the first group feel between the 25th and 50th percentile on the national distribution, schools in the second group fell between the 50th and 75th percentiles, and schools in the third group fell between the 75th and 100th percentiles.
Percentage of minority students
The percentage of students in the schools who were African-American, Hispanic, Asian/Pacific Islander, American Indian, or other non-white race/ethnicity. The measure is constructed by data from the study’s School Characteristics Index
Percentage of students eligible for free and reduced lunch
The percentage of students eligible for free or reduced price lunch at each school. The measure is constructed by data from the study’s School Characteristics Index.
Disadvantage index (α = .79)
The factor composite of schools’ minority percentage, free and reduced lunch percentage and community disadvantage index (CDI).

223
Table continued
Variable Name Descriptive Percentage of FTE principals
The ratio of the number of principal to the total number of leadership staff measured in terms of full-time equivalent (FTE) staff positions, such that a principal who works five day per week in the school would be coded as 1 FTE; and a coordinator who works one day per week would be coded as 0.2 FTE. Principals or their designees who prompted to report the number of principals, assistant principals, program or subject area coordinators/facilitators, teacher consultants/mentor teachers, the categories of which were summed to represent the school’s total number of FTE leaders.
Percentage of FTE assistant principals
The ratio of the number of assistant principal to the total number of leadership staff measured in terms of full-time equivalent (FTE) staff positions.
Percentage of FTE CSR coach
The ratio of the number ASP coach/internal facilitator, or AC coach and literacy coordinator, or SFA reading or math facilitator to the total number of leadership staff measured in terms of full-time equivalent (FTE) staff positions.
Percentage of FTE other instructional leaders
The ratio of the number of subject area coordinator, special program coordinator, or master/mentor teacher to the total number of leadership staff measured in terms of full-time equivalent (FTE) staff positions.

224
APPENDIX J
Teacher-Level Covariates
Variable Name Descriptive
Grade Categorical, 1=grade 1; 2=grade 2; 3=grade 3; 4=grade 4; 5=grade 5
Male Dichotomous, 1=male; 0=female White Dichotomous, 1=white; 0=non-white Hispanic Dichotomous, 1=Hispanic; 0=non-Hispanic Black Dichotomous, 1=black; 0=non-black Asian Dichotomous, 1=Asian; 0=non-Asian Others Dichotomous, 1=others; 0=the other races Master’s degree Dichotomous, 1=have a master’s or higher degree; 0=do
not have a master’s degree Permanently certified Dichotomous, 1=have a permanent teaching
certification; 0=do not have a permanent teaching certification
Teaching experience Continuous, the number of years the teacher has worked as a teacher.
Specialist Dichotomous, 1=subject specialist teacher; 0=regular classroom teacher
English language arts (ELA) specialist
Dichotomous, 1=ELA specialist; 2=non-ELA specialist
Special education teacher Dichotomous, 1=special education teacher; 2=regular classroom teacher
Teach out-of-scope/grade teacher
Dichotomous, 1=do not teach reading/language arts or mathematics/teach grades other than K-6; 0=teach reading/language arts or mathematics/teacher grade K-6
Teach multiple grades Dichotomous, 1= teach students at more than one grade level.; 0=teach single-grade student
Days for professional development in instruction
Continuous, a factor score of the amount of professional development sessions focused on student assessment, curriculum materials or framework, and content or performance standards, as well as teaching methods.
Post-secondary training in language arts and math
Continuous, a factor score of the number of college/university classes the teacher reported having taken in English or related language arts filed, methods of teaching literacy, mathematics, and methods of teaching mathematics.
Number of ELA courses taken
Continuous, the number of ELA courses that the teacher reported have taken

225
APPENDIX K
Correlation among School-Level Covariates
Table K.1 Bivariate Correlation Matrix for School-Level Variables Included in the HLM/HGLM Analysis (N=109)
Variables GDIL School
size Disadvantage index
% of FTE principal
% of FTE assistant principal
% of FTE CSR coach
% of FTE other leaders
AIL GDIL ×AIL
GDIL 1.000 School size 0.090 1.000 Disadvantage index 0.082 -0.028 1.000 % of FTE principal 0.064 -0.180 0.142 1.000 % of FTE assi-principal 0.074 0.002 0.248** 0.866*** 1.000 % of FTE CSR coach -0.071 0.049 0.043 -0.479*** -0.083 1.000 % of FTE other -0.032 0.067 -0.227* -0.702*** -0.924*** -0.272** 1.000 AIL 0.451*** 0.154 0.221* -0.200* -0.200* -0.049 0.236* 1.000 GDIL×AIL -0.362*** -0.044 0.024 0.155 0.158 -0.024 -0.149 -0.256** 1.000 Routine task 0.264*** 0.224* 0.155 0.009 0.038 0.022 -0.012 0.325*** -0.023 Scripted task -0.051 -0.155 0.075 0.054 0.026 0.006 -0.038 -0.134 0.225* Discretional task -0.144 -0.050 -0.234* 0.121 0.084 0.103 -0.049 -0.073 -0.136 Normative task -0.085 -0.028 -0.004 0.190* -0.154 -0.135 0.103 -0.132 -0.071 GDIL ×routine task 0.447*** -0.013 -0.039 0.021 0.002 -0.031 0.005 0.336*** 0.195* GDIL ×scripted task 0.424*** -0.033 0.082 -0.017 0.013 -0.001 0.003 0.408*** -0.495*** GDIL ×discretional task 0.512*** 0.143 -0.008 -0.035 -0.002 0.044 -0.006 0.148 -0.078 GDIL ×normative task 0.386*** 0.108 0.134 0.218* 0.174 -0.211* -0.085 0.211* -0.245* Leader-leader inter 0.293** 0.038 0.035 -0.232* -0.176 0.101 0.156 0.399*** -0.165 Leader-teacher inter 0.159 0.024 0.427* 0.158 0.149 -0.159 -0.070 0.262** 0.004 GDIL ×leader-leader inter -0.353*** -0.055 -0.073 0.158 0.094 -0.124 -0.061 -0.166 0.552*** GDIL ×leader-teacher inter 0.038 0.069 0.043 -0.151 -0.080 0.126 0.049 -0.008 0.431***

226
Table K.1 Continued
Variables Routine
task Scripted task
Discretional task
Normative task
GDIL× routine task
GDIL× scripted task
GDIL× discreti -onal task
GDIL× normative task
Leader- leader inter
Leader- teacher inter
GDIL
×leader- leader inter
Scripted task -0.361*** 1.000 Discretional task -0.352*** -0.329*** 1.000 Normative task -0.336*** -0.314*** -0.307*** 1.000 GDIL×routine task 0.457*** -0.169 -0.169 -0.145 1.000 GDIL×scripted task 0.022 -0.060 0.021 0.018 0.010 1.000 GDIL×discretional task 0.076 0.071 -0.204* 0.060 0.035 -0.004 1.000 GDIL×normative task 0.056 0.052 0.052 -0.176 0.026 -0.003 -0.011 1.000 Leader-leader interaction 0.089 -0.240** 0.144 0.001 0.121 0.357*** 0.058 -0.019 1.000 Leader-teacher interaction 0.253** 0.145 -0.136 -0.277** 0.202* 0.113 -0.165 0.240* 0.120 1.000 GDIL×leader-leader inter -0.059 0.263** -0.080 -0.130 0.023 -0.629*** 0.085 -0.055 -0.198* 0.012 1.000 GDIL×leader-teacher inter 0.078 0.065 -0.276** 0.142 0.219* -0.018 0.183 -0.359*** 0.014 0.144 0.058

227
APPENDIX L
Correlation among Teacher-Level Covariates
Table L.1 Bivariate Correlation Matrix for Teacher-Level Variables Included in the HLM/HGLM Analysis (N=109)
Variables Male White Non
-White Hispanic Black Asian Other
(race) Specialist ELA
specialist Special
education teacher
Teach the scope
subjects White -0.044*** 1.000 Non-White 0.045*** 0.999*** 1.000 Hispanic 0.006 -0.398*** 0.398*** 1.000 Black 0.021 -0.625*** 0.625*** -0.200*** 1.000 Asian 0.023 -0.259*** 0.259*** -0.083*** -0.116*** 1.000 Other (race) 0.034* -0.243*** 0.243*** -0.026 -0.072*** -0.034* 1.000 Specialist 0.148*** 0.036** -0.036** -0.026 -0.007 -0.021 0.007 1.000 ELA specialist -0.009 -0.027* 0.027* -0.013 0.039** -0.010 0.010 0.203*** 1.000 Special education teacher -0.023 0.018 -0.018 -0.020 0.018 -0.031* -0.017 0.282*** -0.055*** 1.000 Teach the scope subjects -0.112*** -0.033* 0.033* 0.026 0.013 -0.002 0.005 -0.745*** 0.146*** -0.386*** 1.000 Grade 0.141*** -0.049* 0.048* -0.028 0.081*** -0.008 0.012 0.126*** 0.088*** 0.060** -0.066** Teach multiple grades 0.042** 0.019 -0.019 0.013 -0.042** 0.028* 0.011 0.205*** -0.034* 0.154*** -0.218*** Postsecondary training in literacy & mathematics
-0.053*** -0.004 0.003 -0.012 -0.028* 0.057*** 0.024 -0.184*** 0.008 -0.030* 0.207***
ELA courses -0.073*** 0.029* -0.029* 0.004 -0.064*** 0.048*** 0.008 -0.110*** 0.036** -0.037** 0.122*** Days for Instr PD -0.033* -0.083*** 0.083*** -0.025 0.080*** 0.053*** 0.018 -0.126*** 0.032* -0.038** 0.137*** Have a master degree 0.022 0.013 -0.013 -0.002 -0.001 -0.003 -0.007 -0.006 0.013 0.004 0.020 Permanently certified -0.025 0.106*** -0.106*** -0.062*** -0.072*** 0.020 -0.027* -0.040** 0.009 -0.041** 0.052*** Teaching experience -0.040** -0.003 -0.003 -0.068*** 0.065*** 0.016 -0.021 0.047*** 0.015 0.001 -0.048*** Being classified correctly -0.008 0.029 -0.029 0.000 -0.059** 0.076*** -0.021 0.075*** 0.014 -0.010 -0.069** Professional community -0.039*** -0.022* 0.022* 0.012 0.003 0.046*** -0.020* -0.026** -0.006 -0.017 0.023*

228
Table L.1 Continued
Variables Grade Teach multiple grades
Postsecondary training in literacy & math
ELA courses
Days for instr PD
Have a master degree
Permanently certified
Teaching experience
Being classified correctly
Teach multiple grades 0.074*** 1.000 Postsecondary training in literacy & mathematics
-0.016 -0.024 1.000
ELA courses -0.044* -0.008 0.903*** 1.000 Days for Instr PD -0.019 -0.066*** 0.245*** 0.212*** 1.000 Have a master degree -0.007 0.007 0.229*** 0.243*** 0.097*** 1.000 Permanently certified -0.076*** -0.044** 0.174*** 0.183*** 0.093*** 0.208*** 1.000 Teaching experience -0.038 -0.001 0.212*** 0.209*** 0.131*** 0.194*** 0.323*** 1.000 Classified correctly -0.028 0.241*** -0.052* -0.043* -0.094*** -0.007 0.018 -0.005 1.000 Professional community -0.012 -0.005 0.052*** 0.034*** 0.201*** -0.003 0.032** 0.074*** -0.017

229
REFERENCES

230
REFERENCES
Aiken, P. & West. S. (1991). Multiple regression: Testing and interpreting interactions. Thousand Oaks, CA: Sage.
Alker, H. (1965). Mathematics and politics. New York, NY: Macmillan. Ammeter, A. P., Douglas, C., Gardner, W. L., Hochwarter, W. A., & Ferris, G. R.
(2002). Toward a political theory of leadership. The Leadership Quarterly, 13(6), 751-796.
Angelle, P. (2010). An organizational perspective of distributed leadership: A portrait of a middle school. Research in Middle Level Education Online, 33(5), 1-16.
Atkinson, A. B. (1970). On the measurement of inequality. Journal of Economic Theory, 2, 244-263
Balkundi, P., & Kilduff, M. (2006). The ties that lead: A social network approach to leadership. The Leadership Quarterly, 17(4), 419-439.
Bandura, A. (1986). Social foundations of thought and action: A social cognitive theory. Englewood Cliffs, HJ: Prentice-Hall.
Barnes, C., Camburn, E., Kim, J., & Rowan, B. (2004). School leadership and instructional improvement in CSR schools. Paper presented at the Annual Meeting of American Educational Research Association (AERA), San Diego, CA.
Barnett, K., & McCormick, J. (2003). Vision, relationships and teacher motivation: A case study. Journal of Educational Administration, 41(1), 55-73.
Barry, D. (1991). Managing the bossless team: Lessons in distributed leadership. Organizational Dynamics, 20(1), 31-47.
Bass, B. M. (1985). Leadership and performance beyond expectations. New York, NY: Free Press.
Becker. M. (2004). Organizational routines: A review of the literature. Industrial and Corporate Change, 13(4), 643-677.
Bedell-Avers, K., Hunter, S. T., Angie, A. D., Eubanks, D. L., & Mumford, M. D. (2009). Charismatic, ideological, and pragmatic leaders: An examination of leader–leader interactions. The Leadership Quarterly, 20(3), 299-315.
Berman, P. (1978). Designing implementation to match policy situation: A contingency analysis of programmed and adaptive implementation. Santa Monica, CA: RAND.
Bidwell, C. (1965). The school as a formal organization. In J. G. March (Ed.), Handbook of organizations (pp.972-1022). Chicago, Illinois: Rand McNally.

231
Biemann, T., & Kearney, E. (2010). Size does matter: How varying group sizes in a
sample affect the most common measures of group diversity. Organizational Research Methods, 13(3), 582-599.
Blake, R. R. & Mouton, J. S. (1982). Catching up with multiple solution realities. Journal of Applied Behavior Science, 18, 473-476
Blase, J. & Blase, J. (1999a). Principals’ instructional leadership and teacher development: Teachers’ perspectives. Educational administration quarterly, 35(3), 349-378.
Blase, J. & Blase, J. (1999b). Implementation of shared governance for instructional improvement: Principals’ perspectives. Journal of Educational Administration, 37(5), 476-500.
Blase, J., & Blase, J. (2000). Effective instructional leadership: Teachers’ perspectives on how principals promote teaching and learning in schools. Journal of Educational Administration, 38(2), 130-141.
Blau, P. M. (1977). Inequality and heterogeneity: A primitive theory of social structure (Vol. 7). New York, NY: Free Press.
Bleichrodt, H., & Doorslaer, E.V. (2006). A welfare economics foundation for health inequality measurement. Journal of Health Economics, 25(5), 945-957.
Bolden, R. (2011). Distributed leadership in organizations: a review of theory and research. International Journal of Management Reviews, 13(3), 251-269.
Borman, G. D., Hewes, G. M., Overman, L. T., & Brown, S. (2003). Comprehensive school reform and achievement: A meta-analysis. Review of Educational Research, 73(2), 125-230.
Bossert, S.T., Dwyer, D. C., Rowan, B. & Lee, G. (1982). The instructional management role of the principal. Educational Administration Quarterly, 18(3), 34-36.
Boyer, E. L. (1995). The basic school: A community for learning. Princeton, NJ: Carnegie Foundation for the Advancement of Teaching.
Braver, M. W., & Helmstadter, G. C. (1989). Executive summary: Impact of career ladder on student achievement. Report presented to the Joint Legislative Committee on Career Ladders, Phoenix, AZ.
Briscoe, C., & Peters, J. (1997). Teacher collaboration across and within schools: Supporting individual change in elementary science teaching. Science Education, 81(1), 51-65.
Brownell, M. T., Yeager, E., Rennells, M. S., & Riley, T. (1997). Teachers working together: What teacher educators and researchers should know. Teacher Education and Special Education, 20, 340-359.
Browning, R. X., & King, G. (1987). Seats, Votes, and Gerrymandering: Estimating Representation and Bias in State Legislative Redistricting. Law and Policy, 9(3), 305-322.
Bryk, A. S., Easton, J. Q., Kerbow, D., Rollow, S. G. & Sebring, P. A. (1994). The state of Chicago school reform. Phi Delta Kappan, 76(1), 74-78.
Bryk, A. S. (1999). Trust in schools. New York, NY: Sussel Sage Foundation. Burns, I., & Stalker, G. M. (1961). The management of innovation. London:
Tavistock. Bush, T., & Glover, D. (2003). School leadership: Concepts and evidence.

232
Nottingham: NCSL. Camburn, E., & Barnes, C. (2004). Assessing the validity of a language arts
instruction log through triangulation. Elementary School Journal, 105, 49-74. Camburn, E. & Han, W. (2009). Investigating connections between distributed
leadership and instructional change. In Harris (2009), Distributed leadership: Difference perspectives (pp.25-45). Netherlands: Springer Press.
Camburn, E., Rowan, B., & Taylor, J. (2003). Distributed leadership in schools: The case of elementary schools adopting comprehensive school reform models. Educational Evaluation and Policy Analysis, 25(4), 347-373.
Carson, J. B., Tesluk, P. E., & Marrone, J. A. (2007). Shared leadership in teams: An investigation of antecedent conditions and performance. Academy of Management Journal, 50 (5), 1217-1234.
Chakraborty, R. N. (2001). Stability and outcomes of common property institutions in forestry: Evidence from the Terai region of Nepal. Ecological Economics, 36(2), 341-353.
Chen, C. N., Tsaur, T. W., & Rhai, T. S. (1982). The Gini coefficient and negative income. Oxford Economic Papers, 34(3), 473-478.
Chubb, J. & Moe, T. (1988). Politics, markets, and the organization of schools. The American Political Science Review, 82(4), 1065-1087.
Cohen, D. K., Peurach, D. J., Glazer, J. L., Gates, K. E., & Goldin, S. (2013). Improvement by design: The promise of better schools. Chicago, IL: University of Chicago Press.
Comstock, D. & Scott. W. R. (1977). Technology and the structure of subunits: Distinguishing individual and workgroup Effects. Administrative Science Quarterly, 22 (2), 177-202.
Conger, J. & Kanungo, R. (1998). The Empowerment process: Integrating theory and practice. The Academy of Management Review, 13(3), 471-482.
Conley, S. & Cooper, B. (1991). The school as a work environment: Implications for reform. Boston: Allyn and Bacon.
Copland, M. A. (2003). Leadership of inquiry: Building and sustaining capacity for school improvement. Educational Evaluation and Policy Analysis, 25(4), 375-395.
Correnti, R. (2007). An empirical investigation of professional development effects on literacy instruction using daily logs. Educational Evaluation and Policy Analysis, 29(4), 262-295.
Correnti, R., & Rowan, B. (2007). Opening Up the Black Box: Literacy Instruction in Schools Participating in Three Comprehensive School Reform Programs. American Educational Research Journal, 44(2), 298-339.
Cowell, F. A. (2000). Measurement of inequality. Handbook of Income Distribution, 1, 87-166.
Crowson, R.L. & Morris, V.C. (1985). Administrative controls in large city school systems: An investigation in Chicago. Educational Administration Quarterly, 21(4), 51-70.
Crowther, F. (2001). Teachers as leaders: A conceptual framework. Report to the Australian Research Council. Toowoomba: University of Southern Queensland.
Cuban , L.(1993). How teacher taught: Constancy and change in American

233
classrooms 1880-1990 (2nd ed.). New York, NY: Teachers College Press. Daft. R. L. (2009). Organization theory and design. Mason, OH: Cengage Learning. Dai, J.l., Wang, P., Wang, X., & Qi, J. (2008). Discussion on impartiality index of
power dispatching based on Gini coefficient. Automation of Electric Power Systems, 32, 26-29
Dalton, H. (1920). The measurement of the inequality of incomes. The Economic Journal, 30 (119), 348-361.
Daly, A. J. (2010). Social network theory and educational change. Cambridge, Mass.: Harvard Education Press. Anand, S. (1983). Inequality and poverty in Malaysia: Measurement and position. New York, NY: Oxford University Press.
Dansereau, F., Graen, G., & Haga, W. J. (1975). A leader-teacher dyad linkage approach to leadership within formal organizations. Organizational Behavior and Human Performance, 13, 46-78.
Darling-Hammond, L. (1990). Teaching and knowledge: Policy issues posed by alternate certification of teachers. Peabody Journal of Education, 67 (3), 123-154.
Darling-Hammond, L. (1995). Policy for restructuring. In A. Lieberman (Ed.), The work of restructuring schools: Building from the group up. New York, NY: Teachers College Press.
Darling-Hammond, L., & Snyder, J. (1992). Curriculum studies and traditions of inquiry: The scientific tradition. In P.W. Jackson (Ed.), Handbook of research on curriculum (pp. 41-77). New York, NY: MacMillan.
Darmawan, I.N. (2002). NORM software review: Handling missing values with multiple imputation method. Evaluation Journal of Australasia, 2(1), 51-57.
Datnow, A. (2005). The sustainability of comprehensive school reform models in changing district and state contexts. Educational Administration Quarterly, 41(1), 121-153.
Davidson, R. (2009). Reliable inference for the Gini index. Journal of Econometrics, 150 (1), 30-40.
Davison, A., Brown, P., Pharo, E., Warr, K., McGregor, H., Terkes, S., et al. (2013). Distributed leadership: building capacity for interdisciplinary climate change teaching at four universities. International Journal of Sustainability in Higher Education, 15 (1), 98-110.
Day, C., Hadfield, M., Tolley, H., Beresford, J., & Harris, A. (2000). Leading schools in times of change. London: Open University Press.
Deal, T. & Peterson, K. (1990). The principal’s role in shaping school culture. Washington D.C.: U.S. Government Printing Office.
Deaton, A. (1997). The analysis of household surveys: a microeconomic approach to development policy. Washington, D. C: Johns Hopkins University Press.
Dee, J. R., Henkin, A. B., & Singleton, C. A. (2006). Organizational commitment of teachers in urban schools: Examining the effects of team structures. Urban Education, 41, 603–627.
Desimone, L. (2002). How can comprehensive school reform models be successfully implemented? Review of Educational Research, 72 (3), 433-479.
Devos, G., Tuytens, M., & Hulpia, H. (2014). Teachers’ Organizational Commitment: Examining the Mediating Effects of Distributed Leadership. American Journal

234
of Education, 120 (2), 205-231. DiMaggio, P. & Powell, W.W. (1983). The iron cage revisited: Institutional
isomorphism and collective rationality in organizational fields. American Sociological Review, 48 (2), 147-160.
Dixon, P. M., Weiner, J., Mitchell-Olds, T., & Woodley, R. (1987). Bootstrapping the Gini coefficient of inequality. Ecology, 68 (5), 1548-1551.
Dorfman, R. (1979). A formula for the Gini coefficient. The Review of Economics and Statistics, 61(1), 146-149.
Drory, A. & Romm, T. (1990). The definition of organizational politics: A review. Human Relations, 43 (11), 1133-1154.
Duignan, P., & Bezzina, M. (2006). Distributed leadership: The theory and the practice. Paper presented at CCEAM Annual Conference, Lefkosia, Cyrus.
Duncan, B. (1972) Characteristics of organizational environment and perceived environmental uncertainty. Administrative Science Quarterly, 17, 313-327
Ebmeier, H. & Hart, A.W. (1992). The effects of a career-ladder program on school organization process. Educational Evaluation and Policy Analysis, 14 (3), 261-281.
Edmonds, R. (1979). Effective schools for the urban poor. Educational Leadership, 37, 15-24.
Eisenhart, K. (1989). Agency theory: A review and assessment. The Academy of Management Review, 14 (1), 57-74.
Elmore, R. F. (2000). Building a new structure for school leadership. Washington, DC: Albert Shanker Institute.
Erb, T. O. (1995). Teamwork in middle school education. In H. G. Garner (Ed.), Teamwork models and experience in education (pp. 175-198). Boston, Massachusetts: Allyn & Bacon.
Etzioni, A. (1965). Organizational Control Structure. In J. G. March (Ed.), Handbook of organizations (pp. 650-677). Chicago: Rand McNally.
Evans, M. G. (1970). The effects of supervisory behavior on the path goal relationships. Organizational Behavioral Human Performance, 5, 277-298.
Feldman. M.& Pentland. B. (2003). Reconceptualizing organizational routines as a source of flexibility and change. Administrative Science Quarterly, 48 (1), 94-118.
Fellman, J. (2012). Estimation of Gini coefficients using Lorenz curves. Journal of Statistical and Econometric Methods, 1(2), 31-38.
Fiedler, F.E. (1967). A theory of leadership effectiveness. New York, NY: McGraw-Hill.
Fiedler, F.E. & Garcia, J. E. (1987). New approaches to effective leadership. New York, NY: Wiley.
Fink, E., & Resnick, L. (2001). Developing principals as instructional leaders. Phi Delta Kappan, 82 (8), 598-606.
Firestone, W. A., & Pennell, J. R. (1993). Teacher commitment, working conditions and differential incentive policies. Review of Educational Research, 63, 489-525.
Fleishman, E.A. (1953). Leadership climate, human relations training, and supervisory behavior. Personnel Psychology, 6 (2), 205-222.
Fraser, J. & Duignan, P. (2004). Perceptions of shared leadership among leaders in

235
Parramatta Diocesan Schools. Sydney: ACU National. Friedkin, N. E., & Slater, M. R. (1994). School leadership and performance: A social
network approach. Sociology of Education, 67 (2), 139-157. Frederickson, H. G., & Cho, Y. H. (1974). Legislative apportionment and fiscal policy
in the American states. The Western Political Quarterly, 27 (1), 5-37. Friedrich, T. L., Vessey, W. B., Schuelke, M. J., Ruark, G. A., & Mumford, M. D.
(2009). A framework for understanding collective leadership: The selective utilization of leader and team expertise within networks. The Leadership Quarterly, 20 (6), 933-958.
Freidson. E. (1984). The changing nature of professional control. Annual Review of Sociology, 10, 1-20
Gamoran, A. & R. Dreeben (1986). Coupling and control in educational organizations. Administrative Science Quarterly, 31 (4), 612-632.
Glasser, G. J. (1962). Variance formulas for the mean difference and coefficient of concentration. Journal of the American Statistical Association, 57 (299), 648-654.
Goddard, Y., Goddard, R., & Tschannen-Moran, M. (2007). A theoretical and empirical investigation of teacher collaboration for school improvement and student achievement in public elementary schools. The Teachers College Record, 109 (4), 877-896.
Goddard, R. D., Sweetland, S. R., & Hoy, W. K. (2000). Academic emphasis of urban elementary schools and student achievement in reading and mathematics: A multilevel analysis. Educational Administration Quarterly, 36 (5), 683-702.
Goode J. W. (1957). Community within a community: The professions. Sociological Review, 22 (2), 94-200.
Graczyk, P. P. (2007). Gini coefficient: a new way to express selectivity of kinase inhibitors against a family of kinases. Journal of medicinal chemistry, 50 (23), 5773-5779.
Graen, G. B., & Cashman, J. (1975). A role-making model of leadership in formal organizations: A developmental approach. In J. G. Hunt & L. L. Larson (Eds.), Leadership frontiers (pp. 143- 165). Kent, OH: Kent State University Press.
Graen, G., Novak, M., & Sommerkamp, P. (1982). The effects of leader-member exchange and job design on productivity and job satisfaction: Testing a dual attachment model. Organizational Behavior and Human Performance, 30, 109-131.
Greenberg, J.H. (1956). The measurement of linguistic diversity. Language, 32, 109-115
Graetz, F. (2000). Strategic change leadership. Management Decisions, 38 (8), 550-562.
Gronn, P. (2000). Distributed properties: A new architecture for leadership, Educational Management and Administration, 28 (3), 317-38.
Gronn, P. (2002). Distributed leadership as a unit of analysis. The Leadership Quarterly, 13(4), 423- 451.
Gronn, P. (2002). Distributed leadership. In Leithwood, K. and Hallinger, P. (Eds), International handbook of educational leadership and administration (pp. 653-696). Dordrecht, Netherland: Kluwer Academic Publishers.
Gronn, P. (2003). The new work of educational leaders: Changing leadership practice

236
in an era of school reform. Thousand Oaks, CA: Sage. Gronn, P. (2008). The future of distributed leadership. Journal of Educational
Administration, 46(2), 141-158. Gronn, P. (2010). Leadership: Its genealogy, configuration and trajectory. Journal of
Educational Administration and History, 42(4), 405-435. Gundelach, P., & Tetzschner, H. (1976). Measurement of influence in organizations:
Critique of the Control-Graph Method. Acta Sociological, 19 (1), 49-63. Hairon, S., & Goh, J. W. (2014). Pursuing the elusive construct of distributed
leadership is the search over? Educational Management Administration and Leadership, 9(3), 1-26
Hallinger, P. (2003). Leading educational change: Reflections on the practice of instructional and transformational leadership. Cambridge Journal of Education, 33(3), 329-352.
Hallinger, P. (2005). Instructional leadership and the school principal: A passing fancy that refuses to fade away. Leadership and Policy in Schools, 4(3), 221-239.
Hallinger, P. (2008). Methodologies for studying school leadership: A review of 25 years of research using the principal instructional management rating scale. Paper presented at the annual meeting of the American Educational Research Association (AERA), New York, NY.
Hallinger, P., & Heck, R. H. (1996). Reassessing the principal's role in school effectiveness: A review of empirical research, 1980-1995. Educational Administration Quarterly, 32 (1), 5.
Hallinger, P. & Heck, R. (1998). Exploring the principal’s contribution to school Effectiveness: 1980-1995. School Effectiveness and School Improvement, 9(2), 157-195.
Hallinger, P. & Murphy, J. (1985). Assessing the instructional management behavior of principals. Elementary School Journal, 86 (2), 217-247.
Halverson, R. (2003). Systems of practice: How leaders use artifacts to create professional community in schools. Education Policy Analysis Archives, 11(37), 1-35.
Hao, L.& Naiman, D.Q (2010). Assessing Inequality. Thousand Oaks, CA: Sage. Hargreaves, A. & Fink, D. (2006). Sustainable Leadership. San Francisco, CA:
Jossey-Bass. Harris, A. (2005). Crossing boundaries and breaking barriers: Distributing
leadership in schools. London: Specialist Schools Trust. Harris, A. (2007). Distributed leadership: Conceptual confusion and empirical
reticence. International Journal of Leadership in Education, 10(3), 315-325. Harris, A. (2008). Distributed leadership: According to the evidence. Journal of
Educational Administration, 46 (2), 172-188. Harris, A. (2009). Distributed leadership: What we know. The Netherlands: Springer. Harris, A. & Muijs, D. (2004). Improving schools through teacher leadership.
London: Open University Press. Harris, A. (2013). Distributed Leadership Friend or Foe? Educational Management
Administration and Leadership, 41 (5), 545-554. Harrison, N. L. T. (2005). The impact of distributed leadership on teachers (Doctoral
dissertation). Retrieved from Proquest Dissertations and Theses Database.

237
(AAT 3189149). Harrison, D. A., & Klein, K. J. (2007). What's the difference? Diversity constructs as
separation, variety, or disparity in organizations. Academy of Management Review, 32 (4), 1199-1228.
Hart, P. E., & Prais, S. J. (1956). The analysis of business concentration: a statistical approach. Journal of the Royal Statistical Society, 119 (2), 150-191.
Hattie, J. (2009). Visible learning: A synthesis of meta-analyses relating to achievement. New York, NY: Routledge.
Heck, R. & Hallinger, P. (2005). The study of educational Leadership and management: Where does the field stand today? Educational Management Administration and Leadership, 33 (2), 229-244.
Heck, R. H., & Hallinger, P. (2009). Assessing the contribution of distributed leadership to school improvement and growth in math achievement. American Educational Research Journal, 46 (3), 659-689.
Heck, R. H., & Hallinger, P. (2010). Testing a longitudinal model of distributed leadership effects on school improvement. The Leadership Quarterly, 21(5), 867-885.
Heck, R. H., Larsen, T. J., & Marcoulides, G. A. (1990). Instructional leadership and school achievement: Validation of a causal model. Educational Administration Quarterly, 26 (2), 94-125.
Heller, M.F. & Firestone, W.A. (1995). Who’s in charge here? Sources of leadership for change in eight schools. The Elementary School Journal, 96 (1), 65-86.
Herfindahl, O. C. (1950). Concentration in the steel industry. Unpublished Dissertation, Columbia University, New York, NY.
Hersey, P., Blanchard, K. H., & Natemeyer, W. E. (1979). Situational leadership, perception, and the impact of power. Group and Organization Management, 4(4), 418-428.
Hickson, D. J., Hinings, C. R., Lee, C. A., Schneck, R. E., & Pennings, J. M. (1971). (1971). A strategic contingencies' theory of intra-organizational power. Administrative Science Quarterly, 16 (2), 216-229.
Hollander, E. & Offerman, L. (1990). Power and leadership in organizations: Relationships in transition. American Psychologist, 45 (2), 179-189.
House, R. J. (1971). A path-goal theory of leadership. Administrative Science Quarterly, 16, 321-338.
House, R. J., & Aditya, R. N. (1997). The social scientific study of leadership: Quo vadis? Journal of Management, 23, 409-473.
Howell, J. M. & Avolio, Bruce J. (1993). Transformational leadership, transactional leadership, locus of control, and support for innovation: Key predictors of consolidated-business-unit performance. Journal of Applied Psychology, 78 (6), 891-902.
Hoy, W. K., & Sabo, D. J. (1998). Quality middle schools: Open and healthy. Thousand Oaks, CA: Corwin Press.
Hoy,W. K.,& Tarter, C. J. (1997). The road to open and healthy schools: A handbook for change (Elementary and secondary school education). Thousand Oaks, CA: Corwin Press.
Hoy, W. K., Tarter, C. J., & Kottkamp, R. (1991). Open schools/healthy schools: Measuring organizational climate. Newbury Park, CA: Sage.

238
Huberman, A., & Miles, M. (1984). Innovations up close: How school improvement works. New York, NY: Plenum Press.
Hulpia, H., & Devos, G. (2010). How distributed leadership can make a difference in teachers' organizational commitment? A qualitative study. Teaching and Teacher Education, 26(3), 565-575.
Hulpia, H., Devos, G., & Keer,V. H. (2009a). The Influence of distributed leadership on teachers' organizational commitment: A multilevel approach. The Journal of Educational Research, 103(1), 40-52.
Hulpia, H., Devos, G., & Rosseel, Y. (2009b). Development and validation of scores on the distributed leadership inventory. Educational and Psychological Measurement, 69 (6), 1013-1034.
Hulpia, H., Devos, G., & Rosseel, Y. (2009c). The Relationship between the perception of distributed leadership in secondary schools and teachers' and teacher leaders' job satisfaction and organizational commitment. School Effectiveness and School Improvement, 20 (3), 291-317
Ingersoll, R. M. (1994). Organizational control in secondary schools. Harvard Education Review, 64 (2), 150-172.
Ingersoll, R. M. (1996). Teachers' decision-making power and school conflict. Sociology of Education, 69 (2), 159-176.
Ingersoll, R. M. (2001). Teacher turnover and teacher shortages: An organizational analysis. American Educational Research Journal, 38 (3), 499-534.
Jacobs, C. D., & Heracleous, L. T. (2005). Answers for questions to come: reflective dialogue as an enabler of strategic innovation. Journal of Organizational Change Management, 18 (4), 338-352.
Jenkins, S. (1991). The measurement of income inequality. In L. Osberg (Ed.). Economic inequality and poverty: International perspectives (pp.3-38). New York, NY: M.E. Sharpe.
Jenkins, S. (1999) INEQDECO: Stata module to calculate inequality indices with decomposition by subgroup, Statistical Software Components S366002, Boston College Department of Economics, revised 24 Feb 2010.
Johnson, S. M. (1986). Incentives for teachers: What motivates, what matters. Educational Administration Quarterly, 22 (3), 54-79
Kelly, G. (2012). Gini coefficient, social network analysis, and markov chains: Quantitative methods for analyzing the distribution of benefits in natural resource-dependent communities.
Kendall, M. G. (1943). The advanced theory of statistics. London: Charles Griffin. Kimura, K. (1994). A micro-macro linkage in the measurement of inequality: another
look at the Gini coefficient. Quality and quantity, 28 (1), 83-97. Lashway, L. (2003). Distributed leadership. Research Roundup, 19 (4), 1-4. Lawrence, P. R. & Lorch, J. W. (1986). Organization and environment: Managing
differentiation and integration. Boston, MA: Harvard Business School Press. Lee, V. E., & Smith, J. B. (1996). Collective responsibility for learning and its effects
on gains in achievement for early secondary school students. American journal of education, 104 (2), 103-147.
Lee, V. E., Smith, J. B. & Croninger, R.G. (1995). Another look at high school restructuring. Issues in Restructuring Schools, 9, 5-10.
Leithwood, K., Day, C., Sammons, P., Hopkins, D. & Harris, A. (2006). Successful

239
school leadership. What it is and how it influences pupil learning. London: Department of Education and Skills.
Leithwood, K., & Jantzi, D. (1998). Distributed leadership and student engagement in school. Paper presented at the Annual Meeting of the American Educational Research Association (AERA), San Diego, CA.
Leithwood, K. & Jantzi, D. (2000). The effects of transformational leadership on organizational conditions and student engagement. Journal of Educational Administration, 38 (2), 112-132
Leithwood, K., Jantzi, D., & Steinbach, R. (1998). Leadership and other conditions which foster organizational learning in schools. In K. Leithwood and K. Seashore-Louis (Eds.), Organizational learning in schools (pp. 67-90). Lisse, Netherlands: Swets and Zeitlinger.
Leithwood, K., & Mascall, B. (2008). Collective leadership effects on student achievement. Educational Administration Quarterly, 44(4), 529-561.
Leithwood, K., Mascall, B., & Strauss, T. (2009). Distributed leadership according to evidence. London: Routledge.
Leithwood, K. & Montgomery, D. (1982). The role of the elementary principal in program involvement. Review of Educational Research, 52(3), 309-339.
Leithwood, K., Patten, S., & Jantzi, D. (2010). Testing a conception of how school leadership influences student learning. Educational Administration Quarterly, 46 (5), 671-706.
Lerman, R. I. & Yitzhaki, S. (1984). A note on the calculation and interpretation of the gini index. Economics Letters, 15, 363-368
Licata, J. W., & Harper, G. W. (1999). Healthy schools, robust schools and academic emphasis as an organizational theme. Journal of Educational Administration, 37(5), 463-475.
Liden, R., & Graen, G. (1980). Generalizability of the leader-teacher dyad linkage model of leadership. Academy of Management Journal, 23, 451-465.
Lieberman, A. & McLaughlin, M. W. (1992). Networks for educational change: Powerful and problematic. Phi Delta Kappan, 73(9), 673-677.
Lieberman, A. (1995). Practices that support teacher development: Transforming conceptions of professional learning. Phi Delta Kappan, 76 (8), 591-596.
Lieberson, S.(1964). An extension of Greenberg’s linguistic diversity measures. Language, 40, 526-531
Lieberson, S. (1969). Measuring population diversity. American Sociological Review, 34 (6), 850-862.
Little, J. W. (1990). The persistence of privacy: Autonomy and initiative in teachers’ professional relations. Teachers College Record, 91 (4), 509-536.
Litwak, E.(1961). Model of bureaucracy that permit conflict. American Journal of Sociology, 67, 177-184
Lorenz, M. O. (1905). Methods of measuring the concentration of wealth. Publications of the American Statistical Association, 9(70), 209-219.
Louis, K.S., Kruse, S.D. & Bryk. (1995). Professionalism and community: Perspectives on reforming urban schools. Thousand Oaks, CA: Corwin Press.
Louis, K. S., Marks, H. M., & Kruse, S. (1996). Teachers’ professional community in restructuring schools. American Educational Research Journal, 33(4), 757-798.

240
Louis, K.S & Marks, H. M. (1998). Does professional community affect the classroom? Teachers’ work and student work in restructuring schools. American Educational Research Journal, 33(4), 757-798.
Louis, K. S. (2006). Changing the culture of schools: Professional community, organizational learning, and trust. Journal of School Leadership, 16 (5), 477-489.
Louis, K. S., Mayrowetz, D., Murphy, J., & Smylie, M. (2013). Making sense of distributed leadership: How secondary school educators look at job redesign. IJELM-International Journal of Educational Leadership and Management, 1(1), 33-68.
Mansfield, E. D. (1992). The concentration of capabilities and the onset of war. Journal of Conflict Resolution, 36(1), 3-24.
Manz, C. C. & Sims, H. P., Jr. (1986). Beyond imitation: Complex behavioral and affective linkages resulting from exposure to leadership training models. Journal of Applied Psychology, 71, 571-578.
March, J.G. & Simon, H.A. (1958). Organizations. New York, NY: John Wiley. Markham, W. T., Bonjean, C. M., & Corder, J. (1984). Measuring organizational
control: The reliability and validity of the control graph approach. Human Relations, 37(4), 263.
Marks H. & Louis. K. S. (1997). Does teacher empowerment affect the classroom? The implications of teacher empowerment for instructional practice and student academic performance. Educational Evaluation and Policy Analysis, 19(3), 245-270
Marks, H. M., & Printy, S. M. (2003). Principal leadership and school performance: An integration of transformational and instructional leadership. Educational Administration Quarterly, 39(3), 370-397.
Martin, J. D., & Gray, L. N. (1971). Measurement of relative variation: Sociological examples. American Sociological Review, 36 (3), 496-502.
Mascall, B., Leithwood, K., Strauss, T., & Sacks, R. (2008). The relationship between distributed leadership and teachers' academic optimism. Journal of Educational Administration, 46(2), 214-228
Mathieu, J. E. & Zajac, D. M. (1990). A review and meta-analysis of the antecedents, correlates, and consequences of organizational commitment. Psychological Bulletin, 108, 171–194.
Mayrowetz, D. & Weinstein, C. S. (1999). Sources of leadership for inclusive education: Creating schools for all children. Educational Administration Quarterly, 35(3), 423–449.
Mayrowetz, D. (2008). Making sense of distributed leadership: Exploring the multiple usages of the concept in the field. Educational Administration Quarterly, 44(3), 424-435.
McDonald, J. B., & Ransom, M. R. (1981). An analysis of the bounds for the Gini coefficient. Journal of Econometrics, 17(2), 177-188.
MacLaughlin, M., & Marsh, D. (1978). Staff development and school change. Teachers College Record, 80 (1), 69-94.
McLaughlin, M. W. & Talbert, J. E. (2007). Building professional learning communities in high schools: Challenges and promising practices. In Stoll, L. and Louis, K.S (Eds.), Professional learning communities: Divergence, depth

241
and dilemmas (pp. 151-165). England: Open University Press, and McGraw-Hill Education.
Mehra, A., Smith, B. R., Dixon, A. L., & Robertson, B. (2006). Distributed leadership in teams: The network of leadership perceptions and team performance. The Leadership Quarterly, 17(3), 232-245.
Meier, K. J., & Bohte, J. (2003). Span of control and public organizations: Implementing Luther Gulick’s research design. Public Administration Review, 63(1), 61-70.
Meyer, J. W. & Rowan, B. (1977). Institutionalized organizations: Formal structure as myth and ceremony. American Journal of Sociology, 83(2), 340-363.
Meyer J.W. & Rowan B. (1978). The structure of educational organizations. In, M.W. Meyer and Associates (Eds.), Environments and Organizations (pp. 78-109). San Francisco, CA: Jossey-Bass.
Milanovic, B. (1997). A simple way to calculate the Gini coefficient, and some implications. Economics Letters, 56(1), 45-49.
Mintzberg. H. (1980). Structure in 5’s: A synthesis of the research on organization design. Management Science, 26(3), 322-341.
Mitchell, C., & Sackney, L. (2006). Building schools, building people: The school principal’s role in leading a learning community. Journal of School Leadership, 16, 627-640.
Moolenaar, N. M., Daly, A. J., & Sleegers, P. J. (2010). Occupying the principal position: Examining relationships between transformational leadership, social network position, and schools’ innovative climate. Educational Administration Quarterly, 46(5), 623-670.
Morgeson, F. P., DeRue, D. S., & Karam, E. P. (2010). Leadership in teams: A functional approach to understanding leadership structure and process. Journal of Management, 36(1), 5-39.
Mulford,B. & Silins,H. (2003). Leadership for organizational learning and improved student outcome – what do we know? Cambridge Journal of Education, 33(2), 175-195.
Murphy, J. (2005). Connecting teacher leadership and school improvement. Thousand Oaks, CA: Corwin Press.
Nguni, S., Sleegers, P., Denessen, E. (2006). Transformational and transactional leadership effects on teachers’ job satisfaction, organizational commitment, and organizational citizenship behavior in primary schools: The Tanzanian case. School Effectives and School Improvement, 17(2), 145-177.
Ogawa, R. T., & Bossert, S. T. (1995). Leadership as an organizational quality. Educational Administration Quarterly, 31, 224–243.
Ogwang, T. (2000). A convenient method of computing the Gini index and its standard error. Oxford Bulletin of Economics and Statistics, 62(1), 123-129.
Olivier, D. F. & Hipp, K.K. (2006). Leadership capacity and collective efficacy: Interacting to sustain learning in a professional learning community. Journal of School Leadership, 16(5), 505-519.
Orr, M. T., Berg, B., Shore, R., & Meier, E. (2008). Putting the pieces together leadership for change in low-performing urban schools. Education and Urban Society, 40(6), 670-693.
Ouchi, W.G. (1979). A conceptual framework for the design of organizational control

242
mechanisms. Management Science, 25(9), 833-848. Ouchi, W. G., & Dowling, J. B. (1974). Defining the span of control. Administrative
Science Quarterly, 19(3), 357-365. Pankhurst, C., Pierret, A., Hawke, B., & Kirby, J. (2002). Microbiological and
chemical properties of soil associated with macropores at different depths in a red-duplex soil in NSW Australia. Plant and Soil, 238 (1), 11-20.
Pastor, J. C., & Mayo, M. (2002). Shared leadership in work teams: A social network approach: Instituto de Empresa, Area of Economic Environment.
Patrick, R. (2004). Multiple imputation of missing values. The Stata Journal, 4(3), 227-24.
Pearce, C. L., & Barkus, B. (2004). The Future of leadership: Combining leader-teacher and shared Leadership to transform knowledge Work [and Executive Commentary]. The Academy of Management Executive (1993-2005), 47-59.
Pearce, C. J. & Conger, C. (2003). Shared leadership: Reframing the hows and whys of leadership. Thousand Oaks, CA: Sage.
Perrow, C. (1967). A framework for the comparative analysis of organizations. American Sociological Review, 32(2), 194-208.
Peterson, K.D. (1984). Mechanisms of administrative control over managers in educational organizations. Administrative Science Quarterly, 29(4), 573-597.
Peterson, S., & Emrick, J. (1983). Advances in practice. In W. Paisley & M. Butter (Eds.), Knowledge utilization systems in education (pp. 219-259). Beverly Hills, CA: Sage.
Peugh, J. L., & Enders, C.K. (2004). Missing data in educational research: A review of reporting practices and suggestions for improvement. Review of Educational Research, 74(4), 525-556.
Peurach, D. J., & Glazer, J. L. (2012). Reconsidering replication: New perspectives on large-scale school improvement. Journal of Educational Change, 13(2), 155-190.
Pfeffer. J. (2007). Human resources from an organizational behavior perspective: Some paradoxes explained. The Journal of Economic Perspectives, 21(4), 115-134.
Pitts, V. M., & Spillane, J. P. (2009). Using social network methods to study school leadership. International Journal of Research and Method in Education, 32(2), 185-207.
Pounder, D. G. (1998). Teacher teams: Redesigning teachers’ work for collaboration. In D. G. Pounder (Ed.), Restructuring schools for collaboration: Promises and pitfalls (pp. 65-88). Albany: State University of New York Press.
Pounder, D. G., Ogawa, R. T., & Adams, E. A. (1995). Leadership as a organization-wide phenomena: Its impact on school performance. Educational Administration Quarterly, 31, 564–588
Preacher, K. J., Curran, P. J., & Bauer, D. J. (2006). Computational tools for probing interactions in multiple linear regression, multilevel modeling, and latent curve analysis. Journal of Educational and Behavioral Statistics, 31(3), 437-448.
Prestine, N.A. (1993). Extending the essential school metaphor: Principal as enabler. Journal of School Leadership, 3(4), 356-379.

243
Pyatt, G. (1976). On the interpretation and disaggregation of Gini coefficients. The Economic Journal, 86(342), 243-255.
Raudenbush, S. W., & Bryk, A. S. (2002). Hierarchical linear models: Applications and data analysis methods (2nd ed.). Thousand Oaks, CA: Sage.
Raudenbush, S. W., Bryk, A. S., Cheong, Y. F., Congdon, R. T., & du Toit, M. (2011). HLM 7 [Computer software]. Chicago, IL: Scientific Software International Inc.
Ray, J. L., & Singer, J. D. (1973). Measuring the concentration of power in the international system. Sociological Methods & Research, 1(4), 403.
Regidor, E. (2004). Measures of health inequalities: part 1. Journal of epidemiology and community health, 58(10), 858-861.
Riehl, C. (2000). The principal's role in creating inclusive schools for diverse students: A review of normative, empirical, and critical literature on the practice of educational administration. Review of Educational Research, 70 (1), 55.
Riehl, C., & Sipple, J. W. (1996). Making the most of time and talent: Secondary school organizational climates, teaching task environments, and teacher commitment. American Educational Research Journal, 33(4), 873-901.
Robinson, V. M. J. (2008). Forging the links between distributed leadership and educational outcomes. Journal of Educational Administration, 46(2), 241-256.
Robinson, V., Lloyd, C.A. & Rowe, KJ. (2008). The impact of leadership on student outcomes: An analysis of the differential effects of leadership types. Educational Administration Quarterly, 44(5), 635-674.
Rowan. B. (1982). Organizational structure and the institutional environment: The case of public schools. Administrative Science Quarterly, 27(2), 259-279.
Rowan, B. (1990). Commitment and control: Alternative strategies for the organizational design of schools. Review of Research in Education, 16, 353-389.
Rowan. B. (1994). Comparing teachers’ work to work in other occupations: Notes on the professional status of teaching. Educational Researcher, 23(6), 4-17.
Rowan, B. (2002a). Teachers’ work and instructional management, Part I: Alternative views of the task of teaching. In W. Hoy and C. Miskel (Eds.), Theory and research in educational administration (Vol.1, pp. 129-150). Greenwich, CN: Information Age.
Rowan. B. (2002b). Teachers’ work and instructional management, Part II: Does organic management promote expert teaching? In, W. Hoy and C. Miskel (Eds.), Theory and Research in Educational Administration (Vol. 1, pp. 151-168). Greenwich, CN: Information Age.
Rowan, B., Camburn, E., & Barnes, C. (2004). Benefiting from comprehensive school reform: A review of research on CSR implementation. In C. Cross (Ed.), Putting the pieces together: Lessons from comprehensive school reform research (pp.1-52). Washington D.C.: Clearringhouse.
Rowan, B., Correnti, R., Miller, R. J., & Camburn, E. M. (2009). School Improvement by Design: Lessons from a Study of Comprehensive School Reform Programs. Philadelphia: Consortium for Policy Research in Education, University of Pennsylvania.
Rowan, B., & Miller, R. J. (2007). Organizational strategies for promoting instructional change: Implementation dynamics in schools working with

244
Comprehensive School Reform providers. American Educational Research Journal, 44(2), 252-297.
Rowan, B. & Miller, R. J. (2009). Interventions to improve instruction: How implementation strategies affect instructional change. In Hoy, W. K., & DiPaola, M. F. (2009). Studies in school improvement (pp. 45- 76), Charlotte, NC: IAP/Information Age Pub.
Schutz, R. R.(1951). On the measurement of income inequality. Ame.econ. Rev, 41, 107-122
Scott, W.R. (1995). Institutions and organizations. Thousand Oaks, CA: Sage. Sen, A. K. (1973). On economic inequality, New York, NY: W. W. Norton. Sen, A. K., & Foster, J. E. (1997). On economic inequality. Oxford, England: Oxford
University Press. Shachar, H., & Shmuelevitz, H. (1997). Implementing cooperative learning, teacher
collaboration and teachers’ sense of efficacy in heterogeneous junior high schools. Contemporary Educational Psychology, 22, 53–72
Shalit, H.(1985). Calculating the gini index of inequality for individual data. Bulletin, 47,185-189
Shavelson, R. J. (1981). A study of alternatives in American education: Conclusions and policy implications. Santa Monica, CA: Rand.
Silins, H & Mulford, B. (2002). Leadership and school results. In K. Leithwood & P. Hallinger (Eds.), International handbook of educational leadership and administration (pp. 561-612). Norwell, MA: Kluwer.
Silva, D. Y., Gimbert, B., & Nolan, J. (2000). Sliding the doors: Locking and unlocking possibilities for teacher leadership. Teachers’ College Record, 102(4), 779-804.
Simpson L. R. (1985). Social control of occupations and work. Annual Review of Sociology, 11, 415-436.
Singh, K., & Billingsley, B. (1998). Professional support and its effects on teachers' commitment. Journal of Educational Research, 91(4), 229-239.
Smith, L., Ross, S., McNelis, M., Squires, M., Wasson, R., Maxwell, S., Weddle, K., Nath, L., Grehan, A., & Buggey, T. (1998). The Memphis restructuring initiative: Analyses of activities and outcomes that impact implementation success. Education and Urban Society, 30 (3), 296–325.
Smylie, M. A., & Denny, J. W. (1990). Teacher leadership: Tensions and ambiguities in organizational perspective. Educational Administration Quarterly, 26, 235-259.
Smylie. M. (1994). Redesigning teachers' work: Connections to the classroom. Review of Research in Education, 20, 129-177.
Sorensen, P. F., & Baum, B. H. (1977). The measurement of intraorganizational power: The application of the control graph to organization development. Group and Organization Management, 2(1), 61-74.
Spillane, J. P. (2006). Distributed leadership. San Francisco, CA: Jossey-Bass. Spillane, J. & Diamond, J. (2007). Distributed Leadership in Practice. New York, NY:
Teachers College Press. Spillane, J., Camburn, E. & Pareja, A. (2007). Taking a distributed perspective to the
school principal’s work day. Leadership and Policy in Schools, 6(1), 103-125.

245
Spillane, J. P., Camburn, E. M., Pustejovsky, J., Pareja, A. S., & Lewis, G. (2008). Taking a distributed perspective: Epistemological and methodological tradeoffs in operationalizing the leader-plus aspect. Journal of Educational Administration, 46(2), 189-213.
Spillane, J., Halverson, R., & Diamond, J.B (2001). Investigating school leadership practice: A distributed perspective. Educational Researcher, 30 (3), 23-28.
Spillane, J.P., Halverson, R. & Diamond, J.B. (2004), Toward a theory of leadership practice: a distributed perspective. Journal of Curriculum Studies, 36(1), 3-34.
Spillane, J. P., & Hunt, B. R. (2010). Days of their lives: a mixed-methods, descriptive analysis of the men and women at work in the principal’s office. Journal of Curriculum Studies, 42(3), 293-331.
Stafford, M., Cummins, S., Macintyre, S., Ellaway, A., & Marmot, M. (2005). Gender differences in the associations between health and neighborhood environment. Social Science & Medicine, 60(8), 1681-1692.
Starratt, R. (2003). Centering educational administration: Cultivating meaning, community, responsibility. Mahwah, NJ: Lawrence Erlbaum.
Stewart, R. (1982). Choices for the manager. Englewood Cliffs, NJ: Prentice-Hag. Stoll, L. Louise, Bolam, Ray, Mcmahon, Agnes, Wallace, Mike & Thomas Sally.
(2006). Professional learning communities: A review of the literature. Journal of Educational Change, 7, 221-258.
Stoll, L. & Louis, S.K. (2007). Professional learning communities. New York, NY: Open University Press.
Southworth, G. (2002). Instructional leadership in schools: reflections and empirical evidence. School Leadership and Management, 22(1), 73.
Taagepera, R., & Lee Ray, J. (1977). A generalized index of concentration. Sociological Methods and Research, 5(3), 367-384.
Talbert, J. E., McLaughlin, M.W. & Rowan, B. (1993). Understanding context effects on secondary school teaching, Teachers College Record, 95(1), 45-68.
Tannenbaum, A. S. (1968). Control in organizations. New York, NY: McGraw-Hill. Teachman, J. D. (1980). Analysis of population diversity: Measures of qualitative
variation. Sociological Methods & Research, 8, 341-362. Tellez, K. (1992). Mentors by choice, not design: Help-seeking by beginning teachers.
Journal of Teacher Education, 43, 214-221. Terreberry. S. (1968). The evolution of organizational environments. Administrative
Science Quarterly, 12(4), 590-613. Theil, H.(1979). The measurement of inequality by components of income.
Economics Letters, 2, 197-199. Thomas, V., Wang, Y., & Fan, X. (2001). Measuring education inequality: Gini
coefficients of education (Vol. 2525). World Bank Publications. Thompson. J. D. (1967). Organizations in Action (1967/2003). New Brunswick:
Transaction. Thon, D. (1982). An axiomatization of the Gini coefficient. Mathematical Social
Sciences, 2(2), 131-143. Timperley, H. (2005). Distributed leadership: Developing theory from practice.
Journal of Curriculum Studies, 37(4), 395-420. Tosi, H. L. (1991). The organization as a context for leadership theory: A multilevel
approach. Leadership Quarterly, 2(3), 205-228.

246
Tsui, K. T., & Cheng, Y. C. (1999). School organizational health and teacher commitment: A contingency study with multi-level analysis. Educational Research and Evaluation, 5, 249-268.
Ulrich, D & Barney. J.B.(1984). Perspectives in Organizations: Resource Dependence, Efficiency, and Population. The Academy of Management Review, 9(3), 471-481.
Vroom, V. H., & Yetton, P. W. (1973). Leadership and decision-making. Pittsburgh, Pennsylvania: University of Pittsburgh Press.
Wahlstrom & Louis (2008). How teachers experience principal leadership: The roles of professional community, trust, efficacy, and shared responsibility. Educational Administration Quarterly, 44(4), 458-495.
Wapole, M., Uribe-Zarain & Lamitina (2010). The Relationship between coaching and instruction in the primary grades: Evidence from high-poverty schools. The Elementary School Journal, 111(1), 115-140.
Wasley, P. A. (1991). Teachers who lead: The rhetoric of reform and the realities of practice. New York, NY: Teachers College Press.
Wasserman, S. & K. Faust (1994). Social network analysis: Methods and applications. Cambridge university press.
Waters, T., Marzano, R. J., & McNulty, B. (2003). Balanced Leadership: What 30 Years of Research Tells Us about the Effect of Leadership on Student Achievement. A Working Paper.
Weick. K. (1976). Educational organizations as loosely coupled systems. Administrative Science Quarterly, 21(1), 1-19
Weiner, J., & Solbrig, O. T. (1984). The meaning and measurement of size hierarchies in plant populations. Oecologia, 61(3), 334-336.
Weiss, E. M. (1999). Perceived workplace conditions and first-year teachers' morale, career choice commitment, and planned retention: A secondary analysis. Teaching and Teacher Education, 15, 861-879.
Wenger, E. (2000) Communities of practice and social learning systems. Organization, 7(2), 225–246.
Whisler, T. L., Meyer, H., Baum, B. H., & Sorensen, P. F. (1967). Centralization of organizational control: An empirical study of its meaning and measurement. The Journal of Business, 40(1), 10-26.
White. P. A. (1992). Teacher empowerment under “ideal” school-site autonomy. Educational Evaluation and Policy Analysis, 14(1), 69-82.
White, T. J. (2007). Sharing resources: The global distribution of the ecological footprint. Ecological Economics, 64(2), 402-410.
Withy, M., Daft, R.L. & Cooper. W. (1983). Measures of Perrow's work unit technology: An empirical assessment and a new scale. The Academy of Management Journal, 26(1), 45-63.
Woods, P. A. (2004). Variabilities and dualities in distributed leadership: Findings from a systematic literature review. Educational Management Administration and Leadership, 32(4), 439-457.
Woodward. J. (1965). Industrial organization: Theory and practice (pp. 50-67). Oxford, England: Oxford University Press.
Wright, L. (2008). Merits and limitations of distributed leadership: Experiences and understandings of school principals. Canadian Journal of Educational

247
Administration and Policy, 69, 1-33. Yitzhaki, S. (1998). More than a dozen alternative ways of spelling Gini. Research on
Economic Inequality, 8, 13-30. York-Barr, J., & Duke, K. (2004). What do we know about teacher leadership?
Findings from two decades of scholarship. Review of Educational Research, 74 (3), 255-316.
Youngs, H. (2009). (Un)Critical times? Situating distributed leadership in the field. Journal of Educational Administration and History, 41(4), 377-389.
Yukl. G. (2008). How leaders influence organizational effectiveness. The Leadership Quarterly, 19, 708–722.
Yukl, G., & Falbe, C. M. (1990). Influence tactics and objectives in upward, downward, and lateral influence attempts. Journal of Applied Psychology, 75, 132-140.
Yukl, G., Falbe, C. M., & Youn, J. Y. (1993). Patterns of influence behavior for managers. Journal of Organizational Behavior, 20, 219-232.
Yukl, G., Kim, H., & Chavez, C. (1999). Task importance, feasibility, and agent influence behavior as determinants of target commitment. Journal of Applied Psychology, 84, 127-143.
Yukl, G., Kim, H., & Falbe, C. M. (1996). Antecedents of influence outcomes. Journal of Applied Psychology, 81, 309-317.
Zohar, D., & Tenne-Gazit, O. (2008). Transformational leadership and group interaction as climate antecedents: a social network analysis. Journal of Applied Psychology, 93(4), 744.