Microlens OGLE2005-BLG-169 Implies That Cool Neptune-like Planets Are Common
Upload
univ-tlse3Category
view
4download
0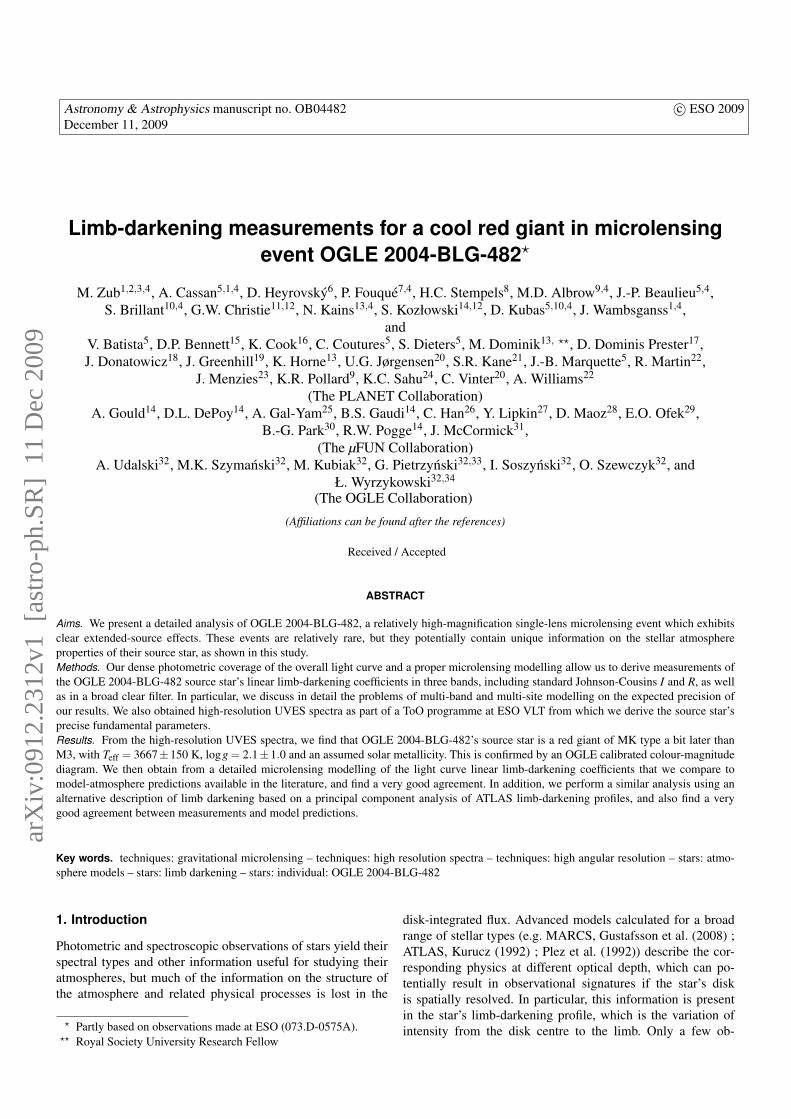
Astronomy & Astrophysics manuscript no. OB04482 c© ESO 2009December 11, 2009
Limb-darkening measurements for a cool red giant in microlensingevent OGLE 2004-BLG-482?
M. Zub1,2,3,4, A. Cassan5,1,4, D. Heyrovsky6, P. Fouque7,4, H.C. Stempels8, M.D. Albrow9,4, J.-P. Beaulieu5,4,S. Brillant10,4, G.W. Christie11,12, N. Kains13,4, S. Kozłowski14,12, D. Kubas5,10,4, J. Wambsganss1,4,
andV. Batista5, D.P. Bennett15, K. Cook16, C. Coutures5, S. Dieters5, M. Dominik13, ??, D. Dominis Prester17,J. Donatowicz18, J. Greenhill19, K. Horne13, U.G. Jørgensen20, S.R. Kane21, J.-B. Marquette5, R. Martin22,
J. Menzies23, K.R. Pollard9, K.C. Sahu24, C. Vinter20, A. Williams22
(The PLANET Collaboration)A. Gould14, D.L. DePoy14, A. Gal-Yam25, B.S. Gaudi14, C. Han26, Y. Lipkin27, D. Maoz28, E.O. Ofek29,
B.-G. Park30, R.W. Pogge14, J. McCormick31,(The µFUN Collaboration)
A. Udalski32, M.K. Szymanski32, M. Kubiak32, G. Pietrzynski32,33, I. Soszynski32, O. Szewczyk32, andŁ. Wyrzykowski32,34
(The OGLE Collaboration)
(Affiliations can be found after the references)
Received / Accepted
ABSTRACT
Aims. We present a detailed analysis of OGLE 2004-BLG-482, a relatively high-magnification single-lens microlensing event which exhibitsclear extended-source effects. These events are relatively rare, but they potentially contain unique information on the stellar atmosphereproperties of their source star, as shown in this study.Methods. Our dense photometric coverage of the overall light curve and a proper microlensing modelling allow us to derive measurements ofthe OGLE 2004-BLG-482 source star’s linear limb-darkening coefficients in three bands, including standard Johnson-Cousins I and R, as wellas in a broad clear filter. In particular, we discuss in detail the problems of multi-band and multi-site modelling on the expected precision ofour results. We also obtained high-resolution UVES spectra as part of a ToO programme at ESO VLT from which we derive the source star’sprecise fundamental parameters.Results. From the high-resolution UVES spectra, we find that OGLE 2004-BLG-482’s source star is a red giant of MK type a bit later thanM3, with Teff = 3667±150 K, logg = 2.1±1.0 and an assumed solar metallicity. This is confirmed by an OGLE calibrated colour-magnitudediagram. We then obtain from a detailed microlensing modelling of the light curve linear limb-darkening coefficients that we compare tomodel-atmosphere predictions available in the literature, and find a very good agreement. In addition, we perform a similar analysis using analternative description of limb darkening based on a principal component analysis of ATLAS limb-darkening profiles, and also find a verygood agreement between measurements and model predictions.
Key words. techniques: gravitational microlensing – techniques: high resolution spectra – techniques: high angular resolution – stars: atmo-sphere models – stars: limb darkening – stars: individual: OGLE 2004-BLG-482
1. Introduction
Photometric and spectroscopic observations of stars yield theirspectral types and other information useful for studying theiratmospheres, but much of the information on the structure ofthe atmosphere and related physical processes is lost in the
? Partly based on observations made at ESO (073.D-0575A).?? Royal Society University Research Fellow
disk-integrated flux. Advanced models calculated for a broadrange of stellar types (e.g. MARCS, Gustafsson et al. (2008) ;ATLAS, Kurucz (1992) ; Plez et al. (1992)) describe the cor-responding physics at different optical depth, which can po-tentially result in observational signatures if the star’s diskis spatially resolved. In particular, this information is presentin the star’s limb-darkening profile, which is the variation ofintensity from the disk centre to the limb. Only a few ob-
arX
iv:0
912.
2312
v1 [
astr
o-ph
.SR
] 1
1 D
ec 2
009
2 M. Zub et al.: Limb-darkening measurements for a cool red giant
servational methods such as stellar interferometry, analysesof eclipsing binaries, transiting extrasolar planets and gravita-tional microlensing are able to constrain in suitable cases stel-lar limb-darkening. Every single measurement thus provides animportant opportunity for testing stellar atmosphere models.
A Galactic gravitational microlensing event (Paczynski1986) occurs when a foreground massive object passes in thevicinity of the line-of-sight to a background star, resulting in atransient brightening of the source star (called magnification,or amplification). Microlenses can spatially resolve a sourcestar thanks to caustic structures created by a lens. They areformed by a single point or by a set of closed curves, alongwhich the point-source magnification is formally infinite, witha steep increase in magnification in their vicinity. In practice,this increase is so steep that the characteristic length scale ofthe differential magnification effect is on the order of a fractionof the source star’s radius. Early works by e.g. Witt (1995) orLoeb & Sasselov (1995) have pointed out the sensitivity of mi-crolensing light curves to limb-darkening, with the aim to helpremove microlensing model degeneracies. The specific use ofmicrolensing as a tool to study stellar atmosphere was proposedlater (e.g. Valls-Gabaud 1995; Sasselov 1996; Hendry et al.1998; Gaudi & Gould 1999), in particular to probe Galacticbulge red giant atmospheres (Heyrovsky et al. 2000). In fact,for a given microlensing configuration, the spatial resolutionincreases with the source’s physical diameter, so that giant starsare primary targets.
Limb darkening measurements by microlensing were per-formed for a number of main-sequence and giant microlensedstars. Event MACHO 1998-SMC-1 (Albrow et al. 1999b;Afonso et al. 2000) allowed for the first time such a mea-surement for a metal-poor A6 dwarf located in the SmallMagellanic Cloud. Its stellar type was derived from a spec-troscopic and photometric analysis in five filters; the lens wasa binary star also located in the SMC. No real comparisonwith atmosphere models could be provided since very littledata existed for these metal-poor A stars. The first microlens-ing limb-darkening measurement for a solar-like star was re-ported by Abe et al. (2003): the source was identified as anF8-G2 main-sequence turn-off star, involved in the very high-magnification microlensing event MOA 2002-BLG-33 causedby a binary microlens. A good agreement with limb-darkeningcoefficient predictions was obtained in the I band. A limb-darkening measurement for the late G / early K sub-giant wasalso performed by Albrow et al. (2001) with the binary-lenscaustic-crossing event OGLE 1999-BLG-23. The stellar typeof the source star was identified by comparing its position ontwo colour-magnitude diagrams obtained from two differenttelescopes, and deriving the star’s effective temperature fromcolour calibration. Again, they found a good agreement withstellar models both for the I and R filters.
Most of the limb-darkening measurements, however, wereobtained on Galactic-bulge giant stars. The first case was re-ported by Alcock et al. (1997) for MACHO 95-30, which in-volved a very late M4 red giant source star (spectroscopic typ-ing). In this event theoretical limb-darkening coefficients wereonly used to improve the light-curve fit, but no limb-darkeningmeasurement has been performed. Heyrovsky (2003) later
argued that the intrinsic variability of the source star pre-cluded any useful limb-darkening analysis. Late M giants areof special interest because they give access to testing modelsat the lower end of the temperature range used to computemost of the synthetic model atmosphere grids. For the eventMACHO 1997-BLG-28, Albrow et al. (1999c) derived I and Vcoefficients for a K2 giant (typing from spectroscopic observa-tions) crossing a caustic cusp, and found a good agreement withstellar models predictions. However, in such a complex event,many side effects could have affected the light curve, whichsomehow decrease the strength of the conclusions. Such a re-mark holds as well for MACHO 1997-BLG-41 (Albrow et al.2000), which involved a late G5-8 giant crossing two disjointcaustics.
Microlensing event EROS BLG-2000-5 provided the firstvery good opportunity to test at high precision limb-darkeningof a K3 giant (typing based on both photometry and high res-olution spectroscopy) in five filters (Fields et al. 2003). Theyconcluded that their results in the V , I, and H filters were dis-crepant from atmosphere models, and furthermore argued thatthe discrepancy is unlikely to be due to microlensing light-curve modelling drawbacks, but could rather be explained byinadequate physics in the stellar models that may be not appli-cable for all surface gravities. A clear variation with time in theshape and equivalent width of the Hα line was also reportedfor the first time in this event (Afonso et al. 2001; Castro et al.2001). Limb-darkening was also detected in OGLE 2003-BLG-238 (Jiang et al. 2004) and OGLE 2004-BLG-262 (Yoo et al.2004), which involved early K1-2 giants, but no strong conclu-sions on limb darkening could be drawn from these events.
From the binary-lens event OGLE 2002-BLG-069 (Cassanet al. 2004; Kubas et al. 2005), it was possible to obtain not onlylimb-darkening measurements for a G5 bulge giant source starin the I and R bands, but also to test directly predictions fromPHOENIX stellar model atmospheres by comparing the changeof the Hα equivalent width during a caustic crossing (Cassanet al. 2004; Thurl et al. 2006) using high resolution UVES/VLTspectra. A discrepancy was found between model and observa-tions, which is most probably explained by the lack of a properchromosphere implementation in the used stellar models. Morerecently, Cassan et al. (2006) performed limb-darkening mea-surements for the K3 giant source of OGLE 2004-BLG-254,and furthermore discussed an apparent systematic discrepancybetween stellar model predictions and measurements whichis observed for G-K bulge giants. However, in the case ofOGLE 2004-BLG-254, it appeared that fitting all data sets to-gether or only a subset of them had an influence on the limb-darkening measurements (Heyrovsky 2008), which remove theobserved discrepancy. In order to quantify this effect, we pro-vide in this paper a detailed study on the impact of includingdata sets on the resulting limb-darkening measurements.
In this work, we model and analyse OGLE 2004-BLG-482,a relatively high-magnification single-lens microlensing eventwhich exhibits clear extended-source effects. The source starfundamental parameters and spectral typing were derived froma high-resolution spectrum obtained on VLT/UVES as part of aToO programme. A good multi-site and multi-band coverage of
M. Zub et al.: Limb-darkening measurements for a cool red giant 3
the light curve allows us to extract linear limb-darkening coef-ficients, which we compare to model-atmosphere predictions.
The paper is organised as follows: in Sec. 2 we present theOGLE 2004-BLG-482 event, our photometric data and our datareduction procedures. We perform a detailed modelling of thelight curve in Sec. 3. The fundamental properties of the targetsource star are derived in Sec. 4. Sec. 5 is dedicated to a detailedanalysis of the measured linear limb-darkening coefficients andtheir comparison with model-atmosphere predictions. Finallyin Sec. 6, we perform a similar analysis using an alternativedescription of limb-darkening based on a principal componentanalysis of a set of ATLAS limb-darkening profiles.
2. Photometric data
2.1. Event alert and follow-up observations
The Galactic microlensing event OGLE 2004-BLG-482(α = 17h57m30.6s, δ = −30◦51′30.′′1 (J2000.0), or l =−0.3392◦, b =−3.1968◦) was discovered and publicly alertedon August 8, 2004 (MHJD1' 3226) by the OGLE-III2 EarlyWarning System (“EWS”, Udalski 2003) on the basis of ob-servations carried out in the I band with the 1.3 m WarsawTelescope at Las Campanas Observatory (Chile).
Table 1. Final selection of data sets, with the raw numberof observational data (frames) and our final selection after thecleaning process. The last column lists the adopted error-barrescaling factors.
Telescope Filter Data (Frames) kσ
UTas (PLANET) I 86 (128) 2.4Perth (PLANET) I 13 (15) 3.8OGLE I 44 (68) 2.4CTIO-Yale (µFUN) I 233 (285) 4.2Danish (PLANET) R 51 (67) 3.2Auckland (µFUN) (clear) 266 (334) 2.4All data − 693 (897) −
Following this alert, the PLANET collaboration (ProbingLensing ANomalies NETwork) started its photometric follow-up observations on August 10 (MHJD ' 3228), using a net-work of ground-based telescopes, including the Danish 1.54m(La Silla, Chile), Canopus 1m (Hobart, Tasmania), andPerth/Lowell 0.6m (Bickley, Western Australia) telescopes.Data sets and quasi real-time fitted light curves were madepublicly available online3, as part of a general data sharingpolicy. The event was also monitored by the µFUN collabo-ration4, which gathered data from six telescopes: the 1.3m andYale 1.0m (Cerro Tololo Inter-American Observatory, Chile),the Palomar 1.5m telescope (Palomar Observatory, USA),Wise 1m (Mitzpe Ramon, Israel), and two New Zealand am-ateur telescopes at Auckland (0.35m) and Farm Cove (0.25m).
1 Modified Heliocentric Julian Date: MHJD = HJD−2,450,0002 http://ogle.astrouw.edu.pl3 http://planet.iap.fr4 http://www.astronomy.ohio-state.edu/∼microfun
On August 15 (MHJD' 3233), photometric data indicateda deviation from a normal point-source point-lens light curve.A public alert was issued on August 16, 16:05 UT, pointing to-ward a high peak magnification event, possibly featuring strongextended-source size effects. In the following hours, on August17, a Target of Opportunity was activated on the UVES spectro-graph at ESO VLT in order to monitor the event peak magnifi-cation region where spectroscopic effects are expected. Thanksto an almost real-time modelling operated in parallel, the cross-ing time of the source disk by the lens was estimated to bearound 2.4 days. The peak of the light curve was reached onAugust 18, 18:32 UT at almost three magnitudes above thebaseline, corresponding to a minimum (i.e. with null blending)peak magnification of A∼ 15.
2.2. Data reduction and error bars
OGLE data were reduced with their own pipeline, whilePLANET and µFUN data were reduced with various versionsof the PLANET pipeline (pySIS; Albrow et al. 2009). All thesereductions are based on the image subtraction method (Alard& Lupton 1998; Bramich 2008). A preliminary image-qualityinspection helped to remove images showing a significant gra-dient across the field, due to strong background moonlight.Under-exposed images were also removed in this process. Wepaid particular attention to the quality of data taken at La Sillaat the time of peak magnification, because of unfavourableweather conditions at that site. We could however keep a fewtrusted data points.
After the data reduction process, we set for each PLANETand µFUN telescope a range of seeing and background withinwhich the homogeneity of the data sets is ensured. For the Yaletelescope, we excluded data with seeing outside the range 1.8–3.2”. In the case of UTas data, we have applied an upper limiton the seeing of 3.0”, and for the Perth, Danish and Aucklandtelescopes, 3.3”. Our final data set is presented in Table 1 anddisplayed in Fig. 1.
It is known that error bars we obtain from the data reduc-tion are usually underestimated, and are not homogeneous fromone data set to another. To avoid this problem, we rescale theerror bars, so that from the best model one has χ2/N ' 1 foreach data set fitted alone, with N the corresponding number ofdata points. Moreover, it happens that some of the original er-ror bars σ are unrealistically small ; to prevent this, we add inquadrature an additional term to the rescaled error bars, so thatσ′2 = (kσ σ)2 +(4× 10⁻⁴)2 magnitudes. The values of kσ aregiven in Table 1.
3. Light-curve modelling
3.1. Linear limb-darkening formalism
Limb-darkening profiles of stars can be described analyticallyat different levels of approximation, in particular by a sum con-taining powers of µ = cosα, where α is the angle of a givenemerging light ray with respect to the normal of the stellar sur-face (e.g. Claret 2000). In the first degree of approximation,
4 M. Zub et al.: Limb-darkening measurements for a cool red giant
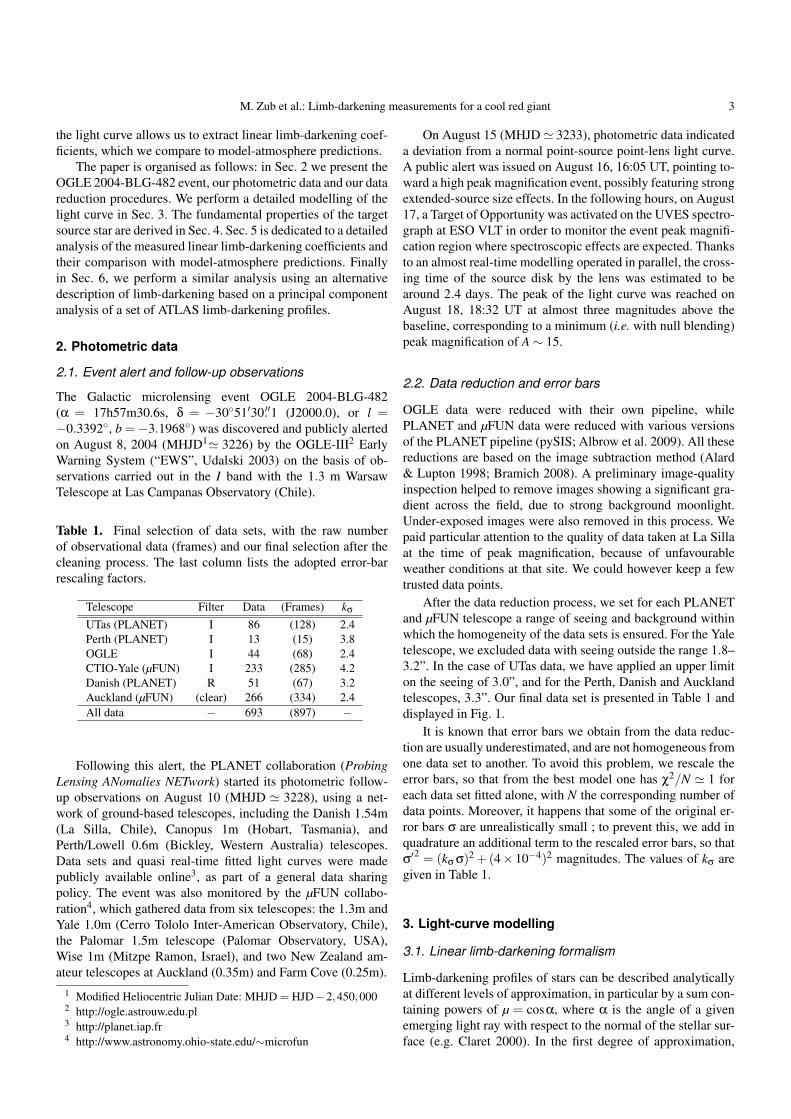
Fig. 1. Light curve of OGLE 2004-BLG-482, with data from PLANET (Danish, UTas and Perth), OGLE and µFUN (CTIO-Yale and Auckland) collaborations. The two gray solid lines in the upper panel draw the best-fit model for the I and R filterswith linear limb-darkening parameters given in Table 2. The two dotted curves correspond respectively to the two extreme cases,Γ = 0 (uniformly bright source, lower dotted curve) and Γ = 1 (upper dotted curve). The two pairs of vertical dashed lines markedu = ρ∗ and u = 0.5ρ∗ indicate when the lens is located at the limb of the source and half way from its centre to the limb. All thecurves intersect at u = 0.77ρ∗, also marked by a vertical dashed line. The fit residuals in magnitudes are displayed in the lowerpanel.
called the linear limb-darkening (hereafter, LLD) law, the starbrightness profile can be written as
I(r) = 1−a(
1−√
1− r2)
, (1)
where r =√
1−µ2 is the fractional radius on the stellardisk from where the light is emitted, and a is the linearlimb-darkening coefficient (hereafter LLDC). In this work, wewill concentrate on measuring LLDCs. Firstly, because in mi-crolensing events higher order coefficients have a very smallimpact (e.g. Dominik (2004) finds that for a caustic crossing,the effect of the change of the LLDC on light curve is ∼ 25times greater than the square-root coefficient). Secondly, be-cause there exists a strong correlation between the coefficients,so it is not possible to precisely measure the LLDC when a fur-ther coefficient is taken into account (Kubas et al. 2005). Lastly,because LLDC are widely used and are available in catalogues; it is an important aspect for our goal to compare our resultswith the existing literature.
For our modelling purpose, a more convenient way torewrite the LLD law is to have a formula which conserves thetotal source flux for all LLDC values. With this requirement,the LLD law equivalent to Eq. (1) (Albrow et al. 1999a) butnormalised to unit flux can be written as
I(r) =1π
[1−Γ
(1− 3
2
√1− r2
)], (2)
where Γ is the LLDC modelling parameter, with
a =3Γ
2+Γ. (3)
With this formalism, it is interesting to notice that all limb-darkening profiles intersect at a common fractional radius(Heyrovsky 2003), rlld =
√5/3' 0.75.
3.2. Single-lens, extended-source models
In its motion relative to the lens, the source centre approachesthe lens at a minimal distance u0 in units of the angular Einstein
ring radius θE =√
4GMc−2 (D−1L −D−1
S ) (Einstein 1936,withDS, DL the distances from the source and the lens to the ob-server, M the lens mass), which can be smaller than the sourceradius ρ∗ expressed in the same units. Since high magnifica-tion events involve small values of impact parameter u0, theyare likely to be affected by extended-source effects in particularif the source star is a giant. Although this happens rather rarelyin practice (a couple of cases amongst the ∼ 700 microlensingevents observed every year), this is the case for OGLE 2004-BLG-482.

M. Zub et al.: Limb-darkening measurements for a cool red giant 5
The point-source magnification at the exact location of thelens is formally infinite, following the well-known formula(Paczynski 1986)
Apspl(u) =u2 +2
u√
u2 +4, (4)
where u is the distance from the lens to a given point on thesource in units of θE. Consequently, the flux originating fromregions of the source in the immediate neighbourhood of thelens (typically a fraction of the source radius) is preferentiallyamplified. The relative motion of the source and lens then re-sults in a time-dependent probing of the stellar atmosphere atdifferent fractional radius, corresponding to different opticaldepths.
Single-lens light curves affected by extended-source effectsdisplay a characteristic flattening at their peak. In the case of auniformly bright extended source, Witt & Mao (1994) derivedan exact analytic formula for the magnification which involveselliptic integrals. But there is no similar formula to describelimb-darkened sources, and calculating the exact magnificationrequires numerical integration. One way is to decompose thesource into small rings of uniform intensity. Another approachby Heyrovsky (2003) is to perform the angular integration overthe stellar disk analytically and only the radial integration nu-merically, for arbitrary sources.
If some conditions are fulfilled, it is also possible to useapproximate formulae, which have the advantage to allow veryfast computation. Considering that in Eq. (4), Apspl ' 1/u whenu� 1, Yoo et al. (2004) find that the magnification Alld foran extended source with a linear limb-darkening profile withcoefficient Γ can be expressed as
Alld (u,ρ∗) = [B0 (z)−ΓB1 (z)] Apspl (u) ,
z = u/ρ∗ ,
B0 (z) =4zπ
E[
arcsinmin(
1,1z
),z]
, (5)
B1 (z) = B0 (z)− 3zπ
πZ0
1Z0
r√
1− r2√r2 + z2−2zr cosφ
r. .φ ,
where E is the incomplete elliptic integral of the second kindfollowing the notation of Gradshteyn & Ryzhik (1965). The in-tegral B1 can be efficiently evaluated and tabulated for z, so canB0. This approximation is valid as far as ρ2
∗/8� 1 and u0� 1.Since these relations hold for OGLE 2004-BLG-482 (althoughclose to the limit case of application, since the maximum errorfor a uniform source here is of the order of 0.2%, but still ismuch lower than the photometric errors), we choose this for-malism.
The complete model then involves four parameters: thesource radius ρ∗, as well as u0, t0 and tE, which define therectilinear motion of the source with respect to the lens, sothat the lens-source separation u satisfies u2(t) = u2
0 + (t −t0)2/t2
E. Moreover, one has to take into account for each tele-scope “i” two more parameters, the baseline magnitude Mi
b =−2.5 log(F i
S + F iB) and the blending factor gi = F i
B/F iS. Here,
F iS and F i
B are respectively the source and the blend flux, the
latter referring to any un-magnified flux entering the photo-metric aperture, from the lens itself and e.g. background stars.They are related to the time-dependent magnification Alld byF i(t) = Alld(t)F i
S +F iB.
3.3. Fitting procedure
To fit our data sets, we use two minimisation schemes: Powell’smethod and a Markov-Chain Monte-Carlo algorithm, fromwhich we also obtain the model parameter error bars (Kainset al. 2009). As stated before, it is not possible to define aproper number of degrees of freedom. In fact, the parametersu0, t0, tE and ρ∗ are common to all data sets, whereas Mi
b and gi
are associated to the data set “i”, and the LLDCs may be chosento be common per observing filter or per individual telescope.This explains the choice of N instead of d.o.f to rescale theerror bars in Sec. 2.2. The first requirement to get precise mea-surements of limb-darkening coefficients is to get an overallwell-covered light curve. This allows us to secure good mea-surements of the basic parameters u0, t0, tE and ρ∗, as wellas Mi
b and gi. The region of the light curve with a notewor-thy sensitivity to limb-darkening is, however, mainly limited towhen the lens is inside the source-star disk, and drops to a fewpercent outside (Heyrovsky et al. 2000). We now discuss thisaspect further.
While all limb-darkening profiles intersect at the same frac-tional radius rlld ' 0.75 as seen in Sec. 3.1, the correspond-ing magnification light curves intersect at around ulld ' 0.77ρ∗(with u the lens-source centre distance). This special point ismarked by a vertical dashed line in Fig. 1, in which we alsohave indicated two other interesting positions of the lens: atthe limb of the source (u = ρ∗) and at half-way from its centreto its limb (u = 0.5ρ∗). The two dotted magnification curvesof the figure show the two extreme cases of LLDC, Γ = 0 (nolimb-darkening) and Γ = 1. From this we can distinguish threemain regions: 0 < u/ρ∗ < 0.5, where the limb-darkening sen-sitivity is high, up to ∼ 16% ; 0.5 < u/ρ∗ < 0.77, where thesensitivity decreases outward to 0, and 0.77 < u/ρ∗ < 1 wherethe sensitivity increases outward and peaks at the limb at ∼8% (Heyrovsky 2003). Based on this argument and from ourdata coverage of OGLE 2004-BLG-482 shown in Fig. 1, it isthen clear that we can expect LLDC measurements from UTasI-band, Danish R-band and Auckland’s clear-filter.
The best-fit parameters and their error bars are given inTable 2, for different combinations of data sets. We commenton the results in detail in Sec. 5 and 6. Fig. 1 is plotted for thecombined fit including all telescopes and using one coefficientper band.
3.4. Estimates of the lens properties
Although the properties of the lens are not of the primary inter-est in this work, we can still provide an estimate of its mass anddistance. However, these quantities cannot be measured here,because an additional observable, such as parallax, is neededto remove a degeneracy between these two parameters. Here,
6 M. Zub et al.: Limb-darkening measurements for a cool red giant
parallax effects are not visible because the time scale of theevent is very short, tE ' 10 days� 1 year.
From our modelling and our estimation of the source ra-dius and distance (see Sec. 4.1), we derive the Einstein radiusto be around θE = θ∗/ρ∗ ' 0.4 mas, which leads to a relativeproper motion of µ = θE/tE ' 16 mas/yr. This high proper mo-tion almost certainly means that the lens is located in the disk(or possibly in the halo). Moreover, with such a high motion,there is a good chance that the lens can be clearly visible (awayfrom the source) in a few years by adaptive optics observations.
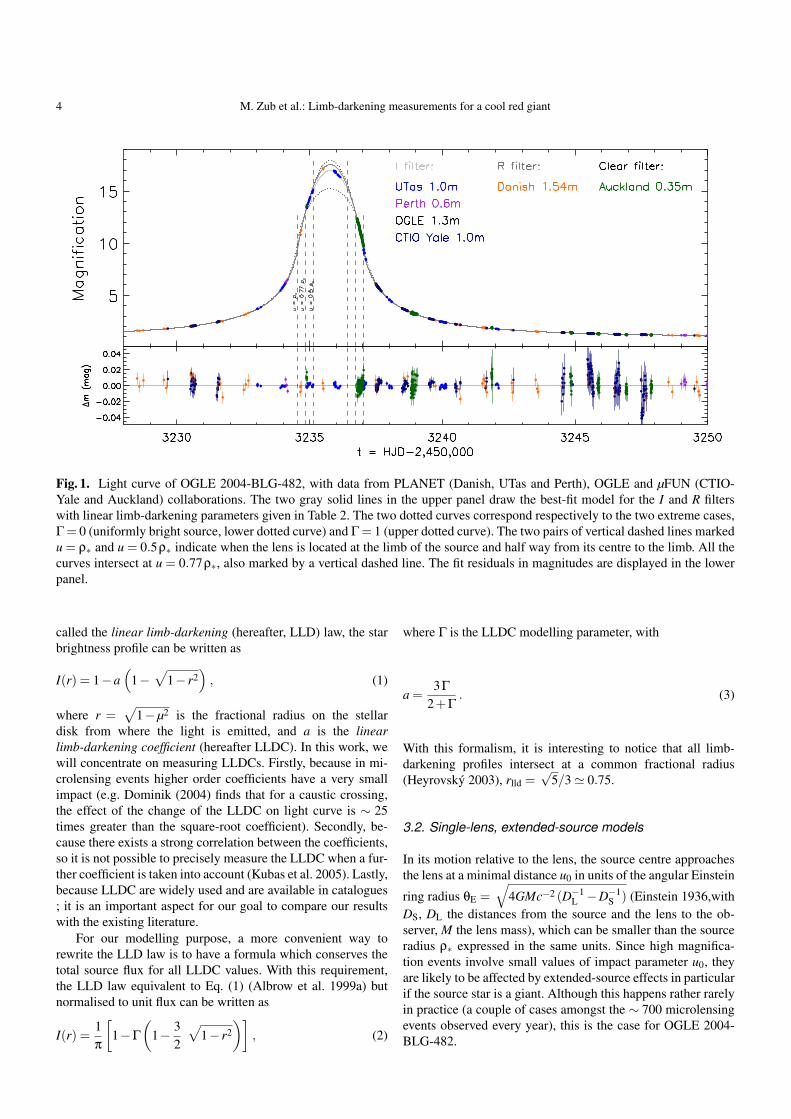
Fig. 2. OGLE-III BLG182.8 field calibrated I vs. (V − I)colour-magnitude diagram, comprising stars within a radius of2.16′ centred on our target OGLE 2004–BLG–482 (red opentriangle). The red circle indicates the mean position of theRCG centre, and the cross the width of the two-dimensionalGaussian distribution.
4. Source star properties
4.1. OGLE calibrated colour-magnitude diagram
The microlensing event OGLE 2004-BLG-482 took place inOGLE-III BLG182.8 field, which was also observed during thesecond phase of OGLE (field BUL SC23) and which photom-etry is calibrated in I and V filters. From this field, we extractan I vs. (V − I) colour-magnitude diagram (CMD) by select-ing stars surrounding our target within a circle of radius 2.16′
(∼ 9000 stars), as shown in Fig. 2. This choice ensures thatwe have enough stars to construct the CMD while keeping areasonably homogeneous extinction across the selected region.
Our target is indicated as the red open triangle and has acalibrated magnitude and colour of I = 14.41±0.03 and (V −I) = 3.93± 0.04. From the analysis of the OGLE images, weconclude that the target is not blended by a neighbouring star inI, which is confirmed by a model blending ratio close to zero.Moreover, since the object is already very red, it is unlikely tobe strongly blended in V as well. We therefore assume in thefollowing no blending, which means the magnitude and colour
of the target correspond to those of the source star. We use theratio of the total to selective extinction RI = 1.01± 0.02 fromSumi (2004) as well as E(V − I) = 1.41±0.01 at the locationof our target (BUL SC23) to get the total extinction AI = RI×E(V − I) = 1.42±0.03, from which we derive the dereddenedmagnitudes and colour of our target, I0 = 13.0± 0.05, V0 =15.52±0.04 and (V − I)0 = 2.53±0.04.
The Red Clump Giant (RCG) centre is marked in Fig. 2 asa red circle with error bars. To determine its mean magnitudeand colour, we fit a two-dimensional Gaussian around its posi-tion (∼ 400 stars), from which we derive IRCG = 15.88±0.01and (V − I)RCG = 2.263± 0.004. Since its absolute magni-tude and intrinsic colour only weakly depend on the star’s ageand chemical composition, it can be used as distance indica-tor (Paczynski & Stanek 1998). Adopting Stanek & Garnavich(1998)’s mean absolute magnitude MI,RCG = −0.23± 0.03based on Hipparcos data, recently confirmed by Groenewegen(2008) with MI,RCG =−0.22±0.03, and intrinsic colour (V −I)0,RCG = 1.01± 0.08 from Paczynski & Stanek (1998), wefind a mean RCG distance of dRCG = 8.6± 0.2kpc. This isnot in disagreement with a mean red clump giant located atthe Galactic centre, for which the distance is found to bedGC = 7.6± 0.3 kpc according to Eisenhauer et al. (2005) or7.9± 0.7 kpc according to Groenewegen et al. (2008). We ac-tually expect dRCG to be slightly larger than dGC in this field,due to the Galactic bar geometry and the negative longitude ofOGLE 2004-BLG-482. Nevertheless, it is likely that the differ-ence we find is mainly due to an uncertainty in the absorptionAI we are using, since there are still many unknowns related tothis topic. In the following, we adopt a source star distance ofd = 8±1 kpc, assuming the same extinction towards the targetas for the RCG.
We fit calibrated isochrones from Bonatto et al. (2004) to2MASS data, from which we derive the near-infrared extinc-tions AJ = 0.52± 0.10, AH = 0.36± 0.11 and AKs = 0.20±0.02. From this and the absorption corresponding to our tar-get in the database (2MASS 17573061-3051305), we get J0 =11.55± 0.10, H0 = 10.68± 0.11 and Ks,0 = 10.42± 0.04, aswell as the corresponding colours (J−H)0 = 0.87±0.16, (H−Ks)0 = 0.26±0.12 and (J−Ks)0 = 1.13±0.11. This allows usto estimate the source radius using the surface brightness rela-tion: logθ∗+V0/5 = (0.24±0.01)× (V −K)0 +(0.61±0.03)from Groenewegen (2004) and which is valid only for M gi-ants, where θ∗ is the source angular diameter in mas and(V −K)0 = V0− (K−AK) = 5.10± 0.06 (assuming K ' Ks).We find an angular diameter of θ∗ = 51.8± 8.2µas, and withthe adopted source distance of d = 8±1 kpc we find a physicalsource radius of R∗ = 45±9R�.
From a pure photometric point of view, (V − I)0 and near-infrared colours point toward an M4 III according to Bessell& Brett (1988), and to an M5.5 III according to Houdasheltet al. (2000). Such discrepancies between authors on spectraltyping based on photometric measurements is already known.In the next section, we perform the analysis of the VLT/UVEShigh resolution spectra we obtained on this event, in order toderive more accurately the spectral type and to determine thefundamental parameters of the source star.
M. Zub et al.: Limb-darkening measurements for a cool red giant 7
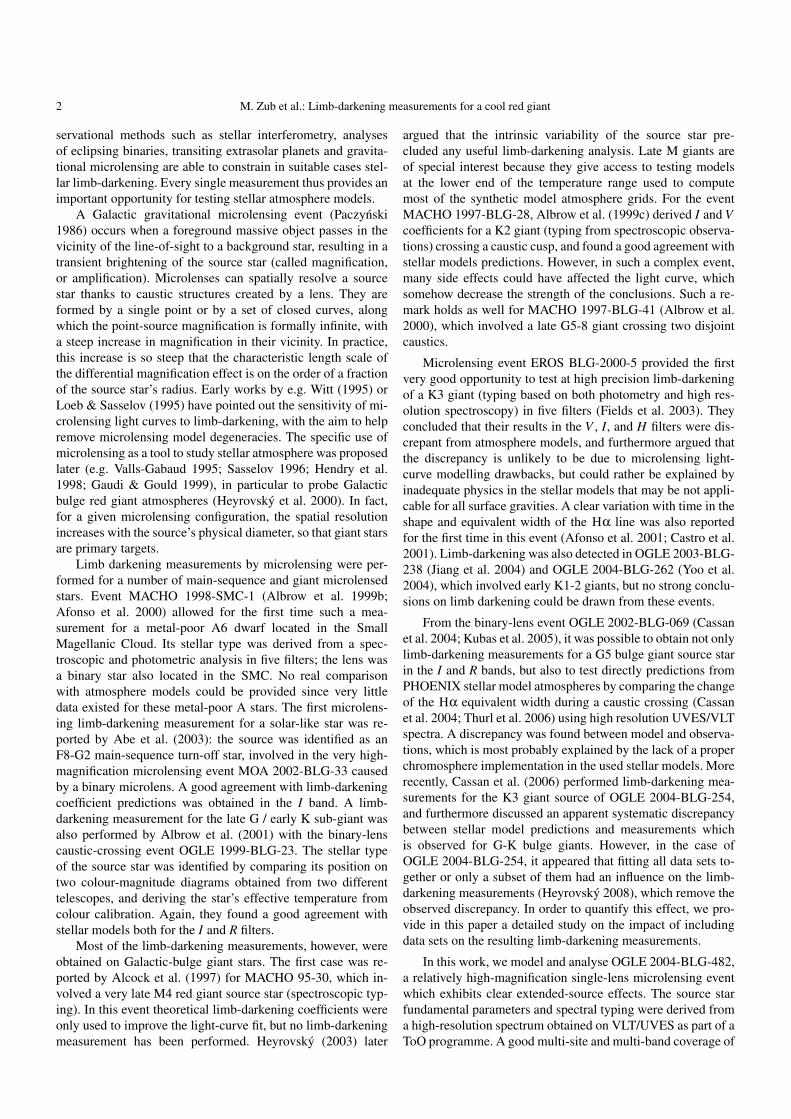
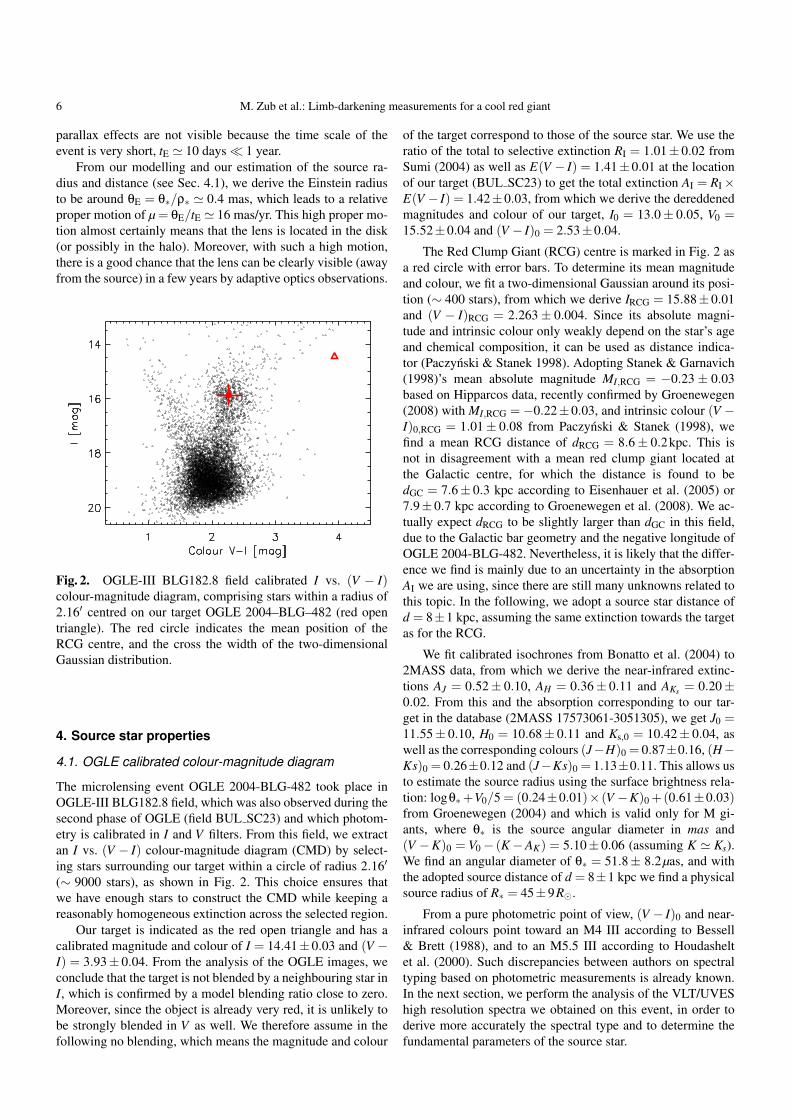
Fig. 3. The observed (black line) and best-fit (blue) template spectrum of OGLE 2004-BLG-482. The region around the TiO7100 shows the agreement of the observed and synthetic spectra. The two orange curves are plotted at ±100 K. The regionsexcluded from the fitting process are shaded in light-grey, while the remainder of the spectrum is shaded in dark grey.
4.2. VLT/UVES spectroscopy
We have obtained for OGLE 2004-BLG-482 high resolutionspectra (R∼ 40000) on VLT/UVES, as part of a ToO activatedshortly after the peak of the light curve was passed. The datawere reduced in a standard way using version 2.1 of the UVEScontext of the MIDAS data reduction software.
The spectrum is dominated by broad absorption bandsfrom molecules. The shape and depth of molecular absorptionbands, particularly TiO, are very sensitive to the stellar effec-tive temperature Teff, and to a lesser degree also to the sur-face gravity logg. We estimated the atmospheric parametersof OGLE 2004-BLG-482 by comparing the observed spectrumwith a grid of pre-calculated synthetic template spectra.
The grid of synthetic template spectra, calculated by Plez(priv. comm.), is based on synthetic spectra calculated fromMARCS spherical model atmospheres with 1D emergent spec-tra and LTE radiative transfer (Gustafsson et al. 2008, 2003,1975; Plez et al. 2003, 1992), and includes the latest availableatomic and molecular line data (Gustafsson et al. 2008; Kupkaet al. 1999; Plez 1998). Synthetic template spectra for M giantscalculated with the MARCS model atmospheres have a good
record for determining stellar parameters in M supergiants (e.g.Levesque et al. 2005, 2007; Massey et al. 2008) and were ex-tensively used to calibrate M giant photometry (Bessell et al.1998).
The grid used in our analysis covers an effective tempera-ture range of 3000K < Teff < 4000K, with steps of 100 K, anda surface gravity range of 0.0 < logg < 3.0, with steps of 0.5.This grid was calculated for giants with solar abundances andno carbon enrichment. Since our grid does not cover a rangeof metallicities, we therefore have no leverage on this parame-ter. We also prepared routines to calculate linear interpolationsbetween the spectra in our grid for any given value of Teff andlogg.
We then compared the observed spectrum of OGLE 2004-BLG-482 with template spectra across the available range ofTeff and logg and determined the goodness-of-fit using the χ2
diagnostic. In calculating χ2, we used the entire observed spec-trum, from approximately 4800 to 10000A, only excludingthree regions that are strongly affected by telluric absorption(7580–7850, 9070–9120A and 9300-9800A). However, sinceno continuum is present in our spectrum, and we also do not

8 M. Zub et al.: Limb-darkening measurements for a cool red giant
know the absolute stellar flux, we renormalised the syntheticspectrum using a one-dimensional polynomial function prior tocalculating χ2. This renormalisation does not affect the shapeof the broad molecular bands that are important for determiningTeff and logg.
We refined the best values of Teff and logg using parabolicminimisation between the grid points that yielded the lowestvalue of the χ2 diagnostic. In Fig. 3 we illustrate the agree-ment between the observed and best-fit template spectrum, in-cluding estimated parameter uncertainties, around the highlytemperature-sensitive TiO band near 7100A. We find that theparameters that best fit our observed spectrum are Teff = 3667±150K and logg = 2.1± 1.0, assuming solar abundances. Thequoted error bars are dominated by systematic uncertainties inthe synthetic spectra and data reduction procedures used, suchas flux calibration. Our uncertainties are further increased dueto the fact that our grid of template spectra was calculated foronly one metallicity. The range of effective temperatures wefind is compatible with a star of MK spectral type betweenM1 and M5, with the best-fit value giving a red giant star a bitlater than M3 (Houdashelt et al. 2000; Strassmeier & Schordan2000).
The large error bar on the surface gravity confirms thatour spectrum has little to offer in gravity-sensitive diagnos-tics. However, we can obtain independent constraints on logg:given that the mass of an M giant of 1 or 10 Gyr is smaller than2.3 and 1M� respectively, using logg = logg�+ logM− 2×logR∗, we find the corresponding upper limits of the surfacegravity: logg = 1.5± 0.2 and logg = 1.1± 0.2 respectively,taking into account the uncertainty of the source radius. This isin agreement with our spectroscopic analysis, although favour-ing the lower boundary.
4.3. Conclusion on the source MK type and parameters
We finally find a good agreement between our photometric andspectroscopic study, with a source star of MK spectral typea bit later than M3. We therefore adopt the fundamental pa-rameters from the spectroscopic analysis (Teff = 3667±150K,logg = 2.1± 1.0, solar metallicity) to make our selection ofatmosphere models used to compare our limb-darkening mea-surements to model predictions, as discussed in the next sec-tion.
5. Linear limb-darkening discussion
As discussed in Sec. 3.3, three data sets have some sensitivity tolimb-darkening: UTas (I-band), Danish (R-band) and Auckland(clear filter). The first question we address now is how the indi-vidual linear limb-darkening coefficients (LLDC) are affectedby including or removing some of our data sets. In fact, our firststep was to model every data set independently, and step bystep to include other telescopes. We first noticed that there wasa change in the LLDC values which depends on the added datasets. We thus performed a detailed analysis to understand whatcould cause such variations, and to identify combinations ofdata sets which lead to correct LLD measurements. The resultswe are commenting are presented in Fig. 4: the three columns
correspond to UTas, Danish and Auckland, respectively, andthe individual panels display the LLDC measurements for var-ious combinations of data sets; the corresponding model pa-rameters are given in Table 2. In the figure and table, the lettersA, C, D, O, P, U refer respectively to the telescopes Auckland,CTIO Yale, Danish, OGLE, Perth and UTas.
UTas (U) clearly provides the best data set for LLDC mea-surements, since the data sample the whole LLD-sensitive re-gion at the peak of the light curve, as well as its wings andbaseline. On the other hand, modelling Danish (D) alone pro-vides a very unrealistic fit, with large error bars and very ir-regular MCMC correlations. To explain this, we recall that asmentioned in Sec. 2.2, the peak of the light curve was observedunder bad weather conditions in La Silla, in particular the twoconsecutive data points around t = 3235.5. Moreover, the datacoverage is not optimal since there are only two epochs whichcover the LLD-sensitive part of the light curve. As a result,this poor coverage combined with some uncertainty in the datalead to a model which apparently looks better in terms of chi-squared, but cannot be trusted. The last telescope with data sen-sitive to limb darkening is Auckland (A). We can fit the corre-sponding data alone and obtain a reasonable fit, but we obtainlarge error bars because the photometric accuracy of the datais a few times lower than for UTas, and furthermore, the datataken during the source crossing are all located close to thelimb, in the region of less sensitivity to limb darkening. Wenote that the LLDC we obtain is higher than UTas’s, which isexpected, since Auckland’s clear filter is known to peak be-tween red and infrared and LLDCs usually decrease toward theinfrared.
Starting from these models, we include different combina-tions of other data sets. If we base our analysis on the LLDCmeasurement from our best data set, UTas, then we find twodistinct behaviours: either the UTas’s LLDC is not displacedfrom the individual fit (a ' 0.67, e.g. U or U+D) or is slightlymodified (a ' 0.71, e.g. U+A or all telescopes). We note thatinterestingly, when combining U and D data, the fit is stabilisedfor D. This is explained by the fact the common fitting param-eters (u0, t0, tE,ρ∗) are better constrained. However, combiningA with U data modifies the LLDCs compared to A and U mod-elled alone. This is also true when combining U+D+A or alltelescopes. The fact that Auckland modifies UTas’s LLDC (ourbest-suited data set for LLDC measurements) when the twodata sets are combined, lead one to be careful about the in-terpretation of Auckland’s LLDC (besides the large error baron the LLDC).
From this, we conclude that a precise measuring of LLDCrequires a very careful study: first, one has to identify the datasets which can potentially provide a limb-darkening measure-ment with enough sensitivity, based on the light-curve sam-pling as discussed in Sec. 3.3. Then, one has to check whetherthe inclusion of additional data sets affects the results. In fact,as we have shown for this microlensing event, adding moredata sets to the light curve modelling can lead to two oppo-site effects: either the new data stabilise the fit and help obtainLLDCs for more data sets, or on the contrary perturb the LLDCmeasurements. The latter may happen if unknown systematiceffects are affecting the data. In the case of OGLE 2004-BLG-
M. Zub et al.: Limb-darkening measurements for a cool red giant 9
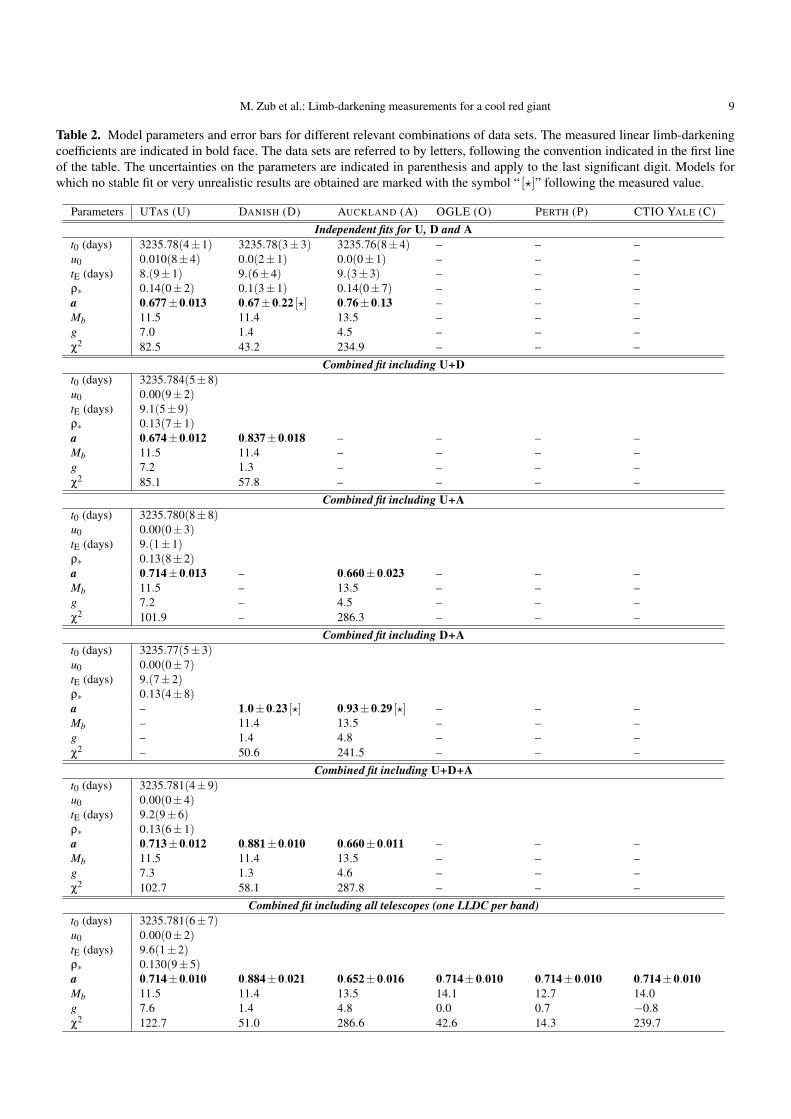
Table 2. Model parameters and error bars for different relevant combinations of data sets. The measured linear limb-darkeningcoefficients are indicated in bold face. The data sets are referred to by letters, following the convention indicated in the first lineof the table. The uncertainties on the parameters are indicated in parenthesis and apply to the last significant digit. Models forwhich no stable fit or very unrealistic results are obtained are marked with the symbol “ [?]” following the measured value.
Parameters UTAS (U) DANISH (D) AUCKLAND (A) OGLE (O) PERTH (P) CTIO YALE (C)Independent fits for U, D and A
t0 (days) 3235.78(4±1) 3235.78(3±3) 3235.76(8±4) – – –u0 0.010(8±4) 0.0(2±1) 0.0(0±1) – – –tE (days) 8.(9±1) 9.(6±4) 9.(3±3) – – –ρ∗ 0.14(0±2) 0.1(3±1) 0.14(0±7) – – –a 0.677±0.013 0.67±0.22 [?] 0.76±0.13 – – –Mb 11.5 11.4 13.5 – – –g 7.0 1.4 4.5 – – –χ2 82.5 43.2 234.9 – – –
Combined fit including U+Dt0 (days) 3235.784(5±8)u0 0.00(9±2)tE (days) 9.1(5±9)ρ∗ 0.13(7±1)a 0.674±0.012 0.837±0.018 – – – –Mb 11.5 11.4 – – – –g 7.2 1.3 – – – –χ2 85.1 57.8 – – – –
Combined fit including U+At0 (days) 3235.780(8±8)u0 0.00(0±3)tE (days) 9.(1±1)ρ∗ 0.13(8±2)a 0.714±0.013 – 0.660±0.023 – – –Mb 11.5 – 13.5 – – –g 7.2 – 4.5 – – –χ2 101.9 – 286.3 – – –
Combined fit including D+At0 (days) 3235.77(5±3)u0 0.00(0±7)tE (days) 9.(7±2)ρ∗ 0.13(4±8)a – 1.0±0.23 [?] 0.93±0.29 [?] – – –Mb – 11.4 13.5 – – –g – 1.4 4.8 – – –χ2 – 50.6 241.5 – – –
Combined fit including U+D+At0 (days) 3235.781(4±9)u0 0.00(0±4)tE (days) 9.2(9±6)ρ∗ 0.13(6±1)a 0.713±0.012 0.881±0.010 0.660±0.011 – – –Mb 11.5 11.4 13.5 – – –g 7.3 1.3 4.6 – – –χ2 102.7 58.1 287.8 – – –
Combined fit including all telescopes (one LLDC per band)t0 (days) 3235.781(6±7)u0 0.00(0±2)tE (days) 9.6(1±2)ρ∗ 0.130(9±5)a 0.714±0.010 0.884±0.021 0.652±0.016 0.714±0.010 0.714±0.010 0.714±0.010Mb 11.5 11.4 13.5 14.1 12.7 14.0g 7.6 1.4 4.8 0.0 0.7 −0.8χ2 122.7 51.0 286.6 42.6 14.3 239.7
10 M. Zub et al.: Limb-darkening measurements for a cool red giant
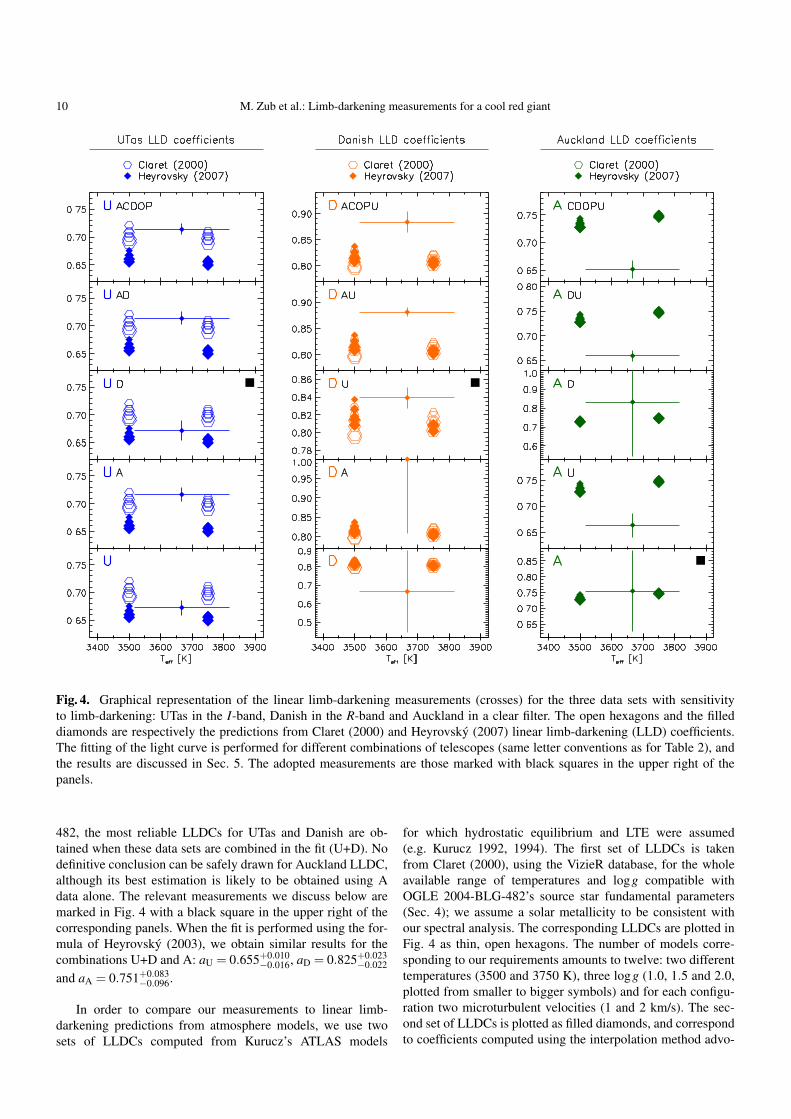
Fig. 4. Graphical representation of the linear limb-darkening measurements (crosses) for the three data sets with sensitivityto limb-darkening: UTas in the I-band, Danish in the R-band and Auckland in a clear filter. The open hexagons and the filleddiamonds are respectively the predictions from Claret (2000) and Heyrovsky (2007) linear limb-darkening (LLD) coefficients.The fitting of the light curve is performed for different combinations of telescopes (same letter conventions as for Table 2), andthe results are discussed in Sec. 5. The adopted measurements are those marked with black squares in the upper right of thepanels.
482, the most reliable LLDCs for UTas and Danish are ob-tained when these data sets are combined in the fit (U+D). Nodefinitive conclusion can be safely drawn for Auckland LLDC,although its best estimation is likely to be obtained using Adata alone. The relevant measurements we discuss below aremarked in Fig. 4 with a black square in the upper right of thecorresponding panels. When the fit is performed using the for-mula of Heyrovsky (2003), we obtain similar results for thecombinations U+D and A: aU = 0.655+0.010
−0.016, aD = 0.825+0.023−0.022
and aA = 0.751+0.083−0.096.
In order to compare our measurements to linear limb-darkening predictions from atmosphere models, we use twosets of LLDCs computed from Kurucz’s ATLAS models
for which hydrostatic equilibrium and LTE were assumed(e.g. Kurucz 1992, 1994). The first set of LLDCs is takenfrom Claret (2000), using the VizieR database, for the wholeavailable range of temperatures and logg compatible withOGLE 2004-BLG-482’s source star fundamental parameters(Sec. 4); we assume a solar metallicity to be consistent withour spectral analysis. The corresponding LLDCs are plotted inFig. 4 as thin, open hexagons. The number of models corre-sponding to our requirements amounts to twelve: two differenttemperatures (3500 and 3750 K), three logg (1.0, 1.5 and 2.0,plotted from smaller to bigger symbols) and for each configu-ration two microturbulent velocities (1 and 2 km/s). The sec-ond set of LLDCs is plotted as filled diamonds, and correspondto coefficients computed using the interpolation method advo-

M. Zub et al.: Limb-darkening measurements for a cool red giant 11
Fig. 5. PCA Limb-darkening (PCA LD) coefficients κ measured (crosses) and predicted (diamonds, Heyrovsky 2008) using the2-term PCA LD as explained in the text. Letters and colours have the same meaning as in Fig. 4.
cated by Heyrovsky (2007). These are computed for the samestellar parameters as previously.
As one can see, our LLDC measurements are in very goodagreement with the predictions from atmosphere models. ForUTas I, our measurement is compatible with both the predic-tions from Claret (2000) and Heyrovsky (2007). For the DanishR filter, the agreement is also very good, although our measure-ment is slightly larger than the prediction. For the Aucklandclear filter, only Heyrovsky (2007) predictions are available;but within the large error bars commented on previously, thedata are fairly compatible with the predictions.
6. PCA-based limb-darkening coefficients
Although stellar limb darkening is usually modelled by ana-lytical laws, another option is to construct new bases of func-tions directly from model-atmosphere limb-darkening profiles.In this section, we use a limb-darkening basis numerically con-structed by principal component analysis (PCA, and PCA LDin the following) for a set of given model atmosphere limb-darkening profiles, following Heyrovsky (2003).
In this approach, the stellar intensity profile is expressed as
I(r) = ∑i
αi fi(r) , (6)
in place of Eq. (1), where the fi(r) are the PCA basis functionsand αi the corresponding coefficients. For our analysis we useda very general PCA basis constructed from the BV RI profilesof the full Kurucz (1992) ATLAS model-atmosphere grid (seeHeyrovsky 2008 for details).
In the simplest case of a 2-term PCA LD law (the analogueof the analytical linear limb-darkening law, LLD), the relevantparameter which defines the shape of the star’s brightness pro-file is κ ≡ α2/α1. With our choice of PCA basis, all possibleprofiles are obtained by varying κ in the range [−0.162, 0.090],from the most peaked to the flattest limb-darkening profiles.
We perform the OGLE 2004-BLG-482 analysis using theHeyrovsky (2003) formalism, for different combinations ofdata sets in a similar way as in Sec. 5. The results are presentedin Fig. 5, for the combinations of data sets which were selectedin the previous section (Fig. 4 panels with a black square in theupper right).
As for the classical LLD law discussed in detail in the pre-vious section, we find a very good agreement between modelpredictions and our measurements. This shows that PCA LDprovides an interesting alternative to analytical models of stel-lar brightness profiles. For applications where LD is not fit-ted (e.g., Kubas et al. 2008), it can be interesting to use PCArather than LLD laws. On the other hand, the PCA LD law isalways dependent on the set of selected model atmospheres.This could lead to discrepancies for instance if the parame-ter grid is too narrow. In addition, any PCA LD law reflectsthe physics included in the construction of the particular atmo-sphere model (e.g., variants of ATLAS, MARCS, or PHOENIXmodels), which may not be ideally suited for the studied star.In either of these cases, however, if the observational data aregood enough, one may use the situation to one’s own bene-fit. By trying different PCA LD laws and checking the qualityof the fits and patterns in the residuals one can discriminatebetween different “candidate” model atmospheres. To summa-rize, in limb-darkening modelling LLD has the advantage ofsimplicity and analyticity, while PCA LD has the advantage ofproviding better accuracy and flexibility.
7. Conclusion
We have analysed OGLE 2004-BLG-482, a relatively high-magnification single-lens microlensing event with notableextended-source effects, which was densely covered by ourtelescope networks. It provided us with the rather rare opportu-nity to directly test model-atmosphere limb-darkening predic-tions for the source star. Such a comparison was made possi-ble because we could obtain high-resolution UVES spectra atVLT at a critical time thanks to the short activation of a ToOprogramme at VLT, from which we could precisely estimatethe star’s fundamental parameters. The source typing has beenconfirmed with good precision by our photometric diagnosticbased on a calibrated colour-magnitude diagram of the field.We have performed a very detailed modelling to evaluate theimpact of including data sets in the modelling process, and pro-vide new diagnostics for future work.
Very interestingly, the measured limb darkening agreesvery well with model-atmosphere predictions, both when con-sidering linear limb-darkening profiles, or an alternative limb-
12 M. Zub et al.: Limb-darkening measurements for a cool red giant
darkening description based on a principal component analysisof ATLAS stellar atmosphere models. From this study in whichthe precision has been pushed at a high level, we conclude thatthis late M giant does not suffer from any clear discrepancybetween limb-darkening model predictions and measurements,which has been pointed out for earlier K giants. Although it isbased on the observation of a single event, it is very likely thatthe conclusion can be extended to similar late M giants.
Acknowledgements. We express our gratitude to the ESO staff atParanal for reacting at short notice to our UVES ToO request.We thank David Warren for financial support for the Mt CanopusObservatory. The OGLE project is partially supported by the PolishMNiSW grant N20303032/4275. AC acknowledges travel support onthe French CNRS/ANR grant HOLMES. DH was supported by CzechScience Foundation grant GACR 205/07/0824 and by the CzechMinistry of Education project MSM0021620860. This publicationmakes use of data products from the 2MASS and DENIS projects,as well as the SIMBAD database, Aladin and VizieR catalogue op-eration tools (CDS Strasbourg, France). CH acknowledges the sup-port by Creative Research Initiative Program (2009-008561) of KoreaScience and Engineering Foundation. BGP acknowledges the supportby Korea Astronomy and Space Science Institute. We thank SuboDong for his comments on the analysis.
References
Abe, F., Bennett, D. P., Bond, I. A., et al. 2003, A&A, 411,L493
Afonso, C., Alard, C., Albert, J. N., et al. 2000, ApJ, 532, 340Afonso, C., Albert, J. N., Andersen, J., et al. 2001, A&A, 378,
1014Alard, C. & Lupton, R. H. 1998, ApJ, 503, 325Albrow, M. D., An, J., Beaulieu, J.-P., et al. 2001, ApJ, 549,
759Albrow, M. D., Beaulieu, J.-P., Caldwell, J. A. R., et al. 1999a,
ApJ, 522, 1022Albrow, M. D., Beaulieu, J.-P., Caldwell, J. A. R., et al. 1999b,
ApJ, 512, 672Albrow, M. D., Beaulieu, J.-P., Caldwell, J. A. R., et al. 2000,
ApJ, 534, 894Albrow, M. D., Beaulieu, J.-P., Caldwell, J. A. R., et al. 1999c,
ApJ, 522, 1011Albrow, M. D., Horne, K., Bramich, D. M., et al. 2009, ArXiv
e-printsAlcock, C., Allen, W. H., Allsman, R. A., et al. 1997, ApJ, 491,
436Bessell, M. S. & Brett, J. M. 1988, PASP, 100, 1134Bessell, M. S., Castelli, F., & Plez, B. 1998, A&A, 333, 231Bonatto, C., Bica, E., & Girardi, L. 2004, A&A, 415, 571Bramich, D. M. 2008, MNRAS, 386, L77Cassan, A., Beaulieu, J. P., Brillant, S., et al. 2004, A&A, 419,
L1Cassan, A., Beaulieu, J.-P., Fouque, P., et al. 2006, A&A, 460,
277Castro, S., Pogge, R. W., Rich, R. M., DePoy, D. L., & Gould,
A. 2001, ApJ, 548, L197Claret, A. 2000, A&A, 363, 1081Dominik, M. 2004, MNRAS, 352, 1315
Einstein, A. 1936, Science, 84, 506Eisenhauer, F., Genzel, R., Alexander, T., et al. 2005, ApJ, 628,
246Fields, D. L., Albrow, M. D., An, J., et al. 2003, ApJ, 596, 1305Gaudi, B. S. & Gould, A. 1999, ApJ, 513, 619Gradshteyn, I. S. & Ryzhik, I. M. 1965, Table of integrals, se-
ries and productsGroenewegen, M. A. T. 2004, MNRAS, 353, 903Groenewegen, M. A. T. 2008, A&A, 488, 935Groenewegen, M. A. T., Udalski, A., & Bono, G. 2008, A&A,
481, 441Gustafsson, B., Bell, R. A., Eriksson, K., & Nordlund, A. 1975,
A&A, 42, 407Gustafsson, B., Edvardsson, B., Eriksson, K., et al. 2008, A&A,
486, 951Gustafsson, B., Edvardsson, B., Eriksson, K., et al. 2003,
in Astronomical Society of the Pacific Conference Series,Vol. 288, Stellar Atmosphere Modeling, ed. I. Hubeny,D. Mihalas, & K. Werner, 331–350
Hendry, M. A., Coleman, I. J., Gray, N., Newsam, A. M., &Simmons, J. F. L. 1998, New Astronomy Review, 42, 125
Heyrovsky, D. 2003, ApJ, 594, 464Heyrovsky, D. 2007, ApJ, 656, 483Heyrovsky, D. 2008, in PoS: Manchester microlensing
conference, ed. E. Kerins, S. Mao, N. Rattenbury, &L. Wyrzykowski, 28
Heyrovsky, D., Sasselov, D., & Loeb, A. 2000, ApJ, 543, 406Houdashelt, M. L., Bell, R. A., Sweigart, A. V., & Wing, R. F.
2000, AJ, 119, 1424Jiang, G., DePoy, D. L., Gal-Yam, A., et al. 2004, ApJ, 617,
1307Kains, N., Cassan, A., Horne, K., et al. 2009, MNRAS, 395,
787Kubas, D., Cassan, A., Beaulieu, J. P., et al. 2005, A&A, 435,
941Kubas, D., Cassan, A., Dominik, M., et al. 2008, A&A, 483,
317Kupka, F., Piskunov, N., Ryabchikova, T. A., Stempels, H. C.,
& Weiss, W. W. 1999, A&AS, 138, 119Kurucz, R. 1994, Solar abundance model atmospheres for
0,1,2,4,8 km/s. Kurucz CD-ROM No. 19. Cambridge,Mass.: Smithsonian Astrophysical Observatory, 1994., 19
Kurucz, R. L. 1992, in IAU Symposium, Vol. 149, The StellarPopulations of Galaxies, ed. B. Barbuy & A. Renzini, 225–+
Levesque, E. M., Massey, P., Olsen, K. A. G., & Plez, B. 2007,ApJ, 667, 202
Levesque, E. M., Massey, P., Olsen, K. A. G., et al. 2005, ApJ,628, 973
Loeb, A. & Sasselov, D. 1995, ApJ, 449, L33+Massey, P., Levesque, E. M., Plez, B., & Olsen, K. A. G. 2008,
ArXiv e-prints, 801Paczynski, B. 1986, ApJ, 304, 1Paczynski, B. & Stanek, K. Z. 1998, ApJ, 494, L219+Plez, B. 1998, A&A, 337, 495Plez, B., Brett, J. M., & Nordlund, A. 1992, A&A, 256, 551Plez, B., van Eck, S., Jorissen, A., et al. 2003, in IAU
Symposium, Vol. 210, Modelling of Stellar Atmospheres,ed. N. Piskunov, W. W. Weiss, & D. F. Gray, 2P–+

M. Zub et al.: Limb-darkening measurements for a cool red giant 13
Sasselov, D. D. 1996, in Astronomical Society of the PacificConference Series, Vol. 109, Cool Stars, Stellar Systems, andthe Sun, ed. R. Pallavicini & A. K. Dupree, 541–+
Stanek, K. Z. & Garnavich, P. M. 1998, ApJ, 503, L131+Strassmeier, K. G. & Schordan, P. 2000, Astronomische
Nachrichten, 321, 277Sumi, T. 2004, MNRAS, 349, 193Thurl, C., Sackett, P. D., & Hauschildt, P. H. 2006, A&A, 455,
315Udalski, A. 2003, Acta Astronomica, 53, 291Valls-Gabaud, D. 1995, in Large Scale Structure in the
Universe, ed. J. P. Mucket, S. Gottloeber, & V. Muller, 326–336
Witt, H. J. 1995, ApJ, 449, 42Witt, H. J. & Mao, S. 1994, ApJ, 430, 505Yoo, J., DePoy, D. L., Gal-Yam, A., et al. 2004, ApJ, 603, 139
1 Astronomisches Rechen-Institut (ARI), Zentrum fur Astronomieder Universitat Heidelberg (ZAH), MonchhofStr. 12-14, 69120Heidelberg, Germany
2 International Max Planck Research School for Astronomy &Cosmic Physics at the University of Heidelberg
3 Institute of Astronomy, University of Zielona Gora, Lubuska st. 2,65-265 Zielona Gora, Poland
4 The PLANET Collaboration5 Institut d’Astrophysique de Paris, UMR 7095 CNRS – Universite
Pierre & Marie Curie, 98bis Bd Arago, 75014 Paris, France6 Institute of Theoretical Physics, Charles University, V
Holesovickach 2, 18000 Prague, Czech Republic7 LATT, Universite de Toulouse, CNRS, 31400 Toulouse, France8 Department of Physics and Astronomy, Box 516, SE-751 20,
Uppsala, Sweden9 University of Canterbury, Department of Physics & Astronomy,
Private Bag 4800, Christchurch, New Zealand10 European Southern Observatory (ESO), Casilla 19001, Vitacura
19, Santiago, Chile11 Auckland Observatory, P.O. Box 24-197, Auckland, New Zealand12 The µFUN Collaboration13 University of St Andrews, School of Physics & Astronomy, North
Haugh, St Andrews, KY16 9SS, United Kingdom14 Department of Astronomy, Ohio State University, 140 W. 18th
Ave., Columbus, OH 43210, USA15 University of Notre Dame, Physics Department, 225 Nieuwland
Science Hall, Notre Dame, IN 46530, USA16 Institute of Geophysics and Planetary Physics, L-413, Lawrence
Livermore National Laboratory, P.O. Box 808, Livermore, CA94550, USA
17 Department of Physics, University of Rijeka, Omladinska 14,51000 Rijeka, Croatia
18 Technical University of Vienna, Dept. of Computing, WiednerHauptstrasse 10, Vienna, Austria
19 University of Tasmania, Physics Department, GPO 252C, Hobart,Tasmania 7001, Australia
20 Niels Bohr Institute and Centre for Star and Planet Formation,Juliane Mariesvej 30, 2100 Copenhagen, Denmark
21 NASA Exoplanet Science Institute, Caltech, MS 100-22, 770South Wilson Avenue Pasadena, CA 91125, USA
22 Perth Observatory, Walnut Road, Bickley, Perth 6076, Australia23 South African Astronomical Observatory, P.O. Box 9 Observatory
7935, South Africa24 Space Telescope Science Institute, 3700 San Martin Drive,
Baltimore, MD 21218, USA
25 Astrophysics Group, Faculty of Physics, Weizmann Institute ofScience, Rehovot 76100, Israel
26 Department of Physics, Institute for Basic Science Research,Chungbuk National University, Chongju 361-763, Korea
27 School of Physics and Astronomy and the Wise Observatory,Raymond and Beverly Sackler Faculty of Exact Sciences, Tel-AvivUniversity, Tel Aviv 69978, Israel
28 School of Physics and Astronomy, Tel-Aviv University, Tel-Aviv69978, Israel
29 Division of Physics, Mathematics and Astronomy, CaliforniaInstitute of Technology, Pasadena, CA
30 Korea Astronomy and Space Science Institute, Daejon 305-348,Korea
31 Farm Cove Observatory, Centre for Backyard Astrophysics,Pakuranga, Auckland New Zealand
32 Warsaw University Observatory. Al. Ujazdowskie 4, 00-478Warszawa, Poland
33 Universidad de Concepcion, Departamento de Fısica, Casilla 160-C, Concepcion, Chile
34 Institute of Astronomy, University of Cambridge, MadingleyRoad, CB3 0HA Cambridge, UK
Copyright © 2022 FDOKUMEN