Light-and dark-adapted electroretinograms (ERGs) and ocular pigmentation: comparison of brown-and...
12
ORIGINAL RESEARCH ARTICLE Light- and dark-adapted electroretinograms (ERGs) and ocular pigmentation: comparison of brown- and blue-eyed cohorts Abdlsaed Al Abdlseaed • Yvonne McTaggart • Thomas Ramage • Ruth Hamilton • Daphne L. McCulloch Received: 12 November 2009 / Accepted: 5 July 2010 / Published online: 28 July 2010 Ó Springer-Verlag 2010 Abstract This study characterizes differences in human ERGs based on ocular pigmentation. Light- and dark-adapted luminance-response (LR) series for a-, b- and i-waves and light-adapted oscillatory potentials (OPs) were recorded in 14 healthy volun- teers (7 blue-eyed Caucasians; 7 brown-eyed Asians, aged 20–22 years). Amplitude interpolations were by logistic growth (Naka-Rushton), Gaussian or the combined ‘photopic hill’ functions. Implicit times (IT) for dark-adapted a- and b-waves, and for light- adapted a-, b- and i-waves were earlier in the blue- eyed group than in the brown-eyed group across all flash strengths (P \ 0.05). For dark-adapted ERGs, saturated a-wave amplitude was larger for blue eyes (397 vs. 318 lV, P \ 0.05) as was the a-wave to strong flash (10 cds/m 2 ; 357 vs. 293 lV, P \ 0.05) and the b-wave to ISCEV standard 0.01 (354 vs. 238 lV, P \ 0.05). Light-adapted b-waves for mid- range flash stimuli were much larger for the blue- eyed group (photopic hill, Gaussian peak: 155 vs. 82 lV, P \ 0.001) with no difference in saturated amplitudes. Similarly, interpolated i-wave amplitudes were larger (48 vs. 18 lV, P \ 0.01). For a light- adapted 2.6 stimulus, a- and b-waves were larger for the blue-eyed group (52 vs. 39 lV; 209 vs. 133 lV, P \ 0.01) as were OP4 and OP5 (37.2 vs. 15.6 lV; 47.5 vs. 22.2 lV, P \ 0.01), but OP1-OP3 did not differ. ERGs have shorter ITs in people with blue irides than in those with dark pigmentation. Ampli- tude differences are highly non-linear and substan- tially larger from eyes with light pigmentation for components thought to be associated with the OFF retinal pathways. Keywords Electroretinogram (ERG) Ocular pigmentation Luminance–response function OFF response Photopic hill Introduction In all applications of clinical electroretinography, results must be compared with suitable normative data [1]. It has been reported that human eyes with lighter fundi demonstrate larger full-field ERGs under both light- and dark-adapted conditions with normal or supranormal amplitudes in those with albinism [2–7]. Fundus pigmentation corresponds closely to iris pig- mentation, iris colour and skin pigmentation [8–10]. Therefore, iris colour is a reasonable proxy for fundus pigmentation. Although dark- and light-skinned humans have similar amounts of melanin pigment in A. Al Abdlseaed (&) Y. McTaggart T. Ramage D. L. McCulloch Department of Vision Sciences, Glasgow Caledonian University, Glasgow G4 0BA, UK e-mail: [email protected] R. Hamilton Department of Clinical Physics, Royal Hospital for Sick Children and University of Glasgow, Glasgow, UK 123 Doc Ophthalmol (2010) 121:135–146 DOI 10.1007/s10633-010-9240-3
Transcript of Light-and dark-adapted electroretinograms (ERGs) and ocular pigmentation: comparison of brown-and...

ORIGINAL RESEARCH ARTICLE
Light- and dark-adapted electroretinograms (ERGs)
and ocular pigmentation: comparison
of brown- and blue-eyed cohorts
Abdlsaed Al Abdlseaed • Yvonne McTaggart •
Thomas Ramage • Ruth Hamilton •
Daphne L. McCulloch
Received: 12 November 2009 / Accepted: 5 July 2010 / Published online: 28 July 2010
Ó Springer-Verlag 2010
Abstract This study characterizes differences in
human ERGs based on ocular pigmentation. Light-
and dark-adapted luminance-response (LR) series
for a-, b- and i-waves and light-adapted oscillatory
potentials (OPs) were recorded in 14 healthy volun-
teers (7 blue-eyed Caucasians; 7 brown-eyed Asians,
aged 20–22 years). Amplitude interpolations were by
logistic growth (Naka-Rushton), Gaussian or the
combined ‘photopic hill’ functions. Implicit times
(IT) for dark-adapted a- and b-waves, and for light-
adapted a-, b- and i-waves were earlier in the blue-
eyed group than in the brown-eyed group across all
flash strengths (P\ 0.05). For dark-adapted ERGs,
saturated a-wave amplitude was larger for blue eyes
(397 vs. 318 lV, P\ 0.05) as was the a-wave to
strong flash (10 cd�s/m2; 357 vs. 293 lV, P\ 0.05)
and the b-wave to ISCEV standard 0.01 (354 vs.
238 lV, P\ 0.05). Light-adapted b-waves for mid-
range flash stimuli were much larger for the blue-
eyed group (photopic hill, Gaussian peak: 155 vs.
82 lV, P\ 0.001) with no difference in saturated
amplitudes. Similarly, interpolated i-wave amplitudes
were larger (48 vs. 18 lV, P\ 0.01). For a light-
adapted 2.6 stimulus, a- and b-waves were larger for
the blue-eyed group (52 vs. 39 lV; 209 vs. 133 lV,
P\ 0.01) as were OP4 and OP5 (37.2 vs. 15.6 lV;
47.5 vs. 22.2 lV, P\ 0.01), but OP1-OP3 did not
differ. ERGs have shorter ITs in people with blue
irides than in those with dark pigmentation. Ampli-
tude differences are highly non-linear and substan-
tially larger from eyes with light pigmentation for
components thought to be associated with the OFF
retinal pathways.
Keywords Electroretinogram (ERG) �Ocular pigmentation � Luminance–response
function � OFF response � Photopic hill
Introduction
In all applications of clinical electroretinography,
results must be compared with suitable normative data
[1]. It has been reported that human eyes with lighter
fundi demonstrate larger full-field ERGs under both
light- and dark-adapted conditions with normal or
supranormal amplitudes in those with albinism [2–7].
Fundus pigmentation corresponds closely to iris pig-
mentation, iris colour and skin pigmentation [8–10].
Therefore, iris colour is a reasonable proxy for fundus
pigmentation. Although dark- and light-skinned
humans have similar amounts of melanin pigment in
A. Al Abdlseaed (&) � Y. McTaggart �T. Ramage � D. L. McCulloch
Department of Vision Sciences, Glasgow Caledonian
University, Glasgow G4 0BA, UK
e-mail: [email protected]
R. Hamilton
Department of Clinical Physics, Royal Hospital for Sick
Children and University of Glasgow, Glasgow, UK
123
Doc Ophthalmol (2010) 121:135–146
DOI 10.1007/s10633-010-9240-3

their retinal pigment epithelium (RPE), humans with
dark skin have, on average, twice as much melanin
pigment in their choroid as those with light skin [9].
Although it seems intuitive that greater light absorption
by the denser choroidal pigment should reduce the
effective retinal illumination and hence the ERG
amplitude, this alone does not adequately explain the
larger ERGs from lighter eyes [3, 7].
To investigate the effect of pigmentation, the
present study compared ERGs between two distinct
groups—Caucasians with blue irides and Asians
with brown irides—using the light-adapted and the
dark-adapted luminance–response (LR) functions of
a-, b- and i-wave amplitudes. This included some of the
ISCEV standard ERGs (dark-adapted 0.01, 3.0 and 10;
light-adapted 3.0) and light-adapted oscillatory poten-
tials (OPs). The implications for clinical ERG record-
ings at the relevant ISCEV standards were considered.
Methods
Participants
The study included 14 adult participants, seven blue-
eyed Caucasians and seven brown-eyed Asians. All
were aged 20–22 years to limit any age effects
[11–13]. All were free of ocular disorders, had
corrected visual acuities of 6/6 or better in each eye;
refractive errors, if present, were in the range of-4.00
to?3.50 dioptres to limit effects associated with axial
length [14, 15]. Each gave informed consent to
participate in the study, as approved by the Human
Research Ethics Committee for Life Sciences at
Glasgow Caledonian University, which adheres to
the tenets of the declaration of Helsinki.
Protocols and recording
Visual acuity, intraocular pressure and eye examina-
tion including anterior chamber angle assessment were
conducted prior to pupil dilation (tropicamide 0.5%,
repeated after 5 min for the brown group) to achieve
maximal dilatation in all participants (C8 mm). A
ground electrode was placed on the contralateral
mastoid, and participants were then dark-adapted for
20 min. After instilling anaesthesia (oxybuprocaine
0.4%) and lubricant (CelluviscÒ), a Burian-Allen
bipolar contact-lens electrode was inserted into the
chosen eye using dim red light. Full-field, 4-ms white
flashes were generated by LEDs (colour temperature
6,500 K) or a xenon strobe as required. For the dark-
adapted series, 5–10 flashes at each of 17 flash levels
(ranging from -3.3 to 2.3 log cd�s/m2 in 0.3 log unit
steps) were delivered using an Espion E2 systemwith a
Colordome stimulator (Diagnosys, UK). The inter-
stimulus interval was 2 s for weaker flashes and up to
10 s for stronger flashes to avoid light adaptation
during testing [1]. Participants were then light-adapted
for 5 min to a 25.5 cd/m2 (1.39 log cd/m2) white
background. A second LR series was then recorded,
consisting of 16 white flashes from -2.0 to 3.0 log
cd�s/m2 in 0.3 log unit steps. The first 5 min of this
protocol consists of sub-threshold strength flashes and
acted as further light adaptation time. For the flash of
2.55 cd�s/m2 in the photopic series (within 0.07 log
units of current ISCEV standard [1]), OPs were
recorded with a bandpass filter of 75–300 Hz. Follow-
ing the ERG recordings, a fundus photograph was
taken, the correlation between iris colour and fundus
pigment concentration was confirmed by visual
inspection [8, 16], and the cornea and intraocular
pressure were examined.
Data analysis
Individual ERGs were examined off-line to remove
manually traces contaminated with blink or eye
movement artefacts. Amplitudes and implicit times
(IT) were measured from the remaining averaged
data as illustrated in Fig. 1.
A-wave amplitudes for both light- and dark-adapted
series and b-wave amplitudes for dark-adapted series
were plotted versus time-integrated luminance for each
individual, and a logistic growth function [17] (Naka-
Rushton) was fitted using Sigmaplot (v.8):
V ¼VmaxI
I þ rð1Þ
where V is amplitude (lV), I is time-integrated lumi-
nance (cd�s/m2), Vmax is the maximum saturated ampli-
tude (lV), and r is the semi-saturated time-integrated
luminance (the flash strength that evokes a half-
maximal response) (cd�s/m2). Only points up to the first
plateauwere included in thefit [18] to avoid distortion of
the logistic function by the secondary rising phase.
B-wave amplitudes for the light-adapted series
were plotted versus time-integrated luminance for
136 Doc Ophthalmol (2010) 121:135–146
123

each individual, and a photopic hill function com-
prising the sum of a logistic growth function and a
Gaussian function was fitted [19]:
Vb ¼ Gb
I
l
� �
lnðl=IÞ
B2
" #
þVbmaxI
I þ rb
ð2Þ
where Vb is b-wave amplitude (lV), Gb is the
maximum amplitude at the peak of the Gaussian
component (lV), B is a measure of the width of the
Gaussian component (cd�s/m2), and l is the flash
strength at the peak of the Gaussian component, Gb
(cd�s/m2). The variables in remaining portion of the
equation are as defined for Eq. 1.
Photopic i-waves were plotted versus time-inte-
grated luminance for each individual and fitted with a
Gaussian function. Up to five photopic OPs were
measured from the preceding trough to each peak.
Logarithms of all amplitudeswere used for statistical
purposes in order to normalise their distributions. Mean
values of the two groups were tested for differences
using two-sample, two-tailed t-tests. To assess ITs over
multiple flash strengths, the differences between group
mean values at each flash strength were tested using a
one-sample t-test relative to zero difference.
Results
Dark-adapted ERG series
All participants showed the expected dark-adapted
ERG waveforms with an increase in amplitude and
decrease in IT as the flash strength was increased.
Figure 2 illustrates typical data for one participant
from each pigmentation group. In all individuals, the
logistic curve provided a good fit to a-wave amplitudes
(Fig. 3, left). Average Vmax for a-waves from blue
eyes was 397 lV, significantly larger than from brown
eyes (318 lV) (P\ 0.05). Semi-saturated luminance
(log r), a measure of a-wave sensitivity, did not differ
between groups. Dark-adapted b-wave amplitudes
were also fitted with logistic growth curves: all showed
saturation by around 2 cd�s/m2 (Fig. 3, right). Neither
Vmax nor semi-saturated luminance, log r, for the
b-waves differed between groups (Table 1).
The a-wave IT shortened for stronger flashes as
expected (Fig. 4). ITs were marginally but signifi-
cantly shorter for blue eyes, by 1 ms on average across
all flash strengths (one-sample t-test, P\ 0.001). The
ITs of the dark-adapted b-wave decreased with
increasing flash strength, reaching a plateau of around
45 ms at around 1 cd�s/m2. Again, the blue-eyed group
had slightly shorter ITs, by 3 ms on average across all
flash strengths (one-sample t-test, P\ 0.01).
Dark-adapted ISCEV standard and recommended
strong flash ERGs
At the ISCEV standard flash [1] (dark-adapted 0.01),
only two (blue) eyes showed an a-wave. Blue eyes
had an average b-wave amplitude of 354 lV, signif-
icantly larger than the average from brown eyes of
238 lV (P\ 0.05). Mean b-wave IT did not differ
between groups (Table 1).
Fig. 1 A typical averaged
ERG from the light-adapted
series at 2.55 cd�s/m2 is
illustrated from one blue-
eyed participant. ITs are
measured from the flash,
a-wave amplitudes from the
pre-stimulus baseline and
the b- and i-waves
amplitudes are measured
from the preceding trough
Doc Ophthalmol (2010) 121:135–146 137
123
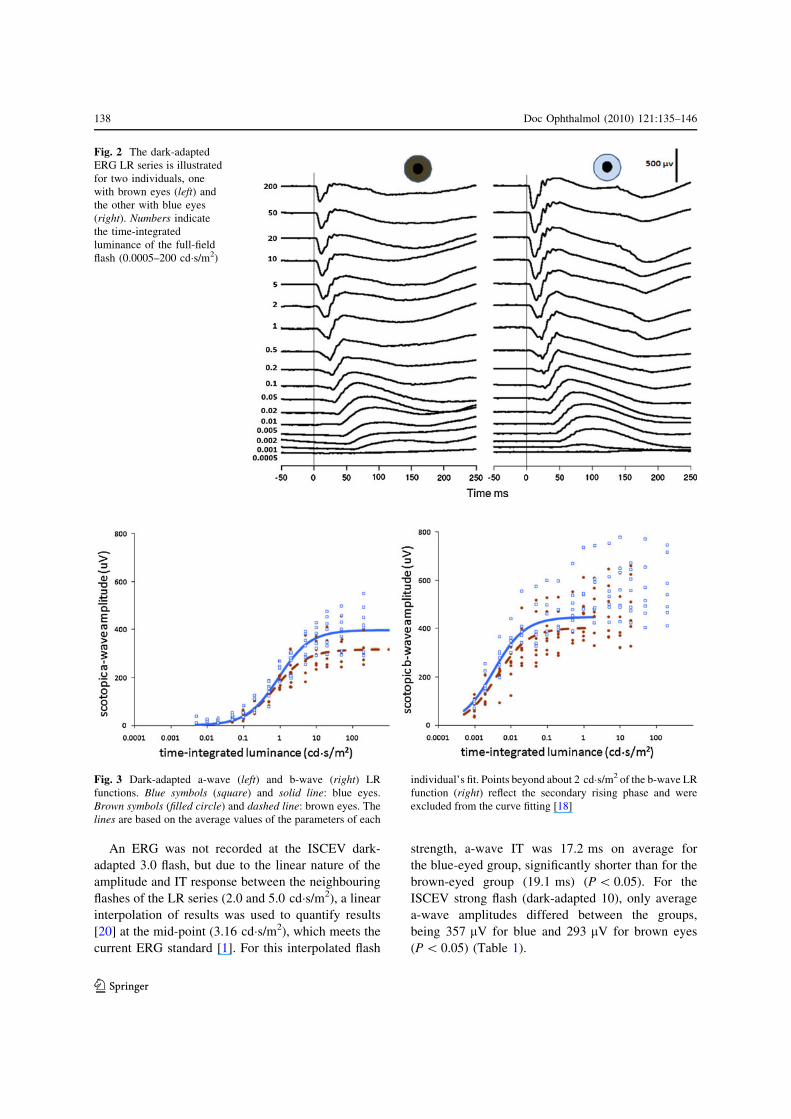
An ERG was not recorded at the ISCEV dark-
adapted 3.0 flash, but due to the linear nature of the
amplitude and IT response between the neighbouring
flashes of the LR series (2.0 and 5.0 cd�s/m2), a linear
interpolation of results was used to quantify results
[20] at the mid-point (3.16 cd�s/m2), which meets the
current ERG standard [1]. For this interpolated flash
strength, a-wave IT was 17.2 ms on average for
the blue-eyed group, significantly shorter than for the
brown-eyed group (19.1 ms) (P\ 0.05). For the
ISCEV strong flash (dark-adapted 10), only average
a-wave amplitudes differed between the groups,
being 357 lV for blue and 293 lV for brown eyes
(P\ 0.05) (Table 1).
Fig. 2 The dark-adapted
ERG LR series is illustrated
for two individuals, one
with brown eyes (left) and
the other with blue eyes
(right). Numbers indicate
the time-integrated
luminance of the full-field
flash (0.0005–200 cd�s/m2)
Fig. 3 Dark-adapted a-wave (left) and b-wave (right) LR
functions. Blue symbols (square) and solid line: blue eyes.
Brown symbols (filled circle) and dashed line: brown eyes. The
lines are based on the average values of the parameters of each
individual’s fit. Points beyond about 2 cd�s/m2 of the b-wave LR
function (right) reflect the secondary rising phase and were
excluded from the curve fitting [18]
138 Doc Ophthalmol (2010) 121:135–146
123

Light-adapted ERG series
Typical ERGs for the light-adapted LR series are
shown in Fig. 5 for a blue-eyed and for a brown-eyed
participant.
The LR function of light-adapted a-wave ampli-
tudes was well described by a logistic growth
function (Eq. 1; Fig. 6) in all participants. Neither
Vmax nor log r for the a-waves differed significantly
between blue and brown eyes (Table 2).
The photopic hill model [19] fitted well to each
individual’s data for b-wave amplitudes (Fig. 7, left).
The curve fitting parameters of the photopic hill model
showed no differences in log r of the logistic growth
function component (Fig. 7, lower right) or in the peak
luminance or width of the Gaussian components
(Fig. 7, upper right; Table 2). The b-wave amplitudes
for the strongest flashes, Vmax, of the logistic compo-
nent did not differ between groups (Fig. 7, lower
right). However, the Gaussian component, which
describes the amplitude increment in the mid-lumi-
nance portion of the photoic hill, was significantly
larger for blue eyes than for brown eyes (Fig. 7, upper
right) with mean values of 155 and 82 lV, respec-
tively (P = 0.0001).
Each individual’s i-wave amplitudes were well
fitted with a Gaussian curve (Fig. 8). The peak
amplitude was again substantially larger for blue eyes
than for brown eyes: 48 versus 18 lV, P = 0.005.
Neither the luminance at the amplitude peak nor the
Table 1 Summary of dark-adapted ERG results
Brown eyes Blue eyes P-value
from t-testMean 95% confidence
interval of mean
Mean 95% confidence
interval of mean
Luminance–response
functions
a-wave Vmax (lV) 318 274–367 397 348–454 0.046*
a-wave log r (log cd�s/m2) -0.12 -0.28–0.03 -0.04 -0.12–0.04 0.36
b-wave Vmax (lV) 403 344–472 448 394–510 0.33
b-wave log r (log cd�s/m2) -2.40 -2.55–-2.26 -2.49 -2.61–-2.36 0.10
ISCEV standard and
additional ERGs
0.01 b-wave amp (lV) 238 188–301 354 313–400 0.03*
0.01 b-wave IT (ms) 91.1 82.6–99.7 92.4 88.5–96.3 0.82
3.0 a-wave amp (lV) 236 199–280 287 253–326 0.09
3.0 a-wave IT (ms) 19.1 17.6–20.7 17.2 16.4–18.0 0.048*
3.0 b-wave amp (lV) 464 395–546 541 471–620 0.19
3.0 b-wave IT (ms) 48.1 45.7–50.4 46.6 44.6–48.5 0.35
10 a-wave amp (lV) 293 258–333 357 323–395 0.04*
10 a-wave IT (ms) 14.1 13.4–14.9 13.3 12.7–13.8 0.11
10 b-wave amp (lV) 462 377–566 565 486–658 0.14
10 b-wave IT (ms) 45.0 39.7–50.3 45.6 42.3–48.9 0.86
Amp amplitude
* P\ 0.05
Fig. 4 ITs for the dark-adapted ERG a-waves (lower) and b-
waves (upper) are shown for the blue-eyed group (blue) and the
brown-eyed group (brown). Error bars indicate the 95%
confidence interval for the mean of each group at each flash
strength
Doc Ophthalmol (2010) 121:135–146 139
123

width of Gaussian curves fitted to i-wave amplitudes
demonstrated significant differences between the
groups (Table 2).
The photopic a-wave IT shortened slightly for
stronger flashes; b-wave IT lengthened then short-
ened again and i-wave IT lengthened (Fig. 9). Across
Fig. 5 Light-adapted LR
series recorded for flashes
from 0.01 (bottom traces) to
1,000 cd�s/m2 (top traces)
flashes for two participants,
one with brown eyes (left)
and one with blue eyes
(right)
Fig. 6 Light-adapted
luminance–response
functions for a-wave
amplitude. Blue symbols
(open square) and solid
line: blue eyes. Brown
symbols (filled circle) and
dashed line: brown eyes.
The lines are based on the
average values of the
parameters of each
individual’s fit to Eq. 1
140 Doc Ophthalmol (2010) 121:135–146
123

all flash strengths, a-wave ITs were 0.7 ms shorter for
blue eyes (one-sample t-test, P = 0.0003); b-wave
ITs were 0.8 ms shorter for blue eyes (one-sample
t-test, P = 0.02) and i-wave ITs were 2 ms shorter
for blue eyes (one-sample t-test, P\ 0.05).
Light-adapted ISCEV standard ERGs
and oscillatory potentials
The 2.55 cd�s/m2 flash used here is close to the current
ISCEV standard flash of 3 cd�s/m2 [1] and within the
2004 standard range [21]. For this stimulus, blue eyes
showed an average a-wave amplitude of 52 lV, 33%
larger than the average amplitude from the brown eyes
(39 lV; P = 0.01). Blue eyes also showed a larger
average b-wave amplitude of 209 lV, 57% larger than
the average from brown eyes (133 lV, P = 0.001).
A-wave average IT was shorter for blue eyes than
brown eyes (14.0 vs. 14.6 ms, P = 0.02), but b-wave
average IT did not differ between the groups (Table 2).
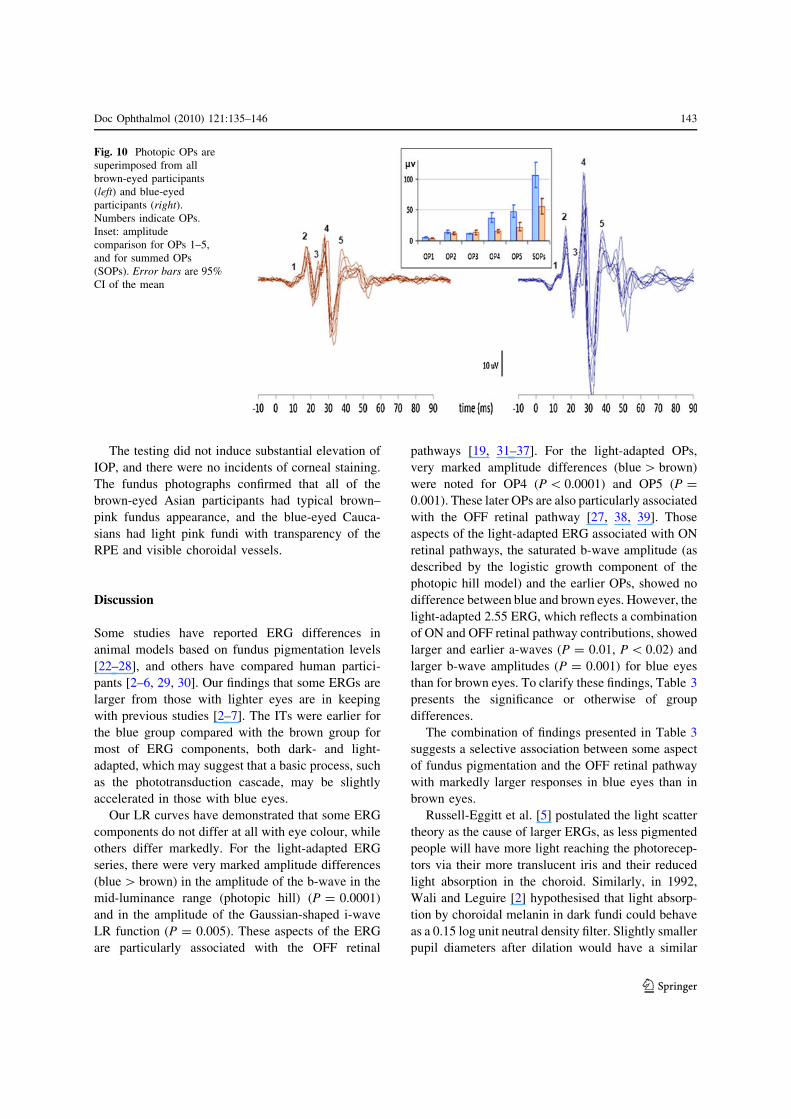
The earlier oscillatory potentials, OP1, OP2 and
OP3, did not differ in amplitude between the groups.
However, OP4 and OP5 were more than twice as
large from blue eyes than from brown eyes,
P\ 0.0001 and P = 0.001 (Fig. 10, Table 2). These
later OPs were sufficiently different in amplitude to
cause the overall summed amplitude (SOPs) to be
significantly larger for blue eyes than for brown eyes:
106 lV for the blue-eyed group and 56 lV for the
brown-eyed group, P = 0.001. OP2 IT was shorter
for blue eyes (although there was zero variability),
and no other OP IT differences were found (Table 2).
Table 2 Summary of light-adapted ERG results
Brown eyes Blue eyes P-values
from t-testMean 95% confidence
interval of mean
Mean 95% confidence
interval of mean
Luminance–response
functions
a-wave amp (lV) 95 81–111 111 98–125 0.15
a-wave sensitivity log r
(log cd�s/m2)
0.54 0.44–0.65 0.44 0.27–0.52 0.30
b-wave amp (lV): Gaussian height 82 68–98 155 135–177 0.0001*
b-wave sensitivity: log Gaussian
position (log cd�s/m2)
0.71 0.53–0.88 0.66 0.56–0.77 0.69
b-wave amp (lV): logistic Vmax 78 62–99 74 57–96 0.79
b-wave sensitivity: logistic log r
(log cd�s/m2)
-0.08 -0.27–0.12 -0.01 -0.15–0.12 0.62
i-wave amp (lV): Gaussian height 18 12–28 48 34–67 0.005*
i-wave sensitivity (log cd�s/m2) 0.36 0.13–0.58 0.54 0.33–0.76 0.26
ISCEV standard
ERGs
2.55 a-wave amp (lV) 39 34–46 52 47–58 0.01*
2.55 a-wave IT (ms) 14.6 14.2–15.0 14.0 14.0–14.0 0.02*
2.55 b-wave amp (lV) 133 115–153 209 179–245 0.001*
2.55 b-wave IT (ms) 29.7 29.4–30.1 29.1 28.6–29.7 0.10
Light-adapted
oscillatory potentials
OP1 amp (lV) 3.3 2.7–4.0 4.9 3.9–6.0 0.11
OP2 amp (lV) 11.2 9.2–14.0 14.1 12.0–17.0 0.10
OP3 amp (lV) 13.2 10.0–18.0 11.0 11.0–11.0 0.43
OP4 amp (lV) 15.6 13.0–18.0 37.2 30.0–46 0.00003*
OP5 amp (lV) 22.2 16.0–30.0 47.5 39.0–58.0 0.001*
OP1 IT (ms) 13.7 13.2–14.3 13.3 12.9–13.6 0.23
OP2 IT (ms) 18.1 17.5–18.8 17.0 All 17.0 0.006*
OP3 IT (ms) 24.7 24.4–25.1 24.7 24.2–25.3 1.0
OP4 IT (ms) 28.3 27.9–28.6 28.1 27.9–28.4 0.55
OP5 IT (ms) 39.1 38.2–40.0 38.3 37.4–39.2 0.22
* P\ 0.05
Doc Ophthalmol (2010) 121:135–146 141
123

Fig. 7 Light-adapted LR functions (‘‘photopic hills’’) for
b-wave amplitudes. Blue symbols (open square) and solid
line: blue eyes. Brown symbols (filled circle) and dashed line:
brown eyes. On the right are the Gaussian components (top)
and logistic growth components (bottom). All lines are based
on the average values of the parameters of each individual’s fit
to Eq. 2
Fig. 8 Light-adapted LR functions for i-wave amplitude. Blue
symbols (open square) and solid line: blue eyes. Brown
symbols (filled circle) and dashed line: brown eyes. The lines
are based on the average values of the parameters of a Gaussian
curve fitted to each individual’s data
0
10
20
30
40
50
60
70
0.001 0.01 0.1 1 10 100 1000 10000
time-integrated luminance (cd·s/m2)
photo
pic
IT
(m
s)
Fig. 9 ITs of the light-adapted a-wave (lower), b-wave
(middle) and i-wave (upper). Error bars indicate the 95%
confidence interval for the mean of each group at each flash.
Where only one data point is available, that data point is
shown. Brown symbols: brown eyes. blue symbols: blue eyes
142 Doc Ophthalmol (2010) 121:135–146
123
The testing did not induce substantial elevation of
IOP, and there were no incidents of corneal staining.
The fundus photographs confirmed that all of the
brown-eyed Asian participants had typical brown–
pink fundus appearance, and the blue-eyed Cauca-
sians had light pink fundi with transparency of the
RPE and visible choroidal vessels.
Discussion
Some studies have reported ERG differences in
animal models based on fundus pigmentation levels
[22–28], and others have compared human partici-
pants [2–6, 29, 30]. Our findings that some ERGs are
larger from those with lighter eyes are in keeping
with previous studies [2–7]. The ITs were earlier for
the blue group compared with the brown group for
most of ERG components, both dark- and light-
adapted, which may suggest that a basic process, such
as the phototransduction cascade, may be slightly
accelerated in those with blue eyes.
Our LR curves have demonstrated that some ERG
components do not differ at all with eye colour, while
others differ markedly. For the light-adapted ERG
series, there were very marked amplitude differences
(blue[ brown) in the amplitude of the b-wave in the
mid-luminance range (photopic hill) (P = 0.0001)
and in the amplitude of the Gaussian-shaped i-wave
LR function (P = 0.005). These aspects of the ERG
are particularly associated with the OFF retinal
pathways [19, 31–37]. For the light-adapted OPs,
very marked amplitude differences (blue[ brown)
were noted for OP4 (P\ 0.0001) and OP5 (P =
0.001). These later OPs are also particularly associated
with the OFF retinal pathway [27, 38, 39]. Those
aspects of the light-adapted ERG associated with ON
retinal pathways, the saturated b-wave amplitude (as
described by the logistic growth component of the
photopic hill model) and the earlier OPs, showed no
difference between blue and brown eyes. However, the
light-adapted 2.55 ERG, which reflects a combination
of ON and OFF retinal pathway contributions, showed
larger and earlier a-waves (P = 0.01, P\ 0.02) and
larger b-wave amplitudes (P = 0.001) for blue eyes
than for brown eyes. To clarify these findings, Table 3
presents the significance or otherwise of group
differences.
The combination of findings presented in Table 3
suggests a selective association between some aspect
of fundus pigmentation and the OFF retinal pathway
with markedly larger responses in blue eyes than in
brown eyes.
Russell-Eggitt et al. [5] postulated the light scatter
theory as the cause of larger ERGs, as less pigmented
people will have more light reaching the photorecep-
tors via their more translucent iris and their reduced
light absorption in the choroid. Similarly, in 1992,
Wali and Leguire [2] hypothesised that light absorp-
tion by choroidal melanin in dark fundi could behave
as a 0.15 log unit neutral density filter. Slightly smaller
pupil diameters after dilation would have a similar
Fig. 10 Photopic OPs are
superimposed from all
brown-eyed participants
(left) and blue-eyed
participants (right).
Numbers indicate OPs.
Inset: amplitude
comparison for OPs 1–5,
and for summed OPs
(SOPs). Error bars are 95%
CI of the mean
Doc Ophthalmol (2010) 121:135–146 143
123

effect of reducing luminance for those with more
pigment. The small but significant increase in ERG
ITs in the brown-eyed group could indeed be
accounted for by light absorption: a 0.15 log unit
reduction in flash brightness would predict a 1.0-ms
slower a-wave IT and a 3.4-ms slower b-wave IT
under dark-adapted conditions; this matches very
closely the 1.0 and 3.0 ms differences actually mea-
sured. Wali and Leguire also postulated that reduced
light scatter would shift the LR function for darker
eyes to the right (less sensitive) without reducing Vmax.
However, as in the present study, they showed no such
shift and in fact recorded smaller Vmax values for
darker eyes [2, 3] and thus rejected reduced light
scatter as the cause for smaller ERGs in dark-eyed
participants.
An alternative explanation lies in the high resis-
tance and semi-conductor-like physical properties of
melanin [3, 46] which is found in greater concentra-
tions in the choroid of darker-skinned individuals [9,
47]. The choroid (with the sclera) forms a resistive
component in the ERG circuit [48], and it is therefore
plausible that the effective resistance of the brown-
eyed ERG circuit is greater than for blue-eyed people,
causing a relative reduction in ERG voltage [3].
However, this resistance theory does not explain the
findings in the present study, which suggest that
increased pigmentation has little effect on the ampli-
tude of ERG components generated by the ON retinal
pathways.
One further possibility is that there is a selective
effect on the OFF pathways of the higher calcium
binding found in the more pigmented tissues of animal
eyes [47]. Although calcium modulates a variety of
retinal functions [48, 49], the ERG signals seen in the
relatively calcium-rich blue eyes are unknown.
Implications for laboratory norms
In clinical electrophysiology, it is vital to be able to
compare individual patient data with comparable
normative ranges. Age [11–13], gender [50] and race
should be considered. In the present study, the groups
were selected to have distinctly different levels of
ocular pigmentation with iris colour and skin tone used
to define the groups. Iris colour has been shown to
closely correlate with fundus pigmentation [8, 9].
Other methods of categorisation, such as evaluation of
Table 3 ERG amplitudes for brown- versus blue-eyed participants with associated retinal sources
ERG component Difference Associated retinal source
LA OP4 **** OFF pathway [27, 38, 39]
Photopic b-wave peak (Gaussian) **** OFF response [19, 34]
LA 2.55 b-wave *** ON and OFF bipolar cells [33]
LA OP5 *** OFF pathway [27, 38, 39]
i-wave amplitude (Gaussian) ** OFF response [36, 37]
LA 2.55 a-wave * Photoreceptors; postreceptoral contributions, primarily OFF pathway [40]
DA 0.01 b-wave * Predominantly rod bipolar cells; ON pathway [41, 42]
DA 10 a-wave * Photoreceptors; postreceptoral contributions, primarily ON pathway [40]
DA a-wave LRF, Vmax * Photoreceptors; postreceptoral contributions, primarily ON pathway [40]
DA 3.0 a-wave – Photoreceptors; postreceptoral contributions, primarily ON pathway [40]
DA 3.0 b-wave – Predominantly rod bipolar cells; ON pathway [41, 42]
LA OP1 – Triggered through ON pathway [43]
LA OP2 – Triggered through ON pathway [43]
LA OP3 – Triggered through ON pathway [43]
DA 10 b-wave – Predominantly rod bipolar cells; ON pathway [41, 42]
LA a-wave LRF, Vmax – Photoreceptors & postreceptoral ON and OFF pathway [44]
DA b-wave LRF, Vmax – Predominantly mass activity of ON bipolar cells [45]
Photopic saturated b-wave (logistic) – Presumptive ON response [19]
LA light-adapted, OP oscillatory potential, LRF luminance–response function, DA dark-adapted
**** P\ 0.001; *** P\ 0.005; ** P\ 0.01; * P\ 0.05; – P[ 0.05
144 Doc Ophthalmol (2010) 121:135–146
123

calibrated digital fundus photographs, fundus reflec-
tometry or infrared imaging, can be used to provide
graded levels of pigmentation [2, 3, 8, 51–53].
We conclude that the major difference in ERGs
between groups with different levels of ocular pig-
mentation is larger photopic ERG components thought
to be associated with the OFF retinal pathways for blue
eyes. In addition, ERGs are slightly faster under most
test conditions, a result that can be accounted for by
reduced light absorption.
Future studies could include the EOG and long flash
duration ERGs to further understand the physiological
differences associated with pigmentation. Given the
higher prevalence of diseases associated with light-
induced damage in Caucasians with blue irides,
particularly age-related macular degeneration, it is
important to understand the underlying differences in
retinal physiology in this group. To this end, it would
seem important to understand fully the electrophysi-
ological consequences of denser retinal pigmentation.
References
1. Marmor MF, Fulton AB, Holder GE, Miyake Y, Brigell M,
Bach M (2009) ISCEV standard for full-field clinical
electroretinography (2008 update). Doc Ophthalmol 118
(1):69–77 (www.iscev.org)
2. Wali N, Leguire LE (1992) Fundus pigmentation and the
dark-adapted electroretinogram. Doc Ophthalmol 80(1):
1–11
3. Wali N, Leguire LE (1993) Fundus pigmentation and the
electroretinographic luminance-response function. Doc
Ophthalmol 84(1):61–69
4. Krill AE, Lee GB (1963) The electroretinogram in albinos
and carriers of the ocular albino trait. Arch Ophthalmol
69:32–38
5. Russell-Eggitt I, Kriss A, Taylor DS (1990) Albinism in
childhood: a flash VEP and ERG study. Br J Ophthalmol
74(3):136–140
6. Nusinowitz S, Sarraf D (2008) Retinal function in X-linked
ocular albinism (OA1). Curr Eye Res 33:789–803
7. Tomei F, Wirth A (1978) The electroretinogram of albinos.
Vision Res 18(10):1465–1466
8. Weiter JJ, Delori FC, Wing GL, Fitch KA (1985) Rela-
tionship of senile macular degeneration to ocular pig-
mentation. Am J Ophthalmol 99(2):185–187
9. Weiter JJ, Delori FC, Wing GL, Fitch KA (1986) Retinal
pigment epithelial lipofuscin and melanin and choroidal
melanin in human eyes. Invest Ophthalmol Vis Sci
27(2):145–152
10. Robins AH (1973) Skin melanin content in blue-eyed and
brown-eyed subjects. Hum Hered 23(1):13–18
11. Birch DG, Anderson JL (1992) Standardized full-field
electroretinography. Normal values and their variation with
age. Arch Ophthalmol 110(11):1571–1576
12. Westall CA, Panton CM, Levin AV (1998) Time courses
for maturation of electroretinogram responses from infancy
to adulthood. Doc Ophthalmol 96(4):355–379
13. Weleber RG (1981) The effect of age on human cone and
rod ganzfeld electroretinograms. Invest Ophthalmol Vis
Sci 20(3):392–399
14. Perlman I, Meyer E, Haim T, Zonis S (1984) Retinal
function in high refractive error assessed electroretino-
graphically. Br J Ophthalmol 68(2):79–84
15. Westall CA, Dhaliwal HS, Panton CM, Sigesmun D, Levin
AV, Nischal KK, Heon E (2001) Values of electroretino-
gram responses according to axial length. Doc Ophthalmol
102(2):115–130
16. Seddon JM, Sahagian CR et al (1990) Evaluation of an iris
color classification system. The Eye Disorders Case-Con-
trol Study Group. Invest Ophthalmol Vis Sci 31(8):
1592–1598
17. Naka KI, Rushton WA (1966) S-potentials from colour
units in the retina of fish (cyprinidae). J Physiol 185(3):
536–555
18. Severns ML, Johnson MA (1993) The care and fitting of
Naka-Rushton functions to electroretinographic intensity-
response data. Doc Ophthalmol 85(2):135–150
19. Hamilton R, Bees MA, Chaplin CA, McCulloch DL (2007)
The luminance-response function of the human photopic
electroretinogram: a mathematical model. Vision Res
47(23):2968–2972
20. Bach M, Poloschek CM, Wozniak S (2009) Moving from
non-standard to standard stimuli in the ERG [abstract]. Doc
Ophthalmol 119:17
21. Marmor MF, Holder GE, Seeliger MW, Yamamoto S
(2004) Standard for clinical electroretinography (2004
update). Doc Ophthalmol 108:107–114
22. Zemel E, Loewenstein A, Lei B, Lazar M, Perlman I
(1995) Ocular pigmentation protects the rabbit retina from
gentamicin-induced toxicity. Invest Ophthalmol Vis Sci
36(9):1875–1884
23. Bui BV, Sinclair AJ, Vingrys AJ (1998) Electroretino-
grams of albino and pigmented guinea-pigs (cavia porcel-
lus). Aust N Z J Ophthalmol 26(Suppl 1):S98–S100
24. Bui BV, Vingrys AJ (1999) Development of receptoral
responses in pigmented and albino guinea-pigs (cavia
porcellus). Doc Ophthalmol 99(2):151–170
25. Vingrys AJ, Bui BV (2001) Development of postreceptoral
function in pigmented and albino guinea pigs. Vis Neurosci
18(4):605–613
26. Behn D, Doke A, Racine J, Casanova C, Chemtob S, La-
chapelle P (2003) Dark adaptation is faster in pigmented
than albino rats. Doc Ophthalmol 106(2):153–159
27. Racine J, Joly S, Rufiange M, Rosolen S, Casanova C,
Lachapelle P (2005) The photopic ERG of the albino
guinea pigs (Cavia porcellus): a model of the human
photopic ERG. Documenta Ophthalmologica 110(1):67–77
28. Heiduschka P, Schraermeyer U (2008) Comparison of
visual function in pigmented and albino rats by electro-
retinography and visual evoked potentials. Graefes Arch
Clin Exp Ophthalmol 246(11):1559–1573
Doc Ophthalmol (2010) 121:135–146 145
123

29. Dodt E, Copenhaver RM, Gunkel RD (1959) Electroreti-
nographic measurement of the spectral sensitivity in albi-
nos, caucasians, and negroes. Arch Ophthalmol 62:
795–803
30. Schmidt B (1965) Sensorial examination in an African
albino child. Acta Fac Med Univ Brumen 25:83–89
31. Kondo M, Piao CH, Tanikawa A, Horiguchi M, Terasaki
H, Miyake Y (2000) Amplitude decrease of photopic erg
b-wave at higher stimulus intensities in humans. Jpn J
Ophthalmol 44(1):20–28
32. Sieving PA (1993) Photopic on- and off-pathway abnor-
malities in retinal dystrophies. Trans Am Ophthalmol Soc
91:701–773
33. Sieving PA, Murayama K, Naarendorp F (1994) Push-pull
model of the primate photopic electroretinogram: a role for
hyperpolarizing neurons in shaping the b-wave. Vis Neu-
rosci 11(3):519–532
34. Ueno S, Kondo M, Niwa Y, Terasaki H, Miyake Y (2004)
Luminance dependence of neural components that under-
lies the primate photopic electroretinogram. Invest Oph-
thalmol Vis Sci 45(3):1033–1040
35. Rufiange M, Dassa J, Dembinska O, Koenekoop RK, Little
JM, Polomeno RC, Dumont M, Chemtob S, Lachapelle P
(2003) The photopic ERG luminance-response function
(photopic hill): method of analysis and clinical application.
Vision Res 43(12):1405–1412
36. Miyake Y (2006) Electrodiagnosis of retinal diseases.
Springer, Tokyo, pp 1–41
37. Rangaswamy NV, Frishman LJ, Dorotheo EU, Schiffman
JS, Bahrani HM, Tang RA (2004) Photopic ERGs in
patients with optic neuropathies: comparison with primate
ERGs after pharmacologic blockade of inner retina. Invest
Ophthalmol Vis Sci 45(10):3827–3837
38. Lachapelle P, Rousseau S, McKerral M, Benoit J, Polo-
meno RC, Koenekoop RK, Little JM (1998) Evidence
supportive of a functional discrimination between photopic
oscillatory potentials as revealed with cone and rod med-
iated retinopathies. Doc Ophthalmol 95(1):35–54
39. Wachtmeister L (1998) Oscillatory potentials in the ret-
ina: what do they reveal. Prog Retin Eye Res 17(4):
485–521
40. Frishman LJ (2006) Origins of the electroretinogram. In:
Heckenlively JR, Arden GB (eds) Principles and practice
of clinical electrophysiology of vision, 2nd edn. MIT press,
Cambridge, p 150
41. Robson JG, Frishman LJ (1999) Dissecting the dark
adapted electroretinogram. Doc Ophthalmol 95:187–215
42. Robson JG, Saszik SM, Jameel A, Frishman LJ (2003) Rod
and Cone contributions to the a-wave of the electroreti-
nogram of the macaque. J Physiol 547(2):509–530
43. Kojima M, Zrenner E (1978) Off-components in response
to brief light flashes in the oscillatory potential of the
human electroretinogram. Albrecht Von Graefes Arch Klin
Exp Ophthalmol 206(2):107–120
44. Hood DC, Birch DG (1996) Beta wave of the scotopic
(rod) electroretinogram as a measure of the activity of
human on-bipolar cells. J Opt Soc Am A Opt Image Sci
Vis 13(3):623–633
45. Fulton AB, Hansen RM (2006) Stimulus-response func-
tions for the scotopic b-wave. In: Heckenlively JR, Arden
GB (eds) Principles and practice of clinical electrophysi-
ology of vision, 2nd edn. MIT press, Cambridge, p 473
46. Abbas M, D’Amico F et al (2009) Structural, electrical,
electronic and optical properties of melanin films. Eur Phys
J E Soft Matter 28(3):285–291
47. Drager UC (1985) Calcium binding in pigmented and
albino eyes. Proc Natl Acad Sci U S A 82(19):6716–6720
48. Yau KW (1994) Phototransduction mechanism in retinal
rods and cones. The Friedenwald Lecture. Invest Oph-
thalmol Vis Sci 35(1):9–32
49. Nakatani K, Yau KW (1988) Calcium and light adaptation
in retinal rods and cones. Nature 334(6177):69–71
50. Brule J, Lavoie MP, Casanova C, Lachapelle P, Hebert M
(2007) Evidence of a possible impact of the menstrual
cycle on the reproducibility of scotopic ergs in women.
Doc Ophthalmol 114(3):125–134
51. Elsner AE, Burns SA, Weiter JJ et al (1996) Infrared
imaging of sub-retinal structures in the human ocular
fundus. Vision Res 36(1):191–205
52. Bone RA, Brener B, Gibert JC (2007) Macular pigment,
photopigments, and melanin: distributions in young sub-
jects determined by four-wavelength reflectometry. Vision
Res 47(26):3259–3268
53. Kilbride PE, Alexander KR, Fishman M, Fishman GA
(1989) Human macular pigment assessed by imaging
fundus reflectometry. Vision Res 29(6):663–674
146 Doc Ophthalmol (2010) 121:135–146
123