Generational Perspective on Teen and Older Drivers on Traffic ...

Ages, Life Stages, and Generational Cohorts: Decomposing the Immigrant First and SecondGenerations in the United StatesAuthor(s): Rubén G. RumbautSource: International Migration Review, Vol. 38, No. 3, Conceptual and MethodologicalDevelopments in the Study of International Migration (Fall, 2004), pp. 1160-1205Published by: The Center for Migration Studies of New York, Inc.Stable URL: http://www.jstor.org/stable/27645429Accessed: 05/04/2010 17:07
Your use of the JSTOR archive indicates your acceptance of JSTOR's Terms and Conditions of Use, available athttp://www.jstor.org/page/info/about/policies/terms.jsp. JSTOR's Terms and Conditions of Use provides, in part, that unlessyou have obtained prior permission, you may not download an entire issue of a journal or multiple copies of articles, and youmay use content in the JSTOR archive only for your personal, non-commercial use.
Please contact the publisher regarding any further use of this work. Publisher contact information may be obtained athttp://www.jstor.org/action/showPublisher?publisherCode=cmigrations.
Each copy of any part of a JSTOR transmission must contain the same copyright notice that appears on the screen or printedpage of such transmission.
JSTOR is a not-for-profit service that helps scholars, researchers, and students discover, use, and build upon a wide range ofcontent in a trusted digital archive. We use information technology and tools to increase productivity and facilitate new formsof scholarship. For more information about JSTOR, please contact [email protected].
The Center for Migration Studies of New York, Inc. is collaborating with JSTOR to digitize, preserve andextend access to International Migration Review.
http://www.jstor.org
Ages, Life Stages, and Generational Cohorts: Decomposing the Immigrant First and Second Generations in the United States
Rub?n G. Rumbaut
University of California, Irvine
This article focuses on problems with the definition and empirical iden tification of immigrant "first" and "second" generations in the United States. These loosely conceived aggregates
are decomposed into a
typol
ogy of distinct generational cohorts defined by age and life stage at
migration for the foreign born and by parental nativity for the U.S. born. Differences in educational and occupational attainment and in
language and other aspects of acculturation are then examined to con
sider whether the practice of "lumping" these generational cohorts to
gether, or "splitting" them into distinctive units of analysis, is empiri cally supported by available evidence. The paper concludes with some
thoughts on data needs and methodological considerations in the study of immigrant generations.
"All the world's a stage, and all the men and women
merely players: They have their exits and their entrances; and one man in his time plays many parts, his acts being
seven ages ..." - William Shakespeare, "As You Like It," Act II, Scene 7.
The study of the long-term consequences of international migration for
receiving countries has focused increasingly on the process of adaptation of
the immigrants' children (Boyd and Grieco, 1998; Caplan et al, 1991;
Gans, 1992; Hern?ndez and Charney, 1998; Levitt and Waters, 2002;
Revision of paper presented at the international conference on "Conceptual and Method
ological Developments in the Study of International Migration," Princeton University, May 23-24, 2003, sponsored by the Center for Migration and Development, Princeton Univer
sity, in collaboration with the International Migration Review and the International Migration
Program of the Social Science Research Council. I gratefully acknowledge the support pro vided to the Children of Immigrants Longitudinal Study (CILS) by research grants from the
Russell Sage Foundation and the Andrew W. Mellon, Spencer, and National Science Foun
dations, to Alejandro Portes and Rub?n G. Rumbaut, Principal Investigators; and the research
assistance of Charlie V. Morgan of the University of California, Irvine.
? 2004 by the Center for Migration Studies of New York. All rights reserved.
0197-9183/04/3803.0147
1160 IMR Volume 38 Number 3 (Fall 2004): 1160-1205
Ages, Life Stages, and Generational Cohorts 1161
Perlmann and Waldinger, 1997; Portes, 1996; Portes and Zhou, 1993; Portes and Rumbaut, 2001; Rumbaut and Cornelius, 1995; Rumbaut and
Ima, 1988; Su?rez-Orozco and Su?rez-Orozco, 2002; Sung, 1987; Zhou,
1997; Zhou and Bankston, 1998). The "new second generation" is rapidly
growing and diversifying through continued immigration, natural increase
and intermarriage, complicating its contours and making it increasingly
important, for theoretical as well as programmatic and public policy reasons,
to clarify who and what is encompassed by that term and to measure its size
and composition. Similarly problematic is the definition, depiction and
measurement of the immigrant "first generation," a large segment of which
is composed of persons who migrated as children and who are often regarded as members of the "second" generation.
Many theoretical questions can be and have been raised about the
incorporation of children of immigrants vis-?-vis that of their parents: about
their "coming of age" in the United States, their modes of acculturation and
ethnic identity (and ethnic group) formation, patterns of language use and
mother-tongue shift, and their social, residential, reproductive, marital, ed
ucational, occupational, economic, civic and political trajectories into adult
hood. As with issues of language and national loyalties, questions have been
raised as well about whether and to what extent the "transnational" attach
ments of their parents are sustained in the generation of their children,
particularly those born in receiving countries such as the United States, who
lack the memories and the symbolic "birth connection" of their emigrant
parents. All of these are open empirical questions, but each of them presup
poses a clear operational definition of what is meant by second generation vis-?-vis the first generation, and even of something as basic as the ethnicity of first- versus
second-generation persons. However, while there is a con
sensus about the import of intergenerational analysis for the study of the
long-term impact of immigration, there is no such consensus on the mean
ing and measurement of generations (Oropesa and Landale, 1997).
Although these may appear to be simple and straightforward matters,
they become complex and elusive on closer inspection. To begin with, the
term generation brings with it a variety of meanings. In a kinship context,
it refers to a stage in a natural succession comprising those who are of the
same genealogical
remove from an ancestor (e.g.,
the generations of the
parents, children, and grandchildren). It is also used as a synonym for
cohort, a term preferred by demographers
to refer to a set of people born at
about the same time (Ryder, 1965; Riley, 1987). In his seminal essay "The
1162 International Migration Review
Problem of Generations," Karl Mannheim ([1928] 1996) distinguished be
tween individuals of the same age group (which he termed a "generational location") and a
"generation as an
actuality" -
contemporaries (typically
compatriots as well) who are exposed to and defined by the effects of a
powerful historical stimulus (especially during the years of the transition to
adulthood when "personal experimentation with life begins") and develop a
shared consciousness about it ?
while noting that members of a generation
may react differently to the common historical stimulus, forming different
"generational units" within the same actual generation.
Immigrant families and communities themselves are often acutely con
scious of the generational status of their members and of generational dif
ferences between them ?
perhaps none more so than the Japanese in the
United States, who have specific terms for the first four generations since the
initial migrations of the late nineteenth and early twentieth centuries {issei, nisei, sansei, y onset), and another term {nikkei) to describe all four generations of people of Japanese ancestry. How recent Japanese immigrants fit into this
closed generational scheme is another matter altogether, since the scheme
posits an original migration (a first generation), in terms of which all sub
sequent U.S.-born generations are genealogically defined and counted. But
the imagery is suggestive: international migration is a powerful and trans
formative force, producing profound social changes not only in the sending and receiving societies, but, above all, among the
immigrants themselves and
their descendants. Those effects may begin to fade over time and generation, the greater the remove from the original migrations and the conditions that
produced them. But how to grasp and measure that "remove" - including
the evolution over time and place of the ethnic self-identities of the referent
populations, in widely different and rapidly changing circumstances and often in a context of continuing immigration
? is
problematic. An example may be instructive. The complexity of some of these issues
was raised in our Children of Immigrants Longitudinal Study (CILS) as soon as we set about to analyze the first wave of survey data collected in 1992
(Portes and Rumbaut, 2001; Rumbaut and Portes, 2001). The CILS base line sample consisted of 5,262 teenage respondents on both coasts of the
United States, most born in 1977 or 1978, representing 77 different na
tionalities. Half were foreign-born youths who had immigrated to the United States before age 12 (the "1.5 generation"), and half were U.S.-born
The idea echoes Erik Erickson's later (1964) concept of identity formation within a common
"psycho-historical actuality."
Ages, Life Stages, and Generational Cohorts 1163
children of at least one immigrant parent (technically the second genera tion). Among the foreign-born youth, the sample was also evenly split by age at arrival: about half had lived in the United States for ten years or more
(that is, they were preschool-age at arrival), while the other half had lived in
the United States nine years or less (that is, they had reached elementary school age in their native country but arrived in the United States before
reaching adolescence and secondary schooling). Time in the United States
for these immigrant children thus was not solely a measure of length of
exposure to American life, but also an indicator of qualitatively different life
stages and sociodevelopmental contexts at the time of immigration.
The determination of ethnicity for CILS respondents was mostly
straightforward and unambiguous among foreign-born youths and those
whose parents were co-nationals (born in the same foreign country), except
for ethnic minorities (such as the Hmong from Laos, the ethnic Chinese
from Vietnam) or in cases involving unique historical circumstances. But in
one fourth of the cases in the CILS sample, the parents were born in
different countries, and in over half of those cases -accounting for 13 percent of the overall sample
? one of the parents was U.S. born. In the case of the
latter, ethnicity was assigned on the basis of the national origin of the
foreign-born parent, whether it was the father or the mother {see Oropesa and Landale, 1997; Waters, 1990).
In the case of the former ?
in mixed marriages where the parents were
born in different foreign countries ? the nationality of the mother took
precedence in the assignment of ethnicity, reflecting both the mother's more
influential role in the children's socialization and the fact that fathers were
absent in 30 percent of the homes in the sample (Rumbaut, 1994). Of
course, what is a methodological problem to the researcher is a central
psychosocial issue to an adolescent in arriving at a
meaningful ethnic self
definition during a stage of the life cycle concerned with "identity crisis" and
its resolution (Erikson, 1968). Over time, as those adolescents come of age,
marry and have children of their own, issues of ethnic identity and the
determination of ethnicity in comparative research studies can be confi
dently predicted to become more complicated still and their measurement
and analysis methodologically more challenging.
Taking off from the preceding observations, this article is intended as
a conceptual, methodological, and empirical contribution to the cognate
research literature. It seeks to specify the size and composition ? and defi
nition ? of what are loosely referred to as the first and second generations in
the United States, identifying such populations empirically, and to advance

1164 International Migration Review
our research and understanding based on specific operational definitions of
distinctive generational cohorts and on new survey data from representative national and regional samples. In particular, it will address the question of the utility and validity of "lumping" versus "splitting" such generational cohorts in the study of immigrant adaptation, including that of foreign-born immigrant children and the native-born children of immigrants.
DEFINING AND REDEFINING THE FIRST AND SECOND GENERATIONS
Differences in nativity (of self and parents) and in age and life stage at arrival, which are criteria used to distinguish between generational cohorts, are
known to affect significantly the modes of acculturation of adults and chil dren in immigrant families, especially with regard to language and accent, educational attainment and patterns of social mobility, outlooks and frames of reference, ethnic identity and even their propensity
to sustain transna
tional attachments over time (cf. Cropley, 1983; Rumbaut, 1991, 1998a, 2002; Rumbaut and Ima, 1988). To carry out such analyses
- and setting aside for the time being the problem of the determination of "ethnicity"
- the measurement of first and second generations requires
at a minimum data
sources that contain information on the country of birth of the respondent; and, if foreign born, the age and date of arrival; and, if native born, the
country of birth of the mother and father.
Spurred by the mass migration of the 1840s to the United States, the 1850 census was the first to collect data on the nativity of the population;
beginning with the 1870 census, a question on parental nativity was added as well and collected in each decennial U.S. census until 1970 (see Gibson and Lennon, 1999). However, the study of the second generation and of the
intergenerational mobility of immigrant-origin groups in the United States was severely undercut after 1970 when the U.S. Census Bureau dropped the
question on parental nativity from the long-form questionnaire of its de cennial census, the
largest and most reliable nationally-representative data
source for the analysis of the myriad of immigrant groups. As a result,
ironically, just at the very moment when a new era of mass
migration made
the collection of such data indispensable in the United States, the last three censuses (1980, 1990, 2000) have permitted only a detailed examination of the foreign-born population by country of birth and date of arrival, but not of their U.S.-born children. The only exception in this regard has been the innovative use of the Public Use Microdata Samples (PUMS) of the decen
Ages, Life Stages, and Generational Cohorts 1165
nial census to construct child files for all children under 18 residing in
households with at least one foreign-born parent, and then concatenating
information on the parents and household to each record (Jensen and Chi
t?se, 1994; Oropesa and Landale, 1997); however, those efforts are limited
only to those children still residing with their (foreign-born) parents and
cannot consider any second-generation persons 18 and older.
Fortunately, in 1994 the questions on paternal and maternal nativity were incorporated in the annual (March) supplement of the Current Popu lation Surveys (CPS) conducted by the Census Bureau for the Bureau of
Labor Statistics. The CPS has since become the main national-level data set
in the United States permitting more refined intergenerational analyses
(from the first to the second and third-and-beyond generations) ? but the
sample size for a given year, while substantial, is not large enough to provide reliable information on smaller immigrant populations or for comparative
analyses by national origin and by generational cohorts defined by age-at arrival and parental nativity. This limitation can be addressed to some extent
by merging annual demographic data files for several consecutive years to
generate sufficient sample sizes for analytical purposes ? a methodological
strategy that will be pursued below.
Aside from the problem of relevant data sources and data needs, the
measurement of the size and composition of the first and second generations, which together comprise the country's "immigrant-stock"
or foreign
parentage population, depends on what is meant by these terms, which have
not been uniformly defined in the literature or operationalized in research
studies. When referring to the first generation, immigration scholars in the
United States commonly have in mind persons born and socialized in an
other country who immigrate as adults, although the term technically in
cludes the foreign born regardless of their age at arrival. Similarly, the second
generation technically refers to the U.S.-born and U.S.-socialized children of
foreign-born parents, although under this rubric immigration scholars also
often, if imprecisely, lump together foreign-born persons who immigrated as
children as well as U.S.-born persons with one U.S.-born parent and one
foreign-born parent, treating them together as a de facto
second generation.
Indeed, the expression "second-generation immigrants" is a common
place in the literature ? although it is technically an oxymoron, inasmuch as
persons born in the United States cannot also be immigrants to the United
States. Still, none of these conventional usages accurately captures the ex
perience of youths who fall in the interstices between these groupings nor,
1166 International Migration Review
among those born abroad, takes into account their different ages and life
stages at the time of migration.
That there are fundamental differences in the pace and mode of ad
aptation between persons who immigrate as adults and those who do so as
children is a well-established observation - indeed, it is the stuff of a rich
popular literature and culture - and wider still are the differences in adaptive outcomes vis-?-vis the native-born children of foreign-born parents (cf.
Ber
rol, 1995; Child, 1943; Ebaugh and Chafetz, 2000; Nahirny and Fishman
[1965] 1996; Piore, 1979:65-68). By 1914, Robert Park could write con
vincingly, "In America it has become proverbial that a Pole, Lithuanian, or
Norwegian cannot be distinguished, in the second generation, from an
American born of native parents" (Park and Burgess, [1921] 1924:757
758). His colleagues W. I. Thomas and Florian Znaniecki, writing over 80
years ago in The Polish Peasant in Europe and America, referred in passing to
the "half-second" generation to describe foreign-born youths coming of age in the United States in contrast to
second-generation native-born youths
([1918?20] 1958:1776). Warner and Srole, in The Social Systems of American
Ethnic Groups (1945), distinguished the foreign-born - whom they called the
"parental" or "P" generation
- from the U.S.-born generations
- the first of
which (the offspring of the immigrants) was dubbed the "filial first" or "Fl"
generation, the second (the grandchildren of the immigrants) was dubbed
"F2," and so on. They divided the immigrant generation, in turn, into those
who entered the United States after the age of 18 (labeled the "PI" genera
tion) and those who entered at age 18 or younger (the P2 generation). Both
the P2 and the half-second concepts are akin to the terms "one-and-a-half
or "1.5 generation," which I coined in studies of Cuban and then Southeast
Asian youths {cf. Rumbaut, 1976, 1991; Rumbaut and Ima, 1988). Those segments of the immigrant first generation that Warner and
Srole labeled PI (adults) and P2 (children) can each be decomposed and
further refined into distinct types, depending on their ages and life stages at
migration. Unique historical circumstances notwithstanding (such as the
case of war-torn refugees), among those who immigrate as adults (PI) their
general orientation and processes of adjustment and incorporation can be
expected to vary significantly depending on whether they immigrated during
early, middle, or older adulthood. For example, unlike the youngest of these
(ages 18?24) who are more likely to be making their transitions to adult
hood, young adults aged 25-34 generally migrate after having completed their educations, at the beginning of their work careers, and in their peak

Ages, Life Stages, and Generational Cohorts 1167
childbearing and family-formation years - but both bring a future-oriented
outlook to their new arrangements.
By contrast, mid-adulthood immigrants (aged 35-54) come with years of prior work experience, by and large have already had their children, and
indeed are often motivated to migrate by the search for opportunities for
their children; they are unlikely to shed their native languages, customs and
identities in the process of their accommodation to the new society. Older
adults (55 and older), who are relatively rare in immigrant (and even refugee) flows, are
already near or at the end of their work careers, and tend to be
followers of children; they lack the plasticity of young migrants and are least
likely to learn the new language or acculturate other than superficially to
their new environment.
Similarly, those immigrants who arrive as children -
what Warner and
Srole called the P2 generation - can be further refined into three distinct
groups, depending on whether their migration occurred during early child
hood (ages 0?5), middle childhood (6?12), or adolescence (in their teens).
Foreign-born adolescents, elementary-school-age children, and pre-school
children are at starkly different life stages at the point of migration, begin their adaptation processes in very different social contexts, and can be clas
sified accordingly. More specifically: 1) those who arrive in early childhood
(ages 0?5) - whom I have elsewhere labeled the 1.75 generation because
their experience and adaptive outcomes are closer to that of the U.S.-born
second generation - are
pre-school children who retain virtually no memory
of their country of birth, were too young to go to school to learn to read or
write in the parental language in the home country (and typically learn
English without an accent), and are almost entirely socialized here; 2) those
who arrive in middle childhood (ages 6?12) ? the classic 1.5 generation
? are
pre-adolescent, primary-school-age children who have learned (or begun to
learn) to read and write in the mother tongue at schools abroad, but whose
education is largely completed here; and 3) those who arrive in their ado
lescent years (ages 13?17), who may or may not come with their families of
origin, either attend secondary schools after arrival or in the older ages may
go directly into the workforce - a 1.25 generation whose experiences and
adaptive outcomes are hypothesized to be closer to the first generation of
immigrant adults than to the native-born second generation (Rumbaut,
1997a). In a rigorous empirical test of this classification, which they referred to
as "decimal" generations, Oropesa and Landale (1997) found significant differences between each of these generational cohorts and strong cohort
1168 International Migration Review
effects on language outcomes (being bilingual, or English or Spanish mono
lingual) in multivariate analyses of native-born and foreign-born second
generation children of Latin American origin, suggesting that these are dis
tinctive populations and that it is inappropriate to combine them, at least
when the focus of the analysis is on language
or on adaptive
outcomes
affected by language competencies. While more precise distinctions based on age and life stage at arrival are
not only possible but theoretically important for the analysis of modes of
acculturation among immigrant parents and their children - including those
variants we have labeled "dissonant," "consonant," and "selective" accultura
tion (Portes and Rumbaut, 1996, 2001) ? the aim here is more limited. For
purposes of estimating and depicting the size and composition of the im
migrant-stock population of the United States, I distinguish first by nativity between the first and second generations (or P and Fl, in Warner and Srole's
scheme) and contrast them to the third-and-beyond generation of native
parentage (F2 in Warner and Srole's terminology). A demographic and
geographic profile of the immigrant-origin population is then presented, broken down by detailed national origins. Second, I decompose the foreign born first generation (by applying the above age-based typology to both
adults and children at different life stages at arrival in the United States) and
the native-born second generation (by distinguishing between persons born in the United States of two foreign-born parents versus persons born in the
United States of one foreign-born parent and one U.S.-born parent) and
estimate the size of these generational cohorts by national origin. The data are drawn from an analysis of merged CPS annual demographic files for the
five years of 1998 to 2002, yielding an overall sample of about 740,000 cases.3
Third, to explore the utility of the proposed typology, I examine
differences in a variety of outcomes among these generational cohorts, re
lying on three data sources. Using the merged CPS data, I first compare the
educational and occupational attainments of these cohorts for the largest immigrant population (that from Mexico) and for types of immigrant
groups who arrive with sharply different levels of human capital. Next, I
3Of course, the accuracy of the estimates decreases as the sample size decreases, and thus care
should be taken when interpreting the results presented below, especially for the smaller
national-origin groups. For a discussion of sampling and nonsampling error in the March
CPS, see Schmidley, 2001; Schmidley and Robinson, 1998. See also <http://
www.bls.census.gov/cps/ads/2002/S8cA. 02.pdf>.

Ages, Life Stages, and Generational Cohorts 1169
focus on patterns of linguistic assimilation among the generational cohorts
composing the foreign-born population, using the 5 percent PUMS from
the 2000 U.S. Census (since data on language are not available from the
CPS). A last section compares differences in acculturation and identity among the cohorts composing "the new second generation," based on new
longitudinal findings from the CILS survey.
THE SIZE, COMPOSITION, AND CONCENTRATION OF THE FIRST AND SECOND GENERATIONS
Based on the 1998-2002 CPS merged data files, Table 1 provides a simple tabulation of the first, second, and third-plus generations, classified solely by
nativity, broken down by self-reported "race" and Hispanic origin. The
table shows both the weighted estimates for these populations and the un
weighted number of cases (sample size). For the total U.S. population at the
turn of the century, the CPS estimated a first generation of some 32 million, a second generation of about 29 million, and a third-and-beyond generation of 211 million.5 Thus, over 60 million people, or 22 percent of the total U.S.
population, were of foreign birth or parentage around the year 2000 ?
including 70 percent of the Mexican-origin population, 95 percent of the
Cubans, Central and South Americans, and 90 percent of the Asians, re
flecting the relative recency of their migrations. By contrast, only about one
in ten of "non-Hispanic whites" and "non-Hispanic blacks" were of immi
grant origin. Short of examining the specific national origins of the foreign born (to which we will turn next), this is the most detailed available gen erational picture of the American ethnoracial mosaic, consisting largely of
one-size-fits-all panethnic categories ("white," "black," "Asian") that conceal
4The first-generation estimate includes nearly 2 million persons who were born in a foreign
country but had at least one parent who was a U.S. citizen. The U.S. Census Bureau classifies
such persons as part of the "native-born population" and excludes them from the "foreign born" population, even though many are in fact recent U.S. arrivals. Most of them come from
Mexico, Canada, Germany, Great Britain, Japan, the Philippines, and Korea (countries from
which immigration to the United States via marriages with U.S. citizens is common).
5The estimates apply to the civilian noninstitutionalized resident population of the 50 states
and the District of Columbia. Given the focus on immigrant generations, American Indians
and Alaska Natives are not included in Table 1. Included under first generation are island
born Puerto Ricans and other U.S. islanders who are U.S. citizens at birth, and under second
generation are mainland-born Puerto Ricans of island-born parents. These figures do not
include the 3.8 million who resided in Puerto Rico, nor the population of the other U.S.
territories.
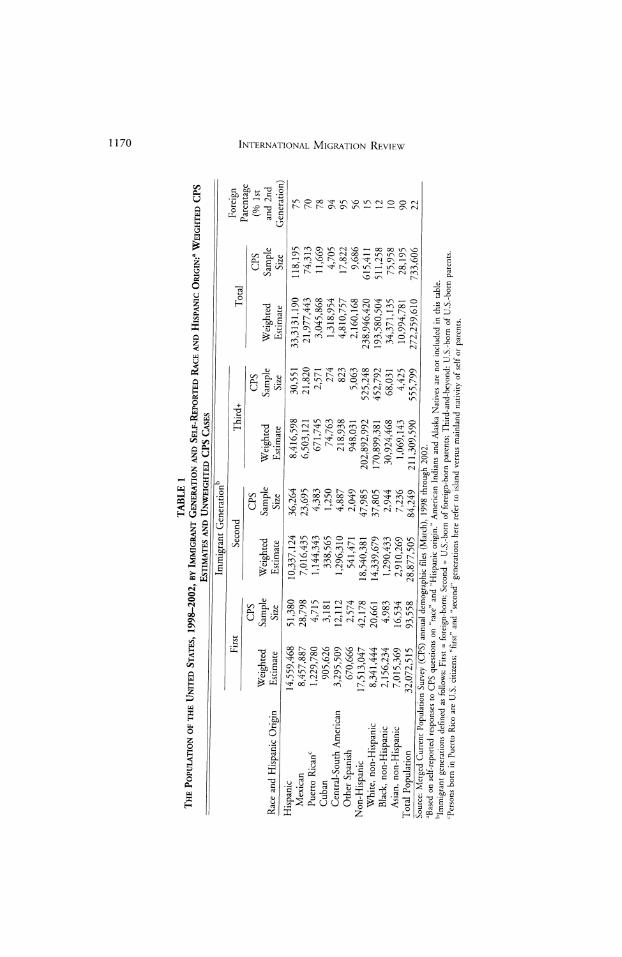
TABLE 1 The Population of the United States, 1998-2002, by Immigrant Generation and Self-Reported Race and Hispanic Origin:3 Weighted CPS Estimates and Unweighted CPS Cases
Immigrant Generation
First
Second
Thirds
Total
Race and Hispanic Origin
Weighted Estimate
CPS Sample Size
Weighted Estimate
CPS Sample Size
Weighted Estimate
CPS Sample Size
Weighted Estimate
CPS Sample Size
Source: Merged Current Population Survey (CPS) annual demographic files (March), aBased on self-reported responses to CPS questions on "race" and "Hispanic origin." immigrant generations defined as follows: First = foreign-born; Second = U.S.-born Tersons born in Puerto Rico are U.S. citizens; "first" and "second" generations here
, 1998 through 2002.
American Indians and Alaska Natives are not included in this table. of foreign-born parents; Third-and-beyond: U.S.-born of U.S.-born parents.
refer to island versus mainland nativity of self or parents.
Foreign Parentage (% 1st
and 2nd Generation)
Hispanic 14,559,468 51,380 10,337,124 36,264 8,416,598 30,551 33,3131,190 118,195 75 Mexican 8,457,887 28,798 7,016,435 23,695 6,503,121 21,820 21,977,443 74,313 70
Puerto Ricanc 1,229,780 4,715 1,144,343 4,383 671,745 2,571 3,045,868 11,669 78
Cuban 905,626 3,181 338,565 1,250 74,763 274 1,318,954 4,705 94
Central-South American 3,295,509 12,112 1,296,310 4,887 218,938 823 4,810,757 17,822 95
Other Spanish 670,666 2,574 541,471 2,049 948,031 5,063 2,160,168 9,686 56 Non-Hispanic 17,513,047 42,178 18,540,381 47,985 202,892,992 525,248 238,946,420 615,411 15
White, non-Hispanic 8,341,444 20,661 14,339,679 37,805 170,899,381 452,792 193,580,504 511,258 12
Black, non-Hispanic 2,156,234 4,983 1,290,433 2,944 30,924,468 68,031 34,371,135 75,958 10 Asian, non-Hispanic 7,015,369 16,534 2,910,269 7,236 1,069,143 4,425 10,994,781 28,195 90
Total Population _32,072,515 93,558 28,877,505 84,249 211,309,590 555,799 272,259,610 733,606_22_
Ages, Life Stages, and Generational Cohorts 1171
far more than they reveal about the extraordinary ethnic diversity subsumed
under those labels.
Moreover, as a methodological caveat, it is worth noting that the data
on race and Hispanic origin are subjective self-reports chosen from a list of
ethnoracial categories specified by the survey (and by the federal govern
ment) and may be susceptible to changes in self-definition over time and
circumstance. Consider, for example, the findings of an exploratory analysis of merged 1996-97 CPS data (Rumbaut, 1998b), which focused on Cu
bans, Mexicans, and Puerto Ricans ? the only distinctive Hispanic groups for which the CPS permits a self-report of ethnic identity (the rest are
lumped under Central/South Americans or Other Spanish). Against that
subjective measure of ethnicity, I contrasted an alternative, objective
measure
based on the country of birth of respondents and of their mother and father.
By using both approaches to "define" who is Cuban, the data yielded a
weighted 1997 "subjective" estimate of about 1.2 million Cubans in the
United States (based on the self-report of respondents who said they were
Cuban), in contrast to an "objective" estimate of 1.6 million Cubans (based on the data on nativity
? i.e., if either the respondent or one or both of the
parents were born in Cuba, they were classified as of Cuban origin). I dubbed this "The Case of the 400,000 Missing Cubans," pointing
out that subjective self-reports may miss large numbers of people who, as a
result of intermarriage and assimilation, especially by the third generation,
may stop identifying ethnically as such and fade into what Richard Alba
(1985, 1990) has called the "twilight of ethnicity" - or disappear into
panethnic and racial categories, much as Haitians, Jamaicans and other West
Indians have been observed to begin to "fade to black" by the second
generation (Kasinitz et al, 2001; Waters, 1999). The "missing Cubans"
tended to be U.S. born, living outside of the dense Miami enclave, more
likely to be children of mixed marriages, and did not self-report as "Cuban"
to the CPS question on Hispanic origin. For the Cuban sample, that was a large discrepancy (close to a 25%
difference between the subjective and the objective measures of ethnicity). But for Mexicans and Puerto Ricans, the comparisons between subjective
and objective definitions yielded only small single-digit discrepancies in size
estimates, suggesting (perhaps) that those groups were more likely to main
tain "thick" ethnic identities over time and generation. Na?ve intergenera
tional studies relying on
self-report measures of ethnicity alone may thus
underestimate the generational slippage and the erosion or "thinning" of
1172 International Migration Review
ethnicity that may occur among differentially advantaged or disadvantaged
groups by the third generation. Table 2 focuses on the first and second generations only, but replaces
the race and Hispanic origin classification for the specific countries of birth
of the respondents (or, for the U.S.-born second generation, of their par
ents). The result yields a
vastly different panorama, revealing the extraordi
nary diversity of national origins that comprises the so-called "foreign-stock" or immigrant-origin population of the United States. Note that in Table 2
Puerto Ricans and other U.S. islanders, who have birthright citizenship, are
listed at the bottom of the table and not included with the immigrant-origin totals, to separate these different citizenship categories (although island born
vs. mainland born first and second generations are
reported for them as
well). Again the table provides both weighted estimates for each group, as
well as the CPS sample sizes. Each of the groups listed have total sample sizes
at least in the thousands (the data for the first- and second-generation Mexicans are based on a merged sample size of over 51,000 cases), with only
two of those listed (the Iranians and Israelis) limited to sample sizes in the
hundreds. In addition, the table provides data on sex and age for each group, as well as the proportion of each group that is foreign born.
The data presented in Table 2 allow for an approximate rank ordering
by size and median age of the largest national-origin groups within the first
and second generations. As the data show, the Mexican-origin population
clearly dwarfs all others in both the first and second generations. By the turn
of the century, the first generation of Mexican immigrants totaled about 8.3
million persons ?
about 7 million more than the next sizable immigrant
groups (the Filipinos, Chinese, Cubans, and Vietnamese) - and with a
median age of 32 years they were one of the youngest immigrant populations in the United States as well. The Mexican-American second generation added another 7 million persons
- over three times larger than the next
largest second-generation group (the "old second generation" of Italian
Americans, estimated at 2.1 million), but with a median age of only 12 years the Mexican-American second generation
was far younger than Italian
Americans of foreign parentage (whose median age was 66, mostly the
children of Italian immigrants who had come to the United States in the
early twentieth century). Both through immigration and natural increase, the Mexican-origin population of the United States is growing more rapidly than virtually any other group and is, as such, of central interest for the study
of immigrant intergenerational mobility. More than three out of every four immigrants in the United States
Ages, Life Stages, and Generational Cohorts 1173
today come from Latin America, the Caribbean and Asia; Mexico alone accounts for more than one fourth of the total. While only one fifth of the
31 million comprising the immigrant first generation hailed from Europe or
Canada, nearly half of the 27 million comprising the second generation did so. Indeed, not only the Italian but also the Canadian, German, British,
Irish, Polish, and Russian second generations are
larger than any other except
for the Mexican, but their median ages are much older, reflecting the fact that they consist largely of the surviving offspring of immigrants who had come to the United States before World War II.
The age data reveal sharp differences between the "old" and the "new"
second generation. As Table 2 shows, the median age of the combined
European and Canadian second generations was 57, compared
to a much
younger average of 12 to 13 years for the U.S.-born offspring of Latin
American, Caribbean and Asian-origin immigrants. For the latter groups, the median age of the generation of their U.S.-born children is still very
young - in fact, they mostly consist of children, with median ages ranging
from 7 to 17 for almost all the groups, the principal exception being the
Japanese second generation with a median age of 35 - a telling marker that
reflects the recency of the immigration of the rest of the first-generation
groups from Latin America and Asia.
In this table, a methodological caveat worth underscoring is the fact
that the data on national origin for second-generation persons (defined as
native born of foreign-born parents) are based on the parents' country of
birth, as discussed earlier. The weighted estimates show that of the more
than 27 million U.S.-born persons of foreign parentage, over 13 million have
parents who were both born in the same foreign country, and nearly 12
million more have one parent born in the United States; for all of them, the
national-origin classification of the U.S.-born child is straightforward. But in
over 2 million cases (8% of the native-born second generation), the parents
were born in different foreign countries, posing a problem in the allocation
of ethnicity. The data in Table 2 follow the mother-centric rule described above:
e.g., in cases where the mother is Mexican and the father is not, the child is
assigned to the Mexican row. I carried out separate analyses (not shown) to
ascertain the consequences for the size and ethnic composition of all the
immigrant-origin populations using both mother-centric and father-centric
rules in ethnic determinations. The results show which groups gain or lose
in size by employing one rule or the other. For example,
a mother-centric
rule would yield an estimated 219,000 persons added to the "Mexican"

TABLE 2 The Immigrant First and Second Generations of the United States, 1998-2002, by Region and National Origin: Weighted CPS Estimates and Unweighted CPS Cases
First Generation (Foreign-born)
Second Generation (U.S.-born)
Total (1st + 2nd)
Region and National Origin
Weighted Estimate
Sample Size
Media
Sex % (male)
Weighted Sample Estimate Size
Median Age
Sex % (male)
Weighted Estimate
Sample Size
% Foreign Born
Latin America and Caribbean 15,006,700 50,315 35 52 10,422,919 36,079 12 50 25,429,619 86,394 59
Mexico 8,255,639 28,035 32 55 7,051,133 23,600 12 50 15,306,772 51,635 54 Cuba 928,831 3,229 52 49 436,143 1,551 17 48 1,364,974 4,780 68
Dominican Republic 669,359 2,434 37 40 446,122 1,627 10 51 1,115,481 4,061 60
El Salvador1 753,236 2,973 33 52 228,993 2,319 8 51 982,229 5,292 77 Guatemala 386,802 1,468 32 56 176,677 686 7 51 563,479 2,154 69
Other Central America 784,891 2,696 35 47 439,145 1,521 11 50 1,224,036 4,217 64
Colombia 486,272 1,719 39 46 236,848 850 12 47 723,120 2,569 67
Ecuador, Peru 552,521 1,949 37 50 263,477 967 10 51 815,998 2,916 68
Other South America 607,923 2,015 36 50 263,011 881 13 53 870,934 2,896 70
Haiti 472,444 1,090 38 51 241,569 555 11 48 714,013 1,645 66 Jamaica 441,896 1,026 40 47 250,275 574 13 51 692,171 1,600 64
Other West Indies 666,886 1,681 39 47 389,526 948 13 47 1,056,412 2,629 63 Asia and Middle East 8,015,700 18,807 38 48 3,884,143 9,616 13 50 11,899,843 28,423 67
Philippines 1,401,792 3,655 41 43 819,497 2,196 13 50 2,221,289 5,851 63 China 921,941 2,112 42 48 410,999 940 20 50 1,332,940 3,052 69
Hong Kong, Taiwan 510,773 1,141 37 47 195,997 444 13 48 706,770 1,585 72
Vietnam 894,880 1,819 37 51 306,718 627 8 57 1,201,598 2,446 74 Laos, Cambodia 259,436 647 36 46 213,762 511 10 48 473,198 1,158 55
India 991,647 2,256 35 55 332,436 773 11 51 1,324,083 3,029 75 Korea 764,097 1,850 38 41 274,146 667 12 50 1,038,243 2,517 74 Japan 428,232 1,146 37 44 335,253 1,138 35 48 763,485 2,284 56
Other SE Asia 821,489 1,873 34 49 368,338 825 7 50 1,189,827 2,698 69
Iran 286,976 600 43 55 125,722 276 12 51 412,698 876 70 Israel 91,448 225 36 56 68,570 172 16 44 160,018 397 57
Arab Middle Eastb 642,989 1,483 37 57 432,705 1,047 16 51 1,075,694 2,530 60
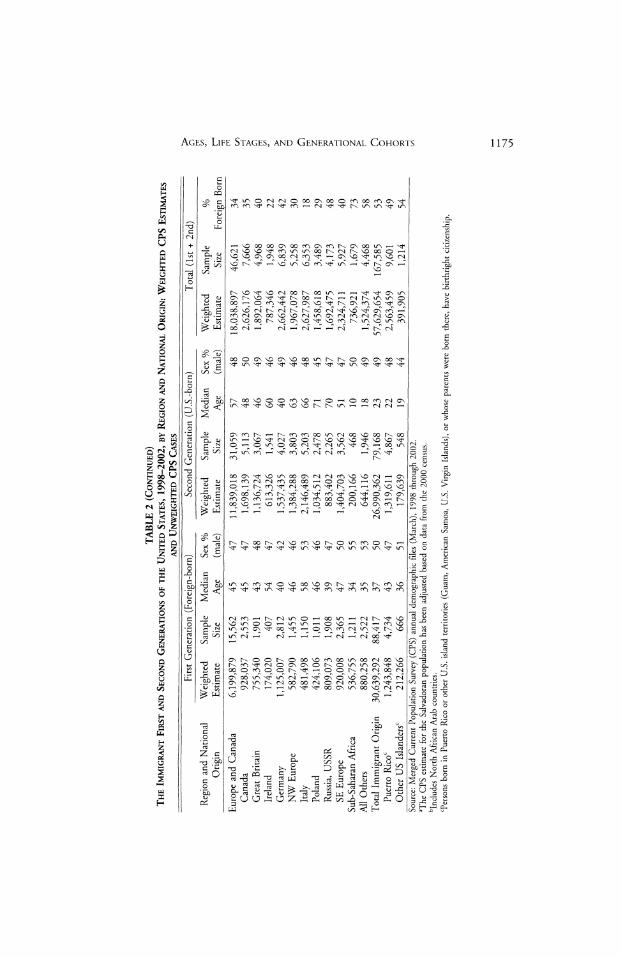
TABLE 2 (Continued) The Immigrant First and Second Generations of the United States, 1998-2002, by Region and National Origin: Weighted CPS Estimates and Unweighted CPS Cases
First Generation (Foreign-born)
Second
Generation
(U.S.-born)
Total (1st + 2nd)
Region and National Origin
Weighted Estimate
Sample Size
Mediar Age
Sex % (male)
Weighted Estimate
Sample Size
Median Sex %
Age (male)
Weighted Estimate
Sample Size
% Foreign Born
Europe and Canada
Canada
Great Britain
Ireland Germany NW
Europe Italy Poland
Russia, USSR SE Europe Sub-Saharan Africa
All Others
Total Immigrant Origin
Puerto Ricoc
Other
US Islanders0
6,199,879 928,037 755,340 174,020 1,125,007
582,790
481,498 424,106 809,073
920,008
536,755 880,258 30,639,292
1,243,848 212,266
15,562 2,553 1,901 407
2,812
1,455 1,150 1,011 1,908
2,365 1,211 2,522 88,417 4,734
666
45 45 43 54 40 46 58 46 39 47 34 35 37 43 36
47 47 48 47 42 46 53 46 47 50 55 53 50 47 51
11,839, 1,698, 1,136, 613,
1,537,
1,384,
2,146, 1,034, 883,
1,404, 200, 644,
26,990,
1,319, 179,
018 139 724 326 ,435 ,288 ,489 ,512 ,402
703 ,166 ,116 ,362 ,611 ,639
31,059 5,113 3,067 1,541 4,027 3,803 5,203 2,478 2,265 3,562 468 1,946 79,168 4,867
548
57 48 46 60 40 63 66 71 70 51 10 18 23 22 19
50 49 46 49 46 48 45 47 47 50 49 49 48 44
18,038,897 2,626,176
1,892,064
787,346 2,662,442 1,967,078 2,627,987 1,458,618 1,692,475
2,324,711 736,921
1,524,374 57,629,654 2,563,459
391,905
46,621 7,666 4,968 1,948 6,839 5,258
6,353
3,489 4,173 5,927 1,679 4,468 167,585 9,601 1,214
34 35 40 22 42 30 18 29 48 40 73 58 53 49 54
Source: Merged Current Population Survey (CPS) annual demographic files (March), 1998 through 2002. aThe CPS estimate for the Salvadoran population has been adjusted based on data from the 2000 census.
includes North African Arab countries.
cPersons born in Puerto Rico or other U.S. island territories (Guam, American Samoa, U.S. Virgin Islands), or whose parents were born there, have birthright citizenship.

1176 International Migration Review
totals, while a father-centric approach would yield 158,000 - for a net
differential of 61,000 persons added to the Mexican totals when a mother
centric rule is used (or an equivalent loss were a father-centric rule used).
Similarly, the Filipinos gain 34,000 to their second-generation totals
via a mother-centric approach, the Canadians gain 46,000, while Domini
cans lose 32,000 and the Italians and Russians lose about 40,000 each. For most other groups the plus/minus differentials are much smaller than those, and in any event they generally entail quite small percentages of their second
generation size estimates. Of course, in analyses of single
nationalities as
opposed to comparative studies, there would be no need to privilege the
maternal or paternal country of birth in these allocations; rather, any in
stance in which a mother or a father is born in, say, Mexico, could be
included in the analysis. (In the Mexican example given, a total of 219,000 + 158,000 = 377,000 persons could be tallied to the Mexican national-origin totals).
Table 3 switches lenses from the demography to the geography of the
first and second generations in the United States. For each of the principal
national-origin groups listed, Table 3 provides their top three primary areas
of settlement, with a measure of their level of concentration in each as a
proportion of their total national population. The results vividly document the huge significance of Southern California and the New York region; those two regions alone absorbed nearly one third of the national immigrant-stock
population. In Los Angeles County alone, 5.9 million people, or 62 percent of its 9.6 million residents, were of immigrant origin; another 3.6 million
persons of foreign birth or parentage lived in the adjacent counties of Or
ange, Riverside, San Bernardino and San Diego,
so that the corridor stretch
ing from San Diego to Los Angeles alone contained 16.4 percent of the
country's foreign-stock population.
New York City and the adjacent New Jersey metropolitan areas on the other side of the Hudson River combined for another 16 percent of the
country's first and second generations. The Bay Area in northern Califor nia
? encompassing San Francisco, Oakland and San Jos?
? and the corridor
stretching from Miami to Ft. Lauderdale and Palm Beach in South Florida each absorbed nearly 5 percent of the national immigrant-origin population.
Nearly three fourths of greater Miami's population was either foreign born or of foreign parentage, the highest proportion in the United States.
Clearly, as Table 3 shows, some
groups are far more densely
concen
trated than others. Nationally, four out of five Dominicans {78%) reside in the New York/New Jersey area or greater Miami ? the most highly concen
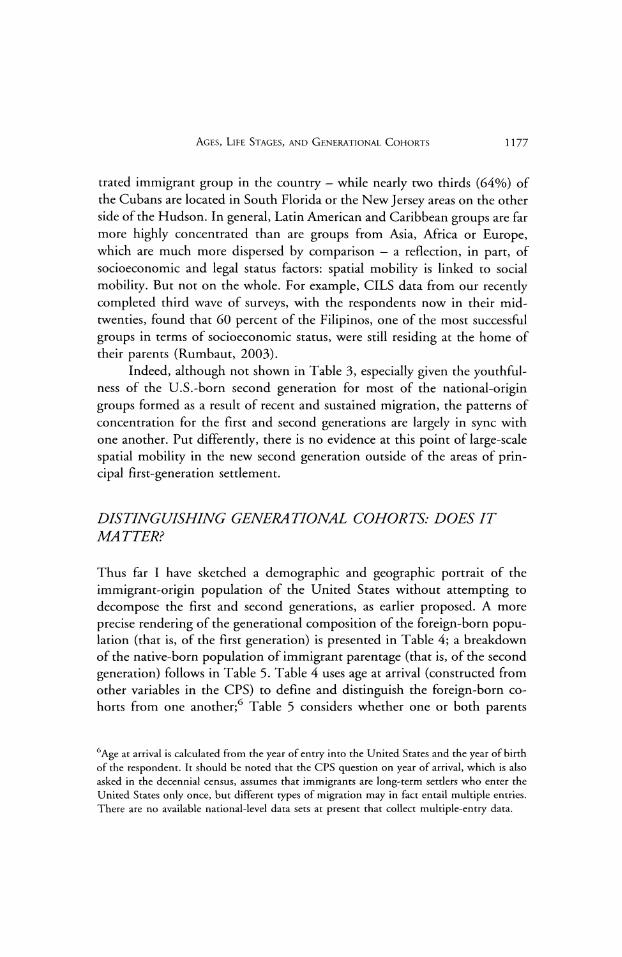
Ages, Life Stages, and Generational Cohorts 1177
trated immigrant group in the country - while nearly two thirds (64%) of
the Cubans are located in South Florida or the New Jersey areas on the other
side of the Hudson. In general, Latin American and Caribbean groups are far more highly concentrated than are groups from Asia, Africa or Europe, which are much more dispersed by comparison
- a reflection, in part, of
socioeconomic and legal status factors: spatial mobility is linked to social
mobility. But not on the whole. For example, CILS data from our recently
completed third wave of surveys, with the respondents now in their mid
twenties, found that 60 percent of the Filipinos, one of the most successful
groups in terms of socioeconomic status, were still residing at the home of
their parents (Rumbaut, 2003).
Indeed, although not shown in Table 3, especially given the youthful ness of the U.S.-born second generation for most of the national-origin
groups formed as a result of recent and sustained migration, the patterns of
concentration for the first and second generations are largely in sync with
one another. Put differently, there is no evidence at this point of large-scale
spatial mobility in the new second generation outside of the areas of prin
cipal first-generation settlement.
DISTINGUISHING GENERATIONAL COHORTS: DOES IT MATTER?
Thus far I have sketched a demographic and geographic portrait of the
immigrant-origin population of the United States without attempting to
decompose the first and second generations, as earlier proposed. A more
precise rendering of the generational composition of the foreign-born popu lation (that is, of the first generation) is presented in Table 4; a breakdown
of the native-born population of immigrant parentage (that is, of the second
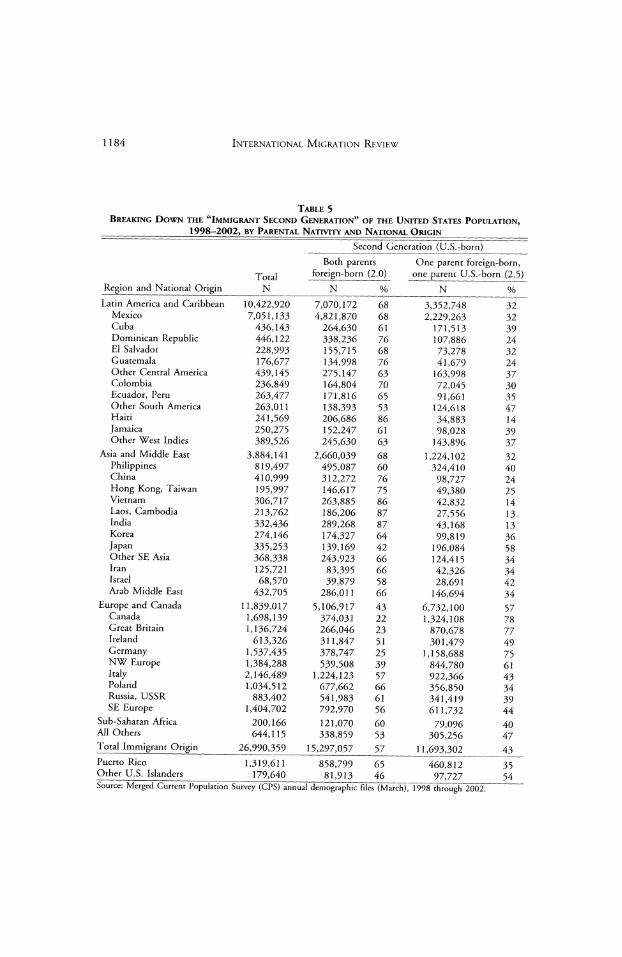
generation) follows in Table 5. Table 4 uses age at arrival (constructed from
other variables in the CPS) to define and distinguish the foreign-born co
horts from one another;6 Table 5 considers whether one or both parents
6Age at arrival is calculated from the year of entry into the United States and the year of birth
of the respondent. It should be noted that the CPS question on year of arrival, which is also
asked in the decennial census, assumes that immigrants are long-term settlers who enter the
United States only once, but different types of migration may in fact entail multiple entries.
There are no available national-level data sets at present that collect multiple-entry data.

TABLE 3 Principal Metropolitan Areas* of Settlement for the Immigrant Stock (Foreign-born and U.S.-born) Population of the United States, _1998-2002, by Regional and National Origin_
__
Combined
National Origin
Total N
Primary
Secondary
Tertiary
MSA
N
MSA
N
MSA
N
N
%
Latin America and Caribbean 27,993,079 Los Angeles 3,988,397 14
Mexico 15,036,774 Los Angeles 2,880,729 19 Cuba 1,364,975 Miami 701,946 51
Dominican Republic 1,115,480 New York 669,973 60
El Salvador 982,229 Los Angeles 316,455 32 Guatemala 563,479 Los Angeles 241,719 43
Other Central America 1,224,035 Miami 176,224 14
Colombia 723,120 New York 139,894 19
Ecuador, Peru 815,998 New York 241,972 30
Other South America 870,934 Miami 87,893 10
Haiti 714,012 Ft. Lauderdale/ 158,133 22 Palm B.
Jamaica 692,172 New York 248,475 36
Other West Indies 1,056,412 New York 497,231 47
New York
San Diego/ Orangeb
New Jersey suburbs
New Jersey
suburbs
Washington,
DC New York Los Angeles New Jersey
suburbs
New Jersey
suburbs
New Jersey suburbs
New York
Ft. Lauderdale/ Palm B.
New Jersey suburbs
3,126,339 11 1,619,475 11 97,663 7 140,995 13 126,839 13 30,951 5 155,281 13 113,145 16 130,642 16 67,682 8 153,778 22 81,147 12 86,630 8
San Diego/ Orange Chicago
Ft. Lauderdale/ PalmB.
Miami
Houston SF/Oakland/ San Jose
New
York
Miami
Los Angeles
New York
Miami
New Jersey suburbs Los Angeles
1,867,076 804,633 81,174 57,699 95,930
30,346 108,331
106,617 62,647 65,911 116,167 48,121 43,952
7 5 6 5 10
5 9 15 16 7
8,981,812
32 5,304,837 35 880,783 868,667 539,224 303,016 435,261 221,486 428,078 377,743 627,813
65 78 55 54
439,836 36 359,656 50
53 25 60 55 59
O Z g? <

TABLE 3 (Continued) Principal Metropolitan Areas51 of Settlement for the Immigrant Stock (Foreign-born and U.S.-born) Population of the United States, _1998-2002, by Regional and National Origin_
Top 3 Combined
National
Origin
Total N
Primary
Secondary
Tertiary
MSA
N
MSA
N
MSA
N
%
N
%
Asia and Middle East
Philippines
China
Hong Kong, Taiwan
Vietnam
Laos, Cambodia
India Korea Japan
Other SE Asia
Iran Israel
Arab Middle East
11,803,889
SF/Oakland/San
Jose 1,290,912 2,221,289 San
Diego/Orange
360,172 1,332,940
SF/Oakland/San
Jose 244,284 706,769
Los Angeles 130,201
1,201,596 SF/Oakland/San Jose 211,807 473,199
San Diego/Orange
39,955 1,324,084
New Jersey suburbs 139,021
1,038,242
Los Angeles 196,708
763,487
Los Angeles 77,372
1,189,826 New York 155,138 412,701
Los Angeles 114,833
160,018
New York 29,808 1,030,725 Detroit 120,770
11 Los Angeles 16 Los Angeles New York
SF/Oakland/ San Jose San Diego/
Orange SF/Oakland/ San Jose
Chicago New York
10 19 28 19
San Diego/
Orange SF/Oakland/ San Jose San Diego/ Orange Los Angeles
1,261,280 11 276,404 12 176,792 13 129,714 18 154,604 13 23,681 115,200
110,222
9 11
12 New York
53,435 7 131,553 11 44,408 11 19,148 12 89,518 9
San Diego/ 1,019,533
Orange
SF/Oakland/ 268,969 San Jose
Los Angeles 120,693 New York 55,680 Los Angeles 106,067 Philadelphia 20,846 New York 110,121 Washington, 83,189
DC
San Diego/ 47,437
Orange
San Diego/ 77,424
Orange
Washington, 40,361
DC
New Jersey 13,414
suburbs
Los Angeles 89,041
9 3,571,725 30 12 905,545 41 9 541,769 41 8 315,595 45 9 472,478 39 4 84,482 18 8 364,342 28 8 390,119 38 6 178,244 23 7 364,115 31 10 199,602 48 8 62,370 39 9 299,329 29
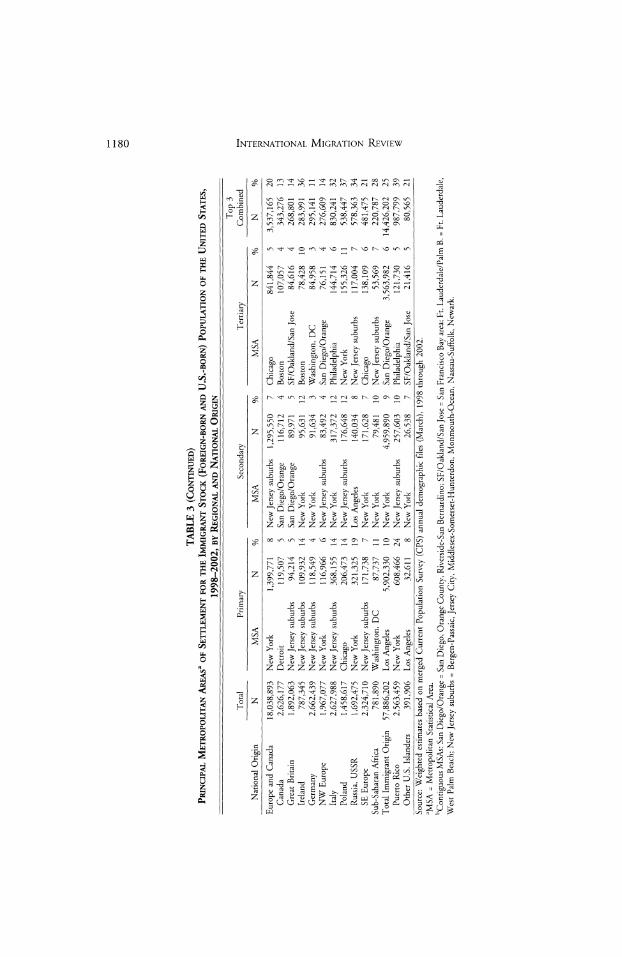
TABLE 3 (Continued) Principal Metropolitan Areas3 of Settlement for the Immigrant Stock (Foreign-born and U.S.-born) Population of the United States, _1998-2002, by Regional and National Origin_
___ Combined
National Origin
Total N
Primary
Secondary
Tertiary
MSA
N
MSA
N
%
MSA
N
N
Z H O Z <
Europe and Canada
Canada
Great Britain
Ireland
Germany NW Europe
Italy
Poland Russia, USSR SE Europe Sub-Saharan
Africa Total
Immigrant Origin
Puerto Rico
Other U.S. Islanders
18,038,893 New York 1,399,771 8 New Jersey suburbs 1,295,550 2,626,177 Detroit 119,507 5 San Diego/Orange 116,712
1,892,063 New Jersey suburbs 94,214 5 San Diego/Orange 89,971
787,345 New Jersey suburbs 109,932 14 New York 95,631 2,662,439 New Jersey suburbs 118,549 4 New York 91,634
1,967,077 New York 116,966 6 New Jersey suburbs 83,492
2,627,988 New Jersey suburbs 368,155 14 New York 317,372
1,458,617 Chicago 206,473 14 New Jersey suburbs 176,648
1,692,475 New York 321,325 19 Los Angeles 140,034
2,324,710 New Jersey suburbs 171,738 7 New York 171,628
781,890 Washington, DC 87,737 11 New York 79,481 57,886,202 Los Angeles 5,902,330 10 New York 4,959,890
2,563,459 New York 608,466 24 New Jersey suburbs 257,603
391,906 Los Angeles 32,611 8 New York 26,538
7 Chicago 841,844 5 3,537,165 20 4 Boston 107,057 4 343,276 13
5 SF/Oakland/San Jose 84,616 4 268,801 14
12 Boston
78,428
10 283,991 36
3 Washington, DC 84,958 3 295,141 11
4 San Diego/Orange 76,151 4 276,609 14
12 Philadelphia 144,714 6 830,241 32 12 New York 155,326 11 538,447 37
8 New Jersey
suburbs
117,004 7 578,363 34
7 Chicago
138,109
6 481,475 21
10 New Jersey
suburbs
53,569 7 220,787 28
9 San Diego/Orange 3,563,982 6 14,426,202 25 10 Philadelphia 121,730 5 987,799 39
7 SF/Oakland/San Jose 21,416 5 80,565 21
Source: Weighted estimates based on merged Current Population Survey (CPS) annual demographic files (March), 1998 through 2002
aMSA = Metropolitan Statistical Area.
Contiguous MSAs: San Diego/Orange = San Diego, Orange County, Riverside-San Bernardino; SF/Oa! West Palm Beach; New Jersey suburbs = Bergen-Passaic, Jersey City, Middlesex-Somerset-Hunterdon
kland/San Jose = San Francisco Bay area; Ft. Lauderdale/Palm B. = Ft. Lauderdale,
Monmouth-Ocean, Nassau-Suffolk, Newark.

Ages, Life Stages, and Generational Cohorts 1181
were foreign born. In both tables the data are broken down by national
origin for the specific generational cohorts described above.7
Table 4 provides weighted CPS estimates of the size and proportion of
foreign-born persons who arrived in the United States as adults or children, broken down by our proposed typology of "seven ages" or life stages: Early childhood (the 1.75 cohort who arrived as pre-school children, ages 0-5);
middle childhood (the 1.5 generation, ages 6 to 12); adolescence (the 1.25
cohort, ages 13 to 17); adult transition (ages 18-24); early adulthood (ages 25-34); middle adulthood (ages 35-54); and late adulthood (ages 55 and
older). As Table 4 shows, of the approximately 30 million foreign born
(excluding Puerto Ricans and other U.S. islanders), an estimated 18 million
(60%) arrived as adults and another 12 million (40%) as children under 18.
Indeed, international migration is the province of the young. Among the
adult cohorts, most came between the ages of 18 and 34 (44% of all
immigrants), with the largest cohort composed of young immigrants 18 to
24 years old (about 6.9 million) and 25 to 34 years old (6.3 million). Very few (13%) immigrated in mid-adulthood (ages 35 to 54) and fewer still (3
percent) in late adulthood.
There are remarkable generational-cohort differences by national ori
gin, suggesting both differences in migration histories as well as potentially
significant implications for social and economic adaptation outcomes. For
example, Mexico, El Salvador and Guatemala, the sending countries with
the highest proportion of undocumented immigrants in the United States
had the highest proportions of immigrants who arrived in their teens and
early twenties, with the 13-17 and 18-24 age cohorts accounting for nearly half of their immigrant totals. More than a third (35%) of those born in
India, however, came to the United States between ages 18 to 24 alone, a
reflection of the large number of young Indian immigrants who have arrived
in the United States with college degrees and preferred job skills and possibly of others who entered with H-1B work visas or as international students (and
who may subsequently gain permanent residence).
By contrast, persons who came from Cuba, China and the former
Soviet Union (all communist countries) were far more likely than other
nationalities to have arrived in middle and late adulthood (with over one
7The construction of these distinctive cohorts further reduces the sample size for the smaller
national-origin groups, shown earlier in Table 2, so that even with five years of merged CPS
data the Ns for certain groups may become too small for reliable estimates, e.g., for older-adult
immigrants among the Laotians and Cambodians, Japanese, Iranians, Israelis, and the Irish.
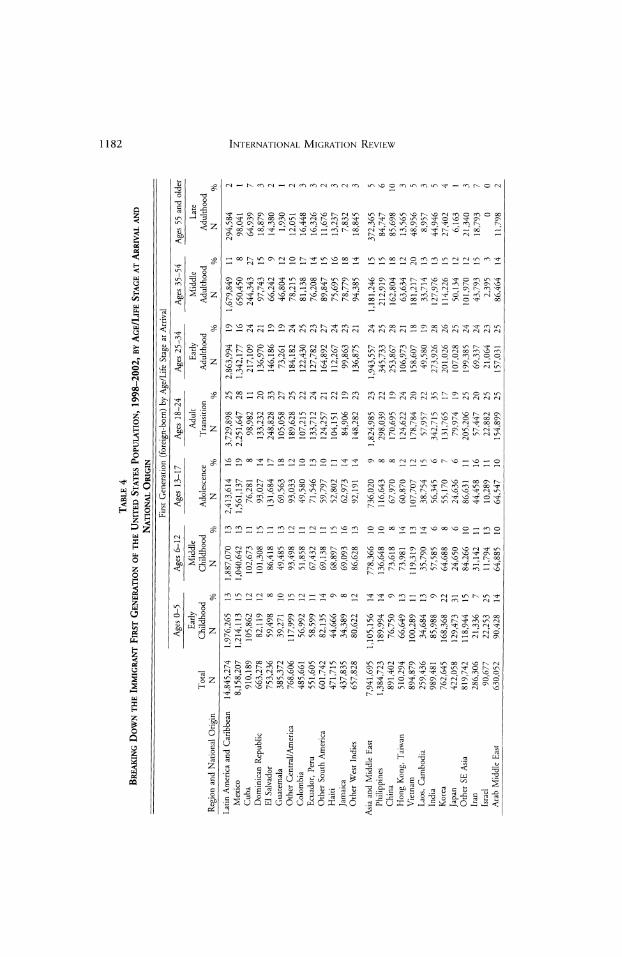
Table 4 Breaking Down the Immigrant First Generation of the United States Population, 1998-2002, by Age/Life Stage at Arrival and
_ National Origin
First Generation (foreign-born) by Age/Life Stage at Arrival
Region and National Origin
Total N
Ages 0-5 Early Childhood N 9
Ages 6-12 Middle Childhood
N ?/
Ages 13-17 Adolescence
N ?/c
Ages 18-24 Adult Transition
N ?A
ges 25-34
Ages 35-54
Ages 55 and older
Early
Adulthood
N 9
Middle Adulthood N %
Late Adulthood
N %
Latin America and Caribbean 14,845,274
Mexico 8,158,207 Cuba 910,189
Dominican Republic 663,278
El Salvador 753,236 Guatemala 385,372
Other Central/America 768,606
Colombia 485,661 Ecuador, Peru 551,605
Other South America 601,742
Haiti 471,715
Jamaica 437,835
Other West Indies 657,828 Asia and Middle East 7,941,695
Philippines 1,384,723
China 891,402
Hong Kong, Taiwan 510,294
Vietnam 894,879
Laos, Cambodia 259,436
India 989,481 Korea 762,645 Japan 422,058
Other SE Asia 819,742
Iran 286,306
Israel 90,677
Arab Middle East 630,052
1,976,265 1,214,113 82,119 59,498 39,271 117,999
56,992 58,599
82,135
44,666 34,389
80,622
13 15
105,862 12 1,105,156
189,994 76,750 66,649 100,289 34,684 85,988 168,368 22 129,473 31 118,944 15 21,336 7 22,253 25 90,428 14
1,887,070 1,040,642 102,673 101,308 86,418 49,485 93,498 51,858 67,432 69,138 68,897 69,093 86,628 778,366 136,648 73,618 73,981 119,319 35,790 57,585 64,688 24,650
84,266
31,142 11,794 64,885
13 13 11 15 11 13 12 11 12 11 15 16 13 10 10 8 14 13 14 6 8 6 10 11 13 10
2,413,614 1,561,137 76,281 93,027 131,684 69,563 93,033 49,580
71,546
59,797 52,802 62,973 92,191
736,020
116,643 67,970 60,870 107,707 38,754 56,345 55,170 24,636 86,631 44,458 10,289 64,547
16 19 8 14 17 18 12 10 13 10 11 14 14
3,729,898 2,251,647 98,982
133,232 248,828 105,058 189,628 107,215 133,712 124,257 104,151
84,906
148,282 1,824,985
298,039 170,695 124,622 178,784 57,957 342,715 131,765
79,974
205,206 57,447
22,882
154,899
25 2,863,994
M 77
28 11 20 33 27 25 22 24 21 22 19 23 23 22 19 24 20 22 35 17 19 25 20 25 25
1,342, 217 136, 146, 73, 184,
122, 127, 164, 112,
99, 136,
11
109 24 970 21 186 19 261 19 182 24 (430 25 782 23 892 27 267 24 863 23 875 21 1,943,557 24 345,733 25 253,867 28 106,973 21
18 19 28
158,607 49,580 273,926 201,026 26 107,028 25 199,385 24 69,337 24 21,064 23 157,031 25
1,679,849 650,450 8 244,343 27 97,743 15 66,242 9 46,804 12 78,215 10 81,138 17 76,208 14 89,847 15 75,695
78,779
94,385 1,181,246 212,919 162,804 63,634 181,217 33,714 127,976 114,226 50,134 101,970 43,793 2,395
86,464
16 18 14 15 15 18 12 20 13 13 15 12 12 15 3 14
294,584 98,041
64,939 18,879 14,380 1,930
12,051 16,448 16,326 11,676 13,237 7,832 18,845 372,365 84,747 85,698 13,565 48,956 8,957 44,946 27,402 6,163 21,340 18,793 0
11,798
2 1 7 3 2 1 2 3 3 2 3 2 3 5 6 10 3 5 3 5 4 1 3 7 0 2

Table 4 (Continued) Breaking Down the Immigrant First Generation of the United States Population, 1998-2002, by Age/Life Stage at Arrival and National Origin
First Generation (foreign-born)
by Age/Life Stage at Arrival
Region and
National
Origin
Total N
Ages 0-5 Early Childhood
N %
Ages 6-12 Middle Childhood N %
iges
13-17
Ages 18-24
Adolescence
N %
Adult Transition
N C
Ages 25-34 Early
Adulthood
N ?/
Ages 35-54 Middle
Adulthood
N ?A
.ges 55 and older Late
Adulthood N %
Europe and Canada
Canada Great Britain
Ireland Germany
NW Europe
Italy Poland Russia, USSR
SE Europe Sub-Saharan
Africa
All Others
Total Immigrant Origin
5,500,303 775,014 666,672 142,043
1,035,447 500,258 369,528 385,306 763,398 862,637 536,020 861,837
29,685,129
5 27
1,367,132 209,516 173,840 26 15,910 11 529,452 106,115 76,743 29,742 102,185 123,629
55,956
127,043
51 21 21 8 13 14 10 15
4,631,912 16
596,576 96,033 65,973 6,254 104,879 52,840 41,012 43,663 85,173 100,749
60,826
94,612 3,417,450
11 12 10 4 10 11 11 11 11 12 11 11 12
448,436 69,428
51,335
13,885 59,360 34,192 40,276 35,893 57,973
86,094
59,809 107,478 3,765,357
981,809 137,757 118,548 48,076 134,875 110,074 79,320 85,915 93,422 173,822 130,640 207,369
18 1,183,116 22 18 155,390 20 18 163,846 25 34 36,593 26 13 142,529 14 22 124,361 25 21 78,350 21 22 98,152 25 12 165,713 22 20 218,182 25 24 155,601 29 24 203,153 24
13 6,874,701 23 6,349,421 21
765,428
96,918
83,828 20,707 58,415 67,485 45,935 82,309 170,616 22 139,215 16 65,793 12 100,175 12 3,792,491 13
157,806 9,972 9,302
618
5,937 5,191 7,892 9,632
88,316 20,946 7,395
21,647 853,797
3 1 1 0 1 1 2 2 12 2 1 3 3
Puerto Rico
Other US Islanders
1,155,060 204,768
290,737 25 65,282 32
178,584 14 25,870 13
169,440 25,175
15 242,623 12 41,119
21 146,896 13 20 29,412 14
103,069 9 13,968 7
23,711 2 3,942 2
Source: Merged Current Population Survey (CPS) annual demographic files (March), 1998 through 2002.
1184 International Migration Review
Table 5 Breaking Down the "Immigrant Second Generation" of the United States Population,
_1998-2002, by Parental Nativity and National Origin_ Second Generation (U.S.-born)
Region and National Origin
Total N
Both parents
foreign-born (2.0)
N %
Puerto Rico Other U.S. Islanders
1,319,611 179,640
858,799 81,913
65 46
One parent foreign-born, one parent U.S.-born (2.5)
N % Latin America and Caribbean 10,422,920 7,070,172 68 3,352,748 32
Mexico 7,051,133 4,821,870 68 2,229,263 32 Cuba 436,143 264,630 61 171,513 39
Dominican Republic 446,122 338,236 76 107,886 24 El Salvador 228,993 155,715 68 73,278 32 Guatemala 176,677 134,998 76 41,679 24 Other Central America 439,145 275,147 63 163,998 37
Colombia 236,849 164,804 70 72,045 30 Ecuador, Peru 263,477 171,816 65 91,661 35 Other South America 263,011 138,393 53 124,618 47
Haiti 241,569 206,686 86 34,883 14 Jamaica 250,275 152,247 61 98,028 39
Other West Indies 389,526 245,630 63 143,896 37 Asia and Middle East 3,884,141 2,660,039 68 1,224,102 32
Philippines 819,497 495,087 60 324,410 40 China 410,999 312,272 76 98,727 24
Hong Kong, Taiwan 195,997 146,617 75 49,380 25 Vietnam 306,717 263,885 86 42,832 14
Laos, Cambodia 213,762 186,206 87 27,556 13 India 332,436 289,268 87 43,168 13 Korea 274,146 174,327 64 99,819 36 Japan 335,253 139,169 42 196,084 58
Other SE Asia 368,338 243,923 66 124,415 34 Iran 125,721 83,395 66 42,326 34
Israel 68,570 39,879 58 28,691 42 Arab Middle East 432,705 286,011 66 146,694 34
Europe and Canada 11,839,017 5,106,917 43 6,732,100 57 Canada 1,698,139 374,031 22 1,324,108 78
Great Britain 1,136,724 266,046 23 870,678 77 Ireland 613,326 311,847 51 301,479 49
Germany 1,537,435 378,747 25 1,158,688 75 NW Europe 1,384,288 539,508 39 844,780 61
Italy 2,146,489 1,224,123 57 922,366 43 Poland 1,034,512 677,662 66 356,850 34
Russia, USSR 883,402 541,983 61 341,419 39 SE Europe 1,404,702 792,970 56 611,732 44
Sub-Saharan Africa 200,166 121,070 60 79,096 40 All Others 644,115 338,859 53 305,256 47
Total Immigrant Origin_26,990,359 15,297,057 57 11,693,302_43
460,812 97,727
35
54 Source: Merged Current Population Survey (CPS) annual demographic files (March), 1998 through 2002.
Ages, Life Stages, and Generational Cohorts 1185
third of the Cuban and Soviet/Russian totals coming in the 35?54 and
55-and-older arrival cohorts). Children under 6 years old predominated
among those born in Germany, Japan, South Korea, Canada, and Great
Britain (countries with large numbers of international marriages to U.S.
citizens and of child adoptions in the case of South Korea). Table 5 focuses on the approximately 27 million native-born persons
of foreign parentage who form the second generation, and distinguishes between two groups:
a 2.0 generation of persons who were born in the
United States of two foreign-born parents and the 2.5 cohort of persons who
were born in the United States of one foreign-born parent and one U.S.
born parent (approximating a more acculturated and intermarried popula
tion situated between the second and third generations). Overall, Table 5
shows that a high proportion (43%) of the second generation belongs to the
2.5 cohort, with one U.S.-born parent. But as would be expected, reflecting
the relative recency of migration of different nationalities, there are very
sharp differences by regional origin, with 68 percent of the Latin American
and Asian-origin second generation having two foreign-born parents, in
contrast to only 43 percent of those of European and Canadian parentage.
Theoretically, these generational cohorts may be hypothesized to differ
significantly with regard to a variety of adaptation outcomes, from socio
economic attainment and mobility to
language and acculturation. But that
is an open empirical question, the answer to which requires research that
breaks down the first and second generations by nativity (of self and parents) and age/life stage at arrival into distinct generational segments, rather than
lumping together, as is often the case, the 1.25, 1.5, 1.75, 2.0 and 2.5
cohorts into a de facto second generation. If there are no significant differ
ences between these cohorts, and if they add little or nothing to our under
standing of adaptive trajectories in the second generation broadly conceived,
then it would make practical as well as theoretical sense to aggregate them.
A similar logic would apply to the life-stage distinctions made among im
migrants who arrive as adults. It is to that question that the remainder of this
article is addressed.
EDUCATIONAL AND OCCUPATIONAL ATTAINMENT ACROSS GENERATIONAL COHORTS
Table 6 compares patterns of educational and occupational attainment
across these generational cohorts for all adults who were 25 to 39 years old
at the time of the survey -
ages at which formal education can be expected
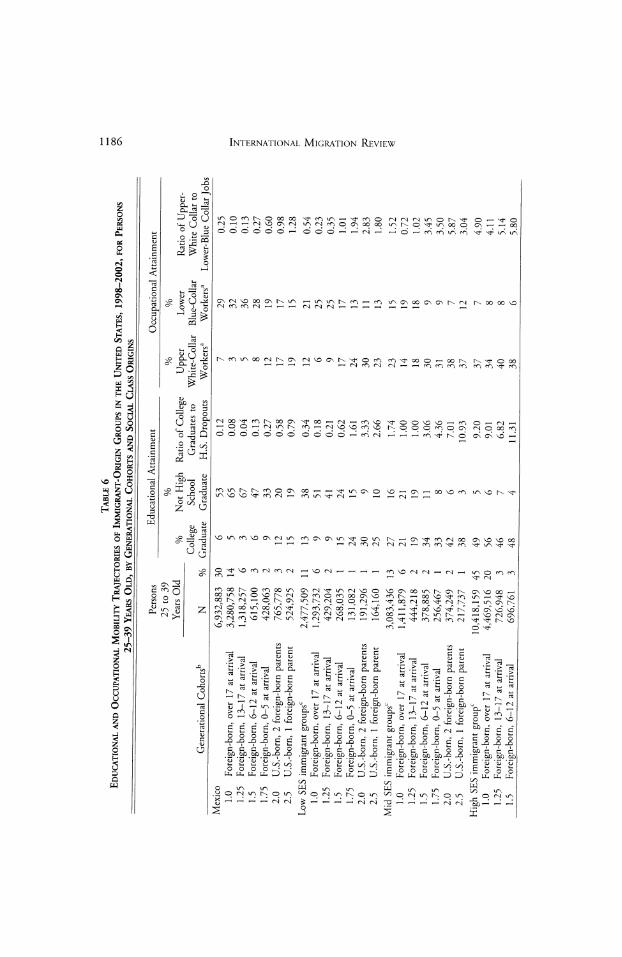
Table 6 Educational and Occupational Mobility Trajectories of Immigrant-Origin Groups in the United States, 1998-2002, for Persons _25-39 Years Old, by Generational Cohorts and Social Class Origins_
Generational Cohorts
Persons 25 to 39 Years Old N <
Educational Attainment
Occupational Attainment
College
Graduate
% Not High School Graduate
Ratio of College Graduates to H.S. Dropouts
Upper Lower Ratio of Upper
White-Collar Blue-Collar White Collar to
Workers3 Workers3 Lower-Blue Collar Jobs
Mexico
1.0 Foreign-born, over 17 at arrival 1.25 Foreign-born, 13-17 at arrival 1.5 Foreign-born, 6-12 at arrival 1.75 Foreign-born, 0-5 at arrival
2.0 U.S.-born, 2 foreign-born parents 2.5 U.S.-born, 1 foreign-born parent
Low SES immigrant groups0
1.0 Foreign-born, over 17 at arrival Foreign-born, 13-17 at arrival
Foreign-born, 6-12 at arrival Foreign-born, 0-5 at arrival
U.S.-born, 2 foreign-born parents U.S.-born, 1 foreign-born parent
Mid SES immigrant groupsc
1.0 Foreign-born, over 17 at arrival Foreign-born, 13-17 at arrival
Foreign-born, 6-12 at arrival Foreign-born, 0-5 at arrival
U.S.-born, 2 foreign-born parents U.S.-born, 1 foreign-born parent
High SES immigrant groupc
1.0 Foreign-born, over 17 at arrival 1.25 Foreign-born, 13-17 at arrival 1.5 Foreign-born, 6-12 at arrival
1.25 1.5 1.75 2.0
2.5 1.25
1.5 1.75 2.0
2.5
883 30 758 14 ,257 6 100 063
778 925
509 11 732 6
6,932: 3,280, 1,318. 615: 428. 765. 524;
2,477: 1,293. 429, 268, 131, 191,
164, 3,083, 1,411. 444, 378,
256, 374, 217, 10,418,159 45
4,469,516 20 726,948 3 696,761 3 204 035 082 296 160
436 13 879 6 218 885 467 249 737
6 5 3 6 9 12 15 13 9 9 15 24 30 25 27 21 19 34 33 42 38 49 56 46
53 65 67 47 33 20 19 38 51 41 24 15 9 10 16 21 19 11 8 6 3 5 6 7 4
0.12 0.08 0.04 0.13 0.27 0.58 0.79
0.34 0.18 0.21 0.62 1.61
3.33 2.66
1.74 1.00 1.00
3.06 4.36
7.01 10.93
9.20 9.01 6.82 11.31
7 3 5 8 12 17 19 12 6 9 17 24 30 23 23 14 18 30 31 38 37 37 34 40 38
29 32 36 28 19 17 15 21 25 25 17 13 11 13 15 19 18 9 9 7 12
0.25 0.10
0.13 0.27 0.60
0.98 1.28
0.54 0.23 0.35 1.01 1.94 2.83 1.80 1.52
0.72 1.02 3.45 3.50 5.87
3.04 4.90 4.11
5.14 5.80

Table 6 (Continued) Educational and Occupational Mobility Trajectories of Immigrant-Origin Groups in the United States, 1998-2002, for Persons 25-39 Years Old, by Generational Cohorts and Social Class Origins
Persons 25 to 39 Years Old
Educational Attainment
Occupational Attainment
%
%
Generational Cohorts
N
College
Not High Ratio of College Upper Lower
School Graduates to
White-Collar
Blue-Collar
Ratio of Upper
White Collar to
% Graduate Graduate H.S. Dropouts
Workersa
Workers'1 Lower-Blue Collar Jobs
>
1.75 Foreign-born,
0-5
at arrival 1,178,492 5 40 6 7.00
2.0 U.S.-born, 2
foreign-born
parents 1,365,127 6 52 4 14.73 2.5 U.S.-born, 1
foreign-born
parent 1,981,315 9 41 4 9.14
Total Immigrant Origin 22,911,985 100 29 25 1.19
1.0 Foreign-born, over
17 at
arrival 10,455,885 46 29 32 0.91
1.25 Foreign-born,
13-17
at arrival 2,918,628 13 17 41 0.42 1.5 Foreign-born,
6-12 at
arrival 1,958,781 9 28 22 1.27 1.75 Foreign-born,
0-5 at
arrival 1,994,104 9 32 12 2.53
2.0 U.S.-born, 2
foreign-born
parents 2,696,450 12 37 9 4.14 2.5 U.S.-born, 1
foreign-born parent 2,888,137 13 35_7_4.79
36 42 37 23 18 16 24 29 34 33
7 6 7 16 19 24 15 10 9 9
5.44 7.47
4.92 1.40
0.94 0.65
1.58 2.94 3.55 3.47
Source: Merged Current Population Survey (CPS) annual demographic files
(March),
1998 through 2002. Figures are weighted estimates, in percents except for ratios.
aUpper White-Collar = professionals, executives, and
managers;
Lower Blue-Collar = operators, fabricators, and laborers.
bGenerational cohorts defined as follows: 1.0 = Foreign-born (F.B.), 18 years or older at
U.S. arrival; 1.25 = F.B., 13-17 at U.S. arrival; 1.5 = F.B., 6-12 at U.S. arrival; 1.75 = F.B.,
0-5 at U.S. arrival; 2.0 = U.S.-born, both parents born in
foreign country; 2.5 = U.S.-born, one parent F.B., one parent U.S.-born.
cNational-origin groups ranked by (educational
and
occupational) socioeconomic status (SES) as follows:
Low SES (well below U.S. norms): Dominican Republic, El Salvador, Guatemala, Honduras, Haiti, and Cambodia.
Mid SES (near U.S. norms): Cuba, Costa Rica, Nicaragua, Panama, Colombia, Ecuador, Peru, Guyana, Uruguay, Jamaica, Other West Indies, Vietnam, Armenia, Afghanistan, Iraq,
and Jordan.
High SES (well above U.S. norms): Other South America (Argentina, Bolivia, Brazil, Chile, Venezuela), Philippines, China, Taiwan, India, Korea, Japan, Other Southeast Asia, Iran,
Israel, Other Arab Middle East, Canada, Great Britain, Ireland, Germany, Italy, Poland, Russia/USSR, Other Europe, Africa, and Australia.
> Z a O H O 2! > o o X o oo ̂ 1
1188 International Migration Review
to have been completed. Limiting the data to persons currently 25 to 39
intentionally excludes from this analysis persons who immigrated at older
ages (40 and older) and for the purpose of this analysis effectively controls
for age within each generational cohort (the median age is 32 for each of the
cohorts). For ease of presentation, those who arrived in the United States as
younger adults (between 18 and 39) are considered in Table 6 as the 1.0
immigrant generation and compared against the 1.25, 1.5, 1.75, 2.0 and 2.5
cohorts, as shown in the table. The left-hand panels of Table 6 present a set
of polar indicators of educational attainment - the percent of college gradu ates, the percent of those who did not graduate from high school - and the
ratio of the two. The right-hand panels of the table present a set of polar indicators of occupational attainment
- the percent of upper white-collar
workers (professionals, executives, and managers) and the percent of lower
blue-collar workers (operators, fabricators, and laborers) - as well as the ratio
of those two.
These data are provided first for the largest of all the immigrant
groups ? those of Mexican origin
? who not only account for fully 30
percent of all first- and second-generation persons aged 25 to 39, but also
exhibit the lowest level of educational and occupational attainment among all immigrant nationalities in the United States, a legacy of their history as
the largest and longest-running labor migration in the contemporary world.
The table then provides the same generational-cohort breakdown for all
other immigrant groups, now ranked by their human capital profiles into
low-SES, mid-SES, and high-SES strata, as compared
to U.S. norms.
The specific nationalities grouped in each of these three strata are listed at the bottom of Table 6, reflecting a mix of immigrant types and modes of
incorporation ?
laborers, professionals, refugees {cf. Portes and Rumbaut,
1996). Low-SES immigrant groups (with attainment characteristics well
below U.S. educational and occupational norms for adults 25-39) hail from
the Dominican Republic, El Salvador, Guatemala, Honduras, Haiti, Laos and Cambodia. High-SES immigrant groups (with attainment characteris
tics well above U.S. norms) include most of the countries of Asia, Africa, and
Europe, as well as Canada, Australia, and several South American countries.
In the middle (with profiles closer to U.S. norms) are immigrant groups from Cuba, Costa Rica, Nicaragua, Panama, Colombia, Ecuador, Peru,
Jamaica, Vietnam, Afghanistan, and Iraq. As a point of comparison, 28
percent of all 25-to-39 year olds in the United States were college graduates and 8 percent were high school dropouts (as estimated from the same
merged 1998-2002 CPS data set). The rates for non-Hispanic whites of
Ages, Life Stages, and Generational Cohorts 1189
native parentage (third generation and beyond) were 32 and 7 percent,
respectively. The patterns that emerge are revealing.
First, looking only at the patterns for the 1.0 generations, there is a
huge gulf evident between high-SES immigrants as a whole - with college
graduation rates of 56 percent and high school dropout rates of 6 percent ?
and those from Mexico, with only 5 percent of 25?39 year olds having
college diplomas and 65 percent lacking high school diplomas. For the 1.0
Mexican immigrants, the ratio of college graduates to high school dropouts is 0.08, in sharp contrast to the 9.0 ratio for high-SES immigrants. In
between are the mid-SES groups, with equivalent 21 percent rates of college
graduates and high school dropouts (a ratio of 1.0), and the low-SES groups, with college graduation rates of 9 percent and high school dropout rates of
51 percent (a ratio of 0.18). In most cases, these levels of education may be presumed
to have been
brought over from the home country ?
having arrived in the United States
as adults, it is likely that their education was completed abroad ? unlike the
situation for those who arrived as children or who were born in the United
States, whose education may be presumed to have been completed here.
These data, especially when they are examined by country of origin for the
1.0 generation (not shown in the table), reveal extremely sharp differences in
human capital from the top groups (the Indians and Chinese, Russian Jews,
Koreans) to the bottom (the Mexicans, Salvadorans and Guatemalans, Cam
bodians and Laotians), with patterns of attainment that are virtually the
polar opposites of each other.
How those initial advantages or disadvantages of the 1.0 generation of
different immigrant nationalities play out across the other generational
groupings is detailed in Table 6. One pattern that stands out is the fairly
rapid advancement of the most disadvantaged groups from the 1.0 to the 1.5
and subsequent generational cohorts. Mexicans, as noted, start out at the 1.0
generation with only 5 percent college graduation rates and 65 percent
having less than a high school diploma; those figures worsen to 3 and 67,
respectively, among those who came as teenagers (the 1.25 generation). But
by the 1.5 generation, the figures improve to 6 and 47 (a tiny increase in
college graduation rates, but a nearly 20 point reduction in dropout rates),
then to 9 and 33 (in the 1.75 generation), 12 and 20 (in the 2.0), and 15
and 19 (among the 2.5ers). Thus, by the second generation (2.0 and 2.5), Mexican adults in their late twenties and thirties had nearly tripled their
college graduation rates and cut by more than a third the proportion of high school dropouts, relative to their 1.0 coethnics.

1190 International Migration Review
They were still lagging behind their counterparts by wide margins, to
be sure, but had made substantial progress in the course of a generation.
Low-SES and mid-SES immigrant groups also exhibit a similar pattern of
upward educational "mobility" (to the extent that such an interpretation
can
be made with cross-sectional data). By contrast, high-SES immigrant groups tend to maintain the level of attainment from the 1.0 to the native-born
second generation (in fact, there is a relative drop in the rate of college
graduates). The top achiever by far - and the most highly educated ethnic
group in the United States - is the population of Indian origin: 81 percent of young adults 25?39 years old in the 1.0 generation had college degrees
while only 4 percent lacked a high school diploma; in the 2.0 generation, the
commensurate figures were virtually identical: 82 and 4 percent, respectively. The right-hand panels of Table 6 shift the focus to patterns of occu
pational attainment among employed young adults 25 to 39 (data on labor
force participation and unemployment rates were examined separately but
are not shown here; by and large they point to similar levels of labor force
participation for most groups and generational cohorts at these ages). As a
standard of comparison, for native-parentage non-Hispanic whites in this
age group in the United States, the proportions employed in the top and
bottom occupational categories were 29 and 12 percent, respectively.
The patterns and rankings are similar but not identical to those seen
for education. As expected, looking first only at the data for the 1.0 gen eration, there are wide disparities between employed high-SES immigrants, a third of whom (34%) were employed as professionals, executives or man
agers while only 8 percent held jobs as operators, fabricators or laborers, and
those from Mexico, with only 3 percent working in upper white-collar
occupations while a third (32%) had lower blue-collar jobs. For the 1.0
Mexican immigrants, the top-to-bottom occupational ratio was 0.10, in
contrast to the ratios for the high-SES (4.1), mid-SES (0.72), and low-SES
(0.23) immigrant groups.
Looking next at the data across the
generational cohorts, all groups
show a general pattern of occupational advancement from the first to the
second generation. Among Mexican and other low-SES immigrants aged 25-39, what had been a
preponderant concentration at the bottom of the
occupational structure in the 1.0 and 1.25 generations
turns around by the
second generation, as Table 6 shows, and the degree of occupational "mo
bility," as measured by the UWC/LWC ratios, is sharper still for the mid SES groups. Even among high-SES immigrant groups, the data now show relative
occupational gains from the 1.0 to the native-born 2.0 generation. In
Ages, Life Stages, and Generational Cohorts 1191
all cases except for the Mexicans, however, this trend is not linear; the gains
peak with the U.S.-born 2.0 cohort (those with two foreign-born parents) and then dip among the 2.5ers (those with only one foreign-born parent).
Why that is so is a complex and interesting question for future research (cf. Jensen, 2001; Oropesa and Landale, 1997).
Another nonlinear finding in Table 6 worth highlighting is that over
all, those who arrived in the United States in their teen years (13-17) - the
1.25 cohort ? tend to do worse or no better than their 1.0 compatriots (and worse than all other cohorts, for that matter), both educationally and occu
pationally. Even among the high-achieving Indians, a notable slippage is seen among the 1.25ers, whose college graduation
rates of 64 percent, al
though still well above the national average, represent a drop of nearly 20
points from the 1.0, 1.5, 1.75, and 2.0 averages. In general, the 1.25 cohort
comes across as a distinctive and seemingly vulnerable one, all the more
when compared to the patterns of their younger-at-arrival 1.5 and 1.75
compatriots. This evidence, added to other findings reviewed below, suggests that 1.25ers may undergo
a comparatively
more problematic adaptation,
which should be taken into account in studies of the incorporation of the
new second generation.
One last datum drawn from this comparative cross-generational analy
sis illustrates and underscores a key methodological point: namely, the need
to place the data in the larger historical contexts of particular migration flows
and the conditions of their reception. We already noted that among 25-to
39-year-old immigrants, certain nationalities in the 1.0 generation
? notably
Mexicans, Salvadorans and Guatemalans ? labored preponderantly in the
lowest rungs of the occupational ladder. Surprisingly, that defining charac
teristic of labor migrants was matched by 1.0-generation Cubans, with 6
percent in top occupations and 31 percent concentrated in lower blue-collar
jobs. In the Cuban case, the 1.0 generation of persons who were 25 to 39
years old around the turn of the century is made up largely of those who
came in the chaotic Mariel boatlift of 1980, and to a lesser extent the balseros
of the early 1990s.
By contrast, the Cuban 2.0 generation
of the same age group, who are
preponderantly the children of more advantaged and better-received Cubans
who came to the United States in the early 1960s, shows an occupational
profile that is the exact opposite of their 1.0 counterparts: 37 percent are
employed in top professions, while only 6 percent are at the bottom of the
occupational structure. It is not the passage of time and generation alone that
explains this about-face in their socioeconomic trajectories, but fundamental
1192 International Migration Review
differences between these cohorts in their social class backgrounds, migration histories, and contexts of reception. The data presented in Table 6 do not
control for such varying historical circumstances, but they need to be con
textualized in any definitive interpretation of intergenerational difference
and social mobility.
LANGUAGE ASSIMILATION ACROSS GENERATIONAL COHORTS
For immigrants who come to the United States from non-English-speaking countries, learning
to speak the new
language is a basic step to enable them
to participate in the life of the larger community, get an education, find a
job, obtain access to health or social services, and apply for citizenship. Instrumentally, language is often cited as the principal initial barrier con
fronting recent
immigrants, from the least educated peasants to the most
educated professionals. But language assimilation is expected of immigrants not
only for instrumental reasons but for symbolic ones as well, since lan
guage also lies at the core of national identities and ethnic solidarities (Portes and Rumbaut, 1996, 2001; cf. Bean and Stevens, 2003:Ch. 7). This section focuses on patterns of linguistic assimilation among the generational cohorts
composing the foreign-born population, using now the 5 percent Public Use Microdata Sample from the 2000 U.S. Census, since data on language are not collected by the CPS.
Table 7 presents cross-sectional census data on English language pro
ficiency among all first-generation immigrants ages five or older from non
English-speaking countries, by age/life stage at arrival in the United States
{i.e., early and middle childhood and adolescence for those younger than 18 at arrival, and early, middle and late adulthood for those 18 and older at
arrival). Excluded from this analysis are immigrants from English-speaking countries, 88 percent of whom speak English only, regardless of their age at arrival in the United States (those countries include the United Kingdom, Ireland, Canada, Bermuda, Jamaica and the anglophone West Indies,
Guyana, Australia and New Zealand). The table focuses on three (self
reported) language measures: the proportion who speak English "not well or at all" versus those who speak English "very well" (among persons who
report speaking a language other than English at home), and the proportion who speak English only.
Without exception, there are sharp linear differences in each of the
language measures in the generational progression from those who arrived in

Table
7 English Language Proficiency among First-Generation Immigrants from non-English Speaking Countries, by Age/Life Stage at Arrival and _Years in the United States, 2000 (in percents)*_
First Generation (foreign-born) by Age/Life Stage at Arrival
Ages 0-5
English Proficiency and English Monolingualism
Early Childhood
Ages 6-12 Middle Childhood
Ages 13-17 Adolescence
Ages 18-34 Early
Adulthood
Ages 35-54
Middle
Adulthood
Ages 55+
Late Adulthood
a O H O n o X o
Speaks English not well or at all
Speaks English
very well Speaks
English only
11.2 68.9 37.4
14.4 61.4 14.8
33.6 37.2 9.1
37.3 34.1
8.6
53.9 21.6 7.0
73.5 12.7
6.7
By time of arrival in the U.S.:
Speaks English not well or at all
Arrived
after 1980 13.5
Arrived
before 1980 6.9 Speaks English very well Arrived after 1980 62.8
Arrived before 1980 80.6
Speaks English only Arrived after 1980 25.4
Arrived before 1980 52.0
16.8 9.1 56.6 72.1
9.7 24.5
38.1 21.2
33.2 48.2 7.1
14.1
41.4 26.6 31.2 41.8 6.9
12.8
54.6 51.8 21.2 22.9
6.3 9.4
73.8 71.0 12.5 14.3 6.5 9.2
Source: 5% PUMS, 2000 U.S. Census.
aExcluded from this table are immigrants from English-speaking countries, 88% of whom speak English only, regardless of age at arrival in the United States. Those countries include:
The United Kingdom, Ireland, Canada, Bermuda, Jamaica and the anglophone West Indies, Guyana, Australia and New Zealand.

1194 International Migration Review
early childhood (ages 5 or younger) through those who arrived in late
adulthood (ages 55 or older), although the differences are not equivalent between the cohorts. Thus, among persons who use a
language other than
English at home, only 11.2 percent of early-childhood immigrants spoke
English "not well or at all," as did 14.4 percent of those who came in middle
childhood (ages 6-12). That figure jumps to 33.6 percent among those who came as adolescents (ages 13-17) and 37.3 percent of those who came in
early adulthood (ages 18-34). More than half (53.9%) of those who came in
mid-adulthood (ages 35-54) did not speak English well or at all, along with
nearly three fourths (73.5%) of those who were 55 or older at arrival.
The proportions who speak English "very well" are reversed, ranging from over two thirds (68.9%) of early-childhood immigrants to only 12.7
percent of late-adulthood immigrants (subtracting from 100 percent the sum
of those two indicators yields the proportion who reported speaking English "well"). Indeed, the data suggest that already among the foreign-born from
non-English-speaking countries, a process of language extinction is under
way, with over one third (37%) of those who came in early childhood
speaking English only and 15 percent of those who came in middle child
hood; the English-only proportions for the other cohorts fall below 10
percent.
To illustrate the effect of time in the United States on language com
petencies, the outcomes are shown in the bottom panel of Table 7 for
immigrants who arrived in the United States before 1980 and those who came after 1980. The pronounced linear differences between generational cohorts persist, and indeed they are shown to be stronger than time in the
United States, especially at the poles.
For example, among those who arrived
in the United States after 1980 and spoke English "not well or at all," the
generational progression moves from 13.5 percent of those who came in
early childhood to 73.8 percent of those who arrived in late adulthood; the
corresponding figures for longer-established immigrants who arrived in the United States before 1980 range from only 6.9 percent of the early childhood cohort to 71 percent of the late-adulthood cohort. The greatest
improvement in this measure is observed among those who immigrated in
their teens or early adulthood.
When the measure is the ability to speak English "very well," the increases are largest over time in the United States for the youngest arrival cohorts and miniscule for the oldest arrival cohorts, as Table 7 demonstrates.
Finally, the shift to English-only is especially pronounced for those who arrived before their teen years and who have been in the United States for

Ages, Life Stages, and Generational Cohorts 1195
more than two decades: e.g., in the middle-childhood cohort, only 9.7
percent of those who arrived after 1980 spoke English only, but the pro
portion jumped to 24.5 percent among those who arrived in the United
States before 1980; the corresponding figures for the early-childhood cohort
are 25.4 and 52 percent for those who arrived in the United States after and
before 1980, respectively. Decomposing the foreign-born first generation into distinct generational cohorts thus clarifies the process of language
ac
quisition and makes plain the importance of accounting for age and life stage at arrival in that central aspect of the process of immigrant incorporation.
ACCULTURATION AND IDENTITY IN THE NEW SECOND GENERATION
There are, of course, many other outcomes of theoretical interest in the study
of the adaptation of the new second generation for which relevant data are
not collected by the annual Current Population Surveys or by the decennial
census. Given the lack of pertinent information in cross-sectional national
data sets, this final section turns to recently collected data from our Children
of Immigrants Longitudinal Study. Basic aspects of the CILS study were
briefly summarized above (for details, see Portes and Rumbaut, 2001). In
Table 8, selected longitudinal findings are presented for the sample originally drawn in San Diego, California, consisting principally of children of immi
grants from Mexico, the Philippines, Vietnam, Laos, Cambodia, China, and
other Asian and Latin American countries. They were first surveyed in 1992
when most were 14 or 15 years old, then again in 1995 as they neared the
end of high school, and finally in 2001?2002, when most were 24 or 25
years old and were located not only in the San Diego area but throughout California and in 29 other states.
For our purposes here, the outcomes of interest across the decade from
1992 to 2002 - English versus foreign language proficiency, preference and
use, ethnic identity, selected experiences with the criminal justice system ?
are presented by four generational cohorts: 1.5, 1.75, 2.0, and 2.5 (there are
no 1.25ers in the CILS sample, since all respondents were younger than 12
at arrival or born in the United States). While the decennial census, as we
have seen, collects data on English proficiency for persons who speak another
language at home, no data are collected on their degree of proficiency in the
foreign language or on their preferences and patterns of language
use.
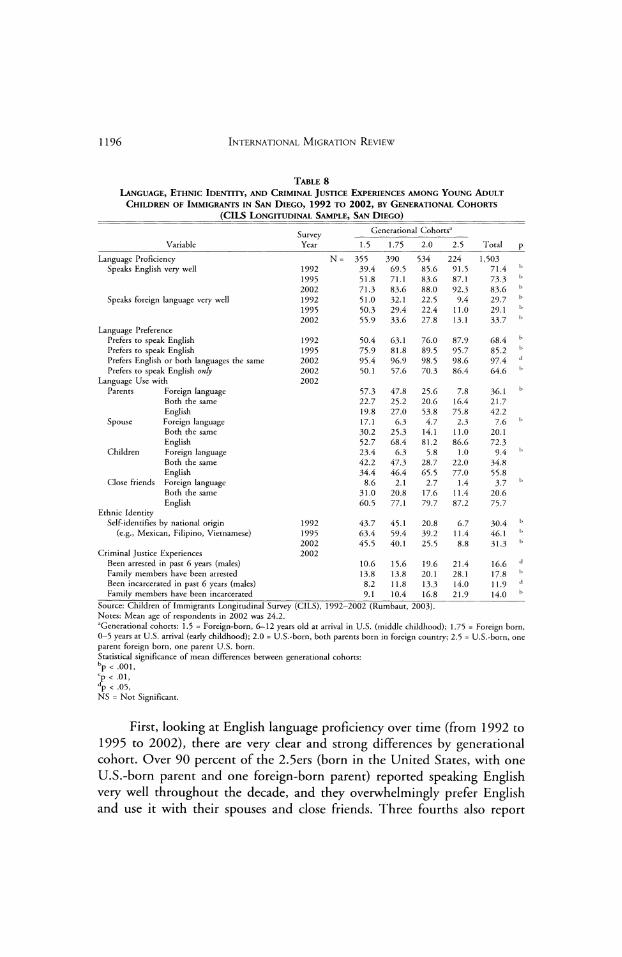
1196 International Migration Review
Table 8
Language, Ethnic Identity, and Criminal Justice Experiences among Young Adult
Children of Immigrants in San Diego, 1992 to 2002, by Generational Cohorts
_(CILS Longitudinal Sample, San Diego)_
Variable Survey Year
Generational Cohorts'1
1.5 1.75 2.0 2.5 Total
Language Proficiency Speaks English very well
Speaks foreign language very well
Language Preference Prefers to speak English Prefers to speak English Prefers English or both languages the same Prefers to speak English only
Language Use with Parents Foreign language
Both the same
English Spouse Foreign language
Both the same
English Children Foreign language
Both the same
English Close friends Foreign language
Both the same
English Ethnic Identity
Self-identifies by national origin (e.g., Mexican, Filipino, Vietnamese)
Criminal Justice Experiences Been arrested in past 6 years (males) Family members have been arrested Been incarcerated in past 6 years (males) Family members have been incarcerated
N =
1992 1995
2002 1992 1995
2002
1992 1995
2002 2002 2002
1992 1995
2002 2002
355 39.4 51.8 71.3 51.0 50.3 55.9
50.4 75.9 95.4 50.1
57.3 22.7 19.8 17.1
30.2 52.7 23.4 42.2 34.4
8.6 31.0 60.5
43.7 63.4 45.5
390 69.5 71.1 83.6 32.1 29.4 33.6
63.1 81.8 96.9 57.6
47.8 25.2 27.0
6.3 25.3 68.4
6.3 47.3 46.4
2.1 20.8 77.1
45.1 59.4 40.1
534 85.6 83.6 88.0 22.5 22.4 27.8
76.0 89.5 98.5 70.3
25.6 20.6 53.8 4.7 14.1 81.2
5.8 28.7 65.5
2.7 17.6
79.7
20.8 39.2 25.5
10.6 15.6 19.6 13.8 13.8 20.1 8.2 11.8 13.3 9.1 10.4 16.8
224 91.5 87.1 92.3
9.4 11.0 13.1
87.9 95.7 98.6 86.4
7.8 16.4
75.8 2.3
11.0 86.6
1.0 22.0 77.0
1.4 11.4
87.2
6.7 11.4
21.4 28.1 14.0
21.9
1,503 71.4 73.3 83.6 29.7 29.1 33.7
68.4 85.2 97.4 64.6
36.1 21.7 42.2
7.6 20.1 72.3
9.4 34.8 55.8
3.7 20.6 75.7
30.4 46.1 31.3
16.6 17.8 11.9 14.0
= Foreign born,
U.S.-born, one
Source: Children of Immigrants Longitudinal Survey (CILS), 1992-2002 (Rumbaut, 2003). Notes: Mean age of respondents in 2002 was 24.2. aGenerational cohorts: 1.5 =
Foreign-born, 6-12 years old at arrival in U.S. (middle childhood); 1.75 0-5 years at U.S. arrival (early childhood); 2.0 = U.S.-born, both parents born in foreign country; 2.5 =
parent foreign born, one parent U.S. born. Statistical significance of mean differences between generational cohorts:
bp < .001,
cp < .01,
dp < .05, NS = Not Significant.
First, looking at English language proficiency over time (from 1992 to
1995 to 2002), there are very clear and strong differences by generational cohort. Over 90 percent of the 2.5ers (born in the United States, with one
U.S.-born parent and one foreign-born parent) reported speaking English very well throughout the decade, and they overwhelmingly prefer English and use it with their spouses and close friends. Three fourths also report

Ages, Life Stages, and Generational Cohorts 1197
speaking only in English with their parents and (where applicable) their own
children. The 2.0 generation (born in the United States but both parents are
foreign born) come next in these rankings: about 85 percent reported speak
ing English very well at all three survey periods, but their preference for
English increased from 76 percent in 1992, to 89 percent in 1995, and 98 per cent by 2002, and their patterns of English use consistently fell behind the
level reported by the 2.5ers, most notably with their parents (over 50% now speak with them in English only, even though in 1992 a foreign lan
guage was the principal language of their homes in the great majority of cases). The 1.75ers (who came to the United States as children under 6)
follow in their patterns of linguistic acculturation: 70 percent spoke English very well in 1992, and 84 percent did so by 2002; their preference for
English increased from 63 to 82 to 97 percent across the three survey
periods; and their patterns of language use with their parents, spouses, and
children also show a significant distance from the patterns exhibited by their
U.S.-born coethnics (indeed, half of them still speak with their parents in the
mother tongue rather than in English). Finally, the 1.5 generation shows the
lowest level of linguistic assimilation among the four cohorts, although the
force of Anglicization clearly prevails over time: while only 39 percent spoke
English very well in 1992, 71 percent did so in 2002; and while just under
half said they preferred English in 1992, a decade later English was the
overwhelming choice and used principally with spouses and close friends.
As Table 8 also shows, similar generational patterns obtained, in re
verse, for their proficiency in the mother tongue (the non-English language
spoken at home), except that there was basically no change over time in their
ability to speak the foreign language very well (proficiency levels remained
unchanged during adolescence from 1992 to 1995, followed by a slight increase from 1995 to 2002 for all cohorts in their transitions to adulthood).
Even among the 1.5ers, only about half could speak the mother tongue very well, as did one third of the 1.75ers, around one fourth of the 2.0 cohort, and only about one tenth of the 2.5ers.
These patterned and strongly significant differences in language accul
turation, not only
over time but between the four generational cohorts, are
also observed in their self-reports of ethnic identity (to an open-ended ques tion about what they called themselves, asked in all three surveys from 1992 to 2002). The analysis of the determination of ethnic identity choices is
complex, especially the boost registered in the proportion who identified by national origin in the 1995 survey, seen notably among Mexicans and Fili
pinos in the wake of Proposition 187 in California, an anti-immigrant
1198 International Migration Review
referendum in a politically charged election (see Portes and Rumbaut, 2001:Ch. 7). Interestingly, that process of "reactive ethnicity" formation in
the face of perceived discrimination and exclusion was observable for all four
generational segments, although it was strongest for the 1.5 generation and
weakest for the 2.5ers. It subsides for all cohorts by 2002, with levels of
self-identification by national origin returning almost exactly to those re
ported in 1992.
For our purposes here, more to the point is the pattern observed
between generational cohorts: by the latest survey (uncannily reflecting the
responses given a decade earlier), close to half of the 1.5ers identified by national origin, as did 40 percent of the 1.75ers - the two cohorts born
abroad ? followed by 25 percent of the 2.0 and less than 9 percent of the
2.5ers ? the two cohorts born in the United States. The widest difference
between cohorts is actually that between the 2.0 and 2.5. For the latter, the
fact that one parent is U.S.-born seems significantly
to decrease the likeli
hood that the child will identify by the foreign national origin of the other
parent, much as it also greatly decreases the likelihood that the child would
become proficient in, prefer, or use the foreign language of the immigrant
parent, whereas for the former (the 2.0), having two co-national parents (and the ethnic socialization that growing up in such immigrant families may
imply) evidently continues to exert some influence in the respondent's self
identification into adulthood. It is, in any event, precisely because of such
differences that the distinction between the 2.0 and 2.5 generational cohorts
is proposed.
Table 8 provides additional evidence of significant differences among these generational cohorts in experiential domains quite unlike the educa
tional, occupational, and acculturative dimensions considered thus far. One
set of relevant data shown in Table 8 comes from questions asked at the
latest CILS survey (when the respondents were in their mid twenties) about
whether they or any family members had ever been arrested or incarcerated in the past six years. Again, linear patterns by generation
are clear for each
of the variables examined, and again they run counter to the direction in
which they may have been expected to do so on the basis of the greater
degree of acculturation and higher socioeconomic status of the 2.5ers (and the lower degree of both on the part of the 1.5ers). The 1.5ers were least
likely to have been arrested (10.6%) or incarcerated (8.2%), whereas the
2.5ers were the most likely on both counts: 21.4 and 14 percent, respec
tively.
The 1.75 and 2.0 cohorts fell in between, as Table 8 spells out. Arrests

Ages, Life Stages, and Generational Cohorts 1199
of family members similarly were much lower among the 1.5ers (13.8%) than the 2.5ers (28.1%), as was the likelihood that family members were
incarcerated: 9.1 percent (for the 1.5) to 21.9 percent (for the 2.5), again with the other two cohorts arrayed linearly in between. These seemingly
paradoxical patterns ?
of outcomes worsening with
increasing "American
ization," sociocultural assimilation and higher socioeconomic status ? have
been reported in the literature (for a review, see Rumbaut 1997b).
CONCLUSION
I have argued that the definition of the immigrant first and second genera tions can be made theoretically and empirically
more precise, and avoid
semantic confusion, by distinguishing among distinctive generational co
horts defined by age and life stage at arrival among the foreign born and by
parental nativity among the U.S. born. Generational cohorts and their so
ciodevelopmental contexts matter in processes of adaptation and social mo
bility; they are not epiphenomena. Evidence has been presented that tends to support both the value and the validity of these calibrations, as well as the
need for greater consensus in the conceptualization and operationalization of
immigrant generations.
Intergenerational analyses of such multiple outcomes as explored here on a
preliminary basis, however, need to take into account multiple other
possible determinants and situate and interpret the data within larger social
and historical contexts. Not all second generations are "new," for example,
as are the Vietnamese or the Cambodians in the United States; others are
only the latest second generation in a much longer history of sustained
migration, as is the case of the Mexicans in the United States (cf. L?pez and
Stanton-Salazar, 2001). First waves and later waves of migrants from the
same sending country may differ fundamentally in their class origins, ethnic
composition, motives for migration, and reception in the United States ?
i.e., there are different "vintages" in migration flows (cf. Kunz, 1973, 1981), not just waves, that need to be taken specifically into account in studies of
intergenerational mobility to avoid confounding period and cohort effects.
At the same time, I have also pointed to a variety of methodological and definitional problems with such measures as age at arrival (e.g., there
may not be a single date of arrival but multiple entries), nativity (e.g., definitions of foreign born and native born in U.S. official statistics have
varied historically and are based on assignments of citizenship status, while
immigrant status is not asked in the CPS or the decennial census; interna
1200 International Migration Review
tional migration statistics differ in the meanings of common terms and
measures), and the determination and allocation of ethnicity for children of
mixed marriages, where the ethnic and national origin of the mother and
father differ. The continued reliance on one-size-fits-all racial categories in
the United States (an "ethnoracial pentagon" of white, black, Asian, His
panic/Latino, and American Indian/Alaska Native categories), in lieu of more refined classifications by national origin and ethnicity, is particularly
pernicious to an understanding of the diversity and complexity of the new
immigration and to the study of processes of acculturation, assimilation, and
social mobility ?
indeed, to theory-building and policymaking. All of these
considerations, in turn, underscore the need for better data and better mea
sures that can help address those specific problems
in comparative research.
Among urgent data needs, perhaps none is more
important for the
study of intergenerational mobility than the restoration of the parental na
tivity question in the decennial U.S. census and in the recently implemented American Community Survey (ACS), which is intended to replace the long form questionnaire of the decennial census and, if funding is secured (al
though that is not certain at this writing), to collect long-form-type data
annually between decennial censuses. As seen here, the data on parental
nativity in the annual CPS yields much valuable information for the study of the new second generation, but the CPS is hampered by small sample sizes
when the available data are broken down by national origin and generational cohort, let alone by other basic demographic variables, such as age and sex,
reducing cell sizes to the point where it becomes impossible to carry out
reliable analyses, even when merging multiple years of the CPS. In addition, data on English language use and ability (which is included in the census
long-form) are not collected by the CPS, but should be, since the CPS
remains at present the principal source of national-level information on
second-generation populations.
The need for such data, from the national to the local level, is critical both for social science and for public policy. However, in the United States at present, there seem to be dark clouds on the data horizon for a
variety of
political, practical and budgetary reasons. Current plans call for dropping the
long-form questionnaire (the one that asks questions about nativity, citizen
ship, year of entry, and language, among many other items) from the 2010
census, but there is no assurance that the U.S. Congress will fund its in
tended replacement, the ACS - a scenario that could precipitate a "data crisis" for the study of international migration and its consequences in the
United States {see Grieco, 2003). Even if basic funding is ensured, the need
Ages, Life Stages, and Generational Cohorts 1201
to add critical items to the ACS questionnaire, and to the CPS and other
relevant surveys, remains to be negotiated. Thus, clarifying and specifying our own definitions and methodological approaches in the study of the
newest first and second (and soon to become third) generations has practical as well as theoretical value. It would not only help the field of immigration studies and expand our knowledge of a phenomenon of both national and
international importance that is transforming both sending and receiving societies, but also make a
compelling case for averting
a potential data crisis
and boost the likelihood that urgent data needs are met.
REFERENCES
Alba, R. D.
1990 Ethnie Identity: The Transformation of White America. New Haven: Yale University Press.
1985 Italian Americans: Into the Twilight of Ethnicity. Englewood Cliffs, NJ: Prentice-Hall.
Bean, F. D. and G. Stevens
2003 Americas Newcomers: Immigrant Incorporation and the Dynamics of Diversity. New
York: Russell Sage Foundation.
Berrol, S. C.
1995 Growing Up American: Immigrant Children in America, Then and Now. New York:
Twayne Publishers.
Boyd, M. and E. M. Grieco
1998 "Triumphant Transitions: Socioeconomic Achievement of the Second Generation in
Canada," International Migration Review, 32(4):853?876.
Bozorgmehr, M.
1997 "Internal Ethnicity: Iranians in Los Angeles," Sociological Perspectives, 40(3):387-408.
Caplan, N., M. H. Choy and J. K. Whitmore
1991 Children of the Boat People: A Study of Educational Success. Ann Arbor: University of
Michigan Press.
Child, I. L.
1943 Italian or American? The Second Generation in Conflict. New Haven: Yale University Press.
Cropley, A. J. 1983 The Education of Immigrant Children: A Social-Psychological Introduction. London:
Croom Helm.
Ebaugh, H. R. and J. S. Chafetz
2000 Religion and the New Immigrants: Continuities and Adaptations in Immigrant Congre
gations. Walnut Creek, CA: AltaMira Press.
Erikson, E. H.
1968 Identity: Youth and Crisis. New York: W.W. Norton.
1202 International Migration Review
1964 "Psychological Reality and Historical Actuality." In Insight and Responsibility. Ed.
E. H. Erikson. New York: W. W. Norton.
Gans, H. J. 1992 "Second Generation Decline: Scenarios for the Economic and Ethnic Futures of the
Post-1965 America Immigrants," Ethnic and Racial Studies, 15:173-192.
Gibson, C. J. and E. Lennon
1999 "Historical Census Statistics on the Foreign-Born Population of the United States:
1850-1990." Population Division Working Paper No. 29. Washington, DC: U.S.
Bureau of the Census.
Grieco, E. M.
2003 "Census 2010 and the Foreign Born: Averting the Data Crisis," MPI Policy Brief, 1.
Washington, DC: Migration Policy Institute.
2002 "Defining 'Foreign Born' and 'Foreigner' in International Migration Statistics." Mi
gration Information Source. Washington, DC: Migration Policy Institute.
Harris, K. M.
1999 "The Health Status and Risk Behavior of Adolescents in Immigrant Families." In
Children of Immigrants: Health, Adjustment, and Public Assistance. Ed. D. J. Hern?ndez.
Washington, DC: National Academy of Sciences Press
Hern?ndez, D. J. and E. Charney, eds.
1998 From Generation to Generation: The Health and Weil-Being of Children in Immigrant Families. Washington, DC: National Academy of Sciences Press.
Jensen, L.
2001 "The Demographic Diversity of Immigrants and Their Children." In Ethnicities: Chil
dren of Immigrants in America. Ed. R. G. Rumbaut and A. Portes. Berkeley and New
York: University of California Press and Russell Sage Foundation.
Jensen, L. and Y. Chit?se
1994 "Today's Second Generation: Evidence from the 1990 U.S. Census," International
Migration Review, 28(4) :714-735.
Kasinitz, P., J. Battle and I. Miyares 2001 "Fade to Black? The Children of West Indian Immigrants in South Florida." In
Ethnicities: Children of Immigrants in America. Ed. R. G. Rumbaut and A. Portes.
Berkeley and New York: University of California Press and Russell Sage Foundation.
Kunz, E.
1981 "Exile and Resettlement: Refugee Theory," International Migration Review, 15(1):42? 51.
1973 "The Refugee in Flight: Kinetic Models and Forms of Displacement," International
Migration Review, 7(1): 125-146.
Levitt, P. and M. C. Waters, eds.
2002 The Changing Face of Home: The Transnational Lives of the Second Generation. New
York: Russell Sage Foundation.
L?pez, D. E. and R. D. Stanton-Salazar
2001 "Mexican Americans: A Second Generation at Risk." In Ethnicities: Children of Im

Ages, Life Stages, and Generational Cohorts 1203
migrants in America. Ed. R. G. Rumbaut and A. Portes. Berkeley and New York:
University of California Press and Russell Sage Foundation.
Mannheim, K.
[1928] 1996 "The Problem of Generations." In Theories of Ethnicity: A Classical Reader. Ed. W.
Sollors. New York: New York University Press.
Nahirny, V. C. and J. A. Fishman
[1965] 1996 "American Immigrant Groups: Ethnic Identification and the Problem of Genera
tions." In Theories of Ethnicity: A Classical Reader. Ed. W. Sollors. New York: New
York University Press.
Oropesa, R. S. and N. S. Landale
1997 "In Search of the New Second Generation: Alternative Strategies for Identifying Sec
ond Generation Children and Understanding Their Acquisition of English," Socio
logical Perspectives, 40(3):427-455.
Park, R. E. and E. W. Burgess [1921] 1924 Introduction to the Science of Sociology. Chicago: University of Chicago Press.
Perlmann, ]. and R. Waldinger 1997 "Second Generation Decline? Children of Immigrants, Past and Present - A Recon
sideration," International Migration Review, 31(4):893-922.
Piore, M. J. 1979 Birds of Passage: Migrant Labor and Industrial Societies. Cambridge: Cambridge Uni
versity Press.
Portes, A., ed.
1996 The New Second Generation. New York: Russell Sage Foundation.
Portes, A. and R. G. Rumbaut
2001 Legacies: The Story of the Immigrant Second Generation. Berkeley and New York:
University of California Press and Russell Sage Foundation
1996 Immigrant America: A Portrait. 2nd Edition. Berkeley: University of California Press.
Portes, A. and M. Zhou
1993 "The New Second Generation: Segmented Assimilation and Its Variants," Annals of the
American Academy of Political and Social Sciences, 530:74-96. November.
Riley, M. W.
1987 "The Significance of Age in Sociology," American Sociological Review, 52:1?14.
Rumbaut, R. G.
2003 "Legacies: The Story of the Immigrant Second Generation in Early Adulthood." The
Sorokin Lecture, presented at the 74th annual meeting of the Pacific Sociological Association, Pasadena, California.
2002 "Severed or Sustained Attachments? Language, Identity, and Imagined Communities
in the Post-Immigrant Generation." In The Changing Face of Home: The Transnational Lives of the Second Generation. Ed. P. Levitt and M. C. Waters. New York: Russell Sage Foundation.

1204 International Migration Review
1998a "Coming of Age in Immigrant America," Research Perspectives on Migration, 1 (6): 1-14.
1998b "Growing Up American in Cuban Miami: Ambition, Language, and Identity in the
'1.5' and Second Generations." Paper presented at the XXI International Congress of
the Latin American Studies Association, Chicago.
1997a "Ties That Bind: Immigration and Immigrant Families in the United States." In
Immigration and the Family: Research and Policy on U.S. Immigrants. Ed. A. Booth, A.
C. Crouter, and N. S. Landale. Mahwah, NJ: Lawrence Erlbaum.
1997b "Assimilation and Its Discontents: Between Rhetoric and Reality," International Mi
gration Review, 31(4):923-960.
1994 "The Crucible Within: Ethnic Identity, Self-Esteem, and Segmented Assimilation
among Children of Immigrants," International Migration Review, 28(4):7'48-794.
1991 "The Agony of Exile: A Study of the Migration and Adaptation of Indochinese
Refugee Adults and Children." In Refugee Children: Theory, Research, and Practice. Ed.
F. L. Ahearn, Jr. and J. Athey. Baltimore: Johns Hopkins University Press.
[1976] Forthcoming "The One-and-a-Half Generation: Crisis, Commitment, Identity." In
The Dispossessed: An Anatomy of Exile. Ed. P. Rose. University of Massachusetts Press.
Rumbaut, R. G. and W. A. Cornelius, eds.
1995 Californias Immigrant Children: Theory, Research, and Implications for Educational
Policy. La Jolla, CA: Center for U.S.-Mexican Studies, University of California, San
Diego.
Rumbaut, R. G. and K. Ima
1988 The Adaptation of Southeast Asian Refugee Youth: A Comparative Study. Washington, DC: U.S. Office of Refugee Resettlement.
Rumbaut, R. G. and A. Portes, eds.
2001 Ethnicities: Children of Immigrants in America. Berkeley and New York: University of
California Press and Russell Sage Foundation.
Ryder, N. B.
1965 "The Cohort as a Concept in the Study of Social Change," American Sociological Review, 30:843-861.
Schmidley, A. D.
2001 Profile of the Foreign-Born Population in the United States: 2000. Series P23-206, Current Population Reports, U.S. Census Bureau. Washington, DC: U.S. Govern
ment Printing Office.
Schmidley, A. D. and J. G. Robinson
1998 "How Well Does the Current Population Survey Measure the Foreign Born Popula tion in the United States?" Population Division Working Paper No. 22. Washington,
DC: U.S. Bureau of the Census.
Su?rez-Orozco, C. and M. M. Su?rez-Orozco
2002 Children of Immigration. Cambridge: Harvard University Press.
Ages, Life Stages, and Generational Cohorts 1205
Sung, B. L.
1987 The Adjustment Experience of Chinese Immigrant Children in New York City. New York:
Center for Migration Studies.
Thomas, W. I. and F. Z.
[1918-20] 1958 The Polish Peasant in Europe and America. New York: Dover.
Warner, W. L. and L. Srole
1945 The Social Systems of American Ethnic Groups. New Haven, CT: Yale University Press.
Waters, M. C.
1999 Black Identities: West Indian Immigrant Dreams and American Realities. Cambridge and
New York: Harvard University Press and Russell Sage Foundation.
1990 Ethnic Options: Choosing Identities in America. Berkeley: University of California Press.
Zhou, M.
1997 "Growing Up American: The Challenge Confronting Immigrant Children and Chil
dren of Immigrants," Annual Review of Sociology, 23:63-95.
Zhou, M. and C. L. Bankston III
1998 Growing Up American: How Vietnamese Children Adapt to Life in the United States.
New York: Russell Sage Foundation.
Copyright © 2022 FDOKUMEN