Life cycle management for railway bridge assets - CiteSeerX
12
Special Issue on work of the Cooperative Research Centre for Rail Innovation, Australia Life cycle management for railway bridge assets Dwayne Nielsen 1,2 , Dhamodharan Raman 1,2 and Gopinath Chattopadhyay 1 Abstract Railway bridges are long-life assets that deteriorate with age, use and poor maintenance practices. The rail industry is suffering from ever-increasing maintenance costs which are exacerbated by increased rail traffic and reduced mainten- ance opportunities. In addition, bridge managers are expected to maintain their assets at specified performance levels while enduring budget cuts and resource constraints. There is an increasing demand for bulk material transport leading to increased axle loads pushing bridge structures to their design loading limit. Making informed decisions for cost- effective condition assessment, maintenance, repairs, upgrades and replacements, often with inadequate and sometimes inaccurate data is a major challenge in the management of railway bridges. Due to these challenges, infrastructure planners require additional time to plan and prepare maintenance budgets, analyse, interpret and make decisions for bridge asset life management. Many of the bridge management systems utilised in Australia are generic and analyse faults at the network level. In many cases, a detailed analysis of individual elements will provide a better understanding of root causes of faults and allow for more informed decision-making on bridge life enhancement. A practical framework for life cycle management of Australian concrete and steel railway bridges was developed in this research. This framework is based on life cycle cost analysis and consists of bridge assessment, maintenance optimisation and implementation. The outcome of this research is a faster, more accurate system that improves the informed decision-making capability for life cycle cost management of railway bridges. Keywords Life cycle cost, railway bridge, bridge defects, maintenance management, bridge assets Date received: 29 November 2012; accepted: 22 July 2013 Introduction Railway bridges perform an essential role in support- ing the economy of any country and their value cannot be understated. Coal is a major export com- modity in Australia, and in the 2008–2009 financial year it was worth approximately $58 billion to the Australian economy. 1 Rail transport is the primary method of moving coal to ports in Australia and the sustained operation of railway bridges is crucial for maintaining this export income. These railway bridges form a complex structural system that deteriorate due to wear, fatigue, traffic volume, environmental impacts, inadequate inspection and poor maintenance management. This deterioration process continues throughout a bridge’s service life and eventually affects its functionality, structural integrity and safety. Australian rail infrastructure owners are experiencing an ever-increasing maintenance cost due to the large number of bridges constructed over 80 years ago. The Australian Rail Network encompasses over 9480 bridges, many of which need urgent repair. 2 Railways around the world have been increasing axle loads and train speeds to improve productivity on existing rail lines that were not originally designed for these higher forces. There is also pressure for deregulation and outsourcing of track maintenance to reduce overall running costs. Railway infrastruc- ture owners are being challenged to find solutions to reduce maintenance costs on ageing infrastructure, 1 Central Queensland University, Centre for Railway Engineering, Australia 2 CRC for Rail Innovation, Australia Corresponding author: Dwayne Nielsen, Centre for Railway Engineering, Faculty of Sciences, Engineering and Health, Central Queensland University, Queensland 4702, Australia. Email: [email protected] Proc IMechE Part F: J Rail and Rapid Transit 227(5) 570–581 ! IMechE 2013 Reprints and permissions: sagepub.co.uk/journalsPermissions.nav DOI: 10.1177/0954409713501297 pif.sagepub.com at PENNSYLVANIA STATE UNIV on September 16, 2016 pif.sagepub.com Downloaded from
-
Upload
khangminh22 -
Category
Documents
-
view
1 -
download
0
Transcript of Life cycle management for railway bridge assets - CiteSeerX
Special Issue on work of the Cooperative Research Centre for Rail Innovation, Australia
Life cycle management for railwaybridge assets
Dwayne Nielsen1,2, Dhamodharan Raman1,2 andGopinath Chattopadhyay1
Abstract
Railway bridges are long-life assets that deteriorate with age, use and poor maintenance practices. The rail industry is
suffering from ever-increasing maintenance costs which are exacerbated by increased rail traffic and reduced mainten-
ance opportunities. In addition, bridge managers are expected to maintain their assets at specified performance levels
while enduring budget cuts and resource constraints. There is an increasing demand for bulk material transport leading
to increased axle loads pushing bridge structures to their design loading limit. Making informed decisions for cost-
effective condition assessment, maintenance, repairs, upgrades and replacements, often with inadequate and sometimes
inaccurate data is a major challenge in the management of railway bridges. Due to these challenges, infrastructure
planners require additional time to plan and prepare maintenance budgets, analyse, interpret and make decisions for
bridge asset life management. Many of the bridge management systems utilised in Australia are generic and analyse faults
at the network level. In many cases, a detailed analysis of individual elements will provide a better understanding of root
causes of faults and allow for more informed decision-making on bridge life enhancement. A practical framework for life
cycle management of Australian concrete and steel railway bridges was developed in this research. This framework is
based on life cycle cost analysis and consists of bridge assessment, maintenance optimisation and implementation. The
outcome of this research is a faster, more accurate system that improves the informed decision-making capability for life
cycle cost management of railway bridges.
Keywords
Life cycle cost, railway bridge, bridge defects, maintenance management, bridge assets
Date received: 29 November 2012; accepted: 22 July 2013
Introduction
Railway bridges perform an essential role in support-ing the economy of any country and their valuecannot be understated. Coal is a major export com-modity in Australia, and in the 2008–2009 financialyear it was worth approximately $58 billion to theAustralian economy.1 Rail transport is the primarymethod of moving coal to ports in Australia and thesustained operation of railway bridges is crucial formaintaining this export income. These railway bridgesform a complex structural system that deteriorate dueto wear, fatigue, traffic volume, environmentalimpacts, inadequate inspection and poor maintenancemanagement. This deterioration process continuesthroughout a bridge’s service life and eventuallyaffects its functionality, structural integrity andsafety. Australian rail infrastructure owners areexperiencing an ever-increasing maintenance costdue to the large number of bridges constructed over80 years ago. The Australian Rail Network
encompasses over 9480 bridges, many of which needurgent repair.2
Railways around the world have been increasingaxle loads and train speeds to improve productivityon existing rail lines that were not originally designedfor these higher forces. There is also pressure forderegulation and outsourcing of track maintenanceto reduce overall running costs. Railway infrastruc-ture owners are being challenged to find solutions toreduce maintenance costs on ageing infrastructure,
1Central Queensland University, Centre for Railway Engineering,
Australia2CRC for Rail Innovation, Australia
Corresponding author:
Dwayne Nielsen, Centre for Railway Engineering, Faculty of Sciences,
Engineering and Health, Central Queensland University, Queensland
4702, Australia.
Email: [email protected]
Proc IMechE Part F:
J Rail and Rapid Transit
227(5) 570–581
! IMechE 2013
Reprints and permissions:
sagepub.co.uk/journalsPermissions.nav
DOI: 10.1177/0954409713501297
pif.sagepub.com
at PENNSYLVANIA STATE UNIV on September 16, 2016pif.sagepub.comDownloaded from
while at the same time minimising and controlling therisk of failure.
Life cycle management of bridges refers to the vari-ous activities conducted during the life of a bridge,including design, construction, operation and main-tenance, which help maintain the integrity of thebridge over the design life and usually beyond. Lifecycle management approaches are equally applicableto existing bridges and aim to reduce total costs overthe remaining life of the structure. In either case, lifecycle analysis is predominantly related to maintainingasset performance by making cost-effective mainten-ance decisions. Hence, the tasks involved in life cyclemanagement of bridges can be summarised as follows.
1. Bridge assessment:. inspections;. automated monitoring.
2. Maintenance optimisation:. prioritisation of defective structures and
structures that require preventative maintenance;. development and periodic review of the
maintenance strategy for each structure.3. Implementation of maintenance actions as listed
within the maintenance strategy.
A search for previous work in the field of bridge lifecycle cost analysis (LCCA) has collated an extensivearray of published research and analytical meth-ods.3–10 Despite a great depth of research in thisfield, a simple model could not be found that linksorganisational cost parameters to determine thefuture life cycle cost (LCC) of bridges consideringgeographic location, skill of inspectors, bridge condi-tion and construction material. Another importantaspect of LCC is to account for uncertainties asso-ciated with bridge maintenance. A common techniqueto process these uncertainties is to conduct a MonteCarlo simulation analysis;11 such an analysis has beenconducted by the current authors and the results willbe presented in a future publication.
Several bridge management systems (BMSs) areavailable in the market to assist infrastructureowners to manage railway bridge assets.Unfortunately, many BMSs are not designed forAustralian conditions and many do not considerLCCA.2 Another issue in railway bridge managementis the priority and timing of maintenance tasks andthe integration of bridge- and network-level decisions.Currently, the decisions for the majority of Australianrepair priorities are based on visual condition andassessed risk. However, they lack a comprehensiveanalytical approach to make maintenance decisionsthat balances bridge performance with the minimisedtotal life cost.
Consequently, a practical framework for life cyclemanagement of Australian concrete and steel railwaybridges has been developed by the authors. Thisframework is based on a LCC approach and consists
of three major modules: bridge assessment module,maintenance optimisation module and maintenanceimplementation module.
The bridge assessment module includes the inspec-tion and monitoring of bridge performance andassesses severity, element criticality and finallybridge importance within the network. Furthermore,this module incorporates element deteriorationmodels to optimally prioritise the defects based oncurrent and predicted condition.
The maintenance optimisation module aims toreduce the uncertainty of maintenance cost estimationfor effective life cycle management and suggests aprioritised repair schedule. This module includes ana-lysis of selected maintenance intervention costs usingsubsystem and element data from the bridge assetregister, inspection reports and structural healthmonitoring data. A database holds the maintenanceactions which can be applied to relevant asset condi-tion states. This information assists in estimatingmaintenance costs based on geographical location,defect extent and severity analysis. Cost modellingfor preventative maintenance actions is included toprovide a complete costing solution for bridge lifemanagement.
A discussion on operational processes for life cyclemanagement of bridges is provided including currentpractices and systems employed by Australian railwayagencies. The developed bridge management frame-work and its components are described in detailwith an illustrative example explaining defect manage-ment and cost analysis to effectively manage bridgeassets.
Current Australian railway bridgemanagement practices
Australian railway infrastructure owners address lifecycle maintenance management tasks either with theirown internal organisational processes or by employ-ing a commercially available BMS. Nevertheless, mostof the management systems utilised in Australia donot support a comprehensive bridge life cycle manage-ment approach to reduce maintenance costs. This ispartly contributable to current assessment processesnot recording the level of detail required to determineoptimal maintenance action.
Bridge inspection
Bridge defects are identified through inspection andmonitoring processes. Australian rail agencies inspectbridges at set frequencies based on their organisa-tional bridge maintenance standards. There are fourmain inspection types: preliminary, general, detailedand engineering. Preliminary inspections are con-ducted at least weekly by a railway patrolman, whois usually not a qualified bridge inspector but has beentrained to look for the symptoms of underlying bridge
Nielsen et al. 571
at PENNSYLVANIA STATE UNIV on September 16, 2016pif.sagepub.comDownloaded from
faults. General inspection frequencies range between1 and 2 years, while detailed inspection frequenciesrange between 2 and 6 years based on risk, construc-tion material and bridge design configuration.Engineering inspections are conducted on an ‘asneeded basis’.12–15
As these bridge inspection schedule timeframes aredesigned to identify the early signs of defects they arealso suitable for life cycle analysis. However, theinformation collected during inspections is limitedand does not include all information required forLCCA. The results from inspections and defect assess-ments are stored within organisational maintenancesystems and historical maintenance records are usu-ally kept for the life of the structure.
Prioritisation of defective structures
Having identified the bridge condition and defectsthrough assessment, each defect is assigned a ratingbased on the visual condition and qualitativelyassessed risk of element failure. Analysis of bridgecondition in one Australian rail agency found that96% of all assigned ratings fall in one of two cate-gories, ‘moderate’ or ‘significant’. This has meant thatrepair crews have many defects assessed at the samerating level and the maintenance manager is left withthe daunting task of determining which repair shouldbe conducted first and by which repair method.
A further two Australian rail agencies use condi-tion and risk of failure to determine the repair prior-ity. The inspector allocates a time-based priorityderived from the duration the defect can remain in-track before causing an increased risk to surroundingelements or to the safety of rail traffic and users. Forthese rail agencies, the bridge condition rating is alsothe defect priority, and the deterioration analysis isdrawn from the expertise and judgement of thebridge inspector.16 This subjective method of defectratings also leaves many defects at the same prioritygiving the same issue as the previously described con-dition-based defect rating system.
Bridge ranking techniques are designed to addressthe issue of too many defects of similar rating or prio-rities by ranking the bridges or defects in order ofmaintenance importance. By definition, bridge rank-ing would also aim to reduce the number of unex-pected urgent repairs. These techniques evaluatesignificant factors simultaneously and produce aquantitative ranked score based on these weightedfactors. Although bridge ranking may not always pro-vide the optimal solution when employed in isolation,it will give a list of repairs in their relative order ofimportance based on set performance criteria. Due toits simplicity, bridge ranking is a very popular tech-nique for prioritising maintenance works, and thereare many documented cases worldwide that are cur-rently in operation that are utilising multiple factorsand weightings.17
Selection of maintenance strategy
The decisions regarding bridge maintenance usuallyrequire consideration of various costs incurred byassessment, analysis, repair and replacement activ-ities. In Australia, some railway organisations requirethe repair cost estimation to be conducted by thebridge inspector, due to the inspector being onsiteand in an ideal position to estimate costs based ondefect severity, defect size, local conditions and main-tenance requirements. However, inspectors are oftennot fully aware of the latest industry maintenancepractices and sometimes quote repairs based oninappropriate maintenance methods. A review ofselected railway organisations revealed that over80% of bridge assessments did not have a repaircost estimation completed by the inspector. Theremaining 20% often had estimates that were basedon limited estimation knowledge.
Hence, it is concluded that the management ofAustralian railway bridges generates the followingissues.
1. General asset management systems are employedwithout LCCA consideration.
2. Bridge ranking is often conducted with limitedassessment information.
3. Maintenance actions are determined based on lim-ited assessment information.
4. No method to determine if long-term maintenancestrategies are cost-effective.
5. Local repairs conducted with minimal local or net-work optimisation.
6. Planning does not consider repair quality or theimpact of future maintenance.
7. Cost of travel to reach the bridge site in remotelocations is not considered in LCC.
8. Cost of access to inspect ‘out of reach’ bridgeelements is not considered in LCCs.
In order to overcome these shortcomings and toenable an effective bridge maintenance paradigm inAustralia, a comprehensive BMS is proposed to min-imise bridge LCC by suggesting a portfolio of main-tenance actions with expected maintenanceintervention dates.
Bridge management framework
Considering the requirements of a comprehensivebridge life cycle management system and consideringcurrent industry practices and constraints, theauthors have proposed the bridge managementframework provided in Figure 1. The framework isbased on a LCC approach and consists of threemodules: bridge assessment module, maintenanceoptimisation module and maintenance implementa-tion module.
572 Proc IMechE Part F: J Rail and Rapid Transit 227(5)
at PENNSYLVANIA STATE UNIV on September 16, 2016pif.sagepub.comDownloaded from
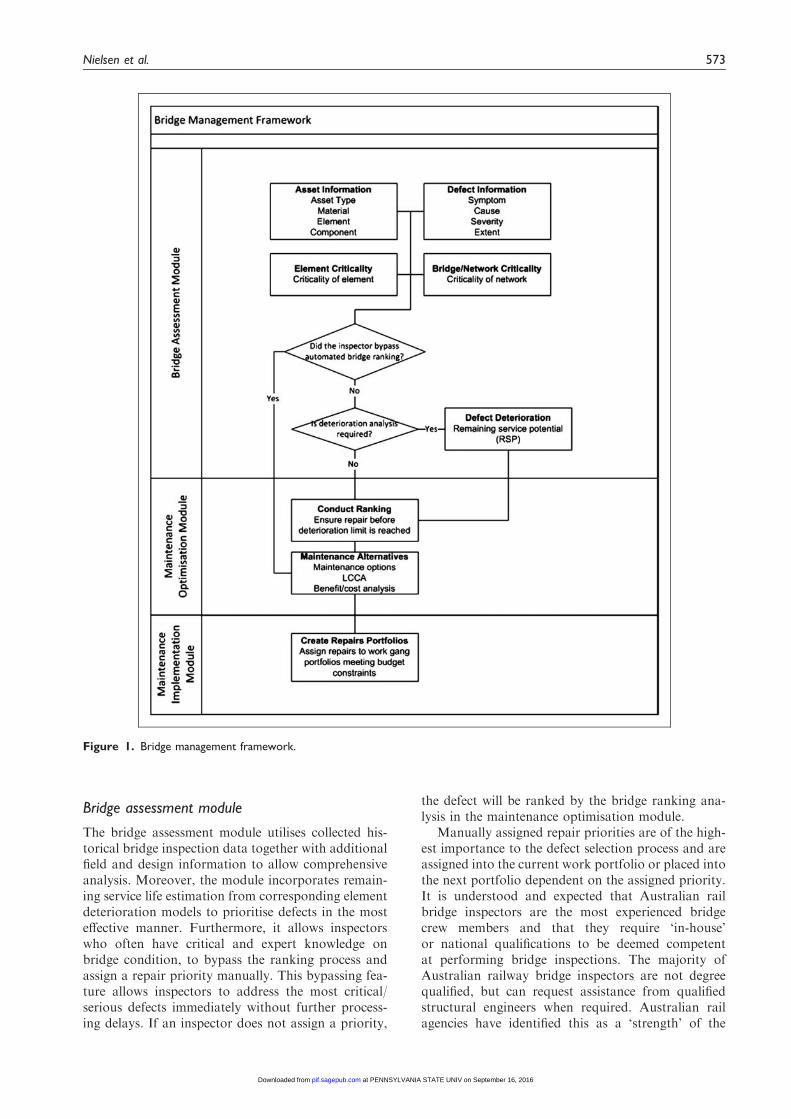
Bridge assessment module
The bridge assessment module utilises collected his-torical bridge inspection data together with additionalfield and design information to allow comprehensiveanalysis. Moreover, the module incorporates remain-ing service life estimation from corresponding elementdeterioration models to prioritise defects in the mosteffective manner. Furthermore, it allows inspectorswho often have critical and expert knowledge onbridge condition, to bypass the ranking process andassign a repair priority manually. This bypassing fea-ture allows inspectors to address the most critical/serious defects immediately without further process-ing delays. If an inspector does not assign a priority,
the defect will be ranked by the bridge ranking ana-lysis in the maintenance optimisation module.
Manually assigned repair priorities are of the high-est importance to the defect selection process and areassigned into the current work portfolio or placed intothe next portfolio dependent on the assigned priority.It is understood and expected that Australian railbridge inspectors are the most experienced bridgecrew members and that they require ‘in-house’or national qualifications to be deemed competentat performing bridge inspections. The majority ofAustralian railway bridge inspectors are not degreequalified, but can request assistance from qualifiedstructural engineers when required. Australian railagencies have identified this as a ‘strength’ of the
Figure 1. Bridge management framework.
Nielsen et al. 573
at PENNSYLVANIA STATE UNIV on September 16, 2016pif.sagepub.comDownloaded from
current bridge inspection process and the inspectors’expert opinion should override any automated rank-ing process. This practical approach ensures struc-tural safety by expediting emergency maintenanceworks.
Defect deterioration analysis of elements is con-ducted to determine the remaining life before elementsbecome ‘at risk’. Elements with known deteriorationperformance threshold dates are scheduled for repairbefore they reach these dates while allowing an appro-priate safety margin.
Asset information. Availability of adequate, relevantand accurate information is essential for effective ana-lysis. Consequently, an asset register was developedwhich contains the details on asset type, location,identification details, asset configuration, materialproperties, geometric details, loading information,environmental conditions, economic data, historicalinformation, ancillary functions and the identificationsystem of bridge structure and truss elements.
Defect information. As bridge elements age due to envir-onmental and operational stressors, they experiencedeterioration at various rates, and parts of the elem-ent will eventually develop noticeable indications of adefect. Defects can also be developed by naturalevents, accidental damage, intentional maliciousdamage, design faults or construction faults. Bridgeinspectors conduct periodic examinations of bridgesto identify defects before they become a risk to bridgeperformance. Defects found during inspections havetheir details captured, categorised and stored for fur-ther analysis or repair. Bridge inspectors assigndefects into categories based on the defect’s symp-toms, causes, severity and extent. Defect categoriesassist in determining the defect priority and act as aguide for maintenance intervention strategies.
1. Symptoms/causes. The words ‘symptoms’ and‘causes’ were selected to promote cultural change ofmaintenance information gathering and to assist withthe selection of the appropriate repair method.16
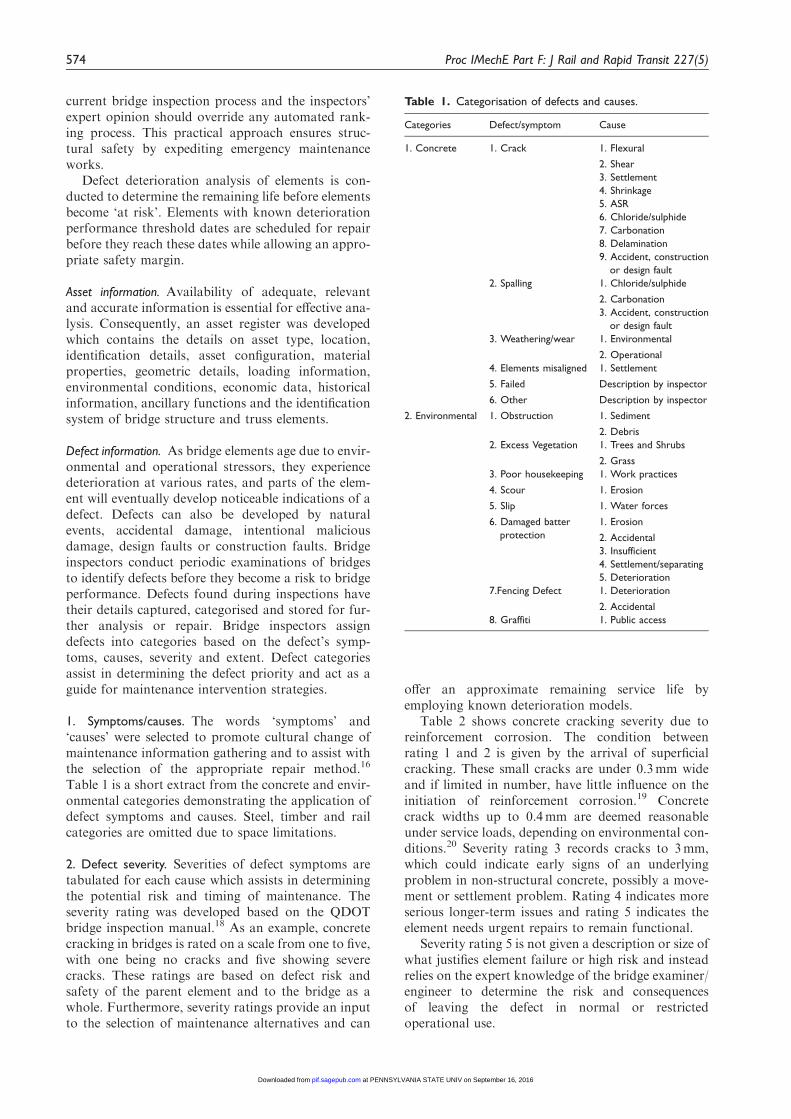
Table 1 is a short extract from the concrete and envir-onmental categories demonstrating the application ofdefect symptoms and causes. Steel, timber and railcategories are omitted due to space limitations.
2. Defect severity. Severities of defect symptoms aretabulated for each cause which assists in determiningthe potential risk and timing of maintenance. Theseverity rating was developed based on the QDOTbridge inspection manual.18 As an example, concretecracking in bridges is rated on a scale from one to five,with one being no cracks and five showing severecracks. These ratings are based on defect risk andsafety of the parent element and to the bridge as awhole. Furthermore, severity ratings provide an inputto the selection of maintenance alternatives and can
offer an approximate remaining service life byemploying known deterioration models.
Table 2 shows concrete cracking severity due toreinforcement corrosion. The condition betweenrating 1 and 2 is given by the arrival of superficialcracking. These small cracks are under 0.3mm wideand if limited in number, have little influence on theinitiation of reinforcement corrosion.19 Concretecrack widths up to 0.4mm are deemed reasonableunder service loads, depending on environmental con-ditions.20 Severity rating 3 records cracks to 3mm,which could indicate early signs of an underlyingproblem in non-structural concrete, possibly a move-ment or settlement problem. Rating 4 indicates moreserious longer-term issues and rating 5 indicates theelement needs urgent repairs to remain functional.
Severity rating 5 is not given a description or size ofwhat justifies element failure or high risk and insteadrelies on the expert knowledge of the bridge examiner/engineer to determine the risk and consequencesof leaving the defect in normal or restrictedoperational use.
Table 1. Categorisation of defects and causes.
Categories Defect/symptom Cause
1. Concrete 1. Crack 1. Flexural
2. Shear
3. Settlement
4. Shrinkage
5. ASR
6. Chloride/sulphide
7. Carbonation
8. Delamination
9. Accident, construction
or design fault
2. Spalling 1. Chloride/sulphide
2. Carbonation
3. Accident, construction
or design fault
3. Weathering/wear 1. Environmental
2. Operational
4. Elements misaligned 1. Settlement
5. Failed Description by inspector
6. Other Description by inspector
2. Environmental 1. Obstruction 1. Sediment
2. Debris
2. Excess Vegetation 1. Trees and Shrubs
2. Grass
3. Poor housekeeping 1. Work practices
4. Scour 1. Erosion
5. Slip 1. Water forces
6. Damaged batter
protection
1. Erosion
2. Accidental
3. Insufficient
4. Settlement/separating
5. Deterioration
7.Fencing Defect 1. Deterioration
2. Accidental
8. Graffiti 1. Public access
574 Proc IMechE Part F: J Rail and Rapid Transit 227(5)
at PENNSYLVANIA STATE UNIV on September 16, 2016pif.sagepub.comDownloaded from
3. Defect extent. Defect extent is another factor con-sidered for maintenance optimisation since it isincluded in the calculation of maintenance costs andLCCA. The extent of the defect is recorded in unitssuitable to measure the size of the defect’s symptom.A defect extent rating was not utilised in this model toimprove the accuracy of repair cost estimation.
Element criticality. Defect severity ratings are inconclu-sive by themselves and require the importance or crit-icality of the defective element to provide thesubsequent impact on bridge performance. For thispurpose, each bridge element is given a criticalityrating based on the significance of the element’simpact on bridge performance. For example, a struc-tural bridge element without any redundant elementswould be more critical than a non-structural element.It is widely believed that more critical elements shouldbe given a higher priority,21 yet too many levels in theratings ‘serves little purpose’.22 A bridge element crit-icality rating is presented in Table 3 with only fourlevels based on the elements’ criticality relating tobridge performance.16
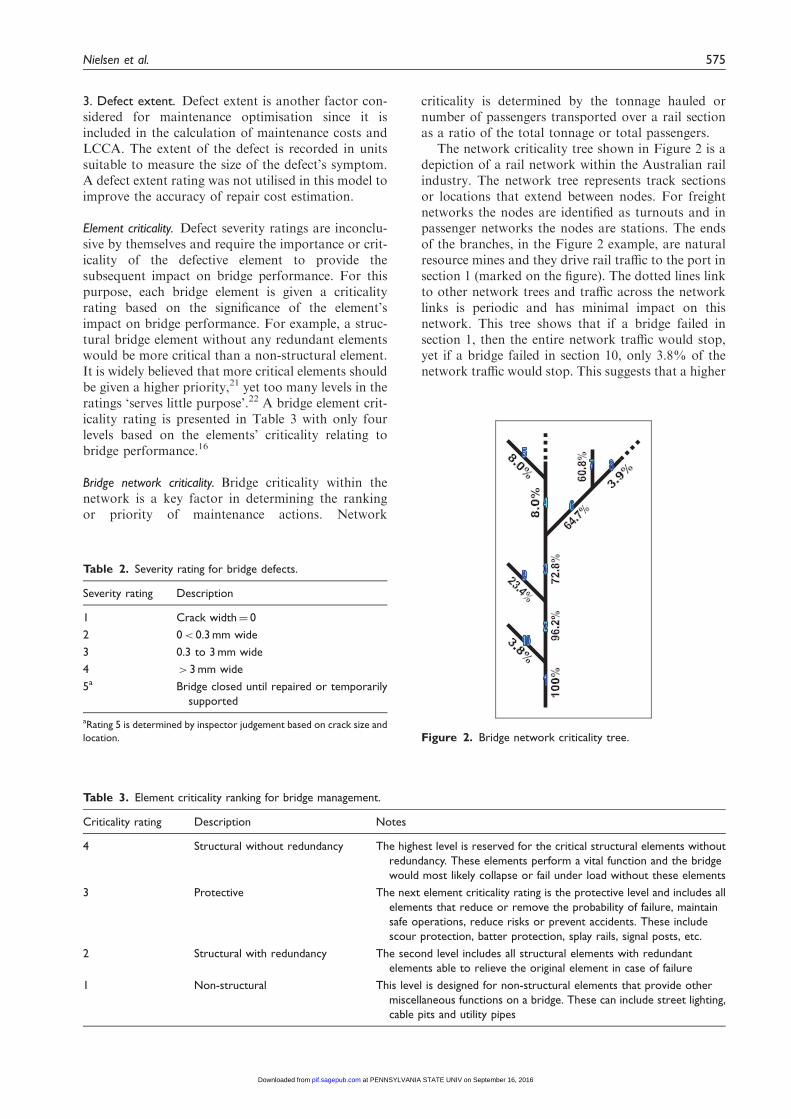
Bridge network criticality. Bridge criticality within thenetwork is a key factor in determining the rankingor priority of maintenance actions. Network
criticality is determined by the tonnage hauled ornumber of passengers transported over a rail sectionas a ratio of the total tonnage or total passengers.
The network criticality tree shown in Figure 2 is adepiction of a rail network within the Australian railindustry. The network tree represents track sectionsor locations that extend between nodes. For freightnetworks the nodes are identified as turnouts and inpassenger networks the nodes are stations. The endsof the branches, in the Figure 2 example, are naturalresource mines and they drive rail traffic to the port insection 1 (marked on the figure). The dotted lines linkto other network trees and traffic across the networklinks is periodic and has minimal impact on thisnetwork. This tree shows that if a bridge failed insection 1, then the entire network traffic would stop,yet if a bridge failed in section 10, only 3.8% of thenetwork traffic would stop. This suggests that a higher
Table 3. Element criticality ranking for bridge management.
Criticality rating Description Notes
4 Structural without redundancy The highest level is reserved for the critical structural elements without
redundancy. These elements perform a vital function and the bridge
would most likely collapse or fail under load without these elements
3 Protective The next element criticality rating is the protective level and includes all
elements that reduce or remove the probability of failure, maintain
safe operations, reduce risks or prevent accidents. These include
scour protection, batter protection, splay rails, signal posts, etc.
2 Structural with redundancy The second level includes all structural elements with redundant
elements able to relieve the original element in case of failure
1 Non-structural This level is designed for non-structural elements that provide other
miscellaneous functions on a bridge. These can include street lighting,
cable pits and utility pipes
Figure 2. Bridge network criticality tree.
Table 2. Severity rating for bridge defects.
Severity rating Description
1 Crack width¼ 0
2 0< 0.3 mm wide
3 0.3 to 3 mm wide
4 > 3 mm wide
5a Bridge closed until repaired or temporarily
supported
aRating 5 is determined by inspector judgement based on crack size and
location.
Nielsen et al. 575
at PENNSYLVANIA STATE UNIV on September 16, 2016pif.sagepub.comDownloaded from
maintenance priority would be placed on repairsin the higher-utilised sections compared with lower-utilised sections.
This network criticality tree is a simple exampledue to all traffic carrying the same axle loads.Traffic with varying axle loads will still use the sametree by including the axle loads and million grosstonnes (or any other factor) and applying a weightingto each factor. Bridges are allocated a network critic-ality percentage equal to the section criticality wherethe bridge is located. If a section has multiple tracksthen the appropriate criticality can be calculated froma ratio based on relevant track usage by rail traffic.
Defect deterioration. As mentioned earlier, the bridgeassessment module carries out deterioration analysisfor selected bridge failure modes. The reinforcementcorrosion on concrete structures requires detailedinformation on the bridge’s environmental factors topermit calculation of the remaining service life.Therefore, environmental information is collectedand stored in the asset register as categories of salinity(salt, fresh or no water), exposure class and averagerainfall. This level of detail greatly increases the accur-acy of the remaining service life estimations.
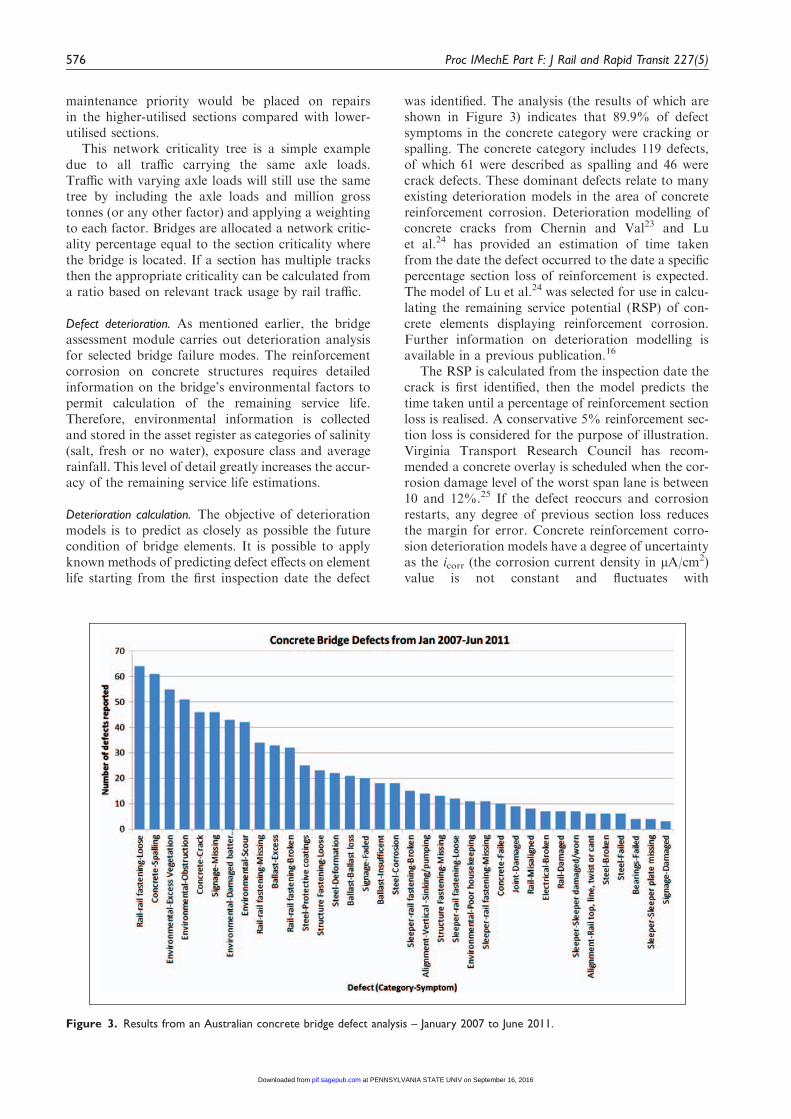
Deterioration calculation. The objective of deteriorationmodels is to predict as closely as possible the futurecondition of bridge elements. It is possible to applyknown methods of predicting defect effects on elementlife starting from the first inspection date the defect
was identified. The analysis (the results of which areshown in Figure 3) indicates that 89.9% of defectsymptoms in the concrete category were cracking orspalling. The concrete category includes 119 defects,of which 61 were described as spalling and 46 werecrack defects. These dominant defects relate to manyexisting deterioration models in the area of concretereinforcement corrosion. Deterioration modelling ofconcrete cracks from Chernin and Val23 and Luet al.24 has provided an estimation of time takenfrom the date the defect occurred to the date a specificpercentage section loss of reinforcement is expected.The model of Lu et al.24 was selected for use in calcu-lating the remaining service potential (RSP) of con-crete elements displaying reinforcement corrosion.Further information on deterioration modelling isavailable in a previous publication.16
The RSP is calculated from the inspection date thecrack is first identified, then the model predicts thetime taken until a percentage of reinforcement sectionloss is realised. A conservative 5% reinforcement sec-tion loss is considered for the purpose of illustration.Virginia Transport Research Council has recom-mended a concrete overlay is scheduled when the cor-rosion damage level of the worst span lane is between10 and 12%.25 If the defect reoccurs and corrosionrestarts, any degree of previous section loss reducesthe margin for error. Concrete reinforcement corro-sion deterioration models have a degree of uncertaintyas the icorr (the corrosion current density in mA/cm2)value is not constant and fluctuates with
Figure 3. Results from an Australian concrete bridge defect analysis – January 2007 to June 2011.
576 Proc IMechE Part F: J Rail and Rapid Transit 227(5)
at PENNSYLVANIA STATE UNIV on September 16, 2016pif.sagepub.comDownloaded from
environmental conditions. The worst-case scenariotakes the icorr as the maximum expected value basedon the individual bridge’s environmental conditions.This will result in a conservative failure risk thresholddate for repair. Onsite monitoring of icorr greatlyimproves the estimation of RSP due to corrosion.
Maintenance optimisation module
The maintenance optimisation module is divided intotwo parts. The first part is the bridge ranking analysisand the second is the LCCA with maintenance inter-vention timing analysis. The bridge ranking analysis isbased on defect severity and element/network critical-ity and outputs a ranked prioritised repair portfolio.LCCA is determined by analysing maintenance inter-vention options, their maintenance effect and costover the life of the structure.
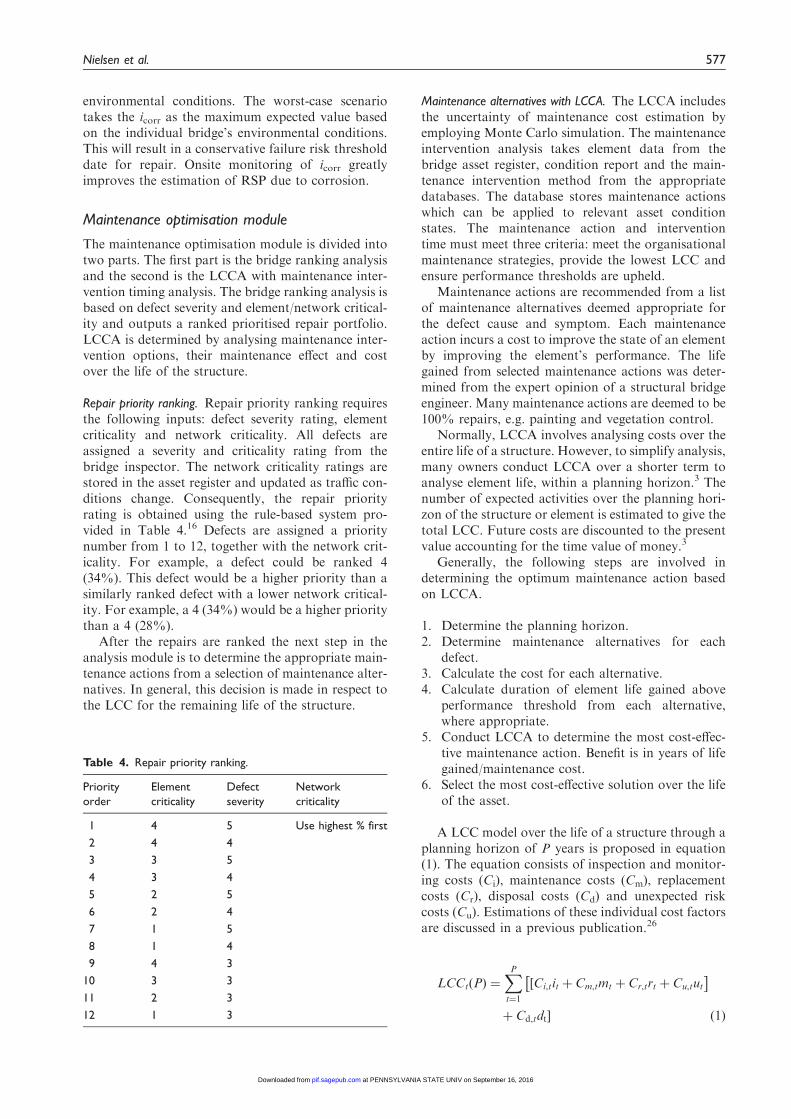
Repair priority ranking. Repair priority ranking requiresthe following inputs: defect severity rating, elementcriticality and network criticality. All defects areassigned a severity and criticality rating from thebridge inspector. The network criticality ratings arestored in the asset register and updated as traffic con-ditions change. Consequently, the repair priorityrating is obtained using the rule-based system pro-vided in Table 4.16 Defects are assigned a prioritynumber from 1 to 12, together with the network crit-icality. For example, a defect could be ranked 4(34%). This defect would be a higher priority than asimilarly ranked defect with a lower network critical-ity. For example, a 4 (34%) would be a higher prioritythan a 4 (28%).
After the repairs are ranked the next step in theanalysis module is to determine the appropriate main-tenance actions from a selection of maintenance alter-natives. In general, this decision is made in respect tothe LCC for the remaining life of the structure.
Maintenance alternatives with LCCA. The LCCA includesthe uncertainty of maintenance cost estimation byemploying Monte Carlo simulation. The maintenanceintervention analysis takes element data from thebridge asset register, condition report and the main-tenance intervention method from the appropriatedatabases. The database stores maintenance actionswhich can be applied to relevant asset conditionstates. The maintenance action and interventiontime must meet three criteria: meet the organisationalmaintenance strategies, provide the lowest LCC andensure performance thresholds are upheld.
Maintenance actions are recommended from a listof maintenance alternatives deemed appropriate forthe defect cause and symptom. Each maintenanceaction incurs a cost to improve the state of an elementby improving the element’s performance. The lifegained from selected maintenance actions was deter-mined from the expert opinion of a structural bridgeengineer. Many maintenance actions are deemed to be100% repairs, e.g. painting and vegetation control.
Normally, LCCA involves analysing costs over theentire life of a structure. However, to simplify analysis,many owners conduct LCCA over a shorter term toanalyse element life, within a planning horizon.3 Thenumber of expected activities over the planning hori-zon of the structure or element is estimated to give thetotal LCC. Future costs are discounted to the presentvalue accounting for the time value of money.3
Generally, the following steps are involved indetermining the optimum maintenance action basedon LCCA.
1. Determine the planning horizon.2. Determine maintenance alternatives for each
defect.3. Calculate the cost for each alternative.4. Calculate duration of element life gained above
performance threshold from each alternative,where appropriate.
5. Conduct LCCA to determine the most cost-effec-tive maintenance action. Benefit is in years of lifegained/maintenance cost.
6. Select the most cost-effective solution over the lifeof the asset.
A LCC model over the life of a structure through aplanning horizon of P years is proposed in equation(1). The equation consists of inspection and monitor-ing costs (Ci), maintenance costs (Cm), replacementcosts (Cr), disposal costs (Cd) and unexpected riskcosts (Cu). Estimations of these individual cost factorsare discussed in a previous publication.26
LCCtðPÞ ¼XP
t¼1
½Ci,tit þ Cm,tmt þ Cr,trt þ Cu,tut� �
þ Cd,tdt� ð1Þ
Table 4. Repair priority ranking.
Priority
order
Element
criticality
Defect
severity
Network
criticality
1 4 5 Use highest % first
2 4 4
3 3 5
4 3 4
5 2 5
6 2 4
7 1 5
8 1 4
9 4 3
10 3 3
11 2 3
12 1 3
Nielsen et al. 577
at PENNSYLVANIA STATE UNIV on September 16, 2016pif.sagepub.comDownloaded from
Note: it,mt, rt, ut and dt equal one if the relevantevents occur within the period t, otherwise they havea value of zero.
The maintenance phase of bridge LCCs is dividedinto five main categories: assessment (inspection andmonitoring), routine maintenance (essential and pre-ventative), rehabilitation (refurbishment), upgradeand renew (new structure). The assessment costincludes the provision for general and detailed visualinspections and incorporates structural health moni-toring. Rehabilitation or element replacements aredescribed as the maintenance activities required tobring the asset back into a good condition.
Maintenance implementation module
The maintenance implementation module assignsmaintenance actions to appropriate work crews, pre-dicts requirements for external works and balancesresources and budget constraints. Defects that arescheduled for maintenance are renamed projects andassigned to work crews as a portfolio of projects.These portfolios hold the work programmed for4 week to 6 monthly blocks, depending on the railagency’s work procedures. The portfolios are assignedto maintenance work crews to manage the resourcingand administration of their maintenance portfolio.Each project may be assigned to one or more port-folios to obtain the input from specialised work crews.
There are many constraints on maintenanceactions, but generally, the largest constraint limitingmaintenance works is the budget. It is assumed thatadditional external resources can be assigned to pro-jects if the budget allows, implying that maintenancecrews will always have the capability to meet the allo-cated portfolios. Once maintenance costs are esti-mated, the projects are assigned to the relevantcrews in the order of maintenance priority rankinguntil the cost of projects allocated meets the mainten-ance budget available.
Case study
As many Australian rail agencies inspect bridges usingdiffering standards, methods and priorities, a fairdegree of creativity was required to merge datasets
for this case study. The data included inspection rec-ords from 208 concrete and concrete/steel bridgesfrom multiple rail agencies located around Australia.A summation of defect categories over the analysisperiod is provided in Figure 3.
The analysis findings show that within the top sixdefect categories, concrete spalling and cracking arethe only two categories that can directly contribute tostructural deficiency. The other top six categories relateto rail-to-rail fastenings, excess vegetation, waterwayobstruction and missing signage. It is important tonote that the greatest vulnerability of bridges is scourdue to the difficulty in accurately detecting active scourrates. Damaged batter protection and scour is listed asthe seventh and eighth most common defects foundrespectively.
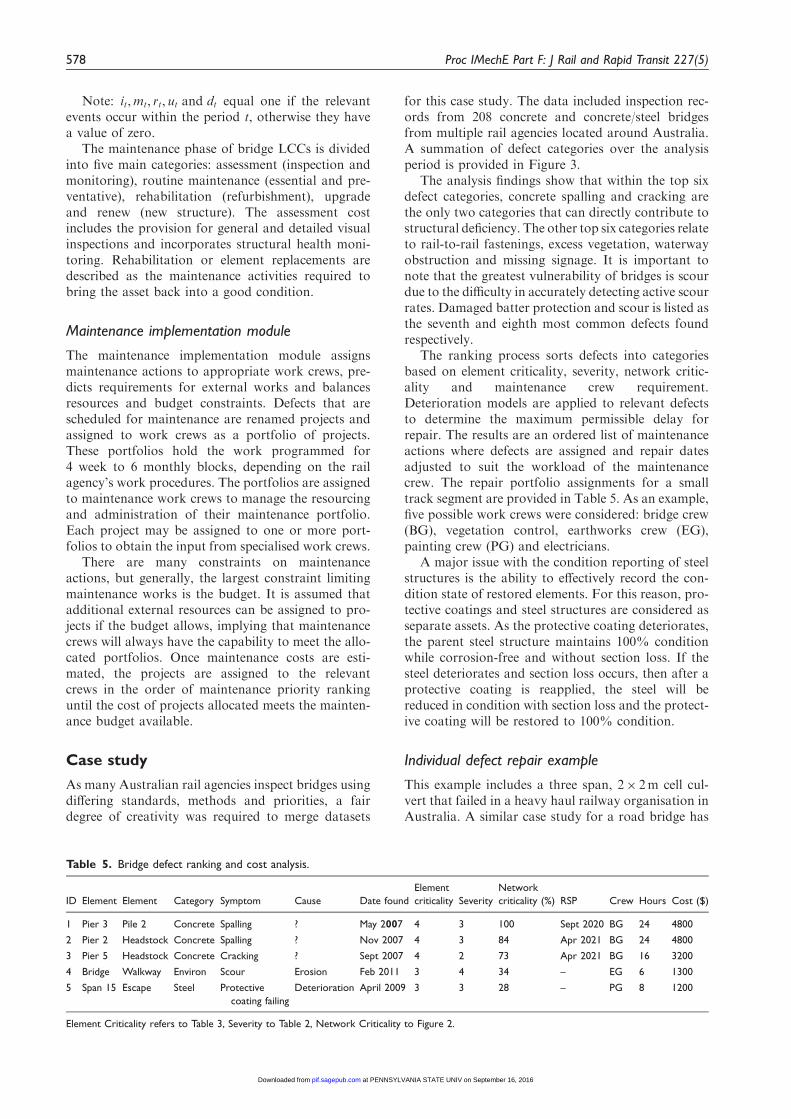
The ranking process sorts defects into categoriesbased on element criticality, severity, network critic-ality and maintenance crew requirement.Deterioration models are applied to relevant defectsto determine the maximum permissible delay forrepair. The results are an ordered list of maintenanceactions where defects are assigned and repair datesadjusted to suit the workload of the maintenancecrew. The repair portfolio assignments for a smalltrack segment are provided in Table 5. As an example,five possible work crews were considered: bridge crew(BG), vegetation control, earthworks crew (EG),painting crew (PG) and electricians.
A major issue with the condition reporting of steelstructures is the ability to effectively record the con-dition state of restored elements. For this reason, pro-tective coatings and steel structures are considered asseparate assets. As the protective coating deteriorates,the parent steel structure maintains 100% conditionwhile corrosion-free and without section loss. If thesteel deteriorates and section loss occurs, then after aprotective coating is reapplied, the steel will bereduced in condition with section loss and the protect-ive coating will be restored to 100% condition.
Individual defect repair example
This example includes a three span, 2� 2m cell cul-vert that failed in a heavy haul railway organisation inAustralia. A similar case study for a road bridge has
Table 5. Bridge defect ranking and cost analysis.
ID Element Element Category Symptom Cause Date found
Element
criticality Severity
Network
criticality (%) RSP Crew Hours Cost ($)
1 Pier 3 Pile 2 Concrete Spalling ? May 2007 4 3 100 Sept 2020 BG 24 4800
2 Pier 2 Headstock Concrete Spalling ? Nov 2007 4 3 84 Apr 2021 BG 24 4800
3 Pier 5 Headstock Concrete Cracking ? Sept 2007 4 2 73 Apr 2021 BG 16 3200
4 Bridge Walkway Environ Scour Erosion Feb 2011 3 4 34 – EG 6 1300
5 Span 15 Escape Steel Protective
coating failing
Deterioration April 2009 3 3 28 – PG 8 1200
Element Criticality refers to Table 3, Severity to Table 2, Network Criticality to Figure 2.
578 Proc IMechE Part F: J Rail and Rapid Transit 227(5)
at PENNSYLVANIA STATE UNIV on September 16, 2016pif.sagepub.comDownloaded from
been made in Sweden by Safi et al.27 The definition offailure is the point at which a structure cannot operateat 100% of its design loading capacity. This culvertfailed to meet its functional capacity due to a speedand load restriction imposed due to the entire culvert‘pumping’ approximately 40mm under the load of railtraffic. The culvert was constructed in 1979 and laterstrengthened in 1987 to accommodate heavier axleloads. Other defects on the culvert included exposedreinforcement on 5% of the base slab and numerousrepaired concrete cracks in the wing walls and culvertcells. The culvert’s RSP was expected to be approxi-mately 25 years.
The location of the culvert is in an alluvial floodplain and it was built on a clay base without aprons.The culvert sat in 1.5m of water for over 10 years andnever dried out due to irrigation runoff from nearbyagricultural land. The repair options considered wereto inject cementitious material under the culvert baseto raise the culvert back to the correct height and toform a solid base for the culvert, or to replace theculvert with a bridge structure.
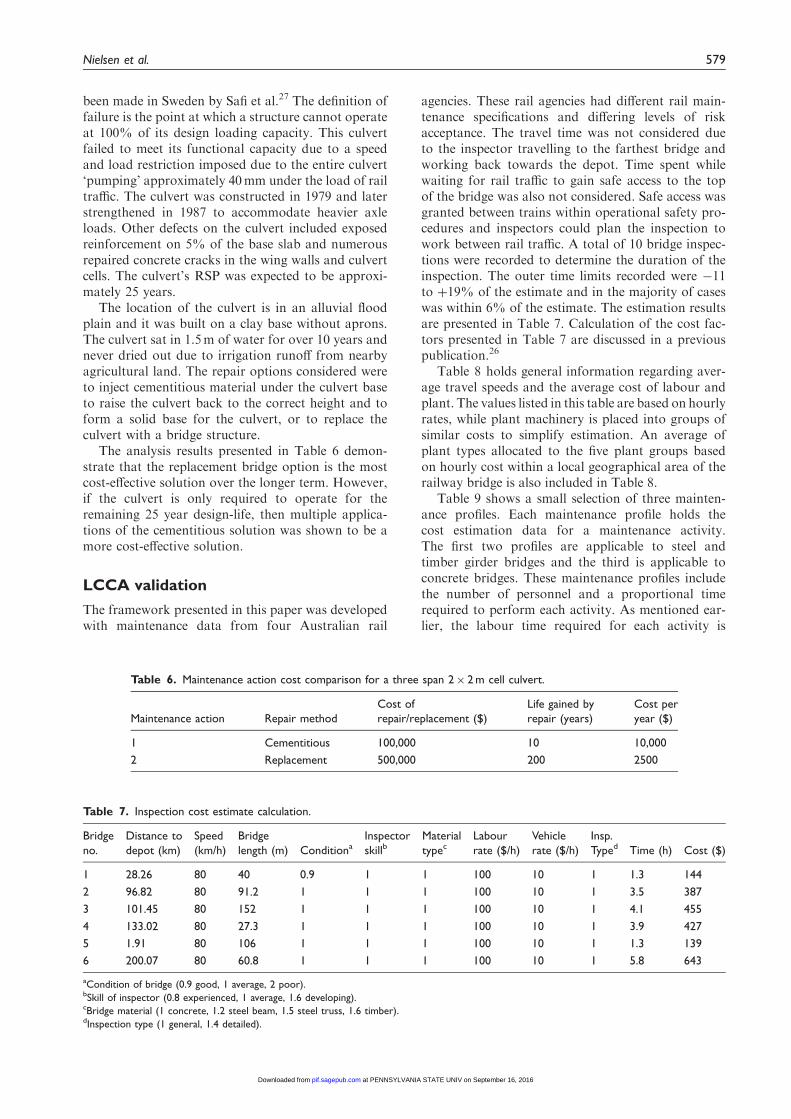
The analysis results presented in Table 6 demon-strate that the replacement bridge option is the mostcost-effective solution over the longer term. However,if the culvert is only required to operate for theremaining 25 year design-life, then multiple applica-tions of the cementitious solution was shown to be amore cost-effective solution.
LCCA validation
The framework presented in this paper was developedwith maintenance data from four Australian rail
agencies. These rail agencies had different rail main-tenance specifications and differing levels of riskacceptance. The travel time was not considered dueto the inspector travelling to the farthest bridge andworking back towards the depot. Time spent whilewaiting for rail traffic to gain safe access to the topof the bridge was also not considered. Safe access wasgranted between trains within operational safety pro-cedures and inspectors could plan the inspection towork between rail traffic. A total of 10 bridge inspec-tions were recorded to determine the duration of theinspection. The outer time limits recorded were �11to þ19% of the estimate and in the majority of caseswas within 6% of the estimate. The estimation resultsare presented in Table 7. Calculation of the cost fac-tors presented in Table 7 are discussed in a previouspublication.26
Table 8 holds general information regarding aver-age travel speeds and the average cost of labour andplant. The values listed in this table are based on hourlyrates, while plant machinery is placed into groups ofsimilar costs to simplify estimation. An average ofplant types allocated to the five plant groups basedon hourly cost within a local geographical area of therailway bridge is also included in Table 8.
Table 9 shows a small selection of three mainten-ance profiles. Each maintenance profile holds thecost estimation data for a maintenance activity.The first two profiles are applicable to steel andtimber girder bridges and the third is applicable toconcrete bridges. These maintenance profiles includethe number of personnel and a proportional timerequired to perform each activity. As mentioned ear-lier, the labour time required for each activity is
Table 7. Inspection cost estimate calculation.
Bridge
no.
Distance to
depot (km)
Speed
(km/h)
Bridge
length (m) ConditionaInspector
skillbMaterial
typecLabour
rate ($/h)
Vehicle
rate ($/h)
Insp.
Typed Time (h) Cost ($)
1 28.26 80 40 0.9 1 1 100 10 1 1.3 144
2 96.82 80 91.2 1 1 1 100 10 1 3.5 387
3 101.45 80 152 1 1 1 100 10 1 4.1 455
4 133.02 80 27.3 1 1 1 100 10 1 3.9 427
5 1.91 80 106 1 1 1 100 10 1 1.3 139
6 200.07 80 60.8 1 1 1 100 10 1 5.8 643
aCondition of bridge (0.9 good, 1 average, 2 poor).bSkill of inspector (0.8 experienced, 1 average, 1.6 developing).cBridge material (1 concrete, 1.2 steel beam, 1.5 steel truss, 1.6 timber).dInspection type (1 general, 1.4 detailed).
Table 6. Maintenance action cost comparison for a three span 2� 2 m cell culvert.
Maintenance action Repair method
Cost of
repair/replacement ($)
Life gained by
repair (years)
Cost per
year ($)
1 Cementitious 100,000 10 10,000
2 Replacement 500,000 200 2500
Nielsen et al. 579
at PENNSYLVANIA STATE UNIV on September 16, 2016pif.sagepub.comDownloaded from
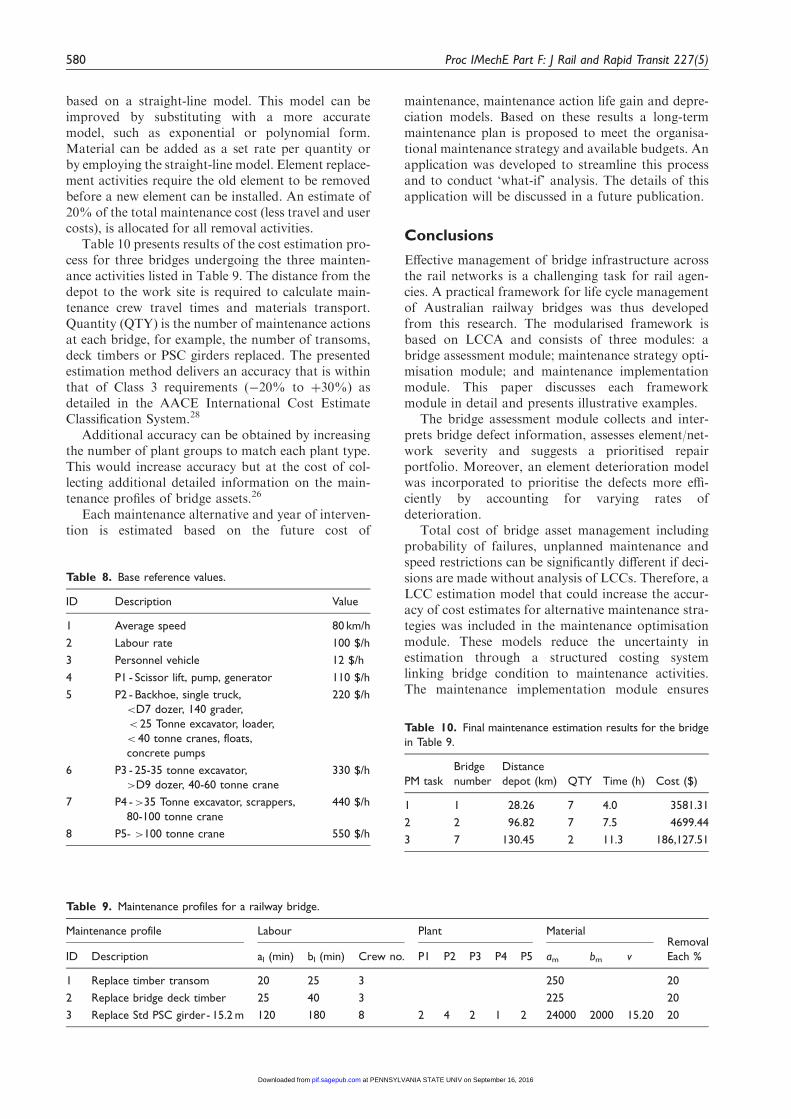
based on a straight-line model. This model can beimproved by substituting with a more accuratemodel, such as exponential or polynomial form.Material can be added as a set rate per quantity orby employing the straight-line model. Element replace-ment activities require the old element to be removedbefore a new element can be installed. An estimate of20% of the total maintenance cost (less travel and usercosts), is allocated for all removal activities.
Table 10 presents results of the cost estimation pro-cess for three bridges undergoing the three mainten-ance activities listed in Table 9. The distance from thedepot to the work site is required to calculate main-tenance crew travel times and materials transport.Quantity (QTY) is the number of maintenance actionsat each bridge, for example, the number of transoms,deck timbers or PSC girders replaced. The presentedestimation method delivers an accuracy that is withinthat of Class 3 requirements (�20% to þ30%) asdetailed in the AACE International Cost EstimateClassification System.28
Additional accuracy can be obtained by increasingthe number of plant groups to match each plant type.This would increase accuracy but at the cost of col-lecting additional detailed information on the main-tenance profiles of bridge assets.26
Each maintenance alternative and year of interven-tion is estimated based on the future cost of
maintenance, maintenance action life gain and depre-ciation models. Based on these results a long-termmaintenance plan is proposed to meet the organisa-tional maintenance strategy and available budgets. Anapplication was developed to streamline this processand to conduct ‘what-if’ analysis. The details of thisapplication will be discussed in a future publication.
Conclusions
Effective management of bridge infrastructure acrossthe rail networks is a challenging task for rail agen-cies. A practical framework for life cycle managementof Australian railway bridges was thus developedfrom this research. The modularised framework isbased on LCCA and consists of three modules: abridge assessment module; maintenance strategy opti-misation module; and maintenance implementationmodule. This paper discusses each frameworkmodule in detail and presents illustrative examples.
The bridge assessment module collects and inter-prets bridge defect information, assesses element/net-work severity and suggests a prioritised repairportfolio. Moreover, an element deterioration modelwas incorporated to prioritise the defects more effi-ciently by accounting for varying rates ofdeterioration.
Total cost of bridge asset management includingprobability of failures, unplanned maintenance andspeed restrictions can be significantly different if deci-sions are made without analysis of LCCs. Therefore, aLCC estimation model that could increase the accur-acy of cost estimates for alternative maintenance stra-tegies was included in the maintenance optimisationmodule. These models reduce the uncertainty inestimation through a structured costing systemlinking bridge condition to maintenance activities.The maintenance implementation module ensures
Table 8. Base reference values.
ID Description Value
1 Average speed 80 km/h
2 Labour rate 100 $/h
3 Personnel vehicle 12 $/h
4 P1 - Scissor lift, pump, generator 110 $/h
5 P2 - Backhoe, single truck,
<D7 dozer, 140 grader,
< 25 Tonne excavator, loader,
< 40 tonne cranes, floats,
concrete pumps
220 $/h
6 P3 - 25-35 tonne excavator,
>D9 dozer, 40-60 tonne crane
330 $/h
7 P4 ->35 Tonne excavator, scrappers,
80-100 tonne crane
440 $/h
8 P5- >100 tonne crane 550 $/h
Table 9. Maintenance profiles for a railway bridge.
Maintenance profile Labour Plant MaterialRemoval
ID Description al (min) bl (min) Crew no. P1 P2 P3 P4 P5 am bm v Each %
1 Replace timber transom 20 25 3 250 20
2 Replace bridge deck timber 25 40 3 225 20
3 Replace Std PSC girder- 15.2 m 120 180 8 2 4 2 1 2 24000 2000 15.20 20
Table 10. Final maintenance estimation results for the bridge
in Table 9.
PM task
Bridge
number
Distance
depot (km) QTY Time (h) Cost ($)
1 1 28.26 7 4.0 3581.31
2 2 96.82 7 7.5 4699.44
3 7 130.45 2 11.3 186,127.51
580 Proc IMechE Part F: J Rail and Rapid Transit 227(5)
at PENNSYLVANIA STATE UNIV on September 16, 2016pif.sagepub.comDownloaded from
planned work can be completed with availableresources and within required deadlines. To conclude,case studies were provided to demonstrate the defectprioritisation and cost estimation method.
Future work in this project includes developmentof maintenance strategy optimisation and mainten-ance portfolio management models. Finally, a soft-ware application will be developed to combine thesemodels into a bridge life cycle management decisionsupport system. The outcome of this research is afaster, more accurate system increasing informed deci-sion-making for LCC management of Australian rail-way bridges.
Funding
The authors are grateful to the CRC for Rail Innovation(established and supported under the AustralianGovernment’s Cooperative Research Centres programme)
for the funding of this research Project no. R3.118.Project Title: ‘Life Cycle Management of Railway Bridges’.
Acknowledgements
The authors acknowledge the support of the Centre for
Railway Engineering, Central Queensland University andthe industry partners that have contributed to this project.
References
1. ACA. Coal exports details. Canberra, Australia:
Australian Coal Association, 2009.2. Nielsen D, Chattopadhyay G and Raman D. Proposed
Australian rail bridge management framework.In: D Galar (ed.) Maintenance performance measure-
ment & management. Lulea, Sweden: Lulea Universityof Technology Press, 2011, pp.225–232.
3. Hawk H. Bridge life cycle costs analysis. National
Cooperative Highway Research Program Report 483,2003.Washington,DC: TransportationResearch Board.
4. Thoft-Christensen P. Infrastructures and life-cycle cost-
benefit analysis. Struct Infrastruct Engng 2012; 8:507–516.
5. Frangopol DM, Strauss A and Bergmeister K. Lifetime
cost optimization of structures by a combined condi-tion-reliability approach. Engng Struct 2009; 31:1572–1580.
6. Santander CF and Sanchez-Silva M. Design and main-
tenance programme optimization for large infrastruc-ture systems. Struct Infrastruct Engng 2008; 4: 297–309.
7. Frangopol DM. Life-cycle performance, management,
and optimisation of structural systems under uncer-tainty: accomplishments and challenges. StructInfrastruct Engng 2011; 7: 389–413.
8. Frangopol DM and Kong JS. Life-cycle safety and cost-ing for maintenance of aging bridges. Washington, DC:American Society of Civil Engineers, 2004.
9. Graubner CA, Knauff A and Pelke E. Life cycle con-
siderations as a base for assessment of the sustainabilityof road bridges. Lebenszyklusbetrachtungen alsGrundlage fur die Nachhaltigkeitsbewertung von
Straßenbrucken 2011; 80: 163–171.10. Kong JS and Frangopol DM. Life-cycle reliability-
based maintenance cost optimization of deteriorating
structures with emphasis on bridges. J Struct Engng2003; 129: 818–828.
11. Diaz CF and Hadipriono FC. Nondeterministic net-
working methods. J Construct Engng Mgment 1993;119: 40–57.
12. Queensland Rail. Civil engineering structures standard.
Module 01 - structure monitoring. Brisbane, Australia:Queensland Rail, 2008.
13. Australian Rail Track Corporation. Bridge and struc-
ture examination: general requirements. Sydney,Australia: Australian Rail Track Corporation, 2005.
14. Rail Corporation. Civil technical maintenance plan.Sydney: Australia: Rail Corporation, 2008.
15. V/Line. Inspection and assessment of bridges and struc-tures. Melbourne, Australia: V/Line, 2008.
16. Nielsen D, Chattopadhyay G and Raman D. Life cycle
management of railway bridges – Defect management.In: CORE – Conference on Railway Engineering (edsM Dhanasekar, T Constable and D Schonfeld),
Brisbane, Australia, 2012, pp.425–34. RailwayTechnical Society of Australasia.
17. Fwa TF. The handbook of highway engineering.
Boca Raton, FL: Taylor & Francis Group, 2006.18. Graham P. Bridge inspection manual. Brisbane,
Australia: Queensland Government, 2004.19. Atimay E and Ferguson PM. Early chloride corrosion
of reinforced concrete—a test report. Mater Perform1974; 13: 18–21.
20. Barth F and Frosch RJ. Control of cracking in concrete
structures. Farmington Hills, MI: American ConcreteInstitute, 2001.
21. Wang Y-M and Elhag TMS. Evidential reasoning
approach for bridge condition assessment. Expert SystAppl 2008; 34: 689–699.
22. Yanev B. The management of bridges in New YorkCity. Engng Struct 1998; 20: 1020–1026.
23. Chernin L and Val DV. Prediction of corrosion-inducedcover cracking in reinforced concrete structures.Construct Build Mater 2011; 25: 1854–1869.
24. Lu C, Jin W and Liu R. Reinforcement corrosion-induced cover cracking and its time prediction for rein-forced concrete structures. Corros Sci 2011; 53:
1337–1347.25. Williamson G, Weyers RE, Brown MC and Sprinkel
MM. Bridge deck service life prediction and costs.
Blacksburg, VA: Virginia Transport ResearchCouncil, 2007.
26. Nielsen D, Chattopadhyay G and Raman D. Life CycleCost Estimation for Railway Bridge Maintenance. In:
International Heavy Haul Association Conference (edsAK Banerjee and AK Singhal), New Delhi, India,2012, pp.311–318. Indian Railways.
27. Safi M, Sundquist H, Karoumi R, Racutanu G.Development of the Swedish bridge managementsystem by upgrading and expanding the use of LCC.
Structure and Infrastructure Engineering 2013; 9: 1240–1250.
28. Christensen P and Dysert L. Cost estimate classificationsystem – as applied in engineering, procurement, and
construction for the process industries. In: TCMFramework: 73 – Cost Estimating and Budgeting (edAACE) Morgantown, WV, 2005, pp.1–9. Association
for the Advancement of Cost Engineering.
Nielsen et al. 581
at PENNSYLVANIA STATE UNIV on September 16, 2016pif.sagepub.comDownloaded from