Chironomus esai n. sp. (Diptera: Chironomidae) in lakes and ...

Freshwater Biology (1995) 33, 511-524
Life cycle and production of Chironomidae (Diptera)from Lake Banyoles (NE Spain)
NARCfS PRAT AND MARIA RIHRADEVALLDepartment of Ecology, University of Barcelona, Diagonal 645, E-08028 Barcelona, Spain
SUMMARY
1. The life cycles and annual production of the eight most abundant species ofchironomids {Procladius cf. choreus, Tanypiis punctipennis, Chironomus bernensis, Chironomusgr. plumosus, Cladopelma virescens, Microchironomus tener, Tanytarsus gr. Jestagei, andCladotanytarsus atridorsum) were studied from sublittoral and profundal samples takenmonthly in Lake Banyoles during 1987 at five sampling stations (depths ranging from 5to 20 m).2. The number of generations per year deduced from instar-frequency data varied fromone to four, depending on the species, lake basin and depth. Annual temperature range,dissolved oxygen in the stratified period and presence of sulphide are the key factorsthat may explain the differences in the number of generations.3. Production estimates were calculated using the size-frequency (SF) method correctedfor the number of generations (SFG), and the increment-summation method (IS) whencohorts could be clearly deduced.4. Production calculated with the SFG method gave results which were comparable withthose of the IS method using smoothed-survivorship curves in the three species forwhich the use of the IS method was possible (C. virescens, M. tener and C. atridorsum).Using these methods production was estimated to range from 23-70 mg AFDW (ash-freedry weight) m~^ yr"^ at 12 m to 74-275 mg AFDW m"^ yr"^ in the sublittoral zone of thelake (5-m depth).5. Galculation of production for the other five species using the size-frequency methodwith the number of generations (SFG) deduced from monthly instar-frequency datagave values ranging from 12 mg AFDW m"^ yr~' {Chironomus bemensis at 20 m depth) to3.75 g AFDW m"2 yr"' (Procladius cf. choreus at 12 m).6. Total chironomid production (with the SFG method) varied from 0.8 to5 g AFDW m"^ yr^^ in the profundal and sublittoral, respectively. At each samplingstation two species groups accounted for most of the production: Procladius cf. choreusand Chironomus spp. Annual production/biomass ratio (P/B) varied from very highvalues for Procladius (between 11 and 27, as four generations completed each year) tovery low values for Chironomus gr. plumosus (2.20), which coniipleted only one generationeach year. The armual production of P. cf. choreus in Lake Banyoles is higher than anyreported in the literature due to the completion of four generations and to the highdensities of this species.
Introduction
As part of an extensive study of the ecology of the life cycles of several species of Ghironomidae andmacrobenthic fauna, and especially of Ghironom^idae, provided estimates of their biomass and production,in Lake Banyoles (Rieradevall & Prat, 1989, 1991; Prat We studied eight species of chironomids, which consti-& Rieradevall, 1993; Rieradevall, 1991) we described tuted 98% of the larval density, from the sublittoral
© 1995 Blackwell Science Ltd 511

512 N. Prat and M. Rieradevall
and profundal zones of this karstic lake. In a previouspaper (Prat & Rieradevall, 1993) the life cycle andproduction of one species in the lake (Cladopelmavirescens) were described. Here we compare produc-tion estimates of the eight most important chironomidspecies in the lake by means of two differentapproaches.
Even though descriptions of life history and estim-ates of production of benthic macroinvertebrates inlakes have a long tradition (Lindegaard, 1989), nocomparable study is available for chironomids inkarstic lakes and ponds. Similarly, papers on life cyclesof Chironomidae in aquatic lentic habitats of Spainare scarce (Vilchez & Gasas, 1987), and productionstudies have not been undertaken until now. Therefore,this is the first esfimate of chironomid production ina Spanish water body, and also the first published dataon production of the species Microchironomus tener.
Site description
Lake Banyoles is situated at 42°7'N, 2°45'E and at175 m above sea level. Its maximum length is 2.13 kmand its surface area is 1.18 km^. The lake is the biggestwater body in a karstic system, which includes severalaccompanying ponds, and the main entrance of wateris by means of subterranean inflow. As a result ofthis water inflow, permanent suspended sediment ismaintained in some deep parts of the lake and ponds.The bathymetry of the lake reveals five main basinsof differing depths (Fig. 1). The mean depth is 15 mand the maximum depth over suspended sedimentsis 35--iO m. The littoral zone (0-3 m) represents a thinstrip, as the lake rapidly reaches a depth of 20 m.Macrophytic vegetation {Phragmites, Schoenoplectus,etc.) and several Myriophyllum verticHlatum meadowsas well as travertinic rocks are abundant in the littoralzone. The lake is oligotrophic with cosmopolitanphyto- and zooplankton. Detailed descriptions of thelake and the limnology of the zone are given elsewhere(Planas, 1973, 1991; Garcia-Gil, 1990; Rieradevall,1991).
From October 1986 to December 1987, Secchi diskdepth ranged between 0.9 and 6.8 m, while bottomtemperatures varied between 8 and 25 °C dependingon depth. Conductivity and pH of surface water werearound 1300 ^S cm"' and 7-8.1, respectively. Theannual cycle of temperature and dissolved oxygen inthe water from two basins (I and III) have been
reported elsewhere (Rieradevall & Prat, 1989;Rieradevall, 1991) as well as the composition of thebenthic fauna in the sublittoral and profundal areasof basins I, III and IV (Rieradevall & Prat, 1991;Rieradevall, 1993; Rieradevall & Gil, 1993; Rieradevall& Real, 1994).
Methods
Sampling and laboratory methods
Population dynamics and secondary production of themost abundant species of Ghironomidae were deducedfrom monthly samples taken from December 1986 toDecember 1987, with a modified Ekman grab (surfacesampling area of 400 cm^) at five stations in the lakein basins I and IV at 5-, 7-, 12-, 13- and 20-m depths(stations 3, 9, 2, 8 and 1, respectively, in Fig. 1). Thesestafions were selected to follow a depth gradient intwo basins representing different anoxic conditionsduring the year. Three replicates per sampling stationwere taken. In total, 195 samples were processed.Samples were washed through a 150-|im-mesh netand the remaining material was sorted following themethod of Anderson (1959). Floating material wascollected and fixed in 70% ethanol, while the remainingsample, due to its volume, was preserved in 4%formalin. The preserved material was examined in thelaboratory and hand sorted under a stereoscope atlOX . Good efficiency (90% of the chironomids werein the floating material) was obtained with Anderson'stechnique (Rieradevall, 1991). In the laboratory thelarvae were examined under a stereomicroscope at40x , and classed in larval instars by measuring thewidth and/or length of the head capsule.
Life cycles
The number of generations of each species at eachsampling station was deduced from monthly changesin the reiafive abundance of each developmental phase(larval instars, prepupae and pupae), combined withchanges in density, according to the method used byLindegaard &J6nsson (1987), Lindegaard & Mortensen(1988) and Lindegaard & M5ehl (1992). Larval abund-ance, percentage of each instar and the mean weightsof larvae were used to calculate the number of genera-tions of each species.
© 1995 Blackwell Science Ltd, Freshwater Biology, 33, 511-524

Production of Chironomidae in Lake Banyoles 513
Fig. 1 Bathymetric map of Lake Banyoles showing the sampling stations (stars). The pn>duchon of Chironomidae was calculatedfor stations 1, 2, 3, 8 and 9. Shaded areas refer to the sites with suspended sediment. Roman numbers (I -V) indicate the differenttake basins.
Biomass and production
Biomass of each instar of each species was found byweighing 100 individuals per instar dried at 60 °C for24 h. The AFDW (ash-free dry weight) was found bysubtracting ash content after ignition (1 h at 550 °C)from dry weight. Weight losses due to preservationwere corrected by multiplying the AFDW biomass by1.67, as proposed by Lindegaard & Jonsson (1987).
If clear cohorts were recognizable, production wascalculated with the increment-summation method(IS). In this case, for each cohort, a smoothed sur-vivorship curve was drawn and the larval densitiesused for producHon calculations were those estimatedfrom the curve. The use of smoothed survivorshipcurves was proposed by Lindegaard & Jonsson (1987)in order to estimate the densities of small individualsthat may have been under rep resented in samples.Production was calculated from the followingequation:
© 1995 Blackweil Science Ltd, Freshwater Biologi/. 33, 511-524
P = I. (1)
where N, and N, +1 are the numbers of larvae at times( and t + 1 deduced from the smoothed survivorshipcurve. W,4.i and W, are the mean weights of larvae attimes (+1 and t, respectively. This method was appliedto Cladopelma virescens, Microchironomus tener andCladotanytarsus atridorsum.
We used the size-frequency method (SF) (Benke,1984; Soluk, 1985) as an altemative to calculate produc-tion of all species when cohorts were difficult todiscem, as recommended by Rader & Ward (1987),Morin, Mousseau & Roff (1987) and many others. Theequation was:
P = / S', = N,) (2)
In this case the differences in mean annual densityof each larval instar (Ny+j - N^ were multiplied by thegeometricmeanof its respective AFDW (W,+ i X W-p'^.The sum of the values for all instars was multiplied

514 N. Prat and M. Rieradevall
(a) Microchironomus tener, I - 12 m
Q
<
E
PLO
n j
E•6_c
0
0
0
0
.7--
5--
.3-
1 -
10
10-2 ,
10-
t
D J F M A M J J A S O N D
(b) Microchironomus tener, I - 5 m
oX
O
E
7
5 -
3 -
1 :
10'
f f
10-D J F M A M J J A S O N D
Fig. 2 (a) Percentage of each larvalinstar on each sampling date, smoothedsurvivorship curve and meanindividual growth for Microchironomustener at station 2 (12 m depth). Eachcohort is marked with differentlyshaded bar. The period with lowoxygen is indicated by the upperhorizontal bar. Ught area meanshypoxia (1-3 mg 1"') and dense areameans anoxia (< 1 mgl"'). Thepresence of pupae in the samples isshowed by means of an arrow. 100%equals the column width, (b) Resultsfor station 3.
by the number of instar classes (i = 3,4 or 5 dependingon the species) and by the number of generations (b)that each species developed in the lake (SFG approach).We ignored negative values in our estimations and
did not correct for the relative duration of each instar(the Pe/P ratio in Menzie, 1981) because data werenot available, and because this ratio is not constant.
At several sampling stations, larval density of some
© 1995 Biackwell Science Ltd, Freshwater Biology, 33, 511-524

species was too low to deduce the life history, or toesfimate production using the methods above. In thesecases, we used the P/B ratio obtained for the speciesat a similar depth in another part of the lake in orderto estimate annual production (production = meanannual biomass x P/B ratio).
Results
Abundance of chironomid species
We found eighteen chironomid species in the benthosof Lake Banyoles; data on spafial distribuHon andmean density of all species in four basins of the lakehave been published elsewhere (Rieradevall & Prat,1989,1991). Of all the chironomids collected, life cyclesand production were studied for eight {Procladius cf.choreus (Meigen), Tanypus punctipennis Meigen, Cladop-elma virescens (Meigen), Microchironomus tener (Kieffer),Ciadotanytarsus atridorsum Kieffer, Tanytarsus gr. lesta-gei, Chironomus bemensis Wulker & Klotzli and Ch. gr.plumosus). These eight species are those with meanannual densifies greater than 100 m~^ (Table 1), andthey accounted for more than 97% of the total chirono-mid community.
Life cycles
Cladopelma virescens. The life cycle and production ofCladopelma virescens has been described in a previouspaper (Prat & Rieradevall, 1993). This species com-pleted two generations at 5 and 12 m depths in basinI (stations 2 and 3). The first developed duringwinter-spring and reached higher densities than thesecond, which was a fast summer generafion. Pupaecorresponding to the first generation were found fromApril to June, and emergence of the second generafionpresumably took place in September-October.Microchironomus tener. Microchironomus tener had twogenerations per year, one in winter-spring and theother in summer at stafion 2 at 12 m (Fig. 2a). Thespring generation also had higher densities than thewinter generation. This life cycle was quite similar tothat of C. virescens. In the sublittoral (stafion 3, 5 m) itwas present at greater densifies (Table 1), and at leasttwo generations developed, according to the instar-frequency figure and density changes (Fig. 2b). Asin C. virescens only the spring generation had highdensifies while during late autumn and winter
© 1995 Blackwell Science Ltd, Freshwater Biology, 33, 511-524
Production of Chironomidae in Lake Banyoles 515
Table 1 Mean annual density of the eight most abundantChironomidae of Lake Banyoles at each of the five stations inwhich secondary production was calculated. Thesize-frequency method was used only when the mean larvaldensity was higher than 100 m~'
Species
Procladius cf. choreusTanypus punctipennisCladopelma I'irescensMicrochironomus tenerChironomus bemensisCh. gr. plumosusCladatatii/tarsus atridorsumTanytarsus gr. lestageiTotal of eight speciesTotal Ch iron o mid ae% eight spp./total Chir.
Sampling stations
1
5771
142822131
1066668497
2
136014544017627612910740
26732667
100
3
1511660
22462283
57450
160473
90019068
99
8
454-
33
66-
6532539
99
9
277899
11613460
13465
18435703664
97
(December - February) densifies were very low. Wesuppose that the bulk of population was at this timein the first instar and as this instar has a head widthof less than 150 \im (Table 2), which was the mesh sizeof our net, many of the young larvae were presumedto have been lost.Cladotanytarsus atridorsum. A similar pattern was foundfor Cladotanytarsus atridorsum. Owing to its meandensities, its life cycle could be detennined only inthe sublittoral area (station 3). Highest densifies werefound in spring. We used the same criteria as forthe previous species in order to draw the smoothedsurvivorship curve (Fig. 3). Three generafions of C.atridorsum in Lake Banyoles were found by thismethod.Procladius cf. choreus. The life cycle of Procladius cf.choreus at the different stations was more difficultto define, because young larvae (I + II instars) andprepupae were present for most of the year(Figs4a-c). As this was the most abundant species(Table 1) it was possible to study its populationdynamics and instar frequency at five of the stationssampled. In Fig. 4(a), data on instar frequency andmean monthly densifies at station 1 (20 m depth) arepresented. Data suggested four generations per year.This can also be deduced from data for station 3, at adepth of 5 m (Fig. 4b). These figures show the difficultyof drawing smoothed survivorship curves (the sam-pling would have to be done more frequently). Forproduction calculafions we assumed that P. cf. clioreuscompleted at least four generations per year at stations1, 2,3 and 9. (Although stations 2 and 9 are not shown

516 N. Prat and M. Rieradevall
Table 2 Mean head capsule length (HCL) and mean individualash-free dry weight (mg AFDW) for the eight most abundantspecies in Lake Banyoles. Some data were deduced from Fig. 8
Procladius cf. choreusInstar IInstar II 'Instar IIIInstar IVPrepupaePupaeTanypus punctipennisInstar IInstar IIInstar IIIInstar IV
Pa'pupaePupaeChironomus bernensisInstar IIInstar IIIInstar IVChironomus gr.plumosusInstar 11Instar IIIInstar IVCladopelma inrescensInstar IIInstar IIIInstar IVMicrocbironomus tenerInstar IInstar 11Instar IIIInstar IVStictochironomusmaculipennisInstar IInstar 11Instar IIIInstar IVCladotanytarsusatridorsumInstar IIInstar IIIInstar IVTanytarsus gr. lestageiInstar [IInstar IIIInstar IVPupae
HCL (^m)
Mean
118194341557
-
110177291463--
221436755
250520929
119200325
79Ul182303
82141319520
107167273
114178298-
Range
113-125154-275300-^25450-725--
103-113154-206257-309375-525--
175-309350-550600-950
150-350412-625700-1075
100-150165-268275-402
72-93100-144150-237257-412
73-93103-185250-381412-675
<125125-200>230
103-124134-216227-412-
AFDW
n
817187
116--
357
75
--
2156
245
550
112
156203164
4248373239
38
1250
5221682
204167
-
mg
-0.0080.0280.1120.4690.600
—0.0100.0330.3630.6180.698
0.0220.0780.591
0.0300.1901.750
0.0070.0200.043
0.0050.0170.049
--
0.3471.200
0.0040.0100.013
0.0040.0120.0470.050
in this paper, the instar-frequency data were verysimilar to those for the other two stations representedin Figs 4a and b.)
At station 8 (basin IV-13 m), anoxia limited thegrowth period of P. cf. choreus populations, as is shown
by the mean larval density and instar-frequency data(Fig. 4c). Due to the anoxia of the previous year, thefirst generation of P. cf. choreus at station 8 (beginningin early spring. Fig. 4c) must have originated from therecruitment of individuals from other parts of the lake,either by dispersion of young larvae or by eggsrecently laid in the area. The second generation hadgreater larval densities and developed from May toJuly. Later, anoxia reduced the P. cf. choreus populationto zero.
Other species. Another moderately abundant species inthe sublittoral was Tanypus punctipennis (Table 1).Using the same criteria as those applied to Procladiuscf. choreus, according to the population dynamics andthe monthly instar-frequency changes, two to threegenerations are possible in the lake.
The density of larvae of first and second instars ofChironomus species was always very low. Even atstation 3, where the density of C. bernensis was consid-erable (Table 1), the young larvae were always scarce,and no clear instar-frequency figure can be calculated.Likewise, changes in density during the year were oflittle use for describing the life cycle in Lake Banyoles.It seems that Chironomus develops slowly in the lakeand that only one generation occurs in the profundalzones, and only two in the sublittoral. We have usedthese figures for production studies, although we areaware that more research is needed regarding the lifecycle of these species and our results on productionshould be considered as a preliminary estimate.
A summary of the number of generations estimatedfor the different species at each sampling station isgiven in Table 3. In general the number of generationswas higher in the sublittoral than in the profundalzone, except for Procladius cf. choreus, which in basinI seemed to complete up to four generations, irrespect-ive of depth. This number of generations (term b inequation 2) is used here for production estimates withthe size-frequency method (SFG).
Size and biomass
The mean length of the larval head capsule and themean AFDW for each larval instar of all species ispresented in Table 2. A high correlation (r̂ = 0.89) wasfound between the length of head capsule and AFDWof all species studied (Fig. 5).
Mean specific annual biomass ranged from verylow values for Microchironomus tener in the deeper
© 1995 Blackwell Science Ltd, Freshwater Biohgy, 33, 511-524

Fig. 3 Percentage of each larval instaron each sampling date, smoothedsurvivorship curve and meanindividual growth for Oadolanytarsusatridorsum at station 3 (5 m depth). Thedifferent cohorts and presence of pupaeare indicated as in Fig. 2.
Production of Chironomidae in Lake Banyoles 517
Cladotanytarus atridorsum, I - 5 m
IV
t f t t
D J F M A M J J A S O N D
part of the lake (0.88 mg m ^), to high values for Ch.bernensis (210.37 mgm"^ at 5 m depth; Tables 4 and5). Total mean annual chironomid biomass at eachstation ranged from 74.08 mg m "^ at 20 m in basin Ito 556.33 mg m"^ at 5 m (Table 5).
Production
Production estimates for the three species in whichthe life cycle is clearest and in which the smoothedsurvivorship and growth curves have been deduced(Cladopelma virescens, Microchironomus tener and Cladot-anytarsus atridorsum) are given in Tables 4 and 5. Dataobtained with the IS and the SFG methods were ofthe same order of magnitude and gave comparableresults (Table 4). It should be noted that densitiesdeduced from smoothed survivorship curves wereused for the IS method, whereas with SFG the meanannual densities obtained from samples were used.
Total annual production and P/B ratio for the rest ofthe spedes at each sampling point using the SFGmethod are given in Table 5. Absence of data indicatesthat the species in question was not present at thissampling point or that its mean annual density wasvery low (see Table 1). The highest values for produc-tion were obtained for Procladius ci. choreus at all stations
because of its high densities throughout the year, and itscompletion of two to four generations. Total chironomidproduction for each sampling station varied between1.05 and 5.09 g m'^^yr"^. As in the case of biomass, thelowest production values were in the profundal and thehighest were in the shallow zones.
Discussion
Chironomid community and production
The chironomids of the sublittoral and profundal zonesof Lake Banyoles form a relatively rich community,particularly represented by eight species. The domin-ant species were the microcamivores like Proeladius,Microchironomus and Cladopelma, filter-feeders or detri-tivores such as Chironomus, Tanytarsus or Ciadotany-tarsus had lower densities and production. This maybe due to the dependence of these species on primaryproduction, as shown by Jonasson (1972, 1978) in hisclassic studies on Lake Esrom, however, because LakeBanyoles is oligotrophic (Planas, 1973,1991) the impor-tance of phytopiankton as food in the benthos shouldbe minimal.
It seems that the trophic web in the lake dependson allochthonous inputs. This small lake (1.18 km^) is
1995 Biackwell Science Ltd, Freshwater Biology, 33, 511-524

518 N. Prat and M. Rieradevall
(a) Procladius cf. choreus, I - 20 m
oK
(b) Procladius cf. choreus. 1 - 5 m
n
(c) Procladius cf. choreus, IV-13 m
PPPIV
I I I11
J
ZI
D J F M A M J J A S O N D
Fig. 4 Percentage of each larval inslaron each sampling date and changes inthe mean monthly density (withstandard error) of larvae of Procladiusd. choreus at (a) station 1 (20 m depth)(b) station 3 (5 m depth) and (c) station8 (13 m depth). Periods with lowoxygen content in the water areindicated with a bar at the bottom as inFig. 2. The different generations areindicated by different shadow strips.
1995 BlackweU Science Ltd, Freshwater Biology, 33, 511-524

surrounded by trees and, in addition to these naturalinputs, contributions of organic matter to the sedimentfrom human activities (manure) have been noted. Theorganic matter in the sediment is between 5 and 34%(Rieradevall, 1991), which may explain the high meanarmual densities of meiofauna (Rieradevall, 1993) and
10000
Production of Chironomidae in Lake Banyoles 519
the dominance of predatory chironomids in the lakebottom. The total density of chironomids is thereforerelatively high and similar to some eutrophic lakes,but the community is dominated by the microcarniv-ores (due to the importance of meiofauna).
Empirical models of population production havebeen proposed to assess secondary production values,and as tools of predictability of this parameter, especi-ally when data on hfe histories are not available.Plante & Downing (1990) proposed an equation basedon selected lake benthic invertebrates, which calculatesproduction as a function of the mean annual biomass(B), mean annual water temperature (T), and max-imum individual weight (W):
lnP = 0.05 + 0.79 ln B -i- 0.05 T - 0.16 In Wm
Similar approaches have been applied to rivers byMorin & Bourassa (1992) and Benke (1993). Using theabove-mentioned empirical model, the values obtainedare as high as, or higher than, our SFG estimates (Fig. 6).The application of models can give us a theoreticalframe of reference for field data. Values higher thanmodel predictions might indicate highly favourableenvironmental conditions, such as good food quality.When values are lower than expected, a stressful envir-onment, low-quality food or intrinsic life-history con-straints, may be implicated (Benke, 1993). Therefore wesuspect that the production of chironomids in sublit-toral and profundal zones of the karstic Lake Banyolesis submaximal due to low food quality of the allochthon-ous inputs and the stressful conditions of the deeperparts of the lake (anoxia, sulphide).
Factors influencing chironomid production in the lake
Factors other than temperature are important in deter-mining the growth of larvae and the survival of the
Table 4 Mean annual biomass (B; mg AFDW m"^), annual production (P; mg AFDW m"^ year"^) and productivity (P/B) of threechironomid species in Lake Banyoles in 1987. On the left, production measured by the increment-summation method of eachgeneration identified in the lake is indicated, as is total annual production. On the right production measured with thesize—frequency method is shown
Fig. 5 Relationship between the logarithm of the length ofhead capsule (HCL) and the tog mean individual ash-free dryweight of the eight species of Chironomidae for whichproduction is calculated. Two, three or four larval instars wereconsidered, depending on the species. Data are from Table 2.
Table 3 Number of generations per year for each species andstation deduced from the relative abundance of each larvalinstar, and changes in density over time. These data were usedin the computation of secondary prtxluction
Species
Procladius cf. choreusTanypus punctipennisCladopelma virescensMicrochironomus tenerChinmoimis bernensisCh. gr. plumosusCladotanytarsus atridorsumTanytarsus gr. lestagei
Sampling
1
4--1----
2
422211-I
stations
3
43
222-22
8
2----1-—
9
42--11-2
C. virescens.C. virescens.M. tener, s\.M. tener, st.
St.
st.32
Cl. atridorsum.
32
St. 3
Increment-summation (IS)
Jst generation
B
72.9019.5056.378.06
33.80
P
197.7060.18
174.5027.33
108.87
PIB
2.713.093.103.393.22
2nd generation
B
11.983.38
35.604.246.15
P
17.629.84
100.8410.4813-70
P/B
1.472.912.832.472.23
3rd
B
9,80
generation
P
15,30
P/B
156
Annual mean
B
42.4011.4045.986.15
19.97
P
215.0070.02275.3037.81137.87
P/B
5.076.145,986,146,90
Size-frequency
SFG
B
47.6310,7449,404.6522.09
P
270,3344,15
225,9322,7974.64
P/B
5.674,114,574.903.37
1995 Blackwell Science Ltd, Freshvmter Biology, 33, 511-524

520 N. Prat and M. Rieradevall
Table 5 Mean annual biomass (B in mg AFDW irt"^), annual production (P in mg AFDW m"^ yr"') and productivity (P/B) of theeight most abundant chironomidae of Lake Banyoles in 1987. Blanks denote the absence of the species at this point or its very lowabundance. An asterisk denotes that the production value was obtained using the P/B ratio of this species in a station of similardepth. Production was calculated with the si2,e-frequency method (SFG) corrected by the number of generations from Table 2
Stations
P/B B P/B B P/B B P/B P/B
Procladius d. choreus 39.86 982.4 24.64 16229 3751.67 23.11 79.59 2122.78 26.67 50.52 561.4311.12 133.25 2958.612220Tanypus
punctipennis
Cladopelma virescens
Microchironomus 0.88
tener
Chironomus
txrnensis
Chironomus gr.
plumosus
Cladotanytarsus
atridorsum
Tanytarsus gr.
lestagei
Total biomass
and production
36.57 350.57 9.58 79.89 1060.06 13.27
10.74 44.15 4.11 47.63 270.33 5.67
2.38 2.72 4.65 22.79 4.90 49.40 225.93 4.57
12.33 24.66 * 2 128.60 371.67 2.89 210.27 1185.67 5.63
144.00 2.20 89.75
74.64 3.37
3.24 2.36 15.26 * 6.47
556.73 5098.67 140.27
8.05 70.10 8.71
27.28 78.63 2.88
21.01 42.02 *2 169.53 498.80 2.88 65.5
2 5 9 . ^ 2.89 183.75 536.53 2.92
22.09
1.65 5.344.78 30.92 6.47
74.08 1051.46 513.03 5035.99821.28 357.11 3674.79
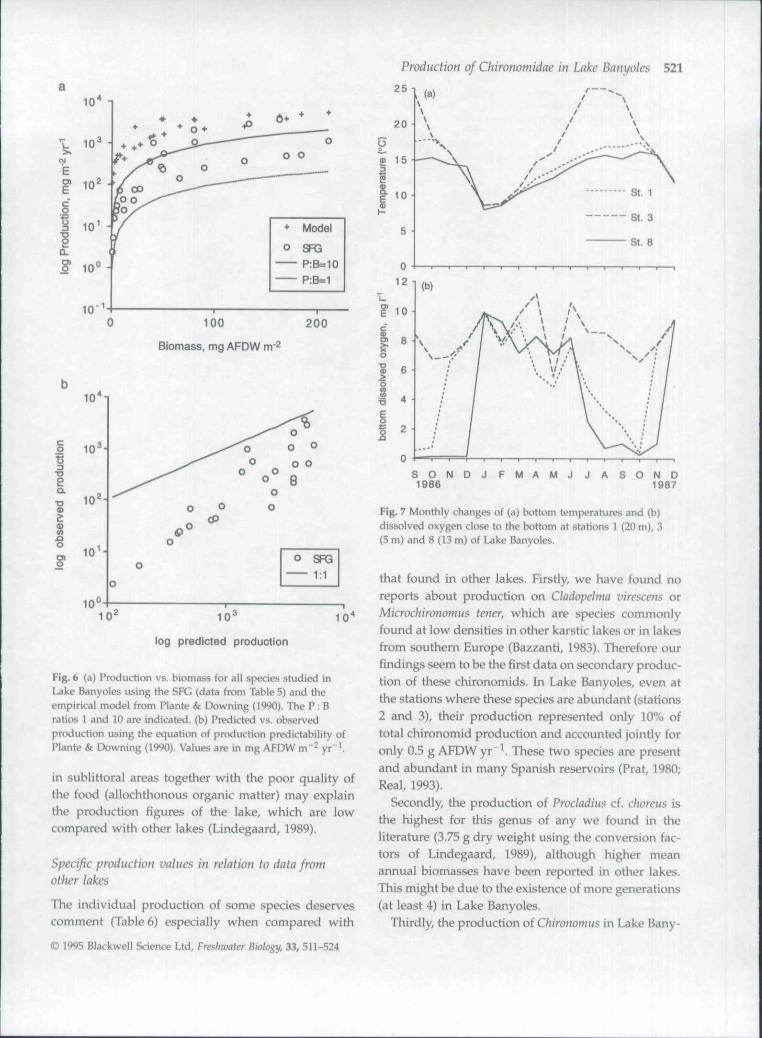
youngest chironomids living in sediments. In LakeBanyoles several constraints can be adduced in orderto explain the lower number of generations and lowergrowth of larvae than would be predicted from tem-perature records (Fig. 7a). Firstly, dissolved oxygencontent of water is low at some stations, where oxygenis absent for 4-5 months of the year. This is the caseat station 8, where only two generations of Procladiusand one of Chironomus developed, and where meanannual larval densities were low (Tables 1 and 5).
Interspecific (between Ciadopelma, Microchironomusand Procladius) or intraspecific (in Procladius due tohigh densities) competition could also account for thelow densities of summer populations after the highpeak of populations in spring. Predation by fishesmay be another important factor. In another paper(Rieradevall, Garcia & Prat, in press) we have shownthat chironomids from lake benthos are present incarp and roach stomachs in a proportion close to thatof benthos densities, showing the importance of thepredaHon factor.
Total chironomid production in Lake Banyoles isaffected, therefore, by depth and anoxia. Higher values(due to higher mean densities of Procladius and Chiron-omus) were obtained in the sublittoral zones (stations3 and 9 without anoxia; Fig. 7b) with intermediatevalues at 12 m (station 2) and lower values in the deep
zones {20 m, station 1 with only 1 month of pooroxygen conditions. Fig. 7b). In the basins with a longanoxic period (station 8) annual production was rela-tively low. At this station the very low oxygen (Fig. 7b)and high sulphide content of water (Garcia-Gil, 1990)prevented the presence of chironomids from June toNovember. Basin IV in Lake Banyoles is temporarilymeromictic at the depth studied, with large amountsof sulphide in bottom waters from June to October(Garcia-Gil, 1990). This element may limit productionof macrofauna due to its toxicity.
Production in the profundal (close to I g m " ^ or24.46 kj) and in the sublittoral (4.3 g m"^ ^^ 117.56 kj) issimilar to the low or intermediate values in publishedrecords from other lakes (Lindegaard, 1989). P/Bvalues are relatively high, especially when comparedwith northern lakes (e.g. Lindegaard, 1992). Highproduction of chironomids is typical of ecosystemswhere opportunistic species, with high recolonizationcapacity, may take advantage of moderate or frequentdisturbances. Environments where active biologicalpressures are exerted (e.g. predation or competition)or with intense or frequent disturbances (e.g. presenceof sulphide) should have lower chironomid produc-Hons, and we suggest, again, that this is the case inLake Banyoles. The intense disturbance in station 8(anoxia and sulphide) and compeHHon and predation
© 1995 BlackweU Science Ltd, Freshzvater Biology, 33, 511-524
3
QQ.
a>
6* * *
Production of Chironomidae in Lake Banyoles 521
25
100
Biomass, mg AFDW
200
10^-
10
10
10
3 .
2 ,
1 .
10'10'
log predicted production
1 0 '
Fig, 6 (a) Production vs. biomass for all species studied inLake Banyoles using the SFG (data from Table 5) and theempirical model from Plante & Downing (1990). The P: Bratios 1 and 10 are indicated, (b) Predicted vs. observedproducfion using the equafion of prcxiuction predictability ofPlante & Downing (1990). Values are in mg AFDW m "̂ yr"',
in sublittoral areas together with the poor quality ofthe food (allochthonous organic matter) may explainthe production figures of the lake, which are lowcompared with other lakes (Lindegaard, 1989).
Specific production values in relation to data fromother lakes
The individual production of some species deservescomment (Table 6) especially when compared with
© 1995 Blackwell Science Ltd, Freshwater Biology, 33, 511-524
S O N D J F M A M J J A S O N D1 9 8 6 1 9 8 7
Fig. 7 Monthly changes of (a) bottom temperatures and (b)dissolved oxygen close to the bottom at stafions 1 (20 m), 3(5 m) and 8 (13 m) of Lake Banyoles.
that found in other lakes. Firstly, we have found noreports about production on Cladopelma virescens orMicrochironomus tener, which are species commonlyfound at low densities in other karstic lakes or in lakesfrom southern Europe (Bazzanti, 1983). Therefore ourfindings seem to be the first data on secondary produc-tion of these chironomids. In Lake Banyoles, even atthe stations where these species are abundant (stations2 and 3), their production represented only 10% oftotal chironomid production and accounted jointly foronly 0.5 g AFDW yr"^ These two species are presentand abundant in many Spanish reservoirs (Prat, 1980;Real, 1993).
Secondly, the production of Procladius cf. choreus isthe highest for this genus of any we found in theliterature (3.75 g dry weight using the conversion fac-tors of Lindegaard, 1989), although higher meanannual biomasses have been reported in other lakes.This might be due to the existence of more generations(at least 4) in Lake Banyoles.
Thirdly, the production of Chironomus in Lake Bany-

522 N. Prat and M. Rieradevall
Table 6 Biomass (B), Production (P) and P/B ratio for different species of Chironomidae of the same genera as those found inLake Banyoles. Data are ranked according to the annual production. Some data on rivers are included. Data obtained with thesize-frequency method are indicated. Values are in mg dry weight. Conversions of different values (AFDW, DW, kcal or kj) areaccording to Lindegaard (1989). Data are from: (1) This study, (2) Ptante & Downing (1990), (3) Lindegaard & J6nsson (1987), (4)Grzybkowska (1989), (5) jonasson et al. (1990), (6) Dermott et at. (1977), (7) Graham & Bums (1983), (8) Iwakuma et at. (1983), (9)Grigelis (1989), (10) Paterson & Walker (1974) and (11) Gerstmeier (1989)
Species
Procladius cf. choreusP. choreusProcladius sp.Procladius sp.P. crassinervisProctadius sp.P. freemaniP. pectinatusProctadius cf. choreusP. choreusP. denticutatusP. barbatusP. denticutalus
Chironomus zealandicusChironomus ptumosusCh. aiithracinusCh. anthracinusCh. ptumosusCh. ptumosusCh. ptumosusChironomus sp.Chironomus sp.Chironomus bernensisChironomus sp.Ch. gr. ptumosusCh. bernensisCh. commutattusCh. gr. plumasus
CladotanytarsusCtadotanytarsusCtadolanytarsusCladotanytarsus
Tanytarsus barbitarsisT. gracilentusTanytarsus sp.r. lugensT. holochhrusT. inoperlusTanytarsus sp.T. gr. iestagei
U k e
Banyoles (12 m)Eglwys NunyddTexas pondHjabaek FjordLoch LevenRiver WidankaManitobaEsrom 'Banyoles (20 m)Loch LevenMemphremagog, SBMalsjoenMemphremagog, NB
HayesKasumgaturaLoch LevenEsromVorstjarveFederseeHjabaek FjordWidanka riverTundra pondsBanyoles (5 m)ManitobaBanyoles (7 m)Banyoles (12 m)Forth-BielthBanyoles (13 m)
Hjarbaek f)ordNormanWidanka riverBanyoies (5 m)
WerowrapMyvatnNormanEglwys NunyddidemidemStanberger seeBanyoles (7 m)
B
16251645
50048751
26951740
271306226S3
1580430065309090298385306100335
670021050
18412826990
3500114
22
80703780
45319^ 9
m2005
P
3752345023901900105610301010982982897860551140
292002400025600251709250897056504860340032311780536372396260
600078817075
664001905048302390154891012631
P/B
23.116.59
53.303.802.17
53.303.751.90
24.603.112.812.432.64
18.485.583.922.783.101.050.91
14.500.465.6335.82.922.891.472.89
1.7172.3045.00
3.37
8.205.40
107.007.526.485.390.636.47
Method
SFSFSF
SFSF
SF
SF
SFSFSFSF
SF
SFSFSF
SF
Ref.
(1)(2)(2)(3)(2)(4)(2)(5)(1)(2)(6)(2)(6)
(7)(8)(2)(2)(9)(2)(3)(4)(2)(1)(2)
(1)(1)(2)(1)
(3)(2)(4)(1)
(10)(2)(2)(2)
(2)(11)(1)
oles was very low compared with eutrophic lakes,
such as Lake Esrom (Denmark; Table 6). The use of
the size—frequency method does not give a high value
in this case because we considered that only one
or two generations develop in the lake. The low
production, despite the relatively high temperature,
may be due to the poor quality of the available food
and the high predation pressure from fishes. The
resulting P/B ratios are closer to those currently found
in the literature.
Finally, production values for Tanytarsini are also
rarely found in literature on lakes. In Lake Banyoles
Cladotanytarsus atridorsum and Tanytarsus spp. werepresent, but due to their low densities, low individual
© 1995 Blackwell Science Ltd, Freshwater Biology, 33, 511-524

Production of Chironomidae in Lake Banyoles 523
weight of larvae and low number of generations, finalproduction was very low compared with other lakes{Table 6).
Acknowledgments
Financial support was provided by CAYCIT projectPR84-0747 and a 'Caixa de Barcelona' personal grantto M. Rieradevall. Two anonymous referees havegreatly improved the text. R. Rycroft has revisedthe English.
References
Anderson R.O. (1959) A modified flotation technique forsorting bottom fauna samples. Limnology andOceanography, 4, 223-225.
Bazzanti M. (1983) Composition and diversity of theprofundal macrozoobenthic community in the pollutedlake Nemi {Central Italy). Acta Oecologica, OecologiaApplicata, 4 (3), 211-220.
Benke A.C. (1984) Secondary production of aquaticinsects. The Ecology of Aquatic Insects (Eds V. H. Reshand D. M. Rosenberg), pp. 289-322. Praeger, New York.
Benke A.C. (1993) Concepts and pattems of invertebrateproduction in running waters. Verhandtungcn derInternationale Vereinigung fiir Theoretische undAngeivandte Limnologie, 25, 15-38.
Dermott R.M., Kalff J., Leggett W.C. & Spence J. (1977)Production of Chironomus, Proctadius, and Chaoborus atdifferent levels of phytoplankton biomass in LakeMemphremagog, Quebec-Vermont. Journal of FisfieriesResearch Board of Canada, 34, 2001-2007.
Garcia-Gil J. (1990) Bacteris fototrofics i cicle del ferro aVestany de Banyoles. PhD thesis. Autonomous Universityof Barcelona, 295 pp.
Graham A. A. & Burns C.W. {1983) Production and ecologyof benthic chironomid larvae {Diptera) in Lake Hayes,New Zealand, a warm-monomictic eutrophic lake.Internationale Revue gesamten Hydrobioiogie, 68, 352-377.
Gerstmeier R. (1989) Seasonal pattems in the abundance,size, and production of profundal chironomidae inStanberger See (Bavaria, FRG). Spixiana, 12, 261-273.
Grigelis A. (1989) Distribution and ecology ofChironomidae larvae in the different types of lakes ofthe Lithuanian SSR. Acta Biologica Debrecina OecologiaHungarica, 2, 127-134.
Grzybkowska M. (1989) Production estimates of thedominant taxa of Chironomidae (Diptera) in themodified River Widawka and the natural River Grabia,Central Poland. Hydrobiologia, 179, 245-259.
Iwakuma T., Yasuno M. & Sugaya Y. (1983) Chironomidproduction in relation to phytoplankton primaryproduction in Lake Kasumigaura, Japan. Verhandlungender Internationale Vereinigung fur Theoretische undAngewandte Limnologie, 22, 1149-1159.
Jonasson P.M. (1972) Ecology and production of theprofundal benthos in relation to phytoplankton in LakeEsrom. Oikos Supplement, 14, 1-148.
Jonasson P.M. (1978) Zoobenthos of lakes. Verhandlungender Internationale Vereinigung fiir Theoretische undAngewandte Limnologie, 20, 13-37.
Jonasson P.M., Lindegaard C. & Hamburger K. {1990)Energy budget of Lake Esrom, Denmark. Verhandlungender Internationale Vereinigung fiir Theoretische undAngewandte Limnologie, 24, 632-640.
Lindegaard C. {1989) A review of secondary productionof zoobenthos in freshwater ecosystems with specialreference to Chironomidae (Diptera). Acta BiologicaDehrecina Oecologia Hungarica, 3, 231-240.
Lindegaard C. (1992) The role of zoobenthos in deep,oligotrophic Lake Thingvallavatn, Iceland.Hydrobiologia, 243/244, 185-195.
Lindegaard C. & Jonsson E. (1987) Abundance, populationdynamics and high production of Chironomidae{Diptera) in Hjarbaek Fjord, Denmark, during a periodof eutrophication. Entomologica Scandinavica Supplement,29, 294-302.
Lindegaard C. & Maehl P. (1992) Abundance, populationdynamics and production of Chironomidae (Diptrera)in an ultraoligotrophic lake in South Greenland.Netherlands Journal of Aquatic Ecology, 26, 297-308.
Lindegaard C. & Mortensen E. (1988) Abundance, lifehistory and production of Chironomidae {Diptera) ina Danish lowland stream. Archiv fur Hydrobioiogie,Supplement-Band, 81, 563-587.
Menzie C.A. (1981) Production ecology of Cricotopussylvestris (Fabricius) {Diptera: Chironomidae) in ashallow estuarine cove. Limnology and Oceanography, 26,467-^81.
Morin A., Mousseau T.A. & Roff D.A. {1987) Accuracy andprecision of secondary production estimates. Limnologyand Oceanography, 32, 1342-1352.
Morin A. & Bourassa N. (1992) Modeles empiriques dela production annuelle et du rapport P/B d'invertebresbenthiques d'eau courante. Canadian foumal of Fisheriesand Aquatic Sciences, 49, 532-539.
Paterson C.G. & Walker K.F. (1984) Seasonal dynamicsand productivity of Tanytarsus barbitarsis Freeman{Diptera: Chironomidae) in the benthos of a shallow,saline lake. Australian journal of Marine and FreshwaterResearch, 25, 151-165.
Planas M.D. (1973) Composicion, cicio y productividad
1995 Blackwell Science Ltd, Freshwater Biology, 33, 511-524

524 N. Prat and M. Rieradevall
del fitoplancton del lago de Banyoles. OecologiaAquatica, 1, 3-106.
Planas M.D. (1991) Factors controlling phytoplanktoncommunity structure in an alkaline vs. a softwater lake.Homage to Ramon Margalef; or. Why there is such pleasurein studying nature (Eds J. D. Ros and N. Prat). OecologiaAquatica, 10, 95-111.
Plante C. & Downing J.A. (1990) Empirical evidences fordifferences among methods for calculating secondaryproduction, journal of North American BenthologicalSociety. 9, 9-16.
Prat N. (1980) Bentos de los embalses espafioles. OecologiaAquatica, 4, 3-43.
Prat N. & Rieradevall M. (1993) Life cycle and productionof Cladopelma virescens (Mg.) (Diptera: Chironomidae)in Lake Banyoles (NE Spain). Netherlands journal ofAquatic Ecology, 26, 315-320.
Rader R.B. & Ward J.V. (1987) Mayfly production in aColorado mountain stream: an assessment of methodsfor synchronous and non-synchronous species.Hydrobiologia, 148, 145-150.
Real M. (1993) Ecologia del zoobetJtos profund alsembassaments de I'Estat Espanyol. PhD thesis. Universityof Barcelona, 180 pp.
Rieradevall M. (1991) Ecologia i produccio del bentos del Uacde Banyoles. PhD thesis. University of Barcelona, 242 pp.
Rieradevall M. (1993) Species composition and depthdistribution of meiobenthos in Lake Banyoies.Verhandtungen der Internationale Vereinigung furTheoretische und Angewandte Limnologie, 25. 726-730.
Rieradevall M. & Gil M.J. (1993) Distribution, densityand specific composition of water mites (Acari) inthe sublittoral of Lake Banyoles (Spain). Annales deLimnologie, 29 (1), 41-46.
Rieradevall M. & Prat N. (1989) Chironomidae ofprofundal samples of Banyoles lake (NE Spain). ActaBiologica Debrecina Oecologia Hungarica, 3, 267-274.
Rieradevall M. & Prat N. (1991) Benthic fauna of BanyolesLake (NE Spain). Verhandlungen der ItiternationaleVereinigung fiir Theoretische und Angewandte Limnologie,24, 1020-1023.
Rieradevall M. & Real M. (1994) On the distributionpattems and population dynamics of sublittoral andprofundal Oligochaeta fauna from Lake Banyoles(Catalonia, Spain). Hydrobiologia, 278, 139-149.
Rieradevall M., Garci'a-Berthou E. & Prat N. (in press)Chironomids in the diet of fish in Lake Banyoles(Catalonia, Spain). Chironomids -from Cenes toEcosystems (ed. P.S. Cranston). CSIRO Publications,Melbourne.
Soluk D.A. (1985) Macroinvertebrate abundance andproduction of psammophilous Chironomidae inshifting sand areas of a lowland river. Canadian journalof Fisheries and Aquatic Sciences, 42, 1296-1302.
Vilchez A. & Casas I. (1987) Chironomidae (Diptera)from stagnant waters in Granada, Spain. EntomotogicaScandinavica Supplements, 29, 57-64.
(Manuscript accepted 30 December 1994)
1995 BlackweU Science Ltd, Freshwater Biology, 33, 511-524

Copyright © 2022 FDOKUMEN