Life-course experiences and mortality by adult social class among young men
22
Social Science & Medicine 58 (2004) 2149–2170 Life-course experiences and mortality by adult social class among young men Tiina Pensola*, Pekka Martikainen Department of Sociology, Population Research Unit, University of Helsinki, P.O. Box 18, FIN-00014, Finland Abstract Circumstances over the life-course may contribute to adult social class differences in mortality. However, it is only rarely that the life-course approach has been applied to mortality studies among young adults. The aim of this study is to determine to what extent social class differences in mortality among young Finnish men are explained by living conditions in the parental home and life paths related to transitions in youth. The data for males born in 1956–60 based on the 1990 census records are linked with death records (3184 deaths) by cause of death for 1991–98, and with information on life-course circumstances from the 1970, 1975, 1980, and 1985 censuses. Controlling for living conditions in the parental home—social class, family type, number of siblings, language and region of residence— reduced the high excess mortality of the lower non-manual (RR 1.51, 95% CI: 1.28–1.79), skilled manual (RR 2.94, 2.54–3.40), and unskilled manual class (RR 4.08, 3.51–4.73) by 10% in all-cause mortality. The equivalent reduction for cardiovascular disease was 28% and for alcohol-related causes 16%. The effect of parental home on mortality differences was mainly mediated through its effect on youth paths (pathway model). Educational, marital, and employment paths had a substantial effect—independent of parental home—on social class differences from various causes of death. When all these variables were controlled for adult social class differences in cause specific mortality were reduced by 75–86%. Most of this reduction in mortality differences can be attributed to educational path. However, marital and employment paths had their independent effects, particularly on the excess mortality of unskilled manual workers with disproportionately common exposure to long-term unemployment and living without a partner. In summary, social class differences in total mortality among men in their middle adulthood were only partly determined by parental home but they were mainly attributable to educational, marital, and employment paths in youth. r 2003 Elsevier Ltd. All rights reserved. Keywords: Mortality; Life-course; Social background; Youth paths; Social inequalities; Social class; Finland Introduction Early life and social class differences in mortality in early middle age There is strong evidence that concurrent circum- stances affect the adult social class differences in mortality. There is also evidence that the origins of adult disease may lie in circumstances preceding adult social class, either in a specific critical or sensitive period probably in very early life, or in the accumulation of detrimental exposures over the life-course (Kuh & Ben- Shlomo, 1997; Ben-Shlomo & Kuh, 2002). According to ‘biological programming theories’, the factors triggering subsequent disease may be either genetic (e.g. some forms of alcoholism (Cadoret, Yates, Troughton, Woodworth, & Stewart, 1995)) or biological in nature (Barker, Bull, Osmond, & Simmonds, 1990; Barker, 1995; Kuh & Ben-Shlomo, 1997; Barker, Fors ! en, Uutela, Osmond, & Eriksson, 2001), affecting morbidity after a latent period independently of later experiences (Wilkinson, 1986, p. 6; Frankel, Davey Smith, & Gunnell, 1999; Leon & Davey Smith, 2000), or in ARTICLE IN PRESS *Corresponding author. Fax: +358-9-191-23967. E-mail address: tiina.pensola@helsinki.fi (T. Pensola). 0277-9536/$ - see front matter r 2003 Elsevier Ltd. All rights reserved. doi:10.1016/j.socscimed.2003.08.014
-
Upload
independent -
Category
Documents
-
view
3 -
download
0
Transcript of Life-course experiences and mortality by adult social class among young men

Social Science & Medicine 58 (2004) 2149–2170
ARTICLE IN PRESS
*Correspondi
E-mail addre
0277-9536/$ - see
doi:10.1016/j.soc
Life-course experiences and mortality by adult social classamong young men
Tiina Pensola*, Pekka Martikainen
Department of Sociology, Population Research Unit, University of Helsinki, P.O. Box 18, FIN-00014, Finland
Abstract
Circumstances over the life-course may contribute to adult social class differences in mortality. However, it is only
rarely that the life-course approach has been applied to mortality studies among young adults. The aim of this study is
to determine to what extent social class differences in mortality among young Finnish men are explained by living
conditions in the parental home and life paths related to transitions in youth. The data for males born in 1956–60 based
on the 1990 census records are linked with death records (3184 deaths) by cause of death for 1991–98, and with
information on life-course circumstances from the 1970, 1975, 1980, and 1985 censuses. Controlling for living
conditions in the parental home—social class, family type, number of siblings, language and region of residence—
reduced the high excess mortality of the lower non-manual (RR 1.51, 95% CI: 1.28–1.79), skilled manual (RR 2.94,
2.54–3.40), and unskilled manual class (RR 4.08, 3.51–4.73) by 10% in all-cause mortality. The equivalent reduction for
cardiovascular disease was 28% and for alcohol-related causes 16%. The effect of parental home on mortality
differences was mainly mediated through its effect on youth paths (pathway model). Educational, marital, and
employment paths had a substantial effect—independent of parental home—on social class differences from various
causes of death. When all these variables were controlled for adult social class differences in cause specific mortality
were reduced by 75–86%. Most of this reduction in mortality differences can be attributed to educational path.
However, marital and employment paths had their independent effects, particularly on the excess mortality of unskilled
manual workers with disproportionately common exposure to long-term unemployment and living without a partner.
In summary, social class differences in total mortality among men in their middle adulthood were only partly
determined by parental home but they were mainly attributable to educational, marital, and employment paths in
youth.
r 2003 Elsevier Ltd. All rights reserved.
Keywords: Mortality; Life-course; Social background; Youth paths; Social inequalities; Social class; Finland
Introduction
Early life and social class differences in mortality in early
middle age
There is strong evidence that concurrent circum-
stances affect the adult social class differences in
mortality. There is also evidence that the origins of
adult disease may lie in circumstances preceding adult
social class, either in a specific critical or sensitive period
ng author. Fax: +358-9-191-23967.
ss: [email protected] (T. Pensola).
front matter r 2003 Elsevier Ltd. All rights reserve
scimed.2003.08.014
probably in very early life, or in the accumulation of
detrimental exposures over the life-course (Kuh & Ben-
Shlomo, 1997; Ben-Shlomo & Kuh, 2002). According to
‘biological programming theories’, the factors triggering
subsequent disease may be either genetic (e.g. some
forms of alcoholism (Cadoret, Yates, Troughton,
Woodworth, & Stewart, 1995)) or biological in nature
(Barker, Bull, Osmond, & Simmonds, 1990; Barker,
1995; Kuh & Ben-Shlomo, 1997; Barker, Fors!en,
Uutela, Osmond, & Eriksson, 2001), affecting morbidity
after a latent period independently of later experiences
(Wilkinson, 1986, p. 6; Frankel, Davey Smith, &
Gunnell, 1999; Leon & Davey Smith, 2000), or in
d.
ARTICLE IN PRESST. Pensola, P. Martikainen / Social Science & Medicine 58 (2004) 2149–21702150
interaction with subsequent risks (Frankel, Elwood,
Sweetnam, Yarnell, & Davey Smith, 1996). According to
the ‘life-course’ or ‘pathways’ approach to disease
epidemiology (Blane, Davey Smith, & Bartley, 1993;
Herztman, 1994; Power & Hertzman, 1997; Ben-Shlomo
& Kuh, 2002), disease or premature death in adulthood
is either a consequence of long-term exposure to physical
risks or adverse social and economic circumstances
(Wadsworth, 1997; Hart, Davey Smith, & Blane, 1998;
Power, Manor, & Matthews, 1999), i.e. accumulation of
risk, or a consequence of adverse concurrent circum-
stances unfolding as a result of unfavourable living
conditions earlier in life. These life-course theories
recognize that socially patterned exposures are not
mutually exclusive with the ‘biological programming’
theories, particularly in the case where the effect of an
early exposure is a cause of adult disease in connection
with the effects of subsequent events and circumstances,
for instance where the low birthweight babies have an
increased risk of coronary heart disease or diabetes if
they are obese as adults (Frankel et al., 1996; Lithell et al.,
1996). However, one important difference between ‘the
accumulative risk model’ and the ‘biological program-
ming’ theory is that the former does not regard a single
exposure leading to a subsequent disease as necessary.
The life-course approach is widely used in mortality
studies (Kuh, Power, Blane, & Bartley, 1997; Leon &
Ben-Shlomo, 1997), and there is an acknowledged need
to apply it in health inequalities research (Davey Smith,
Gunnell, & Ben-Shlomo, 2001). Indeed, it has been
shown that factors preceding own social class are
important in generating social class differences in
mortality in late middle and old age males (Mare,
1990; Wunsch, Duch#ene, Thiltg"es, & Salhi, 1996; Hart
et al., 1998). The impact of past circumstances on social
class differences in mortality is perhaps most apparent in
cardiovascular diseases (V(ager .o & Leon, 1994; Davey
Smith, Hart, Blane, & Hole, 1998a; Frankel et al., 1999),
but among younger people the life-course approach is
mainly used in studies of morbidity, such as those
concerned with self-assessed health or limiting long-
standing illness (Rahkonen, Lahelma, & Huuhka, 1997;
Mheen van de, Stronks, Van den Bos & Mackenbach,
1997; Power, Matthews, & Manor, 1996; Power, Li, &
Manor, 2000). The lack of research on young or middle-
aged adults is probably due to two reasons. First, at
young ages mortality is still low, and data with
sufficiently large numbers of participants and long
follow-up times are not readily available. Second, most
deaths in young adulthood are due to external causes,
whereas life-course theories are usually focussed on
diseases. The applicability of life-course theories to
studying mortality from external causes is not entirely
clear. However, certain life trajectories may predispose a
person to external causes. Failures or inadequate
support in early life or at vulnerable periods (Rutter,
1989) may give rise to an increased tendency to
substance abuse or unnecessary risk taking, and thus
to an increased risk of accidental death (Kalland,
Pensola, Meril.ainen, & Sinkkonen, 2001). Furthermore,
there is evidence that problems in childhood and
adolescence as well as low parental social class are
associated with premature mortality from suicides and
accidental causes between ages 16 and 50 in Britain
(Neeleman, Wessely, & Wadsworth, 1998; Neeleman,
2001). It has also been shown that very early factors,
such as low weight gain in infancy, are related to
subsequent mortality from suicide (Barker, Osmond,
Rodin, Fall, & Winter, 1995).
Young adulthood is period of great social inequality
with respect to mortality. From age 30 through to age
50, relative mortality differences by social class are
greater than in other times of life (Valkonen, Martelin,
Rimpel.a.a, Notkola, & Savela, 1993; V(ager .o, 1992).
Mortality in young adulthood contributes significantly
to social class differences in life expectancy. Further-
more, many of these deaths may be regarded as
avoidable: more than one half of all deaths among
males are due to external causes. The life-course
approach provides important clues for policy-making
by helping us to identify the factors and life phases that
are most effective in reducing social class differences in
mortality in young adulthood (Wadsworth, 1997).
Living conditions in the parental home
Several living conditions in the parental home may
influence both adult social class and health through
intermediate social factors in childhood and adulthood,
and thus form the basis of explanation for adult social
class differences in mortality. Crucial childhood living
conditions include parental social class and family type.
There is abundant evidence on the effects of parental
social class on youth paths and adult social class
(Goldthorpe, 1980; P .ontinen, 1983; Blane, Davey Smith,
& Hart, 1999). The impact of parental social class on
subsequent mortality has been shown in numerous
studies (Davey Smith et al., 1998a; V(ager .o & Leon,
1994; Mare, 1990; Pensola & Valkonen, 2000): the
evidence is most convincing for mortality from cardio-
vascular disease (Forsdahl, 1977; Barker et al., 2001;
Notkola, 1985; Whincup, Cook, & Adshead, 1996;
Frankel et al., 1999; Davey Smith et al., 1998a). This
effect has varied not only by cause of death, but also
between areas (Notkola, 1985; Frankel et al., 1999;
Davey Smith et al., 2001). Furthermore, there is also
some evidence that parental class has no effect on adult
mortality (Lynch, Kaplan, & Cohen, 1994).
Broken homes in childhood may negatively affect
future health and life paths through the accumulation of
difficulties in respect to material and social conditions.
For instance one-parent households have on average less
ARTICLE IN PRESST. Pensola, P. Martikainen / Social Science & Medicine 58 (2004) 2149–2170 2151
disposable income (Valtioneuvoston kanslia 2001; Sauli,
Ahola, Lahelma, & Savolainen, 1989; .Ostberg, 1996).
Another mechanism that ties family type to subsequent
health is lack of time for children ( .Ostberg, 1996) and
inadequate parenting (Maughan & McCarthy, 1997).
Parental separation or a single-parent background has
been shown to be associated with conduct problems,
physical growth and suicide in adolescence and young
adulthood, ill-health and all-cause mortality at later age,
and adult alcohol-related problems (Cole & Cole, 1992;
Maughan & McCarthy, 1997; Romelsj .o, Kaplan,
Cohen, Allebeck & Andreasson, 1992; Schwarz et al.,
1995; Gould, Fisher, Parides, Flory, & Shaffer, 1996;
Sauvola et al., 2001a; Sauvola, Miettunen, Jarvelin, &
Rasanen, 2001b; Lundberg, 1993; Buchanan, Brinke, &
Flouri, 2000; Wadsworth, Hardy, Paul, Marshall, &
Cole, 2002). A single-parent background, and a low
parental social class are associated with lower education
(see Krein & Beller, 1988; Koivusilta, Rimpel.a, &
Rimpel.a, 1995; Ely, Richards, Wadsworth, & Elliot,
1999), early parenthood (Michael & Tuma, 1985), and
lower socio-economic position (Pietil.a & J.arvelin, 1995).
Number of siblings and crowding also reflect childhood
circumstances that may be directly or indirectly con-
nected to health (Power, Manor, & Fox, 1991; Kemppai-
nen et al., 2000; Montgomery, Bartley, & Wilkinson,
1997; Mheen et al., 1997; Cassidy, 2000). In Finland there
is evidence that large family size in the parental home is
associated with later alcoholism and depression (Kemp-
painen et al., 2000), and that growing up without siblings
is associated with violent crime among males (Kemppai-
nen, Jokelainen, J.arvelin, Isohanni, & R.as.anen, 2001).
There is also an inverse association between the number
of siblings and adult social class (Blane et al., 1999), early
marriage and parenthood (Michael & Tuma, 1985;
Gohel, Diamond, & Chambers, 1997).
Besides social and economic factors, many cultural
aspects related to parental home, such as region,
ethnicity, and religion, may affect behaviours, person-
ality, and attitudes in childhood as well as opportunities
to ‘‘self advancement’’ and thus possibly influence adult
social class and health (Mheen van de, 1998). In Finland
region of residence and language have been found to be
related to social class and mortality, but also to mediating
variables such as education (Sauli, 1979; Finn.as, 1986;
Koskinen & Martelin, 1994a; Valkonen, 1987). For
example, during the childhood of our study cohort
educational possibilities in the southern and coastal
regions, where the Swedish speaking population is
concentrated, have been better than in other parts of
the country.
Life trajectories in youth
Youth and early adulthood is a period of major
transitions and upheavals in life during which indivi-
duals leave their parental home, gain a professional
education, set up a family, and enter the labour market.
During this ‘socially critical period’ (Bartley, Blane, &
Montgomery, 1997) failures to embark on adult roles
may generate a drift to socially adverse life trajectories
which extend their effect on own adult social class and
mortality in subsequent years. Life trajectories in youth
may modify the effects of parental home, but they are
also likely to have their own independent effect on adult
social class differences in mortality. At least three
important trajectories can be identified: educational,
family formation and employment path. First, knowl-
edge about health risks, health-related behaviours, and
psycho-social characteristics, such as self-esteem and
coping strategies, are developed in late adolescence
and early adulthood, and are partly, directly or
indirectly, attributable to education (Lenthe et al.,
2001; Lynch, Kaplan, & Salonen, 1997; Koivusilta
et al., 1999; West, 1997; Hendry, Glendinning, &
Shucksmith, 1996; Rutter, 1989).
Second, early family formation, both early marriage
and early parenthood, may interfere with typical
transitions in youth. This may have negative health
consequences and complicate the formation of own
adult social class. It has been shown in a number of
studies that mortality of married men is lower than that
of unmarried men (Hu & Goldman, 1990; Ben-Shlomo,
Davey Smith, Shipley, & Marmot, 1993; Koskinen &
Martelin, 1994b). However, it is possible that early
marriage and parenthood may have a detrimental effect
both on the formation of own social class and on health
status (Mirowsky & Ross, 2002). Part of this effect may
be attributable to earlier problems with home, school,
behaviour, or family history of those men who have
become husbands or fathers in their teens or early 20s
(Michael & Tuma, 1985; Dearden, Hale, & Woolley,
1995; Gohel et al., 1997). However, the independent
effects of early marriage and parenthood may also be
related to material circumstances and health behaviours
(Joung et al., 1996; Joung, Stronks, Mheen, & Mack-
enbach, 1995) that differ from those of men who marry
later.
Third, employment trajectories in youth are crucially
involved in the formation of own social class, health
status and mortality risk. In young adulthood, while
individuals are building up their sense of self-esteem,
digression from a steady employment career can have a
long-lasting effect on socio-economic achievement
(Wadsworth, Montgomery, & Bartley, 1999), social
isolation (Bartley, 1994), health behaviour (Wadsworth
et al., 1999; Fergusson, Horwood, & Woodward, 2001),
and directly on psychological well-being, morbidity,
and suicides and other mortality (Bartley, 1994;
Montgomery, Cook, Bartley, & Wadsworth, 1999;
Fergusson et al., 2001; Johansson & Sundquist, 1997;
Hammarstr .om, 1994; Stefansson, 1991).
ARTICLE IN PRESS
Year
0
5
10
15
20
25
30
35
40
43Age
1956
1960
56 60 65 70 75 80 85 90 95 98
Year of birth
Information on: Parentalhome
Variables on youthAdult Mortality follow-upclass by cause of death
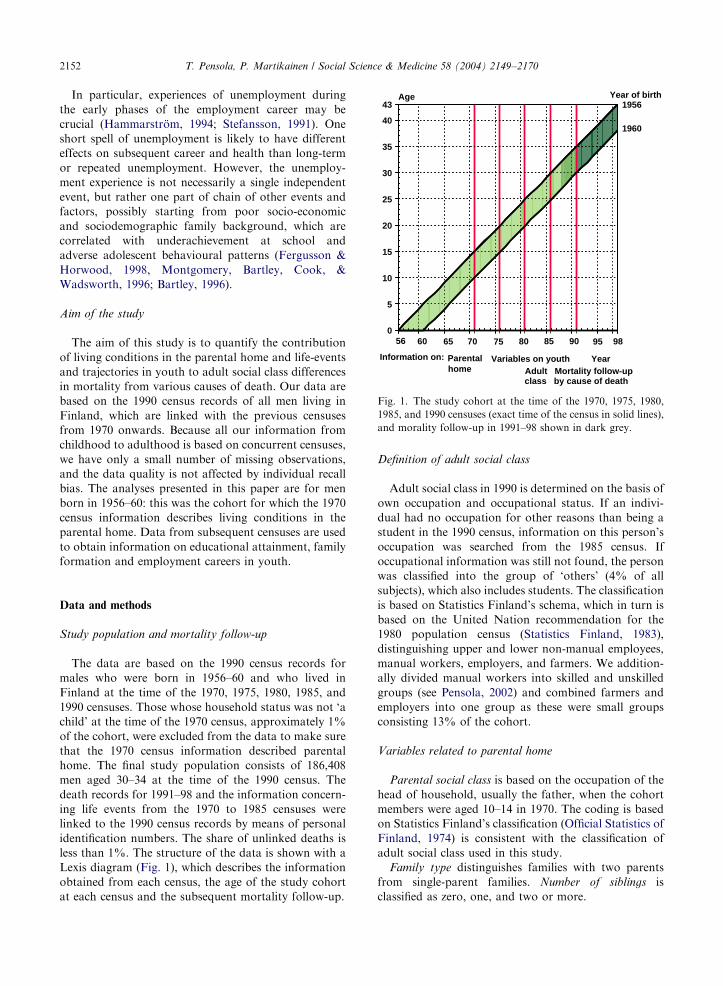
Fig. 1. The study cohort at the time of the 1970, 1975, 1980,
1985, and 1990 censuses (exact time of the census in solid lines),
and morality follow-up in 1991–98 shown in dark grey.
T. Pensola, P. Martikainen / Social Science & Medicine 58 (2004) 2149–21702152
In particular, experiences of unemployment during
the early phases of the employment career may be
crucial (Hammarstr .om, 1994; Stefansson, 1991). One
short spell of unemployment is likely to have different
effects on subsequent career and health than long-term
or repeated unemployment. However, the unemploy-
ment experience is not necessarily a single independent
event, but rather one part of chain of other events and
factors, possibly starting from poor socio-economic
and sociodemographic family background, which are
correlated with underachievement at school and
adverse adolescent behavioural patterns (Fergusson &
Horwood, 1998, Montgomery, Bartley, Cook, &
Wadsworth, 1996; Bartley, 1996).
Aim of the study
The aim of this study is to quantify the contribution
of living conditions in the parental home and life-events
and trajectories in youth to adult social class differences
in mortality from various causes of death. Our data are
based on the 1990 census records of all men living in
Finland, which are linked with the previous censuses
from 1970 onwards. Because all our information from
childhood to adulthood is based on concurrent censuses,
we have only a small number of missing observations,
and the data quality is not affected by individual recall
bias. The analyses presented in this paper are for men
born in 1956–60: this was the cohort for which the 1970
census information describes living conditions in the
parental home. Data from subsequent censuses are used
to obtain information on educational attainment, family
formation and employment careers in youth.
Data and methods
Study population and mortality follow-up
The data are based on the 1990 census records for
males who were born in 1956–60 and who lived in
Finland at the time of the 1970, 1975, 1980, 1985, and
1990 censuses. Those whose household status was not ‘a
child’ at the time of the 1970 census, approximately 1%
of the cohort, were excluded from the data to make sure
that the 1970 census information described parental
home. The final study population consists of 186,408
men aged 30–34 at the time of the 1990 census. The
death records for 1991–98 and the information concern-
ing life events from the 1970 to 1985 censuses were
linked to the 1990 census records by means of personal
identification numbers. The share of unlinked deaths is
less than 1%. The structure of the data is shown with a
Lexis diagram (Fig. 1), which describes the information
obtained from each census, the age of the study cohort
at each census and the subsequent mortality follow-up.
Definition of adult social class
Adult social class in 1990 is determined on the basis of
own occupation and occupational status. If an indivi-
dual had no occupation for other reasons than being a
student in the 1990 census, information on this person’s
occupation was searched from the 1985 census. If
occupational information was still not found, the person
was classified into the group of ‘others’ (4% of all
subjects), which also includes students. The classification
is based on Statistics Finland’s schema, which in turn is
based on the United Nation recommendation for the
1980 population census (Statistics Finland, 1983),
distinguishing upper and lower non-manual employees,
manual workers, employers, and farmers. We addition-
ally divided manual workers into skilled and unskilled
groups (see Pensola, 2002) and combined farmers and
employers into one group as these were small groups
consisting 13% of the cohort.
Variables related to parental home
Parental social class is based on the occupation of the
head of household, usually the father, when the cohort
members were aged 10–14 in 1970. The coding is based
on Statistics Finland’s classification (Official Statistics of
Finland, 1974) is consistent with the classification of
adult social class used in this study.
Family type distinguishes families with two parents
from single-parent families. Number of siblings is
classified as zero, one, and two or more.
ARTICLE IN PRESST. Pensola, P. Martikainen / Social Science & Medicine 58 (2004) 2149–2170 2153
Social and cultural background is described by two
factors, viz. language, categorized as (1) Finnish speak-
ing and (2) others (of which 80% are Swedish speaking),
and region of residence in 1970, categorized as (1)
western Finland, (2) capital (Helsinki) area, and (3)
eastern Finland.
Variables related to youth
Educational path is based on educational attainment
in the 1980 and 1990 censuses reflecting qualifications
obtained at age 20–24. We use the International
Standard Classification of Education (Statistics Finland,
1991) and separate the following categories: higher
education (at least 13 years of education), higher
intermediate education (12 years), lower intermediate
education (10–11 years), middle school (basic education
with academic orientation, 9–10 years), and basic
education (9 years or less).
The family formation process is described with two
variables, marital path and early parenthood. Marital
path is categorized into the following groups: (1)
‘partner in 1990’ consists of those who were not married
at age 20–24, but who were married or cohabiting at age
30–34 (in the 1990 census); (2) ‘partner in 1980’ consists
of those who were married at age 20–24 (in the 1980
census), and (3) ‘no partner’ consists of those who were
not married in 1980 and who lived without a partner in
1990. Unfortunately the data for cohabitation are not
consistent across the censuses. In 1980 cohabitation was
not as common as in the 1990s, and information on
cohabitation for those who did not have common
biological children was not given in the 1980 census.
In the 1990 census, however, cohabitation was sepa-
rately indicated. Cohabitation accounts for approxi-
mately 27% of all cases in the group ‘partner in 1990’.
Early parenthood distinguishes (1) ‘no child in 1980’
from those (2) who had their first ‘child in 1980’ or
before.
Employment path identifies different experiences of
employment career: (1) ‘steady’ employment means
continuous employment up to end of 1990, with the
exception of national service, after compulsory or
further education; (2) ‘short unemployment’ means less
than 6 months unemployment during 1986–90 or only
one spell of unemployment at the time of the 1975, 1980,
1985, or 1990 census; (3) ‘long unemployment’ means
unemployment lasting at least 6 months during 1986–90,
or repeated unemployment experiences at the time of at
least two censuses; (4) a ‘fragmental’ employment path
means occasional exclusion from the labour force for
reasons other than unemployment, retirement, or
education. We had no information on these reasons,
but it is safe to assume this is a heterogeneous group that
includes socially marginalized persons as well as those
having a gap year; (5) ‘retired’ consists of men on
disability pension.
Mortality
The mortality follow-up covers the period from 1991
to 1998, during which 3184 men died. Causes of death
for 1991–95 were coded according to the 1987 Finnish
Classification of Diseases, which is based on the Ninth
Revision of the International Classification of Diseases
(ICD9) (National Board of Health, 1986). The codes for
1996–98 are based on the Tenth Revision of the
International Classification of Diseases (ICD10)
(STAKES, 1999). This change of classification had no
effect on the results. In these male age groups definitions
of cause of death are highly reliable in Finland, as cause
of death certificates are based on autopsies in approxi-
mately 86% of all deaths. The following broad groups of
causes of death are used:
* all causes,* all diseases (including cardiovascular diseases),* cardiovascular diseases (ICD9:390-459, ICD10:i00-
i99),* external causes (including suicides),* suicides (ICD9:E95, ICD10:� 60–� 84,Y870).
In addition to these causes of death we have
distinguished alcohol-related mortality as a separate
group of cause of death because of its importance in this
age group (see Table 1).
Contributory causes of death are also used in the
definition of alcohol-related causes. Causes included in
this category are those in which alcohol intoxication
(ICD9: 305, ICD10: F10.0) is mentioned as a contrib-
utory cause of death, or alcoholic disease, such as
alcoholic psychoses (ICD9: 291, ICD10: F10.5), alco-
holic diseases of the liver (ICD9: 571.0-571.3, ICD10:
K70.0-K70.9), and alcoholic diseases of pancreas (ICD9:
577.0D-F,577.1C-D, ICD10: K86.00-K86.08) or alcohol
poisoning (ICD9: E851, ICD10:X45) are mentioned as
underlying or contributory causes of death. The decision
to use contributory causes here was based on the
fact that at a young age, a large proportion of alcohol-
related causes are due to external causes in which
alcohol has a vitally important role. In our data
which comprised 1441 deaths due to alcohol, alcohol
was the underlying cause for 40% of deaths, of which
315 deaths were due to disease and 261 to alcohol
poisoning. It was a contributory cause of death in 128
deaths in the disease category and in 737 deaths in the
external-cause category. Alcohol-related causes overlap
with all diseases and all external causes. The classifica-
tion of alcoholic causes has been discussed in closer
detail elsewhere (M.akel.a, Valkonen, & Martelin,
1997).
ARTIC
LEIN
PRES
S
Table 1
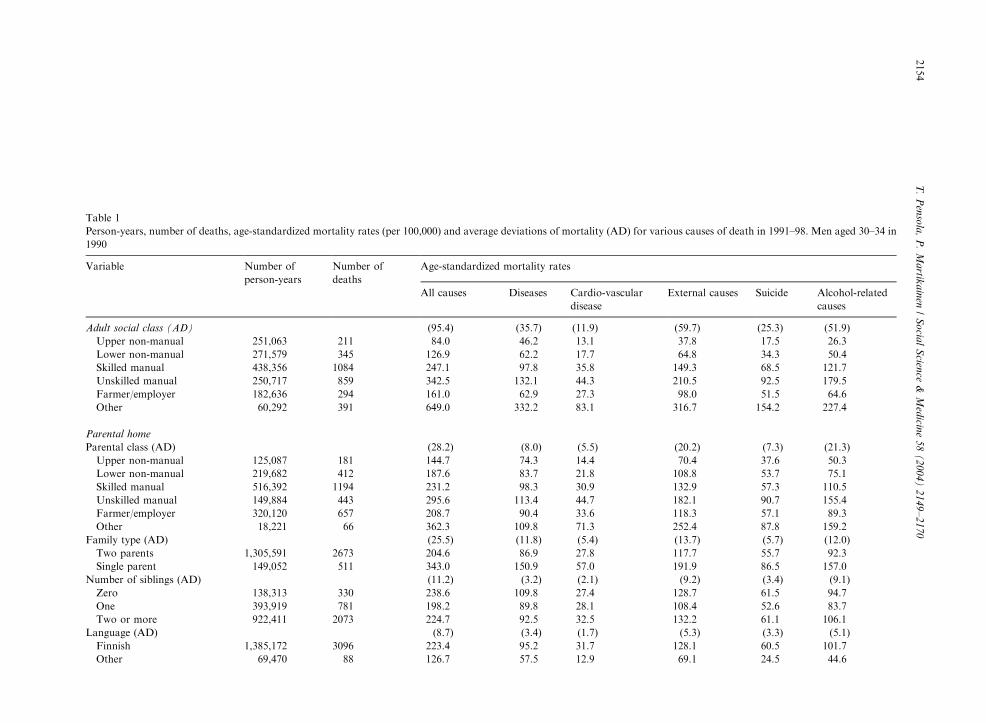
Person-years, number of deaths, age-standardized mortality rates (per 100,000) and average deviations of mortality (AD) for various causes of death in 1991–98. Men aged 30–34 in
1990
Variable Number of
person-years
Number of
deaths
Age-standardized mortality rates
All causes Diseases Cardio-vascular
disease
External causes Suicide Alcohol-related
causes
Adult social class (AD) (95.4) (35.7) (11.9) (59.7) (25.3) (51.9)
Upper non-manual 251,063 211 84.0� 46.2� 13.1� 37.8� 17.5� 26.3�
Lower non-manual 271,579 345 126.9� 62.2� 17.7� 64.8� 34.3� 50.4�
Skilled manual 438,356 1084 247.1� 97.8 35.8 149.3� 68.5� 121.7�
Unskilled manual 250,717 859 342.5� 132.1� 44.3� 210.5� 92.5� 179.5�
Farmer/employer 182,636 294 161.0� 62.9� 27.3 98.0� 51.5 64.6�
Other 60,292 391 649.0� 332.2� 83.1� 316.7� 154.2� 227.4�
Parental home
Parental class (AD) (28.2) (8.0) (5.5) (20.2) (7.3) (21.3)
Upper non-manual 125,087 181 144.7� 74.3� 14.4� 70.4� 37.6� 50.3�
Lower non-manual 219,682 412 187.6� 83.7 21.8� 108.8� 53.7 75.1�
Skilled manual 516,392 1194 231.2 98.3 30.9 132.9 57.3 110.5�
Unskilled manual 149,884 443 295.6� 113.4� 44.7� 182.1� 90.7� 155.4�
Farmer/employer 320,120 657 208.7 90.4 33.6 118.3 57.1 89.3�
Other 18,221 66 362.3� 109.8� 71.3� 252.4� 87.8 159.2�
Family type (AD) (25.5) (11.8) (5.4) (13.7) (5.7) (12.0)
Two parents 1,305,591 2673 204.6� 86.9� 27.8� 117.7� 55.7 92.3�
Single parent 149,052 511 343.0� 150.9� 57.0� 191.9� 86.5� 157.0�
Number of siblings (AD) (11.2) (3.2) (2.1) (9.2) (3.4) (9.1)
Zero 138,313 330 238.6 109.8 27.4 128.7 61.5 94.7
One 393,919 781 198.2� 89.8 28.1 108.4� 52.6 83.7�
Two or more 922,411 2073 224.7 92.5 32.5 132.2 61.1 106.1�
Language (AD) (8.7) (3.4) (1.7) (5.3) (3.3) (5.1)
Finnish 1,385,172 3096 223.4 95.2 31.7 128.1 60.5 101.7
Other 69,470 88 126.7� 57.5� 12.9� 69.1� 24.5� 44.6�
T.
Pen
sola
,P
.M
artik
ain
en/
So
cial
Scien
ce&
Med
icine
58
(2
00
4)
21
49
–2
17
02154

ARTIC
LEIN
PRES
SRegion of residence (AD) (12.6) (5.3) (2.4) (8.2) (5.6) (7.9)
Western 438,508 868 197.9� 84.6 26.9 113.4� 50.0� 86.6�
Capital 215,138 496 230.6 108.2� 31.1 122.2 58.1 97.6
Eastern 800,996 1820 227.2 94.3 32.9 132.9 63.9 106.1�
Youth
Education (AD) (78.2) (27.4) (11.1) (50.7) (21.4) (43.3)
High 225,700 164 72.7� 40.7� 11.1� 31.9� 15.1� 21.7�
Higher intermediate 302,225 423 140.0� 66.8� 18.8� 73.1� 40.0� 52.6�
Lower intermediate 587,009 1428 243.2� 94.5 36.1� 148.7� 72.4� 116.6�
Middle school 128,329 377 293.8� 129.3� 40.5 164.4� 71.7 134.8�
Basic 211,379 792 374.9� 163.2� 48.7� 211.4� 87.0� 177.4�
Marital path (AD) (98.3) (42.3) (11.5) (56.8) (24.6) (50.7)
Partner in 1990 832,032 1125 135.2� 59.4� 20.8� 75.7� 37.4� 54.7�
Partner in 1980 214,366 451 210.4 82.0 32.2 128.3 65.8 101.7
No partner 408,245 1608 393.9� 168.8� 50.7� 225.2� 99.0� 187.9�
Early parenthood (AD) (3.3) (0.4) (0.8) (2.9) (2.4) (3.0)
No child in 1980 1,335,525 2900 217.0 93.2 30.4 123.8 57.5 97.4
Child in 1980 122,117 284 238.4 95.6 35.2 142.7 73.0 116.7
Employment path (AD) (130.5) (54.7) (15.1) (75.8) (31.3) (69.2)
Steady 1,108,919 1493 134.6� 59.0� 21.8� 75.7� 38.3� 53.9�
Short unemployment 60,180 165 274.2� 106.3 44.8 167.8� 93.4� 134.6�
Long unemployment 176,085 961 546.2� 205.1� 62.5� 340.7� 132.8� 331.2�
Fragmental 71,699 143 199.4 73.9 18.1 125.5 58.6 96.2
Retired 37,760 422 1119.0� 605.7� 151.3� 513.6� 256.7� 291.7�
All — — 218.9 93.5 30.9 125.4 58.8 99.1
Numbers 1,454,643 3184 3184 1360 449 1824 856 1441
�Mortality rate differs from the average mortality rate for the whole cohort at 5% significance level.
T.
Pen
sola
,P
.M
artik
ain
en/
So
cial
Scien
ce&
Med
icine
58
(2
00
4)
21
49
–2
17
02155

ARTICLE IN PRESST. Pensola, P. Martikainen / Social Science & Medicine 58 (2004) 2149–21702156
Methods
Person-years and deaths by cause of death were
tabulated by period, own adult social class, variables
related to parental home and youth. The cross-tables
were analysed by means of Poisson regression analysis,
with the cell in cross-tabulation taken as the unit of
analysis. The GLIM statistical package was used in
fitting the models (Francis, Green, & Payne, 1993). The
results are presented in terms of mortality rates and
relative mortality rates (and their 95% confidence
intervals). Our modelling strategy is based on the time
order of the explanatory variables. Thus we have first
adjusted only for age. We have then adjusted for
variables preceding own adult social class, first for the
living conditions in the parental home and then for
youth paths one by one. Information on living condi-
tions in the parental home were all from the 1970 census,
but with youth paths we have taken into account the
approximate time order of these factors on the basis of
1975, 1980, and 1985 censuses.
In Poisson modelling multicollinearity of the vari-
ables, particularly between youth paths, may be a cause
of concern. However, mutual relationships between
these paths were modest: contingency coefficient was
0.24 between educational and employment path, 0.16
between educational and marital path, and 0.25 between
marital and employment path. Therefore, the effect of
employment path, which is associated with both
education and marital path, on adult social class
differences in mortality is only slightly smaller in Table
4 than what it would be in the model where marital path
and education are not adjusted for.
We have used average deviation (AD) as a summary
measure of mortality differences between categories of a
specific variable (Moore & McCabe, 1999). AD mea-
sures how much the mortality rates of the categories
deviate on average from the mortality rate for the whole
cohort. AD is weighted for the number of person-years
in the categories in order to reduce the weight of small
categories with very low or very high mortality.
AD ¼X
ni jMRi � MRj� �
=X
ni;
where ni is the number of person-years in category i;MRi is the mortality rate for a category, and MR is the
mortality rate for the whole cohort. The average
deviation for total mortality is the sum of average
deviations in different causes of death.
In addition, we have calculated the average relative
deviation (ARD), which differs from the above equation
in that instead of differences between mortality rates we
have used differences between the relative mortality
rates for category i (RRi) in relation to mortality in the
upper non-manual class (reference group with RR=1).
This measure shows how much the mortality of the
different social classes deviates on average from
mortality of the upper non-manual class. From ARDs,
we further calculated the average change. Average
change is the percent difference in the ARDs obtained
from the model in which an explanatory variable under
study has been adjusted for to the ARD in the
uncontrolled model. In the context of this study average
change quantifies the extent to which an adjusted
variable explains adult social class differences in
mortality.
Results
According to own adult social class, mortality
increased clearly from the upper non-manual class to
the unskilled manual class in all causes of death studied
(Table 1). For farmers and employers mortality was
lower than average. Social class ‘Others’ comprised only
4% of the cohort, but due to their very high mortality
(their all-cause mortality was sevenfold in comparison to
mortality of the upper non-manual class (Table 3)), they
contribute significantly to the average deviation (AD).
When these men are excluded, AD for total mortality
decreases from 95.7 to 80.8 but the relative contribution
of different causes of death to AD for total mortality is
not changed.
The only cause of death where social class differences
were not observed was from neoplasms (254 men died of
neoplasms); therefore we have not included neoplasms
as a separate cause in this study.
Variables related to living conditions in parental home
were associated with all causes of death. Mortality
increased from higher to lower parental social class
consistently for all causes of death. Men from single-
parent families had higher than average mortality, which
was at least 55% higher than amongst men from two-
parent families. Men who had one sibling had lower
mortality than average in all causes combined, as well as
in external and alcohol-related causes. Men speaking
other languages than Finnish had lower than average
mortality: their mortality ranged from 40% to 60% of
that of Finnish speaking men for various causes of
death. However, as this group speaking other languages
was small (5%), average mortality deviations—our
summary measure of relative mortality differences—
were also minor. Men who lived in western Finland in
1970 had lower than average mortality in external and
alcohol-related causes. Men in the capital area had
elevated mortality from diseases, and men in eastern
Finland from alcohol-related causes. However, although
there were marked mortality differences by variables
related to parental home as described here, these
differences were much smaller than those by own adult
social class. For example, for total mortality average
deviation was 95 by own adult social class and 28 by
ARTICLE IN PRESST. Pensola, P. Martikainen / Social Science & Medicine 58 (2004) 2149–2170 2157
parental class. Alcohol-related causes accounted for a
relatively large part of the average deviation in total
mortality by variables related to parental home; the
proportion varied from 47% to 81%. The equivalent
proportion accounted for by cardiovascular diseases was
about 20%.
Among the variables related to youth, educational,
marital, and employment path were associated with
mortality. Mortality increased from the basic educated
to the higher educated at every level of education in all
specific causes of death, with one exception: there were
no differences between those men with middle school
and lower intermediate education for suicide mortality.
External causes accounted for 65% from the average
deviation in total mortality by education. Those who
had a steady employment path had lower than average
mortality for all causes of death. Men who had
experienced long-term unemployment or who were
retired had elevated mortality. In addition, men who
had a partner in 1990 had lower, and men who did not
have a partner higher mortality. Those men who had a
partner in 1980 showed elevated mortality in compar-
ison to those men who had a partner in 1990. The
association with early parenthood and mortality was
weak. Mortality for men with children in 1980 was
consistently, albeit only slightly, higher than for men
who did not have children at that time. Alcohol-related
causes accounted for 91% of the average deviation in
total mortality.
Variables related to parental home or youth paths
have to be related not only to mortality, but also to
adult social class in order to be able to explain social
class differences in mortality in adulthood. Table 2
shows that there were clear differences in the back-
ground of adult social classes. Non-manual background
was more than twice as common in non-manual classes
than in manual classes, while there was only a minor
difference between the lower non-manual class and
‘others’. In manual classes, more than half of the men
had manual class parents. For men in upper non-manual
and farmer/employer classes, a manual background was
less common. In particular, the proportion of men from
an unskilled manual class background was low, 4% in
the upper non-manual class and 6% among farmers and
employers. Approximately 10% of the cohort had a
single-parent home, this being a more common back-
ground for manual classes and ‘others’ and less common
for upper non-manuals and farmers and employers.
Two-children families and Swedish or other languages
were more prevalent in non-manual classes and farmers
and employers. Parental home in the capital area was
most prevalent in the non-manual class. The differences
within the non-manual class, that is between upper non-
manuals and lower non-manuals, and within the manual
class, between skilled and unskilled manuals, were
relatively small.
There were huge differences between the social classes
according to variables related to youth. The proportion
of men with a higher education was substantially larger
in the upper non-manual class (70%) than in manual
classes (1%), the rate being approximately 10% for all
other classes. Higher intermediate education was typical
of men in the lower non-manual class, and lower
intermediate education for men in the skilled manual
class. Men in the unskilled manual class had more
commonly only basic education than men in the skilled
manual class.
There were also small differences in family formation.
Having a partner or a child in 1980 was somewhat more
infrequent for men in the non-manual classes than for
men in any other class. Among unskilled manuals and
‘others’ there were clearly more men who had no partner
in 1990 than in any other class.
A steady employment path was most common in the
non-manual classes, while manual classes had more
experience of unemployment. The proportion of the
long-term unemployed was particularly high (22%) in
the unskilled manual class.
The effect of controlling for factors related to parental
home and youth paths on social class differences in total
mortality
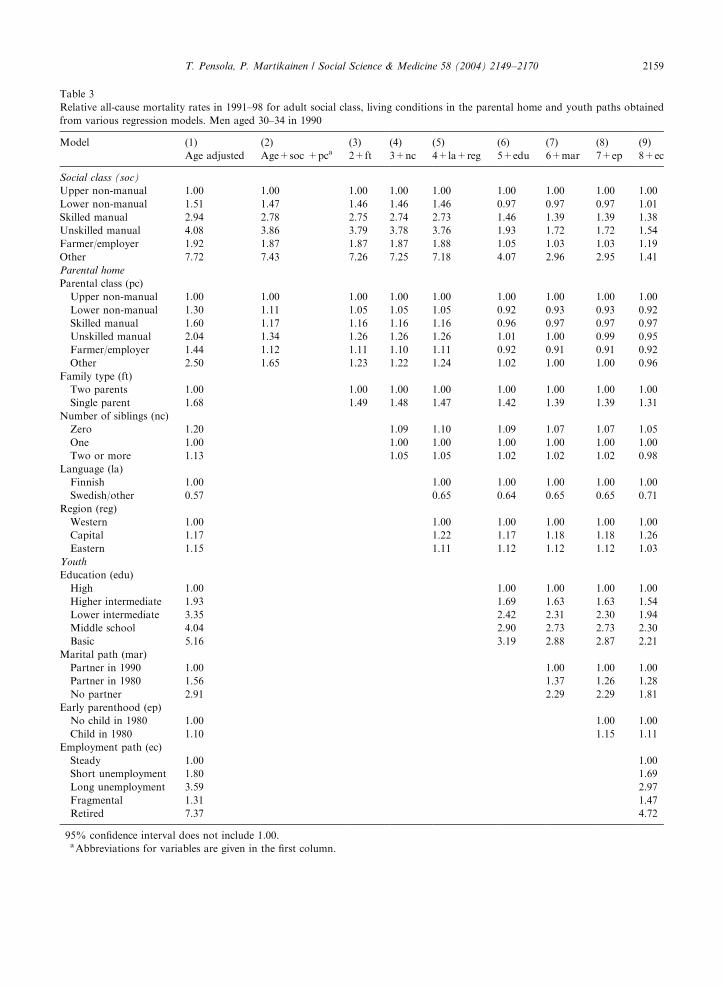
Table 3 describes the effect of controlling for factors
related to parental home and youth on social class
differences in all-cause mortality in adulthood.
Although the variables related to living conditions in
the parental home, i.e. parental class, family type,
number of siblings, language and region of residence
in 1970 were associated with mortality (Table 1 and first
column in Table 3) and adult social class (Table 2), they
contributed very little to social class differences in all-
cause mortality. When all these variables were con-
trolled for (model 5 in Table 3), the excess mortality of
lower non-manual and both manual classes is reduced
by 10%.
The four last columns in Table 3 show that unlike
variables related to parental home, controlling for
variables related to youth considerably attenuated the
mortality differences by own social class. However,
controlling for early parenthood had no effect on social
class differences in mortality. Early parenthood is
therefore excluded from the following analyses. By
contrast, having only a basic education, having a partner
in 1980 or not living with a partner in 1990, or drifting
from a steady employment path due to shorter or longer
unemployment or retirement, all contributed to the
excess mortality of lower social classes (Table 3).
Although educational path had a very strong effect,
both marital and employment path had independent
effects on social class differences in mortality by
significantly reducing the deviance of the model.

ARTICLE IN PRESS
Table 2
Distribution (%) of explanatory variables related to living conditions in the parental home and youth paths by adult social class. Men
aged 30–34 in 1990
All Adult social class
Upper
non-manual�Lower
non-manual�Skilled
manual�Unskilled
manual�Farmer/
Employer�Other�
Parental home
Parental social class
Upper non-manual 8.6 24.9 10.0 2.6 3.3 4.4 13.3
Lower non-manual 15.1 23.3 21.2 11.1 11.5 8.8 16.2
Skilled manual 35.5 26.8 35.8 45.0 39.4 20.2 31.8
Unskilled manual 10.3 4.1 7.9 13.8 15.7 5.7 12.9
Farmer/employer 29.2 20.1 24.2 25.9 28.6 59.9 23.7
Other 1.3 0.7 0.9 1.5 1.6 1.1 2.1
Family type
Two parents 89.8 92.1 90.9 88.4 87.3 92.6 85.9
Single parent 10.2 7.9 9.1 11.6 12.7 7.4 14.1
Number of siblings
Zero 9.5 10.7 10.2 8.7 9.4 8.7 10.4
One 27.1 34.2 30.0 23.8 23.9 25.5 26.7
Two or more 63.4 55.1 59.8 67.6 66.8 65.8 62.9
Language
Finnish 95.2 93.4 94.8 96.8 95.9 93.5 96.1
Swedish/other 4.8 6.7 5.2 3.2 4.2 6.5 3.9
Region
Western 30.1 30.8 29.6 31.9 28.3 29.2 27.2
Capital 14.8 21.1 17.5 11.9 14.8 8.3 16.9
Eastern 55.1 48.1 52.8 56.2 56.9 62.5 55.9
Youth
Education
Higher 15.5 70.2 9.0 0.7 0.7 6.8 12.6
Higher intermediate 20.8 22.7 54.7 6.7 8.3 17.0 25.5
Lower intermediate 40.4 3.6 22.2 67.9 48.1 46.6 24.1
Middle school 8.8 2.3 7.3 8.9 14.9 11.7 8.2
Basic 14.5 1.2 6.9 15.8 27.9 17.8 29.6
Marital path
partner in 1990 57.2 69.0 64.1 54.8 48.4 57.4 30.4
Partner in 1980 14.7 11.1 13.6 17.1 14.6 18.4 6.6
No partner 28.1 19.9 22.2 28.0 37.0 24.2 63.0
Early parenthood
No child in 1980 91.8 96.6 93.2 89.2 90.6 89.4 91.8
Child in 1980 8.2 3.3 6.8 10.8 9.4 10.6 8.2
Employment path
Steady 76.2 86.7 83.8 76.1 67.0 87.2 4.6
Short unemployment 4.1 2.3 3.5 5.4 5.5 2.9 3.8
Long unemployment 12.1 5.0 7.4 14.8 21.9 6.0 20.7
Fragmental 4.9 5.8 4.1 2.3 2.9 3.2 35.3
Retired 2.6 0.2 0.6 1.4 2.6 0.7 35.5
All 100 100 100 100 100 100 100
Number of persons 183,354 31,483 34,110 55,308 31,747 22,974 7732
�Because of a large study population all row-wise differences of more than one percentage points are statistically significant at the 1%
level.
T. Pensola, P. Martikainen / Social Science & Medicine 58 (2004) 2149–21702158
ARTICLE IN PRESS
Table 3
Relative all-cause mortality rates in 1991–98 for adult social class, living conditions in the parental home and youth paths obtained
from various regression models. Men aged 30–34 in 1990
Model (1)
Age adjusted
(2)
Age+soc +pca(3)
2+ft
(4)
3+nc
(5)
4+la+reg
(6)
5+edu
(7)
6+mar
(8)
7+ep
(9)
8+ec
Social class (soc)
Upper non-manual 1.00 1.00 1.00 1.00 1.00 1.00 1.00 1.00 1.00
Lower non-manual 1.51� 1.47� 1.46� 1.46� 1.46� 0.97 0.97 0.97 1.01
Skilled manual 2.94� 2.78� 2.75� 2.74� 2.73� 1.46� 1.39� 1.39� 1.38�
Unskilled manual 4.08� 3.86� 3.79� 3.78� 3.76� 1.93� 1.72� 1.72� 1.54�
Farmer/employer 1.92� 1.87� 1.87� 1.87� 1.88� 1.05 1.03 1.03 1.19
Other 7.72� 7.43� 7.26� 7.25� 7.18� 4.07� 2.96� 2.95� 1.41�
Parental home
Parental class (pc)
Upper non-manual 1.00 1.00 1.00 1.00 1.00 1.00 1.00 1.00 1.00
Lower non-manual 1.30� 1.11 1.05 1.05 1.05 0.92 0.93 0.93 0.92
Skilled manual 1.60� 1.17 1.16 1.16 1.16 0.96 0.97 0.97 0.97
Unskilled manual 2.04� 1.34� 1.26� 1.26� 1.26� 1.01 1.00 0.99 0.95
Farmer/employer 1.44� 1.12 1.11 1.10 1.11 0.92 0.91 0.91 0.92
Other 2.50� 1.65� 1.23 1.22 1.24 1.02 1.00 1.00 0.96
Family type (ft)
Two parents 1.00 1.00 1.00 1.00 1.00 1.00 1.00 1.00
Single parent 1.68� 1.49� 1.48� 1.47� 1.42� 1.39� 1.39� 1.31�
Number of siblings (nc)
Zero 1.20� 1.09 1.10 1.09 1.07 1.07 1.05
One 1.00 1.00 1.00 1.00 1.00 1.00 1.00
Two or more 1.13� 1.05 1.05 1.02 1.02 1.02 0.98
Language (la)
Finnish 1.00 1.00 1.00 1.00 1.00 1.00
Swedish/other 0.57� 0.65� 0.64� 0.65� 0.65� 0.71�
Region (reg)
Western 1.00 1.00 1.00 1.00 1.00 1.00
Capital 1.17� 1.22� 1.17� 1.18� 1.18� 1.26�
Eastern 1.15� 1.11� 1.12� 1.12� 1.12� 1.03
Youth
Education (edu)
High 1.00 1.00 1.00 1.00 1.00
Higher intermediate 1.93� 1.69� 1.63� 1.63� 1.54�
Lower intermediate 3.35� 2.42� 2.31� 2.30� 1.94�
Middle school 4.04� 2.90� 2.73� 2.73� 2.30�
Basic 5.16� 3.19� 2.88� 2.87� 2.21�
Marital path (mar)
Partner in 1990 1.00 1.00 1.00 1.00
Partner in 1980 1.56� 1.37� 1.26� 1.28�
No partner 2.91� 2.29� 2.29� 1.81�
Early parenthood (ep)
No child in 1980 1.00 1.00 1.00
Child in 1980 1.10 1.15 1.11
Employment path (ec)
Steady 1.00 1.00
Short unemployment 1.80� 1.69�
Long unemployment 3.59� 2.97�
Fragmental 1.31� 1.47�
Retired 7.37� 4.72�
�95% confidence interval does not include 1.00.aAbbreviations for variables are given in the first column.
T. Pensola, P. Martikainen / Social Science & Medicine 58 (2004) 2149–2170 2159
ARTICLE IN PRESST. Pensola, P. Martikainen / Social Science & Medicine 58 (2004) 2149–21702160
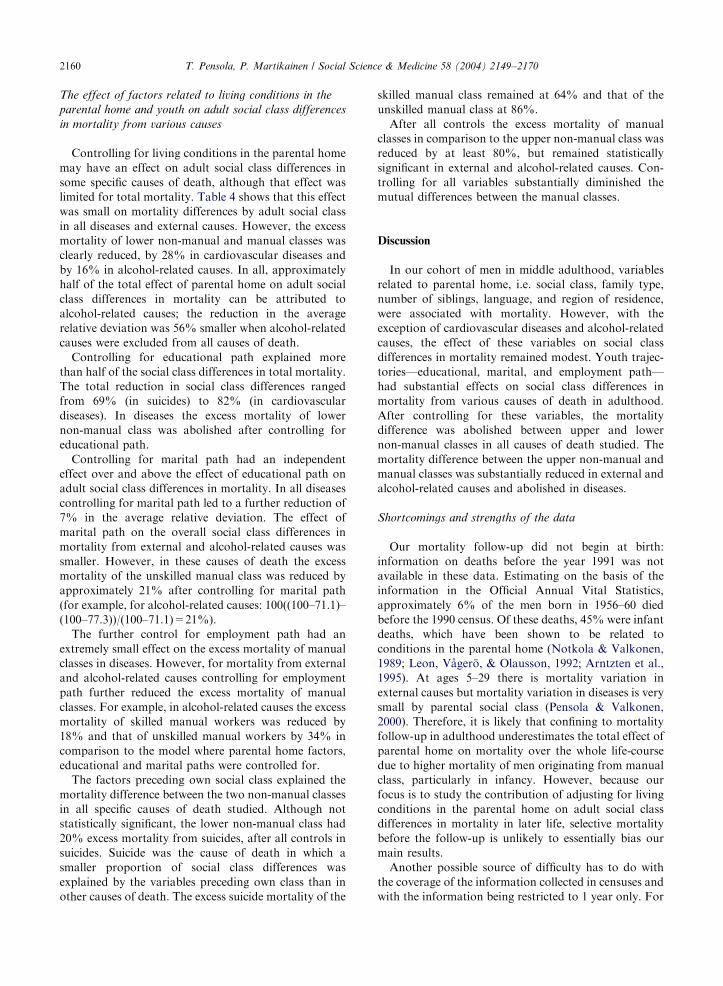
The effect of factors related to living conditions in the
parental home and youth on adult social class differences
in mortality from various causes
Controlling for living conditions in the parental home
may have an effect on adult social class differences in
some specific causes of death, although that effect was
limited for total mortality. Table 4 shows that this effect
was small on mortality differences by adult social class
in all diseases and external causes. However, the excess
mortality of lower non-manual and manual classes was
clearly reduced, by 28% in cardiovascular diseases and
by 16% in alcohol-related causes. In all, approximately
half of the total effect of parental home on adult social
class differences in mortality can be attributed to
alcohol-related causes; the reduction in the average
relative deviation was 56% smaller when alcohol-related
causes were excluded from all causes of death.
Controlling for educational path explained more
than half of the social class differences in total mortality.
The total reduction in social class differences ranged
from 69% (in suicides) to 82% (in cardiovascular
diseases). In diseases the excess mortality of lower
non-manual class was abolished after controlling for
educational path.
Controlling for marital path had an independent
effect over and above the effect of educational path on
adult social class differences in mortality. In all diseases
controlling for marital path led to a further reduction of
7% in the average relative deviation. The effect of
marital path on the overall social class differences in
mortality from external and alcohol-related causes was
smaller. However, in these causes of death the excess
mortality of the unskilled manual class was reduced by
approximately 21% after controlling for marital path
(for example, for alcohol-related causes: 100((100–71.1)–
(100–77.3))/(100–71.1)=21%).
The further control for employment path had an
extremely small effect on the excess mortality of manual
classes in diseases. However, for mortality from external
and alcohol-related causes controlling for employment
path further reduced the excess mortality of manual
classes. For example, in alcohol-related causes the excess
mortality of skilled manual workers was reduced by
18% and that of unskilled manual workers by 34% in
comparison to the model where parental home factors,
educational and marital paths were controlled for.
The factors preceding own social class explained the
mortality difference between the two non-manual classes
in all specific causes of death studied. Although not
statistically significant, the lower non-manual class had
20% excess mortality from suicides, after all controls in
suicides. Suicide was the cause of death in which a
smaller proportion of social class differences was
explained by the variables preceding own class than in
other causes of death. The excess suicide mortality of the
skilled manual class remained at 64% and that of the
unskilled manual class at 86%.
After all controls the excess mortality of manual
classes in comparison to the upper non-manual class was
reduced by at least 80%, but remained statistically
significant in external and alcohol-related causes. Con-
trolling for all variables substantially diminished the
mutual differences between the manual classes.
Discussion
In our cohort of men in middle adulthood, variables
related to parental home, i.e. social class, family type,
number of siblings, language, and region of residence,
were associated with mortality. However, with the
exception of cardiovascular diseases and alcohol-related
causes, the effect of these variables on social class
differences in mortality remained modest. Youth trajec-
tories—educational, marital, and employment path—
had substantial effects on social class differences in
mortality from various causes of death in adulthood.
After controlling for these variables, the mortality
difference was abolished between upper and lower
non-manual classes in all causes of death studied. The
mortality difference between the upper non-manual and
manual classes was substantially reduced in external and
alcohol-related causes and abolished in diseases.
Shortcomings and strengths of the data
Our mortality follow-up did not begin at birth:
information on deaths before the year 1991 was not
available in these data. Estimating on the basis of the
information in the Official Annual Vital Statistics,
approximately 6% of the men born in 1956–60 died
before the 1990 census. Of these deaths, 45% were infant
deaths, which have been shown to be related to
conditions in the parental home (Notkola & Valkonen,
1989; Leon, V(ager .o, & Olausson, 1992; Arntzten et al.,
1995). At ages 5–29 there is mortality variation in
external causes but mortality variation in diseases is very
small by parental social class (Pensola & Valkonen,
2000). Therefore, it is likely that confining to mortality
follow-up in adulthood underestimates the total effect of
parental home on mortality over the whole life-course
due to higher mortality of men originating from manual
class, particularly in infancy. However, because our
focus is to study the contribution of adjusting for living
conditions in the parental home on adult social class
differences in mortality in later life, selective mortality
before the follow-up is unlikely to essentially bias our
main results.
Another possible source of difficulty has to do with
the coverage of the information collected in censuses and
with the information being restricted to 1 year only. For

ARTIC
LEIN
PRES
STable 4
Change (%) in relative mortality rates for various causes of death after successively controlling for factors related to parental home and youth in 1991–98. Men aged 30–34 in 1990.
The reference group is upper non-manual class, for whom the relative mortality rate is 1.00
Change (%) in the relative rates in comparison to the first model
Age+adult class
+Parentalclass
+Familytype
+No of siblings+region+language
+Educationalpath
+Maritalpatha
+Employmentpath
Full modelb
All diseasesLower non-manual 1.35 (1.06–1.70) �5.8 �6.9 �7.5 �120.2 �120.2 �103.7 0.99 (0.75–1.30)Skilled manual 2.12 (1.73–2.60) 5.3 �8.4 �7.4 �83.7 �88.3 �83.8 1.18 (0.89–1.56)Unskilled manual 2.86 (2.32–3.53) �4.3 �7.3 �7.6 �73.9 �82.0 �85.5 1.27 (0.96–1.69)Average change� (�4.9) (�7.8) (�7.5) (�79.0) (�84.7) (�85.7)
Cardiovascular diseasesLower non-manual 1.35 (0.87–2.09) �33.0 �34.7 �37.3 �148.2 �149.0 �137.1 0.87 (0.52–1.46)Skilled manual 2.73 (1.88–3.95) �23.6 �26.4 �28.2 �87.0 �89.7 �87.8 1.21 (0.73–2.01)Unskilled manual 3.37 (2.29–4.96) �22.1 �25.1 �26.9 �80.6 �85.9 �88.1 1.28 (0.77–2.15)Average change� (�23.6) (�26.4) (�28.2) (�82.1) (�85.7) (�86.3)
External causesLower non-manual 1.71 (1.28–2.11) �9.6 �10.1 �11.8 �96.8 �97.3 �93.7 1.05 (0.79–1.39)Skilled manual 3.95 (2.93–4.55) �10.0 �11.3 �13.0 �74.1 �77.3 �79.4 1.61 (1.22–2.12)Unskilled manual 5.56 (4.12–6.42) �9.3 �10.8 �12.3 �69.3 �75.3 �81.7 1.84 (1.39–2.43)Average change� (�9.7) (�11.0) (�12.6) (�73.7) (�77.9) (�81.5)
SuicidesLower non-manual 1.94 (1.38–2.73) �3.9 �4.2 �4.4 �81.0 �81.4 -78.0 1.21 (0.80–1.82)Skilled manual 3.88 (2.87–5.23) �4.7 �5.9 �6.6 �69.7 �72.7 -73.5 1.76 (1.18–2.63)Unskilled manual 5.24 (3.86–7.12) �5.3 �6.6 �7.5 �64.8 �70.3 -75.4 2.04 (1.36–3.07)Average change� (�4.8) (�6.0) (�6.8) (�68.8) (�72.6) (-74.7)
Alcohol-related causesLower non-manual 1.92 (1.44–2.56) �11.2 �11.8 �13.8 �89.1 �90.1 �88.0 1.11 (0.80–1.55)Skilled manual 4.62 (3.60–5.93) �13.1 �14.6 �16.9 �75.1 �78.6 �82.5 1.64 (1.19–2.25)Unskilled manual 6.82 (5.30–8.79) �11.9 �13.6 �15.8 �71.1 �77.3 �85.2 1.86 (1.35–2.57)Average change� (�12.5) (�14.0) (�16.2) (�74.4) (�78.9) (�84.1)
All causesLower non-manual 1.51 (1.28–1.79) �8.4 �9.2 �10.4 �105.7 �106.3 �98.6 1.01 (0.83–1.23)Skilled manual 2.94 (2.54–3.40) �8.2 �10.0 �10.7 �76.3 �80.0 �80.3 1.38 (1.14–1.68)Unskilled manual 4.08 (3.51–4.73) �7.2 �9.2 �10.3 �69.9 �76.6 �82.3 1.54 (1.27–1.88)Average change� (�7.8) (�9.6) (�10.5) (�74.9) (�79.6) (�82.6)
All causes excluding alcohol-related causesLower non-manual 1.33 (1.07–1.64) �4.0 �5.2 �4.9 �128.2 �127.9 �110.7 0.97 (0.75–1.24)Skilled manual 2.18 (1.81–2.61) �2.9 �5.3 �4.1 �81.6 �85.4 �78.6 1.25 (0.98–1.60)Unskilled manual 2.83 (2.34–3.41) �2.7 �5.2 �5.1 �72.7 �79.8 �80.4 1.36 (1.06–1.75)Average change� (�2.9) (�5.2) (�4.6) (�176.9) (�81.9) (�80.3)
aEarly parenthood has not been controlled for due to its minor effect.bFull model=Age+adult class+parental class+family type+number of siblings+region in 1970+language+educational path+marital path+employment path.
T.
Pen
sola
,P
.M
artik
ain
en/
So
cial
Scien
ce&
Med
icine
58
(2
00
4)
21
49
–2
17
02161
ARTICLE IN PRESST. Pensola, P. Martikainen / Social Science & Medicine 58 (2004) 2149–21702162
example, although we were able to identify one-parent
families, we do not know how long this situation has
continued, nor do we know the cause of single
parenthood in the childhood home. Earlier studies have
shown that while the death of a parent had only a very
small effect, the divorce of parents had a clear effect on
subsequent mortality (Friedman, Tucker, & Schwartz,
1995) or other health consequences (Wadsworth et al.,
2002). We were unable in our data to distinguish these
two groups, but according to official statistics approxi-
mately 70% of the children in single-parent families in
these age groups in 1970 were not living with two
parents for some other reason than death of a parent
(Central Statistical Office, 1973). Therefore it is possible
that the association of mortality and family type is
somewhat underestimated in our data. However, be-
cause men from divorced family backgrounds account
for only 7% of the total cohort, it is unlikely that this
minor underestimation significantly alters our observa-
tion that adjusting for family type has a limited effect on
adult social class differences in mortality.
There are also some relevant variables on which we
have no data at all. Parent’s wealth and both the mother
and father’s education have been shown to be important
factors with regard to the descendant’s type of education
and achievement in high school (Mheen et al., 1997;
Koivusilta et al., 1995). Furthermore, it has been shown
that school performance at age 14 predicts both adult
social class and health in another Finnish cohort study
(Pietil.a & J.arvelin, 1995). It seems that besides socio-
economic circumstances other characteristics in the
parental home, such as family centredness, low number
of rows, relationship with parents, time spent with
children, raring styles, and parents’ orientation to their
children’s education (Sweeting & West, 1995; Hertzman,
Power, Matthews, & Manor, 2001; Maughan &
McCarthy, 1997; Bosma, Mheen van de, & Macken-
bach, 1999) may also exert an influence on trajectories in
youth with later afflictions on the risk of premature
death from external causes (e.g. Lundberg, 1993; Davey
Smith et al., 2001). With respect to these variables,
particularly important periods are around the time when
a person starts school and during the critical develop-
mental period around the age 0–3 (Montgomery,
Berney, & Blane, 2000; Siltala, 2002; Scannapieco &
Connell-Carrick, 2002). In this study we measured
parental class at age 10–14. This may provide a more
accurate reflection of the living environment in child-
hood than parental class at the time of birth, when
parents’ occupations may have been transient due to
their young age (Goldthorpe, 1980). However, it is likely
to be too late to provide information on the social and
psychological conditions during critical periods in early
childhood.
In addition, transitions in youth could be measured
differently. For example, for early parenthood, our age
limit of 20–24 may slightly underestimate the association
of early parenthood and mortality. However, only 0.3%
of the participants in the cohort were fathers at a
younger age. Furthermore, in the US the pivotal age of
parenthood for reporting negative health consequences
for males was 23 (Mirowsky & Ross, 2002). It would
also have been interesting to take into account the
possible changes of marital or partnership status. In our
data 10% of those men who had married young, had a
new spouse and a further 10% were without a partner in
1990. These groups were not separated in our analyses
because of their small size, and it is unlikely that the
subsequent changes in their marital status would have
had a major influence on the results presented here.
The major strength of our data is that all information
is always based on a contemporary register and never
inquired from a person retrospectively. Further, social
class and other explanatory variables are determined on
the basis of the same coding scheme in different phases
of life. Thirdly, data quality is not affected by loss to
follow-up and non-linkage of deaths. And fourthly, we
did not have to restrict our analyses to those employed
at the beginning of the mortality follow-up.
Living conditions in the parental home
All the parental home variables we were able to
control for were consistently related to mortality in
adulthood. Earlier they have been shown to be
associated with a wide range of other health outcomes
(see Introduction). The effects of parental class and
number of siblings on all-cause mortality were mediated
by subsequent factors (see also Pensola & Valkonen,
2002; Mare, 1990). However the elevated mortality of
men from single-parent homes remained, albeit at a
reduced level, when own adult social class and factors
related to youth were controlled for. Similar results have
been found for a cohort of Finnish women of the same
age (Pensola & Martikainen, 2003).
These associations indicate that the variables chosen
to represent childhood circumstances at ages 10–14 in
this study are reliable. However, the effect of parental
home on social class differences was minor. It is likely
that only a small part of this minor contribution is
attributable to the nature of the data discussed above,
and that the relative strength of the associations with the
parental home variables and mortality is more relevant.
These associations are substantially weaker than the
association between own adult social class and mortal-
ity, and therefore they can certainly not explain the
whole difference. For example, although conditions in
the parental home were clearly associated with mortality
from cardiovascular diseases, they showed only a weak
association with other diseases. Therefore the effect of
parental home on adult social class differences in
mortality from all diseases is minor. Furthermore, some
ARTICLE IN PRESST. Pensola, P. Martikainen / Social Science & Medicine 58 (2004) 2149–2170 2163
of the adverse exposures in the parental home have not
been common enough to have any substantial effect on
mortality patterns even if they were associated with both
adult social class and mortality. For example, only 10%
of the men came from single-parent families. Even if all
these men had died during the follow-up that would not
have fully explained the mortality difference between the
non-manual and manual classes. (Incidentally, a single
parent background was associated with elevated mor-
tality in all the social classes.) Bearing all these facts in
mind, it is evident that parental class background has
only a moderate effect on social class differences in
mortality (see Wagstaff, Paci, & Joshi, 2001).
The exception to this general finding is that living
conditions in the parental home explained 28% of adult
social class differences in cardiovascular mortality.
Similar findings have been obtained for Finnish women
(Pensola & Martikainen, 2003). The evidence from
earlier studies suggests that cardiovascular disease is
likely to develop earlier in people with poor socio-
economic conditions in the parental home (Kaplan &
Salonen, 1990), and these conditions have a persisting
effect on morbidity (Wannamethee, Whincup, Shaper, &
Walker, 1996) and mortality ( .Ostberg, 1996; Frankel
et al., 1999; Pensola & Valkonen, 2002; Hart et al., 1998)
from cardiovascular disease. However, the mechanism
between parental home and adult social class and
cardiovascular disease is not yet fully understood.
Parental class has been shown to be related to certain
risky behaviours (Lynch et al., 1997; Power & Hertz-
man, 1997) and psychological attributes (Bosma et al.,
1999) that are associated with cardiovascular disease.
Although even well established health habits, such as
heavy smoking and fatty diet, have not had much time
to contribute to cardiovascular disease before the age of
43, there is clear evidence that coronary atherosclerosis
begins at a very early age (Tuzcu, Kapadia, & Tutar,
2001; Strong, Malcom, & McMahan, 1999), and that
smoking in adolescence substantially increases mortality
from cardiovascular disease even at a relatively young
age (McCarron, Davey Smith, Okasha, & McEwen,
2001). These habits are also associated with own class,
so it is likely that parental class has an effect on these
adult class mortality differences. Another intriguing
possibility is that low birthweight babies have a higher
risk of coronary heart disease only if they are obese as
adults (Frankel et al., 1996). Parental class has been
shown to be associated with birthweight (V(ager .o,
Koupilova, Leon, & Lithell, 1999) as well as with
growth patterns in early childhood (Barker et al., 2001)
and body mass index in adulthood (Blane, Hart, Davey
Smith, Gillis, & Hole, 1996; Wright, Parker, Lamont, &
Craft, 2001). Our data thus confirm the statement by
Davey Smith and colleagues (2001) that coronary heart
disease is ‘a cause of death which illustrates the life-
course perspective par excellence’. However, even
though parental home had a clear effect on adult social
class differences in cardiovascular disease, 70% of the
difference could be attributed to factors subsequent to
living conditions in the parental home.
To the extent that living conditions in the parental
home explain adult social class differences in mortality
in our cohort this effect if mediated by other factors in
later life (pathways model). Living conditions in the
parental home were shown to be associated with youth
paths, which in turn exert an effect on adult class and
mortality (Pensola & Valkonen, 2002; Pensola &
Martikainen, 2003). To summarize so far, in men in
their middle adulthood the effect of parental home on
adult social class differences in mortality was modest
with the exception of cardiovascular diseases. This effect
was mainly mediated through its effect on the formation
of youth paths.
Life paths in youth
Educational path
In the models we present on the effects of youth paths
on adult social class differences in mortality, all
characteristics of the parental home were controlled
for. The effects of the youth paths we discuss in the
following are thus all independent of the effects of living
conditions in the parental home.
Continuous information on a person’s registration in
different types of educational institutions was not
available for us. Therefore we used information on
educational attainment. However, this information
provides a good proxy for educational careers. Having
only a basic education indicates that a person has not
been at school after age 15 or 16, and different levels of
further educational degrees encompass information on
the length of educational careers. Educational qualifica-
tions obtained in youth and early adulthood were clearly
associated with all causes of death studied. Mortality
among people with a basic education was five times
higher than among those with a higher education, with
the mortality of the other educational groups falling
between these groups. In our data it is not possible that
the strong association observed reflects socio-economic
circumstances in the parental home, as was possibly the
case in a Scottish sample of older men, in which parental
class and education were not simultaneously controlled
for (Davey Smith, Hart, & Hole, 1998b). Completed
education probably reflects other factors involved, for
instance, health-related behaviours and psychosocial
characteristics such as self-esteem and coping strategies,
which develop in late adolescence and early adulthood
and which are directly or indirectly attributable to
education (Lenthe et al., 2001; Lynch et al., 1997;
Koivusilta et al., 1999; West, 1997; Hendry et al., 1996).
Furthermore, in a Dutch study, a considerable extent
(25–31%) of educational differences in mortality were
ARTICLE IN PRESST. Pensola, P. Martikainen / Social Science & Medicine 58 (2004) 2149–21702164
mediated by material factors in later life (Schrijvers,
Stronks, van de Mheen, & Mackenbach, 1999). Material
factors such as incomes and financial problems no doubt
comes into play in our study as well, though their role
cannot be unambiguously estimated. For example, in
our data the average income in 1990 for men with a
basic education (16,800h) did not differ very much from
the income of men in the next two educational categories
(19,963h and 18,631h, respectively). In our cohort
education was the main path to own social class, and
it had a strong effect on social class mortality differences
in adult life. The mortality difference between the upper
non-manual class and the lower non-manual class was
mainly explained by educational path, and the differ-
ences between the upper non-manual class and manual
classes were substantially reduced.
Family formation, marital path
In our data marital path was associated with mortality
in adulthood. Men who had married relatively young or
who did not have a partner by the age of 30 had higher
mortality than men who had moved to live with a
partner only in their late 20s or early 30s. Early age at
marriage (less than 25) has also been shown to be
associated with poor health amongst men at retirement
age in Great Britain (Grundy & Holt, 2000). Demon-
strating the differences in mortality between the two
married groups by marital age and the elevated
mortality of those without a partner, our study under-
scores the importance of taking into account the whole
life course in analysing marital status differences in
mortality and the contribution of selection and social
causation to these differences (Ben-Shlomo et al., 1993).
Marital path was associated with own adult class. The
proportion of men who had not married young but had
a partner at age 30–34 was highest in the upper non-
manual class (69%), declining steadily to the unskilled
manual class (48%). Marital path explained a consider-
able part of the excess mortality of manual classes in
various causes even after the effects of social back-
ground and educational path had been taken into
account. It is possible that this effect is attributable to
social causation effects, but further longitudinal evi-
dence is needed on the psychosocial and material factors
preceding and concurrent to marital transitions, and on
their effects on social class and mortality.
Employment path
Mortality differences between different groups on the
employment path were clear. Mortality among men on a
steady employment path was low, among men whose
employment path was disrupted by unemployment or
other reasons it was considerably elevated. There was
also a clear difference between the two unemployed
groups, with mortality twice as high among the long-
term unemployed as among the short-term unemployed.
These findings are in line with the study where
unemployment 20 years earlier had an independent
effect, and number of unemployment experiences an
increasing effect, on limiting long-term illness (Bartley &
Plewis, 2002). In a number of studies economic activity
has been related to lower mortality, and unemployment
to excess mortality and other health risks (Martikainen
& Valkonen, 1996; Stefansson, 1991). However, the
exact magnitude and causes of these differences are still
a matter of debate.
The clear pattern of mortality by employment experi-
ences may partly be attributable to the young age of the
cohort. At the beginning of the employment career
success or failure may have greater effects on self-esteem,
behaviours and social networks (Stefansson, 1991;
Bartley, 1994). Unemployment experiences may also
trigger a new chain of experiences leading to stigma and
an increased likelihood of new and extended unemploy-
ment spells (Hammarstr.om, 1994). Prolonged unemploy-
ment at a young age has been shown to be associated with
health and health behaviours and social achievement
(Wadsworth et al. (1999)), possibly through the accumu-
lation of the direct risks of unemployment (Moser,
Goldblatt, Fox, & Jones, 1987) and by keeping a person
in insecure jobs and incomes (Bartley, 1988), thus further
increasing the psychological burden of this employment
path (Karasek et al., 1998). However, a considerable part
of the association of employment path and mortality may
be attributable to characteristics antecedent to employ-
ment experiences (e.g. Martikainen & Valkonen, 1996).
Employment path was found to have a clear effect on
adult social class variation in mortality. This effect can be
attributed to the distribution of different categories of
employment path between adult social classes. Employ-
ment path was only slightly more disadvantageous
amongst men in the lower non-manual class than
amongst men in the upper non-manual class, and thus
its effect on mortality difference between these classes
was minor. Much of the elevated mortality in the
unskilled manual class is due to the over-representation
of the long-term unemployed in that class. In our study
experiences of unemployment were recorded at a time of
low jobless rates (between 2.8% in 1990 and 7.2% in
1980), when structural reasons for unemployment were
weaker. Therefore, the unemployed may be a more select
group in these data, and the effect of employment path
on social class differences in mortality may be much
stronger than in the social context of a higher jobless rate.
Mortality and causes of death in young and middle
adulthood
Death is a rare event among young adults: during the
follow-up only 1.7% of our cohort died. However,
ARTICLE IN PRESST. Pensola, P. Martikainen / Social Science & Medicine 58 (2004) 2149–2170 2165
different health problems are likely to affect a much
larger proportion of persons of the same age as our
cohort (Rahkonen et al., 1997; Power & Matthews,
1997; Kuh & Wadsworth, 1993). Therefore in early and
middle adulthood morbidity, and perhaps emotional
health in particular (Stewart-Brown & Layte, 1997), may
be more clearly affected by living conditions in the
parental home. On the other hand, in line with our
findings, Mheen et al. (1997) found that parental home
characteristics explained only a relatively small propor-
tion of the variation in educational differences for
self-assessed health in a Dutch sample of persons aged
25–74.
Distribution of causes of death is different in our
study of men aged 31–42 at death from that in older
men, and may thus limit the generalizability of our
results to older age groups. Most saliently, the propor-
tion of external causes from all deaths decreases with
increasing age: in our age group it was 57% and in men
above 70 years approximately 4%.
An effect of living conditions in the parental home on
social class differences in cardiovascular diseases was
found in this study. However, the distribution of specific
causes of death within cardiovascular diseases also
changes with age. Statistics Finland’s cause of death
statistics (Statistics Finland, 1992–99) show that among
men aged 31–44 at death approximately 48% of deaths
due to cardiovascular disease were classified as ischae-
mic heart disease and 19% were cerebrovascular
diseases. In the age group 50 and over these figures
were fairly similar, 65% and 20% respectively. Further-
more, our results are consistent with earlier findings
among older men (Hart et al., 1998; Frankel et al., 1999)
and among Finnish women of the same age as men in
our study cohort (Pensola & Martikainen, 2003). In
addition, it is possible that with increasing age diseases,
which have their origin in early life but which are not
common as yet, become more prevalent. However, the
contribution of early circumstances on these diseases
may vary with time and place. For instance, stomach
cancer has shown to be related to early circumstances in
older cohorts but not in younger cohorts, possibly due
to more favourable living conditions in later times
(Davey Smith et al., 1998a; Maheswaran, Strachan,
Dodgeon, & Best, 2002). This may indicate, taking into
account that our cohort has spent its childhood in
relatively good circumstances with respect to housing,
nutrition, and health care, that the effect of the parental
home on social class differences in mortality will not
increase considerably with increasing age.
Conclusions
Our data showed that large social class differences in
all-cause mortality among men aged 31–42 at death were
only moderately attributable to living conditions in the
parental home. However, in mortality from cardiovas-
cular diseases and alcohol-related causes parental home
accounted for about 28% and 16%, respectively, of
social class differences. The effect of the living condi-
tions in the parental home on adult social class
differences in mortality was mainly mediated through
its effect on the formation of youth paths (pathways
model). A large proportion (about 67–77%) of adult
social class differences in mortality can be accounted for
by a disadvantageous educational path. Marital path
had a further effect on the excess mortality of manual
classes, and employment path had an effect on the
elevated mortality from external and alcohol-related
causes in the unskilled manual class. This latter effect is
attributable to the large number of unskilled manual
men who had been unemployed for at least 6 months.
In this study life experiences in youth proved to be
very important in explaining social class differences in
mortality in early adulthood independently of living
conditions in the parental home. It is likely that these life
paths in youth reflect the effects of long chains of
detrimental events on social class differences in mortal-
ity. Our study has identified social processes in youth
that may contribute to the development of social
inequalities in mortality and that may provide important
clues for interventions aimed at reducing these social
inequalities.
Acknowledgements
We are indebted to the Academy of Finland (grants
41498, 48600 and 70631) for funding the study and to
Statistics Finland for granting access to the data set
(permission TK 53-1783-96).
References
Arntzten, A., Moum, T., & Magnus, P., et al. (1995). Is the
higher postneonatal mortality in lower social status groups
due to SIDS? Acta Paediatrica, 84, 188–192.
Barker, D. J. P. (1995). Fetal origins of coronary heart disease.
British Medical Journal, 311, 171–174.
Barker, D. J. P., Bull, A. R., Osmond, C., & Simmonds, S. J.
(1990). Fetal and placental size and risk of hypertension in
adult life. British Medical Journal, 301, 259–262.
Barker, D. J. P., Fors!en, T., Uutela, A., Osmond, C., &
Eriksson, G. J. (2001). Size at birth and resilience to effects
of poor living conditions in adult life: Longitudinal study.
British Medical Journal, 323, 1273–1276.
Barker, D. J. P., Osmond, C., Rodin, I., Fall, C. H. D.,
& Winter, P. D. (1995). Low weight gain in infancy
and suicide in adult life. British Medical Journal, 311,
1203–1205.
ARTICLE IN PRESST. Pensola, P. Martikainen / Social Science & Medicine 58 (2004) 2149–21702166
Bartley, M. (1988). Unemployment and health: Selection or
causation—a false antithesis? Sociology of Health and
Illness, 10, 41–67.
Bartley, M. (1994). Unemployment and ill health: Under-
standing the relationship. Journal of Epidemiology and
Community Health, 48, 333–337.
Bartley, M. (1996). Unemployment and health selection.
Lancet, 348, 904.
Bartley, M., Blane, D., & Montgomery, S. (1997). Socio-
economic determinants of health: Health and the life
course: Why safety nets matter. British Medical Journal,
314, 1194–1196.
Bartley, M., & Plewis, I. (2002). Accumulated labour
market disadvantage and limiting long-term illness: Data
from the 1971–1991 Office for National Statistics’ long-
itudinal study. International Journal of Epidemiology, 31,
336–341.
Ben-Shlomo, Y., Davey Smith, G., Shipley, M., & Marmot, M.
G. (1993). Magnitude and causes of mortality differences
between married and unmarried men. Journal of Epidemiol-
ogy and Community Health, 47, 200–205.
Ben-Shlomo, Y., & Kuh, D. (2002). A life course approach to
chronic disease epidemiology: Conceptual models, empirical
challenges and interdisciplinary perspectives. International
Journal of Epidemiology, 31, 285–293.
Blane, D., Davey Smith, G., & Bartley, M. (1993). Social
selection: What does it contribute to social class difference?
Sociology of Health and Illness, 15, 1–15.
Blane, D., Davey Smith, G., & Hart, C. (1999). Some social and
physical correlates of intergenerational social mobility:
Evidence from the west of Scotland, collaborative study.
Sociology, 33, 169–183.
Blane, D., Hart, C. L., Davey Smith, G., Gillis, C. R., & Hole,
D. J. (1996). Hawthorne VM. Association of cardiovascular
disease risk factors with socioeconomic position during
childhood and during adulthood. British Medical Journal,
313(7070), 1434–1438.
Bosma, H., Mheen van de, H. D., & Mackenbach, J. H. (1999).
Social class in childhood and general health in adulthood:
Questionnaire study of contribution of psychological
attributes. British Medical Journal, 318(7175), 18–22.
Buchanan, A., Brinke, J. T., & Flouri, E. (2000). Parental
background, social disadvantage, public ‘‘care’’, and psy-
chological problems in adolescence and adulthood. Journal
of the American Academy of Child and Adolescent Psychia-
try, 39(11), 1415–1423.
Cadoret, R. J., Yates, W. R., Troughton, E., Woodworth, G.,
& Stewart, M. A. (1995). Adoption study demonstrating
two genetic pathways to drug abuse. Archives of General
Psychiatry, 52(1), 42–52.
Cassidy, T. (2000). Social background, achievement motiva-
tion, optimism and health: A longitudinal study. Counselling
Psychology Quarterly, 13(4), 399–412.
Cole, T. J., & Cole, A. J. (1992). Bone age, social deprivation,
and single parent families. Archives of Disease in Childhood,
67(10), 1281–1285.
Davey Smith, G., Gunnell, D., & Ben-Shlomo, Y. (2001). Life-
course approaches to socio-economic differences. In D. A.
Leon, & G. Walt (Eds.), Poverty, inequality, and health. An
international perspective (pp. 88–124). Oxford: Oxford
University Press.
Davey Smith, G., Hart, C., Blane, D., & Hole, D. (1998a).
Adverse socioeconomic conditions in childhood and cause
specific adult mortality: Prospective observational study.
British Medical Journal, 316, 1631–1635.
Davey Smith, G., Hart, C., Hole, D., Mackinnon, P., Gillis, C.,
Watt, G., Blane, D., & Hawthorne, V. (1998b). Education
and occupational class: Which is the more important
indicator of mortality risk? Journal of Epidemiology and
Community Health, 52, 153–160.
Dearden, K. A., Hale, C. B., & Woolley, T. (1995). The
antecedents of teen fatherhood: A retrospective case-study
of Great Britain youth. American Journal of Public Health,
85(4), 551–554.
Ely, M., Richards, M. P. M., Wadsworth, M. E. J., & Elliot, B.
J. (1999). Secular changes in the association of parental
divorce and children’s educational attainment: Evidence
from three British birth cohorts. Journal of Social Policy, 28,
437–455.
Fergusson, D. M., & Horwood, L. J. (1998). Early conduct
problems and later life opportunities. Journal of Child
Psychology and Psychiatry, 39, 1097–1108.
Fergusson, D. M., Horwood, L. J., & Woodward, L. J. (2001).
Unemployment and social psychosocial adjustment in
young adults: Causation or selection? Social Science &
Medicine, 53, 305–320.
Finn.as, F. (1986). Den Finlandssvenska befolkning utvecklingen
1950-1980. Helsinki: Skrifter utgivna av Svenska litteraturs-
.allskapet i Finland, nr 533.
Forsdahl, A. (1977). Are poor living conditions in childhood
and adolescence an important risk factor for arteriosclerotic
heart disease? British Journal of Preventive and Social
Medicine, 31(2), 91–95.
Francis, B., Green, M., & Payne, C. (Eds.), (1993). The
GLIM System: release 4 manual. Oxford: Clarendon
Press.
Frankel, S., Davey Smith, G., & Gunnell, D. (1999). Childhood
socioeconomic position and adult cardiovascular mortality:
The Boyd Orr Cohort. American Journal of Epidemiology,
150(10), 1081–1084.
Frankel, S., Elwood, P., Sweetnam, P., Yarnell, J., & Davey
Smith, G. (1996). Birthweight, body-mass index in middle
age, and incident coronary heart disease. Lancet, 348(9040),
1478–1480.
Friedman, H. S., Tucker, J. S., Schwartz, J. E., Tomlinson-
Keasey, C., Martin, L. R., Wingard, D. L., & Criqui, M. H.
(1995). Psychosocial and behavioral predictors of longevity.
The aging and death of the ‘‘termites’’. American Psychol-
ogist, 50(2), 69–78.
Gohel, M., Diamond, J. J., & Chambers, C. V. (1997).
Attitudes toward sexual responsibility and parenting: An
explanatory study of young urban males. Family Planning
Perspectives, 29(6), 280–283.
Goldthorpe, J. H. (1980). Social mobility and class structure in
modern Britain. Oxford: Clarendon Press.
Gould, M., Fisher, P., Parides, M., Flory, M., & Shaffer, D.
(1996). Psychosocial risk factors of child and adolescent
completed suicide. Archives of General Psychiatry, 53,
1155–1162.
Grundy, E., & Holt, G. (2000). Adult life experiences and
health in early old age in Great Britain. Social Science &
Medicine, 51, 1061–1074.

ARTICLE IN PRESST. Pensola, P. Martikainen / Social Science & Medicine 58 (2004) 2149–2170 2167
Hammarstr .om, A. (1994). Health consequences of youth
unemployment. Social Science & Medicine, 38, 699–709.
Hart, C. L., Davey Smith, G., & Blane, D. (1998). Social
mobility and 21 year mobility in a cohort of Scottish men.
Social Science & Medicine, 47(8), 1121–1130.
Hendry, L. B., Glendinning, A., & Shucksmith, J. (1996).
Adolescent focal theories: Age-trends in developmental
transitions. Journal of Adolescence, 19, 307–320.
Hertzman, C., Power, C., Matthews, S., & Manor, O. (2001).
Using an interactive framework of society and lifecourse to
explain self-rated health in early adulthood. Social Science
& Medicine, 53(12), 1575–1585.
Herztman, C. (1994). The lifelong impact of childhood
experiences. Daedalus, 123(4), 197–216.
Hu, Y., & Goldman, N. (1990). Mortality differentials by
marital status: An international comparison. Demography,
27(2), 233–250.
Johansson, S. E., & Sundquist, J. (1997). Unemployment is an
important risk factor for suicide in contemporary Sweden:
An 11-year follow-up study of a cross-sectional sample of
37790 people. Public Health, 111, 41–45.
Joung, I. M. A., Stronks, K., Mheen van de, H., &
Mackenbach, J. P. (1995). Health behaviours explain part
of the differences in self-reported health by partner/marital
status. Journal of Epidemiology and Community Health, 49,
482–488.
Joung, I. M. A., Stronks, K., Mheen van de, H., Poppel van, F.
W. A., Meer van der, J. B. W, & Mackenbach, J. P. (1996).
Contribution of psychosocial factors, material circum-
stances and health behaviours to marital status differences
in self-reported health. In: Joung IMA. Marital status and
health. Descriptive and explanatory studies (pp. 143-62).
Thesis Erasmus Universiteit, Rotterdam.
Kalland, M., Pensola, T. H., Meril.ainen, J., & Sinkkonen, J.
(2001). Mortality in child registered in the Finnish child
welfare registry: Population based study. British Medical
Journal, 323, 207–208.
Kaplan, G. A., & Salonen, J. T. (1990). Socioeconomic
conditions in childhood and ischaemic heart disease
during middle age. British Medical Journal, 301(6761),
1121–1123.
Karasek, R., Brisson, C., Kawakami, N., Houtman, I.,
Bongers, P., & Amick, B. (1998). The Job Content
Questionnaire (JCQ): An instrument for international
comparative assessments of psychosocial job characteristics.
Journal of Occupational Health Psychology, 3(4), 322–355.
Kemppainen, L., Jokelainen, J., J.arvelin, M.-R., Isohanni, M.,
& R.as.anen, P. (2001). The one-child-family and violent
criminality: A 31-year follow-up study of the northern
Finland 1966 birth cohort. American Journal of Psychiatry,
158, 960–962.
Kemppainen, L., M.akiryr.o, T., Jokelainen, J., Nieminen, P.,
J.arvelin, M.-R., & Isohanni, M. (2000). Is grand multiparity
associated with offsprings’s hospital treated mental dis-
orders? A 28-year follow-up of the North Finland 1966 birth
cohort. Social Psychiatry and Psychiatric Epidemiology, 35,
104–108.
Koivusilta, L. K., Rimpel.a, A. H., & Rimpel.a, M. K. (1995).
Health status: Does it predict choice in further education?
Journal of Epidemiology and Community Health, 49,
131–138.
Koivusilta, L. K., Rimpel.a, A. H., & Rimpel.a, M. K. (1999).
Health-related lifestyle in adolescence-origin of social class
differences in health? Health Education Research, 14(3),
339–355.
Koskinen, S., & Martelin T. (1994a). Kuolleisuus. (Mortality)
In: S. Koskinen, T. Martelin, I.-L. Notkola, V. Notkola, &
K. Pitk.anen, K. (Eds.), Suomen v.aest .o, (pp. 150–223).
H.ameenlinna: Karisto.
Koskinen, S., & Martelin, T. (1994b). Why are socioeconomic
mortality differences smaller among women than among
men? Social Science & Medicine, 38(10), 1385–1396.
Krein, S. F., & Beller, A. H. (1988). Educational attainment of
children from single-parent families: Differences by expo-
sure gender and race. Demography, 25(2), 221–234.
Kuh, D., & Ben-Shlomo, Y. (eds.), (1997). A life course
approach to chronic disease epidemiology. New York:
Oxford University Press.
Kuh, D., Power, C., Blane, D., & Bartley, M. (1997). Social
pathways between childhood and adult health. In D. Kuh,
& Y. Ben-Shlomo (Eds.), A life course approach to chronic
disease epidemiology (pp. 169–198). New York: Oxford
University Press.
Kuh, D. J. L., & Wadsworth, M. E. J. (1993). Physical health
status at 36 years in a British national birth cohort. Social
Science & Medicine, 37(7), 905–916.
Lenthe van, F. J., Boreham, C. A., Twisk, J. W. R., Strain, J. J.,
Savage, J. M., & Davey Smith, G. (2001). Socio-economic
position and coronary heart disease risk factors in youth.
European Journal of Public Health, 11, 43–50.
Leon, D., & Ben-Shlomo, Y. (1997). Preadult influences on
cardiovascular disease and cancer. In D. Kuh, & Y. Ben-
Shlomo (Eds.), A life course approach to chronic disease
epidemiology (pp. 45–77). New York: Oxford University
Press.
Leon, D., & Davey Smith, G. (2000). Infant mortality, stomach
cancer, stroke, and coronary heart disease: Ecological
analysis. British Medical Journal, 320(7251), 1705–1706.
Leon, D. A., V(ager .o, D., & Olausson, P. O. (1992). Social class
differences in infant mortality in Sweden: Comparison with
England and Wales. British Medical Journal, 305, 687–691.
Lithell, H. O., McKeigue, P. M., Berglund, L., Mohsen, R.,
Lithell, U.-B., & Leon, D. A. (1996). Relation of size at
birth to insulin dependent diabetes and insulin concentra-
tions in men aged 50–60 years. British Medical Journal, 312,
406–410.
Lundberg, O. (1993). The impact of childhood living conditions
on illness and mortality in adulthood. Social Science &
Medicine, 36(8), 1047–1052.
Lynch, J. W., Kaplan, G. A., Cohen, R. D., Kauhanen, J.,
Wilson, T. W., Smith, N. L., & Salonen, J. T. (1994).
Childhood and adult socioeconomic status as predictors of
mortality in Finland. Lancet, 343, 524–527.
Lynch, J. W., Kaplan, G. A., & Salonen, J. T. (1997). Why do
poor people behave poorly? Variation in adult health
behaviours and psychosocial characteristics by stages of
the socioeconomic lifecourse. Social Science & Medicine,
44(6), 809–819.
Maheswaran, R., Strachan, D. P., Dodgeon, B., & Best, N. G.
(2002). A population-based case-control study for examin-
ing early life influences on geographical variation in adult
mortality in England and Wales using stomach cancer and

ARTICLE IN PRESST. Pensola, P. Martikainen / Social Science & Medicine 58 (2004) 2149–21702168
stroke as examples. International Journal of Epidemiology,
31, 375–382.
M.akel.a, P., Valkonen, T., & Martelin, T. (1997). Contribution
of deaths related to alcohol use to socioeconomic variation
in mortality: Registered follow-up study. British Medical
Journal, 315, 211–216.
Mare, R. (1990). Socioeconomic careers and differential
mortality among older men in the United States. In J.
Vallin, S. D’Souza, & A. Palloni (Eds.), Measurement and
analysis of mortality: New approaches (pp. 362–387).
Oxford: Clarendon Press.
Martikainen, P., & Valkonen, T. (1996). Excess mortality of
unemployed men and women during a period of rapidly
increasing unemployment. Lancet, 348, 990–1012.
Maughan, B., & McCarthy, G. (1997). Childhood adversities
and psychological disorders. British Medical Bulletin, 53(1),
156–169.
McCarron, P., Davey Smith, G., Okasha, M., & McEwen, J.
(2001). Smoking in adolescence and young adulthood and
mortality in later life: Prospective observational study.
Journal of Epidemiology and Community Health, 55(5),
334–335.
Mheen van de, H. (1998). Inequalities in health, to be continued.
A life-course perspective on socio-economic inequalities in
health. Wageningen: Ponsen & Looijen, BV.
Mheen van de, H., Stronks, K., Van den Bos, J., &
Mackenbach, J. P. (1997). The contribution of childhood
environment to the explanation of socio-economic inequal-
ities in health in adult life: A retrospective study. Social
Science & Medicine, 44, 13–24.
Michael, R. T., & Tuma, N. B. (1985). Entry into marriage and
parenthood by young men and women: The influence of
family background. Demography, 22(4), 515–544.
Mirowsky, J., & Ross, C. E. (2002). Depression, parenthood,
and age at first birth. Social Science & Medicine, 54,
1281–1298.
Montgomery, S. M., Bartley, M. J., Cook, D. G., & Wads-
worth, M. E. J. (1996). Health and social precursors of
unemployment in young men in Great Britain. Journal of
Epidemiology and Community Health, 50, 415–422.
Montgomery, S. M., Bartley, M. J., & Wilkinson, R. G. (1997).
Family conflict and slow growth. Archive of Disease in
Childhood, 77(4), 326–330.
Montgomery, S. M., Berney, L. R., & Blane, D. (2000).
Prepubertal stature and blood pressure in early old age.
Archives of Disease in Childhood, 82(5), 358–363.
Montgomery, S. M., Cook, D. G., Bartley, M. J., & Wads-
worth, M. E. J. (1999). Unemployment pre-dates symptoms
of depression and anxiety resulting in medical consultation
in young men. International Journal of Epidemiology, 28,
95–100.
Moore, D. S., & McCabe, G. P. (1999). Introduction to the
practice of statistics. New York: W H Freeman and
company.
Moser, K. A., Goldblatt, P. O., Fox, A. J., & Jones, D. R.
(1987). Unemployment and mortality: Comparison of the
1971 and 1981 longitudinal study census samples. British
Medical Journal, 294, 86–90.
National board of health (1986). Tautiluokitus 1987, osa 1,
systemaattinen osa. (Classification of diseases). Helsinki:
L.a.akint .ohallitus.
Neeleman, J. (2001). A continuum of premature death. Meta-
analysis of competing mortality in the psychosocially
vulnerable. International Journal of Epidemiology, 30,
154–162.
Neeleman, J., Wessely, S., & Wadsworth, M. (1998). Predictors
of suicide, accidental death, and premature natural death in
a general-population birth cohort. Lancet, 351, 93–97.
Notkola, V. (1985). Living conditions in childhood and coronary
heart disease in adulthood: A mortality and morbidity study in
two areas of Finland. Helsinki: Societas Scientarium
Fennica.
Notkola, V., & Valkonen, T. (1989) Socioeconomic differences
in stillbirths and infant mortality. In: Yearbook of popula-
tion research in Finland (pp. 5–14). Helsinki: The Population
Research Institute..Ostberg, V. (1996). Social structure and children’s life chances
Swedish Institute for Social Research No 26. Edsbruk:
Akademitryck Ab.
Official Statistics of Finland (1974). Population census. Occupa-
tion and social position. Volume IX. Helsinki.
P .ontinen, S. (1983). Social mobility and social structure: A
comparison of Scandinavian countries. Helsinki: Societas
Scientarium Fennica.
Pensola, T. H. (2002). The classification of social class after
1975: Differentiating skilled manual from unskilled manual
workers. www.valt.helsinki.fi/sosio/pru/ses.htm.
Pensola, T. H., & Martikainen, P. (2003). Effect of living
conditions in the parental home and youth paths on the
social class differences in mortality among women. Scandi-
navian Journal of Public Health, forthcoming.
Pensola, T. H., & Valkonen, T. (2000). Mortality differences
by parental social class from childhood to adulthood.
Journal of Epidemiology and Community Health, 54,
525–529.
Pensola, T. H., & Valkonen, T. (2002). Effect of parental social
class, own education and social class on mortality among
young men. European Journal of Public Health, 12(1),
29–36.
Pietil.a, A. M., & J.arvelin, M. R. (1995). Health and social
standing of young men viewed in light of information on
their childhood and adolescence. International Journal of
Nursing Studies, 6, 545–555.
Power, C., & Hertzman, C. (1997). Social and biological
pathways linking early life and adult disease. British Medical
Bulletin, 53(1), 210–221.
Power, C., Li, L., & Manor, O. (2000). A prospective study of
limiting longstanding illness in early adulthood. Interna-
tional Journal of Epidemiology, 29, 131–139.
Power, C., Manor, O., & Fox, J. (1991). Health and class: The
early years. London: Chapman and Hall.
Power, C., Manor, O., & Matthews, S. (1999). The duration
and timing of exposure: Effects of socioeconomic environ-
ment on adult health. American Journal of Public Health,
89(7), 1059–1065.
Power, C., & Matthews, S. (1997). Origins of health inequalities
in a national population sample. Lancet, 350(9091),
1584–1589.
Power, C., Matthews, S., & Manor, O. (1996). Inequalities in
self rated health in the 1958 birth cohort: Lifetime social
circumstances or social mobility? British Medical Journal,
313, 449–453.
ARTICLE IN PRESST. Pensola, P. Martikainen / Social Science & Medicine 58 (2004) 2149–2170 2169
Rahkonen, O., Lahelma, E., & Huuhka, M. (1997). Past or
present? Childhood living conditions and current socio-
economic status as determinants of adult health. Social
Science & Medicine, 44(3), 327–336.
Romelsj .o, A., Kaplan, G. A., Cohen, R. D., Allebeck, P., &
Andreasson, S. (1992). Protective factors and social risk
factors for hospitalization and mortality among young men.
American Journal of Epidemiology, 135(6), 649–658.
Rutter, M. (1989). Pathways from childhood to adult life.
Journal of Child Psychiatry, 30, 23–51.
Sauli, H. (1979). Ammatti ja kuolleisuus 1971–75. Helsinki:
Tilastokeskus, Tutkimuksia.
Sauli, H., Ahola, A., Lahelma, E., & Savolainen, J. (19891).
Elinolot numeroina, vuoden 1986 elinolotutkimus. Helsinki:
Statistics Finland.
Sauvola, A., Miettunen, J., Jarvelin, M.-R., & Rasanen, P.
(2001b). An examination between single-parent family
background and drunk driving in adulthood: Findings from
the northern Finland 1966 birth cohort. Alcoholism—
Clinical and Experimental Research, 25(2), 206–209.
Sauvola, A., Rasanen, P. K., Joukamaa, M. I., Jokelainen, J.,
Jarvelin, M.-R., & Isohanni, M. K. (2001a). Mortality of
young adults in relation to single-parent family background
A prospective study of the Northern Finland 1966 birth
cohort. European Journal of Public Health, 11(3), 284–286.
Scannapieco, M., & Connell-Carrick, K. (2002). Focus on the
first years: An eco-developmental assessment of child
neglect for children 0 to 3 years of age. Children and Youth
Services Review, 24(8), 601–621.
Schrijvers, C. T., Stronks, K., van de Mheen, H. D., &
Mackenbach, J. P. (1999). Explaining educational differ-
ences in mortality: The role of behavioural and material
factors. American Journal of Public Health, 89(4), 535–540.
Schwarz, J. E., Friedman, H. S., Tucker, J. S., Tomlinson-
Keasey, C., Wingard, D., & Criqui, M. H. (1995). Socio-
demographic and psychosocial factors in childhood as
predictors of adult mortality. American Journal of Public
Health, 85, 1237–1245.
Siltala, P. (2002). Tunteet, mit.a ne ovat, mist.a ne tulevat, mit.a
ne merkitsev.at ihmisen mielenterveydelle ja sairaudelle
(Emotions, what are they, where they come from, what
they mean on psychological well-being and illness). Suomen
L .ak .arilehti, 35, 3369–3373.
STAKES. (1999). Tautiluokitus ICD-10. (Classification of
diseases, tenth revision). Turenki: Turengin tekstipalvelu.
Statistics Finland (1983). Sosioekonominen asema -luokitus.
Ammattiasemaluokitus. (Classification of Occupational
Status). Handbooks 17. Helsinki: Central Statistical Office
of Finland.
Statistics Finland (1992). Causes of death 1991. Helsinki:
Statistics Finland, Health.
Statistics Finland (1991). Causes of death. Helsinki: Statistics
Finland, Health 1992, p. 8.
Statistics Finland (1993). Causes of death 1992. Helsinki:
Statistics Finland, Health.
Statistics Finland (1995). Causes of death 1993. Helsinki:
Statistics Finland, Health.
Statistics Finland (1996). Causes of death 1994. Helsinki: Sta-
tistics Finland, Health.
Statistics Finland (1996). Causes of death 1995. Helsinki:
Statistics Finland, Health.
Statistics Finland (1998). Causes of death 1996. Helsinki:
Statistics Finland, Health.
Statistics Finland (1999). Causes of death 1997. Helsinki:
Statistics Finland, Health.
Stefansson, C. G. (1991). Long-term unemployment and
mortality in Sweden, 1980–1986. Social Science & Medicine,
32, 419–423.
Stewart-Brown, S., & Layte, R. (1997). Emotional health
problems are the most important cause of disability in
adults of working age: A study in the four counties of the
old oxford region. Journal of Epidemiology and Community
Health, 51, 672–675.
Strong, J. P., Malcom, G. T., McMahan, C. A., Tracy, R. E.,
Newman, W. P. 3rd, Herderick, E. E., & Cornhill, J. F.
(1999). Prevalence and extent of atherosclerosis in adoles-
cents and young adults: Implications for prevention from
the pathobiological determinants of atherosclerosis in youth
study. Journal of the American Medical Association, 281(8),
727–735.
Sweeting, H., & West, P. (1995). Family life and health in
adolescence: A role for culture in the health inequalities
debate? Social Science & Medicine, 40(2), 163–175.
Tuzcu, E. M., Kapadia, S. R., & Tutar, E., et al. (2001). High
prevalence of coronary atherosclerosis in asymptomatic
teenagers and young adults: Evidence from intravascular
ultrasound. Circulation, 103(22), 2705–2710.
V(ager .o, D. (1992). Health inequalities from the cradle to the
grave? Hypotheses on health policy. International Journal of
Health Science, 3, 175–183.
V(ager .o, D., Koupilova, I., Leon, D. A., & Lithell, U. B. (1999).
Social determinants of birthweight, ponderal index and
gestational age in Sweden in the 1920s and the 1980s. Acta
Paediatrica, 88(4), 445–453.
V(ager .o, D., & Leon, D. (1994). Effect of social class in
childhood and adulthood on adult mortality. Lancet, 343,
1224–1225.
Valkonen, T. (1987). Male mortality from ischaemic
heart disease in Finland: Relation to region of birth
and region of residence. European Journal of Population,
3, 61–83.
Valkonen, T., Martelin, T., Rimpel.a, A., Notkola, V., & Savela,
S. (1993). Socioeconomic mortality differences in Finland
1981–90. Helsinki: Statistics Finland.
Valtioneuvoston kanslia. (2001/13). Ty .omarkkinoilta syrj-
.aytyminen, tulonjako ja k .oyhyys. ty .oryhm.araportti. Hel-
sinki: Valtioneuvoston kanslian julkaisusarja.
Wadsworth, M. E. J. (1997). Health inequalities in the
life course perspective. Social Science & Medicine, 44(6),
859–869.
Wadsworth, M. E. J., Hardy, R. J., Paul, A. A., Marshall, S. F.,
& Cole, T. J. (2002). Leg and trunk length at 43 years in
relation to childhood health, diet and family circumstances;
evidence from the 1946 national birth cohort. International
Journal of Epidemiology, 31, 383–390.
Wadsworth, M. E. J., Montgomery, S. M., & Bartley, M. J.
(1999). The persisting effect of unemployment on health and
social well-being in men early in working life. Social Science
& Medicine, 48, 1491–1499.
Wagstaff, A., Paci, P., & Joshi, H. (2001). Inequalities in health:
Who you are? Where you live? Or who your parents were?
World Bank Working Paper 2713, Washington, DC.

ARTICLE IN PRESST. Pensola, P. Martikainen / Social Science & Medicine 58 (2004) 2149–21702170
Wannamethee, G. S., Whincup, P. H., Shaper, G., & Walker,
M. (1996). Influence of father’s social class on cardiovascular
disease in middle-aged men. Lancet, 348(9037), 1259–1263.
West, P. (1997). Health inequalities in the early years: Is there
equalisation in youth? Social Science & Medicine, 44(6),
833–858.
Whincup, P. H., Cook, D. G., Adshead, F., Taylor, S.,
Papacosta, O., Walker, M., & Wilson, V. (1996). Cardio-
vascular risk factors in British children from towns with
widely differing adult cardiovascular mortality. British
Medical Journal, 313, 79–84.
Wilkinson, R. (1986). Socioeconomic differences in mortality.
In R. Wilkinson (Ed.), Class and health (pp. 84–114).
London: Tavistock Publications Ltd.
Wright, C. M., Parker, L., Lamont, D., & Craft, A. W. (2001).
Implications of childhood obesity for adult health: Findings
from thousand families cohort study. British Medical
Journal, 323, 1280–1284.
Wunsch, G., Duch#ene, J., Thiltg"es, E., & Salhi, M.
(1996). Socio-economic differences in mortality. A life
course approach. European Journal of Population, 12,
167–185.