
Latino Risk-adjusted Mortality in the Men Screened for the Multiple Risk Factor Intervention Trial
10
Latino Risk-adjusted Mortality in the Men Screened for the Multiple Risk Factor Intervention Trial Avis J. Thomas 1 , Lynn E. Eberly 1 , James D. Neaton 1 , and George Davey Smith 2 for the Multiple Risk Factor Intervention Trial Research Group 1 Coordinating Centers for Biometric Research, Division of Biostatistics, School of Public Health, University of Minnesota, Minneapolis, MN. 2 Department of Social Medicine, University of Bristol, Bristol BS8 2PR, United Kingdom. Received for publication January 26, 2005; accepted for publication April 20, 2005. Latinos are now the largest minority in the United States, but their distinctive health needs and mortality patterns remain poorly understood. Proportional hazards regressions were used to compare Latino versus White risk- and income-adjusted mortality over 25 years’ follow-up from 5,846 Latino and 300,647 White men screened for the Multiple Risk Factor Intervention Trial. Men were aged 35–57 years and residing in 14 states when screened in 1973–1975. Data on coronary heart disease risk factors, self-reported race/ethnicity, and home addresses were obtained at baseline; income was estimated by linking addresses to census data. Mortality follow-up through 1999 was obtained using the National Death Index. The fully adjusted Latino/White hazard ratio for all-cause mortality was 0.82 (95% confidence interval (CI): 0.77, 0.87), based on 1,085 Latino and 73,807 White deaths; this pattern prevailed over time and across states (thus, likely across Latino subgroups). Hazard ratios were significantly greater than one for stroke (hazard ratio ¼ 1.30, 95% CI: 1.01, 1.68), liver cancer (hazard ratio ¼ 2.02, 95% CI: 1.21, 3.37), and infection (hazard ratio ¼ 1.69, 95% CI: 1.24, 2.32). A substudy found only minor racial/ethnic differences in the quality of Social Security numbers, birth dates, soundex-adjusted names, and National Death Index searches. Results were not likely an artifact of return migration or incomplete mortality data. cardiovascular diseases; cerebrovascular accident; diabetes mellitus, type 2; emigration and immigration; ethnology; Hispanic Americans; liver neoplasms; social class Abbreviations: CI, confidence interval; MRFIT, Multiple Risk Factor Intervention Trial. The Latino-American population is growing rapidly and has emerged as America’s largest minority (12.5 percent of the US population in 2000, up from 9.0 percent in 1990) (1, 2). It is thus an important subgroup for analysis. How- ever, there is conflicting information about mortality differ- ences between Latino Americans and other Americans. Various studies have compared Latino-American mortality and morbidity with those of non-Latino White Americans (hereafter called ‘‘Latinos’’ and ‘‘Whites’’). Few Latino/ White mortality studies, however, have also had access to health information. Some, based on national data registries, provide evidence for the ‘‘Hispanic paradox,’’ in which Latinos have significantly lower mortality statistics than do Whites despite financial disadvantages and greater cul- tural and linguistic barriers to health care (3–8). Others, based on community studies, provide evidence against this Hispanic paradox (9, 10). The inconsistency has not been resolved. The current study sheds light on the issues by evaluating 25-year mortality outcomes for a large US co- hort of Latinos and Whites with baseline health and esti- mated income data. MATERIALS AND METHODS Multiple Risk Factor Intervention Trial screening Between 1973 and 1975, the Multiple Risk Factor Inter- vention Trial (MRFIT) screened 361,662 men aged 35–57 Correspondence to Avis Thomas, University of Minnesota, 2221 University Avenue, Suite 200, Minneapolis, MN 55414 (e-mail: [email protected]). 569 Am J Epidemiol 2005;162:569–578 American Journal of Epidemiology Copyright ª 2005 by the Johns Hopkins Bloomberg School of Public Health All rights reserved Vol. 162, No. 6 Printed in U.S.A. DOI: 10.1093/aje/kwi220 by guest on June 12, 2013 http://aje.oxfordjournals.org/ Downloaded from
-
Upload
spanalumni -
Category
Documents
-
view
0 -
download
0
Transcript of Latino Risk-adjusted Mortality in the Men Screened for the Multiple Risk Factor Intervention Trial

Latino Risk-adjusted Mortality in the Men Screened for the Multiple Risk FactorIntervention Trial
Avis J. Thomas1, Lynn E. Eberly1, James D. Neaton1, and George Davey Smith2 for theMultiple Risk Factor Intervention Trial Research Group
1 Coordinating Centers for Biometric Research, Division of Biostatistics, School of Public Health, University of Minnesota,Minneapolis, MN.2 Department of Social Medicine, University of Bristol, Bristol BS8 2PR, United Kingdom.
Received for publication January 26, 2005; accepted for publication April 20, 2005.
Latinos are now the largest minority in the United States, but their distinctive health needs and mortality patternsremain poorly understood. Proportional hazards regressions were used to compare Latino versus White risk- andincome-adjusted mortality over 25 years’ follow-up from 5,846 Latino and 300,647 White men screened for theMultiple Risk Factor Intervention Trial. Men were aged 35–57 years and residing in 14 states when screened in1973–1975. Data on coronary heart disease risk factors, self-reported race/ethnicity, and home addresses wereobtained at baseline; income was estimated by linking addresses to census data. Mortality follow-up through 1999was obtained using the National Death Index. The fully adjusted Latino/White hazard ratio for all-cause mortalitywas 0.82 (95% confidence interval (CI): 0.77, 0.87), based on 1,085 Latino and 73,807 White deaths; this patternprevailed over time and across states (thus, likely across Latino subgroups). Hazard ratios were significantlygreater than one for stroke (hazard ratio ¼ 1.30, 95% CI: 1.01, 1.68), liver cancer (hazard ratio ¼ 2.02, 95%CI: 1.21, 3.37), and infection (hazard ratio ¼ 1.69, 95% CI: 1.24, 2.32). A substudy found only minor racial/ethnicdifferences in the quality of Social Security numbers, birth dates, soundex-adjusted names, and National DeathIndex searches. Results were not likely an artifact of return migration or incomplete mortality data.
cardiovascular diseases; cerebrovascular accident; diabetes mellitus, type 2; emigration and immigration;ethnology; Hispanic Americans; liver neoplasms; social class
Abbreviations: CI, confidence interval; MRFIT, Multiple Risk Factor Intervention Trial.
The Latino-American population is growing rapidly andhas emerged as America’s largest minority (12.5 percentof the US population in 2000, up from 9.0 percent in 1990)(1, 2). It is thus an important subgroup for analysis. How-ever, there is conflicting information about mortality differ-ences between Latino Americans and other Americans.Various studies have compared Latino-American mortalityand morbidity with those of non-Latino White Americans(hereafter called ‘‘Latinos’’ and ‘‘Whites’’). Few Latino/White mortality studies, however, have also had access tohealth information. Some, based on national data registries,provide evidence for the ‘‘Hispanic paradox,’’ in whichLatinos have significantly lower mortality statistics thando Whites despite financial disadvantages and greater cul-
tural and linguistic barriers to health care (3–8). Others,based on community studies, provide evidence against thisHispanic paradox (9, 10). The inconsistency has not beenresolved. The current study sheds light on the issues byevaluating 25-year mortality outcomes for a large US co-hort of Latinos and Whites with baseline health and esti-mated income data.
MATERIALS AND METHODS
Multiple Risk Factor Intervention Trial screening
Between 1973 and 1975, the Multiple Risk Factor Inter-vention Trial (MRFIT) screened 361,662 men aged 35–57
Correspondence to Avis Thomas, University of Minnesota, 2221 University Avenue, Suite 200, Minneapolis, MN 55414 (e-mail:
569 Am J Epidemiol 2005;162:569–578
American Journal of Epidemiology
Copyright ª 2005 by the Johns Hopkins Bloomberg School of Public Health
All rights reserved
Vol. 162, No. 6
Printed in U.S.A.
DOI: 10.1093/aje/kwi220
by guest on June 12, 2013http://aje.oxfordjournals.org/
Dow
nloaded from

years for coronary heart disease risk factors. Screening wascarried out by 22 clinical centers in 18 cities (14 states)across the continental United States. The types of popula-tions screened varied considerably from center to center,and no attempt was made to make the recruits representativeof the general population. Clinical centers that screeneda large number of Latinos relied heavily on recruitmentwithin industrial or governmental work settings and/orunion halls and also on door-to-door recruitment withincensus tracts or geographic locales (M. Sexton, Universityof Maryland, unpublished manuscript) (11). Work sites usedfor recruitment were chosen from industries with a stablework force. Most clinical centers used multiple recruitmentmethods that also included area-wide methods, such as re-cruiting in shopping malls or at street fairs or recruitingthrough affinity groups such as churches or civic clubs.
All men signed a brief consent form giving investigatorsexplicit permission to use all the data collected. Men hadevery opportunity to decline the screening. Undocumentedaliens or men planning to move away from the area mayhave thus been implicitly discouraged.
Data collection at screening is described in detail else-where (12). At the first screening visit, blood pressure wastaken three times with a standard mercury sphygmomanom-eter; this study used the average of the second and thirdreadings. Serum total cholesterol was measured from a non-fasting blood sample. Men were asked how many cigarettesa day they currently smoked, if they were presently takingmedicine for diabetes, and whether or not they had ever beenhospitalized for a heart attack for 2 weeks or longer. Currenthome address, Social Security number, and date of birthwere collected. Men were asked: ‘‘Which of the followingbest describes the group to which you belong: White, Black,Oriental, Spanish American, American Indian, or other?’’Men in the top 10–15 percent group for coronary heart dis-ease, but without history of heart attack or present use ofmedicine for diabetes, were invited to return for additionalscreening and possible inclusion in the randomized trial.
Home address ZIP codes were matched to 1980 USCensus data to obtain ZIP code-based median householdincome and percentage Latino. White versus Latino race/ethnicity-specific median incomes were compared. Latino-specific data were not publicly available for some ZIP codes;to include as many men as possible, we chose to use ZIPcode-based median income for Whites to estimate incomefor both Whites and Latinos.
To investigate the merits of adjusting for ZIP code-basedmedian household income versus census tract-based medianfamily income, we obtained census tracts for as manyscreenees as possible. Home addresses were geocoded usingArcView 8.2 and ArcGIS StreetMap USA (both by ESRI,Inc., Redlands, California) software and matched with 1980US Census tract boundary files from the National HistoricalGeographic Information System.
Study participants
Men were included in this study if they self-identifiedas ‘‘White’’ or ‘‘Spanish American,’’ they had completebaseline health data, and the median income for Whites in
their ZIP code was known. Of the 361,662 men screened,there were 6,647 Latinos and 325,384 Whites. Of these, the5,846 (88 percent) Latinos and 300,647 (92 percent) Whiteswith complete baseline data are the focus of this report.Among the 801 Latinos and 24,737 Whites who were ex-cluded, 25.2 percent and 29.8 percent died during follow-up,respectively.
Mortality data
Participants’ dates of birth, Social Security numbers (ifavailable), and names were used to obtain mortality datafrom the Social Security Death Index and the National DeathIndex through 1999. National Death Index matching wasbased on a probabilistic scoring system developed by theNational Center for Health Statistics; a match with slightlyincorrect or missing Social Security numbers was still possi-ble if the name and date of birth matched exactly, wherenames could be matched on the basis of either exact spellingor the New York State Identification and Intelligence Systemphonetic codes (13). For deaths through 1990, the SocialSecurity Death Index, National Death Index, and MRFITclinic records were used to determine dates of death; two orthree nosologists then read each death certificate and codedthe underlying cause of death. For deaths in 1991–1999, thecause and date of death were obtained from the NationalDeath Index Plus service. Both the Social Security DeathIndex and the National Death Index capture deaths thatoccurred in Puerto Rico (14).
The National Death Index matching criteria have beenshown to have 97 percent specificity and 97 percent sensitiv-ity for the general population (15), and National Death Indexsearches have been shown to produce high-quality results,even with incomplete or incorrect data (13). A NationalDeath Index search correctly identified 98.4 percent of the191 known 1979–1980 deaths among men randomized intothe MRFIT; 93.2 percent were found in a Social SecurityDeath Index search (16). However, it has not been clearwhether matching results for Latinos are of the same highquality as for Whites. National Death Index documentationreports lower matching rates among non-Whites due to lowerreports of Social Security numbers and incorrect spelling/recording of ethnic names (17). To address this question,we randomly selected 500 Whites and 500 Latinos with aSocial Security number available and searched for death re-cords in the Social Security Death Index through January2004. The results were used to evaluate the relative reliabilityof Latino and White Social Security numbers, names, anddates of birth, as well as the overall number of Latino andWhite deaths found.
Statistical methods
Baseline data were tabulated using percentages or meansand standard deviations. Age-adjusted p values for Latino/White differences were calculated using linear or logisticregression.
Proportional hazards regressions were used to examineLatino/White mortality differences. Regressions were stratifiedby clinical center unless they involved state-by-state analysis.
570 Thomas et al.
Am J Epidemiol 2005;162:569–578
by guest on June 12, 2013http://aje.oxfordjournals.org/
Dow
nloaded from
Regressions were adjusted first by age; then by age and riskfactors (smoker (yes/no), cigarettes per day, serum choles-terol, systolic blood pressure, current treatment for diabetes,and prior heart attack); and finally by age, risk factors, andincome. The proportional hazards assumption was checkedfor all-cause mortality by examining the hazard ratios forsequential 10-year time segments.
Similar analyses were repeated for specific medical anddemographic subgroups. Among the subgroups consideredwere Latinos living in a ZIP code with a high versus a lowpercentage of Latinos. Those men in a ZIP code with a highpercentage of Latinos could have lower mortality rates dueto being less acculturated to mainstream US culture, onaverage, or due to greater availability of Spanish-speakingand/or culturally appropriate medical facilities or betterquality social networks.
A separate analysis was also carried out for the subset ofmen for whom both ZIP code-based and census tract-basedmedian incomes were available. We compared Latino/Whitehazard ratios for risk and income-adjusted models using eachof the two income measures.
The state in which they were screened was used as anapproximate proxy for Latinos’ country of origin. To test therobustness of Latino/White hazard ratios across state andacross other variables, we performed fully adjusted propor-tional hazards regressions separately by state, demographicvariables, and risk factors. We tested for linear or categoricalinteraction between race/ethnicity and these variables byadding interaction terms to the regressions.
All analyses were conducted using SAS, version 8.2 (SASInstitute, Inc., Cary, North Carolina), software. All p valueswere two sided.
RESULTS
Baseline characteristics
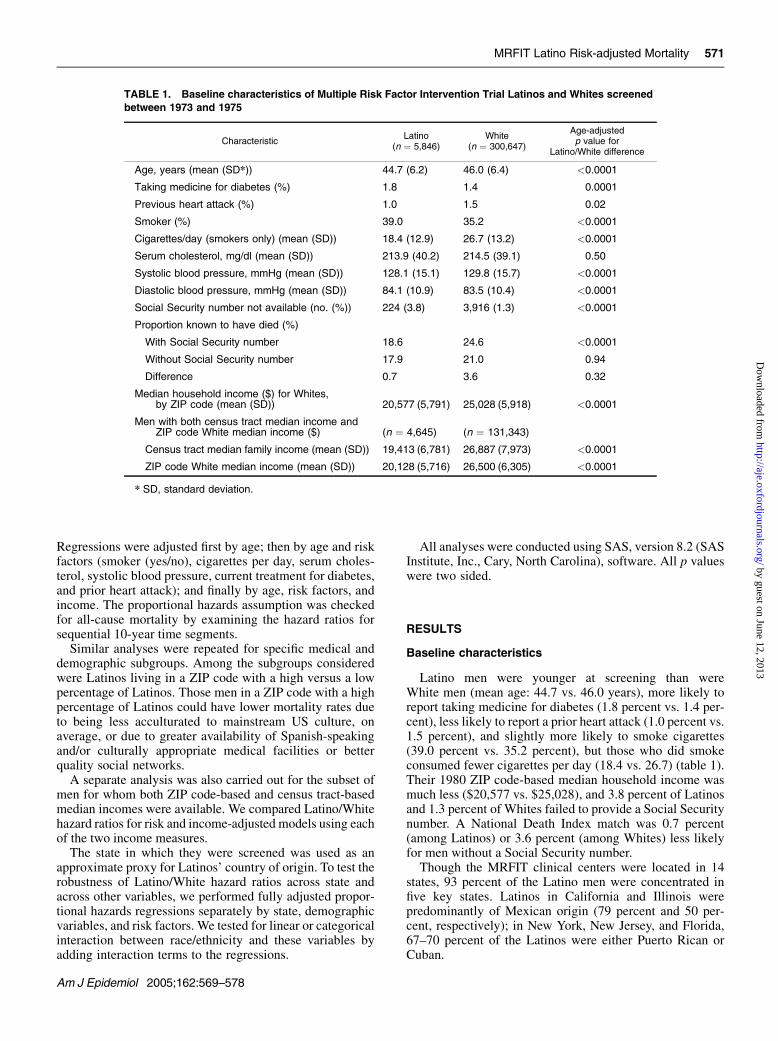
Latino men were younger at screening than wereWhite men (mean age: 44.7 vs. 46.0 years), more likely toreport taking medicine for diabetes (1.8 percent vs. 1.4 per-cent), less likely to report a prior heart attack (1.0 percent vs.1.5 percent), and slightly more likely to smoke cigarettes(39.0 percent vs. 35.2 percent), but those who did smokeconsumed fewer cigarettes per day (18.4 vs. 26.7) (table 1).Their 1980 ZIP code-based median household income wasmuch less ($20,577 vs. $25,028), and 3.8 percent of Latinosand 1.3 percent of Whites failed to provide a Social Securitynumber. A National Death Index match was 0.7 percent(among Latinos) or 3.6 percent (among Whites) less likelyfor men without a Social Security number.
Though the MRFIT clinical centers were located in 14states, 93 percent of the Latino men were concentrated infive key states. Latinos in California and Illinois werepredominantly of Mexican origin (79 percent and 50 per-cent, respectively); in New York, New Jersey, and Florida,67–70 percent of the Latinos were either Puerto Rican orCuban.
TABLE 1. Baseline characteristics of Multiple Risk Factor Intervention Trial Latinos and Whites screened
between 1973 and 1975
CharacteristicLatino
(n ¼ 5,846)White
(n ¼ 300,647)
Age-adjustedp value for
Latino/White difference
Age, years (mean (SD*)) 44.7 (6.2) 46.0 (6.4) <0.0001
Taking medicine for diabetes (%) 1.8 1.4 0.0001
Previous heart attack (%) 1.0 1.5 0.02
Smoker (%) 39.0 35.2 <0.0001
Cigarettes/day (smokers only) (mean (SD)) 18.4 (12.9) 26.7 (13.2) <0.0001
Serum cholesterol, mg/dl (mean (SD)) 213.9 (40.2) 214.5 (39.1) 0.50
Systolic blood pressure, mmHg (mean (SD)) 128.1 (15.1) 129.8 (15.7) <0.0001
Diastolic blood pressure, mmHg (mean (SD)) 84.1 (10.9) 83.5 (10.4) <0.0001
Social Security number not available (no. (%)) 224 (3.8) 3,916 (1.3) <0.0001
Proportion known to have died (%)
With Social Security number 18.6 24.6 <0.0001
Without Social Security number 17.9 21.0 0.94
Difference 0.7 3.6 0.32
Median household income ($) for Whites,by ZIP code (mean (SD)) 20,577 (5,791) 25,028 (5,918) <0.0001
Men with both census tract median income andZIP code White median income ($) (n ¼ 4,645) (n ¼ 131,343)
Census tract median family income (mean (SD)) 19,413 (6,781) 26,887 (7,973) <0.0001
ZIP code White median income (mean (SD)) 20,128 (5,716) 26,500 (6,305) <0.0001
* SD, standard deviation.
MRFIT Latino Risk-adjusted Mortality 571
Am J Epidemiol 2005;162:569–578
by guest on June 12, 2013http://aje.oxfordjournals.org/
Dow
nloaded from
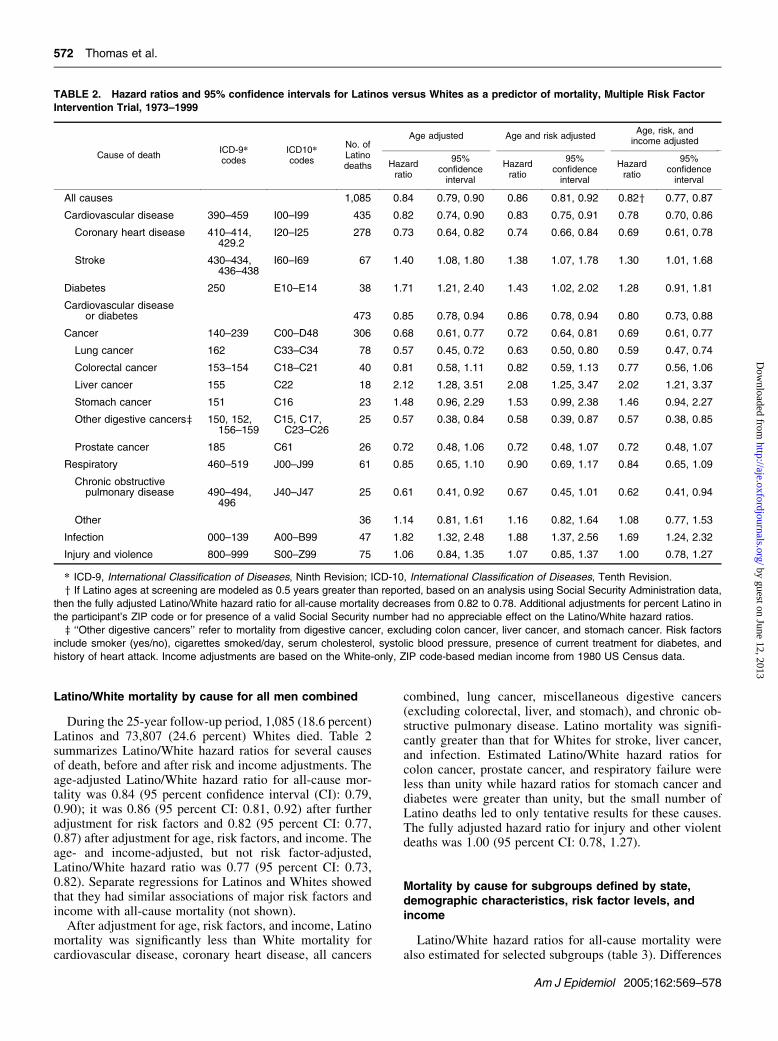
Latino/White mortality by cause for all men combined
During the 25-year follow-up period, 1,085 (18.6 percent)Latinos and 73,807 (24.6 percent) Whites died. Table 2summarizes Latino/White hazard ratios for several causesof death, before and after risk and income adjustments. Theage-adjusted Latino/White hazard ratio for all-cause mor-tality was 0.84 (95 percent confidence interval (CI): 0.79,0.90); it was 0.86 (95 percent CI: 0.81, 0.92) after furtheradjustment for risk factors and 0.82 (95 percent CI: 0.77,0.87) after adjustment for age, risk factors, and income. Theage- and income-adjusted, but not risk factor-adjusted,Latino/White hazard ratio was 0.77 (95 percent CI: 0.73,0.82). Separate regressions for Latinos and Whites showedthat they had similar associations of major risk factors andincome with all-cause mortality (not shown).
After adjustment for age, risk factors, and income, Latinomortality was significantly less than White mortality forcardiovascular disease, coronary heart disease, all cancers
combined, lung cancer, miscellaneous digestive cancers(excluding colorectal, liver, and stomach), and chronic ob-structive pulmonary disease. Latino mortality was signifi-cantly greater than that for Whites for stroke, liver cancer,and infection. Estimated Latino/White hazard ratios forcolon cancer, prostate cancer, and respiratory failure wereless than unity while hazard ratios for stomach cancer anddiabetes were greater than unity, but the small number ofLatino deaths led to only tentative results for these causes.The fully adjusted hazard ratio for injury and other violentdeaths was 1.00 (95 percent CI: 0.78, 1.27).
Mortality by cause for subgroups defined by state,demographic characteristics, risk factor levels, andincome
Latino/White hazard ratios for all-cause mortality werealso estimated for selected subgroups (table 3). Differences
TABLE 2. Hazard ratios and 95% confidence intervals for Latinos versus Whites as a predictor of mortality, Multiple Risk Factor
Intervention Trial, 1973–1999
Cause of deathICD-9*codes
ICD10*codes
No. ofLatinodeaths
Age adjusted Age and risk adjustedAge, risk, and
income adjusted
Hazardratio
95%confidenceinterval
Hazardratio
95%confidenceinterval
Hazardratio
95%confidenceinterval
All causes 1,085 0.84 0.79, 0.90 0.86 0.81, 0.92 0.82y 0.77, 0.87
Cardiovascular disease 390–459 I00–I99 435 0.82 0.74, 0.90 0.83 0.75, 0.91 0.78 0.70, 0.86
Coronary heart disease 410–414,429.2
I20–I25 278 0.73 0.64, 0.82 0.74 0.66, 0.84 0.69 0.61, 0.78
Stroke 430–434,436–438
I60–I69 67 1.40 1.08, 1.80 1.38 1.07, 1.78 1.30 1.01, 1.68
Diabetes 250 E10–E14 38 1.71 1.21, 2.40 1.43 1.02, 2.02 1.28 0.91, 1.81
Cardiovascular diseaseor diabetes 473 0.85 0.78, 0.94 0.86 0.78, 0.94 0.80 0.73, 0.88
Cancer 140–239 C00–D48 306 0.68 0.61, 0.77 0.72 0.64, 0.81 0.69 0.61, 0.77
Lung cancer 162 C33–C34 78 0.57 0.45, 0.72 0.63 0.50, 0.80 0.59 0.47, 0.74
Colorectal cancer 153–154 C18–C21 40 0.81 0.58, 1.11 0.82 0.59, 1.13 0.77 0.56, 1.06
Liver cancer 155 C22 18 2.12 1.28, 3.51 2.08 1.25, 3.47 2.02 1.21, 3.37
Stomach cancer 151 C16 23 1.48 0.96, 2.29 1.53 0.99, 2.38 1.46 0.94, 2.27
Other digestive cancersz 150, 152,156–159
C15, C17,C23–C26
25 0.57 0.38, 0.84 0.58 0.39, 0.87 0.57 0.38, 0.85
Prostate cancer 185 C61 26 0.72 0.48, 1.06 0.72 0.48, 1.07 0.72 0.48, 1.07
Respiratory 460–519 J00–J99 61 0.85 0.65, 1.10 0.90 0.69, 1.17 0.84 0.65, 1.09
Chronic obstructivepulmonary disease 490–494,
496J40–J47 25 0.61 0.41, 0.92 0.67 0.45, 1.01 0.62 0.41, 0.94
Other 36 1.14 0.81, 1.61 1.16 0.82, 1.64 1.08 0.77, 1.53
Infection 000–139 A00–B99 47 1.82 1.32, 2.48 1.88 1.37, 2.56 1.69 1.24, 2.32
Injury and violence 800–999 S00–Z99 75 1.06 0.84, 1.35 1.07 0.85, 1.37 1.00 0.78, 1.27
* ICD-9, International Classification of Diseases, Ninth Revision; ICD-10, International Classification of Diseases, Tenth Revision.
y If Latino ages at screening are modeled as 0.5 years greater than reported, based on an analysis using Social Security Administration data,
then the fully adjusted Latino/White hazard ratio for all-cause mortality decreases from 0.82 to 0.78. Additional adjustments for percent Latino in
the participant’s ZIP code or for presence of a valid Social Security number had no appreciable effect on the Latino/White hazard ratios.
z ‘‘Other digestive cancers’’ refer to mortality from digestive cancer, excluding colon cancer, liver cancer, and stomach cancer. Risk factors
include smoker (yes/no), cigarettes smoked/day, serum cholesterol, systolic blood pressure, presence of current treatment for diabetes, and
history of heart attack. Income adjustments are based on the White-only, ZIP code-based median income from 1980 US Census data.
572 Thomas et al.
Am J Epidemiol 2005;162:569–578
by guest on June 12, 2013http://aje.oxfordjournals.org/
Dow
nloaded from

in Latino/White hazard ratios by state, percent Latino in ZIPcode, income level, age at screening, diabetic status, smok-ing status, cholesterol level, blood pressure level, overallcoronary heart disease risk level, availability of Social Se-curity number, and presence at the second screening visitwere small and in most cases not significant at conventionallevels (p¼ 0.01 for overall coronary heart disease risk level;p ¼ 0.06 for smoking; p > 0.13 for each of the others).
The subgroup of men randomized into the MRFIT, in-cluding 159 Latinos (43 deaths) and 10,683 Whites (3,854deaths) with complete data, was considered separately be-cause personally reported income was collected for thesemen. The fully adjusted Latino/White hazard ratio for all-cause mortality was 0.80 (95 percent CI: 0.59, 1.09) usingZIP code-based income and 0.75 (95 percent CI: 0.55, 1.02)using personally reported family income.
Robustness of results
Latino/White differences in all-cause mortality remainedconstant over the 25 years of follow-up time. The fullyadjusted Latino/White hazard ratios for all-cause mortalitywere 0.86 (95 percent CI: 0.75, 0.99) during years 1–10,0.78 (95 percent CI: 0.71, 0.86) during years 11–20, and0.84 (95 percent CI: 0.76, 0.93) in years 21 and after.
To investigate the use of different census-based incomeestimates, we considered census tract-based and White-only ZIP code-based median income, both of which wereavailable for 5,367 (92 percent) Latinos and 261,539(87 percent) Whites. The age-, risk-, and income-adjustedLatino/White all-cause mortality hazard ratio was 0.82 (95percent CI: 0.77, 0.88) when using ZIP code-based incomeand 0.81 (95 percent CI: 0.76, 0.87) when using census tract-based income. To include as many men as possible, we se-lected White-only, ZIP code-based median income as theincome estimate in all the other analyses.
Quality of reported birth date and vital statusascertainment
To evaluate the quality of the National Death Index searchfor Latinos compared with Whites, we randomly selected500 Latinos and 500 Whites with Social Security numbersfrom the study population and searched the Social SecurityDeath Index database through January 2004 for informationabout them. The average age at screening was 44.7 years forLatinos and 46.2 years for Whites. Matches were soughtusing only the Social Security number and alternately usingonly the last name with soundex code (for more information:http://www.archives.gov/research_room/genealogy/census/soundex.html), first name (exact spelling), and year ofbirth. The National Death Index search had identified 82Latino and 111 White deaths for this group through 1999;the Social Security Death Index search found four additionaldeaths for this time period, all of them for Whites. Incorpo-rating these four additional deaths reduced the unadjustedLatino/White all-cause mortality ratio from 0.78 to 0.75.
The Social Security Death Index database containedinformation on 123 Latino deaths and 155 White deathsthrough January 2004; among them, ten Whites (6.5 per-
cent) and four Latinos (3.3 percent) had single-digit dis-crepancies in Social Security number when compared withthe MRFIT database (table 4). None had larger discrepan-cies. By this criterion alone, the Social Security numbers forLatino MRFIT screenees were 3.2 percent more consistentthan those for the Whites. Additionally, one Latino and sixWhites had Social Security numbers in the MRFIT databasethat were assigned to someone else in the Social SecurityDeath Index database. Soundex-adjusted surnames anddates of birth were 1.9 percent and 10–15 percent less con-sistent for Latinos, respectively; investigations of first nameyielded ambiguous results.
DISCUSSION
In the large, 14-state MRFIT study, 25-year mortalityfollow-up lends support to the Hispanic paradox, with anage-, risk factor-, and income-adjusted Latino/White hazardratio for all-cause mortality of 0.82 (95 percent CI: 0.77,0.87). Mortality hazard ratios were significantly less thanone for cardiovascular disease, coronary heart disease, allcancers combined, and some site-specific cancers. Theywere significantly greater than one for stroke, liver cancer,and infection. The diabetes and stomach cancer hazardratios were markedly elevated, but the small number ofLatino deaths (n ¼ 38 and 23, respectively) limited ourability to estimate these hazard ratios reliably.
In 1973–1975, most Latino Americans were foreign born;it is thus likely that a majority of MRFIT Latino screeneeswere also first generation immigrants. The low Latino/Whiteall-cause mortality hazard ratio could thus reflect a healthyimmigrant phenomenon. In this view, the immigrants’ self-selection process favors individuals with above-averagehealth, intelligence, and self-motivation. These characteris-tics would have favorably influenced immigrants’ mortalityacross their life span (3). Studies have found more favorableself-reported health statuses for first generation immigrants(Hispanic, non-Hispanic White, and non-Hispanic Black)than for native-born Americans, particularly in the earlyyears after immigration (18, 19). Other authors have sug-gested that first generation immigrants may be healthierbecause of lesser past exposure to pollutants, sedentary life-styles, tobacco, and so on, in their country of origin (18, 20)or because they partially retain advantageous cultural char-acteristics and health behaviors (e.g., dietary differences,stronger social networks, and family cohesion) (21, 22).Possible genetic factors, including a propensity for obesityand diabetes, would work against this (23).
Alternately, Latino/White mortality hazard ratios lessthan one have often been attributed to the ‘‘salmon hypoth-esis’’ (24), in which first generation Latino immigrantsare disproportionately likely to return to their country oforigin before death, thus skewing reported mortality rates.Three aspects of the current study mitigate against that pos-sibility. First, several factors would have reduced the like-lihood that undocumented aliens or those planning to leavethe country would have chosen to participate. The menscreened for the MRFIT were recruited from stable popula-tions and gave researchers written permission to use their
MRFIT Latino Risk-adjusted Mortality 573
Am J Epidemiol 2005;162:569–578
by guest on June 12, 2013http://aje.oxfordjournals.org/
Dow
nloaded from

Social Security number and other confidential data. Anoverwhelming majority of both Latinos (96 percent) andWhites (98 percent) provided researchers with a plausibleSocial Security number, indicative of a long-term interest inUS residency.
Second, had Latinos left the country at a significant rate,the Latino/White all-cause mortality hazard ratio wouldhave decreased over time. However, the observed Latino/White differences in mortality rates remained constant over25 years of follow-up.
Third, the salmon hypothesis applies only to immigrantsfrom Mexico, Central America, and South America and not
to those from Puerto Rico (because deaths in Puerto Rico areincluded in the National Death Index and Social SecurityDeath Index databases) or Cuba (who have tended toremain in the United States for political reasons). It wouldthus predict lower observed Latino/White hazard ratios inCalifornia or Illinois, where most Latinos were MexicanAmerican, versus New York, New Jersey, and Florida,where Cubans and Puerto Ricans predominate. However,no such pattern existed.
There has been considerable discussion in the literatureregarding incomplete ascertainment of Latino deaths (8, 9,17, 25), which led us to more carefully examine the quality
TABLE 3. Analysis of Latino and White all-cause mortality by subgroups, Multiple Risk Factor Intervention Trial, 1973–1999
No. of menAll-causedeaths(no.)
Age-adjustedmortality ratesper 10,000*
Age-, income-,and risk-adjusted
Latino/White mortality
Latino White Latino White Latino WhiteHazardratioy
95%confidenceinterval
Overall 5,846 300,647 1,085 73,807 87.4 105.3 0.82 0.77, 0.87
State(s)
Florida 1,855 7,661 391 2,095 94.8 113.5 0.80 0.71, 0.89
New Jersey 385 35,499 54 8,475 73.0 101.9 0.68 0.52, 0.89
New York 332 15,961 59 3,642 85.5 97.7 0.84 0.65, 1.09
California 2,183 42,620 395 10,027 85.4 99.2 0.84 0.76, 0.93
Illinois 674 25,406 110 5,911 78.5 101.2 0.74 0.61, 0.90
Other 417 173,500 76 43,657 89.9 108.5 0.94 0.75, 1.18
% Latino in ZIP code
<1 2,560 122,703 465 27,295 86.0 106.7 0.81 0.74, 0.89
�1 3,286 187,944 620 46,512 88.4 104.6 0.82 0.75, 0.89
Income, by Latino quartile (Q)z
Q1 (lowest) 1,445 11,100 293 3,452 93.4 131.7 0.71 0.62, 0.81
Q2 1,473 48,895 295 14,096 92.2 121.8 0.81 0.72, 0.91
Q3 1,466 88,528 284 23,145 89.6 111.9 0.87 0.77, 0.98
Q4 (highest) 1,462 152,124 213 33,114 74.1 94.2 0.82 0.72, 0.94
Age at screening (years)
Younger (35–44) 2,965 126,012 316 15,894 44.0 51.7 0.83 0.74, 0.93
Older (45–57) 2,881 174,635 769 57,913 121.6 147.6 0.80 0.75, 0.87
Age at screening 3 income quartile
Younger–Q1 683 4,136 80 693 48.6 69.9 0.69 0.53, 0.91
Younger–Q2 704 18,865 86 2,816 50.5 61.7 0.95 0.76, 1.20
Younger–Q3 744 36,601 86 4,948 47.2 55.6 0.90 0.72, 1.12
Younger–Q4 834 66,410 64 7,437 31.1 45.7 0.71 0.55, 0.90
Older–Q1 762 6,964 213 2,759 123.3 182.6 0.71 0.61, 0.82
Older–Q2 769 30,030 209 11,280 120.4 170.9 0.76 0.66, 0.88
Older–Q3 722 51,927 198 18,197 118.6 157.1 0.85 0.73, 0.98
Older–Q4 628 85,714 149 25,677 102.4 131.5 0.87 0.74, 1.03
Diabetic status
Not diabetic 5,738 296,361 1,027 71,220 84.4 103.1 0.82 0.77, 0.87
Diabetic 108 4,286 58 2,587 234.4 269.9 0.79 0.60, 1.04
Table continues
574 Thomas et al.
Am J Epidemiol 2005;162:569–578
by guest on June 12, 2013http://aje.oxfordjournals.org/
Dow
nloaded from

of the MRFIT data and the National Death Index search.Based on the analysis of a random sample of screenees(500 Latinos and 500 Whites), the Latinos in this studyhad Social Security numbers that were 3 percent more con-sistent than did Whites; soundex-adjusted surnames were2 percent less consistent. Because of the preeminence of theSocial Security number in the National Death Index’s searchalgorithm, we conclude that the National Death Index resultsare approximately as complete for Latinos as for Whites, andthat the low Latino/White hazard ratios are not an artifact ofinconsistent or incomplete identifying information. In orderfor the underlying crude death rates among the White andLatino screenees to be equal, an additional 351 (6.0 percent)
of the Latinos would have to have died but been missed bythe National Death Index search, which is a much greatererror rate than that found in the random sample.
We found significantly lower coronary heart disease andcardiovascular disease mortality among Latinos than Whitesbut significantly higher stroke mortality. Stroke has beenshown to be particularly dependent on deprivation in earlylife (26–28), which may be more common for first genera-tion Latino immigrants than for the general population. Thelower risk-adjusted coronary heart disease mortality couldreflect the fact that risk factors were measured only in middleage. It is becoming clear that lifetime exposure to cigarettesmoking, elevated cholesterol, and elevated blood pressure
TABLE 3. Continued
No. of menAll-causedeaths(no.)
Age-adjustedmortality ratesper 10,000*
Age-, income-,and risk-adjusted
Latino/White mortality
Latino White Latino White Latino WhiteHazardratioy
95%confidenceinterval
Smoking status
Nonsmokers 3,565 194,918 563 38,158 115.8 159.8 0.79 0.72, 0.87
Smokers 2,281 105,729 522 35,649 71.5 79.5 0.85 0.78, 0.92
Cholesterol level (mg/dl)
<200 2,191 109,662 367 23,134 80.9 96.5 0.81 0.73, 0.90
200–239 2,287 119,461 433 29,316 89.1 102.7 0.85 0.77, 0.94
�240 1,368 71,524 285 21,357 93.4 123.6 0.77 0.68, 0.86
JNC VII status§
Normal 1,142 55,926 147 9,775 67.3 79.2 0.83 0.70, 0.98
Prehypertensive 2,667 141,764 426 30,627 75.0 94.3 0.78 0.71, 0.87
Hypertensive 2,037 102,957 512 33,405 112.0 133.3 0.83 0.76, 0.91
Modified Framingham score forcoronary heart diseaserisk, by quartile{
Q1 (lowest risk) 1,750 76,170 153 6,565 35.6 34.9 0.92 0.78, 1.09
Q2 1,327 63,422 172 10,390 55.5 71.8 0.76 0.65, 0.89
Q3 1,622 92,699 353 25,559 101.3 129.2 0.80 0.72, 0.90
Q4 (highest risk) 1,147 68,356 407 31,293 155.9 217.2 0.80 0.73, 0.89
Social Security numberavailable
Yes 5,622 296,731 1,045 72,985 87.8 105.7 0.82 0.77, 0.87
No 224 3,916 40 822 77.9 81.2 0.91 0.65, 1.28
Attended second screen
Yes 238 15,753 73 6,418 139.5 182.7 0.81 0.64, 1.03
No 5,608 284,894 1,012 67,389 85.0 101.3 0.82 0.77, 0.87
* All mortality rates are age adjusted except for those of the modified Framingham risk score, which is partially determined by age.
y The p values for linear trend or categorical difference in Latino/White hazard ratios are all greater than 0.13 except for smoking, which has
a p value of 0.06, and the modified Framingham score, which has a p value of 0.01.
z Cutpoints for income quartiles are $16,623, $20,420, and $23,992 in 1980 US dollars.
§ Status according to guidelines from the seventh report of the Joint National Committee of Prevention, Detection, Evaluation, and Treatment of
High Blood Pressure (JNC VII) (43).
{ The modified Framingham risk quartiles are based on the criteria set forth by the third report of the National Cholesterol Education Program
(44). The formula is modified in that it does not take into account high density lipoprotein cholesterol.
MRFIT Latino Risk-adjusted Mortality 575
Am J Epidemiol 2005;162:569–578
by guest on June 12, 2013http://aje.oxfordjournals.org/
Dow
nloaded from

is associated with coronary heart disease risk and that adult-hood measures alone underestimate their importance (29).Thus, while the Latinos have a higher prevalence of smoking(although fewer cigarettes per day) in the early 1970s, theymay have started smoking at a later age than Whites and,thus, had a shorter and lower level of lifetime exposure tocigarette smoke; for diseases with long latency periods, thiswould be related to lower risk. Support for this comes fromthe lower lung cancer and chronic obstructive pulmonarydisease mortality among Latinos, which is unchanged byadjustment for measures of smoking in middle age. Simi-larly, blood pressure-level and cholesterol-level profilesacross the lifetime of Latinos may have been more favorablethan those of the Whites in a way that is not captured by therelative similarity of measures taken in middle age.
Combining cardiovascular disease and diabetes deathsresulted in a fully adjusted combined hazard ratio of 0.80,nearly the same as for cardiovascular disease alone. Thefavorable cardiovascular disease result is, thus, not due tosuch misclassification of cause of death.
The fully adjusted Latino/White hazard ratio for all can-cers combined was 0.69; similar hazard ratios were foundfor most site-specific cancers. In contrast, the Latino/Whitehazard ratios of 2.02 and 1.46 for liver cancer and stomachcancer, respectively, were markedly elevated. The hazardratios for chronic obstructive pulmonary disease and infec-tion were 0.62 and 1.69. Each of these hazard ratios wasconsistent with hazard ratios found in studies based on re-gional cancer registries and census population counts (6, 7)and based on the National Longitudinal Mortality Study (4).
Marmot et al. (30) showed that, for several causes of deathin various English immigrant populations, mortality rates forfirst generation immigrants were between those of Englandand their country of origin; their work underscored the long-term influence of culture and environment on health. Addi-tionally, studies of men of Japanese birth or descent living inJapan, Hawaii, and California have shown that coronaryheart disease risk factors and mortality grade between thoseof Japanese living in Japan and White Americans, withJapanese Americans living in Hawaii having intermediate
values. The risk factors and mortality of Japanese-Americanimmigrant communities approached those of White Americansonly after a few generations (31–37). For first generationLatino immigrants, the lower overall cancer and chronicobstructive pulmonary disease mortality rates seen in thisstudy may likewise reflect the long-term effects of a healthierenvironment and lifestyle in their country of origin. Like-wise, a higher rate of liver cancer, consistent with the higherrates found in Latin America, may be partially explained bythe greater incidence of hepatitis B and hepatitis C in LatinAmerican populations. Latin American countries also havemore humid climates and consequently greater contamina-tion of foods with fungus-based aflatoxins and mycotoxins,known liver carcinogens (6). A higher rate of stomach cancermay be attributed to greater rates of Helicobacter pylori in-fection (38, 39) or dietary salt. H. pylori and hepatitis B areoften acquired in childhood, through horizontal transmis-sion, and have been taken as indicators of inadequate re-sources for maintaining hygiene. This evidence of exposuresconsequent on greater early life deprivation among Latinosis also congruent with the elevated risk of stroke. Ecologicstudies have demonstrated how early life deprivation and/orgreater dietary salt intake may underlie the internationalcorrelation between stroke and stomach cancer risk (40–42).
There were no significant state-by-state variations inLatino/White mortality ratios. This supports the thesis thatLatino/White differences are due to either a healthy immi-grant phenomenon or pan-Latino social, cultural, and be-havioral factors. Latino/White hazard ratios also did nothave any statistically significant material variations byage, risk factor levels, income, or percentage of Latinos inthe ZIP code of residence.
Adjustment for ZIP code-based and census tract-basedmedian incomes had a similar effect on Latino/White hazardratios. Among the MRFIT randomized men, adjustment forpersonally reported family income rather than neighborhoodincome produced a similar effect.
Palloni and Arias (25) speculate that migrant Mexicanpopulations living farther from California or Texas wouldbe more heavily preselected for vigorous health, and they
TABLE 4. Discrepancies in identifying information between MRFIT* and the Social Security Death Index,
based on randomly selected MRFIT records matched to the Social Security Death Index through January
2004
Latinos (among 123 deaths) Whites (among 155 deaths)
Was discrepant Was notdiscrepant (no.)
Was discrepant Was notdiscrepant (no.)No. % No. %
Social Security numbery 4 3.3 119 10 6.5 145
Soundex-adjusted surname 4 3.3 119 1 0.6 154
Full first name 11 8.9 112 12 7.7 143
First initial 0 0.0 123 10 6.5 145
Month and year of birth 18 14.6 105 6 3.9 149
Exact month of birth andyear of birth (�1 year) 17 13.8 106 2 1.3 153
* MRFIT, Multiple Risk Factor Intervention Trial.
y All Social Security number discrepancies involved a single digit.
576 Thomas et al.
Am J Epidemiol 2005;162:569–578
by guest on June 12, 2013http://aje.oxfordjournals.org/
Dow
nloaded from

observe that Mexicans living outside those two states enjoyan 8 percent lower mortality rate. The all-cause mortalityhazard ratios reported here are 0.84 (95 percent CI: 0.76,0.93) in California and 0.74 (95 percent CI: 0.61, 0.90) inIllinois, with no clinical centers in Texas; these data weaklysupport their hypothesis.
Limitations of this MRFIT study include a selectionprocess that would have tended to exclude men who wereundocumented aliens. In addition, the MRFIT Latinos prob-ably included few US-born men. The MRFIT Latinos, whowere recruited in 1973–1975, may not be representative ofthe current Latino-American population. The study is alsolimited by its exclusion of women.
In conclusion, with 25-year follow-up on 5,846 Latinosand 300,647 Whites, Latinos had substantially lower risk-and income-adjusted all-cause mortality than did Whites,particularly for coronary heart disease and most cancers.Risk factor- and income-adjusted stroke, liver cancer, andinfection mortality rates were significantly higher amongLatinos, as was risk factor-adjusted diabetes, and point tothe need for culturally appropriate targeted interventions.The mortality results, both by cause and overall, did notvary significantly over time or by state and did not appearto be an artifact of return migration or poor data. These pan-Latino results may reflect a healthy immigrant phenomenon,as well as possible genetic, cultural, and environmentaldifferences. Understanding the mechanisms behind the dif-ferences may provide insights that can be used to improvethe health of all.
ACKNOWLEDGMENTS
This work was supported by National Heart, Lung, andBlood Institute grants R01-HL-43232 and R01-HL-68140.
The authors thank Gabriela Vazquez-Benitez for herassistance in compiling the US census data. They also thankDr. Karl Eschbach for sharing his insights into Latinoimmigration patterns and National Death Index matchingissues.
Conflict of interest: none declared.
REFERENCES
1. Bureau of the Census. People QuickFacts. Washington, DC:US Department of Commerce, 2005. (http://quickfacts.census.gov/qfd/states/00000.html). (Accessed January 10,2005).
2. Bureau of the Census. We the American . . . Hispanics.Washington, DC: Ethnic and Hispanic Statistics Branch,Population Division, Bureau of the Census, US Department ofCommerce, 1993:4. (http://www.census.gov/apsd/wepeople/we-2r.pdf). (Accessed June 29, 2005).
3. Rosenwaike I. Mortality differentials among persons born inCuba, Mexico, and Puerto Rico residing in the United States,1979–81. Am J Public Health 1987;77:603–6.
4. Sorlie PD, Backlund E, Johnson NJ, et al. Mortality byHispanic status in the United States. JAMA 1993;270:2464–8.
5. Liao Y, Cooper R, Cao G, et al. Mortality from coronaryheart disease and cardiovascular disease among adult U.S.Hispanics: findings from the National Health Interview Study(1986 to 1994). J Am Coll Cardiol 1997;30:1200–5.
6. Trapido EJ, Chen F, Davis K, et al. Cancer among Hispanicmales in south Florida. Arch Intern Med 1994;154:177–85.
7. Canto MT, Chu KC. Annual cancer incidence rates forHispanics in the United States: surveillance, epidemiology,and end results, 1992–1996. Cancer 2000;88:2642–52.
8. Rosenberg HM, Maurer JD, Sorlie PD, et al. Quality of deathrates by race and Hispanic origin: a summary of current re-search, 1999. Vital Health Stat 2 1999;128:1–13.
9. Hunt KJ, Resendez RG, Williams K, et al. All-cause andcardiovascular mortality among Mexican-American and non-Hispanic White older participants in the San Antonio HeartStudy—evidence against the ‘‘Hispanic paradox.’’ Am J Epi-demiol 2003;158:1048–57.
10. Swenson CJ, Trepka MJ, Rewars MJ, et al. Cardiovasculardisease mortality in Hispanics and non-Hispanic Whites. Am JEpidemiol 2002;156:919–28.
11. Neaton JD, Grimm RH, Cutler JA, et al. Recruitment ofparticipants for the Multiple Risk Factor Intervention Trial(MRFIT). Control Clin Trials 1987;8(suppl):41S–53S.
12. MRFIT Research Group. Multiple Risk Factor InterventionTrial: risk factor changes and mortality results. JAMA 1982;248:1465–77.
13. National Center for Health Statistics. National Death Index.Hyattsville, MD: National Center for Health Statistics, 1999.(http://www.cdc.gov/nchs/r&d/ndi/ndi.htm). (AccessedOctober 2, 2003).
14. National Center for Health Statistics. Obtaining state deathcertificates, 2000: state requirements for the release of deathcertificates to National Death Index users. Hyattsville, MD:National Center for Health Statistics, 2000:iii. (DHHS pub-lication no. (PHS) 00-1149).
15. Liao Y, Cooper RS, Cao G, et al. Mortality patterns amongadult Hispanics: findings from the NHIS, 1986 to 1990. Am JPublic Health 1998;8:227–32.
16. Wentworth DN, Neaton JD, Rasmussen WL. An evaluation ofthe Social Security Administration master beneficiary recordfile and the National Death Index in the ascertainment of vitalstatus. Am J Public Health 1983;73:1270–4.
17. Horm J. Assignment of probabilistic scores to National DeathIndex record matches. In: Supplement to the National DeathIndex user’s manual. Hyattsville, MD: National Center forHealth Statistics, 1999:A1–13.
18. Choe Y, Frisbie WP, Hummer RA, et al. Nativity, duration ofresidence, and the health of Hispanic adults in the UnitedStates. Int Migration Rev 2004;38:184–211.
19. Stephen EH, Foote K, Hendershot GE, et al. Health of theforeign-born population: United States, 1989–90. Adv Data1994;241:1–12.
20. Stern MP, Wei M. Do Mexican Americans really have lowrates of cardiovascular disease? Prev Med 1999;29:590–5.
21. Franzini L, Ribble JC, Keddie A. Understanding the Hispanicparadox. Ethn Dis 2001;11:496–518.
22. Pandey DK, Labarthe DR, Goff DC, et al. Community-widecoronary heart disease mortality in Mexican Americans equalsor exceeds that in non-Hispanic whites: the Corpus ChristiHeart Project. Am J Med 2001;110:81–7.
23. Hanis CL, Hewett-Emmett D, Bertin TK, et al. Origins of U.S.Hispanics: implications for diabetes. Diabetes Care 1991;14:618–27.
24. Abriado-Lanza AF, Dohrenwend BP, Ng-Mak DS, et al. TheLatino mortality paradox: a test of the ‘‘salmon bias’’ and
MRFIT Latino Risk-adjusted Mortality 577
Am J Epidemiol 2005;162:569–578
by guest on June 12, 2013http://aje.oxfordjournals.org/
Dow
nloaded from

healthy migrant hypotheses. Am J Public Health 1999;89:1543–8.
25. Palloni A, Arias E. Paradox lost: explaining the Hispanic adultmortality advantage. Demography 2004;41:385–415.
26. Galobardes B, Lynch JW, Davey Smith G. Childhood socio-economic circumstances and cause-specific mortality inadulthood: systematic review and interpretation. EpidemiolRev 2004;26:7–21.
27. Hart CL, Davey Smith G. Relation between number of siblingsand adult mortality and stroke risk: 25 year follow up of men inthe Collaborative study. J Epidemiol Community Health2003;57:385–91.
28. Davey Smith G, Hart C, Blane D, et al. Adverse socioeco-nomic conditions in childhood and cause specific adult mortal-ity: prospective observational study. BMJ 1998;316:1631–5.
29. Davey Smith G, Lynch J. Lifecourse influences on coronaryheart disease. In: Marmot MG, Elliot P, eds. Coronary heartdisease: from epidemiology to prevention. Oxford, UnitedKingdom: Oxford University Press, 2005.
30. Marmot MG, Adelstein AM, Bulusu L. Lessons from the studyof immigrant mortality. Lancet 1984;1:1455–7.
31. Gordon T. Mortality experience among the Japanese in theUnited States, Hawaii, and Japan. Public Health Rep 1957;76:543–53.
32. Keys A, Kimura N, Kusukawa A, et al. Lessons from serumcholesterol studies in Japan, Hawaii and Los Angeles. AnnIntern Med 1958;48:83–94.
33. Gordon T, Garcia-Palmieri MR, Kagan A, et al. Differences incoronary heart disease in Framingham, Honolulu and PuertoRico. J Chronic Dis 1974;27:329–44.
34. Worth RM, Kato H, Rhoads GG, et al. Epidemiologic studiesof coronary heart disease and stroke in Japanese men living inJapan, Hawaii and California: mortality. Am J Epidemiol1975;102:481–90.
35. Nichaman MZ, Hamilton HB, Kagan A, et al. Epidemio-logic studies of coronary heart disease and stroke in Japanesemen living in Japan, Hawaii and California: distribution ofbiochemical risk factors. Am J Epidemiol 1975;102:491–501.
36. Marmot MG, Syme SL, Kagan A, et al. Epidemiologic studiesof coronary heart disease and stroke in Japanese men living inJapan, Hawaii and California: prevalence of coronary andhypertensive heart disease and associated risk factors. Am JEpidemiol 1975;102:514–25.
37. Robertson TL, Kato H, Rhoads GG, et al. Epidemiologicstudies of coronary heart disease and stroke in Japanese menliving in Japan, Hawaii and California. Incidence of myocar-dial infarction and death from coronary heart disease. Am JCardiol 1977;39:239–43.
38. Goodman KJ, O’Rourke K, Day RS, et al. Helicobacter pyloriinfection in pregnant women from a U.S.–Mexico borderpopulation. J Immigr Health 2003;5:99–107.
39. Brenner H, Arndt V, Stegmaier C, et al. Is Heliobacter pyloriinfection a necessary condition of noncardia gastric cancer?Am J Epidemiol 2004;159:252–8.
40. Leon D, Davey Smith G. Infant mortality, stomach cancer,stroke, and coronary heart disease: ecological analysis. BMJ2000;320:1705–6.
41. Tsubono Y, Takahashi T, Iwase Y, et al. Nutrient consumptionand gastric cancer mortality in five regions of Japan. NutrCancer 1997;27:310–15.
42. Joossens JV, Hill MJ, Elliott P, et al. Dietary salt, nitrate andstomach cancer mortality in 24 countries. European CancerPrevention (ECP) and the INTERSALT Cooperative ResearchGroup. Int J Epidemiol 1996;25:494–504.
43. JNC VII. The seventh report of the Joint National Committeeon Prevention, Detection, Evaluation, and Treatment of HighBlood Pressure. Washington, DC: US Department of Healthand Human Services, 2004. (NIH publication no. 04-5230)(http://www.nhlbi.nih.gov/guidelines/hypertension/jnc7full.pdf).
44. Expert Panel on Detection, Evaluation, and Treatment ofHigh Blood Cholesterol in Adults. Executive summary of thethird report of the National Cholesterol Education Program(NCEP) Expert Panel on Detection, Evaluation, and Treatmentof High Blood Cholesterol in Adults (Adult Treatment PanelIII). JAMA 2001;285:2486–97.
578 Thomas et al.
Am J Epidemiol 2005;162:569–578
by guest on June 12, 2013http://aje.oxfordjournals.org/
Dow
nloaded from


![[2021] 45 IAC 3.1 Adjusted Gross Income Tax - IN.gov](https://static.fdokumen.com/doc/165x107/631ecbe61aedb9cd850feba1/2021-45-iac-31-adjusted-gross-income-tax-ingov.jpg)

