Global, regional, and national disability-adjusted life-years ...
57
http://www.diva-portal.org This is the published version of a paper published in The Lancet. Citation for the original published paper (version of record): Kassebaum, N J., Arora, M., Barber, R M., Bhutta, Z., Carter, A. et al. (2016) Global, regional, and national disability-adjusted life-years (DALYs) for 315 diseases and injuries and healthy life expectancy (HALE), 1990-2015: a systematic analysis for the Global Burden of Disease Study 2015. The Lancet, 388(10053): 1603-1658 https://doi.org/10.1016/S0140-6736(16)31460-X Access to the published version may require subscription. N.B. When citing this work, cite the original published paper. Permanent link to this version: http://urn.kb.se/resolve?urn=urn:nbn:se:du-23975
-
Upload
khangminh22 -
Category
Documents
-
view
3 -
download
0
Transcript of Global, regional, and national disability-adjusted life-years ...
http://www.diva-portal.org
This is the published version of a paper published in The Lancet.
Citation for the original published paper (version of record):
Kassebaum, N J., Arora, M., Barber, R M., Bhutta, Z., Carter, A. et al. (2016)Global, regional, and national disability-adjusted life-years (DALYs) for 315 diseases andinjuries and healthy life expectancy (HALE), 1990-2015: a systematic analysis for the GlobalBurden of Disease Study 2015.The Lancet, 388(10053): 1603-1658https://doi.org/10.1016/S0140-6736(16)31460-X
Access to the published version may require subscription.
N.B. When citing this work, cite the original published paper.
Permanent link to this version:http://urn.kb.se/resolve?urn=urn:nbn:se:du-23975
Articles
www.thelancet.com Vol 388 October 8, 2016 1603
Global, regional, and national disability-adjusted life-years (DALYs) for 315 diseases and injuries and healthy life expectancy (HALE), 1990–2015: a systematic analysis for the Global Burden of Disease Study 2015GBD 2015 DALYs and HALE Collaborators*
SummaryBackground Healthy life expectancy (HALE) and disability-adjusted life-years (DALYs) provide summary measures of health across geographies and time that can inform assessments of epidemiological patterns and health system performance, help to prioritise investments in research and development, and monitor progress toward the Sustainable Development Goals (SDGs). We aimed to provide updated HALE and DALYs for geographies worldwide and evaluate how disease burden changes with development.
Methods We used results from the Global Burden of Diseases, Injuries, and Risk Factors Study 2015 (GBD 2015) for all-cause mortality, cause-specifi c mortality, and non-fatal disease burden to derive HALE and DALYs by sex for 195 countries and territories from 1990 to 2015. We calculated DALYs by summing years of life lost (YLLs) and years of life lived with disability (YLDs) for each geography, age group, sex, and year. We estimated HALE using the Sullivan method, which draws from age-specifi c death rates and YLDs per capita. We then assessed how observed levels of DALYs and HALE diff ered from expected trends calculated with the Socio-demographic Index (SDI), a composite indicator constructed from measures of income per capita, average years of schooling, and total fertility rate.
Findings Total global DALYs remained largely unchanged from 1990 to 2015, with decreases in communicable, neonatal, maternal, and nutritional (Group 1) disease DALYs off set by increased DALYs due to non-communicable diseases (NCDs). Much of this epidemiological transition was caused by changes in population growth and ageing, but it was accelerated by widespread improvements in SDI that also correlated strongly with the increasing importance of NCDs. Both total DALYs and age-standardised DALY rates due to most Group 1 causes signifi cantly decreased by 2015, and although total burden climbed for the majority of NCDs, age-standardised DALY rates due to NCDs declined. Nonetheless, age-standardised DALY rates due to several high-burden NCDs (including osteoarthritis, drug use disorders, depression, diabetes, congenital birth defects, and skin, oral, and sense organ diseases) either increased or remained unchanged, leading to increases in their relative ranking in many geographies. From 2005 to 2015, HALE at birth increased by an average of 2·9 years (95% uncertainty interval 2·9–3·0) for men and 3·5 years (3·4–3·7) for women, while HALE at age 65 years improved by 0·85 years (0·78–0·92) and 1·2 years (1·1–1·3), respectively. Rising SDI was associated with consistently higher HALE and a somewhat smaller proportion of life spent with functional health loss; however, rising SDI was related to increases in total disability. Many countries and territories in central America and eastern sub-Saharan Africa had increasingly lower rates of disease burden than expected given their SDI. At the same time, a subset of geographies recorded a growing gap between observed and expected levels of DALYs, a trend driven mainly by rising burden due to war, interpersonal violence, and various NCDs.
Interpretation Health is improving globally, but this means more populations are spending more time with functional health loss, an absolute expansion of morbidity. The proportion of life spent in ill health decreases somewhat with increasing SDI, a relative compression of morbidity, which supports continued eff orts to elevate personal income, improve education, and limit fertility. Our analysis of DALYs and HALE and their relationship to SDI represents a robust framework on which to benchmark geography-specifi c health performance and SDG progress. Country-specifi c drivers of disease burden, particularly for causes with higher-than-expected DALYs, should inform fi nancial and research investments, prevention eff orts, health policies, and health system improvement initiatives for all countries along the development continuum.
Funding Bill & Melinda Gates Foundation.
Copyright © The Author(s). Published by Elsevier Ltd. This is an Open Access article under the CC BY license.
Lancet 2016; 388: 1603–58
This online publication has been corrected. The corrected version first appeared at thelancet.com on January 5, 2017
See Editorial page 1447
See Comment pages 1448 and 1450
*Collaborators listed at the end of the Article
Correspondence to:Prof Christopher J L Murray, 2301 5th Avenue, Suite 600, Seattle, WA 98121, [email protected]
Articles
1604 www.thelancet.com Vol 388 October 8, 2016
IntroductionSummary measures of population health are crucial inputs to guide health system investments and set priorities at global, regional, national, and subnational levels. The Millennium Development Goals (MDGs), which sought to reduce extreme poverty and improve health, expired in 2015, and were replaced by the 2030 Agenda for Sustainable Development, or Sustainable Development Goals (SDGs).1 The shift from the MDGs to the SDGs refl ects a broadening of the global development agenda,2,3 expanding to include targets for non-communicable diseases (NCDs) and indicators that consider the interplay of environmental, societal, and economic factors on health.4 Within this context, summary population health measures are advantageous because they can easily be used to show progress toward SDG 3—to “ensure healthy lives and promote well-being for all at all ages”—and provide a metric by which comparative progress on other SDGs can be monitored.5 Summary measures also provide insights into whether, as societies live longer, they spend more or less of their time with functional health loss, known as the expansion or compression of morbidity, respectively, which has profound implications for societies and the fi nancing of health systems.
Two types of population health summary measures exist: health expectancies and health gaps.6 Healthy life expectancy (HALE), which originates from Sullivan,7 provides a single summary measure of population health by weighting years lived with a measure of functional
health loss experienced before death. Many health expectancy measures have been proposed, but HALE is the only one that captures a full range of functional health loss.8–10 Health gap measures capture diff erences between a population and some normative standard such as a maximum lifespan in full health. Disability-adjusted life-years (DALY) are a widely used gap measure,6,9–11 representing the sum of years of life lost (YLLs) due to premature mortality and years lived with disability (YLDs). YLLs quantify the gap between observed mortality and a normative life expectancy,12 and YLDs capture the prevalence of conditions that lead to non-fatal health loss while accounting for the severity of those conditions. Health gap measures can be easily disaggregated to examine contributions of relative morbidity and mortality, individual diseases, injuries, and attributable risk factors.
The Global Burden of Diseases, Injuries, and Risk Factors (GBD) study is the most comprehensive source of comparable summary population health measures because of its inclusion of country-level results, uncertainty quantifi cation, and its eff ort to maximise comparability across geography, time, and across diff erent health conditions. Alternative summary health assess-ments are not as standardised or comprehensive, with studies reporting only incomplete time-series, no uncertainty measures, or only a subset of countries and causes.13–15 WHO published DALY estimates for 2 years (2000 and 2012), with 132 causes and 174 countries and
Research in context
Evidence before this study Disability-adjusted life-years (DALYs), a summary measure of population health based on estimates of premature mortality and non-fatal health loss, originated from the initial Global Burden of Disease (GBD) study in 1993. DALYs, in combination with other summary measures such as healthy life expectancy (HALE), off er relatively simple yet powerful metrics against which progress and challenges in improving disease burden and extending healthy lifespans can be eff ectively monitored over time. Published in 2012, GBD 2010 provided updated estimates of DALYs due to 291 causes and HALE in 187 countries from 1990 to 2010. GBD 2013 extended this time series to 2013, with 188 countries, and 306 causes. Novel analyses for quantifying epidemiological transitions were introduced as part of GBD 2013, enabling a comparison of shifts in years of life lost (YLLs) and years lived with disability (YLDs) with increasing levels of development. WHO has produced estimates of DALYs and HALE largely based on GBD 2010 and GBD 2013; however, modifi cations were implemented for a subset of causes, disability weights, and countries, and a normative life table of 91·9 years at birth was used for calculating YLLs.
Added value of this study For GBD 2015, we generated estimates of HALE and DALYs for 315 causes by geography, sex, and age group from 1990 to
2015 for 195 countries and territories. We constructed a summary metric referred to as the Socio-demographic Index (SDI) based on measures of income per capita, average years of schooling, and total fertility rate. We estimated SDI for each geography-year, and characterised the average relationship for each age, sex, and cause for DALYs and HALE with SDI. Using these relationships, we calculated expected levels of DALYs, life expectancy, and HALE for each geography over time. We compared observed patterns of both DALYs and HALE with those expected on the basis of SDI, allowing us to explore where health gains exceeded—or lagged behind—corresponding changes in development.
Implications Since 1990, overall health has improved in most countries, with particularly large gains occurring in the past 10 years. Although improved health means longer lifespans, it also translates to more years of functional health lost. The fraction of overall life expectancy spent in poor health is generally constant or has slightly declined in some countries, a result driven by declines in DALYs due to communicable, maternal, nutritional, and neonatal causes and increases in others, mainly non-communicable diseases. Country-specifi c drivers of disease burden, particularly when observed DALYs are higher than expected on the basis of SDI, should inform country-specifi c inquiry and action.
Articles
www.thelancet.com Vol 388 October 8, 2016 1605
without uncertainty intervals. These estimates were derived primarily from GBD 2010 results, but were modifi ed in 60 countries and for 12 cause groups separately estimated by WHO and UN agencies.13,16,17 WHO applied the same approach for GBD 2013 results and used their own life tables to produce HALE estimates for 2015.14 The European Commission (EC) and the Organisation for Economic Co-operation and Development (OECD) also reported healthy life expectancy estimates for European countries from 2004 through 2014, but these were based on self-reported health status.18,19
Here we present GBD 2015 fi ndings for DALYs and HALE, building upon updated estimates of mortality, causes of death, and non-fatal health loss.12,20 Overall analytic approaches are similar to previous GBD studies,9,10 but include new mortality and morbidity data, refi ned methods, and expanded geographies.12,20 This report supersedes all previous GBD studies on DALYs and HALE through the estimation of a complete time-series for 1990 to 2015. To facilitate a more in-depth examination of the drivers of DALY and HALE trends, we assess how HALE, along with overall and cause-specifi c DALYs, change as geographies move through the development continuum. We use this analysis to benchmark overall progress and decompose observed disease burden compared with levels expected for specifi c causes on the basis of development alone, to highlight potential areas for policy investment or further research.
MethodsOverviewDetailed methods for estimating DALYs and HALE, including analytic approaches for mortality and non-fatal health loss estimation, are provided in related pub-lications.12,20 Additional detail on GBD metrics and defi nitions are found elsewhere.21 Interactive tools are also available to explore GBD 2015 results and data sources. This analysis follows the Guidelines for Accurate and Transparent Health Estimates Reporting (GATHER), which includes recommendations on documentation of data sources, estimation methods, and statistical analysis.22,23
In brief, the GBD geographic hierarchy involves 519 total geographies within 195 countries and territories, 21 regions, and seven super-regions. This study reports results for all countries and territories. The GBD cause hierarchy has four levels of classifi cation and causes reported within each level that are mutually exclusive and collectively exhaustive. The full GBD cause list with corresponding International Classifi cation of Diseases (ICD)-9 and ICD-10 codes are available in our publications on cause-specifi c mortality12 and non-fatal health outcomes.20
Estimation of mortality and non-fatal health lossWe estimated all-cause and cause-specifi c mortality with a multistep computation process, which included systematically addressing known data challenges, such as diff erent coding schemes, diff erent age-group reporting,
variation in certifi cation, misclassifi cation of HIV/AIDS deaths in some countries, misclassifi cation of maternal HIV/AIDS deaths, and incorporation of population-based cancer registry data, before computation of cause-specifi c mortality with analytic tools such as Cause of Death Ensemble Modelling (CODEm). Each death could have only one underlying cause. Additional detail, including model specifi cations and data availability for each cause-specifi c model, can be found in the supplementary material of the GBD 2015 mortality and causes of death publication.12 We calculated normative life tables based on the lowest death rates for each age group among geographies with total populations greater than 5 million. We computed cause-specifi c YLLs by multiplying cause-specifi c deaths by the life expectancy at the age of death (ie, 86·59 years at age 0 years; 23·79 years at age 65 years) from this normative life table, and then used the GBD world population age standard to calculate age-standardised mortality rates and YLL rates.12
Our most commonly used analytic approach to estimate non-fatal health loss was DisMod-MR 2.1, a Bayesian meta-regression tool that synthesises diverse data sources to produce internally consistent estimates of incidence, prevalence, remission, and excess mortality. The use of other methods to estimate non-fatal health loss was determined by cause-specifi c data availability and epidemiological characteristics.24 Additional detail, including model specifi cations and data availability for each cause-specifi c model, can be found in the supplementary material of the GBD 2015 non-fatal publication.20 Each non-fatal sequela was estimated separately. We then applied a microsimulation framework to assess the occurrence of comorbidity in each age group, sex, geography, and year separately. Disability from comorbid conditions was apportioned to each of the contributing causes. GBD disability weights were based on population surveys with more than 60 000 respondents, and previous studies show that disability weights do not signifi cantly vary across geographies, income, or educational attainment.25,26 In this study, disability weights are invariant over geography and time, although the distribution of sequelae, and therefore the severity and cumulative disability per case of a condition, can diff er by age, sex, geography, and year.
Estimation of DALYs, HALE, and corresponding uncertaintyDALYs are the sum of YLLs and YLDs as estimated in GBD 2015 for each cause, geography, age group, sex, and year.12,20 Using methods developed by Sullivan,7 we calculated HALE by age group within abridged multiple-decrement life tables and estimates of YLDs per capita for each geography–age–sex–year from 1990 to 2015.8,10,27
For all results, we report 95% uncertainty intervals (UIs), which were derived from 1000 draws from the posterior distribution of each step in the estimation process. UIs are distinct from confi dence intervals, because confi dence
For the interactive visualisation of GBD 2015 results see http://vizhub.healthdata.org/gbd-compare/
For the data citation tool see http://ghdx.healthdata.org/gbd-data-input-sources
Articles
1606 www.thelancet.com Vol 388 October 8, 2016
intervals only capture the uncertainty associated with sampling error, whereas uncertainty intervals provide a method for propagation of uncertainty from multiple sources including sampling, model estimation, and model specifi cation. 95% UIs represent the ordinal 25th and 975th draw of the quantity of interest. For mortality and YLLs, UIs refl ect uncertainty that arises from sample sizes of studies used as data sources, adjustments to sources of all-cause mortality, parameter uncertainty in model estimation, and specifi cation uncertainty for all-cause and cause-specifi c models. For prevalence, incidence, and YLDs, UIs refl ect the uncertainty that arises from sample sizes of studies used as data sources, data adjustments from non-reference defi nitions, parameter uncertainty in model estimation, and uncertainty in the disability weights. In the absence of any direction information about the correlation between uncertainty in YLLs and YLDs, we assumed uncertainty in age-specifi c YLDs is independent of age-specifi c YLLs in DALYs and death rates in HALE.
Epidemiological transition and relationship between DALYs, HALE, and SDIWe examined the relationship between DALYs, HALE, and the Socio-demographic Index (SDI).28 SDI was constructed based on the geometric mean of three indicators: income per capita, average years of schooling among people aged 15 years or older, and the total fertility rate. SDI values were scaled to a range of 0 to 1, with 0 equalling the lowest income, lowest schooling, and highest fertility rate observed from 1980 to 2015, and 1 equalling the highest income, highest schooling, and lowest fertility rate assessed during that time. The average relationships between each summary health measure and SDI were estimated using spline regressions. These regressions were used to estimate expected values at each level of SDI. Additional detail on SDI computation and geography-specifi c SDI values are available in the appendix (pp 4–5 and pp 74–80).
Role of the funding sourceThe funder of the study had no role in study design, data collection, data analysis, data interpretation, or writing of the report. The corresponding author had full access to all the data in the study and had fi nal responsibility for the decision to submit for publication.
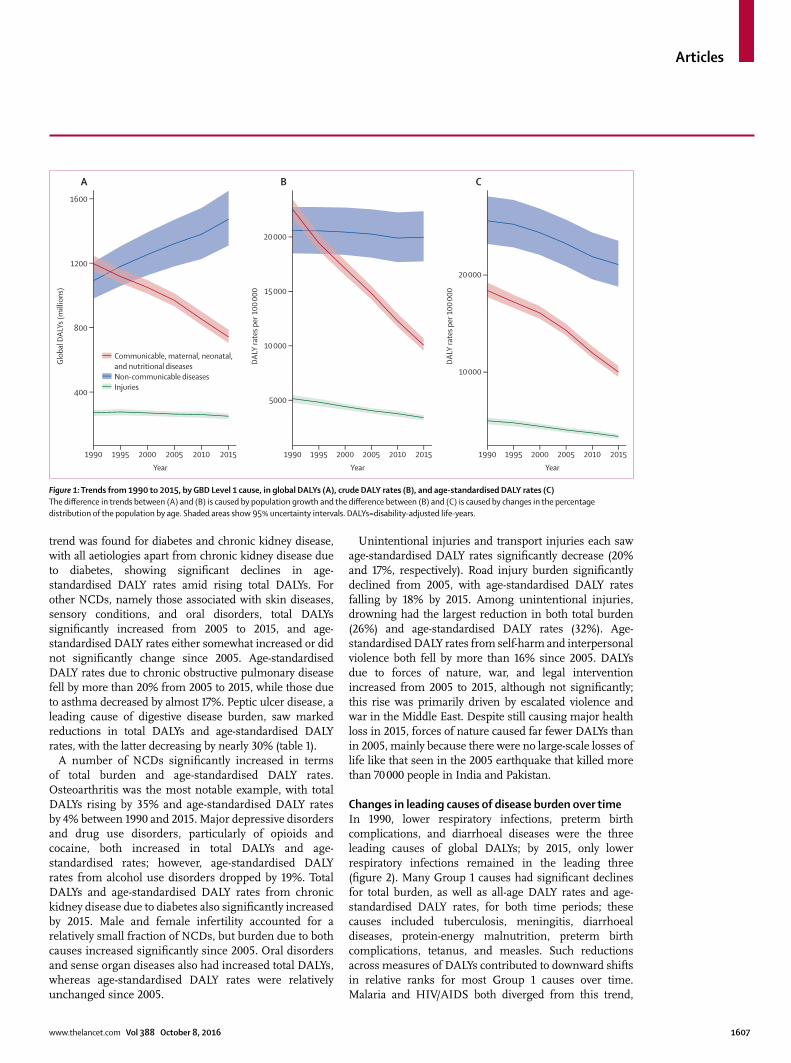
ResultsGlobal trends for DALYs and HALEWorldwide total DALYs due to Group 1 causes fell from 1·2 billion (95% CI UI 1·2–1·2) in 1990, to 741·6 million (703·9–787·7) in 2015, whereas total DALYs due to NCDs increased from 1·1 billion (1·0–1·2), to 1·5 billion (1·3–1·7; fi gure 1; table 1). Total injury DALYs were relatively unchanged between 1990 and 2015. All-age DALY rates for NCDs changed little between 1990 and 2015, whereas they declined substantially for Group 1 causes. Taking into account population ageing, DALY rates for Group 1 causes
and NCDs both decreased (fi gure 1). For injuries, reductions in all-age DALY rates and age-standardised DALY rates were similar between 1990 and 2015.
HALE at birth increased to 60·9 years for men and 64·9 years for women in 2015, rising 2·9 years and 3·5 years since 2005, respectively (table 2). The gap between life expectancy and HALE, which represents years of functional health lost, widened between 2005 and 2015 from 7·7 years to 8·1 years for men, and from 9·4 years to 10·0 years for women. Life expectancy at age 65 years was 15·5 years for men and 18·5 years for women, while HALE was 11·9 years and 14·2 years for each sex, respectively (table 2).
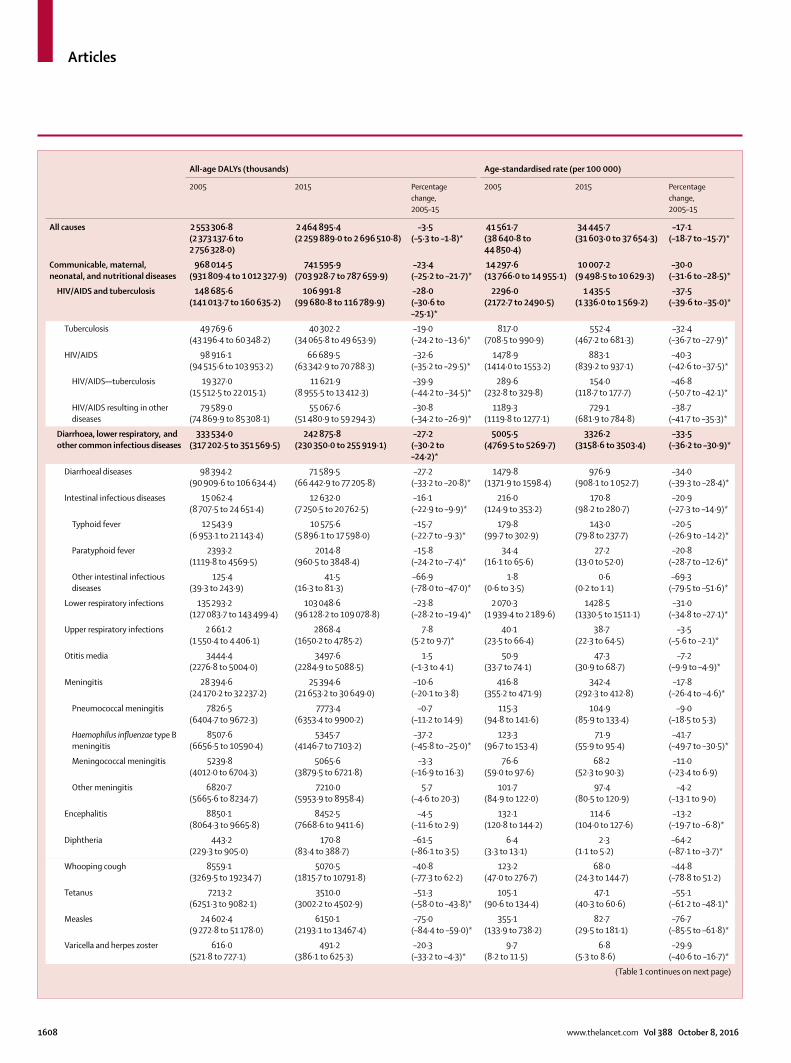
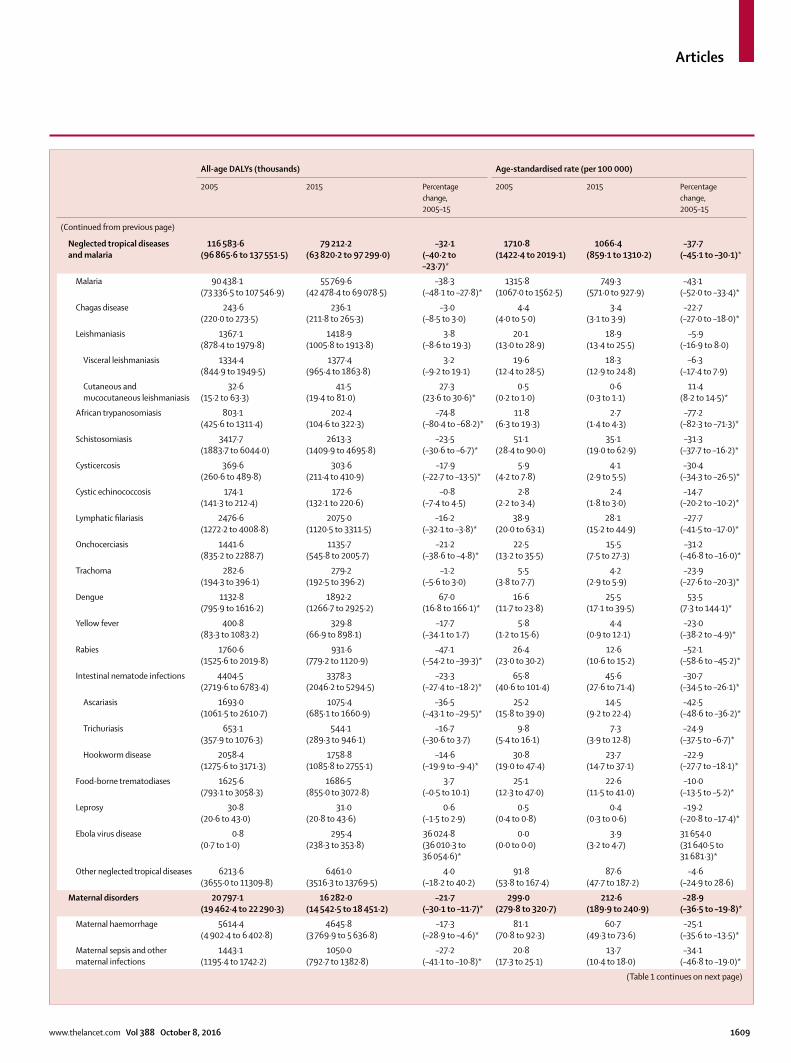
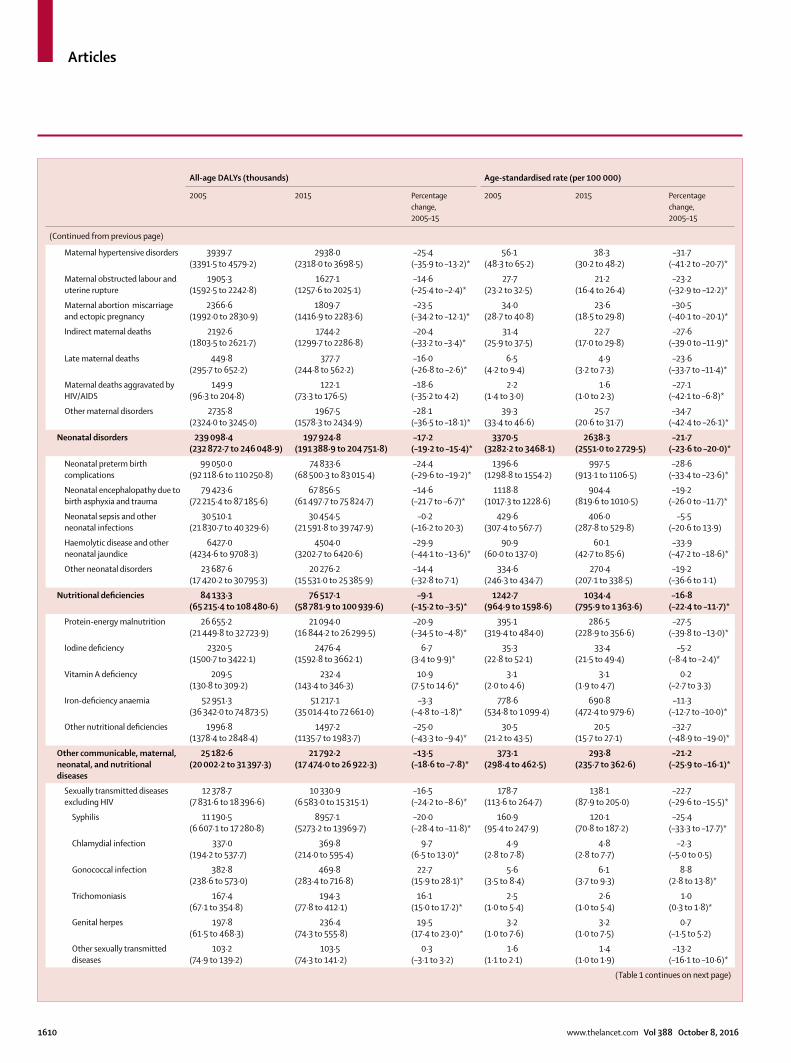
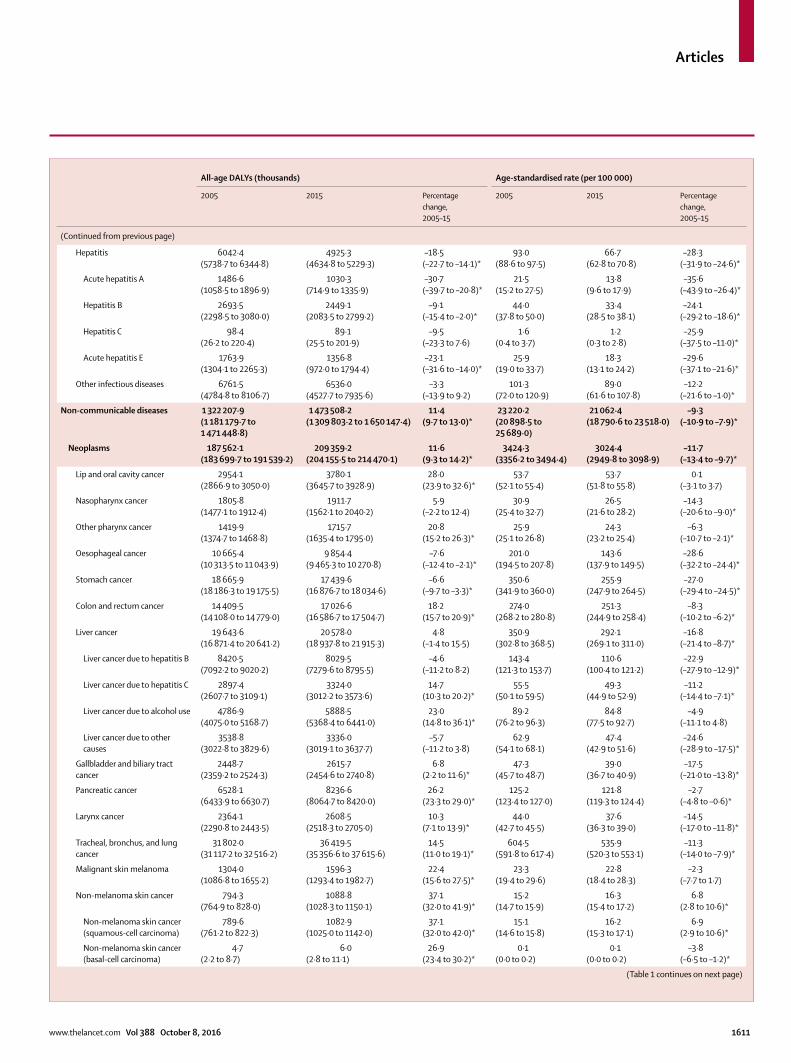
Global causes of DALYsIn 2015, Group 1 causes accounted for 30·1% (95% UI 28·6–31·7%) of global DALYs, with NCDs leading to 59·7% (57·8–61·5) and injuries to 10·1% (9·5–10·7; table 1). Since 2005, DALYs due to many of the world’s leading communicable causes substantially declined, yet burden increased for a subset of infectious diseases. Age-standardised DALY rates from HIV/AIDS and malaria each fell by more than 40% and lower respiratory infections and diarrhoeal diseases had decreases in total and age-standardised rates of DALYs of more than 20% (table 1). From 2005 to 2015, reductions in both total and age-standardised DALY rates due to tetanus and measles surpassed 50% and 70%, respectively. African trypano-somiasis, a disease targeted for elimination, saw both total DALYs and age-standardised rates fall by more than 70% since 2005. DALY rates substantially fell for all types of hepatitis, with age-standardised DALY rates from acute hepatitis A declining by more than 35% by 2015. However, both total DALYs and age-standardised DALY rates from dengue increased by more than 50%. Although the west African Ebola virus outbreak peaked in 2014,29 Ebola virus disease still caused substantial DALYs in 2015 (table 1). Maternal disorders signifi cantly declined from 2005 to 2015, with total DALYs and age-standardised rates each falling by more than 20%. Reductions in the global burden of neonatal disorders were somewhat less pronounced; for instance, the number of DALYs due to neonatal sepsis was largely unchanged (table 1).
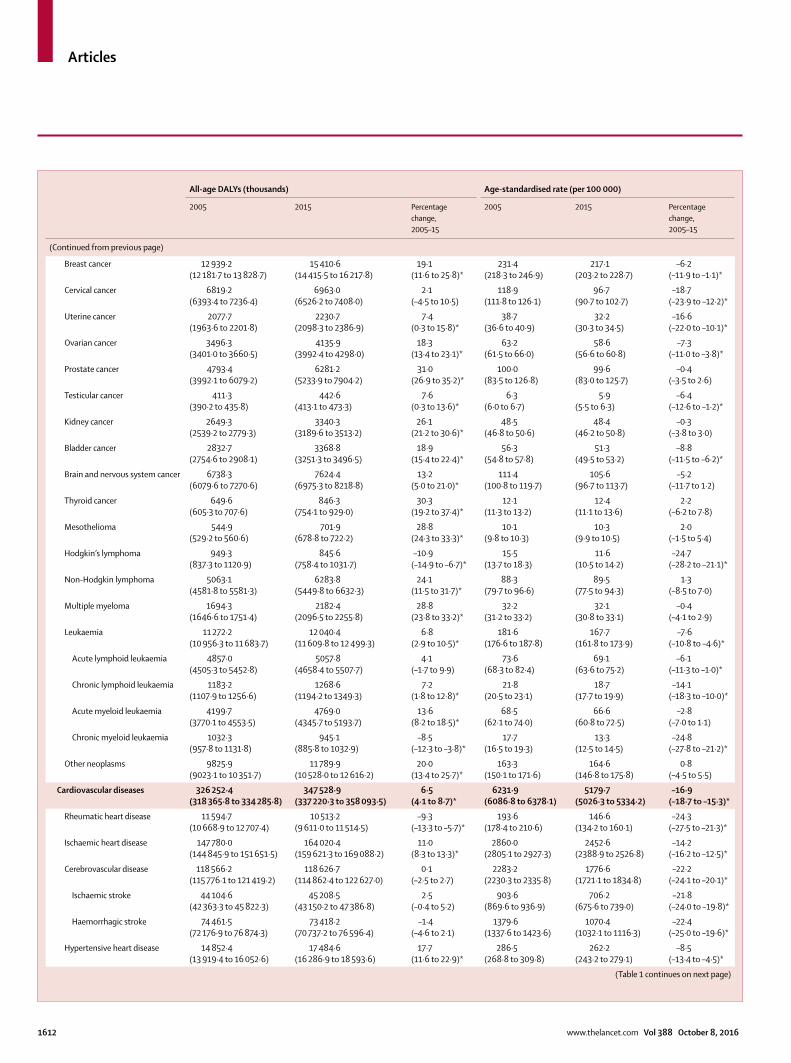
In 2015, cardiovascular diseases, cancers, and mental and substance use disorders were among the leading causes of NCD burden (table 1). For many NCDs, including most cardiovascular causes and most cancers, total DALYs increased but age-standardised DALY rates declined. Nearly all neurological disorders increased in total DALYs, including Alzheimer’s disease and other dementias, which rose by more than 30%, whereas age-standardised rates either moderately decreased (eg, Alzheimer’s disease and other dementias) or were relatively unchanged (eg, Parkinson’s disease). Total DALYs from low back and neck pain also increased, rising by more than 17%. Cirrhosis caused more DALYs in 2015 than in 2005, although age-standardised DALY rates signifi cantly fell. A similar overall
See Online for appendix
Articles
www.thelancet.com Vol 388 October 8, 2016 1607
trend was found for diabetes and chronic kidney disease, with all aetiologies apart from chronic kidney disease due to diabetes, showing signifi cant declines in age-standardised DALY rates amid rising total DALYs. For other NCDs, namely those associated with skin diseases, sensory conditions, and oral disorders, total DALYs signifi cantly increased from 2005 to 2015, and age-standardised DALY rates either somewhat increased or did not signifi cantly change since 2005. Age-standardised DALY rates due to chronic obstructive pulmonary disease fell by more than 20% from 2005 to 2015, while those due to asthma decreased by almost 17%. Peptic ulcer disease, a leading cause of digestive disease burden, saw marked reductions in total DALYs and age-standardised DALY rates, with the latter decreasing by nearly 30% (table 1).
A number of NCDs signifi cantly increased in terms of total burden and age-standardised DALY rates. Osteoarthritis was the most notable example, with total DALYs rising by 35% and age-standardised DALY rates by 4% between 1990 and 2015. Major depressive disorders and drug use disorders, particularly of opioids and cocaine, both increased in total DALYs and age-standardised rates; however, age-standardised DALY rates from alcohol use disorders dropped by 19%. Total DALYs and age-standardised DALY rates from chronic kidney disease due to diabetes also signifi cantly increased by 2015. Male and female infertility accounted for a relatively small fraction of NCDs, but burden due to both causes increased signifi cantly since 2005. Oral disorders and sense organ diseases also had increased total DALYs, whereas age-standardised DALY rates were relatively unchanged since 2005.
Unintentional injuries and transport injuries each saw age-standardised DALY rates signifi cantly decrease (20% and 17%, respectively). Road injury burden signifi cantly declined from 2005, with age-standardised DALY rates falling by 18% by 2015. Among unintentional injuries, drowning had the largest reduction in both total burden (26%) and age-standardised DALY rates (32%). Age-standardised DALY rates from self-harm and interpersonal violence both fell by more than 16% since 2005. DALYs due to forces of nature, war, and legal intervention increased from 2005 to 2015, although not signifi cantly; this rise was primarily driven by escalated violence and war in the Middle East. Despite still causing major health loss in 2015, forces of nature caused far fewer DALYs than in 2005, mainly because there were no large-scale losses of life like that seen in the 2005 earthquake that killed more than 70 000 people in India and Pakistan.
Changes in leading causes of disease burden over timeIn 1990, lower respiratory infections, preterm birth complications, and diarrhoeal diseases were the three leading causes of global DALYs; by 2015, only lower respiratory infections remained in the leading three (fi gure 2). Many Group 1 causes had signifi cant declines for total burden, as well as all-age DALY rates and age-standardised DALY rates, for both time periods; these causes included tuberculosis, meningitis, diarrhoeal diseases, protein-energy malnutrition, preterm birth complications, tetanus, and measles. Such reductions across measures of DALYs contributed to downward shifts in relative ranks for most Group 1 causes over time. Malaria and HIV/AIDS both diverged from this trend,
Figure 1: Trends from 1990 to 2015, by GBD Level 1 cause, in global DALYs (A), crude DALY rates (B), and age-standardised DALY rates (C)The diff erence in trends between (A) and (B) is caused by population growth and the diff erence between (B) and (C) is caused by changes in the percentage distribution of the population by age. Shaded areas show 95% uncertainty intervals. DALYs=disability-adjusted life-years.
1990 1995 2000 2005 2010 2015
400
800
1200
1600
Glob
al D
ALYs
(mill
ions
)
Year1990 1995 2000 2005 2010 2015
5000
10 000
15 000
20 000
DALY
rate
s per
100
000
Year1990 1995 2000 2005 2010 2015
10 000
20 000
A B C
DALY
rate
s per
100
000
Year
Communicable, maternal, neonatal, and nutritional diseasesNon-communicable diseasesInjuries
Articles
1608 www.thelancet.com Vol 388 October 8, 2016
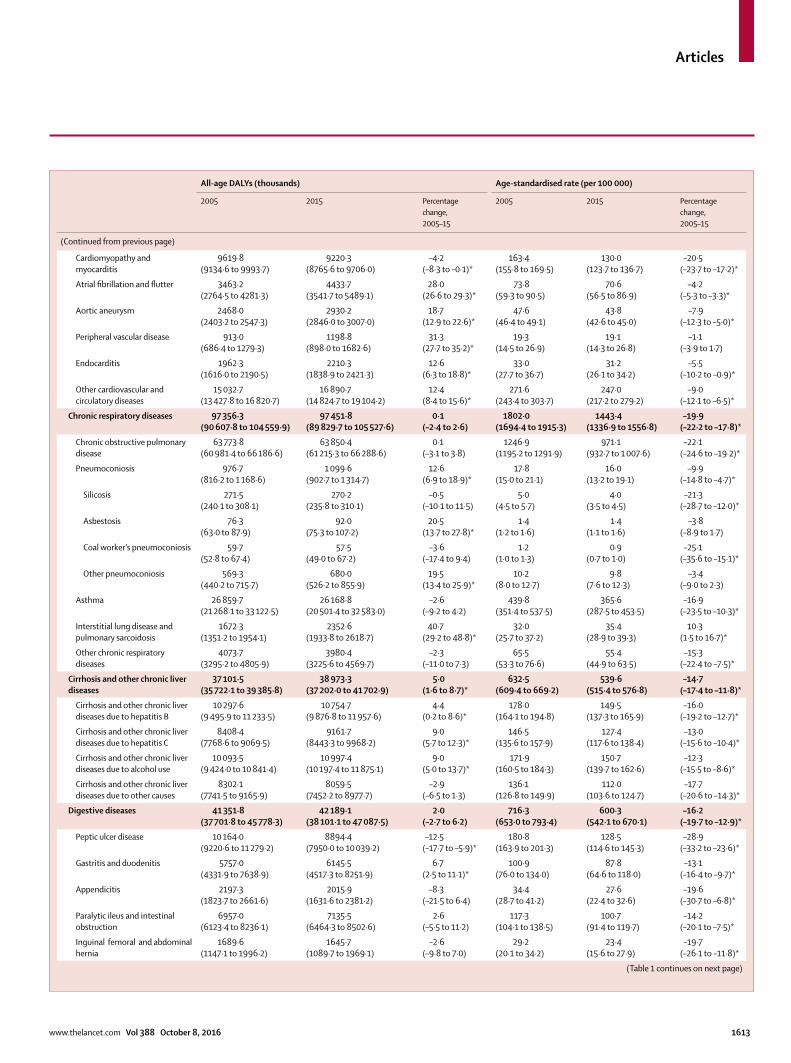
All-age DALYs (thousands) Age-standardised rate (per 100 000)
2005 2015 Percentage change,2005–15
2005 2015 Percentage change,2005–15
All causes 2 553 306·8(2 373 137·6 to 2 756 328·0)
2 464 895·4(2 259 889·0 to 2 696 510·8)
–3·5(–5·3 to –1·8)*
41 561·7(38 640·8 to 44 850·4)
34 445·7(31 603·0 to 37 654·3)
–17·1(–18·7 to –15·7)*
Communicable, maternal, neonatal, and nutritional diseases
968 014·5(931 809·4 to 1 012 327·9)
741 595·9(703 928·7 to 787 659·9)
–23·4(–25·2 to –21·7)*
14 297·6(13 766·0 to 14 955·1)
10 007·2(9 498·5 to 10 629·3)
–30·0(–31·6 to –28·5)*
HIV/AIDS and tuberculosis 148 685·6(141 013·7 to 160 635·2)
106 991·8(99 680·8 to 116 789·9)
–28·0(–30·6 to –25·1)*
2296·0(2172·7 to 2490·5)
1 435·5(1 336·0 to 1 569·2)
–37·5(–39·6 to –35·0)*
Tuberculosis 49 769·6(43 196·4 to 60 348·2)
40 302·2(34 065·8 to 49 653·9)
–19·0(–24·2 to –13·6)*
817·0(708·5 to 990·9)
552·4(467·2 to 681·3)
–32·4(–36·7 to –27·9)*
HIV/AIDS 98 916·1(94 515·6 to 103 953·2)
66 689·5(63 342·9 to 70 788·3)
–32·6(–35·2 to –29·5)*
1478·9(1414·0 to 1553·2)
883·1(839·2 to 937·1)
–40·3(–42·6 to –37·5)*
HIV/AIDS—tuberculosis 19 327·0(15 512·5 to 22 015·1)
11 621·9(8 955·5 to 13 412·3)
–39·9(–44·2 to –34·5)*
289·6(232·8 to 329·8)
154·0(118·7 to 177·7)
–46·8(–50·7 to –42·1)*
HIV/AIDS resulting in other diseases
79 589·0(74 869·9 to 85 308·1)
55 067·6(51 480·9 to 59 294·3)
–30·8(–34·2 to –26·9)*
1189·3(1119·8 to 1277·1)
729·1(681·9 to 784·8)
–38·7(–41·7 to –35·3)*
Diarrhoea, lower respiratory, and other common infectious diseases
333 534·0(317 202·5 to 351 569·5)
242 875·8(230 350·0 to 255 919·1)
–27·2(–30·2 to –24·2)*
5005·5(4769·5 to 5269·7)
3326·2(3158·6 to 3503·4)
–33·5(–36·2 to –30·9)*
Diarrhoeal diseases 98 394·2(90 909·6 to 106 634·4)
71 589·5(66 442·9 to 77 205·8)
–27·2(–33·2 to –20·8)*
1479·8(1371·9 to 1598·4)
976·9(908·1 to 1 052·7)
–34·0(–39·3 to –28·4)*
Intestinal infectious diseases 15 062·4(8 707·5 to 24 651·4)
12 632·0(7 250·5 to 20 762·5)
–16·1(–22·9 to –9·9)*
216·0(124·9 to 353·2)
170·8(98·2 to 280·7)
–20·9(–27·3 to –14·9)*
Typhoid fever 12 543·9(6 953·1 to 21 143·4)
10 575·6(5 896·1 to 17 598·0)
–15·7(–22·7 to –9·3)*
179·8(99·7 to 302·9)
143·0(79·8 to 237·7)
–20·5(–26·9 to –14·2)*
Paratyphoid fever 2393·2(1119·8 to 4569·5)
2014·8(960·5 to 3848·4)
–15·8(–24·2 to –7·4)*
34·4(16·1 to 65·6)
27·2(13·0 to 52·0)
–20·8(–28·7 to –12·6)*
Other intestinal infectious diseases
125·4(39·3 to 243·9)
41·5(16·3 to 81·3)
–66·9(–78·0 to –47·0)*
1·8(0·6 to 3·5)
0·6(0·2 to 1·1)
–69·3(–79·5 to –51·6)*
Lower respiratory infections 135 293·2(127 083·7 to 143 499·4)
103 048·6(96 128·2 to 109 078·8)
–23·8(–28·2 to –19·4)*
2 070·3(1 939·4 to 2 189·6)
1428·5(1330·5 to 1511·1)
–31·0(–34·8 to –27·1)*
Upper respiratory infections 2 661·2(1 550·4 to 4 406·1)
2868·4(1650·2 to 4785·2)
7·8(5·2 to 9·7)*
40·1(23·5 to 66·4)
38·7(22·3 to 64·5)
–3·5(–5·6 to –2·1)*
Otitis media 3444·4(2276·8 to 5004·0)
3497·6(2284·9 to 5088·5)
1·5(–1·3 to 4·1)
50·9(33·7 to 74·1)
47·3(30·9 to 68·7)
–7·2(–9·9 to –4·9)*
Meningitis 28 394·6(24 170·2 to 32 237·2)
25 394·6(21 653·2 to 30 649·0)
–10·6(–20·1 to 3·8)
416·8(355·2 to 471·9)
342·4(292·3 to 412·8)
–17·8(–26·4 to –4·6)*
Pneumococcal meningitis 7826·5(6404·7 to 9672·3)
7773·4(6353·4 to 9900·2)
–0·7(–11·2 to 14·9)
115·3(94·8 to 141·6)
104·9(85·9 to 133·4)
–9·0(–18·5 to 5·3)
Haemophilus infl uenzae type B meningitis
8507·6(6656·5 to 10590·4)
5345·7(4146·7 to 7103·2)
–37·2(–45·8 to –25·0)*
123·3(96·7 to 153·4)
71·9(55·9 to 95·4)
–41·7(–49·7 to –30·5)*
Meningococcal meningitis 5239·8(4012·0 to 6704·3)
5065·6(3879·5 to 6721·8)
–3·3(–16·9 to 16·3)
76·6(59·0 to 97·6)
68·2(52·3 to 90·3)
–11·0(–23·4 to 6·9)
Other meningitis 6820·7(5665·6 to 8234·7)
7210·0(5953·9 to 8958·4)
5·7(–4·6 to 20·3)
101·7(84·9 to 122·0)
97·4(80·5 to 120·9)
–4·2(–13·1 to 9·0)
Encephalitis 8850·1(8064·3 to 9665·8)
8452·5(7668·6 to 9411·6)
–4·5(–11·6 to 2·9)
132·1(120·8 to 144·2)
114·6(104·0 to 127·6)
–13·2(–19·7 to –6·8)*
Diphtheria 443·2(229·3 to 905·0)
170·8(83·4 to 388·7)
–61·5(–86·1 to 3·5)
6·4(3·3 to 13·1)
2·3(1·1 to 5·2)
–64·2(–87·1 to –3·7)*
Whooping cough 8559·1(3269·5 to 19234·7)
5070·5(1815·7 to 10791·8)
–40·8(–77·3 to 62·2)
123·2(47·0 to 276·7)
68·0(24·3 to 144·7)
–44·8(–78·8 to 51·2)
Tetanus 7213·2(6251·3 to 9082·1)
3510·0(3002·2 to 4502·9)
–51·3(–58·0 to –43·8)*
105·1(90·6 to 134·4)
47·1(40·3 to 60·6)
–55·1(–61·2 to –48·1)*
Measles 24 602·4(9 272·8 to 51 178·0)
6150·1(2193·1 to 13467·4)
–75·0(–84·4 to –59·0)*
355·1(133·9 to 738·2)
82·7(29·5 to 181·1)
–76·7(–85·5 to –61·8)*
Varicella and herpes zoster 616·0(521·8 to 727·1)
491·2(386·1 to 625·3)
–20·3(–33·2 to –4·3)*
9·7(8·2 to 11·5)
6·8(5·3 to 8·6)
–29·9(–40·6 to –16·7)*
(Table 1 continues on next page)
Articles
www.thelancet.com Vol 388 October 8, 2016 1609
All-age DALYs (thousands) Age-standardised rate (per 100 000)
2005 2015 Percentage change,2005–15
2005 2015 Percentage change,2005–15
(Continued from previous page)
Neglected tropical diseases and malaria
116 583·6(96 865·6 to 137 551·5)
79 212·2(63 820·2 to 97 299·0)
–32·1(–40·2 to –23·7)*
1710·8(1422·4 to 2019·1)
1066·4(859·1 to 1310·2)
–37·7(–45·1 to –30·1)*
Malaria 90 438·1(73 336·5 to 107 546·9)
55 769·6(42 478·4 to 69 078·5)
–38·3(–48·1 to –27·8)*
1315·8(1067·0 to 1562·5)
749·3(571·0 to 927·9)
–43·1(–52·0 to –33·4)*
Chagas disease 243·6(220·0 to 273·5)
236·1(211·8 to 265·3)
–3·0(–8·5 to 3·0)
4·4(4·0 to 5·0)
3·4(3·1 to 3·9)
–22·7(–27·0 to –18·0)*
Leishmaniasis 1367·1(878·4 to 1979·8)
1418·9(1005·8 to 1913·8)
3·8(–8·6 to 19·3)
20·1(13·0 to 28·9)
18·9(13·4 to 25·5)
–5·9(–16·9 to 8·0)
Visceral leishmaniasis 1334·4(844·9 to 1949·5)
1377·4(965·4 to 1863·8)
3·2(–9·2 to 19·1)
19·6(12·4 to 28·5)
18·3(12·9 to 24·8)
–6·3(–17·4 to 7·9)
Cutaneous and mucocutaneous leishmaniasis
32·6(15·2 to 63·3)
41·5(19·4 to 81·0)
27·3(23·6 to 30·6)*
0·5(0·2 to 1·0)
0·6(0·3 to 1·1)
11·4(8·2 to 14·5)*
African trypanosomiasis 803·1(425·6 to 1311·4)
202·4(104·6 to 322·3)
–74·8(–80·4 to –68·2)*
11·8(6·3 to 19·3)
2·7(1·4 to 4·3)
–77·2(–82·3 to –71·3)*
Schistosomiasis 3417·7(1883·7 to 6044·0)
2613·3(1409·9 to 4695·8)
–23·5(–30·6 to –6·7)*
51·1(28·4 to 90·0)
35·1(19·0 to 62·9)
–31·3(–37·7 to –16·2)*
Cysticercosis 369·6(260·6 to 489·8)
303·6(211·4 to 410·9)
–17·9(–22·7 to –13·5)*
5·9(4·2 to 7·8)
4·1(2·9 to 5·5)
–30·4(–34·3 to –26·5)*
Cystic echinococcosis 174·1(141·3 to 212·4)
172·6(132·1 to 220·6)
–0·8(–7·4 to 4·5)
2·8(2·2 to 3·4)
2·4(1·8 to 3·0)
–14·7(–20·2 to –10·2)*
Lymphatic fi lariasis 2476·6(1272·2 to 4008·8)
2075·0(1120·5 to 3311·5)
–16·2(–32·1 to –3·8)*
38·9(20·0 to 63·1)
28·1(15·2 to 44·9)
–27·7(–41·5 to –17·0)*
Onchocerciasis 1441·6(835·2 to 2288·7)
1135·7(545·8 to 2005·7)
–21·2(–38·6 to –4·8)*
22·5(13·2 to 35·5)
15·5(7·5 to 27·3)
–31·2(–46·8 to –16·0)*
Trachoma 282·6(194·3 to 396·1)
279·2(192·5 to 396·2)
–1·2(–5·6 to 3·0)
5·5(3·8 to 7·7)
4·2(2·9 to 5·9)
–23·9(–27·6 to –20·3)*
Dengue 1132·8(795·9 to 1616·2)
1892·2(1266·7 to 2925·2)
67·0(16·8 to 166·1)*
16·6(11·7 to 23·8)
25·5(17·1 to 39·5)
53·5(7·3 to 144·1)*
Yellow fever 400·8(83·3 to 1083·2)
329·8(66·9 to 898·1)
–17·7(–34·1 to 1·7)
5·8(1·2 to 15·6)
4·4(0·9 to 12·1)
–23·0(–38·2 to –4·9)*
Rabies 1760·6(1525·6 to 2019·8)
931·6(779·2 to 1120·9)
–47·1(–54·2 to –39·3)*
26·4(23·0 to 30·2)
12·6(10·6 to 15·2)
–52·1(–58·6 to –45·2)*
Intestinal nematode infections 4404·5(2719·6 to 6783·4)
3378·3(2046·2 to 5294·5)
–23·3(–27·4 to –18·2)*
65·8(40·6 to 101·4)
45·6(27·6 to 71·4)
–30·7(–34·5 to –26·1)*
Ascariasis 1693·0(1061·5 to 2610·7)
1075·4(685·1 to 1660·9)
–36·5(–43·1 to –29·5)*
25·2(15·8 to 39·0)
14·5(9·2 to 22·4)
–42·5(–48·6 to –36·2)*
Trichuriasis 653·1(357·9 to 1076·3)
544·1(289·3 to 946·1)
–16·7(–30·6 to 3·7)
9·8(5·4 to 16·1)
7·3(3·9 to 12·8)
–24·9(–37·5 to –6·7)*
Hookworm disease 2058·4(1275·6 to 3171·3)
1758·8(1085·8 to 2755·1)
–14·6(–19·9 to –9·4)*
30·8(19·0 to 47·4)
23·7(14·7 to 37·1)
–22·9(–27·7 to –18·1)*
Food-borne trematodiases 1625·6(793·1 to 3058·3)
1686·5(855·0 to 3072·8)
3·7(–0·5 to 10·1)
25·1(12·3 to 47·0)
22·6(11·5 to 41·0)
–10·0(–13·5 to –5·2)*
Leprosy 30·8(20·6 to 43·0)
31·0(20·8 to 43·6)
0·6(–1·5 to 2·9)
0·5(0·4 to 0·8)
0·4(0·3 to 0·6)
–19·2(–20·8 to –17·4)*
Ebola virus disease 0·8(0·7 to 1·0)
295·4(238·3 to 353·8)
36 024·8(36 010·3 to 36 054·6)*
0·0(0·0 to 0·0)
3·9(3·2 to 4·7)
31 654·0(31 640·5 to 31 681·3)*
Other neglected tropical diseases 6213·6(3655·0 to 11309·8)
6461·0(3516·3 to 13769·5)
4·0(–18·2 to 40·2)
91·8(53·8 to 167·4)
87·6(47·7 to 187·2)
–4·6(–24·9 to 28·6)
Maternal disorders 20 797·1(19 462·4 to 22 290·3)
16 282·0(14 542·5 to 18 451·2)
–21·7(–30·1 to –11·7)*
299·0(279·8 to 320·7)
212·6(189·9 to 240·9)
–28·9(–36·5 to –19·8)*
Maternal haemorrhage 5614·4(4 902·4 to 6 402·8)
4645·8(3 769·9 to 5 636·8)
–17·3(–28·9 to –4·6)*
81·1(70·8 to 92·3)
60·7(49·3 to 73·6)
–25·1(–35·6 to –13·5)*
Maternal sepsis and other maternal infections
1443·1(1195·4 to 1742·2)
1050·0(792·7 to 1382·8)
–27·2(–41·1 to –10·8)*
20·8(17·3 to 25·1)
13·7(10·4 to 18·0)
–34·1(–46·8 to –19·0)*
(Table 1 continues on next page)
Articles
1610 www.thelancet.com Vol 388 October 8, 2016
All-age DALYs (thousands) Age-standardised rate (per 100 000)
2005 2015 Percentage change,2005–15
2005 2015 Percentage change,2005–15
(Continued from previous page)
Maternal hypertensive disorders 3939·7(3391·5 to 4579·2)
2938·0(2318·0 to 3698·5)
–25·4(–35·9 to –13·2)*
56·1(48·3 to 65·2)
38·3(30·2 to 48·2)
–31·7(–41·2 to –20·7)*
Maternal obstructed labour and uterine rupture
1905·3(1592·5 to 2242·8)
1627·1(1257·6 to 2025·1)
–14·6(–25·4 to –2·4)*
27·7(23·2 to 32·5)
21·2(16·4 to 26·4)
–23·2(–32·9 to –12·2)*
Maternal abortion miscarriage and ectopic pregnancy
2366·6(1992·0 to 2830·9)
1809·7(1416·9 to 2283·6)
–23·5(–34·2 to –12·1)*
34·0(28·7 to 40·8)
23·6(18·5 to 29·8)
–30·5(–40·1 to –20·1)*
Indirect maternal deaths 2192·6(1803·5 to 2621·7)
1744·2(1299·7 to 2286·8)
–20·4(–33·2 to –3·4)*
31·4(25·9 to 37·5)
22·7(17·0 to 29·8)
–27·6(–39·0 to –11·9)*
Late maternal deaths 449·8(295·7 to 652·2)
377·7(244·8 to 562·2)
–16·0(–26·8 to –2·6)*
6·5(4·2 to 9·4)
4·9(3·2 to 7·3)
–23·6(–33·7 to –11·4)*
Maternal deaths aggravated by HIV/AIDS
149·9(96·3 to 204·8)
122·1(73·3 to 176·5)
–18·6(–35·2 to 4·2)
2·2(1·4 to 3·0)
1·6(1·0 to 2·3)
–27·1(–42·1 to –6·8)*
Other maternal disorders 2735·8(2324·0 to 3245·0)
1967·5(1578·3 to 2434·9)
–28·1(–36·5 to –18·1)*
39·3(33·4 to 46·6)
25·7(20·6 to 31·7)
–34·7(–42·4 to –26·1)*
Neonatal disorders 239 098·4(232 872·7 to 246 048·9)
197 924·8(191 388·9 to 204 751·8)
–17·2(–19·2 to –15·4)*
3370·5(3282·2 to 3468·1)
2638·3(2551·0 to 2 729·5)
–21·7(–23·6 to –20·0)*
Neonatal preterm birth complications
99 050·0(92 118·6 to 110 250·8)
74 833·6(68 500·3 to 83 015·4)
–24·4(–29·6 to –19·2)*
1396·6(1298·8 to 1554·2)
997·5(913·1 to 1106·5)
–28·6(–33·4 to –23·6)*
Neonatal encephalopathy due to birth asphyxia and trauma
79 423·6(72 215·4 to 87 185·6)
67 856·5(61 497·7 to 75 824·7)
–14·6(–21·7 to –6·7)*
1118·8(1017·3 to 1228·6)
904·4(819·6 to 1010·5)
–19·2(–26·0 to –11·7)*
Neonatal sepsis and other neonatal infections
30 510·1(21 830·7 to 40 329·6)
30 454·5(21 591·8 to 39 747·9)
–0·2(–16·2 to 20·3)
429·6(307·4 to 567·7)
406·0(287·8 to 529·8)
–5·5(–20·6 to 13·9)
Haemolytic disease and other neonatal jaundice
6427·0(4234·6 to 9708·3)
4504·0(3202·7 to 6420·6)
–29·9(–44·1 to –13·6)*
90·9(60·0 to 137·0)
60·1(42·7 to 85·6)
–33·9(–47·2 to –18·6)*
Other neonatal disorders 23 687·6(17 420·2 to 30 795·3)
20 276·2(15 531·0 to 25 385·9)
–14·4(–32·8 to 7·1)
334·6(246·3 to 434·7)
270·4(207·1 to 338·5)
–19·2(–36·6 to 1·1)
Nutritional defi ciencies 84 133·3(65 215·4 to 108 480·6)
76 517·1(58 781·9 to 100 939·6)
–9·1(–15·2 to –3·5)*
1242·7(964·9 to 1598·6)
1034·4(795·9 to 1 363·6)
–16·8(–22·4 to –11·7)*
Protein-energy malnutrition 26 655·2(21 449·8 to 32 723·9)
21 094·0(16 844·2 to 26 299·5)
–20·9(–34·5 to –4·8)*
395·1(319·4 to 484·0)
286·5(228·9 to 356·6)
–27·5(–39·8 to –13·0)*
Iodine defi ciency 2320·5(1500·7 to 3422·1)
2476·4(1592·8 to 3662·1)
6·7(3·4 to 9·9)*
35·3(22·8 to 52·1)
33·4(21·5 to 49·4)
–5·2(–8·4 to –2·4)*
Vitamin A defi ciency 209·5(130·8 to 309·2)
232·4(143·4 to 346·3)
10·9(7·5 to 14·6)*
3·1(2·0 to 4·6)
3·1(1·9 to 4·7)
0·2(–2·7 to 3·3)
Iron-defi ciency anaemia 52 951·3(36 342·0 to 74 873·5)
51 217·1(35 014·4 to 72 661·0)
–3·3(–4·8 to –1·8)*
778·6(534·8 to 1 099·4)
690·8(472·4 to 979·6)
–11·3(–12·7 to –10·0)*
Other nutritional defi ciencies 1996·8(1378·4 to 2848·4)
1497·2(1135·7 to 1983·7)
–25·0(–43·3 to –9·4)*
30·5(21·2 to 43·5)
20·5(15·7 to 27·1)
–32·7(–48·9 to –19·0)*
Other communicable, maternal, neonatal, and nutritional diseases
25 182·6(20 002·2 to 31 397·3)
21 792·2(17 474·0 to 26 922·3)
–13·5(–18·6 to –7·8)*
373·1(298·4 to 462·5)
293·8(235·7 to 362·6)
–21·2(–25·9 to –16·1)*
Sexually transmitted diseases excluding HIV
12 378·7(7 831·6 to 18 396·6)
10 330·9(6 583·0 to 15 315·1)
–16·5(–24·2 to –8·6)*
178·7(113·6 to 264·7)
138·1(87·9 to 205·0)
–22·7(–29·6 to –15·5)*
Syphilis 11 190·5(6 607·1 to 17 280·8)
8957·1(5273·2 to 13969·7)
–20·0(–28·4 to –11·8)*
160·9(95·4 to 247·9)
120·1(70·8 to 187·2)
–25·4(–33·3 to –17·7)*
Chlamydial infection 337·0(194·2 to 537·7)
369·8(214·0 to 595·4)
9·7(6·5 to 13·0)*
4·9(2·8 to 7·8)
4·8(2·8 to 7·7)
–2·3(–5·0 to 0·5)
Gonococcal infection 382·8(238·6 to 573·0)
469·8(283·4 to 716·8)
22·7(15·9 to 28·1)*
5·6(3·5 to 8·4)
6·1(3·7 to 9·3)
8·8(2·8 to 13·8)*
Trichomoniasis 167·4(67·1 to 354·8)
194·3(77·8 to 412·1)
16·1(15·0 to 17·2)*
2·5(1·0 to 5·4)
2·6(1·0 to 5·4)
1·0(0·3 to 1·8)*
Genital herpes 197·8(61·5 to 468·3)
236·4(74·3 to 555·8)
19·5(17·4 to 23·0)*
3·2(1·0 to 7·6)
3·2(1·0 to 7·5)
0·7(–1·5 to 5·2)
Other sexually transmitted diseases
103·2(74·9 to 139·2)
103·5(74·3 to 141·2)
0·3(–3·1 to 3·2)
1·6(1·1 to 2·1)
1·4(1·0 to 1·9)
–13·2(–16·1 to –10·6)*
(Table 1 continues on next page)
Articles
www.thelancet.com Vol 388 October 8, 2016 1611
All-age DALYs (thousands) Age-standardised rate (per 100 000)
2005 2015 Percentage change,2005–15
2005 2015 Percentage change,2005–15
(Continued from previous page)
Hepatitis 6042·4(5738·7 to 6344·8)
4925·3(4634·8 to 5229·3)
–18·5(–22·7 to –14·1)*
93·0(88·6 to 97·5)
66·7(62·8 to 70·8)
–28·3(–31·9 to –24·6)*
Acute hepatitis A 1486·6(1058·5 to 1896·9)
1030·3(714·9 to 1335·9)
–30·7(–39·7 to –20·8)*
21·5(15·2 to 27·5)
13·8(9·6 to 17·9)
–35·6(–43·9 to –26·4)*
Hepatitis B 2693·5(2298·5 to 3080·0)
2449·1(2083·5 to 2799·2)
–9·1(–15·4 to –2·0)*
44·0(37·8 to 50·0)
33·4(28·5 to 38·1)
–24·1(–29·2 to –18·6)*
Hepatitis C 98·4(26·2 to 220·4)
89·1(25·5 to 201·9)
–9·5(–23·3 to 7·6)
1·6(0·4 to 3·7)
1·2(0·3 to 2·8)
–25·9(–37·5 to –11·0)*
Acute hepatitis E 1763·9(1304·1 to 2265·3)
1356·8(972·0 to 1794·4)
–23·1(–31·6 to –14·0)*
25·9(19·0 to 33·7)
18·3(13·1 to 24·2)
–29·6(–37·1 to –21·6)*
Other infectious diseases 6761·5(4784·8 to 8106·7)
6536·0(4527·7 to 7935·6)
–3·3(–13·9 to 9·2)
101·3(72·0 to 120·9)
89·0(61·6 to 107·8)
–12·2(–21·6 to –1·0)*
Non-communicable diseases 1 322 207·9(1 181 179·7 to 1 471 448·8)
1 473 508·2(1 309 803·2 to 1 650 147·4)
11·4(9·7 to 13·0)*
23 220·2(20 898·5 to 25 689·0)
21 062·4(18 790·6 to 23 518·0)
–9·3(–10·9 to –7·9)*
Neoplasms 187 562·1(183 699·7 to 191 539·2)
209 359·2(204 155·5 to 214 470·1)
11·6(9·3 to 14·2)*
3424·3(3356·2 to 3494·4)
3024·4(2949·8 to 3098·9)
–11·7(–13·4 to –9·7)*
Lip and oral cavity cancer 2954·1(2866·9 to 3050·0)
3780·1(3645·7 to 3928·9)
28·0(23·9 to 32·6)*
53·7(52·1 to 55·4)
53·7(51·8 to 55·8)
0·1(–3·1 to 3·7)
Nasopharynx cancer 1805·8(1477·1 to 1912·4)
1911·7(1562·1 to 2040·2)
5·9(–2·2 to 12·4)
30·9(25·4 to 32·7)
26·5(21·6 to 28·2)
–14·3(–20·6 to –9·0)*
Other pharynx cancer 1419·9(1374·7 to 1468·8)
1715·7(1635·4 to 1795·0)
20·8(15·2 to 26·3)*
25·9(25·1 to 26·8)
24·3(23·2 to 25·4)
–6·3(–10·7 to –2·1)*
Oesophageal cancer 10 665·4(10 313·5 to 11 043·9)
9 854·4(9 465·3 to 10 270·8)
–7·6(–12·4 to –2·1)*
201·0(194·5 to 207·8)
143·6(137·9 to 149·5)
–28·6(–32·2 to –24·4)*
Stomach cancer 18 665·9(18 186·3 to 19 175·5)
17 439·6(16 876·7 to 18 034·6)
–6·6(–9·7 to –3·3)*
350·6(341·9 to 360·0)
255·9(247·9 to 264·5)
–27·0(–29·4 to –24·5)*
Colon and rectum cancer 14 409·5(14 108·0 to 14 779·0)
17 026·6(16 586·7 to 17 504·7)
18·2(15·7 to 20·9)*
274·0(268·2 to 280·8)
251·3(244·9 to 258·4)
–8·3(–10·2 to –6·2)*
Liver cancer 19 643·6(16 871·4 to 20 641·2)
20 578·0(18 937·8 to 21 915·3)
4·8(–1·4 to 15·5)
350·9(302·8 to 368·5)
292·1(269·1 to 311·0)
–16·8(–21·4 to –8·7)*
Liver cancer due to hepatitis B 8420·5(7092·2 to 9020·2)
8029·5(7279·6 to 8795·5)
–4·6(–11·2 to 8·2)
143·4(121·3 to 153·7)
110·6(100·4 to 121·2)
–22·9(–27·9 to –12·9)*
Liver cancer due to hepatitis C 2897·4(2607·7 to 3109·1)
3324·0(3012·2 to 3573·6)
14·7(10·3 to 20·2)*
55·5(50·1 to 59·5)
49·3(44·9 to 52·9)
–11·2(–14·4 to –7·1)*
Liver cancer due to alcohol use 4786·9(4075·0 to 5168·7)
5888·5(5368·4 to 6441·0)
23·0(14·8 to 36·1)*
89·2(76·2 to 96·3)
84·8(77·5 to 92·7)
–4·9(–11·1 to 4·8)
Liver cancer due to other causes
3538·8(3022·8 to 3829·6)
3336·0(3019·1 to 3637·7)
–5·7(–11·2 to 3·8)
62·9(54·1 to 68·1)
47·4(42·9 to 51·6)
–24·6(–28·9 to –17·5)*
Gallbladder and biliary tract cancer
2448·7(2359·2 to 2524·3)
2615·7(2454·6 to 2740·8)
6·8(2·2 to 11·6)*
47·3(45·7 to 48·7)
39·0(36·7 to 40·9)
–17·5(–21·0 to –13·8)*
Pancreatic cancer 6528·1(6433·9 to 6630·7)
8236·6(8064·7 to 8420·0)
26·2(23·3 to 29·0)*
125·2(123·4 to 127·0)
121·8(119·3 to 124·4)
–2·7(–4·8 to –0·6)*
Larynx cancer 2364·1(2290·8 to 2443·5)
2608·5(2518·3 to 2705·0)
10·3(7·1 to 13·9)*
44·0(42·7 to 45·5)
37·6(36·3 to 39·0)
–14·5(–17·0 to –11·8)*
Tracheal, bronchus, and lung cancer
31 802·0(31 117·2 to 32 516·2)
36 419·5(35 356·6 to 37 615·6)
14·5(11·0 to 19·1)*
604·5(591·8 to 617·4)
535·9(520·3 to 553·1)
–11·3(–14·0 to –7·9)*
Malignant skin melanoma 1304·0(1086·8 to 1655·2)
1596·3(1293·4 to 1982·7)
22·4(15·6 to 27·5)*
23·3(19·4 to 29·6)
22·8(18·4 to 28·3)
–2·3(–7·7 to 1·7)
Non-melanoma skin cancer 794·3(764·9 to 828·0)
1088·8(1028·3 to 1150·1)
37·1(32·0 to 41·9)*
15·2(14·7 to 15·9)
16·3(15·4 to 17·2)
6·8(2·8 to 10·6)*
Non-melanoma skin cancer (squamous-cell carcinoma)
789·6(761·2 to 822·3)
1082·9(1025·0 to 1142·0)
37·1(32·0 to 42·0)*
15·1(14·6 to 15·8)
16·2(15·3 to 17·1)
6·9(2·9 to 10·6)*
Non-melanoma skin cancer (basal-cell carcinoma)
4·7(2·2 to 8·7)
6·0(2·8 to 11·1)
26·9(23·4 to 30·2)*
0·1(0·0 to 0·2)
0·1(0·0 to 0·2)
–3·8(–6·5 to –1·2)*
(Table 1 continues on next page)
Articles
1612 www.thelancet.com Vol 388 October 8, 2016
All-age DALYs (thousands) Age-standardised rate (per 100 000)
2005 2015 Percentage change,2005–15
2005 2015 Percentage change,2005–15
(Continued from previous page)
Breast cancer 12 939·2(12 181·7 to 13 828·7)
15 410·6(14 415·5 to 16 217·8)
19·1(11·6 to 25·8)*
231·4(218·3 to 246·9)
217·1(203·2 to 228·7)
–6·2(–11·9 to –1·1)*
Cervical cancer 6819·2(6393·4 to 7236·4)
6963·0(6526·2 to 7408·0)
2·1(–4·5 to 10·5)
118·9(111·8 to 126·1)
96·7(90·7 to 102·7)
–18·7(–23·9 to –12·2)*
Uterine cancer 2077·7(1963·6 to 2201·8)
2230·7(2098·3 to 2386·9)
7·4(0·3 to 15·8)*
38·7(36·6 to 40·9)
32·2(30·3 to 34·5)
–16·6(–22·0 to –10·1)*
Ovarian cancer 3496·3(3401·0 to 3660·5)
4135·9(3992·4 to 4298·0)
18·3(13·4 to 23·1)*
63·2(61·5 to 66·0)
58·6(56·6 to 60·8)
–7·3(–11·0 to –3·8)*
Prostate cancer 4793·4(3992·1 to 6079·2)
6281·2(5233·9 to 7904·2)
31·0(26·9 to 35·2)*
100·0(83·5 to 126·8)
99·6(83·0 to 125·7)
–0·4(–3·5 to 2·6)
Testicular cancer 411·3(390·2 to 435·8)
442·6(413·1 to 473·3)
7·6(0·3 to 13·6)*
6·3(6·0 to 6·7)
5·9(5·5 to 6·3)
–6·4(–12·6 to –1·2)*
Kidney cancer 2649·3(2539·2 to 2779·3)
3340·3(3189·6 to 3513·2)
26·1(21·2 to 30·6)*
48·5(46·8 to 50·6)
48·4(46·2 to 50·8)
–0·3(–3·8 to 3·0)
Bladder cancer 2832·7(2754·6 to 2908·1)
3368·8(3251·3 to 3496·5)
18·9(15·4 to 22·4)*
56·3(54·8 to 57·8)
51·3(49·5 to 53·2)
–8·8(–11·5 to –6·2)*
Brain and nervous system cancer 6738·3(6079·6 to 7270·6)
7624·4(6975·3 to 8218·8)
13·2(5·0 to 21·0)*
111·4(100·8 to 119·7)
105·6(96·7 to 113·7)
–5·2(–11·7 to 1·2)
Thyroid cancer 649·6(605·3 to 707·6)
846·3(754·1 to 929·0)
30·3(19·2 to 37·4)*
12·1(11·3 to 13·2)
12·4(11·1 to 13·6)
2·2(–6·2 to 7·8)
Mesothelioma 544·9(529·2 to 560·6)
701·9(678·8 to 722·2)
28·8(24·3 to 33·3)*
10·1(9·8 to 10·3)
10·3(9·9 to 10·5)
2·0(–1·5 to 5·4)
Hodgkin’s lymphoma 949·3(837·3 to 1120·9)
845·6(758·4 to 1031·7)
–10·9(–14·9 to –6·7)*
15·5(13·7 to 18·3)
11·6(10·5 to 14·2)
–24·7(–28·2 to –21·1)*
Non-Hodgkin lymphoma 5063·1(4581·8 to 5581·3)
6283·8(5449·8 to 6632·3)
24·1(11·5 to 31·7)*
88·3(79·7 to 96·6)
89·5(77·5 to 94·3)
1·3(–8·5 to 7·0)
Multiple myeloma 1694·3(1646·6 to 1751·4)
2182·4(2096·5 to 2255·8)
28·8(23·8 to 33·2)*
32·2(31·2 to 33·2)
32·1(30·8 to 33·1)
–0·4(–4·1 to 2·9)
Leukaemia 11 272·2(10 956·3 to 11 683·7)
12 040·4(11 609·8 to 12 499·3)
6·8(2·9 to 10·5)*
181·6(176·6 to 187·8)
167·7(161·8 to 173·9)
–7·6(–10·8 to –4·6)*
Acute lymphoid leukaemia 4857·0(4505·3 to 5452·8)
5057·8(4658·4 to 5507·7)
4·1(–1·7 to 9·9)
73·6(68·3 to 82·4)
69·1(63·6 to 75·2)
–6·1(–11·3 to –1·0)*
Chronic lymphoid leukaemia 1183·2(1107·9 to 1256·6)
1268·6(1194·2 to 1349·3)
7·2(1·8 to 12·8)*
21·8(20·5 to 23·1)
18·7(17·7 to 19·9)
–14·1(–18·3 to –10·0)*
Acute myeloid leukaemia 4199·7(3770·1 to 4553·5)
4769·0(4345·7 to 5193·7)
13·6(8·2 to 18·5)*
68·5(62·1 to 74·0)
66·6(60·8 to 72·5)
–2·8(–7·0 to 1·1)
Chronic myeloid leukaemia 1032·3(957·8 to 1131·8)
945·1(885·8 to 1032·9)
–8·5(–12·3 to –3·8)*
17·7(16·5 to 19·3)
13·3(12·5 to 14·5)
–24·8(–27·8 to –21·2)*
Other neoplasms 9825·9(9023·1 to 10 351·7)
11 789·9(10 528·0 to 12 616·2)
20·0(13·4 to 25·7)*
163·3(150·1 to 171·6)
164·6(146·8 to 175·8)
0·8(–4·5 to 5·5)
Cardiovascular diseases 326 252·4(318 365·8 to 334 285·8)
347 528·9(337 220·3 to 358 093·5)
6·5(4·1 to 8·7)*
6231·9(6086·8 to 6378·1)
5179·7(5026·3 to 5334·2)
–16·9(–18·7 to –15·3)*
Rheumatic heart disease 11 594·7(10 668·9 to 12 707·4)
10 513·2(9 611·0 to 11 514·5)
–9·3(–13·3 to –5·7)*
193·6(178·4 to 210·6)
146·6(134·2 to 160·1)
–24·3(–27·5 to –21·3)*
Ischaemic heart disease 147 780·0(144 845·9 to 151 651·5)
164 020·4(159 621·3 to 169 088·2)
11·0(8·3 to 13·3)*
2860·0(2805·1 to 2927·3)
2452·6(2388·9 to 2526·8)
–14·2(–16·2 to –12·5)*
Cerebrovascular disease 118 566·2(115 776·1 to 121 419·2)
118 626·7(114 862·4 to 122 627·0)
0·1(–2·5 to 2·7)
2283·2(2230·3 to 2335·8)
1776·6(1721·1 to 1834·8)
–22·2(–24·1 to –20·1)*
Ischaemic stroke 44 104·6(42 363·3 to 45 822·3)
45 208·5(43 150·2 to 47 386·8)
2·5(–0·4 to 5·2)
903·6(869·6 to 936·9)
706·2(675·6 to 739·0)
–21·8(–24·0 to –19·8)*
Haemorrhagic stroke 74 461·5(72 176·9 to 76 874·3)
73 418·2(70 737·2 to 76 596·4)
–1·4(–4·6 to 2·1)
1379·6(1337·6 to 1423·6)
1070·4(1032·1 to 1116·3)
–22·4(–25·0 to –19·6)*
Hypertensive heart disease 14 852·4(13 919·4 to 16 052·6)
17 484·6(16 286·9 to 18 593·6)
17·7(11·6 to 22·9)*
286·5(268·8 to 309·8)
262·2(243·2 to 279·1)
–8·5(–13·4 to –4·5)*
(Table 1 continues on next page)
Articles
www.thelancet.com Vol 388 October 8, 2016 1613
All-age DALYs (thousands) Age-standardised rate (per 100 000)
2005 2015 Percentage change,2005–15
2005 2015 Percentage change,2005–15
(Continued from previous page)
Cardiomyopathy and myocarditis
9619·8(9134·6 to 9993·7)
9220·3(8765·6 to 9706·0)
–4·2(–8·3 to –0·1)*
163·4(155·8 to 169·5)
130·0(123·7 to 136·7)
–20·5(–23·7 to –17·2)*
Atrial fi brillation and fl utter 3463·2(2764·5 to 4281·3)
4433·7(3541·7 to 5489·1)
28·0(26·6 to 29·3)*
73·8(59·3 to 90·5)
70·6(56·5 to 86·9)
–4·2(–5·3 to –3·3)*
Aortic aneurysm 2468·0(2403·2 to 2547·3)
2930·2(2846·0 to 3007·0)
18·7(12·9 to 22·6)*
47·6(46·4 to 49·1)
43·8(42·6 to 45·0)
–7·9(–12·3 to –5·0)*
Peripheral vascular disease 913·0(686·4 to 1279·3)
1198·8(898·0 to 1682·6)
31·3(27·7 to 35·2)*
19·3(14·5 to 26·9)
19·1(14·3 to 26·8)
–1·1(–3·9 to 1·7)
Endocarditis 1962·3(1616·0 to 2190·5)
2210·3(1838·9 to 2421·3)
12·6(6·3 to 18·8)*
33·0(27·7 to 36·7)
31·2(26·1 to 34·2)
–5·5(–10·2 to –0·9)*
Other cardiovascular and circulatory diseases
15 032·7(13 427·8 to 16 820·7)
16 890·7(14 824·7 to 19 104·2)
12·4(8·4 to 15·6)*
271·6(243·4 to 303·7)
247·0(217·2 to 279·2)
–9·0(–12·1 to –6·5)*
Chronic respiratory diseases 97 356·3(90 607·8 to 104 559·9)
97 451·8(89 829·7 to 105 527·6)
0·1(–2·4 to 2·6)
1802·0(1694·4 to 1915·3)
1443·4(1336·9 to 1556·8)
–19·9(–22·2 to –17·8)*
Chronic obstructive pulmonary disease
63 773·8(60 981·4 to 66 186·6)
63 850·4(61 215·3 to 66 288·6)
0·1(–3·1 to 3·8)
1246·9(1195·2 to 1291·9)
971·1(932·7 to 1 007·6)
–22·1(–24·6 to –19·2)*
Pneumoconiosis 976·7(816·2 to 1 168·6)
1 099·6(902·7 to 1 314·7)
12·6(6·9 to 18·9)*
17·8(15·0 to 21·1)
16·0(13·2 to 19·1)
–9·9(–14·8 to –4·7)*
Silicosis 271·5(240·1 to 308·1)
270·2(235·8 to 310·1)
–0·5(–10·1 to 11·5)
5·0(4·5 to 5·7)
4·0(3·5 to 4·5)
–21·3(–28·7 to –12·0)*
Asbestosis 76·3(63·0 to 87·9)
92·0(75·3 to 107·2)
20·5(13·7 to 27·8)*
1·4(1·2 to 1·6)
1·4(1·1 to 1·6)
–3·8(–8·9 to 1·7)
Coal worker’s pneumoconiosis 59·7(52·8 to 67·4)
57·5(49·0 to 67·2)
–3·6(–17·4 to 9·4)
1·2(1·0 to 1·3)
0·9(0·7 to 1·0)
–25·1(–35·6 to –15·1)*
Other pneumoconiosis 569·3(440·2 to 715·7)
680·0(526·2 to 855·9)
19·5(13·4 to 25·9)*
10·2(8·0 to 12·7)
9·8(7·6 to 12·3)
–3·4(–9·0 to 2·3)
Asthma 26 859·7(21 268·1 to 33 122·5)
26 168·8(20 501·4 to 32 583·0)
–2·6(–9·2 to 4·2)
439·8(351·4 to 537·5)
365·6(287·5 to 453·5)
–16·9(–23·5 to –10·3)*
Interstitial lung disease and pulmonary sarcoidosis
1672·3(1351·2 to 1954·1)
2352·6(1933·8 to 2618·7)
40·7(29·2 to 48·8)*
32·0(25·7 to 37·2)
35·4(28·9 to 39·3)
10·3(1·5 to 16·7)*
Other chronic respiratory diseases
4073·7(3295·2 to 4805·9)
3980·4(3225·6 to 4569·7)
–2·3(–11·0 to 7·3)
65·5(53·3 to 76·6)
55·4(44·9 to 63·5)
–15·3(–22·4 to –7·5)*
Cirrhosis and other chronic liver diseases
37 101·5(35 722·1 to 39 385·8)
38 973·3(37 202·0 to 41 702·9)
5·0(1·6 to 8·7)*
632·5(609·4 to 669·2)
539·6(515·4 to 576·8)
–14·7(–17·4 to –11·8)*
Cirrhosis and other chronic liver diseases due to hepatitis B
10 297·6(9 495·9 to 11 233·5)
10 754·7(9 876·8 to 11 957·6)
4·4(0·2 to 8·6)*
178·0(164·1 to 194·8)
149·5(137·3 to 165·9)
–16·0(–19·2 to –12·7)*
Cirrhosis and other chronic liver diseases due to hepatitis C
8408·4(7768·6 to 9069·5)
9161·7(8443·3 to 9968·2)
9·0(5·7 to 12·3)*
146·5(135·6 to 157·9)
127·4(117·6 to 138·4)
–13·0(–15·6 to –10·4)*
Cirrhosis and other chronic liver diseases due to alcohol use
10 093·5(9 424·0 to 10 841·4)
10 997·4(10 197·4 to 11 875·1)
9·0(5·0 to 13·7)*
171·9(160·5 to 184·3)
150·7(139·7 to 162·6)
–12·3(–15·5 to –8·6)*
Cirrhosis and other chronic liver diseases due to other causes
8302·1(7741·5 to 9165·9)
8059·5(7452·2 to 8977·7)
–2·9(–6·5 to 1·3)
136·1(126·8 to 149·9)
112·0(103·6 to 124·7)
–17·7(–20·6 to –14·3)*
Digestive diseases 41 351·8(37 701·8 to 45 778·3)
42 189·1(38 101·1 to 47 087·5)
2·0(–2·7 to 6·2)
716·3(653·0 to 793·4)
600·3(542·1 to 670·1)
–16·2(–19·7 to –12·9)*
Peptic ulcer disease 10 164·0(9220·6 to 11 279·2)
8894·4(7950·0 to 10 039·2)
–12·5(–17·7 to –5·9)*
180·8(163·9 to 201·3)
128·5(114·6 to 145·3)
–28·9(–33·2 to –23·6)*
Gastritis and duodenitis 5757·0(4331·9 to 7638·9)
6145·5(4517·3 to 8251·9)
6·7(2·5 to 11·1)*
100·9(76·0 to 134·0)
87·8(64·6 to 118·0)
–13·1(–16·4 to –9·7)*
Appendicitis 2197·3(1823·7 to 2661·6)
2015·9(1631·6 to 2381·2)
–8·3(–21·5 to 6·4)
34·4(28·7 to 41·2)
27·6(22·4 to 32·6)
–19·6(–30·7 to –6·8)*
Paralytic ileus and intestinal obstruction
6957·0(6123·4 to 8236·1)
7135·5(6464·3 to 8502·6)
2·6(–5·5 to 11·2)
117·3(104·1 to 138·5)
100·7(91·4 to 119·7)
–14·2(–20·1 to –7·5)*
Inguinal femoral and abdominal hernia
1689·6(1147·1 to 1996·2)
1645·7(1089·7 to 1969·1)
–2·6(–9·8 to 7·0)
29·2(20·1 to 34·2)
23·4(15·6 to 27·9)
–19·7(–26·1 to –11·8)*
(Table 1 continues on next page)
Articles
1614 www.thelancet.com Vol 388 October 8, 2016
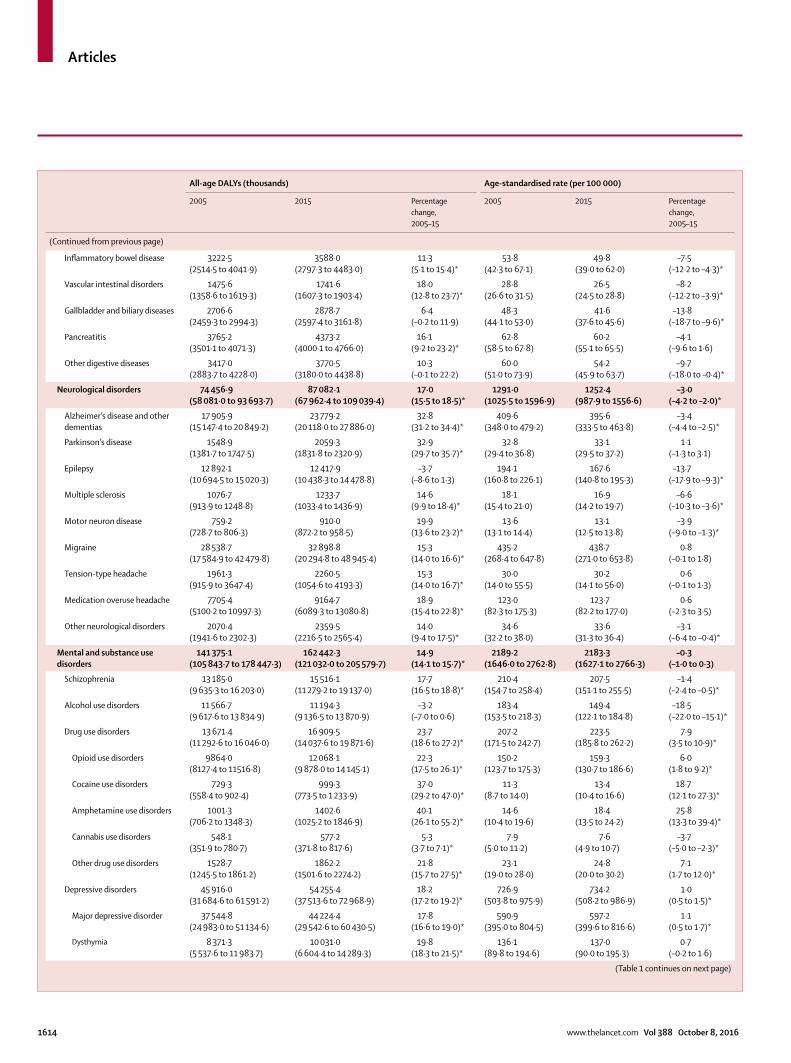
All-age DALYs (thousands) Age-standardised rate (per 100 000)
2005 2015 Percentage change,2005–15
2005 2015 Percentage change,2005–15
(Continued from previous page)
Infl ammatory bowel disease 3222·5(2514·5 to 4041·9)
3588·0(2797·3 to 4483·0)
11·3(5·1 to 15·4)*
53·8(42·3 to 67·1)
49·8(39·0 to 62·0)
–7·5(–12·2 to –4·3)*
Vascular intestinal disorders 1475·6(1358·6 to 1619·3)
1741·6(1607·3 to 1903·4)
18·0(12·8 to 23·7)*
28·8(26·6 to 31·5)
26·5(24·5 to 28·8)
–8·2(–12·2 to –3·9)*
Gallbladder and biliary diseases 2706·6(2459·3 to 2994·3)
2878·7(2597·4 to 3161·8)
6·4(–0·2 to 11·9)
48·3(44·1 to 53·0)
41·6(37·6 to 45·6)
–13·8(–18·7 to –9·6)*
Pancreatitis 3765·2(3501·1 to 4071·3)
4373·2(4000·1 to 4766·0)
16·1(9·2 to 23·2)*
62·8(58·5 to 67·8)
60·2(55·1 to 65·5)
–4·1(–9·6 to 1·6)
Other digestive diseases 3417·0(2883·7 to 4228·0)
3770·5(3180·0 to 4438·8)
10·3(–0·1 to 22·2)
60·0(51·0 to 73·9)
54·2(45·9 to 63·7)
–9·7(–18·0 to –0·4)*
Neurological disorders 74 456·9(58 081·0 to 93 693·7)
87 082·1(67 962·4 to 109 039·4)
17·0(15·5 to 18·5)*
1291·0(1025·5 to 1596·9)
1252·4(987·9 to 1556·6)
–3·0(–4·2 to –2·0)*
Alzheimer’s disease and other dementias
17 905·9(15 147·4 to 20 849·2)
23 779·2(20 118·0 to 27 886·0)
32·8(31·2 to 34·4)*
409·6(348·0 to 479·2)
395·6(333·5 to 463·8)
–3·4(–4·4 to –2·5)*
Parkinson’s disease 1548·9(1381·7 to 1747·5)
2059·3(1831·8 to 2320·9)
32·9(29·7 to 35·7)*
32·8(29·4 to 36·8)
33·1(29·5 to 37·2)
1·1(–1·3 to 3·1)
Epilepsy 12 892·1(10 694·5 to 15 020·3)
12 417·9(10 438·3 to 14 478·8)
–3·7(–8·6 to 1·3)
194·1(160·8 to 226·1)
167·6(140·8 to 195·3)
–13·7(–17·9 to –9·3)*
Multiple sclerosis 1076·7(913·9 to 1248·8)
1233·7(1033·4 to 1436·9)
14·6(9·9 to 18·4)*
18·1(15·4 to 21·0)
16·9(14·2 to 19·7)
–6·6(–10·3 to –3·6)*
Motor neuron disease 759·2(728·7 to 806·3)
910·0(872·2 to 958·5)
19·9(13·6 to 23·2)*
13·6(13·1 to 14·4)
13·1(12·5 to 13·8)
–3·9(–9·0 to –1·3)*
Migraine 28 538·7(17 584·9 to 42 479·8)
32 898·8(20 294·8 to 48 945·4)
15·3(14·0 to 16·6)*
435·2(268·4 to 647·8)
438·7(271·0 to 653·8)
0·8(–0·1 to 1·8)
Tension-type headache 1961·3(915·9 to 3647·4)
2260·5(1054·6 to 4193·3)
15·3(14·0 to 16·7)*
30·0(14·0 to 55·5)
30·2(14·1 to 56·0)
0·6(–0·1 to 1·3)
Medication overuse headache 7705·4(5100·2 to 10997·3)
9164·7(6089·3 to 13080·8)
18·9(15·4 to 22·8)*
123·0(82·3 to 175·3)
123·7(82·2 to 177·0)
0·6(–2·3 to 3·5)
Other neurological disorders 2070·4(1941·6 to 2302·3)
2359·5(2216·5 to 2565·4)
14·0(9·4 to 17·5)*
34·6(32·2 to 38·0)
33·6(31·3 to 36·4)
–3·1(–6·4 to –0·4)*
Mental and substance use disorders
141 375·1(105 843·7 to 178 447·3)
162 442·3(121 032·0 to 205 579·7)
14·9(14·1 to 15·7)*
2189·2(1646·0 to 2762·8)
2183·3(1627·1 to 2766·3)
–0·3(–1·0 to 0·3)
Schizophrenia 13 185·0(9 635·3 to 16 203·0)
15 516·1(11 279·2 to 19 137·0)
17·7(16·5 to 18·8)*
210·4(154·7 to 258·4)
207·5(151·1 to 255·5)
–1·4(–2·4 to –0·5)*
Alcohol use disorders 11 566·7(9 617·6 to 13 834·9)
11 194·3(9 136·5 to 13 870·9)
–3·2(–7·0 to 0·6)
183·4(153·5 to 218·3)
149·4(122·1 to 184·8)
–18·5(–22·0 to –15·1)*
Drug use disorders 13 671·4(11 292·6 to 16 046·0)
16 909·5(14 037·6 to 19 871·6)
23·7(18·6 to 27·2)*
207·2(171·5 to 242·7)
223·5(185·8 to 262·2)
7·9(3·5 to 10·9)*
Opioid use disorders 9864·0(8127·4 to 11516·8)
12 068·1(9 878·0 to 14 145·1)
22·3(17·5 to 26·1)*
150·2(123·7 to 175·3)
159·3(130·7 to 186·6)
6·0(1·8 to 9·2)*
Cocaine use disorders 729·3(558·4 to 902·4)
999·3(773·5 to 1 233·9)
37·0(29·2 to 47·0)*
11·3(8·7 to 14·0)
13·4(10·4 to 16·6)
18·7(12·1 to 27·3)*
Amphetamine use disorders 1001·3(706·2 to 1348·3)
1402·6(1025·2 to 1846·9)
40·1(26·1 to 55·2)*
14·6(10·4 to 19·6)
18·4(13·5 to 24·2)
25·8(13·3 to 39·4)*
Cannabis use disorders 548·1(351·9 to 780·7)
577·2(371·8 to 817·6)
5·3(3·7 to 7·1)*
7·9(5·0 to 11·2)
7·6(4·9 to 10·7)
–3·7(–5·0 to –2·3)*
Other drug use disorders 1528·7(1245·5 to 1861·2)
1862·2(1501·6 to 2274·2)
21·8(15·7 to 27·5)*
23·1(19·0 to 28·0)
24·8(20·0 to 30·2)
7·1(1·7 to 12·0)*
Depressive disorders 45 916·0(31 684·6 to 61 591·2)
54 255·4(37 513·6 to 72 968·9)
18·2(17·2 to 19·2)*
726·9(503·8 to 975·9)
734·2(508·2 to 986·9)
1·0(0·5 to 1·5)*
Major depressive disorder 37 544·8(24 983·0 to 51 134·6)
44 224·4(29 542·6 to 60 430·5)
17·8(16·6 to 19·0)*
590·9(395·0 to 804·5)
597·2(399·6 to 816·6)
1·1(0·5 to 1·7)*
Dysthymia 8 371·3(5 537·6 to 11 983·7)
10 031·0(6 604·4 to 14 289·3)
19·8(18·3 to 21·5)*
136·1(89·8 to 194·6)
137·0(90·0 to 195·3)
0·7(–0·2 to 1·6)
(Table 1 continues on next page)
Articles
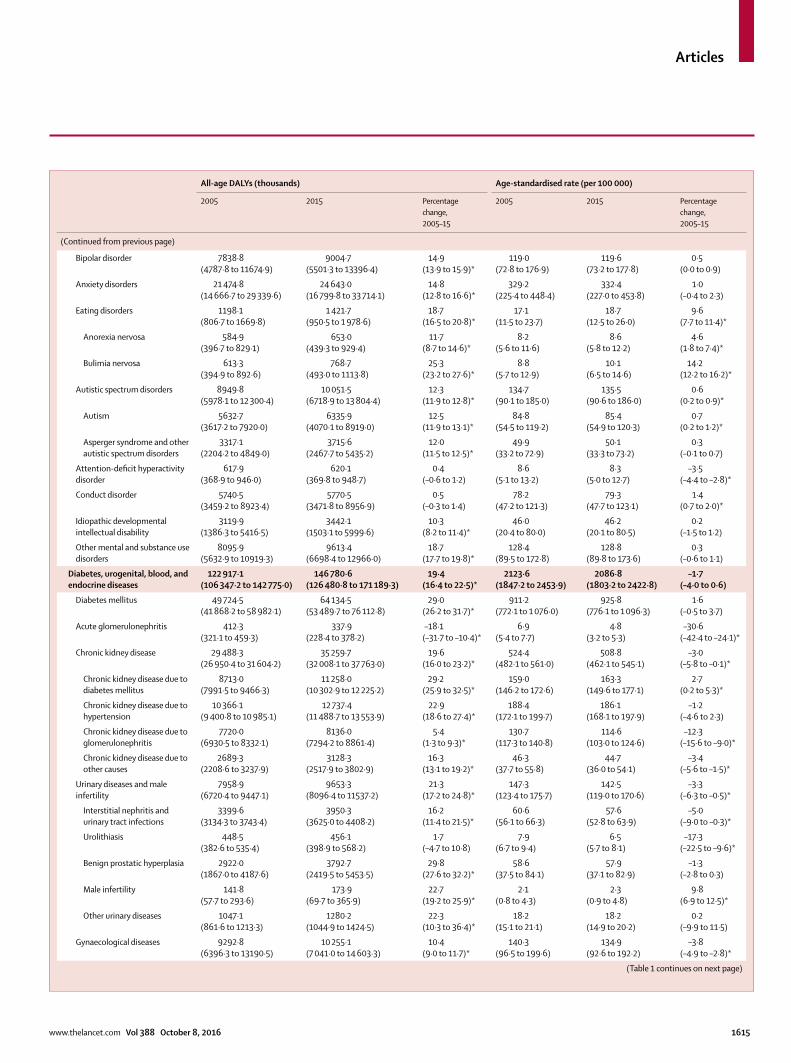
www.thelancet.com Vol 388 October 8, 2016 1615
All-age DALYs (thousands) Age-standardised rate (per 100 000)
2005 2015 Percentage change,2005–15
2005 2015 Percentage change,2005–15
(Continued from previous page)
Bipolar disorder 7838·8(4787·8 to 11674·9)
9004·7(5501·3 to 13396·4)
14·9(13·9 to 15·9)*
119·0(72·8 to 176·9)
119·6(73·2 to 177·8)
0·5(0·0 to 0·9)
Anxiety disorders 21 474·8(14 666·7 to 29 339·6)
24 643·0(16 799·8 to 33 714·1)
14·8(12·8 to 16·6)*
329·2(225·4 to 448·4)
332·4(227·0 to 453·8)
1·0(–0·4 to 2·3)
Eating disorders 1198·1(806·7 to 1669·8)
1 421·7(950·5 to 1 978·6)
18·7(16·5 to 20·8)*
17·1(11·5 to 23·7)
18·7(12·5 to 26·0)
9·6(7·7 to 11·4)*
Anorexia nervosa 584·9(396·7 to 829·1)
653·0(439·3 to 929·4)
11·7(8·7 to 14·6)*
8·2(5·6 to 11·6)
8·6(5·8 to 12·2)
4·6(1·8 to 7·4)*
Bulimia nervosa 613·3(394·9 to 892·6)
768·7(493·0 to 1113·8)
25·3(23·2 to 27·6)*
8·8(5·7 to 12·9)
10·1(6·5 to 14·6)
14·2(12·2 to 16·2)*
Autistic spectrum disorders 8949·8(5978·1 to 12 300·4)
10 051·5(6718·9 to 13 804·4)
12·3(11·9 to 12·8)*
134·7(90·1 to 185·0)
135·5(90·6 to 186·0)
0·6(0·2 to 0·9)*
Autism 5632·7(3617·2 to 7920·0)
6335·9(4070·1 to 8919·0)
12·5(11·9 to 13·1)*
84·8(54·5 to 119·2)
85·4(54·9 to 120·3)
0·7(0·2 to 1·2)*
Asperger syndrome and other autistic spectrum disorders
3317·1(2204·2 to 4849·0)
3715·6(2467·7 to 5435·2)
12·0(11·5 to 12·5)*
49·9(33·2 to 72·9)
50·1(33·3 to 73·2)
0·3(–0·1 to 0·7)
Attention-defi cit hyperactivity disorder
617·9(368·9 to 946·0)
620·1(369·8 to 948·7)
0·4(–0·6 to 1·2)
8·6(5·1 to 13·2)
8·3(5·0 to 12·7)
–3·5(–4·4 to –2·8)*
Conduct disorder 5740·5(3459·2 to 8923·4)
5770·5(3471·8 to 8956·9)
0·5(–0·3 to 1·4)
78·2(47·2 to 121·3)
79·3(47·7 to 123·1)
1·4(0·7 to 2·0)*
Idiopathic developmental intellectual disability
3119·9(1386·3 to 5416·5)
3442·1(1503·1 to 5999·6)
10·3(8·2 to 11·4)*
46·0(20·4 to 80·0)
46·2(20·1 to 80·5)
0·2(–1·5 to 1·2)
Other mental and substance use disorders
8095·9(5632·9 to 10919·3)
9613·4(6698·4 to 12966·0)
18·7(17·7 to 19·8)*
128·4(89·5 to 172·8)
128·8(89·8 to 173·6)
0·3(–0·6 to 1·1)
Diabetes, urogenital, blood, and endocrine diseases
122 917·1(106 347·2 to 142 775·0)
146 780·6(126 480·8 to 171 189·3)
19·4(16·4 to 22·5)*
2123·6(1847·2 to 2453·9)
2086·8(1803·2 to 2422·8)
–1·7(–4·0 to 0·6)
Diabetes mellitus 49 724·5(41 868·2 to 58 982·1)
64 134·5(53 489·7 to 76 112·8)
29·0(26·2 to 31·7)*
911·2(772·1 to 1 076·0)
925·8(776·1 to 1 096·3)
1·6(–0·5 to 3·7)
Acute glomerulonephritis 412·3(321·1 to 459·3)
337·9(228·4 to 378·2)
–18·1(–31·7 to –10·4)*
6·9(5·4 to 7·7)
4·8(3·2 to 5·3)
–30·6(–42·4 to –24·1)*
Chronic kidney disease 29 488·3(26 950·4 to 31 604·2)
35 259·7(32 008·1 to 37 763·0)
19·6(16·0 to 23·2)*
524·4(482·1 to 561·0)
508·8(462·1 to 545·1)
–3·0(–5·8 to –0·1)*
Chronic kidney disease due to diabetes mellitus
8713·0(7991·5 to 9466·3)
11 258·0(10 302·9 to 12 225·2)
29·2(25·9 to 32·5)*
159·0(146·2 to 172·6)
163·3(149·6 to 177·1)
2·7(0·2 to 5·3)*
Chronic kidney disease due to hypertension
10 366·1(9 400·8 to 10 985·1)
12 737·4(11 488·7 to 13 553·9)
22·9(18·6 to 27·4)*
188·4(172·1 to 199·7)
186·1(168·1 to 197·9)
–1·2(–4·6 to 2·3)
Chronic kidney disease due to glomerulonephritis
7720·0(6930·5 to 8332·1)
8136·0(7294·2 to 8861·4)
5·4(1·3 to 9·3)*
130·7(117·3 to 140·8)
114·6(103·0 to 124·6)
–12·3(–15·6 to –9·0)*
Chronic kidney disease due to other causes
2689·3(2208·6 to 3237·9)
3128·3(2517·9 to 3802·9)
16·3(13·1 to 19·2)*
46·3(37·7 to 55·8)
44·7(36·0 to 54·1)
–3·4(–5·6 to –1·5)*
Urinary diseases and male infertility
7958·9(6720·4 to 9447·1)
9653·3(8096·4 to 11537·2)
21·3(17·2 to 24·8)*
147·3(123·4 to 175·7)
142·5(119·0 to 170·6)
–3·3(–6·3 to –0·5)*
Interstitial nephritis and urinary tract infections
3399·6(3134·3 to 3743·4)
3950·3(3625·0 to 4408·2)
16·2(11·4 to 21·5)*
60·6(56·1 to 66·3)
57·6(52·8 to 63·9)
–5·0(–9·0 to –0·3)*
Urolithiasis 448·5(382·6 to 535·4)
456·1(398·9 to 568·2)
1·7(–4·7 to 10·8)
7·9(6·7 to 9·4)
6·5(5·7 to 8·1)
–17·3(–22·5 to –9·6)*
Benign prostatic hyperplasia 2922·0(1867·0 to 4187·6)
3792·7(2419·5 to 5453·5)
29·8(27·6 to 32·2)*
58·6(37·5 to 84·1)
57·9(37·1 to 82·9)
–1·3(–2·8 to 0·3)
Male infertility 141·8(57·7 to 293·6)
173·9(69·7 to 365·9)
22·7(19·2 to 25·9)*
2·1(0·8 to 4·3)
2·3(0·9 to 4·8)
9·8(6·9 to 12·5)*
Other urinary diseases 1047·1(861·6 to 1213·3)
1280·2(1044·9 to 1424·5)
22·3(10·3 to 36·4)*
18·2(15·1 to 21·1)
18·2(14·9 to 20·2)
0·2(–9·9 to 11·5)
Gynaecological diseases 9292·8(6396·3 to 13190·5)
10 255·1(7 041·0 to 14 603·3)
10·4(9·0 to 11·7)*
140·3(96·5 to 199·6)
134·9(92·6 to 192·2)
–3·8(–4·9 to –2·8)*
(Table 1 continues on next page)
Articles
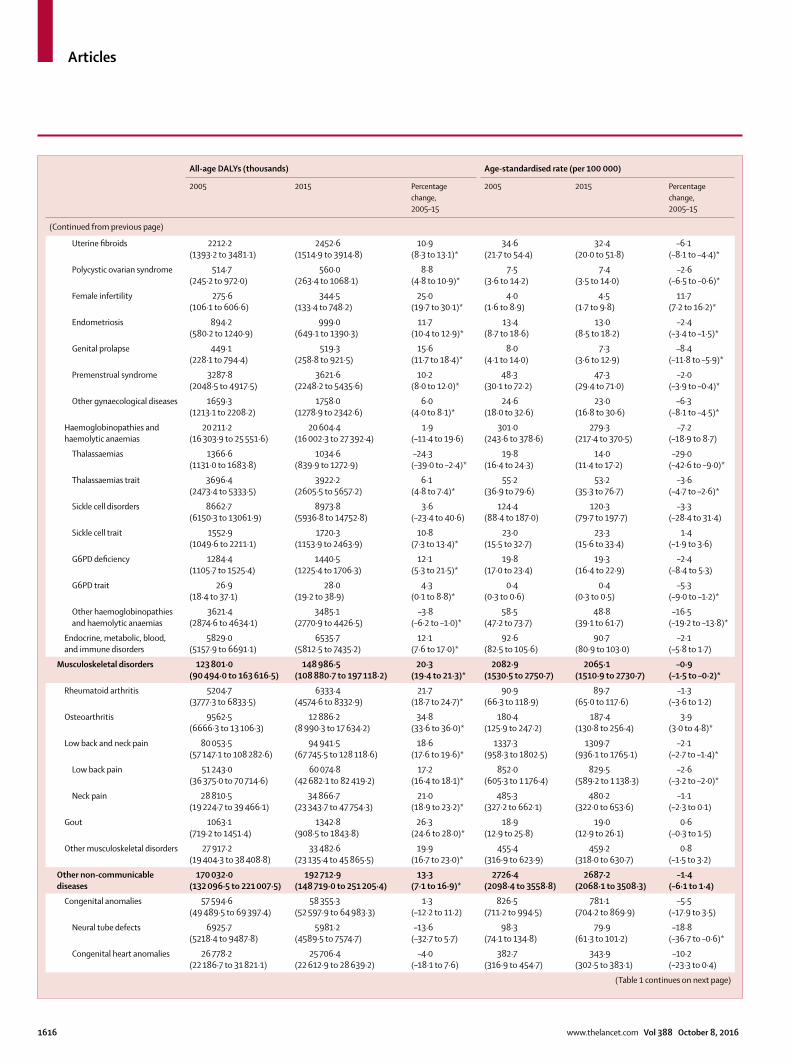
1616 www.thelancet.com Vol 388 October 8, 2016
All-age DALYs (thousands) Age-standardised rate (per 100 000)
2005 2015 Percentage change,2005–15
2005 2015 Percentage change,2005–15
(Continued from previous page)
Uterine fi broids 2212·2(1393·2 to 3481·1)
2452·6(1514·9 to 3914·8)
10·9(8·3 to 13·1)*
34·6(21·7 to 54·4)
32·4(20·0 to 51·8)
–6·1(–8·1 to –4·4)*
Polycystic ovarian syndrome 514·7(245·2 to 972·0)
560·0(263·4 to 1068·1)
8·8(4·8 to 10·9)*
7·5(3·6 to 14·2)
7·4(3·5 to 14·0)
–2·6(–6·5 to –0·6)*
Female infertility 275·6(106·1 to 606·6)
344·5(133·4 to 748·2)
25·0(19·7 to 30·1)*
4·0(1·6 to 8·9)
4·5(1·7 to 9·8)
11·7(7·2 to 16·2)*
Endometriosis 894·2(580·2 to 1240·9)
999·0(649·1 to 1390·3)
11·7(10·4 to 12·9)*
13·4(8·7 to 18·6)
13·0(8·5 to 18·2)
–2·4(–3·4 to –1·5)*
Genital prolapse 449·1(228·1 to 794·4)
519·3(258·8 to 921·5)
15·6(11·7 to 18·4)*
8·0(4·1 to 14·0)
7·3(3·6 to 12·9)
–8·4(–11·8 to –5·9)*
Premenstrual syndrome 3287·8(2048·5 to 4917·5)
3621·6(2248·2 to 5435·6)
10·2(8·0 to 12·0)*
48·3(30·1 to 72·2)
47·3(29·4 to 71·0)
–2·0(–3·9 to –0·4)*
Other gynaecological diseases 1659·3(1213·1 to 2208·2)
1758·0(1278·9 to 2342·6)
6·0(4·0 to 8·1)*
24·6(18·0 to 32·6)
23·0(16·8 to 30·6)
–6·3(–8·1 to –4·5)*
Haemoglobinopathies and haemolytic anaemias
20 211·2(16 303·9 to 25 551·6)
20 604·4(16 002·3 to 27 392·4)
1·9(–11·4 to 19·6)
301·0(243·6 to 378·6)
279·3(217·4 to 370·5)
–7·2(–18·9 to 8·7)
Thalassaemias 1366·6(1131·0 to 1683·8)
1034·6(839·9 to 1272·9)
–24·3(–39·0 to –2·4)*
19·8(16·4 to 24·3)
14·0(11·4 to 17·2)
–29·0(–42·6 to –9·0)*
Thalassaemias trait 3696·4(2473·4 to 5333·5)
3922·2(2605·5 to 5657·2)
6·1(4·8 to 7·4)*
55·2(36·9 to 79·6)
53·2(35·3 to 76·7)
–3·6(–4·7 to –2·6)*
Sickle cell disorders 8662·7(6150·3 to 13061·9)
8973·8(5936·8 to 14752·8)
3·6(–23·4 to 40·6)
124·4(88·4 to 187·0)
120·3(79·7 to 197·7)
–3·3(–28·4 to 31·4)
Sickle cell trait 1552·9(1049·6 to 2211·1)
1720·3(1153·9 to 2463·9)
10·8(7·3 to 13·4)*
23·0(15·5 to 32·7)
23·3(15·6 to 33·4)
1·4(–1·9 to 3·6)
G6PD defi ciency 1284·4(1105·7 to 1525·4)
1440·5(1225·4 to 1706·3)
12·1(5·3 to 21·5)*
19·8(17·0 to 23·4)
19·3(16·4 to 22·9)
–2·4(–8·4 to 5·3)
G6PD trait 26·9(18·4 to 37·1)
28·0(19·2 to 38·9)
4·3(0·1 to 8·8)*
0·4(0·3 to 0·6)
0·4(0·3 to 0·5)
–5·3(–9·0 to –1·2)*
Other haemoglobinopathies and haemolytic anaemias
3621·4(2874·6 to 4634·1)
3485·1(2770·9 to 4426·5)
–3·8(–6·2 to –1·0)*
58·5(47·2 to 73·7)
48·8(39·1 to 61·7)
–16·5(–19·2 to –13·8)*
Endocrine, metabolic, blood, and immune disorders
5829·0(5157·9 to 6691·1)
6535·7(5812·5 to 7435·2)
12·1(7·6 to 17·0)*
92·6(82·5 to 105·6)
90·7(80·9 to 103·0)
–2·1(–5·8 to 1·7)
Musculoskeletal disorders 123 801·0(90 494·0 to 163 616·5)
148 986·5(108 880·7 to 197 118·2)
20·3(19·4 to 21·3)*
2082·9(1530·5 to 2750·7)
2065·1(1510·9 to 2730·7)
–0·9(–1·5 to –0·2)*
Rheumatoid arthritis 5204·7(3777·3 to 6833·5)
6333·4(4574·6 to 8332·9)
21·7(18·7 to 24·7)*
90·9(66·3 to 118·9)
89·7(65·0 to 117·6)
–1·3(–3·6 to 1·2)
Osteoarthritis 9562·5(6666·3 to 13 106·3)
12 886·2(8 990·3 to 17 634·2)
34·8(33·6 to 36·0)*
180·4(125·9 to 247·2)
187·4(130·8 to 256·4)
3·9(3·0 to 4·8)*
Low back and neck pain 80 053·5(57 147·1 to 108 282·6)
94 941·5(67 745·5 to 128 118·6)
18·6(17·6 to 19·6)*
1337·3(958·3 to 1802·5)
1309·7(936·1 to 1765·1)
–2·1(–2·7 to –1·4)*
Low back pain 51 243·0(36 375·0 to 70 714·6)
60 074·8(42 682·1 to 82 419·2)
17·2(16·4 to 18·1)*
852·0(605·3 to 1 176·4)
829·5(589·2 to 1 138·3)
–2·6(–3·2 to –2·0)*
Neck pain 28 810·5(19 224·7 to 39 466·1)
34 866·7(23 343·7 to 47 754·3)
21·0(18·9 to 23·2)*
485·3(327·2 to 662·1)
480·2(322·0 to 653·6)
–1·1(–2·3 to 0·1)
Gout 1063·1(719·2 to 1451·4)
1342·8(908·5 to 1843·8)
26·3(24·6 to 28·0)*
18·9(12·9 to 25·8)
19·0(12·9 to 26·1)
0·6(–0·3 to 1·5)
Other musculoskeletal disorders 27 917·2(19 404·3 to 38 408·8)
33 482·6(23 135·4 to 45 865·5)
19·9(16·7 to 23·0)*
455·4(316·9 to 623·9)
459·2(318·0 to 630·7)
0·8(–1·5 to 3·2)
Other non-communicable diseases
170 032·0(132 096·5 to 221 007·5)
192 712·9(148 719·0 to 251 205·4)
13·3(7·1 to 16·9)*
2726·4(2098·4 to 3558·8)
2687·2(2068·1 to 3508·3)
–1·4(–6·1 to 1·4)
Congenital anomalies 57 594·6(49 489·5 to 69 397·4)
58 355·3(52 597·9 to 64 983·3)
1·3(–12·2 to 11·2)
826·5(711·2 to 994·5)
781·1(704·2 to 869·9)
–5·5(–17·9 to 3·5)
Neural tube defects 6925·7(5218·4 to 9487·8)
5981·2(4589·5 to 7574·7)
–13·6(–32·7 to 5·7)
98·3(74·1 to 134·8)
79·9(61·3 to 101·2)
–18·8(–36·7 to –0·6)*
Congenital heart anomalies 26 778·2(22 186·7 to 31 821·1)
25 706·4(22 612·9 to 28 639·2)
–4·0(–18·1 to 7·6)
382·7(316·9 to 454·7)
343·9(302·5 to 383·1)
–10·2(–23·3 to 0·4)
(Table 1 continues on next page)

Articles
www.thelancet.com Vol 388 October 8, 2016 1617
All-age DALYs (thousands) Age-standardised rate (per 100 000)
2005 2015 Percentage change,2005–15
2005 2015 Percentage change,2005–15
(Continued from previous page)
Cleft lip and cleft palate 355·3(288·5 to 424·1)
196·0(150·8 to 259·3)
–44·8(–54·9 to –33·7)*
5·1(4·1 to 6·1)
2·6(2·0 to 3·5)
–48·3(–57·6 to –38·1)*
Down’s syndrome 2379·1(1571·3 to 3712·7)
2 401·1(1 739·7 to 3 291·8)
0·9(–23·2 to 29·4)
34·8(23·1 to 53·9)
32·2(23·3 to 44·0)
–7·5(–29·2 to 17·8)
Turner’s syndrome 6·0(2·1 to 12·9)
6·6(2·4 to 14·4)
11·4(8·7 to 14·0)*
0·1(0·0 to 0·2)
0·1(0·0 to 0·2)
–0·1(–2·4 to 2·3)
Klinefelter’s syndrome 1·2(0·4 to 2·8)
1·3(0·5 to 3·2)
13·5(10·6 to 15·6)*
0·0(0·0 to 0·0)
0·0(0·0 to 0·0)
0·2(–2·2 to 2·0)
Other chromosomal abnormalities
2110·0(1124·3 to 4575·8)
2354·5(1418·6 to 3905·9)
11·6(–19·2 to 35·1)
30·4(16·4 to 65·4)
31·5(19·0 to 52·2)
3·6(–24·3 to 25·0)
Other congenital anomalies 19 039·2(16 026·4 to 23 290·1)
21 708·1(18 750·6 to 25 714·7)
14·0(0·3 to 26·3)*
275·0(231·4 to 336·5)
291·0(251·2 to 344·6)
5·8(–6·6 to 16·7)
Skin and subcutaneous diseases 42 069·1(27 826·1 to 62 299·6)
47 222·7(31 372·1 to 69 571·8)
12·3(11·5 to 13·2)*
639·6(426·1 to 942·5)
643·4(428·2 to 946·7)
0·6(0·1 to 1·2)*
Dermatitis 7733·8(5244·5 to 10760·5)
8788·0(5957·2 to 12275·5)
13·6(12·9 to 14·4)*
117·8(80·2 to 164·1)
119·7(81·3 to 166·6)
1·6(1·0 to 2·2)*
Psoriasis 5478·8(3816·1 to 7443·3)
6438·3(4487·4 to 8755·9)
17·5(16·6 to 18·4)*
87·4(60·9 to 118·7)
87·9(61·3 to 119·5)
0·6(0·0 to 1·2)
Cellulitis 406·1(251·0 to 550·4)
498·2(315·1 to 692·8)
22·7(11·9 to 34·6)*
6·9(4·3 to 9·4)
7·0(4·5 to 9·8)
1·6(–7·4 to 11·6)
Pyoderma 1070·5(714·3 to 1585·5)
1361·7(932·3 to 2020·6)
27·2(17·0 to 38·8)*
17·5(11·7 to 25·6)
19·1(13·1 to 28·2)
9·2(0·6 to 18·9)*
Scabies 4944·3(2786·4 to 8050·4)
5268·9(2947·0 to 8616·4)
6·6(3·8 to 9·5)*
73·0(41·2 to 118·8)
71·1(39·8 to 116·0)
–2·5(–4·5 to –0·5)*
Fungal skin diseases 2457·6(976·3 to 5214·9)
2783·3(1101·3 to 5914·6)
13·3(12·4 to 14·1)*
37·2(14·7 to 79·0)
37·8(15·0 to 80·3)
1·7(1·4 to 2·0)*
Viral skin diseases 4977·3(3147·1 to 7362·6)
5396·9(3412·0 to 7962·7)
8·4(7·9 to 9·0)*
73·7(46·7 to 109·3)
73·0(46·2 to 107·9)
–1·0(–1·4 to –0·6)*
Acne vulgaris 6553·4(3137·7 to 12159·0)
6854·0(3271·3 to 12744·4)
4·6(3·5 to 5·7)*
91·1(43·7 to 169·0)
91·9(43·9 to 171·0)
0·8(–0·1 to 1·8)
Alopecia areata 610·5(376·1 to 911·7)
695·6(427·5 to 1035·9)
13·9(13·1 to 14·7)*
9·4(5·8 to 14·0)
9·3(5·7 to 13·8)
–1·0(–1·7 to –0·4)*
Pruritus 631·4(306·3 to 1152·1)
741·6(359·8 to 1349·6)
17·5(15·5 to 19·4)*
10·1(4·9 to 18·5)
10·2(4·9 to 18·6)
0·5(–0·7 to 1·7)
Urticaria 3718·5(2297·3 to 5286·3)
4115·7(2560·6 to 5836·2)
10·7(9·5 to 12·0)*
55·5(34·5 to 78·7)
55·5(34·6 to 78·7)
0·0(–0·5 to 0·4)
Decubitus ulcer 494·1(328·7 to 602·5)
609·1(415·1 to 738·7)
23·3(17·3 to 33·2)*
9·8(6·5 to 11·9)
9·4(6·4 to 11·3)
–4·3(–8·9 to 3·7)*
Other skin and subcutaneous diseases
2992·7(1486·8 to 5413·5)
3671·3(1817·7 to 6638·7)
22·7(21·9 to 23·5)*
50·2(24·9 to 90·8)
51·5(25·5 to 93·2)
2·6(2·1 to 3·3)*
Sense organ diseases 54 708·4(38 076·6 to 75 346·3)
68 515·2(47 752·5 to 94 246·6)
25·2(24·2 to 26·4)*
993·6(694·9 to 1 361·8)
999·9(697·1 to 1 370·3)
0·6(–0·1 to 1·3)
Glaucoma 388·4(268·1 to 538·9)
541·3(369·5 to 748·0)
39·4(37·0 to 41·9)*
8·0(5·5 to 11·2)
8·4(5·7 to 11·6)
4·3(2·6 to 5·8)*
Cataract 3091·3(2213·8 to 4152·6)
3879·7(2766·1 to 5232·4)
25·5(24·1 to 26·9)*
62·9(45·1 to 84·3)
60·3(43·0 to 81·0)
–4·2(–5·2 to –3·2)*
Macular degeneration 313·2(219·5 to 429·6)
462·4(327·4 to 633·5)
47·7(45·2 to 49·9)*
6·9(4·9 to 9·5)
7·4(5·2 to 10·1)
6·9(5·3 to 8·6)*
Refraction and accommodation disorders
12 046·9(7737·6 to 18 905·4)
14 593·8(9388·5 to 22 942·4)
21·1(20·2 to 22·1)*
207·8(133·9 to 326·0)
207·3(133·7 to 324·8)
–0·3(–0·9 to 0·4)
Age-related and other hearing loss
32 119·0(21 992·4 to 44 438·1)
40 596·8(27 842·2 to 56 168·9)
26·4(24·6 to 28·3)*
589·4(405·6 to 817·1)
595·9(409·6 to 825·0)
1·1(0·0 to 2·1)
Other vision loss 1352·0(957·1 to 1852·2)
1756·4(1247·4 to 2393·6)
29·9(27·8 to 32·1)*
23·9(17·0 to 32·5)
25·2(17·9 to 34·1)
5·6(4·3 to 6·7)*
Other sense organ diseases 5397·7(3358·7 to 7841·8)
6684·7(4178·4 to 9722·8)
23·8(22·9 to 24·8)*
94·7(59·3 to 137·2)
95·5(59·9 to 138·6)
0·9(0·2 to 1·5)*
(Table 1 continues on next page)
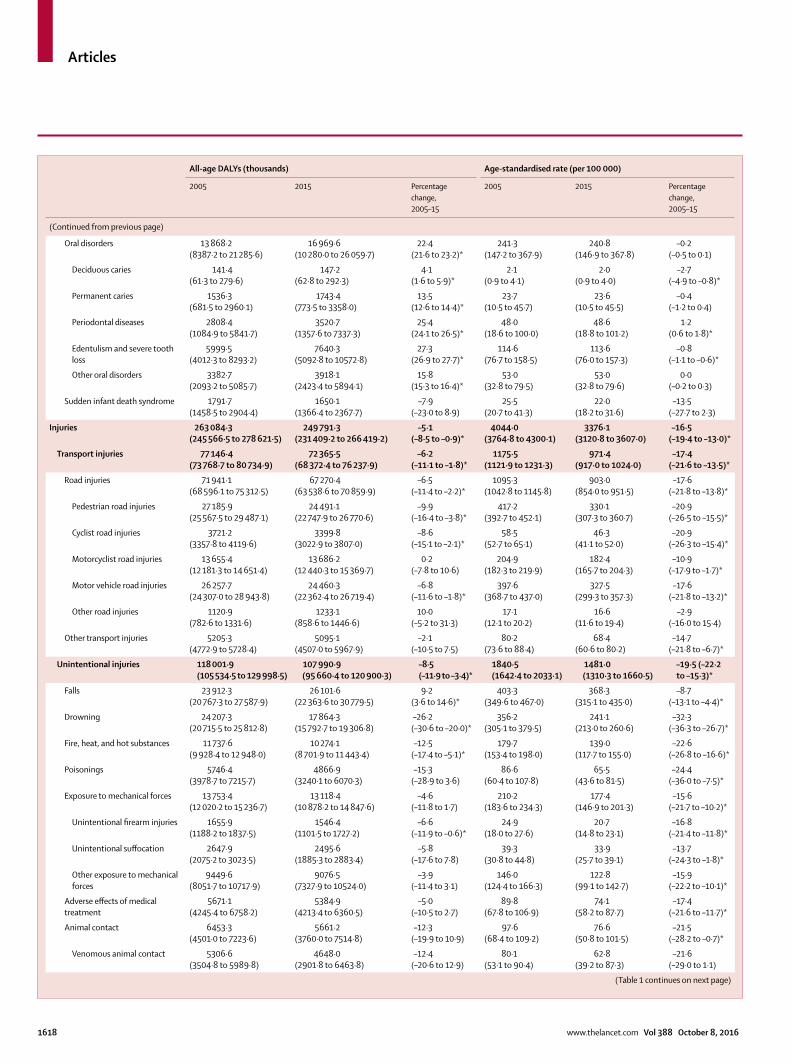
Articles
1618 www.thelancet.com Vol 388 October 8, 2016
All-age DALYs (thousands) Age-standardised rate (per 100 000)
2005 2015 Percentage change,2005–15
2005 2015 Percentage change,2005–15
(Continued from previous page)
Oral disorders 13 868·2(8387·2 to 21 285·6)
16 969·6(10 280·0 to 26 059·7)
22·4(21·6 to 23·2)*
241·3(147·2 to 367·9)
240·8(146·9 to 367·8)
–0·2(–0·5 to 0·1)
Deciduous caries 141·4(61·3 to 279·6)
147·2(62·8 to 292·3)
4·1(1·6 to 5·9)*
2·1(0·9 to 4·1)
2·0(0·9 to 4·0)
–2·7(–4·9 to –0·8)*
Permanent caries 1536·3(681·5 to 2960·1)
1743·4(773·5 to 3358·0)
13·5(12·6 to 14·4)*
23·7(10·5 to 45·7)
23·6(10·5 to 45·5)
–0·4(–1·2 to 0·4)
Periodontal diseases 2808·4(1084·9 to 5841·7)
3520·7(1357·6 to 7337·3)
25·4(24·1 to 26·5)*
48·0(18·6 to 100·0)
48·6(18·8 to 101·2)
1·2(0·6 to 1·8)*
Edentulism and severe tooth loss
5999·5(4012·3 to 8293·2)
7640·3(5092·8 to 10572·8)
27·3(26·9 to 27·7)*
114·6(76·7 to 158·5)
113·6(76·0 to 157·3)
–0·8(–1·1 to –0·6)*
Other oral disorders 3382·7(2093·2 to 5085·7)
3918·1(2423·4 to 5894·1)
15·8(15·3 to 16·4)*
53·0(32·8 to 79·5)
53·0(32·8 to 79·6)
0·0(–0·2 to 0·3)
Sudden infant death syndrome 1791·7(1458·5 to 2904·4)
1650·1(1366·4 to 2367·7)
–7·9(–23·0 to 8·9)
25·5(20·7 to 41·3)
22·0(18·2 to 31·6)
–13·5(–27·7 to 2·3)
Injuries 263 084·3(245 566·5 to 278 621·5)
249 791·3(231 409·2 to 266 419·2)
–5·1(–8·5 to –0·9)*
4044·0(3764·8 to 4300·1)
3376·1(3120·8 to 3607·0)
–16·5(–19·4 to –13·0)*
Transport injuries 77 146·4(73 768·7 to 80 734·9)
72 365·5(68 372·4 to 76 237·9)
–6·2(–11·1 to –1·8)*
1175·5(1121·9 to 1231·3)
971·4(917·0 to 1024·0)
–17·4(–21·6 to –13·5)*
Road injuries 71 941·1(68 596·1 to 75 312·5)
67 270·4(63 538·6 to 70 859·9)
–6·5(–11·4 to –2·2)*
1095·3(1042·8 to 1145·8)
903·0(854·0 to 951·5)
–17·6(–21·8 to –13·8)*
Pedestrian road injuries 27 185·9(25 567·5 to 29 487·1)
24 491·1(22 747·9 to 26 770·6)
–9·9(–16·4 to –3·8)*
417·2(392·7 to 452·1)
330·1(307·3 to 360·7)
–20·9(–26·5 to –15·5)*
Cyclist road injuries 3721·2(3357·8 to 4119·6)
3399·8(3022·9 to 3807·0)
–8·6(–15·1 to –2·1)*
58·5(52·7 to 65·1)
46·3(41·1 to 52·0)
–20·9(–26·3 to –15·4)*
Motorcyclist road injuries 13 655·4(12 181·3 to 14 651·4)
13 686·2(12 440·3 to 15 369·7)
0·2(–7·8 to 10·6)
204·9(182·3 to 219·9)
182·4(165·7 to 204·3)
–10·9(–17·9 to –1·7)*
Motor vehicle road injuries 26 257·7(24 307·0 to 28 943·8)
24 460·3(22 362·4 to 26 719·4)
–6·8(–11·6 to –1·8)*
397·6(368·7 to 437·0)
327·5(299·3 to 357·3)
–17·6(–21·8 to –13·2)*
Other road injuries 1120·9(782·6 to 1331·6)
1233·1(858·6 to 1446·6)
10·0(–5·2 to 31·3)
17·1(12·1 to 20·2)
16·6(11·6 to 19·4)
–2·9(–16·0 to 15·4)
Other transport injuries 5205·3(4772·9 to 5728·4)
5095·1(4507·0 to 5967·9)
–2·1(–10·5 to 7·5)
80·2(73·6 to 88·4)
68·4(60·6 to 80·2)
–14·7(–21·8 to –6·7)*
Unintentional injuries 118 001·9 (105 534·5 to 129 998·5)
107 990·9(95 660·4 to 120 900·3)
–8·5 (–11·9 to –3·4)*
1840·5(1642·4 to 2033·1)
1481·0(1310·3 to 1660·5)
–19·5 (–22·2 to –15·3)*
Falls 23 912·3(20 767·3 to 27 587·9)
26 101·6(22 363·6 to 30 779·5)
9·2(3·6 to 14·6)*
403·3(349·6 to 467·0)
368·3(315·1 to 435·0)
–8·7(–13·1 to –4·4)*
Drowning 24 207·3(20 715·5 to 25 812·8)
17 864·3(15 792·7 to 19 306·8)
–26·2(–30·6 to –20·0)*
356·2(305·1 to 379·5)
241·1(213·0 to 260·6)
–32·3(–36·3 to –26·7)*
Fire, heat, and hot substances 11 737·6(9 928·4 to 12 948·0)
10 274·1(8 701·9 to 11 443·4)
–12·5(–17·4 to –5·1)*
179·7(153·4 to 198·0)
139·0(117·7 to 155·0)
–22·6(–26·8 to –16·6)*
Poisonings 5746·4(3978·7 to 7215·7)
4866·9(3240·1 to 6070·3)
–15·3(–28·9 to 3·6)
86·6(60·4 to 107·8)
65·5(43·6 to 81·5)
–24·4(–36·0 to –7·5)*
Exposure to mechanical forces 13 753·4(12 020·2 to 15 236·7)
13 118·4(10 878·2 to 14 847·6)
–4·6(–11·8 to 1·7)
210·2(183·6 to 234·3)
177·4(146·9 to 201·3)
–15·6(–21·7 to –10·2)*
Unintentional fi rearm injuries 1655·9(1188·2 to 1837·5)
1546·4(1101·5 to 1727·2)
–6·6(–11·9 to –0·6)*
24·9(18·0 to 27·6)
20·7(14·8 to 23·1)
–16·8(–21·4 to –11·8)*
Unintentional suff ocation 2647·9(2075·2 to 3023·5)
2495·6(1885·3 to 2883·4)
–5·8(–17·6 to 7·8)
39·3(30·8 to 44·8)
33·9(25·7 to 39·1)
–13·7(–24·3 to –1·8)*
Other exposure to mechanical forces
9449·6(8051·7 to 10717·9)
9076·5(7327·9 to 10524·0)
–3·9(–11·4 to 3·1)
146·0(124·4 to 166·3)
122·8(99·1 to 142·7)
–15·9(–22·2 to –10·1)*
Adverse eff ects of medical treatment
5671·1(4245·4 to 6758·2)
5384·9(4213·4 to 6360·5)
–5·0(–10·5 to 2·7)
89·8(67·8 to 106·9)
74·1(58·2 to 87·7)
–17·4(–21·6 to –11·7)*
Animal contact 6453·3(4501·0 to 7223·6)
5661·2(3760·0 to 7514·8)
–12·3(–19·9 to 10·9)
97·6(68·4 to 109·2)
76·6(50·8 to 101·5)
–21·5(–28·2 to –0·7)*
Venomous animal contact 5306·6(3504·8 to 5989·8)
4648·0(2901·8 to 6463·8)
–12·4(–20·6 to 12·9)
80·1(53·1 to 90·4)
62·8(39·2 to 87·3)
–21·6(–29·0 to 1·1)
(Table 1 continues on next page)

Articles
www.thelancet.com Vol 388 October 8, 2016 1619
with each recording large increases in burden from 1990 to 2005, but by 2015, all measures of DALYs and relative ranks for malaria and HIV/AIDS had fallen markedly. Trends for NCDs and injuries, both in terms of ranks and changes in disease burden, were more varied. Between 1990 and 2005, total DALYs and all-age DALY rates signifi cantly increased for many NCDs, including ischaemic heart disease, low back and neck pain, lung cancer, chronic kidney disease, and migraine. For these NCDs, their relative ranks also climbed by 2005, yet their age-standardised DALY rates either signifi cantly decreased or remained relatively unchanged, refl ecting the eff ects of changes in population age structure. This pattern continued through 2015 for many NCDs, and was further exemplifi ed by Alzheimer’s disease and other dementias as it rose to the 29th leading cause of global DALYs amid a signifi cant decrease in age-standardised DALY rates. From 1990 to 2005, all three measures of DALYs signifi cantly increased for a subset of NCDs (ie, sense organ diseases,
diabetes, depressive disorders, and other musculoskeletal disorders), which contributed to their rises in relative ranking. More heterogeneous patterns emerged for injuries; for instance, road injuries and interpersonal violence each rose in refl ective ranks from 2005 to 2015, despite signifi cant reductions in total DALYs, all-age DALY rates, and age-standardised DALY rates from each cause.
For at least one of their leading causes of DALYs in 2015, most age groups under 40 years old had a more than 31% decrease in total burden (fi gure 3). The causes for which DALYs largely declined included lower respiratory infections, diarrhoeal diseases, malaria, preterm birth complications, and drowning among children younger than 5 years, and HIV/AIDS and malaria for people between the ages of 5 years and 40 years. Increases in cause-specifi c DALYs varied more by age, with rising DALYs due to depressive disorders and drug use disorders for populations at age 20–30 years. DALYs from low back and neck pain increased since 2005 for many age groups.
All-age DALYs (thousands) Age-standardised rate (per 100 000)
2005 2015 Percentage change,2005–15
2005 2015 Percentage change,2005–15
(Continued from previous page)
Non-venomous animal contact
1146·7(920·0 to 1358·6)
1013·2(840·1 to 1180·4)
–11·6(–20·1 to 5·0)
17·5(14·1 to 20·6)
13·8(11·4 to 16·1)
–21·2(–28·5 to –6·9)*
Foreign body 8668·4(6684·4 to 10942·0)
8244·8(6786·9 to 9635·2)
–4·9(–14·1 to 4·8)
132·2(103·4 to 165·2)
112·4(92·8 to 131·1)
–15·0(–22·5 to –7·3)*
Pulmonary aspiration and foreign body in airway
6632·4(4907·7 to 8950·1)
6321·8(5088·3 to 7704·2)
–4·7(–15·7 to 6·1)
101·0(76·1 to 134·5)
86·2(69·6 to 104·7)
–14·7(–23·9 to –6·2)*
Foreign body in eyes 48·8(20·8 to 87·9)
56·2(24·0 to 101·1)
15·2(13·8 to 16·7)*
0·8(0·3 to 1·4)
0·8(0·3 to 1·4)
0·5(–0·9 to 1·3)
Foreign body in other body part
1987·3(1331·1 to 2717·2)
1866·9(1394·9 to 2247·3)
–6·1(–19·8 to 6·4)
30·4(20·8 to 41·4)
25·4(19·1 to 30·6)
–16·4(–28·8 to –6·5)*
Environmental heat and cold exposure
4503·5(3641·3 to 5457·2)
4234·7(3350·6 to 5294·9)
–6·0(–10·1 to –1·4)*
74·1(59·9 to 89·9)
58·7(46·4 to 73·6)
–20·7(–24·0 to –17·1)*
Other unintentional injuries 13 348·6(11 406·7 to 15 619·1)
12 240·0(10 234·9 to 14 692·0)
–8·3(–12·9 to –3·8)*
210·9(178·2 to 249·5)
167·9(139·9 to 202·4)
–20·4(–24·1 to –16·6)*
Self-harm and interpersonal violence
58 615·7(52 794·8 to 60 379·5)
55 719·4(50 909·8 to 58 127·7)
–4·9(–9·0 to –0·8)*
889·6(801·0 to 916·0)
741·1(676·7 to 773·2)
–16·7(–20·3 to –13·0)*
Self-harm 35 819·1(31 467·1 to 37 112·4)
34 260·9(30 852·1 to 36 042·4)
–4·4(–10·4 to 1·6)
551·9(484·7 to 571·2)
457·9(412·2 to 481·5)
–17·0(–22·3 to –11·9)*
Interpersonal violence 22 796·5(20 747·8 to 23 566·7)
21 458·5(19 354·8 to 22 540·1)
–5·9(–9·0 to –2·0)*
337·6(308·1 to 349·1)
283·3(255·6 to 297·4)
–16·1(–18·8 to –12·7)*
Assault by fi rearm 8856·3(7747·9 to 9172·1)
9188·1(7854·5 to 9689·2)
3·7(0·0 to 8·2)
129·0(113·0 to 133·6)
120·7(103·2 to 127·3)
–6·4(–9·9 to –2·4)*
Assault by sharp object 5425·2(5050·4 to 5731·6)
4546·1(4223·1 to 4937·8)
–16·2(–20·6 to –11·2)*
80·5(75·1 to 85·0)
59·9(55·6 to 65·0)
–25·6(–29·6 to –21·2)*
Assault by other means 8515·1(7723·3 to 9065·4)
7724·3(6927·0 to 8395·8)
–9·3(–14·2 to –2·7)*
128·2(116·6 to 136·2)
102·7(92·2 to 111·6)
–19·8(–24·2 to –14·1)*
Forces of nature, war, and legal intervention
9320·3(6951·1 to 11 778·4)
13 715·5(8561·9 to 18 537·5)
47·2(–1·9 to 100·5)
138·4(103·8 to 174·8)
182·6(114·4 to 246·3)
31·9(–11·6 to 79·5)
Exposure to forces of nature 6203·9(4037·7 to 8412·0)
1435·5(1092·6 to 1846·4)
–76·9(–81·2 to –69·4)*
91·9(60·2 to 124·2)
19·6(14·9 to 25·2)
–78·7(–82·7 to –72·0)*
Collective violence and legal intervention
3116·4(2504·2 to 3760·8)
12 279·9(7208·0 to 17 075·2)
294·0(175·8 to 394·3)*
46·5(37·4 to 56·1)
163·0(95·9 to 226·4)
250·5(144·1 to 341·2)*
Data in parentheses are 95% uncertainty intervals. DALYs=disability-adjusted life-years. G6PD=glucose-6-phosphate dehydrogenase. *Percentage changes that are statistically signifi cant.
Table 1: Global all-age DALYs and age-standardised DALY rates in 2005 and 2015 with median percentage change between 2005 and 2015 for all causes
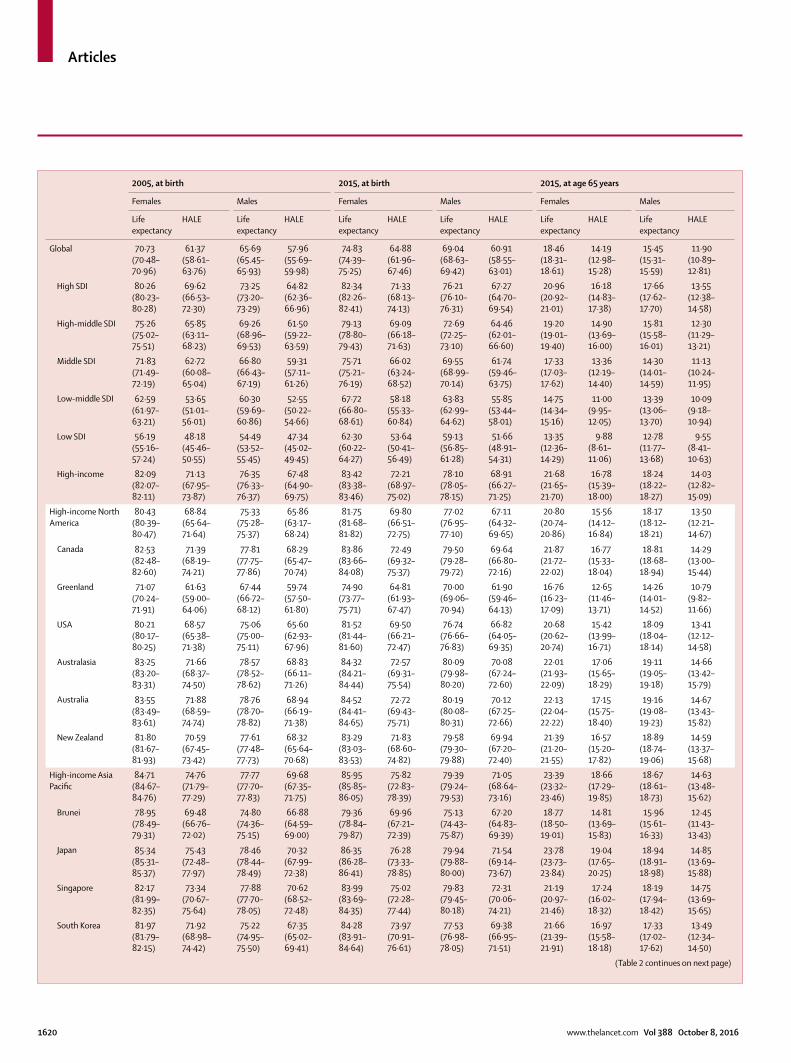
Articles
1620 www.thelancet.com Vol 388 October 8, 2016
2005, at birth 2015, at birth 2015, at age 65 years
Females Males Females Males Females Males
Life expectancy
HALE Life expectancy
HALE Life expectancy
HALE Life expectancy
HALE Life expectancy
HALE Life expectancy
HALE
Global 70·73(70·48–70·96)
61·37(58·61–63·76)
65·69(65.45–65·93)
57·96(55·69–59·98)
74·83(74·39–75·25)
64·88(61·96–67·46)
69·04(68·63–69·42)
60·91(58·55–63·01)
18·46(18·31–18·61)
14·19(12·98–15·28)
15·45(15·31–15·59)
11·90(10·89–12·81)
High SDI 80·26(80·23–80·28)
69·62(66·53–72·30)
73·25(73·20–73·29)
64·82(62·36–66·96)
82·34(82·26–82·41)
71·33(68·13–74·13)
76·21(76·10–76·31)
67·27(64·70–69·54)
20·96(20·92–21·01)
16·18(14·83–17·38)
17·66(17·62–17·70)
13·55(12·38–14·58)
High-middle SDI 75·26(75·02–75·51)
65·85(63·11–68·23)
69·26(68·96–69·53)
61·50(59·22–63·59)
79·13(78·80–79·43)
69·09(66·18–71·63)
72·69(72·25–73·10)
64·46(62·01–66·60)
19·20(19·01–19·40)
14·90 (13·69–16·00)
15·81(15·58–16·01)
12·30(11·29–13·21)
Middle SDI 71·83(71·49–72·19)
62·72(60·08–65·04)
66·80(66·43–67·19)
59·31(57·11–61·26)
75·71(75·21–76·19)
66·02(63·24–68·52)
69·55(68·99–70·14)
61·74(59·46–63·75)
17·33(17·03–17·62)
13·36(12·19–14·40)
14·30(14·01–14·59)
11·13(10·24–11·95)
Low-middle SDI 62·59(61·97–63·21)
53·65(51·01–56·01)
60·30(59·69–60·86)
52·55(50·22–54·66)
67·72(66·80–68·61)
58·18(55·33–60·84)
63·83(62·99–64·62)
55·85(53·44–58·01)
14·75(14·34–15·16)
11·00(9·95–12·05)
13·39(13·06–13·70)
10·09(9·18–10·94)
Low SDI 56·19(55·16–57·24)
48·18(45·46–50·55)
54·49(53·52–55·45)
47·34(45·02–49·45)
62·30(60·22–64·27)
53·64(50·41–56·49)
59·13(56·85–61·28)
51·66(48·91–54·31)
13·35(12·36–14·29)
9·88(8·61–11·06)
12·78(11·77–13·68)
9·55(8·41–10·63)
High-income 82·09(82·07–82·11)
71·13(67·95–73·87)
76·35(76·33–76·37)
67·48(64·90–69·75)
83·42(83·38–83·46)
72·21(68·97–75·02)
78·10 (78·05–78·15)
68·91(66·27–71·25)
21·68(21·65–21·70)
16·78(15·39–18·00)
18·24(18·22–18·27)
14·03(12·82–15·09)
High-income North America
80·43(80·39–80·47)
68·84(65·64–71·64)
75·33(75·28–75·37)
65·86(63·17–68·24)
81·75(81·68–81·82)
69·80(66·51–72·75)
77·02(76·95–77·10)
67·11(64·32–69·65)
20·80(20·74–20·86)
15·56(14·12–16·84)
18·17(18·12–18·21)
13·50(12·21–14·67)
Canada 82·53(82·48–82·60)
71·39(68·19–74·21)
77·81(77·75–77·86)
68·29(65·47–70·74)
83·86(83·66–84·08)
72·49(69·32–75·37)
79·50 (79·28–79·72)
69·64(66·80–72·16)
21·87(21·72–22·02)
16·77(15·33–18·04)
18·81(18·68–18·94)
14·29(13·00–15·44)
Greenland 71·07(70·24–71·91)
61·63(59·00–64·06)
67·44(66·72–68·12)
59·74(57·50–61·80)
74·90(73·77–75·71)
64·81(61·93–67·47)
70·00(69·06–70·94)
61·90(59·46–64·13)
16·76(16·23–17·09)
12·65(11·46–13·71)
14·26(14·01–14·52)
10·79(9·82–11·66)
USA 80·21(80·17–80·25)
68·57(65·38–71·38)
75·06(75·00–75·11)
65·60(62·93–67·96)
81·52(81·44–81·60)
69·50 (66·21–72·47)
76·74(76·66–76·83)
66·82(64·05–69·35)
20·68(20·62–20·74)
15·42(13·99–16·71)
18·09(18·04–18·14)
13·41(12·12–14·58)
Australasia 83·25(83·20–83·31)
71·66(68·37–74·50)
78·57(78·52–78·62)
68·83(66·11–71·26)
84·32(84·21–84·44)
72·57(69·31–75·54)
80·09(79·98–80·20)
70·08(67·24–72·60)
22·01(21·93–22·09)
17·06(15·65–18·29)
19·11(19·05–19·18)
14·66(13·42–15·79)
Australia 83·55(83·49–83·61)
71·88(68·59–74·74)
78·76(78·70–78·82)
68·94(66·19–71·38)
84·52(84·41–84·65)
72·72(69·43–75·71)
80·19(80·08–80·31)
70·12(67·25–72·66)
22·13(22·04–22·22)
17·15(15·75–18·40)
19·16(19·08–19·23)
14·67(13·43–15·82)
New Zealand 81·80(81·67–81·93)
70·59(67·45–73·42)
77·61(77·48–77·73)
68·32(65·64–70·68)
83·29(83·03–83·53)
71·83(68·60–74·82)
79·58(79·30–79·88)
69·94(67·20–72·40)
21·39(21·20–21·55)
16·57(15·20–17·82)
18·89(18·74–19·06)
14·59(13·37–15·68)
High-income Asia Pacifi c
84·71(84·67–84·76)
74·76(71·79–77·29)
77·77(77·70–77·83)
69·68(67·35–71·75)
85·95(85·85–86·05)
75·82(72·83–78·39)
79·39(79·24–79·53)
71·05(68·64–73·16)
23·39(23·32–23·46)
18·66(17·29–19·85)
18·67(18·61–18·73)
14·63(13·48–15·62)
Brunei 78·95(78·49–79·31)
69·48(66·76–72·02)
74·80(74·36–75·15)
66·88(64·59–69·00)
79·36(78·84–79·87)
69·96(67·21–72·39)
75·13(74·43–75·87)
67·20(64·83–69·39)
18·77(18·50–19·01)
14·81(13·69–15·83)
15·96(15·61–16·33)
12·45(11·43–13·43)
Japan 85·34(85·31–85·37)
75·43(72·48–77·97)
78·46(78·44–78·49)
70·32(67·99–72·38)
86·35(86·28–86·41)
76·28(73·33–78·85)
79·94(79·88–80·00)
71·54(69·14–73·67)
23·78(23·73–23·84)
19·04(17·65–20·25)
18·94(18·91–18·98)
14·85(13·69–15·88)
Singapore 82·17(81·99–82·35)
73·34(70·67–75·64)
77·88(77·70–78·05)
70·62(68·52–72·48)
83·99(83·69–84·35)
75·02(72·28–77·44)
79·83(79·45–80·18)
72·31(70·06–74·21)
21·19(20·97–21·46)
17·24(16·02–18·32)
18·19(17·94–18·42)
14·75(13·69–15·65)
South Korea 81·97(81·79–82·15)
71·92(68·98–74·42)
75·22(74·95–75·50)
67·35(65·02–69·41)
84·28(83·91–84·64)
73·97(70·91–76·61)
77·53(76·98–78·05)
69·38(66·95–71·51)
21·66(21·39–21·91)
16·97(15·58–18·18)
17·33(17·02–17·62)
13·49(12·34–14·50)
(Table 2 continues on next page)
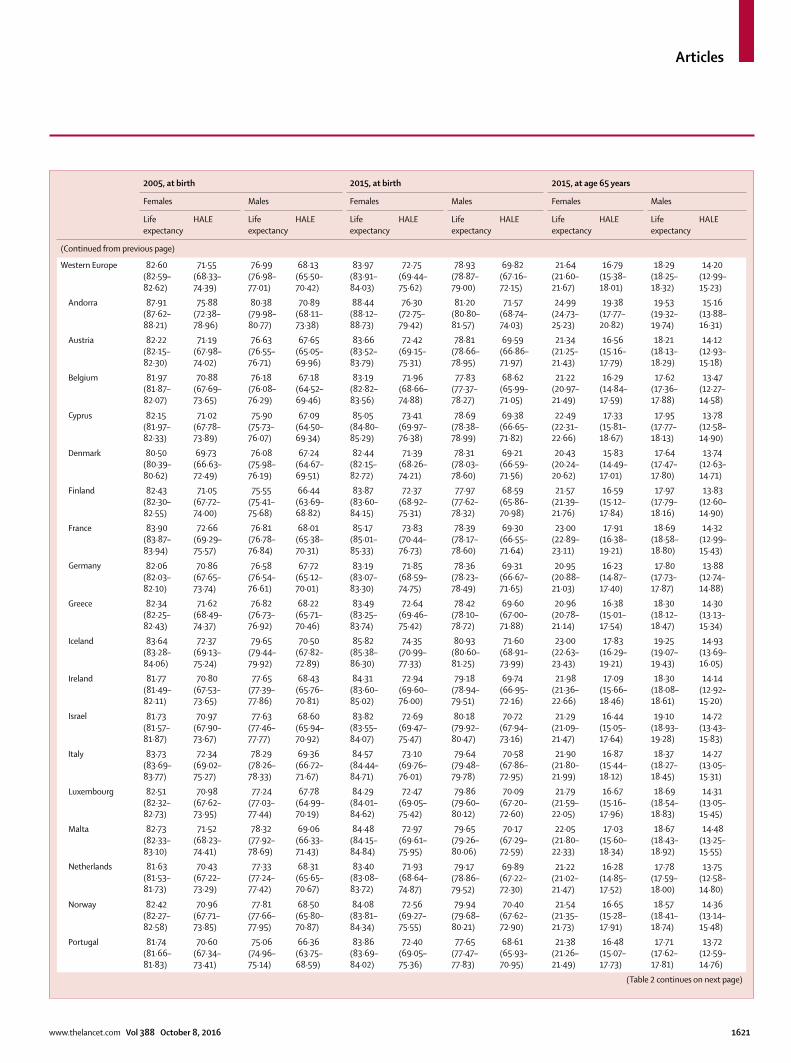
Articles
www.thelancet.com Vol 388 October 8, 2016 1621
2005, at birth 2015, at birth 2015, at age 65 years
Females Males Females Males Females Males
Life expectancy
HALE Life expectancy
HALE Life expectancy
HALE Life expectancy
HALE Life expectancy
HALE Life expectancy
HALE
(Continued from previous page)
Western Europe 82·60(82·59–82·62)
71·55(68·33–74·39)
76·99(76·98–77·01)
68·13(65·50–70·42)
83·97(83·91–84·03)
72·75(69·44–75·62)
78·93(78·87–79·00)
69·82(67·16–72·15)
21·64(21·60–21·67)
16·79(15·38–18·01)
18·29(18·25–18·32)
14·20 (12·99–15·23)
Andorra 87·91(87·62–88·21)
75·88(72·38–78·96)
80·38(79·98–80·77)
70·89(68·11–73·38)
88·44(88·12–88·73)
76·30 (72·75–79·42)
81·20(80·80–81·57)
71·57(68·74–74·03)
24·99(24·73–25·23)
19·38(17·77–20·82)
19·53(19·32–19·74)
15·16(13·88–16·31)
Austria 82·22(82·15–82·30)
71·19(67·98–74·02)
76·63(76·55–76·71)
67·65(65·05–69·96)
83·66(83·52–83·79)
72·42(69·15–75·31)
78·81(78·66–78·95)
69·59(66·86–71·97)
21·34(21·25–21·43)
16·56(15·16–17·79)
18·21(18·13–18·29)
14·12(12·93–15·18)
Belgium 81·97(81·87–82·07)
70·88(67·69–73·65)
76·18(76·08–76·29)
67·18(64·52–69·46)
83·19(82·82–83·56)
71·96(68·66–74·88)
77·83(77·37–78·27)
68·62(65·99–71·05)
21·22(20·97–21·49)
16·29(14·84–17·59)
17·62(17·36–17·88)
13·47(12·27–14·58)
Cyprus 82·15(81·97–82·33)
71·02(67·78–73·89)
75·90(75·73–76·07)
67·09(64·50–69·34)
85·05(84·80–85·29)
73·41(69·97–76·38)
78·69(78·38–78·99)
69·38(66·65–71·82)
22·49(22·31–22·66)
17·33(15·81–18·67)
17·95(17·77–18·13)
13·78(12·58–14·90)
Denmark 80·50(80·39–80·62)
69·73(66·63–72·49)
76·08(75·98–76·19)
67·24(64·67–69·51)
82·44(82·15–82·72)
71·39(68·26–74·21)
78·31(78·03–78·60)
69·21(66·59–71·56)
20·43(20·24–20·62)
15·83(14·49–17·01)
17·64(17·47–17·80)
13·74(12·63–14·71)
Finland 82·43(82·30–82·55)
71·05(67·72–74·00)
75·55(75·41–75·68)
66·44(63·69–68·82)
83·87(83·60–84·15)
72·37(68·92–75·31)
77·97(77·62–78·32)
68·59(65·86–70·98)
21·57(21·39–21·76)
16·59(15·12–17·84)
17·97(17·79–18·16)
13·83(12·60–14·90)
France 83·90 (83·87–83·94)
72·66(69·29–75·57)
76·81(76·78–76·84)
68·01(65·38–70·31)
85·17(85·01–85·33)
73·83(70·44–76·73)
78·39(78·17–78·60)
69·30 (66·55–71·64)
23·00(22·89–23·11)
17·91(16·38–19·21)
18·69(18·58–18·80)
14·32(12·99–15·43)
Germany 82·06(82·03–82·10)
70·86(67·65–73·74)
76·58(76·54–76·61)
67·72(65·12–70·01)
83·19(83·07–83·30)
71·85(68·59–74·75)
78·36(78·23–78·49)
69·31(66·67–71·65)
20·95(20·88–21·03)
16·23(14·87–17·40)
17·80(17·73–17·87)
13·88(12·74–14·88)
Greece 82·34(82·25–82·43)
71·62(68·49–74·37)
76·82(76·73–76·92)
68·22(65·71–70·46)
83·49(83·25–83·74)
72·64(69·46–75·42)
78·42(78·10–78·72)
69·60 (67·00–71·88)
20·96(20·78–21·14)
16·38(15·01–17·54)
18·30(18·12–18·47)
14·30 (13·13–15·34)
Iceland 83·64(83·28–84·06)
72·37(69·13–75·24)
79·65(79·44–79·92)
70·50(67·82–72·89)
85·82(85·38–86·30)
74·35(70·99–77·33)
80·93(80·60–81·25)
71·60 (68·91–73·99)
23·00(22·63–23·43)
17·83(16·29–19·21)
19·25(19·07–19·43)
14·93(13·69–16·05)
Ireland 81·77(81·49–82·11)
70·80(67·53–73·65)
77·65(77·39–77·86)
68·43(65·76–70·81)
84·31(83·60–85·02)
72·94(69·60–76·00)
79·18(78·94–79·51)
69·74(66·95–72·16)
21·98(21·36–22·66)
17·09(15·66–18·46)
18·30(18·08–18·61)
14·14(12·92–15·20)
Israel 81·73(81·57–81·87)
70·97(67·90–73·67)
77·63(77·46–77·77)
68·60(65·94–70·92)
83·82(83·55–84·07)
72·69(69·47–75·47)
80·18(79·92–80·47)
70·72(67·94–73·16)
21·29(21·09–21·47)
16·44(15·05–17·64)
19·10(18·93–19·28)
14·72(13·43–15·83)
Italy 83·73(83·69–83·77)
72·34(69·02–75·27)
78·29(78·26–78·33)
69·36(66·72–71·67)
84·57(84·44–84·71)
73·10(69·76–76·01)
79·64(79·48–79·78)
70·58(67·86–72·95)
21·90(21·80–21·99)
16·87(15·44–18·12)
18·37(18·27–18·45)
14·27(13·05–15·31)
Luxembourg 82·51(82·32–82·73)
70·98(67·62–73·95)
77·24(77·03–77·44)
67·78(64·99–70·19)
84·29(84·01–84·62)
72·47(69·05–75·42)
79·86(79·60–80·12)
70·09(67·20–72·60)
21·79(21·59–22·05)
16·67(15·16–17·96)
18·69(18·54–18·83)
14·31(13·05–15·45)
Malta 82·73(82·33–83·10)
71·52(68·23–74·41)
78·32(77·92–78·69)
69·06(66·33–71·43)
84·48(84·15–84·84)
72·97(69·61–75·95)
79·65(79·26–80·06)
70·17(67·29–72·59)
22·05(21·80–22·33)
17·03(15·60–18·34)
18·67(18·43–18·92)
14·48(13·25–15·55)
Netherlands 81·63(81·53–81·73)
70·43(67·22–73·29)
77·33(77·24–77·42)
68·31(65·65–70·67)
83·40 (83·08–83·72)
71·93(68·64–74·87)
79·17(78·86–79·52)
69·89(67·22–72·30)
21·22(21·02–21·47)
16·28(14·85–17·52)
17·78(17·59–18·00)
13·75(12·58–14·80)
Norway 82·42(82·27–82·58)
70·96(67·71–73·85)
77·81(77·66–77·95)
68·50 (65·80–70·87)
84·08(83·81–84·34)
72·56(69·27–75·55)
79·94(79·68–80·21)
70·40 (67·62–72·90)
21·54(21·35–21·73)
16·65(15·28–17·91)
18·57(18·41–18·74)
14·36(13·14–15·48)
Portugal 81·74(81·66–81·83)
70·60(67·34–73·41)
75·06(74·96–75·14)
66·36(63·75–68·59)
83·86(83·69–84·02)
72·40(69·05–75·36)
77·65(77·47–77·83)
68·61(65·93–70·95)
21·38(21·26–21·49)
16·48(15·07–17·73)
17·71(17·62–17·81)
13·72(12·59–14·76)
(Table 2 continues on next page)
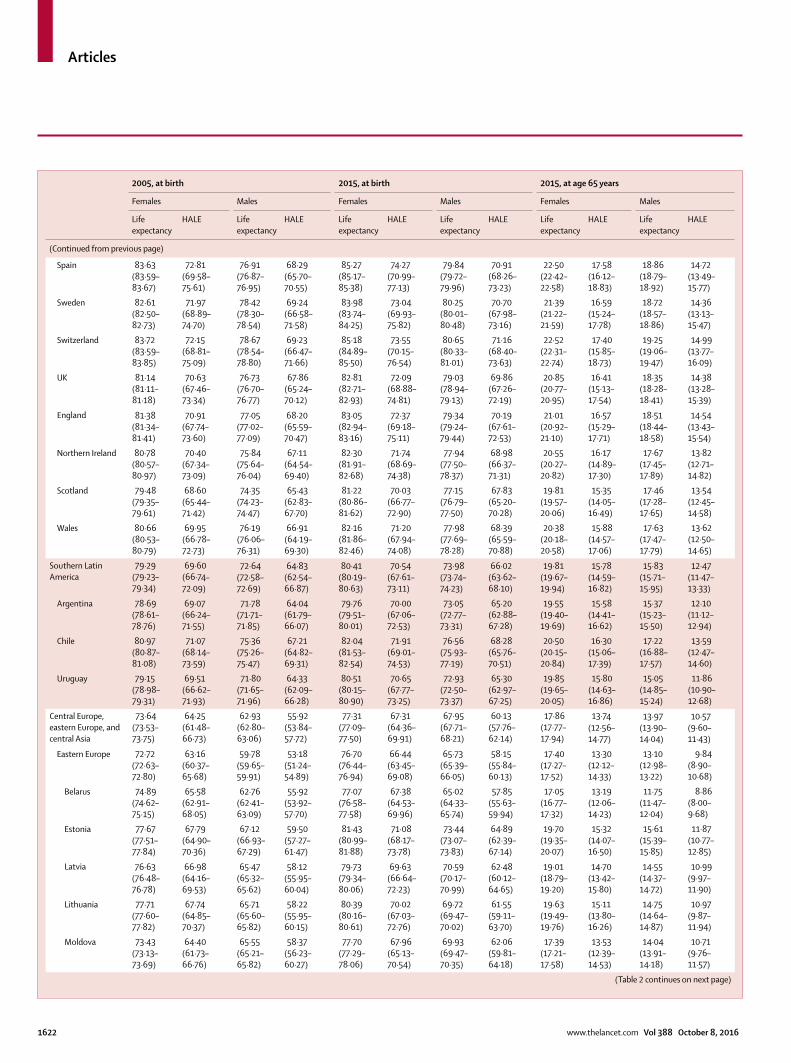
Articles
1622 www.thelancet.com Vol 388 October 8, 2016
2005, at birth 2015, at birth 2015, at age 65 years
Females Males Females Males Females Males
Life expectancy
HALE Life expectancy
HALE Life expectancy
HALE Life expectancy
HALE Life expectancy
HALE Life expectancy
HALE
(Continued from previous page)
Spain 83·63(83·59–83·67)
72·81(69·58–75·61)
76·91(76·87–76·95)
68·29(65·70–70·55)
85·27(85·17–85·38)
74·27(70·99–77·13)
79·84(79·72–79·96)
70·91(68·26–73·23)
22·50 (22·42–22·58)
17·58(16·12–18·83)
18·86(18·79–18·92)
14·72(13·49–15·77)
Sweden 82·61(82·50–82·73)
71·97(68·89–74·70)
78·42(78·30–78·54)
69·24(66·58–71·58)
83·98(83·74–84·25)
73·04(69·93–75·82)
80·25(80·01–80·48)
70·70(67·98–73·16)
21·39(21·22–21·59)
16·59(15·24–17·78)
18·72(18·57–18·86)
14·36(13·13–15·47)
Switzerland 83·72(83·59–83·85)
72·15(68·81–75·09)
78·67(78·54–78·80)
69·23(66·47–71·66)
85·18(84·89–85·50)
73·55(70·15–76·54)
80·65(80·33–81·01)
71·16(68·40–73·63)
22·52(22·31–22·74)
17·40(15·85–18·73)
19·25(19·06–19·47)
14·99(13·77–16·09)
UK 81·14(81·11–81·18)
70·63(67·46–73·34)
76·73(76·70–76·77)
67·86(65·24–70·12)
82·81(82·71–82·93)
72·09(68·88–74·81)
79·03(78·94–79·13)
69·86(67·26–72·19)
20·85(20·77–20·95)
16·41(15·13–17·54)
18·35(18·28–18·41)
14·38(13·28–15·39)
England 81·38(81·34–81·41)
70·91(67·74–73·60)
77·05(77·02–77·09)
68·20(65·59–70·47)
83·05(82·94–83·16)
72·37(69·18–75·11)
79·34(79·24–79·44)
70·19(67·61–72·53)
21·01(20·92–21·10)
16·57(15·29–17·71)
18·51(18·44–18·58)
14·54(13·43–15·54)
Northern Ireland 80·78(80·57–80·97)
70·40(67·34–73·09)
75·84(75·64–76·04)
67·11(64·54–69·40)
82·30(81·91–82·68)
71·74(68·69–74·38)
77·94(77·50–78·37)
68·98(66·37–71·31)
20·55(20·27–20·82)
16·17(14·89–17·30)
17·67(17·45–17·89)
13·82(12·71–14·82)
Scotland 79·48(79·35–79·61)
68·60(65·44–71·42)
74·35(74·23–74·47)
65·43(62·83–67·70)
81·22(80·86–81·62)
70·03(66·77–72·90)
77·15(76·79–77·50)
67·83(65·20–70·28)
19·81(19·57–20·06)
15·35(14·05–16·49)
17·46(17·28–17·65)
13·54(12·45–14·58)
Wales 80·66(80·53–80·79)
69·95(66·78–72·73)
76·19(76·06–76·31)
66·91(64·19–69·30)
82·16(81·86–82·46)
71·20(67·94–74·08)
77·98(77·69–78·28)
68·39(65·59–70·88)
20·38(20·18–20·58)
15·88(14·57–17·06)
17·63(17·47–17·79)
13·62(12·50–14·65)
Southern Latin America
79·29(79·23–79·34)
69·60 (66·74–72·09)
72·64(72·58–72·69)
64·83(62·54–66·87)
80·41(80·19–80·63)
70·54(67·61–73·11)
73·98(73·74–74·23)
66·02(63·62–68·10)
19·81(19·67–19·94)
15·78(14·59–16·82)
15·83(15·71–15·95)
12·47(11·47–13·33)
Argentina 78·69(78·61–78·76)
69·07(66·24–71·55)
71·78(71·71–71·85)
64·04(61·79–66·07)
79·76(79·51–80·01)
70·00(67·06–72·53)
73·05(72·77–73·31)
65·20 (62·88–67·28)
19·55(19·40–19·69)
15·58(14·41–16·62)
15·37(15·23–15·50)
12·10(11·12–12·94)
Chile 80·97(80·87–81·08)
71·07(68·14–73·59)
75·36(75·26–75·47)
67·21(64·82–69·31)
82·04(81·53–82·54)
71·91(69·01–74·53)
76·56(75·93–77·19)
68·28(65·76–70·51)
20·50 (20·15–20·84)
16·30 (15·06–17·39)
17·22(16·88–17·57)
13·59(12·47–14·60)
Uruguay 79·15(78·98–79·31)
69·51(66·62–71·93)
71·80 (71·65–71·96)
64·33(62·09–66·28)
80·51(80·15–80·90)
70·65(67·77–73·25)
72·93(72·50–73·37)
65·30 (62·97–67·25)
19·85(19·65–20·05)
15·80 (14·63–16·86)
15·05(14·85–15·24)
11·86(10·90–12·68)
Central Europe, eastern Europe, and central Asia
73·64(73·53–73·75)
64·25(61·48–66·73)
62·93(62·80–63·06)
55·92(53·84–57·72)
77·31(77·09–77·50)
67·31(64·36–69·91)
67·95(67·71–68·21)
60·13(57·76–62·14)
17·86(17·77–17·94)
13·74(12·56–14·77)
13·97(13·90–14·04)
10·57(9·60–11·43)
Eastern Europe 72·72(72·63–72·80)
63·16(60·37–65·68)
59·78(59·65–59·91)
53·18(51·24–54·89)
76·70(76·44–76·94)
66·44(63·45–69·08)
65·73(65·39–66·05)
58·15(55·84–60·13)
17·40(17·27–17·52)
13·30(12·12–14·33)
13·10(12·98–13·22)
9·84(8·90–10·68)
Belarus 74·89(74·62–75·15)
65·58(62·91–68·05)
62·76(62·41–63·09)
55·92(53·92–57·70)
77·07(76·58–77·58)
67·38(64·53–69·96)
65·02(64·33–65·74)
57·85(55·63–59·94)
17·05(16·77–17·32)
13·19(12·06–14·23)
11·75(11·47–12·04)
8·86(8·00–9·68)
Estonia 77·67(77·51–77·84)
67·79(64·90–70·36)
67·12(66·93–67·29)
59·50(57·27–61·47)
81·43(80·99–81·88)
71·08(68·17–73·78)
73·44(73·07–73·83)
64·89(62·39–67·14)
19·70(19·35–20·07)
15·32(14·07–16·50)
15·61(15·39–15·85)
11·87(10·77–12·85)
Latvia 76·63(76·48–76·78)
66·98(64·16–69·53)
65·47(65·32–65·62)
58·12(55·95–60·04)
79·73(79·34–80·06)
69·63(66·64–72·23)
70·59(70·17–70·99)
62·48(60·12–64·65)
19·01(18·79–19·20)
14·70(13·42–15·80)
14·55(14·37–14·72)
10·99(9·97–11·90)
Lithuania 77·71(77·60–77·82)
67·74(64·85–70·37)
65·71(65·60–65·82)
58·22(55·95–60·15)
80·39(80·16–80·61)
70·02(67·03–72·76)
69·72(69·47–70·02)
61·55(59·11–63·70)
19·63(19·49–19·76)
15·11(13·80–16·26)
14·75(14·64–14·87)
10·97(9·87–11·94)
Moldova 73·43(73·13–73·69)
64·40(61·73–66·76)
65·55(65·21–65·82)
58·37(56·23–60·27)
77·70(77·29–78·06)
67·96(65·13–70·54)
69·93(69·47–70·35)
62·06(59·81–64·18)
17·39(17·21–17·58)
13·53(12·39–14·53)
14·04(13·91–14·18)
10·71(9·76–11·57)
(Table 2 continues on next page)
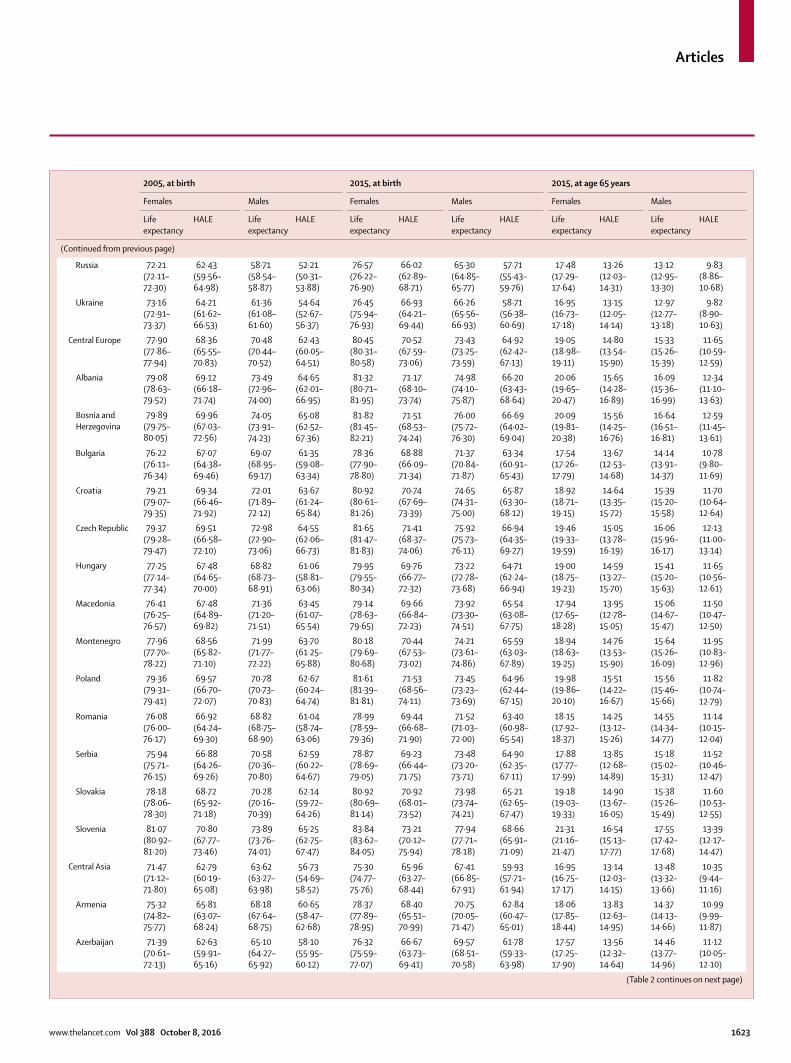
Articles
www.thelancet.com Vol 388 October 8, 2016 1623
2005, at birth 2015, at birth 2015, at age 65 years
Females Males Females Males Females Males
Life expectancy
HALE Life expectancy
HALE Life expectancy
HALE Life expectancy
HALE Life expectancy
HALE Life expectancy
HALE
(Continued from previous page)
Russia 72·21(72·11–72·30)
62·43(59·56–64·98)
58·71(58·54–58·87)
52·21(50·31–53·88)
76·57(76·22–76·90)
66·02(62·89–68·71)
65·30(64·85–65·77)
57·71(55·43–59·76)
17·48(17·29–17·64)
13·26(12·03–14·31)
13·12(12·95–13·30)
9·83(8·86–10·68)
Ukraine 73·16(72·91–73·37)
64·21(61·62–66·53)
61·36(61·08–61·60)
54·64(52·67–56·37)
76·45(75·94–76·93)
66·93(64·21–69·44)
66·26(65·56–66·93)
58·71(56·38–60·69)
16·95(16·73–17·18)
13·15(12·05–14·14)
12·97(12·77–13·18)
9·82(8·90–10·63)
Central Europe 77·90(77·86–77·94)
68·36(65·55–70·83)
70·48(70·44–70·52)
62·43(60·05–64·51)
80·45(80·31–80·58)
70·52(67·59–73·06)
73·43(73·25–73·59)
64·92(62·42–67·13)
19·05(18·98–19·11)
14·80(13·54–15·90)
15·33(15·26–15·39)
11·65(10·59–12·59)
Albania 79·08(78·63–79·52)
69·12(66·18–71·74)
73·49(72·96–74·00)
64·65(62·01–66·95)
81·32(80·71–81·95)
71·17(68·10–73·74)
74·98(74·10–75·87)
66·20(63·43–68·64)
20·06(19·65–20·47)
15·65(14·28–16·89)
16·09(15·36–16·99)
12·34(11·10–13·63)
Bosnia and Herzegovina
79·89(79·75–80·05)
69·96(67·03–72·56)
74·05(73·91–74·23)
65·08(62·52–67·36)
81·82(81·45–82·21)
71·51(68·53–74·24)
76·00(75·72–76·30)
66·69(64·02–69·04)
20·09(19·81–20·38)
15·56(14·25–16·76)
16·64(16·51–16·81)
12·59(11·45–13·61)
Bulgaria 76·22(76·11–76·34)
67·07(64·38–69·46)
69·07(68·95–69·17)
61·35(59·08–63·34)
78·36(77·90–78·80)
68·88(66·09–71·34)
71·37(70·84–71·87)
63·34(60·91–65·43)
17·54(17·26–17·79)
13·67(12·53–14·68)
14·14(13·91–14·37)
10·78(9·80–11·69)
Croatia 79·21(79·07–79·35)
69·34(66·46–71·92)
72·01(71·89–72·12)
63·67(61·24–65·84)
80·92(80·61–81·26)
70·74(67·69–73·39)
74·65(74·31–75·00)
65·87(63·30–68·12)
18·92(18·71–19·15)
14·64(13·35–15·72)
15·39(15·20–15·58)
11·70(10·64–12·64)
Czech Republic 79·37(79·28–79·47)
69·51(66·58–72·10)
72·98(72·90–73·06)
64·55(62·06–66·73)
81·65(81·47–81·83)
71·41(68·37–74·06)
75·92(75·73–76·11)
66·94(64·35–69·27)
19·46(19·33–19·59)
15·05(13·78–16·19)
16·06(15·96–16·17)
12·13(11·00–13·14)
Hungary 77·25(77·14–77·34)
67·48(64·65–70·00)
68·82(68·73–68·91)
61·06(58·81–63·06)
79·95(79·55–80·34)
69·76(66·77–72·32)
73·22(72·78–73·68)
64·71(62·24–66·94)
19·00(18·75–19·23)
14·59(13·27–15·70)
15·41(15·20–15·63)
11·65(10·56–12·61)
Macedonia 76·41(76·25–76·57)
67·48(64·89–69·82)
71·36(71·20–71·51)
63·45(61·07–65·54)
79·14(78·63–79·65)
69·66(66·84–72·23)
73·92(73·30–74·51)
65·54(63·08–67·75)
17·94(17·65–18·28)
13·95(12·78–15·05)
15·06(14·67–15·47)
11·50(10·47–12·50)
Montenegro 77·96(77·70–78·22)
68·56(65·82–71·10)
71·99(71·77–72·22)
63·70(61·25–65·88)
80·18(79·69–80·68)
70·44(67·53–73·02)
74·21(73·61–74·86)
65·59(63·03–67·89)
18·94(18·63–19·25)
14·76(13·53–15·90)
15·64(15·26–16·09)
11·95(10·83–12·96)
Poland 79·36(79·31–79·41)
69·57(66·70–72·07)
70·78(70·73–70·83)
62·67(60·24–64·74)
81·61(81·39–81·81)
71·53(68·56–74·11)
73·45(73·23–73·69)
64·96(62·44–67·15)
19·98(19·86–20·10)
15·51(14·22–16·67)
15·56(15·46–15·66)
11·82(10·74–12·79)
Romania 76·08(76·00–76·17)
66·92(64·24–69·30)
68·82(68·75–68·90)
61·04(58·74–63·06)
78·99(78·59–79·36)
69·44(66·68–71·90)
71·52(71·03–72·00)
63·40(60·98–65·54)
18·15(17·92–18·37)
14·25(13·12–15·26)
14·55(14·34–14·77)
11·14(10·15–12·04)
Serbia 75·94(75·71–76·15)
66·88(64·26–69·26)
70·58(70·36–70·80)
62·59(60·22–64·67)
78·87(78·69–79·05)
69·23(66·44–71·75)
73·48(73·20–73·71)
64·90(62·35–67·11)
17·88(17·77–17·99)
13·85(12·68–14·89)
15·18(15·02–15·31)
11·52(10·46–12·47)
Slovakia 78·18(78·06–78·30)
68·72(65·92–71·18)
70·28(70·16–70·39)
62·14(59·72–64·26)
80·92(80·69–81·14)
70·92(68·01–73·52)
73·98(73·74–74·21)
65·21(62·65–67·47)
19·18(19·03–19·33)
14·90(13·67–16·05)
15·38(15·26–15·49)
11·60(10·53–12·55)
Slovenia 81·07(80·92–81·20)
70·80(67·77–73·46)
73·89(73·76–74·01)
65·25(62·75–67·47)
83·84(83·62–84·05)
73·21(70·12–75·94)
77·94(77·71–78·18)
68·66(65·91–71·09)
21·31(21·16–21·47)
16·54(15·13–17·77)
17·55(17·42–17·68)
13·39(12·17–14·47)
Central Asia 71·47(71·12–71·80)
62·79(60·19–65·08)
63·62(63·27–63·98)
56·73(54·69–58·52)
75·30 (74·77–75·76)
65·96(63·27–68·44)
67·41(66·85–67·91)
59·93(57·71–61·94)
16·95(16·75–17·17)
13·14(12·03–14·15)
13·48(13·32–13·66)
10·35(9·44–11·16)
Armenia 75·32(74·82–75·77)
65·81(63·07–68·24)
68·18(67·64–68·75)
60·65(58·47–62·68)
78·37(77·89–78·95)
68·40(65·51–70·99)
70·75(70·05–71·47)
62·84(60·47–65·01)
18·06(17·85–18·44)
13·83(12·63–14·95)
14·37(14·13–14·66)
10·99(9·99–11·87)
Azerbaijan 71·39(70·61–72·13)
62·63(59·91–65·16)
65·10(64·27–65·92)
58·10(55·95–60·12)
76·32(75·59–77·07)
66·67(63·73–69·41)
69·57(68·51–70·58)
61·78(59·33–63·98)
17·57(17·25–17·90)
13·56(12·32–14·64)
14·46(13·77–14·96)
11·12(10·05–12·10)
(Table 2 continues on next page)

Articles
1624 www.thelancet.com Vol 388 October 8, 2016
2005, at birth 2015, at birth 2015, at age 65 years
Females Males Females Males Females Males
Life expectancy
HALE Life expectancy
HALE Life expectancy
HALE Life expectancy
HALE Life expectancy
HALE Life expectancy
HALE
(Continued from previous page)
Georgia 76·02(75·39–76·63)
67·04(64·39–69·40)
67·40(66·60–68·21)
60·26(58·09–62·26)
78·04(77·27–78·74)
68·48(65·63–71·10)
67·86(66·87–69·05)
60·52(58·23–62·66)
18·13(17·73–18·55)
14·12(12·89–15·23)
13·23(12·89–13·73)
10·15(9·21–11·06)
Kazakhstan 71·06(70·70–71·40)
62·23(59·70–64·57)
59·79(59·41–60·14)
53·24(51·28–54·98)
75·03(74·05–75·95)
65·52(62·54–68·31)
65·29(64·11–66·49)
57·91(55·58–60·11)
16·49(16·00–16·99)
12·70 (11·53–13·82)
12·66(12·21–13·13)
9·60(8·68–10·47)
Kyrgyzstan 70·68(70·16–71·20)
62·06(59·52–64·39)
62·56(61·96–63·23)
55·92(53·99–57·76)
74·10(73·44–74·71)
64·92(62·25–67·31)
65·60(64·83–66·41)
58·62(56·46–60·57)
16·13(15·81–16·47)
12·55(11·47–13·49)
12·64(12·31–12·98)
9·79(8·91–10·58)
Mongolia 67·72(67·00–68·42)
60·10(57·87–62·07)
59·95(59·16–60·71)
53·54(51·58–55·43)
71·87(71·03–72·67)
63·55(61·09–65·93)
62·78(61·90–63·63)
55·92(53·79–57·96)
15·12(14·80–15·43)
11·73(10·76–12·66)
11·78(11·55–12·05)
8·94(8·13–9·73)
Tajikistan 70·16(69·42–70·88)
61·79(59·20–64·06)
65·92(65·24–66·65)
58·68(56·48–60·63)
74·80(73·94–75·53)
65·67(63·00–68·18)
70·12(69·20–70·96)
62·17(59·71–64·38)
16·91(16·48–17·22)
13·20(12·13–14·21)
15·04(14·71–15·31)
11·61(10·61–12·52)
Turkmenistan 69·51(68·21–70·74)
61·31(58·75–63·67)
62·12(60·77–63·27)
55·49(53·35–57·52)
73·69(72·71–74·46)
64·83(62·09–67·28)
66·33(65·35–67·15)
59·11(56·86–61·15)
16·78(16·53–17·01)
13·09(11·99–14·06)
13·57(13·32–13·79)
10·47(9·58–11·31)
Uzbekistan 71·50(70·65–72·29)
62·93(60·29–65·29)
65·48(64·61–66·40)
58·39(56·15–60·45)
75·20(74·34–76·03)
66·03(63·32–68·49)
68·37(67·51–69·27)
60·85(58·49–63·00)
16·77(16·40–17·33)
13·10(11·98–14·12)
13·69(13·42–14·00)
10·59(9·67–11·42)
Latin America and Caribbean
76·49(76·28–76·69)
66·42(63·49–69·02)
70·45(70·24–70·68)
62·25(59·82–64·38)
78·25(77·87–78·62)
67·88(64·80–70·50)
72·20(71·73–72·62)
63·76(61·28–65·91)
18·85(18·69–19·02)
14·38(13·08–15·51)
16·25(16·11–16·40)
12·45(11·37–13·42)
Central Latin America
77·58(77·40–77·75)
67·68(64·81–70·20)
71·92(71·72–72·11)
63·73(61·30–65·83)
78·81(78·44–79·15)
68·69(65·67–71·26)
73·28(72·84–73·72)
64·88(62·36–67·07)
19·06(18·95–19·19)
14·51(13·21–15·68)
16·97(16·86–17·09)
13·05(11·91–14·05)
Colombia 78·26(78·06–78·46)
68·20(65·23–70·78)
72·02(71·80–72·23)
64·05(61·65–66·08)
80·80(80·35–81·25)
70·21(67·06–72·90)
75·15(74·58–75·65)
66·65(64·15–68·88)
20·06(19·85–20·28)
15·33(13·95–16·52)
17·46(17·28–17·64)
13·55(12·44–14·57)
Costa Rica 81·47(81·22–81·69)
70·96(67·85–73·65)
76·56(76·27–76·80)
67·84(65·19–70·12)
82·60(82·12–83·05)
71·84(68·61–74·60)
78·08(77·50–78·58)
69·11(66·46–71·44)
21·24(20·99–21·51)
16·24(14·85–17·48)
18·90 (18·66–19·12)
14·67(13·44–15·77)
El Salvador 77·02(76·56–77·45)
66·63(63·59–69·35)
68·79(68·07–69·49)
60·84(58·45–62·88)
78·94(78·06–79·85)
68·24(64·99–71·16)
70·57(69·32–71·94)
62·56(60·03–64·95)
19·55(19·10–20·06)
14·80(13·36–16·08)
17·79(17·33–18·24)
13·74(12·56–14·87)
Guatemala 73·16(72·79–73·54)
63·27(60·37–65·90)
66·41(66·08–66·75)
58·31(55·91–60·44)
75·20(73·54–77·05)
65·09(61·95–68·07)
69·81(67·75–71·79)
61·33(58·45–64·12)
17·38(16·41–18·60)
13·02(11·59–14·44)
17·18(16·45–17·95)
13·09(11·85–14·29)
Honduras 72·00(69·46–74·83)
63·00(59·75–66·13)
70·45(67·22–72·91)
62·58(59·11–65·60)
73·95(71·41–76·68)
64·71(61·55–68·01)
72·09(68·69–74·71)
64·07(60·73–67·10)
16·30(15·18–17·86)
12·48(11·19–13·99)
16·08(14·54–17·25)
12·49(11·04–13·84)
Mexico 77·72(77·45–77·95)
68·16(65·42–70·62)
72·54(72·25–72·81)
64·56(62·22–66·64)
78·32(77·98–78·60)
68·64(65·82–71·11)
73·43(73·04–73·75)
65·26(62·82–67·38)
18·65(18·59–18·70)
14·24(12·98–15·37)
16·78(16·74–16·83)
12·91(11·78–13·91)
Nicaragua 79·26(78·69–79·76)
69·03(65·97–71·74)
73·74(73·07–74·37)
65·25(62·65–67·57)
80·76(79·93–81·68)
70·31(67·22–73·07)
75·01(73·80–76·26)
66·47(63·72–69·01)
20·76(20·25–21·30)
15·88(14·42–17·17)
18·30(17·75–18·85)
14·19(12·90–15·41)
Panama 79·72(79·09–80·35)
69·27(66·25–72·03)
74·77(73·98–75·48)
66·08(63·42–68·38)
81·01(79·82–82·22)
70·21(66·90–73·23)
75·48(73·89–76·95)
66·63(63·75–69·40)
20·93(20·19–21·70)
15·90(14·35–17·37)
18·34(17·55–19·16)
14·11(12·76–15·39)
Venezuela 78·22(78·11–78·32)
67·39(64·28–70·19)
71·17(71·06–71·27)
61·93(59·15–64·31)
79·16(78·00–80·36)
68·14(64·68–71·24)
70·69(69·02–72·41)
61·62(58·62–64·44)
19·37(18·64–20·13)
14·58(13·09–15·96)
16·05(15·37–16·77)
12·05(10·85–13·25)
Andean Latin America
76·76(76·30–77·23)
66·92(64·06–69·48)
73·09(72·59–73·57)
64·22(61·57–66·57)
79·01(78·22–79·82)
68·86(65·87–71·66)
75·40 (74·51–76·28)
66·26(63·43–68·85)
19·24(18·74–19·76)
14·90(13·63–16·14)
17·61(17·15–18·06)
13·44(12·14–14·60)
(Table 2 continues on next page)
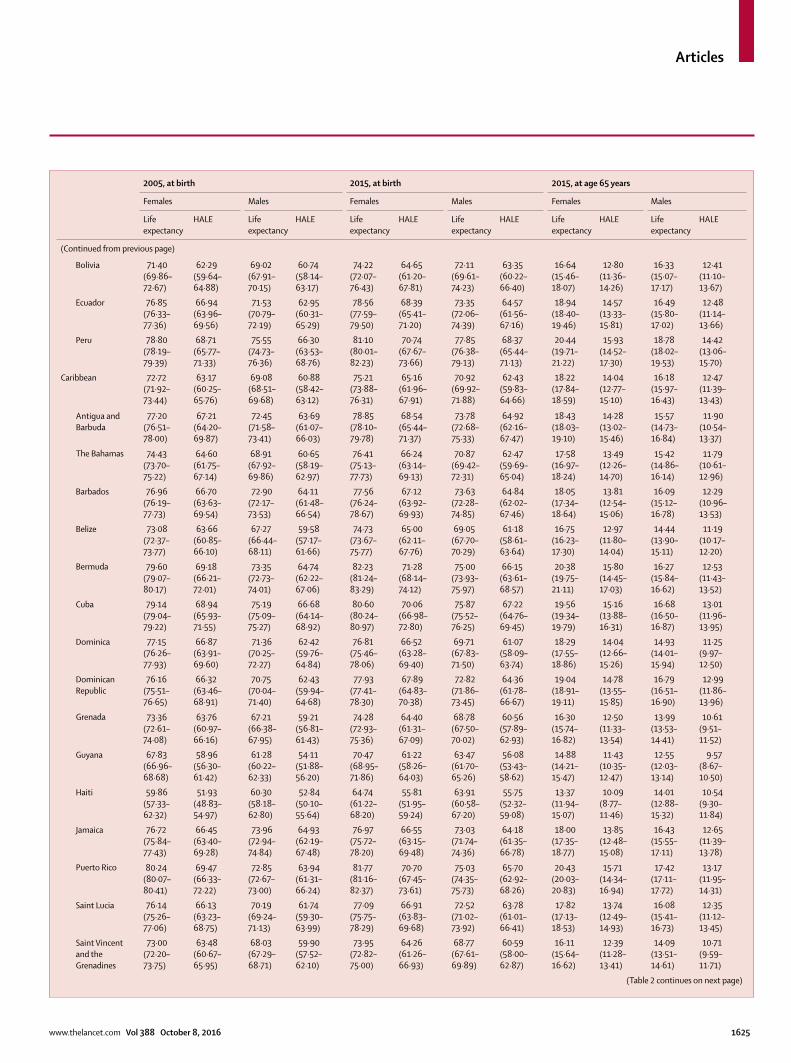
Articles
www.thelancet.com Vol 388 October 8, 2016 1625
2005, at birth 2015, at birth 2015, at age 65 years
Females Males Females Males Females Males
Life expectancy
HALE Life expectancy
HALE Life expectancy
HALE Life expectancy
HALE Life expectancy
HALE Life expectancy
HALE
(Continued from previous page)
Bolivia 71·40(69·86–72·67)
62·29(59·64–64·88)
69·02(67·91–70·15)
60·74(58·14–63·17)
74·22(72·07–76·43)
64·65(61·20–67·81)
72·11(69·61–74·23)
63·35(60·22–66·40)
16·64(15·46–18·07)
12·80 (11·36–14·26)
16·33(15·07–17·17)
12·41(11·10–13·67)
Ecuador 76·85(76·33–77·36)
66·94(63·96–69·56)
71·53(70·79–72·19)
62·95(60·31–65·29)
78·56(77·59–79·50)
68·39(65·41–71·20)
73·35(72·06–74·39)
64·57(61·56–67·16)
18·94(18·40–19·46)
14·57(13·33–15·81)
16·49(15·80–17·02)
12·48(11·14–13·66)
Peru 78·80(78·19–79·39)
68·71(65·77–71·33)
75·55(74·73–76·36)
66·30(63·53–68·76)
81·10(80·01–82·23)
70·74(67·67–73·66)
77·85(76·38–79·13)
68·37(65·44–71·13)
20·44(19·71–21·22)
15·93(14·52–17·30)
18·78(18·02–19·53)
14·42(13·06–15·70)
Caribbean 72·72(71·92–73·44)
63·17(60·25–65·76)
69·08(68·51–69·68)
60·88(58·42–63·12)
75·21(73·88–76·31)
65·16(61·96–67·91)
70·92(69·92–71·88)
62·43(59·83–64·66)
18·22(17·84–18·59)
14·04(12·77–15·10)
16·18(15·97–16·43)
12·47(11·39–13·43)
Antigua and Barbuda
77·20(76·51–78·00)
67·21(64·20–69·87)
72·45(71·58–73·41)
63·69(61·07–66·03)
78·85(78·10–79·78)
68·54(65·44–71·37)
73·78(72·68–75·33)
64·92(62·16–67·47)
18·43(18·03–19·10)
14·28(13·02–15·46)
15·57(14·73–16·84)
11·90(10·54–13·37)
The Bahamas 74·43(73·70–75·22)
64·60 (61·75–67·14)
68·91(67·92–69·86)
60·65(58·19–62·97)
76·41(75·13–77·73)
66·24(63·14–69·13)
70·87(69·42–72·31)
62·47(59·69–65·04)
17·58(16·97–18·24)
13·49(12·26–14·70)
15·42(14·86–16·14)
11·79(10·61–12·96)
Barbados 76·96(76·19–77·73)
66·70(63·63–69·54)
72·90 (72·17–73·53)
64·11(61·48–66·54)
77·56(76·24–78·67)
67·12(63·92–69·93)
73·63(72·28–74·85)
64·84(62·02–67·46)
18·05(17·34–18·64)
13·81(12·54–15·06)
16·09(15·12–16·78)
12·29(10·96–13·53)
Belize 73·08(72·37–73·77)
63·66(60·85–66·10)
67·27(66·44–68·11)
59·58(57·17–61·66)
74·73(73·67–75·77)
65·00(62·11–67·76)
69·05(67·70–70·29)
61·18(58·61–63·64)
16·75(16·23–17·30)
12·97(11·80–14·04)
14·44(13·90–15·11)
11·19(10·17–12·20)
Bermuda 79·60 (79·07–80·17)
69·18(66·21–72·01)
73·35(72·73–74·01)
64·74(62·22–67·06)
82·23(81·24–83·29)
71·28(68·14–74·12)
75·00(73·93–75·97)
66·15(63·61–68·57)
20·38(19·75–21·11)
15·80(14·45–17·03)
16·27(15·84–16·62)
12·53(11·43–13·52)
Cuba 79·14(79·04–79·22)
68·94(65·93–71·55)
75·19(75·09–75·27)
66·68(64·14–68·92)
80·60 (80·24–80·97)
70·06(66·98–72·80)
75·87(75·52–76·25)
67·22(64·76–69·45)
19·56(19·34–19·79)
15·16(13·88–16·31)
16·68(16·50–16·87)
13·01(11·96–13·95)
Dominica 77·15(76·26–77·93)
66·87(63·91–69·60)
71·36(70·25–72·27)
62·42(59·76–64·84)
76·81(75·46–78·06)
66·52(63·28–69·40)
69·71(67·83–71·50)
61·07(58·09–63·74)
18·29(17·55–18·86)
14·04(12·66–15·26)
14·93(14·01–15·94)
11·25(9·97–12·50)
Dominican Republic
76·16(75·51–76·65)
66·32(63·46–68·91)
70·75(70·04–71·40)
62·43(59·94–64·68)
77·93(77·41–78·30)
67·89(64·83–70·38)
72·82(71·86–73·45)
64·36(61·78–66·67)
19·04(18·91–19·11)
14·78(13·55–15·85)
16·79(16·51–16·90)
12·99(11·86–13·96)
Grenada 73·36(72·61–74·08)
63·76(60·97–66·16)
67·21(66·38–67·95)
59·21(56·81–61·43)
74·28(72·93–75·36)
64·40(61·31–67·09)
68·78(67·50–70·02)
60·56(57·89–62·93)
16·30(15·74–16·82)
12·50(11·33–13·54)
13·99(13·53–14·41)
10·61(9·51–11·52)
Guyana 67·83(66·96–68·68)
58·96(56·30–61·42)
61·28(60·22–62·33)
54·11(51·88–56·20)
70·47(68·95–71·86)
61·22(58·26–64·03)
63·47(61·70–65·26)
56·08(53·43–58·62)
14·88(14·21–15·47)
11·43(10·35–12·47)
12·55(12·03–13·14)
9·57(8·67–10·50)
Haiti 59·86(57·33–62·32)
51·93(48·83–54·97)
60·30(58·18–62·80)
52·84(50·10–55·64)
64·74(61·22–68·20)
55·81(51·95–59·24)
63·91(60·58–67·20)
55·75(52·32–59·08)
13·37(11·94–15·07)
10·09(8·77–11·46)
14·01(12·88–15·32)
10·54(9·30–11·84)
Jamaica 76·72(75·84–77·43)
66·45(63·40–69·28)
73·96(72·94–74·84)
64·93(62·19–67·48)
76·97(75·72–78·20)
66·55(63·15–69·48)
73·03(71·74–74·36)
64·18(61·35–66·78)
18·00(17·35–18·77)
13·85(12·48–15·08)
16·43(15·55–17·11)
12·65(11·39–13·78)
Puerto Rico 80·24(80·07–80·41)
69·47(66·33–72·22)
72·85(72·67–73·00)
63·94(61·31–66·24)
81·77(81·16–82·37)
70·70(67·45–73·61)
75·03(74·35–75·73)
65·70(62·92–68·26)
20·43(20·03–20·83)
15·71(14·34–16·94)
17·42(17·11–17·72)
13·17(11·95–14·31)
Saint Lucia 76·14(75·26–77·06)
66·13(63·23–68·75)
70·19(69·24–71·13)
61·74(59·30–63·99)
77·09(75·75–78·29)
66·91(63·83–69·68)
72·52(71·02–73·92)
63·78(61·01–66·41)
17·82(17·13–18·53)
13·74(12·49–14·93)
16·08(15·41–16·73)
12·35(11·12–13·45)
Saint Vincent and the Grenadines
73·00(72·20–73·75)
63·48(60·67–65·95)
68·03(67·29–68·71)
59·90(57·52–62·10)
73·95(72·82–75·00)
64·26(61·26–66·93)
68·77(67·61–69·89)
60·59(58·00–62·87)
16·11(15·64–16·62)
12·39(11·28–13·41)
14·09(13·51–14·61)
10·71(9·59–11·71)
(Table 2 continues on next page)
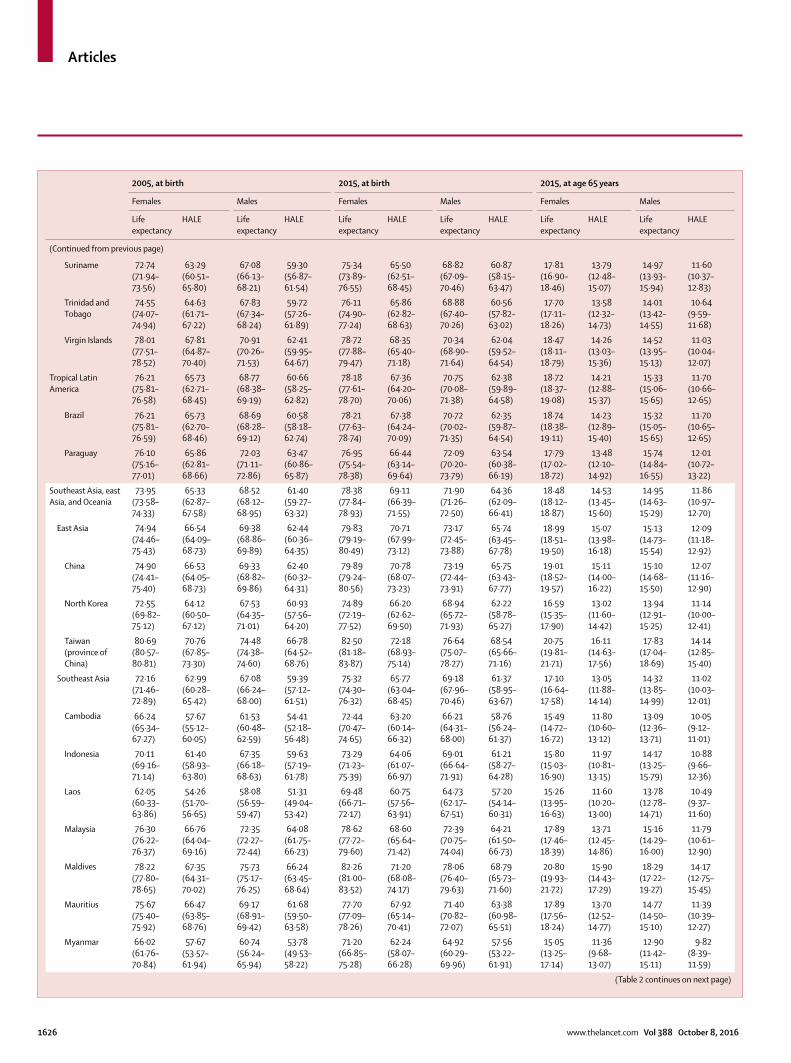
Articles
1626 www.thelancet.com Vol 388 October 8, 2016
2005, at birth 2015, at birth 2015, at age 65 years
Females Males Females Males Females Males
Life expectancy
HALE Life expectancy
HALE Life expectancy
HALE Life expectancy
HALE Life expectancy
HALE Life expectancy
HALE
(Continued from previous page)
Suriname 72·74(71·94–73·56)
63·29(60·51–65·80)
67·08(66·13–68·21)
59·30(56·87–61·54)
75·34(73·89–76·55)
65·50(62·51–68·45)
68·82(67·09–70·46)
60·87(58·15–63·47)
17·81(16·90–18·46)
13·79(12·48–15·07)
14·97(13·93–15·94)
11·60(10·37–12·83)
Trinidad and Tobago
74·55(74·07–74·94)
64·63(61·71–67·22)
67·83(67·34–68·24)
59·72(57·26–61·89)
76·11(74·90–77·24)
65·86(62·82–68·63)
68·88(67·40–70·26)
60·56(57·82–63·02)
17·70(17·11–18·26)
13·58(12·32–14·73)
14·01(13·42–14·55)
10·64(9·59–11·68)
Virgin Islands 78·01(77·51–78·52)
67·81(64·87–70·40)
70·91(70·26–71·53)
62·41(59·95–64·67)
78·72(77·88–79·47)
68·35(65·40–71·18)
70·34(68·90–71·64)
62·04(59·52–64·54)
18·47(18·11–18·79)
14·26(13·03–15·36)
14·52(13·95–15·13)
11·03(10·04–12·07)
Tropical Latin America
76·21(75·81–76·58)
65·73(62·71–68·45)
68·77(68·38–69·19)
60·66(58·25–62·82)
78·18(77·61–78·70)
67·36(64·20–70·06)
70·75(70·08–71·38)
62·38(59·89–64·58)
18·72(18·37–19·08)
14·21(12·88–15·37)
15·33(15·06–15·65)
11·70(10·66–12·65)
Brazil 76·21(75·81–76·59)
65·73(62·70–68·46)
68·69(68·28–69·12)
60·58(58·18–62·74)
78·21(77·63–78·74)
67·38(64·24–70·09)
70·72(70·02–71·35)
62·35(59·87–64·54)
18·74(18·38–19·11)
14·23(12·89–15·40)
15·32(15·05–15·65)
11·70(10·65–12·65)
Paraguay 76·10(75·16–77·01)
65·86(62·81–68·66)
72·03(71·11–72·86)
63·47(60·86–65·87)
76·95(75·54–78·38)
66·44(63·14–69·64)
72·09(70·20–73·79)
63·54(60·38–66·19)
17·79(17·02–18·72)
13·48(12·10–14·92)
15·74(14·84–16·55)
12·01(10·72–13·22)
Southeast Asia, east Asia, and Oceania
73·95(73·58–74·33)
65·33(62·87–67·58)
68·52(68·12–68·95)
61·40(59·27–63·32)
78·38(77·84–78·93)
69·11(66·39–71·55)
71·90(71·26–72·50)
64·36(62·09–66·41)
18·48(18·12–18·87)
14·53(13·45–15·60)
14·95(14·63–15·29)
11·86(10·97–12·70)
East Asia 74·94(74·46–75·43)
66·54(64·09–68·73)
69·38(68·86–69·89)
62·44(60·36–64·35)
79·83(79·19–80·49)
70·71(67·99–73·12)
73·17(72·45–73·88)
65·74(63·45–67·78)
18·99(18·51–19·50)
15·07(13·98–16·18)
15·13(14·73–15·54)
12·09(11·18–12·92)
China 74·90(74·41–75·40)
66·53(64·05–68·73)
69·33(68·82–69·86)
62·40(60·32–64·31)
79·89(79·24–80·56)
70·78(68·07–73·23)
73·19(72·44–73·91)
65·75(63·43–67·77)
19·01(18·52–19·57)
15·11(14·00–16·22)
15·10(14·68–15·50)
12·07(11·16–12·90)
North Korea 72·55(69·82–75·12)
64·12(60·50–67·12)
67·53(64·35–71·01)
60·93(57·56–64·20)
74·89(72·19–77·52)
66·20(62·62–69·50)
68·94(65·72–71·93)
62·22(58·78–65·27)
16·59(15·35–17·90)
13·02(11·60–14·42)
13·94(12·91–15·25)
11·14(10·00–12·41)
Taiwan (province of China)
80·69(80·57–80·81)
70·76(67·85–73·30)
74·48(74·38–74·60)
66·78(64·52–68·76)
82·50(81·18–83·87)
72·18(68·93–75·14)
76·64(75·07–78·27)
68·54(65·66–71·16)
20·75(19·81–21·71)
16·11(14·63–17·56)
17·83(17·04–18·69)
14·14(12·85–15·40)
Southeast Asia 72·16(71·46–72·89)
62·99(60·28–65·42)
67·08(66·24–68·00)
59·39(57·12–61·51)
75·32(74·30–76·32)
65·77(63·04–68·45)
69·18(67·96–70·46)
61·37(58·95–63·67)
17·10(16·64–17·58)
13·05(11·88–14·14)
14·32(13·85–14·99)
11·02(10·03–12·01)
Cambodia 66·24(65·34–67·27)
57·67(55·12–60·05)
61·53(60·48–62·59)
54·41(52·18–56·48)
72·44(70·47–74·65)
63·20(60·14–66·32)
66·21(64·31–68·00)
58·76(56·24–61·37)
15·49(14·72–16·72)
11·80 (10·60–13·12)
13·09(12·36–13·71)
10·05(9·12–11·01)
Indonesia 70·11(69·16–71·14)
61·40(58·93–63·80)
67·35(66·18–68·63)
59·63(57·19–61·78)
73·29(71·23–75·39)
64·06(61·07–66·97)
69·01(66·64–71·91)
61·21(58·27–64·28)
15·80(15·03–16·90)
11·97(10·81–13·15)
14·17(13·25–15·79)
10·88(9·66–12·36)
Laos 62·05(60·33–63·86)
54·26(51·70–56·65)
58·08(56·59–59·47)
51·31(49·04–53·42)
69·48(66·71–72·17)
60·75(57·56–63·91)
64·73(62·17–67·51)
57·20 (54·14–60·31)
15·26(13·95–16·63)
11·60(10·20–13·00)
13·78(12·78–14·71)
10·49(9·37–11·60)
Malaysia 76·30(76·22–76·37)
66·76(64·04–69·16)
72·35(72·27–72·44)
64·08(61·75–66·23)
78·62(77·72–79·60)
68·60 (65·64–71·42)
72·39(70·75–74·04)
64·21(61·50–66·73)
17·89(17·46–18·39)
13·71(12·45–14·86)
15·16(14·29–16·00)
11·79(10·61–12·90)
Maldives 78·22(77·80–78·65)
67·35(64·31–70·02)
75·73(75·17–76·25)
66·24(63·45–68·64)
82·26(81·00–83·52)
71·20(68·08–74·17)
78·06(76·40–79·63)
68·79(65·73–71·60)
20·80 (19·93–21·72)
15·90 (14·43–17·29)
18·29(17·22–19·27)
14·17(12·75–15·45)
Mauritius 75·67(75·40–75·92)
66·47(63·85–68·76)
69·17(68·91–69·42)
61·68(59·50–63·58)
77·70(77·09–78·26)
67·92(65·14–70·41)
71·40 (70·82–72·07)
63·38(60·98–65·51)
17·89(17·56–18·24)
13·70 (12·52–14·77)
14·77(14·50–15·10)
11·39(10·39–12·27)
Myanmar 66·02(61·76–70·84)
57·67(53·57–61·94)
60·74(56·24–65·94)
53·78(49·53–58·22)
71·20(66·85–75·28)
62·24(58·07–66·28)
64·92(60·29–69·96)
57·56(53·22–61·91)
15·05(13·25–17·14)
11·36(9·68–13·07)
12·90(11·42–15·11)
9·82(8·39–11·59)
(Table 2 continues on next page)
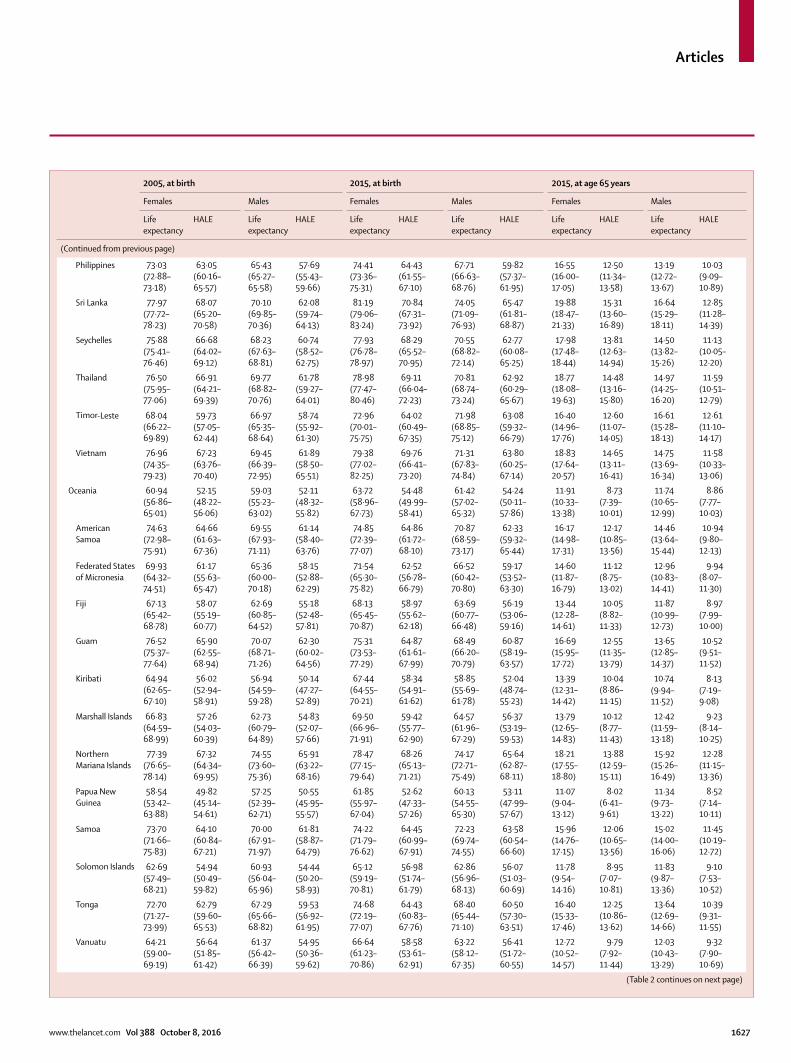
Articles
www.thelancet.com Vol 388 October 8, 2016 1627
2005, at birth 2015, at birth 2015, at age 65 years
Females Males Females Males Females Males
Life expectancy
HALE Life expectancy
HALE Life expectancy
HALE Life expectancy
HALE Life expectancy
HALE Life expectancy
HALE
(Continued from previous page)
Philippines 73·03(72·88–73·18)
63·05(60·16–65·57)
65·43(65·27–65·58)
57·69(55·43–59·66)
74·41(73·36–75·31)
64·43(61·55–67·10)
67·71(66·63–68·76)
59·82(57·37–61·95)
16·55(16·00–17·05)
12·50 (11·34–13·58)
13·19(12·72–13·67)
10·03(9·09–10·89)
Sri Lanka 77·97(77·72–78·23)
68·07(65·20–70·58)
70·10 (69·85–70·36)
62·08(59·74–64·13)
81·19(79·06–83·24)
70·84(67·31–73·92)
74·05(71·09–76·93)
65·47(61·81–68·87)
19·88(18·47–21·33)
15·31(13·60–16·89)
16·64(15·29–18·11)
12·85(11·28–14·39)
Seychelles 75·88(75·41–76·46)
66·68(64·02–69·12)
68·23(67·63–68·81)
60·74(58·52–62·75)
77·93(76·78–78·97)
68·29(65·52–70·95)
70·55(68·82–72·14)
62·77(60·08–65·25)
17·98(17·48–18·44)
13·81(12·63–14·94)
14·50(13·82–15·26)
11·13(10·05–12·20)
Thailand 76·50(75·95–77·06)
66·91(64·21–69·39)
69·77(68·82–70·76)
61·78(59·27–64·01)
78·98(77·47–80·46)
69·11(66·04–72·23)
70·81(68·74–73·24)
62·92(60·29–65·67)
18·77(18·08–19·63)
14·48(13·16–15·80)
14·97(14·25–16·20)
11·59(10·51–12·79)
Timor-Leste 68·04(66·22–69·89)
59·73(57·05–62·44)
66·97(65·35–68·64)
58·74(55·92–61·30)
72·96(70·01–75·75)
64·02(60·49–67·35)
71·98(68·85–75·12)
63·08(59·32–66·79)
16·40(14·96–17·76)
12·60(11·07–14·05)
16·61(15·28–18·13)
12·61(11·10–14·17)
Vietnam 76·96(74·35–79·23)
67·23(63·76–70·40)
69·45(66·39–72·95)
61·89(58·50–65·51)
79·38(77·02–82·25)
69·76(66·41–73·20)
71·31(67·83–74·84)
63·80 (60·25–67·14)
18·83(17·64–20·57)
14·65(13·11–16·41)
14·75(13·69–16·34)
11·58(10·33–13·06)
Oceania 60·94(56·86–65·01)
52·15(48·22–56·06)
59·03(55·23–63·02)
52·11(48·32–55·82)
63·72(58·96–67·73)
54·48(49·99–58·41)
61·42(57·02–65·32)
54·24(50·11–57·86)
11·91(10·33–13·38)
8·73(7·39–10·01)
11·74(10·65–12·99)
8·86(7·77–10·03)
American Samoa
74·63(72·98–75·91)
64·66(61·63–67·36)
69·55(67·93–71·11)
61·14(58·40–63·76)
74·85(72·39–77·07)
64·86(61·72–68·10)
70·87(68·59–73·17)
62·33(59·32–65·44)
16·17(14·98–17·31)
12·17(10·85–13·56)
14·46(13·64–15·44)
10·94(9·80–12·13)
Federated States of Micronesia
69·93(64·32–74·51)
61·17(55·63–65·47)
65·36(60·00–70·18)
58·15(52·88–62·29)
71·54(65·30–75·82)
62·52(56·78–66·79)
66·52(60·42–70·80)
59·17(53·52–63·30)
14·60(11·87–16·79)
11·12(8·75–13·02)
12·96(10·83–14·41)
9·94(8·07–11·30)
Fiji 67·13(65·42–68·78)
58·07(55·19–60·77)
62·69(60·85–64·52)
55·18(52·48–57·81)
68·13(65·45–70·87)
58·97(55·62–62·18)
63·69(60·77–66·48)
56·19(53·06–59·16)
13·44(12·28–14·61)
10·05(8·82–11·33)
11·87(10·99–12·73)
8·97(7·99–10·00)
Guam 76·52(75·37–77·64)
65·90(62·55–68·94)
70·07(68·71–71·26)
62·30(60·02–64·56)
75·31(73·53–77·29)
64·87(61·61–67·99)
68·49(66·20–70·79)
60·87(58·19–63·57)
16·69(15·95–17·72)
12·55(11·35–13·79)
13·65(12·85–14·37)
10·52(9·51–11·52)
Kiribati 64·94(62·65–67·10)
56·02(52·94–58·91)
56·94(54·59–59·28)
50·14(47·27–52·89)
67·44(64·55–70·21)
58·34(54·91–61·62)
58·85(55·69–61·78)
52·04(48·74–55·23)
13·39(12·31–14·42)
10·04(8·86–11·15)
10·74(9·94–11·52)
8·13(7·19–9·08)
Marshall Islands 66·83(64·59–68·99)
57·26(54·03–60·39)
62·73(60·79–64·89)
54·83(52·07–57·66)
69·50 (66·96–71·91)
59·42(55·77–62·90)
64·57(61·96–67·29)
56·37(53·19–59·53)
13·79(12·65–14·83)
10·12(8·77–11·43)
12·42(11·59–13·18)
9·23(8·14–10·25)
Northern Mariana Islands
77·39(76·65–78·14)
67·32(64·34–69·95)
74·55(73·60–75·36)
65·91(63·22–68·16)
78·47(77·15–79·64)
68·26(65·13–71·21)
74·17(72·71–75·49)
65·64(62·87–68·11)
18·21(17·55–18·80)
13·88(12·59–15·11)
15·92(15·26–16·49)
12·28(11·15–13·36)
Papua New Guinea
58·54(53·42–63·88)
49·82(45·14–54·61)
57·25(52·39–62·71)
50·55(45·95–55·57)
61·85(55·97–67·04)
52·62(47·33–57·26)
60·13(54·55–65·30)
53·11(47·99–57·67)
11·07(9·04–13·12)
8·02(6·41–9·61)
11·34(9·73–13·22)
8·52(7·14–10·11)
Samoa 73·70(71·66–75·83)
64·10(60·84–67·21)
70·00(67·91–71·97)
61·81(58·87–64·79)
74·22(71·79–76·62)
64·45(60·99–67·91)
72·23(69·74–74·55)
63·58(60·54–66·60)
15·96(14·76–17·15)
12·06(10·65–13·56)
15·02(14·00–16·06)
11·45(10·19–12·72)
Solomon Islands 62·69(57·49–68·21)
54·94(50·49–59·82)
60·93(56·04–65·96)
54·44(50·20–58·93)
65·12(59·19–70·81)
56·98(51·74–61·79)
62·86(56·96–68·13)
56·07(51·03–60·69)
11·78(9·54–14·16)
8·95(7·07–10·81)
11·83(9·87–13·36)
9·10(7·53–10·52)
Tonga 72·70(71·27–73·99)
62·79(59·60–65·53)
67·29(65·66–68·82)
59·53(56·92–61·95)
74·68(72·19–77·07)
64·43(60·83–67·76)
68·40 (65·44–71·10)
60·50 (57·30–63·51)
16·40 (15·33–17·46)
12·25(10·86–13·62)
13·64(12·69–14·66)
10·39(9·31–11·55)
Vanuatu 64·21(59·00–69·19)
56·64(51·85–61·42)
61·37(56·42–66·39)
54·95(50·36–59·62)
66·64(61·23–70·86)
58·58(53·61–62·91)
63·22(58·12–67·35)
56·41(51·72–60·55)
12·72(10·52–14·57)
9·79(7·92–11·44)
12·03(10·43–13·29)
9·32(7·90–10·69)
(Table 2 continues on next page)

Articles
1628 www.thelancet.com Vol 388 October 8, 2016
2005, at birth 2015, at birth 2015, at age 65 years
Females Males Females Males Females Males
Life expectancy
HALE Life expectancy
HALE Life expectancy
HALE Life expectancy
HALE Life expectancy
HALE Life expectancy
HALE
(Continued from previous page)
North Africa and Middle East
72·55(71·85–73·21)
62·33(59·42–65·02)
68·64(67·98–69·34)
59·98(57·44–62·33)
74·94(74·12–75·69)
64·29(61·31–67·14)
70·07(69·16–70·94)
61·16(58·55–63·62)
17·58(17·28–17·87)
13·07(11·80–14·25)
15·37(15·08–15·65)
11·55(10·45–12·57)
Afghanistan 51·40(47·39–55·64)
44·45(40·62–48·10)
52·67(48·93–56·74)
45·55(42·13–49·21)
54·46(50·19–58·82)
47·11(43·28–51·24)
53·34(49·22–57·70)
46·27(42·42–50·19)
9·41(8·21–10·93)
6·91(5·82–8·22)
10·57(9·49–12·37)
7·68(6·52–9·09)
Algeria 76·07(74·93–77·12)
65·55(62·46–68·52)
73·51(72·29–74·79)
64·39(61·45–67·02)
77·44(76·01–78·52)
66·66(63·44–69·65)
75·37(74·13–76·79)
65·91(63·15–68·58)
18·29(17·47–18·76)
13·73(12·34–15·01)
17·48(16·90–18·23)
13·26(11·99–14·47)
Bahrain 78·06(77·24–78·93)
66·10(62·55–69·30)
74·63(73·80–75·59)
64·92(62·04–67·48)
80·34(78·92–81·83)
67·98(64·36–71·35)
78·21(76·45–79·99)
67·89(64·67–71·12)
19·23(18·60–20·06)
14·00(12·51–15·46)
17·76(16·79–18·90)
13·22(11·71–14·75)
Egypt 72·64(72·38–72·87)
62·41(59·38–65·08)
67·69(67·45–67·94)
59·42(57·08–61·59)
74·45(73·88–74·95)
63·84(60·71–66·58)
68·71(68·13–69·28)
60·23(57·62–62·46)
16·42(16·23–16·61)
12·16(10·97–13·28)
13·50(13·34–13·66)
10·12(9·16–11·03)
Iran 74·58(72·51–76·50)
64·28(61·12–67·51)
69·64(67·24–71·98)
60·98(57·86–64·21)
77·98(75·87–80·02)
67·13(63·56–70·62)
71·85(69·18–74·18)
62·99(59·82–66·40)
17·85(16·78–19·04)
13·34(11·86–14·92)
15·06(14·08–16·17)
11·40(10·11–12·80)
Iraq 68·24(65·65–70·65)
58·57(55·18–61·60)
63·26(59·95–66·53)
54·71(51·15–58·09)
70·66(67·52–73·64)
60·53(56·47–63·92)
64·33(60·79–68·46)
55·65(51·90–59·50)
14·80(13·47–16·11)
10·88(9·40–12·25)
13·05(11·96–15·04)
9·55(8·38–10·94)
Jordan 74·44(73·52–75·33)
63·69(60·58–66·46)
74·66(73·91–75·44)
65·14(62·30–67·75)
80·69(79·65–81·78)
68·76(65·18–72·06)
76·46(75·09–77·61)
66·68(63·79–69·52)
19·84(19·18–20·58)
14·67(13·09–16·13)
17·46(16·64–18·17)
13·12(11·76–14·44)
Kuwait 80·19(79·91–80·52)
68·91(65·71–71·77)
76·27(75·99–76·54)
66·90(64·25–69·36)
81·55(80·47–82·71)
70·19(66·81–73·29)
79·43(77·94–80·67)
69·56(66·56–72·40)
19·18(18·38–20·06)
14·41(12·88–15·84)
18·94(18·09–19·69)
14·40(12·97–15·80)
Lebanon 77·64(75·78–79·42)
65·80(62·25–69·26)
77·03(74·16–79·60)
65·45(61·58–69·00)
79·87(77·76–82·32)
68·01(64·42–71·62)
77·90 (75·08–80·86)
66·81(62·93–70·47)
19·01(18·09–20·31)
14·11(12·60–15·68)
17·80(16·14–19·72)
13·07(11·28–15·01)
Libya 76·92(76·07–77·62)
66·28(63·11–69·04)
73·91(73·06–74·78)
64·74(61·95–67·21)
76·86(75·26–78·22)
66·09(62·84–69·25)
71·41(68·93–73·78)
62·45(59·39–65·54)
17·84(16·99–18·55)
13·34(11·96–14·72)
15·90(14·76–16·92)
11·99(10·61–13·33)
Morocco 73·80(70·89–76·16)
63·24(59·71–66·72)
71·62(68·72–74·08)
61·88(58·64–65·13)
75·83(72·69–79·05)
64·92(61·12–68·62)
73·32(69·45–76·58)
63·37(59·35–66·89)
17·20(15·61–19·00)
12·70(11·04–14·44)
16·39(14·35–18·01)
12·13(10·31–13·70)
Palestine 77·34(76·55–78·10)
66·84(63·82–69·70)
72·06(70·51–73·06)
62·49(59·81–65·14)
77·90(75·78–79·78)
67·44(63·98–70·52)
71·60(68·64–74·52)
62·50(59·06–65·67)
18·17(17·04–19·22)
13·84(12·39–15·21)
15·01(13·92–16·52)
11·35(9·94–12·77)
Oman 78·38(77·34–79·32)
66·81(63·47–69·91)
74·07(72·92–75·18)
64·15(61·29–66·85)
79·64(78·29–81·14)
67·75(64·31–71·05)
75·71(74·05–77·69)
65·38(62·24–68·65)
18·79(18·11–19·71)
13·71(12·25–15·17)
16·32(15·48–17·55)
12·03(10·70–13·57)
Qatar 78·31(77·49–79·11)
67·01(63·71–70·07)
75·24(73·63–76·87)
65·43(62·30–68·46)
81·20(79·43–82·88)
69·31(65·82–72·71)
79·11(76·93–81·25)
68·57(64·92–71·83)
19·76(18·65–20·98)
14·58(12·92–16·27)
18·59(17·07–19·91)
13·80 (12·07–15·51)
Saudi Arabia 80·00(79·43–80·55)
68·99(65·85–71·89)
75·95(75·29–76·58)
66·78(64·09–69·25)
82·21(81·29–83·09)
70·87(67·53–74·08)
77·45(76·34–78·53)
68·15(65·33–70·73)
20·68(19·98–21·46)
15·72(14·25–17·18)
17·77(16·98–18·51)
13·67(12·41–14·90)
Sudan 66·07(62·29–70·01)
56·47(52·50–60·70)
63·09(59·34–67·21)
54·72(50·75–58·67)
69·27(65·38–73·59)
59·38(55·50–63·72)
65·81(61·55–69·91)
57·16(53·08–61·35)
15·03(13·32–17·27)
11·20(9·59–13·17)
14·27(12·39–15·93)
10·56(8·92–12·10)
Syria 77·37(76·74–77·97)
67·20(64·25–69·78)
73·85(73·09–74·68)
65·31(62·81–67·63)
74·81(72·12–77·75)
63·82(59·86–67·73)
62·58(56·48–70·19)
54·17(48·63–61·05)
17·98(17·37–18·82)
13·46(12·11–14·74)
15·47(14·56–16·66)
11·74(10·46–12·98)
Tunisia 78·95(77·45–80·46)
68·16(64·92–71·20)
73·66(71·83–75·41)
64·38(61·36–67·24)
80·73(78·82–82·71)
69·61(66·03–72·89)
74·63(72·03–77·02)
65·26(61·88–68·39)
19·77(18·50–21·22)
14·95(13·25–16·56)
16·18(14·85–17·69)
12·24(10·67–13·82)
(Table 2 continues on next page)
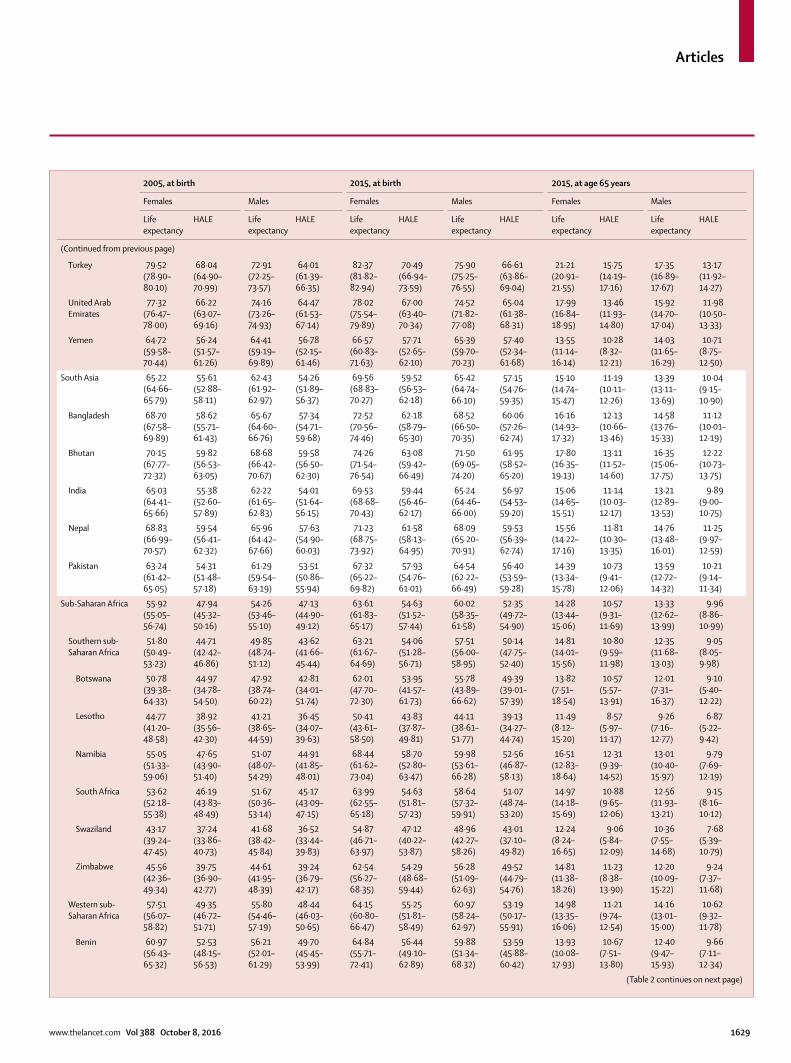
Articles
www.thelancet.com Vol 388 October 8, 2016 1629
2005, at birth 2015, at birth 2015, at age 65 years
Females Males Females Males Females Males
Life expectancy
HALE Life expectancy
HALE Life expectancy
HALE Life expectancy
HALE Life expectancy
HALE Life expectancy
HALE
(Continued from previous page)
Turkey 79·52(78·90–80·10)
68·04(64·90–70·99)
72·91(72·25–73·57)
64·01(61·39–66·35)
82·37(81·82–82·94)
70·49(66·94–73·59)
75·90 (75·25–76·55)
66·61(63·86–69·04)
21·21(20·91–21·55)
15·75(14·19–17·16)
17·35(16·89–17·67)
13·17(11·92–14·27)
United Arab Emirates
77·32(76·47–78·00)
66·22(63·07–69·16)
74·16(73·26–74·93)
64·47(61·53–67·14)
78·02(75·54–79·89)
67·00(63·40–70·34)
74·52(71·82–77·08)
65·04(61·38–68·31)
17·99(16·84–18·95)
13·46(11·93–14·80)
15·92(14·70–17·04)
11·98(10·50–13·33)
Yemen 64·72(59·58–70·44)
56·24(51·57–61·26)
64·41(59·19–69·89)
56·78(52·15–61·46)
66·57(60·83–71·63)
57·71(52·65–62·10)
65·39(59·70–70·23)
57·40(52·34–61·68)
13·55(11·14–16·14)
10·28(8·32–12·21)
14·03(11·65–16·29)
10·71(8·75–12·50)
South Asia 65·22(64·66–65·79)
55·61(52·88–58·11)
62·43(61·92–62·97)
54·26(51·89–56·37)
69·56(68·83–70·27)
59·52(56·53–62·18)
65·42(64·74–66·10)
57·15(54·76–59·35)
15·10(14·74–15·47)
11·19(10·11–12·26)
13·39(13·11–13·69)
10·04(9·15–10·90)
Bangladesh 68·70(67·58–69·89)
58·62(55·71–61·43)
65·67(64·60–66·76)
57·34(54·71–59·68)
72·52(70·56–74·46)
62·18(58·79–65·30)
68·52(66·50–70·35)
60·06(57·26–62·74)
16·16(14·93–17·32)
12·13(10·66–13·46)
14·58(13·76–15·33)
11·12(10·01–12·19)
Bhutan 70·15(67·77–72·32)
59·82(56·53–63·05)
68·68(66·42–70·67)
59·58(56·50–62·30)
74·26(71·54–76·54)
63·08(59·42–66·49)
71·50(69·05–74·20)
61·95(58·52–65·20)
17·80(16·35–19·13)
13·11(11·52–14·60)
16·35(15·06–17·75)
12·22(10·73–13·75)
India 65·03(64·41–65·66)
55·38(52·60–57·89)
62·22(61·65–62·83)
54·01(51·64–56·15)
69·53(68·68–70·43)
59·44(56·46–62·17)
65·24(64·46–66·00)
56·97(54·53–59·20)
15·06(14·65–15·51)
11·14(10·03–12·17)
13·21(12·89–13·53)
9·89(9·00–10·75)
Nepal 68·83(66·99–70·57)
59·54(56·41–62·32)
65·96(64·42–67·66)
57·63(54·90–60·03)
71·23(68·75–73·92)
61·58(58·13–64·95)
68·09(65·20–70·91)
59·53(56·39–62·74)
15·56(14·22–17·16)
11·81(10·30–13·35)
14·76(13·48–16·01)
11·25(9·97–12·59)
Pakistan 63·24(61·42–65·05)
54·31(51·48–57·18)
61·29(59·54–63·19)
53·51(50·86–55·94)
67·32(65·22–69·82)
57·93(54·76–61·01)
64·54(62·22–66·49)
56·40 (53·59–59·28)
14·39(13·34–15·78)
10·73(9·41–12·06)
13·59(12·72–14·32)
10·21(9·14–11·34)
Sub-Saharan Africa 55·92(55·05–56·74)
47·94(45·32–50·16)
54·26(53·46–55·10)
47·13(44·90–49·12)
63·61(61·83–65·17)
54·63(51·52–57·44)
60·02(58·35–61·58)
52·35(49·72–54·90)
14·28(13·44–15·06)
10·57(9·31–11·69)
13·33(12·62–13·99)
9·96(8·86–10·99)
Southern sub-Saharan Africa
51·80 (50·49–53·23)
44·71(42·42–46·86)
49·85(48·74–51·12)
43·62(41·66–45·44)
63·21(61·67–64·69)
54·06(51·28–56·71)
57·51(56·00–58·95)
50·14(47·75–52·40)
14·81(14·01–15·56)
10·80 (9·59–11·98)
12·35(11·68–13·03)
9·05(8·05–9·98)
Botswana 50·78(39·38–64·33)
44·97(34·78–54·50)
47·92(38·74–60·22)
42·81(34·01–51·74)
62·01(47·70–72·30)
53·95(41·57–61·73)
55·78(43·89–66·62)
49·39(39·01–57·39)
13·82(7·51–18·54)
10·57(5·57–13·91)
12·01(7·31–16·37)
9·10(5·40–12·22)
Lesotho 44·77(41·20–48·58)
38·92(35·56–42·30)
41·21(38·65–44·59)
36·45(34·07–39·63)
50·41(43·61–58·50)
43·83(37·87–49·81)
44·11(38·61–51·77)
39·13(34·27–44·74)
11·49(8·12–15·20)
8·57(5·97–11·17)
9·26(7·16–12·77)
6·87(5·22–9·42)
Namibia 55·05(51·33–59·06)
47·65(43·90–51·40)
51·07(48·07–54·29)
44·91(41·85–48·01)
68·44(61·62–73·04)
58·70 (52·80–63·47)
59·98(53·61–66·28)
52·56(46·87–58·13)
16·51(12·83–18·64)
12·31(9·39–14·52)
13·01(10·40–15·97)
9·79(7·69–12·19)
South Africa 53·62(52·18–55·38)
46·19(43·83–48·49)
51·67(50·36–53·14)
45·17(43·09–47·15)
63·99(62·55–65·18)
54·63(51·81–57·23)
58·64(57·32–59·91)
51·07(48·74–53·20)
14·97(14·18–15·69)
10·88(9·65–12·06)
12·56(11·93–13·21)
9·15(8·16–10·12)
Swaziland 43·17(39·24–47·45)
37·24(33·86–40·73)
41·68(38·42–45·84)
36·52(33·44–39·83)
54·87(46·71–63·97)
47·12(40·22–53·87)
48·96(42·27–58·26)
43·01(37·10–49·82)
12·24(8·24–16·65)
9·06(5·84–12·09)
10·36(7·55–14·68)
7·68(5·39–10·79)
Zimbabwe 45·56(42·36–49·34)
39·75(36·90–42·77)
44·61(41·95–48·39)
39·24(36·79–42·17)
62·54(56·27–68·35)
54·29(48·68–59·44)
56·28(51·09–62·63)
49·52(44·79–54·76)
14·81(11·38–18·26)
11·23(8·38–13·90)
12·20 (10·09–15·22)
9·24(7·37–11·68)
Western sub-Saharan Africa
57·51(56·07–58·82)
49·35(46·72–51·71)
55·80 (54·46–57·19)
48·44(46·03–50·65)
64·15(60·80–66·47)
55·25(51·81–58·49)
60·97(58·24–62·97)
53·19(50·17–55·91)
14·98(13·35–16·06)
11·21(9·74–12·54)
14·16(13·01–15·00)
10·62(9·32–11·78)
Benin 60·97(56·43–65·32)
52·53(48·15–56·53)
56·21(52·01–61·29)
49·70 (45·45–53·99)
64·84(55·71–72·41)
56·44(49·10–62·89)
59·88(51·34–68·32)
53·59(45·88–60·42)
13·93(10·08–17·93)
10·67(7·51–13·80)
12·40 (9·47–15·93)
9·66(7·11–12·34)
(Table 2 continues on next page)
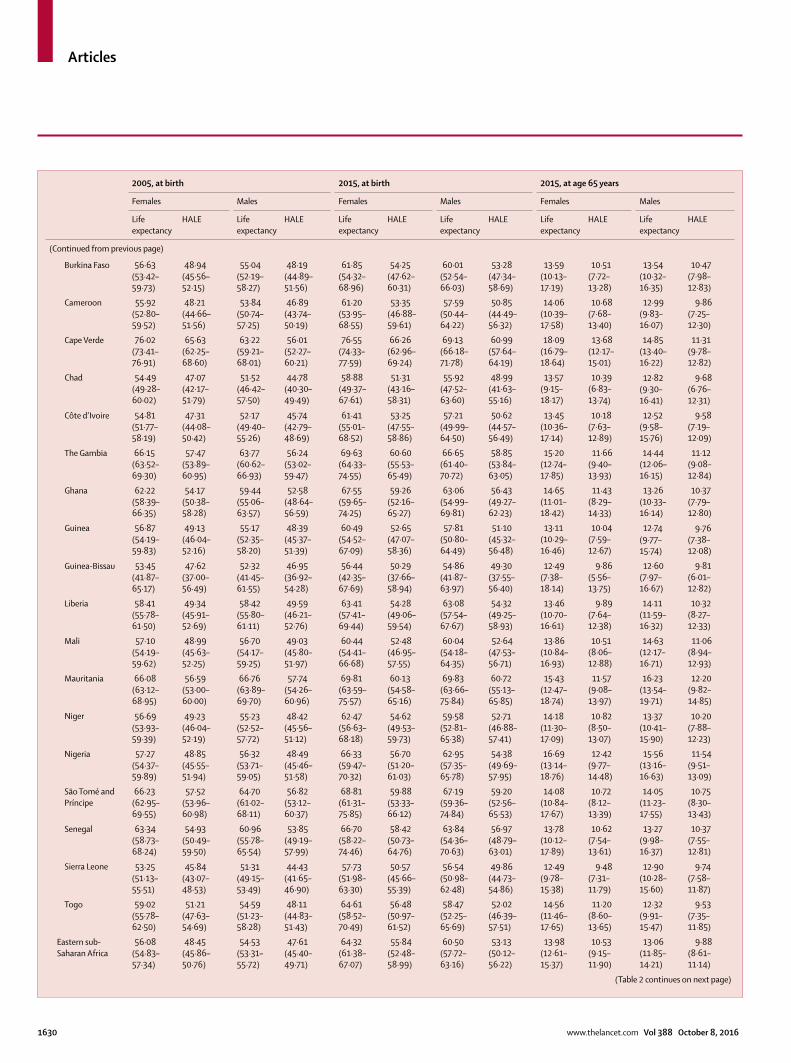
Articles
1630 www.thelancet.com Vol 388 October 8, 2016
2005, at birth 2015, at birth 2015, at age 65 years
Females Males Females Males Females Males
Life expectancy
HALE Life expectancy
HALE Life expectancy
HALE Life expectancy
HALE Life expectancy
HALE Life expectancy
HALE
(Continued from previous page)
Burkina Faso 56·63(53·42–59·73)
48·94(45·56–52·15)
55·04(52·19–58·27)
48·19(44·89–51·56)
61·85(54·32–68·96)
54·25(47·62–60·31)
60·01(52·54–66·03)
53·28(47·34–58·69)
13·59(10·13–17·19)
10·51(7·72–13·28)
13·54(10·32–16·35)
10·47(7·98–12·83)
Cameroon 55·92(52·80–59·52)
48·21(44·66–51·56)
53·84(50·74–57·25)
46·89(43·74–50·19)
61·20 (53·95–68·55)
53·35(46·88–59·61)
57·59(50·44–64·22)
50·85(44·49–56·32)
14·06(10·39–17·58)
10·68(7·68–13·40)
12·99(9·83–16·07)
9·86(7·25–12·30)
Cape Verde 76·02(73·41–76·91)
65·63(62·25–68·60)
63·22(59·21–68·01)
56·01(52·27–60·21)
76·55(74·33–77·59)
66·26(62·96–69·24)
69·13(66·18–71·78)
60·99(57·64–64·19)
18·09(16·79–18·64)
13·68(12·17–15·01)
14·85(13·40–16·22)
11·31(9·78–12·82)
Chad 54·49(49·28–60·02)
47·07(42·17–51·79)
51·52(46·42–57·50)
44·78(40·30–49·49)
58·88(49·37–67·61)
51·31(43·16–58·31)
55·92(47·52–63·60)
48·99(41·63–55·16)
13·57(9·15–18·17)
10·39(6·83–13·74)
12·82(9·30–16·41)
9·68(6·76–12·31)
Côte d’Ivoire 54·81(51·77–58·19)
47·31(44·08–50·42)
52·17(49·40–55·26)
45·74(42·79–48·69)
61·41(55·01–68·52)
53·25(47·55–58·86)
57·21(49·99–64·50)
50·62(44·57–56·49)
13·45(10·36–17·14)
10·18(7·63–12·89)
12·52(9·58–15·76)
9·58(7·19–12·09)
The Gambia 66·15(63·52–69·30)
57·47(53·89–60·95)
63·77(60·62–66·93)
56·24(53·02–59·47)
69·63(64·33–74·55)
60·60 (55·53–65·49)
66·65(61·40–70·72)
58·85(53·84–63·05)
15·20 (12·74–17·85)
11·66(9·40–13·93)
14·44(12·06–16·15)
11·12(9·08–12·84)
Ghana 62·22(58·39–66·35)
54·17(50·38–58·28)
59·44(55·06–63·57)
52·58(48·64–56·59)
67·55(59·65–74·25)
59·26(52·16–65·27)
63·06(54·99–69·81)
56·43(49·27–62·23)
14·65(11·01–18·42)
11·43(8·29–14·33)
13·26(10·33–16·14)
10·37(7·79–12·80)
Guinea 56·87(54·19–59·83)
49·13(46·04–52·16)
55·17(52·35–58·20)
48·39(45·37–51·39)
60·49(54·52–67·09)
52·65(47·07–58·36)
57·81(50·80–64·49)
51·10 (45·32–56·48)
13·11(10·29–16·46)
10·04(7·59–12·67)
12·74(9·77–15·74)
9·76(7·38–12·08)
Guinea-Bissau 53·45(41·87–65·17)
47·62(37·00–56·49)
52·32(41·45–61·55)
46·95(36·92–54·28)
56·44(42·35–67·69)
50·29(37·66–58·94)
54·86(41·87–63·97)
49·30 (37·55–56·40)
12·49(7·38–18·14)
9·86(5·56–13·75)
12·60 (7·97–16·67)
9·81(6·01–12·82)
Liberia 58·41(55·78–61·50)
49·34(45·91–52·69)
58·42(55·80–61·11)
49·59(46·21–52·76)
63·41(57·41–69·44)
54·28(49·06–59·54)
63·08(57·54–67·67)
54·32(49·25–58·93)
13·46(10·70–16·61)
9·89(7·64–12·38)
14·11(11·59–16·32)
10·32(8·27–12·33)
Mali 57·10 (54·19–59·62)
48·99(45·63–52·25)
56·70 (54·17–59·25)
49·03(45·80–51·97)
60·44(54·41–66·68)
52·48(46·95–57·55)
60·04(54·18–64·35)
52·64(47·53–56·71)
13·86(10·84–16·93)
10·51(8·06–12·88)
14·63(12·17–16·71)
11·06(8·94–12·93)
Mauritania 66·08(63·12–68·95)
56·59(53·00–60·00)
66·76(63·89–69·70)
57·74(54·26–60·96)
69·81(63·59–75·57)
60·13(54·58–65·16)
69·83(63·66–75·84)
60·72(55·13–65·85)
15·43(12·47–18·74)
11·57(9·08–13·97)
16·23(13·54–19·71)
12·20 (9·82–14·85)
Niger 56·69(53·93–59·39)
49·23(46·04–52·19)
55·23(52·52–57·72)
48·42(45·56–51·12)
62·47(56·63–68·18)
54·62(49·53–59·73)
59·58(52·81–65·38)
52·71(46·88–57·41)
14·18(11·30–17·09)
10·82(8·50–13·07)
13·37(10·41–15·90)
10·20 (7·88–12·23)
Nigeria 57·27(54·37–59·89)
48·85(45·55–51·94)
56·32(53·71–59·05)
48·49(45·46–51·58)
66·33(59·47–70·32)
56·70 (51·20–61·03)
62·95(57·35–65·78)
54·38(49·69–57·95)
16·69(13·14–18·76)
12·42(9·77–14·48)
15·56(13·16–16·63)
11·54(9·51–13·09)
São Tomé and Príncipe
66·23(62·95–69·55)
57·52(53·96–60·98)
64·70 (61·02–68·11)
56·82(53·12–60·37)
68·81(61·31–75·85)
59·88(53·33–66·12)
67·19(59·36–74·84)
59·20 (52·56–65·53)
14·08(10·84–17·67)
10·72(8·12–13·39)
14·05(11·23–17·55)
10·75(8·30–13·43)
Senegal 63·34(58·73–68·24)
54·93(50·49–59·50)
60·96(55·78–65·54)
53·85(49·19–57·99)
66·70 (58·22–74·46)
58·42(50·73–64·76)
63·84(54·36–70·63)
56·97(48·79–63·01)
13·78(10·12–17·89)
10·62(7·54–13·61)
13·27(9·98–16·37)
10·37(7·55–12·81)
Sierra Leone 53·25(51·13–55·51)
45·84(43·07–48·53)
51·31(49·15–53·49)
44·43(41·65–46·90)
57·73(51·98–63·30)
50·57(45·66–55·39)
56·54(50·98–62·48)
49·86(44·73–54·86)
12·49(9·78–15·38)
9·48(7·31–11·79)
12·90 (10·28–15·60)
9·74(7·58–11·87)
Togo 59·02(55·78–62·50)
51·21(47·63–54·69)
54·59(51·23–58·28)
48·11(44·83–51·43)
64·61(58·52–70·49)
56·48(50·97–61·52)
58·47(52·25–65·69)
52·02(46·39–57·51)
14·56(11·46–17·65)
11·20 (8·60–13·65)
12·32(9·91–15·47)
9·53(7·35–11·85)
Eastern sub-Saharan Africa
56·08(54·83–57·34)
48·45(45·86–50·76)
54·53(53·31–55·72)
47·61(45·40–49·71)
64·32(61·38–67·07)
55·84(52·48–58·99)
60·50 (57·72–63·16)
53·13(50·12–56·22)
13·98(12·61–15·37)
10·53(9·15–11·90)
13·06(11·85–14·21)
9·88(8·61–11·14)
(Table 2 continues on next page)
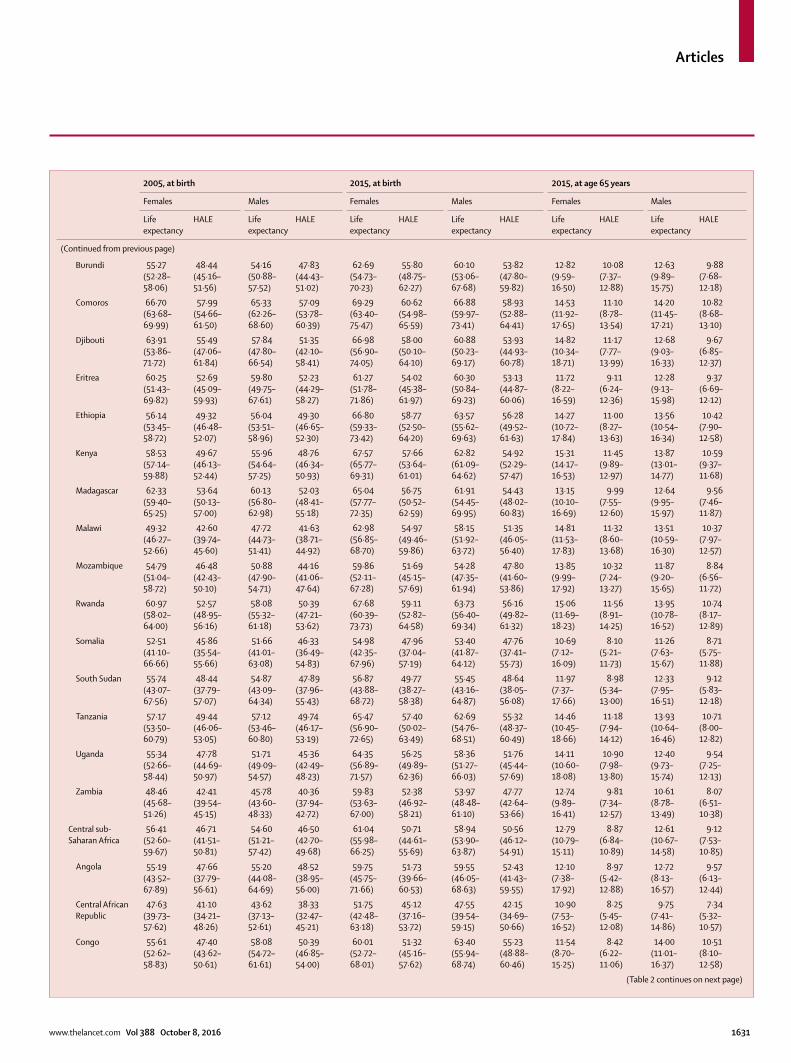
Articles
www.thelancet.com Vol 388 October 8, 2016 1631
2005, at birth 2015, at birth 2015, at age 65 years
Females Males Females Males Females Males
Life expectancy
HALE Life expectancy
HALE Life expectancy
HALE Life expectancy
HALE Life expectancy
HALE Life expectancy
HALE
(Continued from previous page)
Burundi 55·27(52·28–58·06)
48·44(45·16–51·56)
54·16(50·88–57·52)
47·83(44·43–51·02)
62·69(54·73–70·23)
55·80 (48·75–62·27)
60·10 (53·06–67·68)
53·82(47·80–59·82)
12·82(9·59–16·50)
10·08(7·37–12·88)
12·63(9·89–15·75)
9·88(7·68–12·18)
Comoros 66·70 (63·68–69·99)
57·99(54·66–61·50)
65·33(62·26–68·60)
57·09(53·78–60·39)
69·29(63·40–75·47)
60·62(54·98–65·59)
66·88(59·97–73·41)
58·93(52·88–64·41)
14·53(11·92–17·65)
11·10 (8·78–13·54)
14·20 (11·45–17·21)
10·82(8·68–13·10)
Djibouti 63·91(53·86–71·72)
55·49(47·06–61·84)
57·84(47·80–66·54)
51·35(42·10–58·41)
66·98(56·90–74·05)
58·00 (50·10–64·10)
60·88(50·23–69·17)
53·93(44·93–60·78)
14·82(10·34–18·71)
11·17(7·77–13·99)
12·68(9·03–16·33)
9·67(6·85–12·37)
Eritrea 60·25(51·43–69·82)
52·69(45·09–59·93)
59·80 (49·75–67·61)
52·23(44·29–58·27)
61·27(51·78–71·86)
54·02(45·38–61·97)
60·30 (50·84–69·23)
53·13(44·87–60·06)
11·72(8·22–16·59)
9·11(6·24–12·36)
12·28(9·13–15·98)
9·37(6·69–12·12)
Ethiopia 56·14(53·45–58·72)
49·32(46·48–52·07)
56·04(53·51–58·96)
49·30 (46·65–52·30)
66·80 (59·33–73·42)
58·77(52·50–64·20)
63·57(55·62–69·63)
56·28(49·52–61·63)
14·27(10·72–17·84)
11·00 (8·27–13·63)
13·56(10·54–16·34)
10·42(7·90–12·58)
Kenya 58·53(57·14–59·88)
49·67(46·13–52·44)
55·96(54·64–57·25)
48·76(46·34–50·93)
67·57(65·77–69·31)
57·66(53·64–61·01)
62·82(61·09–64·62)
54·92(52·29–57·47)
15·31(14·17–16·53)
11·45(9·89–12·97)
13·87(13·01–14·77)
10·59(9·37–11·68)
Madagascar 62·33(59·40–65·25)
53·64(50·13–57·00)
60·13(56·80–62·98)
52·03(48·41–55·18)
65·04(57·77–72·35)
56·75(50·52–62·59)
61·91(54·45–69·95)
54·43(48·02–60·83)
13·15(10·10–16·69)
9·99(7·55–12·60)
12·64(9·95–15·97)
9·56(7·46–11·87)
Malawi 49·32(46·27–52·66)
42·60 (39·74–45·60)
47·72(44·73–51·41)
41·63(38·71–44·92)
62·98(56·85–68·70)
54·97(49·46–59·86)
58·15(51·92–63·72)
51·35(46·05–56·40)
14·81(11·53–17·83)
11·32(8·60–13·68)
13·51(10·59–16·30)
10·37(7·97–12·57)
Mozambique 54·79(51·04–58·72)
46·48(42·43–50·10)
50·88(47·90–54·71)
44·16(41·06–47·64)
59·86(52·11–67·28)
51·69(45·15–57·69)
54·28(47·35–61·94)
47·80 (41·60–53·86)
13·85(9·99–17·92)
10·32(7·24–13·27)
11·87(9·20–15·65)
8·84(6·56–11·72)
Rwanda 60·97(58·02–64·00)
52·57(48·95–56·16)
58·08(55·32–61·18)
50·39(47·21–53·62)
67·68(60·39–73·73)
59·11(52·82–64·58)
63·73(56·40–69·34)
56·16(49·82–61·32)
15·06(11·69–18·23)
11·56(8·91–14·25)
13·95(10·78–16·52)
10·74(8·17–12·89)
Somalia 52·51(41·10–66·66)
45·86(35·54–55·66)
51·66(41·01–63·08)
46·33(36·49–54·83)
54·98(42·35–67·96)
47·96(37·04–57·19)
53·40 (41·87–64·12)
47·76(37·41–55·73)
10·69(7·12–16·09)
8·10 (5·21–11·73)
11·26(7·63–15·67)
8·71(5·75–11·88)
South Sudan 55·74(43·07–67·56)
48·44(37·79–57·07)
54·87(43·09–64·34)
47·89(37·96–55·43)
56·87(43·88–68·72)
49·77(38·27–58·38)
55·45(43·16–64·87)
48·64(38·05–56·08)
11·97(7·37–17·66)
8·98(5·34–13·00)
12·33(7·95–16·51)
9·12(5·83–12·18)
Tanzania 57·17(53·50–60·79)
49·44(46·06–53·05)
57·12(53·46–60·80)
49·74(46·17–53·19)
65·47(56·90–72·65)
57·40 (50·02–63·49)
62·69(54·76–68·51)
55·32(48·37–60·49)
14·46(10·45–18·66)
11·18(7·94–14·12)
13·93(10·64–16·46)
10·71(8·00–12·82)
Uganda 55·34(52·66–58·44)
47·78(44·69–50·97)
51·71(49·09–54·57)
45·36(42·49–48·23)
64·35(56·89–71·57)
56·25(49·89–62·36)
58·36(51·27–66·03)
51·76(45·44–57·69)
14·11(10·60–18·08)
10·90 (7·98–13·80)
12·40 (9·73–15·74)
9·54(7·25–12·13)
Zambia 48·46(45·68–51·26)
42·41(39·54–45·15)
45·78(43·60–48·33)
40·36(37·94–42·72)
59·83(53·63–67·00)
52·38(46·92–58·21)
53·97(48·48–61·10)
47·77(42·64–53·66)
12·74(9·89–16·41)
9·81(7·34–12·57)
10·61(8·78–13·49)
8·07(6·51–10·38)
Central sub-Saharan Africa
56·41(52·60–59·67)
46·71(41·51–50·81)
54·60 (51·21–57·42)
46·50 (42·70–49·68)
61·04(55·98–66·25)
50·71(44·61–55·69)
58·94(53·90–63·87)
50·56(46·12–54·91)
12·79(10·79–15·11)
8·87(6·84–10·89)
12·61(10·67–14·58)
9·12(7·53–10·85)
Angola 55·19(43·52–67·89)
47·66(37·79–56·61)
55·20 (44·08–64·69)
48·52(38·95–56·00)
59·75(45·75–71·66)
51·73(39·66–60·53)
59·55(46·05–68·63)
52·43(41·43–59·55)
12·10 (7·38–17·92)
8·97(5·42–12·88)
12·72(8·13–16·57)
9·57(6·13–12·44)
Central African Republic
47·63(39·73–57·62)
41·10 (34·21–48·26)
43·62(37·13–52·61)
38·33(32·47–45·21)
51·75(42·48–63·18)
45·12(37·16–53·72)
47·55(39·54–59·15)
42·15(34·69–50·66)
10·90 (7·53–16·52)
8·25(5·45–12·08)
9·75(7·41–14·86)
7·34(5·32–10·57)
Congo 55·61(52·62–58·83)
47·40 (43·62–50·61)
58·08(54·72–61·61)
50·39(46·85–54·00)
60·01(52·72–68·01)
51·32(45·16–57·62)
63·40 (55·94–68·74)
55·23(48·88–60·46)
11·54(8·70–15·25)
8·42(6·22–11·06)
14·00 (11·01–16·37)
10·51(8·10–12·58)
(Table 2 continues on next page)
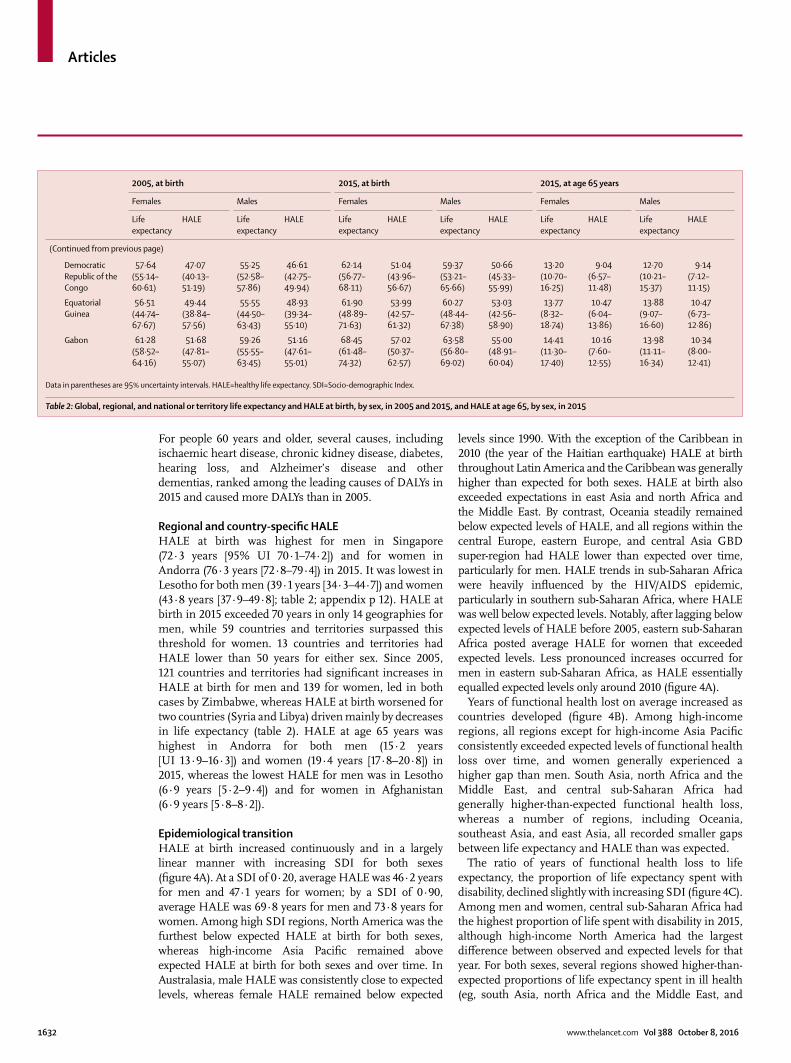
Articles
1632 www.thelancet.com Vol 388 October 8, 2016
For people 60 years and older, several causes, including ischaemic heart disease, chronic kidney disease, diabetes, hearing loss, and Alzheimer’s disease and other dementias, ranked among the leading causes of DALYs in 2015 and caused more DALYs than in 2005.
Regional and country-specifi c HALEHALE at birth was highest for men in Singapore (72·3 years [95% UI 70·1–74·2]) and for women in Andorra (76·3 years [72·8–79·4]) in 2015. It was lowest in Lesotho for both men (39·1 years [34·3–44·7]) and women (43·8 years [37·9–49·8]; table 2; appendix p 12). HALE at birth in 2015 exceeded 70 years in only 14 geographies for men, while 59 countries and territories surpassed this threshold for women. 13 countries and territories had HALE lower than 50 years for either sex. Since 2005, 121 countries and territories had signifi cant increases in HALE at birth for men and 139 for women, led in both cases by Zimbabwe, whereas HALE at birth worsened for two countries (Syria and Libya) driven mainly by decreases in life expectancy (table 2). HALE at age 65 years was highest in Andorra for both men (15·2 years [UI 13·9–16·3]) and women (19·4 years [17·8–20·8]) in 2015, whereas the lowest HALE for men was in Lesotho (6·9 years [5·2–9·4]) and for women in Afghanistan (6·9 years [5·8–8·2]).
Epidemiological transitionHALE at birth increased continuously and in a largely linear manner with increasing SDI for both sexes (fi gure 4A). At a SDI of 0·20, average HALE was 46·2 years for men and 47·1 years for women; by a SDI of 0·90, average HALE was 69·8 years for men and 73·8 years for women. Among high SDI regions, North America was the furthest below expected HALE at birth for both sexes, whereas high-income Asia Pacifi c remained above expected HALE at birth for both sexes and over time. In Australasia, male HALE was consistently close to expected levels, whereas female HALE remained below expected
levels since 1990. With the exception of the Caribbean in 2010 (the year of the Haitian earthquake) HALE at birth throughout Latin America and the Caribbean was generally higher than expected for both sexes. HALE at birth also exceeded expectations in east Asia and north Africa and the Middle East. By contrast, Oceania steadily remained below expected levels of HALE, and all regions within the central Europe, eastern Europe, and central Asia GBD super-region had HALE lower than expected over time, particularly for men. HALE trends in sub-Saharan Africa were heavily infl uenced by the HIV/AIDS epidemic, particularly in southern sub-Saharan Africa, where HALE was well below expected levels. Notably, after lagging below expected levels of HALE before 2005, eastern sub-Saharan Africa posted average HALE for women that exceeded expected levels. Less pronounced increases occurred for men in eastern sub-Saharan Africa, as HALE essentially equalled expected levels only around 2010 (fi gure 4A).
Years of functional health lost on average increased as countries developed (fi gure 4B). Among high-income regions, all regions except for high-income Asia Pacifi c consistently exceeded expected levels of functional health loss over time, and women generally experienced a higher gap than men. South Asia, north Africa and the Middle East, and central sub-Saharan Africa had generally higher-than-expected functional health loss, whereas a number of regions, including Oceania, southeast Asia, and east Asia, all recorded smaller gaps between life expectancy and HALE than was expected.
The ratio of years of functional health loss to life expectancy, the proportion of life expectancy spent with disability, declined slightly with increasing SDI (fi gure 4C). Among men and women, central sub-Saharan Africa had the highest proportion of life spent with disability in 2015, although high-income North America had the largest diff erence between observed and expected levels for that year. For both sexes, several regions showed higher-than-expected proportions of life expectancy spent in ill health (eg, south Asia, north Africa and the Middle East, and
2005, at birth 2015, at birth 2015, at age 65 years
Females Males Females Males Females Males
Life expectancy
HALE Life expectancy
HALE Life expectancy
HALE Life expectancy
HALE Life expectancy
HALE Life expectancy
HALE
(Continued from previous page)
Democratic Republic of the Congo
57·64(55·14–60·61)
47·07(40·13–51·19)
55·25(52·58–57·86)
46·61(42·75–49·94)
62·14(56·77–68·11)
51·04(43·96–56·67)
59·37(53·21–65·66)
50·66(45·33–55·99)
13·20 (10·70–16·25)
9·04(6·57–11·48)
12·70 (10·21–15·37)
9·14(7·12–11·15)
Equatorial Guinea
56·51(44·74–67·67)
49·44(38·84–57·56)
55·55(44·50–63·43)
48·93(39·34–55·10)
61·90 (48·89–71·63)
53·99(42·57–61·32)
60·27(48·44–67·38)
53·03(42·56–58·90)
13·77(8·32–18·74)
10·47(6·04–13·86)
13·88(9·07–16·60)
10·47(6·73–12·86)
Gabon 61·28(58·52–64·16)
51·68(47·81–55·07)
59·26(55·55–63·45)
51·16(47·61–55·01)
68·45(61·48–74·32)
57·02(50·37–62·57)
63·58(56·80–69·02)
55·00 (48·91–60·04)
14·41(11·30–17·40)
10·16(7·60–12·55)
13·98(11·11–16·34)
10·34(8·00–12·41)
Data in parentheses are 95% uncertainty intervals. HALE=healthy life expe ctancy. SDI=Socio-demographic Index.
Table 2: Global, regional, and national or territory life expectancy and HALE at birth, by sex, in 2005 and 2015, and HALE at age 65, by sex, in 2015
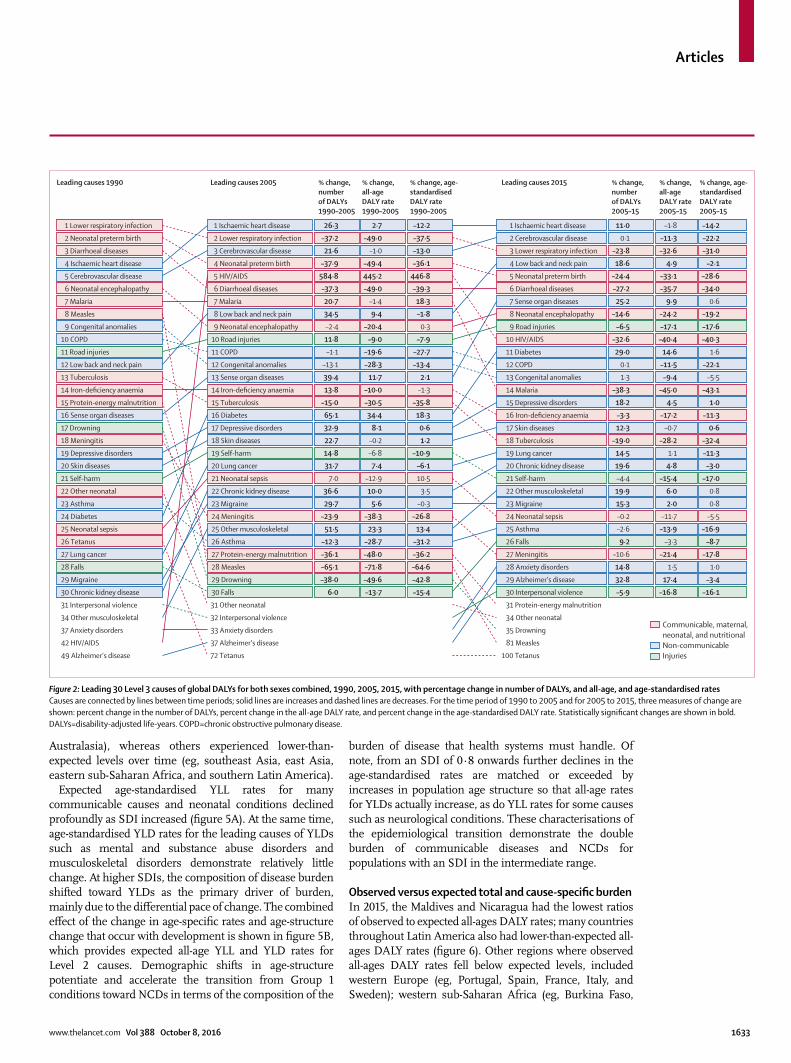
Articles
www.thelancet.com Vol 388 October 8, 2016 1633
Australasia), whereas others experienced lower-than-expected levels over time (eg, southeast Asia, east Asia, eastern sub-Saharan Africa, and southern Latin America).
Expected age-standardised YLL rates for many communicable causes and neonatal conditions declined profoundly as SDI increased (fi gure 5A). At the same time, age-standardised YLD rates for the leading causes of YLDs such as mental and substance abuse disorders and musculoskeletal disorders demonstrate relatively little change. At higher SDIs, the composition of disease burden shifted toward YLDs as the primary driver of burden, mainly due to the diff erential pace of change. The combined eff ect of the change in age-specifi c rates and age-structure change that occur with development is shown in fi gure 5B, which provides expected all-age YLL and YLD rates for Level 2 causes. Demographic shifts in age-structure potentiate and accelerate the transition from Group 1 conditions toward NCDs in terms of the composition of the
burden of disease that health systems must handle. Of note, from an SDI of 0·8 onwards further declines in the age-standardised rates are matched or exceeded by increases in population age structure so that all-age rates for YLDs actually increase, as do YLL rates for some causes such as neurological conditions. These characterisations of the epidemiological transition demonstrate the double burden of communicable diseases and NCDs for populations with an SDI in the intermediate range.
Observed versus expected total and cause-specifi c burdenIn 2015, the Maldives and Nicaragua had the lowest ratios of observed to expected all-ages DALY rates; many countries throughout Latin America also had lower-than-expected all-ages DALY rates (fi gure 6). Other regions where observed all-ages DALY rates fell below expected levels, included western Europe (eg, Portugal, Spain, France, Italy, and Sweden); western sub-Saharan Africa (eg, Burkina Faso,
Figure 2: Leading 30 Level 3 causes of global DALYs for both sexes combined, 1990, 2005, 2015, with percentage change in number of DALYs, and all-age, and age-standardised ratesCauses are connected by lines between time periods; solid lines are increases and dashed lines are decreases. For the time period of 1990 to 2005 and for 2005 to 2015, three measures of change are shown: percent change in the number of DALYs, percent change in the all-age DALY rate, and percent change in the age-standardised DALY rate. Statistically signifi cant changes are shown in bold. DALYs=disability-adjusted life-years. COPD=chronic obstructive pulmonary disease.
Leading causes 1990 Leading causes 2005 Leading causes 2015% change,numberof DALYs1990–2005
% change,all-age DALY rate 1990–2005
% change, age-standardisedDALY rate1990–2005
% change,numberof DALYs2005–15
% change,all-age DALY rate 2005–15
% change, age-standardisedDALY rate2005–15
Communicable, maternal, neonatal, and nutritionalNon-communicableInjuries
1 Lower respiratory infection 1 Ischaemic heart disease 1 Ischaemic heart disease 11·0
0·1
–23·8
18·6
–24·4
–27·2
25·2
–14·6
–6·5
–32·6
29·0
0·1
1·3
–38·3
18·2
–3·3
12·3
–19·0
14·5
19·6
–4·4
19·9
15·3
–0·2
–2·6
9·2
–10·6
14·8
32·8
–5·9
–1·8
–11·3
–32·6
4·9
–33·1
–35·7
9·9
–24·2
–17·1
–40·4
14·6
–11·5
–9·4
–45·0
4·5
–17·2
–0·7
–28·2
1·1
4·8
–15·4
6·0
2·0
–11·7
–13·9
–3·3
–21·4
1·5
17·4
–16·8
–14·2
–22·2
–31·0
–2·1
–28·6
–34·0
0·6
–19·2
–17·6
–40·3
1·6
–22·1
–5·5
–43·1
1·0
–11·3
0·6
–32·4
–11·3
–3·0
–17·0
0·8
0·8
–5·5
–16·9
–8·7
–17·8
1·0
–3·4
–16·1
26·3
–37·2
21·6
–37·9
584·8
–37·3
20·7
34·5
–2·4
11·8
–1·1
–13·1
39·4
13·8
–15·0
65·1
32·9
22·7
14·8
31·7
7·0
36·6
29·7
–23·9
51·5
–12·3
–36·1
–65·1
–38·0
6·0
2·7
–49·0
–1·0
–49·4
445·2
–49·0
–1·4
9·4
–20·4
–9·0
–19·6
–28·3
11·7
–10·0
–30·5
34·4
8·1
–0·2
–6·8
7·4
–12·9
10·0
5·6
–38·3
23·3
–28·7
–48·0
–71·8
–49·6
–13·7
–12·2
–37·5
–13·0
–36·1
446·8
–39·3
18·3
–1·8
0·3
–7·9
–27·7
–13·4
2·1
–1·3
–35·8
18·3
0·6
1·2
–10·9
–6·1
10·5
3·5
–0·3
–26·8
13·4
–31·2
–36·2
–64·6
–42·8
–15·4
2 Neonatal preterm birth 2 Lower respiratory infection 2 Cerebrovascular disease
3 Diarrhoeal diseases 3 Cerebrovascular disease 3 Lower respiratory infection
4 Ischaemic heart disease 4 Neonatal preterm birth 4 Low back and neck pain
5 Cerebrovascular disease 5 HIV/AIDS 5 Neonatal preterm birth
6 Neonatal encephalopathy 6 Diarrhoeal diseases 6 Diarrhoeal diseases
7 Malaria 7 Malaria 7 Sense organ diseases
8 Measles 8 Low back and neck pain 8 Neonatal encephalopathy
9 Congenital anomalies 9 Road injuries
10 COPD 10 Road injuries 10 HIV/AIDS
11 Road injuries 11 COPD 11 Diabetes
12 Low back and neck pain 12 Congenital anomalies 12 COPD
13 Tuberculosis 13 Sense organ diseases 13 Congenital anomalies
14 Iron-deficiency anaemia 14 Iron-deficiency anaemia 14 Malaria
15 Protein-energy malnutrition 15 Tuberculosis 15 Depressive disorders
16 Sense organ diseases 16 Diabetes 16 Iron-deficiency anaemia
17 Drowning 17 Depressive disorders 17 Skin diseases
18 Meningitis 18 Skin diseases 18 Tuberculosis
19 Depressive disorders 19 Self-harm 19 Lung cancer
20 Skin diseases 20 Lung cancer 20 Chronic kidney disease
21 Self-harm 21 Neonatal sepsis 21 Self-harm
22 Other neonatal 22 Chronic kidney disease 22 Other musculoskeletal
23 Asthma 23 Migraine 23 Migraine
24 Diabetes 24 Meningitis 24 Neonatal sepsis
25 Neonatal sepsis 25 Other musculoskeletal 25 Asthma
26 Tetanus 26 Asthma 26 Falls
27 Lung cancer 27 Protein-energy malnutrition 27 Meningitis
28 Falls 28 Measles 28 Anxiety disorders
29 Migraine 29 Drowning 29 Alzheimer’s disease
30 Chronic kidney disease 30 Falls 30 Interpersonal violence
31 Other neonatal31 Interpersonal violence 31 Protein-energy malnutrition
32 Interpersonal violence34 Other musculoskeletal 34 Other neonatal
33 Anxiety disorders37 Anxiety disorders 35 Drowning
37 Alzheimer’s disease42 HIV/AIDS 81 Measles
72 Tetanus49 Alzheimer’s disease 100 Tetanus
9 Neonatal encephalopathy
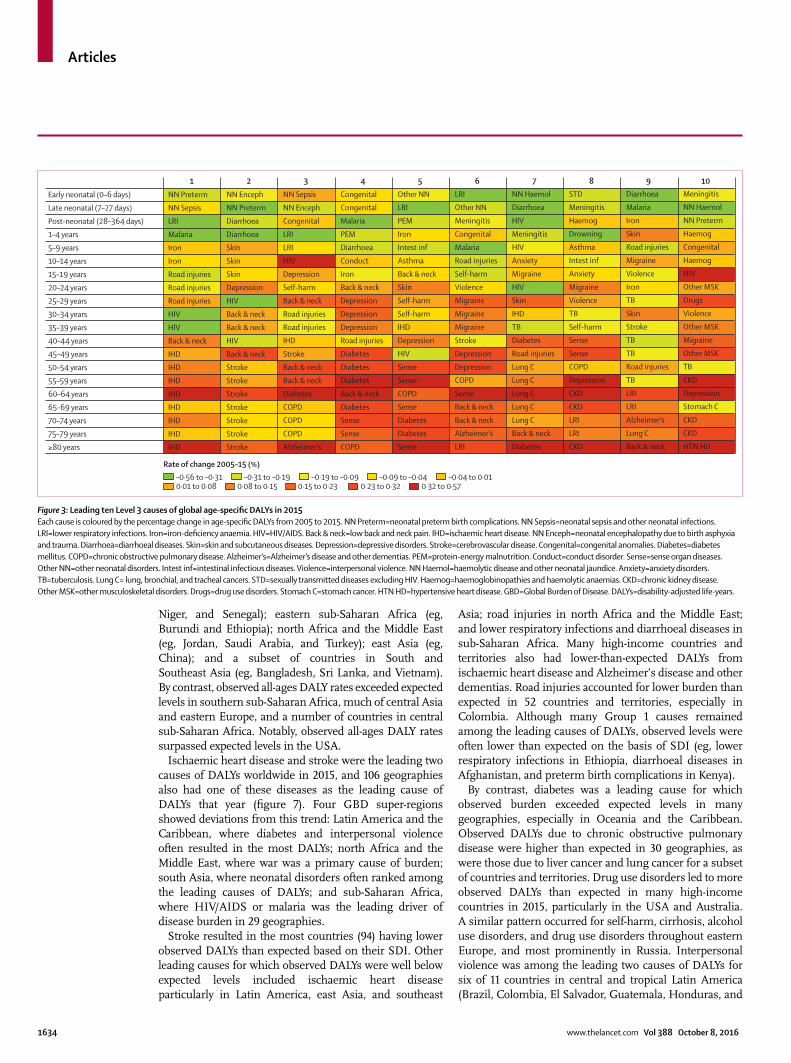
Articles
1634 www.thelancet.com Vol 388 October 8, 2016
Niger, and Senegal); eastern sub-Saharan Africa (eg, Burundi and Ethiopia); north Africa and the Middle East (eg, Jordan, Saudi Arabia, and Turkey); east Asia (eg, China); and a subset of countries in South and Southeast Asia (eg, Bangladesh, Sri Lanka, and Vietnam). By contrast, observed all-ages DALY rates exceeded expected levels in southern sub-Saharan Africa, much of central Asia and eastern Europe, and a number of countries in central sub-Saharan Africa. Notably, observed all-ages DALY rates surpassed expected levels in the USA.
Ischaemic heart disease and stroke were the leading two causes of DALYs worldwide in 2015, and 106 geographies also had one of these diseases as the leading cause of DALYs that year (fi gure 7). Four GBD super-regions showed deviations from this trend: Latin America and the Caribbean, where diabetes and interpersonal violence often resulted in the most DALYs; north Africa and the Middle East, where war was a primary cause of burden; south Asia, where neonatal disorders often ranked among the leading causes of DALYs; and sub-Saharan Africa, where HIV/AIDS or malaria was the leading driver of disease burden in 29 geographies.
Stroke resulted in the most countries (94) having lower observed DALYs than expected based on their SDI. Other leading causes for which observed DALYs were well below expected levels included ischaemic heart disease particularly in Latin America, east Asia, and southeast
Asia; road injuries in north Africa and the Middle East; and lower respiratory infections and diarrhoeal diseases in sub-Saharan Africa. Many high-income countries and territories also had lower-than-expected DALYs from ischaemic heart disease and Alzheimer’s disease and other dementias. Road injuries accounted for lower burden than expected in 52 countries and territories, especially in Colombia. Although many Group 1 causes remained among the leading causes of DALYs, observed levels were often lower than expected on the basis of SDI (eg, lower respiratory infections in Ethiopia, diarrhoeal diseases in Afghanistan, and preterm birth complications in Kenya).
By contrast, diabetes was a leading cause for which observed burden exceeded expected levels in many geographies, especially in Oceania and the Caribbean. Observed DALYs due to chronic obstructive pulmonary disease were higher than expected in 30 geographies, as were those due to liver cancer and lung cancer for a subset of countries and territories. Drug use disorders led to more observed DALYs than expected in many high-income countries in 2015, particularly in the USA and Australia. A similar pattern occurred for self-harm, cirrhosis, alcohol use disorders, and drug use disorders throughout eastern Europe, and most prominently in Russia. Interpersonal violence was among the leading two causes of DALYs for six of 11 countries in central and tropical Latin America (Brazil, Colombia, El Salvador, Guatemala, Honduras, and
Figure 3: Leading ten Level 3 causes of global age-specifi c DALYs in 2015Each cause is coloured by the percentage change in age-specifi c DALYs from 2005 to 2015. NN Preterm=neonatal preterm birth complications. NN Sepsis=neonatal sepsis and other neonatal infections. LRI=lower respiratory infections. Iron=iron-defi ciency anaemia. HIV=HIV/AIDS. Back & neck=low back and neck pain. IHD=ischaemic heart disease. NN Enceph=neonatal encephalopathy due to birth asphyxia and trauma. Diarrhoea=diarrhoeal diseases. Skin=skin and subcutaneous diseases. Depression=depressive disorders. Stroke=cerebrovascular disease. Congenital=congenital anomalies. Diabetes=diabetes mellitus. COPD=chronic obstructive pulmonary disease. Alzheimer’s=Alzheimer’s disease and other dementias. PEM=protein-energy malnutrition. Conduct=conduct disorder. Sense=sense organ diseases. Other NN=other neonatal disorders. Intest inf=intestinal infectious diseases. Violence=interpersonal violence. NN Haemol=haemolytic disease and other neonatal jaundice. Anxiety=anxiety disorders. TB=tuberculosis. Lung C= lung, bronchial, and tracheal cancers. STD=sexually transmitted diseases excluding HIV. Haemog=haemoglobinopathies and haemolytic anaemias. CKD=chronic kidney disease. Other MSK=other musculoskeletal disorders. Drugs=drug use disorders. Stomach C=stomach cancer. HTN HD=hypertensive heart disease. GBD=Global Burden of Disease. DALYs=disability-adjusted life-years.
–0·56 to –0·31 –0·31 to –0·19 –0·19 to –0·09 –0·09 to –0·04 –0·04 to 0·010·01 to 0·08 0·08 to 0·15 0·15 to 0·23 0·23 to 0·32 0·32 to 0·57
1 2 3 4 5 6 7 8 9 10
Early neonatal (0–6 days)
Late neonatal (7–27 days)
Post-neonatal (28–364 days)
1–4 years
5–9 years
10–14 years
15–19 years
20–24 years
25–29 years
30–34 years
35–39 years
40–44 years
45–49 years
50–54 years
55–59 years
60–64 years
65–69 years
70–74 years
75–79 years
≥80 years
NN Preterm
NN Sepsis
LRI
Malaria
Iron
Iron
Road injuries
Road injuries
Road injuries
HIV
HIV
Back & neck
IHD
IHD
IHD
IHD
IHD
IHD
IHD
IHD
NN Enceph
NN Preterm
Diarrhoea
Diarrhoea
Skin
Skin
Skin
Depression
HIV
Back & neck
Back & neck
HIV
Back & neck
Stroke
Stroke
Stroke
Stroke
Stroke
Stroke
Stroke
NN Sepsis
NN Enceph
Congenital
LRI
LRI
HIV
Depression
Self-harm
Back & neck
Road injuries
Road injuries
IHD
Stroke
Back & neck
Back & neck
Diabetes
COPD
COPD
COPD
Alzheimer’s
Congenital
Congenital
Malaria
PEM
Diarrhoea
Conduct
Iron
Back & neck
Depression
Depression
Depression
Road injuries
Diabetes
Diabetes
Diabetes
Back & neck
Diabetes
Sense
Sense
COPD
Other NN
LRI
PEM
Iron
Intest inf
Asthma
Back & neck
Skin
Self-harm
Self-harm
IHD
Depression
HIV
Sense
Sense
COPD
Sense
Diabetes
Diabetes
Sense
LRI
Other NN
Meningitis
Congenital
Malaria
Road injuries
Self-harm
Violence
Migraine
Migraine
Migraine
Stroke
Depression
Depression
COPD
Sense
Back & neck
Back & neck
Alzheimer’s
LRI
NN Haemol
Diarrhoea
HIV
Meningitis
HIV
Anxiety
Migraine
HIV
Skin
IHD
TB
Diabetes
Road injuries
Lung C
Lung C
Lung C
Lung C
Lung C
Back & neck
Diabetes
STD
Meningitis
Haemog
Drowning
Asthma
Intest inf
Anxiety
Migraine
Violence
TB
Self-harm
Sense
Sense
COPD
Depression
CKD
CKD
LRI
LRI
CKD
Diarrhoea
Malaria
Iron
Skin
Road injuries
Migraine
Violence
Iron
TB
Skin
Stroke
TB
TB
Road injuries
TB
LRI
LRI
Alzheimer’s
Lung C
Back & neck
Meningitis
NN Haemol
NN Preterm
Haemog
Congenital
Haemog
HIV
Other MSK
Drugs
Violence
Other MSK
Migraine
Other MSK
TB
CKD
Depression
Stomach C
CKD
CKD
HTN HD
Rate of change 2005–15 (%)
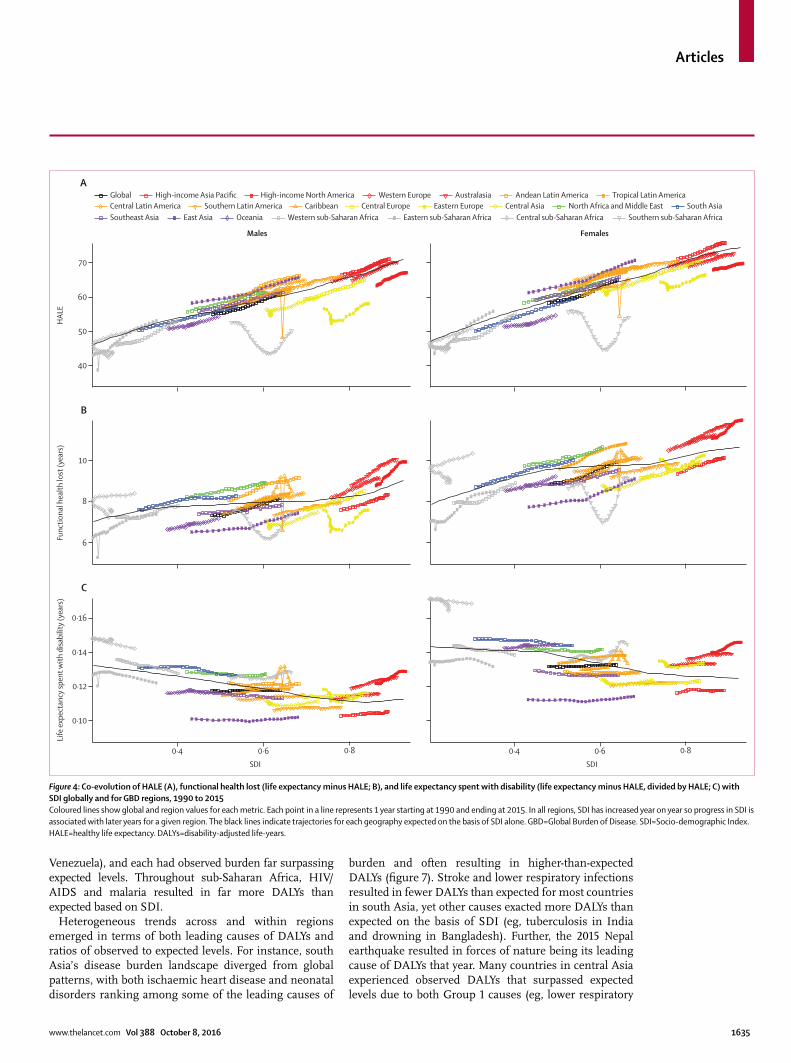
Articles
www.thelancet.com Vol 388 October 8, 2016 1635
Venezuela), and each had observed burden far surpassing expected levels. Throughout sub-Saharan Africa, HIV/AIDS and malaria resulted in far more DALYs than expected based on SDI.
Heterogeneous trends across and within regions emerged in terms of both leading causes of DALYs and ratios of observed to expected levels. For instance, south Asia’s disease burden landscape diverged from global patterns, with both ischaemic heart disease and neonatal disorders ranking among some of the leading causes of
burden and often resulting in higher-than-expected DALYs (fi gure 7). Stroke and lower respiratory infections resulted in fewer DALYs than expected for most countries in south Asia, yet other causes exacted more DALYs than expected on the basis of SDI (eg, tuberculosis in India and drowning in Bangladesh). Further, the 2015 Nepal earthquake resulted in forces of nature being its leading cause of DALYs that year. Many countries in central Asia experienced observed DALYs that surpassed expected levels due to both Group 1 causes (eg, lower respiratory
Figure 4: Co-evolution of HALE (A), functional health lost (life expectancy minus HALE; B), and life expectancy spent with disability (life expectancy minus HALE, divided by HALE; C) with SDI globally and for GBD regions, 1990 to 2015Coloured lines show global and region values for each metric. Each point in a line represents 1 year starting at 1990 and ending at 2015. In all regions, SDI has increased year on year so progress in SDI is associated with later years for a given region. The black lines indicate trajectories for each geography expected on the basis of SDI alone. GBD=Global Burden of Disease. SDI=Socio-demographic Index. HALE=healthy life expectancy. DALYs=disability-adjusted life-years.
Global High-income Asia Pacific High-income North America Western Europe Australasia Andean Latin America Tropical Latin AmericaCentral Latin America Southern Latin America Caribbean Central Europe Eastern Europe Central Asia North Africa and Middle East South AsiaSoutheast Asia East Asia Oceania Western sub-Saharan Africa Eastern sub-Saharan Africa Central sub-Saharan Africa Southern sub-Saharan Africa
A
Males
40
50
60
70
HAL
E
Females
B
6
8
10
Func
tiona
l hea
lth lo
st (y
ears
)
C
0·4 0·6 0·8
0·10
0·12
0·14
0·16
Life
exp
ecta
ncy
spen
t with
disa
bilit
y (y
ears
)
SDI0·4 0·6 0·8
SDI
��������������������
������
� � � � �� � � �
� � �� � �
� � � � � � ��� ��
� ������������� � �
� � ����
����
� � � � � � � � � � � � �� � � � � � � � � � � � �
����
�������
����
����� � � � � � �
���������
����������
�������
� � � � � �� � �
� �� � �
� � �� � � � �
�� ��
� ��
���������� � � �
� � ���
������ � � � � � � � � � � � �
� � � � � � � � � � � � �
����
�
��������
������ � � � � � � �
����������
������������
����
� � � � �� � �
��� � �
� �� � � � � � ��
� ��
� ��
�
���������� � �
� � ���
�����
� � � � � � � � � � � � �� � � � � � � � � � � � �
����
�
������
���� �
� � � � � � � � � �
�����������
���������
������
� � � �� � � �
��� � �
� � �� � � � � �
�� ��
� ��
����������� � �
� � ���
�����
� � � � � � � � � � � � �� � � � � � � � � � � � �
����
�
��������
������� � � � � � �
������������
������
��������
� � � � � � � � ��� � � � � � � � � � � ����� � �
�
����������� � �
� � ����
����
� � � � � � � � � � � � � � � � � � � � � � � � � �
����
�
���������� � � � � � � � � � � �
������������
�������
�������
� � � � � � � � �� � � � � � � �
� � � � �����
� ������������� � � � � ����
����
� � � � � � � � � � � � � � � � � � � � � � � � � �
���������������
� � � � � � � � � � �
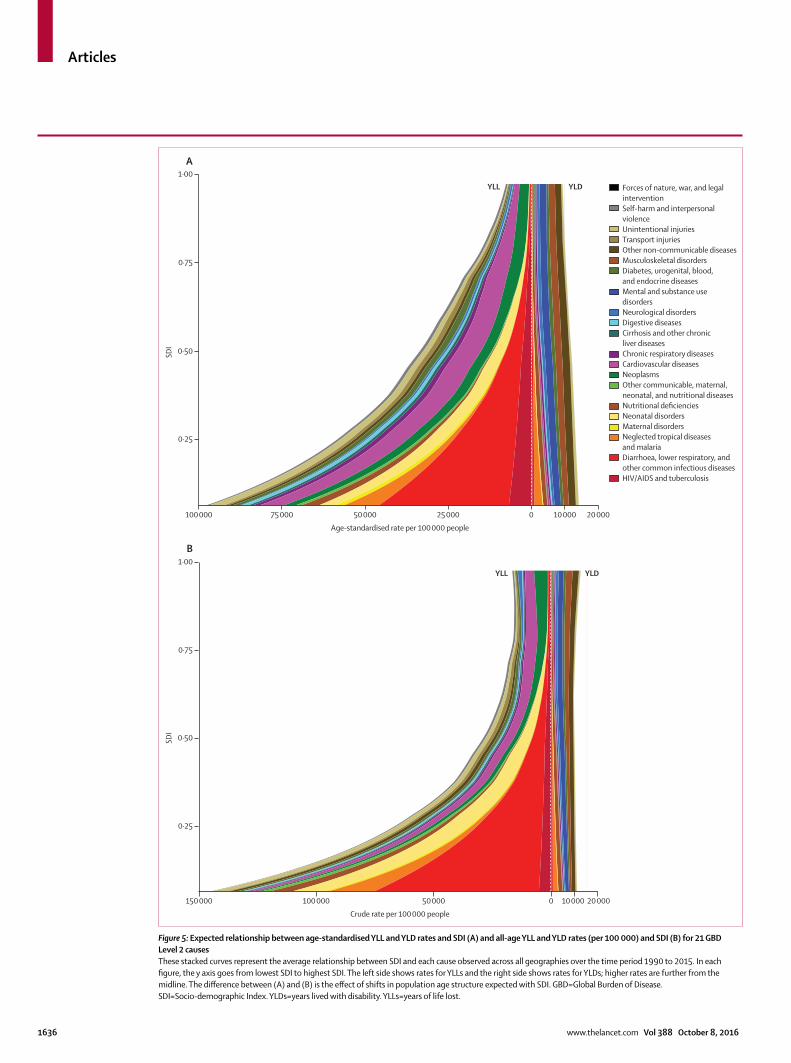
Articles
1636 www.thelancet.com Vol 388 October 8, 2016
Figure 5: Expected relationship between age-standardised YLL and YLD rates and SDI (A) and all-age YLL and YLD rates (per 100 000) and SDI (B) for 21 GBD Level 2 causesThese stacked curves represent the average relationship between SDI and each cause observed across all geographies over the time period 1990 to 2015. In each fi gure, the y axis goes from lowest SDI to highest SDI. The left side shows rates for YLLs and the right side shows rates for YLDs; higher rates are further from the midline. The diff erence between (A) and (B) is the eff ect of shifts in population age structure expected with SDI. GBD=Global Burden of Disease. SDI=Socio-demographic Index. YLDs=years lived with disability. YLLs=years of life lost.
Forces of nature, war, and legal interventionSelf-harm and interpersonal violenceUnintentional injuriesTransport injuriesOther non-communicable diseasesMusculoskeletal disordersDiabetes, urogenital, blood, and endocrine diseasesMental and substance usedisordersNeurological disordersDigestive diseasesCirrhosis and other chronic liver diseasesChronic respiratory diseasesCardiovascular diseasesNeoplasmsOther communicable, maternal,neonatal, and nutritional diseasesNutritional deficienciesNeonatal disordersMaternal disordersNeglected tropical diseases and malariaDiarrhoea, lower respiratory, and other common infectious diseasesHIV/AIDS and tuberculosis
75 000100 000 50 000 25 000 0 10 000 20 000
0·25
0·25
0·50
0·75
1·00
0·50
0·75
1·00A
B
SDI
SDI
Age-standardised rate per 100 000 people
150 000 100 000 50 000 10 000 20 0000Crude rate per 100 000 people
YLL YLD
YLL YLD
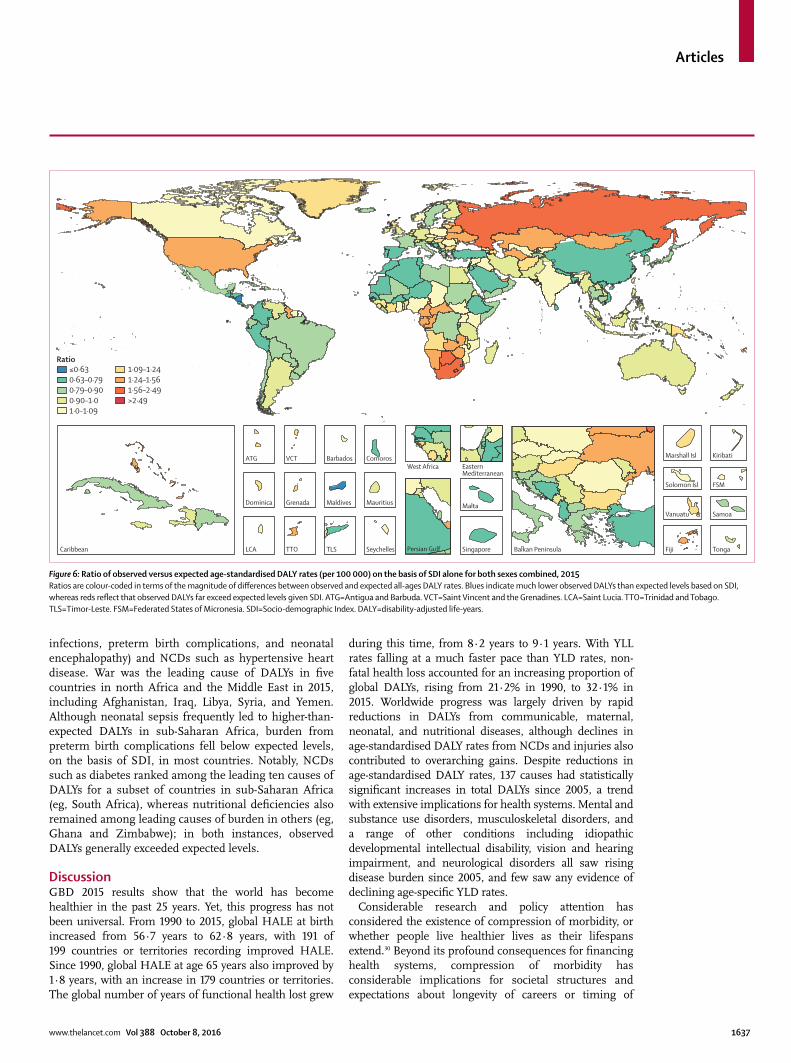
Articles
www.thelancet.com Vol 388 October 8, 2016 1637
infections, preterm birth complications, and neonatal encephalopathy) and NCDs such as hypertensive heart disease. War was the leading cause of DALYs in fi ve countries in north Africa and the Middle East in 2015, including Afghanistan, Iraq, Libya, Syria, and Yemen. Although neonatal sepsis frequently led to higher-than-expected DALYs in sub-Saharan Africa, burden from preterm birth complications fell below expected levels, on the basis of SDI, in most countries. Notably, NCDs such as diabetes ranked among the leading ten causes of DALYs for a subset of countries in sub-Saharan Africa (eg, South Africa), whereas nutritional defi ciencies also remained among leading causes of burden in others (eg, Ghana and Zimbabwe); in both instances, observed DALYs generally exceeded expected levels.
DiscussionGBD 2015 results show that the world has become healthier in the past 25 years. Yet, this progress has not been universal. From 1990 to 2015, global HALE at birth increased from 56·7 years to 62·8 years, with 191 of 199 countries or territories recording improved HALE. Since 1990, global HALE at age 65 years also improved by 1·8 years, with an increase in 179 countries or territories. The global number of years of functional health lost grew
during this time, from 8·2 years to 9·1 years. With YLL rates falling at a much faster pace than YLD rates, non-fatal health loss accounted for an increasing proportion of global DALYs, rising from 21·2% in 1990, to 32·1% in 2015. Worldwide progress was largely driven by rapid reductions in DALYs from communicable, maternal, neonatal, and nutritional diseases, although declines in age-standardised DALY rates from NCDs and injuries also contributed to overarching gains. Despite reductions in age-standardised DALY rates, 137 causes had statistically signifi cant increases in total DALYs since 2005, a trend with extensive implications for health systems. Mental and substance use disorders, musculoskeletal disorders, and a range of other conditions including idiopathic developmental intellectual disability, vision and hearing impairment, and neurological disorders all saw rising disease burden since 2005, and few saw any evidence of declining age-specifi c YLD rates.
Considerable research and policy attention has considered the existence of compression of morbidity, or whether people live healthier lives as their lifespans extend.30 Beyond its profound consequences for fi nancing health systems, compression of morbidity has considerable implications for societal structures and expectations about longevity of careers or timing of
Figure 6: Ratio of observed versus expected age-standardised DALY rates (per 100 000) on the basis of SDI alone for both sexes combined, 2015Ratios are colour-coded in terms of the magnitude of diff erences between observed and expected all-ages DALY rates. Blues indicate much lower observed DALYs than expected levels based on SDI, whereas reds refl ect that observed DALYs far exceed expected levels given SDI. ATG=Antigua and Barbuda. VCT=Saint Vincent and the Grenadines. LCA=Saint Lucia. TTO=Trinidad and Tobago. TLS=Timor-Leste. FSM=Federated States of Micronesia. SDI=Socio-demographic Index. DALY=disability-adjusted life-years.
Persian GulfCaribbean LCA
Dominica
ATG
TTO
Grenada
VCT
TLS
Maldives
Barbados
Seychelles
Mauritius
ComorosWest Africa Eastern
Mediterranean
Malta
Singapore Balkan Peninsula Tonga
Samoa
FSM
Fiji
Solomon Isl
Marshall Isl
Vanuatu
Kiribati
≤0·630·63–0·790·79–0·900·90–1·01·0–1·09
1·09–1·241·24–1·561·56–2·49>2·49
Ratio

Articles
1638 www.thelancet.com Vol 388 October 8, 2016
retirement. Compression can be interpreted in both absolute and relative terms. Absolute compression implies that as people live longer lives, they lose fewer years due to functional health loss, whereas relative compression implies that as people live longer lives, the ratio of years of functional health lost to life expectancy declines. Although some evidence shows that compression occurs among people with specifi c diseases such as diabetes and dementia,31,32 national studies show more mixed results.33–35 This might not be surprising, as most national studies rely on self-reported health status and chronic conditions, which are then further complicated by variations in how individuals use the response scales and profound framing eff ects.36–39 By contrast, the GBD study provides a more comprehensive and comparable assessment of changes in functional health status by synthesising many types of data, by cause, and applying standardised disability weights to refl ect the public’s average views of severity of diff erent conditions. GBD 2015 results unequivocally show that as life expectancy increases, people spend more time with reduced functional health status, and thus absolute expansion of morbidity has occurred. This trend is driven by marked declines in age-specifi c mortality at the same time minimal improvement, if any, has occurred for age-specifi c YLDs per capita. The proportion of lifespans spent in ill health has remained comparatively constant since 1990, and did not vary as a function of SDI; thus, we found nominal evidence of relative compression at the global level.
Drawing from our empirical characterisation of epidemiological transitions on the basis of SDI, we found that life expectancy and HALE increased linearly with SDI, whereas years of functional health lost climbed with rising SDI. Historically, increases in SDI are associated with a rapid decrease in burden from communicable, neonatal, maternal, and nutritional diseases, the leading killers of children, adolescent girls, and women. Eff orts to increase income, provide more years of education, and reduce adolescent and total fertility rates thus might catalyse additional gains for life expectancy, HALE, and reduced disease burden, emphasising the critical role of policy interventions beyond more traditional health service delivery.
At diff erent locations in this continuous process of change, we see evidence of a so-called double burden of disease: from a SDI of approximately 0·35 to 0·60, we expect NCDs and Group 1 causes to each account for at least 20% of disease burden. The average relationships with SDI imply that within a country with wide inequalities in SDI, we should also expect wide variation in disease burden patterns. Subnational disparities might be consistent with variations in subnational SDI, either recording higher or lower burden than that of the national level. Use of average patterns can help to benchmark a country against others, but such assessments can also help to provide insights as to whether public action or other factors are helping make inequalities narrower than
expected based on SDI alone. Given the complexity of health patterns identifi ed for many causes and diff erential patterns by age and sex, providing some understanding of expected patterns on the basis of SDI alone can help to anchor the exploration of results and could provide some measure of the performance of health systems or the magnitude of avertable burden within each country or territory.
The Lancet Commission on Investing in Health40 galvanised considerable interest in the notion of a “grand convergence”, such that levels of under-5 mortality, maternal mortality, and some infectious diseases could converge across all countries within a generation. Convergence can be achieved through progress on in-creasing SDI (ie, increasing per-capita income and average years of schooling, and reducing fertility) and reducing or inverting high ratios between observed and expected (based on SDI alone) health expectancies and health gaps. The Commission has argued that, within a generation, preventable deaths in children and mothers could largely be avoided through increased investment of development assistance for health and expanded national expenditure on health. The vision inspired some of the absolute threshold SDG targets, including reducing under-5 mortality to 25 deaths per 1000 livebirths, neonatal mortality to 12 deaths per 1000 livebirths, and maternal mortality ratio to 70 deaths per 100 000 livebirths. The relationships between these health outcomes, broader health measures, and SDI off er a framework by which the likelihood of such a grand convergence can be assessed. Based on GBD 2015 results, the historical relationship between SDI and health suggests that convergence in the sense of reduced absolute diff erences in rates is likely to occur with faster improvements in SDI. However, if convergence means smaller relative diff erences, then improvements in SDI alone might not be suffi cient. Our fi ndings show that continued SDI improvement does not appear to be historically associated with absolute convergence in life expectancy or HALE. The Lancet Commission also emphasised the importance of hastening progress through strategic investments by donors and govern-ments in eff ective health technologies, an approach that has the potential to catalyse faster progress than what would be expected on the basis of SDI alone. Convergence in this scenario could then be interpreted as reduction in the ratio of observed to expected burden for low-income and lower-middle-income countries (LMICs), and could be used as an indirect, but summary, metric to monitor health system performance and overall progress toward the SDGs. Since history provides a perspective for identifying which countries have been able to reduce their ratio of observed to expected health outcomes, the comprehensive and longitudinal approach of the GBD is optimally suited for monitoring health system-driven convergence at a macro-level. The same tools can also therefore be used to generate insights on
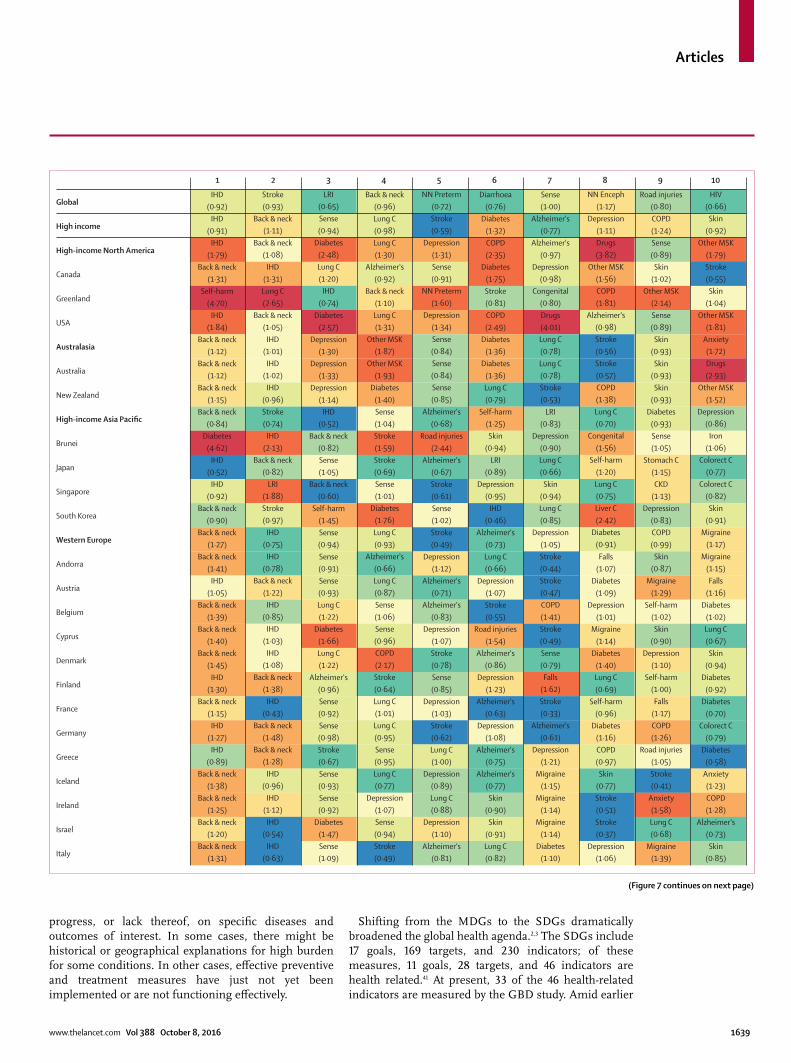
Articles
www.thelancet.com Vol 388 October 8, 2016 1639
progress, or lack thereof, on specifi c diseases and outcomes of interest. In some cases, there might be historical or geographical explanations for high burden for some conditions. In other cases, eff ective preventive and treatment measures have just not yet been implemented or are not functioning eff ectively.
Shifting from the MDGs to the SDGs dramatically broadened the global health agenda.2,3 The SDGs include 17 goals, 169 targets, and 230 indicators; of these measures, 11 goals, 28 targets, and 46 indicators are health related.41 At present, 33 of the 46 health-related indicators are measured by the GBD study. Amid earlier
(Figure 7 continues on next page)
Global
High income
High-income North America
Canada
Greenland
USA
Australasia
Australia
New Zealand
High-income Asia Pacific
Brunei
Japan
Singapore
South Korea
Western Europe
Andorra
Austria
Belgium
Cyprus
Denmark
Finland
France
Germany
Greece
Iceland
Ireland
Israel
Italy
IHD(0·92)
IHD(0·91)
IHD(1·79)
Back & neck(1·31)
Self-harm(4·70)
IHD(1·84)
Back & neck(1·12)
Back & neck(1·12)
Back & neck(1·15)
Back & neck(0·84)
Diabetes(4·62)
IHD(0·52)
IHD(0·92)
Back & neck(0·90)
Back & neck(1·27)
Back & neck(1·41)
IHD(1·05)
Back & neck(1·39)
Back & neck(1·40)
Back & neck(1·45)
IHD(1·30)
Back & neck(1·15)
IHD(1·27)
IHD(0·89)
Back & neck(1·38)
Back & neck(1·25)
Back & neck(1·20)
Back & neck(1·31)
Stroke(0·93)
Back & neck(1·11)
Back & neck(1·08)
IHD(1·31)Lung C(2·65)
Back & neck(1·05)
IHD(1·01)
IHD(1·02)
IHD(0·96)Stroke(0·74)
IHD(2·13)
Back & neck(0·82)
LRI(1·88)Stroke(0·97)
IHD(0·75)
IHD(0·78)
Back & neck(1·22)
IHD(0·85)
IHD(1·03)
IHD(1·08)
Back & neck(1·38)
IHD(0·43)
Back & neck(1·48)
Back & neck(1·28)
IHD(0·96)
IHD(1·12)
IHD(0·54)
IHD(0·63)
LRI(0·65)Sense(0·94)
Diabetes(2·48)Lung C(1·20)
IHD(0·74)
Diabetes(2·57)
Depression(1·30)
Depression(1·33)
Depression(1·14)
IHD(0·52)
Back & neck(0·82)Sense(1·05)
Back & neck(0·60)
Self-harm(1·45)Sense(0·94)Sense(0·91)Sense(0·93)Lung C(1·22)
Diabetes(1·66)Lung C(1·22)
Alzheimer's(0·96)Sense(0·92)Sense(0·98)Stroke(0·67)Sense(0·93)Sense(0·92)
Diabetes(1·47)Sense(1·09)
Back & neck(0·96)Lung C(0·98)Lung C(1·30)
Alzheimer's(0·92)
Back & neck(1·10)Lung C(1·31)
Other MSK(1·87)
Other MSK(1·93)
Diabetes(1·40)Sense(1·04)Stroke(1·59)Stroke(0·69)Sense(1·01)
Diabetes(1·76)Lung C(0·93)
Alzheimer's(0·66)Lung C(0·87)Sense(1·06)Sense(0·96)COPD(2·17)Stroke(0·64)Lung C(1·01)Lung C(0·95)Sense(0·95)Lung C(0·77)
Depression(1·07)Sense(0·94)Stroke(0·49)
NN Preterm(0·72)Stroke(0·59)
Depression(1·31)Sense(0·91)
NN Preterm(1·60)
Depression(1·34)Sense(0·84)Sense(0·84)Sense(0·85)
Alzheimer's(0·68)
Road injuries(2·44)
Alzheimer's(0·67)Stroke(0·61)Sense(1·02)Stroke(0·49)
Depression(1·12)
Alzheimer's(0·71)
Alzheimer's(0·83)
Depression(1·07)Stroke(0·78)Sense(0·85)
Depression(1·03)Stroke(0·62)Lung C(1·00)
Depression(0·89)Lung C(0·88)
Depression(1·10)
Alzheimer's(0·81)
Diarrhoea(0·76)
Diabetes(1·32)COPD(2·35)
Diabetes(1·75)Stroke(0·81)COPD(2·49)
Diabetes(1·36)
Diabetes(1·36)Lung C(0·79)
Self-harm(1·25)Skin
(0·94)LRI
(0·89)Depression
(0·95)IHD
(0·46)Alzheimer's
(0·73)Lung C(0·66)
Depression(1·07)Stroke(0·55)
Road injuries(1·54)
Alzheimer's(0·86)
Depression(1·23)
Alzheimer's(0·63)
Depression(1·08)
Alzheimer's(0·75)
Alzheimer's(0·77)Skin
(0·90)Skin
(0·91)Lung C(0·82)
Sense(1·00)
Alzheimer's(0·77)
Alzheimer's(0·97)
Depression(0·98)
Congenital(0·80)Drugs(4·01)Lung C(0·78)Lung C(0·78)Stroke(0·53)
LRI(0·83)
Depression(0·90)Lung C(0·66)
Skin(0·94)Lung C(0·85)
Depression(1·05)Stroke(0·44)Stroke(0·47)COPD(1·41)Stroke(0·49)Sense(0·79)Falls
(1·62)Stroke(0·33)
Alzheimer's(0·61)
Depression(1·21)
Migraine(1·15)
Migraine(1·14)
Migraine(1·14)
Diabetes(1·10)
NN Enceph(1·17)
Depression(1·11)Drugs(3·82)
Other MSK(1·56)COPD(1·81)
Alzheimer's(0·98)Stroke(0·56)Stroke(0·57)COPD(1·38)Lung C(0·70)
Congenital(1·56)
Self-harm(1·20)Lung C(0·75)Liver C(2·42)
Diabetes(0·91)Falls
(1·07)Diabetes
(1·09)Depression
(1·01)Migraine
(1·14)Diabetes
(1·40)Lung C(0·69)
Self-harm(0·96)
Diabetes(1·16)COPD(0·97)Skin
(0·77)Stroke(0·51)Stroke(0·37)
Depression(1·06)
Road injuries(0·80)COPD(1·24)Sense(0·89)
Skin(1·02)
Other MSK(2·14)Sense(0·89)
Skin(0·93)Skin
(0·93)Skin
(0·93)Diabetes
(0·93)Sense(1·05)
Stomach C(1·15)CKD
(1·13)Depression
(0·83)COPD(0·99)
Skin(0·87)
Migraine(1·29)
Self-harm(1·02)Skin
(0·90)Depression
(1·10)Self-harm
(1·00)Falls
(1·17)COPD(1·26)
Road injuries(1·05)Stroke(0·41)
Anxiety(1·58)Lung C(0·68)
Migraine(1·39)
HIV(0·66)
Skin(0·92)
Other MSK(1·79)Stroke(0·55)Skin
(1·04)Other MSK
(1·81)Anxiety(1·72)Drugs(2·93)
Other MSK(1·52)
Depression(0·86)
Iron(1·06)
Colorect C(0·77)
Colorect C(0·82)Skin
(0·91)Migraine
(1·17)Migraine
(1·15)Falls
(1·16)Diabetes
(1·02)Lung C(0·67)Skin
(0·94)Diabetes
(0·92)Diabetes
(0·70)Colorect C
(0·79)Diabetes
(0·58)Anxiety(1·23)COPD(1·28)
Alzheimer's(0·73)Skin
(0·85)
1 2 3 4 5 6 7 8 9 10
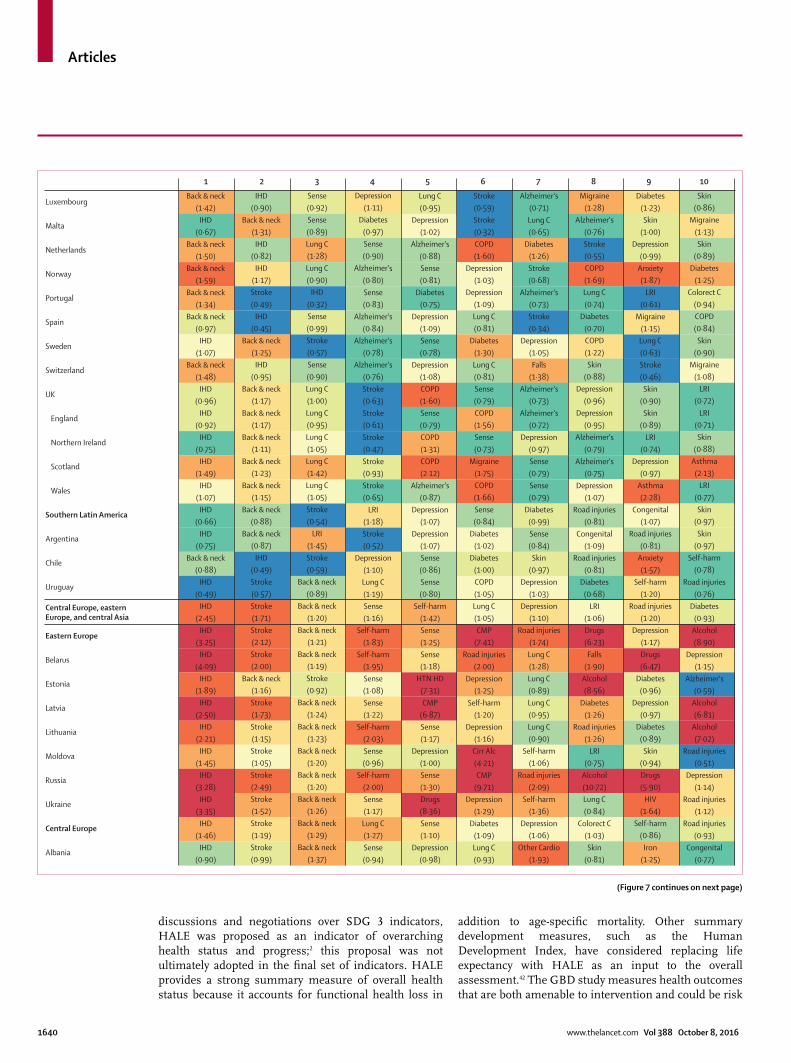
Articles
1640 www.thelancet.com Vol 388 October 8, 2016
discussions and negotiations over SDG 3 indicators, HALE was proposed as an indicator of overarching health status and progress;2 this proposal was not ultimately adopted in the fi nal set of indicators. HALE provides a strong summary measure of overall health status because it accounts for functional health loss in
addition to age-specifi c mortality. Other summary development measures, such as the Human Development Index, have considered replacing life expectancy with HALE as an input to the overall assessment.42 The GBD study measures health outcomes that are both amenable to intervention and could be risk
(Figure 7 continues on next page)
Back & neck(1·42)
IHD(0·67)
Back & neck(1·50)
Back & neck(1·59)
Back & neck(1·34)
Back & neck(0·97)
IHD(1·07)
Back & neck(1·48)
IHD(0·96)
IHD(0·92)
IHD(0·75)
IHD(1·49)
IHD(1·07)
IHD(0·66)
IHD(0·75)
Back & neck(0·88)
IHD(0·49)
IHD(2·45)
IHD(3·25)
IHD(4·09)
IHD(1·89)
IHD(2·50)
IHD(2·21)
IHD(1·45)
IHD(3·28)
IHD(3·35)
IHD(1·46)
IHD(0·90)
IHD(0·90)
Back & neck(1·31)
IHD(0·82)
IHD(1·17)Stroke(0·49)
IHD(0·45)
Back & neck(1·25)
IHD(0·95)
Back & neck(1·17)
Back & neck(1·17)
Back & neck(1·11)
Back & neck(1·23)
Back & neck(1·15)
Back & neck(0·88)
Back & neck(0·87)
IHD(0·49)Stroke(0·57)Stroke(1·71)Stroke(2·12)Stroke(2·00)
Back & neck(1·16)Stroke(1·73)Stroke(1·15)Stroke(1·05)Stroke(2·49)Stroke(1·52)Stroke(1·19)Stroke(0·99)
Sense(0·92)Sense(0·89)Lung C(1·28)Lung C(0·90)
IHD(0·32)Sense(0·99)Stroke(0·57)Sense(0·90)Lung C(1·00)Lung C(0·95)Lung C(1·05)Lung C(1·42)Lung C(1·05)Stroke(0·54)
LRI(1·45)Stroke(0·59)
Back & neck(0·89)
Back & neck(1·20)
Back & neck(1·21)
Back & neck(1·19)Stroke(0·92)
Back & neck(1·24)
Back & neck(1·23)
Back & neck(1·20)
Back & neck(1·20)
Back & neck(1·26)
Back & neck(1·29)
Back & neck(1·37)
Depression(1·11)
Diabetes(0·97)Sense(0·90)
Alzheimer's(0·80)Sense(0·83)
Alzheimer's(0·84)
Alzheimer's(0·78)
Alzheimer's(0·76)Stroke(0·63)Stroke(0·61)Stroke(0·47)Stroke(0·93)Stroke(0·65)
LRI(1·18)Stroke(0·52)
Depression(1·10)Lung C(1·19)Sense(1·16)
Self-harm(1·83)
Self-harm(1·95)Sense(1·08)Sense(1·22)
Self-harm(2·03)Sense(0·96)
Self-harm(2·00)Sense(1·17)
Lung C(1·27)Sense(0·94)
Lung C(0·95)
Depression(1·02)
Alzheimer's(0·88)Sense(0·81)
Diabetes(0·75)
Depression(1·09)Sense(0·78)
Depression(1·08)COPD(1·60)Sense(0·79)COPD(1·31)COPD(2·12)
Alzheimer's(0·87)
Depression(1·07)
Depression(1·07)Sense(0·86)Sense(0·80)
Self-harm(1·42)Sense(1·25)Sense(1·18)
HTN HD(7·31)CMP
(6·87)Sense(1·17)
Depression(1·00)Sense(1·30)Drugs(8·36)Sense(1·10)
Depression(0·98)
Stroke(0·59)Stroke(0·32)COPD(1·60)
Depression(1·03)
Depression(1·09)Lung C(0·81)
Diabetes(1·30)Lung C(0·81)Sense(0·79)COPD(1·56)Sense(0·73)
Migraine(1·75)COPD(1·66)Sense(0·84)
Diabetes(1·02)
Diabetes(1·00)COPD(1·05)Lung C(1·05)CMP
(7·41)Road injuries
(2·00)Depression
(1·25)Self-harm
(1·20)Depression
(1·16)Cirr Alc(4·21)CMP
(9·71)Depression
(1·29)Diabetes
(1·09)Lung C(0·93)
Alzheimer's(0·71)Lung C(0·65)
Diabetes(1·26)Stroke(0·68)
Alzheimer's(0·73)Stroke(0·34)
Depression(1·05)Falls
(1·38)Alzheimer's
(0·73)Alzheimer's
(0·72)Depression
(0·97)Sense(0·79)Sense(0·79)
Diabetes(0·99)Sense(0·84)
Skin(0·97)
Depression(1·03)
Depression(1·10)
Road injuries(1·74)Lung C(1·28)Lung C(0·89)Lung C(0·95)Lung C(0·90)
Self-harm(1·06)
Road injuries(2·09)
Self-harm(1·36)
Depression(1·06)
Other Cardio(1·93)
Migraine(1·28)
Alzheimer's(0·76)Stroke(0·55)COPD(1·69)Lung C(0·74)
Diabetes(0·70)COPD(1·22)Skin
(0·88)Depression
(0·96)Depression
(0·95)Alzheimer's
(0·79)Alzheimer's
(0·75)Depression
(1·07)Road injuries
(0·81)Congenital
(1·09)Road injuries
(0·81)Diabetes
(0·68)LRI
(1·06)Drugs(6·23)Falls
(1·90)Alcohol(8·56)
Diabetes(1·26)
Road injuries(1·26)
LRI(0·75)
Alcohol(10·72)Lung C(0·84)
Colorect C(1·03)Skin
(0·81)
Diabetes(1·23)Skin
(1·00)Depression
(0·99)Anxiety(1·87)
LRI(0·61)
Migraine(1·15)Lung C(0·63)Stroke(0·46)
Skin(0·90)
Skin(0·89)
LRI(0·74)
Depression(0·97)
Asthma(2·28)
Congenital(1·07)
Road injuries(0·81)
Anxiety(1·57)
Self-harm(1·20)
Road injuries(1·20)
Depression(1·17)Drugs(6·47)
Diabetes(0·96)
Depression(0·97)
Diabetes(0·89)
Skin(0·94)Drugs(5·90)
HIV(1·64)
Self-harm(0·86)
Iron(1·25)
Skin(0·86)
Migraine(1·13)Skin
(0·89)Diabetes
(1·25)Colorect C
(0·94)COPD(0·84)
Skin(0·90)
Migraine(1·08)
LRI(0·72)
LRI(0·71)Skin
(0·88)Asthma
(2·13)LRI
(0·77)Skin
(0·97)Skin
(0·97)Self-harm
(0·78)Road injuries
(0·76)Diabetes
(0·93)Alcohol(8·90)
Depression(1·15)
Alzheimer's(0·59)
Alcohol(6·81)
Alcohol(7·02)
Road injuries(0·51)
Depression(1·14)
Road injuries(1·12)
Road injuries(0·93)
Congenital(0·77)
1 2 3 4 5 6 7 8 9 10
Luxembourg
Malta
Netherlands
Norway
Portugal
Spain
Sweden
Switzerland
UK
England
Northern Ireland
Scotland
Wales
Southern Latin America
Argentina
Chile
Uruguay
Central Europe, easternEurope, and central Asia
Eastern Europe
Belarus
Estonia
Latvia
Lithuania
Moldova
Russia
Ukraine
Central Europe
Albania
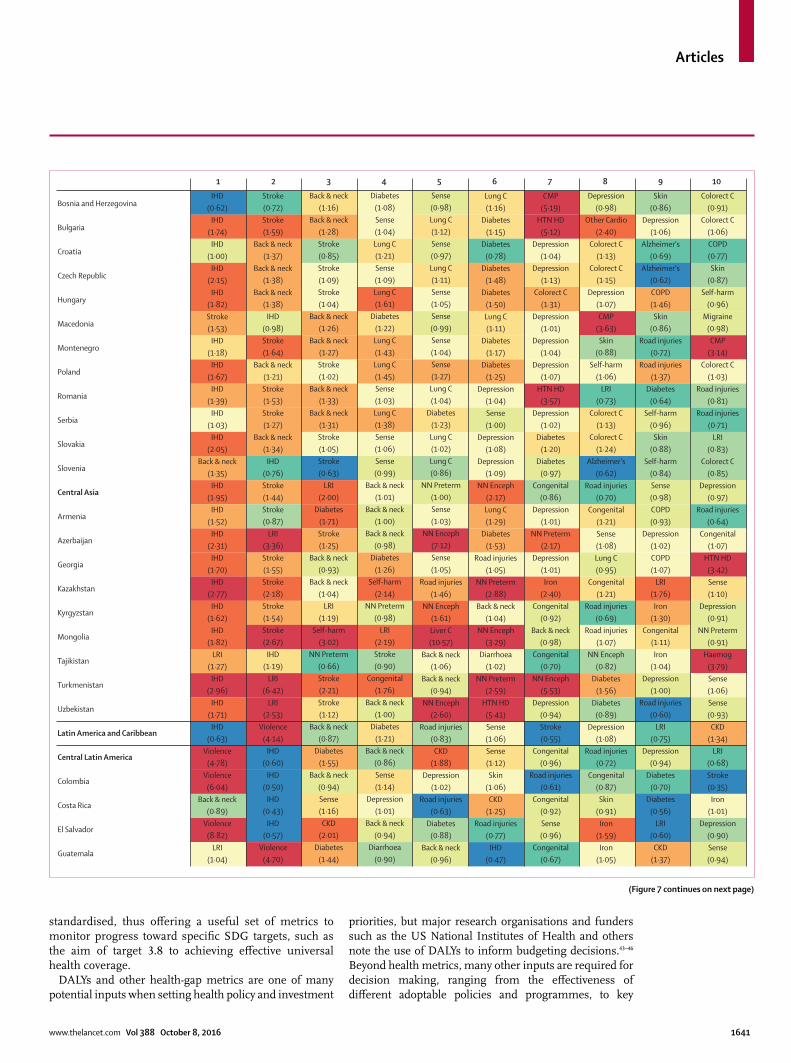
Articles
www.thelancet.com Vol 388 October 8, 2016 1641
standardised, thus off ering a useful set of metrics to monitor progress toward specifi c SDG targets, such as the aim of target 3.8 to achieving eff ective universal health coverage.
DALYs and other health-gap metrics are one of many potential inputs when setting health policy and investment
priorities, but major research organisations and funders such as the US National Institutes of Health and others note the use of DALYs to inform budgeting decisions.43–46 Beyond health metrics, many other inputs are required for decision making, ranging from the eff ectiveness of diff erent adoptable policies and programmes, to key
(Figure 7 continues on next page)
IHD(0·62)
IHD(1·74)
IHD(1·00)
IHD(2·15)
IHD(1·82)Stroke(1·53)
IHD(1·18)
IHD(1·67)
IHD(1·39)
IHD(1·03)
IHD(2·05)
Back & neck(1·35)
IHD(1·95)
IHD(1·52)
IHD(2·31)
IHD(1·70)
IHD(2·77)
IHD(1·62)
IHD(1·82)
LRI(1·27)
IHD(2·96)
IHD(1·71)
IHD(0·63)
Violence(4·78)
Violence(6·04)
Back & neck(0·89)
Violence(8·82)
LRI(1·04)
Stroke(0·72)Stroke(1·59)
Back & neck(1·37)
Back & neck(1·38)
Back & neck(1·38)
IHD(0·98)Stroke(1·64)
Back & neck(1·21)Stroke(1·53)Stroke(1·27)
Back & neck(1·34)
IHD(0·76)Stroke(1·44)Stroke(0·87)
LRI(3·36)Stroke(1·55)Stroke(2·18)Stroke(1·54)Stroke(2·67)
IHD(1·19)
LRI(6·42)
LRI(2·53)
Violence(4·14)
IHD(0·60)
IHD(0·50)
IHD(0·43)
IHD(0·57)
Violence(4·70)
Back & neck(1·16)
Back & neck(1·28)Stroke(0·85)Stroke(1·09)Stroke(1·04)
Back & neck(1·26)
Back & neck(1·27)Stroke(1·02)
Back & neck(1·33)
Back & neck(1·31)Stroke(1·05)Stroke(0·63)
LRI(2·00)
Diabetes(1·71)Stroke(1·25)
Back & neck(0·93)
Back & neck(1·04)
LRI(1·19)
Self-harm(3·02)
NN Preterm(0·66)Stroke(2·21)Stroke(1·12)
Back & neck(0·87)
Diabetes(1·55)
Back & neck(0·94)Sense(1·16)CKD
(2·01)Diabetes
(1·44)
Diabetes(1·08)Sense(1·04)Lung C(1·21)Sense(1·09)Lung C(1·61)
Diabetes(1·22)Lung C(1·43)Lung C(1·45)Sense(1·03)Lung C(1·38)Sense(1·06)Sense(0·99)
Back & neck(1·01)
Back & neck(1·00)
Back & neck(0·98)
Diabetes(1·26)
Self-harm(2·14)
NN Preterm(0·98)
LRI(2·19)Stroke(0·90)
Congenital(1·76)
Back & neck(1·00)
Diabetes(1·21)
Back & neck(0·86)Sense(1·14)
Depression(1·01)
Back & neck(0·94)
Diarrhoea(0·90)
Sense(0·98)Lung C(1·12)Sense(0·97)Lung C(1·11)Sense(1·05)Sense(0·99)Sense(1·04)Sense(1·27)Lung C(1·04)
Diabetes(1·23)Lung C(1·02)Lung C(0·86)
NN Preterm(1·00)Sense(1·03)
NN Enceph(7·12)Sense(1·05)
Road injuries(1·46)
NN Enceph(1·61)Liver C(10·57)
Back & neck(1·06)
Back & neck(0·94)
NN Enceph(2·60)
Road injuries(0·83)
CKD(1·88)
Depression(1·02)
Road injuries(0·63)
Diabetes(0·88)
Back & neck(0·96)
Lung C(1·16)
Diabetes(1·15)
Diabetes(0·78)
Diabetes(1·48)
Diabetes(1·50)Lung C(1·11)
Diabetes(1·17)
Diabetes(1·25)
Depression(1·04)Sense(1·00)
Depression(1·08)
Depression(1·09)
NN Enceph(2·17)Lung C(1·29)
Diabetes(1·53)
Road injuries(1·05)
NN Preterm(2·88)
Back & neck(1·04)
NN Enceph(3·29)
Diarrhoea(1·02)
NN Preterm(2·59)
HTN HD(5·41)Sense(1·06)Sense(1·12)Skin
(1·06)CKD
(1·25)Road injuries
(0·77)IHD
(0·47)
CMP(5·19)
HTN HD(5·12)
Depression(1·04)
Depression(1·13)
Colorect C(1·31)
Depression(1·01)
Depression(1·04)
Depression(1·07)
HTN HD(3·57)
Depression(1·02)
Diabetes(1·20)
Diabetes(0·97)
Congenital(0·86)
Depression(1·01)
NN Preterm(2·17)
Depression(1·01)Iron
(2·40)Congenital
(0·92)Back & neck
(0·98)Congenital
(0·70)NN Enceph
(5·53)Depression
(0·94)Stroke(0·55)
Congenital(0·96)
Road injuries(0·61)
Congenital(0·92)Sense(0·96)
Congenital(0·67)
Depression(0·98)
Other Cardio(2·40)
Colorect C(1·13)
Colorect C(1·15)
Depression(1·07)CMP
(3·63)Skin
(0·88)Self-harm
(1·06)LRI
(0·73)Colorect C
(1·13)Colorect C
(1·24)Alzheimer's
(0·62)Road injuries
(0·70)Congenital
(1·21)Sense(1·08)Lung C(0·95)
Congenital(1·21)
Road injuries(0·69)
Road injuries(1·07)
NN Enceph(0·82)
Diabetes(1·56)
Diabetes(0·89)
Depression(1·08)
Road injuries(0·72)
Congenital(0·87)Skin
(0·91)Iron
(1·59)Iron
(1·05)
Skin(0·86)
Depression(1·06)
Alzheimer's(0·69)
Alzheimer's(0·62)COPD(1·46)Skin
(0·86)Road injuries
(0·72)Road injuries
(1·37)Diabetes
(0·64)Self-harm
(0·96)Skin
(0·88)Self-harm
(0·84)Sense(0·98)COPD(0·93)
Depression(1·02)COPD(1·07)
LRI(1·76)Iron
(1·30)Congenital
(1·11)Iron
(1·04)Depression
(1·00)Road injuries
(0·60)LRI
(0·75)Depression
(0·94)Diabetes
(0·70)Diabetes
(0·56)LRI
(0·60)CKD
(1·37)
Colorect C(0·91)
Colorect C(1·06)COPD(0·77)Skin
(0·87)Self-harm
(0·96)Migraine
(0·98)CMP
(3·14)Colorect C
(1·03)Road injuries
(0·81)Road injuries
(0·71)LRI
(0·83)Colorect C
(0·85)Depression
(0·97)Road injuries
(0·64)Congenital
(1·07)HTN HD
(3·42)Sense(1·10)
Depression(0·91)
NN Preterm(0·91)
Haemog(3·79)Sense(1·06)Sense(0·93)
CKD(1·34)
LRI(0·68)Stroke(0·35)
Iron(1·01)
Depression(0·90)Sense(0·94)
1 2 3 4 5 6 7 8 9 10
Bosnia and Herzegovina
Bulgaria
Croatia
Czech Republic
Hungary
Macedonia
Montenegro
Poland
Romania
Serbia
Slovakia
Slovenia
Central Asia
Armenia
Azerbaijan
Georgia
Kazakhstan
Kyrgyzstan
Mongolia
Tajikistan
Turkmenistan
Uzbekistan
Latin America and Caribbean
Central Latin America
Colombia
Costa Rica
El Salvador
Guatemala
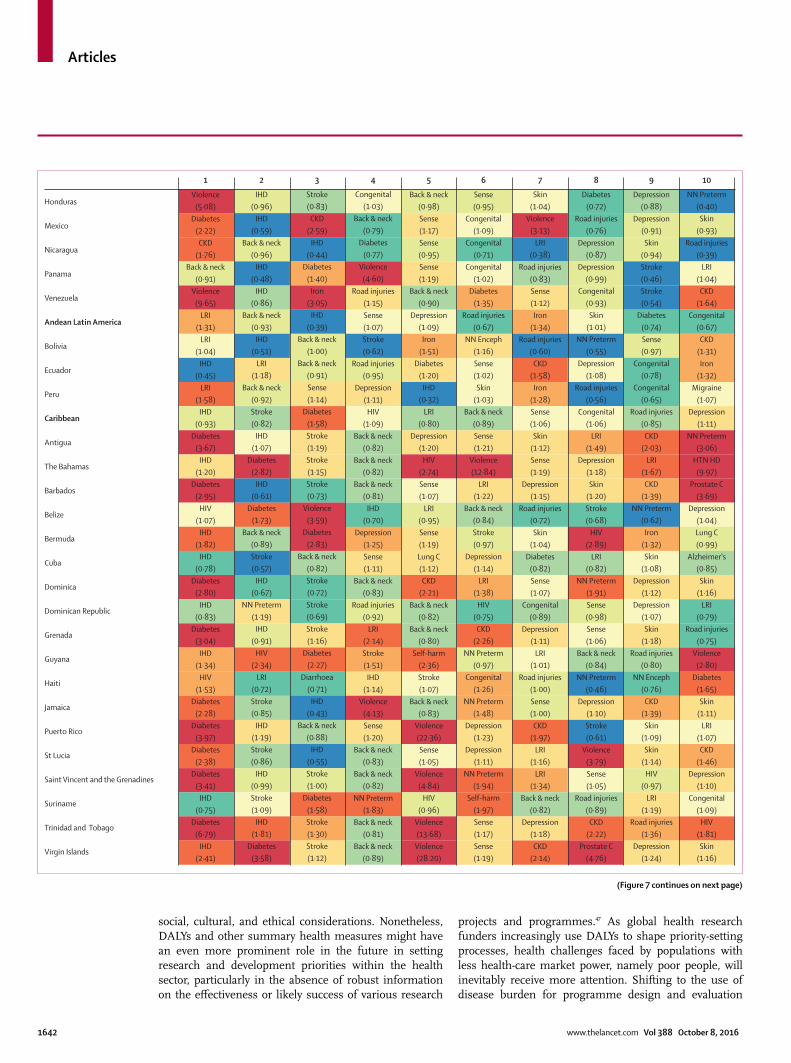
Articles
1642 www.thelancet.com Vol 388 October 8, 2016
social, cultural, and ethical considerations. Nonetheless, DALYs and other summary health measures might have an even more prominent role in the future in setting research and development priorities within the health sector, particularly in the absence of robust information on the eff ectiveness or likely success of various research
projects and programmes.47 As global health research funders increasingly use DALYs to shape priority-setting processes, health challenges faced by populations with less health-care market power, namely poor people, will inevitably receive more attention. Shifting to the use of disease burden for programme design and evaluation
(Figure 7 continues on next page)
Violence(5·08)
Diabetes(2·22)CKD
(1·76)Back & neck
(0·91)Violence
(9·65)LRI
(1·31)LRI
(1·04)IHD
(0·45)LRI
(1·58)IHD
(0·93)Diabetes
(3·67)IHD
(1·20)Diabetes
(2·95)HIV
(1·07)IHD
(1·82)IHD
(0·78)Diabetes
(2·80)IHD
(0·83)Diabetes
(3·04)IHD
(1·34)HIV
(1·53)Diabetes
(2·28)Diabetes
(3·97)Diabetes
(2·38)Diabetes
(3·41)IHD
(0·75)Diabetes
(6·79)IHD
(2·41)
IHD(0·96)
IHD(0·59)
Back & neck(0·96)
IHD(0·48)
IHD(0·86)
Back & neck(0·93)
IHD(0·51)
LRI(1·18)
Back & neck(0·92)Stroke(0·82)
IHD(1·07)
Diabetes(2·82)
IHD(0·61)
Diabetes(1·73)
Back & neck(0·89)Stroke(0·57)
IHD(0·67)
NN Preterm(1·19)
IHD(0·91)
HIV(2·34)
LRI(0·72)Stroke(0·85)
IHD(1·19)Stroke(0·86)
IHD(0·99)Stroke(1·09)
IHD(1·81)
Diabetes(3·58)
Stroke(0·83)
CKD(2·59)
IHD(0·44)
Diabetes(1·40)
Iron(3·05)
IHD(0·39)
Back & neck(1·00)
Back & neck(0·91)Sense(1·14)
Diabetes(1·58)Stroke(1·19)Stroke(1·15)Stroke(0·73)
Violence(3·59)
Diabetes(2·83)
Back & neck(0·82)Stroke(0·72)Stroke(0·69)Stroke(1·16)
Diabetes(2·27)
Diarrhoea(0·71)
IHD(0·43)
Back & neck(0·88)
IHD(0·55)Stroke(1·00)
Diabetes(1·58)Stroke(1·30)Stroke(1·12)
Congenital(1·03)
Back & neck(0·79)
Diabetes(0·77)
Violence(4·60)
Road injuries(1·15)Sense(1·07)Stroke(0·62)
Road injuries(0·95)
Depression(1·11)
HIV(1·09)
Back & neck(0·82)
Back & neck(0·82)
Back & neck(0·81)
IHD(0·70)
Depression(1·25)Sense(1·11)
Back & neck(0·83)
Road injuries(0·92)
LRI(2·14)Stroke(1·51)
IHD(1·14)
Violence(4·13)Sense(1·20)
Back & neck(0·83)
Back & neck(0·82)
NN Preterm(1·83)
Back & neck(0·81)
Back & neck(0·89)
Back & neck(0·98)Sense(1·17)Sense(0·95)Sense(1·19)
Back & neck(0·90)
Depression(1·09)
Iron(1·51)
Diabetes(1·20)
IHD(0·32)
LRI(0·80)
Depression(1·20)
HIV(2·74)Sense(1·07)
LRI(0·95)Sense(1·19)Lung C(1·12)CKD
(2·21)Back & neck
(0·82)Back & neck
(0·80)Self-harm
(2·36)Stroke(1·07)
Back & neck(0·83)
Violence(22·36)Sense(1·05)
Violence(4·84)
HIV(0·96)
Violence(13·68)
Violence(28·20)
Sense(0·95)
Congenital(1·09)
Congenital(0·71)
Congenital(1·02)
Diabetes(1·35)
Road injuries(0·67)
NN Enceph(1·16)Sense(1·02)Skin
(1·03)Back & neck
(0·89)Sense(1·21)
Violence(12·84)
LRI(1·22)
Back & neck(0·84)Stroke(0·97)
Depression(1·14)
LRI(1·38)
HIV(0·75)CKD
(2·26)NN Preterm
(0·97)Congenital
(1·26)NN Preterm
(1·48)Depression
(1·23)Depression
(1·11)NN Preterm
(1·94)Self-harm
(1·97)Sense(1·17)Sense(1·19)
Skin(1·04)
Violence(3·13)
LRI(0·38)
Road injuries(0·83)Sense(1·12)Iron
(1·34)Road injuries
(0·60)CKD
(1·58)Iron
(1·28)Sense(1·06)Skin
(1·12)Sense(1·19)
Depression(1·15)
Road injuries(0·72)Skin
(1·04)Diabetes
(0·82)Sense(1·07)
Congenital(0·89)
Depression(1·11)
LRI(1·01)
Road injuries(1·00)Sense(1·00)CKD
(1·97)LRI
(1·16)LRI
(1·34)Back & neck
(0·82)Depression
(1·18)CKD
(2·14)
Diabetes(0·72)
Road injuries(0·76)
Depression(0·87)
Depression(0·99)
Congenital(0·93)Skin
(1·01)NN Preterm
(0·55)Depression
(1·08)Road injuries
(0·56)Congenital
(1·06)LRI
(1·49)Depression
(1·18)Skin
(1·20)Stroke(0·68)
HIV(2·89)
LRI(0·82)
NN Preterm(1·91)Sense(0·98)Sense(1·06)
Back & neck(0·84)
NN Preterm(0·46)
Depression(1·10)Stroke(0·61)
Violence(3·79)Sense(1·05)
Road injuries(0·89)
CKD(2·22)
Prostate C(4·76)
Depression(0·88)
Depression(0·91)Skin
(0·94)Stroke(0·46)Stroke(0·54)
Diabetes(0·74)Sense(0·97)
Congenital(0·78)
Congenital(0·65)
Road injuries(0·85)
CKD(2·03)
LRI(1·67)CKD
(1·39)NN Preterm
(0·62)Iron
(1·32)Skin
(1·08)Depression
(1·12)Depression
(1·07)Skin
(1·18)Road injuries
(0·80)NN Enceph
(0·76)CKD
(1·39)Skin
(1·09)Skin
(1·14)HIV
(0·97)LRI
(1·19)Road injuries
(1·36)Depression
(1·24)
NN Preterm(0·40)
Skin(0·93)
Road injuries(0·39)
LRI(1·04)CKD
(1·64)Congenital
(0·67)CKD
(1·31)Iron
(1·32)Migraine
(1·07)Depression
(1·11)NN Preterm
(3·06)HTN HD
(9·97)Prostate C
(3·69)Depression
(1·04)Lung C(0·99)
Alzheimer's(0·85)Skin
(1·16)LRI
(0·79)Road injuries
(0·75)Violence
(2·80)Diabetes
(1·65)Skin
(1·11)LRI
(1·07)CKD
(1·46)Depression
(1·10)Congenital
(1·09)HIV
(1·81)Skin
(1·16)
1 2 3 4 5 6 7 8 9 10
Honduras
Mexico
Nicaragua
Panama
Venezuela
Andean Latin America
Bolivia
Ecuador
Peru
Caribbean
Antigua
The Bahamas
Barbados
Belize
Bermuda
Cuba
Dominica
Dominican Republic
Grenada
Guyana
Haiti
Jamaica
Puerto Rico
St Lucia
Saint Vincent and the Grenadines
Suriname
Trinidad and Tobago
Virgin Islands
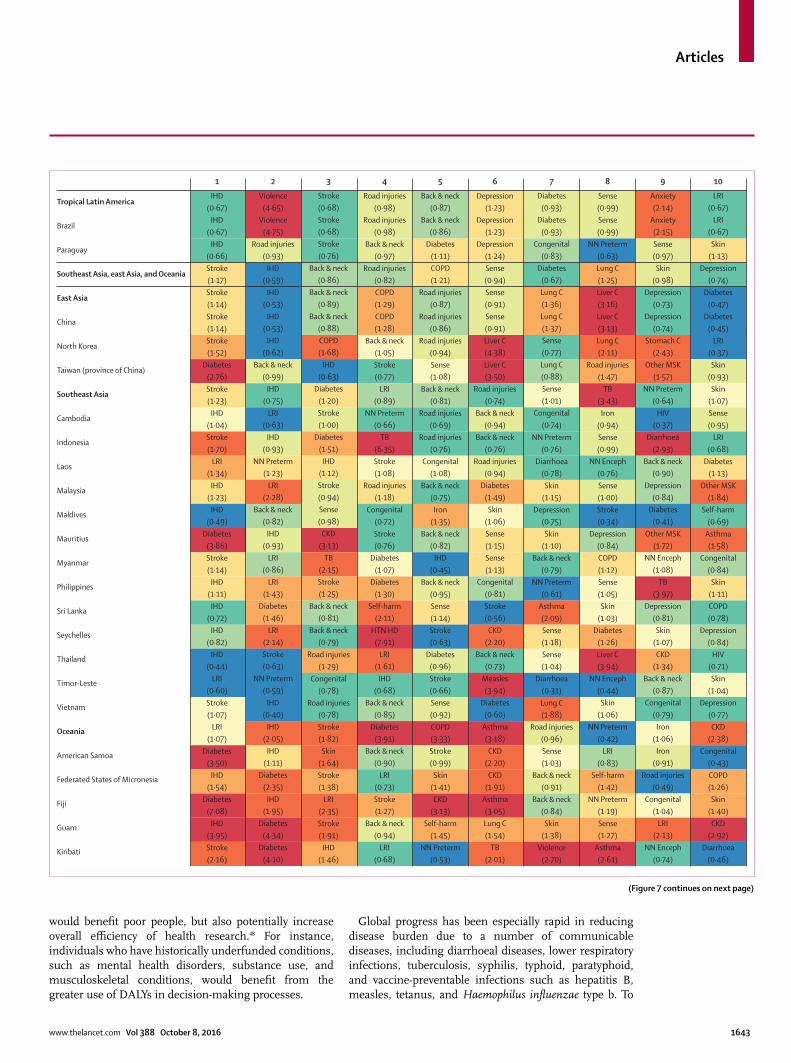
Articles
www.thelancet.com Vol 388 October 8, 2016 1643
would benefi t poor people, but also potentially increase overall effi ciency of health research.48 For instance, individuals who have historically underfunded conditions, such as mental health disorders, substance use, and musculoskeletal conditions, would benefi t from the greater use of DALYs in decision-making processes.
Global progress has been especially rapid in reducing disease burden due to a number of communicable diseases, including diarrhoeal diseases, lower respiratory infections, tuberculosis, syphilis, typhoid, paratyphoid, and vaccine-preventable infections such as hepatitis B, measles, tetanus, and Haemophilus infl uenzae type b. To
(Figure 7 continues on next page)
IHD(0·67)
IHD(0·67)
IHD(0·66)Stroke(1·17)Stroke(1·14)Stroke(1·14)Stroke(1·52)
Diabetes(2·76)Stroke(1·23)
IHD(1·04)Stroke(1·70)
LRI(1·34)
IHD(1·23)
IHD(0·49)
Diabetes(3·86)Stroke(1·14)
IHD(1·11)
IHD(0·72)
IHD(0·82)
IHD(0·44)
LRI(0·60)Stroke(1·07)
LRI(1·07)
Diabetes(3·50)
IHD(1·54)
Diabetes(7·08)
IHD(3·95)Stroke(2·16)
Violence(4·65)
Violence(4·75)
Road injuries(0·93)
IHD(0·59)
IHD(0·53)
IHD(0·53)
IHD(0·62)
Back & neck(0·99)
IHD(0·75)
LRI(0·63)
IHD(0·93)
NN Preterm(1·23)
LRI(2·28)
Back & neck(0·82)
IHD(0·93)
LRI(0·86)
LRI(1·43)
Diabetes(1·46)
LRI(2·14)Stroke(0·63)
NN Preterm(0·59)
IHD(0·40)
IHD(2·05)
IHD(1·11)
Diabetes(2·35)
IHD(1·95)
Diabetes(4·34)
Diabetes(4·10)
Stroke(0·68)Stroke(0·68)Stroke(0·76)
Back & neck(0·86)
Back & neck(0·89)
Back & neck(0·88)COPD(1·68)
IHD(0·63)
Diabetes(1·20)Stroke(1·00)
Diabetes(1·51)
IHD(1·12)Stroke(0·94)Sense(0·98)
CKD(3·13)
TB(2·15)Stroke(1·25)
Back & neck(0·81)
Back & neck(0·79)
Road injuries(1·29)
Congenital(0·78)
Road injuries(0·78)Stroke(1·82)Skin
(1·64)Stroke(1·38)
LRI(2·35)Stroke(1·91)
IHD(1·46)
Road injuries(0·98)
Road injuries(0·98)
Back & neck(0·97)
Road injuries(0·82)COPD(1·29)COPD(1·28)
Back & neck(1·05)Stroke(0·77)
LRI(0·89)
NN Preterm(0·66)
TB(6·35)Stroke(1·08)
Road injuries(1·18)
Congenital(0·72)Stroke(0·76)
Diabetes(1·07)
Diabetes(1·30)
Self-harm(2·11)
HTN HD(7·91)
LRI(1·61)
IHD(0·68)
Back & neck(0·85)
Diabetes(3·91)
Back & neck(0·90)
LRI(0·73)Stroke(1·27)
Back & neck(0·94)
LRI(0·68)
Back & neck(0·87)
Back & neck(0·86)
Diabetes(1·11)COPD(1·21)
Road injuries(0·87)
Road injuries(0·86)
Road injuries(0·94)Sense(1·08)
Back & neck(0·81)
Road injuries(0·69)
Road injuries(0·76)
Congenital(1·08)
Back & neck(0·75)Iron
(1·35)Back & neck
(0·82)IHD
(0·45)Back & neck
(0·95)Sense(1·14)Stroke(0·63)
Diabetes(0·96)Stroke(0·66)Sense(0·92)COPD(3·33)Stroke(0·99)
Skin(1·41)CKD
(3·13)Self-harm
(1·45)NN Preterm
(0·53)
Depression(1·23)
Depression(1·23)
Depression(1·24)Sense(0·94)Sense(0·91)Sense(0·91)Liver C(4·38)Liver C(3·50)
Road injuries(0·74)
Back & neck(0·94)
Back & neck(0·76)
Road injuries(0·94)
Diabetes(1·49)Skin
(1·06)Sense(1·15)Sense(1·13)
Congenital(0·81)Stroke(0·56)
CKD(2·20)
Back & neck(0·73)
Measles(3·94)
Diabetes(0·60)
Asthma(3·18)CKD
(2·20)CKD
(1·91)Asthma(3·05)Lung C(1·54)
TB(2·01)
Diabetes(0·93)
Diabetes(0·93)
Congenital(0·83)
Diabetes(0·67)Lung C(1·36)Lung C(1·37)Sense(0·77)Lung C(0·88)Sense(1·01)
Congenital(0·74)
NN Preterm(0·76)
Diarrhoea(0·78)Skin
(1·15)Depression
(0·75)Skin
(1·10)Back & neck
(0·79)NN Preterm
(0·61)Asthma(2·09)Sense(1·18)Sense(1·04)
Diarrhoea(0·31)Lung C(1·88)
Road injuries(0·96)Sense(1·03)
Back & neck(0·91)
Back & neck(0·84)
Skin(1·38)
Violence(2·70)
Sense(0·99)Sense(0·99)
NN Preterm(0·63)Lung C(1·25)Liver C(3·16)Liver C(3·13)Lung C(2·11)
Road injuries(1·47)
TB(3·43)
Iron(0·94)Sense(0·99)
NN Enceph(0·76)Sense(1·00)Stroke(0·34)
Depression(0·84)COPD(1·12)Sense(1·05)Skin
(1·03)Diabetes
(1·26)Liver C(3·94)
NN Enceph(0·44)
Skin(1·06)
NN Preterm(0·42)
LRI(0·83)
Self-harm(1·42)
NN Preterm(1·19)Sense(1·27)
Asthma(2·61)
Anxiety(2·14)
Anxiety(2·15)Sense(0·97)Skin
(0·98)Depression
(0·73)Depression
(0·74)Stomach C
(2·43)Other MSK
(1·57)NN Preterm
(0·64)HIV
(0·37)Diarrhoea
(2·93)Back & neck
(0·90)Depression
(0·84)Diabetes
(0·41)Other MSK
(1·72)NN Enceph
(1·08)TB
(3·97)Depression
(0·81)Skin
(1·07)CKD
(1·34)Back & neck
(0·87)Congenital
(0·79)Iron
(1·06)Iron
(0·91)Road injuries
(0·49)Congenital
(1·04)LRI
(2·13)NN Enceph
(0·74)
LRI(0·67)
LRI(0·67)Skin
(1·13)Depression
(0·74)Diabetes
(0·47)Diabetes
(0·45)LRI
(0·37)Skin
(0·93)Skin
(1·07)Sense(0·95)
LRI(0·68)
Diabetes(1·13)
Other MSK(1·84)
Self-harm(0·69)
Asthma(1·58)
Congenital(0·84)
Skin(1·11)COPD(0·78)
Depression(0·84)
HIV(0·71)Skin
(1·04)Depression
(0·77)CKD
(2·38)Congenital
(0·43)COPD(1·26)Skin
(1·40)CKD
(2·92)Diarrhoea
(0·46)
1 2 3 4 5 6 7 8 9 10
Tropical Latin America
Brazil
Paraguay
Southeast Asia, east Asia, and Oceania
East Asia
China
North Korea
Taiwan (province of China)
Southeast Asia
Cambodia
Indonesia
Laos
Malaysia
Maldives
Mauritius
Myanmar
Philippines
Sri Lanka
Seychelles
Thailand
Timor-Leste
Vietnam
Oceania
American Samoa
Federated States of Micronesia
Fiji
Guam
Kiribati
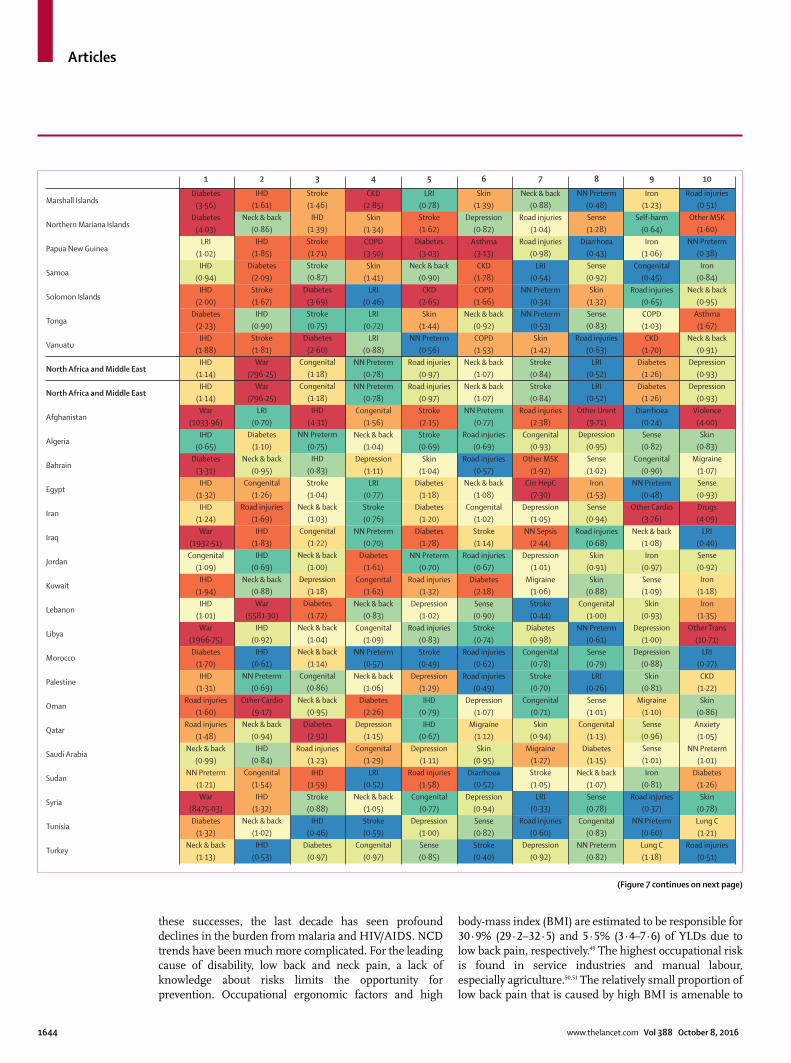
Articles
1644 www.thelancet.com Vol 388 October 8, 2016
these successes, the last decade has seen profound declines in the burden from malaria and HIV/AIDS. NCD trends have been much more complicated. For the leading cause of disability, low back and neck pain, a lack of knowledge about risks limits the opportunity for prevention. Occupational ergonomic factors and high
body-mass index (BMI) are estimated to be responsible for 30·9% (29·2–32·5) and 5·5% (3·4–7·6) of YLDs due to low back pain, respectively.49 The highest occupational risk is found in service industries and manual labour, especially agriculture.50,51 The relatively small proportion of low back pain that is caused by high BMI is amenable to
(Figure 7 continues on next page)
Diabetes(3·56)
Diabetes(4·03)
LRI(1·02)
IHD(0·94)
IHD(2·00)
Diabetes(2·23)
IHD(1·88)
IHD(1·14)
IHD(1·14)War
(1033·96)IHD
(0·65)Diabetes
(3·31)IHD
(1·32)IHD
(1·24)War
(1932·51)Congenital
(1·09)IHD
(1·94)IHD
(1·01)War
(1966·75)Diabetes
(1·70)IHD
(1·31)Road injuries
(1·60)Road injuries
(1·48)Neck & back
(0·99)NN Preterm
(1·21)War
(8475·03)Diabetes
(1·32)Neck & back
(1·13)
IHD(1·61)
Neck & back(0·86)
IHD(1·85)
Diabetes(2·09)Stroke(1·67)
IHD(0·90)Stroke(1·81)War
(796·25)War
(796·25)LRI
(0·70)Diabetes
(1·10)Neck & back
(0·95)Congenital
(1·26)Road injuries
(1·69)IHD
(1·83)IHD
(0·69)Neck & back
(0·88)War
(5581·30)IHD
(0·92)IHD
(0·61)NN Preterm
(0·69)Other Cardio
(9·17)Neck & back
(0·94)IHD
(0·84)Congenital
(1·54)IHD
(1·32)Neck & back
(1·02)IHD
(0·53)
Stroke(1·46)
IHD(1·39)Stroke(1·71)Stroke(0·87)
Diabetes(3·69)Stroke(0·75)
Diabetes(2·60)
Congenital(1·18)
Congenital(1·18)
IHD(4·31)
NN Preterm(0·75)
IHD(0·83)Stroke(1·04)
Neck & back(1·03)
Congenital(1·22)
Neck & back(1·00)
Depression(1·18)
Diabetes(1·72)
Neck & back(1·04)
Neck & back(1·14)
Congenital(0·86)
Neck & back(0·95)
Diabetes(2·92)
Road injuries(1·23)
IHD(1·59)Stroke(0·88)
IHD(0·46)
Diabetes(0·97)
CKD(2·85)Skin
(1·34)COPD(3·50)Skin
(1·41)LRI
(0·46)LRI
(0·72)LRI
(0·88)NN Preterm
(0·78)NN Preterm
(0·78)Congenital
(1·56)Neck & back
(1·04)Depression
(1·11)LRI
(0·77)Stroke(0·76)
NN Preterm(0·70)
Diabetes(1·61)
Congenital(1·62)
Neck & back(0·83)
Congenital(1·09)
NN Preterm(0·57)
Neck & back(1·06)
Diabetes(2·26)
Depression(1·15)
Congenital(1·29)
LRI(0·52)
Neck & back(1·05)Stroke(0·59)
Congenital(0·97)
LRI(0·78)Stroke(1·62)
Diabetes(3·03)
Neck & back(0·90)
CKD(2·65)Skin
(1·44)NN Preterm
(0·56)Road injuries
(0·97)Road injuries
(0·97)Stroke(2·15)Stroke(0·69)
Skin(1·04)
Diabetes(1·18)
Diabetes(1·20)
Diabetes(1·78)
NN Preterm(0·70)
Road injuries(1·32)
Depression(1·02)
Road injuries(0·83)Stroke(0·49)
Depression(1·29)
IHD(0·79)
IHD(0·67)
Depression(1·11)
Road injuries(1·58)
Congenital(0·77)
Depression(1·00)Sense(0·85)
Skin(1·39)
Depression(0·82)
Asthma(3·13)CKD
(1·78)COPD(1·66)
Neck & back(0·92)COPD(1·53)
Neck & back(1·07)
Neck & back(1·07)
NN Preterm(0·77)
Road injuries(0·69)
Road injuries(0·57)
Neck & back(1·08)
Congenital(1·02)Stroke(1·14)
Road injuries(0·67)
Diabetes(2·18)Sense(0·90)Stroke(0·74)
Road injuries(0·62)
Road injuries(0·49)
Depression(1·07)
Migraine(1·12)Skin
(0·95)Diarrhoea
(0·52)Depression
(0·94)Sense(0·82)Stroke(0·40)
Neck & back(0·88)
Road injuries(1·04)
Road injuries(0·98)
LRI(0·54)
NN Preterm(0·34)
NN Preterm(0·53)Skin
(1·42)Stroke(0·84)Stroke(0·84)
Road injuries(2·38)
Congenital(0·93)
Other MSK(1·92)
Cirr HepC(7·30)
Depression(1·05)
NN Sepsis(2·44)
Depression(1·01)
Migraine(1·06)Stroke(0·44)
Diabetes(0·98)
Congenital(0·78)Stroke(0·70)
Congenital(0·71)Skin
(0·94)Migraine
(1·27)Stroke(1·05)
LRI(0·33)
Road injuries(0·60)
Depression(0·92)
NN Preterm(0·48)Sense(1·28)
Diarrhoea(0·43)Sense(0·92)Skin
(1·32)Sense(0·83)
Road injuries(0·63)
LRI(0·52)
LRI(0·52)
Other Unint(9·71)
Depression(0·95)Sense(1·02)Iron
(1·53)Sense(0·94)
Road injuries(0·68)
Skin(0·91)Skin
(0·88)Congenital
(1·00)NN Preterm
(0·61)Sense(0·79)
LRI(0·26)Sense(1·01)
Congenital(1·13)
Diabetes(1·15)
Neck & back(1·07)Sense(0·78)
Congenital(0·83)
NN Preterm(0·82)
Iron(1·23)
Self-harm(0·64)
Iron(1·06)
Congenital(0·45)
Road injuries(0·65)COPD(1·03)CKD
(1·70)Diabetes
(1·26)Diabetes
(1·26)Diarrhoea
(0·24)Sense(0·82)
Congenital(0·90)
NN Preterm(0·48)
Other Cardio(3·76)
Neck & back(1·08)
Iron(0·97)Sense(1·09)Skin
(0·93)Depression
(1·00)Depression
(0·88)Skin
(0·81)Migraine
(1·10)Sense(0·96)Sense(1·01)Iron
(0·81)Road injuries
(0·37)NN Preterm
(0·60)Lung C(1·18)
Road injuries(0·51)
Other MSK(1·60)
NN Preterm(0·38)
Iron(0·84)
Neck & back(0·95)
Asthma(1·67)
Neck & back(0·91)
Depression(0·93)
Depression(0·93)
Violence(4·00)
Skin(0·83)
Migraine(1·07)Sense(0·93)Drugs(4·09)
LRI(0·40)Sense(0·92)
Iron(1·18)Iron
(1·35)Other Trans
(10·71)LRI
(0·27)CKD
(1·22)Skin
(0·86)Anxiety(1·05)
NN Preterm(1·01)
Diabetes(1·26)Skin
(0·78)Lung C(1·21)
Road injuries(0·51)
1 2 3 4 5 6 7 8 9 10
Marshall Islands
Northern Mariana Islands
Papua New Guinea
Samoa
Solomon Islands
Tonga
Vanuatu
North Africa and Middle East
North Africa and Middle East
Afghanistan
Algeria
Bahrain
Egypt
Iran
Iraq
Jordan
Kuwait
Lebanon
Libya
Morocco
Palestine
Oman
Qatar
Saudi Arabia
Sudan
Syria
Tunisia
Turkey
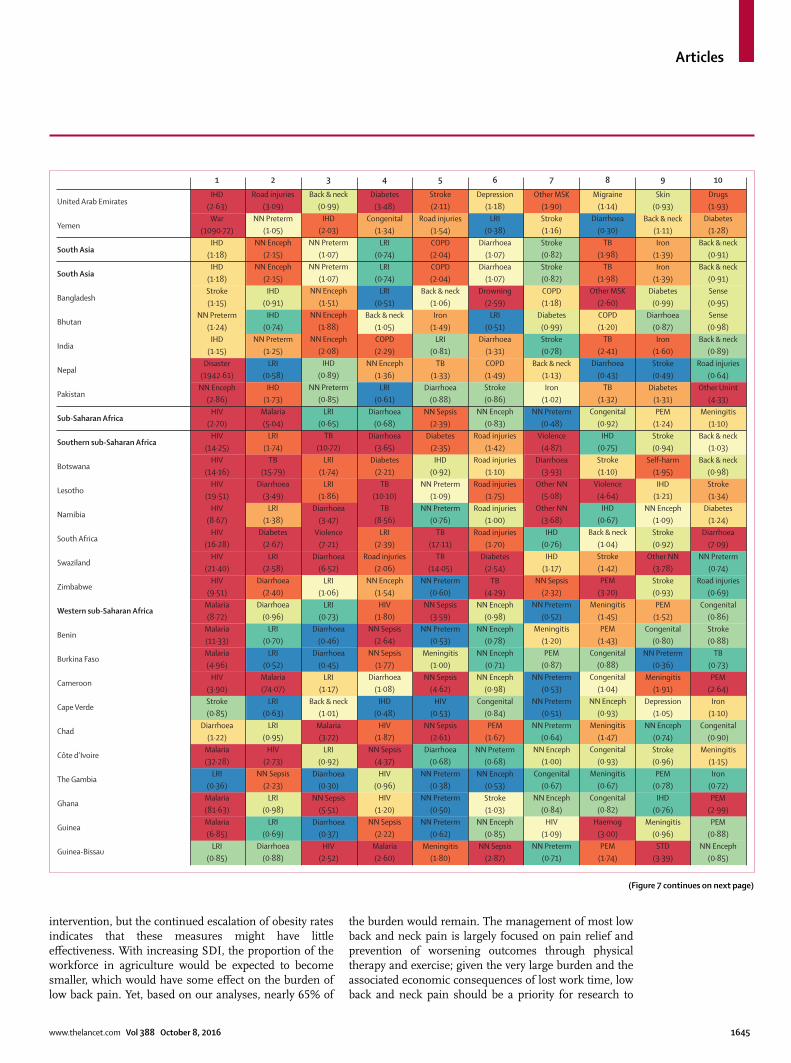
Articles
www.thelancet.com Vol 388 October 8, 2016 1645
intervention, but the continued escalation of obesity rates indicates that these measures might have little eff ectiveness. With increasing SDI, the proportion of the workforce in agriculture would be expected to become smaller, which would have some eff ect on the burden of low back pain. Yet, based on our analyses, nearly 65% of
the burden would remain. The management of most low back and neck pain is largely focused on pain relief and prevention of worsening outcomes through physical therapy and exercise; given the very large burden and the associated economic consequences of lost work time, low back and neck pain should be a priority for research to
(Figure 7 continues on next page)
IHD(2·63)
War(1090·72)
IHD(1·18)
IHD(1·18)Stroke(1·15)
NN Preterm(1·24)
IHD(1·15)
Disaster(1942·61)
NN Enceph(2·86)
HIV(2·70)
HIV(14·25)
HIV(14·16)
HIV(19·51)
HIV(8·67)
HIV(16·28)
HIV(21·40)
HIV(9·51)
Malaria(8·72)
Malaria(11·33)Malaria(4·96)
HIV(3·90)Stroke(0·85)
Diarrhoea(1·22)
Malaria(32·28)
LRI(0·36)
Malaria(81·63)Malaria(6·85)
LRI(0·85)
Road injuries(3·09)
NN Preterm(1·05)
NN Enceph(2·15)
NN Enceph(2·15)
IHD(0·91)
IHD(0·74)
NN Preterm(1·25)
LRI(0·58)
IHD(1·73)
Malaria(5·04)
LRI(1·74)
TB(15·79)
Diarrhoea(3·49)
LRI(1·38)
Diabetes(2·67)
LRI(2·58)
Diarrhoea(2·40)
Diarrhoea(0·96)
LRI(0·70)
LRI(0·52)
Malaria(74·07)
LRI(0·63)
LRI(0·95)
HIV(2·73)
NN Sepsis(2·23)
LRI(0·98)
LRI(0·69)
Diarrhoea(0·88)
Back & neck(0·99)
IHD(2·03)
NN Preterm(1·07)
NN Preterm(1·07)
NN Enceph(1·51)
NN Enceph(1·88)
NN Enceph(2·08)
IHD(0·89)
NN Preterm(0·85)
LRI(0·65)
TB(10·72)
LRI(1·74)
LRI(1·86)
Diarrhoea(3·47)
Violence(7·21)
Diarrhoea(6·52)
LRI(1·06)
LRI(0·73)
Diarrhoea(0·46)
Diarrhoea(0·45)
LRI(1·17)
Back & neck(1·01)
Malaria(3·72)
LRI(0·92)
Diarrhoea(0·30)
NN Sepsis(5·51)
Diarrhoea(0·37)
HIV(2·52)
Diabetes(3·48)
Congenital(1·34)
LRI(0·74)
LRI(0·74)
LRI(0·51)
Back & neck(1·05)COPD(2·29)
NN Enceph(1·36)
LRI(0·61)
Diarrhoea(0·68)
Diarrhoea(3·65)
Diabetes(2·21)
TB(10·10)
TB(8·56)
LRI(2·39)
Road injuries(2·06)
NN Enceph(1·54)
HIV(1·80)
NN Sepsis(2·64)
NN Sepsis(1·77)
Diarrhoea(1·08)
IHD(0·48)
HIV(1·87)
NN Sepsis(4·37)
HIV(0·96)
HIV(1·20)
NN Sepsis(2·22)
Malaria(2·60)
Stroke(2·11)
Road injuries(1·54)COPD(2·04)COPD(2·04)
Back & neck(1·06)
Iron(1·49)
LRI(0·81)
TB(1·33)
Diarrhoea(0·88)
NN Sepsis(2·39)
Diabetes(2·35)
IHD(0·92)
NN Preterm(1·09)
NN Preterm(0·76)
TB(17·11)
TB(14·05)
NN Preterm(0·60)
NN Sepsis(3·59)
NN Preterm(0·53)
Meningitis(1·00)
NN Sepsis(4·62)
HIV(0·53)
NN Sepsis(2·61)
Diarrhoea(0·68)
NN Preterm(0·38)
NN Preterm(0·50)
NN Preterm(0·62)
Meningitis(1·80)
Depression(1·18)
LRI(0·38)
Diarrhoea(1·07)
Diarrhoea(1·07)
Drowning(2·59)
LRI(0·51)
Diarrhoea(1·31)COPD(1·49)Stroke(0·86)
NN Enceph(0·83)
Road injuries(1·42)
Road injuries(1·10)
Road injuries(1·75)
Road injuries(1·00)
Road injuries(1·70)
Diabetes(2·54)
TB(4·29)
NN Enceph(0·98)
NN Enceph(0·78)
NN Enceph(0·71)
NN Enceph(0·98)
Congenital(0·84)PEM
(1·67)NN Preterm
(0·68)NN Enceph
(0·53)Stroke(1·03)
NN Enceph(0·85)
NN Sepsis(2·87)
Other MSK(1·90)Stroke(1·16)Stroke(0·82)Stroke(0·82)COPD(1·18)
Diabetes(0·99)Stroke(0·78)
Back & neck(1·13)Iron
(1·02)NN Preterm
(0·48)Violence
(4·87)Diarrhoea
(3·93)Other NN
(5·08)Other NN
(3·68)IHD
(0·76)IHD
(1·17)NN Sepsis
(2·32)NN Preterm
(0·52)Meningitis
(1·20)PEM
(0·87)NN Preterm
(0·53)NN Preterm
(0·51)NN Preterm
(0·64)NN Enceph
(1·00)Congenital
(0·67)NN Enceph
(0·84)HIV
(1·09)NN Preterm
(0·71)
Migraine(1·14)
Diarrhoea(0·30)
TB(1·98)
TB(1·98)
Other MSK(2·60)COPD(1·20)
TB(2·41)
Diarrhoea(0·43)
TB(1·32)
Congenital(0·92)
IHD(0·75)Stroke(1·10)
Violence(4·64)
IHD(0·67)
Back & neck(1·04)Stroke(1·42)PEM
(3·20)Meningitis
(1·45)PEM
(1·43)Congenital
(0·88)Congenital
(1·04)NN Enceph
(0·93)Meningitis
(1·47)Congenital
(0·93)Meningitis
(0·67)Congenital
(0·82)Haemog
(3·00)PEM
(1·74)
Skin(0·93)
Back & neck(1·11)Iron
(1·39)Iron
(1·39)Diabetes
(0·99)Diarrhoea
(0·87)Iron
(1·60)Stroke(0·49)
Diabetes(1·31)PEM
(1·24)Stroke(0·94)
Self-harm(1·95)
IHD(1·21)
NN Enceph(1·09)Stroke(0·92)
Other NN(3·78)Stroke(0·93)PEM
(1·52)Congenital
(0·80)NN Preterm
(0·36)Meningitis
(1·91)Depression
(1·05)NN Enceph
(0·74)Stroke(0·96)PEM
(0·78)IHD
(0·76)Meningitis
(0·96)STD
(3·39)
Drugs(1·93)
Diabetes(1·28)
Back & neck(0·91)
Back & neck(0·91)Sense(0·95)Sense(0·98)
Back & neck(0·89)
Road injuries(0·64)
Other Unint(4·33)
Meningitis(1·10)
Back & neck(1·03)
Back & neck(0·98)Stroke(1·34)
Diabetes(1·24)
Diarrhoea(7·09)
NN Preterm(0·74)
Road injuries(0·69)
Congenital(0·86)Stroke(0·88)
TB(0·73)PEM
(2·64)Iron
(1·10)Congenital
(0·90)Meningitis
(1·15)Iron
(0·72)PEM
(2·99)PEM
(0·88)NN Enceph
(0·85)
1 2 3 4 5 6 7 8 9 10
United Arab Emirates
Yemen
South Asia
South Asia
Bangladesh
Bhutan
India
Nepal
Pakistan
Sub-Saharan Africa
Southern sub-Saharan Africa
Botswana
Lesotho
Namibia
South Africa
Swaziland
Zimbabwe
Western sub-Saharan Africa
Benin
Burkina Faso
Cameroon
Cape Verde
Chad
Côte d’Ivoire
The Gambia
Ghana
Guinea
Guinea-Bissau
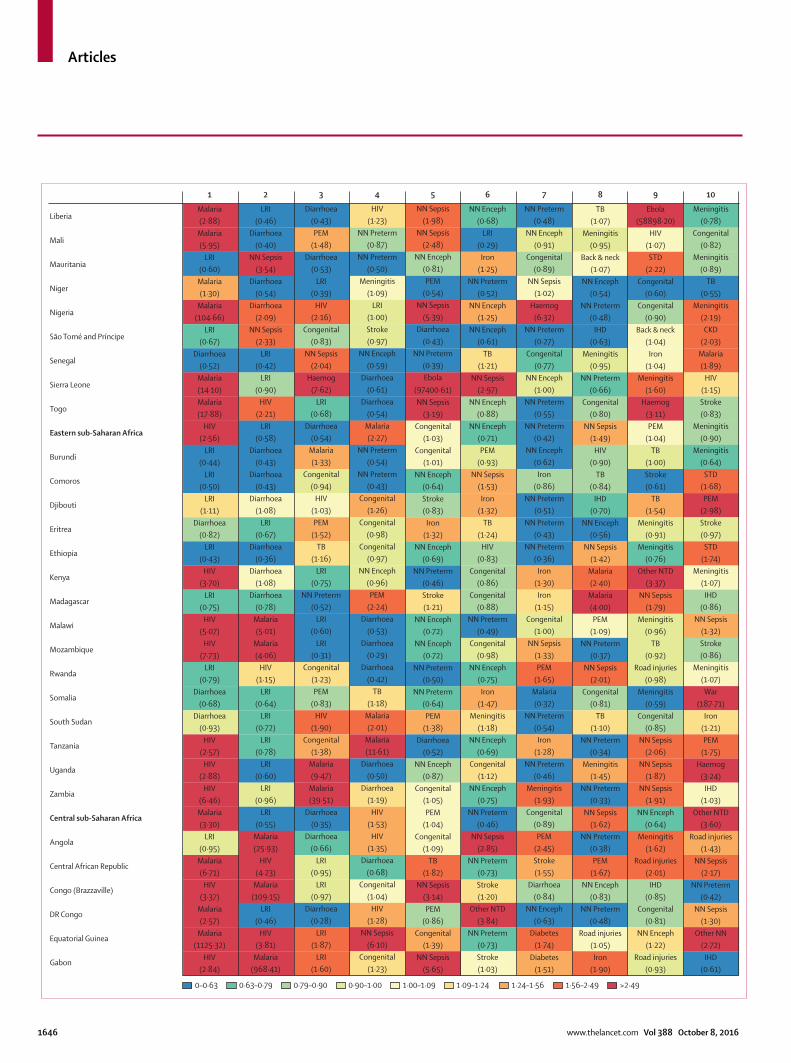
Articles
1646 www.thelancet.com Vol 388 October 8, 2016
Malaria(2·88)
Malaria(5·95)
LRI(0·60)
Malaria(1·30)
Malaria(104·66)
LRI(0·67)
Diarrhoea(0·52)
Malaria(14·10)Malaria(17·88)
HIV(2·56)
LRI(0·44)
LRI(0·50)
LRI(1·11)
Diarrhoea(0·82)
LRI(0·43)
HIV(3·70)
LRI(0·75)
HIV(5·07)
HIV(7·73)
LRI(0·79)
Diarrhoea(0·68)
Diarrhoea(0·93)
HIV(2·57)
HIV(2·88)
HIV(6·46)Malaria(3·30)
LRI(0·95)
Malaria(6·71)
HIV(3·37)
Malaria(2·57)
Malaria(1125·32)
HIV(2·84)
LRI(0·46)
Diarrhoea(0·40)
NN Sepsis(3·54)
Diarrhoea(0·54)
Diarrhoea(2·09)
NN Sepsis(2·33)
LRI(0·42)
LRI(0·90)
HIV(2·21)
LRI(0·58)
Diarrhoea(0·43)
Diarrhoea(0·43)
Diarrhoea(1·08)
LRI(0·67)
Diarrhoea(0·36)
Diarrhoea(1·08)
Diarrhoea(0·78)
Malaria(5·01)
Malaria(4·06)
HIV(1·15)
LRI(0·64)
LRI(0·72)
LRI(0·78)
LRI(0·60)
LRI(0·96)
LRI(0·55)
Malaria(25·93)
HIV(4·23)
Malaria(109·15)
LRI(0·46)
HIV(3·81)
Malaria(968·41)
Diarrhoea(0·43)PEM
(1·48)Diarrhoea
(0·53)LRI
(0·39)HIV
(2·16)Congenital
(0·83)NN Sepsis
(2·04)Haemog
(7·62)LRI
(0·68)Diarrhoea
(0·54)Malaria(1·33)
Congenital(0·94)
HIV(1·03)PEM
(1·52)TB
(1·16)LRI
(0·75)NN Preterm
(0·52)LRI
(0·60)LRI
(0·31)Congenital
(1·23)PEM
(0·83)HIV
(1·90)Congenital
(1·38)Malaria(9·47)
Malaria(39·51)
Diarrhoea(0·35)
Diarrhoea(0·66)
LRI(0·95)
LRI(0·97)
Diarrhoea(0·28)
LRI(1·87)
LRI(1·60)
HIV(1·23)
NN Preterm(0·87)
NN Preterm(0·50)
Meningitis(1·09)
LRI(1·00)Stroke(0·97)
NN Enceph(0·59)
Diarrhoea(0·61)
Diarrhoea(0·54)
Malaria(2·27)
NN Preterm(0·54)
NN Preterm(0·43)
Congenital(1·26)
Congenital(0·98)
Congenital(0·97)
NN Enceph(0·96)PEM
(2·24)Diarrhoea
(0·53)Diarrhoea
(0·29)Diarrhoea
(0·42)TB
(1·18)Malaria(2·01)
Malaria(11·61)
Diarrhoea(0·50)
Diarrhoea(1·19)
HIV(1·53)
HIV(1·35)
Diarrhoea(0·68)
Congenital(1·04)
HIV(1·28)
NN Sepsis(6·10)
Congenital(1·23)
NN Sepsis(1·98)
NN Sepsis(2·48)
NN Enceph(0·81)PEM
(0·54)NN Sepsis
(5·39)Diarrhoea
(0·43)NN Preterm
(0·39)Ebola
(97400·61)NN Sepsis
(3·19)Congenital
(1·03)Congenital
(1·01)NN Enceph
(0·64)Stroke(0·83)
Iron(1·32)
NN Enceph(0·69)
NN Preterm(0·46)Stroke(1·21)
NN Enceph(0·72)
NN Enceph(0·72)
NN Preterm(0·50)
NN Preterm(0·64)PEM
(1·38)Diarrhoea
(0·52)NN Enceph
(0·87)Congenital
(1·05)PEM
(1·04)Congenital
(1·09)TB
(1·82)NN Sepsis
(3·14)PEM
(0·86)Congenital
(1·39)NN Sepsis
(5·65)
NN Enceph(0·68)
LRI(0·29)
Iron(1·25)
NN Preterm(0·52)
NN Enceph(1·25)
NN Enceph(0·61)
TB(1·21)
NN Sepsis(2·97)
NN Enceph(0·88)
NN Enceph(0·71)PEM
(0·93)NN Sepsis
(1·53)Iron
(1·32)TB
(1·24)HIV
(0·83)Congenital
(0·86)Congenital
(0·88)NN Preterm
(0·49)Congenital
(0·98)NN Enceph
(0·75)Iron
(1·47)Meningitis
(1·18)NN Enceph
(0·69)Congenital
(1·12)NN Enceph
(0·75)NN Preterm
(0·46)NN Sepsis
(2·85)NN Preterm
(0·73)Stroke(1·20)
Other NTD(3·84)
NN Preterm(0·73)Stroke(1·03)
NN Preterm(0·48)
NN Enceph(0·91)
Congenital(0·89)
NN Sepsis(1·02)
Haemog(6·32)
NN Preterm(0·27)
Congenital(0·77)
NN Enceph(1·00)
NN Preterm(0·55)
NN Preterm(0·42)
NN Enceph(0·62)
Iron(0·86)
NN Preterm(0·51)
NN Preterm(0·43)
NN Preterm(0·36)
Iron(1·30)Iron
(1·15)Congenital
(1·00)NN Sepsis
(1·33)PEM
(1·65)Malaria(0·32)
NN Preterm(0·54)
Iron(1·28)
NN Preterm(0·46)
Meningitis(1·93)
Congenital(0·89)PEM
(2·45)Stroke(1·55)
Diarrhoea(0·84)
NN Enceph(0·63)
Diabetes(1·74)
Diabetes(1·51)
TB(1·07)
Meningitis(0·95)
Back & neck(1·07)
NN Enceph(0·54)
NN Preterm(0·48)
IHD(0·63)
Meningitis(0·95)
NN Preterm(0·66)
Congenital(0·80)
NN Sepsis(1·49)
HIV(0·90)
TB(0·84)
IHD(0·70)
NN Enceph(0·56)
NN Sepsis(1·42)
Malaria(2·40)
Malaria(4·00)PEM
(1·09)NN Preterm
(0·37)NN Sepsis
(2·01)Congenital
(0·81)TB
(1·10)NN Preterm
(0·34)Meningitis
(1·45)NN Preterm
(0·33)NN Sepsis
(1·62)NN Preterm
(0·38)PEM
(1·67)NN Enceph
(0·83)NN Preterm
(0·48)Road injuries
(1·05)Iron
(1·90)
Ebola(58898·20)
HIV(1·07)STD
(2·22)Congenital
(0·60)Congenital
(0·90)Back & neck
(1·04)Iron
(1·04)Meningitis
(1·60)Haemog
(3·11)PEM
(1·04)TB
(1·00)Stroke(0·61)
TB(1·54)
Meningitis(0·91)
Meningitis(0·76)
Other NTD(3·37)
NN Sepsis(1·79)
Meningitis(0·96)
TB(0·92)
Road injuries(0·98)
Meningitis(0·59)
Congenital(0·85)
NN Sepsis(2·06)
NN Sepsis(1·87)
NN Sepsis(1·91)
NN Enceph(0·64)
Meningitis(1·62)
Road injuries(2·01)
IHD(0·85)
Congenital(0·81)
NN Enceph(1·22)
Road injuries(0·93)
Meningitis(0·78)
Congenital(0·82)
Meningitis(0·89)
TB(0·55)
Meningitis(2·19)CKD
(2·03)Malaria(1·89)
HIV(1·15)Stroke(0·83)
Meningitis(0·90)
Meningitis(0·64)
STD(1·68)PEM
(2·98)Stroke(0·97)
STD(1·74)
Meningitis(1·07)
IHD(0·86)
NN Sepsis(1·32)Stroke(0·86)
Meningitis(1·07)War
(187·71)Iron
(1·21)PEM
(1·75)Haemog
(3·24)IHD
(1·03)Other NTD
(3·60)Road injuries
(1·43)NN Sepsis
(2·17)NN Preterm
(0·42)NN Sepsis
(1·30)Other NN
(2·72)IHD
(0·61)
1 2 3 4 5 6 7 8 9 10
Liberia
Mali
Mauritania
Niger
Nigeria
São Tomé and Príncipe
Senegal
Sierra Leone
Togo
Eastern sub-Saharan Africa
Burundi
Comoros
Djibouti
Eritrea
Ethiopia
Kenya
Madagascar
Malawi
Mozambique
Rwanda
Somalia
South Sudan
Tanzania
Uganda
Zambia
Central sub-Saharan Africa
Angola
Central African Republic
Congo (Brazzaville)
DR Congo
Equatorial Guinea
Gabon
0–0·63 0·63–0·79 0·79–0·90 0·90–1·00 1·00–1·09 1·09–1·24 1·24–1·56 1·56–2·49 >2·49
Articles
www.thelancet.com Vol 388 October 8, 2016 1647
identify more eff ective preventive and therapy measures.52 Similarly, despite broad decreases in age-standardised rates of injury burden, the pace of progress for these causes has been comparatively slow and ultimately has led to minimal changes in the proportion of overall burden due to injuries during the past 25 years. Prevention of injuries requires strong public safety policies,53 but minimising mortality and long-term disability from injuries hinges upon having comprehensive trauma care systems54,55 that provide timely, evidence-based care,56–58 including emergency surgical services.59,60
In 2015, sense organ disorders were the second-leading cause of YLDs and resulted in more than 68 million DALYs. Reducing DALYs from vision impairment is achievable through vertically integrated programmes, including the delivery of eyeglasses for refractive error, curative surgery for cataracts, and onchocerciasis and trachoma prevention. Given the availability of cost-eff ective interventions, greater policy attention is needed for vision loss burden. Although interventions for hearing loss are less clear, the use of timely antibiotics for otitis media and meningitis and the provision of hearing aids for conductive hearing loss are likely to reduce its burden.
Reductions in age-standardised DALY rates due to some NCDs such as cardiovascular diseases, most cancers, chronic respiratory diseases, and many digestive diseases—some of which can be attributed to reductions in risk factors such as tobacco and improvements in cause-specifi c treatment and event survival—mask the eff ects of population ageing. This means more people had disease burden from these causes and total DALYs have remained largely unchanged (eg, chronic obstructive pulmonary disease) or signifi cantly increased (eg, cardiovascular diseases, cancers, neurological disorders, diabetes, chronic kidney disease, and musculoskeletal disorders such as osteoarthritis and low back and neck pain) over time. As demographic transitions are widely expected to continue, the burden from NCDs is likely to continue expanding. Widespread eff orts must continue to enact societal and environmental policies to reduce risk factor exposure, while national and local health systems must adapt to meet the prevention, screening, and treatment needs of their populations. As we now recognise many of the risk factors related to NCDs, low-SDI and middle-SDI countries could adopt policies to circumvent the mistakes made by other countries as they progressed along the SDI spectrum.
Mental and substance use disorders are a particularly challenging group of conditions with non-trivial levels of disease burden in all geographies. Some countries provide excellent mental health resources, whereas others, particularly LMICs, do not have screening or treatment programmes. Addressing the growing burden and disparity in mental health disorders will be an especially pressing challenge during the SDG era.
A number of emerging and growing health threats also deserve special attention in policy planning, including infectious diseases such as outbreaks of dengue fever, Ebola virus disease, Zika virus, and pandemic infl uenza, and antimicrobial-resistant pathogens, which represent acute threats to life and highlight health-system defi ciencies where they occur; substance abuse disorders, particularly of opioids and cocaine, in eastern Europe, Australia, and North America; and intentional fi rearm injuries, especially in Latin America, the USA, and South Africa. In the case of dengue fever and potentially other yet to be identifi ed infectious diseases, urbanisation and global environmental change have contributed to an increased incidence and future climate change scenarios depict a rising trend in the coming years.61 Other emerging infectious diseases, including Zika and chikungunya viruses, have yet to be comprehensively analysed by the GBD.
A major change in the GBD 2015 assessment has been the closer integration of the assessments of mortality and disease sequelae prevalence in modelling. For cancers, HIV/AIDS, and injuries, previous iterations of the GBD modelled mortality, incidence, and prevalence in a coherent manner. For some other diseases, the modelling of disease prevalence and cause-specifi c mortality rates largely used diff erent data sources and modelling techniques. Independent estimation of prevalence and mortality led in some cases to patterns across locations of excess mortality rates that were not consistent with expected relationships related to health-system access. For GBD 2015, we built the modelling of cause-specifi c mortality, excess mortality, incidence, and prevalence into nearly every cause. The eff ect of this approach has led to increases in the number of DALYs from injuries due to YLDs and changes in prevalence for other conditions, particularly those with minimal data for prevalence or incidence. More attention will be paid in future iterations of the GBD study to identifying unpublished data from cohort studies or linkage studies
Figure 7: Leading ten causes of DALYs with the ratio of observed DALYs to DALYs expected on the basis of SDI in 2015, by locationThe ratio of observed DALYs to DALYs expected based on SDI is provided in brackets for each cause and cells are colour coded by ratio ranges (calculated to place a roughly equal number of cells into each bin). Shades of blue represent much lower observed DALYs than expected levels based on SDI, whereas red shows observed DALYs that exceed expected levels. IHD=ischaemic heart disease. Back & neck=low back and neck pain. Diabetes=diabetes mellitus. Stroke=Cerebrovascular disease. Lung C=lung, bronchus, and trachea cancers. Sense=sense organ diseases. Depression=depressive disorders. Alzheimer’s=Alzheimer’s disease and other dementias. Oth MSK=other musculoskeletal disorders. COPD=chronic obstructive pulmonary disease. NN Preterm=neonatal preterm birth complications. Diarrhoea=diarrhoeal diseases. Skin=skin and subcutaneous diseases. NN Enceph=neonatal encephalopathy due to birth asphyxia and trauma. Drugs=drug use disorders. Congenital=congenital anomalies. Liver C=liver cancer. Stomach C=stomach cancer. CKD=chronic kidney disease. Anxiety=anxiety disorders. Iron=iron-defi ciency anaemia. HIV=HIV/AIDS. Colorect C=colon and rectum cancer. LRI=lower respiratory infections. Cirr HepC=cirrhosis due to hepatitis C. CMP=cardiomyopathy and myocarditis. Cirr alc=cirrhosis due to alcohol use. Other Cardio=other cardiovascular and circulatory diseases. Alcohol=alcohol use disorders. Violence=interpersonal violence. HTN HD=hypertensive heart disease. Haemog=haemoglobinopathies and haemolytic anaemias. TB=tuberculosis. Prostate C=prostate cancer. War=collective violence and legal intervention. Other Unint= other unintentional injuries. Oth trans=other transport injuries. Other NN=Other neonatal disorders. NN Sepsis=neonatal sepsis and other neonatal infections. PEM=protein-energy malnutrition. STD=sexually transmitted diseases excluding HIV. Ebola=Ebola virus disease. Other NTD=other neglected tropical diseases. GBD=Global Burden of Disease. SDI=Socio-demographic Index. DALYs=disability-adjusted life-years.
Articles
1648 www.thelancet.com Vol 388 October 8, 2016
on levels of excess mortality by age and sex, especially in LMICs, to further strengthen modelling eff orts.
A major development for the GBD 2015 has been adaptation of the GATHER guidelines endorsed by WHO, the Institute for Health Metrics and Evaluation (IHME), and other organisations.22,23 GATHER compliance, including the sharing of statistical code for each of the many analytical steps in the GBD, provides a new level of transparency for the overall enterprise. We expect that many researchers will want to investigate, propose improvements, and provide alternative assessments for many components of the GBD. We welcome the debate that will follow on the best way to analyse diff erent components of the GBD. We believe enhanced transparency will lead to healthy debate and exchange and to improved methods, data, and results for many aspects of the GBD. Transparency will not necessarily lead to consensus but it will broaden everyone’s understanding of the available evidence on descriptive epidemiology. Adoption by the GBD of the GATHER guidelines will hopefully stimulate other organisations to adopt the guidelines in all aspects of their work as well.
Although the volume of input data to the GBD has continued to increase substantially, major data gaps remain.12,20,62,63 Geographical and temporal coverage of all-cause and cause-specifi c mortality datasets are variable, as is the quality of the data contained in such systems. Development of methods to report overall evidence grades for each outcome–location–year combination would be valuable to help to guide strategies for improving data quality and closing data gaps. Investing to develop and improve cause of death and vital registration systems is crucial to improve the quality of insights from the GBD; incorporation of existing data from existing and new collaborators that are not currently in the GBD is another important aspect of this eff ort. Several countries have experienced signifi cant recent turmoil, especially armed confl ict in Syria, Yemen, and other countries in north Africa and the Middle East. Burden from many conditions is believed to have increased during and following those events, but due to disruption of data-collection systems, the full eff ect of such events has been diffi cult to quantify. For non-fatal health outcomes, some of the most notable data gaps pertain to aspects of individual diseases and injuries that are not typically included as part of standard epidemiological reports such as distribution of symptoms for those with chronic conditions at various stages of illness, duration of disability following acute events, or long-term disability after major acute injuries. Therefore, our recommendations regarding data gaps pertaining to non-fatal health loss are twofold. First, reports and scientifi c journals should strive to include reporting on functional health status including severity, distribution, and duration of symptoms with all epidemiological studies. Second, countries should work to centralise and compile existing non-fatal health data and invest to collect population-level epidemiological data on important causes of YLDs.
The iterative and now annual cycle of the GBD revisions provide opportunities to improve the estimation or scope of the GBD. Due to the high interest in Zika virus, we believe that we should try to quantify the burden related to Zika virus disease in the GBD 2016 analysis. Given the focus in the SDGs on various forms of sexual violence, we believe careful investigation of the evidence base for estimation is warranted. As noted in the GBD papers on mortality and non-fatal outcomes,12,20 there are also a number of opportunities to improve data processing and estimation methods that will be explored for the next cycle of estimation. We also expect to include more subnational analyses, particularly for large countries.
Our analysis has several limitations. First and foremost, the calculation of DALYs and HALE refl ects the limitations of all the underlying analyses of the GBD, including all-cause mortality, cause-specifi c mortality, prevalence, incidence, disability-weight derivation, and simulation of comorbidity. Second, as discussed above, data limitations are apparent in a number of facets of our analysis. Third, inherent to the GBD approach is the eff ort to quantify specifi c sequelae of each disease and injury. This means that the full disease burden of certain conditions such as heart failure, anaemia, vision and hearing loss, infertility, epilepsy, and intellectual disability are not as readily apparent in high-level review of the GBD results. However, the YLDs for these impairments are reported elsewhere.20 Fourth, our analysis of the relationship between SDI, DALYs, and HALE refl ects the average historical relationship between SDI and each measure, so despite often strong correlation with SDI it cannot be interpreted as being causal in nature. In some cases, association of SDI with health indicators could be considered a confounder when the same elements (education, income, and fertility) are used to develop both the index and as a covariate in cause-specifi c models. SDI utility might be improved in the future through consideration of additional societal elements such as inequality in each component. Other measures that capture the status of women in society, such as the female labour-force participation, could be considered in future revisions. Fifth, we have assumed independence of uncertainty between YLLs and YLDs as well as between YLDs and life expectancy. Empirical evidence to guide alternative assumptions, however, is currently very limited. Sixth, recent events in Syria and Libya and the resulting mass migration have led to considerable health loss, including drownings of many migrants. New migrants have diff erent health problems than the populations of the countries to which they have moved. Both the drownings and the change in health status in countries receiving migrants are not adequately captured in this assessment due to the time-lags in data collection and data capture intrinsic in all health data systems. Seventh, estimates of expected burden from SDI alone are based on the average levels of burden at each level of SDI. For endemic diseases, comparisons of observed rates to expected rates will lead to high observed over expected ratios in endemic countries
Articles
www.thelancet.com Vol 388 October 8, 2016 1649
and low ratios in non-endemic countries. Interpretation of the ratios for conditions that are endemic in only some countries needs to take this into account.
WHO has estimated DALYs by cause for the single years of 2000 and 2012.13,17 They used published GBD 2010 results used to generate WHO 2012 DALYs for 132 causes with some modifi cations. First, WHO life tables were used instead of GBD life tables.14 WHO life tables are diff erent from the UN Population Division life tables and use a set of methods developed by Murray and colleagues in the late 1990s;11,64 this approach does not benefi t from the many improvements in data processing and estimation methods that have emerged in the last 15 years.12,65,66 Second, WHO altered the empirical disability weights, which were derived from an international sample of more than 60 000 respondents from the GBD analysis26 for 32 out -comes using the opinions of 45 respondents.13,67 Third, WHO calculated YLLs after changing from the GBD 2010 normative standard life expectancy of 86·0 years to 91·9 years.68 Fourth, rather than using GBD results, WHO elected to use alternative estimates for 12 causes of death, including tuberculosis, HIV/AIDS and other sexually transmitted infections, malaria, whooping cough, measles, schistosomiasis, maternal disorders, cancers, alcohol and drug use disorders, epilepsy, confl ict and natural disasters, and road traffi c accidents.13 Finally, WHO substituted prevalence estimates produced internally for vision loss, hearing loss, intellectual disability, infertility, anaemia, back pain, alcohol use disorders, headache, and skin diseases. The fi nal hybrid estimates of DALYs do not provide uncertainty measures and have not been peer-reviewed.
WHO has also produced HALE estimates for three time periods, 2000, 2012, and 2015, using GBD 2010 results as described above for 2000 and 2012, and GBD 2013 results for 2015, also without uncertainty measures.14 Diff erences between their estimates and those for HALE from GBD 2015 refl ect changes in age-specifi c YLDs per capita from GBD 2013 to GBD 2015 and diff erences in WHO life expectancy (appendix p 85). The EC and the OECD also report healthy life expectancy estimates based on self-reported health status from 2004 through 2014, but without specifi c consideration of prevalence or incidence of disease.52,53 Comparison of 2014 estimates from the EC and GBD mostly show lower estimates from EC (appendix pp 86–87). EC estimates also report much wider ranges in HALE across countries in Europe than those estimated through GBD. Further, in a number of countries, EC estimates point to lower HALE among women than for men. These diff erences, both in terms of absolute estimates and those by sex, are probably due to the inclusion of non-health factors in self-reported assessments of disability.
In conclusion, HALE has increased steadily throughout the world over the MDG era, with a concomitant decrease in age-standardised DALY rates from most conditions. Declines occurred in overall health loss due to many communicable, maternal, neonatal, and nutritional
diseases. Much of the evolution of health is consistent with the expected changes in disease burden with development that have been quantifi ed in this study. Substantial variation in burden compared with levels expected on the basis of SDI suggests wide heterogeneity in the ability of governments and health systems to adequately meet the health needs of their populations. Progress in reducing these gaps will be crucial to achieving the ambitious SDG agenda. Demographic changes leading to increased population size and older average age have off set otherwise important gains in age-specifi c DALY rates leading to rising burden on health systems for many ailments of ageing. Emerging health threats and causes with lagging progress should be viewed as essential foci for investment in health infrastructure and health data systems to improve the global community’s insights into the aggregate quality of care and the overall health of populations.GBD 2015 DALYs and HALE CollaboratorsNicholas J Kassebaum, Megha Arora, Ryan M Barber, Zulfi qar A Bhutta, Jonathan Brown, Austin Carter, Daniel C Casey, Fiona J Charlson, Matthew M Coates, Megan Coggeshall, Leslie Cornaby, Lalit Dandona, Daniel J Dicker, Holly E Erskine, Alize J Ferrari, Christina Fitzmaurice, Kyle Foreman, Mohammad H Forouzanfar, Nancy Fullman, Peter W Gething, Ellen M Goldberg, Nicholas Graetz, Juanita A Haagsma, Simon I Hay, Catherine O Johnson, Laura Kemmer, Ibrahim A Khalil, Yohannes Kinfu, Michael J Kutz, Hmwe H Kyu, Janni Leung, Xiaofeng Liang, Stephen S Lim, Rafael Lozano, George A Mensah, Joe Mikesell, Ali H Mokdad, Meghan D Mooney, Mohsen Naghavi, Grant Nguyen, Elaine Nsoesie, David M Pigott, Christine Pinho, Zane Rankin, Nikolas Reinig, Joshua A Salomon, Logan Sandar, Alison Smith, Reed J D Sorensen, Jeff rey Stanaway, Caitlyn Steiner, Stephanie Teeple, Chris Troeger, Thomas Truelsen, Amelia VanderZanden, Joseph A Wagner, Valentine Wanga, Harvey A Whiteford, Maigeng Zhou, Leo Zoeckler, Amanuel Alemu Abajobir*, Kalkidan Hassen Abate*, Cristiana Abbafati*, Kaja M Abbas*, Foad Abd-Allah*, Biju Abraham*, Ibrahim Abubakar*, Laith J Abu-Raddad*, Niveen M E Abu-Rmeileh*, Tom Achoki*, Ilana N Ackerman*, Akindele Olupelumi Adebiyi*, Isaac Akinkunmi Adedeji*, José C Adsuar*, Kossivi Agbelenko Afanvi*, Ashkan Afshin*, Emilie Elisabet Agardh*, Arnav Agarwal*, Sanjay Kumar Agarwal*, Muktar Beshir Ahmed*, Aliasghar Ahmad Kiadaliri*, Hamid Ahmadieh*, Nadia Akseer*, Ziyad Al-Aly*, Khurshid Alam*, Noore K M Alam*, Saleh Fahed Aldhahri*, Miguel Angel Alegretti*, Alicia V Aleman*, Zewdie Aderaw Alemu*, Lily T Alexander*, Raghib Ali*, Ala’a Alkerwi*, François Alla*, Peter Allebeck*, Christine Allen*, Ubai Alsharif*, Khalid A Altirkawi*, Elena Alvarez Martin*, Nelson Alvis-Guzman*, Azmeraw T Amare*, Alemayehu Amberbir*, Adeladza Kofi Amegah*, Heresh Amini*, Walid Ammar*, Stephen Marc Amrock*, Gregory M Anderson*, Benjamin O Anderson*, Carl Abelardo T Antonio*, Palwasha Anwari*, Johan Ärnlöv*, Valentina S Arsic Arsenijevic*, Al Artaman*, Hamid Asayesh*, Rana Jawad Asghar*, Euripide Frinel G Arthur Avokpaho*, Ashish Awasthi*, Beatriz Paulina Ayala Quintanilla*, Peter Azzopardi*, Umar Bacha*, Alaa Badawi*, Kalpana Balakrishnan*, Amitava Banerjee*, Aleksandra Barac*, Suzanne L Barker-Collo*, Till Bärnighausen*, Lars Barregard*, Lope H Barrero*, Sanjay Basu*, Tigist Assefa Bayou*, Justin Beardsley*, Neeraj Bedi*, Ettore Beghi*, Brent Bell*, Michelle L Bell*, Corina Benjet*, Derrick A Bennett*, Isabela M Bensenor*, Adugnaw Berhane*, Eduardo Bernabé*, Balem Demtsu Betsu*, Addisu Shunu Beyene*, Neeraj Bhala*, Anil Bhansali*, Samir Bhatt*, Sibhatu Biadgilign*, Kelly Bienhoff *, Boris Bikbov*, Aref A Bin Abdulhak*, Stan Biryukov*,Donal Bisanzio*, Espen Bjertness*, Jed D Blore*, Rohan Borschmann*, Soufi ane Boufous*, Rupert R A Bourne*, Michael Brainin*, Alexandra Brazinova*, Nicholas J K Breitborde*, Traolach S Brugha*,
Articles
1650 www.thelancet.com Vol 388 October 8, 2016
Rachelle Buchbinder*, Geoff rey Colin Buckle*, Zahid A Butt*, Bianca Calabria*, Ismael Ricardo Campos-Nonato*, Julio Cesar Campuzano*, Hélène Carabin*, Jonathan R Carapetis*, Rosario Cárdenas*, Juan Jesus Carrero*, Carlos A Castañeda-Orjuela*, Jacqueline Castillo Rivas*, Ferrán Catalá-López*, Fiorella Cavalleri*, Jung-Chen Chang*, Peggy Pei-Chia Chiang*, Mirriam Chibalabala*, Chioma Ezinne Chibueze*, Vesper Hichilombwe Chisumpa*, Jee-Young Jasmine Choi*, Lincoln Choudhury*, Hanne Christensen*, Liliana G Ciobanu*, Valentina Colistro*, Mercedes Colomar*, Samantha M Colquhoun*, Monica Cortinovis*, John A Crump*, Albertino Damasceno*, Rakhi Dandona*, Paul I Dargan*, José das Neves*, Gail Davey*, Adrian C Davis*, Diego De Leo*, Louisa Degenhardt*, Liana C Del Gobbo*, Sarah Derrett*, Don C Des Jarlais*, Gabrielle A deVeber*, Samath D Dharmaratne*, Preet K Dhillon*, Eric L Ding*, Kerrie E Doyle*, Tim R Driscoll*, Leilei Duan*, Manisha Dubey*, Bruce Bartholow Duncan*, Hedyeh Ebrahimi*, Richard G Ellenbogen*, Iqbal Elyazar*, Aman Yesuf Endries*, Sergey Petrovich Ermakov*, Babak Eshrati*, Alireza Esteghamati*, Kara Estep*, Saman Fahimi*, Talha A Farid*, Carla Sofi a e Sa Farinha*, André Faro*, Maryam S Farvid*, Farshad Farzadfar*, Valery L Feigin*, Seyed-Mohammad Fereshtehnejad*, Jeff erson G Fernandes*, Joao C Fernandes*, Florian Fischer*, Joseph R A Fitchett*, Nataliya Foigt*, F Gerry R Fowkes*, Richard C Franklin*, Joseph Friedman*, Joseph Frostad*, Thomas Fürst*, Neal D Futran*, Belinda Gabbe*, Fortuné Gbètoho Gankpé*, Alberto L Garcia-Basteiro*, Tsegaye Tewelde Gebrehiwot*, Amanuel Tesfay Gebremedhin*, Johanna M Geleijnse*, Katherine B Gibney*, Richard F Gillum*, Ibrahim Abdelmageem Mohamed Ginawi*, Ababi Zergaw Giref*, Maurice Giroud*, Melkamu Dedefo Gishu*, Giorgia Giussani*,William W Godwin*, Hector Gomez-Dantes*, Philimon Gona*, Amador Goodridge*, Sameer Vali Gopalani*, Carolyn C Gotay*, Atsushi Goto*, Hebe N Gouda*, Harish Gugnani*, Yuming Guo*, Rahul Gupta*, Rajeev Gupta*, Vipin Gupta*, Reyna A Gutiérrez*, Nima Hafezi-Nejad*, Demewoz Haile*, Alemayehu Desalegne Hailu*, Gessessew Bugssa Hailu*, Yara A Halasa*, Randah Ribhi Hamadeh*, Samer Hamidi*, Mouhanad Hammami*, Alexis J Handal*, Graeme J Hankey*, Hilda L Harb*, Sivadasanpillai Harikrishnan*, Josep Maria Haro*, Mohammad Sadegh Hassanvand*, Tahir Ahmed Hassen*, Rasmus Havmoeller*, Roderick J Hay*, Mohammad T Hedayati*, Ileana Beatriz Heredia-Pi*, Pouria Heydarpour*, Hans W Hoek*, Daniel J Hoff man*, Masako Horino*, Nobuyuki Horita*, H Dean Hosgood*, Damian G Hoy*, Mohamed Hsairi*, Hsiang Huang*, John J Huang*, Kim Moesgaard Iburg*, Bulat T Idrisov*, Kaire Innos*, Manami Inoue*, Kathryn H Jacobsen*, Alejandra Jauregui*, Achala Upendra Jayatilleke*, Panniyammakal Jeemon*, Vivekanand Jha*, Guohong Jiang*, Ying Jiang*, Tariku Jibat*, Aida Jimenez-Corona*, Ye Jin*, Jost B Jonas*, Zubair Kabir*, Dan K Kajungu*, Yogeshwar Kalkonde*, Ritul Kamal*, Haidong Kan*, Amit Kandel*, André Karch*, Corine Kakizi Karema*, Chante Karimkhani*, Amir Kasaeian*, Marzieh Katibeh*, Anil Kaul*, Norito Kawakami*, Dhruv S Kazi*, Peter Njenga Keiyoro*, Andrew Haddon Kemp*, Andre Pascal Kengne*, Andre Keren*, Chandrasekharan Nair Kesavachandran*, Yousef Saleh Khader*, Abdur Rahman Khan*, Ejaz Ahmad Khan*, Young-Ho Khang*, Tawfi k Ahmed Muthafer Khoja*, Jagdish Khubchandani*, Christian Kieling*, Cho-il Kim*, Daniel Kim*, Yun Jin Kim*, Niranjan Kissoon*, Miia Kivipelto*, Luke D Knibbs*, Ann Kristin Knudsen*, Yoshihiro Kokubo*, Dhaval Kolte*, Jacek A Kopec*, Parvaiz A Koul*, Ai Koyanagi*, Barthelemy Kuate Defo*, Ricardo S Kuchenbecker*, Burcu Kucuk Bicer*, Ernst J Kuipers*, G Anil Kumar*, Gene F Kwan*, Ratilal Lalloo*, Tea Lallukka*, Anders Larsson*, Asma Abdul Latif*, Pablo M Lavados*, Alicia Elena Beatriz Lawrynowicz*, Janet L Leasher*, James Leigh*, Ricky Leung*, Yichong Li*, Yongmei Li*, Steven E Lipshultz*, Patrick Y Liu*, Yang Liu*, Belinda K Lloyd*, Giancarlo Logroscino*, Katharine J Looker*, Paulo A Lotufo*, Robyn M Lucas*, Raimundas Lunevicius*, Ronan A Lyons*, Hassan Magdy Abd El Razek*, Mahdi Mahdavi*, Marek Majdan*, Azeem Majeed*, Reza Malekzadeh*, Deborah Carvalho Malta*,
Wagner Marcenes*, Jose Martinez-Raga*, Felix Masiye*, Amanda J Mason-Jones*, Richard Matzopoulos*, Bongani M Mayosi*, John J McGrath*, Martin McKee*, Peter A Meaney*, Alem Mehari*, Yohannes Adama Melaku*, Peter Memiah*, Ziad A Memish*, Walter Mendoza*, Atte Meretoja*, Tuomo J Meretoja*, Yonatan Moges Mesfi n*, Francis Apolinary Mhimbira*, Anoushka Millear*, Ted R Miller*, Edward J Mills*, Mojde Mirarefi n*, Erkin M Mirrakhimov*, Philip B Mitchell*, Charles N Mock*, Karzan Abdulmuhsin Mohammad*, Alireza Mohammadi*, Shafi u Mohammed*, Lorenzo Monasta*, Julio Cesar Montañez Hernandez*, Marcella Montico*, Maziar Moradi-Lakeh*, Rintaro Mori*, Ulrich O Mueller*, John Everett Mumford*, Michele E Murdoch*, Gudlavalleti Venkata Satyanarayana Murthy*, Jean B Nachega*, Aliya Naheed*, Luigi Naldi*, Vinay Nangia*, John N Newton*, Marie Ng*, Frida Namnyak Ngalesoni*, Quyen Le Nguyen*, Muhammad Imran Nisar*, Patrick Martial Nkamedjie Pete*, Joan M Nolla*, Ole F Norheim*, Rosana E Norman*, Bo Norrving*, Carla Makhlouf Obermeyer*, Felix Akpojene Ogbo*, In-Hwan Oh*, Olanrewaju Oladimeji*, Pedro R Olivares*, Bolajoko Olubukunola Olusanya*, Jacob Olusegun Olusanya*, Eyal Oren*, Alberto Ortiz*, Erika Ota*, Abayomi Samuel Oyekale*, Mahesh PA*, Eun-Kee Park*, Mahboubeh Parsaeian*, Scott B Patten*, George C Patton*, João Mário Pedro*, David M Pereira*, Norberto Perico*, Konrad Pesudovs*, Max Petzold*, Michael Robert Phillips*, Frédéric B Piel*, Julian David Pillay*, Farhad Pishgar*, Dietrich Plass*, Suzanne Polinder*, Svetlana Popova*, Richie G Poulton*, Farshad Pourmalek*, Noela M Prasad*, Mostafa Qorbani*, Rynaz H S Rabiee*, Amir Radfar*, Anwar Rafay*, Kazem Rahimi*, Vafa Rahimi-Movaghar*, Mahfuzar Rahman*, Mohammad Hifz Ur Rahman*, Sajjad Ur Rahman*, Dheeraj Rai*, Rajesh Kumar Rai*, Sasa Rajsic*, Murugesan Raju*, Usha Ram*, Kavitha Ranganathan*, Amany H Refaat*, Marissa B Reitsma*, Giuseppe Remuzzi*, Serge Resnikoff *, Alex Reynolds*, Antonio L Ribeiro*, Stefano Ricci*, Hirbo Shore Roba*, David Rojas-Rueda*, Luca Ronfani*, Gholamreza Roshandel*, Gregory A Roth*, Ambuj Roy*, Ben Benasco Sackey*, Rajesh Sagar*, Juan R Sanabria*, Maria Dolores Sanchez-Niño*, Itamar S Santos*, João Vasco Santos*, Rodrigo Sarmiento-Suarez*, Benn Sartorius*, Maheswar Satpathy*, Miloje Savic*, Monika Sawhney*, Maria Inês Schmidt*, Ione J C Schneider*, Aletta E Schutte*, David C Schwebel*, Soraya Seedat*, Sadaf G Sepanlou*, Edson E Servan-Mori*, Saeid Shahraz*, Masood Ali Shaikh*, Rajesh Sharma*, Jun She*, Sara Sheikhbahaei*, Jiabin Shen*, Kevin N Sheth*, Kenji Shibuya*, Mika Shigematsu*, Min-Jeong Shin*, Rahman Shiri*, Inga Dora Sigfusdottir*, Diego Augusto Santos Silva*, Jonathan I Silverberg*, Edgar P Simard*, Abhishek Singh*, Jasvinder A Singh*, Prashant Kumar Singh*, Vegard Skirbekk*, Jens Christoff er Skogen*, Michael Soljak*, Kjetil Søreide*, Reed J D Sorensen*, Chandrashekhar T Sreeramareddy*, Vasiliki Stathopoulou*, Nicholas Steel*, Dan J Stein*, Murray B Stein*, Timothy J Steiner*, Lars Jacob Stovner*, Saverio Stranges*, Konstantinos Stroumpoulis*, Bruno F Sunguya*, Patrick J Sur*, Soumya Swaminathan*, Bryan L Sykes*, Cassandra E I Szoeke*, Rafael Tabarés-Seisdedos*, Nikhil Tandon*, David Tanne*, Mohammad Tavakkoli*, Bineyam Taye*, Hugh R Taylor*, Braden J Te Ao*, Teketo Kassaw Tegegne*, Dejen Yemane Tekle*, Abdullah Sulieman Terkawi*, Gizachew Assefa Tessema*, J S Thakur*, Alan J Thomson*, Andrew L Thorne-Lyman*, Amanda G Thrift*, George D Thurston*, Ruoyan Tobe-Gai*, Marcello Tonelli*, Roman Topor-Madry*, Fotis Topouzis*, Bach Xuan Tran*, Thomas Truelsen*, Zacharie Tsala Dimbuene*, Miltiadis Tsilimbaris*, Abera Kenay Tura*, Emin Murat Tuzcu*, Stefanos Tyrovolas*, Kingsley N Ukwaja*, Eduardo A Undurraga*, Chigozie Jesse Uneke*, Olalekan A Uthman*, Coen H van Gool*, Jim van Os*, Tommi Vasankari*, Ana Maria Nogales Vasconcelos*, Narayanaswamy Venketasubramanian*, Francesco S Violante*, Vasiliy Victorovich Vlassov*, Stein Emil Vollset*, Gregory R Wagner*, Mitchell T Wallin*, Linhong Wang*, Scott Weichenthal*, Elisabete Weiderpass*, Robert G Weintraub*, Andrea Werdecker*, Ronny Westerman*, Tissa Wijeratne*, James D Wilkinson*,
Articles
www.thelancet.com Vol 388 October 8, 2016 1651
Hywel C Williams*, Charles Shey Wiysonge*, Solomon Meseret Woldeyohannes*, Charles D A Wolfe*, Sungho Won*, Gelin Xu*, Ajit Kumar Yadav*, Bereket Yakob*, Lijing L Yan*, Yuichiro Yano*, Mehdi Yaseri*, Pengpeng Ye*, Paul Yip*, Naohiro Yonemoto*, Seok-Jun Yoon*, Mustafa Z Younis*, Chuanhua Yu*, Zoubida Zaidi*, Maysaa El Sayed Zaki*, Hajo Zeeb*, Sanjay Zodpey*, David Zonies*, Liesl Joanna Zuhlke*, Theo Vos†, Alan D Lopez†, Christopher J L Murray†.*Authors listed alphabetically. †Joint senior authors.
Affi liations Institute for Health Metrics and Evaluation (N J Kassebaum MD, M Arora BSA, R M Barber BS, J Brown MAIS, A Carter BS, D C Casey BA, F J Charlson PhD, M M Coates MPH, M Coggeshall BA, L Cornaby BS, Prof L Dandona MD, D J Dicker BS, H E Erskine PhD, A J Ferrari PhD, C Fitzmaurice MD, K Foreman PhD, M H Forouzanfar MD, N Fullman MPH, E M Goldberg BS, N Graetz MPH, J A Haagsma PhD, Prof S I Hay DSc, C O Johnson PhD, L Kemmer PhD, I A Khalil MD, Y Kinfu PhD, M J Kutz BS, H H Kyu PhD, J Leung PhD, Prof S S Lim PhD, Prof R Lozano PhD, J Mikesell BS, Prof A H Mokdad PhD, M D Mooney BS, Prof M Naghavi MD PhD, G Nguyen MPH, E Nsoesie PhD, D M Pigott DPhil, C Pinho BA, Z Rankin BS, N Reinig BS, L Sandar BS, A Smith BA, R J D Sorensen MPH, J Stanaway PhD, C Steiner MPH, S Teeple BA, B A Thomas MD, C Troeger MPH, A VanderZanden MSc, J A Wagner BS, V Wanga MS, Prof H A Whiteford PhD, Prof M Zhou PhD, L Zoeckler BA, T Achoki MD, A Afshin MD, L T Alexander BA, C Allen BA, G M Anderson MSEE, B Bell MLIS, K Bienhoff MA, S Biryukov BS, J D Blore PhD, K Estep MPA, J Friedman BA, J Frostad MPH, W W Godwin BS, P Y Liu BA, F Masiye PhD, A Millear BA, M Mirarefi n MPH, M Moradi-Lakeh MD, J E Mumford BA, M Ng PhD, M B Reitsma BS, A Reynolds BA, G A Roth MD, P J Sur BA, Prof S E Vollset DrPH, Prof T Vos PhD, Prof A D Lopez PhD, Prof C J L Murray DPhil), Harborview/UW Medicine (R G Ellenbogen MD), Harborview Injury Prevention and Research Center (C N Mock PhD), University of Washington, Seattle, WA, USA (Prof B O Anderson MD, N D Futran MD); Centre of Excellence in Women and Child Health (Prof Z A Bhutta PhD), Aga Khan University, Karachi, Pakistan (M I Nisar MSc); Centre for Global Child Health (Prof Z A Bhutta PhD, N Akseer MSc), The Hospital for Sick Children, Toronto, ON, Canada (G A deVeber MD); School of Public Health (F J Charlson PhD, H E Erskine PhD, J Leung PhD, Prof H A Whiteford PhD, A A Abajobir MPH, A J Ferrari PhD, L D Knibbs PhD), School of Dentistry (Prof R Lalloo PhD), University of Queensland, Brisbane, QLD, Australia (N K M Alam MPH, H N Gouda PhD, Y Guo PhD, Prof J J McGrath MD); Queensland Centre for Mental Health Research, Brisbane, QLD, Australia (F J Charlson PhD, H E Erskine PhD, J Leung PhD, Prof H A Whiteford PhD, A J Ferrari PhD); Centre for Control of Chronic Conditions (P Jeemon PhD), Public Health Foundation of India, New Delhi, India (Prof L Dandona MD, R Dandona PhD, G A Kumar PhD); Department of Zoology (P W Gething PhD), Oxford Big Data Institute, Li Ka Shing Centre for Health Information and Discovery, University of Oxford, Oxford, UK (Prof S I Hay DSc), and Nuffi eld Department of Medicine (D Bisanzio PhD), University of Oxford, Oxford, UK (R Ali FRCP, D A Bennett PhD, Prof V Jha DM, K Rahimi DM); Department of Public Health, Erasmus MC, University Medical Center, Rotterdam, Netherlands (J A Haagsma PhD); Centre for Research & Action in Public Health, Faculty of Health, University of Canberra, Canberra, ACT, Australia (Y Kinfu PhD); National Center for Chronic and Noncommunicable Disease Control and Prevention (L Duan MD, Y Jin MS, Y Li MPH, Prof L Wang MD, P Ye MPH, Prof M Zhou PhD), Chinese Center for Disease Control and Prevention, Beijing, China (Prof X Liang MD); Center for Translation Research and Implementation Science, National Heart, Lung, and Blood Institute, National Institutes of Health, Bethesda, MD, USA (G A Mensah MD); Department of Global Health and Population (Prof J A Salomon PhD), Department of Nutrition (A L Thorne-Lyman ScD), Harvard T H Chan School of Public Health (Prof T Bärnighausen MD, I R Campos-Nonato PhD, E L Ding ScD, M S Farvid PhD, G R Wagner MD), Harvard University, Boston, MA, USA (J R A Fitchett MD); Jimma University, Jimma,
Ethiopia (K H Abate MS, M B Ahmed MPH, T T Gebrehiwot MPH, A T Gebremedhin MPH); La Sapienza, University of Rome, Rome, Italy (C Abbafati PhD); Virginia Tech, Blacksburg, VA, USA (Prof K M Abbas PhD); Department of Neurology, Cairo University, Cairo, Egypt (Prof F Abd-Allah MD); NMSM Government College Kalpetta, Kerala, India (Prof B Abraham MPhil); Institute for Global Health (Prof I Abubakar PhD), Farr Institute of Health Informatics Research (A Banerjee DPhil), University College London, London, UK; Infectious Disease Epidemiology Group, Weill Cornell Medical College in Qatar, Doha, Qatar (L J Abu-Raddad PhD); Institute of Community and Public Health, Birzeit University, Ramallah, Palestine (N M Abu-Rmeileh PhD); Department of Epidemiology and Preventive Medicine, School of Public Health and Preventive Medicine (I N Ackerman PhD, Prof R Buchbinder PhD, Prof B Gabbe PhD), Department of Medicine, School of Clinical Sciences at Monash Health, (Prof A G Thrift PhD), Eastern Health Clinical School (B K Lloyd PhD), Monash University, Melbourne, VIC, Australia; College of Medicine, University of Ibadan, Ibadan, Nigeria (A O Adebiyi MD); University College Hospital, Ibadan, Nigeria (A O Adebiyi MD); Olabisi Onabanjo University, Ago-Iwoye, Nigeria (I A Adedeji MS); University of Extremadura, Cáceres, Spain (Prof J C Adsuar PhD); Direction du District Sanitaire de Haho, Notse, Togo (K A Afanvi MD); Faculte des Sciences de Santé, Universite de Lomé, Lomé, Togo (K A Afanvi MD); Institution of Public Health Sciences, Stockholm, Sweden (E E Agardh PhD); Dalla Lana School of Public Health (N Akseer MSc), Department of Nutritional Sciences, Faculty of Medicine (A Badawi PhD), Centre for Addiction and Mental Health (S Popova PhD), University of Toronto, Toronto, ON, Canada (A Agarwal BHSc); McMaster University, Hamilton, ON, Canada (A Agarwal BHSc); All India Institute of Medical Sciences, New Delhi, India (Prof S K Agarwal MD, A Roy DM, R Sagar MD, M Satpathy PhD, Prof N Tandon PhD); Department of Clinical Sciences Lund, Orthopedics, Clinical Epidemiology Unit (A Ahmad Kiadaliri PhD), Skane University Hospital, Department of Clinical Sciences Lund (Prof B Norrving PhD), Lund University, Lund, Sweden; Health Services Management Research Center, Institute for Futures Studies in Health, Kerman University of Medical Sciences, Kerman, Iran (A Ahmad Kiadaliri PhD); Ophthalmic Research Center (H Ahmadieh MD, M Yaseri PhD), Ophthalmic Epidemiology Research Center (M Katibeh MD), Shahid Beheshti University of Medical Sciences, Tehran, Iran; Department of Ophthalmology, Labbafi nejad Medical Center, Tehran, Iran (H Ahmadieh MD); Washington University in Saint Louis, St Louis, MO, USA (Z Al-Aly MD); Murdoch Childrens Research Institute (K Alam PhD, P Azzopardi MEpi, R Borschmann PhD, S M Colquhoun PhD, Prof G C Patton MD, R G Weintraub MBBS), Department of Paediatrics (P Azzopardi MEpi), Department of Medicine (A Meretoja PhD), Institute of Health and Ageing (Prof C E I Szoeke PhD), Melbourne School of Population and Global Health (Prof A D Lopez PhD), University of Melbourne, Melbourne, VIC, Australia (K Alam PhD, R Borschmann PhD, Prof H R Taylor AC, Prof T Wijeratne MD); Sydney School of Public Health (Prof T R Driscoll PhD), University of Sydney, Sydney, NSW, Australia (K Alam PhD, J Leigh PhD, Prof A H Kemp PhD); Queensland Health, Herston, QLD, Australia (N K M Alam MPH); King Saud University, Riyadh, Saudi Arabia (S F Aldhahri MD, K A Altirkawi MD); Department of Anesthesiology (A S Terkawi MD), King Fahad Medical City, Riyadh, Saudi Arabia (S F Aldhahri MD); Department of Preventive and Social Medicine, Faculty of Medicine (M A Alegretti MD), School of Medicine (A V Aleman MD), Faculty of Medicine (F Cavalleri BS), University of the Republic, Montevideo, Uruguay (V Colistro MSc); Debre Markos University, Debre Markos, Ethiopia (Z A Alemu MPH, T K Tegegne MPH); Luxembourg Institute of Health (LIH), Strassen, Luxembourg (A Alkerwi PhD); School of Public Health, University of Lorraine, Nancy, France (Prof F Alla PhD); Department of Public Health Sciences (P Allebeck PhD, R H S Rabiee MPH), Department of Clinical Science, Intervention and Technology (Prof J J Carrero PhD), Department of Neurobiology, Care Sciences and Society (NVS) (S M Fereshtehnejad PhD), Aging Research Center (Prof M Kivipelto PhD), Department of Medical Epidemiology and Biostatistics (E Weiderpass PhD), Karolinska Institutet, Stockholm, Sweden (R Havmoeller PhD, Shireen Sindi PhD); Charité
Articles
1652 www.thelancet.com Vol 388 October 8, 2016
Universitätsmedizin, Berlin, Germany (U Alsharif MPH); Spanish Observatory on Drugs, Government Delegation for the National Plan on Drugs, Ministry of Health, Social Policy and Equality, Madrid, Spain (E Alvarez Martin PhD); Universidad de Cartagena, Cartagena de Indias, Colombia (Prof N Alvis-Guzman PhD); School of Medicine (A T Amare MPH, Y A Melaku MPH), University of Adelaide, Adelaide, SA, Australia (L G Ciobanu MS, G A Tessema MPH); College of Medicine and Health Sciences, Bahir Dar University, Bahir Dar, Ethiopia (A T Amare MPH); Dignitas International, Zomba, Malawi (A Amberbir PhD); University of Cape Coast, Cape Coast, Ghana (A K Amegah PhD); National Hospital, Abuja, Nigeria (Prof E A Ameh MBBS); Environmental Health Research Center, Kurdistan University of Medical Sciences, Sanandaj, Iran (H Amini MSPH); Department of Epidemiology and Public Health (H Amini MSPH, T Fürst PhD), Swiss Tropical and Public Health Institute, Basel, Switzerland (C K Karema MSc); University of Basel, Basel, Switzerland (H Amini MSPH, T Fürst PhD); Ministry of Public Health, Beirut, Lebanon (W Ammar PhD, H L Harb MPH); Oregon Health and Science University, Portland, OR, USA (S M Amrock PhD, D Zonies MD); Department of Health Policy and Administration, College of Public Health, University of the Philippines Manila, Manila, Philippines (C A T Antonio MD); Self-employed, Kabul, Afghanistan (P Anwari MD); Department of Medical Sciences, Uppsala University, Uppsala, Sweden (Prof J Ärnlöv PhD, Prof A Larsson PhD); Dalarna University, Falun, Sweden (Prof J Ärnlöv PhD); School of Medicine, Institute of Microbiology and Immunology (Prof V S Arsic Arsenijevic PhD), Faculty of Medicine (A Barac PhD), University of Belgrade, Belgrade, Serbia; University Children Hospital, Belgrade, Serbia (Prof V S Arsic Arsenijevic PhD); University of Manitoba, Winnipeg, MB, Canada (A Artaman PhD); Department of Medical Emergency, School of Paramedic, Qom University of Medical Sciences, Qom, Iran (H Asayesh PhD); South Asian Public Health Forum, Islamabad, Pakistan (R J Asghar MD); Institut de Recherche Clinique du Bénin, Cotonou, Benin (E F G A Avokpaho MPH); Laboratoire d’Etudes et de Recherche-Action en Santé (LERAS Afrique), Parakou, Benin (E F G A Avokpaho MPH, F G Gankpé MD); Sanjay Gandhi Postgraduate Institute of Medical Sciences, Lucknow, India (A Awasthi MSc); The Judith Lumley Centre for Mother, Infant and Family Health Research, La Trobe University, Melbourne, VIC, Australia (B P Ayala Quintanilla PhD); Peruvian National Institute of Health, Lima, Peru (B P Ayala Quintanilla PhD); Wardliparingga Aboriginal Research Unit, South Australian Health and Medical Research Institute, Adelaide, SA, Australia (P Azzopardi MEpi); School of Health Sciences, University of Management and Technology, Lahore, Pakistan (U Bacha PhD); Public Health Agency of Canada, Toronto, ON, Canada (A Badawi PhD); Department of Environmental Health Engineering, Sri Ramachandra University, Chennai, India (K Balakrishnan PhD); School of Psychology, University of Auckland, Auckland, New Zealand (S L Barker-Collo PhD); Africa Health Research Institute, Mtubatuba, South Africa (Prof T Bärnighausen MD); Institute of Public Health, Heidelberg University, Heidelberg, Germany (Prof T Bärnighausen MD, S Mohammed PhD); Department of Occupational and Environmental Health (Prof L Barregard MD), Health Metrics Unit (Prof M Petzold PhD), University of Gothenburg, Gothenburg, Sweden; Department of Industrial Engineering, School of Engineering, Pontifi cia Universidad Javeriana, Bogotá, Colombia (L H Barrero ScD); Stanford University, Stanford, CA, USA (S Basu PhD, L C Del Gobbo PhD); School of Public Health (Y A Melaku MPH), Mekelle University, Mekelle, Ethiopia (T A Bayou BS, B D Betsu MPH, G B Hailu MSc, D Y Tekle MS); Oxford University, Ho Chi Minh City, Vietnam (J Beardsley MBChB); College of Public Health and Tropical Medicine, Jazan, Saudi Arabia (N Bedi MD); IRCCS—Istituto di Ricerche Farmacologiche Mario Negri, Milan, Italy (E Beghi MD); School of Medicine (K N Sheth MD), Yale University, New Haven, CT, USA (Prof M L Bell PhD, J J Huang MD); National Institute of Psychiatry Ramon de la Fuente, Mexico City, Mexico (C Benjet PhD, R A Gutiérrez PhD); Internal Medicine Department (Prof I S Santos PhD), University of São Paulo, São Paulo, Brazil (I M Bensenor PhD, Prof P A Lotufo DrPH); Debre Berhane University, Debre Berhan, Ethiopia (A Berhane PhD); Division of Health and Social Care Research (Prof C D Wolfe MD), King’s College London, London,
UK (E Bernabé PhD, Prof R J Hay DM); College of Health and Medical Sciences (H S Roba MPH), Haramaya University, Harar, Ethiopia (A S Beyene MPH, T A Hassen MS, Y M Mesfi n MPH); Queen Elizabeth Hospital Birmingham, Birmingham, UK (N Bhala DPhil); University of Otago Medical School, Wellington, New Zealand (N Bhala DPhil); Postgraduate Institute of Medical Education and Research, Chandigarh, India (A Bhansali DM); Department of Infectious Disease Epidemiology (T Fürst PhD), Department of Epidemiology and Biostatistics (F B Piel PhD), Division of Brain Sciences (Prof T J Steiner PhD), Imperial College London, London, UK (S Bhatt DPhil, Prof A Majeed MD, M Soljak PhD); Independent Public Health Consultants, Addis Ababa, Ethiopia (S Biadgilign MPH); Department of Nephrology Issues of Transplanted Kidney, Academician V I Shumakov Federal Research Center of Transplantology and Artifi cial Organs, Moscow, Russia (B Bikbov MD); University of Iowa Hospitals and Clinics, Iowa City, IA, USA (A A Bin Abdulhak MD); Department of Community Medicine, University of Oslo, Oslo, Norway (Prof E Bjertness PhD); Vision & Eye Research Unit, Anglia Ruskin University, Cambridge, UK (Prof R R A Bourne FRCOphth); Danube-University Krems, Krems, Austria (Prof M Brainin PhD); Faculty of Health Sciences and Social Work, Department of Public Health, Trnava University, Trnava, Slovakia (A Brazinova PhD, M Majdan PhD); International Neurotrauma Research Organization, Vienna, Austria (A Brazinova PhD); College of Medicine (J Shen PhD), Ohio State University, Columbus, OH, USA (Prof N J K Breitborde PhD); German Cancer Research Center, Heidelberg, Germany (Prof H Brenner MD); University of Leicester, Leicester, UK (Prof T S Brugha MD); Monash Department of Clinical Epidemiology, Cabrini Institute, Melbourne, VIC, Australia (Prof R Buchbinder PhD); University of California, San Francisco, San Francisco, CA, USA (G C Buckle MD); Al Shifa Trust Eye Hospital, Rawalpindi, Pakistan (Z A Butt PhD); National Centre for Epidemiology and Population Health, The Australian National University, Canberra, ACT, Australia (B Calabria PhD, Prof R M Lucas PhD); Transport and Road Safety (TARS) Research (S Boufous PhD), National Drug and Alcohol Research Centre (Prof L Degenhardt PhD), Brien Holden Vision Institute (Prof S Resnikoff MD), University of New South Wales, Kensington, NSW, Australia (B Calabria PhD, Prof P B Mitchell MD); National Institute of Public Health, Cuernavaca, Mexico (I R Campos-Nonato PhD, J C Campuzano PhD, H Gomez-Dantes MSc, I B Heredia-Pi PhD, A Jauregui MSc, J C Montañez Hernandez MSc, Prof E E Servan-Mori MSc); Department of Biostatistics and Epidemiology, University of Oklahoma Health Sciences Center, Oklahoma City, OK, USA (H Carabin PhD); Telethon Kids Institute, the University of Western Australia, Princess Margaret Hospital for Children, Subiaco, WA, Australia (Prof J R Carapetis PhD); Metropolitan Autonomous University, Mexico City, Mexico (R Cárdenas ScD); Colombian National Health Observatory, Instituto Nacional de Salud, Bogotá, Colombia (C A Castañeda-Orjuela MSc); Epidemiology and Public Health Evaluation Group, Public Health Department, Universidad Nacional de Colombia, Bogotá, Colombia (C A Castañeda-Orjuela MSc); Caja Costarricense de Seguro Social, San Jose, Costa Rica (Prof J Castillo Rivas MPH); Universidad de Costa Rica, San Pedro, Montes de Oca, Costa Rica (Prof J Castillo Rivas MPH); Department of Medicine, University of Valencia/INCLIVA Health Research Institute and CIBERSAM, Valencia, Spain (F Catalá-López PhD); Clinical Epidemiology Program, Ottawa Hospital Research Institute, Ottawa, ON, Canada (F Catalá-López PhD); School of Nursing, College of Medicine, National Taiwan University, Taipei, Taiwan (Prof J Chang PhD); Clinical Governance Unit, Gold Coast Health, Southport, QLD, Australia (P P Chiang PhD); Crowd Watch Africa, Lusaka, Zambia (M Chibalabala BS); National Center for Child Health and Development, Setagaya, Japan (C E Chibueze PhD, R Mori PhD); University of Zambia, Lusaka, Zambia (V H Chisumpa MPhil, F Masiye PhD); University of Witwatersrand, Johannesburg, South Africa (V H Chisumpa MPhil); Seoul National University Medical Library, Seoul, South Korea (J J Choi PhD); World Bank, New Delhi, India (L Choudhury MPH); Bispebjerg University Hospital, Copenhagen, Denmark (Prof H Christensen DMSCi); Ministerio de Salud Pública, Montevideo, Uruguay (V Colistro MSc); UNICEM, Montevideo, Uruguay (M Colomar MSc); Centre for
Articles
www.thelancet.com Vol 388 October 8, 2016 1653
International Health, Dunedin School of Medicine (Prof J A Crump MD), Injury Prevention Research Unit, Department of Preventive and Social Medicine, Dunedin School of Medicine (Prof S Derrett PhD), University of Otago, Dunedin, New Zealand (Prof R G Poulton PhD); IRCCS—Istituto di Ricerche Farmacologiche Mario Negri, Bergamo, Italy (G Giussani Biol D, M Cortinovis Biotech D, N Perico MD, Prof G Remuzzi MD); Faculty of Medicine, Eduardo Mondlane University, Maputo, Mozambique (Prof A Damasceno PhD); Guy’s and St Thomas’ NHS Foundation Trust, London, UK (Prof P I Dargan FRCP); i3S—Instituto de Investigação e Inovação em Saúde and INEB—Instituto de Engenharia Biomédica (J das Neves PhD), EPIUnit—Institute of Public Health (J M Pedro MS), University of Porto, Porto, Portugal (J V Santos BHlthSc); Wellcome Trust Brighton & Sussex Centre for Global Health Research, Brighton, UK (Prof G Davey MD); Public Health England, London, UK (Prof A C Davis PhD, Prof J N Newton FRCP, Prof N Steel PhD); Griffi th University, Brisbane, QLD, Australia (Prof D De Leo DSc); Mount Sinai Beth Israel, New York, NY, USA (Prof D C Des Jarlais PhD); Icahn School of Medicine at Mount Sinai, New York, NY, USA (Prof D C Des Jarlais PhD); Department of Community Medicine, Faculty of Medicine, University of Peradeniya, Peradeniya, Sri Lanka (S D Dharmaratne MD); Centre for Control of Chronic Conditions (P Jeemon PhD), Public Health Foundation of India, Gurgaon, India (P K Dhillon PhD, Prof S Zodpey PhD); RMIT University, Bundoora, VIC, Australia (Prof K E Doyle PhD); International Institute for Population Sciences, Mumbai, India (M Dubey MPhil, M H U Rahman MPhil, Prof U Ram PhD, A Singh PhD, A K Yadav MPhil); Federal University of Rio Grande do Sul, Porto Alegre, Brazil (B B Duncan PhD, C Kieling MD, Prof M I Schmidt MD); University of North Carolina, Chapel Hill, NC, USA (B B Duncan PhD); Non-Communicable Diseases Research Center, Endocrinology and Metabolism Population Sciences Institute (H Ebrahimi MD, Prof A Esteghamati MD, F Farzadfar MD, N Hafezi-Nejad MD, A Kasaeian PhD, M Parsaeian PhD, F Pishgar MD, S Sheikhbahaei MD), Liver and Pancreaticobiliary Diseases Research Center, Digestive Disease Research Institute, Shariati Hospital (H Ebrahimi MD), Digestive Diseases Research Institute (S Fahimi PhD, Prof R Malekzadeh MD, G Roshandel PhD, S G Sepanlou PhD), Center for Air Pollution Research, Institute for Environmental Research (M S Hassanvand PhD), Multiple Sclerosis Research Center, Neuroscience Institute (P Heydarpour MD), Hematology-Oncology and Stem Cell Transplantation Research Center (A Kasaeian PhD), Department of Epidemiology and Biostatistics, School of Public Health (M Parsaeian PhD), Uro-Oncology Research Center (F Pishgar MD), Sina Trauma and Surgery Research Center (Prof V Rahimi-Movaghar MD), Tehran University of Medical Sciences, Tehran, Iran (M Yaseri PhD); Eijkman-Oxford Clinical Research Unit, Jakarta, Indonesia (I Elyazar PhD); Arba Minch University, Arba Minch, Ethiopia (A Y Endries MPH); The Institute of Social and Economic Studies of Population, Russian Academy of Sciences, Moscow, Russia (Prof S P Ermakov DSc); Federal Research Institute for Health Organization and Informatics, Ministry of Health of the Russian Federation, Moscow, Russia (Prof S P Ermakov DSc); Ministry of Health and Medical Education, Tehran, Iran (B Eshrati PhD); Arak University of Medical Sciences, Arak, Iran (B Eshrati PhD); University of Louisville, Louisville, KY, USA (T A Farid MD, A R Khan MD); DGS Directorate General of Health, Lisbon, Portugal (C S E S Farinha MSc); Universidade Aberta, Lisbon, Portugal (C S E S Farinha MSc); Federal University of Sergipe, Aracaju, Brazil (Prof A Faro PhD); Harvard/MGH Center on Genomics, Vulnerable Populations, and Health Disparities, Mongan Institute for Health Policy, Massachusetts General Hospital, Boston, MA, USA (M S Farvid PhD); National Institute for Stroke and Applied Neurosciences (V L Feigin PhD), Auckland University of Technology, Auckland, New Zealand (B J Te Ao MPH); Institute of Education and Sciences, German Hospital Oswaldo Cruz, São Paulo, Brazil (Prof J G Fernandes PhD); Centre for Experimental Medicine & Rheumatology, William Harvey Research Institute, Barts and The London School of Medicine & Dentistry, Queen Mary University of London, London, UK (J C Fernandes PhD); Bielefeld University, Bielefeld, Germany (F Fischer MPH); Institute of Gerontology, Academy of Medical Science, Kiev, Ukraine (N Foigt PhD); University of
Edinburgh, Edinburgh, UK (Prof F G R Fowkes PhD); James Cook University, Townsville, QLD, Australia (R C Franklin PhD); CHU Hassan II, Fès, Morocco (F G Gankpé MD); Manhiça Health Research Center, Manhiça, Mozambique (A L Garcia-Basteiro MSc Epidemiology); Barcelona Institute for Global Health, Barcelona, Spain (A L Garcia-Basteiro MSc Epidemiology); Ludwig Maximilians University, Munich, Germany (A T Gebremedhin MPH); Division of Human Nutrition (J M Geleijnse PhD), Wageningen University, Wageningen, Netherlands (T Jibat MS); The Peter Doherty Institute for Infection and Immunity, University of Melbourne & The Royal Melbourne Hospital, Melbourne, VIC, Australia (K B Gibney FRACP); The Royal Melbourne Hospital, Melbourne, VIC, Australia (K B Gibney FRACP); College of Medicine, Howard University, Washington, DC, USA (R F Gillum MD, A Mehari MD); College of Medicine, University of Hail, Hail, Saudi Arabia (I A Ginawi MD); School of Public Health (A D Hailu MPH), Addis Ababa University, Addis Ababa, Ethiopia (A Z Giref PhD, D Haile MPH, T Jibat MS); University Hospital of Dijon, Dijon, France (Prof M Giroud MD); College of Health and Medical Sciences (H S Roba MPH), Haramaya University, Dire Dawa, Ethiopia (M D Gishu MS A K Tura MPH); Kersa Health and Demographic Surveillance System, Harar, Ethiopia (M D Gishu MS); University of Massachusetts Boston, Boston, MA, USA (Prof P Gona PhD); Instituto de Investigaciones Cientifi cas y Servicios de Alta Tecnologia—INDICASAT-AIP, Ciudad del Saber, Panamá (A Goodridge PhD); Department of Health and Social Aff airs, Government of the Federated States of Micronesia, Palikir, Federated States of Micronesia (S V Gopalani MPH); University of British Columbia, Vancouver, BC, Canada (C C Gotay PhD, Prof N Kissoon MD, J A Kopec PhD, F Pourmalek PhD); Division of Epidemiology, Center for Public Health Sciences (A Goto PhD), National Cancer Center, Tokyo, Japan (M Inoue MD); Departments of Microbiology and Epidemiology & Biostatistics, Saint James School of Medicine, The Quarter, Anguilla (Prof H Gugnani PhD); West Virginia Bureau for Public Health, Charleston, WV, USA (R Gupta MD); Eternal Heart Care Centre and Research Institute, Jaipur, India (R Gupta PhD); Department of Anthropology, University of Delhi, Delhi, India (V Gupta PhD); Department of Global Public Health and Primary Care (A K Knudsen PhD, Prof S E Vollset DrPH), University of Bergen, Bergen, Norway (A D Hailu MPH, Prof O F Norheim PhD); Kilte Awlaelo Health and Demographic Surveillance System, Mekelle, Ethiopia (G B Hailu MSc); Brandeis University, Waltham, MA, USA (Y A Halasa MS, E A Undurraga PhD); Arabian Gulf University, Manama, Bahrain (Prof R R Hamadeh DPhil); Hamdan Bin Mohammed Smart University, Dubai, United Arab Emirates (S Hamidi PhD); Wayne County Department of Health and Human Services, Detroit, MI, USA (M Hammami MD); University of New Mexico, Albuquerque, NM, USA (A J Handal PhD); School of Medicine and Pharmacology, University of Western Australia, Perth, WA, Australia (Prof G J Hankey MD); Harry Perkins Institute of Medical Research, Nedlands, WA, Australia (Prof G J Hankey MD); Western Australian Neuroscience Research Institute, Nedlands, WA, Australia (Prof G J Hankey MD); Sree Chitra Tirunal Institute for Medical Sciences and Technology, Trivandrum, India (S Harikrishnan DM); Parc Sanitari Sant Joan de Déu—CIBERSAM, Sant Boi de Llobregat (Barcelona), Spain (J M Haro MD); Universitat de Barcelona, Barcelona, Spain (J M Haro MD); International Foundation for Dermatology, London, UK (Prof R J Hay DM); Department of Medical Mycology and Parasitology, School of Medicine, Mazandaran University of Medical Sciences, Sari, Iran (Prof M T Hedayati PhD); Department of Psychiatry, University Medical Center Groningen (Prof H W Hoek MD), University of Groningen, Groningen, Netherlands (A K Tura MPH); Department of Epidemiology, Mailman School of Public Health (Prof H W Hoek MD), Columbia University, New York, NY, USA (Prof V Skirbekk PhD); Rutgers University, New Brunswick, NJ, USA (D J Hoff man PhD); Nevada Division of Public and Behavioral Health, Department of Health and Human Services, Carson City, NV, USA (M Horino MPH); Department of Pulmonology, Yokohama City University Graduate School of Medicine, Yokohama, Japan (N Horita MD); Albert Einstein College of Medicine, Bronx, NY, USA (Prof H D Hosgood PhD); Public Health Division, The Pacifi c Community, Noumea, New Caledonia (D G Hoy PhD); Department of Epidemiology, Salah Azaiz Institute,
Articles
1654 www.thelancet.com Vol 388 October 8, 2016
Tunis, Tunisia (Prof M Hsairi MD); Cambridge Health Alliance, Cambridge, MA, USA (H Huang MD); Aarhus University, Aarhus, Denmark (K M Iburg PhD); Boston Medical Center (B T Idrisov MD), School of Medicine (G F Kwan MD), Boston University, Boston, MA, USA; National Institute for Health Development, Tallinn, Estonia (K Innos PhD); Graduate School of Medicine (M Inoue MD), School of Public Health (Prof N Kawakami MD), University of Tokyo, Tokyo, Japan (K Shibuya MD); Department of Global and Community Health, George Mason University, Fairfax, VA, USA (K H Jacobsen PhD); Postgraduate Institute of Medicine, Colombo, Sri Lanka (A U Jayatilleke PhD); Institute of Violence and Injury Prevention, Colombo, Sri Lanka (A U Jayatilleke PhD); Centre for Chronic Disease Control, New Delhi, India (P Jeemon PhD); George Institute for Global Health India, New Delhi, India (Prof V Jha DM); Tianjin Centers for Disease Control and Prevention, Tianjin, China (G Jiang MD); Department of Health Development, Institute of Industrial Ecological Sciences, University of Occupational and Environmental Health, Kitakyushu, Japan (Y Jiang PhD); Department of Ocular Epidemiology and Visual Health, Institute of Ophthalmology Conde de Valencia, Mexico City, Mexico (A Jimenez-Corona PhD); General Directorate of Epidemiology, Ministry of Health, Mexico City, Mexico (A Jimenez-Corona PhD); Department of Ophthalmology, Medical Faculty Mannheim, Ruprecht-Karls-University Heidelberg, Mannheim, Germany (Prof J B Jonas MD); University College Cork, Cork, Ireland (Z Kabir PhD); Sante Stat & Analytical Research Institute, Kampala, Uganda (D K Kajungu MS); Mildmay Uganda, Kampala, Uganda (D K Kajungu MS); Society for Education, Action and Research in Community Health, Gadchiroli, India (Y Kalkonde MD); CSIR—Indian Institute of Toxicology Research, Lucknow, India (R Kamal MSc, C N Kesavachandran PhD); Department of Pulmonary Medicine, Zhongshan Hospital (J She MD), Fudan University, Shanghai, China (H Kan MD); University at Buff alo, Buff alo, NY, USA (A Kandel MBBS); Epidemiological and Statistical Methods Research Group, Helmholtz Centre for Infection Research, Braunschweig, Germany (A Karch MD); Hannover-Braunschweig Site, German Center for Infection Research, Braunschweig, Germany (A Karch MD); Quality and Equity Health Care, Kigali, Rwanda (C K Karema MSc); Case Western University Hospitals, Cleveland, OH, USA (C Karimkhani MD); Oklahoma State University, Tulsa, OK, USA (A Kaul MD); University of California San Francisco, San Francisco, CA, USA (D S Kazi MD); Institute of Tropical and Infectious Diseases, Nairobi, Kenya (P N Keiyoro PhD); School of Continuing and Distance Education, Nairobi, Kenya (P N Keiyoro PhD); Farr Institute (Prof R A Lyons MD), Swansea University, Swansea, UK (Prof A H Kemp PhD); South African Medical Research Council, Cape Town, South Africa (A P Kengne PhD, R Matzopoulos PhD, Prof C S Wiysonge PhD); School of Public Health and Family Medicine (R Matzopoulos PhD), Department of Psychiatry (Prof D J Stein PhD), University of Cape Town, Cape Town, South Africa (A P Kengne PhD, Prof B M Mayosi DPhil); Assuta Hospitals, Assuta Hashalom, Tel Aviv, Israel (Prof A Keren MD); Jordan University of Science and Technology, Irbid, Jordan (Prof Y S Khader ScD); Health Services Academy, Islamabad, Pakistan (E A Khan MPH); College of Medicine (Prof Y H Khang MD), Graduate School of Public Health (Prof S Won PhD), Seoul National University, Seoul, South Korea; Executive Board of the Health Ministers’ Council for Cooperation Council States, Riyadh, Saudi Arabia (Prof T A M Khoja FRCP); Ball State University, Muncie, IN, USA (J Khubchandani PhD); Hospital de Clínicas de Porto Alegre, Porto Alegre, Brazil (C Kieling MD); Korea Health Industry Development Institute, Cheongju-si, South Korea (C Kim PhD); Department of Health Sciences, Northeastern University, Boston, MA, USA (Prof D Kim DrPH); Southern University College, Skudai, Malaysia (Y J Kim PhD); Centre for Disease Burden (A K Knudsen PhD, Prof S E Vollset DrPH), Department of Health Promotion (J C Skogen PhD), Norwegian Institute of Public Health, Oslo, Norway (M Savic PhD, Prof V Skirbekk PhD); Department of Preventive Cardiology, National Cerebral and Cardiovascular Center, Suita, Japan (Y Kokubo PhD); Division of Cardiology, Brown University, Providence, RI, USA (D Kolte MD); Sher-i-Kashmir Institue of Medical Sciences, Srinagar, India (Prof P A Koul MD); Research and Development Unit, Parc Sanitari Sant Joan de Deu (CIBERSAM), Barcelona, Spain (A Koyanagi MD); Department of Demography and
Public Health Research Institute (Prof B Kuate Defo PhD), Department of Social and Preventive Medicine, School of Public Health (Prof B Kuate Defo PhD), University of Montreal, Montreal, QC, Canada; Graduation Studies in Epidemiology Universidade Federal do Rio Grande do Sul, Porto Alegre, Brazil (Prof R S Kuchenbecker PhD); Institute of Public Health, Hacettepe University, Ankara, Turkey (B Kucuk Bicer PhD); Erasmus MC, University Medical Center Rotterdam, Rotterdam, Netherlands (Prof E J Kuipers PhD); Work Organizations, Work Disability Prevention, The Finnish Institute of Occupational Health, Helsinki, Finland (T Lallukka PhD, R Shiri PhD); Department of Public Health, Faculty of Medicine (T Lallukka PhD), University of Helsinki, Helsinki, Finland (T J Meretoja PhD); Department of Zoology, Lahore College for Women University, Lahore, Pakistan (A A Latif PhD); Servicio de Neurologia, Clinica Alemana, Universidad del Desarrollo, Santiago, Chile (P M Lavados MD); Instituto Nacional de Epidemiología “Dr Juan H Jara,” Mar del Plata, Argentina (A E B Lawrynowicz MPH); College of Optometry, Nova Southeastern University, Fort Lauderdale, FL, USA (J L Leasher OD); State University of New York, Albany, Rensselaer, NY, USA (R Leung PhD); San Francisco VA Medical Center, San Francisco, CA, USA (Y Li PhD); School of Medicine, Wayne State University, Detroit, MI, USA (Prof S E Lipshultz MD, Prof J D Wilkinson MD); Children’s Hospital of Michigan, Detroit, MI, USA (Prof S E Lipshultz MD); Rollins School of Public Health (E P Simard PhD), Emory University, Atlanta, GA, USA (Prof Y Liu PhD, Prof M R Phillips MD); Turning Point, Eastern Health, Melbourne, VIC, Australia (B K Lloyd PhD); University of Bari, Bari, Italy (Prof G Logroscino PhD); University of Bristol, Bristol, UK (K J Looker PhD, D Rai PhD); Aintree University Hospital National Health Service Foundation Trust, Liverpool, UK (Prof R Lunevicius PhD); School of Medicine, University of Liverpool, Liverpool, UK (Prof R Lunevicius PhD); Mansoura Faculty of Medicine, Mansoura, Egypt (H Magdy Abd El Razek MBBCH); Social Security Organization Research Institute, Tehran, Iran (M Mahdavi PhD); Institute of Health Policy and Management, Erasmus University Rotterdam, Rotterdam, Netherlands (M Mahdavi PhD); Universidade Federal de Minas Gerais, Belo Horizonte, Brazil (Prof D C Malta PhD); Division of Population and Patient Health, King’s College London Dental Institute, London, UK (Prof W Marcenes PhD); University Hospital Doctor Peset, University of Valencia, Valencia, Spain (J Martinez-Raga PhD); CEU Cardenal Herrera University, Moncada (Valencia), Spain (J Martinez-Raga PhD); Department of Health Sciences, University of York, York, UK (A J Mason-Jones PhD); London School of Hygiene & Tropical Medicine, London, UK (Prof M McKee DSc, Prof G V S Murthy MD); Perelman School of Medicine, University of Pennsylvania, Philadelphia, PA, USA (P A Meaney MD); Children’s Hospital of Philadelphia, Philadelphia, PA, USA (P A Meaney MD); University of West Florida, Pensacola, FL, USA (P Memiah PhD); Saudi Ministry of Health, Riyadh, Saudi Arabia (Prof Z A Memish MD); College of Medicine, Alfaisal University, Riyadh, Saudi Arabia (Prof Z A Memish MD); United Nations Population Fund, Lima, Peru (W Mendoza MD); Department of Neurology, Helsinki University Hospital, Helsinki, Finland (A Meretoja PhD); Helsinki University Hospital, Comprehensive Cancer Center, Breast Surgery Unit, Helsinki, Finland (T J Meretoja PhD); Ifakara Health Institute, Bagamoyo, Tanzania (F A Mhimbira MS); Pacifi c Institute for Research & Evaluation, Calverton, MD, USA (T R Miller PhD); Centre for Population Health, Curtin University, Perth, WA, Australia (T R Miller PhD); University of Ottawa, Ottawa, ON, Canada (E J Mills PhD); Kyrgyz State Medical Academy, Bishkek, Kyrgyzstan (Prof E M Mirrakhimov PhD); National Center of Cardiology and Internal Disease, Bishkek, Kyrgyzstan (Prof E M Mirrakhimov PhD); University of Salahaddin, Erbil, Iraq (K A Mohammad PhD); Neuroscience Research Center, Baqiyatallah University of Medical Sciences, Tehran, Iran (A Mohammadi PhD); Health Systems and Policy Research Unit, Ahmadu Bello University, Zaria, Nigeria (S Mohammed PhD); Institute for Maternal and Child Health, IRCCS Burlo Garofolo, Trieste, Italy (L Monasta DSc, M Montico MSc, L Ronfani PhD); Department of Community Medicine, Gastrointestinal and Liver Disease Research Center, Preventive Medicine and Public Health Research Center, Iran University of Medical Sciences, Tehran, Iran (M Moradi-Lakeh MD); Competence Center Mortality-Follow-Up of
Articles
www.thelancet.com Vol 388 October 8, 2016 1655
the German National Cohort (A Werdecker PhD), Federal Institute for Population Research, Wiesbaden, Germany (Prof U O Mueller PhD, R Westerman PhD); West Herts Hospitals NHS Trust, Watford, UK (M E Murdoch FRCP); Indian Institute of Public Health (Prof G V S Murthy MD), Public Health Foundation of India, Gurgaon, India (P K Dhillon PhD, Prof S Zodpey PhD); Graduate School of Public Health, University of Pittsburgh, Pittsburgh, PA, USA (Prof J B Nachega PhD); Stellenbosch University, Cape Town, South Africa (Prof J B Nachega PhD, Prof S Seedat PhD, Prof C S Wiysonge PhD); Bloomberg School of Public Health (Prof J B Nachega PhD), Johns Hopkins University, Baltimore, MD, USA (B X Tran PhD); International Centre for Diarrhoeal Disease Research, Bangladesh (icddr,b), Dhaka, Bangladesh (A Naheed PhD); Azienda Ospedaliera Papa Giovanni XXIII, Bergamo, Italy (Prof L Naldi MD, Prof G Remuzzi MD); Suraj Eye Institute, Nagpur, India (V Nangia MD); Ministry of Health and Social Welfare, Dar es Salaam, Tanzania (F N Ngalesoni MSc); Institute for Global Health Innovations, Duy Tan University, Da Nang, Vietnam (Q L Nguyen MD); Institute For Research, Socio-Economic Development and Communication, Yaoundé, Cameroon (P M Nkamedjie Pete MS); Hospital Universitari de Bellvitge, L’Hospitalet, Spain (J M Nolla PhD); Institute of Health and Biomedical Innovation, Queensland University of Technology, Brisbane, QLD, Australia (R E Norman PhD); Center for Research on Population and Health, Faculty of Health Sciences, American University of Beirut, Beirut, Lebanon (Prof C M Obermeyer DSc); Centre for Health Research, Western Sydney University, Sydney, NSW, Australia (F A Ogbo MPH); Department of Preventive Medicine, School of Medicine, Kyung Hee University, Seoul, South Korea (Prof I Oh PhD); Human Sciences Research Council, Durban, South Africa (O Oladimeji MD); University of KwaZulu-Natal, Durban, South Africa (O Oladimeji MD, Prof B Sartorius PhD); Universidad Autonoma de Chile, Talca, Chile (Prof P R Olivares PhD); Center for Healthy Start Initiative, Lagos, Nigeria (B O Olusanya PhD, J O Olusanya MBA); University of Arizona, Tucson, AZ, USA (Prof E Oren PhD); IIS-Fundacion Jimenez Diaz-UAM, Madrid, Spain (Prof A Ortiz PhD); St Luke’s International University, Tokyo, Japan (E Ota PhD); Hypertension in Africa Research Team (HART) (Prof A E Schutte PhD), North-West University, Mafi keng, South Africa (Prof A S Oyekale PhD); JSS Medical College, JSS University, Mysore, India (Prof M PA DNB); Department of Medical Humanities and Social Medicine, College of Medicine, Kosin University, Busan, South Korea (E Park PhD); Department of Community Health Sciences (Prof S B Patten PhD), University of Calgary, Calgary, AB, Canada (Prof M Tonelli MD); Health Research Centre of Angola, Caxito, Angola (J M Pedro MS); REQUIMTE/LAQV, Laboratório de Farmacognosia, Departamento de Química, Faculdade de Farmácia, Universidade do Porto, Porto, Portugal (Prof D M Pereira PhD); Flinders University, Adelaide, SA, Australia (Prof K Pesudovs PhD); University of the Witwatersrand, Johannesburg, South Africa (Prof M Petzold PhD); Shanghai Jiao Tong University School of Medicine, Shanghai, China (Prof M R Phillips MD); Durban University of Technology, Durban, South Africa (J D Pillay PhD); Exposure Assessment and Environmental Health Indicators, German Environment Agency, Berlin, Germany (D Plass DrPH); Department of Public Health, Erasmus University Medical Center, Rotterdam, Netherlands (S Polinder PhD); The Fred Hollows Foundation, Sydney, NSW, Australia (N M Prasad DO); Centre for Eye Research Australia, Melbourne, VIC, Australia (N M Prasad DO); Department of Community Medicine, School of Medicine, Alborz University of Medical Sciences, Karaj, Iran (M Qorbani PhD); A T Still University, Kirksville, MO, USA (A Radfar MD); Contech School of Public Health, Lahore, Pakistan (A Rafay MS); Research and Evaluation Division, BRAC, Dhaka, Bangladesh (M Rahman PhD); Hamad Medical Corporation, Doha, Qatar (S U Rahman FCPS); Society for Health and Demographic Surveillance, Suri, India (R K Rai MPH); ERAWEB Program, UMIT, Hall in Tirol, Austria (S Rajsic MD); University of Missouri, Columbia, MO, USA (M Raju PhD); University of Michigan Health Systems, Ann Arbor, MI, USA (K Ranganathan MD); Walden University, Minneapolis, MN, USA (Prof A H Refaat PhD); Suez Canal University, Ismailia, Egypt (Prof A H Refaat PhD); Department of Biomedical and Clinical Sciences L Sacco, University of Milan, Milan, Italy (Prof G Remuzzi MD); Hospital das Clinicas da Universidade Federal de Minas Gerais, Belo
Horizonte, Brazil (Prof A L Ribeiro MD); UO Neurologia USL Umbria 1, Città di Castello, Italy (S Ricci FRCPEd); (ISGlobal) Instituto de Salud Global de Barcelona, Barcelona, Spain (D Rojas-Rueda PhD); Golestan Research Center of Gastroenterology and Hepatology, Golestan University of Medical Sciences, Gorgan, Iran (G Roshandel PhD); World Health Organization, Accra, Ghana (B B Sackey MS); Marshall University J Edwards School of Medicine, Huntington, WV, USA (J R Sanabria MD); Case Western Reserve University, Cleveland, OH, USA (J R Sanabria MD); IIS-Fundacion Jimenez Diaz, Madrid, Spain (M D Sanchez-Niño PhD); Universidad Ciencias Aplicadas y Ambientales, Bogotá, Colombia (R Sarmiento-Suarez MPH); Marshall University, Huntington, WV, USA (M Sawhney PhD); Federal University of Santa Catarina, Florianópolis, Brazil (I J C Schneider PhD, D A S Silva PhD); South African Medical Research Council, Potchefstroom, South Africa (Prof A E Schutte PhD); University of Alabama at Birmingham, Birmingham, AL, USA (D C Schwebel PhD, J A Singh MD); Tufts Medical Center, Boston, MA, USA (S Shahraz PhD); Independent Consultant, Karachi, Pakistan (M A Shaikh MD); Indian Institute of Technology Ropar, Rupnagar, India (R Sharma MA); Research Institute at Nationwide Children’s Hospital, Columbus, OH, USA (J Shen PhD); National Institute of Infectious Diseases, Tokyo, Japan (M Shigematsu PhD); Sandia National Laboratories, Albuquerque, NM, USA (M Shigematsu PhD); Department of Public Health Science, Graduate School (Prof M Shin PhD), Department of Preventive Medicine, College of Medicine (S Yoon PhD), Korea University, Seoul, South Korea; Reykjavik University, Reykjavik, Iceland (I D Sigfusdottir PhD); Feinberg School of Medicine (J I Silverberg MD), Department of Preventive Medicine (Y Yano MD), Northwestern University, Chicago, IL, USA; Institute for Human Development, New Delhi, India (P K Singh PhD); Alcohol and Drug Research Western Norway (J C Skogen PhD), Stavanger University Hospital, Stavanger, Norway (K Søreide PhD); Department of Community Medicine, International Medical University, Kuala Lumpur, Malaysia (C T Sreeramareddy MD); Attikon University Hospital, Athens, Greece (V Stathopoulou PhD); University of East Anglia, Norwich, UK (Prof N Steel PhD); South African Medical Research Council Unit on Anxiety & Stress Disorders, Cape Town, South Africa (Prof D J Stein PhD); University of California, San Diego, La Jolla, CA, USA (M B Stein MD); Department of Neuroscience, Norwegian University of Science and Technology, Trondheim, Norway (Prof T J Steiner PhD, Prof L J Stovner PhD); Norwegian Advisory Unit on Headache, St Olavs Hospital, Trondheim, Norway (Prof L J Stovner PhD); Luxembourg Institute of Health, Strassen, Luxembourg (S Stranges PhD); Alexandra General Hospital of Athens, Athens, Greece (K Stroumpoulis PhD); Centre Hospitalier Public du Cotentin, Cherbourg, France (K Stroumpoulis PhD); Muhimbili University of Health and Allied Sciences, Dar es Salaam, Tanzania (B F Sunguya PhD); Indian Council of Medical Research, New Delhi, India (S Swaminathan MD); Departments of Criminology, Law & Society, Sociology, and Public Health, University of California, Irvine, Irvine, CA, USA (Prof B L Sykes PhD); Department of Medicine, University of Valencia, INCLIVA Health Research Institute and CIBERSAM, Valencia, Spain (Prof R Tabarés-Seisdedos PhD); Chaim Sheba Medical Center, Tel Hashomer, Israel (Prof D Tanne MD); Tel Aviv University, Tel Aviv, Israel (Prof D Tanne MD); New York Medical College, Valhalla, NY, USA (M Tavakkoli MD); Department of Biology, Colgate University, Hamilton, NY, USA (B Taye PhD); Department of Anesthesiology, University of Virginia, Charlottesville, VA, USA (A S Terkawi MD); Outcomes Research Consortium (A S Terkawi MD), Cleveland Clinic, Cleveland, OH, USA (Prof E M Tuzcu MD); University Of Gondar, Gondar, Ethiopia (G A Tessema MPH); School of Public Health, Post Graduate Institute of Medical Education and Research, Chandigarh, India (Prof J Thakur MD); Adaptive Knowledge Management, Victoria, BC, Canada (A J Thomson PhD); WorldFish, Penang, Malaysia (A L Thorne-Lyman ScD); Nelson Institute of Environmental Medicine, School of Medicine, New York University, Tuxedo, NY, USA (Prof G D Thurston ScD); National Center for Child Health and Development, Tokyo, Japan (R Tobe-Gai PhD); Institute of Public Health, Faculty of Health Sciences, Jagiellonian University Medical College, Kraków, Poland (R Topor-Madry PhD); Faculty of Health Sciences, Wroclaw Medical University, Wroclaw, Poland (R Topor-
Articles
1656 www.thelancet.com Vol 388 October 8, 2016
Madry PhD); Aristotle University of Thessaloniki, Thessaloniki, Greece (Prof F Topouzis PhD); Hanoi Medical University, Hanoi, Vietnam (B X Tran PhD); Department of Neurology, Rigshospitalet, University of Copenhagen, Copenhagen, Denmark (T Truelsen DMSc); Department of Population Sciences and Development, Faculty of Economics and Management, University of Kinshasa, Kinshasa, Democratic Republic of the Congo (Z Tsala Dimbuene PhD); African Population and Health Research Center, Nairobi, Kenya (Z Tsala Dimbuene PhD); Department of Medicine, University of Crete, Heraklion, Greece (Prof M Tsilimbaris PhD); Parc Sanitari Sant Joan de Déu, Fundació Sant Joan de Déu, Universitat de Barcelona, CIBERSAM, Barcelona, Spain (S Tyrovolas PhD); Department of Internal Medicine, Federal Teaching Hospital, Abakaliki, Nigeria (K N Ukwaja MD); Ebonyi State University, Abakaliki, Nigeria (C J Uneke PhD); Warwick Medical School, University of Warwick, Coventry, UK (O A Uthman PhD); National Institute for Public Health and the Environment, Bilthoven, Netherlands (C H van Gool PhD); Maastricht University Medical Centre, Maastricht, Netherlands (Prof J van Os PhD); UKK Institute for Health Promotion Research, Tampere, Finland (Prof T Vasankari PhD); University of Brasilia, Brasília, Brazil (Prof A M N Vasconcelos PhD); Raffl es Neuroscience Centre, Raffl es Hospital, Singapore, Singapore (N Venketasubramanian FRCP); University of Bologna, Bologna, Italy (Prof F S Violante MD); National Research University Higher School of Economics, Moscow, Russia (Prof V V Vlassov MD); National Institute for Occupational Safety and Health, Washington, DC, USA (G R Wagner MD); VA Medical Center, Washington, DC, USA (M T Wallin MD); Neurology Department, Georgetown University, Washington, DC, USA (M T Wallin MD); McGill University, Montreal, QC, Canada (S Weichenthal PhD); Department of Research, Cancer Registry of Norway, Institute of Population-Based Cancer Research, Oslo, Norway (E Weiderpass PhD); Department of Community Medicine, Faculty of Health Sciences, University of Tromsø, The Arctic University of Norway, Tromsø, Norway (E Weiderpass PhD); Genetic Epidemiology Group, Folkhälsan Research Center, Helsinki, Finland (E Weiderpass PhD); Royal Children’s Hospital, Melbourne, VIC, Australia (R G Weintraub MBBS); German National Cohort Consortium, Heidelberg, Germany (R Westerman PhD); Western Health, Footscray, VIC, Australia (Prof T Wijeratne MD); Children’s Hospital of Michigan, Detroit, MI, USA (Prof J D Wilkinson MD); Centre of Evidence-based Dermatology, University of Nottingham, Nottingham, UK (Prof H C Williams DSc); Department of Epidemiology and Biostatistics, Institute of Public Health, University of Gondar, Gondar, Ethiopia (S M Woldeyohannes MPH); National Institute for Health Research Comprehensive Biomedical Research Centre, Guy’s & St Thomas’ NHS Foundation Trust and King’s College London, London, UK (Prof C D Wolfe MD); Department of Neurology, Jinling Hospital, Nanjing University School of Medicine, Nanjing, China (Prof G Xu PhD); Discipline of Public Health Medicine, School of Nursing and Public Health, University of KwaZulu Natal, Durban, South Africa (B Yakob PhD); Global Health Research Center, Duke Kunshan University, Kunshan, China (Prof L L Yan PhD); Social Work and Social Administration Department and The Hong Kong Jockey Club Centre for Suicide Research and Prevention, University of Hong Kong, Hong Kong, China (Prof P Yip PhD); Department of Biostatistics, School of Public Health, Kyoto University, Kyoto, Japan (N Yonemoto MPH); Jackson State University, Jackson, MS, USA (Prof M Z Younis DrPH); Department of Epidemiology and Biostatistics, School of Public Health (Prof C Yu PhD), Global Health Institute (Prof C Yu PhD), Wuhan University, Wuhan, China; University Hospital, Setif, Algeria (Prof Z Zaidi PhD); Faculty of Medicine, Mansoura University, Mansoura, Egypt (Prof M E Zaki PhD); Leibniz Institute for Prevention Research and Epidemiology, Bremen, Germany (Prof H Zeeb PhD); Red Cross War Memorial Children’s Hospital, Cape Town, South Africa (L J Zuhlke PhD)
ContributorsCJLM, NK, and NF prepared the fi rst draft. CJLM and ADL conceived of the study and provided overall guidance. All other authors provided data, developed models, reviewed results, initiated modelling infrastructure, and/or reviewed and contributed to the report.
Declaration of interestsBenjamin O Anderson is supported by the Susan G Komen Leadership Grant Research Project, award number SAC160001. Itamar S Santos reports grants from FAPESP (Brazilian Public Agency), outside the submitted work. Carl Abelardo T Antonio reports grants, personal fees, and non-fi nancial support from Johnson & Johnson (Philippines), outside the submitted work. Rafael Tabarés-Seisdedos and Ferrán Catalá-López are supported in part by grant PROMETEOII/2015/021 from Generalitat Valenciana, and Rafael Tabarés-Seisdedos is supported by the national grant PI14/00894 from ISCIII-FEDER. Pablo M Lavados reports grants, personal fees, and non-fi nancial support from Bayer, non-fi nancial support from Boehringer Ingelheim, grants and personal fees from AstraZeneca, grants from CONICYT, and grants from The George Institute for Global Health, outside the submitted work. Jasvinder A Singh serves as the principal investigator for an investigator-initiated study funded by Horizon pharmaceuticals through a grant to DINORA, a 501c3 entity, and is on the steering committee of OMERACT, an international organization that develops measures for clinical trials and receives arms-length funding from 36 pharmaceutical companies. Ai Koyanagi’s work is supported by the Miguel Servet contract fi nanced by the CP13/00150 and PI15/00862 projects, integrated into the National R+D+I and funded by the ISCIII General Branch Evaluation and Promotion of Health Research and the European Regional Development Fund (ERDF-FEDER). Aletta E Schutte is funded by the Medical Research Council of South Africa, and the South African Research Chair Initiative by the National Research Foundation. Ana Maria Nogales Vasconcelos and her team in Brazil has received funding from Ministry of Health (process number: 25000192049/2014-14). Mahesh PA acknowledges the Indian Council of Medical Research for fi nancial support (ICMR Grant number 5/8/4-4 (Env)/2003-NCD-I). Katharine J Looker has received funding from the World Health Organization for the HSV-2 seroprevalence review which informs this work; during the study, KJL also received separate funding from the World Health Organization, USAID/PATH, Sexual Health 24, and the National Institute for Health Research (NIHR) Health Protection Research Unit (HPRU) in Evaluation of Interventions at the University of Bristol. Donal Bisanzio is supported by Bill & Melinda Gates Foundation (#OPP1068048). Thomas Fürst received fi nancial support from the Swiss National Science Foundation (SNSF; project no P300P3-154634. Jost B Jonas reports personal fees from Consultant for Mundipharma (Cambridge, UK); from Patent holder with Biocompatibles UK (Franham, Surrey, UK; Treatment of eye diseases using encapsulated cells encoding and secreting neuroprotective factor and/or anti-angiogenic factor; Patent number: 20120263794), patent application with University of Heidelberg (Heidelberg, Germany; Agents for use in the therapeutic or prophylactic treatment of myopia or hyperopia; Europäische Patentanmeldung 15 000 771.4), outside the submitted work. Rodrigo Sarmiento-Suarez receives institutional support from Universidad de Ciencias Aplicadas y Ambientales, UDCA, Bogotá, Colombia. Stefanos Tyrovolas’s work is supported by the Foundation for Education and European Culture (IPEP), the Sara Borrell postdoctoral programme (reference no CD15/00019 from the Instituto de Salud Carlos III (ISCIII—Spain) and the Fondos Europeo de Desarrollo Regional (FEDER). Beatriz Paulina Ayala Quintanilla acknowledges institutional support of PRONABEC (National Program of Scholarship and Educational Loan), provided by the Peruvian Government, while studying for her doctoral course at the Judith Lumley Centre of La Trobe University funded by PRONABEC. Manami Inoue is the benefi ciary of a fi nancial contribution from the AXA Research fund as chair holder of the AXA Department of Health and Human Security, Graduate School of Medicine, The University of Tokyo from Nov 1, 2012; the AXA Research Fund has no role in this work. Laith J Abu-Raddad acknowledges the support of Qatar National Research Fund (NPRP 9-040-3-008) who provided the main funding for generating the data provided to the GBD-IHME eff ort. Yogeshwar Kalkonde is a Wellcome Trust/ DBT India Alliance Intermediate Fellow in Public Health. Sarah Derrett reports grants and fees from the Euroqol Foundation, outside the submitted work. Dan J Stein reports personal fees from Lundbeck, Novartis, AMBRF, Biocodex, Sevier, SUN, and CIPLA, and grants from
Articles
www.thelancet.com Vol 388 October 8, 2016 1657
NRGF and MRC, outside the submitted work. Tea Lallukka reports funding from The Academy of Finland, grant 287488, as an Academy Research Fellow. Charles D A Wolfe’s research was funded/supported by the National Institute for Health Research (NIHR) Biomedical Research Centre based at Guy’s and St Thomas’ NHS Foundation Trust and King’s College London. The views expressed are those of the authors and not necessarily those of the NHS, the NIHR, the UK Department of Health, Public Health England, or the World Health Organization. All other authors declare no competing interests.
AcknowledgmentsWe would like to thank the countless individuals who have contributed to the Global Burden of Disease Study 2015 in various capacities. The data reported here have been supplied by the US Renal Data System (USRDS). Data for this research was provided by MEASURE Evaluation, funded by the United States Agency for International Development (USAID). Collection of these data was made possible by the US Agency for International Development (USAID) under the terms of cooperative agreement GPO-A-00-08-000_D3-00. Views expressed do not necessarily refl ect those of USAID, the US Government, or MEASURE Evaluation. Parts of this material are based on data and information provided by the Canadian institute for Health Information. However, the analyses, conclusions, opinions and statements expressed herein are those of the author and not those of the Canadian Institute for Health information. The Palestinian Central Bureau of Statistics granted the researchers access to relevant data in accordance with license no SLN2014-3-170, after subjecting data to processing aiming to preserve the confi dentiality of individual data in accordance with the General Statistics Law, 2000. The researchers are solely responsible for the conclusions and inferences drawn upon available data. This paper uses data from SHARE Waves 1, 2, 3 (SHARELIFE), 4 and 5 (DOIs: 10.6103/SHARE.w1.500, 10.6103/SHARE.w2.500, 10.6103/SHARE.w3.500, 10.6103/SHARE.w4.500, 10.6103/SHARE.w5.500), see Börsch-Supan and colleagues, 2013, for methodological details. The SHARE data collection has been primarily funded by the European Commission through FP5 (QLK6-CT-2001-00360), FP6 (SHARE-I3: RII-CT-2006-062193, COMPARE: CIT5-CT-2005-028857, SHARELIFE: CIT4-CT-2006-028812) and FP7 (SHARE-PREP: number 211909, SHARE-LEAP: number 227822, SHARE M4: number 261982). Additional funding from the German Ministry of Education and Research, the US National Institute on Aging (U01_AG09740-13S2, P01_AG005842, P01_AG08291, P30_AG12815, R21_AG025169, Y1-AG-4553-01, IAG_BSR06-11, and OGHA_04-064) and from various national funding sources is gratefully acknowledged. This study has been realised using the data collected by the Swiss Household Panel (SHP), which is based at the Swiss Centre of Expertise in the Social Sciences FORS. The project is fi nanced by the Swiss National Science Foundation. The following individuals would like to acknowledge various forms of institutional support: Simon I Hay is funded by a Senior Research Fellowship from the Wellcome Trust (#095066), and grants from the Bill & Melinda Gates Foundation (OPP1119467, OPP1093011, OPP1106023 and OPP1132415). Amanda G Thrift is supported by a fellowship from the National Health and Medical Research Council (GNT1042600). Panniyammakal Jeemon is supported by the Wellcome Trust-DBT India Alliance, Clinical and Public Health, Intermediate Fellowship (2015–2020). Boris Bikbov, Norberto Percio, and Giuseppe Remuzzi acknowledge that work related to this paper has been done on the behalf of the GBD Genitourinary Disease Expert Group supported by the International Society of Nephrology (ISN). Amador Goodridge acknowledges funding from Sistema Nacional de Investigadores de Panamá-SNI. José das Neves was supported in his contribution to this work by a Fellowship from Fundação para a Ciência e a Tecnologia, Portugal (SFRH/BPD/92934/2013). Lijing L Yan is supported by the National Natural Sciences Foundation of China grants (71233001 and 71490732). Olanrewaju Oladimeji is an African Research Fellow at Human Sciences Research Council (HSRC) and Doctoral Candidate at the University of KwaZulu-Natal (UKZN), South Africa, and would like to acknowledge the institutional support by leveraging on the existing organisational research infrastructure at HSRC and UKZN. Nicholas Steel received funding from Public Health England as a Visiting Scholar in the Institute for Health Metrics and Evaluation in 2016. No individuals acknowledged received additional compensation for their eff orts.
References1 UN. Sustainable development goals. Oct 29, 2015. http://www.
un.org/sustainabledevelopment/sustainable-development-goals/ (accessed Oct 29, 2015).
2 Murray CJL. Choosing indicators for the health-related SDG targets. Lancet 2015; 386: 1314–17.
3 Murray CJL. Shifting to Sustainable Development Goals—Implications for global health. N Engl J Med 2015; 373: 1390–93.
4 Nilsson M, Griggs D, Visbeck M. Policy: Map the interactions between Sustainable Development Goals. Nature News 2016; 534: 320.
5 UN. United Nations Sustainable Development. http://www.un.org/sustainabledevelopment/health/ (accessed June 26, 2016).
6 Murray CJL, Salomon JA, Mathers CD, Lopez AD. Summary Measures in Population Health: Concepts, Ethics, Measurement, and Applications. Geneva: World Health Organization, 2002.
7 Sullivan DF. A single index of mortality and morbidity. HSMHA Health Rep 1971; 86: 347–54.
8 Mathers CD, Sadana R, Salomon JA, Murray CJ, Lopez AD. Healthy life expectancy in 191 countries, 1999. Lancet 2001; 357: 1685–91.
9 Murray CJ, Vos T, Lozano R, et al. Disability-adjusted life years (DALYs) for 291 diseases and injuries in 21 regions, 1990–2010: a systematic analysis for the Global Burden of Disease Study 2010. Lancet 2012; 380: 2197–223.
10 Murray CJ, Barber RM, Foreman KJ, et al. Global, regional, and national disability-adjusted life years (DALYs) for 306 diseases and injuries and healthy life expectancy (HALE) for 188 countries, 1990–2013: quantifying the epidemiological transition. Lancet 2015; 386: 2145–91.
11 Murray CJ. Quantifying the burden of disease: the technical basis for disability-adjusted life years. Bull World Health Organ 1994; 72: 429–45.
12 GBD 2015 Mortality and Causes of Death Collaborators. Global, regional, and national life expectancy, all-cause mortality, and cause-specifi c mortality for 249 causes of death, 1980–2015: a systematic analysis for the Global Burden of Disease Study 2015. Lancet 2016; 388: 1459–544.
13 WHO. WHO methods and data sources for global burden of disease estimates 2000–2011. Geneva: World Health Organization, 2013.
14 WHO. WHO methods and data sources for life tables 1990–2015. Geneva: World Health Organization, 2016.
15 EHLEIS. Bibliography on Health Expectancy in Europe, April 2015. http://www.eurohex.eu/pdf/Reports_2015/2015_TR4%204_Bibliography.pdf (accessed June 7, 2016).
16 WHO. WHO methods and data sources for country-level causes of death 2000–2012. Geneva: World Health Organization, 2014.
17 WHO. Estimates for 2000–2012. http://www.who.int/healthinfo/global_burden_disease/estimates/en/ (accessed June 11, 2016).
18 European Commission. Healthy Life Years (HLY). http://ec.europa.eu/health/indicators/healthy_life_years/hly_en.htm#fragment2 (accessed June 7, 2016).
19 OECD. Health at a Glance: Europe 2012. Paris: Organisation for Economic Co-operation and Development, 2012. http://www.oecd-ilibrary.org/content/book/9789264183896-en (accessed June 7, 2016).
20 GBD 2015 Risk Factors Collaborators. Global, regional, and national incidence, prevalence, and years lived with disability for 310 diseases and injuries during 1990–2015: a systematic analysis for the Global Burden of Disease Study 2015. Lancet 2016; 388: 1545–604.
21 Murray CJ, Ezzati M, Flaxman AD, et al. GBD 2010: design, defi nitions, and metrics. Lancet 2012; 380: 2063–66.
22 Stevens GA, Alkema L, Black RE, et al. Guidelines for Accurate and Transparent Health Estimates Reporting: the GATHER statement. Lancet 2016; published online June 28. http://dx.doi.org/10.1016/S0140-6736(16)30388-9.
23 Stevens GA, Alkema L, Black RE, et al. Guidelines for Accurate and Transparent Health Estimates Reporting: the GATHER statement. PLoS Med 2016; 13: e1002056.
24 Stanaway JD, Shepard DS, Undurraga EA, et al. The global burden of dengue: an analysis from the Global Burden of Disease Study 2013. Lancet Infect Dis 2016; 16: 712–23.
25 Salomon JA, Vos T, Hogan DR, et al. Common values in assessing health outcomes from disease and injury: disability weights measurement study for the Global Burden of Disease Study 2010. Lancet 2012; 380: 2129–43.
For funding for SHARE see http://www.share-project.org
Articles
1658 www.thelancet.com Vol 388 October 8, 2016
26 Salomon JA, Haagsma JA, Davis A, et al. Disability weights for the Global Burden of Disease 2013 study. Lancet Glob Health 2015; 3: e712–23.
27 Salomon JA, Wang H, Freeman MK, et al. Healthy life expectancy for 187 countries, 1990–2010: a systematic analysis for the Global Burden Disease Study 2010. Lancet 2012; 380: 2144–62.
28 Calculating the Indices. Human Development Reports. http://hdr.undp.org/en/content/calculating-indices (accessed April 27, 2016).
29 WHO Ebola Response Team. West African Ebola epidemic after one year— slowing but not yet under control. N Engl J Med 2015; 372: 584–87.
30 Fries JF. The compression of morbidity. Milbank Q 2005; 83: 801–23.31 Langa KM, Larson EB, Karlawish JH, et al. Trends in the prevalence
and mortality of cognitive impairment in the United States: is there evidence of a compression of cognitive morbidity? Alzheimers Dement 2008; 4: 134–44.
32 Bardenheier BH, Lin J, Zhuo X, et al. Compression of disability between two birth cohorts of US adults with diabetes, 1992–2012: a prospective longitudinal analysis. Lancet Diabetes Endocrinol 2016; 4: 686–94.
33 Beltran-Sanchez H, Preston S, Canudas-Romo V. An integrated approach to cause-of-death analysis: cause-deleted life tables and decompositions of life expectancy. Demogr Res 2008; 19: 1323–50.
34 Jagger C, Matthews R, Matthews F, et al. The burden of diseases on disability-free life expectancy in later life. J Gerontol A Biol Sci Med Sci 2007; 62: 408–14.
35 van Gool CH, Picavet HSJ, Deeg DJ, et al. Trends in activity limitations: the Dutch older population between 1990 and 2007. Int J Epidemiol 2011; 40: 1056–67.
36 King G, Murray CJL, Salomon JA, Tandon A. Enhancing the validity and cross-cultural comparability of measurement in survey research. Am Polit Sci Rev 2004; 98: 191–207.
37 Salomon JA, Tandon A, Murray CJL. Comparability of self rated health: cross sectional multi-country survey using anchoring vignettes. BMJ 2004; 328: 258.
38 Tandon A, Murray CJL, Salomon JA, King G. Statistical Models for Enhancing Cross-Population Comparability. Geneva: World Health Organization, 2002.
39 Bowling A. Commentary: Trends in activity limitation. Int J Epidemiol 2011; 40: 1068–70.
40 Jamison DT, Summers LH, Alleyne G, et al. Global health 2035: a world converging within a generation. Lancet 2013; 382: 1898–955.
41 GBD 2015 SDG Collaborators. Measuring the health-related Sustainable Development Goals in 188 countries: a baseline analysis from the Global Burden of Disease Study 2015. Lancet 2016; 388: 1815–52.
42 Engineer MH, Roy N, Fink S. ‘Healthy’ Human Development Indices. Soc Indic Res 2009; 99: 61–80.
43 National Institutes of Health (NIH). NIH unveils FY2016–2020 Strategic Plan. Dec 15, 2015. http://www.nih.gov/news-events/news-releases/nih-unveils-fy2016–2020-strategic-plan (accessed March 26, 2016).
44 Gillum LA, Gouveia C, Dorsey ER, et al. NIH disease funding levels and burden of disease. PLoS One 2011; 6: e16837.
45 Emdin CA, Odutayo A, Hsiao AJ, et al. Association between randomised trial evidence and global burden of disease: cross sectional study (Epidemiological Study of Randomized Trials—ESORT). BMJ 2015; 350: h117.
46 Catalá-López Ferrán, García-Altés Anna, Álvarez-Martín E, Gènova-Maleras R, Morant-Ginestar C. Does the development of new medicinal products in the European Union address global and regional health concerns? Popul Health Metr 2010; 8: 34.
47 WHO. Investing in health research and development. http://www.who.int/tdr/publications/tdr-research-publications/investing-in-health/en/ (accessed June 11, 2016).
48 Chalmers I, Bracken MB, Djulbegovic B, et al. How to increase value and reduce waste when research priorities are set. Lancet 2014; 383: 156–65.
49 GBD 2015 Risk Factors Collaborators. Global, regional, and national comparative risk assessment of 79 behavioural, environmental and occupational, and metabolic risks or clusters of risks, 1990–2015: a systematic analysis for the Global Burden of Disease Study 2015. Lancet 2016; 388: 1661–736.
50 Leigh JP, Sheetz RM. Prevalence of back pain among fulltime United States workers. Br J Ind Med 1989; 46: 651–57.
51 Leino-Arjas P, Hänninen K, Puska P. Socioeconomic variation in back and joint pain in Finland. Eur J Epidemiol 1998; 14: 79–87.
52 Waddell G, Burton AK. Occupational health guidelines for the management of low back pain at work: evidence review. Occup Med (Lond) 2001; 51: 124–35.
53 Haddon W. Advances in the epidemiology of injuries as a basis for public policy. Public Health Rep 1980; 95: 411–21.
54 Moore L, Evans D, Hameed SM, et al. Mortality in Canadian trauma systems: a multicenter cohort Study. Ann Surg 2016; published online Jan 7. DOI:10.1097/SLA.0000000000001614.
55 Uthkarsh PS, Gururaj G, Reddy SS, Rajanna MS. Assessment and availability of trauma care services in a district hospital of south India: a fi eld observational study. Bull Emerg Trauma 2016; 4: 93–100.
56 Ghajar J. Traumatic brain injury. Lancet 2000; 356: 923–29.57 Cheatham ML, Malbrain ML, Kirkpatrick A, et al. Results from the
International Conference of Experts on Intra-abdominal Hypertension and Abdominal Compartment Syndrome. II. Recommendations. Intensive Care Med 2007; 33: 951–62.
58 Stuke LE, Pons PT, Guy JS, Chapleau WP, Butler FK, McSwain NE. Prehospital spine immobilization for penetrating trauma—review and recommendations from the Prehospital Trauma Life Support Executive Committee. J Trauma 2011; 71: 763–69.
59 Rickard JL, Ntakiyiruta G, Chu KM. Associations with perioperative mortality rate at a major referral hospital in Rwanda. World J Surg 2015; 40: 784–90.
60 Odhiambo FO, Beynon CM, Ogwang S, et al. Trauma-related mortality among adults in rural western Kenya: characterising deaths using data from a Health and Demographic Surveillance System. PLoS One 2013; 8: e79840.
61 Naish S, Dale P, Mackenzie JS, McBride J, Mengersen K, Tong S. Climate change and dengue: a critical and systematic review of quantitative modelling approaches. BMC Infect Dis 2014; 14: 167.
62 GBD 2015 Child Mortality Collaborators. Global, regional, national, and selected subnational levels of stillbirths, neonatal, infant, and under-5 mortality, 1980–2015: a systematic analysis for the Global Burden of Disease Study 2015. Lancet 2016; 388: 1727–76.
63 GBD 2015 Maternal Mortality Collaborators. Maternal mortality 1990 to 2015: a systematic analysis of the Global Burden of Disease 2015 Study. Lancet 2016; 388: 1777–814.
64 Murray CJL, Ferguson BD, Lopez AD, Guillot M, Salomon JA, Ahmad O. Modifi ed logit life table system: principles, empirical validation, and application. Popul Stud 2003; 57: 165–82.
65 Wang H, Dwyer-Lindgren L, Lofgren KT, et al. Age-specifi c and sex-specifi c mortality in 187 countries, 1970–2010: a systematic analysis for the Global Burden of Disease Study 2010. Lancet 2012; 380: 2071–94.
66 GBD 2013 Mortality and Causes of Death Collaborators. Global, regional, and national age-sex specifi c all-cause and cause-specifi c mortality for 240 causes of death, 1990–2013: a systematic analysis for the Global Burden of Disease Study 2013. Lancet 2015; 385: 117–71.
67 Stouthard ME, Essink-Bot M, Bonsel G, Barendregt J, Kramers P. Disability weights for diseases in the Netherlands. Rotterdam: Department of Public Health, Erasmus University, 1997.
68 UN, Department of Economic and Social Aff airs, Population Division. World Population Prospects: The 2012 Revision, Key Findings and Advance Tables. Working Paper number ESA/P/WP.227. New York: United Nations, 2013.