Library Preparation and Data Analysis Packages for Rapid Genome Sequencing
22
1 Nancy P. Keller and Geoffrey Turner (eds.), Fungal Secondary Metabolism: Methods and Protocols, Methods in Molecular Biology, vol. 944, DOI 10.1007/978-1-62703-122-6_1, © Springer Science+Business Media, LLC 2012 Chapter 1 Library Preparation and Data Analysis Packages for Rapid Genome Sequencing Kyle R. Pomraning, Kristina M. Smith, Erin L. Bredeweg, Lanelle R. Connolly, Pallavi A. Phatale, and Michael Freitag Abstract High-throughput sequencing (HTS) has quickly become a valuable tool for comparative genetics and genomics and is now regularly carried out in laboratories that are not connected to large sequencing cen- ters. Here we describe an updated version of our protocol for constructing single- and paired-end Illumina sequencing libraries, beginning with purified genomic DNA. The present protocol can also be used for “multiplexing,” i.e. the analysis of several samples in a single flowcell lane by generating “barcoded” or “indexed” Illumina sequencing libraries in a way that is independent from Illumina-supported methods. To analyze sequencing results, we suggest several independent approaches but end users should be aware that this is a quickly evolving field and that currently many alignment (or “mapping”) and counting algo- rithms are being developed and tested. Key words: High-throughput sequencing, Solexa/illumina library , Reference genome, Paired-end library , De novo assembly , Barcoding High-throughput DNA sequencing (HTS) is now commonly used to determine the DNA sequence of closely related strains within one species, referred to as “re-sequencing” because a reference genome sequence had been previously determined by more tradi- tional chain termination, or “Sanger,” sequencing. Single- or paired- end re-sequencing has proven useful for identification of SNPs, indels, rearrangements and differences in copy number compared to a reference genome (1–5). Paired-end high-throughput sequenc- ing has also been used as the basis for de novo assembly of previ- ously unknown genome sequences (6–9). De novo assembly from 1. Introduction
-
Upload
independent -
Category
Documents
-
view
2 -
download
0
Transcript of Library Preparation and Data Analysis Packages for Rapid Genome Sequencing
1
Nancy P. Keller and Geoffrey Turner (eds.), Fungal Secondary Metabolism: Methods and Protocols, Methods in Molecular Biology, vol. 944, DOI 10.1007/978-1-62703-122-6_1, © Springer Science+Business Media, LLC 2012
Chapter 1
Library Preparation and Data Analysis Packages for Rapid Genome Sequencing
Kyle R. Pomraning , Kristina M. Smith , Erin L. Bredeweg , Lanelle R. Connolly , Pallavi A. Phatale , and Michael Freitag
Abstract
High-throughput sequencing (HTS) has quickly become a valuable tool for comparative genetics and genomics and is now regularly carried out in laboratories that are not connected to large sequencing cen-ters. Here we describe an updated version of our protocol for constructing single- and paired-end Illumina sequencing libraries, beginning with puri fi ed genomic DNA. The present protocol can also be used for “multiplexing,” i.e. the analysis of several samples in a single fl owcell lane by generating “barcoded” or “indexed” Illumina sequencing libraries in a way that is independent from Illumina-supported methods. To analyze sequencing results, we suggest several independent approaches but end users should be aware that this is a quickly evolving fi eld and that currently many alignment (or “mapping”) and counting algo-rithms are being developed and tested.
Key words: High-throughput sequencing , Solexa/illumina library , Reference genome , Paired-end library , De novo assembly , Barcoding
High-throughput DNA sequencing (HTS) is now commonly used to determine the DNA sequence of closely related strains within one species, referred to as “re-sequencing” because a reference genome sequence had been previously determined by more tradi-tional chain termination, or “Sanger,” sequencing. Single- or paired- end re-sequencing has proven useful for identi fi cation of SNPs, indels, rearrangements and differences in copy number compared to a reference genome ( 1– 5 ) . Paired-end high-throughput sequenc-ing has also been used as the basis for de novo assembly of previ-ously unknown genome sequences ( 6– 9 ) . De novo assembly from
1. Introduction
2 K.R. Pomraning et al.
short paired-end reads is particularly feasible in fi lamentous fungi where small genomes (<100 Mb) are common ( 7, 9 ) . In these cases, the coding portion of the genome is typically well repre-sented, especially in species where the fraction of repetitive DNA is low ( 9 ) because of excision of repeats by recombination or muta-tion by RIP, respectively ( 10 ) . The methods to construct high-throughput sequencing libraries with genomic DNA are essentially the same as those for DNA derived from chromatin immunopre-cipitation (ChIP) or cDNA generated for transcriptome analyses as long as suf fi cient starting material can be produced.
Prior to preparation of a sequencing library, DNA must be isolated and puri fi ed (see http://www.illumina.com/support/documentation.ilmn ; “Genomic DNA Sample Preparation Guide”). Here we begin with puri fi ed genomic DNA as a starting point (Fig. 1 ). We previously published a detailed protocol for the isolation of high-quality genomic DNA from Neurospora crassa ( 11 ) , which we have now also used with Fusarium spp., Trichoderma spp., and Aspergillus nidulans . Genomic DNA, which should fi rst be analyzed for contaminating levels of RNA and if necessary treated with RNase A (see Note 1), must be sheared to near-homogeneous fragment sizes. Three commonly used meth-ods to generate small DNA fragments for HTS library generation are (1) digestion, (2) nebulization, and (3) sonication. For rapid whole-genome sequencing digestion is not suitable because of bias in enzyme recognition sites and enzyme activity. Nebulization has a tendency to generate heterogeneous DNA fragments and results in substantial loss of DNA by vaporization ( 12 ) . Therefore, we describe here shearing of genomic DNA or whole cells by soni-cation with a Bioruptor, which allows us to reproducibly sonicate 24 samples at one time. We also provide an alternative protocol that describes sonication with a standard tip sonicator. In both cases the DNA is sheared almost randomly, generating double strand breaks with blunt ends, as well as 3 ¢ - and 5 ¢ -overhangs. The ends are made fl ush with a mixture of enzymes. A 3 ¢ adenine over-hang is added to make the DNA library compatible for ligation with Illumina sequencing adapters (Table 1 ), which all have 3 ¢ thymine overhangs. After ligation, PCR primers that are compat-ible with the adapter sequences are used to amplify and enrich for successfully ligated DNA (see Note 2).
To drastically reduce sequencing cost, several samples can be combined and sequenced in one lane (“multiplexing”). For a typi-cal ~40 Mb fi lamentous fungal genome, we routinely combine up to four samples in one lane of the Illumina GAIIx, or eight samples in the HiSeq 2000, which generally yield more than 30 or 250 mil-lion total reads per lane, respectively. Divided among four or eight equally loaded samples, this yields more than 7–40 million reads per sample, in our experience suf fi cient to call statistically signi fi cant ChIP-seq peaks and even single point mutations. For de novo

31 Rapid Genome Sequencing
Fig. 1. Work fl ow for rapid genome sequencing. Genomic DNA, ChIPed DNA, or cDNA prepared from RNA is ligated to single-end or paired-end adapters to generate a sequencing library. Sequencing centers generally perform the fi nal “wet lab” (cluster generation and sequencing) and initial computational steps (running the Illumina pipeline) indicated in the gray box . This generates sequence fi les with quality scores, the Illumina output fi les, which are used as input for software programs that either assemble reads de novo (if the genome is unknown) or map reads to a reference genome. Reference genomes are necessary for ef fi cient analysis of ChIP-seq data and for calling mutations, genotyping strains, or other appli-cations. RNA-seq reads can either be assembled de novo, or mapped to a reference set of transcripts or a reference genome. More details on various analysis software can be found in the text.
4 K.R. Pomraning et al.
assembly or transcriptome assembly we do not multiplex on this machine. On the Illumina HiSeq 2000 machine, 100–250 mil-lion reads are generated per lane, so additional samples can be multiplexed.
While Illumina advocates and supports an indexing method that does not reduce the read length (see http://www.illumina.com/support/documentation.ilmn ; “Multiplexing Preparation Guide”), we often use adapters that have a four-nucleotide (nt) “barcode” to “index” each sample, based on an earlier 3-nt system ( 13 ) . The barcode is sequenced as part of a normal read, thus yield-ing a unique four base identi fi er at the beginning of each read that is later used to sort or “parse” reads from the combined sample. This means that each read is reduced by 4 nt, e.g. from 58 to 54 nt on the HiSeq 2000 machine. Barcode sequences have been tested and optimized in various ways. We found problems with certain combinations of nucleotides that resulted in either higher than normal error rates or speci fi c exclusion of some barcodes from cluster generation and/or sequencing, and thus started to balance the sequences of the adapters present in a single lane to yield even numbers of expected calls for all nucleotides in the fi rst four cycles (one example set of four balanced barcodes would be 5 ¢ -ACGT, 5 ¢ -CGTA, 5 ¢ -GTAC, and 5 ¢ -TACG; Table 2 ). Because of the adapter design, the fi fth base of each read is always a T.
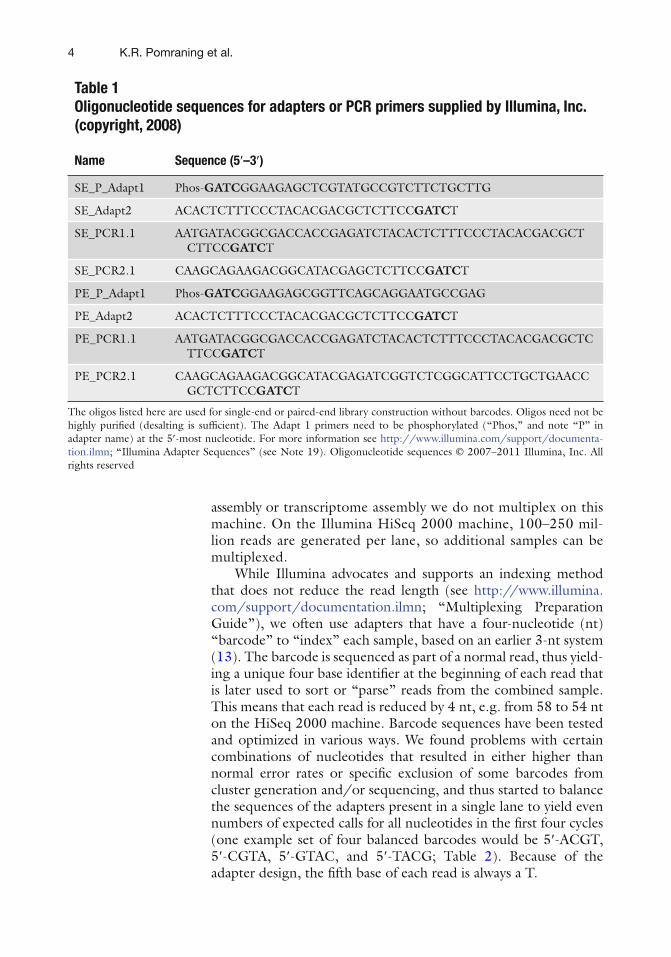
Table 1 Oligonucleotide sequences for adapters or PCR primers supplied by Illumina, Inc. (copyright, 2008)
Name Sequence (5 ¢ –3 ¢ )
SE_P_Adapt1 Phos- GATC GGAAGAGCTCGTATGCCGTCTTCTGCTTG
SE_Adapt2 ACACTCTTTCCCTACACGACGCTCTTCC GATC T
SE_PCR1.1 AATGATACGGCGACCACCGAGATCTACACTCTTTCCCTACACGACGCTCTTCC GATC T
SE_PCR2.1 CAAGCAGAAGACGGCATACGAGCTCTTCC GATC T
PE_P_Adapt1 Phos- GATC GGAAGAGCGGTTCAGCAGGAATGCCGAG
PE_Adapt2 ACACTCTTTCCCTACACGACGCTCTTCC GATC T
PE_PCR1.1 AATGATACGGCGACCACCGAGATCTACACTCTTTCCCTACACGACGCTCTTCC GATC T
PE_PCR2.1 CAAGCAGAAGACGGCATACGAGATCGGTCTCGGCATTCCTGCTGAACCGCTCTTCC GATC T
The oligos listed here are used for single-end or paired-end library construction without barcodes. Oligos need not be highly puri fi ed (desalting is suf fi cient). The Adapt 1 primers need to be phosphorylated (“Phos,” and note “P” in adapter name) at the 5 ¢ -most nucleotide. For more information see http://www.illumina.com/support/documenta-tion.ilmn ; “Illumina Adapter Sequences” (see Note 19). Oligonucleotide sequences © 2007–2011 Illumina, Inc. All rights reserved
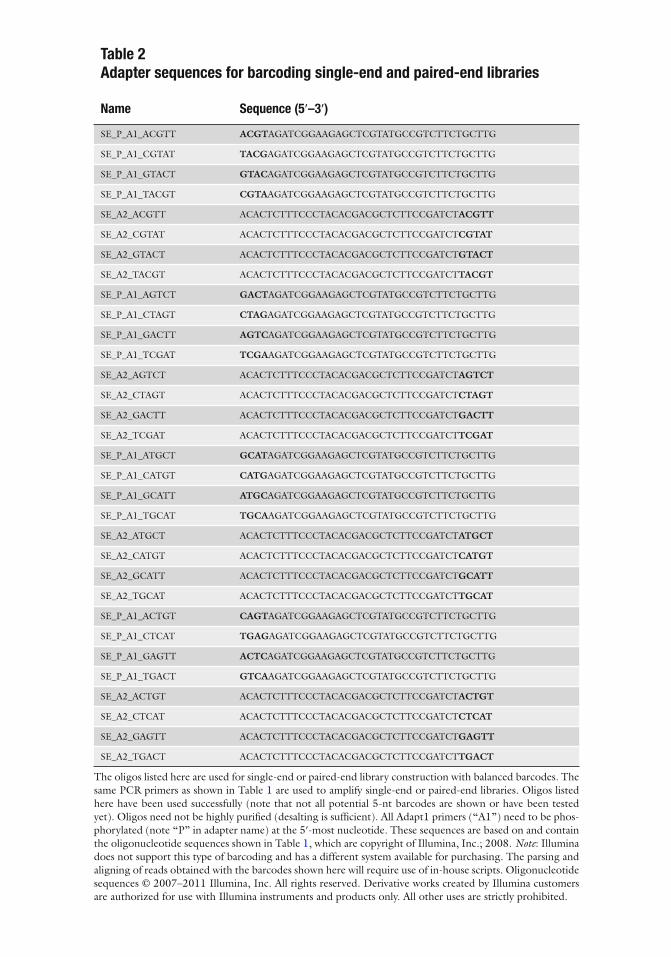
Table 2 Adapter sequences for barcoding single-end and paired-end libraries
Name Sequence (5 ¢ –3 ¢ )
SE_P_A1_ACGTT ACGT AGATCGGAAGAGCTCGTATGCCGTCTTCTGCTTG
SE_P_A1_CGTAT TACG AGATCGGAAGAGCTCGTATGCCGTCTTCTGCTTG
SE_P_A1_GTACT GTAC AGATCGGAAGAGCTCGTATGCCGTCTTCTGCTTG
SE_P_A1_TACGT CGTA AGATCGGAAGAGCTCGTATGCCGTCTTCTGCTTG
SE_A2_ACGTT ACACTCTTTCCCTACACGACGCTCTTCCGATCT ACGTT
SE_A2_CGTAT ACACTCTTTCCCTACACGACGCTCTTCCGATCT CGTAT
SE_A2_GTACT ACACTCTTTCCCTACACGACGCTCTTCCGATCT GTACT
SE_A2_TACGT ACACTCTTTCCCTACACGACGCTCTTCCGATCT TACGT
SE_P_A1_AGTCT GACT AGATCGGAAGAGCTCGTATGCCGTCTTCTGCTTG
SE_P_A1_CTAGT CTAG AGATCGGAAGAGCTCGTATGCCGTCTTCTGCTTG
SE_P_A1_GACTT AGTC AGATCGGAAGAGCTCGTATGCCGTCTTCTGCTTG
SE_P_A1_TCGAT TCGA AGATCGGAAGAGCTCGTATGCCGTCTTCTGCTTG
SE_A2_AGTCT ACACTCTTTCCCTACACGACGCTCTTCCGATCT AGTCT
SE_A2_CTAGT ACACTCTTTCCCTACACGACGCTCTTCCGATCT CTAGT
SE_A2_GACTT ACACTCTTTCCCTACACGACGCTCTTCCGATCT GACTT
SE_A2_TCGAT ACACTCTTTCCCTACACGACGCTCTTCCGATCT TCGAT
SE_P_A1_ATGCT GCAT AGATCGGAAGAGCTCGTATGCCGTCTTCTGCTTG
SE_P_A1_CATGT CATG AGATCGGAAGAGCTCGTATGCCGTCTTCTGCTTG
SE_P_A1_GCATT ATGC AGATCGGAAGAGCTCGTATGCCGTCTTCTGCTTG
SE_P_A1_TGCAT TGCA AGATCGGAAGAGCTCGTATGCCGTCTTCTGCTTG
SE_A2_ATGCT ACACTCTTTCCCTACACGACGCTCTTCCGATCT ATGCT
SE_A2_CATGT ACACTCTTTCCCTACACGACGCTCTTCCGATCT CATGT
SE_A2_GCATT ACACTCTTTCCCTACACGACGCTCTTCCGATCT GCATT
SE_A2_TGCAT ACACTCTTTCCCTACACGACGCTCTTCCGATCT TGCAT
SE_P_A1_ACTGT CAGT AGATCGGAAGAGCTCGTATGCCGTCTTCTGCTTG
SE_P_A1_CTCAT TGAG AGATCGGAAGAGCTCGTATGCCGTCTTCTGCTTG
SE_P_A1_GAGTT ACTC AGATCGGAAGAGCTCGTATGCCGTCTTCTGCTTG
SE_P_A1_TGACT GTCA AGATCGGAAGAGCTCGTATGCCGTCTTCTGCTTG
SE_A2_ACTGT ACACTCTTTCCCTACACGACGCTCTTCCGATCT ACTGT
SE_A2_CTCAT ACACTCTTTCCCTACACGACGCTCTTCCGATCT CTCAT
SE_A2_GAGTT ACACTCTTTCCCTACACGACGCTCTTCCGATCT GAGTT
SE_A2_TGACT ACACTCTTTCCCTACACGACGCTCTTCCGATCT TGACT
The oligos listed here are used for single-end or paired-end library construction with balanced barcodes. The same PCR primers as shown in Table 1 are used to amplify single-end or paired-end libraries. Oligos listed here have been used successfully (note that not all potential 5-nt barcodes are shown or have been tested yet). Oligos need not be highly puri fi ed (desalting is suf fi cient). All Adapt1 primers (“A1”) need to be phos-phorylated (note “P” in adapter name) at the 5 ¢ -most nucleotide. These sequences are based on and contain the oligonucleotide sequences shown in Table 1 , which are copyright of Illumina, Inc.; 2008. Note : Illumina does not support this type of barcoding and has a different system available for purchasing. The parsing and aligning of reads obtained with the barcodes shown here will require use of in-house scripts. Oligonucleotide sequences © 2007–2011 Illumina, Inc. All rights reserved. Derivative works created by Illumina customers are authorized for use with Illumina instruments and products only. All other uses are strictly prohibited.
6 K.R. Pomraning et al.
There are few labs with access to their own HTS machines. In most cases sequencing libraries will be processed for sequencing by dedicated staff in sequencing centers or private companies. Thus we do not elaborate on the Illumina cluster generation and sequencing steps (Fig. 1 ). We wish to emphasize that investment in computational hardware and personnel “know-how” is essential to successfully undertake whole-genome sequencing approaches. Here, we do not go into details with regard to the downstream handling of sequencing data, for two reasons: (1) Currently the processing pipelines supplied by Illumina change frequently as throughput increases every few months and (2) new and drasti-cally improved analysis tools become available or are being updated almost monthly. Thus, we provide only brief outlines for how to prepare for the fl ood of sequencing data but we do not recom-mend speci fi c software. Instead we focus on the part of the sequencing that is most in fl uenced by the end user of this technol-ogy, the preparation and troubleshooting of Illumina sequencing libraries.
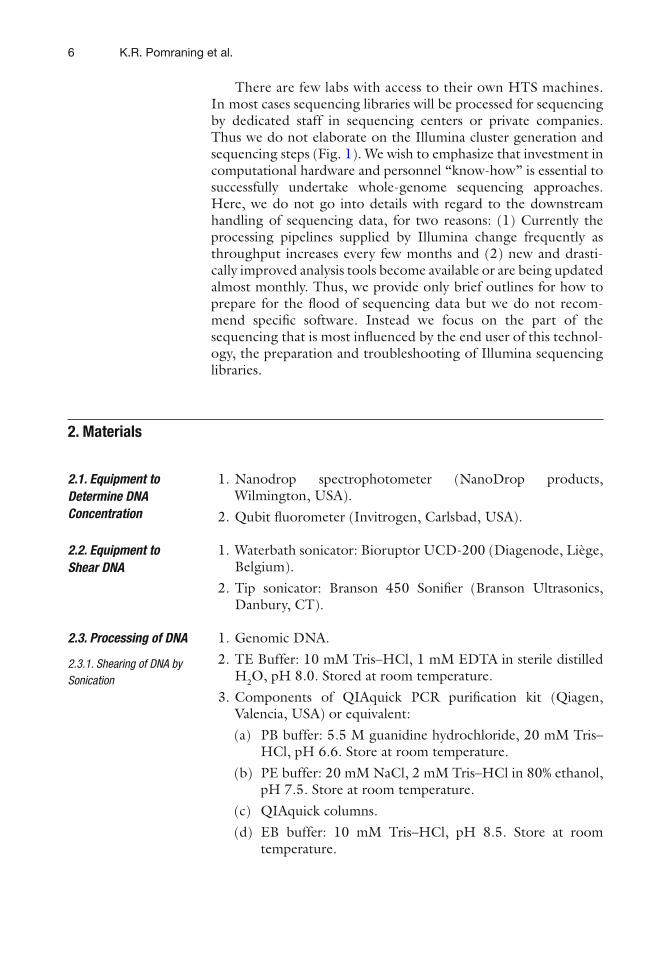
1. Nanodrop spectrophotometer (NanoDrop products, Wilmington, USA).
2. Qubit fl uorometer (Invitrogen, Carlsbad, USA).
1. Waterbath sonicator: Bioruptor UCD-200 (Diagenode, Liège, Belgium).
2. Tip sonicator: Branson 450 Soni fi er (Branson Ultrasonics, Danbury, CT).
1. Genomic DNA. 2. TE Buffer: 10 mM Tris–HCl, 1 mM EDTA in sterile distilled
H 2 O, pH 8.0. Stored at room temperature. 3. Components of QIAquick PCR puri fi cation kit (Qiagen,
Valencia, USA) or equivalent: (a) PB buffer: 5.5 M guanidine hydrochloride, 20 mM Tris–
HCl, pH 6.6. Store at room temperature. (b) PE buffer: 20 mM NaCl, 2 mM Tris–HCl in 80% ethanol,
pH 7.5. Store at room temperature. (c) QIAquick columns. (d) EB buffer: 10 mM Tris–HCl, pH 8.5. Store at room
temperature.
2. Materials
2.1. Equipment to Determine DNA Concentration
2.2. Equipment to Shear DNA
2.3. Processing of DNA
2.3.1. Shearing of DNA by Sonication
71 Rapid Genome Sequencing
1. Sheared genomic DNA. 2. 10× T4 DNA ligase buffer: 500 mM Tris–HCl, 100 mM
MgCl 2 , 100 mM dithiothreitol 10 mM ATP, pH 7.5 (New England Biolabs [NEB], Ipswich, USA) (see Note 4).
3. dNTPs (20 mM of each nucleotide, i.e. mix 20 m l each of 100 mM dATP, dCTP, dGTP, dTTP, and H 2 O).
4. T4 DNA polymerase, 3 units/ m L (NEB). 5. DNA polymerase I, large (Klenow) fragment, 5 units/ m L
(NEB). 6. T4 polynucleotide kinase, 10 units/ m L (NEB). 7. Components of QIAquick puri fi cation kits ( see Subheading 2.3.1 ,
items a–d; Qiagen).
1. End-repaired, sheared DNA. 2. 10× NEBuffer 2: 500 mM NaCl, 100 mM Tris–HCl, 100 mM
MgCl 2 , 10 mM dithiothreitol, pH 7.9 (NEB). 3. 1 mM dATP. 4. DNA polymerase I, large (Klenow) fragment (3 ¢ → 5 ¢ exo - ),
5 units/ m L (NEB). 5. Components of QIAquick and MinElute puri fi cation kits
(see Subheading 2.3.1 , items a, b, d; Qiagen) or equivalent. 6. MinElute columns (Qiagen).
1. A-tailed, end-repaired, sheared DNA. 2. Single-end (SE) and paired-end (PE) library adapters (Table 1 )
or SE barcode adapters (Table 2 ): mix 5 m M of each of two oligonucleotides in sterile distilled H 2 O. To anneal adapters, boil for 2 min (min) in a heat block and allow to cool for 30 min at room temperature. Store annealed adapters at −20°C.
3. T4 DNA ligase, 400 units/ m L (NEB). 4. NuSieve GTG low melting temperature agarose (Lonza,
Walkersville, USA). 5. TAE buffer: 40 mM Tris, 20 mM acetate, 1 mM EDTA. To
make 50× stock, dissolve 242 g Tris base in water, add 57.1 mL glacial acetic acid, 100 mL of 500 mM EDTA (pH 8.0), and bring the fi nal volume to 1 L. Store at 20°C.
6. Ethidium bromide solution (stocks of 10 mg/mL, use 5–10 m L stock for 100 mL of gel).
7. 5× DNA gel loading buffer: 125 mg bromophenol blue, 125 mg xylene cyanol, 25 mL of 0.2 M EDTA (pH 8.0), 15 mL glycerol, 10 mL H 2 O.
8. DNA ladder able to resolve 100–1,000 bp (e.g., Qiagen GelPilot 1 kb Plus Ladder, #239095).
2.3.2. End Repair of Sheared DNA Fragments (See Note 3)
2.3.3. Addition of A-Overhang
2.3.4. Ligation of Sequencing Adapters
8 K.R. Pomraning et al.
9. Glass microscope cover slips. 10. Components of QIAquick Gel Extraction and PCR puri fi cation
kits (see Subheading 2.3.1 , items b–d; Qiagen) or equivalent. 11. QG buffer: 5.5 M guanidine thiocyanate, 20 mM Tris–HCl,
pH 6.6. Store at room temperature (Qiagen). 12. Isopropanol.
1. DyNAzyme II DNA polymerase, 2 units/ m L (Finnzymes, Vantaa, Finland).
2. 10× buffer for DyNAzyme II DNA polymerase (Finnzymes): 100 mM Tris–HCl (pH 8.8), 15 mM MgCl 2 , 500 mM KCl, 1% Triton X-100.
3. Single-end (SE) and paired-end (PE) library PCR ampli fi cation primers (Table 1 ); Dpn II sites are indicated in bold): mix 5 m M each in H 2 O. Store at −20°C.
4. 2× Phusion Flash master mix: 1 unit/ m L Phusion Flash High-Fidelity polymerase, 50 mM TAPS-HCl (pH 9.3), 100 mM KCl, 3 mM MgCl 2 , 2 mM b -mercaptoethanol, 400 m M of dATP, dCTP, dGTP, and dTTP (NEB).
The two tables contain Illumina oligonucleotide sequences (Table 1 ; these oligonucleotide sequences are copyright of Illumina, Inc.; 2008) or barcode adapter sequences for construction of indexed single-end libraries (Table 2 ).
All procedures are carried out at room temperature unless other-wise noted.
1. Adjust the water bath temperature of the Bioruptor to 4°C prior to sonication (see Note 5).
2. Melt a 1% agarose gel and a 2% NuSieve low melting tempera-ture agarose gel in TAE buffer and cool to 55°C. Add ethidium bromide to 0.5 m g/mL and pour in separate gel casting trays prior to sonication. When the gels are cool, place in separate electrophoresis chambers and cover with TAE buffer.
3. Dilute 5 m g puri fi ed genomic DNA into 100 m L TE buffer in an Eppendorf tube (recommended: VWR 87003-294; see Note 6).
4. Place the Eppendorf tube with DNA in the Bioruptor and son-icate on high for 20 min total with 30 s of sonication followed by 30 s of rest ( T 1 = 20 min, T 2 = 30 s, T 3 = 30 s).
2.3.5. Ampli fi cation of Sequencing Library
2.3.6. Oligonucleotide Sequences
3. Methods
3.1. Shearing of DNA by Sonication
91 Rapid Genome Sequencing
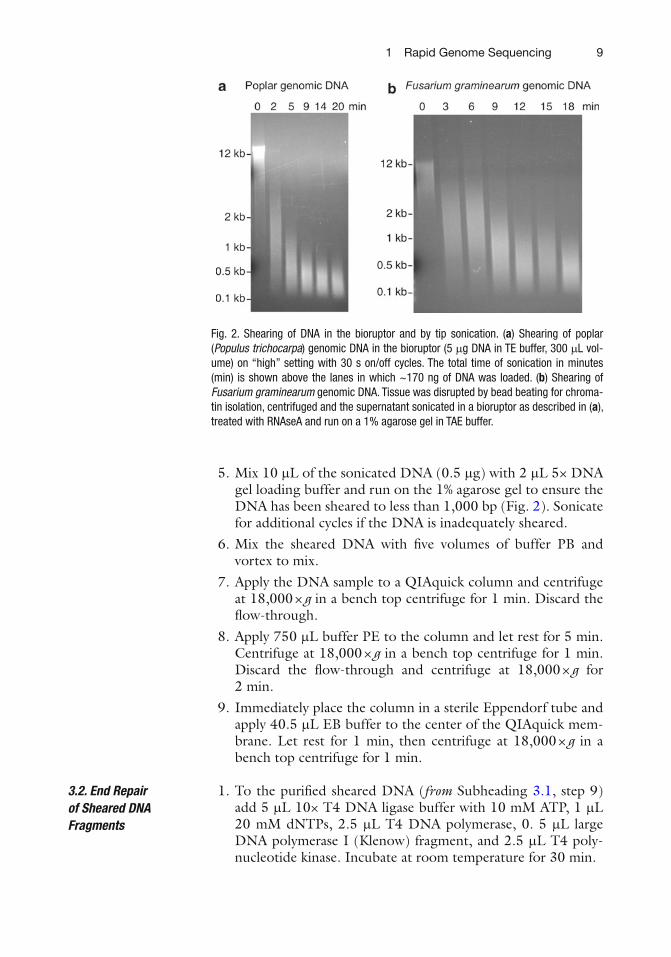
5. Mix 10 m L of the sonicated DNA (0.5 m g) with 2 m L 5× DNA gel loading buffer and run on the 1% agarose gel to ensure the DNA has been sheared to less than 1,000 bp (Fig. 2 ). Sonicate for additional cycles if the DNA is inadequately sheared.
6. Mix the sheared DNA with fi ve volumes of buffer PB and vortex to mix.
7. Apply the DNA sample to a QIAquick column and centrifuge at 18,000 × g in a bench top centrifuge for 1 min. Discard the fl ow-through.
8. Apply 750 m L buffer PE to the column and let rest for 5 min. Centrifuge at 18,000 × g in a bench top centrifuge for 1 min. Discard the fl ow-through and centrifuge at 18,000 × g for 2 min.
9. Immediately place the column in a sterile Eppendorf tube and apply 40.5 m L EB buffer to the center of the QIAquick mem-brane. Let rest for 1 min, then centrifuge at 18,000 × g in a bench top centrifuge for 1 min.
1. To the puri fi ed sheared DNA ( from Subheading 3.1 , step 9) add 5 m L 10× T4 DNA ligase buffer with 10 mM ATP, 1 m L 20 mM dNTPs, 2.5 m L T4 DNA polymerase, 0. 5 m L large DNA polymerase I (Klenow) fragment, and 2.5 m L T4 poly-nucleotide kinase. Incubate at room temperature for 30 min.
3.2. End Repair of Sheared DNA Fragments
Fig. 2. Shearing of DNA in the bioruptor and by tip sonication. ( a ) Shearing of poplar ( Populus trichocarpa ) genomic DNA in the bioruptor (5 m g DNA in TE buffer, 300 m L vol-ume) on “high” setting with 30 s on/off cycles. The total time of sonication in minutes (min) is shown above the lanes in which ~170 ng of DNA was loaded. ( b ) Shearing of Fusarium graminearum genomic DNA. Tissue was disrupted by bead beating for chroma-tin isolation, centrifuged and the supernatant sonicated in a bioruptor as described in ( a ), treated with RNAseA and run on a 1% agarose gel in TAE buffer.

10 K.R. Pomraning et al.
2. Stop the reaction by adding 250 m L buffer PB. Vortex to mix. 3. Apply the DNA sample to a QIAquick column and centrifuge
at 18,000 × g in a bench top centrifuge for 1 min. Discard the fl ow-through.
4. Apply 750 m L buffer PE to the column and let rest for 5 min. Centrifuge at 18,000 × g in a bench top centrifuge for 1 min. Discard the fl ow-through and centrifuge at 18,000 × g for 2 min.
5. Immediately place the column in a sterile Eppendorf tube and apply 34 m L EB buffer to the center of the QIAquick mem-brane. Let rest for 1 min, then centrifuge at 18,000 × g in a bench top centrifuge for 1 min.
1. To the puri fi ed sheared and end-repaired DNA ( from Subheading 3.2 , step 5), add 5 m L 10× NEBuffer 2, 10 m L 1 mM dATP, and 3 m L DNA polymerase I Klenow fragment (3 ¢ → 5 ¢ exo - ). Incubate at 37°C for 30 min.
2. Stop the reaction by adding 250 m L buffer PB. Vortex to mix. 3. Apply the DNA sample to a MinElute column and centrifuge
at 18,000 × g in a bench top centrifuge for 1 min. Discard the fl ow-through.
4. Apply 750 m L buffer PE to the column and let rest for 5 min. Centrifuge at 18,000 × g in a bench top centrifuge for 1 min. Discard the fl ow-through and centrifuge at 18,000 × g for 1 min.
5. Immediately place the column in a sterile Eppendorf tube and apply 17 m L EB buffer to the center of the MinElute mem-brane. Let rest for 1 min, then centrifuge at 18,000 × g in a bench top centrifuge for 1 min.
1. To the puri fi ed sheared, end-repaired, and tailed DNA ( from Subheading 3.3 , step 5), add 2 m L 10× T4 ligase buffer with 10 mM dATP, 1 m L of 5 m M library adapters (non-barcoded single- or paired-end adapters, Table 1 ; barcoded single-end adapters, Table 2 ) and 1 m L T4 DNA ligase (see Note 7). Incubate at room temperature for 20 min.
2. Stop the reaction by mixing ligated DNA with 4 m L 5× DNA gel loading buffer.
3. Load the ligated DNA on the 2% NuSieve low melting tem-perature agarose gel. Use DNA ladder to resolve 100–1,000 bp and run for ~45 min at 100 V (see Note 8).
4. View the gel on a UV transilluminator and excise a gel frag-ment between 250 and 350 bp with a clean glass cover slip (Fig. 3a ; see Note 9).
3.3. Addition of A-Overhang
3.4. Ligation of Sequencing Adapters

111 Rapid Genome Sequencing
Fig. 3. Preparation of genomic and ChIP paired-end sequencing libraries. ( a ) Neurospora crassa genomic DNA was sonicated with a tip sonicator (see Note 5), and libraries were generated as described. Two replicates were done in parallel and loaded on a 2% NuSieve agarose gel for DNA isolation ( left panel ). Two fractions were removed from the gel (250–325 bp, “small”; 325–500 bp, “large”). We do this to insure that we have library material for future PCRs even in cases when library ampli fi cations fail or other unforeseen dif fi culties arise. ( b ) Three parallel PCR ampli fi cations of the small insert libraries shown in ( a ) (5 m L of 35 m L were loaded). Note the presence of adapter and PCR primer bands. ( c ) Example of construction of ChIP-seq libraries. After ligation of adapters (“AdaptLig”) the library is invis-ible on the gel (but note the presence of adapter bands below 100 bp). After excision of the bands and extraction of DNA from the gel (Qiagen gel extraction kit), PCR reactions that are puri fi ed (Qiagen PCR puri fi cation kit) typically yield slightly smeary library bands (“clean”) but no bands <200 bp. It is important to adjust the adapter:DNA ratio to ~10:1. In cases of great adapter excess, which can be a problem with ChIP-seq library generation, spurious bands are observed. Paired-end adapters run at ~160 bp and single-end adapters run at ~110 bp (“contamination,” see arrow ). We would not subject the library in the right-most lane to sequencing as the amount of contamination present will signi fi cantly reduce the number of useable reads, because most reads will be adapter sequence instead of insert.
12 K.R. Pomraning et al.
5. Extract DNA with a QIAquick gel extraction kit: Weigh the gel slice and mix with three volumes of QG buffer in an Eppendorf tube. Melt the gel at 50°C for ~10 min with vor-texing every 3 min (see Note 10).
6. To increase recovery of small DNA fragments, add a volume of isopropanol equivalent to one gel slice volume, vortex to mix, and apply the sample to a QIAquick column. Centrifuge at 18,000 × g in a bench top centrifuge for 1 min. Discard the fl ow-through.
7. Apply 750 m L buffer PE to the column and let rest for 5 min. Centrifuge at 18,000 × g in a bench top centrifuge for 1 min. Repeat the PE wash. Discard the fl ow-through and centrifuge at 18,000 × g for 2 min (see Note 11).
8. Immediately place the column in a sterile Eppendorf tube and apply 50 m L EB buffer to the center of the QIAquick mem-brane. Let rest for 1 min, then centrifuge at 18,000 × g in a bench top centrifuge for 1 min. This constitutes the non-ampli fi ed Illumina sequencing library.
1. Test a range of cycle numbers to determine the optimum number of PCR cycles to amplify the sequencing library (see Note 12).
2. Mix 14.75 m L H 2 O, 1 m L library DNA, 2 m L 10× DyNAzyme buffer, 0.25 m L of 20 mM dNTPs, 1.5 m L of 5 m M library ampli fi cation primers, and 0.5 m L DyNAzyme (see Note 13) for each number of cycles to be tested and amplify using the following protocol on a thermocycler: (a) 180 s at 94°C. (b) 30 s at 94°C. (c) 30 s at 60°C. (d) 60 s at 72°C. (e) Repeat (b) to (d) for 15, 18, or 21 cycles. (f) 300 s at 72°C.
3. Melt a 2% agarose gel in TAE buffer and cool to 55°C. Add ethidium bromide to 0.5 m g/mL and pour in a gel casting tray. When the gel cools, place in an electrophoresis chambers and cover with TAE buffer.
4. Mix the PCR reactions with 4 m L of 5× DNA gel loading buf-fer and load into the 2% agarose gel wells next to a DNA ladder able to resolve 100–1,000 bp and run for 45 min at 100 V.
5. View the gel on a UV transilluminator. The appropriate num-ber of cycles results in a just visible DNA smear of ~50–100 bp greater than the size excised earlier (primers add 53 bp to the adapter ligated fragments; Notes 14 and 15).
3.5. Ampli fi cation of Sequencing Library
131 Rapid Genome Sequencing
6. After the appropriate number of cycles has been determined, amplify the DNA libraries in three separate reactions with 1–5 m L template DNA. Try to minimize the number of cycles necessary (Fig. 3b ; Note 16).
7. Mix 8.5 m L template DNA and H 2 O, 1.5 m L of 5 m M of each library ampli fi cation primers (SE_PCR1.1. and SE_PCR2.1. or PE_PCR1.1. and PE_PCR2.1.; Table 1 ) and 10 m L 2× Phusion Flash master mix. Amplify the library in three separate reactions using the following protocol on a Thermocycler (see Note 17): (a) 30 s at 98°C. (b) 10 s at 98°C. (c) 30 s at 65°C. (d) 30 s at 72°C. (e) Repeat steps b–d for the number of cycles determined. (f) 300 s at 72°C.
8. Pool the three reactions in an Eppendorf tube and add 300 m L buffer PB. Vortex to mix.
9. Apply the DNA sample to a QIAquick column and centrifuge at 18,000 × g in a bench top centrifuge for 1 min. Discard the fl ow-through.
10. Apply 750 m L buffer PE to the column and let rest for 5 min. Centrifuge at 18,000 × g in a bench top centrifuge for 1 min. Discard the fl ow-through and centrifuge at 18,000 × g for 2 min.
11. Immediately place the column in a sterile Eppendorf tube and apply 32 m L EB buffer to the center of the QIAquick mem-brane. Let rest for 1 min, then centrifuge at 18,000 × g in a bench top centrifuge for 1 min.
12. Melt a 2% agarose gel in TAE buffer and cool to 55°C. Add ethidium bromide to 0.5 m g/mL and pour in a gel casting tray. When the gel cools, place in an electrophoresis chamber and cover with TAE buffer.
13. Mix 5 m L of the puri fi ed PCR reactions with 5 m L of 1× DNA gel loading buffer and load into the 2% agarose gel wells next to a DNA ladder able to resolve 100–1,000 bp and run for 45 min at 100 V.
14. View the gel on a UV transilluminator. Only the library smear should be visible now, and no bands lower than 200 bp are expected (Figs. 3c and 4d ).
15. Quantify the library by using a Qubit fl uorometer or by quantitative PCR with the Illumina sequencing primers (see Note 18).
14 K.R. Pomraning et al.
16. Dilute the sample in buffer EB to a concentration recom-mended by your core laboratory or sequencing company of choice.
Illumina software pipelines generate fi les of several formats, the most useful being “sequence.txt” fi les, which contain sequence and quality scores, and ELAND or bam fi les, which also contain the start and stop positions (or “coordinates”) speci fi c reads map to in reference genomes (see http://www.illumina.com/support/documentation.ilmn ). Pre-analysis of raw data directly from the sequencer is typically run by core facilities or companies who provide the actual sequencing services, and this relies on proprietary Illumina software. File types supported by software for post-sequencing analysis vary, and so does their input and output fi le types. For this reason, familiarity with the program manuals is required and they should be consulted frequently for updated information.
Older pipelines of Illumina Genome Analyzers generated a different set of fi les than the current pipeline (CASAVA 1.8). Illumina CASAVA 1.7, for example, still used with the Illumina GAIIx machines, relies on analysis by the Illumina GERALD pack-age to generate a comprehensive fi le “sequence.txt” of all the reads and quality score. Files of the format “sequence.txt” contain each read in a 4-line format: header, read, header, quality score. The header has information about the location on the fl ow cell from which the read was collected, the read consists of base calls made by the software analysis of the images, and the quality score has information about the probability of a base call being wrong. In this pipeline, quality scores are in a phred scale 64 Illumina-type offset format. The newer version, CASAVA 1.8, which is required for the higher throughputs on HiSeq 2000 machines, has been changed in several ways including the available output formats. Now, archival bam fi les and a collection of compressed fastq fi les are the primary source of total sequence reads. CASAVA 1.8 also uses different, Sanger-type quality scores, which are in phred scale 33 offset in ASCII format.
Many freely available programs will take Illumina “sequence.txt” fi les as input, such as Bowtie ( 14 ) and Velvet ( 15 ) . There are tools available to convert sequence.txt fi les into fastq and other desired formats, when necessary. Some, such as MAQ ( 16 ) , have these scripts built into a comprehensive package. Similar tools for quality score conversion are available through the BioPerl project for the savvy programmer ( http://www.bioperl.org ), and the Java-based Vancouver Short Read Analysis package, which also converts between popular formats ( http://vancouvershortr.sourceforge.net ). When samples are not barcoded for multiplexing samples, the GERALD output of CASAVA 1.7, or the compressed fastq fi les of CASAVA 1.8 may be used directly as input for downstream applications.
3.6. Post-sequencing Data Analyses
151 Rapid Genome Sequencing
This is slightly more challenging when several distinct samples are run in one lane of a fl owcell (multiplexing), as “barcoded” or “indexed” samples. In this case, several fi les need to be generated, grouped by the barcodes. Multiplexed samples prepared with pro-prietary Illumina indexing kits are supported by the CASAVA 1.8 software and thus can easily be separated into different fi les accord-ing to the barcode; the barcode sequence is automatically removed in this process. The barcoding scheme we mention here, however, may require one additional concatenation step of the many CASAVA 1.8 output fi les to combine the contents of a lane into one single huge, unwieldy fi le. Alternatively, and likely more con-venient, the many CASAVA 1.8 output fi les can be used as input for sorting by barcode, followed by concatenation of the appropri-ate fi les. Both approaches require additional scripts for parsing of reads according to barcodes and removal of the barcode sequences prior to read mapping. Some institutions may have in-house soft-ware available for sorting and removal of barcodes but there are also freely available tools, such as “NovoBarCode” (novoalign package from Novocraft Technologies; http://www.novocraft.com/main/index.php ). The goal of the sequencing will determine subsequent steps and fi le formats or conversions necessary. Prior to undertaking an analysis project, perhaps even the sequencing itself, it is recommended that users become comfortable with the com-mand line interface and basic scripting, and read program manuals available online. For most of the software packages user groups are available that can advise on speci fi c problems. The Seqanswers forum ( http://seqanswers.com ) is particularly useful for keeping up to date with constantly changing formats and software.
A variety of open source programs for de novo assembly of genomes are available and are being improved regularly. Some of the more popular programs have been compared on identical datasets and are reviewed elsewhere ( 17 ) . Most rely on the construction of a De Bruijn graph and differ primarily in their error correction steps. The authors have used Velvet ( 15 ) and its many updates to assem-ble fungal genomes ( 9 ) , but other state of the art short read assem-blers including ABySS ( 18 ) , QSRA ( 19, 20 ) , SOAPdenovo ( 21 ) , Ray ( 22 ) , and others described in ref. ( 17 ) promise to improve the speed and accuracy of assembly from short reads.
Short read sequence alignment programs are useful for identifying single nucleotide polymorphisms (SNPs), indels, and rearrange-ments in organisms genetically similar to a reference sequence. The programs map each read to a reference genome and allow the user to specify a variety of options including the number of mismatches allowed per read and whether reads are mapped to a single match in the genome or all possible perfect matches in the reference genome if identical kmer repeats exist; kmer refers to a speci fi c
3.6.1. De Novo Assembly Software
3.6.2. Discovery of SNPs, Insertion/Deletions (Indels), and Genome Rearrangements for Mutation Mapping

16 K.R. Pomraning et al.
determined length, i.e. 36mer. If the algorithm uses quality score values it is essential that the user specify the appropriate quality score scale. Popular open source programs for read alignment include SOAP ( 23 ) , MAQ ( 16 ) , Bowtie ( 14 ) , BWA ( 24 ) , CASHX ( 25 ) , and Stampy ( 26 ) . While some programs such as MAQ include SNP and indel analysis, others, like Bowtie, require additional anal-ysis by a package such as SAMtools ( 27 ) to call variants. We have used these approaches to fi nd single-point mutations in several fungal genomes, for example, see ( 5 ) . Deciding which software program to use for read alignment may depend on computational power available versus what is required, which depends on the size of your genome and amount of sequence data.
The analysis of ChIP-seq data begins with aligning reads to a refer-ence genome using one of the software packages mentioned above. How regions of enrichment are determined depends on the target of immunoprecipitation. In some cases, such as centromere pro-teins with localization to de fi ned regions of each chromosome, sta-tistical analysis of enrichment levels is not crucial ( 28 ) . In the case of transcription factors, however, enriched regions must be called with software that uses statistical tools to assign a con fi dence level to each of the identi fi ed peaks ( 29 ) . Different software packages are designed speci fi cally to analyze localized binding, e.g. by tran-scription factors, versus diffuse binding, e.g. by histones and their modi fi cations. We have used our own scripts in the past to call enrichment peaks ( 28, 29 ) but have also used MACS ( 30 ) , a package which uses binomial peak identi fi cation to build a model of transcription factor binding. Diffuse binding seen in ChIP of histone modi fi cations or other chromatin proteins requires a pack-age such as SICER ( 31 ) or RSEG ( 32 ) , which identify domains of enrichment spanning multiple nucleosomes, rather than discrete peaks. A wide variety of open source peak fi nding programs exist, and new additions and updates are frequent. If a genome assembly and gene annotations are available, visual con fi rmation of identi fi ed peaks in a browser like IGV ( www.broadinstitute.org/igv/ ), GenomeView ( http://genomeview.org/ ), or gbrowse ( http://gmod.org/wiki/GBrowse ) can be used to re fi ne the settings and adjustable parameters of the program.
Transcriptome sequencing by analysis of cDNA, or “RNA-seq,” is performed to identify expressed genes from an organism with no reference genome, or in a quantitative way to identify differential expression between two or more conditions. If a reference genome is unavailable, RNA-seq reads must be assembled into contigs with Velvet ( 15 ) or SOAPdenovo ( 21 ) , or any of the other de novo assemblers described above. If a reference genome is available, RNA-seq reads are mapped to the genome with an aligner that can fi nd splice junctions. These include SOAP ( 23 ) , Tophat ( 33 ) , and
3.6.3. Analysis of ChIP-Sequencing and MeDIP-Sequencing Data
3.6.4. Analysis of Transcriptomes
171 Rapid Genome Sequencing
BWA ( 24 ) . Other programs are designed speci fi cally to identify novel intron/exon junctions ( 20 ) . Counting cDNA tags from dif-ferent samples and replicate experiments to generate comparable datasets that give meaningful results is challenging. To quantify transcript levels and call differential expression between two sam-ples, statistical tools have been developed, including DEseq ( 34 ) , Cuf fl inks ( 35, 36 ) , and GENEcounter ( 37 ) but this fi eld is still very much in fl ux.
1. When generating libraries from pooled DNA samples (e.g., to do bulk segregant analyses) it is essential that an equal amount of DNA from each strain be used. If different amounts of RNA are present in different samples this will affect the measured amount of nucleic acids and underestimate the amount of DNA in some samples. Imbalances in the concentration of the DNA pool are sometimes signi fi cant enough to affect muta-tion mapping. While presence of RNA will reduce the effective DNA concentration this is not a problem with library con-struction of non-pooled samples.
2. DNA shearing, end repair, A-overhang addition, ligation, and the subsequent gel extraction should be performed in a single day for best ligation ef fi ciency. Ligated DNA can be stored at −20°C and ampli fi ed by PCR at any time prior to Illumina sequencing cluster generation. The incubation steps prior to ligation are short so plan ahead and thaw buffers for the next reaction during the incubation so that the next step can be performed immediately.
3. Several manufacturers now offer kits that contain all or most enzymes required for library preparation (e.g., NEB #E6040, contains all required enzymes; NEB Quick-Blunting kit #E1201 or Epicentre End-It end-repair kit #ER0720, contain enzymes for blunting reactions). In our hands both kits and individual enzymes work equally well. We typically use enzymes from NEB but enzymes from other suppliers can be used. Compare units/ m l (e.g., Invitrogen T4 ligase is typically less concentrated than NEB T4 ligase, so we use 2.5 m l of this enzyme).
4. Ligase buffer can be prepared fresh or premade buffers from several manufacturers can be used, e.g. 10× ligase buffer from NEB or 5× ligase buffer from Invitrogen: 250 mM Tris–HCl (pH 7.6), 50 mM MgCl 2 , 5 mM ATP, 5 mM DTT, 25% (w/v) polyethylene glycol (8000). No differences in library construc-tion were observed when different buffers were used.
4. Notes

18 K.R. Pomraning et al.
5. Instead of the Bioruptor, tip sonicators can be used, e.g. a Branson 450 soni fi er equipped with a microtip. Genomic DNA is sonicated with fi ve 10-s pulses with 30 s rest on ice between repeats (settings: output 1.2, duty cycle 80%).
6. The stiffness of the Eppendorf tube impacts shearing ef fi ciency. Always use the same brand of tubes once a reliable Bioruptor protocol has been established. Volumes of 100–300 m L can be used in standard Eppendorf tubes in the Bioruptor.
7. One can measure the concentration of the tailed DNA with Invitrogen Picogreen kits. Typically, 1 m l of 5 m M adapters is used in a 25 m l reaction when starting with 5–10 m g of genomic DNA. In the case of chromatin immunoprecipitated (ChIPed) DNA we found that those adapter concentrations can be 1,000- to 10,000-fold too high and may contribute to spuri-ous 160-bp bands that appear after library PCR (Fig. 3c ). The goal is to have a ~10:1 adapter:insert ratio.
8. To avoid cross contamination, leave an empty lane between each sample.
9. A non-UV transilluminator will result in less DNA degrada-tion. We routinely use a standard low- or high-range UV tran-silluminator but expose the DNA for as short a time as possible. The size range of DNA insert will affect the standard deviation of insert size during library assembly.
10. Instead of weighing it is suf fi cient to use marks on the Eppendorf tubes to judge the volume after gel slices have been centrifuged. Melting the gel closer to room temperature will increase the yield of AT-rich DNA ( 12 ) .
11. Two washes with PE buffer are necessary to get rid of all the salt from the QG buffer and to allow for measurement of DNA concentration with a nanodrop spectrophotometer.
12. Typically, 15–21 cycles of PCR are optimal for generation of libraries from genomic DNA. For ChIP-seq libraries up to 24 cycles are acceptable. The best genomic DNA libraries only require as few as 12 cycles while libraries made from dilute or poorly ligated DNA can require as many as 25 cycles to yield suf fi cient DNA. In general fewer cycles are better because less PCR bias will be introduced, resulting in fewer “clonal” reads (i.e. large numbers of reads that have identical start and stop coordinates when mapped to the genome sequence).
13. To test the library any Taq DNA polymerase can be used and we have not found large differences in overall ampli fi cation behavior. For the preparation of the library used for actual sequencing a high- fi delity and highly processive enzyme is pre-ferred but Phusion Flash polymerase is not the only such enzyme available.

191 Rapid Genome Sequencing
14. “Tightening” of the DNA smear with more cycles indicates over-ampli fi cation. DNA greater than 100 bp but lower than the excised library size should not be present. A band at ~120 bp for single-end libraries and ~160 bp for paired-end libraries indicates adapter-primer hybrids contaminating the library (Fig. 3c ). Such libraries should not be sequenced. It is possible to amplify the libraries again and to isolate and gel purify fragments above the contaminating bands but often adapter primer multimers “hide” below the library bands and still result in signi fi cant contamination of sequencing runs with these nonspeci fi c sequences. In addition, gel puri fi cation at this stage of the protocol often results in signi fi cant loss of library DNA.
15. Complexity of libraries can be assessed by digestion of test PCR fragments with Dpn II, as this cleaves most of the adapter off the inserts (Fig. 4c ). If predominantly genomic DNA has been cloned it will result in a smear similar to genomic DNA digested for Southern blots. Conversely, if mostly low complexity samples (i.e. adapters or small amounts of contaminants) have been cloned, sharp banding is observed instead of the smear and the library is unsuitable for further processing.
16. Ideally, doubling of the amount of template DNA is expected to reduce the number of cycles needed by one. For example, if 20 cycles with 1 m L of template is suf fi cient, 18 cycles with 4 m L of template should be similar and result in similar com-plexity of libraries. In practice this relationship is not exactly linear.
17. Increasing the initial denaturation step from 30 s to 3 min and each subsequent denaturation step from 10 to 80 s or decreas-ing the temperature ramp rate of the thermocycler to 2°C/s improves the yield of GC-rich amplicons. Similarly, addition of 2 M betaine also improves recovery of GC-rich amplicons. Decreasing the annealing temperature from 65 to 60°C slightly improves the yield of AT-rich amplicons ( 38 ) .
18. Other quanti fi cation methods such as spectrophotometry (e.g., by Nanodrop or similar devices) are less accurate and typically result in overestimation of DNA concentration and production of signi fi cantly fewer clusters. Quanti fi cation by qPCR is most accurate since it directly measures the concentration of only DNA that is able to form clusters on the fl owcell.
19. Results with in-house adapter and PCR primer mix will not be identical to results obtained with Illumina-purchased kits, as certain modi fi cations are made to oligos in Illumina library preparation kits to improve performance.

20 K.R. Pomraning et al.
Fig. 4. Preparation of paired-end sequencing libraries from Sordaria macrospora. ( a ) Genomic DNA (10 m g in 450 m L TE) was prepared as described in ref. ( 11 ) and sheared by sonication with a Branson 450 Soni fi er with microtip (duty cycle 80%, output 1.2; fi ve cycles of 10 s pulses, interrupted by 30 s rest on ice). Sheared DNA was concentrated (Qiagen PCR puri fi cation kit) and separated on a 1.2% agarose gel. Gel slices of ~300 and ~500 bp fragments were isolated and puri fi ed (Qiagen Gel extraction kit, see Subheading 3.4 , step 5). ( b ) Paired-end libraries were constructed as described in the methods from the 300- and 500-bp fractions and ampli fi ed with 12 cycles of PCR, yielding barely visible bands. Note presence of adapters and PCR primers below the 100 bp marker. ( c ) Test for library complexity. One simple test to show that libraries contain predominantly genomic DNA and are not enriched for adapter dimers or other spurious overampli fi ed bands is to digest the DyNAzyme-ampli fi ed libraries with Dpn II. This cleaves most of the adapter off the inserts. If genomic DNA has been cloned it will result in a smear (similar to genomic DNA digested for Southern blots). If only low complexity samples have been cloned in the library, sharp banding is observed instead of the smear and the library is unsuitable for further processing. ( d ) Libraries were ampli fi ed with 18 cycles of PCR with Phusion Flash High-Fidelity polymerase and puri fi ed (Qiagen PCR puri fi cation kit; see three 300-bp library samples). We typically pool three independent 25 m L PCR reactions before puri fi cation and run 5 m L of 35 m L to show that only expected bands are obtained. Note the absence of the adapters or PCR primers and primer dimers (compare to ( b )).

211 Rapid Genome Sequencing
Acknowledgments
We thank Mark Dasenko, Chris Sullivan, Steve Drake, Matthew Peterson, and Scott Givan at the OSU CGRB core facility for assis-tance with Illumina sequencing, and Chris Sullivan, Jason Cumbie, Noah Fahlgren and Henry Priest for helpful discussions and shar-ing code. Work in our laboratory is supported by funds from the American Cancer Society (RSG-08-030-01-CCG), the National Institutes of Health (P01GM068087 and R01GM097637), and start-up funds from the OSU Computational and Genome Biology Initiative. The authors have no con fl icting interests
References
1. Blumenstiel JP, Noll AC, Grif fi ths JA et al (2009) Identi fi cation of EMS-induced muta-tions in Drosophila melanogaster by whole-genome sequencing. Genetics 182:25–32
2. Birkeland SR, Jin N, Ozdemir AC et al (2010) Discovery of mutations in Saccharomyces cer-evisiae by pooled linkage analysis and whole-genome sequencing. Genetics 186:1127–1137
3. Ehrenreich IM, Torabi N, Jia Y et al (2010) Dissection of genetically complex traits with extremely large pools of yeast segregants. Nature 464:1039–1042
4. Wenger JW, Schwartz K, Sherlock G (2010) Bulk segregant analysis by high-throughput sequencing reveals a novel xylose utilization gene from Saccharomyces cerevisiae . PLoS Genet 6:e1000942
5. Pomraning KR, Smith KM, Freitag M (2011) Bulk segregant analysis followed by high-throughput sequencing reveals the Neurospora cell cycle gene, ndc-1 , to be allelic with the gene for ornithine decarboxylase, spe-1 . Eukaryot Cell 10:724–733
6. Reinhardt JA, Baltrus DA, Nishimura MT et al (2009) De novo assembly using low-coverage short read sequence data from the rice patho-gen Pseudomonas syringae pv. oryzae . Genome Res 19:294–305
7. Diguistini S, Liao NY, Platt D et al (2009) De novo genome sequence assembly of a fi lamentous fungus using Sanger, 454 and Illumina sequence data. Genome Biol 10:R94
8. Li R, Fan W, Tian G et al (2010) The sequence and de novo assembly of the giant panda genome. Nature 463:311–317
9. Nowrousian M, Stajich JE, Chu M et al (2010) De novo assembly of a 40 Mb eukary-
otic genome from short sequence reads: Sordaria macrospora , a model organism for fungal morphogenesis. PLoS Genet 6:e1000891
10. Pomraning KR, Connolly LR, Whalen JP et al (2011) Repeat-induced point mutation, DNA methylation and heterochromatin in Gibberella zeae (anamorph: Fusarium graminearum ). In: Brown D, Proctor RH (eds) Fusarium genom-ics and molecular and cellular biology. Horizon Scienti fi c Press, Norwich
11. Pomraning KR, Smith KM, Freitag M (2009) Genome-wide high throughput analysis of DNA methylation in eukaryotes. Methods 47:142–150
12. Quail MA, Kozarewa I, Smith F et al (2008) A large genome center’s improvements to the Illumina sequencing system. Nat Methods 5:1005–1010
13. Cronn R, Liston A, Parks M et al (2008) Multiplex sequencing of plant chloroplast genomes using Solexa sequencing-by-synthesis technology. Nucleic Acids Res 36:e122
14. Langmead B, Trapnell C, Pop M et al (2009) Ultrafast and memory-ef fi cient alignment of short DNA sequences to the human genome. Genome Biol 10:R25
15. Zerbino DR, Birney E (2008) Velvet: algo-rithms for de novo short read assembly using de Bruijn graphs. Genome Res 18:821–829
16. Li H, Ruan J, Durbin R (2008) Mapping short DNA sequencing reads and calling variants using mapping quality scores. Genome Res 18:1851–1858
17. Lin Y, Li J, Shen H et al (2011) Comparative studies of de novo assembly tools for next-generation sequencing technologies. Bioinformatics 27:2031–2037

22 K.R. Pomraning et al.
18. Simpson JT, Wong K, Jackman SD et al (2009) ABySS: a parallel assembler for short read sequence data. Genome Res 19:1117–1123
19. Filichkin SA, Priest HD, Givan SA et al (2010) Genome-wide mapping of alternative splicing in Arabidopsis thaliana . Genome Res 20:45–58
20. Bryant DW Jr, Wong WK, Mockler TC (2009) QSRA: a quality-value guided de novo short read assembler. BMC Bioinformatics 10:69
21. Li R, Zhu H, Ruan J et al (2010) De novo assembly of human genomes with massively parallel short read sequencing. Genome Res 20:265–272
22. Boisvert S, Laviolette F, Corbeil J (2010) Ray: simultaneous assembly of reads from a mix of high-throughput sequencing technolo-gies. J Comput Biol 17:1519–1533
23. Li R, Li Y, Kristiansen K et al (2008) SOAP: short oligonucleotide alignment program. Bioinformatics 24:713–714
24. Li H, Durbin R (2009) Fast and accurate short read alignment with Burrows-Wheeler trans-form. Bioinformatics 25:1754–1760
25. Fahlgren N, Sullivan CM, Kasschau KD et al (2009) Computational and analytical frame-work for small RNA pro fi ling by high-through-put sequencing. RNA 15:992–1002
26. Lunter G, Goodson M (2011) Stampy: a statis-tical algorithm for sensitive and fast mapping of Illumina sequence reads. Genome Res 21:936–939
27. Li H, Handsaker B, Wysoker A et al (2009) The sequence alignment/map format and SAMtools. Bioinformatics 25:2078–2079
28. Smith KM, Phatale PA, Sullivan CM et al (2011) Heterochromatin is required for nor-mal distribution of Neurospora CenH3. Mol Cell Biol 31:2528–2542
29. Smith KM, Sancar G, Dekhang R et al (2010) Transcription factors in light and circadian clock signaling networks revealed by genom-ewide mapping of direct targets for Neurospora White Collar Complex. Eukaryot Cell 9:1549–1556
30. Zhang Y, Liu T, Meyer CA et al (2008) Model-based analysis of ChIP-Seq (MACS). Genome Biol 9:R137
31. Zang C, Schones DE, Zeng C et al (2009) A clustering approach for identi fi cation of enriched domains from histone modi fi cation ChIP-Seq data. Bioinformatics 25:1952–1958
32. Song Q, Smith AD (2011) Identifying dis-persed epigenomic domains from ChIP-Seq data. Bioinformatics 27:870–871
33. Trapnell C, Pachter L, Salzberg SL (2009) TopHat: discovering splice junctions with RNA-Seq. Bioinformatics 25:1105–1111
34. Anders S, Huber W (2010) Differential expres-sion analysis for sequence count data. Genome Biol 11:R106
35. Trapnell C, Williams BA, Pertea G et al (2010) Transcript assembly and quanti fi cation by RNA-Seq reveals unannotated transcripts and isoform switching during cell differentiation. Nat Biotechnol 28:511–515
36. Singh D, Orellana CF, Hu Y et al (2011) FDM: a graph-based statistical method to detect dif-ferential transcription using RNA-seq data. Bioinformatics 27:2633–2640
37. Cumbie JS, Kimbrel JA, Di Y et al (2011) GENE-counter: a computational pipeline for the analysis of RNA-Seq data for gene expres-sion differences. PLoS One 6:e25279
38. Aird D, Ross MG, Chen WS et al (2011) Analyzing and minimizing PCR ampli fi cation bias in Illumina sequencing libraries. Genome Biol 12:R18