
LFAC at 8Hz
6
International Journal of Science, Engineering and Technology Research (IJSETR), Volume 3, Issue 7, July 2014 ISSN: 2278 – 7798 All Rights Reserved © 2014 IJSETR 1940 Simulation of Dc-Link Power Converter for Integrating Offshore Wind Turbine Generator to Grid Chaitanya Krishna Jambotkar #1, Prof. Uttam S Satpute #2 #1Department of Electronics and Communication Engineering, KLS’s VDRIT, Haliyal-581329, India. #2Department of Electrical and Electronics Engineering, KLS’s VDRIT, Haliyal-581329, India. Abstract—In the recent years Off-shore wind power plants have gained interest due to the fact that, there is an ample space available for its installation. Moreover it offers other advantages such as; high wind energy potential, turbine blades can be larger (no transportation and construction problems), also the blades can be allowed to rotate at higher speed (no noise constrain) thereby increasing the rated power. The most important requirements of Off-shore wind power plants are less weight, less maintenance and less cost; and these requirements can be met by eliminating or reducing gear size. So, Direct-drive Permanent Magnet Synchronous generator concept is found most attractive. In such scheme, the frequency of power generation depends upon the number of generator poles and the rotor speed. The rotor speed depends upon the wind speed, which is fixed for a site. So the frequency of power generation depends upon the number of poles of generator. In this project the concept of Fractional frequency Transmission system (FTTS) is introduced. This project deals with optimal selection of frequency for power converter such that the total cost of generation-transmission is minimum with maximum converter efficiency. This study requires the analysis on power quality of power converter which is integrated to grid. SVPWM based three phase controlled DC- Link power converter integrated to grid is implemented on MATLAB/Simulink platform (7.11 R2011b version) where in the power converter is simulated for lower frequencies such as 50/2, 50/3, 50/4, 50/5, 50/6, 50/7, 50/8 further all the results such as %THD, harmonic analysis, efficiency of converter etc are noted based on which we conclude the optimal frequency for power converter. Based on the obtained results we can conclude that f/6 i.e. 8.33 Hz is the optimal frequency for the power converter which is integrated to grid via FFTS. The generator and transmission lines are also expected to present the similar benefits. But the cost of power generation increases with the decrease in frequency. So systematic methodology has to be adopted in optimal selection of frequency for complete system design. Keywords- AC-DC-AC power converter, FFTS, PLL, SVPWM. I. INTRODUCTION In recent years, the electrical power generation from renewable energy sources, such as wind is increasingly attraction interest because of environmental problem and shortage of traditional energy source in the near future. Nowadays, the extraction of power from the wind on large scale became a recognized industry. It holds great potential showing that future will become undisputed number one choice form of renewable source of energy. The force that pushes this technology is the simple economics and clean energy. As a consequence of rising fossil fuel price and advanced technology, more and more homes business have been installing small wind turbines for the purposes of cutting energy bills and carbon dioxide emissions and are even selling extra electricity back to the national grid. The kinetic energy in the wind is converted into mechanical energy by the turbine by way of shaft and gear box arrangement because of the different operating speed ranges of the wind turbine rotor and generator. The generator converts this mechanical energy into electrical energy. However, as wind is an intermittent renewable source, the wind source extracted by a wind turbine is therefore not constant. For this reason, the fluctuation of wind power results in fluctuated power output from wind turbine generator. From the point of view of utilities, due to the fluctuation of generator output, it’s not appropriate for the generator to be directly connected to power grid. In order to achieve the condition that the generator output power is suitable for grid connection, it is necessary to use a controller to manage the output produced by the wind turbine generator. At present the transmission technologies such as HVAC, MVAC, HVDC and FACTS are giving their level best. Each technology has got its own importance when evaluated on different parameters. Basically the fundamental issue that made the rise for various technologies was the power quality. The power quality is given by P max = V 2 X = V 2 2пfL ----------- (1) %∆V= QX V 2 × 100 = 2пfLQ V 2 × 100 ----------- (2) From equation (1) we can say that power transmission capacity increases by the factor of decrease in frequency and equation (2) says that voltage fluctuation will decrease by the factor of increase in transmission efficiency. Power converter is required at the grid side to convert the fractional frequency of transmission into a standard frequency 50Hz before integrating to grid. We have implemented
-
Upload
independent -
Category
Documents
-
view
0 -
download
0
Transcript of LFAC at 8Hz
International Journal of Science, Engineering and Technology Research (IJSETR), Volume 3, Issue 7, July 2014
ISSN: 2278 – 7798 All Rights Reserved © 2014 IJSETR 1940
Simulation of Dc-Link Power Converter for
Integrating Offshore Wind Turbine Generator to Grid Chaitanya Krishna Jambotkar #1, Prof. Uttam S Satpute #2
#1Department of Electronics and Communication Engineering, KLS’s VDRIT, Haliyal-581329, India.
#2Department of Electrical and Electronics Engineering, KLS’s VDRIT, Haliyal-581329, India.
Abstract—In the recent years Off-shore wind power plants
have gained interest due to the fact that, there is an ample space
available for its installation. Moreover it offers other advantages
such as; high wind energy potential, turbine blades can be larger
(no transportation and construction problems), also the blades
can be allowed to rotate at higher speed (no noise constrain)
thereby increasing the rated power. The most important
requirements of Off-shore wind power plants are less weight, less
maintenance and less cost; and these requirements can be met by
eliminating or reducing gear size. So, Direct-drive Permanent
Magnet Synchronous generator concept is found most attractive.
In such scheme, the frequency of power generation depends upon
the number of generator poles and the rotor speed. The rotor
speed depends upon the wind speed, which is fixed for a site. So
the frequency of power generation depends upon the number of
poles of generator. In this project the concept of Fractional
frequency Transmission system (FTTS) is introduced. This
project deals with optimal selection of frequency for power
converter such that the total cost of generation-transmission is
minimum with maximum converter efficiency. This study
requires the analysis on power quality of power converter which
is integrated to grid. SVPWM based three phase controlled DC-
Link power converter integrated to grid is implemented on
MATLAB/Simulink platform (7.11 R2011b version) where in the
power converter is simulated for lower frequencies such as 50/2,
50/3, 50/4, 50/5, 50/6, 50/7, 50/8 further all the results such as
%THD, harmonic analysis, efficiency of converter etc are noted
based on which we conclude the optimal frequency for power
converter. Based on the obtained results we can conclude that f/6
i.e. 8.33 Hz is the optimal frequency for the power converter
which is integrated to grid via FFTS. The generator and
transmission lines are also expected to present the similar
benefits. But the cost of power generation increases with the
decrease in frequency. So systematic methodology has to be
adopted in optimal selection of frequency for complete system design.
Keywords- AC-DC-AC power converter, FFTS, PLL, SVPWM.
I. INTRODUCTION
In recent years, the electrical power generation from
renewable energy sources, such as wind is increasingly
attraction interest because of environmental problem and
shortage of traditional energy source in the near future.
Nowadays, the extraction of power from the wind on large
scale became a recognized industry. It holds great potential
showing that future will become undisputed number one
choice form of renewable source of energy. The force that
pushes this technology is the simple economics and clean
energy. As a consequence of rising fossil fuel price and
advanced technology, more and more homes business have
been installing small wind turbines for the purposes of cutting
energy bills and carbon dioxide emissions and are even selling
extra electricity back to the national grid.
The kinetic energy in the wind is converted into mechanical
energy by the turbine by way of shaft and gear box
arrangement because of the different operating speed ranges
of the wind turbine rotor and generator. The generator
converts this mechanical energy into electrical energy.
However, as wind is an intermittent renewable source, the
wind source extracted by a wind turbine is therefore not
constant. For this reason, the fluctuation of wind power results
in fluctuated power output from wind turbine generator. From
the point of view of utilities, due to the fluctuation of generator output, it’s not appropriate for the generator to be
directly connected to power grid. In order to achieve the
condition that the generator output power is suitable for grid
connection, it is necessary to use a controller to manage the
output produced by the wind turbine generator.
At present the transmission technologies such as HVAC,
MVAC, HVDC and FACTS are giving their level best. Each technology has got its own importance when evaluated on
different parameters. Basically the fundamental issue that
made the rise for various technologies was the power quality.
The power quality is given by
Pmax = V2
X =
V2
2пfL ----------- (1)
%∆V = QX
V2 × 100 = 2пfLQ
V2 × 100 ----------- (2)
From equation (1) we can say that power transmission
capacity increases by the factor of decrease in frequency and
equation (2) says that voltage fluctuation will decrease by the
factor of increase in transmission efficiency.
Power converter is required at the grid side to convert the
fractional frequency of transmission into a standard frequency
50Hz before integrating to grid. We have implemented
International Journal of Science, Engineering and Technology Research (IJSETR), Volume 3, Issue 7, July 2014
ISSN: 2278 – 7798 All Rights Reserved © 2014 IJSETR 1941
AC-DC-AC converter i.e. a pair of rectifier and inverter as
power converter in our project. SVPWM technique is used to
produce an appropriate firing angle to the switching device so
that the output of the inverter circuit is always maintained at
50Hz at appropriate voltage level. SVPWM is used ahead of
other PWM techniques as it provides less THD, switching losses, and a bit boost in voltage level compared to other
PWM techniques.
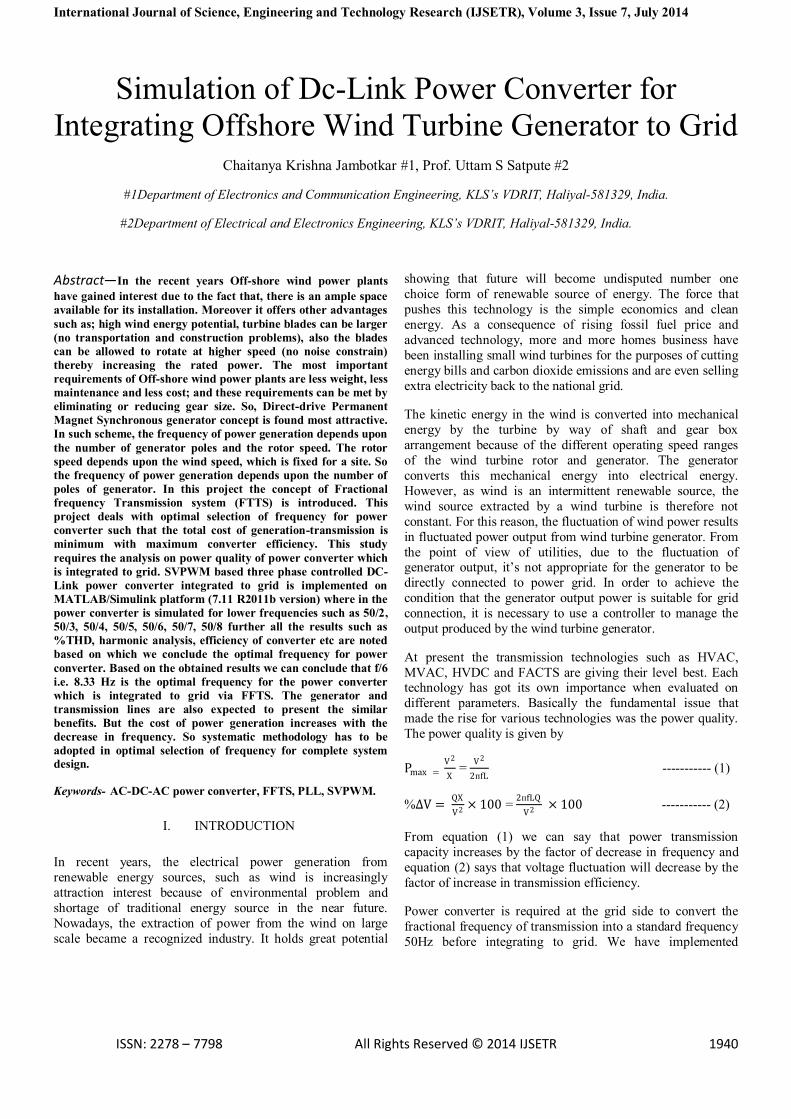
II. SYSTEM DESCRIPTION
The power converter system is analyzed by giving various lower frequencies as input to it such as f/2, f/3, f/4, f/5, f/6,
f/7, f/8 at standard transmission voltage level. The block
diagram implementation of power converter integrated to grid
is shown in the figure 1.
Fig 1 Block diagram of the power converter integrated to
grid
It is assumed that the power is transmitted at the fractional
frequency and given as input to the controlled rectifier which
converts a fractional frequency AC voltage to a DC voltage
which acts as input to the controlled inverter the output of the
controlled inverter is produced with reference to the grid
voltage and frequency. Then the output of controlled inverter
is compared with the grid code as defind by IEC61727 [3] and
conditions for synchronization such as voltage magnitude, phase and frequency. If the incoming line (output of inverter)
satisfies all these conditions then the control signal will be
provided to the circuit breaker to integrate the incoming line
to the grid.
The following figure 2 shows 2 Electrical scheme of a wind
turbine equipped with a direct-drive PMSG.
Fig 2 Electrical scheme of a wind turbine equipped with a
direct-drive PMSG.
III. MATLAB/SIMULINK IMPLEMENTATION
A. SVPWM Modeling
The proposed approach is based on the instantaneous values
of the reference voltages of a, b and c phases only and the
actual switching times for each inverter leg are deduced
directly. The obtained load current is converted from three
phase Iabc to two phase components Id and Iq respectively.
The two phase currents are then compared with the reference
values of the two phase components and the obtained output is
again converted back to three phase components.
The obtained three phase components are used to obtain the
Uα and Uβ by using the transformation as stated below .
Uα = 2
3 Ia + Ib cos
2π
3+ Ic cos
2π
3 ---------- (3)
Uβ = 2
3 Ib sin
2π
3− Ic cos
2π
3 ---------- (4)
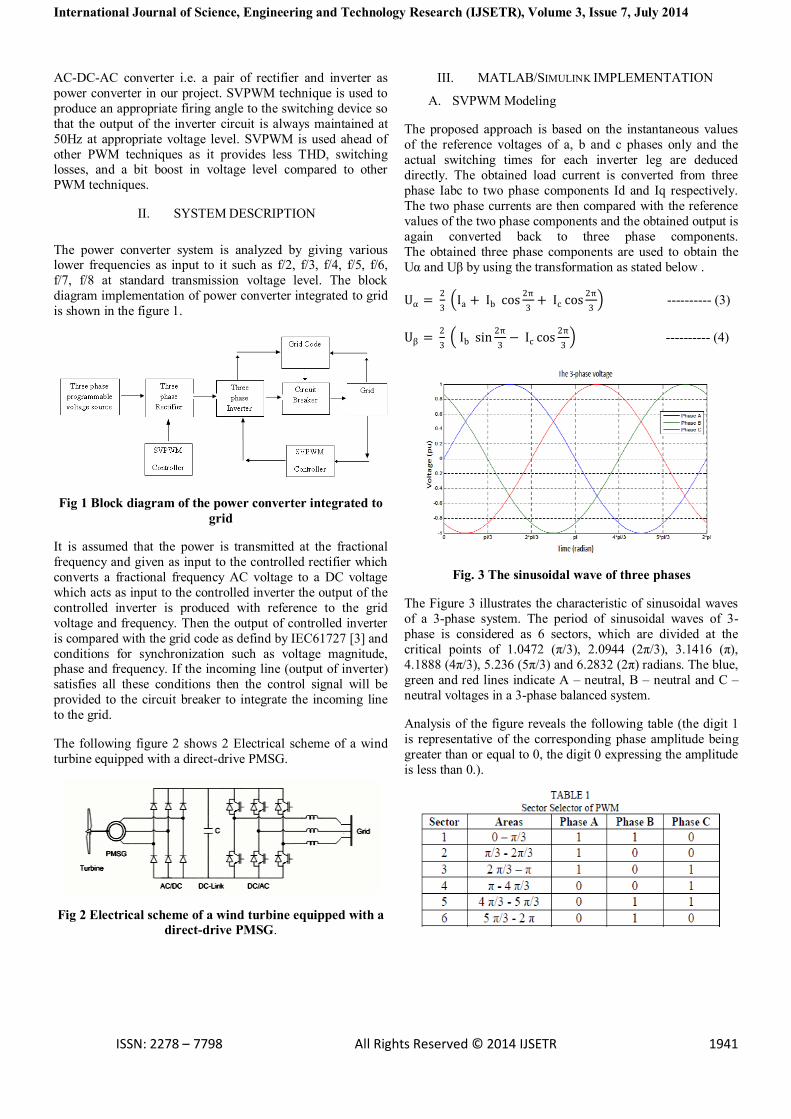
Fig. 3 The sinusoidal wave of three phases
The Figure 3 illustrates the characteristic of sinusoidal waves
of a 3-phase system. The period of sinusoidal waves of 3-
phase is considered as 6 sectors, which are divided at the
critical points of 1.0472 (π/3), 2.0944 (2π/3), 3.1416 (π),
4.1888 (4π/3), 5.236 (5π/3) and 6.2832 (2π) radians. The blue,
green and red lines indicate A – neutral, B – neutral and C –
neutral voltages in a 3-phase balanced system.
Analysis of the figure reveals the following table (the digit 1
is representative of the corresponding phase amplitude being
greater than or equal to 0, the digit 0 expressing the amplitude
is less than 0.).
International Journal of Science, Engineering and Technology Research (IJSETR), Volume 3, Issue 7, July 2014
ISSN: 2278 – 7798 All Rights Reserved © 2014 IJSETR 1942
For the neutral voltage of Phase A, B and C, in this
interpretation of the logical relationship an alternative method
of expressing the relationship in algebra is given by ,
N = A + 2B + 4C ------------ (4)
Where N represents the sector mapping Based on the above
equation the above table can be modified as follows
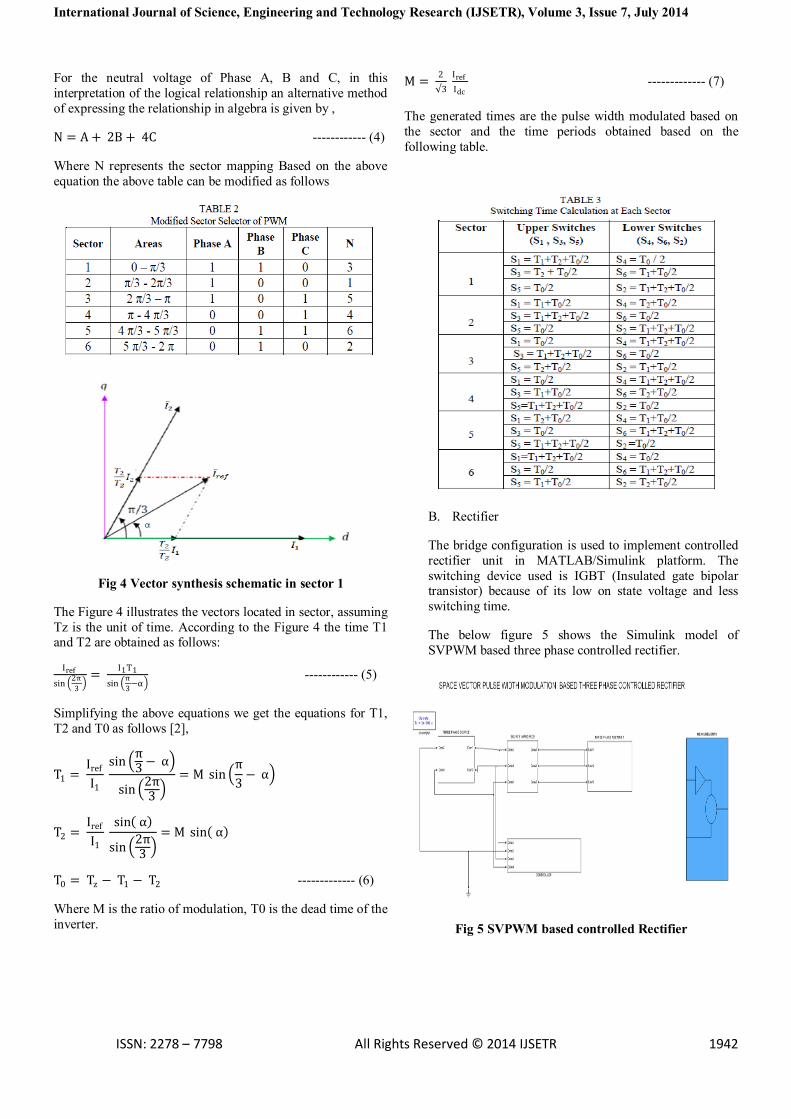
Fig 4 Vector synthesis schematic in sector 1
The Figure 4 illustrates the vectors located in sector, assuming
Tz is the unit of time. According to the Figure 4 the time T1 and T2 are obtained as follows:
Iref
sin 2π
3
= I1T1
sin π
3−α
------------ (5)
Simplifying the above equations we get the equations for T1,
T2 and T0 as follows [2],
T1 = Iref
I1
sin
π3 − α
sin 2π3
= M sin π
3− α
T2 = Iref
I1
sin α
sin 2π3
= M sin α
T0 = Tz − T1 − T2 ------------- (6)
Where M is the ratio of modulation, T0 is the dead time of the
inverter.
M = 2
√3
Iref
Idc ------------- (7)
The generated times are the pulse width modulated based on
the sector and the time periods obtained based on the
following table.
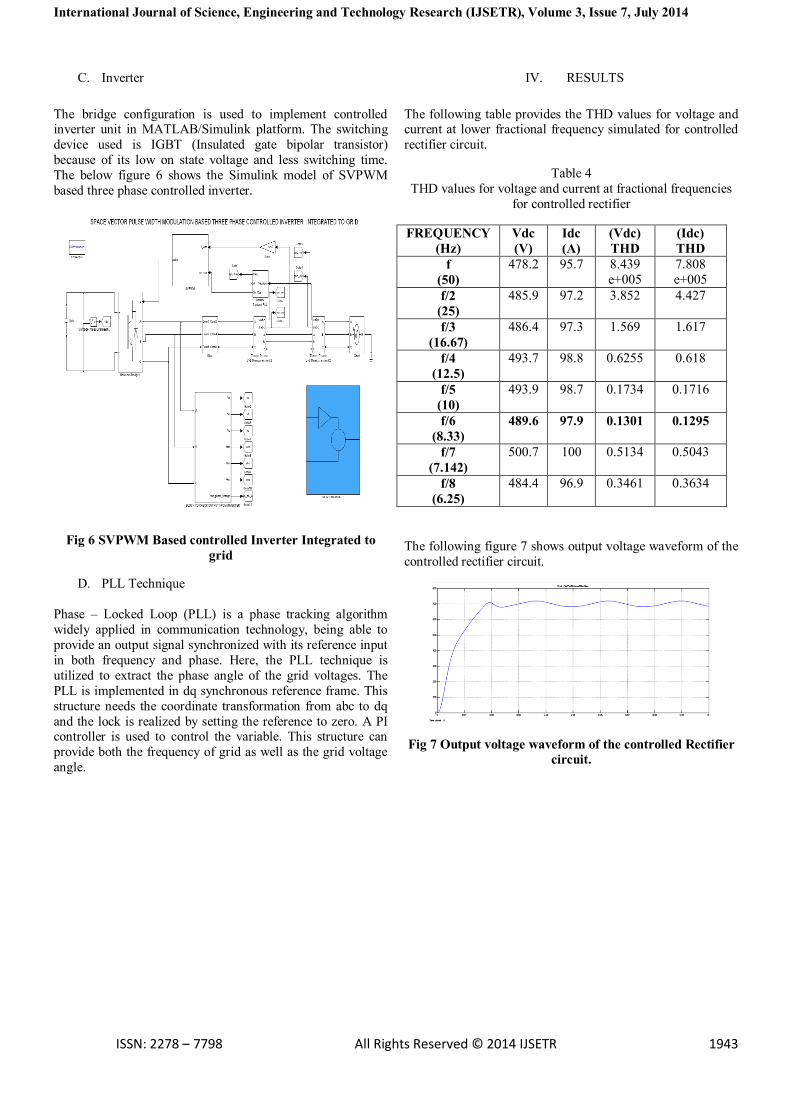
B. Rectifier
The bridge configuration is used to implement controlled
rectifier unit in MATLAB/Simulink platform. The
switching device used is IGBT (Insulated gate bipolar transistor) because of its low on state voltage and less
switching time.
The below figure 5 shows the Simulink model of
SVPWM based three phase controlled rectifier.
Fig 5 SVPWM based controlled Rectifier
International Journal of Science, Engineering and Technology Research (IJSETR), Volume 3, Issue 7, July 2014
ISSN: 2278 – 7798 All Rights Reserved © 2014 IJSETR 1943
C. Inverter
The bridge configuration is used to implement controlled inverter unit in MATLAB/Simulink platform. The switching
device used is IGBT (Insulated gate bipolar transistor)
because of its low on state voltage and less switching time.
The below figure 6 shows the Simulink model of SVPWM
based three phase controlled inverter.
Fig 6 SVPWM Based controlled Inverter Integrated to
grid
D. PLL Technique
Phase – Locked Loop (PLL) is a phase tracking algorithm
widely applied in communication technology, being able to
provide an output signal synchronized with its reference input
in both frequency and phase. Here, the PLL technique is
utilized to extract the phase angle of the grid voltages. The
PLL is implemented in dq synchronous reference frame. This
structure needs the coordinate transformation from abc to dq
and the lock is realized by setting the reference to zero. A PI controller is used to control the variable. This structure can
provide both the frequency of grid as well as the grid voltage
angle.
IV. RESULTS
The following table provides the THD values for voltage and current at lower fractional frequency simulated for controlled
rectifier circuit.
Table 4
THD values for voltage and current at fractional frequencies
for controlled rectifier
FREQUENCY
(Hz)
Vdc
(V)
Idc
(A)
(Vdc)
THD
(Idc)
THD
f
(50)
478.2 95.7 8.439
e+005
7.808
e+005
f/2
(25)
485.9 97.2 3.852 4.427
f/3
(16.67)
486.4 97.3 1.569 1.617
f/4
(12.5)
493.7 98.8 0.6255 0.618
f/5
(10)
493.9 98.7 0.1734 0.1716
f/6
(8.33)
489.6 97.9 0.1301 0.1295
f/7
(7.142)
500.7 100 0.5134 0.5043
f/8
(6.25)
484.4 96.9 0.3461 0.3634
The following figure 7 shows output voltage waveform of the
controlled rectifier circuit.
Fig 7 Output voltage waveform of the controlled Rectifier
circuit.
International Journal of Science, Engineering and Technology Research (IJSETR), Volume 3, Issue 7, July 2014
ISSN: 2278 – 7798 All Rights Reserved © 2014 IJSETR 1944
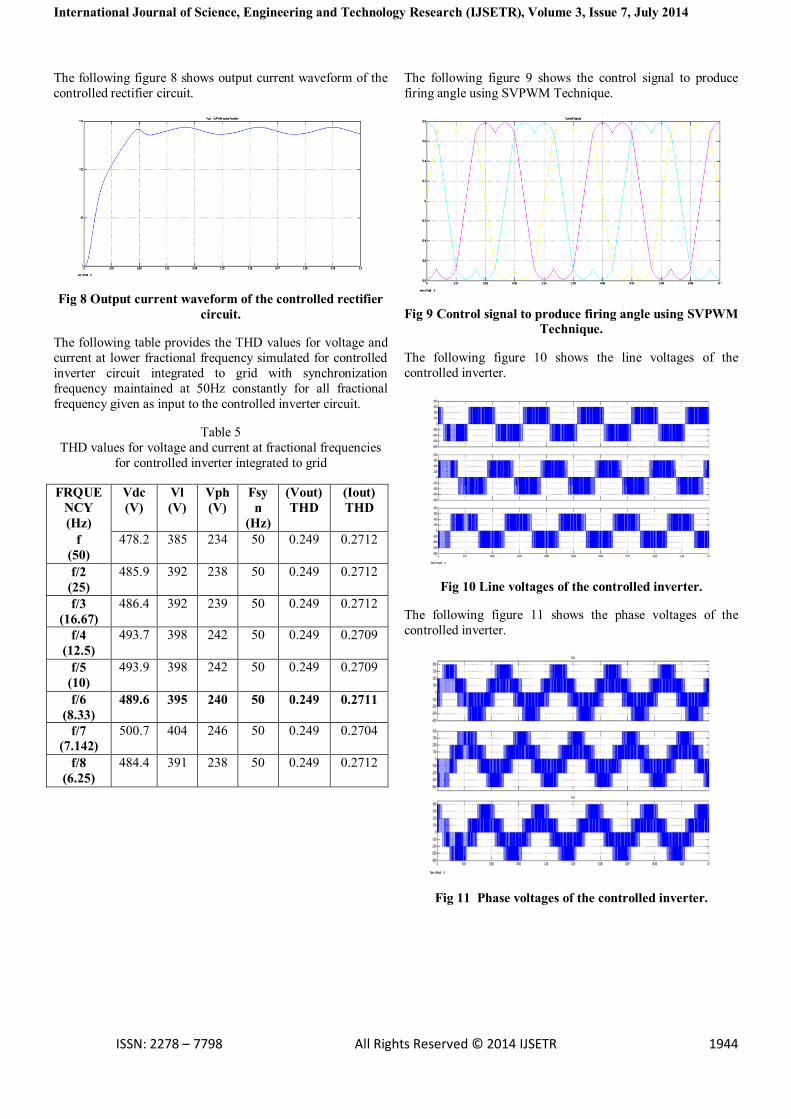
The following figure 8 shows output current waveform of the
controlled rectifier circuit.
Fig 8 Output current waveform of the controlled rectifier
circuit.
The following table provides the THD values for voltage and
current at lower fractional frequency simulated for controlled
inverter circuit integrated to grid with synchronization
frequency maintained at 50Hz constantly for all fractional
frequency given as input to the controlled inverter circuit.
Table 5
THD values for voltage and current at fractional frequencies
for controlled inverter integrated to grid
FRQUE
NCY
(Hz)
Vdc
(V)
Vl
(V)
Vph
(V)
Fsy
n
(Hz)
(Vout)
THD
(Iout)
THD
f
(50)
478.2 385 234 50 0.249 0.2712
f/2
(25)
485.9 392 238 50 0.249 0.2712
f/3
(16.67)
486.4 392 239 50 0.249 0.2712
f/4
(12.5)
493.7 398 242 50 0.249 0.2709
f/5
(10)
493.9 398 242 50 0.249 0.2709
f/6
(8.33)
489.6 395 240 50 0.249 0.2711
f/7
(7.142)
500.7 404 246 50 0.249 0.2704
f/8
(6.25)
484.4 391 238 50 0.249 0.2712
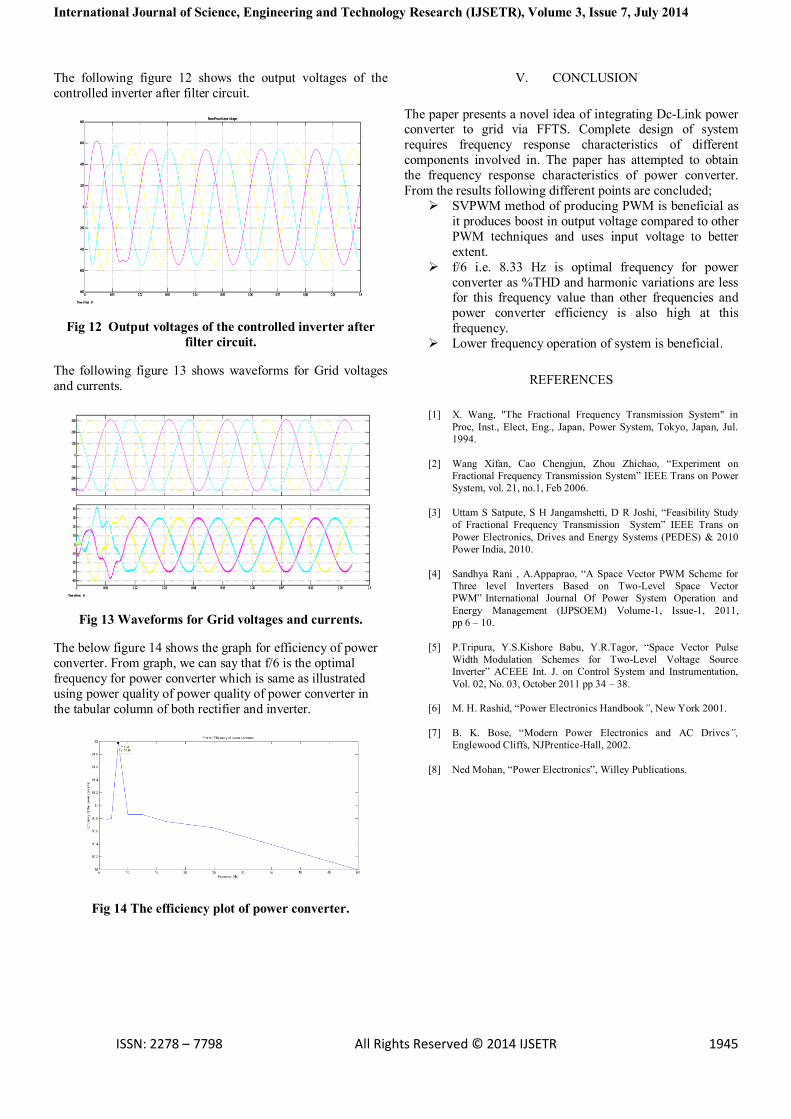
The following figure 9 shows the control signal to produce
firing angle using SVPWM Technique.
Fig 9 Control signal to produce firing angle using SVPWM
Technique.
The following figure 10 shows the line voltages of the
controlled inverter.
Fig 10 Line voltages of the controlled inverter.
The following figure 11 shows the phase voltages of the
controlled inverter.
Fig 11 Phase voltages of the controlled inverter.
International Journal of Science, Engineering and Technology Research (IJSETR), Volume 3, Issue 7, July 2014
ISSN: 2278 – 7798 All Rights Reserved © 2014 IJSETR 1945
The following figure 12 shows the output voltages of the
controlled inverter after filter circuit.
Fig 12 Output voltages of the controlled inverter after
filter circuit.
The following figure 13 shows waveforms for Grid voltages
and currents.
Fig 13 Waveforms for Grid voltages and currents.
The below figure 14 shows the graph for efficiency of power
converter. From graph, we can say that f/6 is the optimal
frequency for power converter which is same as illustrated
using power quality of power quality of power converter in
the tabular column of both rectifier and inverter.
Fig 14 The efficiency plot of power converter.
V. CONCLUSION
The paper presents a novel idea of integrating Dc-Link power converter to grid via FFTS. Complete design of system
requires frequency response characteristics of different
components involved in. The paper has attempted to obtain
the frequency response characteristics of power converter.
From the results following different points are concluded;
SVPWM method of producing PWM is beneficial as
it produces boost in output voltage compared to other
PWM techniques and uses input voltage to better
extent.
f/6 i.e. 8.33 Hz is optimal frequency for power
converter as %THD and harmonic variations are less for this frequency value than other frequencies and
power converter efficiency is also high at this
frequency.
Lower frequency operation of system is beneficial.
REFERENCES
[1] X. Wang, "The Fractional Frequency Transmission System" in
Proc, Inst., Elect, Eng., Japan, Power System, Tokyo, Japan, Jul.
1994.
[2] Wang Xifan, Cao Chengjun, Zhou Zhichao, “Experiment on
Fractional Frequency Transmission System” IEEE Trans on Power
System, vol. 21, no.1, Feb 2006.
[3] Uttam S Satpute, S H Jangamshetti, D R Joshi, “Feasibility Study
of Fractional Frequency Transmission System” IEEE Trans on
Power Electronics, Drives and Energy Systems (PEDES) & 2010
Power India, 2010.
[4] Sandhya Rani , A.Appaprao, “A Space Vector PWM Scheme for
Three level Inverters Based on Two-Level Space Vector
PWM” International Journal Of Power System Operation and
Energy Management (IJPSOEM) Volume-1, Issue-1, 2011,
pp 6 – 10.
[5] P.Tripura, Y.S.Kishore Babu, Y.R.Tagor, “Space Vector Pulse
Width Modulation Schemes for Two-Level Voltage Source
Inverter” ACEEE Int. J. on Control System and Instrumentation,
Vol. 02, No. 03, October 2011 pp 34 – 38.
[6] M. H. Rashid, “Power Electronics Handbook”, New York 2001.
[7] B. K. Bose, “Modern Power Electronics and AC Drives”,
Englewood Cliffs, NJPrentice-Hall, 2002.
[8] Ned Mohan, “Power Electronics”, Willey Publications.