Leveraging local network communities to predict academic ...
12
Leveraging local network communities to predict academic performance David Burstein 1,2 , Franklin Kenter 3 , and Feng Shi *4 1 Swarthmore College 2 Fifth Third Bank 3 United States Naval Academy 4 University of North Carolina at Chapel Hill Abstract For more than 20 years, social network analysis of stu- dent collaboration networks has focused on a student’s centrality to predict academic performance. And even though a growing amount of sociological literature has supported that academic success is contagious, identify- ing central students in the network alone does not cap- ture how peer interactions facilitate the spread of aca- demic success throughout the network. Consequently, we propose novel predictors that treat academic success as a contagion by identifying a student’s learning com- munity, consisting of the peers that are most likely to influence a student’s performance in a course. We eval- uate the importance of these learning communities by predicting academic outcomes in an introductory col- lege statistics course with 103 students. In particular, we observe that by including these learning community predictors, the resulting model is 68 times more likely to be the correct model than the current state-of-the-art centrality network models in the literature. 1 Introduction Education research has long acknowledged that peer in- teractions play a critical role in students’ academic suc- cess [9, 15, 16, 19]. Consequently, to accurately identify * [email protected] academically at-risk students and implement innovative pedagogic strategies in the classroom, we need to incor- porate our understanding of the network of student in- teractions, or student collaboration network, to inform such decisions. The transformative potential for net- work analysis is not exclusive to education, but has in- fluenced many other disciplines as well including neuro- science and epidemiology. In particular, epidemiologists have employed network analysis to design vaccination strategies for preventing the spread of biological conta- gions [7, 8]. Further, network science has shown that intangible characteristics such as happiness and shar- ing information on social media permeate like tangible pathogens [11, 14]. We anticipate that the successes of network science in analyzing biological contagions can be transferred to educational applications as well, since academic success is also contagious [3]. Prior work using social network analysis has primarily focused on leveraging the student’s position, or cen- trality, in the network to predict academic outcomes. [2, 5, 13]. While network centrality has been shown to be a statistically robust predictor of academic per- formance, such analyses do not take into account the heterogeneity of learning connections in the network. Without integrating network measures that account for the learning process on the student collaboration net- work, we cannot expect to develop accurate models to predict academic success. Consequently, by identifying attributes important to the learning process, and mea- 1 arXiv:1810.04730v1 [cs.SI] 10 Oct 2018
-
Upload
khangminh22 -
Category
Documents
-
view
2 -
download
0
Transcript of Leveraging local network communities to predict academic ...

Leveraging local network communities to predict academic
performance
David Burstein1,2, Franklin Kenter3, and Feng Shi∗4
1Swarthmore College2Fifth Third Bank
3United States Naval Academy4University of North Carolina at Chapel Hill
Abstract
For more than 20 years, social network analysis of stu-dent collaboration networks has focused on a student’scentrality to predict academic performance. And eventhough a growing amount of sociological literature hassupported that academic success is contagious, identify-ing central students in the network alone does not cap-ture how peer interactions facilitate the spread of aca-demic success throughout the network. Consequently,we propose novel predictors that treat academic successas a contagion by identifying a student’s learning com-munity, consisting of the peers that are most likely toinfluence a student’s performance in a course. We eval-uate the importance of these learning communities bypredicting academic outcomes in an introductory col-lege statistics course with 103 students. In particular,we observe that by including these learning communitypredictors, the resulting model is 68 times more likely tobe the correct model than the current state-of-the-artcentrality network models in the literature.
1 Introduction
Education research has long acknowledged that peer in-teractions play a critical role in students’ academic suc-cess [9, 15, 16, 19]. Consequently, to accurately identify
academically at-risk students and implement innovativepedagogic strategies in the classroom, we need to incor-porate our understanding of the network of student in-teractions, or student collaboration network, to informsuch decisions. The transformative potential for net-work analysis is not exclusive to education, but has in-fluenced many other disciplines as well including neuro-science and epidemiology. In particular, epidemiologistshave employed network analysis to design vaccinationstrategies for preventing the spread of biological conta-gions [7, 8]. Further, network science has shown thatintangible characteristics such as happiness and shar-ing information on social media permeate like tangiblepathogens [11, 14]. We anticipate that the successes ofnetwork science in analyzing biological contagions canbe transferred to educational applications as well, sinceacademic success is also contagious [3].
Prior work using social network analysis has primarilyfocused on leveraging the student’s position, or cen-trality, in the network to predict academic outcomes.[2, 5, 13]. While network centrality has been shownto be a statistically robust predictor of academic per-formance, such analyses do not take into account theheterogeneity of learning connections in the network.Without integrating network measures that account forthe learning process on the student collaboration net-work, we cannot expect to develop accurate models topredict academic success. Consequently, by identifyingattributes important to the learning process, and mea-
1
arX
iv:1
810.
0473
0v1
[cs
.SI]
10
Oct
201
8

suring these attributes in context to a student’s com-munity, consisting of the peers that are most likely toinfluence a student’s performance, we more faithfullymodel academic success as a social contagion processand achieve significant improvements over existing mod-els.
2 Data
We collected student data from an introductory statis-tics course with 103 students. Each student listed theircollaborators on every graded assignment throughoutthe semester. The course contains units in probabil-ity, hypothesis testing and confidence intervals, wherestudents apply their understanding of the material toanalyze real-world data sets using the R statistical soft-ware language.
Throughout the course, there were six graded collab-orative assessments, consisting of five homework assign-ments and one in-class assignment. When submittinghomework assignments, students had the opportunityto fill out a short questionnaire identifying their collab-orators for the assignment, their interest in the materialon a Likert scale, and their confidence in the same man-ner. While some students did not complete all of thequestionnaires, all 103 students agreed to participate inthe study.
Additional background information pertaining to theirprior quantitative (i.e., mathematics and statistics)coursework and college entrance exams scores was col-lected at the beginning of the semester, since the resultsof these exams have correlated with students’ first-yearperformance in college [17]. For the SAT entrance ex-ams, only the general math score is used. Since somestudents took the ACT instead of the SAT, we convertedACT scores by identifying the corresponding SAT scorein the same percentile. [10].
2.1 Network Construction
The collaboration network of students consists of onenode for each student with an edge from student x tostudent y if either x or y reported that they collabo-rated on a given assignment. For the purposes of thenetwork, we consider the collaborative relationships to
be symmetric and only consider undirected networks.Since there were 6 assignments, we built 6 collaborationnetworks cumulatively with each network built on top ofthe prior one. Specifically, for assignment i, we considerthe network generated by all of the collaboration dataup to and including assignment i. For emphasis, we arenot concerned with how often students work with eachother, but rather, only if there is a reported relationshipand when that relationship begins. This process resultsin six consecutive and different unweighted networks,each with progressively more edges than its predeces-sor. Snapshots of this network can be found in Figure1.
3 Centrality Measures
While much prior literature has emphasized the impor-tance of integrating tools from network science to pre-dict academic outcomes, such analysis has been primar-ily restricted to measuring the centrality of nodes in thenetwork [12, 21, 22]. In the context of student col-laboration networks, students with high centrality arewell-connected with their peers. Since there are manymathematical definitions of centrality, we briefly reviewsome prominent measures of centrality and later usethese measures as a benchmark to evaluate the sig-nificance of our newly proposed community-based net-work measures for modeling academic performance. Inmost cases, technical definitions can be found in theAppendix.
3.1 Degree and Log-Degree
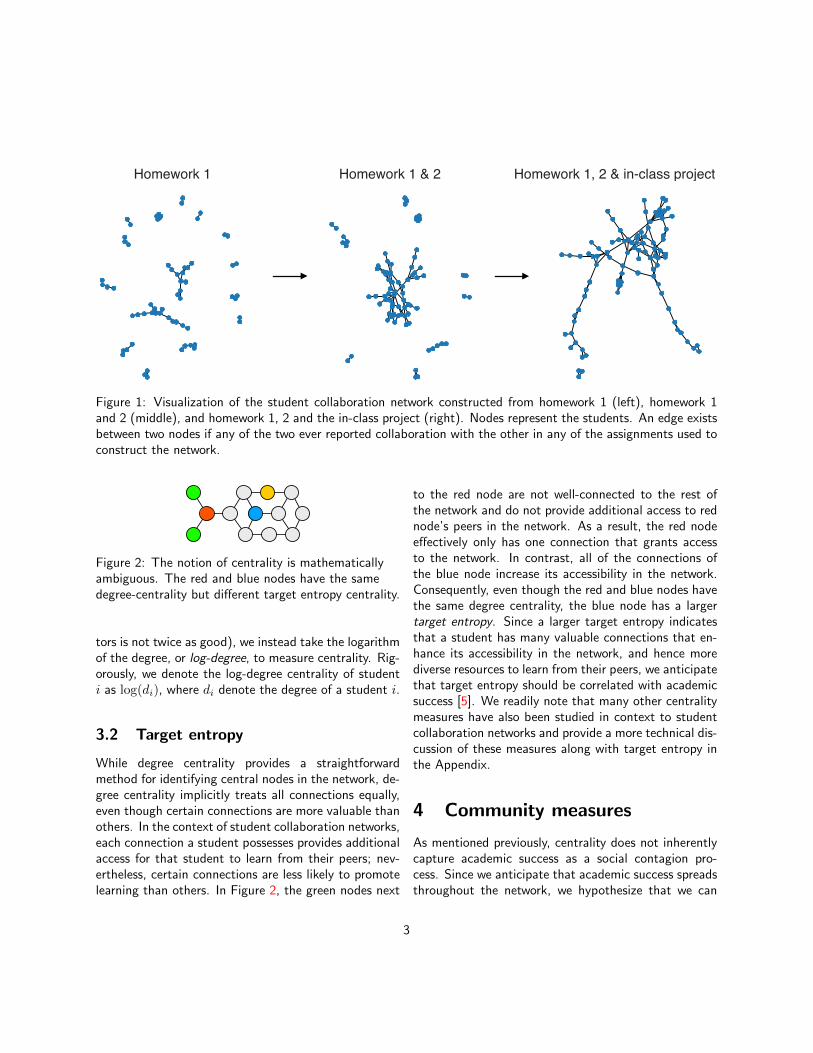
The simplest centrality measure is the degree of a nodewhich identifies the number of connections emanatingfrom that node. Observe that in Figure 2, the blueand red nodes both have a degree of 3, while the yellownode has a degree of 2. In the student collaboration net-work, the degree of a student indicates the number ofother students they collaborated with whether reportedby themselves and/or another student. Consequently,we anticipate that students who have many collabora-tors are more likely to succeed in the course. However,since studying with more student would likely have di-minishing returns (i.e., having twice as many collabora-
2
Homework 1 Homework 1 & 2 Homework 1, 2 & in-class project
Figure 1: Visualization of the student collaboration network constructed from homework 1 (left), homework 1and 2 (middle), and homework 1, 2 and the in-class project (right). Nodes represent the students. An edge existsbetween two nodes if any of the two ever reported collaboration with the other in any of the assignments used toconstruct the network.
Figure 2: The notion of centrality is mathematicallyambiguous. The red and blue nodes have the samedegree-centrality but different target entropy centrality.
tors is not twice as good), we instead take the logarithmof the degree, or log-degree, to measure centrality. Rig-orously, we denote the log-degree centrality of studenti as log(di), where di denote the degree of a student i.
3.2 Target entropy
While degree centrality provides a straightforwardmethod for identifying central nodes in the network, de-gree centrality implicitly treats all connections equally,even though certain connections are more valuable thanothers. In the context of student collaboration networks,each connection a student possesses provides additionalaccess for that student to learn from their peers; nev-ertheless, certain connections are less likely to promotelearning than others. In Figure 2, the green nodes next
to the red node are not well-connected to the rest ofthe network and do not provide additional access to rednode’s peers in the network. As a result, the red nodeeffectively only has one connection that grants accessto the network. In contrast, all of the connections ofthe blue node increase its accessibility in the network.Consequently, even though the red and blue nodes havethe same degree centrality, the blue node has a largertarget entropy. Since a larger target entropy indicatesthat a student has many valuable connections that en-hance its accessibility in the network, and hence morediverse resources to learn from their peers, we anticipatethat target entropy should be correlated with academicsuccess [5]. We readily note that many other centralitymeasures have also been studied in context to studentcollaboration networks and provide a more technical dis-cussion of these measures along with target entropy inthe Appendix.
4 Community measures
As mentioned previously, centrality does not inherentlycapture academic success as a social contagion pro-cess. Since we anticipate that academic success spreadsthroughout the network, we hypothesize that we can
3

more accurately predict academic outcomes by identify-ing groups of students that are more likely to influenceone another. We call these groups of nodes commu-nities. Mathematically, this suggests that nodes withinthe same community are more likely to be connectedwith one another. Consider the network in Figure 3,where there are three communities highlighted in pink,blue and yellow. Note that the yellow nodes tend to beconnected with one another. While the mathematicaldescription of a community may appear straightforward,there are in fact many definitions for a community andmany implementations for finding them [18]. We de-scribe two of these methods, Personalized Pagerank andInfomap below.
Figure 3: An illustration of communities in a hypoth-esized network. There are three disjoint communitieshighlighted in pink, blue and yellow, with denser connec-tions within communities than between communities.
4.1 Personalized Pagerank
Personalized Pagerank identifies a community for eachnode by performing a random walk on the network [1].Without loss of generality, below we describe the pro-cedure for constructing a personalized community for afocal node v. Suppose we are currently located at anygiven node in the network. With probability 1 − α wemove to a node picked uniformly at random from all thenodes connected to the current one, and with probabil-ity α we teleport to v. Through simulating many timesteps, we attain probabilities that we visit any node inthe network when v is the focal node. Accordingly, weuse those probabilities as the weights of other nodes
in v’s community. In other words, nodes with largerweights are more likely to be in v’s community.
In the left network displayed in Figure 4, we computedthe Personalized Pagerank for the star node, wherenodes with darker shades of red have larger Pagerankscores and hence are more likely to be in the commu-nity of the star node. Recalling our informal definitionof communities, observe that the darker nodes are morelikely to share a connection with each other. In fact,by including a rule that we teleport back to node v, weensure that nodes with large weights are typically closeto v.
At this juncture, we would like to emphasize that theoutput of this method produces a personalized com-munity. This means that nodes u and v can have largeweights in each others’ personalized community, but thepersonalized community for node u and the personalizedcommunity for node v can look different. Furthermore,note that in contrast to Figure 3, where we partitionnodes into fixed, disjoint clusters, Personalized Pager-ank is an example of a soft partition. We do not assign athreshold to determine whether a particular node is partof a community; the output of Personalized Pagerankonly provides weights to illustrate if a node is relativelysuited to be part of another node’s community.
After attaining the list of weights for each node’spersonalized community, we can then constructcommunity-weighted measures. For example, insteadof looking at an individual student’s self-rated confi-dence in the material, we can use these weights totake a weighted average of the confidence of that stu-dent’s personalized community, consisting of the peersthat are most likely to influence that student’s perfor-mance. When computing this weighted-average, we ex-clude that student from the computation. Naturally,we can apply the same technique to create other pre-dictors as well, including community-averaged interestscores and community-averaged SAT scores. By de-signing predictors that take into account the attributesof a student’s peers that are most likely to influencetheir academic performance, we are building a predic-tive model that is able to exploit the contagious natureof academic success.
4

Figure 4: Community structure in the student collaboration network constructed from all assignments. Left: Thepagerank score of everyone in the star node’s personalized community, with darker color corresponding to higherscore. Right: Communities identified by the Infomap method, with colors denoting different communities.
5
0
1
01
00
100
110
0
0
0
00
01
10
11
1
1
11
111
101
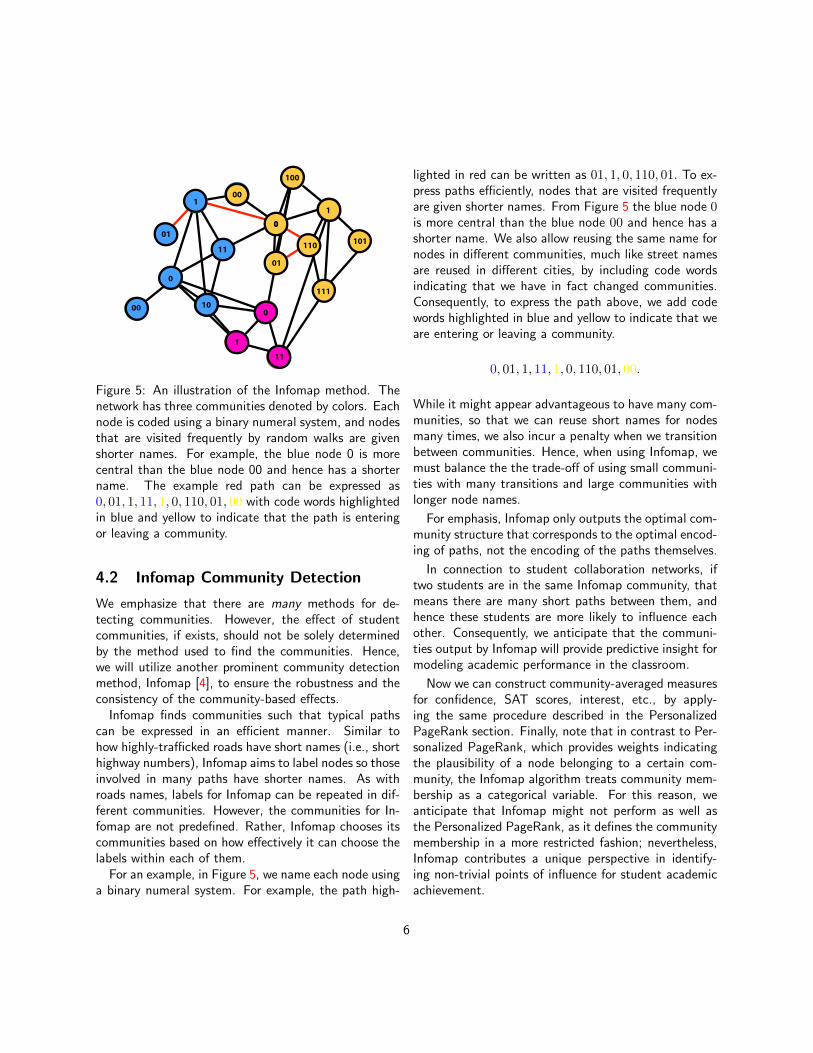
Figure 5: An illustration of the Infomap method. Thenetwork has three communities denoted by colors. Eachnode is coded using a binary numeral system, and nodesthat are visited frequently by random walks are givenshorter names. For example, the blue node 0 is morecentral than the blue node 00 and hence has a shortername. The example red path can be expressed as0, 01, 1, 11, 1, 0, 110, 01, 00 with code words highlightedin blue and yellow to indicate that the path is enteringor leaving a community.
4.2 Infomap Community Detection
We emphasize that there are many methods for de-tecting communities. However, the effect of studentcommunities, if exists, should not be solely determinedby the method used to find the communities. Hence,we will utilize another prominent community detectionmethod, Infomap [4], to ensure the robustness and theconsistency of the community-based effects.
Infomap finds communities such that typical pathscan be expressed in an efficient manner. Similar tohow highly-trafficked roads have short names (i.e., shorthighway numbers), Infomap aims to label nodes so thoseinvolved in many paths have shorter names. As withroads names, labels for Infomap can be repeated in dif-ferent communities. However, the communities for In-fomap are not predefined. Rather, Infomap chooses itscommunities based on how effectively it can choose thelabels within each of them.
For an example, in Figure 5, we name each node usinga binary numeral system. For example, the path high-
lighted in red can be written as 01, 1, 0, 110, 01. To ex-press paths efficiently, nodes that are visited frequentlyare given shorter names. From Figure 5 the blue node 0is more central than the blue node 00 and hence has ashorter name. We also allow reusing the same name fornodes in different communities, much like street namesare reused in different cities, by including code wordsindicating that we have in fact changed communities.Consequently, to express the path above, we add codewords highlighted in blue and yellow to indicate that weare entering or leaving a community.
0, 01, 1, 11, 1, 0, 110, 01, 00.
While it might appear advantageous to have many com-munities, so that we can reuse short names for nodesmany times, we also incur a penalty when we transitionbetween communities. Hence, when using Infomap, wemust balance the the trade-off of using small communi-ties with many transitions and large communities withlonger node names.
For emphasis, Infomap only outputs the optimal com-munity structure that corresponds to the optimal encod-ing of paths, not the encoding of the paths themselves.
In connection to student collaboration networks, iftwo students are in the same Infomap community, thatmeans there are many short paths between them, andhence these students are more likely to influence eachother. Consequently, we anticipate that the communi-ties output by Infomap will provide predictive insight formodeling academic performance in the classroom.
Now we can construct community-averaged measuresfor confidence, SAT scores, interest, etc., by apply-ing the same procedure described in the PersonalizedPageRank section. Finally, note that in contrast to Per-sonalized PageRank, which provides weights indicatingthe plausibility of a node belonging to a certain com-munity, the Infomap algorithm treats community mem-bership as a categorical variable. For this reason, weanticipate that Infomap might not perform as well asthe Personalized PageRank, as it defines the communitymembership in a more restricted fashion; nevertheless,Infomap contributes a unique perspective in identify-ing non-trivial points of influence for student academicachievement.
6

Predictor SectionConfidence, Interest, and SAT 2Log-Degree 3.1Target entropy 3.2Hide Appendix CPageRank Community Confidence 4.1PageRank Community Interest 4.1PageRank Community SAT 4.1Infomap Community Confidence 4.2Infomap Community Interest 4.2Infomap Community SAT 4.2
Table 1: Reference table for definitions of the predictorsused in the regression model.
5 Results
We build a series of linear regression models to pre-dict students’ final exam scores with the communitymeasures and other features of students as predictors.Specifically, we have three groups of predictors: (1)individual information including SAT scores and self-reported confidence and interest in the course; (2) net-work centrality measures including degree, target en-tropy and hide; (3) community-based measures includ-ing community-averaged SAT, confidence and interest.See Table 1 for a complete list of the predictors.
Accordingly, for the network at each time point, weestimate 3 families of models. The first family of mod-els use only the first group of predictors (i.e., individualinformation), and serve as the baseline of prediction.The second family of models add centrality measures tothe first and use both the first and the second group ofpredictors. They represent the state-of-the-art in pre-dicting academic performance from student networks[5, 13, 22]. Finally, the third family of models incorpo-rate the community-averaged measures into the secondand use all the predictors. A brief summary for whichpredictors are included in each of the three families ofmodels is shown in Table 2.
We then compare the different models to assess theempirical significance of the community measures. Inorder to evaluate community (or network) predictors,we only create predictions for students that have con-nections in the network. Since some students did not
report connections until later in the course, models cor-responding to earlier time shots would not generate pre-dictions for those students. Furthermore, we cannotcompare the R2 of those models directly since addingmore predictors will only increase the prediction accu-racy. Instead, we use Akaike information criteria (AIC)as the measure of model performance which penalizesmodels with more predictors [6]. Hence, for each fam-ily of models we perform a model selection based ontheir AIC’s and report the one with the optimal AIC.If the community measures do not sufficiently improvethe predictive performance, then they will not appear inthe optimal model from the third family of models.
We report the predictive performance of each of thethree families of models in Table 3 consisting of theR2 statistic and the evidence ratio between the over-all optimal model and each model listed in the table.Specifically, the evidence ratio compares the likelihoodof the overall optimal model with the likelihood of theoptimal model from each family listed, based on theirAIC scores. Therefore, smaller numbers of the evidenceratio indicate better performance, and a ratio of 1 meansthat the listed model is as good as the overall optimalmodel.
From the evidence ratios listed in the column forHomework 1 (HW 1), we note that while the network-based models appear competitive with the baseline(non-network) model, the network models do not yielda substantial improvement over the baseline model. Weattribute this result to a lack of network data, since theaverage number of connections per node is close to 1and the network is too sparse.
After attaining the homework 2 collaboration data,the average number of connections per node is close to2 and the network is significantly more connected. Con-sequently, adding community predictors yields a 62%increase in R2 from the baseline model and a 40% in-crease in R2 from the centrality model. The evidenceratios also begin to demonstrate the improvement fromthe community predictors; for example, from the AICevidence ratios, the optimal Infomap Community modelis the overall optimal model, and it is 8.65 times morelikely than the baseline models given our data.
Since we conjecture that academic success spreadslike a biological contagion, we anticipate that we canimprove our predictions by including network data that
7

Community ModelsPredictors Baseline Models Centrality Models Pagerank InfomapConfidence x x x xInterest x x x xSAT x x x xLog-Degree x x xTarget Entropy x x xHide x x xPagerank Confidence xPagerank Interest xPagerank SAT xInfomap Confidence xInfomap Interest xInfomap SAT x
Table 2: Quick look-up table for which predictors are included in each the three families of models.
R2 Evidence RatioHW 1 HW 2 In-Class HW 1 HW 2 In-Class
Baseline Model .117 .161 .225 1.00 8.56 560.39Centrality Model .126 .187 .276 1.95 6.39 67.56Infomap Community Model .138 .261 .345 1.26 1.00 4.87PageRank Community Model .133 .246 .367 1.51 2.27 1.00
Table 3: Predictive performance of each of the three families of models. The evidence ratio is the ratio betweenthe likelihood of the overall optimal model and the likelihood of the optimal model from each family listed, basedon their AIC scores. Therefore, smaller numbers of the evidence ratio indicate better performance, and a ratio of1 means that the listed model is as good as the overall optimal model.
8

captures how students interact both inside and out-side the classroom. When we include the connectionsfrom the in-class project, we attain statistically signifi-cant improvements by using community predictors. Inparticular, the optimal PageRank Community Model is560 times more likely than the Baseline (non-network)Model and 68 times more likely than the optimal Cen-trality Model, given our data. Furthermore, these com-munity predictors result in a 63% increase in R2 fromthe baseline model and a 33% increase in R2 from thecentrality model. We specify the coefficients for this op-timal Pagerank Community Model in Table 4. In partic-ular, we observe that even though the Interest variabledoes not appear in the optimal model, its communityanalogue, Pagerank Interest is present in the model.Furthermore, the p-values for both of the communitypredictors are substantially smaller than the centralitypredictor, Target Entropy. Consequently, our analysisemphasizes the importance of including network com-munity predictors to build accurate models for predict-ing academic success.
6 Discussion and Conclusion
We propose novel predictors for academic performancebased on a student’s learning communities, consistingof the peers that are most likely to influence a student’sacademic performance in a homework collaboration net-work. Using only the first two homework assignmentsand one in-class assignment, we find that the networkcommunity-based models are 560 times more likely thanmodels that use non-network predictors alone, given ourdata. We also note that the network community-basedmodel is 68 times more likely than the state-of-the-artnetwork centrality-based models. As a result, the accu-racy of the community-based model suggests the con-tagious nature of academic success on social networks,similar to other intangible properties such as happinessor obesity.
When building the aforementioned predictive mod-els for academic performance, we deliberately avoidedpredictors that incorporate homework and exam grades,(which are often not available at the beginning of acourse). Since we suspect students’ midterm gradesinfluenced the self-rated confidence scores reported in
Homework 3-5, we focused our analysis on the datacollected from Homework 1-2 and the In-Class Assign-ment, which capture 85% of the network connectionsreported throughout the study (Table 5). In particular,we observe that the midterm had a marginal impact onthe formation of new homework collaborations. On ac-count of the rapid stabilization of the network, we caninfer that the collaborations recorded from the in-classassignment, which took place after the midterm, werepresent before the midterm. Consequently, the perfor-mance of the community network models highlight thevalue of using community-based predictors for detectingacademically at-risk students early in the course, whengrades are not available.
Since our work only establishes a correlation betweenacademic performance and the community predictors,further analysis is necessary to measure the causal effectof learning communities on academic performance. Fur-thermore, our work exclusively utilizes linear models toevaluate the utility of community predictors in modelingacademic outcomes, even though there are many othermodels for predicting academic performance. Conse-quently, we look forward to the development of data-driven approaches that leverage both state-of-the-artmachine learning techniques and network communityanalysis to inform pedagogic practices in the classroom.With these community-based predictors, we anticipatethat our work will provide instructors with new toolsto quickly and accurately identify academically at-riskstudents.
References
[1] Reid Andersen, Fan Chung, and Kevin Lang. Lo-cal graph partitioning using pagerank vectors. InFoundations of Computer Science, 2006. FOCS’06.47th Annual IEEE Symposium on, pages 475–486.IEEE, 2006.
[2] Timothy T Baldwin, Michael D Bedell, andJonathan L Johnson. The social fabric of a team-based mba program: Network effects on studentsatisfaction and performance. Academy of man-agement journal, 40(6):1369–1397, 1997.
9

Coefficient 95% Confidence Interval p-value
Confidence 4.46 (2.18, 6.75) .0002PageRank Confidence 20.06 (8.75, 31.37) .0006
PageRank Interest -13.76 (-23.82, -3.70) .0079SAT 0.05 (0.02, 0.09) .0021
Target Entropy 5.42 (0.94, 9.90) .0184
Table 4: The regression results for the optimal model using the Homework 1, 2 and in-class network data.
Homework 1 Homework 2 Homework 3 Homework 4 In-class project Homework 5Nodes 103 103 103 103 103 103Edges 119 176 197 212 275 281
Table 5: The growth of edges in the student collaboration networks.
[3] Deanna Blansky, Christina Kavanaugh, CaraBoothroyd, Brianna Benson, Julie Gallagher, JohnEndress, and Hiroki Sayama. Spread of academicsuccess in a high school social network. PloS one,8(2):e55944, 2013.
[4] Ludvig Bohlin, Daniel Edler, Andrea Lancichinetti,and Martin Rosvall. Community detection andvisualization of networks with the map equationframework. In Measuring Scholarly Impact, pages3–34. Springer, 2014.
[5] Jesper Bruun and Eric Brewe. Talking and learn-ing physics: Predicting future grades from net-work measures and force concept inventory pretestscores. Physical Review Special Topics-Physics Ed-ucation Research, 9(2):020109, 2013.
[6] Kenneth P Burnham and David R Anderson. Mul-timodel inference: understanding aic and bic inmodel selection. Sociological methods & research,33(2):261–304, 2004.
[7] Nicholas A Christakis and James H Fowler. Socialnetwork sensors for early detection of contagiousoutbreaks. PloS one, 5(9):e12948, 2010.
[8] Reuven Cohen, Shlomo Havlin, and Daniel Ben-Avraham. Efficient immunization strategies forcomputer networks and populations. Physical re-view letters, 91(24):247901, 2003.
[9] Jessica M Dennis, Jean S Phinney, and Lizette IvyChuateco. The role of motivation, parental sup-port, and peer support in the academic suc-cess of ethnic minority first-generation college stu-dents. Journal of College Student Development,46(3):223–236, 2005.
[10] Neil J Dorans. Correspondences between act andsat i scores. college board report no. 99-1. ets rr no.99-2. College Entrance Examination Board, 1999.
[11] James H Fowler and Nicholas A Christakis. Dy-namic spread of happiness in a large social network:longitudinal analysis over 20 years in the framing-ham heart study. Bmj, 337:a2338, 2008.
[12] Dragan Gasevic, Amal Zouaq, and Robert Janzen.choose your classmates, your gpa is at stake!the association of cross-class social ties and aca-demic performance. American Behavioral Scientist,57(10):1460–1479, 2013.
[13] Daniel Z Grunspan, Benjamin L Wiggins, andSteven M Goodreau. Understanding classroomsthrough social network analysis: A primer for socialnetwork analysis in education research. CBE-LifeSciences Education, 13(2):167–178, 2014.
[14] Nathan O Hodas and Kristina Lerman. The simplerules of social contagion. Scientific reports, 4:4343,2014.
10

[15] David W Johnson, Roger T Johnson, and KarlSmith. The state of cooperative learning in post-secondary and professional settings. EducationalPsychology Review, 19(1):15–29, 2007.
[16] David W Johnson, Roger T Johnson, and Karl ASmith. Cooperative learning: Improving univer-sity instruction by basing practice on validated the-ory. Journal on Excellence in University Teaching,25(4):1–26, 2014.
[17] Jennifer L Kobrin and Rochelle S Michel. The satas a predictor of different levels of college perfor-mance. 2006.
[18] Andrea Lancichinetti and Santo Fortunato. Com-munity detection algorithms: a comparative anal-ysis. Physical review E, 80(5):056117, 2009.
[19] Janice McCabe. Friends with academic benefits.Contexts, 15(3):22–29, 2016.
[20] Lawrence Page, Sergey Brin, Rajeev Motwani, andTerry Winograd. The pagerank citation ranking:Bringing order to the web. Technical report, Stan-ford InfoLab, 1999.
[21] Goran Putnik, Eric Costa, Catia Alves, Helio Cas-tro, Leonilde Varela, and Vaibhav Shah. Analysingthe correlation between social network analysismeasures and performance of students in socialnetwork-based engineering education. Interna-tional Journal of Technology and Design Educa-tion, 26(3):413–437, 2016.
[22] Scott L Thomas. Ties that bind: A social net-work approach to understanding student integra-tion and persistence. The journal of higher educa-tion, 71(5):591–615, 2000.
A PageRank Centrality
PageRank was originally developed to rank webpageson the internet to determine which ones are more in-fluential [20], and it is a special case of the eigenvectorcentrality. The eigenvector centrality of a network isgiven by the eigenvector v corresponding to the maxi-mum eigenvalue of the adjacency matrix of the network.
PageRank is an adjusted eigenvector with a tuning pa-rameter (also known as jumping parameter) α. For astrongly connected graph, it is the solution to the gen-eralized eigenvector equation
xα = αATD−1xα + (1− α)1n
where A is the adjacency matrix, D is the diagonaldegree matrix, and 1 is the all-one vector.
PageRank can also be defined by the following ran-dom process: Start at a random node, with probabilityα move to a random adjacent node; otherwise (withprobability 1 − α), jump to a random node. Then, re-peat the process. The PageRank vector, xα is the vec-tor describing the limiting probability you will visit eachvertex after a large number of steps.
B Target Entropy
For a given node i, imagine that each other node senda message to i, and the messages travel along shortestpaths. If there are N > 1 shortest paths between somenode and i, split the message evenly so that each short-est path carries 1/N message. For each neighbor j ofi, let mij be the number of messages i received fromj. The messages can be originated from j or forwardedby j, and the number mij is not necessarily a wholenumber since a message could be split between multi-ple shortest paths. Lastly, let Mi be the total numberof messages i received, and cij be mij/Mi, the fractionof messages from j. The target entropy of i is definedas
Ti = −∑j∼i
cij log(cij)
It is easier to interpret the target entropy with a hy-pothetical example. Assume a student A who interactswith many other students who are highly connected inthe network; and another student B who has equallymany friends but most of her friends are only connectedto her. Then A would have larger target entropy thanB. What this means is that A has many sources of infor-mation while B, being the source of information amongher community, does not have as many sources of in-formation as A.
11

C Hide
Hide describes how hard a node can be found within anetwork [5]. A hard to find node is usually lacking inter-actions with other nodes, hence providing informationon the constraints that the student might experience.In our context, A student with high hide score mightnot have the same access to ideas and information as astudent with low hide.
To introduce the definition of hide, we first definethe search information S(i, j) from node i to node j.Let i → j denote a shortest path from i to j, andk − k′ ∈ i → j be any consecutive two nodes on thepath from i to j. Then the probability of a random walkfollowing the path i→ j can be calculated as
P (i→ j) =∏
k−k′∈i→j
wkk′
soutk
,
where wkk′ is the weight of edge k− k′ and soutk is theout-strength of node k. The product is taken over alladjacent edges on the path.
The search information from i to j is then defined as:
S(i, j) = − log2(∑i→j
P (i→ j)),
where the summation is taken over all shortest pathsfrom i to j. The search information quantifies howmuch information a random walk needs to go from i toj. It S(i, j) is large, then it is hard to find j from isince it requires a lot of information.
Finally, the hide score Hi of a node i is defined asthe average information needed to find i from any othernodes:
Hi =1
N − 1
∑j∈V,j 6=i
S(j, i),
where N is the number of nodes in the networks, andV is the set of nodes.
D Personalized Pagerank
The personalized Pagerank community of a node, v isgiven by solving a slightly different generalized eigen-vector equation
xvα = αATD−1xvα + (1− α)1v,
where A is the adjacency matrix, D is the diagonaldegree matrix, α is a predetermined jumping parameter,and 1v is the indicator vector for node v. The result isa probability distribution on all the nodes, “centered”around v.
It should be noted that in many cases the vector xvαis heavily supported at node v. Further, if v is isolated,the vector xvα is precisely 1v.
E Infomap
Infomap uses a random walk on a network as a proxyfor the information flow on the network, and aims tofind a partition of the nodes such that the descriptionlength of random walks on the network is minimized. Asan analogy in geography, think of each community as acity and the nodes as street addresses. Then a randomwalk can be described by enumerating the names of allthe city and street names visited by the random walk.This description has a certain length and this length canchange if the city and street names change. Hence, thecommunity detection problem is equivalent to solving anoptimal coding problem. Mathematically, the averagedescription length of a single step of random walks ona network is given by
L(M) = qH(Q) +
m∑i=1
piH(P i), (1)
where M is a given partition of the network, q is theprobability that the random walk switches communi-ties on any given step, H(Q) is the entropy of thecommunity names, H(P i) is the entropy of the within-community movements, and pi is the fraction of within-module movements that occur in community i, plus theprobability of exiting community i. In the end, the out-put of this method is the partition M of nodes thatminimizes this description length.
12