Levels and Key Factors in Implementation of CAD/CAM/CAE ...
126
Knowledge and Technology Transfer: Levels and Key Factors in Implementation of CAD/CAM/CAE Systems in Context of Manufacturing in Thailand by Pondchanok Piraintorn A thesis submitted in partial fulfillment of the requirements for the degree of Master of Science in Industrial and Manufacturing Engineering Examination Committee: Assoc. Prof. Erik L.J. Bohez (Co-chairperson) Dr. Mongkol Ekpanyapong (Co-chairperson) Dr. Huynh Trung Luong Dr. Than Lin Mr. Khoopkomen Wiriyapirom (External Expert) Nationality: Thai Previous Degree: Bachelor of Science in Actuarial Science Mahidol University Thailand Scholarship Donor: Royal Thai Government Fellowship Asian Institute of Technology School of Engineering and Technology Thailand May 2017
-
Upload
khangminh22 -
Category
Documents
-
view
0 -
download
0
Transcript of Levels and Key Factors in Implementation of CAD/CAM/CAE ...

Knowledge and Technology Transfer: Levels and Key Factors in
Implementation of CAD/CAM/CAE Systems in
Context of Manufacturing in Thailand
by
Pondchanok Piraintorn
A thesis submitted in partial fulfillment of the requirements for the
degree of Master of Science in
Industrial and Manufacturing Engineering
Examination Committee: Assoc. Prof. Erik L.J. Bohez (Co-chairperson)
Dr. Mongkol Ekpanyapong (Co-chairperson)
Dr. Huynh Trung Luong
Dr. Than Lin
Mr. Khoopkomen Wiriyapirom (External Expert)
Nationality: Thai
Previous Degree: Bachelor of Science in Actuarial Science
Mahidol University
Thailand
Scholarship Donor: Royal Thai Government Fellowship
Asian Institute of Technology
School of Engineering and Technology
Thailand
May 2017

ii
ACKNOWLEDGEMENTS
First of all, I would like to express my gratitude and my sincere thanks to Assoc. Prof.
Erik L.J Bohez for being my advisor and giving me a valuable suggestions, inspiration
and interesting lecture. Furthermore, he has continued giving me stimulation and
guidance help in all the time of research and writing of this thesis.
Sincere thanks are conveyed to the rest of my thesis committee: Dr. Mongkol
Ekpanyapong, Dr. Huynh Trung Luong, Dr. Than Lin and Mr. Khoopkomen
Wiriyapirom for their insightful comments and encouragement, but also for the hard
question which incented me to widen my research from various perspectives.
My sincere thanks also go to Dr. Vimolwan Yukongdi and Dr. Jariyaporn Onwong for
their valuable suggestion. Without they precious support it would not be possible to
conduct this research.
I also would like to express a special thanks to Mr. Somchai Taopanich, a laboratory
technician for special advice, help, guidance and coordinate with every section, no matter
faculty, company or institute throughout my thesis.
Special thanks to SPITTA PPSC joint venture that allowed me to work with. Also,
special thanks to C.C.S Group of Companies, Thai-German Institute (TGI), Electricity
Generating Authority of Thailand (EGAT) and all of companies in Appendix C for
supporting more information.
I am thankful to all my teachers, faculty staffs, seniors and juniors in department of
Industrial Systems Engineering (ISE) for their kind guidance and help throughout my
time in Asian Institute of Technology (AIT).
It is with immense gratitude that I acknowledge the support from Royal Thai
Government (RTG) Fellowship. This Master’s degree study cannot be accomplished
without its assistance.
Finally, words are never enough to express my deep gratitude to my family and my
friends whose love for their inspiration and encouragements to complete my master
degree program. Without them, this study would not be done. Thanks once again.

iii
ABSTRACT
Many countries endorse technology transfer to reduce cost and to increase employment
efficiency and productivity. Technology transfer requires partners’ collaboration and
readiness from the receiving end. Due to the difficulty in the production process and the
complexity of the information and communication, knowledge and technology transfer
is introduced to help deal with the present challenges of manufacturing. Knowledge and
technology transfer is an effective method of development that supports production
strategy. Therefore, this research aims to develop a framework to assess the level and
key factors for the knowledge and technology transfer to implement CAD/CAM/CAE
system in manufacturing in Thai society. Data gathering through questionnaire was
done with questions applied from the related empirical researches. The content validity
and the test of reliability were verified by experts in CAD/CAM/CAE field. A pilot test
was conducted using the questionnaire from the sample groups who use
CAD/CAM/CAE technology in organization. The data were analyzed by various types
of statistic in order to identify the extent of technology transferred. The background
information will be presented in order for the respondents to have a full understanding
of the study. Lastly, a guideline of the levels and key factors affecting the knowledge
and technology transfer; and a practical guideline for implementation of
CAD/CAM/CAE system in context of manufacturing in Thailand was recommended.
Keywords: Knowledge, Technology Transfer, CAD/CAM/CAE System

iv
TABLE OF CONTENTS
CHAPTER TITLE PAGE
TITLE PAGE i
ACKNOWLEDGEMENTS ii
ABSTRACT iii
TABLE OF CONTENTS iv
LIST OF FIGURES vii
LIST OF TABLES
LIST OF ABBREVIATIONS
ix
x
1
2
INTRODUCTION
1.1 Problem Background
1.2 Problem Statement
1.3 Objectives
1.4 Scope and Limitations
LITERATURE REVIEW
2.1 Knowledge
2.2 Tacit Knowledge
2.3 Explicit Knowledge 2.4 Technology
2.5 Technology S-Curve
2.6 Technology Gap
2.7 Technology Acceptance
2.8 Theory of Reasoned Action (TRA)
2.9 Theory of Planned Behavior (TPB)
2.10 Technology Acceptance Model (TAM)
2.11 Case Study of Technology Acceptance
2.12 Case Study I (E-Books’ Purchase Decisions)
2.12.1 Technology Acceptance and Online Consumer Behavior
Affecting E-Books’ Purchase Decisions of Customers in
Bangkok
2.12.2 Statement of The Problems (Case Study I)
2.12.3 The Relevant Model, The Approach Used, and Solution
Method (Case Study I)
2.12.4 Summary (Case Study I)
2.13 Case Study II (Basic Education in Thailand)
2.13.1 The Acceptance and Use of Technology Tablet for
Educational: The Context of Basic Education in
Thailand
2.13.2 Statement of The Problems (Case Study II)
2.13.3 The Relevant Model, The Approach Used, and Solution
Method (Case Study II)
2.13.4 Summary (Case Study II)
2.14 Comparison Case Study of Technology Acceptance
2.15 Knowledge and Technology Transfer
1
1
1
1
1
2
2
2
2
3
3
4
4
5
6
7
7
7
7
8
8
9
9
9
9
9
10
10
14

v
3
4
2.16 Technology Readiness Level
2.17 Technology Readiness Level Assessment
2.18 Technology Readiness Risk Assessment
2.19 Key Factors in Knowledge and Technology Transfer
2.20 Case Study of Technology Transfer
2.21 Case Study I (Carbon Capture Simulation Initiative)
2.21.1 Development of Technology Readiness Level (TRL)
Metrics and Risk Measures
2.21.2 Statement of The Problems (Case Study I)
2.21.3 The Relevant Model, The Approach Used, and Solution
Method (Case Study I)
2.21.4 Summary (Case Study I)
2.22 Case Study II (Microelectronics and Computer
Technology Corporation – MCC)
2.22.1 Knowledge and Technology Transfer: Levels and Key
Factors
2.22.2 Statement of The Problems (Case Study II)
2.22.3 The Relevant Model, The Approach Used, and Solution
Method (Case Study II)
2.22.4 Summary (Case Study II)
2.23 Case Study III (Thailand’s Automotive Parts Industry)
2.23.1 International Technology Transfer Analyzed at
The Technology Component Level: A Case Study of
Thailand’s Automotive Parts Industry
2.23.2 Statement of The Problems (Case Study III)
2.23.3 The Relevant Model, The Approach Used, and Solution
Method (Case Study III)
2.23.4 Summary (Case Study III)
2.24 Comparison Case Study of Technology Transfer
METHODOLOGY
3.1 Study Phase
3.2 Development Phase
3.2.1 Collect Data
3.2.2 Develop a Framework
3.3 Verification Phase
3.3.1 Check Content Validity and Reliability
3.3.2 Collect Data
3.4 Evaluation Phase
DATA COLLECTION
4.1 Collect Data (Development Phase)
4.1.1 Secondary Information
4.1.2 Primary Information
4.2 Collect Data (Verification Phase)
4.2.1 Primary Information
15
17
17
17
18
18
18
19
19
20
20
20
20
21
23
23
23
23
24
25
25
29
30
30
30
30
33
33
34
34
33
36
36
46
49
49

vi
5
6
RESULTS AND DISCUSSIONS
5.1 Results and Discussions of Verification Phase
5.1.1 Results and Discussions of Check Content Validity and
Reliability
5.2 Results and Discussions of Evaluation Phase
5.2.1 Descriptive Statistics (Percentage, Mean and Standard
Deviation)
5.2.2 General Information
5.2.3 State of Using CAD/CAM/CAE in Company 5.2.4 Before Implementation Period (Preparation Period)
5.2.5 Implementation Period 5.2.6 After Implementation Period
5.2.7 The Problem of Implementation CAD/CAM/CAE in
Company
5.2.8 Inferential Statistics (Hypothesis Testing: One-Way
ANOVA)
5.2.9 Hypothesis 1
5.2.10 Hypothesis 2
5.2.11 Hypothesis 3
5.2.12 Hypothesis 4
5.2.13 Hypothesis 5
5.2.14 Hypothesis 6
5.2.15 Hypothesis 7
5.2.16 Hypothesis 8
CONCLUSIONS AND RECOMMENDATION
6.1 Conclusions
6.1.1 General Information
6.1.2 State of Using CAD/CAM/CAE in Company
6.1.3 Before Implementation Period (Preparation Period)
6.1.4 Implementation Period
6.1.5 After Implementation Period
6.1.6 The Problem of Implementation CAD/CAM/CAE in
Company
6.1.7 Hypothesis Testing: One-Way ANOVA)
6.2 Recommendations
BIBLIOGRAPHY/REFERENCE
APPENDICES
52
52
52
54
54
54
56
63
69
71
73
75
75
76
78
79
80
80
82
82
84
84
84
84
84
85
85
85
85
86
87
93

vii
LIST OF FIGURES
FIGURE TITLE PAGE
Figure 2.1
Figure 2.2
Figure 2.3
Figure 2.4
Figure 2.5
Figure 2.6
Technology S-Curve – Technology Gap
Theory of Reasoned Action (TRA)
Theory of Planned Behavior (TPB)
Technology Acceptance Model (TAM)
Research Model
Four Levels of Knowledge and Technology Transfer
3
5
6
7
10
14
Figure 2.7 Technology Readiness Level 16
Figure 2.8
Figure 3.1
Figure 3.2
Figure 4.1
Figure 4.2
Figure 4.3
Figure 4.4
Figure 4.5
Figure 4.6
Figure 4.7
Figure 4.8
Figure 4.9
Figure 4.10
Figure 4.11
Figure 4.12
Figure 4.13
Figure 4.14
Figure 4.15
Figure 4.16
Knowledge and Technology Transfer Grid
Research Flow
Conceptual Framework Computer Aided Design Program
The Example of Using CAD to Create Surface and Solid
Modeling
The Example of Using CAD to Create Wire-Frame Modeling
The Computer Aided Manufacturing Program
The Computer Aided Engineering Program
The Example of Using CNC Machine
CAD Model and CNC Machine Part
G-Code in CNC Machine
Creating Modeling Part by CAD
Analyzing Modeling Part by CAE
Stimulating Toolpath by CAM
Coordinated Measuring Machine
Types of CMM
Probe Tools
The Diagram Showing The Procedure of CAI
Designed Model and Measured Data
18
29
31
36
37
37
38
39
40
40
40
41
41
42
43
43
44
45
46

viii
LIST OF TABLES
TABLE TITLE PAGE
Table 2.1
Table 2.2
Table 2.3
Table 2.4
Table 2.5
Table 2.6
Table 2.7
Table 2.8
Table 2.9
Table 2.10
Table 5.1
Table 5.2
Table 5.3
Table 5.4
Table 5.5
Table 5.6
Table 5.7
Table 5.8
Table 5.9
Table 5.10
Table 5.11
Table 5.12
Table 5.13
Table 5.14
Table 5.15
Comparison of Case Study I/II (Technology Acceptance)
PROS/CONS of Case Study I/II (Technology Acceptance)
Proposed TRL Scale for Carbon Capture
Example Case Showing Probability of Completing Each TRL
Descriptive Statistics of Research Variables
Results of Factor Analysis on Research Variables
The Results of Cluster Analysis
Technology Gap for Products and Production Process/Equipment
Comparison of Case Study I/II/III (Technology Transfer)
PROS/CONS of Case Study I/II/III (Technology Transfer)
Results of Check Content Validity and Reliability
Number and Percentage of Sampled Respondent on General
Information
Number and Percentage of Sampled Respondent on State of
Using CAD/CAM/CAE in Company
Percentage, Average, Standard Deviation, and Level Importance
Have/Buy/Use CAD/CAM/CAE Technology
Number and Percentage of Sampled Respondent on Before
Implementation Period (Preparation Period)
Number and Percentage of Sampled Respondent on
Implementation Period
Percentage, Average, Standard Deviation and Level of Influential
Factors in CAD/CAM/CAE Implementation
Number and Percentage of Sampled Respondent After
Implementation Period
Percentage, Average, Standard Deviation and Level of The
Change After Implement CAD/CAM/CAE Technology
Percentage, Average, Standard Deviation and Level of Problem
of Implementation CAD/CAM/CAE in Company
Comparison of The Different Factors Affecting Level of
Importance of Have/Buy/Use of CAD/CAM/CAE Technology
Classified by CAD Software in The Company
Comparison of The Different Factors Affecting Level of
Importance of Have/Buy/Use of CAD/CAM/CAE Technology
Classified by CAM Software in The Company
Comparison of The Different Factors Affecting Level of
Importance of Have/Buy/Use of CAD/CAM/CAE Technology
Classified by CAE Software in The Company
Comparison of the Different Influential Factors Affecting Level
Implementation of CAD/CAM/CAE Classified by CAD Skills
and Understanding
Comparison of The Different Influential Factors Affecting Level
Implementation of CAD/CAM/CAE Classified by CAM Skills
and Understanding
11
13
19
20
21
22
22
24
26
28
52
54
56
62
63
69
70
71
72
73
75
77
78
79
80

ix
Table 5.16
Table 5.17
Table 5.18
Comparison of The Different Influential Factors Affecting Level
Implementation of CAD/CAM/CAE Classified by CAE Skills
and Understanding
Comparison of The Different Factors Affecting The Problem in
Implementation of CAD/CAM/CAE, Faceting on
CAD/CAM/CAE Software Product
Comparison of The Different Factors Affecting The Problem in
Implementation of CAD/CAM/CAE, Faceting on Production
Process and Equipment of CAD/CAM/CAE Software Product
81
82
83

x
LIST OF ABBREVIATIONS
AIT Asian Institute of Technology
CAD Computer Aided Design
CAE Computer Aided Engineering
CAI Computer Aided Inspection
CAM Computer Aided Manufacturing
CCD Change-Coupled Device
CCSI Carbon Capture Simulation Initiative
CMM Coordinate Measuring Machine
CNC Computer Numerical Control
EGAT Electricity Generating Authority of Thailand
ERP Enterprise Resource Planning
GD&T Geometry Dimensional and Tolerance
IOC Index of Congruence
ISE Industrial Systems Engineering
MRO Maintenance, Repair, and Operations
NATO North Atlantic Treaty Organization
OEM Original Equipment Manufacturer
R&D Research and Development
RTG Royal Thai Government
SAP Systems Application Products
TAM Technology Acceptance Model
TGI Thai-German Institute
TPB Theory of Planned Behavior
TRA Technology Readiness Assessment
TRA Theory of Reasoned Action
TRL Technology Readiness Level
QC Quality Control
SEM Structural Equation Model

1
CHAPTER 1
INTRODUCTION
1.1 Problem Background
It is now fully recognized that Technology has become a significant player in the
economic advancement of any developing countries. Developing countries therefore are
realizing the importance of “catching up” and reducing the technology gap between
themselves and many of developed countries. However, it will take much time and
resource for developing countries to grow their own competences in an attempt to lessen
this technology gap. Many therefore look towards technology transfer as a solution.
They can acquire technology to help fasten their understanding or even to leapfrog to
the next technology. Furthermore, Government can also assist the process of technology
transfer. They are able to play an important role by developing friendly policies and
incentives to encouraging foreign investment into their own country.
1.2 Problem Statement
An application of technology is an important factor for improving operation in an
organization; small, medium, and large company as technology can help organization
enhancing its performances of effectiveness, efficiency, product quality, responsiveness
and competitive advantage. Currently, CAD/CAM/CAE technology applied in the Thai
manufacturing is inadequately managed and exploited. This results in lower degree of
utilization.
1.3 Objectives
● To study knowledge and technology transfer, level and key problem in
implementing of CAD/CAM/CAE system in context of manufacturing in
Thailand.
● To identify the key factors in implementing of CAD/CAM/CAE system
in context of manufacturing in Thailand.
● To suggest the practical guideline in implementing of CAD/CAM/CAE
system in context of manufacturing in Thailand.
1.4 Scope and Limitations
This study focuses only on central of Thailand to study knowledge and technology
transfer: levels and key factors in implementation of CAD/CAM/CAE systems in
context of manufacturing in Thailand due to time limitation.

2
CHAPTER 2
LITERATURE REVIEW
2.1 Knowledge
Knowledge is the understanding of topics in terms of theories or practical usage. The
understanding of knowledge can range from practical skills to theories, as there are no
requirements for the topic to be known formally or informally to be categorized as
knowledge (Stevenson, 2010). Epistemology, the study of knowledge, is what Plato
referred as “justified true belief” and many philosophers agreed with the claims,
although the Gettier problems pose a challenge to the statement (Gulley, 2013). There
are several ways that people define knowledge and come up with theories to explain
their existence. Using complex cognitive processes that involved perception,
communication and reasoning can lay out how knowledge is acquired (Dekel, 2009)
although knowledge is limited by the capability of a human being by their
acknowledgment (Cavell, 2015).
2.2 Tacit Knowledge
Tacit knowledge is the knowledge that people acquired, although these skills are
difficult to transfer or to express to others. This knowledge includes skills, ideas, and
experiences (Chugh, 2015). People do not usually recognize their own tacit knowledge
that they possess or understand its importance for others without the knowledge. In
order to transfer this tacit knowledge, close personal interaction is required to
effectively transfer tacit knowledge (Goffin and Koners, 2011). As mentioned, tacit
knowledge cannot be easily written down as learning the skill is required. It means that
experts are people that know how to do things with ease without needing to rely on
principles and rules (theories) (Schmidt and Hunter,1993).
2.3 Explicit Knowledge
Explicit knowledge can be expressed through writing or speaking easily (Frixione and
Lieto, 2014). They have high accessibility to the readers and can be easily stored in
various media, such as textbooks, which are considered to be the most common forms
of explicit knowledge (Dalkir and Liebowitz, 2011). How-to videos, audio-visual and
works of art can be included as other kinds of explicit knowledge, where skills, motives,
and knowledge are portrayed (Koskinen, 2013).
2.4 Technology
According to Hughes (2004), human creativity and invention create technology as a
creative process. Technology deals with the use of knowledge that combines and applies
various technical aspects. The application is drawn from the interaction of human
activities in the society, nature and creating a branch of knowledge in natural science
(House, 2015). The application that technology gives can be viewed as a process that
constantly shaped culture (Borgmann, 2006). Technology is defined in different forms,
in which it can be in the form of social relationship, hardware, software and brainware
that connects to each other where all of the components are equally important and
should be balanced equally (Sharif (1986). The fourth component of technology is
technology support network, where the technology is embodied. Technology Atlas

3
Team (1987) defined technology in embodied technology in diverse forms, Technoware
(object-embodied technology), Humanware (person-embodied technology), Inforware
(document-embodied technology) and Orgaware (institution-embodied technology). By
this definition, the resource transformation process operates on a formed based and all
four components are used simultaneously.
2.5 Technology S-Curve
The technology S-curve is the phenomenon describing the growth of technology, where
technology growth in the first period shows slow growth but gradually becomes faster
as a new breakthrough is made and reaches a ceiling at some point (Sood, 2010). This
phenomenon has become the main focus in technology strategy, which displays the
potential of technological improvement and its development pattern. This connotes that
improvement for a product or process requires a certain amount of time and effort
before emerging into an effective stage. As more studies and researches are being done
on the technology the faster, the growth the technology becomes (Sahal, 1981). Thus
the technology S-curve served as a useful framework that describes the substitution of
previous technology into a new one in industry level (Christensen, 1992).
2.6 Technology Gap
The variances in technological advancement between two subjects are called technology
gap. The gap implies that technology is not adopted across the globe in a spontaneous
manner when a new advancement is made (Arestis and Sawyer, 1994). The time lag in
new technology that is being discovered and the adaptation of the technology in each
country determines the size of the gap (Deardorff, 2014). This means that technological
gap can be the cause of economic deterioration via constant adaptation of new
technology in developing countries and with globalization and global market expanding
and encouraging cutthroat competition (Stromquist, 2002).
Figure 2.1: Technology S-Curve – Technology Gap

4
2.7 Technology Acceptance
Technology acceptance occurs when an adapter chooses to adopt the technology that is
going to benefit them. This starts from knowing the technology then learning the
technology. After being proficient with the subject, this technology can be applied in
various applications, becoming another valuable asset (Foster, 1973). Technology
acceptance is the decision to use technology or innovation because of its advantage over
the previous one. The factors that influence the decision making time are the decision
maker and the quality of the technology/innovation. Moreover, technology acceptance
means understanding the technology to adopt one technology. In this case, various
aspects of the technology, the usefulness, the intention to use, the rick, attitude toward
using the technology and the actual practical usage must be examined (Strutton,
Lumpkin, and Vitell, 2011; Chu and Chu, 2011). In addition, there are 5 stages of
technology acceptance (Roger, 1986). First is the Awareness Stage, a starting point
where new technology emerged, but the adopter does not have enough knowledge about
the technology. Next is the Interest Stage, the adopter becomes more interested in the
technology and starts to learn more about it. Following this is the Evaluation Stage, the
adopter evaluates whether it is better to adopt the new technology or not. This all
depends on the risks it poses. After the Evaluation Stage is the Trial Stage, the adopter
tests the new technology. Lastly, Adoption Stage, the adopter assents the technology
and implements it (Laeieddeenun, 2016). A variety of theories is used to study human
behavior in accepting technology. A number of those are: Theory of Reasoned Action,
Theory of Planned Behavior and Technology Acceptance Model (Chaveesuk and
Wongjatupat, 2012).
2.8 Theory of Reasoned Action (TRA)
The Theory of Reasoned Action links the relationship between attitudes and behaviors
in human action and attempts to come up with an explanation. This can be used to
explain human action based on their previous actions and their behavioral intentions
(Fishbein and Ajzen, 1975). Additionally, the theory served as a tool to understand
voluntary behavior of a person (Doswell, et al., 2011). An individual’s basic motivation
influences one to perform an action, whereas the behavioral intention dictates the actual
behavior that one expresses (Ajzen and Madden, 1986). Behavioral intention (attitudes
and subjective) can determine the outcome of an action which makes it a crucial
component to the theory. Attitude is linked to a person’s perspective on the behavior
regardless if it’s positive or negative, while the subjective norm is the social construct
culture that steers people’s behavior, such as discerning between good and bad
(Colman, 2015). Although the theory itself still have limitations, behaviors can be seen
as an output for people's attitude, as not all people give the same reaction to the same
thing, thus making the process more complex and impossible to accurately predict
(Ajzen,1991).

5
Figure 2.2: Theory of Reasoned Action (TRA)
2.9 Theory of Planned Behavior (TPB)
The Theory of Planned Behavior links belief and behavior, the concept was a
continuation of the Theory of Reasoned Action by using perceived behavioral control,
which strengthens the predictive power (Ajzen, 1991). The perceived behavioral
control, which is the belief of a person that they have control over their behavior, was
added as a new factor (Ajzen and Fishbein, 2005). The theory suggests that people have
the tendency to react in certain ways when they feel that they are in control of their
behavior. Self-efficacy and controllability increase the control in perceived behavioral
control (Ajzen, 2002). As mentioned by Bandura (1997), self-efficacy refers to one's
faith in their ability to succeed in controlling their behavior that is at par to the level of
difficulty that is required to control the behavior Controllability denotes one's belief that
they have control over the outcome of the behavior, or they believe to be controlled by
extrinsic factors (Albarracin, Johnson, Fishbein and Muellerleile, 2001). A person with
high perceived behavioral control will have increased confidence as they can convey
certain behaviors with higher chance of success (Fishbein and Ajzen, 2011). However,
the Theory of Planned Behavior have restrictions in explaining attitude and behavior
accurately, for example, certain behaviors and intentions of an individual can be
inconsistent with each other as time goes by (Ajzen, 1985).

6
Figure 2.3: Theory of Planned Behavior (TPB)
2.10 Technology Acceptance Model (TAM)
Technology Acceptance Model, proposed by Davis in 1986 is one the well-known
models because of its use that help in explaining and predicting user behavior of
information technology (Legris, Ingham, and Collerette, 2003; Park, 2009). The model
is related to technology acceptance that was based on the Theory of Reasoned Action
(Abbasi, Tarhini, Elyas, and Shah, 2015). The model explains why a user accepts or
rejects information technology. The model can be used to trace what variables influence
users’ belief, attitude and intention (Bagozzi, Davis, and Warshaw, 1992). Perceived
usefulness and perceived ease of use are the two cognitive beliefs that technology
acceptance model use. The model explains that the actual use of technology is
influenced by variety of factors directly and indirectly, such as the user’s behavioral
intention, attitude, perceived usefulness of the system and perceived ease of the system
(Davis, 1986 ; Davis, Bagozzi, and Warshaw, 1989). The external variables that affect
the actual use and intention also affected the perceived usefulness and perceived ease of
use as well (Davis, 1989).

7
Figure 2.4: Technology Acceptance Model (TAM)
2.11 Case Study of Technology Acceptance
2.12 Case Study I (E-Books’ Purchase Decisions)
2.12.1 Technology Acceptance and Online Consumer Behavior Affecting E-Books’
Purchase Decisions of Customers in Bangkok
Kewwarin Laeieddeenun
Graduate School, Bangkok University, Thailand
Public on BU Research
April, 2016
2.12.2 Statement of The Problems (Case Study I)
In 21st century people’s behavior in reading is changing as they read through E-books
and use the internet more. This trend seems to increase continuously, so the study about
online consumer behavior in Thailand is in a sizzling and interesting topic. Online
consumer behavior consists of online cognitions, online emotions, online entertainment,
flow, and online attitudes. From studying related researches and documentaries, it was
found that there is less amount of research about online consumer behavior. The
consumer behavior in the digital era has changed because of increasing social media

8
communication and internet usage. Consequently, people believed in their own
connection and followed the general trend of a group. This plays a role in the
consumers’ decision regarding purchasing as more are paying more through the internet
system. In this research, the researcher studied the technology and online consumer
behavior acceptance affecting E-books purchase decision as guidelines for firms and
business sectors related to printing media adapt modern operations. Moreover, it is an
alternative for writers to publish their works online for consumers who are interested in
purchasing E-books.
2.12.3 The Relevant Model, The Approach Used, and Solution Method (Case
Study I)
The objective of this research is to investigate technology acceptance and online
consumer behavior that affect E-books’ purchase decision in Bangkok. In addition,
there are 6 factors in technology acceptance and 5 factors in online consumer behavior
that are considered. The population and the sample used were consumers who live in
Bangkok and have bought E-book. The sample size was chosen through multistage
sampling. The first step was Simple Random Sampling by draw lots. Bangkok
administrative district was divided into 50 districts, and they were drawn for only 5
districts which were Ladprao, Pathumwan, Phrakanong, Bangrak, and Ladkrabang. The
second step, Quota Sampling was used as the representative district from the first step
became the place for survey through questionnaire with a total of 260 samples from a
quota of 52 samples from each district. The third step utilized Convenience Sampling
by distributing questionnaire to consumers who bought E-book in malls or community
in any district sampled from the first step. The questionnaire had a total of 66 questions
with 2 parts: personal information 11 questions, technology acceptance effecting E-
books’ purchase decision 50 questions. After collecting the data, multiple regression
analysis was applied in order to test the hypothesis. SPSS was used to choose the factor
that influence E-books’ purchase decision with the 0.05 level of significance. The factor
which had less than 0.05 level of significant was the factor that affected Electronic
Books Purchase Decision as it was divided into 3 factors from 6 factors of technology
acceptance, which consisted perceived usefulness, intention to use, and actual use. As
for the 3 factors of the 5 Online Consumer Behaviors, these were Online Cognitions,
Online Entertainment, and Online Attitudes.
2.12.4 Summary (Case Study I)
From the study of technology acceptance and online consumer behavior that influence
E-books’ purchase decision in Bangkok, it was found that technology acceptance on
actual use had the most effect on E-books’ purchase decision of consumers in Bangkok;
thus authors and printing press should strongly pay attention on the factor actual use of
E-books, focusing on internet usage and convenience. Moreover they should encourage
consumers to be in favor of reading E-book as they make readers feel like reading
conventional books.

9
2.13 Case Study II (Basic Education in Thailand)
2.13.1 The Acceptance and Use of Technology Tablet for Educational: The
Context of Basic Education in Thailand
Phonthep Jamroenkanokkul
College of Innovation, Thammasat University, Thailand
Public for College of Innovation, Thammasat University
April, 2014
2.13.2 Statement of The Problems (Case Study II)
In recent times, information technology and computer have an important role on
education. They make educational system to be more efficient, making the quality of
education better more accurate and faster. In this aspect, the use of electronic device
(Tablet) and the process of learning through internet (e-learning) develop efficiency in
education, so the students are able to review their lessons. Similarly, electronic books
(e-Book) show pictures and videos, and provide global information, making learning
more fun and more comprehensible than before. This will help attract student attention,
leading to more concentration in their lessons and higher efficiency of Thailand
education system. Moreover, information technology and computer can be used in the
adjustment of strategy in the development of tablet application to have more benefits in
the competition of organizations.
2.13.3 The Relevant Model, The Approach Used, and Solution Method (Case
Study II)
The limitations of this study take from the context of developing and using tablet
technology to support basic educational system. It also studied the factor affecting the
acceptance of using tablet technology to support Thailand’s basic educational system
from 1st to 3
rd junior high school. Quantitative Technique was applied by using survey
research through questionnaire to collect feedbacks from the sample. Following this,
statistical analysis was utilized to determine the relationship between the independent
and dependent variables to make sure that the survey was equitable and reliable. The
researcher tested the accuracy of content validity by having the questionnaire checked
by an expert. The index of congruence or IOC(𝐼𝑂𝐶 =∑ 𝑅
𝑁) was also estimated. The
admitted IOC should be more than 0.5 from which the reliability was recalculated. The
reliability test was done before adopting it by conducting a pilot test with a 30 test
group using Internal Consistency Method to compute Cronbach’s Alpha. The test was
approved when alpha is equal or more than 0.5. For the next step, the researchers
prepared 400 questionnaires with 52 questions each for random sampling at the 2013
Science and Technology National Affair, Bitec Bangna. The collected data was to be
tested with 11 hypotheses. The independent variables were device, internet, learner,
support, perceived usefulness, and perceived ease of use; whereas the dependent
variables utilized structural Equation Model: SEM was analyzed to test the concurrence
with theoretical model and to explain the relationship among variables and the effect of
variables both directly and indirectly to the acceptance of the use of tablet technology to
support basic education. All the factors were significant to the use, and the researchers

10
can rank the importance of factors from high to low in Device, Perceived Usefulness,
Perceived Ease of Use, Learner, and Support and Internet.
Figure 2.5: Research Model
2.13.4 Summary (Case Study II)
The purpose of studying the Acceptance and Use of Technology Tablet was for
Education. The Context of Basic Education in Thailand was to study the factors to
accept the use of tablet technology in order to support basic education, and to prove that
Perceived Usefulness and Perceived Ease of Use positively affect the acceptance of
students. Moreover, in the aspect of studying, the acceptance and the use of technology
can lead to the use of tablet technology in education, supporting the efficient
improvement of education.
2.14 Comparison Case Study of Technology Acceptance
The case study implemented was I because reading is the most basic skill regardless if
these are e-books or normal books. While tablets are full of various applications such as
games, social media, etc., students can be easily distracted in their studies. Moreover,
the cost of adopting the case study I was cheaper than the case study II, and the problem
from the first case was less complicated than the second as e-books are more famous in
many regions, while tablet is rarely used, thus it is better to apply case study I in a real
situation.
11
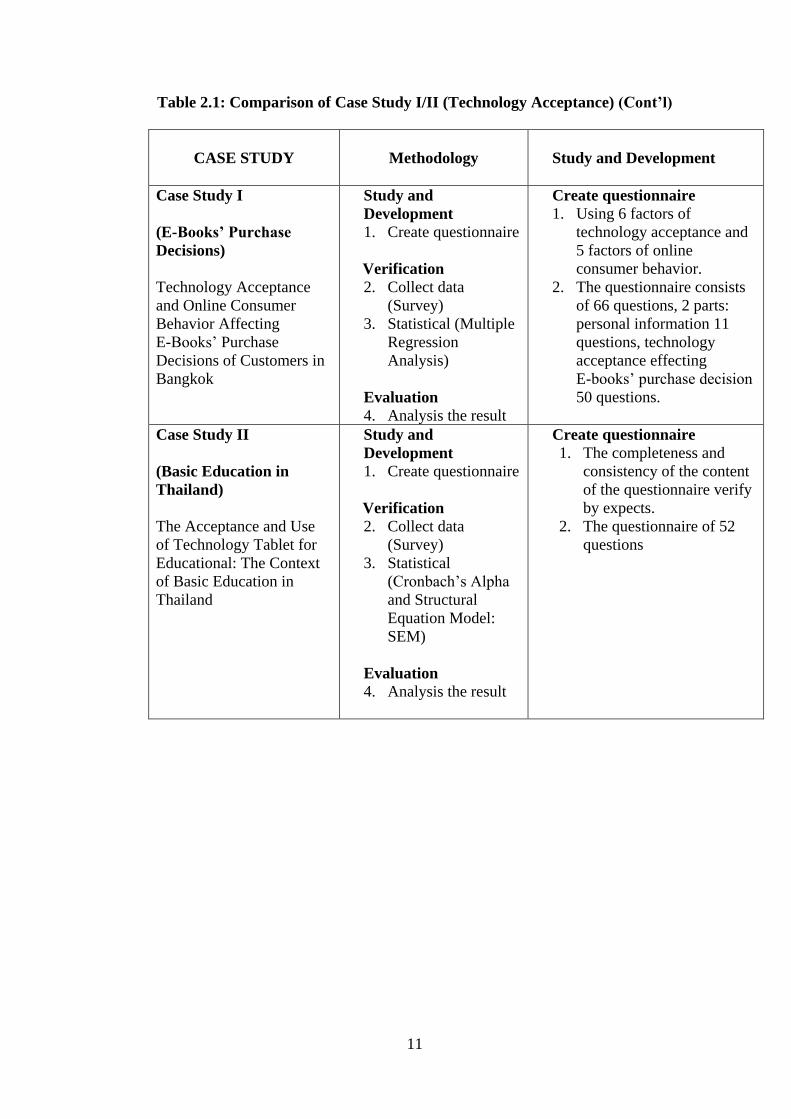
Table 2.1: Comparison of Case Study I/II (Technology Acceptance) (Cont’l)
CASE STUDY
Methodology Study and Development
Case Study I
(E-Books’ Purchase
Decisions)
Technology Acceptance
and Online Consumer
Behavior Affecting
E-Books’ Purchase
Decisions of Customers in
Bangkok
Study and
Development
1. Create questionnaire
Verification
2. Collect data
(Survey)
3. Statistical (Multiple
Regression
Analysis)
Evaluation
4. Analysis the result
Create questionnaire
1. Using 6 factors of
technology acceptance and
5 factors of online
consumer behavior.
2. The questionnaire consists
of 66 questions, 2 parts:
personal information 11
questions, technology
acceptance effecting
E-books’ purchase decision
50 questions.
Case Study II
(Basic Education in
Thailand)
The Acceptance and Use
of Technology Tablet for
Educational: The Context
of Basic Education in
Thailand
Study and
Development
1. Create questionnaire
Verification
2. Collect data
(Survey)
3. Statistical
(Cronbach’s Alpha
and Structural
Equation Model:
SEM)
Evaluation
4. Analysis the result
Create questionnaire
1. The completeness and
consistency of the content
of the questionnaire verify
by expects.
2. The questionnaire of 52
questions

12
Table 2.1: Comparison of Case Study I/II (Technology Acceptance)
CASE STUDY
Verification Evaluation
Case Study I
(E-Books’ Purchase
Decisions)
Technology Acceptance
and Online Consumer
Behavior Affecting
E-Books’ Purchase
Decisions of Customers
in Bangkok
Collect data
The first step is
Simple Random
Sampling.
The second step is
using Quota
Sampling. The third
step uses
Convenience
Sampling
Statistical
Use multiple
regression analysis to
test hypothesis. The
program SPSS is used
to choose the factor
that effect E-books’
purchase decision
with the 0.05 level of
significant.
Analysis the result
The factor which had
less than 0.05 level
of
significant is the
factor that effect the
Electronic Book’s
Purchase Decision
Case Study II
(Basic Education in
Thailand)
The Acceptance and Use
of Technology Tablet for
Educational: The
Context of Basic
Education in Thailand
Collect data
Survey from a target
population of 400
respondents, sample
randomly at the 2013
science and
technology nation
affair, Bitec Bangna,
Statistical
Using Internal
Consistency Method
to compute
Cronbach’s Alpha.
The test was
approved when alpha
is equal or more than
0.5.
Use Structural
Equation Model
means to be tested
with 11 hypotheses.
Analysis the result
Analysis to test the
accordance with
theoretical model
and explain the
cause relationship
between variables
and the effect of
variables both
direct and indirect
way to the
acceptance of the
use of tablet
technology to
support basic
education

13
Table 2.2: PROS/CONS of Case Study I/II (Technology Acceptance)
CASE STUDY
PROS CONS
Case Study I
(E-Books’ Purchase
Decisions)
Technology Acceptance
and Online Consumer
Behavior Affecting E-
Books’ Purchase Decisions
of Customers in Bangkok
1. The firm and the
press can adapt their
operation to changes.
2. The author
understands more on
how to get the best
purchase.
1. There are many factors to
control
2. The case is only studied in
one area of Bangkok
3. Have to answer on how to
publish e-book similar to
conventional books.
Case Study II
(Basic Education in
Thailand)
The Acceptance and Use
of Technology Tablet for
Educational: The Context
of Basic Education in
Thailand
1. Further develop the
researched factors to
further support Thai
basic education
2. The tablet technology
brings effectiveness
to the student’s
education
3. Further develop the
tablet application that
will benefit
organizations
1. The best benefit also
comes from the way
students use technology,
not only technology
2. Technology works both
ways so it is the
acceptance of the use
must be careful

14
2.15 Knowledge and Technology Transfer
Even the best managed company still suffered the complexity and the challenging task
in the transfer of an innovative idea from laboratory to production unit, marketing unit,
and sales-to-customer unit (Peters and Waterman, 1982; Leonard-Barton, 1988). To run
the big scale of work, it needs excellent production process and high standard
technology. Therefore knowledge and technology transfer are essentially taken part as a
key to success of individuals, organizations, and nations in this globalized era (Sung and
Gibson, 2015). Knowledge and technology is not just a thing and that transfer requires
a profoundly human endeavor (Gibson and Smilor, 1991). The movement of knowledge
and technology through some channel from one individual or organization to another is
called transfer. Because it often requires collaborative activity between two or more
individuals or functional units who are separated by structural, cultural, and
organizational boundaries, knowledge and technology transfer is a particularly difficult
type of communication (Gibson and Smilor, 1991). Most of the research today only
described the process in detail but no plausible explanation on levels and factors
affecting transfer of knowledge and technology. So the four levels of knowledge and
technology transfer: Creation (Level I), Sharing (Level II), Implementation (Level III),
and Commercialization (Level IV) are suggested and the variables affecting the process
and the results of knowledge and technology transfer are identified based on Gibson and
Smilor’s (1991) in order to overcome these limitations.
Figure 2.6: Four Levels of Knowledge and Technology Transfer

15
2.16 Technology Readiness Level
The Technology Readiness Level (TRL) defined as a systematic metric or measurement
system that supports assessments of the maturity of a particular technology and the
consistent comparison of maturity between different types of technology (Thuy, 2015).
TRL used now by the U.S. Department of Defence is the most generic and best suited
for adaptation by other fields of study (Islam and Brousseau, 2014). In manufacturing
context, the TRL has been used in order to decide what technology to use and weather it
is ready for the industry (Smith, 2005; Ashleigh and Nandhakumar, 2007; Brousseau,
Barton, et al, 2010; Fast-Berglund, Åsa, et al, 2014). The methodology was supposed to
provide a more accurate means to describe the depth to which a research and technology
program is to be pursued (Fast-Berglund, Åsa, et al, 2014), and it can be harmful to just
take the methodology and apply it in another context; for example, TRL evaluation
process can be quite complex and time consuming if done by book (Islam and
Brousseau, 2014). Each technology project is evaluated against the parameters for each
technology level and is then assigned a TRL rating based on the projects progress,
having TRL 1 is the lowest and TRL 9 is the highest (Thuy, 2015). At TRL 1, scientific
research is starting, and TRL 2 occurs as the basic principles have been studied and
practical applications can be formulated (Mankins, 2004). For TRL 3, analytical and
laboratory studies are required and a proof-of-concept model is constructed. TRL 4 is
the test of component and/or breadboard validation in laboratory environment, while
TRL 5 is a continuation of TRL 4, testing component and/or breadboard validation in
environments that are as close to realistic as possible (Mankins, 2004; Thuy, 2015).
Advancing to the next level, a TRL 6 technology has a fully functional prototype or
representational model. For TRL 7 technology, it requires that the working model or
prototype be demonstrated in a space environment. At TRL 8, the technology has been
tested and "flight qualified" (Thuy, 2015), preparing for implementation into an already
existing technology or technology system. When a technology has been "flight proven"
during a successful mission, it can be called TRL 9 (Mankins, 2004). Noting that a TRL
number is obtained once the description in the diagram has been achieved, for example,
the technology still remains TRL 4 until the relevant environmental validation is
complete, so it will move to TRL 5 (Thuy, 2015).

16
Figure 2.7: Technology Readiness Level

17
2.17 Technology Readiness Level Assessment
Technology Readiness Level Assessment is used when an organization tries to
determine the readiness and capability of a new technology (Heslop, McGregor, et al,
2001). It is a systematic measurement that supports assessments of the maturity of a
particular technology and measures how much that technology suited for deployment in
a real operational environment (Parasuraman, 2000). Technology readiness level
assessment is evaluated by subdividing the process of the technology development into
clear steps as TRLs and operationalizing each TRL with the particular indicators to
determine the readiness in overall readiness division scheme (Mankins, 2004; Nolte,
Kennedy, et al, 2004; Mankins, 2009). From exclusively technical indicators, TRL
coverage has been expanded to include additional dimensions of readiness metrics such
as hardware and software readiness, system readiness, programmatic readiness,
manufacturing readiness, and integration readiness (Nolte, Kennedy, et al, 2004; Smith,
2005).
2.18 Technology Readiness Risk Assessment
Risk related with technology transition and adoption can be mitigated by the readiness
of technologies as according to various studies on technology readiness assessment.
Furthermore, the researchers suggested an inverse relationship between technology
readiness and the risk of technology adoption (Heslop, McGregor, et al, 2001;
Walczuch 2007). The higher levels of technology readiness signal are, the lower
perceived risks; and low technology readiness denotes an increased level of risks
(Smith, 2005). Risk calculation often leans toward conservatism in the past TRL
assessments as the minimum readiness level is taken to represent the readiness level of
the technology as a whole (Mathews, 2009). Then, the uncertainty bounds are estimated
and statistical analysis is utilized to visualize the risk after the minimum level of
technology readiness level is established based on a conservative estimation (Mathews,
2009; Engel, Dalton, et al, 2012). However, this conservative approach tends to
condense the distinct and rich information provided by the evaluators. If all the elicited
TRL assessment information can be incorporated into risk calculations, then the
resulting risk estimates could provide a more realistic assessment of the magnitude and
spread of the risks (Engel, Dalton, et al, 2012).
2.19 Key Factors in Knowledge and Technology Transfer
Effective linkage and information movement usually to the exclusion of management
theory has been traditionally determined by the research on technology transfer
(Levenson and Moran, 1987). Creighton et al. (1985) made an exception for this
tradition by creating nine elements that were repeatedly stated or implied in descriptions
of technology transfer models. They are organization, project, documentation of
information, distribution of information, linking etc. Smilor et al. (1990) emphasized the
importance of difference between consortia and their member companies in terms of for
example; academic and business values, networking and information sharing. The other
variable such as risk, cost, and timing of the transfer process are also referred as being
important to successful transfer (Inman, 1987; Gibson and Rogers, 1994). To identify
important factors affecting knowledge and technology transfer, factor analysis was
performed so that the following four key factors in knowledge and technology transfer
were suggested (Gibson and Smilor, 1991). The four factors were Communication (the

18
degree to which a medium is able to efficiently and accurately conveys task-relevant
information and media), Distance (physical and cultural proximity), Equivocality (the
degree of concreteness of knowledge and technology to be transferred), and Motivation
(incentives for and the recognition of the importance of knowledge and technology
transfer activities) (Sung and Gibson, 2015).
Figure 2.8: Knowledge and Technology Transfer Grid
Sung and Gibson (2015) explained that, cell I is the successful application of knowledge
and/or technology transfer. Because of highly interactive communication processes,
highly motivation and recognitions for knowledge and technology transfer, Low
distance in physical and cultural proximity among developers and users, and Low
equivocality which knowledge and/or technology is unambiguous and its application
easy to understood.
2.20 Case Study of Technology Transfer
2.21 Case Study I (Carbon Capture Simulation Initiative)
2.21.1 Development of Technology Readiness Level (TRL) Metrics and Risk
Measures
DW Engel
AC Dalton
K Anderson
C Sivaramakrishnan
C Lansing
Pacific Northwest National Laboratory, Richland, Washington 99352
Public for The United States Department of Energy
Operated by BATTELLE under Contract DE-AC05-76RL01830
October 2012

19
2.21.2 Statement of The Problems (Case Study I)
Technology readiness level (TRL) is a risk measurement application integrated with
utilization of new technologies into standard system and process. For the Carbon
Capture Simulation Initiative (CCSI), the technology readiness assessment is a major
component of technical risk model and functional system performance analysis. This
report describes the brief overview of technology readiness assessment research,
informs development information about Carbon Capture Technology, evaluates the risk
measures and uncertainty quantification approaches used in this report, and summarizes
future path that CCSI Task 7 team aims to accomplish.
2.21.3 The Relevant Model, The Approach Used, and Solution Method (Case
Study I)
This study on technology readiness level of Carbon Capture Simulation Initiative
focuses on technology development, demonstration, and system integration through
computational model and simulation. To prepare for the assessment of Carbon Capture
technologies, the team will recruit experts from the national laboratories, the academic
communities, and the power industries to perform an assessment via online
questionnaire. The identification of concrete readiness indicators for each of the nine
technology readiness levels was made. The indicators in the questionnaire were selected
based on the criticality which measures manufacturing and programmatic readiness for
hardware for each different level.
Table 2.3: Proposed TRL Scale for Carbon Capture
After creating the minimum level of technology readiness by using conservative
estimation, there will be an estimation of uncertainty bound and a visualization of risk
using statistical analysis. The risk is evaluated by cumulative probability distributions
with all TRLs so that it can bring informative and realistic result. The questionnaire
assessment of CCSI consists of a series of questions with 2 possible answers: YES/NO.
In order to transform qualitative data into quantitative one, the researchers will use
binomial distribution to create uncertainty model. The equation for this model is
𝑃(𝑇𝑅𝐿𝑖) = (𝑛𝑘
)𝑝𝑘 (1 − 𝑝)𝑛−𝑘, leading to the estimate of probability being in a TRL.
Then from doing research in various industries, it will direct to find solution to an

20
estimation of uncertainty. To illustrate this work, an example of table 2.2 shows the
probability of completing each TRL.
Table 2.4: Example Case Showing Probability of Completing Each TRL
For conservative approach, the uncertainty bound of TRL-3 will be utilized because it is
the largest level that has been satisfied P(TRL) = 1.0. However, the utilization of the
additional information to complete other higher levels in order to combine all of the
TRLs and omit computing TRL 1 and 2 since TRL 1-3 have been satisfactorily
completed. Form this study TRL that should apply for Carbon Capture Simulation
Initiative is TRL 3.
2.21.4 Summary (Case Study I)
The risk assessment was done by using probability and mathematic equation to find the
probability and the uncertainty of each completed level. Consequently, it led to the
identification of the TRL of the simulation, providing decision makers to consider
technology readiness probabilistically rather than deterministically to help them make
an informed decision about carbon capture technology adoption.
2.22 Case Study II (Microelectronics and Computer Technology Corporation –
MCC)
2.22.1 Knowledge and Technology Transfer: Levels and Key Factors
David V. Gibson
IC2 Institute, the University of Texas at Austin
Tae Kyung Sung
Kyonggi University, Seoul, Korea, and IC2 Institute & Department of MSIS
Public on International Conference on Technology Policy and Innovation (ICTPI)
September, 2015
2.22.2 Statement of The Problems (Case Study II)
The most current researches on knowledge and technology transfer focused on
describing the process detail; nevertheless they have limitations in the application of
contemporary high-tech industries as most of them had not provided good practical
explanation on the levels and factors that affected knowledge and technology transfer.
Transferring innovative ideas from the laboratory to the production unit, marketing unit,
and the sales-to-customer unit in order to gain profit is a complex and challenging job
for any company, even for the best managed company. To deal with these limitations,
this paper aims to define and categorize the level of transfer, identify the key factors
affecting the knowledge and technology transfer, and develop knowledge and
technology transfer grid as a guide for practice.
21
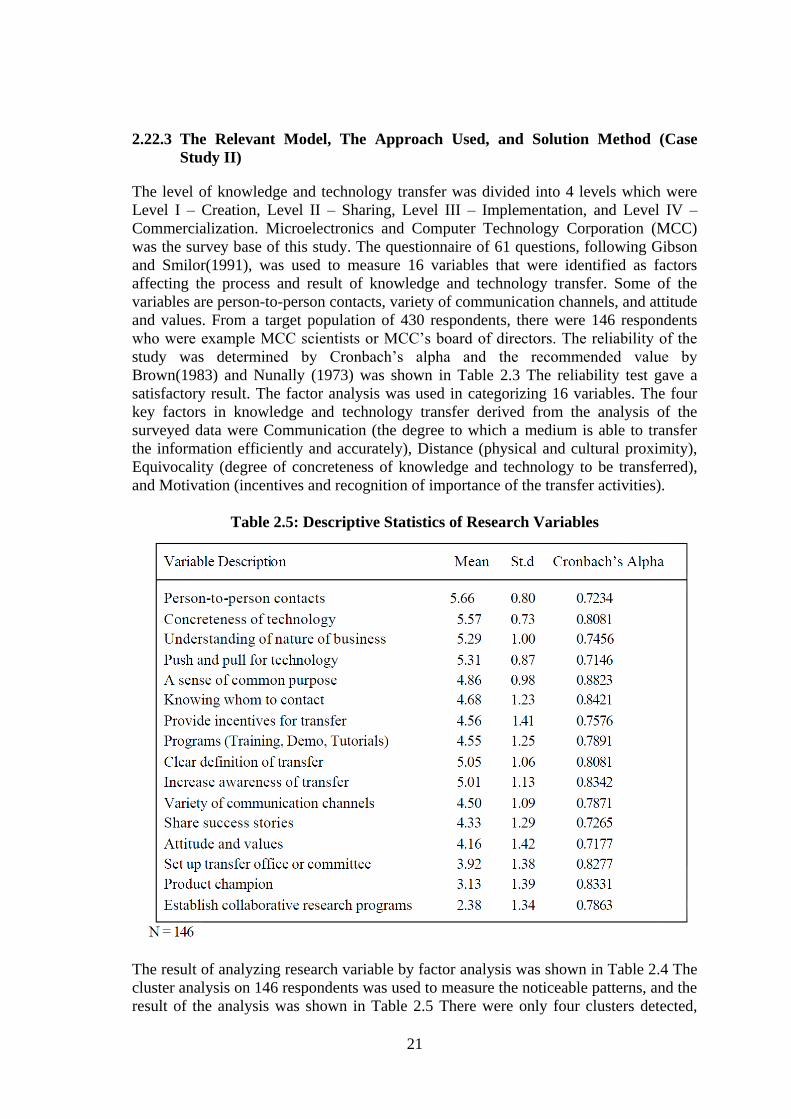
2.22.3 The Relevant Model, The Approach Used, and Solution Method (Case
Study II)
The level of knowledge and technology transfer was divided into 4 levels which were
Level I – Creation, Level II – Sharing, Level III – Implementation, and Level IV –
Commercialization. Microelectronics and Computer Technology Corporation (MCC)
was the survey base of this study. The questionnaire of 61 questions, following Gibson
and Smilor(1991), was used to measure 16 variables that were identified as factors
affecting the process and result of knowledge and technology transfer. Some of the
variables are person-to-person contacts, variety of communication channels, and attitude
and values. From a target population of 430 respondents, there were 146 respondents
who were example MCC scientists or MCC’s board of directors. The reliability of the
study was determined by Cronbach’s alpha and the recommended value by
Brown(1983) and Nunally (1973) was shown in Table 2.3 The reliability test gave a
satisfactory result. The factor analysis was used in categorizing 16 variables. The four
key factors in knowledge and technology transfer derived from the analysis of the
surveyed data were Communication (the degree to which a medium is able to transfer
the information efficiently and accurately), Distance (physical and cultural proximity),
Equivocality (degree of concreteness of knowledge and technology to be transferred),
and Motivation (incentives and recognition of importance of the transfer activities).
Table 2.5: Descriptive Statistics of Research Variables
The result of analyzing research variable by factor analysis was shown in Table 2.4 The
cluster analysis on 146 respondents was used to measure the noticeable patterns, and the
result of the analysis was shown in Table 2.5 There were only four clusters detected,

22
and they showed distinctive characteristics in term of four key factors. Interestingly for
each of the factor, there were two clusters that showed high scores and two clusters
(which revealed) low scores.
Table 2.6: Results of Factor Analysis on Research Variables
Table 2.7: The Results of Cluster Analysis

23
The knowledge and technology transfer grid as shown in Figure 2.3 illustrated the
patterns of the combination of the four key factors. As compared with other cells, the
cell I had the best characteristics to be successful in the application of knowledge and
technology transfer because it had high interactive communication, variety of incentives
and recognitions for knowledge and technology transfer, close cultural proximity among
developers and users, unambiguous knowledge and technology, and understood
application. Cell IV was the least cell to be successful because it had low interactive
communication, low personal motivation, high cultural distance, and high equivocality.
The management can develop an infrastructure of knowledge and technology transfer in
level III and level IV by identifying and giving clear authority to a person or group to
improve the effectiveness of communication, expanding the population and diversity of
people interacting in the transfer process to decrease cultural distance. Moreover, the
researchers encourage collaborative projects in order to disseminate research results to
make knowledge and technology more understandable and to provide incentives,
rewards, and recognition to researchers and user organizations to heighten personal
motivation.
2.22.4 Summary (Case Study II)
The research had defined knowledge and technology transfer, categorized its level,
identified key factors affecting its transfer through empirical data, and developed the
transfer grid to provide practice guidelines. The factor analysis on survey data had given
four key factors affecting knowledge and technology transfer. In testing noticeable
patterns in terms of four key factors, the researcher used cluster analysis resulting in
four distinctive clusters with very contrasting characteristics. The knowledge and
technology grid showed or yielded useful information of the knowledge and technology
transfer. In conclusion there were some suggestions of increasing the communication
interactivity and motivation and reducing of cultural distance and equivocality.
2.23 Case Study III (Thailand’s Automotive Parts Industry)
2.23.1 International Technology Transfer Analyzed at The Technology
Component Level: A Case Study of Thailand’s Automotive Parts
Industry
Vanisa Miksirakul
School of Management, Asian Institute of Technology, Thailand
Public on AIT Publication
August, 2003
2.23.2 Statement of The Problems (Case Study III)
Technology plays a very important in understanding the extent of technology transfer
that has taken place within the automotive parts industry. By studying it, the component
of transfer and the level of sophistication can be seen; thus it results to a better approach
to remove the obstacles in transferring specific components through policy intervention.
For example, countries like China have recently conducted related studies on this kind
of technology. However, it is rare in Thailand as limited studies were also done;

24
therefore, the main purpose of this research is to propose a study of technology transfer
in Thailand that will focus on level of its components.
2.23.3 The Relevant Model, The Approach Used, and Solution Method (Case
Study III)
The study of technology transfer in Thailand automotive parts industry was based on a
postal questionnaire that contained one hundred items and after which was sent to
various manufacturers that produced different kinds of automotive parts to obtain a
general state of the industry. The information collected was from the Thai Auto Parts
Manufacturers Association and Toyota supplier list. It can be noted that there were five
parts of the questionnaire that covered the companies’ background information, product
design, production process, management system, and technology gap. Moreover, the
companies’ background information encourages a deeper insight and understanding of
all technology components. Additionally, the export promotion of automotive parts to
raise positive trade balance is necessary in improving the Thai economy. The product
which is classified as the automotive manufactured part has its main reason of its
product design: novelty, additional functions, higher product quality, and lower
production cost. On the one hand, the production process pertains to the construction
techniques. Evidently, there has always been an existing technology gap between the
developed and the developing countries. In this aspect, Thai automotive part industries
have earned support and encouragement from the government in promoting their
industry through the incentive import of technology transfer to reduce technology gap.
Accordingly, the variances in technology gap will be measured in this investigative
study by basing on the manufacturer’s perception to the number of years that they
needed to reach the international levels of technology capability as compared to their
present technology capability.
Table 2.8: Technology Gap for Products and Production Process/Equipment

25
The range of technology gap for products and production process perceived by local
partners is shown in the table. From the table, all companies believed that their
technology gap did not exceed 10 years. 5-10 years gap in technology and production
process were perceived by majority of the respondents. Nevertheless, 2 companies
claimed that was no gap for both aspects.
2.23.4 Summary (Case Study III)
The result of this case study proved to be positive in the overall capabilities of the
automotive parts manufacturer as reflected in the current condition of Thailand’s
automotive parts industry due to the incentive care and protection by the government.
The result can be attributed to the help of foreign countries such as Japan because they
brought advancement of technology in terms of products and production process in
Thailand. In addition, state of the art product designs were purchased from developed
countries. Furthermore, short term technical assistance employment was also considered
for locally established companies to alleviate the threat of overseas firms in
employment. This is why the technology gap perceived by the automotive part
manufacturers is quite small.
2.24 Comparison Case Study of Technology Transfer
The Case Study I: Development of Technology Readiness Level (TRL) Metrics and
Risk Measures has the best possibility because it documented the development of
technology readiness levels (TRLs) specific to carbon capture technologies, so it is
more likely to be adapted into other researches because the researchers of this research
are trying to improve the research in many steps, making it more productive to
contribute to the development of a rigorous decision framework that can apply the same
steps but change questionnaire to apply with another case study. The analysis is show in
table below

26
Table 2.9: Comparison of Case Study I/II/III (Technology Transfer) (Cont’l)
CASE STUDY
Methodology Study and Development
Case Study I
(Carbon Capture
Simulation Initiative)
Development of
Technology
Readiness Level (TRL)
Metrics and Risk Measures
Study and Development
5. Create questionnaire
Verification
6. Collect data (Survey)
7. Statistical (Binomial
distribution)
Evaluation
8. Analysis the result
Create questionnaireดย 3. Experts from the national
laboratories, the academic
communities, and the
power industries to
perform a questionnaire
4. Number of question
divided into nine
technology readiness
levels and each level
approximate 10 questions
Case Study II
(Microelectronics and
Computer Technology
Corporation – MCC)
Knowledge and
Technology Transfer:
Levels and Key Factors
Study and Development
5. Create questionnaire
Verification
6. Collect data (Survey)
7. Statistical (Mean and
Standard Deviation)
Evaluation
8. Analysis the result
Create questionnaire
3. Following Gibson and
Smilor (1991), was used
to measure 16 variables
that were identified as
factors affecting the
process and result of
knowledge and
technology transfer.
4. The questionnaire of 61
questions
Case Study III
(Thailand’s Automotive
Parts Industry)
International Technology
Transfer Analyzed at The
Technology Component
Level: A Case Study of
Thailand’s Automotive
Parts Industry
Study and Development
1. Create questionnaire
Verification
2. Collect data (Survey)
3. Statistical (Variance)
Evaluation
4. Analysis the result
Create questionnaire
1. Information on
companies was gathered
from the Thai Auto
Parts Manufacturers
Association and Toyota
supplier list.
2. One hundred
questionnaires divided
into five parts each part
approximate 5 questions

27
Table 2.9: Comparison of Case Study I/II/III (Technology Transfer)
CASE STUDY
Verification Evaluation
Case Study I
(Carbon Capture
Simulation Initiative)
Development of
Technology
Readiness Level (TRL)
Metrics and Risk
Measures
Collect data
Survey via online
questionnaire parallel
to the questionnaire
user interface
enhancement
activities
Statistical
Use Binomial
distribution to find
probability of TRL in
each level
Analysis the result
Suggest which
Technology
Readiness Level
(TRL) should apply
Case Study II
(Microelectronics and
Computer Technology
Corporation – MCC)
Knowledge and
Technology Transfer:
Levels and Key Factors
Collect data
Survey from a target
population of 430
respondents, there
were 146 respondents
who were example
MCC scientists or
MCC’s board of
directors.
Statistical
Use mean and
standard deviation to
describe statistics of
research variables
Analysis the result
Identified key
factors that affect
technology transfer
Case Study III
(Thailand’s Automotive
Parts Industry)
International Technology
Transfer Analyzed at The
Technology Component
Level: A Case Study of
Thailand’s Automotive
Parts Industry
Collect data
Surveys were sent to
various types of
manufacturers that
produced different
kinds of automotive
parts
Statistical
Use variance to
measure the
technology gap of
products and
production process
Analysis the result
Identified the
technology gap of
products and
production process
28
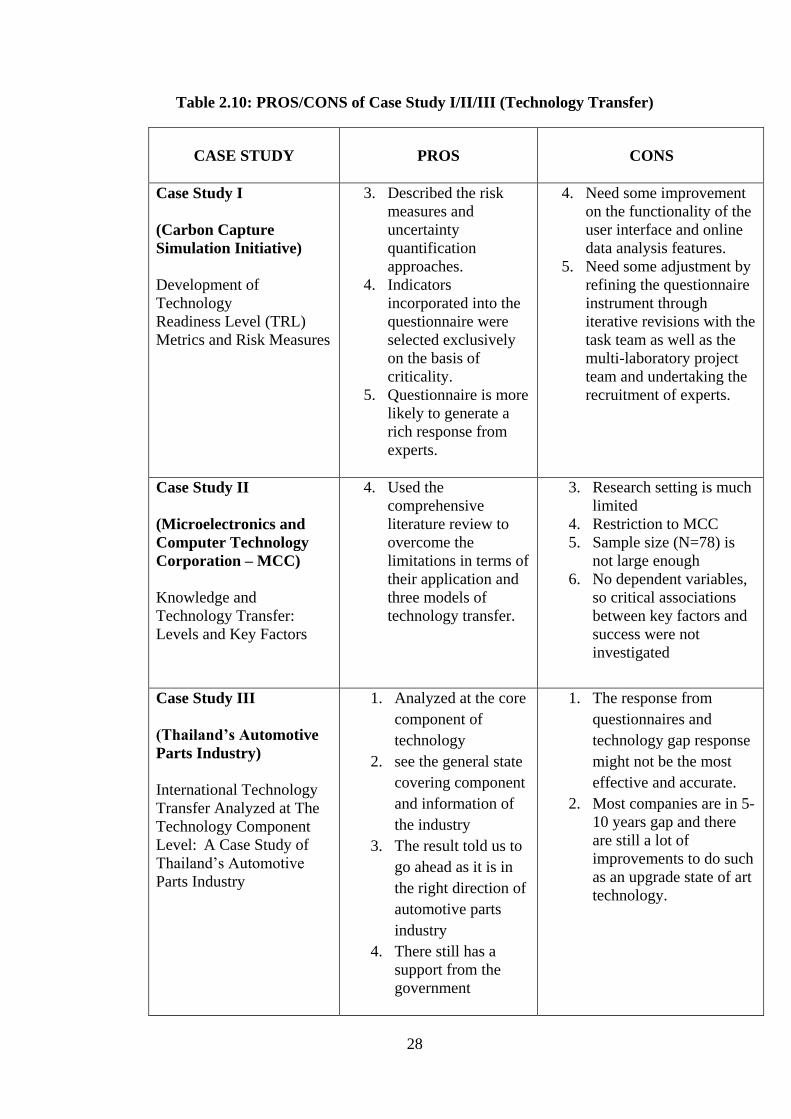
Table 2.10: PROS/CONS of Case Study I/II/III (Technology Transfer)
CASE STUDY
PROS CONS
Case Study I
(Carbon Capture
Simulation Initiative)
Development of
Technology
Readiness Level (TRL)
Metrics and Risk Measures
3. Described the risk
measures and
uncertainty
quantification
approaches.
4. Indicators
incorporated into the
questionnaire were
selected exclusively
on the basis of
criticality.
5. Questionnaire is more
likely to generate a
rich response from
experts.
4. Need some improvement
on the functionality of the
user interface and online
data analysis features.
5. Need some adjustment by
refining the questionnaire
instrument through
iterative revisions with the
task team as well as the
multi-laboratory project
team and undertaking the
recruitment of experts.
Case Study II
(Microelectronics and
Computer Technology
Corporation – MCC)
Knowledge and
Technology Transfer:
Levels and Key Factors
4. Used the
comprehensive
literature review to
overcome the
limitations in terms of
their application and
three models of
technology transfer.
3. Research setting is much
limited
4. Restriction to MCC
5. Sample size (N=78) is
not large enough
6. No dependent variables,
so critical associations
between key factors and
success were not
investigated
Case Study III
(Thailand’s Automotive
Parts Industry)
International Technology
Transfer Analyzed at The
Technology Component
Level: A Case Study of
Thailand’s Automotive
Parts Industry
1. Analyzed at the core
component of
technology
2. see the general state
covering component
and information of
the industry
3. The result told us to
go ahead as it is in
the right direction of
automotive parts
industry
4. There still has a
support from the
government
1. The response from
questionnaires and
technology gap response
might not be the most
effective and accurate.
2. Most companies are in 5-
10 years gap and there
are still a lot of
improvements to do such
as an upgrade state of art
technology.

29
CHAPTER 3
METHODOLOGY
A methodology is presented below as research flow (Figure 3.1) entails an effective
way to achieve thesis’ objectives.
Figure 3.1: Research Flow
Study knowledge and technology
Study knowledge and technology acceptance
Study existing methodology to assess key factors
for the knowledge and technology acceptance
Study knowledge and technology transfer
Study existing methodology to assess level and key factors
for the knowledge and technology transfer
Collect data
(Secondary information, Primary information)
Develop a framework to assess level and key factors
for the knowledge and technology transfer
to implement CAD/CAM/CAE system
in manufacturing in Thai society
Check content validity and reliability
(Item-Objective Congruence Index: IOC)
Collect data
(Primary information)
Analysis the result of the framework
(Descriptive Statistics, Inferential Statistics)
Suggest a practical guideline for implement
CAD/CAM/CAE system
in manufacturing in Thai society
Study
Verification
Development
Evaluation
Start
End

30
3.1 Study Phase
Starting with study varies and various ways to assess key factors for knowledge and
technology acceptance: Technology Acceptance, Theory of Reasoned Action, Theory of
Planned behavior, Technology Acceptance Model and Case Study of Technology
Acceptance. Then, study various ways to assess level and key factors for knowledge and
technology transfer: Study Knowledge and Technology Transfer, Technology Readiness
Level, Technology Readiness Level Assessment, Key Factors in Knowledge and
Technology Transfer and Case Study of Technology Transfer.
3.2 Development Phase
In this phase divided into two main steps: Collect data and Develop a framework
3.2.1 Collect Data
● Secondary Information
Secondary information will be gathered from literatures, internet, published books on
the related topic and government publications.
● Primary Information
Primary information will be gathered a face-to-face discussion about information that
should be in questionnaire with Associate Professor Erik L.J. Bohez and Mr. Somchai
Taopanich (Laboratory Technician) at Asian Institute of Technology, Thailand. Then,
face-to-face discussion about questionnaire with another experts in order to check
completeness and consistency of the content of the questionnaire, clarify and
supplement open-ended follow-up comment.
3.2.2 Develop a Framework
In order to develop a framework (make questionnaire) to assess level and key factors for
the knowledge and technology transfer to implement CAD/CAM/CAE system in
manufacturing in Thai society, require more study about existing methodology to assess
level and key factors for the knowledge and technology transfer. Also, study existing
methodology to assess key factors for the knowledge and technology acceptance. The
methods used to gather the information and the details of the research framework for
assessing the level and key factors for technology transfer. The framework is necessary
so as to provide a clear measurement of technology transfer.

31
● Conceptual Framework
Figure 3.2: Conceptual Framework
General Information is work position, firm’s
size, product’s type, process type, and
process of production and design
Using status of CAD/CAM/CAE in the firm
is CAD/CAM/CAE software, factor to
choose brand, software-importing source,
number of officer, etc.
Before Implementation (preparation) is
things to implement, preparation period of
CAD/CAM/CAE, Understanding and Skill,
etc.
During Implementation is implementing
process, using experience of
CAD/CAM/CAE technology
Problem of implementing CAD/CAM/CAE
in company is the level of suggesting
problem in implementing CAD/CAM/CAE
in company
After Implementation is the advantage for
the officer or organization, and business
earn after implementing CAD/CAM/CAE
technology, etc.
Implementation of
CAD/CAM/CAE
system in context
of manufacturing
in Thailand

32
● Tools Used in Researching
The tools that were used in this research are the questionnaire made by studying concept
and related theory as to be the basis to create the one set of the tools. It is divided into 6
parts:
Part 1 General Information is work position, firm’s size, product’s type, process type,
and process of production and design using statistics of evaluation, frequency, and
percentage.
Part 2 Using status of CAD/CAM/CAE in company includes CAD software, CAM
software, CAE software, where to know software, reason to use software, factor to
choose brand, importing source of software, number of officer who able to use
CAD/CAM/CAE, important characteristic of CAD/CAM/CAE software the company
needed, type of using CAD/CAM/CAE technology, trend to invest of company on
CAD/CAM/CAE, type of buying CAD/CAM/CAE, trend to upgrade license of
company, and the consultant of CAD/CAM/CAE in company using the statistics of
evaluation, frequency, and percentage. For the level of significance of
having/buying/using of CAD/CAM/CAE technology, which is the set of questions in
this part, is the rating scale questions in the form of Likert. The form is scale answer
with 5 levels.
Part 3 Before implementation (preparation) includes things to implement, duration of
preparation the technology, understanding and skill using the statistics of evaluation,
frequency, and percentage.
Part 4 During implementation includes implementation process, using experience of
CAD/CAM/CAE technology using the statistics of evaluation, frequency, and
percentage.
Part 5 After implementation includes the advantage for the officer or organization, and
business earn after implementing CAD/CAM/CAE technology, the route to develop
CAD/CAM/CAE technology in the future, the required time for the firm to top up the
technology to the international standard of product and production process and
equipment using the statistics of evaluation, frequency, and percentage, and the level of
suggestion. The changing after implementation of CAD/CAM/CAE technology, which
is the set of question of this part, is the rating scale question in the form of Likert. The
form is scale answer with 5 levels.
Part 6 The problem in implementation of CAD/CAM/CAE in the company includes the
level of suggestion in implementing CAD/CAM/CAE in the company, which is the set
of question of this part, is the rating scale question in the form of Likert. The form is
scale answer with 5 levels. The form of data is the interval scale:
Score Level of Agreement
5 Very High
4 High
3 Medium
2 Low
1 Very Low

33
The analysis of data is the rating scale, with mean as statistics for analyzing collected
data from entire sample. There has been a level of mean in following scale
Class Interval = Highest Score – Lowest Score
Number of level
= 5 – 1
5
= 0.8
The translation of the score, the researcher has appointed
Mean (score) Level of Agreement
4.21 – 5.00 Very High
3.41 – 4.20 High
2.61 – 3.40 Medium
1.81 – 2.60 Low
1.00 - 1.80 Very Low
3.3 Verification Phase
In this phase divided into two main steps: Check content validity and reliability and
Collect data.
3.3.1 Check Content Validity and Reliability
The completeness and consistency of the content of the questionnaire verify by experts:
● Assoc. Prof. Erik L.J. Bohez (Expert1) is an Associate Professor of Industrial
and Manufacturing Engineering at the Asian Institute of Technology, Thailand
● Mr. Somchai Taopanich (Expert2) is a Laboratory Technician of Industrial and
Manufacturing Engineering at the Asian Institute of Technology, Thailand.
● Mr. Ketan Pole (Expert3) is Chief Executive Officer at C.C.S. Advance Tech.
Company Limited, Thailand
● Mr. Supot Prachumthong (Expert4) is an Acting Manager, Precision and Digital
Machining Division, Mould Die and Machine Tool Center at Thai-German
Institute (TGI), Thailand
● Dr. Isarawit Chaopanich (Expert5) is a Head of Workshop Engineering Section,
Mechanical Workshop Department, Workshop and Spare Parts Division,
Electricity Generating Authority of Thailand (EGAT), EGAT Public Company
Limited, Thailand
Examination content validity of the questionnaire use Item-Objective Congruence
Index: IOC. Expects consider complete and consistent between the question and the
definition of variable, then evaluated with score: +1, 0, and -1

34
● +1 Expert is sure that the question is consistent with the definition of
variable.
● 0 Expect is not sure that the question is consistent with the definition of
variable.
● -1 Expert is sure that the question is inconsistent with the definition of
variable.
Formula of Item-Objective Congruence Index: IOC
𝐼𝑂𝐶 = ∑ 𝑅
𝑁
● 𝐼𝑂𝐶 is Item-Objective Congruence Index in each question
● 𝑅 is score of each expect
● ∑ 𝑅 is the summation of score of each expect
● 𝑁 is number of expect
Note: Item-Objective Congruence Index is accepted when the value more than 0.5
3.3.2 Collect Data
● Primary Information
Primary information will be based on quantitative information drawn by in-depth
questionnaires survey and if possible with a follow up of a face-to-face discussion of the
questionnaire in order to clarify and supplement open-ended follow-up comment. The
expected simple size is more than 30 of 100 people (Pilot Test) to answer the
questionnaire.
3.4 Evaluation Phase
Analysis the result of the framework, aim to evaluate the results based on the data
collected in order to identify the extent of technology transferred. The background
information will be presented in order to have a full understanding of the respondents of
the questionnaires. The data were analyzed by two types of statistic:
● Descriptive Statistics (Percentage, Mean and Standard Deviation)
● Inferential Statistics (Hypothesis Testing: One-way ANOVA)
Hypothesis 1 the differences of CAD software in companies have
different factors affecting level of importance of have/buy/use of
CAD/CAM/CAE technology

35
Hypothesis 2 the differences of CAM software in companies have
different factors affecting level of importance of have/buy/use of
CAD/CAM/CAE technology
Hypothesis 3 the differences of CAE software in companies have
different factors affecting level of importance of have/buy/use of
CAD/CAM/CAE technology
Hypothesis 4 the CAD users in different companies that have skills and
understanding in CAD software have different influential factors in
implementing CAD/CAM/CAE
Hypothesis 5 the CAM users in different companies that have skills and
understanding in CAM software have different influential factors in
implementing CAD/CAM/CAE
Hypothesis 6 the CAE users in different companies that have skills and
understanding in CAE software have different influential factors in
implementing CAD/CAM/CAE
Hypothesis 7 the different users of CAD/CAM/CAE software product
have different factors affecting the problem in implementation of
CAD/CAM/CAE
Hypothesis 8 the different users of CAD/CAM/CAE software product on
production process and equipment have different factors affecting the
problem in implementation of CAD/CAM/CAE
Finally, suggest a guideline for the levels and key factors affecting the knowledge and
technology transfer and suggest a practical guideline for implement CAD/CAM/CAE
system in manufacturing in context of Thailand.

36
CHAPTER 4
DATA COLLECTION
4.1 Collect Data (Development Phase)
4.1.1 Secondary Information
Secondary information will be gathered from literatures, internet, published books on
the related topic and government publications. Then, summary the information to be a
brief understanding in each topic below:
● What is CAD?
CAD or Computer Aided Design is the use of computer in the creation, modification,
analysis, or optimization of a design with a geometric model. Mechanical engineer or
Design engineer uses CAD software to create a part or what is called a model and this
model can be illustrated in drawing or CAD file. Production engineer uses CAD
software to
Develop parts from obtained model
Estimate and fix the CAD information of parts that has been designed on
CAD system as for approval of production
Turn the designed part for approval of production. This may include
increasing draft angle or develop model of parts that are different for
different steps in complex production system.
Design holding device, model cavity, mold base, or other devices
The utilization of CAD to create parts can be done in 3 figures which are solid, surface,
and wire frame. Each is suited to a specific work or function.
Figure 4.1: Computer Aided Design program

37
Figure 4.2: The Example of Using CAD to Create Surface and Solid
Modeling
Figure 4.3: The Example of Using CAD to Create Wire-Frame Modeling
Rather than creating parts by CAD nowadays, some CAD software can be used in
reverse engineering. The quality of surface created from reverse engineering software
mostly depends on 2 compositions which are the quality of model or scanning
component and the quality of numerical information. Sometimes in a real situation,
people cannot have a perfect model or a good quality of numerical information because
of deficient or broken parts. Some CAD software are able to fix the model’s surface
problem in the defective area or improve it so that it will be better than the former one
that was scanned.
● What is CAM?
CAM or Computer Aided Manufacturing is the utilization of computer in creating G-
code to control CNC machine in milling process through the information from CAD.
CAM started in 1950 and was developed at MIT with the language Automatic Program
Tool (APT). A programmer worked on a blueprint and used APT to create a G-code
program or handwritten. CAD was not integrated with CAM until 1970. At some place,
CAM was applied to fix the geometry of parts that were obtained from CAD for CNC
machine to begin the milling process. That led to the integration of CAD and CAM.
From the advancement of IT CAM technology, the information from CAD can be used
to decide what machine to use in the production, the dimension of material used, how to
put reference position, what tools will be used in the cutting, what method and the steps
to cut, and also the stimulation of working step to see the cutting path of the cutting
tools and inspect the error in production process. With the progressively development of
CAM software, at the present day CAM software is developed to support roughing cuts
to be faster and finishing cuts with high-speed, and also 5-axis cuts.

38
Figure 4.4: The Computer Aided Manufacturing Program
● What is CAE?
CAE or Computer Aided Engineering is basically the use of computer and software to
fix problems. CAE is one branch of engineering related to the application of computer
technology in solving hard complex problems or impossible problems to solve when
using former analysis technique. CAE is the most efficient tool for predicting parts’
behavior. Through the use of CAE, users can know if the created parts can be assembled
by putting load into parts for 6 months or 1 year at different temperature conditions to
check if it can deform the shape of the parts or if the mechanical property changes.
Normally, the objectives of CAE are to:
Estimate the success of designing parts
Seek for weak point before starting to do prototype
Make part or tools that have the lowest price
Search for the cause and fix the defective parts
The use of CAE stimulates the mechanical part in working condition when putting load
or testing load of parts’ reaction can be predicted and chosen the best value.
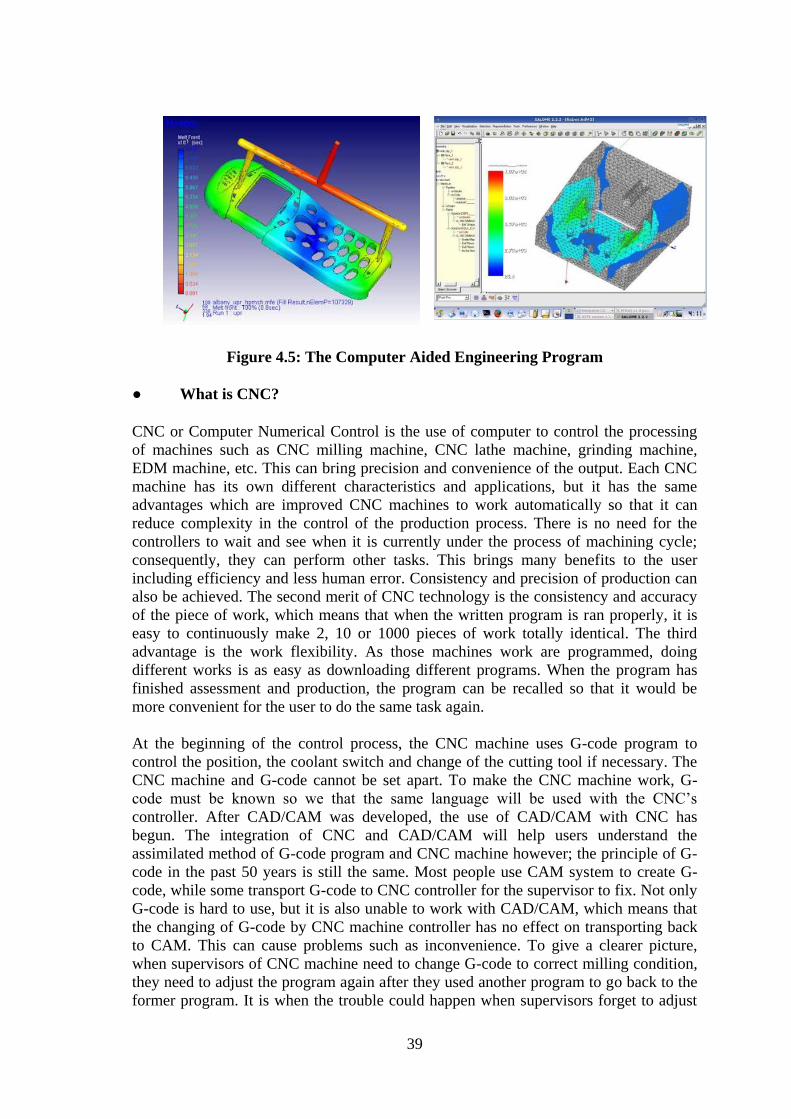
39
Figure 4.5: The Computer Aided Engineering Program
● What is CNC?
CNC or Computer Numerical Control is the use of computer to control the processing
of machines such as CNC milling machine, CNC lathe machine, grinding machine,
EDM machine, etc. This can bring precision and convenience of the output. Each CNC
machine has its own different characteristics and applications, but it has the same
advantages which are improved CNC machines to work automatically so that it can
reduce complexity in the control of the production process. There is no need for the
controllers to wait and see when it is currently under the process of machining cycle;
consequently, they can perform other tasks. This brings many benefits to the user
including efficiency and less human error. Consistency and precision of production can
also be achieved. The second merit of CNC technology is the consistency and accuracy
of the piece of work, which means that when the written program is ran properly, it is
easy to continuously make 2, 10 or 1000 pieces of work totally identical. The third
advantage is the work flexibility. As those machines work are programmed, doing
different works is as easy as downloading different programs. When the program has
finished assessment and production, the program can be recalled so that it would be
more convenient for the user to do the same task again.
At the beginning of the control process, the CNC machine uses G-code program to
control the position, the coolant switch and change of the cutting tool if necessary. The
CNC machine and G-code cannot be set apart. To make the CNC machine work, G-
code must be known so we that the same language will be used with the CNC’s
controller. After CAD/CAM was developed, the use of CAD/CAM with CNC has
begun. The integration of CNC and CAD/CAM will help users understand the
assimilated method of G-code program and CNC machine however; the principle of G-
code in the past 50 years is still the same. Most people use CAM system to create G-
code, while some transport G-code to CNC controller for the supervisor to fix. Not only
G-code is hard to use, but it is also unable to work with CAD/CAM, which means that
the changing of G-code by CNC machine controller has no effect on transporting back
to CAM. This can cause problems such as inconvenience. To give a clearer picture,
when supervisors of CNC machine need to change G-code to correct milling condition,
they need to adjust the program again after they used another program to go back to the
former program. It is when the trouble could happen when supervisors forget to adjust

40
the milling condition because much time and money could be wasted from CAM
system.
Figure 4.6: The Example of Using CNC Machine
Figure 4.7: CAD Model and CNC Machine Part
Figure 4.8: G-Code in CNC Machine

41
● Using CAD/CAM/CAE/CNC Together in Production
Normal production starts from using CAD to design parts or fix numerical information
taken from scanned work piece. After that, CAE is utilized to analyze designed part for
putting load and seeking desired property. In case problem occurs, CAD is applied to
fix the defective part and then it is analyzed again with CAE to get the parts’ desired
property. Next is the sending of CAD information to CAM software to simulate the
course of milling tool or fix the model for CNC machine to mill. In this step, CAE is
used to analyze the task such as plastic injection molding work. CAE is applied to
review the designed part then use CNC machine to mill to be sure that the plastic is
molded correctly when molding was injected. This analysis points out which area of the
plastic is not created properly or if it has a space or a connecting line. Changing the
model to improve the plastic injection ability can be done in the spot whose model is
not yet done, and this will save much money that is relevant to the change of milling
tools. After using CAE to analyze and CAM to fix the path of milling tools, the use of
CAM to create G-code and transport to CNC machine for it to mill or mold follows.
When CNC finishes milling, CAE can be used to examine the created work piece
whether it has the dimension similar to the model such as precision.
Figure 4.9: Creating Modeling Part by CAD
Figure 4.10: Analyzing Modeling Part by CAE

42
Figure 4.11: Stimulating Toolpath by CAM
● How to Choose CAD/CAM/CAE/CNC System?
It is not always necessary to use the best CAD/CAM/CAE/CNC in the market. What is
more important is choosing the function that is most appropriate to a firm’s need. The
most important need of a system is reliability of the system that is appropriate to the
demand of the firm or factory and to people in the factory who use it. The system
should be used with the new software and hardware. If the system is out of date, then
the user will expect the supplier to change it in the future. Another important thing is the
user’s contented feeling when using this system, hence; the system must be easy to
learn, understand, and use. No matter how good the CAD/CAM/CAE/CNC system the
factory/firm has, the person who operates the system is more important in order to get
the most efficient system. The operating person must have a broad knowledge and
understanding of the system, which means that not only he is responsible for the parts
but also to other relevant systems. For instance, a person who works with CAD/CAM
system should know and work with CNC machine in his factory/firm. He or she for
example should be able to deal with the power of the machine motor, the maximum
speed, how much motive axis the working area of the machine has, etc. All of these will
help in adjusting the milling condition to be appropriate and to make the machine work
fully efficient. Unfortunately, Thailand manufacture industry lacks individuals working
in this area. Nowadays many factories need to use CAD/CAM/CAE or CNC, but they
suffered the insufficient human resource while the able person seems to be shallow,
rarely using the software and machine to its full potential. Having ideal
CAD/CAM/CAE/CNC system with no ideal user appears to be luxurious trashes put in
the factory.
● What is CMM?
CMM or Coordinate Measuring Machine is a measuring device for the physical
geometrical characteristics of an object. CMM is used to measure the actual shape of
work piece, comparing it against the desired shape, and evaluating the metrological
information such as size, form, location, and orientation in manufacturing and assembly
processes. It can measure complex geometrical tolerances and deviations of parts. The
accuracy of the machines nowadays is close to 1 µm, and they are widely used in
Aerospace and automotive sector where higher accuracy of measurement is required.

43
Figure 4.12: Coordinated Measuring Machine
The machine works on Coordinated Measuring, so the typical 3D "bridge" CMM is
composed of three axes, X, Y and Z. It can be manually controlled by an operator or it
can be computer controlled. Measurements are estimated by a probe attached to the
third moving axis of the machine, and the probes can be mechanical, optical, laser, or
white light.
Figure 4.13: Types of CMM
Types of CMM
Contact Coordinate Measurement Machine – the probe touch work piece
Non-Contact Coordinate Measurement Machine – a CCD camera or a
laser scan is shot to a work piece

44
Three main components of CMM
The three axes moving frame
Probing system
Data collection and reduction system - typically includes a machine
controller, desktop computer and application software
Figure 4.14: Probe Tools
● How Does CMM Work?
After placing a work piece on the machine table, a probe is used to measure different
points on it by mapping the x, y, z coordinates. The probe operates either manually or
automatically. These points are then uploaded to a computer interface where they can be
analyzed by using modeling software such as CAD and regression algorithms for
further development. The machines nowadays can have the analysis function of
measured result of Geometry Dimensional and Tolerance (GD&T). Moreover, this can
compare the measured result with CAD.
The traditional quality inspection techniques that use micrometers, calipers, gauges,
optical comparators and Coordinate Measuring Machines (CMM) are slow processes
that require a lot of pre-planning or programming before they start to function. These
methods require contact with the tool or product, and to double check practical errors is
a redundant process of measuring. Modern methodology allows efficient 3D scanning
of a product to create digital replica of it. It will be collected as a point cloud. Computer
Aided Inspection (CAI) has functions for scan registrations to CAD using options such
as best fit, datum-based, or 3-2-1 alignment.
● What is CAI?
CAI or Computer Aided Inspection is a modern technology in Computer Aided Control
Quality that enables comparison between a physical part and a 3D CAD model. This
process is faster, more complete, and more accurate than using a Coordinate Measuring
Machine (CMM) or other more traditional inspection methods.

45
Figure 4.15: The Diagram Showing The Procedure of CAI
CAD integrated with 3D laser scanning will have a product that can be
3D inspected and raised to compare the physical part to the design with
the use of a color map and point clouds.
Producing point clouds gives the ability to measure any part instead of
being limited to certain parts on a drawing.
An automatic inspection method and apparatus that utilizes structured light and vision
camera is used to inspect an object in conjunction with the geometric model of the
object. Camera images of the object are analyzed by computer to produce the location
of points on the object's surfaces in three dimensions. Point-cloud data is taken from a
laser scanner or other 3-D scanning device. During the set-up phase before inspecting
the object, the points are analyzed with respect to the geometric model of the object.
The software provides a graphical comparison of the manufactured part to that of the
CAD model. Many points are eliminated to reduce data-taking and analysis time to a
minimum; thus, preventing extraneous reflections from producing errors. When the
same objects are subsequently inspected, points from each surface of interest are
spatially averaged to give more accurate measurements of object dimensions. The
inspection device uses several multiplex sensors, each composed of a camera and a
structured light source to measure all sides of the object in a single pass.

46
Figure 4.16: Designed Model and Measured Data
It is easier to compare the digital 3D product to the original using
CAI with CAD database because it distinguishes whether the
deviations are marginal or serious; hence, ultimately saving the
product from failing the inspection.
● Integration Quality Control with CAD/CAM/CAE Technology
CAI can also be used to investigate the details using dimension across sections to
compare against drawing callouts or Geometric Dimension and Tolerance (GD&T).
This enables quality controls related to assemblies by putting verification and inspection
process into the 3D digital realm; therefore making CAI fully integrated into the
existence of CAD/CAM/CAE processes. This technology complements rather than
replaces the CAD/CAM/CAE systems. Early CAI adopters are accelerating their
inspection processes and increasing the value of their existing CAD/CAM/CAE tools,
giving them the potential of getting ahead of their competitors to fulfill the promise of
Six Sigma concept (the concept of quality management focusing on decreasing variation
and avoiding the problem rather than dealing with it).
4.1.2 Primary Information
Primary information will be gathered a face-to-face discussion with experts from:
● Asian Institute of Technology (First Time)
A face-to-face discussion with Associate Professor Erik L.J. Bohez and Mr. Somchai
Taopanich (Laboratory Technician) at Asian Institute of Technology, 58, Moo9, Km.42,
Paholyothin Highway, Klong Luang, Pathumthani, 12120, Thailand about the
information that should be in questionnaire. Next step, researcher makes the
questionnaire around 45 questions divided in to 5 parts:

47
Part1; General Information
Part2; State of using CAD/CAM/CAE in company
Part3; Before Implementation Period (Preparation Period)
Part4; Implementation Period
Part5; After Implementation Period
Then, give the questionnaire to Associate Professor Erik L.J. Bohez and Mr. Somchai
Taopanich to suggest what question should be edit, delete or add some information to
improve it. After that, researcher rewrites the questionnaire as recommended to be the
questionnaire of 50 questions but divided in to 5 parts as before. Then, face-to-face
discussion about questionnaire with another experts in order to check completeness and
consistency of the content of the questionnaire, clarify and supplement open-ended
follow-up comment.
● C.C.S. Advance Tech. Company Limited (First Time)
On Tuesday 7th
February 2017, go to visit C.C.S. Advance Tech. Company Limited,
54/2, Moo9, Soi Kantana, Bangyai-Bangkoolad Road, Bangmuang, Bangyai,
Nonthaburi, 11140, Thailand. This company is one part in C.C.S Group which is a
vertically integrated "One Stop Manufacturing Company" involved in CNC
turning/machining, precision manufacturing, metal stamping, plastic molding, mold/die,
jigs/fixtures and cutting tools manufacturing. Production system includes "One-Off",
"Small Batch" as well as "Mass Production" high quality precision parts. Projects are
using global accreditations and world class manufacturing systems with an integrated
SAP/ERP.
Researcher along with Associate Professor Erik L.J. Bohez discussion with Mr. Ketan
Pole, who is Chief Executive Officer at C.C.S. Advance Tech. Company Limited. He
suggests more information about CAD/CAM that more use in this company but a litter
bit about CAE that use not much. Researcher gained new ideas that will assist
immensely in the thesis; Factor to have/buy/use technology CAD/CAM/CAE, The
Influential factors to implement CAD/CAM/CAE Technology, and The problem of
implementation CAD/CAM/CAE in company.
After come back from the company, researcher edits some information of the
questionnaire and adds 4 questions use Rating Scale (Likert-5 Level).
Q38 Level of importance to have/buy/use technology CAD/CAM/CAE
Q46 Influential factors in CAD/CAM/CAE implementation
Q52 The change after implement CAD/CAM/CAE technology
Q55 The problem of implementation CAD/CAM/CAE in company
And add one past: Past6; The problem of implementation CAD/CAM/CAE in company
to carry Q55. The questionnaire will be questionnaire of 54 questions and divided in to
6 parts.

48
● Thai-German Institute (First Time)
On Friday 17th
February 2017, go to visit Thai-German Institute (TGI), 700/1, Moo1,
Amata Nakorn Industrial Estate, Km.57, Bangna-Trad Highway, Klongtamru, Muang
Chonburi, Chonburi, 20000, Thailand. The Thai-German Institute is a joint initiative of
the Government of the Kingdom of Thailand and the Government of the Federal
Republic of German, the aim was to be an effective training center for transferring
advanced manufacturing technology to Thai industry. It was set up as an autonomous
body outside the formal education system with it's operation under the supervision of
the Foundation for Industrial Development and a broad oversight by the Ministry of
Industry.
Researcher along with Associate Professor Erik L.J. Bohez, Assistant Prof. Than Lin
and Mr. Somchai Taopanich discussion with Mr. Marnop Thongsaeng, Senior Vice
President, Mr. Somchai Jukkarin, Deputy Director and Mr. Supot Prachumthong,
Acting Manager, Precision and Digital Machining Division, Mold Die and Machine
Tool Center at Thai-German Institute. They tell the information about CAD/CAM/CAE
to develop mold/die, machinery and automation system to be ready for international
competitiveness. And how to drive competitiveness capability enhancement through
R&D, technology transfer, and technology applied.
After come back from Thai-German Institute, researcher got some idea to improve the
questionnaire and then finds more information about understanding and skill to
assessment CAD/CAM/CAE capability. With help from Mr. Somchai Taopanich, the
researcher makes understanding and skill table to assessment CAD/CAM/CAE
capability. Next step, the researcher sends this table to Associate Professor Erik L.J.
Bohez to check the completeness, give suggestion and feedback what should be edit or
add some information to improve it. After that, researcher rewrites the table as
recommended and adds it to be Q44 Understanding and Skill in Part3; Before
Implementation Period (Preparation Period). For this reason, the questionnaire will be
questionnaire of 55 questions and divided in to 6 parts.
● Asian Institute of Technology (Second Time)
Researcher makes questionnaire to be English and Thai version. Then, examination
content validity of the questionnaire use Item-Objective Congruence Index: IOC.
Expects (Associate Professor Erik L.J. Bohez and Mr. Somchai Taopanich) consider
complete and consistent between the question and the definition of variable, then
evaluated with score: +1, 0, and -1
● Electricity Generating Authority of Thailand (First Time)
On Friday 24th
March 2017, go to Electricity Generating Authority of Thailand
(EGAT), 25, Moo8, Suwinthawong Road, Nongchok, Bangkok, 10530, Thailand.
EGAT is Thailand’s leading state-owned power utility under the Ministry of Energy,
responsible for electric power generation and transmission for the whole country as well
as bulk electric energy sales. EGAT is the largest power producer in Thailand, owning
and operating power plants of different types and sizes which are located in 45 sites
across the country with a total installed capacity of 15,548.13 MW. EGAT also engages
in energy-related services businesses and expands, through the EGAT Group, our

49
business and investment in electricity and other energy-related businesses at home and
abroad.
Researcher along with Associate Professor Erik L.J. Bohez and Mr. Somchai Taopanich
discussion with Dr. Isarawit Chaopanich, who is a Head of Workshop Engineering
Section, Mechanical Workshop Department, Workshop and Spare Parts Division,
Electricity Generating Authority of Thailand (EGAT). After that, let him examine
content validity of the questionnaire use Item-Objective Congruence Index: IOC,
consider complete and consistent between the question and the definition of variable,
then evaluated with score: +1, 0, and -1. Also give some of questionnaires to Dr.
Isarawit and his staff (5 people) to do as a first sample group.
● Thai-German Institute (Second Time)
On Thursday 30th
March 2017, send the questionnaire by E-mail to Mr. Supot
Prachumthong to let him examine content validity of the questionnaire use Item-
Objective Congruence Index: IOC, consider complete and consistent between the
question and the definition of variable, then evaluated with score: +1, 0, and -1. He
examines and sends the E-mail back on Wednesday 5th
April 2017.
● C.C.S. Advance Tech. Company Limited (Second Time)
On Monday 3rd
April 2017, go to C.C.S. Advance Tech. Company Limited to let Mr.
Ketan Pole examine content validity of the questionnaire use Item-Objective
Congruence Index: IOC, consider complete and consistent between the question and the
definition of variable, then evaluated with score: +1, 0, and -1. And give some of
questionnaires to him and his staff (10 people) to do as a second sample group.
4.2 Collect Data (Verification Phase)
4.2.1 Primary Information
Primary information will be based on quantitative information drawn by in-depth
questionnaires survey and if possible with a follow up of a face-to-face discussion of the
questionnaire in order to clarify and supplement open-ended follow-up comment from
the company as following:
● Aapico Hitech Public Company Limited
99, Moo1, Hitech Industrial Estate, Ban Lane, Bang Pa-in, Ayuthaya, 13160,
Thailand
(Main business: OEM Auto Parts Manufacturing, Design & Manufacture of
Assembly Jigs, Design & Manufacture of Stamping Dies)
● Asahi Tec Aluminium (Thailand) Company Limited
700/145, Moo5, Amata Nakorn Industrial Estate, Klongtamharu, Muang
Chonburi, Chonburi, 2000, Thailand
(Main business: Aluminium Wheel, Gravity Die Casting)

50
● Choknamchai Autopressing Company Limited
52/2, Moo2, Takha, Bangplama, Suphanburi, 72150, Thailand
(Main business: Die making)
● Chromalloy (Thailand) Limited
25, Moo5, Bungkhamproi, Lamlukka, Pathumthani, 12150, Thailand
(Main business: OEM Services, Operator/MRO Services)
● CNC Design Company Limited 25/4, Moo12, Bungkhamporoi, Lumlukka, Pathumthani, 12150, Thailand
(Main business: Design and Manufacturer of CNC Machines)
● CSP Casting (Thailand) Company Limited
57/1-2, Moo2, Bangpo-nuar, Samkhok, Pathumthani, 12160, Thailand
(Main business: Aluminum and Zinc Die Casting, Gravity Casting Products, Die
Casting Mould, Precision Machined products)
● Enkei Thai Company Limited 444, Moo17, Bangplee Industrial Estate, Soi6, Thepharak, Bang Sao Thong,
Bang Sao Thong, Samut Prakan, 10540, Thailand
(Main business: Aluminium Wheel for Automobile/Motorcycle, Engine
Parts/Outer Tube/Swing Arm for Motorcycle)
● Honda Automobiles (Thailand) Company Limited
27, Moo14, Soi Serithai87, Serithai Road, Minburi, Bangkok, 10510, Thailand
(Main business: Manufactures and Distributes Passenger Cars in Thailand and
Internationally)
● Klonkij Intertrade Company Limited
283, Ladkrabang Industrial Estate, Chalongkrung Road, Lam Plathio, Lat
Krabang, Bangkok, 10520, Thailand
(Main business: OEM Auto Parts Manufacturing)
● Kriangthai Plastech Company Limited
112/4-5,112/10, Moo11, Ekkachai8 Road, Bang Khunthian, Chomthong,
Bangkok 10150, Thailand
(Main business: Plastic Injection)
● Nawa Intertech Company Limited
130/3, Moo3, Nonglalok, Baan-khai, Rayong, 21120, Thailand
(Main business: Design and Manufacture of Moulds and Dies)
● Sammitr Motors Manufacturing Public Company Limited
39, Moo12, Petchkasem Road, Om-noi, Kratumban, Samuthsakorn, 74130,
Thailand
(Main business: Manufacture of Car and Truck Body Parts, Moulds and Fixtures
for Auto Makers, Manufacture of Stamping Dies)
51
● Sri Thai Thana Auto Parts Company Limited
63, Moo8, Phahonyothin Road, Chiangraknoi, Bang Pa-in, Ayuthaya, 13180,
Thailand
(Main business: Automotive Body Replacement Parts Manufacturer and
Exporter)
● Thai Rung Union Car Public Company Limited
304, Macharoen Road, Nong Khang Phlu, Nong Khaem, Bangkok, 10160,
Thailand
(Main business: Auto Parts Production, Dies & Moulds, Jigs & Fixtures)
● Top Mould Company Limited
194, Moo5, Bangnang, Phanthong, Chonburi, 20160, Thailand
(Main business: Mold Maker and Die Casting Mold)
● Toyota Daihatsu Engineering & Manufacturing Company Limited (TDEM)
99, Moo5, Ban-Ragast, Bang Bor, Samut Prakarn, 10560, Thailand
(Main business: Manufactures and Distributes Passenger Cars in Thailand and
Internationally)
● Uni-Tech Mold and Die Industrial (Thailand) Limited
9, Soi31 Land8, Koobon Road, Kannayao, Bangkok, 10230, Thailand
(Main business: Design and Manufacture of Moulds and Dies)

52
CHAPTER 5
RESULTS AND DISCUSSIONS
5.1 Results and Discussions of Verification Phase
5.1.1 Results and Discussions of Check Content Validity and Reliability
The completeness and consistency of the content of the questionnaire verify by experts:
● Assoc. Prof. Erik L.J. Bohez (Expert1) is an Associate Professor of Industrial
and Manufacturing Engineering at the Asian Institute of Technology, Thailand
● Mr. Somchai Taopanich (Expert2) is a Laboratory Technician of Industrial and
Manufacturing Engineering at the Asian Institute of Technology, Thailand.
● Mr. Ketan Pole (Expert3) is Chief Executive Officer at C.C.S. Advance Tech.
Company Limited, Thailand
● Mr. Supot Prachumthong (Expert4) is an Acting Manager, Precision and Digital
Machining Division, Mould Die and Machine Tool Center at Thai-German
Institute (TGI), Thailand
● Dr. Isarawit Chaopanich (Expert5) is a Head of Workshop Engineering Section,
Mechanical Workshop Department, Workshop and Spare Parts Division,
Electricity Generating Authority of Thailand (EGAT), EGAT Public Company
Limited, Thailand
Examination content validity of the questionnaire (55 questions) use Item-Objective
Congruence Index: IOC which is accepted when the value more than 0.5. The results
showed in the following table.
Table 5.1: Results of Check Content Validity and Reliability
No. Score of Each Expert
IOC Result Expert1 Expert2 Expert3 Expert4 Expert5
1 1 1 1 1 1 1 Accept
2 1 1 1 1 1 1 Accept
3 1 1 1 1 1 1 Accept
4 1 1 1 1 1 1 Accept
5 1 1 1 1 1 1 Accept
6 1 1 1 1 1 1 Accept
7 1 1 1 1 1 1 Accept
8 1 1 1 1 1 1 Accept
9 1 1 1 1 1 1 Accept
10 0 1 1 1 1 0.8 Accept
11 0 1 1 1 1 0.8 Accept
12 1 1 1 1 1 1 Accept
13 1 1 1 1 1 1 Accept

53
14 1 1 1 1 0 0.8 Accept
15 1 1 1 1 1 1 Accept
16 1 1 1 1 1 1 Accept
17 1 1 1 1 1 1 Accept
18 1 1 1 1 1 1 Accept
19 1 1 1 1 1 1 Accept
20 1 1 1 1 1 1 Accept
21 1 1 1 1 1 1 Accept
22 1 1 1 1 1 1 Accept
23 1 1 1 1 1 1 Accept
24 1 1 1 1 1 1 Accept
25 1 1 1 1 1 1 Accept
26 1 1 1 1 1 1 Accept
27 1 1 1 1 1 1 Accept
28 1 1 1 1 1 1 Accept
29 1 1 1 1 1 1 Accept
30 1 1 1 1 1 1 Accept
31 1 1 1 1 1 1 Accept
32 1 1 1 1 1 1 Accept
33 1 1 1 1 1 1 Accept
34 1 1 1 1 1 1 Accept
35 1 1 1 1 1 1 Accept
36 1 1 1 1 1 1 Accept
37 1 1 1 1 1 1 Accept
38 1 1 1 1 1 1 Accept
39 1 1 1 1 1 1 Accept
40 1 1 1 1 1 1 Accept
41 0 1 1 1 1 0.8 Accept
42 1 0 1 1 1 0.8 Accept
43 1 1 1 1 1 1 Accept
44 1 1 1 1 1 1 Accept
45 1 0 1 1 1 0.8 Accept
46 1 1 1 1 1 1 Accept
47 1 1 1 1 1 1 Accept
48 0 1 1 1 0 0.6 Accept
49 0 1 1 1 0 0.6 Accept
50 0 1 1 1 1 0.8 Accept
51 1 1 1 1 1 1 Accept
52 1 1 1 1 1 1 Accept
53 1 1 1 1 1 1 Accept
54 1 1 1 1 1 1 Accept
55 1 1 1 1 1 1 Accept

54
As the results in the table show that Item-Objective Congruence Index: IOC of each
question is between 0.6 and 1 which is more than 0.5. Thus, all of the questions in this
questionnaire are accepted.
5.2 Results and Discussions of Evaluation Phase
5.2.1 Descriptive Statistics (Percentage, Mean and Standard Deviation)
The research topic “Knowledge and Technology Transfer: Levels and Key Factors in
implementation of CAD/CAM/CAE Systems in Context of Manufacturing in Thailand
used questionnaire to survey from 60 people including managers, officers, and
CAD/CAM/CAE workers in the central of Thailand and the information collected was
analyzed by qualitative analysis. The analyzed information result was divided into 6
parts which are
● General Information
● State of using CAD/CAM/CAE in company
● Before Implementation Period (Preparation Period)
● Implementation Period
● After Implementation Period
● The problem of implementation CAD/CAM/CAE in company
5.2.2 General Information
Table 5.2: Number and Percentage of Sampled Respondent on General
Information (Cont’l)
General Information Respondents (60) Mean
Position in your company
Concerned with CAD 60 100.00
Concerned with CAM 46 76.67
Concerned with CAE 9 15.00
Size of company
Small (Workers not more than
50 people) 14 23.33
Middle (Workers between 51
and 200 people)
8 13.33
Large (Workers more than
201 people)
38 63.34
Source: Survey

55
Table 5.2: Number and Percentage of Sampled Respondent on General
Information
General Information Respondents (60) Mean
Type of product that your company make
Metal 28 46.67
Plastic 14 23.33
Rubber 4 6.67
Other 18 30.00
Characteristic of process in business
Produce for another company 17 28.33
Produce and sell it to the market 8 13.33
The owner of product, design by
own but outsources to produce
12 20.00
Design and manufacture 36 60.00
Process for design and manufacture
CAD 60 100.00
CAM 46 76.67
CAE
9 15.00
Source: Survey
From Table 5.2, it can be seen that 60 people or 100 percent of the respondents are
working with CAD, 46 people or 76.67 percent are working with CAM, and 9 people or
15 percent are working with CAE.
In the aspect of company’s size, it can be seen that the respondents in the large-sized
company (more than 201 workers) were 34 people or 63.34 percent, 14 people or 23.33
percent in the small-sized company, and 8 people or 13.33 percent in the medium-sized
company.
In the aspect of product type, it can be seen that the 28 respondents or 46.67 percent
work with metal product, 18 respondents or 30 percent work with others such as
research and education, clothes, etc., 14 respondents or 23.33 percent work with plastic
product, and 4 respondents or 6.67 percent work with rubber product.
In the aspect of business type, it can be seen that 36 respondents or 60.00 percent work
in design and manufacture, 17 respondents or 28.33 percent work in produce for another
company, 12 respondents or 20 percent work in owner but hiring manuf1acturer type,
and 8 respondents or 13.33 percent work in produce and sell it to the market.
In the aspect of design and production process, it can be seen that 60 respondents or 100
percent have CAD, 46 respondents or 76.67 percent have CAM, and 9 respondents or
15 percent have CAE.

56
5.2.3 State of Using CAD/CAM/CAE in Company
Table 5.3: Number and Percentage of Sampled Respondent on State of Using
CAD/CAM/CAE in Company (Cont’l)
State of using CAD/CAM/CAE
in company
Respondents (60) Mean
Which CAD software is currently
used in your company
Auto CAD 60 100.00
CADKEY 2 3.33
Solid Edge 44 73.33
Solid Works 9 15.00
NX Unigraphics 5 8.33
Catia 0 0.00
Pro/Engineer 4 6.67
Cimatron 0 0.00
Rhino 0 0.00
Co Create 0 0.00
Alibre 0 0.00
Key Creator 0 0.00
Turbo CAD 0 0.00
Sketch Up 12 20.00
Mechanical Desktop 1 1.67
Creo Elements/ Pro 0 0.00
Inventor 2 3.33
Not have to use now
Other
0
9
0.00
0.00
Which CAM software is currently
used in your company
Master CAM 36 60.00
Creo Elements/Pro 1 1.67
Solid CAM 16 26.67
Surf CAM 2 3.37
Edge CAM 2 3.37
Delcam 5 8.33
Esprit 4 6.67
Gibbs CAM 0 0.00
A CAM package associated with
your CAD package
0 0.00
Not have to use now 0 0.00
Other
20 33.33
Source: Survey

57
Table 5.3: Number and Percentage of Sampled Respondent on State of Using
CAD/CAM/CAE in Company (Cont’l)
State of using CAD/CAM/CAE
in company
Respondents (60) Mean
Which CAE software is currently
used in your company
Cosmos 6 10.00
MSC/Nastran 1 1.67
ANSYS 4 6.67
Abaqus 2 3.33
Not have to use now 6 3.60
Other 3 5.00
How did you Know the software
From Software retail/service
company
11 18.33
From another company in the
same type of industry
8 13.33
From technical journal or
magazine
8 13.33
From internet 0 0.00
From mother company 11 18.33
From person (head / customer/
friend)
12 20.00
From seminar/exhibition 6 10.00
Other 4 6.67
Reason of using CAD/CAM/CAE
in the company
Vision of manager or policy of
company
27 45.00
Would like to upgrade the
company
4 6.67
Other 8 13.33
Influential factor to choose the
brand of CAD/CAM/CAE
software
Capable function match the
company is requirements
40 66.67
Famous and used in more sectors
in market
14 23.33
Field reference in Thailand is
good
0 0.00
Have branch or good customer
support in Thailand
6 10.00
Price
0 0.00
Source: Survey

58
Table 5.3: Number and Percentage of Sampled Respondent on State of Using
CAD/CAM/CAE in Company (Cont’l)
State of using CAD/CAM/CAE
in company
Respondents (60) Mean
Source of software CAD/CAM/CAE
Software company 52 86.67
Government support 10 16.67
IT Center 12 20.00
Other 0 0.00
The number of worker who can use
CAD technology
None 0 0.00
1-5 people 20 33.33
6-15 people 40 66.67
More than 15 people 0 0.00
The number of worker who can use
CAM technology
None 8 13.33
1-5 people 23 38.33
6-15 people
More than 15 people
29
0
48.33
0.00
The number of worker who can
use CAE technology
None 50 83.33
1-5 people 6 10.00
6-15 people 4 6.67
More than 15 people 0 0.00
The important characteristic of
CAD/CAM/CAE software that
company need
Evaluate the result quickly 38 63.33
User Friendliness 32 53.33
Support more format and
functionality
41 68.33
Can compute more information 23 38.33
The manual explain in detail
(Thai)
22 36.37
The manual explain in detail
(English)
11 18.33
Other
0 0.00
Source: Survey

59
Table 5.3: Number and Percentage of Sampled Respondent on State of Using
CAD/CAM/CAE in Company
State of using CAD/CAM/CAE
in company
Respondents (60) Mean
The Format of use CAD/CAM/CAE
technology
Compatible with partners 50 83.33
Not compatible with partners 10 16.67
Trend of your company to invest in new
CAD/CAM/CAE technology
No plan now 38 63.33
Not sure 6 10.00
Have plan to invest 6 10.00
Have plan to upgrade 10 16.67
Type of buying CAD technology
None
0
0.00
Buy permanent license 17 28.33
Buy license yearly
Buy license for 3-5 years
22
21
36.671
35.00
Type of buying CAM technology
None 8 13.33
Buy permanent license 13 21.67
Buy license yearly 27 45.00
Buy license for 3-5 years 17 28.33
Type of buying CAE technology
None 50 83.33
Buy permanent license 6 10.00
Buy license yearly 4 6.67
Buy license for 3-5 years 0 0
Trend of your company to
upgrade CAD/CAM/CAE
As soon as new version 16 26.67
Use as long possible without
upgrading
16 26.67
Upgrade because there is an
important in software
17 28.33
Upgrade because compatibility
with partners
11 18.33
Is your company using
CAD/CAM/CAE consultant
No 40 66.67
Yes
20 33.33
Source: Survey

60
From Table 5.3 it can see the using of CAD in the company that 60 respondents or 100
percent use AutoCAD, 44 respondents or 73.33 percent use Solid Edge, 12 respondents
or 20 percent use Sketch Up, 9 respondents or 15 percent use Solid Works and other
software such as 3ds max Maya, 5 respondents or 8.33 percent use NX Unigraphics, 4
respondents or 6.67 percent use Pro/Engineer, 2 respondents or 3.33 percent use
Inventor, and 1 respondent or 1.67 percent uses Mechanical Desktop.
In the aspect of CAM using in the company, it can be seen that 1 respondent or 1.67
percent uses Master CAM, 3 respondents or 5 percent use A cam associated with your
CAD package and power shape, 2 respondents or 3.33 percent use Solid CAM, 5
respondents or 8.33 percent use Delcam, 4 respondents or 6.67 percent use Espirit, 2
respondents or 3.37 percent use Surf CAM and Edge CAM, and 1 respondent or 1.67
percent uses Creo Elements/Pro.
In the aspect of CAE using in the company, it can be seen that 6 respondents or 10
percent use Not have to use now and Cosmos software, 4 respondents or 6.67 percent
use ANSYS software, 3 respondents or 5 percent use Nuto Form software, 1 respondent
or 1.67 percent uses MSC/Nastran software.
In the aspect of how to know the software, it can be seen that 12 respondents or 20
percent knew from persons (boss/customer/friend), 11 respondents or 18.33 percent
knew from software seller/service company and parent company, 11 respondents or
18.33 percent knew from other companies in the same business and relevant magazine,
6 respondents or 10 percent knew from the seminar/software expo, and 4 respondents or
6.67 percent knew from other sources such as universities.
In the aspect of reason using CAD/CAM/CAE in the company, it can be seen that 27
respondents or 45 percent use because of the executive’s vision or company’s policy, 21
respondents or 35 percent use because of business competition, 8 respondents or 13.33
percent use because of research and education, and 4 respondents or 6.77 percent use
for developing their company.
In the aspect of important factor to choose the brand of CAD/CAM/CAE software, it
can be seen that 40 respondents or 66.67 percent chose brand whose functions answer to
the need of company, 14 respondents or 23.33 percent chose brand from the popularity
in the market, 6 respondents or 10 percent chose from the available branch in the
country or the good support services in the country.
In the aspect of importing source of CAD/CAM/CAE software, it can be seen that 52
respondents or 86.67 percent imported from software company, 12 respondents or 20
percent imported from IT center, and 10 respondents or 16.67 percent imported from
government’s support.
In the aspect of number employee who are able to use CAD, it can be seen that 40
respondent or 66.67 percent have number of employee from 6-15 people, and 20
respondents or 33.33 percent have 1-5 people.

61
In the aspect of number employee who are able to use CAM, it can be seen that 29
respondent or 68.33 percent have number of employee from 6 -15 people, 23
respondents or 38.33 percent have number of employee from 1 -5 people, and 8
respondents or 13.33 percent don’t use CAM.
In the aspect of number employee who are able to use CAE, it can be seen that 50
respondent or 83.33 percent don’t use CAE, 6 respondents or 10 percent have number of
employee from 1-5 people, and 4 respondents or 6.67 percent have number of employee
from 6-15 people.
In the aspect of the important characteristic of CAD/CAM/CAE software that company
need, it can be seen that 41 respondents or 68.33 percent need the support more format
and functionality, 38 respondents or 63.33 percent need quickly evaluation of result, 32
respondents or 53.33 percent need user friendliness, 22 respondents or 36.37 percent
need manual explanation, and 11 respondents or 18.33 percent need detail English
manual explanation.
In the aspect of the format of CAD/CAM/CAE use, it can be seen that 50 respondents or
83.33 percent are compatible with the partners, and 10 respondents or 16.67 percent are
not compatible with the partners.
In the aspect of company’s trend to invest in new CAD/CAM/CAE, it can be seen that
38 respondents or 63.33 have no plan, 10 respondents or 16.67 percent have plan to
upgrade, and 6 respondents or 10 percent are not sure and also have plan to invest.
In the aspect of buying CAD type, it can be seen that 22 respondents or 36.67 percent
bought license yearly, 21 respondents or 35 percent bought 3-5 year license, and 17
respondents or 28.33 percent bought permanent license.
In the aspect of buying CAM type, it can be seen that 27 respondents or 45 percent
bought license yearly, 17 respondents or 28.33 percent bought 3 -5 year license, 8
respondents or 13.33 percent bought permanent license, and 8 respondents did not buy.
In the aspect of buying CAE type, it can be seen that 50 respondents or 83.33 percent
did not buy license, 6 respondents or 10 percent bought permanent license, and 4
respondents or 6.67 percent bought license yearly.
In the aspect of company’s trend to upgrade CAD/CAM/CAE certificate, it can be seen
that 17 respondents or 28.33 percent upgraded because of significant software
improvement, 16 respondents or 26.67 percent upgraded as soon as new version
launched and use it as long as possible without any further upgrading, and 11
respondents or 18.33 percent upgraded because of compatibility with partners.
In the aspect of CAD/CAM/CAE consultant, it can be seen that 40 respondents or 66.67
percent have no consultant, and 20 respondents or 33.33 percent have consultant.

62
Table 5.4: Percentage, Average, Standard Deviation, and Level Importance
Have/Buy/Use CAD/CAM/CAE Technology
Technology
CAD/CAM/CAE
Very
low
(n,%)
Low
(n,%)
Medium
(n,%)
High
(n,%)
Very
High
(n,%)
Mean
S.D.
Level
Import
ance
1. The price of
computer and
software are
reasonably/accept
2. Type of
product produced
is complex or
varied frequently
3. Financial
benefits for
CAD/CAM/CAE
technology
2
(3.33)
6
(10.00)
2
(3.33)
2
(3.33)
10
(16.67)
6
(10.00)
25
(41.67)
11
(18.33)
19
(31.67)
14
(23.33)
20
(33.33)
27
(45.00)
17
(28.33)
13
(7.80)
6
(10.00)
3.70
3.40
3.48
1.03
1.28
0.93
High
Medium
High
4. Have more
competency in
the market
2
(3.33)
4
(6.67)
19
(31.67)
27
(45.00)
8
(13.33)
3.58 0.92 High
5. Reduce the
cost in design and
manufacturing
2
(3.33)
10
(16.67)
12
(20.00)
14
(23.33)
22
(36.67)
3.73 1.22 High
6. Reduce the
number of
workers
4
(6.67)
14
(23.33)
20
(33.33)
10
(16.67)
12
(20.00)
3.20 1.22 Medium
7. Fulfill the need
of customer by
using
CAD/CAM/CAE
Technology
8. Improve
control and
increase accuracy
in design and
manufacturing
4
(6.67)
2
(3.33)
2
(3.33)
4
(6.67)
13
(21.67)
8
(13.33)
20
(33.33)
14
(23.33)
21
(35.00)
32
(53.33)
3.87
4.17
1.21
1.14
High
High
9. Increase
productivity
4
(6.67)
4
(6.67)
10
(16.67)
16
(26.67)
26
(43.33)
3.93 1.05 High
10. would like to
expand market
share
0 16
(26.67)
19
(31.67)
15
(25.00)
10
(16.67)
3.32 0.98 Medium
11. Customer can
understand
product
Better
2
(3.33)
11
(18.33)
18
(30.00)
24
(40.00)
5
(8.33)
3.32 1.11 Medium
12. Have
CAD/CAM/ CAE
experts
4
(6.67)
10
(16.67)
19
(31.67)
19
(31.67)
8
(13.33)
3.28 0.61 Medium
Mean 3.59 0.61 High

63
From Table 5.4, it can be found that the level significant of having/buying/using
CAD/CAM/CAE technology in overall is in level high mean = 3.59. Considering on
each facet, it is seen that Improve control and increase accuracy in design and
manufacturing Mean = 4.17, Increase productivity Mean = 3.93, Fulfill the need of
customer by using CAD/CAM/CAE technology Mean = 3.87, Reduce the cost in design
and manufacturing Mean = 3.73, The price of computer and software are
reasonably/accepted Mean = 3.70, Have more competency in the market mean = 3.58,
Financial benefits for CAD/CAM/CAE technology Mean = 3.48, Type of product
produced is complex or varied frequently Mean = 3.40, would like to expand market
share and Customer can understand product Better Mean = 3.32, Have CAD/CAM/
CAE experts Mean = 3.28, and Reduce the number of workers Mean = 3.20.
5.2.4 Before Implementation Period (Preparation Period)
Table 5.5: Number and Percentage of Sampled Respondent on Before
Implementation Period (Preparation Period) (Cont’l)
Before Implementation Period
(Preparation Period)
Respondents (60) Mean
Prerequisites to have before implement
Knowledge and understanding
about CAD/CAM/CAE
technology
56 93.33
User training for
CAD/CAM/CAE technology
37 61.37
Prepare hardware 22 36.67
Expert to take care of CAD/CAM
/CAE technology
17 28.33
Required time period to prepare
CAD/CAM/CAE
1 moth 21 35.00
3 months 30 50.00
6 months 4 6.67
1 year 5 8.33
Understanding and Skill (2D CAD)
Create single and multiple
auxiliary views of surfaces and
objects
56 93.33
Insert and manipulate dimensions 60 100.00
Specify geometric tolerancing on
a drawing
Generate a 2-D Multiview
drawing
60
60
100.00
100.00
Generate a pictorial drawing 58 96.67
Create an assembly in 2-D
geometry
58 96.67
Create a bill of materials (BOM) 58 96.67
Scale and print hard copy on
output device
58 96.67
Source: Survey

64
Table 5.5: Number and Percentage of Sampled Respondent on Before
Implementation Period (Preparation Period) (Cont’l)
Before Implementation Period
(Preparation Period)
Respondents (60) Mean
Understanding and Skill (3D
CAD)
Create and manipulate solids,
edit and combine solids
58 96.67
Understand the mathematical
concepts behind typical 3D
curves B-spline, Nurbs and
Surfaces
50 83..33
Create complex 3D surface
models
60 100.00
3-D graphics sections views 56 93.33
Create a 2-D drawing from a 3-D
model
58 96.67
Create a 3-D model from a 2-D
drawing
56 93.33
Create a 3-D model 54 90.00
Produce bills of materials (BOM)
58 96.67
Produce an engineering drawing
From a generated 3D model
56 93.33
Use reverse engineering to
generate CAD
Understanding and Skill (CAM)
56 93.33
Determine and manipulate
geometry to be used for
programming
52 86.67
Verify and validate CNC
program
54 90.00
Identify cutting tools and cutting
condition
54 90.00
Post-processing 56 93.33
Understand data exchange 56 93.33
Generate CNC code from
exported data
54 90.00
Generate 2D tool paths 56 93.33
Generate 3D tool paths 54 90.00
Generate 5-asxis tool paths 52 86.67
Prototyping and model
manufacture
54 90.00
Use reverse engineering to
generate CAM
50 83.33
Source: Survey

65
Table 5.5: Number and Percentage of Sampled Respondent on Before
Implementation Period (Preparation Period) (Cont’l)
Before Implementation Period
(Preparation Period)
Respondents (60) Mean
Understanding and Skill (CFD)
Steady-state and transient 14 23.33
Laminar and turbulent 14 23.33
Incompressible and compressible 14 23.33
Forced, natural and mixed
convection
14 23.33
Condensation 12 20.00
Non-Newtonian fluids 14 23.33
Two-phase flow 12 20.00
Apply flow analysis of the
exported data
12 20.00
Understanding and Skill (K/B A)
Kinematics 10 16.67
Multi-body flexible bodies 10 16.67
Rigid and flexible bodies 12 20.00
Apply assembly analysis
software of exported data
12 20.00
Understanding and Skill
(BEA/Acoustics)
Sound pressure analysis 18 30.00
Sound intensity analysis 14 23.33
Sound power predictions 12 20.00
Radiation efficiency analysis
Subjective noise prediction
21
22
35.00
36.67
Sound quality optimization 16 26.67
Understanding and Skill (FEA)
Skill
Create 3D model with a variety
of geometry types
16 26.67
Create objects suitable for finite
element modeling and carry out
a thermal/stress/modal analysis
13
21.67
Understand the major practical
considerations in using
integrated FE analysis techniques
and how these relate to
analytical methods
18 30.00
Source: Survey

66
Table 5.5: Number and Percentage of Sampled Respondent on Before
Implementation Period (Preparation Period)
Before Implementation Period
(Preparation Period)
Respondents (60) Mean
Understanding and Skill (FEA)
Linear and nonlinear structural analysis
Static and dynamic stress 13 21.67
Normal modes 12 20.00
Buckling 15 25.00
Stress stiffening and spin
softening
32 53.33
Modal analysis with differential
stiffness 33 55.00
Dynamic response analysis 15 25.00
Nonlinear material models 20 33.33
Large displacement, large strain 24 40.00
Material hardening and creep 21 35.00
Glue connections 24 40.00
Node-to-node contact including
friction
27 45.00
3D surface-to-surface contact 24 40.00
Laminate composites analysis 25 41.67
Apply stress analysis software of
exported data
22 36.67
Understanding and Skill (FEA)
Durability/fatigue analysis
Strength and fatigue safety for
cyclic loading (infinite life
model)
25 41.67
Advanced life and fatigue
damage Prediction (Finite life
model)
24 40.00
Both uniaxial and biaxial stress
cycles
23 38.33
Utilize linear or nonlinear
stress/strain results from FE
models
25 41.67
Apply mechanical analysis
software of exported data
25 41.67
Understanding and Skill (FEA)
Thermal analysis
Steady-state and transient 18 30.00
Conduction, convection and
radiation
14 23.33
Advanced radiation and
environmental heating
12 20.00
Apply heat analysis of the
exported data
10 16.67
Source: Survey
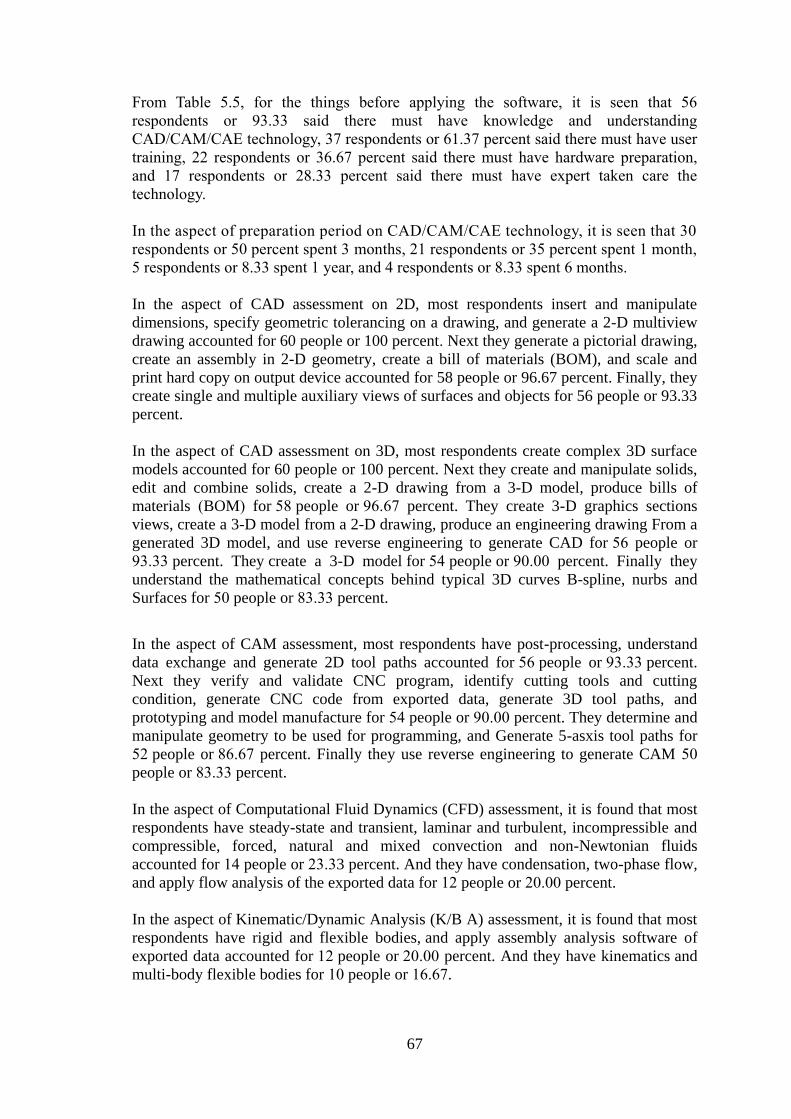
67
From Table 5.5, for the things before applying the software, it is seen that 56
respondents or 93.33 said there must have knowledge and understanding
CAD/CAM/CAE technology, 37 respondents or 61.37 percent said there must have user
training, 22 respondents or 36.67 percent said there must have hardware preparation,
and 17 respondents or 28.33 percent said there must have expert taken care the
technology.
In the aspect of preparation period on CAD/CAM/CAE technology, it is seen that 30
respondents or 50 percent spent 3 months, 21 respondents or 35 percent spent 1 month,
5 respondents or 8.33 spent 1 year, and 4 respondents or 8.33 spent 6 months.
In the aspect of CAD assessment on 2D, most respondents insert and manipulate
dimensions, specify geometric tolerancing on a drawing, and generate a 2-D multiview
drawing accounted for 60 people or 100 percent. Next they generate a pictorial drawing,
create an assembly in 2-D geometry, create a bill of materials (BOM), and scale and
print hard copy on output device accounted for 58 people or 96.67 percent. Finally, they
create single and multiple auxiliary views of surfaces and objects for 56 people or 93.33
percent.
In the aspect of CAD assessment on 3D, most respondents create complex 3D surface
models accounted for 60 people or 100 percent. Next they create and manipulate solids,
edit and combine solids, create a 2-D drawing from a 3-D model, produce bills of
materials (BOM) for 58 people or 96.67 percent. They create 3-D graphics sections
views, create a 3-D model from a 2-D drawing, produce an engineering drawing From a
generated 3D model, and use reverse engineering to generate CAD for 56 people or
93.33 percent. They create a 3-D model for 54 people or 90.00 percent. Finally they
understand the mathematical concepts behind typical 3D curves B-spline, nurbs and
Surfaces for 50 people or 83.33 percent.
In the aspect of CAM assessment, most respondents have post-processing, understand
data exchange and generate 2D tool paths accounted for 56 people or 93.33 percent.
Next they verify and validate CNC program, identify cutting tools and cutting
condition, generate CNC code from exported data, generate 3D tool paths, and
prototyping and model manufacture for 54 people or 90.00 percent. They determine and
manipulate geometry to be used for programming, and Generate 5-asxis tool paths for
52 people or 86.67 percent. Finally they use reverse engineering to generate CAM 50
people or 83.33 percent.
In the aspect of Computational Fluid Dynamics (CFD) assessment, it is found that most
respondents have steady-state and transient, laminar and turbulent, incompressible and
compressible, forced, natural and mixed convection and non-Newtonian fluids
accounted for 14 people or 23.33 percent. And they have condensation, two-phase flow,
and apply flow analysis of the exported data for 12 people or 20.00 percent.
In the aspect of Kinematic/Dynamic Analysis (K/B A) assessment, it is found that most
respondents have rigid and flexible bodies, and apply assembly analysis software of
exported data accounted for 12 people or 20.00 percent. And they have kinematics and
multi-body flexible bodies for 10 people or 16.67.

68
In the aspect Boundary Element Analysis (BEA/Acoustics) assessment, it is found that
most respondents have subjective noise prediction accounted for 6 people or 36.67
percent. Next they have radiation efficiency analysis for 21 people or 35.00 percent.
They have sound pressure analysis for 18 or 30.00 percent. 16 people or 26.67 percent
for Sound quality optimization. 14 people or 23.33 percent for Sound intensity analysis,
and 12 people or 20 percent for Sound power predictions.
In the aspect of Finite Element Analysis (FEA) assessment with skills, most respondents
have skills on understand the major practical considerations in using integrated FE
analysis techniques and how these relate to analytical methods accounted for 18 people
or 30.00 percent, create 3D model with a variety of geometry types for 16 people or
26.67 percent, and create objects suitable for finite element modeling and carry out a
thermal/stress/modal analysis for 13 people or 21.67 percent.
In the aspect of Finite Element Analysis (FEA) with linear and nonlinear structural
analysis, it is found that most respondents have modal analysis with differential stiffness
for 33 people or 55.00 percent, stress stiffening and spin softening for 32 people or
53.33 percent, node to node contact including friction 27 people or 45.00 percent,
laminate composites analysis 25 people or 41.67 percent, large displacement with large
strain, glue connections, and 3D surface-to-contact each for 24 people or 40.00 percent,
apply stress analysis software of exported data for 22 people or 36.67 percent, material
hardening and creep for 21 people or 35.00 percent, nonlinear material models for 20
people or 33.33 percent, dynamic response analysis and Buckling each for 15 people or
25.00 percent, static and dynamic stress for 13 people or 21.67 percent, and normal
modes for 12 people or 20.00.
In the aspect of Finite Element Analysis (FEA) assessment with Durability/fatigue
analysis, it is seen that most respondents have strength and fatigue safety for cyclic
loading (infinite life model), utilize linear or nonlinear stress/strain results from FE
models, and apply mechanical analysis software of exported data for 25 people or 41.67
percent, advanced life and fatigue damage Prediction (Finite life model) for 24 people
or 40.00 percent, and both uniaxial and biaxial stress cycles for 23 people or 38.33.
In the aspect of Finite Element Analysis (FEA) with thermal analysis, most respondents
used steady-state and transient for 18 people or 30.00 percent, conduction, convection
and radiation for 14 people or 23.33 percent, advanced radiation and environmental
heating for 12 people or 20.00 percent, and apply heat analysis of the exported data for
10 people or 16.67 percent.

69
5.2.5 Implementation Period
Table 5.6: Number and Percentage of Sampled Respondent on Implementation
Period
Implementation Period Respondents (60) Mean
Process for implement
Big bang 28 46.67
Mini bang 12 20.00
Phased by site 6 10.00
Phased by module 14 23.33
Experience of using CAD/CAM/CAE
technology
High cost (Software, hardware,
implement, consult, manage and
training )
48 80.00
Quality is not as good as
expected
6 10.00
More problems occur such as bug 10 16.67
More time to solve the problem
because it more depends on
software
16 26.67
Hard to use such as command is
not standard
Document is not update and hard
to understand
6
10
10.00
16.67
The process hard and take time to
understand
8 13.33
Cannot use it to fulfill
requirement
8 13.33
Not support with other software 14 23.33
Other 2 3.33
Source: Survey
From Table 5.6, implementation period, it is seen that most respondents had Big bang
process of implement (adjust every module in every same time zone) accounted for 28
people or 46.67 percent, phased by module (adjust one module for one zone) for 14
people or 23.33 percent, mini bang (adjust one module for every same time zone) for 12
people or 20 percent, and phased by site (adjust every module for one zone editing time)
for 6 people or 10 percent.
In the aspect of CAD/CAM/CAE using experience, it is seen that most respondents
spent high expense for 48 people or 80 percent, spent more time to solve the problem
because it more depends on software for 16 people or 26.67 percent, not able to support
with other software for 14 people or 23.33 percent, had the document not update and
hard to understand for 10 people or 16.67 percent, the process hard and take time to
understand and cannot use it to fulfill requirement each for 8 people or 13.33 percent,

70
quality is not as good as expected and hard to use such as command is not standard each
of 6 people or 10 percent, and others for 2 people or 3.33 percent.
Table 5.7: Percentage, Average, Standard Deviation and Level of Influential
Factors in CAD/CAM/CAE Implementation
From Table 5.7, Influential factors in CAD/CAM/CAE implementation in overall is in
high level Mean = 3.42. For each facet, the highest is the readiness of management team
in attitude and knowledge Mean = 3.63. Next below is the readiness of organization in
term of time, capital and Personnel Mean = 3.55. The last is consultant /User and
Technical problem mean = 3.25
Influential factors
in
CAD/CAM/CAE
implementation
Very
low
(n,%)
Low
(n,%)
Me
dium
(n,%)
High
(n,%)
Very
High
(n,%)
Mean
S.D.
Level
Import
ance
1.Cousultant/User 10
(16.67)
4
(6.67)
17
(28.33)
19
(31.67)
10
(16.67)
3.25 1.29 Medium
2. The readiness of
management team
in attitude and
knowledge
2
(3.33)
8
(13.33)
13
(21.67)
24
(40.00)
13
(21.67)
3.63 1.07 High
3.The readiness of
organization in
term of time,
capital and
Personnel
2
(3.33)
12
(20.00)
13
(21.67)
17
(28.33)
16
(26.67)
3.55 1.18 High
4. Technical
problem
0 17
(28.33)
20
(33.33)
14
(23.33)
9
(15.00)
3.25 1.04 Medium
Mean 3.42 0.98 High

71
5.2.6 After Implementation Period
Table 5.8: Number and Percentage of Sampled Respondent After Implementation
Period
After Implementation Period Respondents(60) Mean
The benefit that the workers
or organization got after implement
CAD/CAM/CAE technology
Understanding of workers 29 48.33
Improve quality of work 46 76.67
More accuracy of work 32 53.33
More convenient 30 50.00
Reduce cost in case of word fail 14 23.33
Reduce processing time 42 70.00
The benefit that business got after
implement CAD/CAM/CAE technology
Customer more satisfy on product 38 63.33
Increase the number of customer 17 28.33
Reduce processing cost of
business
39 65.00
Increase turnover of business 19 31.67
Can competition with another
company
19 31.67
The way to develop CAD/CAM/CAE
technology in the future
Develop or adjust existing
technology in the future
33 55.00
Bring up-to-date technology to
use in company or organization
27 45.00
Other
Products
0 0
No gap 18 30.00
Less than 5 years 28 46.67
5-10 years 14 23.33
More than 10 years 0 0
Production Process/Equipment
No gap 18 30.00
Less than 5 years 32 53.33
5-10 years 10 16.67
More than 10 years 0 0
Source: Survey
From Table 5.8, after implementation period on the benefit that the workers or
organization got after implement CAD/CAM/CAE technology, it is seen that most
respondents have improve quality of work for 46 people or 76.67 percent, reduce
processing time for 42 people or 70.00 percent, have more accuracy of work for 32
people or 53.33 percent, get more convenient for 30 people or 50.00 percent, get

72
understanding of workers for 29 people or 48.33 percent, and reduce cost in case of
word fail for 14 people or 23.33 percent.
On the benefit that business got after implement CAD/CAM/CAE technology, it is seen
that most respondents have reduce processing cost of business for 39 people or 65.00
percent, customer gets more satisfy on product for 38 people or 63.33 percent,
increasing turnover of business and can compete with another company for 19 people or
31.67 percent, and Increase the number of customer for 17 people or 28.33 percent.
On the way to develop CAD/CAM/CAE technology in the future, it is seen that most
respondents have develop or adjust existing technology in the future for 33 people or
55.00 percent, and bring up-to-date technology to use in company or organization for 27
people or 45.00 percent.
In the product aspect of the after implementation period the company needed to top up
their technology to international standard, most respondent claimed it takes less than 5
years for 28 people or 46.67 percent, no gap for 18 people or 30.00 percent, and takes
5-10years for 14 people or 23.33 percent.
In the production process/equipment aspect of the after implementation period the
company needed to top up their technology to international standard, most respondent
claimed it takes less than 5 years for 32 people or 53.33 percent, no gap for 18 people or
30.00 percent, and takes 5-10years for 10 people or 16.67 percent.
Table 5.9: Percentage, Average, Standard Deviation and Level of The Change
After Implement CAD/CAM/CAE Technology (Cont’l)
The change after
implement CAD/
CAM /CAE
technology
Very
low
(n,%)
Low
(n,%)
Me
dium
(n,%)
High
(n,%)
Very
High
(n,%)
Mean
S.D.
Level
Import
ance
1. The variety of
product
4
(6.67)
4
(6.67)
15
(25.00)
23
(38.33)
14
(23.33)
3.65 1.12 High
2. The number of
Customer
0 12
(20.00)
9
(15.00)
33
(55.00)
6
(10.00)
3.55 0.93 High
3. The quantity of
work from
customer
2
(3.33)
12
(20.00)
5
(8.33)
31
(51.67)
10
(16.67)
3.58 1.09
High
4. The error from
manufacturing
4
(6.67)
22
(36.67)
13
(21.67)
11
(18.33)
10
(16.67)
3.02 1.23 Medium
5. The time for
manufacturing
4
(6.67)
20
(33.33)
15
(25.00)
11
(18.33)
10
(16.67)
3.05 1.21 Medium
6. The quality of
design
4
(6.67)
2
(3.33)
10
(16.67)
25
(41.67)
19
(31.67)
3.88 1.10 High
7. The quality of
product
0 2
(3.33)
10
(16.67)
26
(43.33)
22
(36.67)
4.13 0.81 High

73
Table 5.9: Percentage, Average, Standard Deviation and Level of The Change
After Implement CAD/CAM/CAE Technology
From Table 5.9 the level of change after implement CAD/CAM/CAE technology in
overall is in high level with mean of 3.50. However, the highest facet is the quality of
product with mean of 4.13. Next facet is the quality of design with mean = 3.88. The
mean of variety of product is 3.65. The mean of revenue of company is 3.63. The mean
of quantity of work from customer and the profit of company is 3.58. The mean of
number of customer is 3.55. The mean of capital for design is 3.23. The mean of capital
for product is 3.22. The mean of time for manufacturing is 3.05, and the mean of error
from manufacturing is 3.02.
5.2.7 The Problem of Implementation CAD/CAM/CAE in company
Table 5.10: Percentage, Average, Standard Deviation and Level of Problem of
Implementation CAD/CAM/CAE in Company (Cont’l)
The change after
implement CAD/
CAM /CAE
technology
Very
low
(n,%)
Low
(n,%)
Me
dium
(n,%)
High
(n,%)
Very
High
(n,%)
Mean
S.D.
Level
Import
ance
8. The capital for
design
2
(3.33)
9
(15.00)
34
(56.67)
3
(5.00)
12
(20.00)
3.23 1.05 Medium
9. The capital for
product
2
(3.33)
7
(11.67)
35
(58.33)
8
(13.33)
8
(13.33)
3.22 0.94 Medium
10. The revenue of
company
2
(3.33)
3
(5.00)
22
(36.67)
21
(35.00)
12
(20.00)
3.63 0.97 High
11. The profit of
company
4
(6.67)
4
(6.67)
17
(28.33)
23
(38.33)
12
(20.00)
3.58 1.09 High
Mean 3.50 0.73 High
The Problem of
implementation
CAD/CAM/CAE
in
company
Very
low
(n,%)
Low
(n,%)
Me
dium
(n,%)
High
(n,%)
Very
High
(n,%)
Mean
S.D.
Level
Import
ance
1. workers lack of
knowledge in
technology
2
(3.33)
13
(21.67)
20
(33.33)
17
(28.33)
8
(13.33)
3.27 1.05 Medium
2. workers lack of
experience and
skill in technology
2
(3.33)
13
(21.67)
20
(33.33)
21
(35.00)
8
(13.33)
3.33 1.06 Medium
3. workers do not
understand the
English menu
10
(16.67)
15
(25.00)
24
(40.00)
6
(10.00)
5
(8.33)
2.68 1.13 Medium

74
Table 5.10: Percentage Average Standard Deviation and Level of Problem of
Implementation CAD/CAM/CAE in Company
The Problem of
implementation
CAD/CAM/CAE
in company
Very
low
(n,%)
Low
(n,%)
Me
dium
(n,%)
High
(n,%)
Very
High
(n,%)
Mean
S.D.
Level
Import
ance
4. workers
familiar with old
technology
cannot adjust to
the
New technology
6
(10.00)
13
(21.67)
24
(40.00)
15
(25.00)
2
(3.33)
2.90 1.00 Medium
5. workers miss
some course of
training
9
(15.00)
12
(20.00)
21
(35.00)
10
(16.67)
8
(13.33)
2.93 1.23 Medium
6. workers often
change the job
position
6
(10.00)
19
(31.67)
19
(31.67)
12
(20.00)
4
(6.67)
2.82 1.08 Medium
7. Management
team not realize
the important of
implement
technology
15
(25.00)
12
(20.00)
19
(31.67)
10
(16.67)
4
(6.67)
2.60 1.22 Low
8. Management
team does not
support worker
training
15
(25.00)
12
(20.00)
19
(31.67)
10
(16.67)
4
(6.67)
2.60 1.22 Low
9. Training course
not appropriate in
the real situation
6
(10.00)
19
(31.67)
21
(35.00)
10
(16.67)
4
(6.67)
2.78 1.06 Medium
10. Transfer of
knowledge and
technology from
top to bottom not
smooth
11. High capital
not be worth white
for Invest
7
(11.67)
7
(11.67)
18
(30.00)
18
(30.00)
17
(28.33)
17
(28.33)
14
(23.33)
14
(23.33)
4
(6.67)
4
(6.67)
2.83
2.83
1.12
1.12
Medium
Medium
12. Lack of capital
for Buy
For equipment
2
(3.33)
12
(20.00)
25
(41.67)
15
(25.00)
6
(10.00)
3.18 0.98 Medium
Mean 2.89 0.72 Medium

75
From Table 5.10, the level of problem of implementation CAD/CAM/CAE in company
is in the medium level with mean of 2.89. However, the highest facet is the lack of
capital for buying equipment with mean of 3.18. The mean of transferring of knowledge
and technology from top to bottom not smooth and high capital not be worth white for
Invest is 2.83. The mean of workers often change the job position is 2.82. The mean of
training course not appropriate in the real situation mean is 2.78. The mean of
management team not realize the important of implement technology and management
team does not support worker training is 2.60.
5.2.8 Inferential Statistics (Hypothesis Testing: One-way ANOVA)
5.2.9 Hypothesis 1
Hypothesis 1 the differences of CAD software in companies have different factors
affecting level of importance of have/buy/use of CAD/CAM/CAE technology. It can be
written in following statistic hypothesis:
H0 = the differences of CAD software in companies have no different factors affecting
level of importance of have/buy/use of CAD/CAM/CAE technology.
H1 = the differences of CAD software in companies have different factors affecting
level of importance of have/buy/use of CAD/CAM/CAE technology.
Table 5.11: Comparison of The Different Factors Affecting Level of Importance of
Have/Buy/Use of CAD/CAM/CAE Technology Classified by CAD Software in The
Company (Cont’l)
Sum of
Squares
df Mean
Square
F Sig.
Auto CAD
Between Groups
Within Groups
Total
4.505
8.095
12.600
16
43
59
0.282
0.188
1.496
0.146
Solid
Edge
Between Groups
Within Groups
Total
0.933
1.000
1.933
16
43
59
0.058
0.023
2.508 0.008
Solid
Works
Between Groups
Within Groups
Total
7.543
4.190
11.733
16
43
59
0.471
0.097
4.837 0.000
NX
Unigrap
hics
Between Groups
Within Groups
Total
5.137
2.333
7.650
16
43
59
0.332
0.054
6.124 0.000
Sig.>0.05
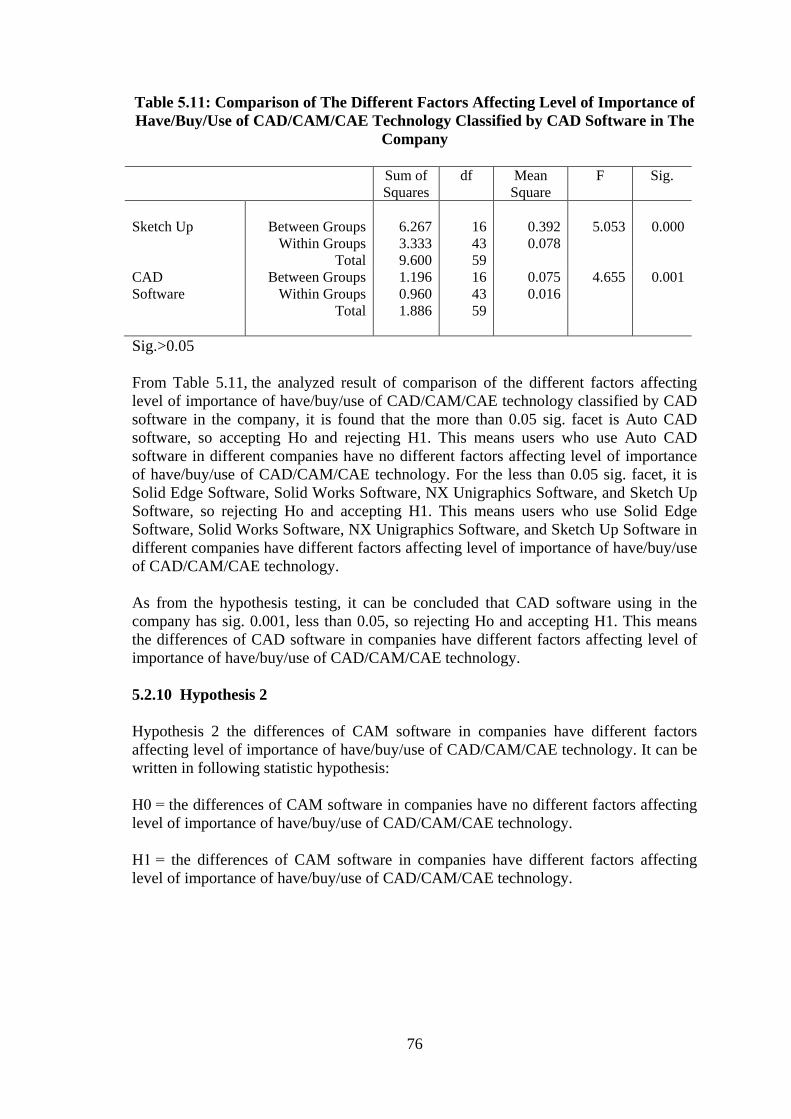
76
Table 5.11: Comparison of The Different Factors Affecting Level of Importance of
Have/Buy/Use of CAD/CAM/CAE Technology Classified by CAD Software in The
Company
Sum of
Squares
df Mean
Square
F Sig.
Sketch Up
Between Groups
Within Groups
Total
6.267
3.333
9.600
16
43
59
0.392
0.078
5.053
0.000
CAD
Software
Between Groups
Within Groups
Total
1.196
0.960
1.886
16
43
59
0.075
0.016
4.655 0.001
Sig.>0.05
From Table 5.11, the analyzed result of comparison of the different factors affecting
level of importance of have/buy/use of CAD/CAM/CAE technology classified by CAD
software in the company, it is found that the more than 0.05 sig. facet is Auto CAD
software, so accepting Ho and rejecting H1. This means users who use Auto CAD
software in different companies have no different factors affecting level of importance
of have/buy/use of CAD/CAM/CAE technology. For the less than 0.05 sig. facet, it is
Solid Edge Software, Solid Works Software, NX Unigraphics Software, and Sketch Up
Software, so rejecting Ho and accepting H1. This means users who use Solid Edge
Software, Solid Works Software, NX Unigraphics Software, and Sketch Up Software in
different companies have different factors affecting level of importance of have/buy/use
of CAD/CAM/CAE technology.
As from the hypothesis testing, it can be concluded that CAD software using in the
company has sig. 0.001, less than 0.05, so rejecting Ho and accepting H1. This means
the differences of CAD software in companies have different factors affecting level of
importance of have/buy/use of CAD/CAM/CAE technology.
5.2.10 Hypothesis 2
Hypothesis 2 the differences of CAM software in companies have different factors
affecting level of importance of have/buy/use of CAD/CAM/CAE technology. It can be
written in following statistic hypothesis:
H0 = the differences of CAM software in companies have no different factors affecting
level of importance of have/buy/use of CAD/CAM/CAE technology.
H1 = the differences of CAM software in companies have different factors affecting
level of importance of have/buy/use of CAD/CAM/CAE technology.

77
Table 5.12: Comparison of The Different Factors Affecting Level of Importance of
Have/Buy/Use of CAD/CAM/CAE Technology Classified by CAM Software in The
Company
Sum of
Squares
df Mean
Square
F Sig.
Master CAM
Between Groups
Within Groups
Total
9.210
5.190
14.400
16
43
59
0.576
0.121
4.768
0.000
Solid
CAM
Between Groups
Within Groups
Total
7.543
4.190
11.733
16
43
59
0.471
0.097
4.837 0.000
Surf CAM Between Groups
Within Groups
Total
0.933
1.000
1.933
16
43
59
0.058
0.023
2.508 0.008
Edge
CAM
Delcam
Esprit
CAM
Software
Between Groups
Within Groups
Total
Between Groups
Within Groups
Total
Between Groups
Within Groups
Total
Between Groups
Within Groups
Total
0.933
1.000
1.933
3.583
1.000
4.583
2.733
1.000
3.733
0.578
0.271
0.850
16
43
59
16
43
59
16
43
59
16
43
59
0.058
0.023
0.224
0.023
0.171
0.023
0.036
0.006
2.508
9.630
7.346
5.732
0.008
0.000
0.000
0.000
Sig.>0.05
From Table 5.12, the analyzed result of comparison of the different factors affecting
level of importance of have/buy/use of CAD/CAM/CAE technology classified by CAM
software in the company, it is found that all the 6 software (Master CAM, Solid CAM,
Surf CAM, Edge CAM, Delcam, and Esprit) sig. are less than 0.05. So rejecting Ho and
accepting H1. This means that the users of Master CAM, Solid CAM, Surf CAM, Edge
CAM, Delcam, and Esprit in different companies have different factors affecting level
of importance of have/buy/use of CAD/CAM/CAE technology.
As from the hypothesis testing, it can be concluded that CAM software using in the
company has sig. 0.000, less than 0.05, so rejecting Ho and accepting H1. This means
the differences of CAM software in companies have different factors affecting level of
importance of have/buy/use of CAD/CAM/CAE technology.

78
5.2.11 Hypothesis 3
Hypothesis 3 the differences of CAE software in companies have different factors
affecting level of importance of have/buy/use of CAD/CAM/CAE technology. It can be
written in following statistic hypothesis:
H0 = the differences of CAE software in companies have no different factors affecting
level of importance of have/buy/use of CAD/CAM/CAE technology.
H1 = the differences of CAE software in companies have different factors affecting
level of importance of have/buy/use of CAD/CAM/CAE technology.
Table 5.13: Comparison of The Different Factors Affecting Level of Importance of
Have/Buy/Use of CAD/CAM/CAE Technology Classified by CAE Software in The
Company
Sum of
Squares
df Mean
Square
F Sig.
Cosmos
Between Groups
Within Groups
Total
1.543
3.857
5.400
16
43
59
0.096
0.090
1.075
0.406
MSC/
Natran
Between Groups
Within Groups
Total
0.233
0.750
0.983
16
43
59
0.015
0.015
0.836 0.640
ANSYS Between Groups
Within Groups
Total
0.793
2.940
3.733
16
43
59
0.050
0.068
0.725 0.754
Abaqus
Not have
to use
now
CAE
Software
Between Groups
Within Groups
Total
Between Groups
Within Groups
Total
Between Groups
Within Groups
Total
0.933
1.000
1.933
1.138
4.262
5.400
0.124
0.635
5.400
16
43
59
16
43
59
16
43
59
0.058
0.023
0.071
0.099
0.008
0.015
2.508
0.718
0.525
0.008
0.761
0.919
Sig.>0.05
From Table 5.13, the analyzed result of comparison of the different factors affecting
level of importance of have/buy/use of CAD/CAM/CAE technology classified by CAE
software in the company, it is found that the more than 0.05 sig. facets are Cosmos,
MSC/Natran, ANSYS, and Not have to use now, so accepting Ho and rejecting H1.
This means users who use Cosmos, MSC/Natran, ANSYS, and Not have to use now in
different companies have no different factors affecting level of importance of
have/buy/use of CAD/CAM/CAE technology. For the less than 0.05 sig. facet, it is
Abaqus, so rejecting Ho and accepting H1. This means users who use Abaqus Software
in different companies have different factors affecting level of importance of
have/buy/use of CAD/CAM/CAE technology.

79
As from the hypothesis testing, it can be concluded that CAE software using in the
company has sig. 0.919, more than 0.05, so accepting Ho and rejecting H1. This means
the differences of CAE software in companies have no different factors affecting level
of importance of have/buy/use of CAD/CAM/CAE technology.
5.2.12 Hypothesis 4
Hypothesis 4 the CAD users in different companies that have skills and understanding
in CAD software have different influential factors in implementing CAD/CAM/CAE. It
can be written in following statistic hypothesis:
H0 = the CAD users in different companies that have skills and understanding in CAD
software have no different influential factors in implementing CAD/CAM/CAE.
H1 = the CAD users in different companies that have skills and understanding in CAD
software have different influential factors in implementing CAD/CAM/CAE.
Table 5.14: Comparison of The Different Influential Factors Affecting Level
Implementation of CAD/CAM/CAE Classified by CAD Skills and Understanding
Sum of
Squares
df Mean
Square
F Sig.
2D CAD
Between Groups
Within Groups
Total
0.484
0.041
0.525
11
48
29
0.044
0.001
52.028
0.000
3D CAD Between Groups
Within Groups
Total
0.929
0.455
1.384
11
48
59
0.084
0.009
8.900 0.000
CAD Skills
and
Understanding
Between Groups
Within Groups
Total
0.613
0.144
0.757
11
48
59
0.056
0.003
18.585 0.000
Sig.>0.05
From Table 5.14 the analyzed result of comparison of the different influential factors
affecting level implementation of CAD/CAM/CAE classified by CAD skills and
understanding, it is found that both facets with less than 0.05 sig. are 2D CAD, 3D
CAD, so rejecting Ho and accepting H1. This means that users that have understanding
and skills in 2D CAD and 3D CAD in different companies have different influential
factors affecting the implementation of CAD/CAM/CAE.
As from the hypothesis testing, it can be concluded that skills and understanding in
CAD software using in the company has sig. 0.000, less than 0.05, so rejecting Ho and
accepting H1. This means that users that have understanding and skill in CAD software
of different companies have different influential factors affecting the implementation of
CAD/CAM/CAE.

80
5.2.13 Hypothesis 5
Hypothesis 5 the CAM users in different companies that have skills and understanding
in CAM software have different influential factors in implementing CAD/CAM/CAE. It
can be written in following statistic hypothesis:
H0 = the CAM users in different companies that have skills and understanding in CAM
software have no different influential factors in implementing CAD/CAM/CAE.
H1 = the CAM users in different companies that have skills and understanding in CAM
software have different influential factors in implementing CAD/CAM/CAE.
Table 5.15: Comparison of The Different Influential Factors Affecting Level
Implementation of CAD/CAM/CAE Classified by CAM Skills and Understanding
Sum of
Squares
df Mean
Square
F Sig.
CAM Skills
and
Understanding
Between Groups
Within Groups
Total
1.492
2.326
3.818
11
48
59
0.136
0.048
2.800
0.007
Sig.>0.05
From Table 5.15, comparison of the different influential factors affecting level
implementation of CAD/CAM/CAE classified by CAM skills and understanding, it is
found that it has 0.007 sig., which is less than 0.05, so rejecting Ho and accepting H1.
This means that users that have understanding and skills in CAM software of different
companies have different influential factors affecting the implementation of
CAD/CAM/CAE.
5.2.14 Hypothesis 6
Hypothesis 6 the CAE users in different companies that have skills and understanding in
CAE software have different influential factors in implementing CAD/CAM/CAE. It
can be written in following statistic hypothesis:
H0 = the CAE users in different companies that have skills and understanding in CAE
software have no different influential factors in implementing CAD/CAM/CAE.
H1 = the CAE users in different companies that have skills and understanding in CAE
software have different influential factors in implementing CAD/CAM/CAE.

81
Table 5.16 Comparison of The Different Influential Factors Affecting Level
Implementation of CAD/CAM/CAE Classified by CAE Skills and Understanding
Sum of
Squares
df Mean
Square
F Sig.
Computational
Fluid Dynamics
(CFD)
Between Groups
Within Groups
Total
1.526
5.137
6.663
11
48
59
0.139
0.018
1.296
0.256
Kinematic/
Dynamic Analysis
(K/B A)
Between Groups
Within Groups
Total
1.632
3.673
5.305
11
48
59
0.148
0.077
1.939 0.057
Boundary Element
Analysis (BEA/
Acoustics)
Between Groups
Within Groups
Total
1.175
2.284
3.459
11
48
59
0.107
0.048
2.245 0.027
Finite Element Analysis
(FEA)
Between Groups
Within Groups
Total
1.017
2.149
3.166
11
48
59
0.092
0.045
2.065 0.042
CAE Skills and
Understanding
Between Groups
Within Groups
Total
16.412
44.098
60.510
11
48
59
1.492
0.919
1.624 0.122
Sig.>0.05
From Table 5.16, the analyzed result of comparison of the different influential factors
affecting level implementation of CAD/CAM/CAE classified by CAE skills and
understanding, it is found that the facet with more than 0.05 sig. are Computational Fluid
Dynamics (CFD) and Kinematic/Dynamic Analysis (K/B A), so accepting Ho and
rejecting H1. This means that users that have understanding and skills in Computational
Fluid Dynamics (CFD) and Kinematic/Dynamic Analysis (K/B A) of different
companies have no different influential factors affecting the implementation of
CAD/CAM/CAE. For the facet with less than 0.05 of sig. is Boundary Element Analysis
(BEA/Acoustics) and Finite Element Analysis (FEA) shows that rejecting Ho and
accepting H1. This means that the users that have understanding and skills in Boundary
Element Analysis (BEA/Acoustics) and Finite Element Analysis (FEA) of different
companies have different influential factors affecting the implementation of
CAD/CAM/CAE.
As from the hypothesis testing, it can be concluded that skills and understanding in CAE
software using in the company has sig. 0.122, more than 0.05, so accepting Ho and
rejecting H1. This means that users that have understanding and skill in CAE software of
different companies have no different influential factors affecting the implementation of
CAD/CAM/CAE.

82
5.2.15 Hypothesis 7
Hypothesis 7 the different users of CAD/CAM/CAE software product have different
factors affecting the problem in implementation of CAD/CAM/CAE. It can be written
in following statistic hypothesis:
H0 = the different users of CAD/CAM/CAE software product have no different factors
affecting the problem in implementation of CAD/CAM/CAE
H1 = the different users of CAD/CAM/CAE software product have different factors
affecting the problem in implementation of CAD/CAM/CAE.
Table 5.17: Comparison of The Different Factors Affecting The Problem in
Implementation of CAD/CAM/CAE, Faceting on CAD/CAM/CAE Software
Product
Sum of
Squares
df Mean Square F Sig.
Between Groups
Within Groups
Total
23.067
8.667
31.733
20
39
59
1.153
0.222
5.190
0.000
Sig.>0.05
From Table 5.17, the analyzed result of comparison of the different factors affecting the
problem in implementation of CAD/CAM/CAE, faceting on CAD/CAM/CAE software
product, it is found that the facet has 0.000 sig, which is less than 0.05, so rejecting Ho
and accepting H1. This means that different users of CAD/CAM/CAE software product
have different factors affecting the problem in implementation of CAD/CAM/CAE.
5.2.16 Hypothesis 8
Hypothesis 8 the different users of CAD/CAM/CAE software product on production
process and equipment have different factors affecting the problem in implementation
of CAD/CAM/CAE. It can be written in following statistic hypothesis:
H0 = the different users of CAD/CAM/CAE software product on production process
and equipment have no different factors affecting the problem in implementation of
CAD/CAM/CAE.
H1 = the different users of CAD/CAM/CAE software product on production process
and equipment have different factors affecting the problem in implementation of
CAD/CAM/CAE.

83
Table 5.18 Comparison of The Different Factors Affecting The Problem in
Implementation of CAD/CAM/CAE, Faceting on Production Process and
Equipment of CAD/CAM/CAE Software Product
Sum of
Squares
df Mean Square F Sig.
Between Groups
Within Groups
Total
20.600
6.333
26.933
20
39
59
1.030
0.162
6.343
0.000
Sig.>0.05
From Table 5.18, the analyzed result of comparison of the different factors affecting the
problem in implementation of CAD/CAM/CAE, faceting on production process and
equipment of CAD/CAM/CAE software product, it is found that the facet has 0.000 sig,
which is less than 0.05, so rejecting Ho and accepting H1. This means that the different
users of CAD/CAM/CAE software product on production process and equipment have
different factors affecting the problem in implementation of CAD/CAM/CAE.

84
CHAPTER 6
CONCLUSIONS AND RECOMMENDATIONS
6.1 Conclusions
6.1.1 General Information
Most of the respondents work in the CAD-related position in the large-sized company.
The company product is metal. The business area is the processed product and design,
using CAD software.
6.1.2 State of Using CAD/CAM/CAE in Company
Most of the respondents use Auto CAD software, Master CAM, and Cosmos software
in the company. Knowing the software from others (boss/customer/friend), they use
CAD/CAM/CAE because the vision of the board executive or the firm’s policy. The
main factor of choosing the software brand of CAD/CAM/CAE is because the capable
function is compatible with the company’s requirements. The importing source of
software CAD/CAM/CAE is software firm, and the number of officer who can use
CAD technology is around 6-15 people, who can use CAM is around 6-15 people, who
can use CAE is around 1-5 people. The important characteristic of CAD/CAM/CAE
software that the company targeted is the supporting of more format and functionality.
The format of using CAD/CAM/CAE technology is the compatible with partner. There
is no trend of company to invest in any new CAD/CAM/CAE technology. The license
of CAD technology has been bought yearly as the same for the CAM technology, while
the license of CAE is permanent. There is a trend of company to upgrade
CAD/CAM/CAE license because there will be a significant improvement of software.
The company has no consultant of CAD/CAM/CAE, and the level of importance in
have/buy/use CAD/CAM/CAE technology on overall is in the high level with mean of
3.59 (Likert Scale).
6.1.3 Before Implementation Period (Preparation Period)
From the analysis, it can be concluded that most respondents should have the right
knowledge and understanding before implementation. The preparation period of
CAD/CAM/CAE technology is about 3 months. The understanding and skill of CAD
software in 2D drafting is inserted and manipulate dimensions, specify geometric
tolerancing on a drawing, and generate a 2-D multiview drawing. For 3D drafting, it is
create complex 3D surface model. The understanding and skill for CAM software is
post-processing, understand data exchange, and generate 2D tool paths. The
understanding and skill for CAE software on CFD is steady-state and transient, laminar
and turbulent, incompressible and compressible, forced, natural and mixed convection,
and non-Newtonian fluids. For the analysis of (K/B A), it is rigid and flexible bodies,
and apply assembly analysis. The assessment of CAE on BEA/Acoustics is subjective
noise prediction. The assessment of CAE on FEA is understand the major practical
considerations in using integrated FE analysis techniques and how these relate to
analytical methods, while linear and nonlinear structural analysis uses modal analysis
with differential stiffness. The Durability/fatigue analysis is the finding of the strength
and fatigue safety for cyclic loading (infinite life model), utilizing linear or nonlinear

85
stress/strain results from FE models, and applying mechanical analysis software of
exported data. Finally, the thermal analysis uses steady-state and transient analysis.
6.1.4 Implementation Period
From the analysis, most respondents use Big bang as the process implement The
experience of using CAD/CAM/CAE technology is the high cost (Software, hardware,
implement, consult, manage and training),and the level of significant factor in
implementing CAD/CAM/CAE is in the high level with mean of 3.42 (Likert Scale).
6.1.5 After Implementation Period
From the analysis, the response on the benefit that the workers or organization can earn
after implementing CAD/CAM/CAE technology is the more accuracy of work. The
benefit that business can earn after implementing CAD/CAM/CAE technology is the
reduction of processing cost of business, and there must be improvement current
technology to be more efficient. In the future, the company will need not more than 5
years of time to develop on product, equipment, and production process, reaching the
international standard. The level of the change after implementing CAD/CAM/CAE
technology is high with mean of 3.50 (Likert Scale).
6.1.6 The Problem of Implementation CAD/CAM/CAE in Company
From the analysis of the Problem of implementation CAD/CAM/CAE in company, on
overall, it is in the medium level with mean of 2.89 (Likert Scale).
6.1.7 Hypothesis Testing: One-Way ANOVA)
● Hypothesis 1
Hypothesis 1 found that CAD software using in the company has sig. 0.001, less than
0.05, so rejecting Ho and accepting H1. This means the differences of CAD software in
companies have different factors affecting level of importance of have/buy/use of
CAD/CAM/CAE technology.
● Hypothesis 2
Hypothesis 2 found that CAM software using in the company has sig. 0.000, less than
0.05, so rejecting Ho and accepting H1. This means the differences of CAM software in
companies have different factors affecting level of importance of have/buy/use of
CAD/CAM/CAE technology.
● Hypothesis 3
Hypothesis 3 found that CAE software using in the company has sig. 0.919, more than
0.05, so accepting Ho and rejecting H1. This means the differences of CAE software in
companies have no different factors affecting level of importance of have/buy/use of
CAD/CAM/CAE technology.

86
● Hypothesis 4
Hypothesis 4 found that skills and understanding in CAD software using in the
company has sig. 0.000, less than 0.05, so rejecting Ho and accepting H1. This means
that users that have understanding and skill in CAD software of different companies
have different influential factors affecting the implementation of CAD/CAM/CAE.
● Hypothesis 5
Hypothesis 5 found that skills and understanding in CAM software using in the
company has sig. 0.007, less than 0.05, so rejecting Ho and accepting H1. This means
that users that have understanding and skill in CAM software of different companies
have different influential factors affecting the implementation of CAD/CAM/CAE.
● Hypothesis 6
Hypothesis 6 found that skills and understanding in CAE software using in the company
has sig. 0.122, more than 0.05, so accepting Ho and rejecting H1. This means that users
that have understanding and skill in CAE software of different companies have no
different influential factors affecting the implementation of CAD/CAM/CAE.
● Hypothesis 7
Hypothesis 7 found that on the product CAD/CAM/CAE software, the value of sig. is
0.000, which is less than 0.05, so rejecting Ho and accepting H1. This means that
different users of CAD/CAM/CAE software product have different factors affecting the
problem in implementation of CAD/CAM/CAE.
● Hypothesis 8
Hypothesis 8 found that on the production process and equipment of CAD/CAM/CAE
software, the value of sig. is 0.000, which is less than 0.05, so rejecting Ho and
accepting H1. This means that the different users of CAD/CAM/CAE software product
on production process and equipment have different factors affecting the problem in
implementation of CAD/CAM/CAE.
6.2 Recommendations
Officers lack the essential knowledge of technology, lack of experience and skill of
technology, and get familiar with old version of technology, so that they were not able
to learn new technology. From the point of view of the researcher, the executive should
set the training session about the fundamental knowledge and skill of CAD/CAM/CAE
software at least 2 or 3 times per week, so that the officers will be more familiar to the
newer version of this technology. There are overload hiring of officers with the less
extension of market, less understanding of product from customer, and no real expert on
CAD/CAM/CAE software. From those problems, the researcher suggests the executive
some methods which are laying off some amount of employee that are not keen to adapt
the change first. Next the market should be expanded, and a clear and precise
explanation of product for customer is very necessary. Finally, there should be skill
training for the CAD/CAM/CAE software.

87
Bibliography/References
Abbasi, M. S., Tarhini, A., Elyas, T., & Shah, F. (2015). Impact of individualism and
collectivism over the individual’s technology acceptance behaviour: A multi-group
analysis between Pakistan and Turkey. Journal of Enterprise Information
Management, 28(6), 747-768.
Ajzen, I. (1985). From intentions to actions: A theory of planned behavior. In Action
control (pp. 11-39). Springer Berlin Heidelberg.
Ajzen, I., & Madden, T. J. (1986). Prediction of goal-directed behavior: Attitudes,
intentions, and perceived behavioral control. Journal of experimental social
psychology, 22(5), 453-474.
Ajzen, I. (1991). The theory of planned behavior. Organizational behavior and human
decision processes, 50(2), 179-211.
Ajzen, I. (2002). Residual effects of past on later behavior: Habituation and reasoned
action perspectives. Personality and social psychology review, 6(2), 107-122.
Ajzen, I. & Fishbein, M. (2005). The influence of attitudes on behavior. In Albarracin,
D.; Johnson, B.T.; Zanna M.P. (Eds.), The handbook of attitudes, Lawrence Erlbaum
Associates.
Arestis, P., & Sawyer, M. C. (Eds.). (1994). The Elgar companion to radical political
economy. Edward Elgar Publishing.
Albarracin, D., Johnson, B. T., Fishbein, M., & Muellerleile, P. A. (2001). Theories of
reasoned action and planned behavior as models of common use: a meta-analysis.
Psychological bulletin, 127(1), 142.
Ashleigh, M. J., & Nandhakumar, J. (2007). Trust and technologies: Implications for
organizational work practices. Decision support systems,43(2), 607-617.
Bagozzi, R. P., Davis, F. D., & Warshaw, P. R. (1992). Development and test of a
theory of technological learning and usage. Human relations, 45(7), 659-686.
Bandura, A. (1997). Self-efficacy: The exercise of control.
Boonparsawai, S. (2006). CAD/CAM/CAE/CNC in Manufacturing Industry. IPST
Magazine, 34(141), 67-70.
Borgmann, A. (2006). Technology as a cultural force: For Alena and Griffin. The
Canadian Journal of Sociology, 31(3), 351-360.
Bowonder, B., & Sharif, M. N. (1988). Basis for techno-economic policy
analysis. Science and Public Policy, 15(4), 217-219.
Brousseau, E., Barton, R., Dimov, S., & Bigot, S. (2010, February). A methodology for
evaluating the technological maturity of micro and nano fabrication processes.

88
In International Precision Assembly Seminar (pp. 329-336). Springer Berlin
Heidelberg.
Cavell, S. (2015). Must we mean what we say?: A book of essays. Cambridge University
Press.
Chaveesuk, S. & Wongjatupat, S. (2012). Theory of Acceptance in Use of Information
Technology. Retrieved February 24, 2017, from Faculty of Information Technology,
King Mongkut’s Institute of Technology Ladkrabang website:
http://www.it.kmitl.ac.th/~journal/index.php/main_journal/article/view/2
Christensen, C. M. (1992). Exploring the limits of the technology S‐curve. Part I:
component technologies. Production and Operations Management, 1(4), 334-357.
Chugh R. (2015). Do Australian Universities Encourage Tacit Knowledge Transfer?. In
Proceedings of the 7th International Joint Conference on Knowledge Discovery,
Knowledge Engineering and Knowledge Management, ISBN 978-989-758-158-8, pages
128-135. DOI: 10.5220/0005585901280135
Chu, A. Z. C., & Chu, R. J. C. (2011). The internet's role in newcomer socialization in
the hotel industry in Taiwan–technology acceptance model analysis. The International
Journal of Human Resource Management, 22(05), 1163-1179.
Colman, A. M. (2015). A dictionary of psychology. Oxford University Press, USA.
Creighton, J. W., Jolly, J. A., & Buckles, M. T. (1985). The manager's role in
technology transfer. The Journal of Technology Transfer, 10(1), 65-81.
Dalkir, K., & Liebowitz, J. (2011). Knowledge management in theory and practice.
MIT press.
Davis Jr, F. D. (1986). A technology acceptance model for empirically testing new end-
user information systems: Theory and results (Doctoral dissertation, Massachusetts
Institute of Technology).
Davis, F. D. (1989). Perceived usefulness, perceived ease of use, and user acceptance of
information technology. MIS quarterly, 319-340.
Davis, F. D., Bagozzi, R. P., & Warshaw, P. R. (1989). User acceptance of computer
technology: a comparison of two theoretical models. Management science, 35(8), 982-
1003.
Deardorff, A. V. (2014). Terms of trade: glossary of international economics. World
Scientific.
Dekel, G. (2009). Inspiration: a functional approach to creative practice (Doctoral
dissertation, University of Portsmouth).

89
Doswell, W. M., Baxter, B. J., Cha, E., & Kim, K. H. (2011). Testing the theory of
reasoned action in explaining sexual behavior among African American young teen
girls. Journal of pediatric nursing, 26(6), e45-e54.
Engel, D. W., Dalton, A. C., Anderson, K., Sivaramakrishnan, C., & Lansing, C.
(2012). Development of technology readiness level (TRL) metrics and risk
Measures. Pacific Northwest National Laboratory.
Fast-Berglund, Å., Bligård, L. O., Åkerman, M., & Karlsson, M. (2014). Using the
TRL-methodology to design supporting ICT-tools for production operators.Procedia
CIRP, 17, 726-731.
Fishbein, M., & Ajzen, I. (1975). Theories of Attitude. Beliefs, Attitudes, Intention, and
Behavior: An Introduction to Theory and Research, 335-383.
Fishbein, M., & Ajzen, I. (2011). Predicting and changing behavior: The reasoned
action approach. Taylor & Francis.
Foster, G. M. (1973). Traditional societies and technological change. HarperCollins
Publishers.
Frixione, M., & Lieto, A. (2014). Formal Ontologies and Semantic Technologies: A
“Dual Process” Proposal for Concept Representation. Philosophia Scientiae, 18(3), 139-
152.
Gibson, D. V., & Rogers, E. M. (1994). R & D collaboration on trial: the
Microelectronics and Computer Technology Corporation. Harvard Business Press.
Gibson, D. V., & Smilor, R. W. (1991). Key variables in technology transfer: A field-
study based empirical analysis. Journal of Engineering and Technology
management, 8(3), 287-312.
Goffin, K., & Koners, U. (2011). Tacit knowledge, lessons learnt, and new product
development. Journal of Product Innovation Management, 28(2), 300-318.
Gulley, N. (2013). Plato's Theory of Knowledge (Routledge Revivals). Routledge.
Heslop, L. A., McGregor, E., & Griffith, M. (2001). Development of a technology
readiness assessment measure: The cloverleaf model of technology transfer. The
Journal of Technology Transfer, 26(4), 369-384.
House, R. (2015). Inc..“inclusion.” nd Dictionary. com Unabridged.
Hughes, T. P. (2004). Human-built world: How to think about technology and culture.
University of Chicago Press.
Inman, B. R. (1984). The microelectronics and computer technology
corporation. Robert Lawrence Kuhn (1984), Commercializing Defense-Related
Technology, New York, Praeger, 149-152.

90
Inman, B. R. (1987). Balancing Competing Interests in Technology Transfer.Colum. J.
Transnat'l L., 26, 3.
Islam, N., & Brousseau, E. (2014). Implementing a multi-staged methodology to micro
and nanotechnology: Technology maturity assessment and framework.International
Journal of Productivity and Performance Management, 63(2), 170-193.
Jamroenkanokkul, P. (2014). The Acceptance and Use of Technology Tablet for
Educational: The Context of Basic Education in Thailand. Pathumthani: College of
Innovation, Thammasat University.
Keitipattanakul, T. (2009). A Study of the Applications of CAD/CAM/CAE in the
Manufacturing of Automotive Parts. Pathumthani: College of Innovation, Thammasat
University.
Koskinen, K. U. (2013). Knowledge and Knowledge Management. In Knowledge
Production in Organizations (pp. 79-96). Springer International Publishing.
Laeieddeenun, K. (2016). Technology Acceptance and Online Consumer Behavior
Affecting E-Books’ Purchase Decisions of Customers in Bangkok. Bangkok: BU
Research.
Legris, P., Ingham, J., & Collerette, P. (2003). Why do people use information
technology? A critical review of the technology acceptance model. Information &
management, 40(3), 191-204.
Leonard-Barton, D. (1988). Implementation as mutual adaptation of technology and
organization. Research policy, 17(5), 251-267.
Levinson, N. S., & Moran, D. D. (1987). R&D management and organizational
coupling. IEEE Transactions on Engineering Management, (1), 28-35.
Mankins, J. C. (2004). Technology readiness levels: a white paper, NASA, Office of
space access and technology, advanced concepts office. NASA, Washington, DC.
Mankins, J. C. (2009). Technology readiness assessments: A retrospective.Acta
Astronautica, 65(9), 1216-1223.
Mathews, S. (2009). Valuing risky projects with real options. Research-Technology
Management, 52(5), 32-41.
Miksirakul, V. (2003). International Technology Transfer Analyzed at the Technology
Component Level: A Case Study of Thailand’s Automotive Parts Industry.
Pathumthani: Asian Institute of Technology.
Neumann, H. J. (1990). Coordinate Metrology: Technology and Application. Verlag
moderne Industrie.
Neumann, H. J. (2000). Industrial Coordinate Metrology: Ten Years of Innovations.
Verlag Moderne Industrie.

91
Nolte, W., Kennedy, B. C., & Dziegiel, R. J. (2004). Technology readiness
calculator. White Paper.
Parasuraman, A. (2000). Technology Readiness Index (TRI) a multiple-item scale to
measure readiness to embrace new technologies. Journal of service research, 2(4), 307-
320.
Park, S. Y. (2009). An analysis of the technology acceptance model in understanding
university students' behavioral intention to use e-learning. Educational technology &
society, 12(3), 150-162.
Pengcham, P. (2014). The Study of Implementation of CAD/CAM Technology to Gems
and Jewelry Industry: Case Study of Maneekan Siam Company. Bangkok: Bangkok
Thonburi University.
Peters, T. J., Waterman, R. H., & Jones, I. (1982). In search of excellence: Lessons from
America's best-run companies.
Renishaw Plc. (2017). CMM probes, software and retrofits. Retrieved April 9, 2017,
from Renishaw Apply Innovation website: http://www.renishaw.com/en/cmm-probes-
software-and-retrofits--6329
Renishaw Plc. (2017). Machine tool probes and software. Retrieved April 9, 2017, from
Renishaw Apply Innovation website: http://www.renishaw.com/en/machine-tool-
probes-and-software--6073
Rogers, E. M. (1986). Communication technology (Vol. 1). Simon and Schuster.
Sahal, D. (1981). Patterns of technological innovation. Addison-Wesley.
Schmidt, F. L., & Hunter, J. E. (1993). Tacit knowledge, practical intelligence, general
mental ability, and job knowledge. Current Directions in Psychological Science, 2(1),
8-9.
Stevenson, A. (Ed.). (2010). Oxford dictionary of English. Oxford University Press,
USA.
Sharif, M. (1986) ‘High Technology Management’ Human Systems Management
Volume 6 Issue 2:109. USA
Smilor, R. W., Kozmetsky, G., & Gibson, D. V. (1988). Technology and economic
development in the modern technopolis. Technology in Society,10(4), 433-445.
Smilor, R. W., Gibson, D. V., & Dietrich, G. B. (1990). University spin-out companies:
technology start-ups from UT-Austin. Journal of business venturing, 5(1), 63-76
Smith, J. D. (2005, January). An alternative to technology readiness levels for non-
developmental item (NDI) software. In Proceedings of the 38th Annual Hawaii
International Conference on System Sciences (pp. 315a-315a). IEEE.
Sood, A. (2010). Technology S‐Curve. Wiley International Encyclopedia of Marketing.

92
Stromquist, N. P. (2002). Education in a globalized world: The connectivity of
economic power, technology, and knowledge. Rowman & Littlefield Publishers.
Strutton, H. D., Lumpkin, J. R., & Vitell, S. J. (2011). An applied investigation of
Rogers and Shoemakers perceived innovation attribute typology when marketing to
elderly consumers. Journal of Applied Business Research (JABR), 10(1), 118-131.
Sung, T. K., & Gibson, D. V. (2015, September). Knowledge and technology transfer:
levels and key factors. International Conference on Technology Policy and Innovation
(ICTPI).
Technology Atlas Team, (1987). Components of Technology for Resources
Transformation. Technological Forecasting and Social Changes, Vol. 32, pp.19-35
Thuy, M. (2015). Technology Readiness Level. Retrieved September 11, 2016, from
NASA official
https://www.nasa.gov/directorates/heo/scan/engineering/technology/txt_accordion1.htm
l
Venkatesh, V. (2000). Determinants of perceived ease of use: Integrating control,
intrinsic motivation, and emotion into the technology acceptance model. Information
systems research, 11(4), 342-365.
Vichayayothin, P. (2013). Need Assessment of Competence Development of Production
Personnel in Mold and Die Industries, THAILAND. RMUTT Global Business and
Economics Review, 8(1), 73-86.
Walczuch, R., Lemmink, J., & Streukens, S. (2007). The effect of service employees’
technology readiness on technology acceptance. Information & Management, 44(2),
206-215.

93
APPENDICES

94
Appendix A: English Questionnaires

Dear Sir/Madam,
I am a student of Asian Institute of Technology. I am currently conducting a survey
for my thesis on the topic “Knowledge and Technology Transfer: Levels and Key
Factors in implementation of CAD/CAM/CAE systems in manufacturing in Thai
Society". I thank you for spending your valuable time on this questionnaire
This questionnaire is prepared to collect the information about CAD/CAM/CAE This part is for experts to check
systems in design and manufacturing industry to study how to implement highly the completeness (CP) and
efficient CAD/CAM/CAE systems to use in Thailand. Your response will be consistency (CS) of question (Q)
completely anonymous. The findings of the survey are only for academic research. (Score 1, 0, -1)
● 1 = Sure (Q is CP and CS)
(You can skip some question that you do not satisfy to answer.) ● 0 = Not sure (Q is CP and CS)
● -1 = Sure (Q is not CP and not CS)
1. General Information 1 0 -1
1. Your name_________________________________________________
2. Position in your company_____________________________________
(can answer more than 1)
[] Concerned with CAD
[] Concerned with CAM
[] Concerned with CAE
3. Name of company___________________________________________
4. Type of business____________________________________________
5. Vision of company___________________________________________
6. Policy of company___________________________________________
7. Size of company
[] Small (Workers not more than 50 people)
[] Middle (Workers between 51 and 200 people)
[] Large (Workers more than 201 people)
8. Type of product that your company make
(can answer more than 1)
[] Metal
[] Plastic
[] Rubber
[] Other_____________________________________________
9. Characteristic of process in business
(can answer more than 1)
[] Produce for another company
[] Produce and sell it to the market
[] The owner of product, design by own but outsources
to produce
[] Design and manufacture
10. Average sales in a year_________________________
11. Quality system that your company got (Ex. ISO 9001)
____________________________________________________________
12. Process for design and manufacture
CAD [] Have [] Not have
CAM [] Have [] Not have
CAE [] Have [] Not have

2. State of using CAD/CAM/CAE in company 1 0 -1
13. Which CAD software is currently used in your company
(can answer more than 1)
[] AutoCAD [] CADKEY [] Solid Edge
[] SolidWorks [] NX Unigraphics [] Catia
[] Pro/Engineer [] Cimatron [] Rhino
[] CoCreate [] IronCAD [] Alibre
[] KeyCreator [] TurboCAD [] SketchUp
[] Mechanical Desktop [] Creo Elements/Pro [] Inventor
[] Not have to use now [] Other______________________
14. Which CAM software is currently used in your company
(can answer more than 1)
[] MasterCAM [] Creo Elements/Pro [] SolidCAM
[] SurfCAM [] EdgeCAM [] Delcam
[] Esprit [] GibbsCAM
[] A CAM package associated with your CAD package
[] Not have to use now [] Other______________________
15. Which CAE software is currently used in your company
(can answer more than 1)
[] Cosmos [] MSC/Nastran [] ANSYS
[] Mold Flow [] Abaqus
[] Not have to use now [] Other______________________
16. How did you know the software
[] From software retail/service company
[] From another company in the same type of industry
[] From technical journal or magazine
[] From internet
[] From mother company
[] From person (head/customer/friend)
[] From seminar/exhibition
[] Other________________________________________
17. Reason of using CAD/CAM/CAE in the company
[] Vision of manager or policy of company
[] Would like to upgrade the company
[] The need in business to improve competition
[] Other________________________________________
18. Influential factor to choose the brand of CAD/CAM/CAE
software
[] Capable function match the company is requirements
[] Famous and used in more sectors in market
[] Field reference in Thailand is good
[] Have branch or good customer support in Thailand
[] Price
19. Source of software CAD/CAM/CAE
(can answer more than 1)
[] Software company [] Government support
[] IT Center [] Other_____________
20. The number of worker who can use CAD technology
[] None [] 1-5 people
[] 6-15 people [] More than 15 people

1 0 -1
21. How many CAD station______________________________________
22. In each CAD station use 2D or 3D CAD__________________________
___________________________________________________________
23. The number of worker who can use CAM technology
[] None [] 1-5 people
[] 6-15 people [] More than 15 people
24. How many CAM station____________________________________
25. The number of worker who can use CAE technology
[] None [] 1-5 people
[] 6-15 people [] More than 15 people
26. How many CAE station______________________________________
27. The important characteristic of CAD/CAM/CAE software
that company need
(can answer more than 1)
[] Evaluate the result quickly
[] User friendliness
[] Support more format and functionality
[] Can compute more information
[] The manual explain in detail (Thai)
[] The manual explain in detail (English)
[] Other________________________________________
28. The format of use CAD/CAM/CAE technology
[] Compatible with partners
[] Not compatible with partners
29. Trend of your company to invest in new CAD/CAM/CAE
technology
[] No plan now [] Not sure
[] Have plan to invest [] Have plan to upgrade
30. Type of buying CAD technology
[] Buy permanent license [] Buy license yearly
[] Buy license for 3-5 years [] Other______________
31. How many CAD license that your company has___________________
_____________________________________________________________
32. Type of buying CAM technology
[] Buy permanent license [] Buy license yearly
[] Buy license for 3-5 years [] Other_____________
33. How many CAM license that your company has__________________
______________________________________________________________
34. Type of buying CAE technology
[] Buy permanent license [] Buy license yearly
[] Buy license for 3-5 years [] Other_____________
35. How many CAE license that your company has__________________
______________________________________________________________
36. Trend of your company to upgrade CAD/CAM/CAE
[] As soon as new version
[] Use as long as possible without upgrading
[] Upgrade because there is an important improvement in
software
[] Upgrade because compatibility with partners

1 0 -1
37. Is your company using CAD/CAM/CAE consultant
[] No [] Yes______________________
38. Level of importance to have/buy/use technology CAD/CAM/CAE
(1 = Very low, 2 = Low, 3 = Medium, 4 = High, 5 = Very high)
Level
1. The price of computer and software are reasonably/accepted
2. Type of product produced is complex or varied frequently
3. Financial benefits for CAD/CAM/CAE technology
4. Have more competency in the market
5. Reduce the cost in design and manufacturing
6. Reduce the number of workers
7. Fulfil the need of customer by using CAD/CAM/CAE technology
8. Improve control and increase accuracy in design and manufacturing
9. Increase productivity
10. Would like to expand market share
11. Customer can understand product better
12. Have CAD/CAM/CAE experts
3. Before Implementation Period (Preparation Period)
Preparation is a plan to be ready for using CAD/CAM/CAE
technology in the company or organization by considering
the related factors before implementation 1 0 -1
39. Prerequisites to have before implement
(can answer more than 1)
[] Knowledge and understanding about CAD/CAM/CAE
technology
[] User training for CAD/CAM/CAE technology
[] Prepare hardware
[] Expert to take care of CAD/CAM/CAE technology
40. Required time period to prepare CAD/CAM/CAE
technology
[] 1 month [] 3 months
[] 6 months [] 1 year
41. Identify the part you use to test software first.
______________________________________________________________
42. Did you integrate your quality control (dimensions, tolerance, etc.)
with your CAD/CAM/CAE technology
______________________________________________________________
43. Did you use CMM (Coordinate Measuring Machine) in your company
______________________________________________________________
Factors

44. Understanding and Skill
Can Cannot
● Create single and multiple auxiliary views of surfaces and
objects
● Insert and manipulate dimensions
● Specify geometric tolerancing on a drawing
● Generate a 2-D multiview drawing
● Generate a pictorial drawing
● Create an assembly in 2-D geometry
● Create a bill of materials (BOM)
● Scale and print hard copy on output device
● Create and manipulate solids, edit and combine solids
● Understand the mathematical concepts behind typical 3D
curves B-spline, Nurbs and Surfaces
● Create complex 3D surface models
● 3-D graphics sections views
● Create a 2-D drawing from a 3-D model
● Create a 3-D model from a 2-D drawing
● Create a 3-D model
● Produce bills of materials (BOM)
● Produce an engineering drawing from a generated 3D model
● Use reverse engineering to generate CAD
1 0 -1
Can Cannot
● Determine and manipulate geometry to be used for programming
● Verify and validate CNC program
● Identify cutting tools and cutting condition
● Post-processing
● Understand data exchange
● Generate CNC code from exported data
● Generate 2D tool paths
● Generate 3D tool paths
● Generate 5-axis tool paths
● Prototyping and model manufacture
● Use reverse engineering to generate CAM
1 0 -1
CAD Assessment
2D CAD
3D CAD
CAM Assessment
Skill
Skill
CAM

Can Cannot
● Steady-state and transient
● Laminar and turbulent
● Incompressible and compressible
● Forced, natural and mixed convection
● Condensation
● Non-Newtonian fluids
● Two-phase flow
● Apply flow analysis of the exported data
1 0 -1
Can Cannot
● Kinematics
● Multi-body dynamics
● Rigid and flexible bodies
● Apply assembly analysis software of exported data
1 0 -1
Can Cannot
● Sound pressure analysis
● Sound intensity analysis
● Sound power predictions
● Radiation efficiency analysis
● Subjective noise prediction (audio listening files)
● Sound quality optimization (Noise field prediction and analysis)
1 0 -1
Motion analysis
Flow analysis
Skill
Skill
Skill
CAE Assessment
Computational Fluid
(CFD)
Dynamics
CAE Assessment
(BEA/Acoustics)
Analysis
Boundary Element
CAE Assessment
Kinematic/Dynamic
(K/B A)
Analysis

Can Cannot
● Create 3D model with a variety of geometry types
● Create objects suitable for finite element modelling and
carry out a thermal/stress/modal analysis
● Understand the major practical considerations in using
integrated FE analysis techniques and how these relate to
analytical methods
● Static and dynamic stress
● Normal modes
● Buckling
● Stress stiffening and spin softening
● Modal analysis with differential stiffness
● Dynamic response analysis
● Nonlinear material models
● Large displacement, large strain
● Material hardening and creep
● Glue connections
● Node-to-node contact including friction
● 3D surface-to-surface contact
● Laminate composites analysis
● Apply stress analysis software of exported data
● Strength and fatigue safety for cyclic loading
(infinite life model)
● Advanced life and fatigue damage prediction
(finite life model)
● Both uniaxial and biaxial stress cycles
● Utilize linear or nonlinear stress/strain results from FE models
● Apply mechanical analysis software of exported data
● Steady-state and transient
● Conduction, convection and radiation
● Advanced radiation and environmental heating
● Apply heat analysis of the exported data
1 0 -1
CAE Assessment
Finite Element Analysis
(FEA)
Linear and nonlinear structural analysis
Skill
Durability/fatigue analysis
Thermal analysis

4. Implementation Period 1 0 -1
45. Process for implement
[] Big bang (All modules all sites same time)
[] Mini bang (One modules all sites same time)
[] Phased by site (All modules one site at a time-like pilot)
[] Phased by module (One module one site at a time)
46. Influential factors in CAD/CAM/CAE implementation
(1 = Very low, 2 = Low, 3 = Medium, 4 = High, 5 = Very high)
Level
1. Consultant/User
2. The readiness of management team in attitude and knowledge
3. The readiness of organization in term of time, capital and personnel
4. Technical problem
47. Experience of using CAD/CAM/CAE technology
(can answer more than 1)
[] High cost (software, hardware, implement, consult, manage
and training)
[] Quality is not as good as expected
[] More problems occur such as bug
[] More time to solve the problem because it more depends on
software
[] Hard to use such as command is not standard
[] Document is not update and hard to understand
[] The process hard and take time to understand
[] Cannot use it to fulfill requirement
[] Not support with other software
[] Other________________________________________
48. The problem that occur when install the software
______________________________________________________________
______________________________________________________________
49. The period of time in implement process
______________________________________________________________
5. After Implementation Period 1 0 -1
50. The benefit that the workers or organization got after
implement CAD/CAM/CAE technology
(can answer more than 1)
[] Understanding of workers [] Improve quality of work
[] More accuracy of work [] More convenient
[] Reduce cost in case of work fail [] Reduce processing time
51. The benefit that business got after implement
CAD/CAM/CAE technology
(can answer more than 1)
[] Customer more satisfy on product
[] Increase the number of customer
[] Reduce processing cost of business
[] Increase turnover of business
[] Can competition with another company
[] Other________________________________________
Factors

1 0 -1
52. The change after implement CAD/CAM/CAE technology
(1 = Very low, 2 = Low, 3 = Medium, 4 = High, 5 = Very high)
The change after implement CAD/CAM/CAE Level
1. The variety of product
2. The number of customer
3. The quantity of work from customer
4. The error from manufacturing
5. The time for manufacturing
6. The quality of design
7. The quality of product
8. The capital for design
9. The capital for product
10. The revenue of company
11. The profit of company
53. The way to develop CAD/CAM/CAE technology in the future
[] Develop or adjust existing technology to be high efficiency
[] Bring up-to-date technology to use in company or organization
[] Other_____________________________________________
54. How many years would be needed for your company to reach the
international levels in terms of technology capability, based on your
present technology capability?
Products
[] No gap [] less than 5 years
[] 5-10 years [] more than 10 years
Production Process/Equipment
[] No gap [] less than 5 years
[] 5-10 years [] more than 10 years
6. The problem of implementation CAD/CAM/CAE in company 1 0 -1
55. The problem of implementation CAD/CAM/CAE in company
(1 = Very low, 2 = Low, 3 = Medium, 4 = High, 5 = Very high)
The problem of implement CAD/CAM/CAE in company Level
1. Workers lack of knowledge in technology
2. Workers lack of experience and skill in technology
3. Workers do not understand the English manu
4. Workers familiar with old technology cannot adjust to the
new technology
5. Workers miss some course of training
6. Workers often change the job position
7. Management team not realize the important of implement
technology
8. Management team does not support worker training
9. Training course not appropriate in the real situation
10. Transfer of knowledge and technology from top to
bottom not smooth
11. High capital not be worthwhile for invest
12. Lack of capital for buy equipment
----- Thank you for spending your valuable time on this questionnaire -----

Appendix B: Thai Questionnaires

สวสดผท ำแบบสอบถำมทกทำน
ดฉนเปนนกศกษำจำกสถำบนเทคโนโลยแหงเอเชย ซงขณะนดฉนก ำลงเกบขอมลส ำหรบ
วทยำนพนธในหวขอ “กำรถำยทอดควำมรและเทคโนโลย: ระดบควำมละเอยด และ
ปจจยส ำคญในกำรประยกตใชระบบ CAD/CAM/CAE ใน อตสำหกรรมกำรผลต
ในบรบทสงคมไทย” ขอบคณทกทานส าหรบการใหเวลาในการตอบแบบส ารวจน
แบบส ำรวจนจะเกบขอมลเกยวกบระบบ CAD/CAM/CAE ในกำรออกแบบ และ สวนนส าหรบผเชยวชาญ เพอตรวจสอบ
อตสำหกรรมกำรผลตเพอศกษำหำวธประยกตใชระบบ CAD/CAM/CAE ใหเกด ความครบถวน, ความสอดคลอง และ
ประสทธภำพสงเพอน ำไปใชในประเทศไทย จะไมมกำรเปดเผยชอและขอมลของ เหมาะสมของเนอหาค าถาม
ผตอบแบบสอบถาม ผลของแบบส ารวจครงน มไวส าหรบการวจยทางวชาการเทานน(คะแนน 1, 0, -1)
● 1 = แนใจวา (ครบถวนและเหมาะสม)
(ทำนสำมำรถขำมค ำถำมทไมมควำมประสงคทจะตอบได) ● 0 = ไมแนใจวา (ครบถวนและเหมาะสม)
● -1 = แนใจวา (ไมครบถวนและไมเหมาะสม)
1. ขอมลท วไป 1 0 -1
1. ชอ___________________________________________________
2. ต าแหนงในบรษท________________________________________
(สามารถตอบไดมากกวา 1 ขอ)
[] เกยวของกบ CAD
[] เกยวของกบ CAM
[] เกยวของกบ CAE
3. ชอบรษท_______________________________________________
4. ประเภทธรกจ____________________________________________
5. วสยทศนของบรษท_______________________________________
6. นโยบายของบรษท________________________________________
7. ขนาดบรษท
[] เลก (พนกงานนอยกวา 50 คน)
[] กลาง (พนกงาน 51 ถง 200 คน)
[] ใหญ (พนกงานมากกวา 201 คน)
8. ประเภทของผลตภณฑทบรษทผลต
(สามารถตอบไดมากกวา 1 ขอ)
[] เหลก
[] พลำสตก
[] ยำง
[] อนๆ_________________________________________
9. ลกษณะกระบวนการของธรกจ
(สามารถตอบไดมากกวา 1 ขอ)
[] ผลตใหกบบรษทอน
[] ผลตและขายสงสทองตลาด
[] เปนเจาของผลตภณฑ ออกแบบเองแตจางบรษทอนในการผลต
[] ออกแบบและผลต
10. ยอดขายประจ าป_________________________________________
11. มาตรฐานระบบบรหารงานคณภาพทบรษทไดรบ (Ex. ISO 9001)
____________________________________________________________
12. กระบวนการการออกแบบและผลต
CAD [] ม [] ไมม
CAM [] ม [] ไมม
CAE [] ม [] ไมม

2. สถานภาพการใชงาน CAD/CAM/CAE ในบรษท 1 0 -1
13. ซอฟตแวร CAD ทใชอยในบรษทขณะน
(สามารถตอบไดมากกวา 1 ขอ)
[] AutoCAD [] CADKEY [] Solid Edge
[] SolidWorks [] NX Unigraphics [] Catia
[] Pro/Engineer [] Cimatron [] Rhino
[] CoCreate [] IronCAD [] Alibre
[] KeyCreator [] TurboCAD [] SketchUp
[] Mechanical Desktop [] Creo Elements/Pro [] Inventor
[] Not have to use now [] Other______________________
14. ซอฟตแวร CAM ทใชอยในบรษทขณะน
(สามารถตอบไดมากกวา 1 ขอ)
[] MasterCAM [] Creo Elements/Pro [] SolidCAM
[] SurfCAM [] EdgeCAM [] Delcam
[] Esprit [] GibbsCAM
[] A CAM package associated with your CAD package
[] Not have to use now [] Other______________________
15. ซอฟตแวร CAE ทใชอยในบรษทขณะน
(สามารถตอบไดมากกวา 1 ขอ)
[] Cosmos [] MSC/Nastran [] ANSYS
[] Mold Flow [] Abaqus
[] Not have to use now [] Other______________________
16. รจกซอฟตแวรจากทไหน
[] จากรานขายซอฟตแวร/บรษทผใหบรการ
[] จากบรษทอนทอยในธรกจประเภทเดยวกน
[] จากหนงสอนตยสารทเกยวของ
[] จากอนเทอรเนต
[] จากบรษทแม
[] จากบคคลอนๆ (หวหนา/ลกคา/เพอน)
[] จากการประชม/งานแสดงสนคาและซอฟตแวร
[] อนๆ_________________________________________
17. เหตผลทใช CAD/CAM/CAE ในบรษท
[] วสยทศนของผบรหารหรอนโยบายของบรษท
[] เพอพฒนาบรษท
[] เพอการแขงขนในธรกจ
[] อนๆ_________________________________________
18. ปจจยหลกในการเลอกแบรนดซอฟตแวรของ CAD/CAM/CAE
[] ฟงกชนการท างานทตรงกบความตองการของบรษท
[] ชอเสยงและความนยมทใชในทองตลาด
[] ไดรบการอางองและแนะน าจากในประเทศวาด
[] มสาขาอยในประเทศหรอมฝายสนบสนนลกคาทดในประเทศ
[] ราคา
19. แหลงการน าเขาซอฟตแวร CAD/CAM/CAE
(สามารถตอบไดมากกวา 1 ขอ)
[] บรษทซอฟตแวร [] กำรสนบสนนจำกรฐบำล
[] ศนยกำรคำเทคโนโลย (IT Center) [] อนๆ_____________
20. จ านวนพนกงานทสามารถใชเทคโนโลย CAD
[] ไมม [] 1-5 คน
[] 6-15 คน [] มำกกวำ 15 คน

1 0 -1
21. มสถาน CAD กสถาน_____________________________________
22. ในแตละสถาน CAD ใชงาน CAD แบบใด 2D หรอ 3D ____________
___________________________________________________________
23. จ านวนพนกงานทสามารถใชเทคโนโลย CAM
[] ไมม [] 1-5 คน
[] 6-15 คน [] มำกกวำ 15 คน
24. มสถาน CAM กสถาน_____________________________________
25. จ านวนพนกงานทสามารถใชเทคโนโลย CAE
[] None [] 1-5 people
[] 6-15 people [] More than 15 people
26. มสถาน CAE กสถาน_____________________________________
27. คณลกษณะส าคญของซอฟตแวร CAD/CAM/CAE ทบรษทตองการ
(สามารถตอบไดมากกวา 1 ขอ)
[] ประมวลผลไดอยางรวดเรว
[] งายตอการใช
[] สนบสนนกำรท ำงำนในหลำยรปแบบ
[] สามารถประมวลขอมลไดมาก
[] มคมอการใชงานอธบายอยางละเอยด (ภาษาไทย)
[] มคมอการใชงานอธบายอยางละเอยด (ภาษาองกฤษ)
[] อนๆ_________________________________________
28. รปแบบการใชเทคโนโลย CAD/CAM/CAE
[] สำมำรถใชไดกบบรษทหนสวน
[] ไมสำมำรถใชไดกบบรษทหนสวน
29. แนวโนมของบรษททจะลงทนในเทคโนโลย CAD/CAM/CAE รนใหม
[] ไมม [] ไมแนชด
[] มแผนทจะลงทน [] มแผนทจะพฒนำ
30. รปแบบการซอเทคโนโลย CAD
[] ซอใบอนญาตแบบถาวร [] ซอใบอนญาตแบบรายป
[] ซอใบอนญาตแบบราย 3-5ป [] อนๆ_____________
31. บรษทมใบอนญาตการใช CAD กใบ______________________________
______________________________________________________________
32. รปแบบการซอเทคโนโลย CAM
[] ซอใบอนญาตแบบถาวร [] ซอใบอนญาตแบบรายป
[] ซอใบอนญาตแบบราย 3-5ป [] อนๆ_____________
33. บรษทมใบอนญาตการใช CAM กใบ______________________________
______________________________________________________________
34. รปแบบการซอเทคโนโลย CAE
[] ซอใบอนญาตแบบถาวร [] ซอใบอนญาตแบบรายป
[] ซอใบอนญาตแบบราย 3-5ป [] อนๆ_____________
35. บรษทมใบอนญาตการใช CAE กใบ______________________________
______________________________________________________________
36. แนวโนมของบรษททจะอพเกรดใบอนญาต CAD/CAM/CAE
[] ทนทเมอมเวอรชนใหมออกมา
[] ใชใหนานทสดโดยไมตองอพเกรด
[] อพเกรดเพราะมการปรบปรงพฒนาทส าคญในซอฟตแวร
[] อพเกรดเพราะสามารถใชรวมกบบรษทหนสวนอนๆได

1 0 -1
37. บรษทของคณใชทปรกษา CAD/CAM/CAE หรอไม
[] ไม [] ใช (โปรดระบ)_______________
38. ระดบความส าคญในการม/การซอ/การใช เทคโนโลย CAD/CAM/CAE
(1 = นอยมาก, 2 = นอย, 3 = ปานกลาง, 4 = สง, 5 = สงมาก)
ระดบ
1. ราคาของคอมพวเตอรและซอฟตแวร สมเหตสมผล
2. ประเภทของผลตภณฑมความซบซอนหรอหลากหลาย
3. ผลประโยชนทางการเงนในการใชเทคโนโลย CAD/CAM/CAE
4. มชองทางการแขงขนมากขนในตลาด
5. ลดคาใชจายในการออกแบบและผลต
6. ลดจ านวนพนกงาน
7. ตอบสนองความตองการของลกคาโดยใช CAD/CAM/CAE
8. เพมความแมนย าและการควบคมในการออกแบบและการผลต
9. เพมความเรวในการท างาน
10. ตองการขยายตลาด
11. ลกคาสามารถเขาใจผลตภณฑมากขน
12. มผเชยวชาญดาน CAD/CAM/CAE
3. ชวงกอนน ามาประยกตใช (ชวงเตรยมการ)
แผนการเตรยมการมไวรองรบการใชเทคโนโลย CAD/CAM/CAE
ในบรษทหรอองคกรโดยทจะค ำนงถง ปจจยตำงๆกอนน ำไปใชประยกตใช 1 0 -1
39. สงทตองมกอนการน าไปประยกตใช
(สามารถตอบไดมากกวา 1 ขอ)
[] ความรและความเขาใจเกยวกบเทคโนโลย CAD/CAM/CAE
[] การฝกอบรมผใชเทคโนโลย CAD/CAM/CAE
[] การเตรยมพรอมฮารดแวร
[] มผเชยวชาญในการดแลเทคโนโลย CAD/CAM/CAE
40. ระยะเวลาทตองใชในการเตรยมเทคโนโลย CAD/CAM/CAE
[] 1 เดอน [] 3 เดอน
[] 6 เดอน [] 1 ป
41. โปรดระบองคประกอบของซอฟตแวรทถกทดสอบกอนใชงาน
______________________________________________________________
42. คณเคยใชการตรวจสอบคณภาพ (ขอบเขต,ความคงทน,อนๆ) รวมกบ
เทคโนโลย CAD/CAM/CAE
______________________________________________________________
43. คณเคยใช CMM (Coordinate Measuring Machine) ในบรษท
______________________________________________________________
ปจจย

44. Understanding and Skill
สามารถ ไมสามารถ
● สรางแบบแผนเชงเดยวและหลายเชงของวตถและพนผว
● แทรกและปรบ รปมต
● ระบสรางและก าหนดรปแบบลกษณะเรขาคณตบนแผนภาพ
● สรางภาพ 2 มตแบบ multiview
● สรางภาพแบบ หลายมมมอง (pictorial)
● สรางสวนประกอบใน 2มตในรปทรงเรขาคณต
● สรางบญชแสดงรายการวสด (BOM)
● ปรบสเกลและพมพรปแบบออกมาจากเครอง
● สราง ปรบรปแบบ รวม โมเดลตางๆ
● เขาใจหลกการคณตศาสตรในรปแบบสามมตของ พนผว และ
รปโคงตางๆ (B-spline, Nurbs)
● สรางโมเดล 3 มตแบบซบซอน
● ท าภาพตดของรป 3 มต
● สรางแบบ 2 มตจาก โมเดล 3 มต
● สรางโมเดล 3 มตจากแบบ 2 มต
● สรางโมเดล 3 มต
● สราง Bill of Materials (BOM)
● เขยนแบบวศวกรรมจาก โมเดล 3 มต
● ใชวศวกรรมยอนกลบในการสราง CAD
1 0 -1
สามารถ ไมสามารถ
● ตงคาและก าหนด รปเรขาคณตเพอใชในโปรแกรม
● ตรวจสอบและยนยน โปรแกรม CNC
● ก าหนดเครองมอตดและสภาวะการตด
● การประมวลผล (post-processing)
● เขาใจการแลกเปลยนขอมล
● สรางโคด CNC จาก Exported data
● สรางแผนทางเดนของมดตดแบบ 2 มต
● สรางแผนทางเดนของมดตดแบบ 3 มต
● สรางแผนทางเดนของมดตดแบบ 5 แกน
● สรางตนแบบ และโมเดลการผลต
● ใชวศวกรรมยอนกลบในการสราง CAM
1 0 -1
การประเมน CAD
เขยนแบบ 2 มต
เขยนแบบ 3 มต
การประเมน CAM
ทกษะ
ทกษะ
CAM

สามารถ ไมสามารถ
● จ าลองการไหลแบบสภาวะนง และชวคร
● วเคราะหการไหลแบบการไหลคงท และไหลเชยว
● วเคราะหของไหลทงทอดตวไมได และอดตวได
● การถายเทความรอนแบบบงคบ แบบธรรมชาต และแบบประสม
● วเคราะหการไหลแบบควบแนน
● วเคราะหการไหลแบบ Non-Newtonian fluids
● วเคราะหการไหลเวยนแบบ 2 phase
● การน าขอมลทไดจากการวเคราะหการไหลมาใช
1 0 -1
สามารถ ไมสามารถ
● วเคราะหการเคลอนทอนภาคของวตถ
● วเคราะหการเคลอนทของอนภาคของวตถหลายๆอนภาค
● วเคราะหการเคลอนทของวตถแขงเกรง และวตถทยดหยน
● การประยกตใชขอมลทไดจากการ assembly analysis
1 0 -1
สามารถ ไมสามารถ
● การวเคราะหแรงดนเสยง
● การวเคราะหความรนแรงของเสยง
● การคาดเดาพลงของเสยง
● การวเคราะหประสทธภาพการแผรงส
● การคาดเดาเสยงจากการฟง (การฟงไฟลเสยง)
● การปรบปรงคณภาพเสยง (การคาดเดาและวเคราะหในภาคเสยง)
1 0 -1
การวเคราะหการเคลอนท
การวเคราะหการไหล
ทกษะ
ทกษะ
ทกษะ
การประเมน CAE
พลศาสตรของไหล
(CFD)
เชงค านวณ
การประเมน CAE
(BEA/Acoustics)
Analysis
Boundary Element
การประเมน CAE
การวเคราะหจลนศาสตร
(K/B A)
/จลนวสย

สามารถ ไมสามารถ
● สรางโมเดล 3 มตดวยรปทรงเรขาคณตตางๆ
● สรางรปแบบวตถทเหมาะสมส าหรบการน ามาวเคราะหการ
ถายเทความรอน ความเคน และรปรางโหมด
● เขาใจและสามารถประยกตใช FE รวมกนในการวเคราะห
● การวเคราะหความเครยดแบบ static และ dynamic
● การวเคราะหโหมดปกต
● การวเคราะหการโกงตว
● การวเคราะหแรงเคนแบบแขงและแบบออนโดยการหมน
● การวเคราะหโครงสรางรปรางโหมด ดวยคาความแขงแรงทแปรผน
● การวเคราะหหาผลตอบสนองแบบ Dynamic
● การวเคราะหโมเดลวสดแบบ nonlinear
● การวเคราะหการเคลอนทขนาดใหญ ความเครยดสง
● การวเคราะหการท าใหวสดแขงตว และ creep
● การวเคราะหการเชอมตอดวยกาว
● การวเคราะหการตอกนของโหนดแตละตว รวมไปถงแรงเสยดทาน
● การวเคราะหการตอเนองของพนผวแบบ 3 มต
● การวเคราะหช นงานทซอนทบของวสดหลายชนด
● การประยกตใชขอมลจากการวเคราะหความเคนท Export มา
● หาคาความปลอดภยจากความคงทน/ความลา กรณรบแรงกระท าซ า
(infinite life model)
● ประเมนหาอายการใชงานของโครงสรางทเกดความลา
(finite life model)
● วเคราะหวงจรความเคนทงแบบแกนเดยวและแกนค
● การใชผลลพธของการทดสอบความเคนและความเครยด
แบบ linear หรอ nonlinear จากโมเดล FE
● การประยกตใชขอมลทไดจากซอฟตแวรการวเคราะหเครองจกร
● การวเคราะหแบบสภาวะนง และชวคร
● การวเคราะหการน าความรอน, การถายเทความรอน และ
กำรแผรงส ระหวำงกอนชนงำน
● การแผรงสขนสง และการถายเทความรอนทางธรรมชาต
● การประยกตใชขอมลทไดจากการวเคราะหความรอน
1 0 -1
การประเมน CAE
Finite Element Analysis
(FEA)
การวเคราะหโครงสรางแบบ linear และ nonlinear
ทกษะ
การวเคราะห ความคงทน/ความลา
การวเคราะหความรอน

4. ชวงน ามาประยกตใช 1 0 -1
45. กระบวนการประยกต
[] Big bang (เปลยนทกโมดล ในทกเขตในเวลาเดยวกน)
[] Mini bang (เปลยนหนงโมดล ในทกเขตในเวลาเดยวกน)
[] Phased by site (เปลยนทกโมดล ในเขตเดยวโดยก าหนดเวลา)
[] Phased by module (เปลยนทละหนงโมดล ตอหนงเขต)
46. ปจจยส าคญในการประยกตใช CAD/CAM/CAE
(1 = นอยมาก, 2 = นอย, 3 = ปานกลาง, 4 = สง, 5 = สงมาก)
ระดบ
1. ทปรกษา/ผใช
2. ความพรอมของผบรหารในเรองทศนคตและความร
3. ความพรอมขององคกรในเชงของเวลา ทรพยากร และ บคลากร
4. ปญหาทางดานเทคนค
47. ประสบการณการใชเทคโนโลย CAD/CAM/CAE
(สามารถตอบไดมากกวา 1 ขอ)
[] คาใชจายสง (ซอฟตแวร, ฮารดแวร, การประยกต, การปรกษา,
การจดการ และ การอบรม)
[] คณภาพไมดเทาทคาดหวงไว
[] มปญหาซบซอนเกดขน เชน บคในโปรแกรม
[] เวลาในการแกปญหามากขนเนองจากมการใชซอฟตแวรเปนหลก
[] ใชงานยาก เนองจากค าสงตางๆ ไมมาตรฐาน
[] เอกสารไมไดถกอพเดทท าใหยากตอการเขาใจ
[] กระบวนการซบซอนท าใหใชเวลามากในการท าความเขาใจ
[] ไมสามารถใชเพอตอบสนองความตองการได
[] ไมสามารถใชรวมกบซอฟตแวรอนๆได
[] อนๆ_________________________________________
48. ปญหาทพบเมอตดตงซอฟตแวร
______________________________________________________________
______________________________________________________________
49. ระยะเวลาในการน ากระบวนการน ามาประยกตใช
______________________________________________________________
5. ชวงหลงการประยกต 1 0 -1
50. ประโยชนทพนกงานหรอองคกรไดรบหลงจากการประยกตใชเทคโนโลย
CAD/CAM/CAE
(สามารถตอบไดมากกวา 1 ขอ)
[] เพมควำมเขำใจของพนกงำน [] เพมคณภำพงำน
[] เพมความแมนย าของงาน [] สะดวกสบำยมำกขน
[] ลดคำใชจำยเมอมขอผดพลำด [] ลดเวลาทใช
51. ประโยชนทธรกจไดรบหลงจากการประยกตใชเทคโนโลย CAD/CAM/CAE
(สามารถตอบไดมากกวา 1 ขอ)
[] ลกคำมควำมพงพอใจในผลตภณฑมำกขน
[] มลกคำมำกขน
[] ลดคำใชจำยในกระบวนกำรของธรกจ
[] เพมรำยไดของธรกจ
[] สำมำรถแขงขนกบคแขงในธรกจอนๆได
[] อนๆ_________________________________________
ปจจย

1 0 -1
52. การเปลยนแปลงหลงการประยกตใชเทคโนโลย CAD/CAM/CAE
(1 = นอยมาก, 2 = นอย, 3 = ปานกลาง, 4 = สง, 5 = สงมาก)
ระดบ
1. จ านวนความหลากหลายของผลตภณฑ
2. จ านวนลกคา
3. จ านวนงานจากลกคา
4. ความผดพลาดจากผผลต
5. เวลาส าหรบการผลต
6. คณภาพของการออกแบบ
7. คณภาพของสนคา
8. งบประมาณส าหรบการออกแบบ
9. งบประมาณส าหรบผลตภณฑ
10. รายไดของบรษท
11. ก าไรของบรษท
53. ชองทางทจะพฒนาเทคโนโลย CAD/CAM/CAE ในอนาคต
[] พฒนาหรอปรบเปลยนเทคโนโลยทมอยใหมประสทธภาพมากขน
[] น าเทคโนโลยททนสมยมาใชบรษทหรอในองคกร
[] อนๆ_________________________________________
54. บรษทของคณตองการเวลากปทความสามารถการใชงานทางเทคโนโลย
จะกาวเขาถงระดบสากล อางองจากความสามารถเทคโนโลยทมอยปจจบน
ดำนผลตภณฑ
[] ไมมชองวำง [] นอยกวำ 5 ป
[] 5 - 10 ป [] มากกวา 10 ป
ดานกระบวนการผลตและเครองมอ
[] ไมมชองวำง [] นอยกวำ 5 ป
[] 5 - 10 ป [] มากกวา 10 ป
6. ปญหาในการประยกตใช CAD/CAM/CAE ในบรษท 1 0 -1
55. ปญหาตางๆในการประยกตใช CAD/CAM/CAE ในบรษท
(1 = นอยมาก, 2 = นอย, 3 = ปานกลาง, 4 = สง, 5 = สงมาก)
ระดบ
1. พนกงำนขำดควำมรในเทคโนโลย
2. พนกงำนขำดประสบกำรณและทกษะในเทคโนโลย
3. พนกงำนไมเขำใจเมนภำษำองกฤษ
4.พนกงำนคนเคยกบเทคโนโลยเกำจงไมสำมำรถปรบเขำกบ
เทคโนโลยใหมได
5. พนกงำนเขำรบกำรอบรมไมครบ
6. พนกงำนเปลยนต ำแหนงงำนบอย
7.ผบรหำรไมเหนถงควำมส ำคญของกำรประยกตใชเทคโนโลย
8. ผบรหำรไมสนบสนนกำรอบรมพนกงำน
9. กำรอบรมไมสอดคลองกบสถำนกำรณจรง
10. กำรถำยเทควำมรและเทคโนโลยจำกบนสลำงไมรำบรน
11. มคำใชจำยสงไมคมคำกบกำรลงทน
12. ขำดงบประมำณในกำรซออปกรณ
----- ขอบคณส าหรบการใหเวลาในการตอบแบบส ารวจน -----
ความเปลยนแปลงหลงการประยกตใชเทคโนโลย CAD/CAM/CAE
ปญหาของการประยกตใช CAD/CAM/CAE ในบรษท

Appendix C: List of Companies

● Aapico Hitech Public Company Limited
99, Moo1, Hitech Industrial Estate, Ban Lane, Bang Pa-in, Ayuthaya, 13160, Thailand
(Main business: OEM Auto Parts Manufacturing, Design & Manufacture of Assembly
Jigs, Design & Manufacture of Stamping Dies)
● Asahi Tec Aluminium (Thailand) Company Limited
700/145, Moo5, Amata Nakorn Industrial Estate, Klongtamharu, Muang Chonburi,
Chonburi, 2000, Thailand
(Main business: Aluminium Wheel, Gravity Die Casting)
● C.C.S. Advance Tech. Company Limited
54/2, Moo9, Soi Kantana, Bangyai-Bangkoolad Road, Bangmuang, Bangyai,
Nonthaburi, 11140, Thailand
(Main business: CNC Turning/Machining, Precision Manufacturing, Metal Stamping,
Plastic Molding, Mold/Die, Jigs/Fixtures, Cutting Tools Manufacturing)
● Choknamchai Autopressing Company Limited
52/2, Moo2, Takha, Bangplama, Suphanburi, 72150, Thailand
(Main business: Die Making)
● Chromalloy (Thailand) Limited
25, Moo5, Bungkhamproi, Lamlukka, Pathumthani, 12150, Thailand
(Main business: OEM Services, Operator/MRO Services)
● CNC Design Company Limited 25/4, Moo12, Bungkhamporoi, Lumlukka, Pathumthani, 12150, Thailand
(Main business: Design and Manufacturer of CNC Machines)
● CSP Casting (Thailand) Company Limited
57/1-2, Moo2, Bangpo-nuar, Samkhok, Pathumthani, 12160, Thailand
(Main business: Aluminum and Zinc Die Casting, Gravity Casting Products, Die
Casting Mould, Precision Machined products)
● Electricity Generating Authority of Thailand
25, Moo8, Suwinthawong Road, Nongchok, Bangkok, 10530, Thailand
(Main business: Electric Power Generation)
● Enkei Thai Company Limited 444, Moo17, Bangplee Industrial Estate, Soi6, Thepharak, Bang Sao Thong, Bang
Sao Thong, Samut Prakan, 10540, Thailand
(Main business: Aluminium Wheel for Automobile/Motorcycle, Engine Parts/Outer
Tube/Swing Arm for Motorcycle)
● Honda Automobiles (Thailand) Company Limited
27, Moo14, Soi Serithai87, Serithai Road, Minburi, Bangkok, 10510, Thailand
(Main business: Manufactures and Distributes Passenger Cars in Thailand and
Internationally)

● Klonkij Intertrade Company Limited
283, Ladkrabang Industrial Estate, Chalongkrung Road, Lam Plathio, Lat Krabang,
Bangkok, 10520, Thailand
(Main business: OEM Auto Parts Manufacturing)
● Kriangthai Plastech Company Limited
112/4-5,112/10, Moo11, Ekkachai8 Road, Bang Khunthian, Chomthong, Bangkok
10150, Thailand
(Main business: Plastic Injection)
● Nawa Intertech Company Limited
130/3, Moo3, Nonglalok, Baan-khai, Rayong, 21120, Thailand
(Main business: Design and Manufacture of Moulds and Dies)
● Sammitr Motors Manufacturing Public Company Limited
39, Moo12, Petchkasem Road, Om-noi, Kratumban, Samuthsakorn, 74130, Thailand
(Main business: Manufacture of Car and Truck Body Parts, Moulds and Fixtures for
Auto Makers, Manufacture of Stamping Dies)
● Sri Thai Thana Auto Parts Company Limited
63, Moo8, Phahonyothin Road, Chiangraknoi, Bang Pa-in, Ayuthaya, 13180,
Thailand
(Main business: Automotive Body Replacement Parts Manufacturer and Exporter)
● Thai Rung Union Car Public Company Limited
304, Macharoen Road, Nong Khang Phlu, Nong Khaem, Bangkok, 10160, Thailand
(Main business: Auto Parts Production, Dies & Moulds, Jigs & Fixtures)
● Top Mould Company Limited
194, Moo5, Bangnang, Phanthong, Chonburi, 20160, Thailand
(Main business: Mold Maker and Die Casting Mold)
● Toyota Daihatsu Engineering & Manufacturing Company Limited (TDEM)
99, Moo5, Ban-Ragast, Bang Bor, Samut Prakarn, 10560, Thailand
(Main business: Manufactures and Distributes Passenger Cars in Thailand and
Internationally)
● Uni-Tech Mold and Die Industrial (Thailand) Limited
9, Soi31 Land8, Koobon Road, Kannayao, Bangkok, 10230, Thailand
(Main business: Design and Manufacture of Moulds and Dies)