Let's Workout! Exploring Social Exercise in an Online Fitness ...
12
Let’s Workout! Exploring Social Exercise in an Online Fitness Community Li Zeng 1 , Zack W. Almquist 2 , Emma S. Spiro 1 1 University of Washington, USA 2 University of Minnesota, USA Abstract Increasing attention has been paid to promoting certain healthy habits through social interaction in online communities. At the intersection of social media and activity tracking applications, these platforms capture information on physical activities as well as peer-to-peer interactions. Importantly, they also offer researchers a novel opportunity to understand health behaviors by utilizing the large-scale behavioral trace data they archive. In this study we explore the characteristics and dynamics of social exercise (i.e. fitness activities with at least one peer physically co-present) using data collected from an online fitness community popular with cyclists and runners. In particular, we ask if factors such as temporal seasonality, activity performance and social feedback vary by the number of people participating in an activity; we do so by comparing associations for both men and women. Our results indicate that when peers are physically co-present for fitness activities (i.e. group workouts), exercise tends to be more intense and receive more feedback from other users, across both genders. Findings also suggest gender differences in the observed tendency to complete activities with others. These results have important implications for health and wellness interventions. Keywords: social exercise; health behaviors; online fitness communities; social media; behavioral traces Citation: Zeng, L., Amquist, Z. W. & Spiro, E. S. (2017). Let’s Workout! Exploring Social Exercise in an Online Fitness Community. In iConference 2017 Proceedings, Vol. 2 (pp. 87-98). https://doi.org/10.9776/17028 Copyright: Copyright is held by the authors. Acknowledgements: This material is based upon work supported by, or in part by, the U.S. Army Research Laboratory and the U.S. Army Research Office under YIP awards # W911NF-14-1-0577 and # W911NF-15-1-0270 and the Office of the Vice President for Research, University of Minnesota. Contact: Li Zeng, [email protected]. 1 Introduction Exercising is known to be associated with numerous physical and mental benefits such as controlling weight (Blair, 1993), decreasing the risks of cardiovascular diseases and reducing stress (Fletcher et al., 1996). Although aware that exercising is good for health, not everyone engages in physical activity on a regular basis. The Center for Disease Control in the United States estimates that only 20% of adults meet exercise guidelines (Jaslow, n.d.). 1 Indeed, the World Health Organization continues to combat the global obesity epidemic (Organization, 2000). Health, and more specifically physical activity, is a complex issue and as such has been studied in many fields. Beyond the medical community, issues of health are studied in the social sciences, where research has examined how social, racial, emotional, and socioeconomic factors influence health promotion and likewise health disparities (Walker, Sechrist, & Pender, 1987; Frankish, Milligan, & Reid, 1998; Lee, Wildeman, Wang, Matusko, & Jackson, 2014; Dishman, Sallis, & Orenstein, 1985). A number of studies demonstrate that peer influence and social support have positive health-related effects, such as helping people lose weight and participate in more physical activities (Ahtinen et al., 2009; Chen & Pu, 2014; Wing & Jeffery, 1999; Kulik & Mahler, 1989; Dishman et al., 1985). Prior research also points out that exercising with others can improve psychological functioning (Plante, Coscarelli, & Ford, 2001). However, many of these early studies of peer effects are based on surveys or experiments involving a small number of participants. Recently, social media and online fitness communities are gaining scholarly attention as a new research environment in which to study health behaviors (Centola, 2013). Social media have been used to explore health communication and promotion (Paul & Dredze, 2011; Morris et al., 2011; Vaterlaus, Patten, Roche, & Young, 2015; Pechmann, Pan, Delucchi, Lakon, & Prochaska, 1 http://www.cdc.gov/nchs/fastats/exercise.htm
-
Upload
khangminh22 -
Category
Documents
-
view
0 -
download
0
Transcript of Let's Workout! Exploring Social Exercise in an Online Fitness ...
Let’s Workout! Exploring Social Exercise in an Online Fitness Community
Li Zeng
1, Zack W. Almquist
2, Emma S. Spiro
11University of Washington, USA2University of Minnesota, USA
AbstractIncreasing attention has been paid to promoting certain healthy habits through social interaction inonline communities. At the intersection of social media and activity tracking applications, these platformscapture information on physical activities as well as peer-to-peer interactions. Importantly, they also o�erresearchers a novel opportunity to understand health behaviors by utilizing the large-scale behavioraltrace data they archive. In this study we explore the characteristics and dynamics of social exercise (i.e.fitness activities with at least one peer physically co-present) using data collected from an online fitnesscommunity popular with cyclists and runners. In particular, we ask if factors such as temporal seasonality,activity performance and social feedback vary by the number of people participating in an activity; we doso by comparing associations for both men and women. Our results indicate that when peers are physicallyco-present for fitness activities (i.e. group workouts), exercise tends to be more intense and receive morefeedback from other users, across both genders. Findings also suggest gender di�erences in the observedtendency to complete activities with others. These results have important implications for health andwellness interventions.Keywords: social exercise; health behaviors; online fitness communities; social media; behavioral tracesCitation: Zeng, L., Amquist, Z. W. & Spiro, E. S. (2017). Let’s Workout! Exploring Social Exercise in an Online FitnessCommunity. In iConference 2017 Proceedings, Vol. 2 (pp. 87-98). https://doi.org/10.9776/17028
Copyright: Copyright is held by the authors.Acknowledgements: This material is based upon work supported by, or in part by, the U.S. Army Research Laboratoryand the U.S. Army Research O�ce under YIP awards # W911NF-14-1-0577 and # W911NF-15-1-0270 and the O�ce of theVice President for Research, University of Minnesota.Contact: Li Zeng, [email protected].
1 IntroductionExercising is known to be associated with numerous physical and mental benefits such as controlling weight(Blair, 1993), decreasing the risks of cardiovascular diseases and reducing stress (Fletcher et al., 1996).Although aware that exercising is good for health, not everyone engages in physical activity on a regularbasis. The Center for Disease Control in the United States estimates that only 20% of adults meet exerciseguidelines (Jaslow, n.d.).1 Indeed, the World Health Organization continues to combat the global obesityepidemic (Organization, 2000). Health, and more specifically physical activity, is a complex issue and as suchhas been studied in many fields. Beyond the medical community, issues of health are studied in the socialsciences, where research has examined how social, racial, emotional, and socioeconomic factors influencehealth promotion and likewise health disparities (Walker, Sechrist, & Pender, 1987; Frankish, Milligan, &Reid, 1998; Lee, Wildeman, Wang, Matusko, & Jackson, 2014; Dishman, Sallis, & Orenstein, 1985).
A number of studies demonstrate that peer influence and social support have positive health-relatede�ects, such as helping people lose weight and participate in more physical activities (Ahtinen et al., 2009;Chen & Pu, 2014; Wing & Je�ery, 1999; Kulik & Mahler, 1989; Dishman et al., 1985). Prior research alsopoints out that exercising with others can improve psychological functioning (Plante, Coscarelli, & Ford,2001). However, many of these early studies of peer e�ects are based on surveys or experiments involving asmall number of participants. Recently, social media and online fitness communities are gaining scholarlyattention as a new research environment in which to study health behaviors (Centola, 2013).
Social media have been used to explore health communication and promotion (Paul & Dredze, 2011;Morris et al., 2011; Vaterlaus, Patten, Roche, & Young, 2015; Pechmann, Pan, Delucchi, Lakon, & Prochaska,
1http://www.cdc.gov/nchs/fastats/exercise.htm
iConference 2017 Zeng et al.
2015) and physical activity (Teodoro & Naaman, 2013; Munson, Cavusoglu, Frisch, & Fels, 2013). Studieshave even used randomized experiments to establish causal peer influence e�ects (Zhang, Brackbill, Yang,& Centola, 2015). Online fitness communities o�er even more promising directions for work in this area(Centola & van de Rijt, 2015). These new platforms are specifically designed to provide participants witha group of peers and social support in reaching their fitness or health goals. Moreover, users are able touse wearable devices to track personal activities, including exact Global Positioning System (GPS) traces ofroutes, and upload them to their online profiles within in the community.
For researchers, an important feature of online platforms is their ability to archive a large volume ofbehavioral trace data, including fitness statistics, user profile data, and potentially users’ social networks, aspart of their normal operation. This enables users to explore and compare their own activity e�orts to othersin their “fitness circles”, but it also presents novel opportunities to analyze health behaviors. Researchersnow have the opportunity to observe not what people say they do, but what they actually do.2
In this study, we employ behavioral trace data from one such fitness community to study socialexercise. In particular, this work analyzes how factors including gender, temporal seasonality, activityperformance and social feedback may vary by number of people participating in exercise. Our work aims toanswer the following research questions: (1) When do individuals choose to exercise alone and in groups, andare these dynamics gender dependent? (2) How do peoples’ fitness behaviors di�er, in terms of performanceand social feedback, when exercising alone compared to activities with others physically co-present? Inanswering these questions, this study has implications for health promotion and social network-based healthinterventions.
2 Related Work
2.1 Social Support and Physical ActivityPrevious work suggests that factors such as pleasant surroundings, an enthusiastic exercise leader, andsympathetic co-exercisers during leisure-time activities are all likely to relieve negative emotions associatedwith exercise (Haskell, Montoye, & Orenstein, 1985; Pelphrey et al., 2003; Flaherty, 2005). A laboratory-basedstudy found that exercising with others helped to reduce stress and produce overall positive e�ects on energy,calmness and tiredness, compared with a control group exercising alone (Plante et al., 2001). However,this experiment was conducted in a laboratory setting and participants (recruited from a college studentpopulation) were fairly homogeneous in terms of age and fitness levels, making its applicability in real-worldsettings a open question. Despite limitations of prior studies, it is well-established that social support andphysical activity are linked (Dishman et al., 1985; McAuley et al., 2000; Berkman & Glass, 2000).
More recently, the relationship between social support and physical activity has been studied usingmobile fitness applications (Munson & Consolvo, 2012). Some new platforms explicitly include the element ofsocial support, allowing users to exercise in a virtual group environment so as to motivate them to performphysical activities (Campbell, Ngo, & Fogarty, 2008; Consolvo, Everitt, Smith, & Landay, 2006; Chen &Pu, 2014). For example, (Chen & Pu, 2014) designed a mobile application with gamification settings ofcompetition (i.e. two users compete to gain more virtual rewards by exercising), cooperation (i.e. twousers contribute equally to win virtual rewards) and hybrid (i.e. weighting the cooperation and competitionsettings). Even though users are not required to exercise side by side in the physical environment, all threeconditions of virtual group activities were found to increase users’ activity frequency and intensity.
2.2 Online Fitness CommunitiesThe past few years have seen in explosion of new online fitness communities (e.g. RunKeeper, MapMyRun,Strava, etc.) where users’ natural, everyday activity can be tracked and explored with a rapidly expandingcollection of tools and technologies (Centola, 2013). These fitness communities sit at the intersection of socialmedia and activity tracking applications; users can not only track/log their activities, but also interact witha group of peers and posted activities. One example of such a platform is Strava. Promotional content on
2This is not to say behavior trace data from online fitness communities is not without limitations (as we discuss at the end ofthis paper).
88
iConference 2017 Zeng et al.
the site’s home page3 says: “ The social network for athletes. Connect with friends and make the most ofevery run and ride.” The proliferation of similar platforms, coupled with recent research indicating thatjust over 20% of adults use some form of technology to track their health data (Fox, 2011), signals newopportunities for understanding the social dimensions of health-oriented behaviors. In particular, behavioraltraces of human behavior and interaction collected from these online sources o�er novel data and strategiesfor understanding social dynamics and peer influence.
Online fitness communities have attracted researchers from many disciplines. Some scholars areinterested in the technical potential of sensors and human-computer interaction aspects of these technologies(Consolvo et al., 2008), others have focused on play, incentives, and user engagement (Chen & Pu, 2014). Agrowing body of work concerns social media as a potential tool in medicine (Centola, 2013). All of theseapproaches promise insight into the social aspects of health, however, limited work has specifically exploredthe e�ects of peer co-presence, leaving a gap in our current understanding of the social dynamics in thesesettings.
3 DataData were collected for the online fitness community Strava. Strava continues to grow in popularity amongcyclists and runners in recent years. Strava provides two main competitive, gamifying features to motivateusers to reach their fitness goals. The one is the ability to compare users’ activity e�orts against their historye�orts or compete with other athletes. Another important feature is to accomplish challenges and earnachievement badges. As such, millions of people upload their rides and runs to Strava every week via theirsmartphones or GPS devices.
Strava was also chosen as the research environment because it has a number of desirable characteristics:(1) it attracts an increasing number of users around the world who upload millions of activities to the platformevery week; (2) the Strava Application Programming Interface (API)4 provides access to public Stravabehavioral trace data; and (3) data include activity characteristics, user characteristics and user social networkcharacteristics, providing rich data for research that seeks to understand health behaviors.
To retrieve data about an activity posted to a user’s profile on Strava, a valid activityID is required.We randomly generate a list of activityIDs from a previously-built (and ideally exhaustive) ID space. Wethen query each activityID so as to check if this ID exists. If that activityID does not exist on the platform,we discard this one. If it exists, we retrieve the data associated with that activityID (i.e. information andmetadata about a particular activity). As each activity is associated with a particular user, this data includesa summary representation of the posting athlete which allows us to query for a detailed representation ofthat user. Study procedures were reviewed by the Institutional Review Board at the authors’ university.
As stated previously that Strava API provides access to its rich metadata, our data include butnot limit to the following main components: (1) activity characteristics such as activity type (e.g. cycling,running, swimming, etc.), activity location, activity names, activity-related stats (e.g. distance, moving time,elevation, etc.); (2) user characteristics such as user demographics, user location, physiological measurements(e.g. height, weight, etc.), equipment; (3) social interaction characteristics such as following and followedrelationship, comments, kudos (or "likes").
We collected 888,093 sampled activities posted during 2011-2016 from 514,362 unique users. 81.33%of users report their gender as male. 14.64% of users report their gender as female and 4.03% of users’self-reported gender are unknown. 93.98% of data represent rides (cycling) and runs, but data also representsworkout types such as swimming, walking, hiking, skiing, etc. It is important to note that this data does notrepresent a random sample of platform users, but is instead more likely to capture the behaviors of highlyactive users. While this limits the generalizability of any user-specific findings, it also means our analysis isconducted on regular users who are more likely to fully utilize platform features. This is important for thiscase, because many of our research questions focus on group activities - fitness events where users specify inthe application that they are physically co-present with others. Moreover, we do obtain a random sample ofactivities, and much of the following analysis uses the activity itself as the unit of analysis.
3Strava homepage is at https://www.strava.com/
4Strava V3 API Documentation is at https://strava.github.io/api/
89

iConference 2017 Zeng et al.
4 MethodsTo explore the characteristics and dynamics of solo and group exercise, we begin by classifying observed databased on the number of peers co-present for the activity. Each activity record has an attribute that representsthe number of athletes/users taking part in that activity. We identify activities involving only one athleteas solo activities and activities having more than one athletes as group activities. Our data have 696,856(78.47%) solo activities and 191,237 (21.53%) group activities. In the analysis that follows, we evaluate thecharacteristics and dynamics of each type of activity, comparing solo exercise against group exercise. We doso for men and women separately, in order to tease apart any gender di�erences in these results. Comparingbetween genders is also important because the Strava platform is heavily male dominated and prior work hasnoted that individuals within this environment may have di�erent experiences and social networks (Spiro &Almquist, 2016).
When exploring the temporal dynamics of exercise, we consider: (1) the day of the week (i.e. Mondayto Sunday) and (2) the hour of the day (i.e. 0:00 to 23:00) during which activities are observed. Each activityhas a local timestamp indicating the start time of the event. An analysis of temporal features could helpunderstand the seasonal patterns of solo and group activities. We hypothesize that people prefer to do moresolo activities on weekdays because it is possibly harder to coordinate time among multiple people for groupactivities during these days. Hence, we also hypothesize that group activities take place more frequently onweekends. We also want to find out the “busy” time periods for solo activities and group activities.
Next, we want to understand how performance, that is physical exertion, is related to peer co-presence.Prior work on peer influence and social support suggests that peer co-presence motivates individuals to engagein physical activity more regularly and more often, but it might also motivate them to work harder, exertingthemselves more throughout their physical activity. Measuring performance is challenging and likely involvesa multifaceted approach. Strava also applies a diversity of measurements for physical activities. Therefore weconsider five distinct measures to operationalize activity performance. These include:
a. Distance: total distance of an activity (available on all data)
b. Elevation: total elevation gain of an activity (available on all data)
c. Duration: total moving time of an activity (available on all data)
d. Activity e�ort: average watts (available on cycling activities - around 60% data) and average speed(available on all data)5
e. Physical challenge level: Strava provides its users with a computed “su�er score” which it calculates basedon estimated heart rate intensity (available on premium users’ activities - around 10.5% of data)6
Finally, our work aims to compare social feedback for activities that are complete solo versus ingroups. Strava users can post comments and kudos (i.e. “likes” or +1s) on an activity. Related work suggeststhat these social interaction functions have motivating e�ects on physical activities (Chen & Pu, 2014).Hence, we are interested in analyzing whether workouts as a group receive more comments and/or kudosfrom activity participants or other Strava users.
5 ResultsIn this section, we present findings to address the research questions outlined previously. First, we discussoverall gender di�erences in posting behavior and exercising alone or with a group. We then continue,considering the temporal dynamics of when individuals choose to exercise alone and in groups, and howthese dynamics are gender dependent. Next we evaluate how fitness behaviors di�er, in terms of performance
5Average watts measures the rate of energy conversion with respect to time. Since it is available on partial data, we use themeasure of average speed that is available on activities of other types including running, hiking so as to avoid possible biasedsampling merely from rides.
6Solo activities and group activities account for 76.25% and 23.75% of premium users’ activities, respectively, roughly matchingthe proportions in the entire data sample. Therefore, we believe that the measure of suffer score is still representative and notlikely to introduce large bias to the analysis.
90

iConference 2017 Zeng et al.
(a) 1-3 activity participants (b) 2-5 activity participants (c) 5-N activity participants
Figure 1: Proportion of di�erent athlete counts by gender. Each rectangle visualizes the proportion ofactivities with a specified athlete count. The width and height of a rectangle indicate the proportion ofmen’s activities and the proportion of women’s activities respectively with that count. If the upper rightvertex of a rectangle falls on the dashed line (y = x), this indicates the cumulative women’s proportion isequal to cumulative men’s proportion at that point.
and social feedback, when individuals exercise alone compared to when they exercise with others physicallyco-present. Again, we consider the di�erential e�ect of these activity features by gender.
5.1 Gender Di�erences in Activity
Activity counts PercentageFemale Alone 91,248 0.768Female with Others 27,576 0.232Male Alone 580,832 0.786Male with Others 158,448 0.214
Table 1: Counts and Percentages of Solo/Group Activities by Gender
Strava is a male-dominated platform, where the large majority of platform users are males, and thisis reflected in our dataset. To begin our analysis, we count the number of activities of both types for eachgender, and calculate the corresponding percentages. Table 1 shows a greater percentage of activities postedby females are group activities than among males, indicating that there are proportionally more women whoare involved in group activities.7
Figure 1 shows how each gender is observed to participate in activities that involve a specifiednumber of participants. For example, in the Figure 1(a), the largest rectangle represents the proportionof activities posted that include only one user across gender. The width (0.7857) and height (0.7679) ofthe rectangle correspond to the proportion for men and women, respectively. Since, in this case, the widthis greater than the height, we know that solo activities enjoy a larger proportion among men than amongwomen. However, for activities having two participants, we find a much larger proportion among women,indicating exercising with a single peer is observed more frequently among women. As the number of activityparticipants increases, rectangles gradually deviate from the dashed line, indicating that female users tendto engage in more activities in smaller groups (mostly in a group of size two); as participants continue toincrease, we find that the trajectory of the rectangle position goes back, closer to the dashed line, indicatingthat men (in proportion) are involved in larger group activities.
7A chi-squared test was performed to determine if significant di�erence exists in these counts. Unsurprisingly, given thedataset size, we find a highly significant (p < 0.001) relationship between gender and exercising alone versus with others.
91
iConference 2017 Zeng et al.
5.2 Temporal Dynamics of Activity
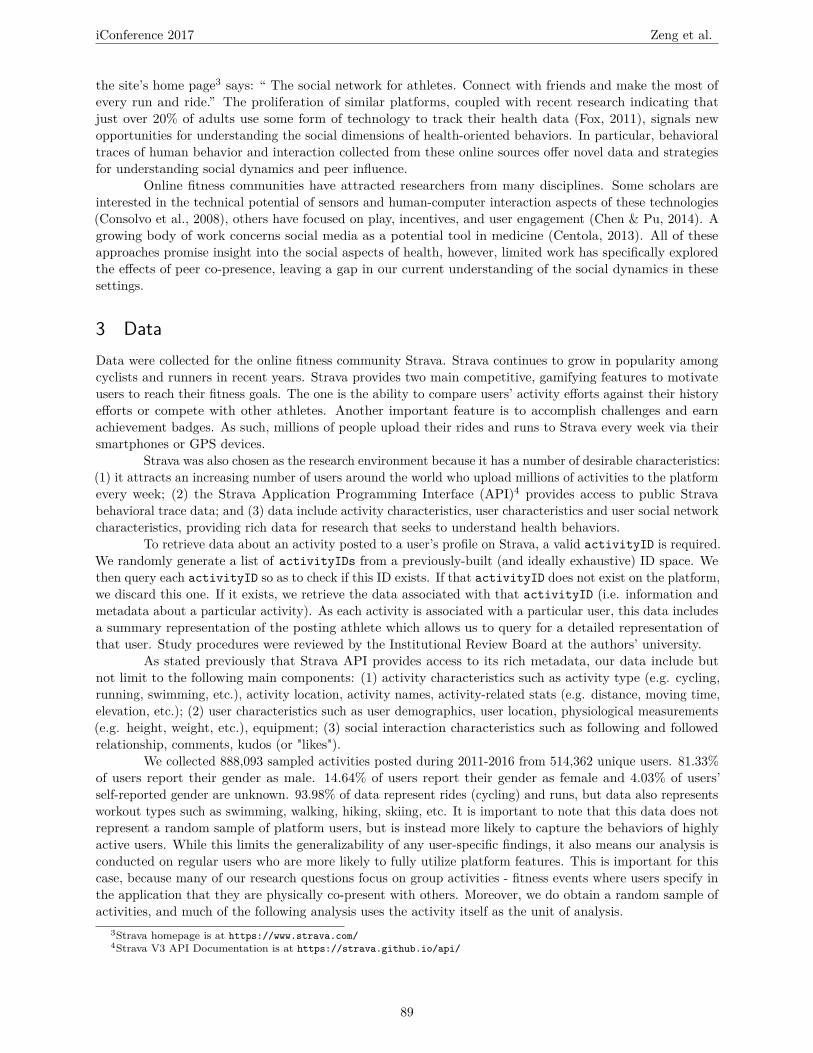
Figure 2: Distribution of solo (yellow) and group (green) activities across the seven weekdays. Correspond-ing lines map trends over the week.
One of our primary research questions aims to identify seasonality patterns for solo and group exercise.Figure 2 shows the proportion of solo and group activities posted to Strava across the week. We observethat proportions of group activities are smaller on weekdays compared to that of solo activities. Moreover,about 50% group activities occur over weekends, greatly exceeding the proportion of solo activities. For soloactivities, we see a relatively stable and consistent pattern throughout the week. Exercising on Mondaysand Fridays appears to be less attractive to athletes, as fewer activities - both solo and group activities - areposted on these days.
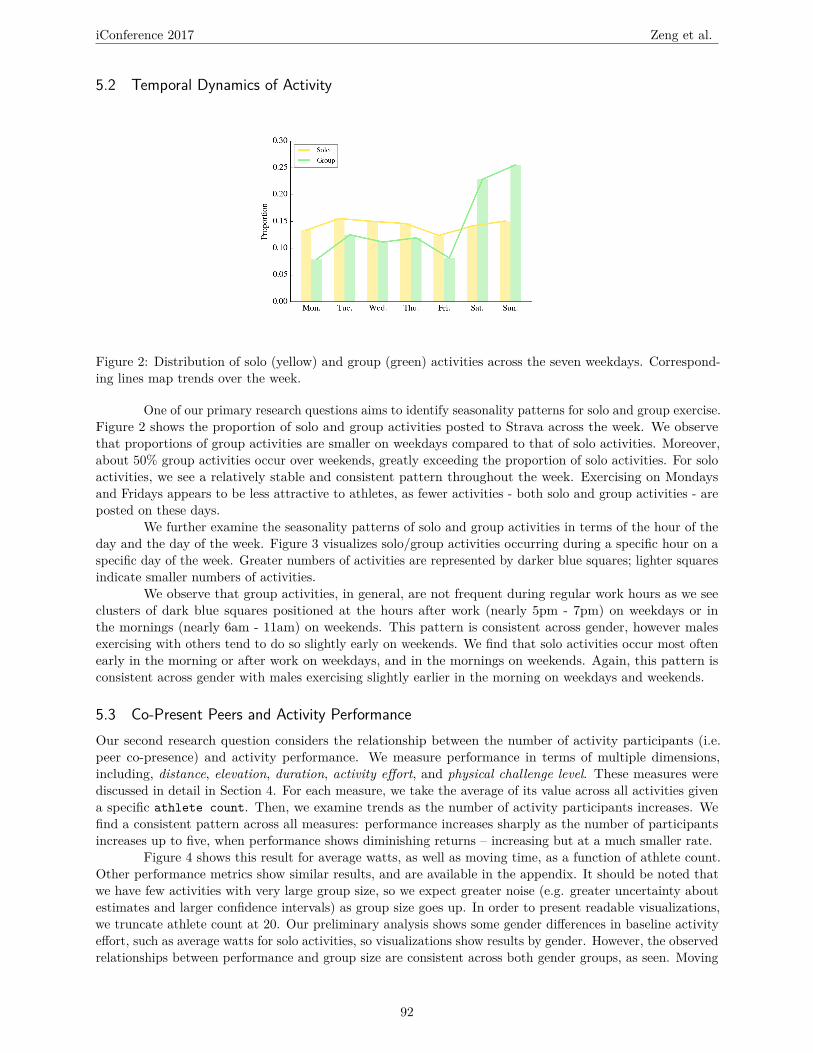
We further examine the seasonality patterns of solo and group activities in terms of the hour of theday and the day of the week. Figure 3 visualizes solo/group activities occurring during a specific hour on aspecific day of the week. Greater numbers of activities are represented by darker blue squares; lighter squaresindicate smaller numbers of activities.
We observe that group activities, in general, are not frequent during regular work hours as we seeclusters of dark blue squares positioned at the hours after work (nearly 5pm - 7pm) on weekdays or inthe mornings (nearly 6am - 11am) on weekends. This pattern is consistent across gender, however malesexercising with others tend to do so slightly early on weekends. We find that solo activities occur most oftenearly in the morning or after work on weekdays, and in the mornings on weekends. Again, this pattern isconsistent across gender with males exercising slightly earlier in the morning on weekdays and weekends.
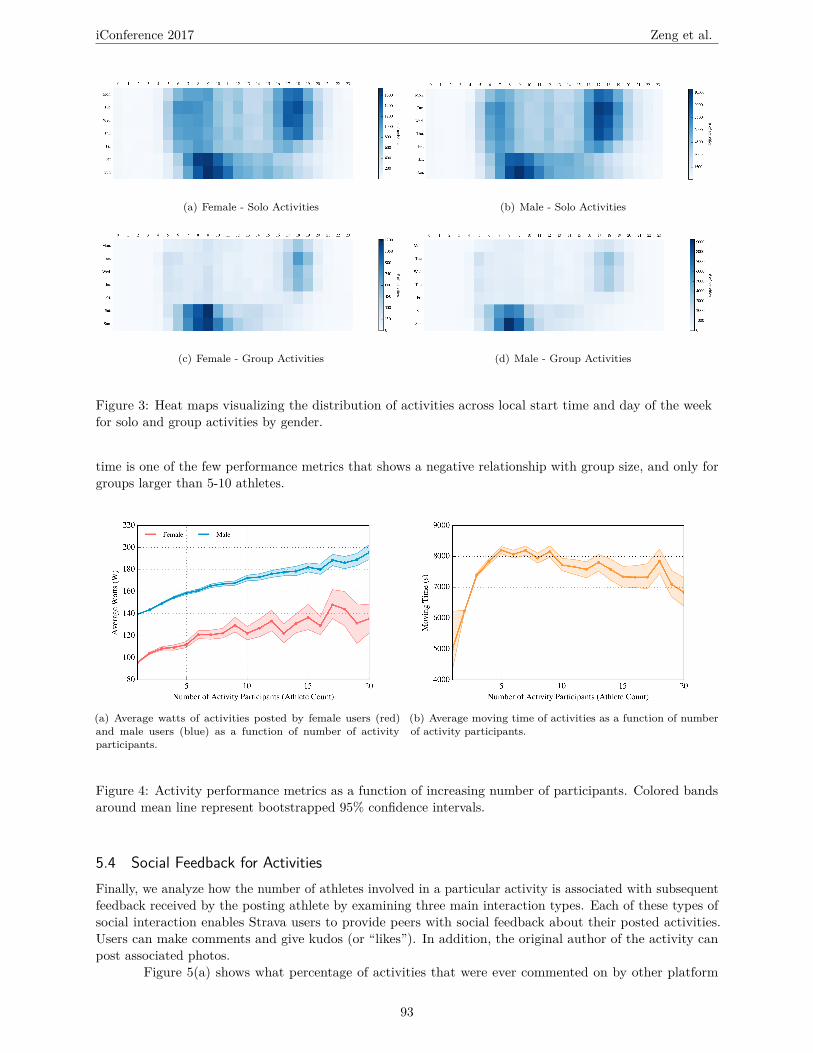
5.3 Co-Present Peers and Activity PerformanceOur second research question considers the relationship between the number of activity participants (i.e.peer co-presence) and activity performance. We measure performance in terms of multiple dimensions,including, distance, elevation, duration, activity e�ort, and physical challenge level. These measures werediscussed in detail in Section 4. For each measure, we take the average of its value across all activities givena specific athlete count. Then, we examine trends as the number of activity participants increases. Wefind a consistent pattern across all measures: performance increases sharply as the number of participantsincreases up to five, when performance shows diminishing returns – increasing but at a much smaller rate.
Figure 4 shows this result for average watts, as well as moving time, as a function of athlete count.Other performance metrics show similar results, and are available in the appendix. It should be noted thatwe have few activities with very large group size, so we expect greater noise (e.g. greater uncertainty aboutestimates and larger confidence intervals) as group size goes up. In order to present readable visualizations,we truncate athlete count at 20. Our preliminary analysis shows some gender di�erences in baseline activitye�ort, such as average watts for solo activities, so visualizations show results by gender. However, the observedrelationships between performance and group size are consistent across both gender groups, as seen. Moving
92
iConference 2017 Zeng et al.
(a) Female - Solo Activities (b) Male - Solo Activities
(c) Female - Group Activities (d) Male - Group Activities
Figure 3: Heat maps visualizing the distribution of activities across local start time and day of the weekfor solo and group activities by gender.
time is one of the few performance metrics that shows a negative relationship with group size, and only forgroups larger than 5-10 athletes.
(a) Average watts of activities posted by female users (red)and male users (blue) as a function of number of activityparticipants.
(b) Average moving time of activities as a function of numberof activity participants.
Figure 4: Activity performance metrics as a function of increasing number of participants. Colored bandsaround mean line represent bootstrapped 95% confidence intervals.
5.4 Social Feedback for ActivitiesFinally, we analyze how the number of athletes involved in a particular activity is associated with subsequentfeedback received by the posting athlete by examining three main interaction types. Each of these types ofsocial interaction enables Strava users to provide peers with social feedback about their posted activities.Users can make comments and give kudos (or “likes”). In addition, the original author of the activity canpost associated photos.
Figure 5(a) shows what percentage of activities that were ever commented on by other platform
93

iConference 2017 Zeng et al.
(a) Percentage of activities earning at least one comment byanother Strava user
(b) Percentage of activities with photos available on Strava orInstagram
Figure 5: Measure of social feedback by gender and activity (solo versus group).
users for type of activity, across genders and then combined. We find that group activities are much morelikely to be commented on; percentages of activities commented involving groups are twice as high as thoseof solo activities in across all cases. Additionally, we do not see significant gender di�erences here. We do notshow results for kudoed activities because it has roughly the same pattern as commented activities.
Figure 5(b) shows the percentage of activities with accompanying photos posted in Strava or Instagram.We see that users are more likely to post photos to group activities. Moreover, we observe that female userstend to post more photos to both solo and group activities than male users.
Overall, group activities and solo activities di�er in terms of the proportion of received social feedback.We find that group activities are much more likely to attract social feedback including comments and likesfrom peers. Moreover, group activities tend to motivate users’ behavior of content sharing by postingactivity-related photos, which in turn is likely to gain more attention among users’ online social circle.
6 DiscussionThis study compares activities posted by users in an online fitness community. In particular, we focus analysison how the characteristics of these activities – when they occur, how intense they seem to be, and how muchsocial feedback they receive – may be associated with the number of co-participants. To do so we make useof a unique dataset collected from the online community Strava, utilizing application features that allowusers to specify who they are exercising with; data comprise not only the behavior of individual athletes(users), but also detailed records of who is physically co-present with these users. Our analysis demonstratesa number of significant findings.
First, we observe that female users tend to post activities that involve a single peer – exercise eventswhere the number of total participants is two. Males, on the other hand, tend to post solo activities oractivities that involve larger groups. These results hint at specific gender preferences in group exerciseand have numerous implications for peer e�ects on motivation and health promotion. Importantly, for anynetwork-based intervention or behavior change, the social networks (and as a consequence influential peers)for men and women look very di�erent (Granovetter, 1973; Centola & Macy, 2007; Bakshy, Rosenn, Marlow,& Adamic, 2012; Lewis, Gonzalez, & Kaufman, 2012). Results suggest that females might have a single orsmall set of influential strong ties (i.e. exercise partners), while men may have a large, diverse set of peerswho could be influential.
This study finds evidence for strong seasonal e�ects on group exercise. Group activities usually takeplace after work during the week or early in the day on weekends, whereas many solo activities also takeplace in the early mornings on weekdays. Building from the previous discussion, while strong diurnal patternsare unsurprising in human behavior (Golder & Macy, 2011), results demonstrate that opportunities for peerinfluence on health behaviors are likely to be restricted or constrained in systematic ways. For example,
94

iConference 2017 Zeng et al.
designers of application features might suggest that exercise partners should take into account optimal timesfor group exercise and individuals preferences for when to work out. While outside the scope of this study,there are many interesting directions for future work that considers mechanisms to a�ect behavior change.
Group activities di�er from solo activities, in terms of e�ort, exertion and performance, our analysisindicates. When exercising with others, even just a single peer, athletes see notable gains in workoutintensity and energy expended – increases in average power output (measured in average watts for cyclingevents), moving time and distance. Interestingly, these gains continue to increase for every additional activityparticipant (though primary gains are seen for the first 5 additional co-present peers). Activities withco-present peers might be informal (organized by the participants themselves) or formal (group rides perhapsorganized by a local club or other organizational entity). Further work might tease apart these di�erentconditions to o�er insight into peer e�ects and impact of institutional structure on exercise (Vilhjalmsson &Kristjansdottir, 2003).
Co-presence and social interaction are distinct but related concepts. In the final component ofthe analysis presented here, we consider observations of social exchange among athletes. In particular, weconsider social feedback behaviors - platform users commenting and liking each others’ activities. Findingsdemonstrate that group activities are associated with higher levels of social feedback than solo activities.Moreover, group activities are significantly more likely to include multimedia (photos). In the latter case,data also reveals gender di�erences, where females are more likely to post group activities with photos thanmales. Increased engagement and social feedback may also be related to motivation and future activity,suggesting more promising directions for further work.
7 LimitationsWhile the study presented here o�ers novel insight into the characteristics of physical activities where peersare co-present, it is not without limitations. One notable concern is the ability of Strava application users torestrict their activities to be private, shared only with pre-screened peers. Private accounts, and likewiseprivate activities, cannot be accessed from the Strava API, and therefore are excluded from the data used inthis study. Athletes who choose to restrict access to their data may systematically di�er from users whomake their data public. Unfortunately, we are unable to assess the impact of this bias because of lack of data.Instead, one should be careful about generalizing these results beyond the population of study.
8 ConclusionAs social fitness mobile applications become widely used for personal activity tracking, social support andhealth promotion, opportunities for understanding the e�ects of social networks and peer influence on behaviorchange and health expand. Drawing on features of social media and activity tracking applications, manyof these new platforms capture rich data about physical activities as well as peer-to-peer interactions. Thebehavioral trace data they archive have the potential to significantly alter understanding of health andwell-being. In this study, we explore the characteristics and dynamics of social exercise, that is fitnessactivities with at least one peer physically co-present. Our research focuses on quantifying diurnal patterns,activity performance and social feedback as they vary by the number of people participating in an activity; wealso compare associations by gender. Our results indicate that when peers are physically co-present exercisetends to be more intense and receive more feedback from other users. Findings also suggest gender di�erencesin the observed tendency to engage in physical activity with others. The implications of these results fornetwork-based health and wellness interventions are also discussed.
ReferencesAhtinen, A., Isomursu, M., Mukhtar, M., Mäntyjärvi, J., Häkkilä, J., & Blom, J. (2009). Designing
social features for mobile and ubiquitous wellness applications. In Proceedings of the 8th internationalconference on mobile and ubiquitous multimedia (p. 12).
Bakshy, E., Rosenn, I., Marlow, C., & Adamic, L. (2012). The role of social networks in information di�usion.In Proceedings of the 21st international conference on world wide web (pp. 519–528).
95

iConference 2017 Zeng et al.
Berkman, L. F., & Glass, T. (2000). Social integration, social networks, social support, and health. Socialepidemiology, 1 , 137–173.
Blair, S. N. (1993). Evidence for success of exercise in weight loss and control. Annals of Internal Medicine,119 (7_Part_2), 702–706.
Campbell, T., Ngo, B., & Fogarty, J. (2008). Game design principles in everyday fitness applications. InProceedings of the 2008 acm conference on computer supported cooperative work (pp. 249–252).
Centola, D. (2013). Social media and the science of health behavior. Circulation, 127 (21), 2135–2144.Centola, D., & Macy, M. (2007). Complex contagions and the weakness of long ties1. American journal of
Sociology, 113 (3), 702–734.Centola, D., & van de Rijt, A. (2015). Choosing your network: Social preferences in an online health
community. Social Science & Medicine, 125 , 19–31.Chen, Y., & Pu, P. (2014). Healthytogether: exploring social incentives for mobile fitness applications. In
Proceedings of the second international symposium of chinese chi (pp. 25–34).Consolvo, S., Everitt, K., Smith, I., & Landay, J. A. (2006). Design requirements for technologies that
encourage physical activity. In Proceedings of the sigchi conference on human factors in computingsystems (pp. 457–466).
Consolvo, S., McDonald, D. W., Toscos, T., Chen, M. Y., Froehlich, J., Harrison, B., . . . others (2008).Activity sensing in the wild: a field trial of ubifit garden. In Proceedings of the sigchi conference onhuman factors in computing systems (pp. 1797–1806).
Dishman, R. K., Sallis, J. F., & Orenstein, D. R. (1985). The determinants of physical activity and exercise.Public health reports, 100 (2), 158.
Flaherty, A. W. (2005). Frontotemporal and dopaminergic control of idea generation and creative drive.Journal of Comparative Neurology, 493 (1), 147–153.
Fletcher, G. F., Balady, G., Blair, S. N., Blumenthal, J., Caspersen, C., Chaitman, B., . . . others (1996).Statement on exercise: Benefits and recommendations for physical activity programs for all americans astatement for health professionals by the committee on exercise and cardiac rehabilitation of the councilon clinical cardiology, american heart association. Circulation, 94 (4), 857–862.
Fox, S. (2011). The social life of health information, 2011. Pew Internet & American Life Project Washington,DC.
Frankish, C. J., Milligan, C. D., & Reid, C. (1998). A review of relationships between active living anddeterminants of health. Social Science & Medicine, 47 (3), 287–301.
Golder, S. A., & Macy, M. W. (2011). Diurnal and seasonal mood vary with work, sleep, and daylengthacross diverse cultures. Science, 333 (6051), 1878–1881.
Granovetter, M. S. (1973). The strength of weak ties. American journal of sociology, 1360–1380.Haskell, W. L., Montoye, H. J., & Orenstein, D. (1985). Physical activity and exercise to achieve health-related
physical fitness components. Public Health Reports, 100 (2), 202.Jaslow, R. (n.d.). Cdc: 80 percent of american adults don’t get recommended exercise. cbc news may 3, 2013.Kulik, J. A., & Mahler, H. I. (1989). Social support and recovery from surgery. Health Psychology, 8 (2), 221.Lee, H., Wildeman, C., Wang, E. A., Matusko, N., & Jackson, J. S. (2014). A heavy burden: the cardiovascular
health consequences of having a family member incarcerated. American journal of public health, 104 (3),421–427.
Lewis, K., Gonzalez, M., & Kaufman, J. (2012). Social selection and peer influence in an online socialnetwork. Proceedings of the National Academy of Sciences, 109 (1), 68–72.
McAuley, E., Blissmer, B., Marquez, D. X., Jerome, G. J., Kramer, A. F., & Katula, J. (2000). Socialrelations, physical activity, and well-being in older adults. Preventive medicine, 31 (5), 608–617.
Morris, M. E., Consolvo, S., Munson, S., Patrick, K., Tsai, J., & Kramer, A. D. (2011). Facebook for health:opportunities and challenges for driving behavior change. In Chi’11 extended abstracts on human factorsin computing systems (pp. 443–446).
Munson, S. A., Cavusoglu, H., Frisch, L., & Fels, S. (2013). Sociotechnical challenges and progress in usingsocial media for health. Journal of Medical Internet Research, 15 , e226.
Munson, S. A., & Consolvo, S. (2012). Exploring goal-setting, rewards, self-monitoring, and sharing tomotivate physical activity. In 2012 6th international conference on pervasive computing technologies forhealthcare (pervasivehealth) and workshops (pp. 25–32).
Organization, W. H. (2000). Obesity: preventing and managing the global epidemic (No. 894). Author.Paul, M. J., & Dredze, M. (2011). You are what you tweet: Analyzing twitter for public health. ICWSM ,
20 , 265–272.Pechmann, C., Pan, L., Delucchi, K., Lakon, C. M., & Prochaska, J. J. (2015). Development of a twitter-
based intervention for smoking cessation that encourages high-quality social media interactions viaautomessages. Journal of medical Internet research, 17 (2), e50.
Pelphrey, K. A., Mitchell, T. V., McKeown, M. J., Goldstein, J., Allison, T., & McCarthy, G. (2003). Brainactivity evoked by the perception of human walking: controlling for meaningful coherent motion. TheJournal of Neuroscience, 23 (17), 6819–6825.
Plante, T. G., Coscarelli, L., & Ford, M. (2001). Does exercising with another enhance the stress-reducingbenefits of exercise? International Journal of Stress Management, 8 (3), 201–213.
96
iConference 2017 Zeng et al.
Spiro, E. S., & Almquist, Z. W. (2016). Mechanisms of tie formation in activity-based online social networks,2016. 36th Sunbelt Network Conference (INSNA). Newport Beach, California.
Teodoro, R., & Naaman, M. (2013). Fitter with twitter: Understanding personal health and fitness activityin social media. In Icwsm.
Vaterlaus, J. M., Patten, E. V., Roche, C., & Young, J. A. (2015). # gettinghealthy: The perceived influenceof social media on young adult health behaviors. Computers in Human Behavior , 45 , 151–157.
Vilhjalmsson, R., & Kristjansdottir, G. (2003). Gender di�erences in physical activity in older children andadolescents: the central role of organized sport. Social science & medicine, 56 (2), 363–374.
Walker, S. N., Sechrist, K. R., & Pender, N. J. (1987). The health-promoting lifestyle profile: developmentand psychometric characteristics. Nursing research, 36 (2), 76–81.
Wing, R. R., & Je�ery, R. W. (1999). Benefits of recruiting participants with friends and increasing socialsupport for weight loss and maintenance. Journal of consulting and clinical psychology, 67 (1), 132.
Zhang, J., Brackbill, D., Yang, S., & Centola, D. (2015). E�cacy and causal mechanism of an online socialmedia intervention to increase physical activity: results of a randomized controlled trial. Preventivemedicine reports, 2 , 651–657.
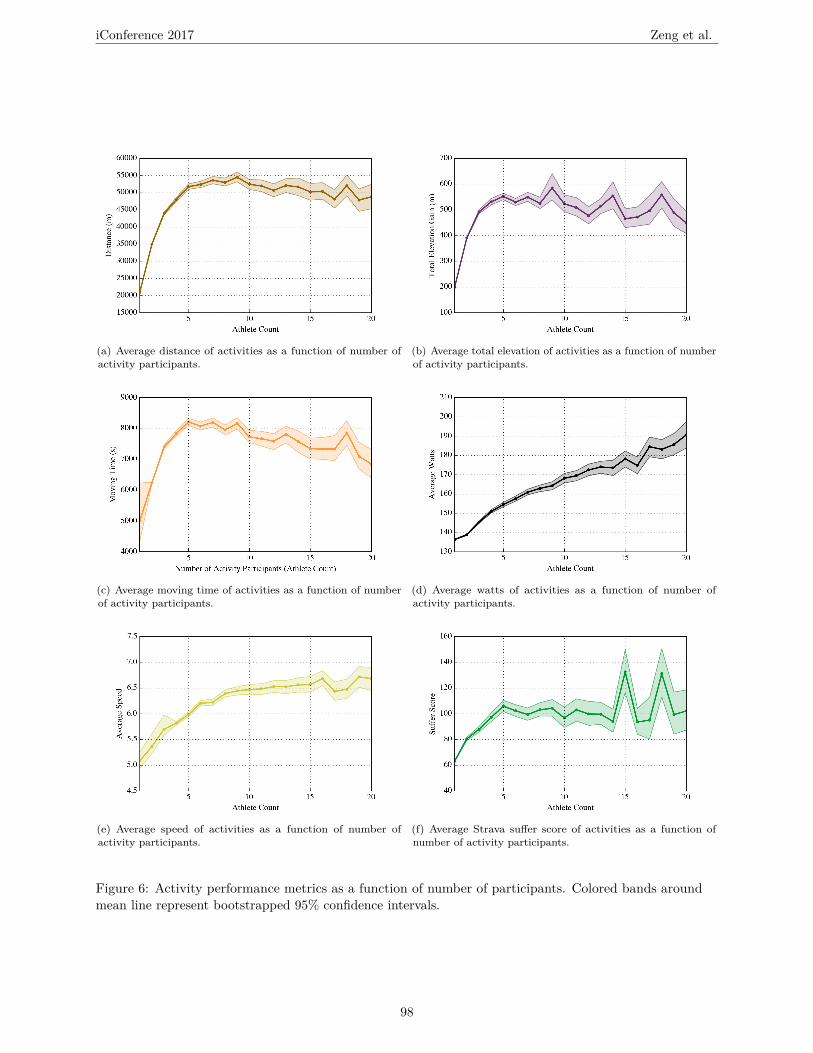
9 Appendix: Peer Co-presence versus Activity PerformanceThis appendix contains results demonstrating how all measurements of activity performance change as thenumber of participants increases.
97
iConference 2017 Zeng et al.
(a) Average distance of activities as a function of number ofactivity participants.
(b) Average total elevation of activities as a function of numberof activity participants.
(c) Average moving time of activities as a function of numberof activity participants.
(d) Average watts of activities as a function of number ofactivity participants.
(e) Average speed of activities as a function of number ofactivity participants.
(f) Average Strava su�er score of activities as a function ofnumber of activity participants.
Figure 6: Activity performance metrics as a function of number of participants. Colored bands aroundmean line represent bootstrapped 95% confidence intervals.
98