Les systèmes métallogéniques hydrothermaux à tungstène et ...
408
HAL Id: tel-01822836 https://tel.archives-ouvertes.fr/tel-01822836 Submitted on 25 Jun 2018 HAL is a multi-disciplinary open access archive for the deposit and dissemination of sci- entific research documents, whether they are pub- lished or not. The documents may come from teaching and research institutions in France or abroad, or from public or private research centers. L’archive ouverte pluridisciplinaire HAL, est destinée au dépôt et à la diffusion de documents scientifiques de niveau recherche, publiés ou non, émanant des établissements d’enseignement et de recherche français ou étrangers, des laboratoires publics ou privés. Les systèmes métallogéniques hydrothermaux à tungstène et métaux rares (Nb-Ta-Li-Sn) de la période Jurassique-Crétacé au sud de la province de Jiangxi (Chine) Helène Legros To cite this version: Helène Legros. Les systèmes métallogéniques hydrothermaux à tungstène et métaux rares (Nb-Ta-Li- Sn) de la période Jurassique-Crétacé au sud de la province de Jiangxi (Chine). Sciences de la Terre. Université de Lorraine, 2017. Français. NNT : 2017LORR0266. tel-01822836
-
Upload
khangminh22 -
Category
Documents
-
view
0 -
download
0
Transcript of Les systèmes métallogéniques hydrothermaux à tungstène et ...
HAL Id: tel-01822836https://tel.archives-ouvertes.fr/tel-01822836
Submitted on 25 Jun 2018
HAL is a multi-disciplinary open accessarchive for the deposit and dissemination of sci-entific research documents, whether they are pub-lished or not. The documents may come fromteaching and research institutions in France orabroad, or from public or private research centers.
L’archive ouverte pluridisciplinaire HAL, estdestinée au dépôt et à la diffusion de documentsscientifiques de niveau recherche, publiés ou non,émanant des établissements d’enseignement et derecherche français ou étrangers, des laboratoirespublics ou privés.
Les systèmes métallogéniques hydrothermaux àtungstène et métaux rares (Nb-Ta-Li-Sn) de la période
Jurassique-Crétacé au sud de la province de Jiangxi(Chine)
Helène Legros
To cite this version:Helène Legros. Les systèmes métallogéniques hydrothermaux à tungstène et métaux rares (Nb-Ta-Li-Sn) de la période Jurassique-Crétacé au sud de la province de Jiangxi (Chine). Sciences de la Terre.Université de Lorraine, 2017. Français. �NNT : 2017LORR0266�. �tel-01822836�
AVERTISSEMENT
Ce document est le fruit d'un long travail approuvé par le jury de soutenance et mis à disposition de l'ensemble de la communauté universitaire élargie. Il est soumis à la propriété intellectuelle de l'auteur. Ceci implique une obligation de citation et de référencement lors de l’utilisation de ce document. D'autre part, toute contrefaçon, plagiat, reproduction illicite encourt une poursuite pénale. Contact : [email protected]
LIENS Code de la Propriété Intellectuelle. articles L 122. 4 Code de la Propriété Intellectuelle. articles L 335.2- L 335.10 http://www.cfcopies.com/V2/leg/leg_droi.php http://www.culture.gouv.fr/culture/infos-pratiques/droits/protection.htm
Faculté des Sciences et Technologies – Campus des Aiguillettes – 54506 Vandoeuvre-lè-Nancy Cedex
Ecole Doctorale RP2E « Ressources, Procédés, Produits, Environnement »
Collegium Sciences et Technologies Université de Lorraine CARNOT ICEEL – CARNOT BRGM
UMR 7359 GeoRessources
THESE Présentée pour l’obtention du grade de
Docteur de l’Université de Lorraine Mention « Géosciences »
Par Hélène LEGROS
Les systèmes métallogéniques hydrothermaux à tungstène et métaux rares (Nb-Ta-Li-Sn) de la période Jurassique-Crétacé au sud de la province de
Jiangxi (Chine)
Tungsten and rare metal (Nb-Ta-Li-Sn) hydrothermal metallogenic systems of the Jurassic-
Cretaceous period in the southern Jiangxi province (SE China)
Soutenance publique le 14 Décembre 2017
Membres du jury:
Directeur de thèse : Marc-Yves Lespinasse Professeur, GeoRessources, UL, France Rapporteurs : David Dolejs Professeur, Université de Freiburg, Allemagne Philippe Boulvais Maître de Conférence, Géosciences Rennes, France Examinateurs : Marieke Van Lichtervelde Chargé de Recherche, IRD/GET, France Stanislas Sizaret Professeur, Université d’Orléans, France Nicolas Charles Chercheur, BRGM, France Gaston Giuliani Directeur de Recherche, IRD/CRPG/GET/CNRS, France Rolf Romer Professeur, GFZ Potsdam, Allemagne Invités : Christian Marignac Professeur émerite, Ecole des Mines de Nancy, UL, France

3
Résumé
Le tungstène est défini comme “ressource minérale critique” par la Commission
Européenne. En effet, plus de 60% des réserves mondiales sont localisées en Chine où plus
de 80% de la production mondiale est distribuée. La province de Jiangxi, située au sud-est de
la Chine, dans le bloc Cathaysia, représente 90 % des réserves en tungstène chinoises. Ces
ressources sont principalement observées sous la forme de veines hydrothermales à quartz-
wolframite-cassiterite peri-granitiques, associées à des granites jurassiques et crétacés. Cette
thèse a pour but de (i) développer des traceurs pétrographiques et minéralogiques de
processus minéralisateurs à travers des études paragénétiques détaillées et la géochimie des
micas lithinifères, (ii) définir les paramètres nécessaires à la précipitation de la minéralisation
par une étude d’inclusions fluides et, (iii) de développer des approches de datation associées
à ces systèmes. Ce travail est basé sur l’étude des gisements hydrothermaux à W-Sn de
Maoping et Piaotang, tous deux situés dans le district de Dayu (sud de la province de Jiangxi),
par des approches de pétrographie et minéralogie détaillées, de géochimie minérales et
isotopiques, d’inclusions fluides et géochronologiques.
L’étude détaillée des gisements de Maoping et Piaotang démontre l’implication de
processus régionaux permettant la mise en place de ces gisements à W-Sn « géants » entre
165 et 130 Ma (Jurassique-Crétacé) dans le sud de la province de Jiangxi. L’étude
géochimique des micas lithinifères et d’inclusions fluides convergent vers un modèle
impliquant des fluides multiples se chevauchant dans le temps et associés à plusieurs
épisodes distincts de mise en place de minéralisations en métaux rares. Au sein du
communément appelé « stade à silicate-oxydes » où l’essentiel de la minéralisation se met en
place. L’étude d’inclusions fluides a permis de caractériser des paramètres distincts de
précipitation des minéraux de gangue et de la minéralisation et donc une cristallisation
séquencée. Le cas exceptionnel des gisements de Maoping et Piaotang permet de définir deux
processus fluides comme seul responsables de la précipitation de la minéralisation dans ces
gisements « géants » : la différenciation magmatique de granites peralumineux et des
processus de mélange. Le premier âge sur wolframite (U-Pb) a permis de montrer que la
minéralisation en tungstène se met en place aux alentours de 160 Ma, antérieurement à la
plupart des âges obtenus sur les minéraux de gangue datés dans cette zone et défini alors
une remise à zéro majeure des systèmes isotopiques par de multiples circulations fluides entre
150 et 155 Ma. De plus, les stades post-minéralisations ont pu être définis pour la première
fois et révèlent l’implication de magmatisme peralcalin impliqué dans la précipitation de
minéralisations à Nb-Ta-Y-REE aux alentours de 130 Ma. A la lumière de cette observation,
cette thèse s’est aussi tournée vers le développement de méthodes de datation in situ sur
columbo-tantalite.
4
Abstract
Tungsten is defined as a “critical mineral resource” by the European Commission.
Indeed, more than 60% of the world reserves are located in China where more than 80% of
the worldwide production is distributed. The Jiangxi province, located in the southeastern part
of China, in the Cathaysia block, represents 90% of the Chinese tungsten resources. These
resources are mainly observed as peri-granitic quartz-wolframite-cassiterite hydrothermal vein
systems associated to Jurassic and Cretaceous granites. This thesis aims to (i) develop
mineralogical and petrological tracers of ore-forming processes through detailed paragenetic
sequences and geochemistry of Li-micas, (ii) distinguish prequisite parameters involved in ore-
forming processes by fluid inclusions studies and, (iii) develop dating approaches associated
to these systems. This work is based on the study of the Maoping and Piaotang W-Sn
hydrothermal deposits located in the Dayu district (southern Jiangxi), using petrography and
detailed mineralogy, mineral and isotope geochemistry, fluid inclusions and geochronology.
The detailed study of the Maoping and Piaotang deposits demonstrate the implication
of regional processes emplacing giant W-Sn deposits between 165-130 Ma (Jurassic-
Cretaceous) in the southern Jiangxi province. Li-micas geochemistry as well as the fluid
inclusion studies converge to multiple overlapping fluids associated to several and distinct rare-
metal mineralizing stages. Within the commonly called “silicate-oxide” stage where main of the
ore-bearing minerals occur, fluid inclusions permitted to characterize distinct parameters of
precipitation for the gangue and W-Sn minerals and therefore a non-coeval crystallization. The
exceptional cases of the Maoping and Piaotang deposits allow to define peraluminous
magmatic differentiation and mixing processes as only prequisite for the formation of these
giant deposits. First U-Pb dating of wolframite in this region show that the W mineralization
formed at ca. 160 Ma, prior to most ages obtained on gangue minerals in the area, defining a
major resetting of isotopic systems due to multiple fluid circulations around 150-155 Ma.
Moreover, post-“silicate-oxide” stages have been defined for the first time and reveal the
implication of peralkaline new fluid sources involved in the precipitation of Nb-Ta-Y-REE
minerals at ca. 130 Ma. In the light of these results, this thesis gives new developments for in
situ direct dating of ore-bearing minerals such as columbo-tantalite.
Sommaire
5
Table des matières
RESUME ------------------------------------------------------------------------------------------------------------------------ 3
ABSTRACT -------------------------------------------------------------------------------------------------------------------- 4
REMERCIEMENTS -------------------------------------------------------------------------------------------------------- 11
INTRODUCTION ------------------------------------------------------------------------------------------------------------ 11
ETAT DE L’ART ------------------------------------------------------------------------------------------------------------ 19
1. POURQUOI ETUDIER LE TUNGSTENE ? ------------------------------------------------------------------------------ 19 2. LE TUNGSTENE: L’ELEMENT ------------------------------------------------------------------------------------------- 21 3. LES GISEMENTS A W-SN : CAS DES GISEMENTS PERIGRANITIQUES DE TYPE « VEINES » ------------------- 22
3.1. Morphologie ------------------------------------------------------------------------------------------------------ 22 3.2. Magmatismes associés --------------------------------------------------------------------------------------- 23 3.3. Les veines -------------------------------------------------------------------------------------------------------- 25 3.4. Modèle général de mise en place -------------------------------------------------------------------------- 25 3.5 Données d’inclusions fluides --------------------------------------------------------------------------------- 26
4. EXEMPLE DE GISEMENT FINI-VARISQUE : LE MASSIF CENTRAL FRANÇAIS ------------------------------------- 31 RÉFÉRENCES -------------------------------------------------------------------------------------------------------------- 33
CHAPTER 1: ASSESSMENT OF THE GEODYNAMICAL AND MAGMATIC SETTINGS OF THE JURASSIC-CRETACEOUS PERIOD IN THE CATHAYSIA BLOCK (SE CHINA): A PRELIMINARY REVIEW ----------------------------------------------------------------------------------------------------------------------- 37
1. INTRODUCTION ---------------------------------------------------------------------------------------------------------- 37 2. THE CATHAYSIA BASEMENT------------------------------------------------------------------------------------------- 39
2.1. Paleoproterozoic remnants in the Chencai and Wuyishan domains ------------------------------- 39 2.2 Mesoproterozoic rocks in the Hainan Island and in the Nanling domain -------------------------- 41 2.3 Evidences from inherited zircons ---------------------------------------------------------------------------- 42 2.4 The Yunkai domain --------------------------------------------------------------------------------------------- 43 2.5 Cathaysia subcontinental lithospheric mantle ------------------------------------------------------------ 44
3. ARCHITECTURE OF THE CATHAYSIA (META)CRATONIC AREA ---------------------------------------------------- 46 3.1 The Jiangnan (Sibao) orogen and the Yangtze-Cathaysia boundary ------------------------------ 46 3.2 An E-W boundary between N and S parts of W Cathaysia? ------------------------------------------ 48 3.3 The significance of the Zenghe-Dapu fault zone (ZDFZ) ---------------------------------------------- 49
4. THE JIANGNAN OROGEN ----------------------------------------------------------------------------------------------- 50 4.1. The accretionary Sibao orogen ----------------------------------------------------------------------------- 52 4.2. The Jinning event: an inverted proto-Nanhua rift? ----------------------------------------------------- 53 4.3 The ca.830 Ma granitoids and the age of the Jinning event ------------------------------------------ 54 4.4 Meaning of the Jinning cycle: an inverted proto-Nanhua rift? ---------------------------------------- 55
5. FROM THE NANHUA RIFT TO THE KWANGSIAN OROGEN --------------------------------------------------------- 56
Sommaire
6
5.1. The ca. 830 Ma episode -------------------------------------------------------------------------------------- 56 5.2. The failed Nanhua Rift----------------------------------------------------------------------------------------- 56
6. THE “SOUTH CHINA CALEDONIAN FOLD BELT”: KWANGSIAN OROGENY --------------------------------------- 58 7. THE INDOSINIAN EVENTS ---------------------------------------------------------------------------------------------- 63 8. THE YANSHANIAN EVENTS -------------------------------------------------------------------------------------------- 64 9. MAGMATISM DURING THE JURASSIC-CRETACEOUS PERIOD ----------------------------------------------------- 67
9.1 Introduction to the diagrams ---------------------------------------------------------------------------------- 67 9.2 The J1/2 period (200-165Ma) ---------------------------------------------------------------------------------- 68 9.3 The J3 period (165-150Ma) ----------------------------------------------------------------------------------- 69 9.4 The K1 period (150-110Ma) ---------------------------------------------------------------------------------- 71 9.5 The K2 period (110-70Ma) ------------------------------------------------------------------------------------ 73
APPENDIX A1 – COMPILATION OF DATING ANALYSES OF ROCKS FORMED BETWEEN 210 AND 60 MA IN THE
WESTERN CATHAYSIA BLOCK ------------------------------------------------------------------------------------------- 77 APPENDIX A2 - COMPILATION OF DATING ANALYSES OF ROCKS FORMED BETWEEN 210 AND 60 MA IN THE
EASTERN CATHAYSIA BLOCK -------------------------------------------------------------------------------------------- 78 APPENDIX B1 – COMPILATION OF WHOLE-ROCK ANALYSIS FROM THE J1/2 PERIOD IN THE CATHAYSIA AND
PLOTTED IN THE A-B AND (QBF)*3 DIAGRAMS (DEBON ET LEFORT, 1983; DE LA ROCHE ET AL., 1964) --- 79 APPENDIX B2 – COMPILATION OF WHOLE-ROCK ANALYSIS FROM THE J3 PERIOD IN THE CATHAYSIA AND
PLOTTED IN THE A-B AND (QBF)*3 DIAGRAMS (DEBON ET LEFORT, 1983; DE LA ROCHE ET AL., 1964) --- 80 APPENDIX B3 – COMPILATION OF WHOLE-ROCK ANALYSIS FROM THE K1 PERIOD IN THE CATHAYSIA AND
PLOTTED IN THE A-B AND (QBF)*3 DIAGRAMS (DEBON ET LEFORT, 1983; DE LA ROCHE ET AL., 1964) --- 81 APPENDIX B4 – COMPILATION OF WHOLE-ROCK ANALYSIS FROM THE K2 PERIOD IN THE WESTERN
CATHAYSIA AND PLOTTED IN THE A-B AND (QBF)*3 DIAGRAMS (DEBON ET LEFORT, 1983; DE LA ROCHE ET
AL., 1964) ------------------------------------------------------------------------------------------------------------------ 82 APPENDIX B5 – COMPILATION OF WHOLE-ROCK ANALYSIS FROM THE K2 PERIOD IN THE EASTERN
CATHAYSIA AND PLOTTED IN THE A-B AND (QBF)*3 DIAGRAMS (DEBON ET LEFORT, 1983; DE LA ROCHE ET
AL., 1964) ------------------------------------------------------------------------------------------------------------------ 83 APPENDIX C – WHOLE ROCK DATA COMPILED FROM THE LITERATURE AND USED IN APPENDIX B1 TO B5,
ORGANIZED BY PERIOD OF TIME. ---------------------------------------------------------------------------------------- 84 REFERENCES ------------------------------------------------------------------------------------------------------------ 105
PART 1 – PETROGRAPHY AND MINERAL GEOCHEMISTRY --------------------------------------------- 125
CHAPTER 2: DETAILED PARAGENESIS AND LI-MICA COMPOSITIONS AS RECORDERS OF THE MAGMATIC-HYDROTHERMAL EVOLUTION OF THE MAOPING W-SN DEPOSIT (JIANGXI, CHINA) ---------------------------------------------------------------------------------------------------------------------- 127
ABSTRACT ---------------------------------------------------------------------------------------------------------------- 127 1. INTRODUCTION -------------------------------------------------------------------------------------------------------- 128 2. GEOLOGICAL SETTING AND SAMPLING ---------------------------------------------------------------------------- 129
2.1. The southern Jiangxi W-Sn Metallogenic Province -------------------------------------------------- 129 2.2. The Maoping deposit ---------------------------------------------------------------------------------------- 132
Sommaire
7
2.3. Sampling -------------------------------------------------------------------------------------------------------- 134 3. ANALYTICAL METHODS ---------------------------------------------------------------------------------------------- 135 4. RESULTS --------------------------------------------------------------------------------------------------------------- 136
4.1. Paragenetic sequence -------------------------------------------------------------------------------------- 136 4.2. Composition of Li-micas ------------------------------------------------------------------------------------ 144
5. DISCUSSION ----------------------------------------------------------------------------------------------------------- 153 5.1. Magmatic-hydrothermal Li-mica trends ----------------------------------------------------------------- 153 5.2. Hydrothermal Li-mica trends: insights into fluid typology and mixing ---------------------------- 154 5.3. Interpretation of magma and fluid evolution ------------------------------------------------------------ 156 5.4. Temporal rather than spatial zoning --------------------------------------------------------------------- 157
6. CONCLUSION ---------------------------------------------------------------------------------------------------------- 158 REFERENCES ------------------------------------------------------------------------------------------------------------ 159
CHAPTER 3: THE ORE-FORMING MAGMATIC-HYDROTHERMAL SYSTEM OF THE PIAOTANG W-SN DEPOSIT (JIANGXI, CHINA) AS SEEN FROM LI-MICA GEOCHEMISTRY -------------------- 165
ABSTRACT ---------------------------------------------------------------------------------------------------------------- 165 1. INTRODUCTION -------------------------------------------------------------------------------------------------------- 166 2. GEOLOGICAL SETTING AND SAMPLING ---------------------------------------------------------------------------- 168
2.1 The southern Jiangxi Metallogenic Province ----------------------------------------------------------- 168 2.2 The Piaotang W-Sn deposit --------------------------------------------------------------------------------- 171
3. ANALYTICAL METHODS ---------------------------------------------------------------------------------------------- 173 4. PARAGENETIC SEQUENCE------------------------------------------------------------------------------------------- 175 5. COMPOSITION OF MICAS -------------------------------------------------------------------------------------------- 182
5.1 Major elements ------------------------------------------------------------------------------------------------- 182 5.2 Trace elements ------------------------------------------------------------------------------------------------ 187
6. COMPOSITION OF CHLORITES -------------------------------------------------------------------------------------- 191 7. DISCUSSION ----------------------------------------------------------------------------------------------------------- 194
7.1 Major elements in hydrothermal micas: evidence for fluid mixing --------------------------------- 194 7.2 Conditions of interpretation of trace element compositions ----------------------------------------- 195 7.3 Trace elements: characterization of fluid end-members --------------------------------------------- 197 7.4 Relationships with the ore-forming process ------------------------------------------------------------- 198 7.5 Comparison with published fluid inclusion studies ---------------------------------------------------- 199 7.6 Origin of the fluids --------------------------------------------------------------------------------------------- 200 7.7 Geothermometry implications ------------------------------------------------------------------------------ 201
8. IMPLICATIONS --------------------------------------------------------------------------------------------------------- 201 REFERENCES ------------------------------------------------------------------------------------------------------------ 203
PART 2 – FLUID INCLUSIONS --------------------------------------------------------------------------------------- 211
CHAPTER 4: MULTIPLE FLUIDS INVOLVED IN GRANITE-RELATED W-SN DEPOSITS FROM THE WORLD-CLASS JIANGXI PROVINCE (CHINA) ---------------------------------------------------------- 213
ABSTRACT ---------------------------------------------------------------------------------------------------------------- 213
Sommaire
8
1. INTRODUCTION -------------------------------------------------------------------------------------------------------- 214 2. GEOLOGICAL SETTINGS, PREVIOUS FLUID INCLUSION STUDIES AND SAMPLING ----------------------------- 216
2.1 The southern Jiangxi metallogenic province (Nanling Range) ------------------------------------- 216 2.2. Previous fluid inclusion studies in Sn-W deposits from the Nanling Range -------------------- 218 2.3. Sampling -------------------------------------------------------------------------------------------------------- 219
3. ANALYTICAL METHODS ---------------------------------------------------------------------------------------------- 227 3.1 Fluid inclusion petrography and microthermometry --------------------------------------------------- 227 3.2 Raman spectrometry ----------------------------------------------------------------------------------------- 229 3.3 LA-ICPMS analysis ------------------------------------------------------------------------------------------- 230 3.4 Isotopic measurements -------------------------------------------------------------------------------------- 231
4. RESULTS --------------------------------------------------------------------------------------------------------------- 233 4.1 Fluid inclusion petrography --------------------------------------------------------------------------------- 233 4.2 Microthermometry and Raman spectrometry data ---------------------------------------------------- 235 4.3 LA-ICPMS data ------------------------------------------------------------------------------------------------ 240 4.4 Oxygen and hydrogen stable isotopes data ------------------------------------------------------------ 244
5. DISCUSSION ----------------------------------------------------------------------------------------------------------- 246 5.1 Fluid identification and characterization------------------------------------------------------------------ 246 5.2 Nature and origin of fluids ----------------------------------------------------------------------------------- 249 5.3 Processes involved in W-Sn deposits -------------------------------------------------------------------- 251
6. CONCLUSION ---------------------------------------------------------------------------------------------------------- 253 REFERENCES ------------------------------------------------------------------------------------------------------------ 255
PART 3 – GEOCHRONOLOGY -------------------------------------------------------------------------------------- 265
CHAPTER 5 - MULTIPLE HYDROTHERMAL PULSES IN THE NANLING METALLOGENIC BELT: CONSTRAINTS FROM THE W-SN MAOPING DEPOSIT (JIANGXI, CHINA) --------------------------- 267
ABSTRACT ---------------------------------------------------------------------------------------------------------------- 267 KEYWORDS --------------------------------------------------------------------------------------------------------------- 268 1. INTRODUCTION -------------------------------------------------------------------------------------------------------- 268 2. GEOLOGICAL SETTING AND SAMPLING ---------------------------------------------------------------------------- 269
2.1 The Jiangxi metallogenic province ------------------------------------------------------------------------ 269 2.2 Sampling and description of the Maoping deposit ----------------------------------------------------- 273
3. ANALYTICAL METHODS ---------------------------------------------------------------------------------------------- 276 3.1 EMPA analysis ------------------------------------------------------------------------------------------------- 276 3.2 LA-ICPMS analysis ------------------------------------------------------------------------------------------- 276 3.3 40Ar/39Ar Fe-Li-micas dating --------------------------------------------------------------------------------- 277 3.4 U-Pb wolframite ID-TIMS dating --------------------------------------------------------------------------- 278 3.5 U-Th-Pb xenotime LA-ICPMS dating --------------------------------------------------------------------- 279
4. SAMPLE DESCRIPTIONS --------------------------------------------------------------------------------------------- 279 4.1 Fe-Li micas grains --------------------------------------------------------------------------------------------- 280 4.2 Wolframite grains ---------------------------------------------------------------------------------------------- 282
Sommaire
9
4.3 Xenotime grains ----------------------------------------------------------------------------------------------- 284 5. RESULTS --------------------------------------------------------------------------------------------------------------- 285
5.1 40Ar-39Ar Fe-Li-micas dating -------------------------------------------------------------------------------- 285 5.2 U-Pb wolframite dating --------------------------------------------------------------------------------------- 291
6. DISCUSSION ----------------------------------------------------------------------------------------------------------- 297 7. CONCLUSION ---------------------------------------------------------------------------------------------------------- 303 REFERENCES ------------------------------------------------------------------------------------------------------------ 305 APPENDIX A – DETAILED ANALITYCAL 40AR-39AR DATING PROCEDURE ON FE-LI-MICAS --------------------- 317 APPENDIX B – LA-ICPMS ANALYSES OF WOLFRAMITE SAMPLES ----------------------------------------------- 319 APPENDIX C – BACK-SCATTERED ELECTRON IMAGES OF XENOTIME EXTRACTED FROM STAGE VI FLUORITE
OF THE MAOPING DEPOSIT. CIRCLES INDICATE LOCATION OF ISOTOPIC U-PB-TH ANALYSIS. --------------- 320 APPENDIX D – TABLE OF DATING DATA FROM THE LITERATURE ON W-SN VEINS IN THE CATHAYSIA ------- 321 APPENDIX E – MAP OF THE W-SN DEPOSITS ASSOCIATED WITH W-SN VEIN DATING IN THE CATHAYSIA
(DETAILS IN APPENDIX D AND FIGURE 68) --------------------------------------------------------------------------- 323
CHAPTER 6 – NEW COLUMBO-TANTALITE REFERENCE MATERIALS FOR SIMS U-PB GEOCHRONOLOGY ---------------------------------------------------------------------------------------------------- 325
ABSTRACT ---------------------------------------------------------------------------------------------------------------- 325 KEYWORDS --------------------------------------------------------------------------------------------------------------- 326 1. INTRODUCTION -------------------------------------------------------------------------------------------------------- 326 2. SAMPLE LOCATION --------------------------------------------------------------------------------------------------- 327
2.1 CT and ISSIA, Ivory Coast ---------------------------------------------------------------------------------- 327 2.2 Rongi and Buranga, Rwanda ------------------------------------------------------------------------------- 328 2.4 NT-2 and A-1, Altai -------------------------------------------------------------------------------------------- 328 2.5 NP2, China ------------------------------------------------------------------------------------------------------ 328 2.6 CC1716, France ----------------------------------------------------------------------------------------------- 328
3. ANALYTICAL TECHNIQUES ------------------------------------------------------------------------------------------- 328 3.1 EPMA------------------------------------------------------------------------------------------------------------- 329 3.2 TIMS -------------------------------------------------------------------------------------------------------------- 329 3.3 SIMS -------------------------------------------------------------------------------------------------------------- 330
4. RESULTS AND DISCUSSION ----------------------------------------------------------------------------------------- 331 4.1 BSE imaging and reflected light --------------------------------------------------------------------------- 331 4.2 EMPA geochemistry ------------------------------------------------------------------------------------------ 331 4.3 U-Pb ID-TIMS dating ----------------------------------------------------------------------------------------- 335 4.4 SIMS dating and calibration --------------------------------------------------------------------------------- 345
5. CONCLUSION ---------------------------------------------------------------------------------------------------------- 349 REFERENCES ------------------------------------------------------------------------------------------------------------ 351 APPENDIX A – EMPA ANALYTICAL RESULTS FOR COLUMBO-TANTALITES -------------------------------------- 353 APPENDIX B – SIMS ANALYTICAL RESULTS FOR COLUMBO-TANTALITES. DATA IN ITALIC WERE NOT USED
FOR AGE CALCULATION. ------------------------------------------------------------------------------------------------ 359
Sommaire
10
GENERAL DISCUSSION, CONCLUSIONS AND PERSPECTIVES ---------------------------------------- 369
1. INTEGRATED MODEL FOR W-SN HYDROTHERMAL DEPOSITS -------------------------------------------------- 369 2. THE W-SN JURASSIC-CRETACEOUS EVENT IN THE NANLING RANGE ---------------------------------------- 372
2.1 The timing of W-Sn mineralizations ----------------------------------------------------------------------- 372 2.2 Why is it located in the Nanling Range? ----------------------------------------------------------------- 374
3. COMPARISON TO THE FRENCH MASSIF CENTRAL, AN EXAMPLE FROM THE VARISCAN BELT ------------- 376 2.1 Geodynamic settings ----------------------------------------------------------------------------------------- 376 2.2 W-Sn deposits model ----------------------------------------------------------------------------------------- 377
4. CONCLUSIONS -------------------------------------------------------------------------------------------------------- 379 5. PERSPECTIVES ------------------------------------------------------------------------------------------------------- 381 REFERENCES ------------------------------------------------------------------------------------------------------------ 383
LIST OF FIGURES ------------------------------------------------------------------------------------------------------- 387
LIST OF TABLES -------------------------------------------------------------------------------------------------------- 403
Remerciements
11
Remerciements
A la lumière de ces trois ans de thèse au sein du laboratoire GeoRessources, je tiens à
remercier un grand nombre de personnes qui m’ont apporté leur soutien professionnel et/ou
personnel, tout au long de ce périple qui restera gravé dans ma mémoire.
Tout ceci a commencé lors de mon stage de fin d’étude qui m’a conduite dans ce laboratoire
sous la supervision de Michel Cuney et Julien Mercadier. Merci à eux d’avoir pris le temps de
m’introduire au monde de la recherche, ce stage a été l’élément déclencheur qui m’a conduite
à ce qui fut une formidable expérience de trois ans.
Je remercie tout particulièrement Julien Mercadier qui a été le leader de ce projet de thèse,
qui m’a soutenu durant cette thèse, qui m’a poussé dans l’espoir de devenir un jour chercheuse
et qui a monté la collaboration avec le BRGM au travers des financeurs Carnot ICEEL et
BRGM, que je remercie également. Cette collaboration m’a notamment permis de rencontrer
Nicolas Charles qui fut mon superviseur au sein du BRGM. Merci à toi Nicolas pour ta bonne
humeur constante, ton soutien et les fous rires en Chine ! J’espère que cette collaboration
perdurera. Je remercie d’ailleurs l’ensemble des collaborateurs chinois qui nous ont permis de
nous rendre en Chine pour cette expérience inoubliable : Ru-Cheng Wang, Xu-Dong Che et
Zeying Zhu. Enfin, je te tiens aussi à remercier Marc-Yves Lespinasse qui a accepté de devenir
mon directeur de thèse et a ainsi rendu ce projet possible.
Durant cette thèse, j’ai eu le privilège de pouvoir satisfaire ma curiosité et de développer des
aspects scientifiques divers qui m’ont amené à voyager et rencontrer de nombreux chercheurs
qui m’ont suivie, soutenue et appris beaucoup, merci à vous. Parmi eux, j’aimerais notamment
remercier Christian Marignac, Antonin Richard et Rolf Romer, qui ont pris le temps de
m’enseigner une partie de leur savoir. Je vous suis très reconnaissante. Travailler avec vous
fut un plaisir et une superbe expérience. Je m’attacherai à conserver au mieux la rigueur
scientifique que vous avez su m’enseigner.
D’autre part, je remercie grandement l’ensemble de mes stagiaires : Thomas Tabary, Renaud
Mulot, Alexis Locatelli et Simon Hector pour m’avoir épaulé durant cette thèse et avoir fourni
un travail de qualité qui m’a permis d’avancer.
Je tiens aussi à remercier l’ensemble des chercheurs et co-auteurs de ces chapitres pour leur
aide et leur implication, toutes les personnes avec qui j’ai travaillé au SCMEM, au CRPG mais
aussi à GeoRessources et qui m’ont notamment beaucoup aidé d’un point de vue analytique.
En particulier, je tiens à remercier : Christian Marignac, Nicolas Charles, Ru-Cheng Wang,
Julien Mercadier, Michel Cuney, Antonin Richard, Marc-Yves Lespinasse, Alexandre
Tarantola, Kalin Kouzmanov, Torsten Vennemann, Laurent Bailly, Rolf Romer, Marc poujol,
Remerciements
12
Matthieu Harlaux, Alfred Camacho, Johan Villeneuve, Etienne Deloule, Stijn Dewaele, Xudong
Che, Marieke Van Lichtervelde, Marie-Camille Caumon et Chantal Peiffert.
Enfin, je remercie l’ensemble des membres de mon jury de thèse pour avoir pris le temps de
lire ce manuscrit et de s’être déplacé pour ce qui a été un grand moment pour moi. Je tiens
donc à remercier David Dolejs, Philippe Boulvais, Marieke Van Lichtervelde, Nicolas Charles,
Gaston Giuliani, Rolf Romer, Stanislas Sizaret et Christian Marignac.
Sur une pointe plus personnelle, je tiens à remercier l’ensemble des thésards et post-doc qui
ont croisé ma route tout au long de cette aventure. Je ne le dirai jamais assez, mais cette
réussite je vous la dois aussi. Vous avez été là dans les bons et les mauvais moments, toujours
à l’écoute de mes blagues douteuses et de mes coups de gueule. C’est un plaisir de venir
chaque jour vous retrouver au labo et partager ces journées avec vous. C’est cette ambiance
qui m’a permis de tenir et de me tirer vers le haut. Je n’aurais jamais pensé pouvoir vivre une
telle expérience. Vous êtes plus que mes collègues, vous êtes mes amis.
Parmi eux j’aimerais notamment remercier Roland Salardon, qui m’a faites mourir de rire aux
pauses clopes avec ses histoires à la « père castor » ; Matthieu Harlaux, avec qui j’ai passé
des moments difficiles mais aussi de rire à G’nève et en Chine (j’espère que la pipe va bien) ;
Marion Grosjean, pour avoir marqué ma voiture à vie (elle va bien !) ; Maïa Reilh, pour avoir
fait concurrence à ma touffe ; Raphael Vasseur, pour ta sagesse de dandy et nos discussions
moto ; Héloïse Verron, pour avoir partagé la garde de notre petite Chewie ; Joséphine Gigon,
pour sa folie qui me fait toujours autant rire et sa bonne humeur constante ; Maxime Dargent,
pour sa patience à chaque fois que je viens de le déranger dans son bureau alors qu’il n’a rien
demandé ; Benoit Quesnel, qui a toujours une bonne histoire à raconter et notamment celle
de son tatouage ; Yoram Teitler, pour avoir proposé mainte fois de venir se les cailler pour
ramasser des champignons (je viendrai un jour !) ; Eleonora Carocci, pour sa touche exotique
qui sait toujours faire rire ; et bien d’autres…
Je tiens aussi particulièrement à remercier mes co-bureaux Guillaume Barré et Christophe
Scheffer qui m’ont soutenue et supportée pendant ce long périple. J’ai passé de très bons
moments de rigolade avec vous. D’autre part, merci d’avoir accepté « mon œuvre » au sein
de votre bureau, un travail de longue haleine qui ne s’est toujours pas écroulé ! Bientôt trois
cent boites de café, un reflet de cette période riche en émotions !
Un merci tout particulier à mes deux compagnons de rédaction et de soutenance : François
Turlin et Pierre Martz (#Chaton). Cette dernière ligne droite a été très difficile mais on a réussi
ensemble et je suis contente d’avoir vécu cette expérience avec vous ! Je n’aurais jamais été
capable de pondre ça sans vous, ça ne fait aucun doute. Vous êtes deux personnes que
j’apprécie énormément et je n’oublierai jamais ces moments que nous avons passés
Remerciements
13
ensemble. Je n’oublierai pas les craquages et blagues douteuses de fin soirée en bas de la
3B, les diners à la cafet’ avec l’ensemble de la gamme de plats à rechauffer Super U, les
cafetières lancées la nuit, les parties de cartes, les kinder pingui, les coups de gueules, les
rush, les fous rires, les répliques et chansons cultes, les angoisses et bien d’autres choses qui
sont maintenant de bons souvenirs.
Enfin, merci à Julien Bonnet, mon pilier durant ces trois ans. Tu as su m’écouter tout au long
de cette thèse et me réconforter lorsqu’il le fallait. J’ai eu la chance de te connaitre lors de
cette thèse et cette amitié restera ! Merci pour avoir passé environ une journée sur deux dans
mon salon à me faire découvrir le terroir, à m’avoir faites rire, à avoir partagé des choses
douteuses, mais aussi pour avoir regardé des navets avec moi et m’avoir accompagnée aux
quatre coins du monde ! Une magnifique rencontre.
Merci à tous.

Introduction
15
Introduction
Cette thèse fait partie d’un projet collaboratif entre l’Université de Lorraine et le Bureau
des Ressources Géologiques et Minières (BRGM). Ces deux laboratoires ont dédiés de
nombreuses années à l’étude des gisements à tungstène (W)-étain (Sn) en Europe (Massif
Central, Panasqueira, les Cornouailles…) et dans le monde. Cette thèse a pour but de
proposer de nouvelles contraintes et outils pour la compréhension de ces gisements à travers
l’étude de la province la plus riche en W-Sn au monde : la province de Jiangxi (Chine), en
collaboration avec le State Key Laboratory for Mineral Deposits Research (Nanjing, China).
Afin de répondre à cette problématique, cette thèse de doctorat comporte quatre objectifs
scientifiques :
(i) Le premier objectif est de définir les aspects pétrographiques et minéralogiques de
ces gisements afin de combler le manque d’informations présentées dans la littérature. La
réalisation d’une étude pétrographique détaillée est cruciale pour la compréhension de la
formation de ces gisements et un préalable à toute étude plus approfondie.
(ii) Le deuxième objectif concerne l’identification de sources possiblement impliquées
dans les stades pré-, syn- et post-minéralisation. Les micas sont connus pour être de bons
traceurs de processus magmatiques et de bons transporteurs de métaux rares tels que le W,
Sn, Nb et Ta. Les micas sont ubiquistes dans les gisements à W-Sn et cristallisent
généralement sous forme de plusieurs générations successives et représentent donc un
marqueur potentiellement de processus hydrothermaux et de sources pouvant ensuite être
liés à une étude d’inclusions fluides.
(iii) Le troisième objectif est de caractériser la nature des réservoirs fluides impliqués
dans la formation des gisements à W-Sn chinois. La nature des fluides minéralisateurs est
encore débattue dans la littérature mondiale. L’implication évidente d’un fluide météorique
tend à cacher l’information concernant les fluides porteurs de métaux qui pourraient être de
Introduction
16
nature magmatique, directement exsolvés d’un magma granitique ou externes, lixiviant le
granite sous-jacent.
(iv) Le quatrième objectif est de définir l’âge de mise en place des minéralisations
hydrothermales à W-Sn dans le sud de la province du Jiangxi. Bien que de nombreuses études
de datation ont été effectuées à ce jour, les analyses de datation directe sur les minéraux
porteurs de minéralisation restent rares voire inexistantes sur wolframite. La complexité de la
paragénèse exposée associée à de multiples impulsions fluides pouvant altérer les systèmes
isotopiques met en avant la nécessité d’effectuer des études de datations dites « directes ».
L’absence de standards appropriés à W (wolframite), Sn (cassitérite) et Nb-Ta (columbo-
tantalite) pour des méthodes de datation in situ soulève la nécessité de développer de
nouveaux standards afin de valoriser les méthodes de datation directes sur des phases
minéralogiques de tailles réduites.
Ces objectifs ont pour but de répondre à trois grandes questions : (i) Quels sont les
processus responsables de la mise en place ces gisements géants ?, (ii) Pourquoi ces
gisements se sont-ils mis en place spécifiquement dans cette région et à cette période ? et,
(iii) Pourquoi cette région, en comparaison à de nombreuses autres régions à W-Sn, a-t-elle
été si productive ?
Ce manuscrit de thèse s’organise en trois parties, subdivisées en six chapitres rédigés
comme des articles indépendants.
Le premier chapitre (Chapter 1) n’a été incorporé dans aucune de ces grandes parties.
Ce chapitre a pour but de proposer une revue du contexte géologique du Bloc Cathaysia où
sont situés les deux gisements étudiés dans cette thèse (Maoping et Piaotang).Ce chapitre
donne une vue simplifiée des évènements géodynamiques successifs observés dans le Bloc
Cathaysia jusqu’à l’arrivée des évènements Yanshanien (Jurassique-Crétacé) où la majeure
partie des granites associés à des gisements à W-Sn sont mis en place. Ce chapitre offre
aussi une compilation et interprétation des données géochimiques sur roches totales
effectuées sur les formations magmatiques de la période yanshanienne. Ce chapitre tend à
Introduction
17
fournir une vision complémentaire à l’ensemble des chapitres suivants qui sont concentrés sur
l’étude des veines minéralisées.
La première partie de ce manuscrit est dédiée à des études de pétrographie détaillées
et de géochimie des micas lithinifères comme traceurs des processus hydrothermaux à travers
l’étude des gisements de Maoping (Chapter 2) et Piaotang (Chapter 3). L’objectif est d’utiliser
les micas lithinifères comme marqueurs des processus hydrothermaux et d’interpréter les
différents réservoirs fluides associés à l’évolution de leurs compositions chimiques au cours
du temps. Les inclusions fluides peuvent parfois être difficiles à observer et caractériser. Ces
deux chapitres ont pour but de fournir une seconde approche d’identification des fluides
impliqués dans la formation de ces gisements.
La deuxième partie de ce manuscrit se concentre sur l’étude d’inclusions fluides sur
les deux gisements d’intérêt (Chapter 4). Ce chapitre présente les cas similaires du gisement
de Maoping et Piaotang comme représentatifs de la dynamique des fluides régionaux lors de
leur mise en place. Une étude intégrée pétrographique, géochimique et isotopique a permis
de caractériser de multiples fluides impliqués dans la formation de ces gisements polyphasés
complexes. Les multiples approches de ce chapitre ont été effectuées en collaboration avec
le Mineral Resources and Geofluids laboratory (SSTE-UNIGE Geneva, Switzerland), le
Institute of Earth Surface Dynamics (IDYST Lausanne, Switzerland) et le Centre de
Recherches Pétrographiques et Géochimiques (CRPG Nancy, France).
La troisième partie de ce manuscrit est dédiée au développement de méthodes de
datation et leur application. Le premier chapitre de cette partie (Chapter 5) se concentre sur
l’application de méthodes de datation multiples au cas du gisement de Maoping : 40Ar-39Ar sur
micas, U-Pb sur xénotime et U-Pb sur wolframite, le but étant de documenter l’agencement
dans le temps des multiples circulations de fluides identifiées dans les chapitres précédents.
Ce chapitre est le fruit de collaborations avec le Department of Geological Sciences of the
University of Manitoba (Canada), Géosciences Rennes (France) et le German Research
Centre for Geosciences (GFZ Potsdam, Germany). Le second chapitre (Chapter 6) présente
Introduction
18
le développement de standards de columbo-tantalite pour datation U-Pb in situ. Pour cela des
collaborations ont été mises en place pour les différents aspects analytiques avec le Centre
de Recherches Pétrographiques et Géochimiques (CRPG Nancy, France) et le German
Research Centre for Geosciences (GFZ Potsdam, Germany). Les échantillons fournis pour
cette étude ont été collectés en collaboration avec le Royal Museum of Central Africa
(Tervuren, Belgium), le State Key Laboratory for Mineral Deposits Research (Nanjing, China),
le Bureau pour la Recherche Géologique et Minière (BRGM Orléans, France) et le German
Research Centre for Geosciences (GFZ Potsdam, Germany).
Ce manuscrit développe ensuite une discussion basée sur les trois grandes questions
posées précédemment. Cette discussion reprend les différents modèles de la littérature afin
de les discuter à la lumière des nouveaux résultats de cette thèse. Elle se veut indépendante
des différents chapitres et tend à raccrocher cette étude à une réflexion plus large qui est celle
de la formation des gisements à W-Sn.
Etat de l’art
19
Etat de l’art
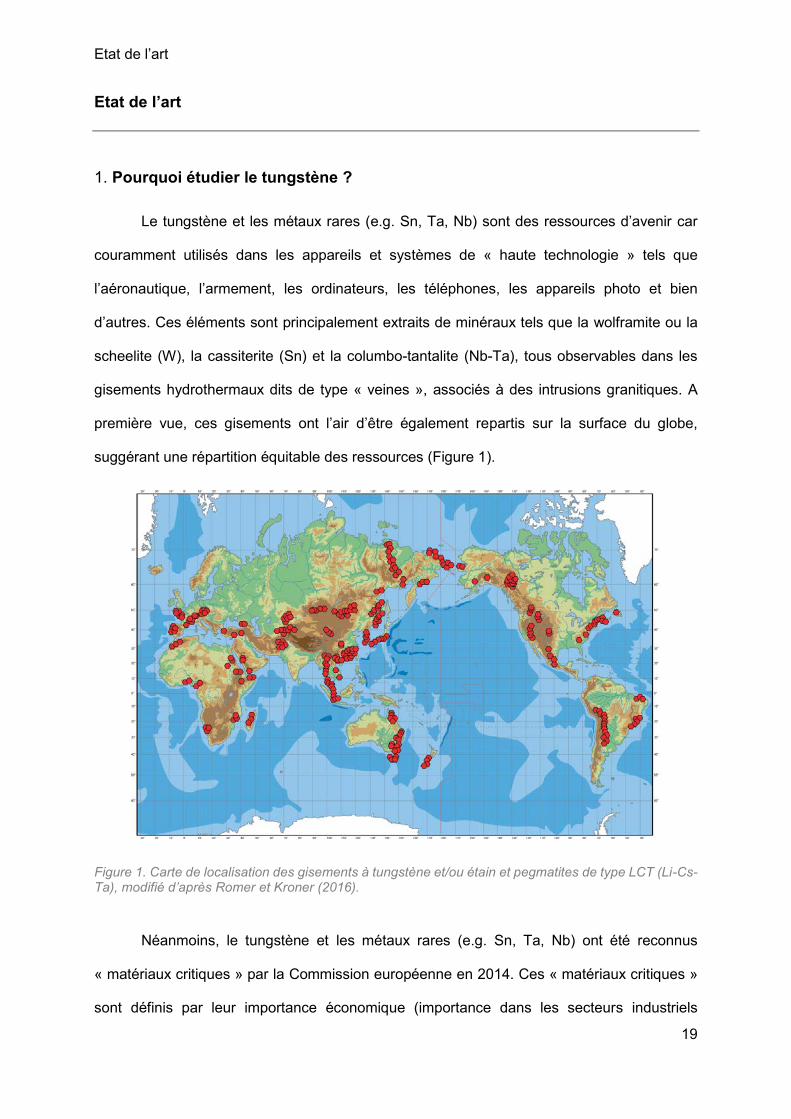
1. Pourquoi étudier le tungstène ?
Le tungstène et les métaux rares (e.g. Sn, Ta, Nb) sont des ressources d’avenir car
couramment utilisés dans les appareils et systèmes de « haute technologie » tels que
l’aéronautique, l’armement, les ordinateurs, les téléphones, les appareils photo et bien
d’autres. Ces éléments sont principalement extraits de minéraux tels que la wolframite ou la
scheelite (W), la cassiterite (Sn) et la columbo-tantalite (Nb-Ta), tous observables dans les
gisements hydrothermaux dits de type « veines », associés à des intrusions granitiques. A
première vue, ces gisements ont l’air d’être également repartis sur la surface du globe,
suggérant une répartition équitable des ressources (Figure 1).
Figure 1. Carte de localisation des gisements à tungstène et/ou étain et pegmatites de type LCT (Li-Cs-Ta), modifié d’après Romer et Kroner (2016).
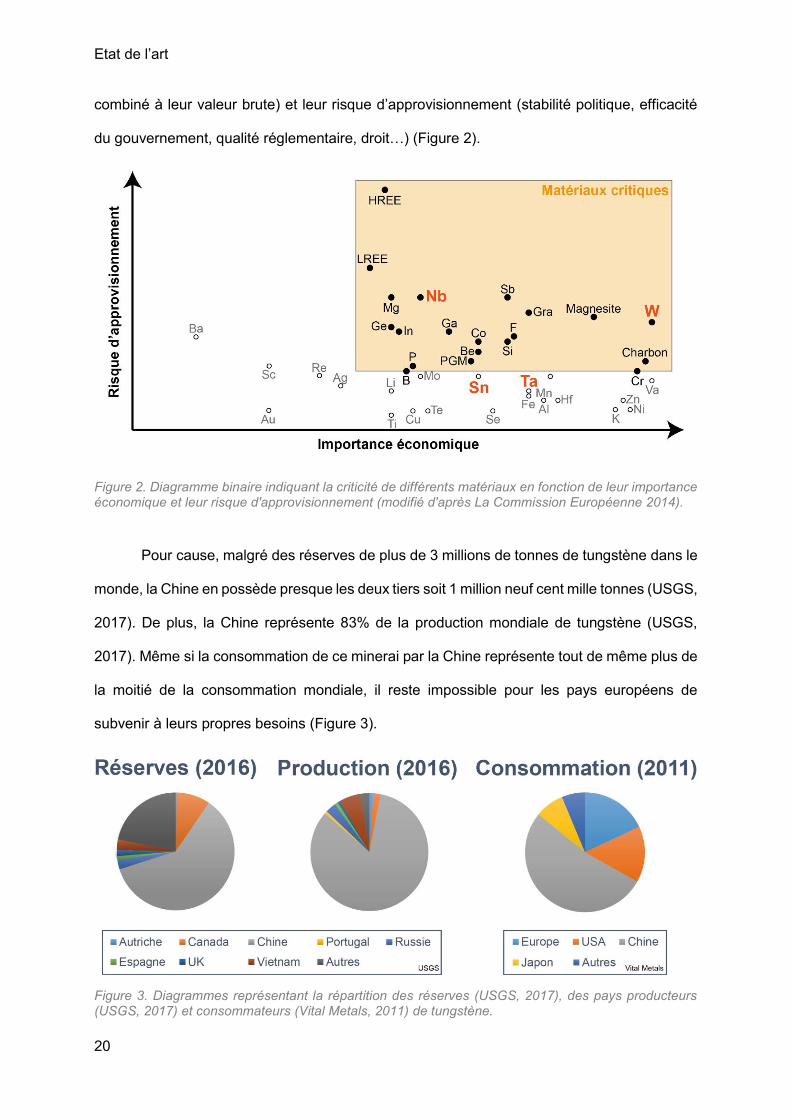
Néanmoins, le tungstène et les métaux rares (e.g. Sn, Ta, Nb) ont été reconnus
« matériaux critiques » par la Commission européenne en 2014. Ces « matériaux critiques »
sont définis par leur importance économique (importance dans les secteurs industriels
Etat de l’art
20
combiné à leur valeur brute) et leur risque d’approvisionnement (stabilité politique, efficacité
du gouvernement, qualité réglementaire, droit…) (Figure 2).
Figure 2. Diagramme binaire indiquant la criticité de différents matériaux en fonction de leur importance économique et leur risque d'approvisionnement (modifié d'après La Commission Européenne 2014).
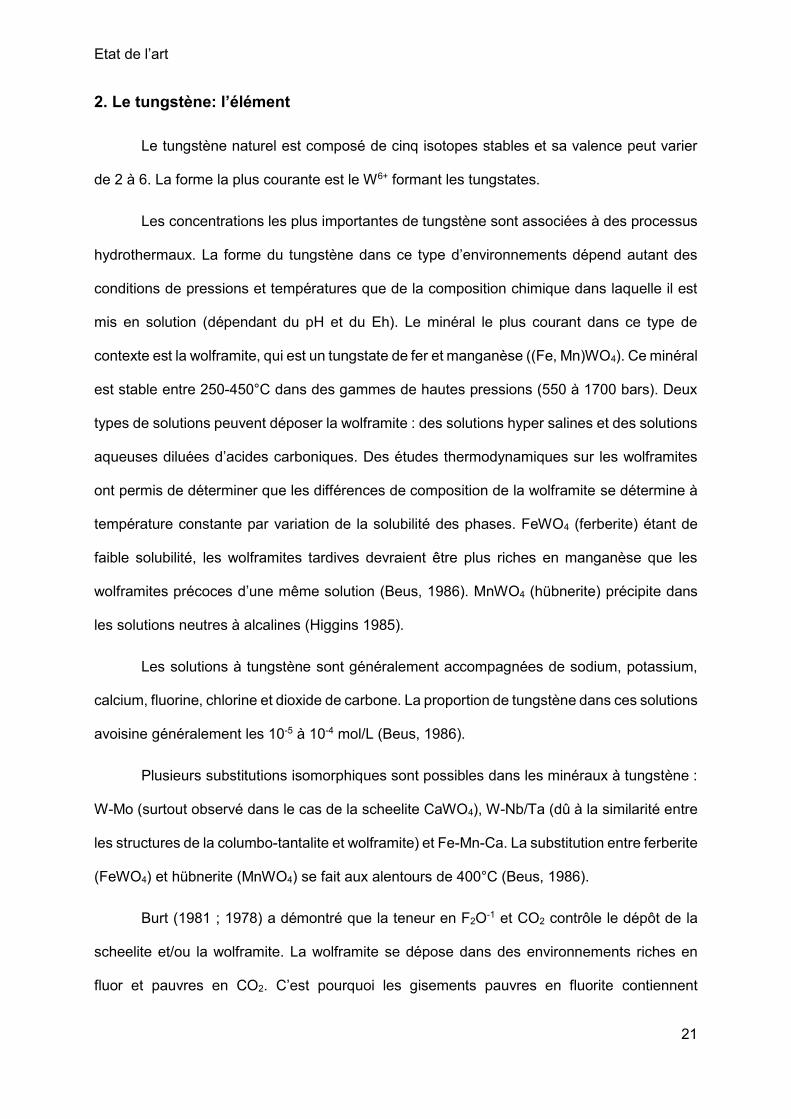
Pour cause, malgré des réserves de plus de 3 millions de tonnes de tungstène dans le
monde, la Chine en possède presque les deux tiers soit 1 million neuf cent mille tonnes (USGS,
2017). De plus, la Chine représente 83% de la production mondiale de tungstène (USGS,
2017). Même si la consommation de ce minerai par la Chine représente tout de même plus de
la moitié de la consommation mondiale, il reste impossible pour les pays européens de
subvenir à leurs propres besoins (Figure 3).
Figure 3. Diagrammes représentant la répartition des réserves (USGS, 2017), des pays producteurs (USGS, 2017) et consommateurs (Vital Metals, 2011) de tungstène.
Etat de l’art
21
2. Le tungstène: l’élément
Le tungstène naturel est composé de cinq isotopes stables et sa valence peut varier
de 2 à 6. La forme la plus courante est le W6+ formant les tungstates.
Les concentrations les plus importantes de tungstène sont associées à des processus
hydrothermaux. La forme du tungstène dans ce type d’environnements dépend autant des
conditions de pressions et températures que de la composition chimique dans laquelle il est
mis en solution (dépendant du pH et du Eh). Le minéral le plus courant dans ce type de
contexte est la wolframite, qui est un tungstate de fer et manganèse ((Fe, Mn)WO4). Ce minéral
est stable entre 250-450°C dans des gammes de hautes pressions (550 à 1700 bars). Deux
types de solutions peuvent déposer la wolframite : des solutions hyper salines et des solutions
aqueuses diluées d’acides carboniques. Des études thermodynamiques sur les wolframites
ont permis de déterminer que les différences de composition de la wolframite se détermine à
température constante par variation de la solubilité des phases. FeWO4 (ferberite) étant de
faible solubilité, les wolframites tardives devraient être plus riches en manganèse que les
wolframites précoces d’une même solution (Beus, 1986). MnWO4 (hübnerite) précipite dans
les solutions neutres à alcalines (Higgins 1985).
Les solutions à tungstène sont généralement accompagnées de sodium, potassium,
calcium, fluorine, chlorine et dioxide de carbone. La proportion de tungstène dans ces solutions
avoisine généralement les 10-5 à 10-4 mol/L (Beus, 1986).
Plusieurs substitutions isomorphiques sont possibles dans les minéraux à tungstène :
W-Mo (surtout observé dans le cas de la scheelite CaWO4), W-Nb/Ta (dû à la similarité entre
les structures de la columbo-tantalite et wolframite) et Fe-Mn-Ca. La substitution entre ferberite
(FeWO4) et hübnerite (MnWO4) se fait aux alentours de 400°C (Beus, 1986).
Burt (1981 ; 1978) a démontré que la teneur en F2O-1 et CO2 contrôle le dépôt de la
scheelite et/ou la wolframite. La wolframite se dépose dans des environnements riches en
fluor et pauvres en CO2. C’est pourquoi les gisements pauvres en fluorite contiennent
Etat de l’art
22
préférentiellement de la scheelite. La wolframite, bien que premier tungstate à cristalliser, est
rapidement transformée en scheelite lors de l’arrivée de carbonates (Higgins 1985) tel que :
FeWO4 + CaCO3 = CaWO4 + FeCO3
Le coefficient de partage du tungstène entre le magma et la phase fluide n’est pas bien
contraint. Néanmoins, quelques expériences ont permis de déterminer un faible coefficient de
partage d’environ 1 (Manning et Henderson, 1984 ; Keppler et Wyllie, 1991).
3. Les gisements à W-Sn : cas des gisements périgranitiques de type « veines »
3.1. Morphologie
La plupart des gisements à W-Sn sont régulièrement associés à des intrusions
magmatiques de type felsiques qui sont généralement interprétées comme étant la source de
ces métaux (Romer and Kroner, 2016). Une grande variété de gisements à W-Sn ont été
identifiées par de nombreux auteurs : les gisements disséminés de type greisen, les skarns,
les gisements de type veines (qui sont au centre de cette étude) et moins communément les
gisements de type porphyre et pegmatitiques (Romer and Kroner, 2016). Ces différents types
dépendent de l’évolution du magma granitique associé, de la profondeur de mise en place de
celui-ci, de l’encaissant, du contrôle structural régional permettant la circulation de magmas et
de la nature et l’évolution de fluides hydrothermaux au sein du système ainsi que leurs possible
interactions avec l’encaissant (Romer and Kroner, 2016).
Au niveau des gisements de type « veines », les intrusions sont décrites comme
multiphasées et enrichies en éléments incompatibles (dans les plus récentes et plus petites).
La morphologie de ces structures dépend des conditions locales de perméabilité et du rapport
entre la pression du fluide générée par le magma et la pression lithostatique. Ces paramètres
permettent de passer de conditions de tectonique radiaire, au sommet d’une intrusion pour les
gîtes précoces, à des contraintes régionales pour les plus tardifs (Jébrak et Marcoux, 2008)
(Figure 4).
Etat de l’art
23
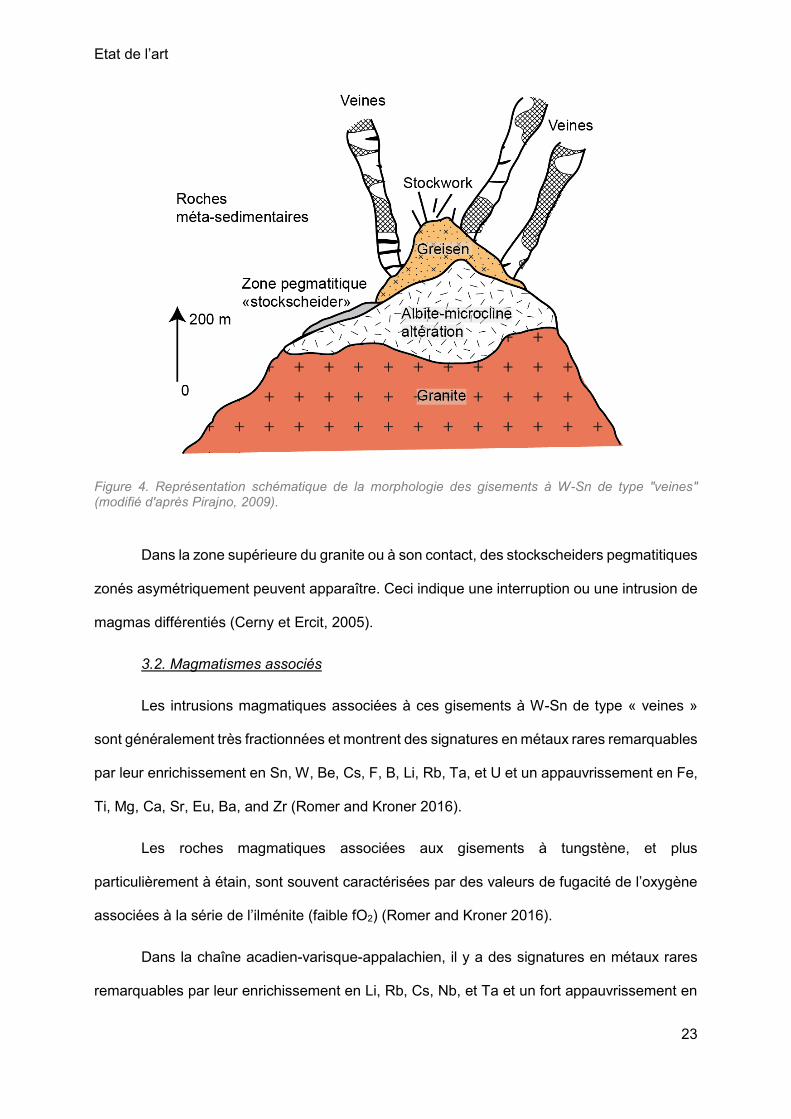
Figure 4. Représentation schématique de la morphologie des gisements à W-Sn de type "veines" (modifié d'après Pirajno, 2009).
Dans la zone supérieure du granite ou à son contact, des stockscheiders pegmatitiques
zonés asymétriquement peuvent apparaître. Ceci indique une interruption ou une intrusion de
magmas différentiés (Cerny et Ercit, 2005).
3.2. Magmatismes associés
Les intrusions magmatiques associées à ces gisements à W-Sn de type « veines »
sont généralement très fractionnées et montrent des signatures en métaux rares remarquables
par leur enrichissement en Sn, W, Be, Cs, F, B, Li, Rb, Ta, et U et un appauvrissement en Fe,
Ti, Mg, Ca, Sr, Eu, Ba, and Zr (Romer and Kroner 2016).
Les roches magmatiques associées aux gisements à tungstène, et plus
particulièrement à étain, sont souvent caractérisées par des valeurs de fugacité de l’oxygène
associées à la série de l’ilménite (faible fO2) (Romer and Kroner 2016).
Dans la chaîne acadien-varisque-appalachien, il y a des signatures en métaux rares
remarquables par leur enrichissement en Li, Rb, Cs, Nb, et Ta et un fort appauvrissement en
Etat de l’art
24
Ca, Sr, and Ba (Romer and Kroner 2016). Ces signatures peuvent être obtenues par une
cristallisation fractionnée extrême. Néanmoins, dans le cas d’une cristallisation fractionnée
moins poussée, ce type de signature peut être observée car héritée du protolithe. Par exemple,
une altération extrême peut produire des enrichissements résiduels similaires (Romer and
Kroner 2016).
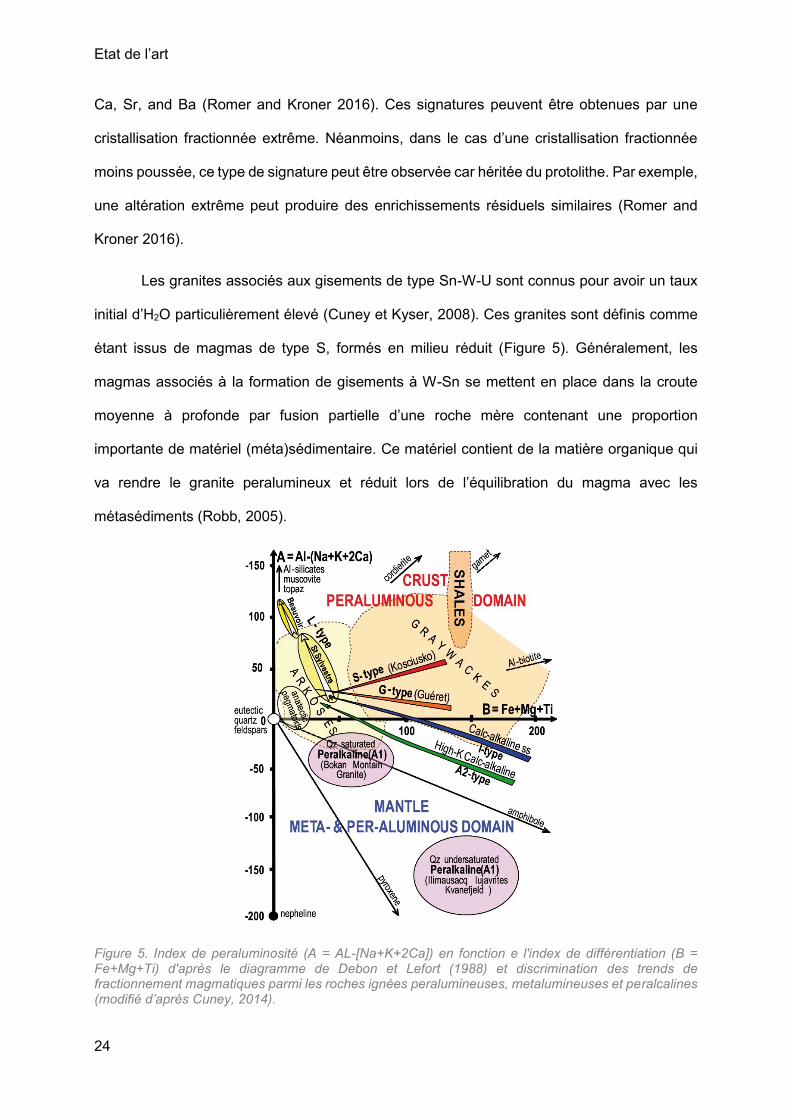
Les granites associés aux gisements de type Sn-W-U sont connus pour avoir un taux
initial d’H2O particulièrement élevé (Cuney et Kyser, 2008). Ces granites sont définis comme
étant issus de magmas de type S, formés en milieu réduit (Figure 5). Généralement, les
magmas associés à la formation de gisements à W-Sn se mettent en place dans la croute
moyenne à profonde par fusion partielle d’une roche mère contenant une proportion
importante de matériel (méta)sédimentaire. Ce matériel contient de la matière organique qui
va rendre le granite peralumineux et réduit lors de l’équilibration du magma avec les
métasédiments (Robb, 2005).
Figure 5. Index de peraluminosité (A = AL-[Na+K+2Ca]) en fonction e l'index de différentiation (B = Fe+Mg+Ti) d'après le diagramme de Debon et Lefort (1988) et discrimination des trends de fractionnement magmatiques parmi les roches ignées peralumineuses, metalumineuses et peralcalines (modifié d’après Cuney, 2014).
Etat de l’art
25
Le tungstène se comporte, en milieu réduit (magmas de type S), comme un élément
incompatible. Par conséquent, sa proportion augmente dans le magma résiduel lors du
processus de cristallisation fractionnée. Le tungstène sera donc associé à des magmas très
différenciés (Robb, 2005).
Les altérations sont dans ce type de contexte sont diverses. La greisenification, par
exemple, indique une métasomatose à potassium et lithium du sommet du système (Jébrak
et Marcoux, 2008).
3.3. Les veines
Généralement, les minéralisations à W-Sn sont associées à un enrichissement en
éléments lithophiles de type Ta, Li, B, Be, In, Ge, et Ga (Romer et Kroner 2016).
Les magmas saturés en eau se situent au sommet des intrusions granitiques. Lorsque
le magma devient trop saturé, une exsolution de fluides aqueux se produit, formant une
nouvelle phase plus différenciée. Le plus souvent, la percolation de ces fluides chauds à
travers les fractures entraîne la formation de veines de quartz potentiellement minéralisées
(Robb, 2005). Dans le cas d’un fluide riche en chlore, Cu, Mo, Sn et W vont alors
préférentiellement dans la phase fluide. Durant cette transition magmatique-hydrothermale,
les fluides précoces sont généralement aqueux et circulent dans des conditions allant de 400
à 600°C et de 500 à 600 bars. Les filons sont alors remplis par des pulsations successives de
fluides (Jébrak et Marcoux, 2008). Les fluides fluorés ont tendance à plus facilement se mêler
aux magmas silicatés qu’aux fluides aqueux et par conséquent, le fluor se présente rarement
comme un agent complexant pour les métaux dans la phase aqueuse.
3.4. Modèle général de génèse
Les premiers modèles établis furent en majorité basés sur des contextes de subduction
d’une plaque océanique sous une plaque continentale et discutaient de la distribution des
intrusions à métaux vis-à-vis de leur distance à la fosse (profondeur de fusion de la croute
subductée et/ou angle de subduction) interprétant que les gisements à W-Sn étaient corrélés
Etat de l’art
26
à des subductions « plates » (Romer et Kroner 2016). Le point commun à ces modèles est
que la distribution des gisements est strictement dépendante de la zone de subduction, la
croute océanique subductée représentant la source ultime des métaux et le manteau servant
de moteur thermique faisant fondre la croute. Ce type de modèles restent très limités car
nombreux sont les gisements à W-Sn formés en zones externes de types bassins arrière-arc,
dans les zones de collision ou encore hors limites de plaques lorsque la minéralisation est
associée à des granites de type A. D’autre part, les gisements à W-Sn peuvent tout aussi bien
être associés à des contextes d’extension crustale ou de rifting. La distribution des
minéralisations semble être contrôlée par d’anciennes zones de marges continentales et en
particulier, liée à des protolithes granitiques à métaux rares et des volumes très importants de
roches sédimentaires intensivement altérées chimiquement (Romer et Kroner, 2016).
Ces gisements se forment en conditions réduites (alors que le tungstène se comporte
en élément incompatible) et le tungstène va donc s’enrichir dans le magma résiduel pendant
la cristallisation fractionnée. Comme ce type de magma (S, peralumineux) est formé à partir
de la fusion partielle de matériel metasédimentaire, le magma sera relativement hydraté et
aura tendance à cristalliser assez profondément dans la croute. Quand la phase fluide
s’exsolve, celle-ci rentre alors en interaction avec un magma très différencié et enrichi en
tungstène. La phase fluide va alors récupérer une partie de ce tungstène mais le faible
coefficient de partage de cet élément induit que la majeure partie de la concentration en
tungstène sera atteinte avant la saturation en eau (Robb, 2005).
3.5 Données d’inclusions fluides
3.5.1 Généralités
La grande majorité des inclusions fluides observées dans les gisements à W-Sn sont
biphasées, comprenant une phase liquide et une phase gazeuse (Naumov et al., 2011). Il n’est
néanmoins pas impossible d’observer certains solides pouvant s’avérer être des sels. Le
contenu en gaz est néanmoins minime. La majorité des inclusions sont de type aqueuses ou
à faible quantité de CO2. Il est tout de même possible d’observer des inclusions à CH4 et/ou
Etat de l’art
27
N2 suivant le rapport moyen suivant : 56.4% CO2, 30.9 % CH4 et 13.3 % N2 (Naumov et al.,
2011).
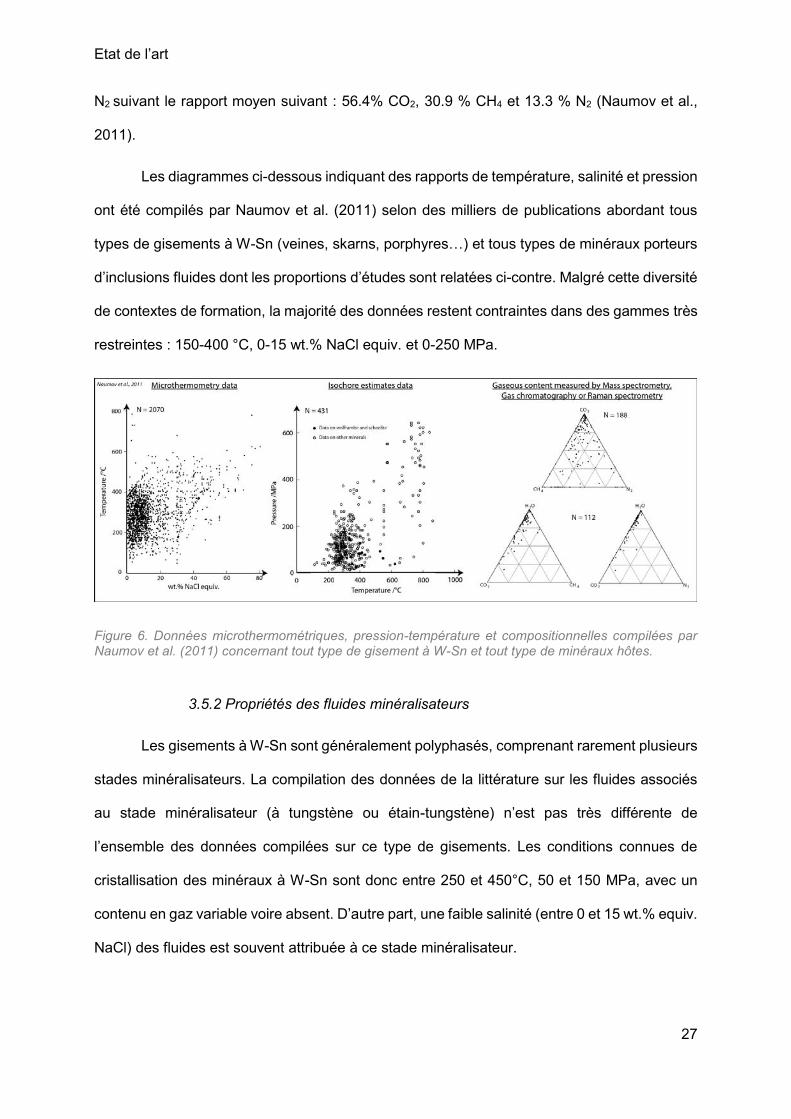
Les diagrammes ci-dessous indiquant des rapports de température, salinité et pression
ont été compilés par Naumov et al. (2011) selon des milliers de publications abordant tous
types de gisements à W-Sn (veines, skarns, porphyres…) et tous types de minéraux porteurs
d’inclusions fluides dont les proportions d’études sont relatées ci-contre. Malgré cette diversité
de contextes de formation, la majorité des données restent contraintes dans des gammes très
restreintes : 150-400 °C, 0-15 wt.% NaCl equiv. et 0-250 MPa.
Figure 6. Données microthermométriques, pression-température et compositionnelles compilées par Naumov et al. (2011) concernant tout type de gisement à W-Sn et tout type de minéraux hôtes.
3.5.2 Propriétés des fluides minéralisateurs
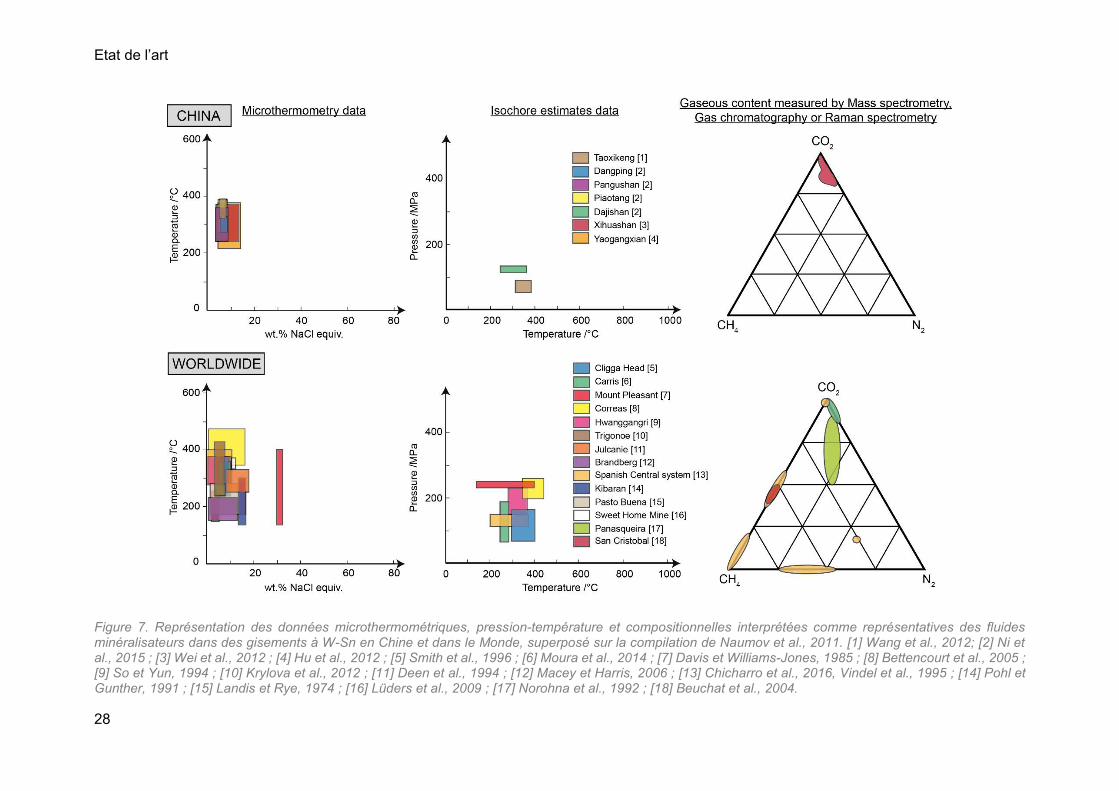
Les gisements à W-Sn sont généralement polyphasés, comprenant rarement plusieurs
stades minéralisateurs. La compilation des données de la littérature sur les fluides associés
au stade minéralisateur (à tungstène ou étain-tungstène) n’est pas très différente de
l’ensemble des données compilées sur ce type de gisements. Les conditions connues de
cristallisation des minéraux à W-Sn sont donc entre 250 et 450°C, 50 et 150 MPa, avec un
contenu en gaz variable voire absent. D’autre part, une faible salinité (entre 0 et 15 wt.% equiv.
NaCl) des fluides est souvent attribuée à ce stade minéralisateur.
Etat de l’art
28
Figure 7. Représentation des données microthermométriques, pression-température et compositionnelles interprétées comme représentatives des fluides minéralisateurs dans des gisements à W-Sn en Chine et dans le Monde, superposé sur la compilation de Naumov et al., 2011. [1] Wang et al., 2012; [2] Ni et al., 2015 ; [3] Wei et al., 2012 ; [4] Hu et al., 2012 ; [5] Smith et al., 1996 ; [6] Moura et al., 2014 ; [7] Davis et Williams-Jones, 1985 ; [8] Bettencourt et al., 2005 ; [9] So et Yun, 1994 ; [10] Krylova et al., 2012 ; [11] Deen et al., 1994 ; [12] Macey et Harris, 2006 ; [13] Chicharro et al., 2016, Vindel et al., 1995 ; [14] Pohl et Gunther, 1991 ; [15] Landis et Rye, 1974 ; [16] Lüders et al., 2009 ; [17] Norohna et al., 1992 ; [18] Beuchat et al., 2004.
Etat de l’art
29
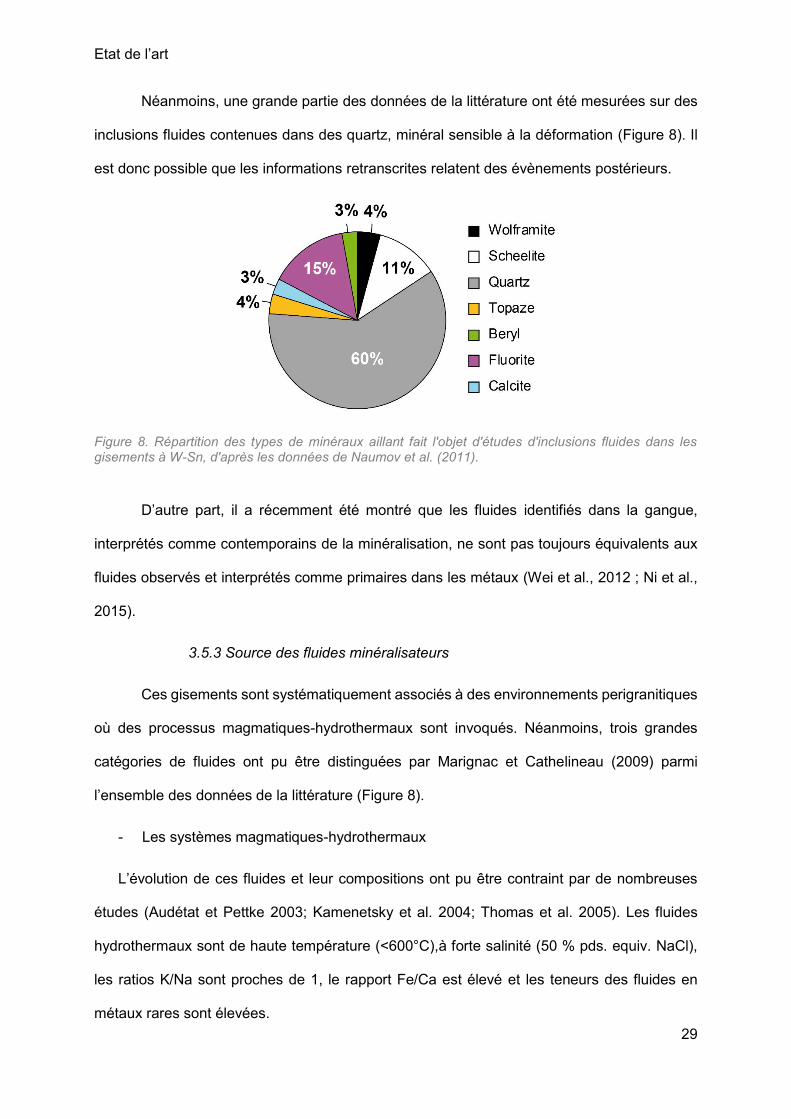
Néanmoins, une grande partie des données de la littérature ont été mesurées sur des
inclusions fluides contenues dans des quartz, minéral sensible à la déformation (Figure 8). Il
est donc possible que les informations retranscrites relatent des évènements postérieurs.
Figure 8. Répartition des types de minéraux aillant fait l'objet d'études d'inclusions fluides dans les gisements à W-Sn, d'après les données de Naumov et al. (2011).
D’autre part, il a récemment été montré que les fluides identifiés dans la gangue,
interprétés comme contemporains de la minéralisation, ne sont pas toujours équivalents aux
fluides observés et interprétés comme primaires dans les métaux (Wei et al., 2012 ; Ni et al.,
2015).
3.5.3 Source des fluides minéralisateurs
Ces gisements sont systématiquement associés à des environnements perigranitiques
où des processus magmatiques-hydrothermaux sont invoqués. Néanmoins, trois grandes
catégories de fluides ont pu être distinguées par Marignac et Cathelineau (2009) parmi
l’ensemble des données de la littérature (Figure 8).
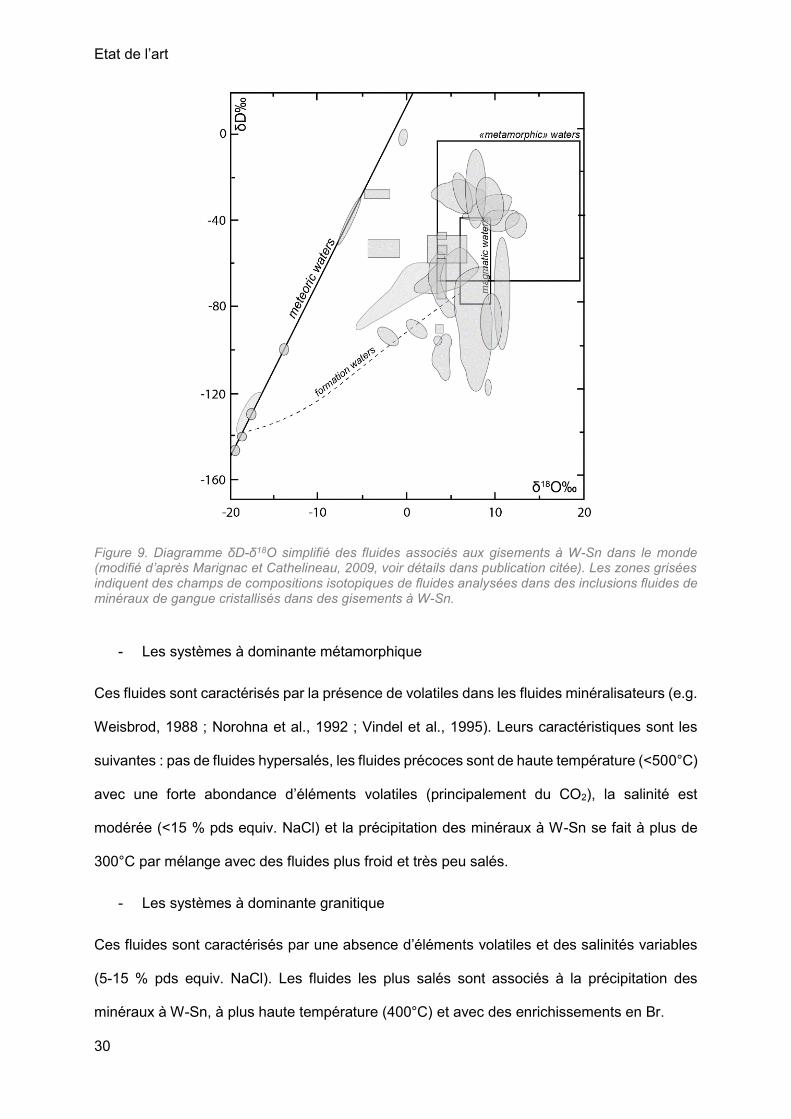
- Les systèmes magmatiques-hydrothermaux
L’évolution de ces fluides et leur compositions ont pu être contraint par de nombreuses
études (Audétat et Pettke 2003; Kamenetsky et al. 2004; Thomas et al. 2005). Les fluides
hydrothermaux sont de haute température (<600°C),à forte salinité (50 % pds. equiv. NaCl),
les ratios K/Na sont proches de 1, le rapport Fe/Ca est élevé et les teneurs des fluides en
métaux rares sont élevées.
Etat de l’art
30
Figure 9. Diagramme δD-δ18O simplifié des fluides associés aux gisements à W-Sn dans le monde (modifié d’après Marignac et Cathelineau, 2009, voir détails dans publication citée). Les zones grisées indiquent des champs de compositions isotopiques de fluides analysées dans des inclusions fluides de minéraux de gangue cristallisés dans des gisements à W-Sn.
- Les systèmes à dominante métamorphique
Ces fluides sont caractérisés par la présence de volatiles dans les fluides minéralisateurs (e.g.
Weisbrod, 1988 ; Norohna et al., 1992 ; Vindel et al., 1995). Leurs caractéristiques sont les
suivantes : pas de fluides hypersalés, les fluides précoces sont de haute température (<500°C)
avec une forte abondance d’éléments volatiles (principalement du CO2), la salinité est
modérée (<15 % pds equiv. NaCl) et la précipitation des minéraux à W-Sn se fait à plus de
300°C par mélange avec des fluides plus froid et très peu salés.
- Les systèmes à dominante granitique
Ces fluides sont caractérisés par une absence d’éléments volatiles et des salinités variables
(5-15 % pds equiv. NaCl). Les fluides les plus salés sont associés à la précipitation des
minéraux à W-Sn, à plus haute température (400°C) et avec des enrichissements en Br.
Etat de l’art
31
4. Exemple de gisement fini-varisque : le Massif Central français
Les gisements de tungstène associés à des systèmes de veines à quartz-wolframite-
cassiterite sont à ce jour bien connus dans la Chaine varisque. La Chaine varisque
européenne est de loin la plus importante en occurrences de métaux rares (Nb, Ta, Li, Be)
avec des districts à métaux rares et W-Sn de classe mondiale tels qu’en Cornouailles, dans le
Massif ibérique, le Massif de la Bohème, le Massif armoricain et le Massif Central Français
(FMC). Ce dernier abrite de nombreux gisements à tungstène avec un potentiel économique
de plus de 45 kt WO3, principalement sous forme de minéralisations disséminées dans les
granites ou sous forme de veines hydrothermales peri-granitiques (Marignac et Cuney, 1999).
Le principal évènement à tungstène eut lieu à la fin de la collision continentale entre les blocs
Gondwana et Laurussia, au Paléozoïque supérieur. Les conditions géodynamiques de mise
en place sont complexes et caractérisées par des contraintes simultanées de compression et
extension, typiques de processus de délamination de la lithosphère. A la fin du carbonifère,
des pulsations magmatiques successives ont permis la mise en place de granites à
profondeurs variables et sous divers régimes tectoniques. Des granites d’origine crustale
profonde et moyenne ont été produits. Le premier est caractérisé par de fortes interactions
avec des magmas mafiques issus de la fusion partielle du manteau lithosphérique
subcontinental métasomatisé. L’autre est typiquement peralumineux et spatialement associé
à des minéralisations à W-Sn-Nb-Ta.
Des recherches réalisées sur le Massif Central Français et la province ibérique ont
montré que les fluides dominants associés aux veines minéralisées font partis d’un système
fluide de type C-O-H-N à signatures isotopiques caractéristiques de fluides externes tels que
méteoriques et/ou métamorphiques (Polya et al., 2000, Harlaux 2016). La majorité des travaux
d’inclusions fluides sur les gisements à W-Sn du Massif Central Français a été menée sur le
gisement d’Echassières (Aïssa et al., 1987b; Cuney et al., 1992). Quatre types d’inclusions
fluides ont pu y être décrits : (i) des inclusions fluides magmatiques L1 précoces de haute
température (490-590°C), fortes salinités (25-30 pds% NaCl equiv.) et enrichies en lithium, (ii)
Etat de l’art
32
des inclusions vapeur V2 et liquides L2 issus de l’ébullition de ces premières inclusions fluides
à des températures comprises entre 400 et 520°C et des salinités variant de 3 à 12 pds% NaCl
equiv. pour les inclusions vapeurs et de 30 à 50 pds% NaCl equiv. pour les inclusions liquides,
(iii) des inclusions fluides aqueuses L3 à faibles salinités (2-6 pds% NaCl equiv.) pour des
températures entre 330 et 420°C et (iv) des inclusions fluides aqueuses tardives de
températures n’excédant pas 350 °C mais de salinités variables (0 à 60 pds% NaCl equiv.).
Etat de l’art
33
Références
Aïssa, M., Weisbrod, A., Marignac, C., 1987b. Caractéristiques chimiques et
thermodynamiques des circulations hydrothermales du site d’Echassières. In Géologie
profonde de la France, Echassières : le forage scientifique. Une clé pour la
compréhension des mécanismes magmatiques et hydrothermaux associés aux
granites à métaux rares (eds. M. Cuney and A. Autran). Géologie de la France, 2-3,
335-350.
Audétat, A., et Pettke, T., 2003. The magmatic-hydrothermal evolution of two barren granites:
a melt and fluid inclusion study of the Rito del Medio and Canada Pinabete plutons in
northern New Mexico (USA). Geochimica et Cosmochimica Acta 67, 97-121.
Bettencourt, J.S., Leite, W.B., Goraieb, C.L., Sparrenberger, I., Bello, R.M., Payolla, B.L.,
2005. Sn-polymetallic greisen-type deposits associated with late-stage rapakivi
granites, Brazil: fluid inclusion and stable isotope characteristics. Lithos 80, 363-386.
Beuchat, S., Moritz, R., & Pettke, T., 2004. Fluid evolution in the W–Cu–Zn–Pb San Cristobal
vein, Peru: fluid inclusion and stable isotope evidence. Chemical Geology 210, 201-
224.
Beus, A.A. (Ed.). 1986. Geology of Tungsten (No. 18). United Nations Educational. 271 p.
Burt, D.M., 1978. Wolframite-Scheelite Equilibria Involving Fluorine, Phosphorus, and Sulfur.
Economic geology 73, 1389-1389.
Burt, D.M., 1981. Acidity-salinity diagrams; application to greisen and porphyry
deposits. Economic geology 76, 832-843.
Černý, P., et Ercit, T. S., 2005. The classification of granitic pegmatites revisited. The Canadian
Mineralogist 43.
Chicharro, E., Boiron, M.C., López-García, J.Á., Barfod, D.N., Villaseca, C., 2016. Origin, ore
forming fluid evolution and timing of the Logrosán Sn–(W) ore deposits (Central Iberian
Zone, Spain). Ore Geology Reviews 72, 896-913.
Commission européenne 2014. Mémo 14/377.
Cuney, M., 2014. Felsic magmatism and uranium deposits. Bulletin de la Société Géologique
de France, 185, 75-92.
Cuney, M., Marignac, C., Weisbrod, A., 1992. The Beauvoir topaz-lepidolite albite granite
(Massif Central, France): the disseminated magmatic Sn-Li-Ta-Nb-Be mineralization.
Economic Geology 87, 1766-1794.
Etat de l’art
34
Cuney, M., et Kyser, K., 2008. Hydrothermal uranium deposits related to igneous rocks.
Mineralogical Association of Canada Short Course Series 39, 117-160.
Davis, W.J., et Williams-Jones, A.E., 1985. A fluid inclusion study of the porphyry-greisen,
tungsten-molybdenum deposit at Mount Pleasant, New Brunswick, Canada.
Mineralium Deposita 20, 94-101.
Debon, F., et Lefort, P., 1986. Une classification Chimicomineralogique des roches plutoniques
et applications. French translation from Ciencias da Terra (Brazil).
Deen, J.A., Rye, R.O., Munoz, J.L., Drexler, J.W., 1994. The magmatic hydrothermal system
at Julcani, Peru; evidence from fluid inclusions and hydrogen and oxygen isotopes.
Economic Geology 89, 1924-1938.
Harlaux, M., 2016. Tungsten and rare-metal (Nb, Ta, Sn) hydrothermal metallogenic systems
in the late-variscan orogenic context: example of the French Massif Central (Doctoral
dissertation, Université de Lorraine).
Hu, R.Z., Bi, X.W., Jiang, G.H., Chen, H.W., Peng, J.T., Qi, Y.Q., Wu, L.Y., Wei, W.F., 2012.
Mantle-derived noble gases in ore-forming fluids of the granite-related Yaogangxian
tungsten deposit, Southeastern China. Mineralium Deposita 47, 623-632.
Higgins, N.C., 1985. Wolframite deposition in a hydrothermal vein system; the Grey River
tungsten prospect, Newfoundland, Canada. Economic Geology 80, 1297-1327.
Jébrak M., Marcoux E., 2008. Géologie des ressources minérales. Géologie Québec. 685p.
Kamenetsky, V.S., Naumov, V.B., Davidson, P., van Achtenbergh, E., Rya, C.G., 2004.
Immiscibility between silicate magmas and aqueous fluids: a melt inclusion pursuit into
the magmatic-hydrothermal transition in the Omsukchan Granite (NE Russia).
Chemical Geology 210, 73-90.
Keppler, H., et Wyllie, P.J., 1991. Partitioning of Cu, Sn, Mo, W, U, and Th between melt and
aqueous fluid in the systems haplogranite-H 2 O− HCl and haplogranite-H 2 O−
HF. Contributions to Mineralogy and Petrology 109, 139-150.
Krylova, T.L., Pandian, M.S., Bortnikov, N.S., Gorelikova, N.V., Gonevchuk, V.G., Korostelev,
P.G., 2012. Degana (Rajasthan, India) and Tigrinoe (Primorye, Russia) tungsten and
tin-tungsten deposits: Composition of mineral-forming fluids and conditions of
wolframite deposition. Geology of Ore Deposits 54, 276-294.
Landis, G.P., et Rye, R.O., 1974. Geologic, fluid inclusion, and stable isotope studies of the
Pasto Buena tungsten-base metal ore deposit, Northern Peru. Economic Geology 69,
1025-1059.
Etat de l’art
35
Lüders, V., Romer, R.L., Gilg, H.A., Bodnar, R.J., Pettke, T., Misantoni, D., 2009. A
geochemical study of the Sweet Home Mine, Colorado Mineral Belt, USA: hydrothermal
fluid evolution above a hypothesized granite cupola. Mineralium deposita 44, 415.
Macey, P., et Harris, C., 2006. Stable isotope and fluid inclusion evidence for the origin of the
Brandberg West area Sn–W vein deposits, NW Namibia. Mineralium Deposita 41, 671-
690.
Manning, D.A., et Henderson, P., 1984. The behaviour of tungsten in granitic melt-vapour
systems. Contributions to Mineralogy and Petrology 86, 286-293.
Marignac, C. et Cathelineau, M., 2009. The nature of ore-forming fluids in peri-batholitic Sn-W
deposits and a classification. In: Williams et al. eds, Smart science for exploration and
mining, Proceedings Xth Biennial SGA Meeting, Townsville: 245-247.
Marignac, C., Cuney, M., 1999. Ore deposits of the French Massif Central: insight into the
metallogenesis of the Variscan collision belt. Mineralium Deposita 34, 472-504.
Moura, A., Dória, A., Neiva, A.M.R., Gomes, C.L., Creaser, R.A., 2014. Metallogenesis at the
Carris W–Mo–Sn deposit (Gerês, Portugal): constraints from fluid inclusions, mineral
geochemistry, Re–Os and He–Ar isotopes. Ore Geology Reviews 56, 73-93.
Naumov, V.B., Dorofeev, V.A., Mironova, O.F., 2011. Physicochemical parameters of the
formation of hydrothermal deposits: a fluid inclusion study. I. Tin and tungsten deposits.
Geochemistry International 49, 1002-1021.
Ni, P., Wang, X.D., Wang, G.G., Huang, J.B., Pan, J.Y., Wang, T.G., 2015. An infrared
microthermometric study of fluid inclusions in coexisting quartz and wolframite from
Late Mesozoic tungsten deposits in the Gannan metallogenic belt, South China. Ore
Geological Reviews 65, 1062-1077.
Noronha, F., Doria, A., Dubessy, J., Charoy, B., 1992. Characterization and timing of the
different types of fluids present in the barren and ore veins of the W-Sn deposit of
Panasqueira, Central Portugal. Mineralium Deposita 27, 72-79.
Pirajno, F., 2009. Skarn systems. In Hydrothermal Processes and Mineral Systems (pp. 535-
580). Springer Netherlands.
Pohl, W., et Günther, M.A., 1991. The origin of Kibaran (late Mid-Proterozoic) tin, tungsten and
gold quartz vein deposits in Central Africa: a fluid inclusions study. Mineralium Deposita
26, 51-59.
Polya, D.A., Foxford, K.A., Stuart, F., Boyce, A., Fallick, A.E., 2000. Evolution and paragenetic
context of low δD hydrothermal fluids from the Panasqueira W-Sn deposit, Portugal:
Etat de l’art
36
new evidence from microthermometric, stable isotope, noble gas and halogen analyses
of primary fluid inclusions. Geochimica et Cosmochimica Acta 64, 3357-3371.
Robb, J., 2005. Magmatic-hydrothermal ore forming processes. Introduction to ore forming
processes. Johannesburg, Black well Publishing Company, 77-128.
Romer, R.L., et Kroner, U., 2016. Phanerozoic tin and tungsten mineralization—Tectonic
controls on the distribution of enriched protoliths and heat sources for crustal
melting. Gondwana Research 31, 60-95.
Smith, M., Banks, D.A., Yardley, B.W.D., Boyce, A., 1996. Fluid inclusion and stable isotope
constraints on the genesis of the Cligga Head Sn-W deposit, S.W. England. European
Journal of Mineralogy 8, 961-974.
So, C.S., et Yun, S.T., 1994. Origin and evolution of W-Mo-producing fluids in a granitic
hydrothermal system; geochemical studies of quartz vein deposits around the Susan
Granite, Hwanggangri District, Republic of Korea. Economic Geology 89, 246-267.
Weisbrod, A., 1988. Caractères généraux des phases fluides dans les indices et gisements de
tungstène et d'étain. In: Johan Z, Ohnenstetter D (eds), Gisements métallifères dans
leur contexte géologique, Documents du BRGM 158-1, 9-14.
Vindel, E., Lopez, J.A., Boiron, M-C., Cathelineau, M., Prieto, A.C., 1995. PV-T-X-fO2
evolution from wolframite to sulphide depositional stage in intragranitic W-veins. An
example from the Spanish Central System. European Journal of Mineralogy 7, 675-
688.
Vital Metals 2011. Tungsten uses. < https://www.vitalmetals.com.au/metal-
markets/tungsten/tungsten-uses/>
Wang, Q.Y., Lu, Y.F., Chen, Z.H., Peng, X.L., Xiong, X.F., 2012. Fluid inclusion characteristic
and its geological implication of the Taoxikeng tungsten deposit, southern Jiangxi
Province. Geology and Mineral Resources of South China 1, 006.
Wei, W., Hu, R., Bi, X., Peng, J., Su, W., Song, S., Shi, S., 2012. Infrared microthermometric
and stable isotopic study of fluid inclusions in wolframite at the Xihuashan tungsten
deposit, Jiangxi province, China. Mineralium Deposita 47, 589-605.
Chapter 1
37
Chapter 1: Assessment of the geodynamical and magmatic settings of the
Jurassic-Cretaceous period in the Cathaysia Block (SE China): a preliminary
review
Article in preparation for Earth-Science reviews
Christian Marignac a, Hélène Legros b, Nicolas Charles c, Ru-Cheng Wang d
a Ecole Nationale Supérieure des Mines de Nancy, Parc de Saurupt, F-54042 Nancy, France
b Université de Lorraine, CNRS, CREGU, GeoRessources, Boulevard des Aiguillettes B.P. 70239, F-54506-
Vandoeuvre-lès-Nancy, France
c BRGM-French Geological Survey, 3, Av. Claude Guillemin, BP 36009, 45060 Orléans Cedex 2, France
d State Key Laboratory for Mineral Deposits Research, School of Earth Sciences and Engineering, Nanjing
University, Xianlin University Town, Nanjing 210046- China
1. Introduction
The Mesozoic activity in South China is responsible for the major sources of W, Sn, Sb,
Ta, Cu, Hg, As, Tl, Pb, Zn, Au and Ag resources of China and worldwide. Most of these
deposits are associated to hydrothermal processes related to felsic intrusions as vein-type,
porphyries, skarns, MVT and epithermal deposits (e.g. Hu R.z et al., 2017). Recent studies
consider the Trias-Cretaceous period (Indosinian-Yanshanian) is mostly responsible for the
formation of these deposits (e.g. Hu R.z et al., 2017). With 1.7 Mt tungsten, the Jurassic-
Cretaceous (Yanshanian) “E-W” trending granite belts in the Nanling Ranges are the repository
for the largest tungsten province worldwide and this magmatism is also responsible for the
largest antimony province and with 1.2 Mt Sn for one of the main tin provinces worldwide (e.g.,
Sun W.d et al., 2012; Hu and Zhou, 2012; Li Z. et al., 2014).
The South China Craton (SCC) resulted from the (late) Grenvillian suturing between two
terranes, the Yangtze craton, to the north, and the Cathaysia Block, to the south, through the
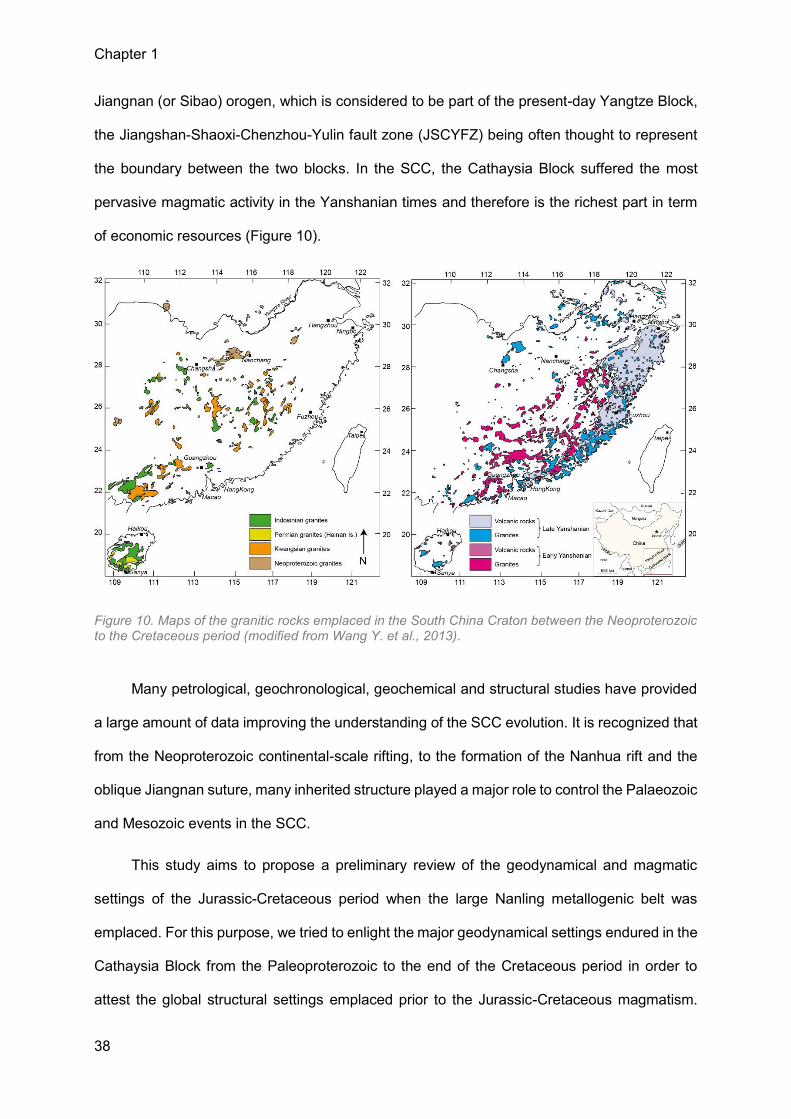
Chapter 1
38
Jiangnan (or Sibao) orogen, which is considered to be part of the present-day Yangtze Block,
the Jiangshan-Shaoxi-Chenzhou-Yulin fault zone (JSCYFZ) being often thought to represent
the boundary between the two blocks. In the SCC, the Cathaysia Block suffered the most
pervasive magmatic activity in the Yanshanian times and therefore is the richest part in term
of economic resources (Figure 10).
Figure 10. Maps of the granitic rocks emplaced in the South China Craton between the Neoproterozoic to the Cretaceous period (modified from Wang Y. et al., 2013).
Many petrological, geochronological, geochemical and structural studies have provided
a large amount of data improving the understanding of the SCC evolution. It is recognized that
from the Neoproterozoic continental-scale rifting, to the formation of the Nanhua rift and the
oblique Jiangnan suture, many inherited structure played a major role to control the Palaeozoic
and Mesozoic events in the SCC.
This study aims to propose a preliminary review of the geodynamical and magmatic
settings of the Jurassic-Cretaceous period when the large Nanling metallogenic belt was
emplaced. For this purpose, we tried to enlight the major geodynamical settings endured in the
Cathaysia Block from the Paleoproterozoic to the end of the Cretaceous period in order to
attest the global structural settings emplaced prior to the Jurassic-Cretaceous magmatism.
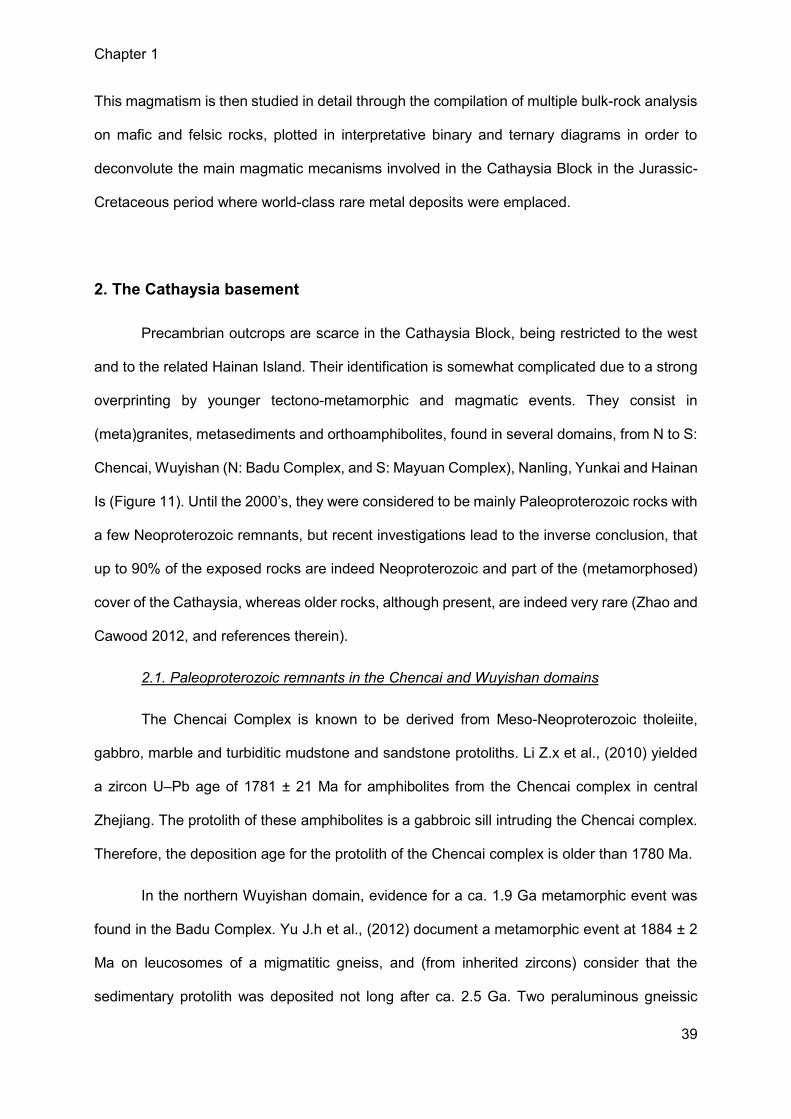
Chapter 1
39
This magmatism is then studied in detail through the compilation of multiple bulk-rock analysis
on mafic and felsic rocks, plotted in interpretative binary and ternary diagrams in order to
deconvolute the main magmatic mecanisms involved in the Cathaysia Block in the Jurassic-
Cretaceous period where world-class rare metal deposits were emplaced.
2. The Cathaysia basement
Precambrian outcrops are scarce in the Cathaysia Block, being restricted to the west
and to the related Hainan Island. Their identification is somewhat complicated due to a strong
overprinting by younger tectono-metamorphic and magmatic events. They consist in
(meta)granites, metasediments and orthoamphibolites, found in several domains, from N to S:
Chencai, Wuyishan (N: Badu Complex, and S: Mayuan Complex), Nanling, Yunkai and Hainan
Is (Figure 11). Until the 2000’s, they were considered to be mainly Paleoproterozoic rocks with
a few Neoproterozoic remnants, but recent investigations lead to the inverse conclusion, that
up to 90% of the exposed rocks are indeed Neoproterozoic and part of the (metamorphosed)
cover of the Cathaysia, whereas older rocks, although present, are indeed very rare (Zhao and
Cawood 2012, and references therein).
2.1. Paleoproterozoic remnants in the Chencai and Wuyishan domains
The Chencai Complex is known to be derived from Meso-Neoproterozoic tholeiite,
gabbro, marble and turbiditic mudstone and sandstone protoliths. Li Z.x et al., (2010) yielded
a zircon U–Pb age of 1781 ± 21 Ma for amphibolites from the Chencai complex in central
Zhejiang. The protolith of these amphibolites is a gabbroic sill intruding the Chencai complex.
Therefore, the deposition age for the protolith of the Chencai complex is older than 1780 Ma.
In the northern Wuyishan domain, evidence for a ca. 1.9 Ga metamorphic event was
found in the Badu Complex. Yu J.h et al., (2012) document a metamorphic event at 1884 ± 2
Ma on leucosomes of a migmatitic gneiss, and (from inherited zircons) consider that the
sedimentary protolith was deposited not long after ca. 2.5 Ga. Two peraluminous gneissic
Chapter 1
40
metagranites that were intrusive in the metamorphic rocks and of which compositions are close
to the migmatite leucosomes, yield slightly younger U-Pb (Zrn) ages of 1888±7 Ma (Xiaji
granite) and 1875±9 Ma (Lizhuang granite) (Yu J.h et al., 2009), i.e., a ca. 1883 Ma age. Two
A2-type monzogranites yield still younger ages of 1856±10 Ma (Tianhou granite) and 1855±9
to 1869±10 Ma (Danzhou massif) (Yu J.h et al., 2009), i.e., a ca. 1862 Ma age., with inherited
cores in the 2.1 to 2.9 Ga range, while metamorphism at ca. 1.9 Ga affected protoliths formed
in the 2.5 to 1.9 Ga range (Xia Y. et al., 2012).
Figure 11. Map of South China showing the remaining evidences of formations dated from the Paleoproterozoic to the Neoproterozoic (modified after Zhao J.h and Asimow P.d, 2014)
Chapter 1
41
In the southern Wuyishan domain (Mayuan Complex), the so-called Tianjinping
Formation contains amphibolites with protoliths dated at ca. 1.9 Ga, associated with
paragneiss, the youngest detrital zircon in which is dated at 1.76 Ga, although most of the
“Formation” is indeed by far younger (Wan Y.s et al., 2007). These data are taken as evidence
for the existence in the W Cathaysia of a complete collisional cycle of Paleoproterozoic age,
with the 1.77 to 1.78 Ga amphibolites and “A-type” granites representing a post-orogenic
intracontinental rifting stage (e.g., Li X.h et al., 2014). In addition, within the so-called “Mayuan
Group”, some rocks with ca. 2.1 to 1.8 Ga “protolith” ages, display a ca. 1.4 Ga metamorphic
age (Xu X.s et al., 2005). Metakeratophyres of this group were dated, using conventional zircon
U-Pb methods, at 1438 ± 41 Ma (Gan et al., 1993) and amphibolites were dated by Sm-Nd
whole rock isochron methods at 1376 ± 82 Ma and 1347 ± 39 Ma (Zhou H.w et al., 1997). Li
X.h et al., (1998) obtained a SHRIMP U-Pb zircon age of 1766 ± 19 Ma for amphibolites of
Mayuan group, which was interpreted as the age of their protolith.
2.2 Mesoproterozoic rocks in the Hainan Island and in the Nanling domain
In the Hainan Island, the high-grade Baoban Complex is made of a gneissic granite
dated at ca. 1430 Ma and metamorphosed in the amphibolite facies at ca. 1.3-1.1 Ga, while
the low-grade platformal metasediments of the Shilu Group were deposited at 1440-1430 Ma,
and they are both unconformably covered by the ≤1.2 Ga sediments of the foreland Sihuiding
Formation (Li Z.x et al., 2008). An older basement is also probably underlying the Island,
inferred from gneissic charnockite-amphibolite assemblages in Qiongzhon and have a zircon
U-Pb age of ca. 2560 Ma (Zhang K.j et al., 1997).
In the Nanling domain, very scarce observations were made. Although Nd model ages
of granitoid rocks implied that Mesoproterozoic basement was present beneath parts of the
Caledonian belt (Chen and Jahn, 1998; Wang and Shen, 2003), the only evidence for
Mesoproterozoic basement in the Cathaysia was made with the Lanhe orthogneiss that display
a 1.5 to 1.3 Ga magmatic age and a Neoarchean source, would have suffered metamorphism
at ca. 1.0 Ga (Xu X.s et al., 2005).
Chapter 1
42
2.3 Evidences from inherited zircons
Other evidences for an old basement include dating of inherited zircons, either
xenocrysts or cores of magmatic zircons in Phanerozoic granites and mafic rocks, and
geochemical modelling (bulk rock NdTDM or zircon HfTDM). Most of these data point to
Paleoproterozoic and Archean basement, but evidence for a Mesoproterozoic event is also
found.
The old ages obtained on some zircons may be a priori interpreted either as recycling
through sedimentary cannibalization or as representative of old magmatic and/or metamorphic
rocks presently concealed in the basement.
Compiling the ages obtained for detrital zircons in (meta)sedimentary rocks, Li X.h et
al., (2014) note that most Neoarchean zircons (peaking age at ca. 2.5 Ga) are smoothed and
must therefore be interpreted as sourced in “exotic” Archean continents, not as records of
presently unexposed Cathaysia basement, whereas to the contrary the zircons with ages
comprised between 1.9 and 0.8 Ga display euhedral to subhedral morphologies and are clearly
of magmatic origin, testifying for proximal sources. As cogently argued by Wan et al., (2011),
from the Neoproterozoic onwards, the Cathaysia (meta)sediments could not be fed by the
Yangtze craton, and consequently the reworked zircons testify for a Cathaysian provenance.
Beside the Neoarchean peak, there are two other peaks, one at ca. 1.85 Ga, confirming the
importance of the Paleoproterozoic event, the other at ca. 970 Ma, clearly recording the
Jiangnan orogeny, with minor peaks at ca. 1.43 Ga, 1.07 Ga, 780 Ma and 590 Ma. Regarding
the 1.43 Ga Mesoproterozoic age, which is similar to the dates obtained in the Nanling and
Hainan domains, it may be recalled that in the Neoproterozoic sediments of the Kangdian Rift
(Yangtze craton), detrital zircons with a ca. 1.4 Ga age are considered to be sourced in
Cathaysia (Li Z.x et al., 2002). From these data, Li X.h et al., (2014) conclude that “(...) the
oldest crustal basement rocks in Cathaysia were most likely formed by generation of juvenile
crust and reworking of recycled Archean components in Late Paleoproterozoic at ~ 1.9-1.8 Ga
Chapter 1
43
(...)”, although, strictly speaking, they only testify that since the Paleoproterozoic no Archean
rocks never outcropped in the Cathaysia block.
On the other hand, xenocrysts or inherited zircon cores in Jurassic and Cenozoic
basaltic dykes and diatremes (E Guianxi: Pingnan, Pingle, i.e. SW of the W Cathaysia block),
which provide a direct insight on the deeper crust (Zheng J.p et al. 2011), mainly yield Archean
ages with four age populations: 3.85 Ga, 3.55 Ga, 3.3 to 3.2 Ga and the main 2.9 to 2.5 Ga
group. These Archean zircons display euhedral to subhedral morphologies and, being clearly
of magmatic origin, indubitably testify for a magmatic source (or a source in proximal
sediments). The inescapable conclusion is that “(...) the western Cathaysia block is an old
continent and has a lower crust that is significantly older than the exposed upper crust” (Zheng
J.p et al., 2011, p. 254). From the oldest zircon data, it could be deduced that Eo- to
Paleoarchean nuclei included in Mesoarchean rocks would constitute a large part of the
Cathaysia lower crust (Zheng J.p et al. 2011). These conclusions are reinforced by Nd (whole
rock) and Hf (zircon) isotope geochemistry and age modelling.
In conclusion, the origin of the W Cathaysia terrane was likely the amalgamation and
reworking of Neoarchean nuclei in the Paleoproterozoic, as part of the formation of the Nuna
supercontinent. It may be proposed that W Cathaysia was part of a large Paleoproterozoic belt
connecting E Antarctica and Laurentia (Li X.h et al., 2014), which would be consistent with a
proposal by Li X.h et al., (2014) that the Mesoproterozoic (ca. 1.4-1.5) granites of Hainan and
the Nanling Ranges were in the prolongation of western Laurentia.
2.4 The Yunkai domain
In the Yunkai domain, Paleoproterozoic (“Guanzhou Group”) and Neoproterozoic
(“Yunkai Group”) metasediments coexist. The inventory of detrital zircons show that in both
“groups”, the youngest zircons are not older than 0.8 or even 0.6 Ga (Wan Y.s et al., 2010; Yu
J.h et al., 2010), thus indicating the predominance of Nanhua rift-related sedimentation in the
area. These findings are corroborated by geochemistry, with in addition strong indication of the
presence of some Neoarchean rocks at depth. Evidence comes from the study of both
Chapter 1
44
Phanerozoic granites (whole rock Sm-Nd, U-Pb dating of zircon xenocrysts and/or inherited
cores, zircon Lu/Hf) and the detrital zircon populations in metasediments of all age.
Pioneering work by Chen and Jahn (1998) demonstrated that most Phanerozoic
granites in Cathaysia were sourced in a Paleoproterozoic crust, with a small component of
recycled Neoarchean material, to the exception of a NE-trending central belt with
Mesoproterozoic Nd model ages (1.6 to 1.4 Ga). Further work fully validated these views. Nd
and Hf model ages for a large number of granites and metasediments of all ages are in line
with a Paleoproterozoic-Neoarchean basement (e.g., Wan Y.s et al., 2007, 2010; Zhang F.f et
al., 2012). Moreover, Hf model ages confirm the existence of a belt with a dominantly
Mesoproterozoic signature.
U-Pb dating of either inherited cores in magmatic zircons or detrital zircons yield the
same results. For instance, in the Mayuan Complex, the Neoproterozoic volcano-sedimentary
metasediments of the Nanshan Formation contains detrital zircons ranging from 2.7 to 1.75
Ma (Wan Y.s et al., 2007) as do the “Caledonian” migmatites (Liu R et al., 2010). Similar results
(2.77 to 1.72 Ga) were obtained in the late Neoproterozoic Yunkai metasediments (Wan et al.,
2011).
2.5 Cathaysia subcontinental lithospheric mantle
Insights on the Phanerozoic Cathaysia SCLM are provided by mantle xenoliths found
in mafic volcanic and subvolcanic rocks of Mesozoic or Cenozoic ages. Results point to the
presence of a newly accreted SCLM in the Phanerozoic times, mostly beneath the major
translithospheric faults, remnants of the Proterozoic SCLM being however recognized outside
these faults (Zheng J et al., 2004; Li X.y et al., 2014, and references therein). Removal of the
Proterozoic SCLM and replacement by a thin lithospheric mantle (≤ 80 km) was already
achieved in the Jurassic according to Liu C.z et al., (2012).
Olivine compositions indicate that “most of the peridotites of the W Cathaysia block plot in the
Tecton field or overlap the field between Tecton and Proton”, some rare xenoliths contained in
Chapter 1
45
far-fault intrusions being close to the Archon field (Zheng J et al., 2004). According however to
a geochemical study of the Paleoproterozoic amphibolites in the Wuyishan domain (interpreted
as representative of post-collisional rifting) the SCLM at that time was strongly depleted (Li X.h
et al., 2000) and likely still of the Archon type. It is therefore inferred that the residual
Proterozoic SCLM in the Phanerozoic was derived from metasomatic transformation of an
Archean depleted mantle (Zheng J et al., 2004; Li X.y et al. 2014), when the major part of the
pristine SCLM was delaminated and replaced by new lithospheric material directly evolved
from the asthenospheric mantle. Re/Os studies of sulphides in xenoliths from Cenozoic basalts
allowed Liu C.z et al., (2012) to propose a time scale of the primitive Cathaysia SCLM. There
were numerous infiltration events that reset the Re/Os ages of the mantle sulphides. The older
ages are Neoarchean (2.7 to 2.5 Ga), likely providing evidence for the existence of remnants
of the Neoarchean mantle and overlying crustal rocks in the E Cathaysia basement (Liu C.z et
al., 2012). Paleoproterozoic (c. 1.8 Ga), Mesoproterozoic (1.5 to 1.3 Ga), as well as
Neoproterozoic (Jiangnan orogeny and Nanhua rifting), and earliest Yanshanian (c. 180 Ma)
events are equally documented (Liu C.z et al., 2012).
Two conclusions may be drawn: (i) For the main part, the SCCFB basement consists
in early Paleoproterozoic rocks that were involved in a strong tectonothermal event at c. 1.8
Ga, i.e., the formation of the Nuna supercontinent with the likely presence of Neoarchean
reworked microcontinental blocks. In this respect, Cathaysia was likely very similar to the
Yangtze craton (Zheng Y.f et al., 2013 and references therein). (ii) A central belt of younger
rocks was formed during the Mesoproterozoic (ca. 1.6 to ca. 1.4 Ga). The outcropping Lanhe
gneisses and granodiorite in Hainan Island are likely part of this belt. Based on the Hainan
evidence, it has been proposed that prior to the worldwide Grenvillian events, Cathaysia was
located to the west of the Laurentia craton and the Hainan Bayoban granite was in the
continuity of the “Transcontinental granite-rhyolite province” or “Mojave province” (1500-1350
Ma) in Laurentia (“Missing Link” solution of the Rodinia supercontinent reconstruction) (Li Z.x
Chapter 1
46
et al., 2002, 2007). This conclusion may be tentatively expanded to the whole of the “LTB” in
Cathaysia.
3. Architecture of the Cathaysia (meta)cratonic area
At first glance, the Cathaysia Block appears to been composite, formed from three segments,
separated by two major fault zones, the Zenghe-Dapu fault zone (ZDFZ) and the Changle-
Nan’ao fault zone (CNFZ): the South China Caledonian fold belt (SCCFB) or E Cathaysia (Xu
X.s et al., 2007), to the west of the ZDFZ, the Southeast China Coastal Volcanic Belt (SCVB)
between the ZDFZ and the CNFZ, and the Metamorphic Coastal Belt (MCB) to the east of the
CNFZ, both constituting the E Cathaysia block (Xu X.s et al., 2007; Figure 12). The Hainan
Island is generally thought to be part of the W Cathaysia; the island is however divided into
two parts by the NE-trending Baisha fault zone (Xu Y.h et al., 2014), a possible SW-wards
prolongation of the ZDFZ, and thus, only the NW portion of the island (with the Mesoproterozoic
Baoban and Sihuilding groups) would be part of the W Cathaysia.
3.1 The Jiangnan (Sibao) orogen and the Yangtze-Cathaysia boundary
The Jiangnan orogenic belt consists in arc (e.g., Shuangxiwu arc) and back-arc (e.g.,
N Jiangxi ophiolite) terranes thought to have been overthrusted onto the Yangtze craton, thus
welding the Yangtze with the Cathaysia, which acted as the passive margin (Charvet 2013 and
references therein).
The Jiangshan-Shaoxi fault zone bordering the belt to the SE is generally considered
to mark the boundary between the two terranes, in accordance with the seismological evidence
for a several km jump of the Moho depth at the crossing of the fault zone (from 30-32 km to
the east to 34-36 km to the west) (Wang Y.j et al., 2013 and references therein). The SW
prolongation of the Jiangshan-Shiaoxi fault is more problematic. Many workers point to an
apparent continuity with the Chenzhou-Linwu fault, which displays the same seismological
signature
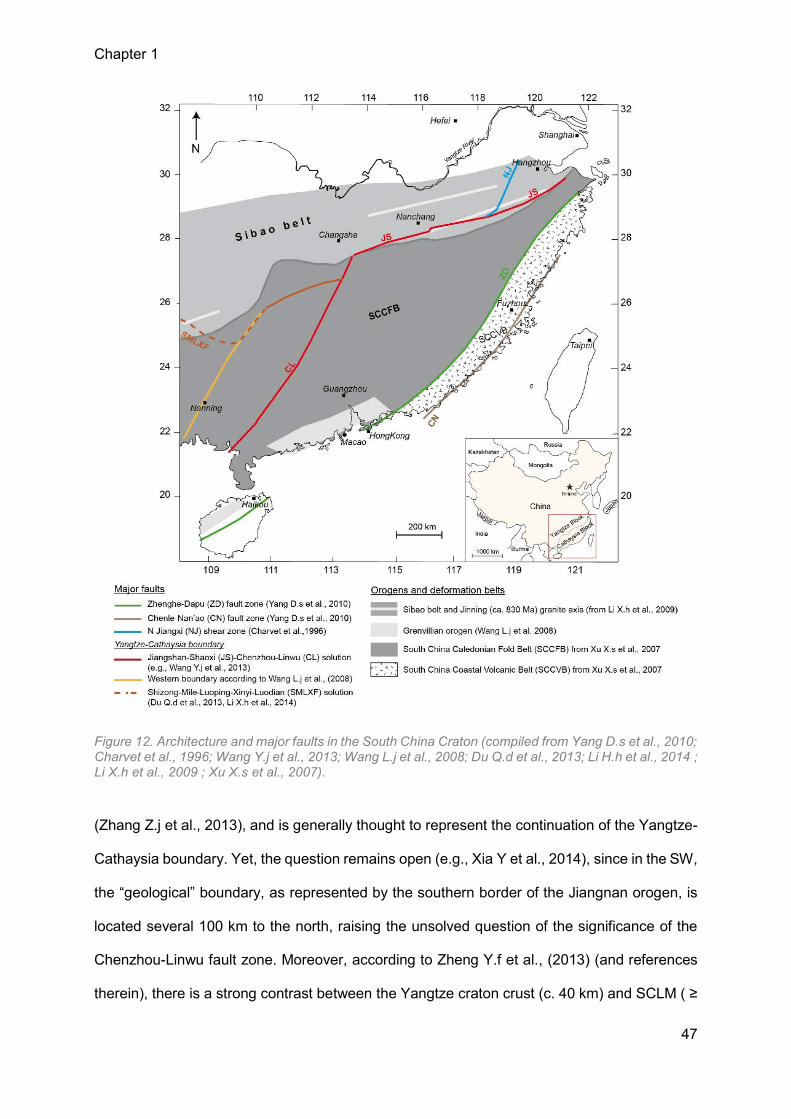
Chapter 1
47
Figure 12. Architecture and major faults in the South China Craton (compiled from Yang D.s et al., 2010; Charvet et al., 1996; Wang Y.j et al., 2013; Wang L.j et al., 2008; Du Q.d et al., 2013; Li H.h et al., 2014 ; Li X.h et al., 2009 ; Xu X.s et al., 2007).
(Zhang Z.j et al., 2013), and is generally thought to represent the continuation of the Yangtze-
Cathaysia boundary. Yet, the question remains open (e.g., Xia Y et al., 2014), since in the SW,
the “geological” boundary, as represented by the southern border of the Jiangnan orogen, is
located several 100 km to the north, raising the unsolved question of the significance of the
Chenzhou-Linwu fault zone. Moreover, according to Zheng Y.f et al., (2013) (and references
therein), there is a strong contrast between the Yangtze craton crust (c. 40 km) and SCLM ( ≥
Chapter 1
48
150 km) and the “Jiangnan orogeny-W Cathaysia” crust (c. 30 km) and SCLM (c. 70-80 km),
lending some support to the idea that the SW prolongation of the terrane boundary is, to the
north, the Anhua-Luocheng fault zone (Yang D.s et al., 2010). For some workers (Shu X.j et
al., 2013 and references therein) the Chenzhou-Linwu fault would rather represent a Mesozoic
lithospheric boundary (see below: Yanshanian). In support of this hypothesis, it must be noted
(i) that the extent of the Kwangsian deformations is bounded to the west by the Anhua-
Luocheng fault (Lin et al., 2008), as (ii) is also bounded the Phanerozoic development of
granite magmatism (Wang Y.j et al., 2013). It must be added that both the Jiangshan-Shaoxi
and Anhua-Luocheng faults play a major role in the Kwangsian and Indo-Sinian orogenies,
being apparently reactivated, and even be envisaged that in relation with its “Caledonian”
reactivation, the Jiangshan-Shaoxi fault in reality truncates the Jiangnan belt (Li X.h et al.,
2009).
3.2 An E-W boundary between N and S parts of W Cathaysia?
According to Yu J.h et al., (2010) there are significant differences in the zircon age
spectra from metasediments according to their location in either the Wuyishan domain or both
the Nanling and Yunkai domains, which appears similar from this point of view. In all domains,
there are Neoarchean (ca. 2.6-2.5 Ga) and Neoproterozoic (ca. 0.8-0.7 Ga) zircons, whereas
the northern domain is characterized by Paleoproterozoic zircons (ca. 2.1-2.0 and 1.86 Ga),
which are lacking in the southern domains, where to the contrary, beside Mesoarchean (ca.
3.3 Ga) zircons, there is a strong inprint of Mesoproterozoic (ca. 1.7 to 1.5 Ga) and Grenvillian
(ca. 1.1 to 0.9 Ga) zircons. This is interpreted by Yu J.h et al., (2010) as recording the presence
of an E-W boundary, the location of which would be marked by the E-W clustering of the
earliest Yanshanian bi-modal volcanic rocks (Liu C.z et al., 2012b), gabbro-syenite complexes
and A-type granites. Yu J.h et al., (2010 and references therein) further observe that inherited
zircons in intrusions from both sides of the hypothetical boundary may testify for a difference
in the respective basements: Mesoarchean and ca. 1.4 Ga zircons to the S (Kwangsian
Tanghu granite and Guzhai granodiorite in the Nanling Ranges), and 1.86 Ga zircons in the
Chapter 1
49
Mesozoic Doushui lamprophyre in the Wuyishan. It may be added that very limited evidence
for the presence of E-W shear zones in the basement is preserved in the Mesoproterozoic
Lanhe gneiss (Xu X.s et al., 2005). According to Yu J.h et al., (2010) the two Wuyishan and
Nanling-Yunkai domains were distinct terranes, which would have been docked during the
Grenvillian events, at ca. 1.1-1.0 Ga, i.e., close to the docking of Yangtze and Cathaysia. If it
is so, it must be concluded that the cathaysian prolongation of the Mesoproterozoic Laurentian
transcontinental granite-rhyolite province would have indeed be restricted to the Nanling-
Yunkai terrane.
3.3 The significance of the Zenghe-Dapu fault zone (ZDFZ)
Owing to the fact that, from zircon data, the E Cathaysia basement apparently shares
the same history as the Wuyishan domain, which is different from the Nanling-Yunkai domain,
it results that the ZDFZ would not be a major terrane boundary within the Cathaysia
(meta)craton (Yu J.h et al., 2010).
On the other hand, the abundance of detrital zircons with 1.0 to 0.9 Ga in the S
Cathaysia metasediments (Nanling-Yunkai domain), along the Zenghe-Dapu fault, suggests a
source in a Grenvillian orogen, and the Hf isotopic data indicate that they more precisely would
come from a late Mesoproterozoic magmatic arc developed onto a Paleoproterozoic crust
(Wang L.j et al., 2008). It is thus suggested that the ZDFZ could mark the boundary of a
Grenvillian suture. In this connection, it must be noted that, in Hainan Island, to the SE of the
Baisha fault zone which is likely in prolongation of the Zenghe-Dapu fault, the sediments of the
Yalong Bay (in provenance of this SE domain) yield detrital zircons with Neoproterozoic ages,
ranging from 984 to 728 Ma (Xu Y.h et al., 2014). Although these zircons yield HfTDM2 ages
peaking at 1.6-1.3 Ga (Xu Y.h et al., 2014), reminiscent of the Baoban Complex, the ca. 1.0
Ga age would be fitting with a Grenvillian event associated to the ZDFZ.
Basaltic pillow-lavas, interpreted as ophiolite remnants, are observed along the ZDFZ
and have been dated at 853±4 Ma (U-Pb, Zrn: in Shu L.s et al., 2007). In the Jiangnan orogen,
the Jinning cycle also overprints the Grenvillian Sibao event and emphasizes the similarities
Chapter 1
50
between the Jiangshan-Shaoxi FZ and the Zenghe-Dapu fault. This raises the possibility that
the E Cathaysia was amalgamated to the W Cathaysia basement approximatively at the same
time as the latter was sutured to the Yangtze craton, and that the Zenghe-Dapu Fault Zone
could be another suture in the South China (meta)craton. This would be consistent with the
point of view that W and E Cathaysia were distinct terranes (Xu X.s et al., 2007), the latter with
its Paleoproterozoic crust and no reworking prior to the Late Yanshanian (Cretaceous),
whereas the former, with also a Paleoproterozoic crust, displays a major Mesoproterozoic
crust-forming event, and was strongly reworked by the “Caledonian” and Indo-Sinian events.
That the ZDFZ is a lithospheric-scale structure is demonstrated by seismological data. On the
other hand, the Zenghe-Dapu fault could be only one of the large NE-trending lithospheric
faults developed within the Cathaysia crust at an unknown time, and have been more strongly
reworked than others.
4. The Jiangnan orogen
There is a consensus that the Yangtze and Cathaysia terrane were welded at the end
of the Neoproterozoic, forming the South China Craton, and that the ~ E-W belt of folded and
metamorphosed Neoproterozoic sedimentary and volcanic rocks which lay between them (the
Jiangnan belt) does represent the welding terrane, formed during the Jiangnan orogeny (e.g.
Charvet et al., 2013 and references therein). The precise timing of the end of the Jiangnan
orogeny is however a highly controversial subject (e.g., Yao J.l et al., 2013 and references
therein). There are two conflicting points of view: on one hand, some authors consider an
ending of the orogeny at the youngest at c. 860 Ma, with a major development around 0.9 Ga
(e.g., Li Z.x et al., 2007, Li W.x et al., 2008, Li X.h et al., 2009). On the other hand, many
workers claim that the Jiangnan orogenesis was not ended before ca. 830 Ma (Wang X.l et al.,
2006, Hu and Zhou 2012) or even 800 Ma (Yao J.l et al., 2013). Given the arguments for one
or the other point of view (see below), it must be concluded that the Jiangnan belt is indeed
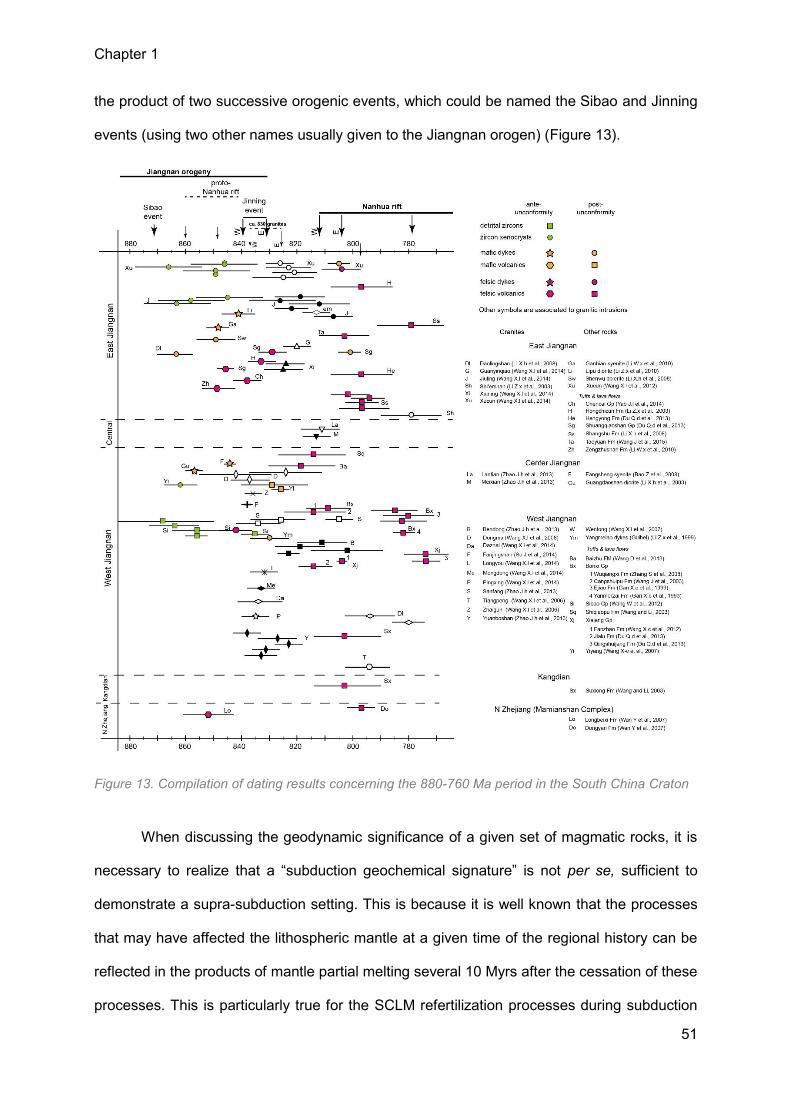
Chapter 1
51
the product of two successive orogenic events, which could be named the Sibao and Jinning
events (using two other names usually given to the Jiangnan orogen) (Figure 13).
Figure 13. Compilation of dating results concerning the 880-760 Ma period in the South China Craton
When discussing the geodynamic significance of a given set of magmatic rocks, it is
necessary to realize that a “subduction geochemical signature” is not per se, sufficient to
demonstrate a supra-subduction setting. This is because it is well known that the processes
that may have affected the lithospheric mantle at a given time of the regional history can be
reflected in the products of mantle partial melting several 10 Myrs after the cessation of these
processes. This is particularly true for the SCLM refertilization processes during subduction
Chapter 1
52
(i.e. mantle enrichment in volatiles and incompatible elements). For instance, the Miocene
magmas of the Apuseni Mts (Romania), although clearly produced in an intra-continental
extensional setting, display typical subduction signatures, recording in fact the Tethyan
subduction more than 50 Myrs earlier (Harris et al., 2013). This evidently applies to the Jinning
event.
4.1. The accretionary Sibao orogen
The main argument for the Jiangnan orogeny suturing the Yangtze and Cathaysia
terranes is the presence, in the easternmost segment of the belt, of ophiolitic rocks and arc
terranes, the age of which are usually taken to be Neoproterozoic.
Arc and back-arc terranes in the E Jiangnan belt: The (back-arc) ophiolitic packages
are dismembered within an ophiolitic melange (the Xiwan melange) elongated along the North
Jianxi Shear Zone (NJSZ) (or Dexing- SZ), considered as a suture. The ophiolites were dated
at ca. 1.0 to 0.9 Ga by Sm-Nd whole rock isochrones (Yao J.l et al., 2013). Adakite-like
magmatic rocks are present in the melange, and one was dated at 968±23 Ma (Li Z.x et al.,
2007). Blue-schist rocks are also present in the Xiwan melange, and a glaucophane yielded
an Ar/Ar age of 866±14 Ma (in: Shu L.s et al. 2007). Obduction of the Xiwan ophiolites was
associated with partial melting in the sole, yielding undeformed “obduction-type” leucogranite
lenses intrusive in serpentinites and dated (U/Pb, Zrn) at 880±19 Ma (Li W.x et al., 2008).
The arc terrane package (Huayu arc) is separated from the foreland (Jiuling terrane)
by the NJSZ (Yao J.l et al., 2013). The Huayu arc is represented by the Shuangxiwu Group,
which is dated at ca. 970 Ma (Pingshui basalt-andesites, in: Li X.h et al., 2009). The deformed
and metamorphosed (in the greenschist facies) rocks of the Shuangxiwu Group are
overprinted by undeformed dolerite dykes with an intra-plate signature, dated at 849±7 Ma and
unconformably covered by sediments of the Nanhua rift (≤ 820 Ma) (Li X.h et al., 2009).
The Tianli Schists, which were deposited after 1530 Ma on the Yangtze margin, exhibit
polyphase deformation and low-grade metamorphism dated (Ar/Ar) from 1042±7 Ma for the
Chapter 1
53
earliest to 942±8 Ma for the latest (Li Z.x et al. 2007), in line with the existence of syn-kinematic
tonalites and granodiorites with a ca. 910 Ma age (Ye M.f et al., 2007). The age difference
between the ≥ 0.95 Ga event(s) in the Tianli Schist and the ca. 870 (≥860) Ma late events in
the Xiwan ophiolites was interpreted by Li Z.x et al., (2007) as recording a late opening to
closing cycle of the NE Jiangxi back-arc following a first collision stage recorded by the Tianli
Schists in the Jiuling terrane.
The better argument however for the existence of an old (1.0-0.9 Ga, ≥ 860 Ma)
accretionnary belt at the Yangtze-Cathaysia junction is the evidence for rocks with these ages
beneath the Jiangnan belt. Such an evidence is provided by inherited cores in the zircons of a
series of 830-800 Ma granites intrusive in the Jiangnan belt. The inherited cores yield ages in
the 1200-870 Ma range (Wang X.l et al., 2006), and thus provide evidence for the partial
melting of a concealed rocks of this age at depth.
4.2. The Jinning event: an inverted proto-Nanhua rift?
Three arguments are presented in favour of a more recent than ca. 860 Ma age for the
Jiangnan orogeny. First, intensely folded metasediments, which are unconformably covered
by the Nanhua rift sedimentary packages (≤ 820 Ma, see below), contain detrital zircons and
are associated with datable volcanic layers, both yielding sedimentation ages the youngest of
which are close to ca. 830 Ma (Wang W et al., 2012). Second, many of the bi-modal volcanic
rocks associated with the Jiangnan metasediments displaying a typical “subduction signature”,
are interpreted as recording the existence of a back-arc basin, closed towards 830 Ma (Wang
et al., 2012). Third, a series of ca. 825 Ma Crd-Bt granodiorites, which overprint the Jiangnan
metasediments, but are unconformably covered by the Nanhua sediments, exhibit typical S-
type signatures and “generally plot in the collision-related areas of the tectonic discrimination
diagrams”, which is interpreted as them being post-collisional for the just finished Jiangnan
orogenesis (Wang X.l et al., 2006).
Chapter 1
54
4.3 The ca.830 Ma granitoids and the age of the Jinning event
The age of the Jinning event is bracketed by the youngest ages provided by detrital
zircons in Sibao Group sediments and/or volcanic intercalations, on one hand, and the age of
a series of Bt-Crd granodiorites that are intrusive into these metamorphosed (low grade) and
intensely folded sediments.
A compilation of available data yields two results: (i) there is no more in a given area
than a few Myr between the youngest Sibao metasediment and the oldest grantoid intrusion,
thus tightly constraining the age of the Jinning event, and (ii) there is a diachronism between
the west and east segments of the Jiangnan belt, with a 10 Myr difference between the west
(Jinning event at ca. 840 Ma) and the east (Jinning event at ca. 830 Ma), although in each
area the duration of the granite event is about 10 Myr, with some overlapping between west
and east.
However, Yao J.l et al., (2013) claim that the end of the Jinning event could not be older
than c. 800 Ma, on the basis of the dating of detrital (magmatic) zircons in metasediments from
the Huaiyu arc “basement” (considered as an equivalent of the Sibao Group), which contain
zircons as young as 796±10 Ma. Such a result is evidently in contradiction with the preceding
data. However, as noted by Li W.x et al., (2008), the alleged “basement” phyllites and
greywackes, although deformed under very low-grade conditions, are much less deformed and
metamorphosed than the Tianli Schists, and as they rework Neoproterozoic magmatic zircons
recording both the Sibao orogeny (970-860 Ma) and the early post-orogenic magmatism (850-
830 Ma), they obviously cannot represent the Jiangnan “basement”, thus invalidating the
argument of Yao J.l et al., (2013). The deformation of the cover sediments observed in the
Huaiyu terrane must therefore be ascribed to a more recent episode, most likely the
“Caledonian” event.
Chapter 1
55
4.4 Meaning of the Jinning cycle: an inverted proto-Nanhua rift?
Other workers, on the other hand, claim that the Jiangnan orogenesis was not ended
before ca. 830 Ma (Wang X.l et al., 2006, Hu and Zhou 2012) or even 800 Ma (Yao J.l et al.,
2013). In the western end of the Jiangnan belt (N Guianxi), Wang X.l et al. (2006) have dated
a series of late granites which yield two age groups: ca. 830 Ma granodiorites (between
835.8±2.5 and 824±13 Ma) and ca. 800 Ma Bt-granites (between 804±5.2 and 794.2±8.1 Ma),
the latter, being coeval with “layered diabase” intrusions at 811.5± 4.8 Ma, are likely
representative of the bi-modal magmatism associated with the Nanhua rifting (see below); tin
mineralization is associated with the late Bt-granites. Wang X.l et al. (2006) argue that since
these granites are of the S-type and “generally plot in the collision-related areas of the tectonic
discrimination diagrams”, they must be related to the Jiangnan orogenesis. Yet, as seen above,
post-orogenic intra-plate basaltic magmas are attested in the eastern Jiangnan belt as early
as 849±6 Ma (Li X.h et al., 2009). It may be noted that. In any case, according to Wang X.l et
al., (2006), the ca. 830 granodiorites, which clearly overprint the low-grade metasediments of
the arc series (the Sibao Group), are themselves unconformably covered by the sediments of
the Nanhua rift (the Danzhou Group). The latter are not older than 745±10 Ma, the age of the
youngest zircon found by Yao J.l et al., (2013) in the greywackes of the Denshang Formation
of the Huaiyu terrane (equivalent to the Denzhou Group: Wang X.l et al., 2006). These
greywackes mainly reworked magmatic zircons with ages comprised between ca. 950 and ca.
800 Ma (Yao J.l et al., 2013), indicating that erosion of the Jiangnan belt, including the post-
orogenic granites, was the main source of these sediments.
Finally, it may be concluded that the Jiangnan orogeny mainly occurred between 1.0
and 0.9 Ga, and was definitely ended at ca. 860 Ma. As noted by Ye M.f et al., (2007), this age
may be compared with that of other 1.0-0.9 Ga orogenic belts such as the Eastern Ghâts Belt
(India) or the Rayner Province (East Antarctica), which are known to contribute to the final
welding of the Rodinia supercontinent, and thus, the Jiangnan orogeny must also be
considered as part of the late Grenvillian events.
Chapter 1
56
5. From the Nanhua Rift to the Kwangsian orogen
5.1. The ca. 830 Ma episode
Following the Jiangnan orogeny, post-orogenic granites were emplaced at ca. 825-830
Ma (see above) not only within the orogenic belt but also in the two surrounding cratonic areas,
and were immediately exhumed to be unconformably covered by sediments of the Nanhua Rift
(see below). These granites, which define a “Jiuling suite”, are clearly of crustal origin, with Hf
model ages of their zircons at ca. 1.9 Ga (Zheng Y.f et al., 2007). Intra-plate dolerite dykes
dated at 849±7 Ma in the Shuangxiwu group of the Jiuling terrane (Li X.h et al., 2009), and
ultra-mafic dykes dated at 828±7 Ma in the Huaiyu terrane (in: Wang X.l et al. 2006), both
unconformably covered by sediments of the Nanhua system, suggest that this post-orogenic
magmatism was bi-modal and could therefore testify for a first rifting stage in the SCmC (Li X.h
et al., 2009).
However, along the JSFZ, the ca. 830 Ma granites are overprinted by late sinistral
ductile shearing (Yao M.f et al., 2013 and references therein), for instance a 825±3 Ma Crd-
granite, the shearing of which was sealed by the pre-Nanhua unconformity (ca. 0.75 Ga)
(Charvet, 2013). This “late Jiangnanian” reactivation of the Jiangshan-Shaoxi fault zone, more
than 40 Myr after the end of the orogeny, is very similar to the “late-Pan-African” reactivation
of the Pan-African megashear zones in the Touareg Shield. It may thus be speculated that,
just as in the Touareg Shield, linear delamination along the reactivated JSSZ could have been
at the origin of the ca. 830 Ma magmatism in the Jiangnan orogen.
5.2. The failed Nanhua Rift
Starting very soon after the ca. 830 Ma episode, a major rifting event is attested in the
SCmC by an unconformity, siliciclastic sedimentation and a bi-modal magmatism, giving way
in the western Yangtze craton to the N-S Kangdian Rift, and in W Cathaysia and the adjacent
Jiangnan belt to the NE-trending Nanhua Rift, itself subdivided in several sub-rifts, and
Chapter 1
57
extending from the Anhua-Luocheng fault to the Wuchi-Yunkai domain (e.g., Wang Y.j et al.,
2011).
In the Guangfeng sub-rift, the volcano-sedimentary Taoyuan Formation which
unconformably covers the Tianli Schists is dated at 827±14 Ma (Li W.x et al., 2008), whereas
in the N Zhejiang sub-rift, the Shuangxiwu Group is overprinted by the Daolishan “granite-
diabase” complex, dated at 794±9 Ma and likely feeding the bi-modal volcanism (basalt-
rhyolite) of the unconformable Shangsu Formation, with similar 797±11 to 792±5 Ma ages (Li
X.h et al., 2008). In the Mayuan Complex, the Nanshan Formation is the oldest Neoproterozoic
metasedimentary formation found together with Paleoproterozoic basement rocks and is dated
at 807±12 Ma (Wan Y.s et al., 2007). The Mamianshan bi-modal metavolcanic rocks are dated
at 816±9 Ma (Li W.x et al., 2005). These data show that the rifting was initiated as early as ca.
820 Ma, with coeval sedimentation and bi-modal magmatism in the 820-800 Ma range. The
Jiangshan-Shaoxi fault zone is thought to have been one of the main rift faults at that time.
Along the ZDFZ, there are manifestations of a bi-modal volcanism, with tholeiitic basalts dated
(U-Pb Zrn) at 795± 7 Ma, and rhyolites dated at 818± 9 Ma (in: Shu L.s et al., 2007), and it is
therefore likely that this fault, too, was active in the rifting process.
The importance of the Cryogenian sedimentation in the W Cathaysia Block has been
underestimated for a long time. Recent dating in both the Wuyishan (Mayuan Group) and the
Yunkaishan domains demonstrates however that most of the metasediments in these areas
contain very young zircons of late Neoproterozoic (≤ 0.8 Ga) to early Paleozoic ages (Wan Y.s
et al., 2007, 2011). Cryogenian sedimentation and bi-modal magmatism were continued until
ca. 750 Ma (e.g., Li W.x et al., 2008) or 730 Ma (e.g., Xu X.b et al., 2011), with a second
generation of granitic intrusions at ca. 760-750 Ma defining the “Chenjiang suite” characterized
by a significant juvenile component (Zheng Y.f et al., 2007). Most of the amphibolite layers or
lenses found in the metasedimentary rocks of the Cathaysia basement (Mayuan, Badu, Yunkai
and Zhoutan Complexes) were found by Li L.m et al., (2011) to yield very consistent late
Mesoproterozoic Hf model ages at ca. 1.2-1.1 Ga, possibly pointing to a distensive event of
Chapter 1
58
this age in W Cathaysia. However, these amphibolites are more likely of Neoproterozoic age
(800-750 Ma) and would be part of the bi-modal magmatic activity related to the Nanhua rift
(Wang Y.j et al., 2012).
Following the Cryogenian rift stage, thermal subsidence lead to a thick succession of
up to 7-8 km of Ediacarian (Sinian) to middle Ordovician siliciclastic deposits (Charvet et al.,
2010 and references therein) that occupy the whole W Cathaysia and may be unconformable
onto the Cryogenian formations and granites (Zheng Y.f et al., 2007). However, from the middle
Ordovician to the Silurian, there was a northwestward (present coordinates) migration of the
depocenters onto the Yangtze Block (in: Li Z.x et al., 2010), with formation of a foreland basin
testifying for the beginning of the Kwangsian orogenesis.
6. The “South China Caledonian Fold belt”: Kwangsian orogeny
Everywhere in E Cathaysia, there is a strong unconformity below the middle Devonian,
testifying for a major “Caledonian” tectono-metamorphic event in the Middle Paleozoic.
The Kwangsian orogen is a double verging NE-trending belt, interpreted as resulting from the
inversion of the Nanhua Rift (Charvet et al., 2010; Charvet, 2013) or (less convincingly) from
an intracontinental subduction process (Faure et al. 2009). The Jiangshan-Shaoxi fault was
reactivated as a thrust fault onto the Yangtze Block (e.g., Shu L.s et al., 2007, Li Z.x et al.,
2010), as was also reactivated the ZDFZ (Wang Y.j et al., 2013). From the metamorphic point
of view, it is highly dissymmetrical, with mainly low- to very-low grade Ediacarian (Sinian) and
Cambrian-Ordovician metasediments to the west, and a high-grade metamorphic core (the
Wuyi-Yunkai belt) running along the ZDFZ to the east (e.g., Yao W.h et al., 2012), and
comprising most of the (reworked) basement outcrops. This was interpreted by Faure M et al.,
(2009) as the result of a decollement between the Neoproterozoic-Ordoviciaan cover and the
reworked older Precambrian basement, although, according to Lin W et al., (2008), there is a
continuum between the schistosity of the low-grade and high-grade rocks. Moreover, it has
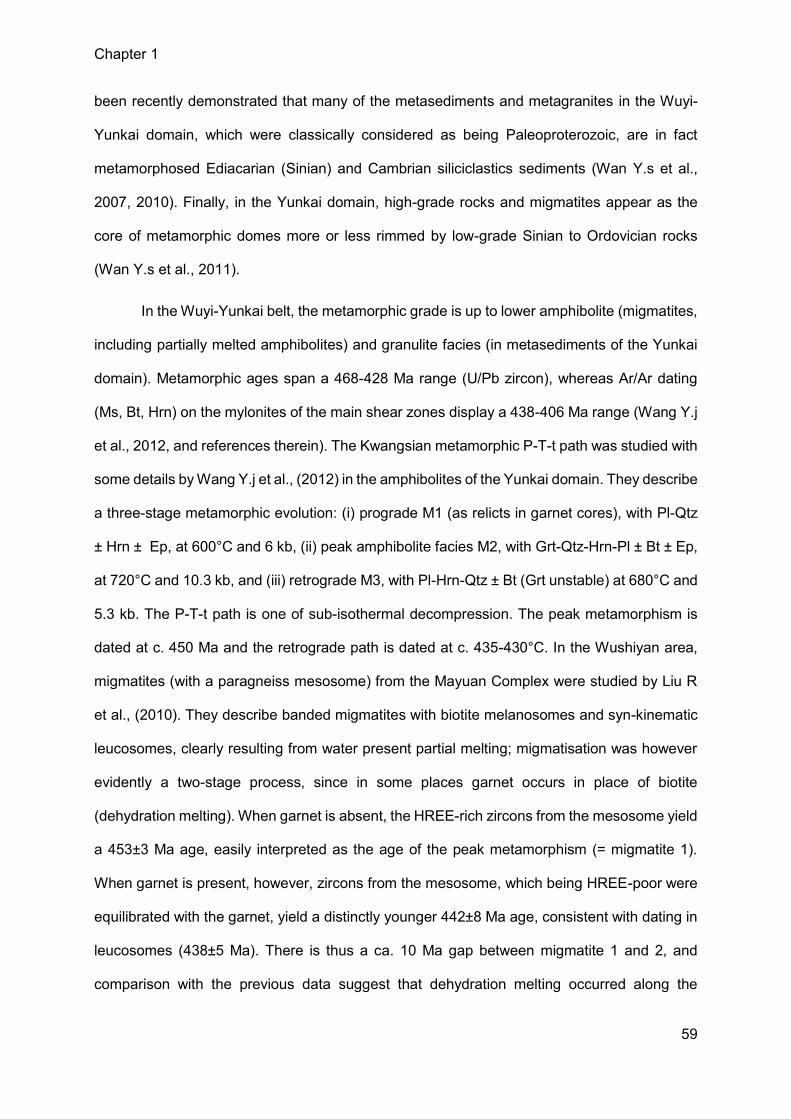
Chapter 1
59
been recently demonstrated that many of the metasediments and metagranites in the Wuyi-
Yunkai domain, which were classically considered as being Paleoproterozoic, are in fact
metamorphosed Ediacarian (Sinian) and Cambrian siliciclastics sediments (Wan Y.s et al.,
2007, 2010). Finally, in the Yunkai domain, high-grade rocks and migmatites appear as the
core of metamorphic domes more or less rimmed by low-grade Sinian to Ordovician rocks
(Wan Y.s et al., 2011).
In the Wuyi-Yunkai belt, the metamorphic grade is up to lower amphibolite (migmatites,
including partially melted amphibolites) and granulite facies (in metasediments of the Yunkai
domain). Metamorphic ages span a 468-428 Ma range (U/Pb zircon), whereas Ar/Ar dating
(Ms, Bt, Hrn) on the mylonites of the main shear zones display a 438-406 Ma range (Wang Y.j
et al., 2012, and references therein). The Kwangsian metamorphic P-T-t path was studied with
some details by Wang Y.j et al., (2012) in the amphibolites of the Yunkai domain. They describe
a three-stage metamorphic evolution: (i) prograde M1 (as relicts in garnet cores), with Pl-Qtz
± Hrn ± Ep, at 600°C and 6 kb, (ii) peak amphibolite facies M2, with Grt-Qtz-Hrn-Pl ± Bt ± Ep,
at 720°C and 10.3 kb, and (iii) retrograde M3, with Pl-Hrn-Qtz ± Bt (Grt unstable) at 680°C and
5.3 kb. The P-T-t path is one of sub-isothermal decompression. The peak metamorphism is
dated at c. 450 Ma and the retrograde path is dated at c. 435-430°C. In the Wushiyan area,
migmatites (with a paragneiss mesosome) from the Mayuan Complex were studied by Liu R
et al., (2010). They describe banded migmatites with biotite melanosomes and syn-kinematic
leucosomes, clearly resulting from water present partial melting; migmatisation was however
evidently a two-stage process, since in some places garnet occurs in place of biotite
(dehydration melting). When garnet is absent, the HREE-rich zircons from the mesosome yield
a 453±3 Ma age, easily interpreted as the age of the peak metamorphism (= migmatite 1).
When garnet is present, however, zircons from the mesosome, which being HREE-poor were
equilibrated with the garnet, yield a distinctly younger 442±8 Ma age, consistent with dating in
leucosomes (438±5 Ma). There is thus a ca. 10 Ma gap between migmatite 1 and 2, and
comparison with the previous data suggest that dehydration melting occurred along the
Chapter 1
60
exhumation path. Describing the migmatite domes in the Yunkai area, Wan et al., (2010) state
that “the magmatic component decreases gradually from the center to the margin” where are
exposed the banded syn-kinematic migmatites, thus confirming that an important melt
generation process (likely migmatite 2) overprinted the earlier migmatites. According to Lin W
et al., (2008) this is in the Yunkai domain the result of “a post-orogenic syn-migmatite
extensional event” following the “top-to-NW ductile shearing” associated with the peak
amphibolite facies. In the Chencai Complex, Li Z.x et al., (2010) describe a similar evolution,
with a four-stage metamorphic process: (i) prograde M1 (relicts in garnet cores), with Chl-Ms-
Bt-Grt, (ii) peak M2 (regional schistosity), with Ms-Bt-Ky-Grt, (iii) static M3, with Sil (at the
expense of garnet), and (iv) retrograde and post-kinematic M4, with Chl. The P-T-t path is also
one of sub-isothermal decompression, but with evidence of thermal increase at low pressure,
implying heat input in the orogen. A garnet micaschist yields a peak metamorphism age of
447±7 Ma, while a Sil migmatite (paragneiss protolith) was dated at 433±3 Ma (Li Z.x et al.,
2010). migmatisation (425 Ma in the Nanling Ranges: Xu X.s et al., 2005). In the Wuyi domain,
the peak metamorphism of a Neoproterozoic amphibolite (Hrn-Pl-Qtz) was dated at 443±6 Ma,
consistent with the 452±8 Ma age of an overprinting undeformed granite vein (Li Z.x et al.,
2010), i.e., a c. 447 Ma age for the peak. In several places, the amphibolites suffered
migmatization, owing to Hrn-dehydration melting (Li L.m et al., 2011). As hornblende
destruction releases zirconium, some zircons in the amphibolite may yield the migmatisation
age. Metamorphic zircons yield ages of 446±5, 435±2 and 434±4 Ma (Li L.m et al., 2011), the
former being clearly the amphibolite facies age, and the two others evidently recording the
hornblende breakdown. Summarizing, it appears that the P-T-t path in the Wuyi-Yunkai high-
grade domain was characterized by a syntectonic prograde stage implying both significant
crustal thickening and heat input (the highest conditions recorded in the granulites being 750-
880°C and 11-10 kb, in: Li L.m et al., 2011), at ca. 450 Ma, followed by a quasi-isothermal
decompression path allowing water-present partial melting in the paragneisses at the onset of
the exhumation and, owing to a new heat input, a second post-kinematic melting stage
involving biotite and hornblend dehydration melting, at ca. 440-435 Ma. Evidence of heat input
Chapter 1
61
in the Kwangsian orogen is provided by the observation of mafic intrusions coeval with the
tectono-metamorphic evolution. At the beginning of the evolution, the Wugongshan appinites
were emplaced along the Jiangshan-Shiaoxi fault at 473±3 and 452±2 Ma; they were derived
from a metasomatised SCLM (Zhong Y.f et al., 2014). High-Mg basalts (the Chayuanshua
suite) were recently described (Yao W.h et al., 2012); they are late-orogenic, being
unconformably deposited onto Cambro-Ordovician sediments, but tilted under the, themselves
unconformable, middle Devonian conglomerates. They were dated at ca. 435 Ma (Yao W.h et
al., 2012), i.e., were coeval with the second (dehydration melting) migmatite event. They are
interpreted as issued from a basaltic underplating resulting from the delamination of the
eclogitised lower crust, following the crustal thickening episode (Yao W.h et al., 2012; Li Z.x et
al., 2013; Xia Y et al., 2014) and this may be easily correlated with the late migmatisation
event.
Kwangsian granites are abundant, and subdivide into “gneissoid” granites, for the most
part located in the high-grade Wuyi-Yunkai domain, and “massive” granites, mostly found to
the west of the Heynan-Guangfeng fault (Wang Y.j et al., 2011), i.e., within the low-grade
domain. The latter cover 20 000 km2 (Li L.m et al., 2011), while the former are likely to be
numerous, having been by the past more or less confused with Paleoproterozoic granites
(Wang Y.j et al., 2011). To the east of the Jiangshan-Shaoxi fault massive granites were
emplaced from 454±2 to 382±2 Ma (Zhang F.f et al., 2012, Li Z.x et al., 2013), with however
most of them around 430 Ma, while to the west of the fault, they are younger, spanning only
the 429±11 to 400±4 Ma, with a peak at ca. 420 Ma (Zhang F,f et al., 2012). The “gneissoid”
granites (a confuse notion, including magmatic foliation and subsolidus plastic deformation:
Wang Y.j et al., 2011) span a similar age interval, and they were in the same way mainly
emplaced between 435 and 430 Ma (Wang Y.j et al., 2011). Massive and “gneissoid” granites
both contain paragneiss or amphibolite enclaves (Wang Y.j et al., 2011; Zhang F.f et al., 2012),
in good agreement with their dating as mainly post-orogenic. The “gneissoid” granites are not,
therefore, really syn-orogenic, since the main prograde deformation was at c. 450 Ma; they are
Chapter 1
62
syn-kinematic of a shearing episode, at ca. 830 Ma (Xu X.b et al., 2011), and it may be
suspected that this event was correlated with the extensional event – in other terms, although
the word is not used for the Kwangsian orogen by the Chinese workers, the migmatitic domes
and their related “gneissic” granites could well have been metamorphic core complexes. By
the way, Wan Y.s et al., (2010 and references therein) interpret the whole Kwangsian orogen
as “extension-detachment” related (Yao W.h et al., 2012). In any case, it is evident that the
main episode of granite magmatism in the Kwangsian orogen was post-orogenic and coeval
with intense migmatisation and mafic magmatism.
Most Kwangsian granites, either massive or “gneissoid”, are of the “S”-type (Ms-, Tur-
and Grt-granites) and derive of partial melting of the Cathaysian crust, with negligible juvenile
components (Zhang F.f et al., 2012, Xia Y et al., 2014). A few monzogranite and granodiorite
intrusions, only found in the core of the high-grade Wuyi-Yunkai domain, display a significant
juvenile component, and were formed at a higher temperature (810-850°C) than the other
Kwangsian granites (700-830°C) (Xia Y et al., 2014). These granites are among the youngest
in the orogen, being dated at ca. 410 Ma, and they reworked the earlier granites, since they
contain inherited zircon cores at 436±5 Ma (Xia Y et al., 2014). They point to a
permanence/renewal of the mafic underplating at ca. 410 Ma and span a 440-382 (± 2) Ma
interval (Li Z.x et al., 2013 and references therein), with however a marked late-orogenic “peak”
at 440-415 Ma (Yao W.h et al., 2012, and references therein). They consequently post-date
the peak metamorphism (460-445 Ma: Yao W.h et al., 2012 and references therein) but are
still coeval with 446±5 to 423±2 Ma in several amphibolites: Li L.m et al., 2011). The granites
are mainly of the “S”-type and result of partial melting of the Paleoproterozoic crust, with only
a very minor juvenile component, mainly represented by scarce coeval mafic enclaves,
whereas a few intrusions, only found in the core of the high-grade Wuyi-Yunkai belt, display a
significant juvenile contribution (Xia Y et al., 2014).
Chapter 1
63
The origin of the Kwangsian orogeny remains unclear. Most workers call for “far-field
stress related to collision-subduction systems beyond the southern margin of the South China
Block” (Wang Y.j et al., 2012 and references therein), i.e., a Paleotethysian control.
7. The Indosinian events
A strong unconformity separates the Late Paleozoic to Middle Triassic shallow-platform
sediments (2.5 to 3 km) from the overlying Mesozoic deposits including the late Triassic
conglomerates, testifying for an Indo-Sinian tectonic event.
In the Cathaysia Block the Indo-Sinian events are observed in the same area as the
“Caledonian” deformations that they overprint; they are however more expanded, being also
observed in the Yangtze Block, where they overprint the Jiangnan belt. The early Indo-Sinian
events include compressive tectonic deformations (fold-and-thrust belts), metamorphism and
granite magmatism, the latter spanning a 265-205 Ma interval (Mao et al. 2013 and references
therein) and covering 14,300 km2 (Sun W.d et al., 2012). The great NE-SW faults are
(re)activated during the Indo-Sinian episode.
There are in fact two Indo-Sinian magmatic episodes: a first one (245-230 Ma) with I-
type granites, is associated with subduction and formation of the Song-Ma suture, to the SW
of the SCC; a second one (218-210 Ma) with “S”-type Ms-, Crd- and Tur-granites, is pervasive
in Cathaysia (Shu L.s et al., 2008 and references therein). The latter are associated with a first
cycle of Nb-Ta mineralization in the Nanling Ranges (Mao et al., 2013), with several RMG
(e.g., Limu granites), organized in three E-W trending belts about 30-40 km wide according to
Shu L.s et al. (2007). This is however more evident for the Early Yanshanian granites. It may
be recalled that the Mesoproterozoic Lanhe gneiss, in the Nanling Ranges, display E-W
trending ductile shearing (Xu X.s et al., 2005).
The Indo-Sinian deformation is partitioned, with several NE-trending fold-and-thrust
belts separated by zones of weaker deformations with only “Jura style” folding (Shu L.s et al.,
Chapter 1
64
2007); most proeminent are the Xuefengshan and Jiulingshan fold and thrust belts, witin the
Jiangnan orogen, and the Nanling fold and thrust belt, close to the ZDFZ, all with NW to NNW
vergencies.
Following the compressive events, distensive conditions are realized from 200 to 180
Ma (e.g., Zaw et al., 2007), with the formation of several metamorphic core complexes (Faure
M et al., 1996, Shu L.s et al., 2007). According to Shu L.s et al., (2007), the three E-W belts of
granitic intrusions testify for three linear zones of crustal thinning in the Nanling Ranges. It is
not clear if the high-grade metamorphism recorded in several areas (and significantly in the
former Wuyi-Yunkai belt) is related with the distensive events, although it is likely. In the Badu
Complexe, Xia Y et al., (2012) report ages of ca. 230 Ma and consider that granulite facies
was attained, with the coeval intrusion of a quartz monzonite (226±1.4 Ma).
The Indo-Sinian intracontinental event in the SCC is likely the result (“far field effects”)
of the penecontemporaneous collisions of (i) the SCC and the North China Craton (Qinling-
Dabie-Sulu orogenic belt, with the ca. 220 Ma UHP metamorphism), and (ii) the SCC and the
Indo-Sinian Block (Song-Ma suture, about 245-230 Ma) (e.g., Wang D.z et al., 2001, Shu L.s
et al., 2008).
According to Li Z.x and Li X.h (2007) and Li Z.x et al., (2013), the Indo-Sinian crustal
thickening was associated with the flat subduction of the Paleo-Pacific (Izanagi) plate, in the
same way as the Laramian Cordilleran orogeny was related to the Farallon plate subduction.
8. The Yanshanian events
From the Early Jurassic to the late Cretaceous, the Tethysian tectonic was progressively
replaced by the Paleo-Pacific regime (J1 period) with the initiation of extensional basin and
range tectonics in response to flat subduction of the Paleo-Pacific plate under the eastern
Asian continental margin along the Japan Trench (Wang H.z and Mo X.x, 1995; Wang D.z and
Zhou X.m, 2002; Li Z.x and Li X.h, 2007). Evidences of this regime are mainly observed in the
Chapter 1
65
coastal areas of the SCB with the uplift of the Wuyi range (Shu L.s et al., 2009).
The Basin and Range structure are mainly composed of Precambrian basement and
paleozoic meta-sedimentary rocks. Two depositional regimes coexist at the early J1/2 period
(200-165 Ma): the Tethysian regime composed of E-W trending carbonates and flyschs and
the paleo-pacific regime that consists of NE-trending volcanoclastic rocks and red beds. In the
Nanling belt, large E-W trending S-type granitoid zones are emplaced (Zhou J.c et al., 2006)
and are considered as issued from the Tethysian regime or the post-collision Tethysian belt
(Shu L.s et al., 2009).
The Paleo-Pacific plate subduction induced the remobilization of intracontinental faults
previously formed during the Tethysian regime, and magmatism. The appearance of A-type
granite at ca. 190 Ma was interpreted as the beginning of the slab break-off which evolved into
large-scale anorogenic magmatism (Li Z.x and Li X.h, 2007). Igneous rocks, mainly observed
in the eastern Nanling Range, are interpreted as evidences of the transition from the Tethysian
compressional regime to the Paleo-Pacific extension regime (Wang D.z and Shu L.s, 2012).
This change from to Basin and Range settings was interpreted as originated from the
lithospheric rebound following the delamination of the flat slab (Li Z.x and Li X.h, 2007).
During the J2 and J3 periods (165-150 Ma), the Nanling-Wuyishan belt experienced large-
scale granitic magmatism from 180 to 145 Ma (Zhou J.c et al., 2006) that controlled the
formation of granite ranges and fault-depression basins. The first stage (180-160 Ma) is
interpreted as caused from underplating of basaltic magmas that provided the necessary heat
input for anatexis of Proterozoic sedimentary rocks (Wang D.z and Zhou X.m, 2002). The
second stage (160-145 Ma) yields NE-trending batholith mainly exposed in the eastern Nanling
Range and are constrained by the Paleo-Pacific plate subduction regime (Wang D.z and Shu
L.s, 2012). From the 190 to 150 Ma, the magmatism progressively propagated from the center
of the orogen to the broad inland region where fractionated I-type granites are associated with
A-type granites and rift-type syenite during the slab rollback (Li Z.x and Li X.h, 2007)
At the K1 period (150-110 Ma), all the SCB is affected by the influence of the Paleo-
Chapter 1
66
Pacific plate subduction that gave rise to intracontinental deformation metamorphism inducing
a wide intracontinental fold-and-thrust belt (Lin W et al., 2008; Zhang Y.q et al., 2008; Xu X.b
et al., 2009). The low-angle subduction reaches the Chenzhou-Linwu (CL) fault and the
Yangtze River at ca. 140 Ma (Ling et al., 2009) and creates a back-arc extensional environment
in the whole SCB (Wang D.z and Zhou X.m, 2002; Shu L.s and Zhou x.m, 2002; Zhou X.m
and Li W.x, 2000; Zhou J.c et al., 2006). This regime induced partial melting of the mantle of
the upper slab, crustal thinning and underplating of basaltic rocks associated to upwelling of
mixed crust-mantle magmas.
At ca. 136Ma, the thickened SCB lithosphere reached a limiting crustal thickness and started
to collapse (Li J.h et al., 2013). From 136 to 118 Ma, the SCB is under an extensional regime
followed by tectonic inversion between 117-108 Ma and these alternating settings will repeat
at ca. 107 Ma (Li J.h, 2014). These variations are explained by the variation of the dip angle
of the subducting slab and rate of convergence across the Paleo-Pacific subduction boundary
(Li J.h, 2014). At ca. 100 Ma, a short-term uplift occurred in the coastal areas (i.e. uplift of pre-
Cretaceous granites) in response to the possible collision between the eastern asia continental
margin and the Philippine plate (Charvet J et al., 1985, 1999; Maruyama S et al., 1997; Shu
L.s et al., 2004, 2009).
The K2 period (110-70 Ma) starts at the end of this uplift period with the migration of the
subduction zone of the Pacific plate eastward toward the high-angle Japan and Maliana
trenchs (Zhou X.m and Li W.x, 2000; Shu L.s and Zhou X.m, 2002). This extension generated
multiple NE-NNE striking extensional basins and produced A-type granites and bimodal
volcanism (Shu L.s et al., 2009). From this period, the subduction-type magmatism produced
by melting of the subducting slab migrated from the SCB and thus, granitic magmatism ceased
at ca. 90 Ma (Wang D.z and Zhou X.m, 2002). The extensional settings were followed by
transpressional regime at ca. 86 Ma and caused a second tectonic inversion of the K2 basins
as expressed by the folding and strike-slip faulting observed in the SCB and the exhumation
of the Jiangnan belt (Tian M et al., 2010; Shi W et al., 2012; Tang S.l et al., 2013).
Chapter 1
67
9. Magmatism during the Jurassic-Cretaceous period
9.1 Introduction to the diagrams
Two types of diagrams are used in the following. These diagrams aim to combine
interpretations of bulk-rock and mineralogical analysis for an integrated study. Both diagrams
are constructed from oxides analyses turned into millications and then used to build vectors
that could project analyses in a given mineralogical reference.
The first diagram is named A-B diagram and was constructed by Debon and Le Fort (1983)
(Figure 14A). This diagram is binary opposes the aluminous character to the ferro-magnesian
charge by defining two vectors: A = Al - (Na+K+2Ca) and B = Fe+Ti+Mg and discriminates the
metaluminous domain (A negative) from the peraluminous domain (A positive). Here, the
metaluminous domain includes all subaluminous, metaluminous and peralkaline rocks. The
diagram can be divided in different sectors by lines rooted at the origin. As quartz and feldspars
are located at the origin, the location of the rock in the diagram is representative of its
characteristics minerals. The main granite lineages can be discriminated as the identification
of the three RMG classes defined by Linnen and Cuney (2005). However, this type of
representation is highly sensitive to hydrothermal alteration.
In order to deconvolute this possible inconvenience, we combined our A-B results with a
second diagram called (QBF)3 by de La Roche et al. (1964) (Figure 14B). This ternary diagram
defines three vectors:
- Q3 = Si+7Al/2-5Ca-13(Na+K)/2,
- B3 = -7Al/2+7Ca+7(K+Na)/2+8(Fe+Ti+Mg)/3,
- F3 = Al+3Ca+4(K+Na)-5(Fe+Ti+Mg)/3.
These vectors are then normalized to the sum of the three vectors in order to create the
three poles Q*3, B*3 and F*3. The (QBF)*3 representation tends to disperse the alteration
trends parallel to the differentiation trends in the A-B diagram (i.e. greisenization trend).
Chapter 1
68
Figure 14. Theorical diagrams used to combine bulk-rock and mineralogical analysis. (A) A-B binary diagram constructed by Debon and Lefort (1983), (B) (QBF)*3 ternary diagram constructed by de La Roche et al., 1964.
9.2 The J1/2 period (200-165Ma)
Whole-rock analysis of rocks dated between 200 and 165 Ma are various and described
mafic compositions (basalts and gabbros), intermediate compositions (granodiorite and
syenite) and felsic compositions (granite and rhyolite) (Figure 15, Appendix A).
The mafic melts evolution is define by two distinct trends associated with basalt and gabbro
analysis respectively (Figure 15). The basalt trend is mainly defined by the Changpu formation
which associated with many basaltic magmas in the same area. Their geochemical
characteristics describe an asthenospheric mantle origin, fractionation crystallization and
variable degrees of contamination (Cen T et al., 2016). The grabbroic trend is defined by the
Xialan and Xianli grabbros. The Xianli grabbros are associated to the Wengong granite and
are described as derived from the melting of a depleted asthenospheric mantle source and
also indicate fractional crystallization of the parental magma combined with variable degrees
Chapter 1
69
of crustal contamination (Zhu W.g et al., 2010). The Xialan gabbro are also interpreted as
derived from the asthenospheric mantle and subsequently modified by interaction with the
overlying SCLM and contamination with the upper crust (Bai Z.j et al., 2015).
The felsic melts also display two groups of melts defining two sources of granites, each
associated to a distinct mafic trend (Figure 15). The granitic pole associated to rhyolite
compositions is mainly defined by the Waitun granites that are interpreted of crustal origin,
derived from partial melting of a mixed source of meta-igneous and metasedimentary material,
triggered by underplating of basaltic magmas (Wang G.c et al., 2016). The A-B and (QBF)*3
diagrams are in accordance with this interpretation. The other granitic pole is located at the
centre of the A-B diagram and is depleted in the B*3 end-member and is mainly defined by the
Wengong granite. This granite is described as a peraluminous A2-type granite formed from
partial melting of the lower crust and mixed with mantle-derived basaltic magmas (Zhu W.g et
al., 2010).
The intermediate compositions of granodiorite are aligned in trends between the felsic
and mafic end-members (Figure 15). The granodiorite shows interaction between granitic and
basaltic magmas. This interaction is in the continuity of the two end-members and is likely to
define a mixing trend typical of I-type suites. On the other hand, syenites are the ultimate end-
member of the gabbroic magmas but do not correlate to any felsic magma (Figure 15). In that
case, this trend is not likely to represent mixing and is more likely to represent an A2-type suite
associated with the A2-type Wengong intrusion.
9.3 The J3 period (165-150Ma)
Whole-rock analysis of basalt, diorite, gabbro, MME, syenite lamprophyre and granite
described heterogeneous compositions among the 165-150 Ma period (Figure 16, Appendix
A).
Chapter 1
70
Figure 15. Schematic representation of the whole-rock analysis compilation dated between 200 and 165 Ma. See details in Appendix B1.
Chapter 1
71
The mafic melts describe one trend composed of basalts, diorites and gabbros (Figure
16). The basaltic trend is defined by the Daoxian basalts which are described as alkaline and
tholeiitic series. These basalts were formed from partial melting of shallow lithospheric mantle
in response to thermal perturbations associated with rifting and continental arc settings (Jiang
Y.h et al., 2009). The gabbros and diorite are described as the result of the mixing of mantle-
derived juvenile basaltic magma and a magma issued from the dehydration partial melting of
lower crust basaltic rocks (Xu X.s et al., 2007).
The felsic melts described by granite analysis show three trends converging toward
one pole which is represented by numerous granite as, for example, the Mufushan complex,
the Jiufeng complex and the Guposhan complex (Figure 16). These magmas are characterized
as originated from a crustal-derived metasedimentary source or A-type granites reworked by
basaltic mantle-derived magmas (Wang L.x et al., 2014; Huang H.q et al., 2015; Wang Z et
al., 2014).
The Qitianling and Guposhan complex from the three intermediate magmatic trends
(Figure 16). These trends are composed of granite and MME. These MME, aligned with their
respective granitic associated rocks, show a partial mixing with the granites. This interpretation
was also exposed by Wang Z. et al. (2014) and is interpreted as triggered by underplating of
mafic magma from upwelling asthenosphere and/or metasomatised lithospheric mantle in an
extensive regime. The three trends are bounded by the two mafic trends observed in the J1/2
period, one of which is observable in the J3 period.
One sample of syenite only was found in the literature (Shiling syenite, Xu X.s et al.,
2007) and seems disconnected from all trends. More data need to be compiled before
interpretation.
9.4 The K1 period (150-110Ma)
The whole-rock analysis associated to the 150-110 Ma in the literature are associated
to granites, rhyolites, syenites, diabase, basalts and gabbros (Figure 17, Appendix A).
Chapter 1
72
Figure 16. Schematic representation of the whole-rock analysis compilation dated between 165-150 Ma. See details in Appendix B2.
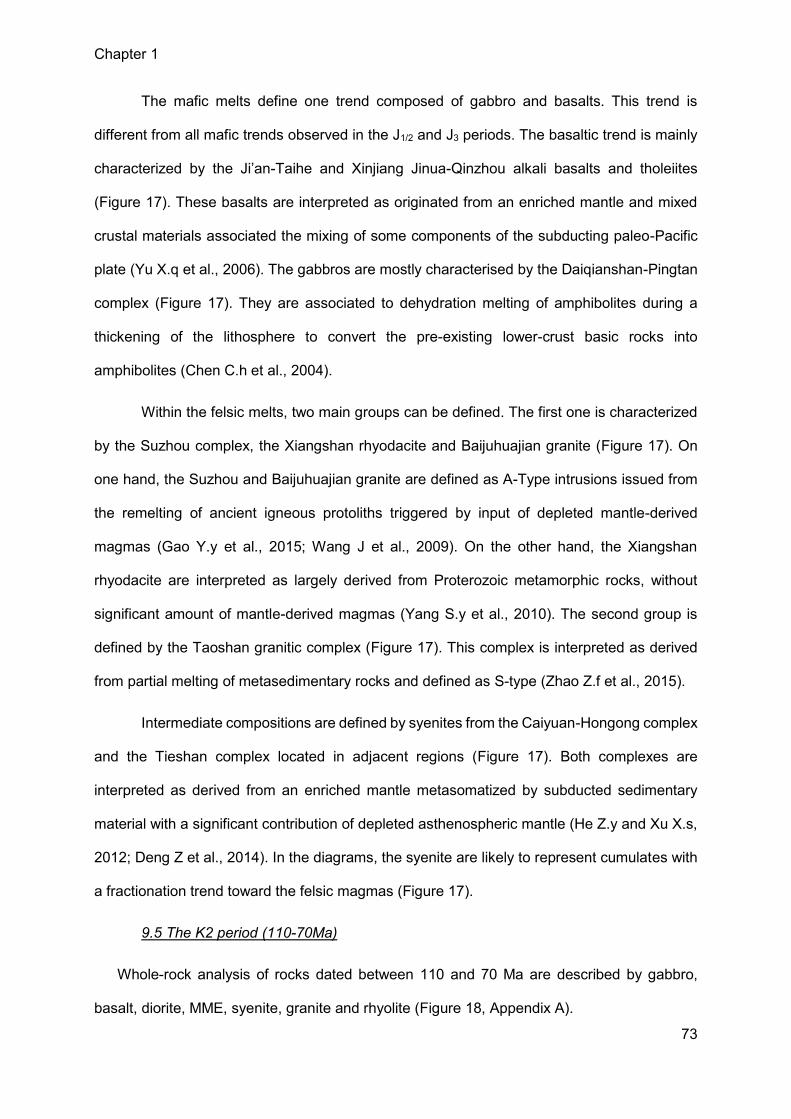
Chapter 1
73
The mafic melts define one trend composed of gabbro and basalts. This trend is
different from all mafic trends observed in the J1/2 and J3 periods. The basaltic trend is mainly
characterized by the Ji’an-Taihe and Xinjiang Jinua-Qinzhou alkali basalts and tholeiites
(Figure 17). These basalts are interpreted as originated from an enriched mantle and mixed
crustal materials associated the mixing of some components of the subducting paleo-Pacific
plate (Yu X.q et al., 2006). The gabbros are mostly characterised by the Daiqianshan-Pingtan
complex (Figure 17). They are associated to dehydration melting of amphibolites during a
thickening of the lithosphere to convert the pre-existing lower-crust basic rocks into
amphibolites (Chen C.h et al., 2004).
Within the felsic melts, two main groups can be defined. The first one is characterized
by the Suzhou complex, the Xiangshan rhyodacite and Baijuhuajian granite (Figure 17). On
one hand, the Suzhou and Baijuhuajian granite are defined as A-Type intrusions issued from
the remelting of ancient igneous protoliths triggered by input of depleted mantle-derived
magmas (Gao Y.y et al., 2015; Wang J et al., 2009). On the other hand, the Xiangshan
rhyodacite are interpreted as largely derived from Proterozoic metamorphic rocks, without
significant amount of mantle-derived magmas (Yang S.y et al., 2010). The second group is
defined by the Taoshan granitic complex (Figure 17). This complex is interpreted as derived
from partial melting of metasedimentary rocks and defined as S-type (Zhao Z.f et al., 2015).
Intermediate compositions are defined by syenites from the Caiyuan-Hongong complex
and the Tieshan complex located in adjacent regions (Figure 17). Both complexes are
interpreted as derived from an enriched mantle metasomatized by subducted sedimentary
material with a significant contribution of depleted asthenospheric mantle (He Z.y and Xu X.s,
2012; Deng Z et al., 2014). In the diagrams, the syenite are likely to represent cumulates with
a fractionation trend toward the felsic magmas (Figure 17).
9.5 The K2 period (110-70Ma)
Whole-rock analysis of rocks dated between 110 and 70 Ma are described by gabbro,
basalt, diorite, MME, syenite, granite and rhyolite (Figure 18, Appendix A).
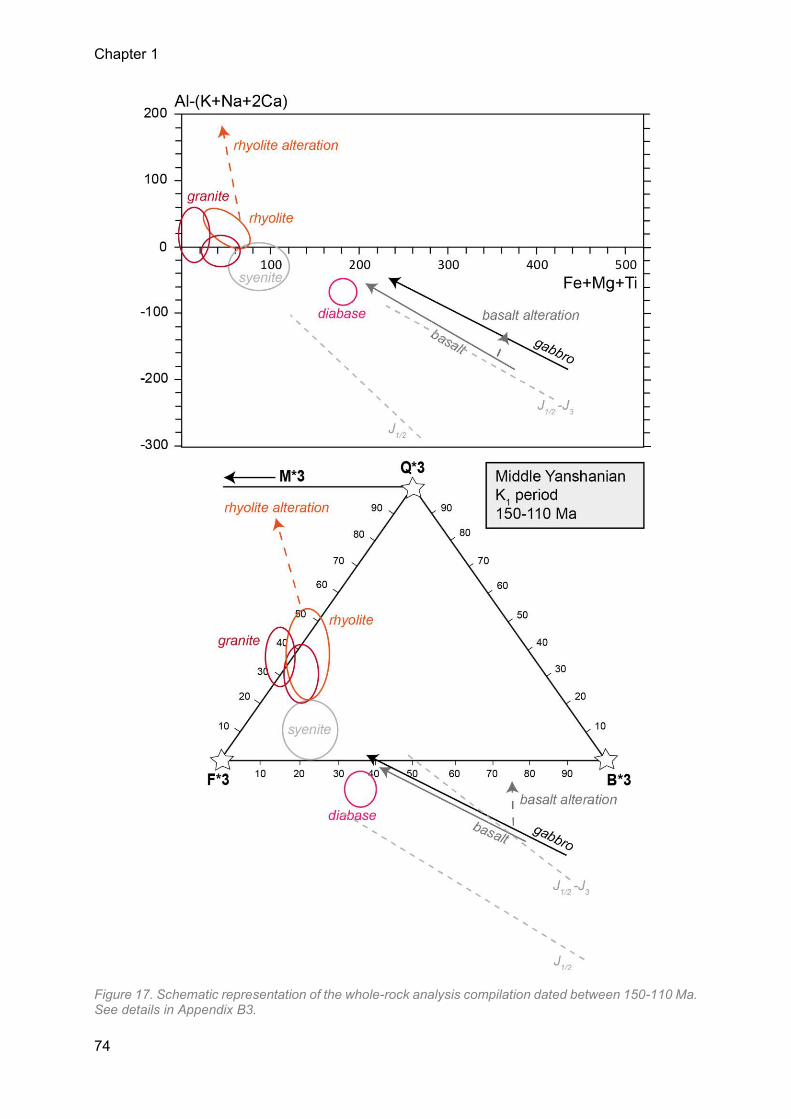
Chapter 1
74
Figure 17. Schematic representation of the whole-rock analysis compilation dated between 150-110 Ma. See details in Appendix B3.
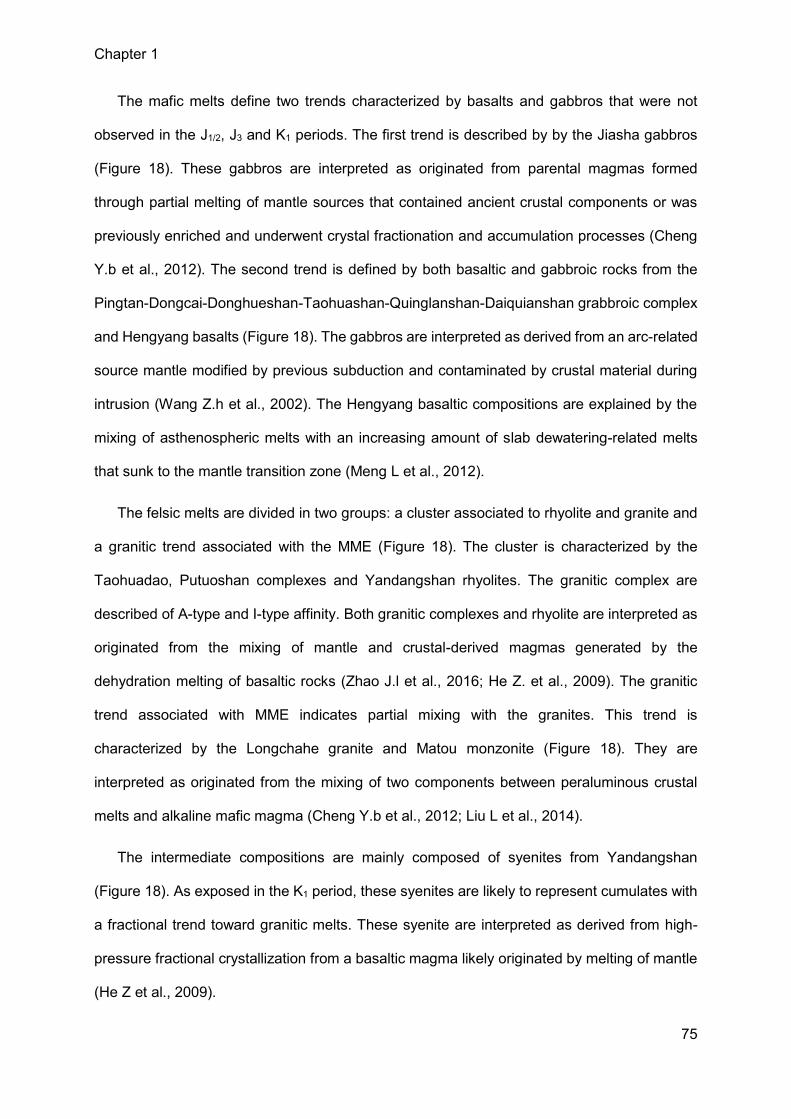
Chapter 1
75
The mafic melts define two trends characterized by basalts and gabbros that were not
observed in the J1/2, J3 and K1 periods. The first trend is described by by the Jiasha gabbros
(Figure 18). These gabbros are interpreted as originated from parental magmas formed
through partial melting of mantle sources that contained ancient crustal components or was
previously enriched and underwent crystal fractionation and accumulation processes (Cheng
Y.b et al., 2012). The second trend is defined by both basaltic and gabbroic rocks from the
Pingtan-Dongcai-Donghueshan-Taohuashan-Quinglanshan-Daiquianshan grabbroic complex
and Hengyang basalts (Figure 18). The gabbros are interpreted as derived from an arc-related
source mantle modified by previous subduction and contaminated by crustal material during
intrusion (Wang Z.h et al., 2002). The Hengyang basaltic compositions are explained by the
mixing of asthenospheric melts with an increasing amount of slab dewatering-related melts
that sunk to the mantle transition zone (Meng L et al., 2012).
The felsic melts are divided in two groups: a cluster associated to rhyolite and granite and
a granitic trend associated with the MME (Figure 18). The cluster is characterized by the
Taohuadao, Putuoshan complexes and Yandangshan rhyolites. The granitic complex are
described of A-type and I-type affinity. Both granitic complexes and rhyolite are interpreted as
originated from the mixing of mantle and crustal-derived magmas generated by the
dehydration melting of basaltic rocks (Zhao J.l et al., 2016; He Z. et al., 2009). The granitic
trend associated with MME indicates partial mixing with the granites. This trend is
characterized by the Longchahe granite and Matou monzonite (Figure 18). They are
interpreted as originated from the mixing of two components between peraluminous crustal
melts and alkaline mafic magma (Cheng Y.b et al., 2012; Liu L et al., 2014).
The intermediate compositions are mainly composed of syenites from Yandangshan
(Figure 18). As exposed in the K1 period, these syenites are likely to represent cumulates with
a fractional trend toward granitic melts. These syenite are interpreted as derived from high-
pressure fractional crystallization from a basaltic magma likely originated by melting of mantle
(He Z et al., 2009).
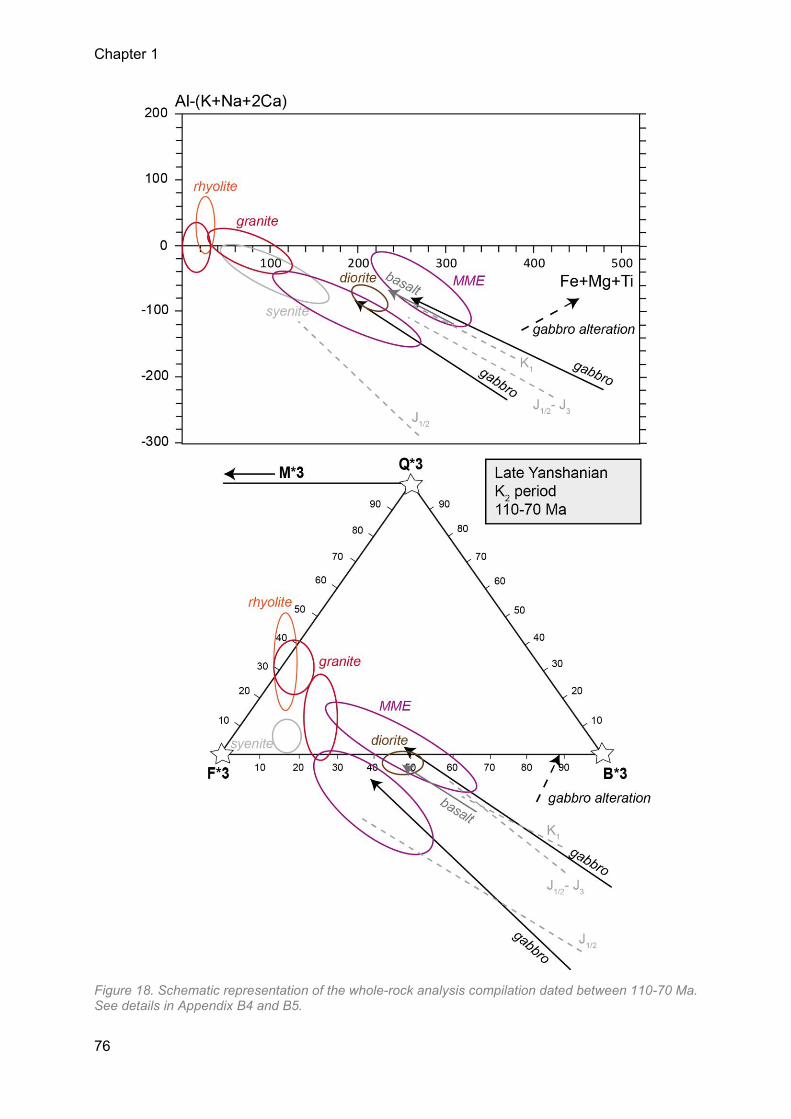
Chapter 1
76
Figure 18. Schematic representation of the whole-rock analysis compilation dated between 110-70 Ma. See details in Appendix B4 and B5.
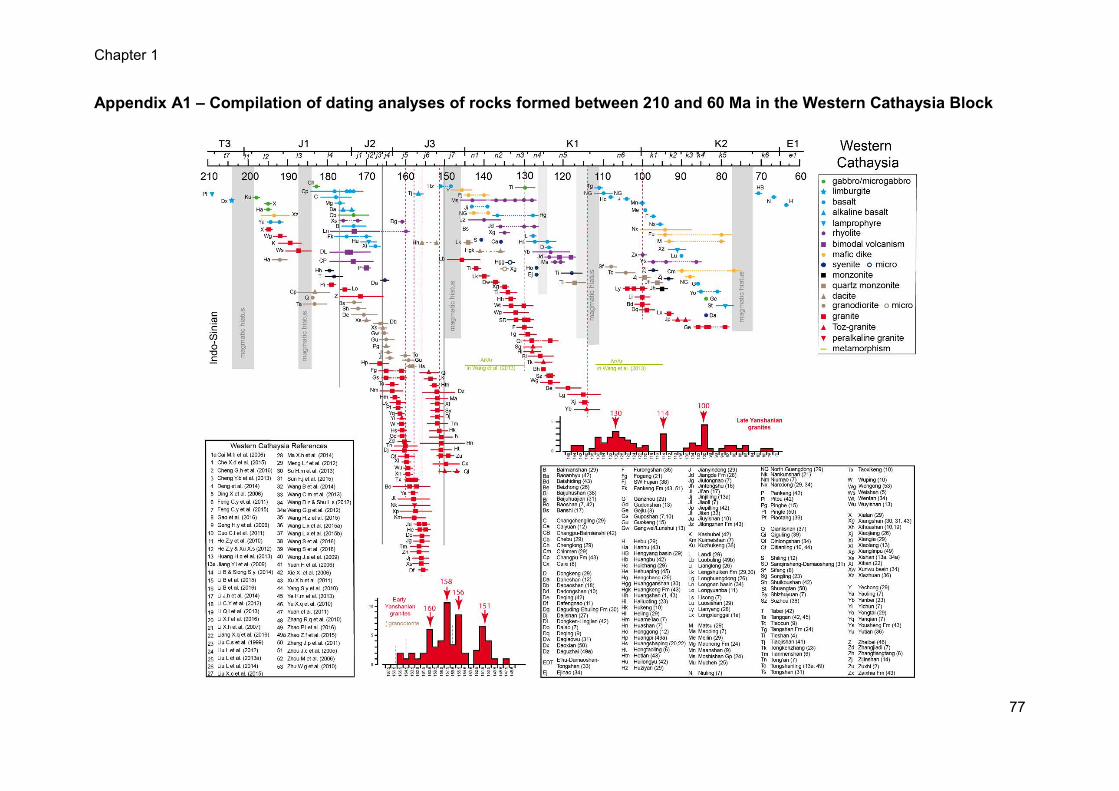
Chapter 1
77
Appendix A1 – Compilation of dating analyses of rocks formed between 210 and 60 Ma in the Western Cathaysia Block
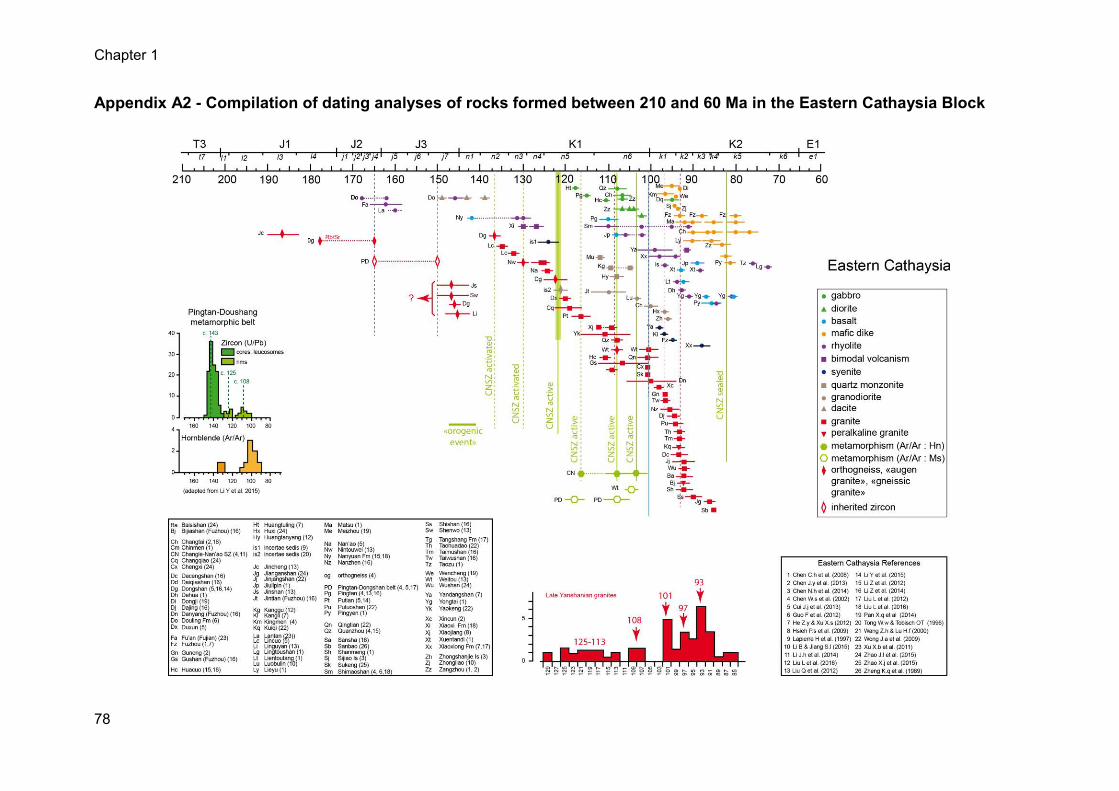
Chapter 1
78
Appendix A2 - Compilation of dating analyses of rocks formed between 210 and 60 Ma in the Eastern Cathaysia Block
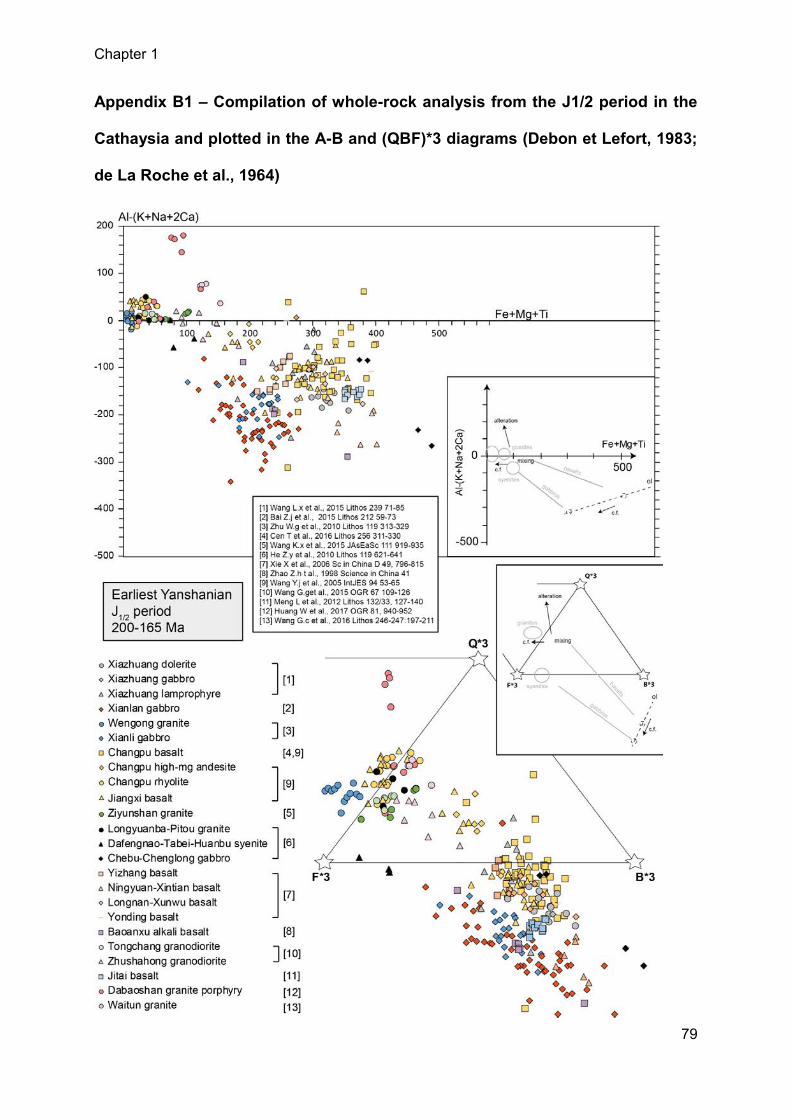
Chapter 1
79
Appendix B1 – Compilation of whole-rock analysis from the J1/2 period in the
Cathaysia and plotted in the A-B and (QBF)*3 diagrams (Debon et Lefort, 1983;
de La Roche et al., 1964)
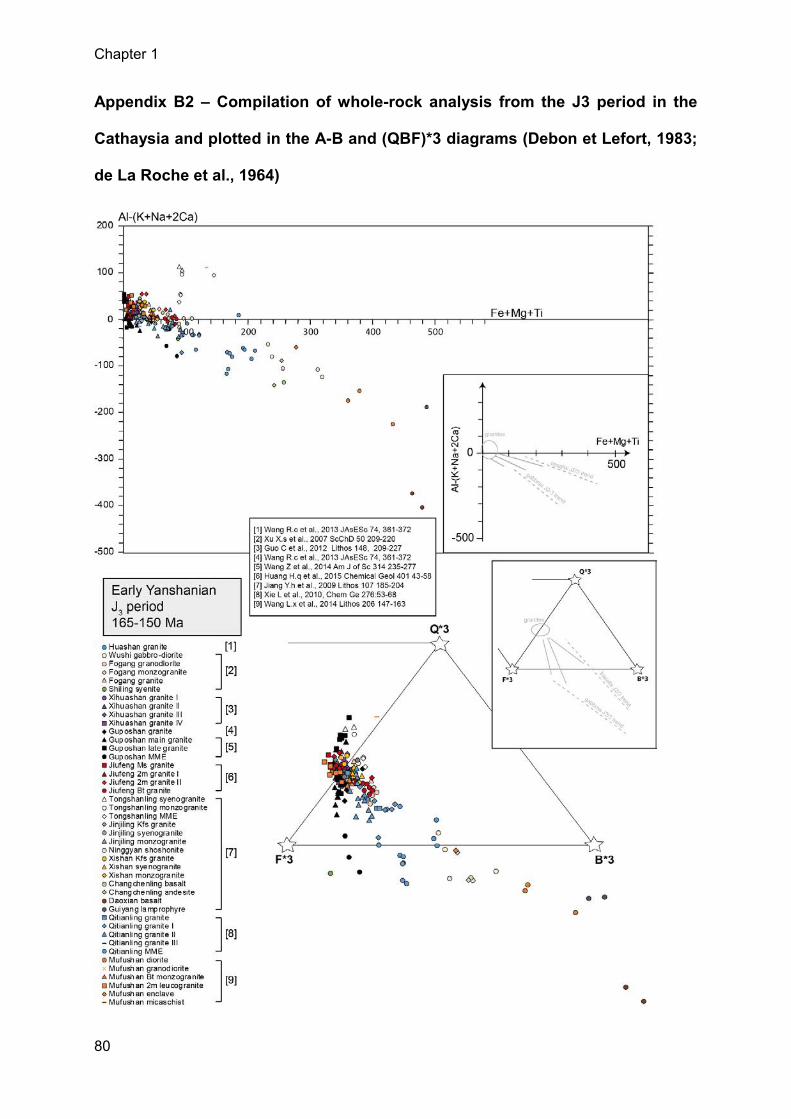
Chapter 1
80
Appendix B2 – Compilation of whole-rock analysis from the J3 period in the
Cathaysia and plotted in the A-B and (QBF)*3 diagrams (Debon et Lefort, 1983;
de La Roche et al., 1964)

Chapter 1
81
Appendix B3 – Compilation of whole-rock analysis from the K1 period in the
Cathaysia and plotted in the A-B and (QBF)*3 diagrams (Debon et Lefort, 1983;
de La Roche et al., 1964)

Chapter 1
82
Appendix B4 – Compilation of whole-rock analysis from the K2 period in the
Western Cathaysia and plotted in the A-B and (QBF)*3 diagrams (Debon et
Lefort, 1983; de La Roche et al., 1964)
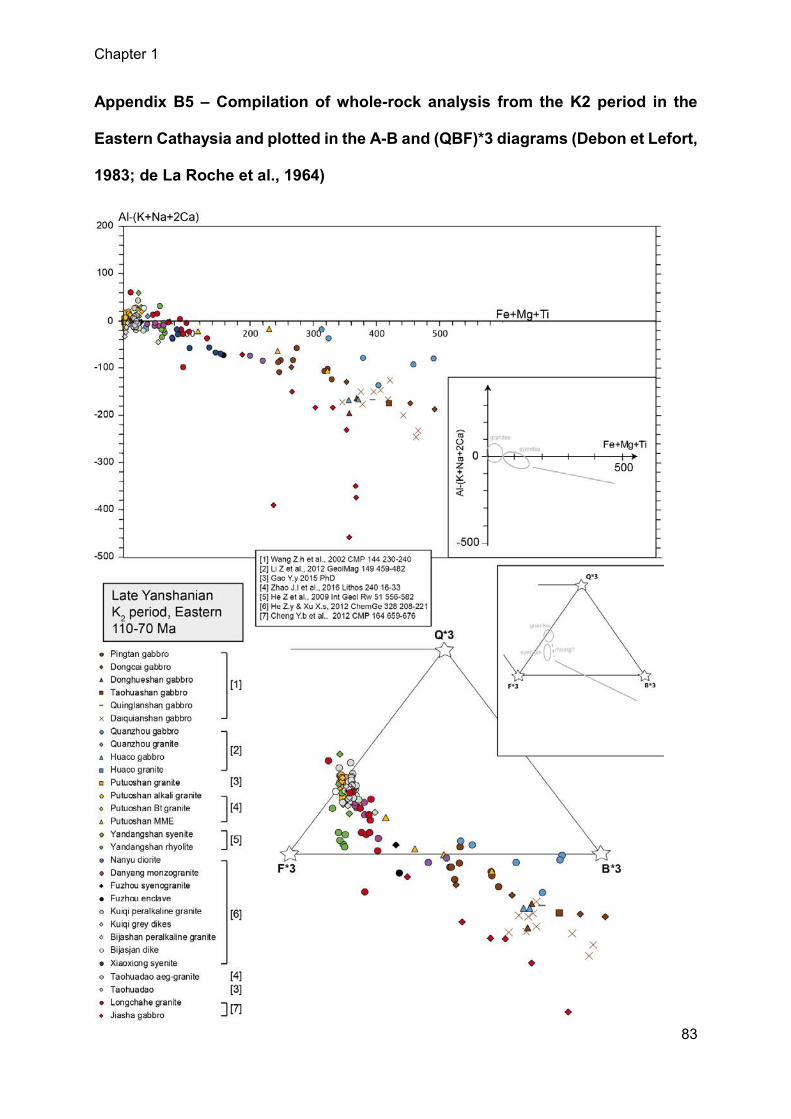
Chapter 1
83
Appendix B5 – Compilation of whole-rock analysis from the K2 period in the
Eastern Cathaysia and plotted in the A-B and (QBF)*3 diagrams (Debon et Lefort,
1983; de La Roche et al., 1964)
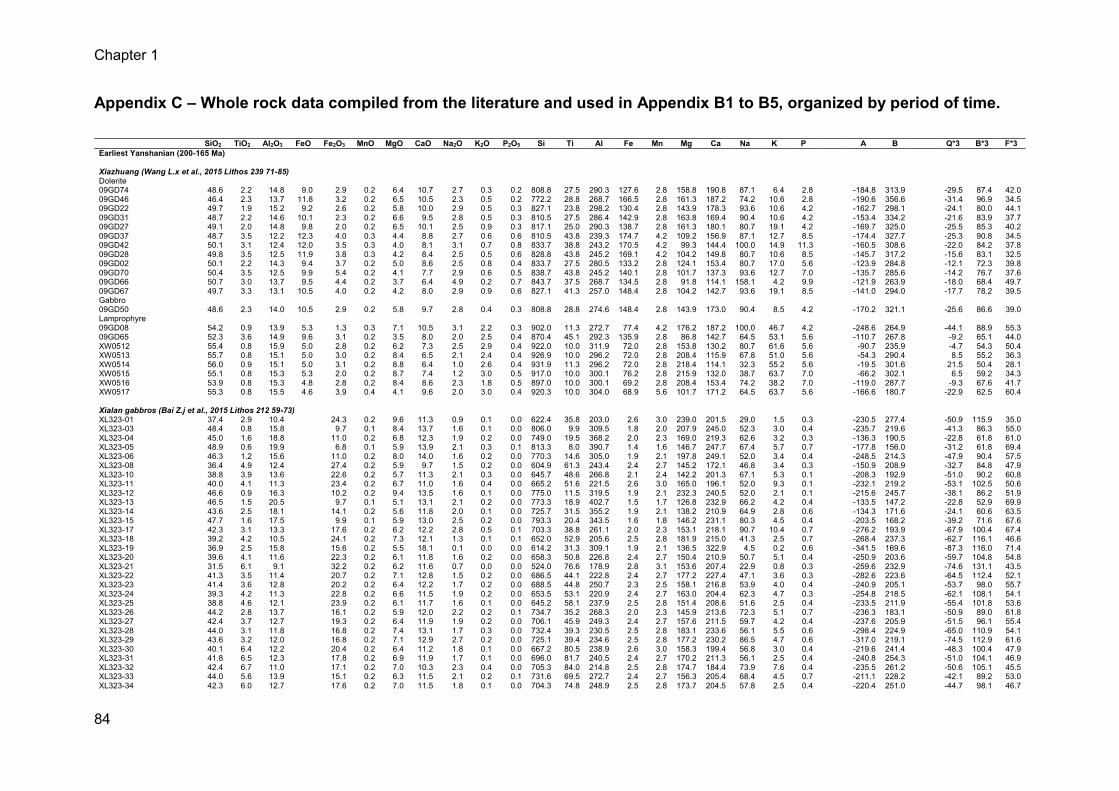
Chapter 1
84
Appendix C – Whole rock data compiled from the literature and used in Appendix B1 to B5, organized by period of time.
SiO2 TiO2 Al2O3 FeO Fe2O3 MnO MgO CaO Na2O K2O P2O5 Si Ti Al Fe Mn Mg Ca Na K P A B Q*3 B*3 F*3 Earliest Yanshanian (200-165 Ma)
Xiazhuang (Wang L.x et al., 2015 Lithos 239 71-85)
Dolerite
09GD74 48.6 2.2 14.8 9.0 2.9 0.2 6.4 10.7 2.7 0.3 0.2 808.8 27.5 290.3 127.6 2.8 158.8 190.8 87.1 6.4 2.8 -184.8 313.9 -29.5 87.4 42.0 09GD46 46.4 2.3 13.7 11.8 3.2 0.2 6.5 10.5 2.3 0.5 0.2 772.2 28.8 268.7 166.5 2.8 161.3 187.2 74.2 10.6 2.8 -190.6 356.6 -31.4 96.9 34.5 09GD22 49.7 1.9 15.2 9.2 2.6 0.2 5.8 10.0 2.9 0.5 0.3 827.1 23.8 298.2 130.4 2.8 143.9 178.3 93.6 10.6 4.2 -162.7 298.1 -24.1 80.0 44.1 09GD31 48.7 2.2 14.6 10.1 2.3 0.2 6.6 9.5 2.8 0.5 0.3 810.5 27.5 286.4 142.9 2.8 163.8 169.4 90.4 10.6 4.2 -153.4 334.2 -21.6 83.9 37.7 09GD27 49.1 2.0 14.8 9.8 2.0 0.2 6.5 10.1 2.5 0.9 0.3 817.1 25.0 290.3 138.7 2.8 161.3 180.1 80.7 19.1 4.2 -169.7 325.0 -25.5 85.3 40.2 09GD37 48.7 3.5 12.2 12.3 4.0 0.3 4.4 8.8 2.7 0.6 0.6 810.5 43.8 239.3 174.7 4.2 109.2 156.9 87.1 12.7 8.5 -174.4 327.7 -25.3 90.8 34.5 09GD42 50.1 3.1 12.4 12.0 3.5 0.3 4.0 8.1 3.1 0.7 0.8 833.7 38.8 243.2 170.5 4.2 99.3 144.4 100.0 14.9 11.3 -160.5 308.6 -22.0 84.2 37.8 09GD28 49.8 3.5 12.5 11.9 3.8 0.3 4.2 8.4 2.5 0.5 0.6 828.8 43.8 245.2 169.1 4.2 104.2 149.8 80.7 10.6 8.5 -145.7 317.2 -15.6 83.1 32.5 09GD02 50.1 2.2 14.3 9.4 3.7 0.2 5.0 8.6 2.5 0.8 0.4 833.7 27.5 280.5 133.2 2.8 124.1 153.4 80.7 17.0 5.6 -123.9 284.8 -12.1 72.3 39.8 09GD70 50.4 3.5 12.5 9.9 5.4 0.2 4.1 7.7 2.9 0.6 0.5 838.7 43.8 245.2 140.1 2.8 101.7 137.3 93.6 12.7 7.0 -135.7 285.6 -14.2 76.7 37.6 09GD66 50.7 3.0 13.7 9.5 4.4 0.2 3.7 6.4 4.9 0.2 0.7 843.7 37.5 268.7 134.5 2.8 91.8 114.1 158.1 4.2 9.9 -121.9 263.9 -18.0 68.4 49.7 09GD67 49.7 3.3 13.1 10.5 4.0 0.2 4.2 8.0 2.9 0.9 0.6 827.1 41.3 257.0 148.4 2.8 104.2 142.7 93.6 19.1 8.5 -141.0 294.0 -17.7 78.2 39.5 Gabbro
09GD50 48.6 2.3 14.0 10.5 2.9 0.2 5.8 9.7 2.8 0.4 0.3 808.8 28.8 274.6 148.4 2.8 143.9 173.0 90.4 8.5 4.2 -170.2 321.1 -25.6 86.6 39.0 Lamprophyre
09GD08 54.2 0.9 13.9 5.3 1.3 0.3 7.1 10.5 3.1 2.2 0.3 902.0 11.3 272.7 77.4 4.2 176.2 187.2 100.0 46.7 4.2 -248.6 264.9 -44.1 88.9 55.3 09GD65 52.3 3.6 14.9 9.6 3.1 0.2 3.5 8.0 2.0 2.5 0.4 870.4 45.1 292.3 135.9 2.8 86.8 142.7 64.5 53.1 5.6 -110.7 267.8 -9.2 65.1 44.0 XW0512 55.4 0.8 15.9 5.0 2.8 0.2 6.2 7.3 2.5 2.9 0.4 922.0 10.0 311.9 72.0 2.8 153.8 130.2 80.7 61.6 5.6 -90.7 235.9 -4.7 54.3 50.4 XW0513 55.7 0.8 15.1 5.0 3.0 0.2 8.4 6.5 2.1 2.4 0.4 926.9 10.0 296.2 72.0 2.8 208.4 115.9 67.8 51.0 5.6 -54.3 290.4 8.5 55.2 36.3 XW0514 56.0 0.9 15.1 5.0 3.1 0.2 8.8 6.4 1.0 2.6 0.4 931.9 11.3 296.2 72.0 2.8 218.4 114.1 32.3 55.2 5.6 -19.5 301.6 21.5 50.4 28.1 XW0515 55.1 0.8 15.3 5.3 2.0 0.2 8.7 7.4 1.2 3.0 0.5 917.0 10.0 300.1 76.2 2.8 215.9 132.0 38.7 63.7 7.0 -66.2 302.1 6.5 59.2 34.3 XW0516 53.9 0.8 15.3 4.8 2.8 0.2 8.4 8.6 2.3 1.8 0.5 897.0 10.0 300.1 69.2 2.8 208.4 153.4 74.2 38.2 7.0 -119.0 287.7 -9.3 67.6 41.7 XW0517 55.3 0.8 15.5 4.6 3.9 0.4 4.1 9.6 2.0 3.0 0.4 920.3 10.0 304.0 68.9 5.6 101.7 171.2 64.5 63.7 5.6 -166.6 180.7 -22.9 62.5 60.4
Xialan gabbros (Bai Z.j et al., 2015 Lithos 212 59-73)
XL323-01 37.4 2.9 10.4 24.3 0.2 9.6 11.3 0.9 0.1 0.0 622.4 35.8 203.0 2.6 3.0 239.0 201.5 29.0 1.5 0.3 -230.5 277.4 -50.9 115.9 35.0 XL323-03 48.4 0.8 15.8 9.7 0.1 8.4 13.7 1.6 0.1 0.0 806.0 9.9 309.5 1.8 2.0 207.9 245.0 52.3 3.0 0.4 -235.7 219.6 -41.3 86.3 55.0 XL323-04 45.0 1.6 18.8 11.0 0.2 6.8 12.3 1.9 0.2 0.0 749.0 19.5 368.2 2.0 2.3 169.0 219.3 62.6 3.2 0.3 -136.3 190.5 -22.8 61.8 61.0 XL323-05 48.9 0.6 19.9 6.8 0.1 5.9 13.9 2.1 0.3 0.1 813.3 8.0 390.7 1.4 1.6 146.7 247.7 67.4 5.7 0.7 -177.8 156.0 -31.2 61.8 69.4 XL323-06 46.3 1.2 15.6 11.0 0.2 8.0 14.0 1.6 0.2 0.0 770.3 14.6 305.0 1.9 2.1 197.8 249.1 52.0 3.4 0.4 -248.5 214.3 -47.9 90.4 57.5 XL323-08 36.4 4.9 12.4 27.4 0.2 5.9 9.7 1.5 0.2 0.0 604.9 61.3 243.4 2.4 2.7 145.2 172.1 46.8 3.4 0.3 -150.9 208.9 -32.7 84.8 47.9 XL323-10 38.8 3.9 13.6 22.6 0.2 5.7 11.3 2.1 0.3 0.0 645.7 48.6 266.8 2.1 2.4 142.2 201.3 67.1 5.3 0.1 -208.3 192.9 -51.0 90.2 60.8 XL323-11 40.0 4.1 11.3 23.4 0.2 6.7 11.0 1.6 0.4 0.0 665.2 51.6 221.5 2.6 3.0 165.0 196.1 52.0 9.3 0.1 -232.1 219.2 -53.1 102.5 50.6 XL323-12 46.6 0.9 16.3 10.2 0.2 9.4 13.5 1.6 0.1 0.0 775.0 11.5 319.5 1.9 2.1 232.3 240.5 52.0 2.1 0.1 -215.6 245.7 -38.1 86.2 51.9 XL323-13 46.5 1.5 20.5 9.7 0.1 5.1 13.1 2.1 0.2 0.0 773.3 18.9 402.7 1.5 1.7 126.8 232.9 66.2 4.2 0.4 -133.5 147.2 -22.8 52.9 69.9 XL323-14 43.6 2.5 18.1 14.1 0.2 5.6 11.8 2.0 0.1 0.0 725.7 31.5 355.2 1.9 2.1 138.2 210.9 64.9 2.8 0.6 -134.3 171.6 -24.1 60.6 63.5 XL323-15 47.7 1.6 17.5 9.9 0.1 5.9 13.0 2.5 0.2 0.0 793.3 20.4 343.5 1.6 1.8 146.2 231.1 80.3 4.5 0.4 -203.5 168.2 -39.2 71.6 67.6 XL323-17 42.3 3.1 13.3 17.6 0.2 6.2 12.2 2.8 0.5 0.1 703.3 38.8 261.1 2.0 2.3 153.1 218.1 90.7 10.4 0.7 -276.2 193.9 -67.9 100.4 67.4 XL323-18 39.2 4.2 10.5 24.1 0.2 7.3 12.1 1.3 0.1 0.1 652.0 52.9 205.6 2.5 2.8 181.9 215.0 41.3 2.5 0.7 -268.4 237.3 -62.7 116.1 46.6 XL323-19 36.9 2.5 15.8 15.6 0.2 5.5 18.1 0.1 0.0 0.0 614.2 31.3 309.1 1.9 2.1 136.5 322.9 4.5 0.2 0.6 -341.5 169.6 -87.3 116.0 71.4 XL323-20 39.6 4.1 11.6 22.3 0.2 6.1 11.8 1.6 0.2 0.0 658.3 50.8 226.8 2.4 2.7 150.4 210.9 50.7 5.1 0.4 -250.9 203.6 -59.7 104.8 54.8 XL323-21 31.5 6.1 9.1 32.2 0.2 6.2 11.6 0.7 0.0 0.0 524.0 76.6 178.9 2.8 3.1 153.6 207.4 22.9 0.8 0.3 -259.6 232.9 -74.6 131.1 43.5 XL323-22 41.3 3.5 11.4 20.7 0.2 7.1 12.8 1.5 0.2 0.0 686.5 44.1 222.8 2.4 2.7 177.2 227.4 47.1 3.6 0.3 -282.6 223.6 -64.5 112.4 52.1 XL323-23 41.4 3.6 12.8 20.2 0.2 6.4 12.2 1.7 0.2 0.0 688.5 44.8 250.7 2.3 2.5 158.1 216.8 53.9 4.0 0.4 -240.9 205.1 -53.7 98.0 55.7 XL323-24 39.3 4.2 11.3 22.8 0.2 6.6 11.5 1.9 0.2 0.0 653.5 53.1 220.9 2.4 2.7 163.0 204.4 62.3 4.7 0.3 -254.8 218.5 -62.1 108.1 54.1 XL323-25 38.8 4.6 12.1 23.9 0.2 6.1 11.7 1.6 0.1 0.0 645.2 58.1 237.9 2.5 2.8 151.4 208.6 51.6 2.5 0.4 -233.5 211.9 -55.4 101.8 53.6 XL323-26 44.2 2.8 13.7 16.1 0.2 5.9 12.0 2.2 0.2 0.1 734.7 35.2 268.3 2.0 2.3 145.9 213.6 72.3 5.1 0.7 -236.3 183.1 -50.9 89.0 61.8 XL323-27 42.4 3.7 12.7 19.3 0.2 6.4 11.9 1.9 0.2 0.0 706.1 45.9 249.3 2.4 2.7 157.6 211.5 59.7 4.2 0.4 -237.6 205.9 -51.5 96.1 55.4 XL323-28 44.0 3.1 11.8 16.8 0.2 7.4 13.1 1.7 0.3 0.0 732.4 39.3 230.5 2.5 2.8 183.1 233.6 56.1 5.5 0.6 -298.4 224.9 -65.0 110.9 54.1 XL323-29 43.6 3.2 12.0 16.8 0.2 7.1 12.9 2.7 0.2 0.0 725.1 39.4 234.6 2.5 2.8 177.2 230.2 86.5 4.7 0.6 -317.0 219.1 -74.5 112.9 61.6 XL323-30 40.1 6.4 12.2 20.4 0.2 6.4 11.2 1.8 0.1 0.0 667.2 80.5 238.9 2.6 3.0 158.3 199.4 56.8 3.0 0.4 -219.6 241.4 -48.3 100.4 47.9 XL323-31 41.8 6.5 12.3 17.8 0.2 6.9 11.9 1.7 0.1 0.0 696.0 81.7 240.5 2.4 2.7 170.2 211.3 56.1 2.5 0.4 -240.8 254.3 -51.0 104.1 46.9 XL323-32 42.4 6.7 11.0 17.1 0.2 7.0 10.3 2.3 0.4 0.0 705.3 84.0 214.8 2.5 2.8 174.7 184.4 73.9 7.6 0.4 -235.5 261.2 -50.6 105.1 45.5 XL323-33 44.0 5.6 13.9 15.1 0.2 6.3 11.5 2.1 0.2 0.1 731.6 69.5 272.7 2.4 2.7 156.3 205.4 68.4 4.5 0.7 -211.1 228.2 -42.1 89.2 53.0 XL323-34 42.3 6.0 12.7 17.6 0.2 7.0 11.5 1.8 0.1 0.0 704.3 74.8 248.9 2.5 2.8 173.7 204.5 57.8 2.5 0.4 -220.4 251.0 -44.7 98.1 46.7
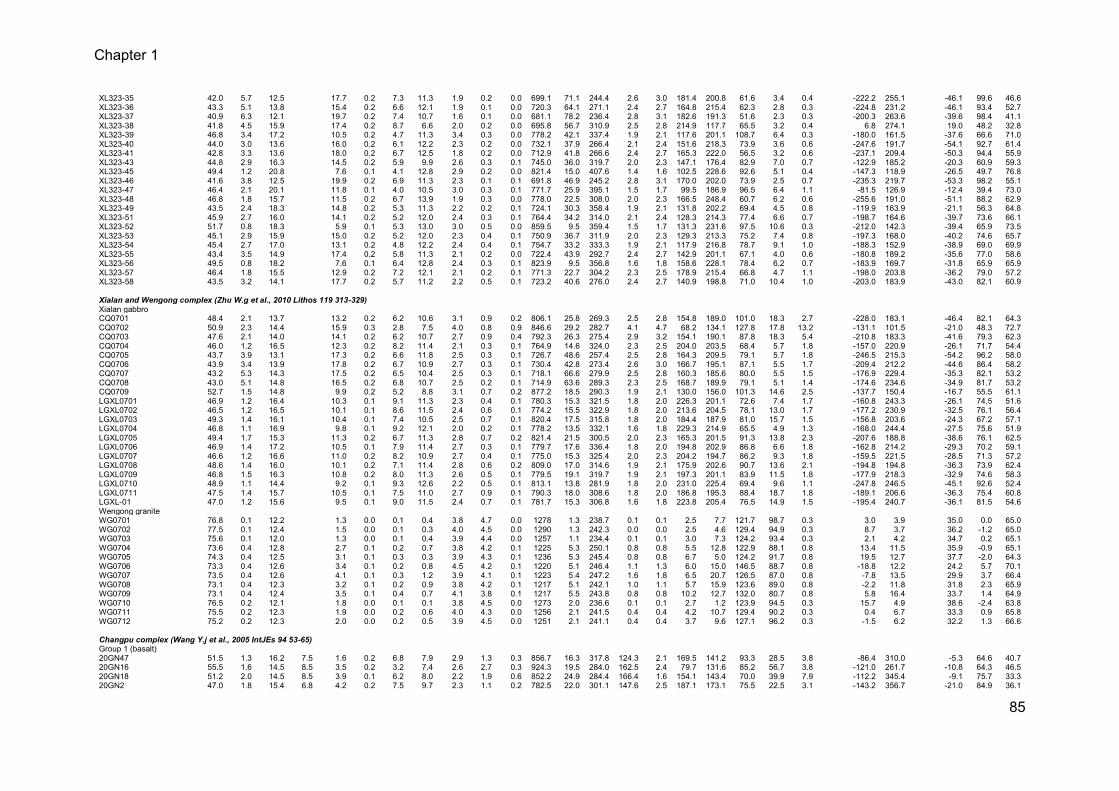
Chapter 1
85
XL323-35 42.0 5.7 12.5 17.7 0.2 7.3 11.3 1.9 0.2 0.0 699.1 71.1 244.4 2.6 3.0 181.4 200.8 61.6 3.4 0.4 -222.2 255.1 -46.1 99.6 46.6 XL323-36 43.3 5.1 13.8 15.4 0.2 6.6 12.1 1.9 0.1 0.0 720.3 64.1 271.1 2.4 2.7 164.8 215.4 62.3 2.8 0.3 -224.8 231.2 -46.1 93.4 52.7 XL323-37 40.9 6.3 12.1 19.7 0.2 7.4 10.7 1.6 0.1 0.0 681.1 78.2 236.4 2.8 3.1 182.6 191.3 51.6 2.3 0.3 -200.3 263.6 -39.6 98.4 41.1 XL323-38 41.8 4.5 15.9 17.4 0.2 8.7 6.6 2.0 0.2 0.0 695.8 56.7 310.9 2.5 2.8 214.9 117.7 65.5 3.2 0.4 6.8 274.1 19.0 48.2 32.8 XL323-39 46.8 3.4 17.2 10.5 0.2 4.7 11.3 3.4 0.3 0.0 778.2 42.1 337.4 1.9 2.1 117.6 201.1 108.7 6.4 0.3 -180.0 161.5 -37.6 66.6 71.0 XL323-40 44.0 3.0 13.6 16.0 0.2 6.1 12.2 2.3 0.2 0.0 732.1 37.9 266.4 2.1 2.4 151.6 218.3 73.9 3.6 0.6 -247.6 191.7 -54.1 92.7 61.4 XL323-41 42.8 3.3 13.6 18.0 0.2 6.7 12.5 1.8 0.2 0.0 712.9 41.8 266.6 2.4 2.7 165.3 222.0 56.5 3.2 0.6 -237.1 209.4 -50.3 94.4 55.9 XL323-43 44.8 2.9 16.3 14.5 0.2 5.9 9.9 2.6 0.3 0.1 745.0 36.0 319.7 2.0 2.3 147.1 176.4 82.9 7.0 0.7 -122.9 185.2 -20.3 60.9 59.3 XL323-45 49.4 1.2 20.8 7.6 0.1 4.1 12.8 2.9 0.2 0.0 821.4 15.0 407.6 1.4 1.6 102.5 228.6 92.6 5.1 0.4 -147.3 118.9 -26.5 49.7 76.8 XL323-46 41.6 3.8 12.5 19.9 0.2 6.9 11.3 2.3 0.1 0.1 691.8 46.9 245.2 2.8 3.1 170.0 202.0 73.9 2.5 0.7 -235.3 219.7 -53.3 98.2 55.1 XL323-47 46.4 2.1 20.1 11.8 0.1 4.0 10.5 3.0 0.3 0.1 771.7 25.9 395.1 1.5 1.7 99.5 186.9 96.5 6.4 1.1 -81.5 126.9 -12.4 39.4 73.0 XL323-48 46.8 1.8 15.7 11.5 0.2 6.7 13.9 1.9 0.3 0.0 778.0 22.5 308.0 2.0 2.3 166.5 248.4 60.7 6.2 0.6 -255.6 191.0 -51.1 88.2 62.9 XL323-49 43.5 2.4 18.3 14.8 0.2 5.3 11.3 2.2 0.2 0.1 724.1 30.3 358.4 1.9 2.1 131.8 202.2 69.4 4.5 0.8 -119.9 163.9 -21.1 56.3 64.8 XL323-51 45.9 2.7 16.0 14.1 0.2 5.2 12.0 2.4 0.3 0.1 764.4 34.2 314.0 2.1 2.4 128.3 214.3 77.4 6.6 0.7 -198.7 164.6 -39.7 73.6 66.1 XL323-52 51.7 0.8 18.3 5.9 0.1 5.3 13.0 3.0 0.5 0.0 859.5 9.5 359.4 1.5 1.7 131.3 231.6 97.5 10.6 0.3 -212.0 142.3 -39.4 65.9 73.5 XL323-53 45.1 2.9 15.9 15.0 0.2 5.2 12.0 2.3 0.4 0.1 750.9 36.7 311.9 2.0 2.3 129.3 213.3 75.2 7.4 0.8 -197.3 168.0 -40.2 74.6 65.7 XL323-54 45.4 2.7 17.0 13.1 0.2 4.8 12.2 2.4 0.4 0.1 754.7 33.2 333.3 1.9 2.1 117.9 216.8 78.7 9.1 1.0 -188.3 152.9 -38.9 69.0 69.9 XL323-55 43.4 3.5 14.9 17.4 0.2 5.8 11.3 2.1 0.2 0.0 722.4 43.9 292.7 2.4 2.7 142.9 201.1 67.1 4.0 0.6 -180.8 189.2 -35.6 77.0 58.6 XL323-56 49.5 0.8 18.2 7.6 0.1 6.4 12.8 2.4 0.3 0.1 823.9 9.5 356.8 1.6 1.8 158.6 228.1 78.4 6.2 0.7 -183.9 169.7 -31.8 65.9 65.9 XL323-57 46.4 1.8 15.5 12.9 0.2 7.2 12.1 2.1 0.2 0.1 771.3 22.7 304.2 2.3 2.5 178.9 215.4 66.8 4.7 1.1 -198.0 203.8 -36.2 79.0 57.2 XL323-58 43.5 3.2 14.1 17.7 0.2 5.7 11.2 2.2 0.5 0.1 723.2 40.6 276.0 2.4 2.7 140.9 198.8 71.0 10.4 1.0 -203.0 183.9 -43.0 82.1 60.9
Xialan and Wengong complex (Zhu W.g et al., 2010 Lithos 119 313-329)
Xialan gabbro
CQ0701 48.4 2.1 13.7 13.2 0.2 6.2 10.6 3.1 0.9 0.2 806.1 25.8 269.3 2.5 2.8 154.8 189.0 101.0 18.3 2.7 -228.0 183.1 -46.4 82.1 64.3 CQ0702 50.9 2.3 14.4 15.9 0.3 2.8 7.5 4.0 0.8 0.9 846.6 29.2 282.7 4.1 4.7 68.2 134.1 127.8 17.8 13.2 -131.1 101.5 -21.0 48.3 72.7 CQ0703 47.6 2.1 14.0 14.1 0.2 6.2 10.7 2.7 0.9 0.4 792.3 26.3 275.4 2.9 3.2 154.1 190.1 87.8 18.3 5.4 -210.8 183.3 -41.6 79.3 62.3 CQ0704 46.0 1.2 16.5 12.3 0.2 8.2 11.4 2.1 0.3 0.1 764.9 14.6 324.0 2.3 2.5 204.0 203.5 68.4 5.7 1.8 -157.0 220.9 -26.1 71.7 54.4 CQ0705 43.7 3.9 13.1 17.3 0.2 6.6 11.8 2.5 0.3 0.1 726.7 48.6 257.4 2.5 2.8 164.3 209.5 79.1 5.7 1.8 -246.5 215.3 -54.2 96.2 58.0 CQ0706 43.9 3.4 13.9 17.8 0.2 6.7 10.9 2.7 0.3 0.1 730.4 42.8 273.4 2.6 3.0 166.7 195.1 87.1 5.5 1.7 -209.4 212.2 -44.6 86.4 58.2 CQ0707 43.2 5.3 14.3 17.5 0.2 6.5 10.4 2.5 0.3 0.1 718.1 66.6 279.9 2.5 2.8 160.3 185.6 80.0 5.5 1.5 -176.9 229.4 -35.3 82.1 53.2 CQ0708 43.0 5.1 14.8 16.5 0.2 6.8 10.7 2.5 0.2 0.1 714.9 63.6 289.3 2.3 2.5 168.7 189.9 79.1 5.1 1.4 -174.6 234.6 -34.9 81.7 53.2 CQ0709 52.7 1.5 14.8 9.9 0.2 5.2 8.8 3.1 0.7 0.2 877.2 18.5 290.3 1.9 2.1 130.0 156.0 101.3 14.6 2.5 -137.7 150.4 -16.7 55.5 61.1 LGXL0701 46.9 1.2 16.4 10.3 0.1 9.1 11.3 2.3 0.4 0.1 780.3 15.3 321.5 1.8 2.0 226.3 201.1 72.6 7.4 1.7 -160.8 243.3 -26.1 74.5 51.6 LGXL0702 46.5 1.2 16.5 10.1 0.1 8.6 11.5 2.4 0.6 0.1 774.2 15.5 322.9 1.8 2.0 213.6 204.5 78.1 13.0 1.7 -177.2 230.9 -32.5 76.1 56.4 LGXL0703 49.3 1.4 16.1 10.4 0.1 7.4 10.5 2.5 0.7 0.1 820.4 17.5 315.8 1.8 2.0 184.4 187.9 81.0 15.7 1.5 -156.8 203.6 -24.3 67.2 57.1 LGXL0704 46.8 1.1 16.9 9.8 0.1 9.2 12.1 2.0 0.2 0.1 778.2 13.5 332.1 1.6 1.8 229.3 214.9 65.5 4.9 1.3 -168.0 244.4 -27.5 75.6 51.9 LGXL0705 49.4 1.7 15.3 11.3 0.2 6.7 11.3 2.8 0.7 0.2 821.4 21.5 300.5 2.0 2.3 165.3 201.5 91.3 13.8 2.3 -207.6 188.8 -38.6 76.1 62.5 LGXL0706 46.9 1.4 17.2 10.5 0.1 7.9 11.4 2.7 0.3 0.1 779.7 17.6 336.4 1.8 2.0 194.8 202.9 86.8 6.6 1.8 -162.8 214.2 -29.3 70.2 59.1 LGXL0707 46.6 1.2 16.6 11.0 0.2 8.2 10.9 2.7 0.4 0.1 775.0 15.3 325.4 2.0 2.3 204.2 194.7 86.2 9.3 1.8 -159.5 221.5 -28.5 71.3 57.2 LGXL0708 48.6 1.4 16.0 10.1 0.2 7.1 11.4 2.8 0.6 0.2 809.0 17.0 314.6 1.9 2.1 175.9 202.6 90.7 13.6 2.1 -194.8 194.8 -36.3 73.9 62.4 LGXL0709 46.8 1.5 16.3 10.8 0.2 8.0 11.3 2.6 0.5 0.1 779.5 19.1 319.7 1.9 2.1 197.3 201.1 83.9 11.5 1.8 -177.9 218.3 -32.9 74.6 58.3 LGXL0710 48.9 1.1 14.4 9.2 0.1 9.3 12.6 2.2 0.5 0.1 813.1 13.8 281.9 1.8 2.0 231.0 225.4 69.4 9.6 1.1 -247.8 246.5 -45.1 92.6 52.4 LGXL0711 47.5 1.4 15.7 10.5 0.1 7.5 11.0 2.7 0.9 0.1 790.3 18.0 308.6 1.8 2.0 186.8 195.3 88.4 18.7 1.8 -189.1 206.6 -36.3 75.4 60.8 LGXL-01 47.0 1.2 15.6 9.5 0.1 9.0 11.5 2.4 0.7 0.1 781.7 15.3 306.8 1.6 1.8 223.8 205.4 76.5 14.9 1.5 -195.4 240.7 -36.1 81.5 54.6 Wengong granite
WG0701 76.8 0.1 12.2 1.3 0.0 0.1 0.4 3.8 4.7 0.0 1278 1.3 238.7 0.1 0.1 2.5 7.7 121.7 98.7 0.3 3.0 3.9 35.0 0.0 65.0 WG0702 77.5 0.1 12.4 1.5 0.0 0.1 0.3 4.0 4.5 0.0 1290 1.3 242.3 0.0 0.0 2.5 4.6 129.4 94.9 0.3 8.7 3.7 36.2 -1.2 65.0 WG0703 75.6 0.1 12.0 1.3 0.0 0.1 0.4 3.9 4.4 0.0 1257 1.1 234.4 0.1 0.1 3.0 7.3 124.2 93.4 0.3 2.1 4.2 34.7 0.2 65.1 WG0704 73.6 0.4 12.8 2.7 0.1 0.2 0.7 3.8 4.2 0.1 1225 5.3 250.1 0.8 0.8 5.5 12.8 122.9 88.1 0.8 13.4 11.5 35.9 -0.9 65.1 WG0705 74.3 0.4 12.5 3.1 0.1 0.3 0.3 3.9 4.3 0.1 1236 5.3 245.4 0.8 0.8 6.7 5.0 124.2 91.7 0.8 19.5 12.7 37.7 -2.0 64.3 WG0706 73.3 0.4 12.6 3.4 0.1 0.2 0.8 4.5 4.2 0.1 1220 5.1 246.4 1.1 1.3 6.0 15.0 146.5 88.7 0.8 -18.8 12.2 24.2 5.7 70.1 WG0707 73.5 0.4 12.6 4.1 0.1 0.3 1.2 3.9 4.1 0.1 1223 5.4 247.2 1.6 1.8 6.5 20.7 126.5 87.0 0.8 -7.8 13.5 29.9 3.7 66.4 WG0708 73.1 0.4 12.3 3.2 0.1 0.2 0.9 3.8 4.2 0.1 1217 5.1 242.1 1.0 1.1 5.7 15.9 123.6 89.0 0.8 -2.2 11.8 31.8 2.3 65.9 WG0709 73.1 0.4 12.4 3.5 0.1 0.4 0.7 4.1 3.8 0.1 1217 5.5 243.8 0.8 0.8 10.2 12.7 132.0 80.7 0.8 5.8 16.4 33.7 1.4 64.9 WG0710 76.5 0.2 12.1 1.8 0.0 0.1 0.1 3.8 4.5 0.0 1273 2.0 236.6 0.1 0.1 2.7 1.2 123.9 94.5 0.3 15.7 4.9 38.6 -2.4 63.8 WG0711 75.5 0.2 12.3 1.9 0.0 0.2 0.6 4.0 4.3 0.0 1256 2.1 241.5 0.4 0.4 4.2 10.7 129.4 90.2 0.3 0.4 6.7 33.3 0.9 65.8 WG0712 75.2 0.2 12.3 2.0 0.0 0.2 0.5 3.9 4.5 0.0 1251 2.1 241.1 0.4 0.4 3.7 9.6 127.1 96.2 0.3 -1.5 6.2 32.2 1.3 66.6
Changpu complex (Wang Y.j et al., 2005 IntJEs 94 53-65)
Group 1 (basalt)
20GN47 51.5 1.3 16.2 7.5 1.6 0.2 6.8 7.9 2.9 1.3 0.3 856.7 16.3 317.8 124.3 2.1 169.5 141.2 93.3 28.5 3.8 -86.4 310.0 -5.3 64.6 40.7 20GN16 55.5 1.6 14.5 8.5 3.5 0.2 3.2 7.4 2.6 2.7 0.3 924.3 19.5 284.0 162.5 2.4 79.7 131.6 85.2 56.7 3.8 -121.0 261.7 -10.8 64.3 46.5 20GN18 51.2 2.0 14.5 8.5 3.9 0.1 6.2 8.0 2.2 1.9 0.6 852.2 24.9 284.4 166.4 1.6 154.1 143.4 70.0 39.9 7.9 -112.2 345.4 -9.1 75.7 33.3 20GN2 47.0 1.8 15.4 6.8 4.2 0.2 7.5 9.7 2.3 1.1 0.2 782.5 22.0 301.1 147.6 2.5 187.1 173.1 75.5 22.5 3.1 -143.2 356.7 -21.0 84.9 36.1
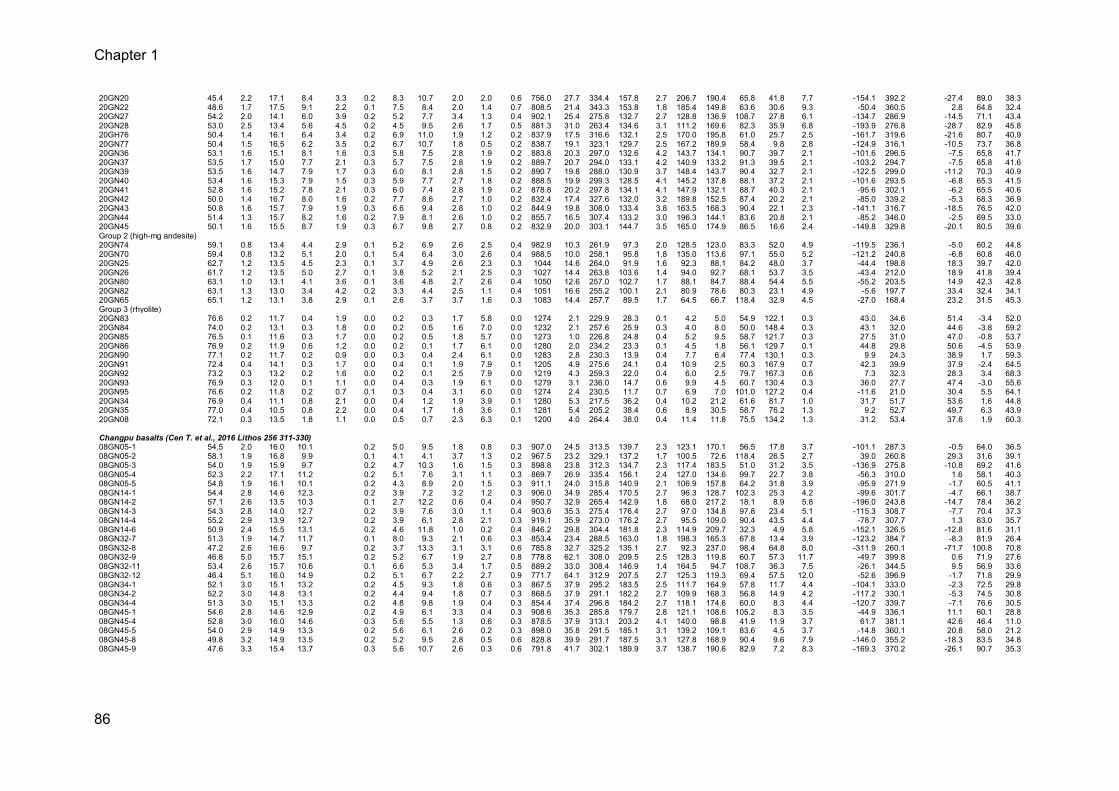
Chapter 1
86
20GN20 45.4 2.2 17.1 8.4 3.3 0.2 8.3 10.7 2.0 2.0 0.6 756.0 27.7 334.4 157.8 2.7 206.7 190.4 65.8 41.8 7.7 -154.1 392.2 -27.4 89.0 38.3 20GN22 48.6 1.7 17.5 9.1 2.2 0.1 7.5 8.4 2.0 1.4 0.7 808.5 21.4 343.3 153.8 1.8 185.4 149.8 63.6 30.6 9.3 -50.4 360.5 2.8 64.8 32.4 20GN27 54.2 2.0 14.1 6.0 3.9 0.2 5.2 7.7 3.4 1.3 0.4 902.1 25.4 275.8 132.7 2.7 128.8 136.9 108.7 27.8 6.1 -134.7 286.9 -14.5 71.1 43.4 20GN28 53.0 2.5 13.4 5.6 4.5 0.2 4.5 9.5 2.6 1.7 0.5 881.3 31.0 263.4 134.6 3.1 111.2 169.6 82.3 35.9 6.8 -193.9 276.8 -28.7 82.9 45.8 20GH76 50.4 1.4 16.1 6.4 3.4 0.2 6.9 11.0 1.9 1.2 0.2 837.9 17.5 316.6 132.1 2.5 170.0 195.8 61.0 25.7 2.5 -161.7 319.6 -21.6 80.7 40.9 20GN77 50.4 1.5 16.5 6.2 3.5 0.2 6.7 10.7 1.8 0.5 0.2 838.7 19.1 323.1 129.7 2.5 167.2 189.9 58.4 9.8 2.8 -124.9 316.1 -10.5 73.7 36.8 20GN36 53.1 1.6 15.1 8.1 1.6 0.3 5.8 7.5 2.8 1.9 0.2 883.8 20.3 297.0 132.6 4.2 143.7 134.1 90.7 39.7 2.1 -101.6 296.5 -7.5 65.8 41.7 20GN37 53.5 1.7 15.0 7.7 2.1 0.3 5.7 7.5 2.8 1.9 0.2 889.7 20.7 294.0 133.1 4.2 140.9 133.2 91.3 39.5 2.1 -103.2 294.7 -7.5 65.8 41.6 20GN39 53.5 1.6 14.7 7.9 1.7 0.3 6.0 8.1 2.8 1.5 0.2 890.7 19.8 288.0 130.9 3.7 148.4 143.7 90.4 32.7 2.1 -122.5 299.0 -11.2 70.3 40.9 20GN40 53.4 1.6 15.3 7.9 1.5 0.3 5.9 7.7 2.7 1.8 0.2 888.5 19.9 299.3 128.5 4.1 145.2 137.8 88.1 37.2 2.1 -101.6 293.5 -6.8 65.3 41.5 20GN41 52.8 1.6 15.2 7.8 2.1 0.3 6.0 7.4 2.8 1.9 0.2 878.8 20.2 297.8 134.1 4.1 147.9 132.1 88.7 40.3 2.1 -95.6 302.1 -6.2 65.5 40.6 20GN42 50.0 1.4 16.7 8.0 1.6 0.2 7.7 8.6 2.7 1.0 0.2 832.4 17.4 327.6 132.0 3.2 189.8 152.5 87.4 20.2 2.1 -85.0 339.2 -5.3 68.3 36.9 20GN43 50.8 1.6 15.7 7.9 1.9 0.3 6.6 9.4 2.8 1.0 0.2 844.9 19.8 308.0 133.4 3.8 163.5 168.3 90.4 22.1 2.3 -141.1 316.7 -18.5 76.5 42.0 20GN44 51.4 1.3 15.7 8.2 1.6 0.2 7.9 8.1 2.6 1.0 0.2 855.7 16.5 307.4 133.2 3.0 196.3 144.1 83.6 20.8 2.1 -85.2 346.0 -2.5 69.5 33.0 20GN45 50.1 1.6 15.5 8.7 1.9 0.3 6.7 9.8 2.7 0.8 0.2 832.9 20.0 303.1 144.7 3.5 165.0 174.9 86.5 16.6 2.4 -149.8 329.8 -20.1 80.5 39.6 Group 2 (high-mg andesite)
20GN74 59.1 0.8 13.4 4.4 2.9 0.1 5.2 6.9 2.6 2.5 0.4 982.9 10.3 261.9 97.3 2.0 128.5 123.0 83.3 52.0 4.9 -119.5 236.1 -5.0 60.2 44.8 20GN70 59.4 0.8 13.2 5.1 2.0 0.1 5.4 6.4 3.0 2.6 0.4 988.5 10.0 258.1 95.8 1.8 135.0 113.6 97.1 55.0 5.2 -121.2 240.8 -6.8 60.8 46.0 20GN25 62.7 1.2 13.5 4.5 2.3 0.1 3.7 4.9 2.6 2.3 0.3 1044 14.6 264.0 91.9 1.6 92.3 88.1 84.2 48.0 3.7 -44.4 198.8 18.3 39.7 42.0 20GN26 61.7 1.2 13.5 5.0 2.7 0.1 3.8 5.2 2.1 2.5 0.3 1027 14.4 263.8 103.6 1.4 94.0 92.7 68.1 53.7 3.5 -43.4 212.0 18.9 41.8 39.4 20GN80 63.1 1.0 13.1 4.1 3.6 0.1 3.6 4.8 2.7 2.6 0.4 1050 12.6 257.0 102.7 1.7 88.1 84.7 88.4 54.4 5.5 -55.2 203.5 14.9 42.3 42.8 20GN82 63.1 1.3 13.0 3.4 4.2 0.2 3.3 4.4 2.5 1.1 0.4 1051 16.6 255.2 100.1 2.1 80.9 78.6 80.3 23.1 4.9 -5.6 197.7 33.4 32.4 34.1 20GN65 65.1 1.2 13.1 3.8 2.9 0.1 2.6 3.7 3.7 1.6 0.3 1083 14.4 257.7 89.5 1.7 64.5 66.7 118.4 32.9 4.5 -27.0 168.4 23.2 31.5 45.3 Group 3 (rhyolite)
20GN83 76.6 0.2 11.7 0.4 1.9 0.0 0.2 0.3 1.7 5.8 0.0 1274 2.1 229.9 28.3 0.1 4.2 5.0 54.9 122.1 0.3 43.0 34.6 51.4 -3.4 52.0 20GN84 74.0 0.2 13.1 0.3 1.8 0.0 0.2 0.5 1.6 7.0 0.0 1232 2.1 257.6 25.9 0.3 4.0 8.0 50.0 148.4 0.3 43.1 32.0 44.6 -3.8 59.2 20GN85 76.5 0.1 11.6 0.3 1.7 0.0 0.2 0.5 1.8 5.7 0.0 1273 1.0 226.8 24.8 0.4 5.2 9.5 58.7 121.7 0.3 27.5 31.0 47.0 -0.8 53.7 20GN86 76.9 0.2 11.9 0.6 1.2 0.0 0.2 0.1 1.7 6.1 0.0 1280 2.0 234.2 23.3 0.1 4.5 1.8 56.1 129.7 0.1 44.8 29.8 50.6 -4.5 53.9 20GN90 77.1 0.2 11.7 0.2 0.9 0.0 0.3 0.4 2.4 6.1 0.0 1283 2.8 230.3 13.9 0.4 7.7 6.4 77.4 130.1 0.3 9.9 24.3 38.9 1.7 59.3 20GN91 72.4 0.4 14.1 0.3 1.7 0.0 0.4 0.1 1.9 7.9 0.1 1205 4.9 275.6 24.1 0.4 10.9 2.5 60.3 167.9 0.7 42.3 39.9 37.9 -2.4 64.5 20GN92 73.2 0.3 13.2 0.2 1.6 0.0 0.2 0.1 2.5 7.9 0.0 1219 4.3 259.3 22.0 0.4 6.0 2.5 79.7 167.3 0.6 7.3 32.3 28.3 3.4 68.3 20GN93 76.9 0.3 12.0 0.1 1.1 0.0 0.4 0.3 1.9 6.1 0.0 1279 3.1 236.0 14.7 0.6 9.9 4.5 60.7 130.4 0.3 36.0 27.7 47.4 -3.0 55.6 20GN95 76.6 0.2 11.8 0.2 0.7 0.1 0.3 0.4 3.1 6.0 0.0 1274 2.4 230.5 11.7 0.7 6.9 7.0 101.0 127.2 0.4 -11.6 21.0 30.4 5.5 64.1 20GN34 76.9 0.4 11.1 0.8 2.1 0.0 0.4 1.2 1.9 3.9 0.1 1280 5.3 217.5 36.2 0.4 10.2 21.2 61.6 81.7 1.0 31.7 51.7 53.6 1.6 44.8 20GN35 77.0 0.4 10.5 0.8 2.2 0.0 0.4 1.7 1.8 3.6 0.1 1281 5.4 205.2 38.4 0.6 8.9 30.5 58.7 76.2 1.3 9.2 52.7 49.7 6.3 43.9 20GN08 72.1 0.3 13.5 1.8 1.1 0.0 0.5 0.7 2.3 6.3 0.1 1200 4.0 264.4 38.0 0.4 11.4 11.8 75.5 134.2 1.3 31.2 53.4 37.8 1.9 60.3
Changpu basalts (Cen T. et al., 2016 Lithos 256 311-330)
08GN05-1 54.5 2.0 16.0 10.1 0.2 5.0 9.5 1.8 0.8 0.3 907.0 24.5 313.5 139.7 2.3 123.1 170.1 56.5 17.8 3.7 -101.1 287.3 -0.5 64.0 36.5 08GN05-2 58.1 1.9 16.8 9.9 0.1 4.1 4.1 3.7 1.3 0.2 967.5 23.2 329.1 137.2 1.7 100.5 72.6 118.4 26.5 2.7 39.0 260.8 29.3 31.6 39.1 08GN05-3 54.0 1.9 15.9 9.7 0.2 4.7 10.3 1.6 1.5 0.3 898.8 23.8 312.3 134.7 2.3 117.4 183.5 51.0 31.2 3.5 -136.9 275.8 -10.8 69.2 41.6 08GN05-4 52.3 2.2 17.1 11.2 0.2 5.1 7.6 3.1 1.1 0.3 869.7 26.9 335.4 156.1 2.4 127.0 134.6 99.7 22.7 3.8 -56.3 310.0 1.6 58.1 40.3 08GN05-5 54.8 1.9 16.1 10.1 0.2 4.3 8.9 2.0 1.5 0.3 911.1 24.0 315.8 140.9 2.1 106.9 157.8 64.2 31.8 3.9 -95.9 271.9 -1.7 60.5 41.1 08GN14-1 54.4 2.8 14.6 12.3 0.2 3.9 7.2 3.2 1.2 0.3 906.0 34.9 285.4 170.5 2.7 96.3 128.7 102.3 25.3 4.2 -99.6 301.7 -4.7 66.1 38.7 08GN14-2 57.1 2.6 13.5 10.3 0.1 2.7 12.2 0.6 0.4 0.4 950.7 32.9 265.4 142.9 1.8 68.0 217.2 18.1 8.9 5.8 -196.0 243.8 -14.7 78.4 36.2 08GN14-3 54.3 2.8 14.0 12.7 0.2 3.9 7.6 3.0 1.1 0.4 903.6 35.3 275.4 176.4 2.7 97.0 134.8 97.8 23.4 5.1 -115.3 308.7 -7.7 70.4 37.3 08GN14-4 55.2 2.9 13.9 12.7 0.2 3.9 6.1 2.8 2.1 0.3 919.1 35.9 273.0 176.2 2.7 95.5 109.0 90.4 43.5 4.4 -78.7 307.7 1.3 63.0 35.7 08GN14-6 50.9 2.4 15.5 13.1 0.2 4.6 11.8 1.0 0.2 0.4 846.2 29.8 304.4 181.8 2.3 114.9 209.7 32.3 4.9 5.8 -152.1 326.5 -12.8 81.6 31.1 08GN32-7 51.3 1.9 14.7 11.7 0.1 8.0 9.3 2.1 0.6 0.3 853.4 23.4 288.5 163.0 1.8 198.3 165.3 67.8 13.4 3.9 -123.2 384.7 -8.3 81.9 26.4 08GN32-8 47.2 2.6 16.6 9.7 0.2 3.7 13.3 3.1 3.1 0.6 785.8 32.7 325.2 135.1 2.7 92.3 237.0 98.4 64.8 8.0 -311.9 260.1 -71.7 100.8 70.8 08GN32-9 46.8 5.0 15.7 15.1 0.2 5.2 6.7 1.9 2.7 0.8 778.8 62.1 308.0 209.5 2.5 128.3 119.8 60.7 57.3 11.7 -49.7 399.8 0.6 71.9 27.6 08GN32-11 53.4 2.6 15.7 10.6 0.1 6.6 5.3 3.4 1.7 0.5 889.2 33.0 308.4 146.9 1.4 164.5 94.7 108.7 36.3 7.5 -26.1 344.5 9.5 56.9 33.6 08GN32-12 46.4 5.1 16.0 14.9 0.2 5.1 6.7 2.2 2.7 0.9 771.7 64.1 312.9 207.5 2.7 125.3 119.3 69.4 57.5 12.0 -52.6 396.9 -1.7 71.8 29.9 08GN34-1 52.1 3.0 15.1 13.2 0.2 4.5 9.3 1.8 0.6 0.3 867.5 37.9 295.2 183.5 2.5 111.7 164.9 57.8 11.7 4.4 -104.1 333.0 -2.3 72.5 29.8 08GN34-2 52.2 3.0 14.8 13.1 0.2 4.4 9.4 1.8 0.7 0.3 868.5 37.9 291.1 182.2 2.7 109.9 168.3 56.8 14.9 4.2 -117.2 330.1 -5.3 74.5 30.8 08GN34-4 51.3 3.0 15.1 13.3 0.2 4.8 9.8 1.9 0.4 0.3 854.4 37.4 296.8 184.2 2.7 118.1 174.6 60.0 8.3 4.4 -120.7 339.7 -7.1 76.6 30.5 08GN45-1 54.6 2.8 14.6 12.9 0.2 4.9 6.1 3.3 0.4 0.3 908.6 35.3 285.8 179.7 2.8 121.1 108.6 105.2 8.3 3.5 -44.9 336.1 11.1 60.1 28.8 08GN45-4 52.8 3.0 16.0 14.6 0.3 5.6 5.5 1.3 0.6 0.3 878.5 37.9 313.1 203.2 4.1 140.0 98.8 41.9 11.9 3.7 61.7 381.1 42.6 46.4 11.0 08GN45-5 54.0 2.9 14.9 13.3 0.2 5.6 6.1 2.6 0.2 0.3 898.0 35.8 291.5 185.1 3.1 139.2 109.1 83.6 4.5 3.7 -14.8 360.1 20.8 58.0 21.2 08GN45-8 49.8 3.2 14.9 13.5 0.2 5.2 9.5 2.8 0.5 0.6 828.8 39.9 291.7 187.5 3.1 127.8 168.9 90.4 9.6 7.9 -146.0 355.2 -18.3 83.5 34.8 08GN45-9 47.6 3.3 15.4 13.7 0.3 5.6 10.7 2.6 0.3 0.6 791.8 41.7 302.1 189.9 3.7 138.7 190.6 82.9 7.2 8.3 -169.3 370.2 -26.1 90.7 35.3
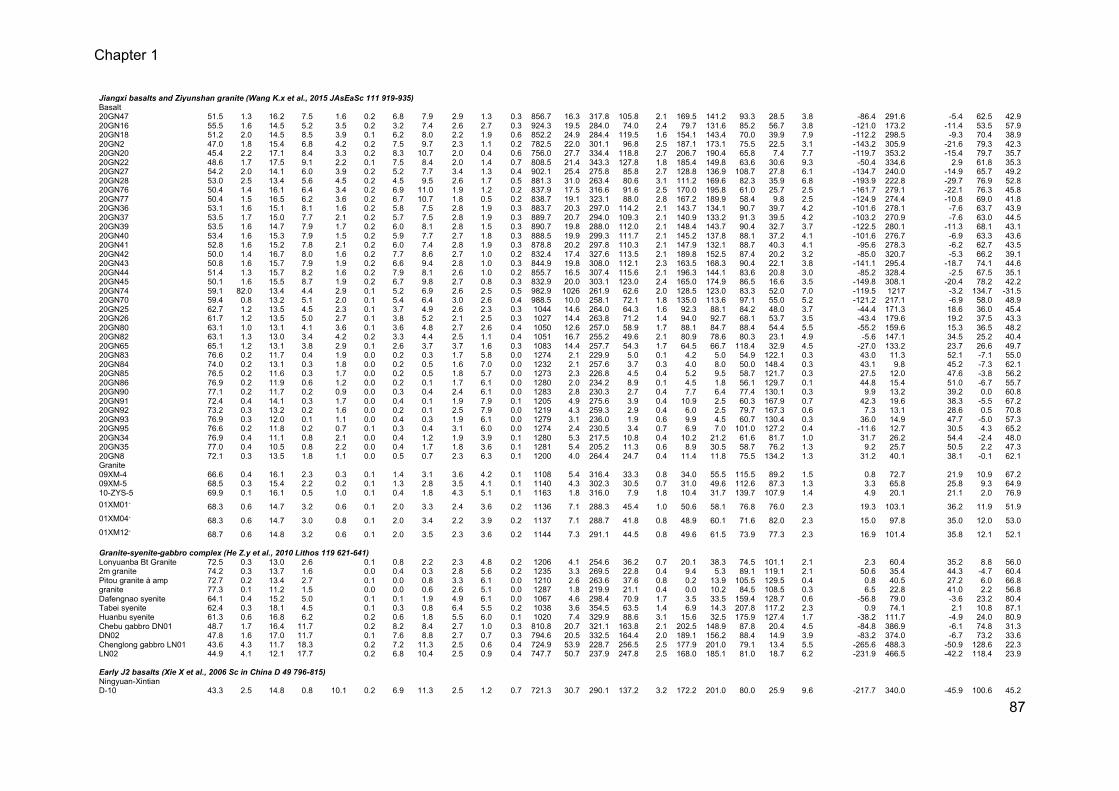
Chapter 1
87
Jiangxi basalts and Ziyunshan granite (Wang K.x et al., 2015 JAsEaSc 111 919-935)
Basalt
20GN47 51.5 1.3 16.2 7.5 1.6 0.2 6.8 7.9 2.9 1.3 0.3 856.7 16.3 317.8 105.8 2.1 169.5 141.2 93.3 28.5 3.8 -86.4 291.6 -5.4 62.5 42.9 20GN16 55.5 1.6 14.5 5.2 3.5 0.2 3.2 7.4 2.6 2.7 0.3 924.3 19.5 284.0 74.0 2.4 79.7 131.6 85.2 56.7 3.8 -121.0 173.2 -11.4 53.5 57.9 20GN18 51.2 2.0 14.5 8.5 3.9 0.1 6.2 8.0 2.2 1.9 0.6 852.2 24.9 284.4 119.5 1.6 154.1 143.4 70.0 39.9 7.9 -112.2 298.5 -9.3 70.4 38.9 20GN2 47.0 1.8 15.4 6.8 4.2 0.2 7.5 9.7 2.3 1.1 0.2 782.5 22.0 301.1 96.8 2.5 187.1 173.1 75.5 22.5 3.1 -143.2 305.9 -21.6 79.3 42.3 20GN20 45.4 2.2 17.1 8.4 3.3 0.2 8.3 10.7 2.0 0.4 0.6 756.0 27.7 334.4 118.8 2.7 206.7 190.4 65.8 7.4 7.7 -119.7 353.2 -15.4 79.7 35.7 20GN22 48.6 1.7 17.5 9.1 2.2 0.1 7.5 8.4 2.0 1.4 0.7 808.5 21.4 343.3 127.8 1.8 185.4 149.8 63.6 30.6 9.3 -50.4 334.6 2.9 61.8 35.3 20GN27 54.2 2.0 14.1 6.0 3.9 0.2 5.2 7.7 3.4 1.3 0.4 902.1 25.4 275.8 85.8 2.7 128.8 136.9 108.7 27.8 6.1 -134.7 240.0 -14.9 65.7 49.2 20GN28 53.0 2.5 13.4 5.6 4.5 0.2 4.5 9.5 2.6 1.7 0.5 881.3 31.0 263.4 80.6 3.1 111.2 169.6 82.3 35.9 6.8 -193.9 222.8 -29.7 76.9 52.8 20GN76 50.4 1.4 16.1 6.4 3.4 0.2 6.9 11.0 1.9 1.2 0.2 837.9 17.5 316.6 91.6 2.5 170.0 195.8 61.0 25.7 2.5 -161.7 279.1 -22.1 76.3 45.8 20GN77 50.4 1.5 16.5 6.2 3.6 0.2 6.7 10.7 1.8 0.5 0.2 838.7 19.1 323.1 88.0 2.8 167.2 189.9 58.4 9.8 2.5 -124.9 274.4 -10.8 69.0 41.8 20GN36 53.1 1.6 15.1 8.1 1.6 0.2 5.8 7.5 2.8 1.9 0.3 883.7 20.3 297.0 114.2 2.1 143.7 134.1 90.7 39.7 4.2 -101.6 278.1 -7.6 63.7 43.9 20GN37 53.5 1.7 15.0 7.7 2.1 0.2 5.7 7.5 2.8 1.9 0.3 889.7 20.7 294.0 109.3 2.1 140.9 133.2 91.3 39.5 4.2 -103.2 270.9 -7.6 63.0 44.5 20GN39 53.5 1.6 14.7 7.9 1.7 0.2 6.0 8.1 2.8 1.5 0.3 890.7 19.8 288.0 112.0 2.1 148.4 143.7 90.4 32.7 3.7 -122.5 280.1 -11.3 68.1 43.1 20GN40 53.4 1.6 15.3 7.9 1.5 0.2 5.9 7.7 2.7 1.8 0.3 888.5 19.9 299.3 111.7 2.1 145.2 137.8 88.1 37.2 4.1 -101.6 276.7 -6.9 63.3 43.6 20GN41 52.8 1.6 15.2 7.8 2.1 0.2 6.0 7.4 2.8 1.9 0.3 878.8 20.2 297.8 110.3 2.1 147.9 132.1 88.7 40.3 4.1 -95.6 278.3 -6.2 62.7 43.5 20GN42 50.0 1.4 16.7 8.0 1.6 0.2 7.7 8.6 2.7 1.0 0.2 832.4 17.4 327.6 113.5 2.1 189.8 152.5 87.4 20.2 3.2 -85.0 320.7 -5.3 66.2 39.1 20GN43 50.8 1.6 15.7 7.9 1.9 0.2 6.6 9.4 2.8 1.0 0.3 844.9 19.8 308.0 112.1 2.3 163.5 168.3 90.4 22.1 3.8 -141.1 295.4 -18.7 74.1 44.6 20GN44 51.4 1.3 15.7 8.2 1.6 0.2 7.9 8.1 2.6 1.0 0.2 855.7 16.5 307.4 115.6 2.1 196.3 144.1 83.6 20.8 3.0 -85.2 328.4 -2.5 67.5 35.1 20GN45 50.1 1.6 15.5 8.7 1.9 0.2 6.7 9.8 2.7 0.8 0.3 832.9 20.0 303.1 123.0 2.4 165.0 174.9 86.5 16.6 3.5 -149.8 308.1 -20.4 78.2 42.2 20GN74 59.1 82.0 13.4 4.4 2.9 0.1 5.2 6.9 2.6 2.5 0.5 982.9 1026 261.9 62.6 2.0 128.5 123.0 83.3 52.0 7.0 -119.5 1217 -3.2 134.7 -31.5 20GN70 59.4 0.8 13.2 5.1 2.0 0.1 5.4 6.4 3.0 2.6 0.4 988.5 10.0 258.1 72.1 1.8 135.0 113.6 97.1 55.0 5.2 -121.2 217.1 -6.9 58.0 48.9 20GN25 62.7 1.2 13.5 4.5 2.3 0.1 3.7 4.9 2.6 2.3 0.3 1044 14.6 264.0 64.3 1.6 92.3 88.1 84.2 48.0 3.7 -44.4 171.3 18.6 36.0 45.4 20GN26 61.7 1.2 13.5 5.0 2.7 0.1 3.8 5.2 2.1 2.5 0.3 1027 14.4 263.8 71.2 1.4 94.0 92.7 68.1 53.7 3.5 -43.4 179.6 19.2 37.5 43.3 20GN80 63.1 1.0 13.1 4.1 3.6 0.1 3.6 4.8 2.7 2.6 0.4 1050 12.6 257.0 58.9 1.7 88.1 84.7 88.4 54.4 5.5 -55.2 159.6 15.3 36.5 48.2 20GN82 63.1 1.3 13.0 3.4 4.2 0.2 3.3 4.4 2.5 1.1 0.4 1051 16.7 255.2 49.6 2.1 80.9 78.6 80.3 23.1 4.9 -5.6 147.1 34.5 25.2 40.4 20GN65 65.1 1.2 13.1 3.8 2.9 0.1 2.6 3.7 3.7 1.6 0.3 1083 14.4 257.7 54.3 1.7 64.5 66.7 118.4 32.9 4.5 -27.0 133.2 23.7 26.6 49.7 20GN83 76.6 0.2 11.7 0.4 1.9 0.0 0.2 0.3 1.7 5.8 0.0 1274 2.1 229.9 5.0 0.1 4.2 5.0 54.9 122.1 0.3 43.0 11.3 52.1 -7.1 55.0 20GN84 74.0 0.2 13.1 0.3 1.8 0.0 0.2 0.5 1.6 7.0 0.0 1232 2.1 257.6 3.7 0.3 4.0 8.0 50.0 148.4 0.3 43.1 9.8 45.2 -7.3 62.1 20GN85 76.5 0.2 11.6 0.3 1.7 0.0 0.2 0.5 1.8 5.7 0.0 1273 2.3 226.8 4.5 0.4 5.2 9.5 58.7 121.7 0.3 27.5 12.0 47.6 -3.8 56.2 20GN86 76.9 0.2 11.9 0.6 1.2 0.0 0.2 0.1 1.7 6.1 0.0 1280 2.0 234.2 8.9 0.1 4.5 1.8 56.1 129.7 0.1 44.8 15.4 51.0 -6.7 55.7 20GN90 77.1 0.2 11.7 0.2 0.9 0.0 0.3 0.4 2.4 6.1 0.0 1283 2.8 230.3 2.7 0.4 7.7 6.4 77.4 130.1 0.3 9.9 13.2 39.2 0.0 60.8 20GN91 72.4 0.4 14.1 0.3 1.7 0.0 0.4 0.1 1.9 7.9 0.1 1205 4.9 275.6 3.9 0.4 10.9 2.5 60.3 167.9 0.7 42.3 19.6 38.3 -5.5 67.2 20GN92 73.2 0.3 13.2 0.2 1.6 0.0 0.2 0.1 2.5 7.9 0.0 1219 4.3 259.3 2.9 0.4 6.0 2.5 79.7 167.3 0.6 7.3 13.1 28.6 0.5 70.8 20GN93 76.9 0.3 12.0 0.1 1.1 0.0 0.4 0.3 1.9 6.1 0.0 1279 3.1 236.0 1.9 0.6 9.9 4.5 60.7 130.4 0.3 36.0 14.9 47.7 -5.0 57.3 20GN95 76.6 0.2 11.8 0.2 0.7 0.1 0.3 0.4 3.1 6.0 0.0 1274 2.4 230.5 3.4 0.7 6.9 7.0 101.0 127.2 0.4 -11.6 12.7 30.5 4.3 65.2 20GN34 76.9 0.4 11.1 0.8 2.1 0.0 0.4 1.2 1.9 3.9 0.1 1280 5.3 217.5 10.8 0.4 10.2 21.2 61.6 81.7 1.0 31.7 26.2 54.4 -2.4 48.0 20GN35 77.0 0.4 10.5 0.8 2.2 0.0 0.4 1.7 1.8 3.6 0.1 1281 5.4 205.2 11.3 0.6 8.9 30.5 58.7 76.2 1.3 9.2 25.7 50.5 2.2 47.3 20GN8 72.1 0.3 13.5 1.8 1.1 0.0 0.5 0.7 2.3 6.3 0.1 1200 4.0 264.4 24.7 0.4 11.4 11.8 75.5 134.2 1.3 31.2 40.1 38.1 -0.1 62.1 Granite
09XM-4 66.6 0.4 16.1 2.3 0.3 0.1 1.4 3.1 3.6 4.2 0.1 1108 5.4 316.4 33.3 0.8 34.0 55.5 115.5 89.2 1.5 0.8 72.7 21.9 10.9 67.2 09XM-5 68.5 0.3 15.4 2.2 0.2 0.1 1.3 2.8 3.5 4.1 0.1 1140 4.3 302.3 30.5 0.7 31.0 49.6 112.6 87.3 1.3 3.3 65.8 25.8 9.3 64.9 10-ZYS-5 69.9 0.1 16.1 0.5 1.0 0.1 0.4 1.8 4.3 5.1 0.1 1163 1.8 316.0 7.9 1.8 10.4 31.7 139.7 107.9 1.4 4.9 20.1 21.1 2.0 76.9 01XM01∗ 68.3 0.6 14.7 3.2 0.6 0.1 2.0 3.3 2.4 3.6 0.2 1136 7.1 288.3 45.4 1.0 50.6 58.1 76.8 76.0 2.3 19.3 103.1 36.2 11.9 51.9 01XM04∗ 68.3 0.6 14.7 3.0 0.8 0.1 2.0 3.4 2.2 3.9 0.2 1137 7.1 288.7 41.8 0.8 48.9 60.1 71.6 82.0 2.3 15.0 97.8 35.0 12.0 53.0 01XM12∗ 68.7 0.6 14.8 3.2 0.6 0.1 2.0 3.5 2.3 3.6 0.2 1144 7.3 291.1 44.5 0.8 49.6 61.5 73.9 77.3 2.3 16.9 101.4 35.8 12.1 52.1
Granite-syenite-gabbro complex (He Z.y et al., 2010 Lithos 119 621-641)
Lonyuanba Bt Granite 72.5 0.3 13.0 2.6 0.1 0.8 2.2 2.3 4.8 0.2 1206 4.1 254.6 36.2 0.7 20.1 38.3 74.5 101.1 2.1 2.3 60.4 35.2 8.8 56.0 2m granite 74.2 0.3 13.7 1.6 0.0 0.4 0.3 2.8 5.6 0.2 1235 3.3 269.5 22.8 0.4 9.4 5.3 89.1 119.1 2.1 50.6 35.4 44.3 -4.7 60.4 Pitou granite à amp 72.7 0.2 13.4 2.7 0.1 0.0 0.8 3.3 6.1 0.0 1210 2.6 263.6 37.6 0.8 0.2 13.9 105.5 129.5 0.4 0.8 40.5 27.2 6.0 66.8 granite 77.3 0.1 11.2 1.5 0.0 0.0 0.6 2.6 5.1 0.0 1287 1.8 219.9 21.1 0.4 0.0 10.2 84.5 108.5 0.3 6.5 22.8 41.0 2.2 56.8 Dafengnao syenite 64.1 0.4 15.2 5.0 0.1 0.1 1.9 4.9 6.1 0.0 1067 4.6 298.4 70.9 1.7 3.5 33.5 159.4 128.7 0.6 -56.8 79.0 -3.6 23.2 80.4 Tabei syenite 62.4 0.3 18.1 4.5 0.1 0.3 0.8 6.4 5.5 0.2 1038 3.6 354.5 63.5 1.4 6.9 14.3 207.8 117.2 2.3 0.9 74.1 2.1 10.8 87.1 Huanbu syenite 61.3 0.6 16.8 6.2 0.2 0.6 1.8 5.5 6.0 0.1 1020 7.4 329.9 88.6 3.1 15.6 32.5 175.9 127.4 1.7 -38.2 111.7 -4.9 24.0 80.9 Chebu gabbro DN01 48.7 1.7 16.4 11.7 0.2 8.2 8.4 2.7 1.0 0.3 810.8 20.7 321.1 163.8 2.1 202.5 148.9 87.8 20.4 4.5 -84.8 386.9 -6.1 74.8 31.3 DN02 47.8 1.6 17.0 11.7 0.1 7.6 8.8 2.7 0.7 0.3 794.6 20.5 332.5 164.4 2.0 189.1 156.2 88.4 14.9 3.9 -83.2 374.0 -6.7 73.2 33.6 Chenglong gabbro LN01 43.6 4.3 11.7 18.3 0.2 7.2 11.3 2.5 0.6 0.4 724.9 53.9 228.7 256.5 2.5 177.9 201.0 79.1 13.4 5.5 -265.6 488.3 -50.9 128.6 22.3 LN02 44.9 4.1 12.1 17.7 0.2 6.8 10.4 2.5 0.9 0.4 747.7 50.7 237.9 247.8 2.5 168.0 185.1 81.0 18.7 6.2 -231.9 466.5 -42.2 118.4 23.9
Early J2 basalts (Xie X et al., 2006 Sc in China D 49 796-815)
Ningyuan-Xintian
D-10 43.3 2.5 14.8 0.8 10.1 0.2 6.9 11.3 2.5 1.2 0.7 721.3 30.7 290.1 137.2 3.2 172.2 201.0 80.0 25.9 9.6 -217.7 340.0 -45.9 100.6 45.2
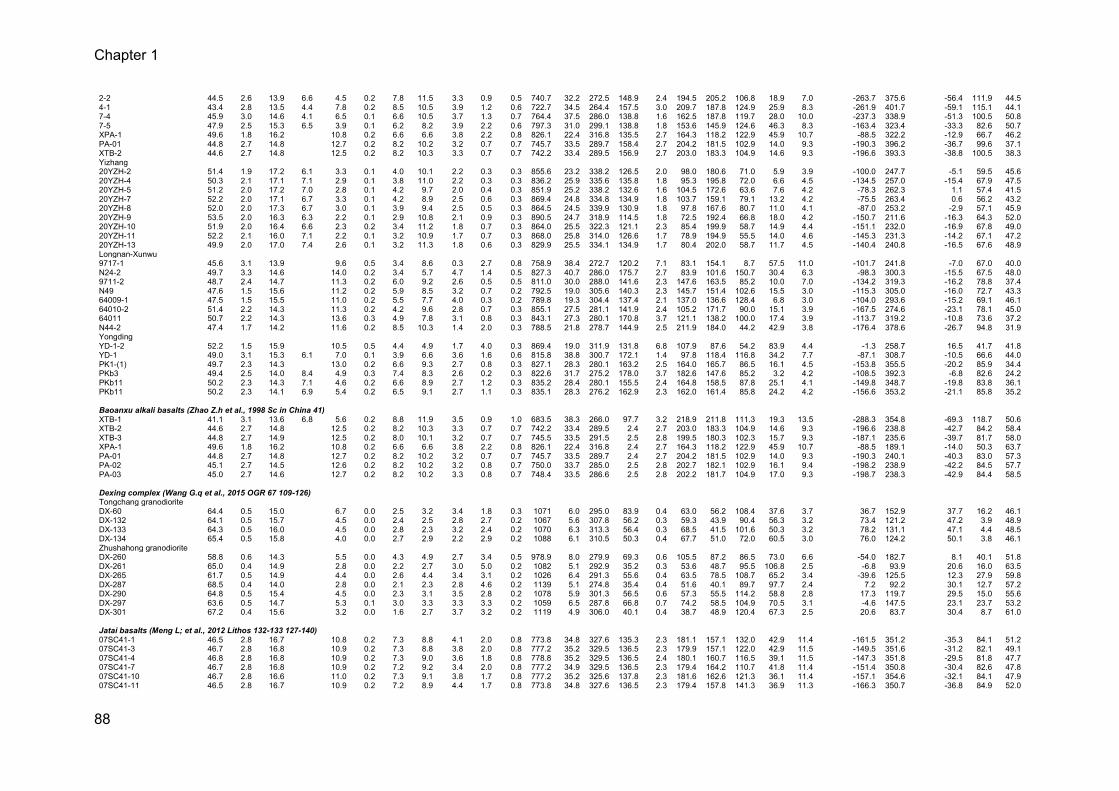
Chapter 1
88
2-2 44.5 2.6 13.9 6.6 4.5 0.2 7.8 11.5 3.3 0.9 0.5 740.7 32.2 272.5 148.9 2.4 194.5 205.2 106.8 18.9 7.0 -263.7 375.6 -56.4 111.9 44.5 4-1 43.4 2.8 13.5 4.4 7.8 0.2 8.5 10.5 3.9 1.2 0.6 722.7 34.5 264.4 157.5 3.0 209.7 187.8 124.9 25.9 8.3 -261.9 401.7 -59.1 115.1 44.1 7-4 45.9 3.0 14.6 4.1 6.5 0.1 6.6 10.5 3.7 1.3 0.7 764.4 37.5 286.0 138.8 1.6 162.5 187.8 119.7 28.0 10.0 -237.3 338.9 -51.3 100.5 50.8 7-5 47.9 2.5 15.3 6.5 3.9 0.1 6.2 8.2 3.9 2.2 0.6 797.3 31.0 299.1 138.8 1.8 153.6 145.9 124.6 46.3 8.3 -163.4 323.4 -33.3 82.6 50.7 XPA-1 49.6 1.8 16.2 10.8 0.2 6.6 6.6 3.8 2.2 0.8 826.1 22.4 316.8 135.5 2.7 164.3 118.2 122.9 45.9 10.7 -88.5 322.2 -12.9 66.7 46.2 PA-01 44.8 2.7 14.8 12.7 0.2 8.2 10.2 3.2 0.7 0.7 745.7 33.5 289.7 158.4 2.7 204.2 181.5 102.9 14.0 9.3 -190.3 396.2 -36.7 99.6 37.1 XTB-2 44.6 2.7 14.8 12.5 0.2 8.2 10.3 3.3 0.7 0.7 742.2 33.4 289.5 156.9 2.7 203.0 183.3 104.9 14.6 9.3 -196.6 393.3 -38.8 100.5 38.3 Yizhang
20YZH-2 51.4 1.9 17.2 6.1 3.3 0.1 4.0 10.1 2.2 0.3 0.3 855.6 23.2 338.2 126.5 2.0 98.0 180.6 71.0 5.9 3.9 -100.0 247.7 -5.1 59.5 45.6 20YZH-4 50.3 2.1 17.1 7.1 2.9 0.1 3.8 11.0 2.2 0.3 0.3 836.2 25.9 335.6 135.8 1.8 95.3 195.8 72.0 6.6 4.5 -134.5 257.0 -15.4 67.9 47.5 20YZH-5 51.2 2.0 17.2 7.0 2.8 0.1 4.2 9.7 2.0 0.4 0.3 851.9 25.2 338.2 132.6 1.6 104.5 172.6 63.6 7.6 4.2 -78.3 262.3 1.1 57.4 41.5 20YZH-7 52.2 2.0 17.1 6.7 3.3 0.1 4.2 8.9 2.5 0.6 0.3 869.4 24.8 334.8 134.9 1.8 103.7 159.1 79.1 13.2 4.2 -75.5 263.4 0.6 56.2 43.2 20YZH-8 52.0 2.0 17.3 6.7 3.0 0.1 3.9 9.4 2.5 0.5 0.3 864.5 24.5 339.9 130.9 1.8 97.8 167.6 80.7 11.0 4.1 -87.0 253.2 -2.9 57.1 45.9 20YZH-9 53.5 2.0 16.3 6.3 2.2 0.1 2.9 10.8 2.1 0.9 0.3 890.5 24.7 318.9 114.5 1.8 72.5 192.4 66.8 18.0 4.2 -150.7 211.6 -16.3 64.3 52.0 20YZH-10 51.9 2.0 16.4 6.6 2.3 0.2 3.4 11.2 1.8 0.7 0.3 864.0 25.5 322.3 121.1 2.3 85.4 199.9 58.7 14.9 4.4 -151.1 232.0 -16.9 67.8 49.0 20YZH-11 52.2 2.1 16.0 7.1 2.2 0.1 3.2 10.9 1.7 0.7 0.3 868.0 25.8 314.0 126.6 1.7 78.9 194.9 55.5 14.0 4.6 -145.3 231.3 -14.2 67.1 47.2 20YZH-13 49.9 2.0 17.0 7.4 2.6 0.1 3.2 11.3 1.8 0.6 0.3 829.9 25.5 334.1 134.9 1.7 80.4 202.0 58.7 11.7 4.5 -140.4 240.8 -16.5 67.6 48.9 Longnan-Xunwu
9717-1 45.6 3.1 13.9 9.6 0.5 3.4 8.6 0.3 2.7 0.8 758.9 38.4 272.7 120.2 7.1 83.1 154.1 8.7 57.5 11.0 -101.7 241.8 -7.0 67.0 40.0 N24-2 49.7 3.3 14.6 14.0 0.2 3.4 5.7 4.7 1.4 0.5 827.3 40.7 286.0 175.7 2.7 83.9 101.6 150.7 30.4 6.3 -98.3 300.3 -15.5 67.5 48.0 9711-2 48.7 2.4 14.7 11.3 0.2 6.0 9.2 2.6 0.5 0.5 811.0 30.0 288.0 141.6 2.3 147.6 163.5 85.2 10.0 7.0 -134.2 319.3 -16.2 78.8 37.4 N49 47.6 1.5 15.6 11.2 0.2 5.9 8.5 3.2 0.7 0.2 792.5 19.0 305.6 140.3 2.3 145.7 151.4 102.6 15.5 3.0 -115.3 305.0 -16.0 72.7 43.3 64009-1 47.5 1.5 15.5 11.0 0.2 5.5 7.7 4.0 0.3 0.2 789.8 19.3 304.4 137.4 2.1 137.0 136.6 128.4 6.8 3.0 -104.0 293.6 -15.2 69.1 46.1 64010-2 51.4 2.2 14.3 11.3 0.2 4.2 9.6 2.8 0.7 0.3 855.1 27.5 281.1 141.9 2.4 105.2 171.7 90.0 15.1 3.9 -167.5 274.6 -23.1 78.1 45.0 64011 50.7 2.2 14.3 13.6 0.3 4.9 7.8 3.1 0.8 0.3 843.1 27.3 280.1 170.8 3.7 121.1 138.2 100.0 17.4 3.9 -113.7 319.2 -10.8 73.6 37.2 N44-2 47.4 1.7 14.2 11.6 0.2 8.5 10.3 1.4 2.0 0.3 788.5 21.8 278.7 144.9 2.5 211.9 184.0 44.2 42.9 3.8 -176.4 378.6 -26.7 94.8 31.9 Yongding
YD-1-2 52.2 1.5 15.9 10.5 0.5 4.4 4.9 1.7 4.0 0.3 869.4 19.0 311.9 131.8 6.8 107.9 87.6 54.2 83.9 4.4 -1.3 258.7 16.5 41.7 41.8 YD-1 49.0 3.1 15.3 6.1 7.0 0.1 3.9 6.6 3.6 1.6 0.6 815.8 38.8 300.7 172.1 1.4 97.8 118.4 116.8 34.2 7.7 -87.1 308.7 -10.5 66.6 44.0 PK1-(1) 49.7 2.3 14.3 13.0 0.2 6.6 9.3 2.7 0.8 0.3 827.1 28.3 280.1 163.2 2.5 164.0 165.7 86.5 16.1 4.5 -153.8 355.5 -20.2 85.9 34.4 PKb3 49.4 2.5 14.0 8.4 4.9 0.3 7.4 8.3 2.6 0.2 0.3 822.6 31.7 275.2 178.0 3.7 182.6 147.6 85.2 3.2 4.2 -108.5 392.3 -6.8 82.6 24.2 PKb11 50.2 2.3 14.3 7.1 4.6 0.2 6.6 8.9 2.7 1.2 0.3 835.2 28.4 280.1 155.5 2.4 164.8 158.5 87.8 25.1 4.1 -149.8 348.7 -19.8 83.8 36.1 PKb11 50.2 2.3 14.1 6.9 5.4 0.2 6.5 9.1 2.7 1.1 0.3 835.1 28.3 276.2 162.9 2.3 162.0 161.4 85.8 24.2 4.2 -156.6 353.2 -21.1 85.8 35.2
Baoanxu alkali basalts (Zhao Z.h et al., 1998 Sc in China 41)
XTB-1 41.1 3.1 13.6 6.8 5.6 0.2 8.8 11.9 3.5 0.9 1.0 683.5 38.3 266.0 97.7 3.2 218.9 211.8 111.3 19.3 13.5 -288.3 354.8 -69.3 118.7 50.6 XTB-2 44.6 2.7 14.8 12.5 0.2 8.2 10.3 3.3 0.7 0.7 742.2 33.4 289.5 2.4 2.7 203.0 183.3 104.9 14.6 9.3 -196.6 238.8 -42.7 84.2 58.4 XTB-3 44.8 2.7 14.9 12.5 0.2 8.0 10.1 3.2 0.7 0.7 745.5 33.5 291.5 2.5 2.8 199.5 180.3 102.3 15.7 9.3 -187.1 235.6 -39.7 81.7 58.0 XPA-1 49.6 1.8 16.2 10.8 0.2 6.6 6.6 3.8 2.2 0.8 826.1 22.4 316.8 2.4 2.7 164.3 118.2 122.9 45.9 10.7 -88.5 189.1 -14.0 50.3 63.7 PA-01 44.8 2.7 14.8 12.7 0.2 8.2 10.2 3.2 0.7 0.7 745.7 33.5 289.7 2.4 2.7 204.2 181.5 102.9 14.0 9.3 -190.3 240.1 -40.3 83.0 57.3 PA-02 45.1 2.7 14.5 12.6 0.2 8.2 10.2 3.2 0.8 0.7 750.0 33.7 285.0 2.5 2.8 202.7 182.1 102.9 16.1 9.4 -198.2 238.9 -42.2 84.5 57.7 PA-03 45.0 2.7 14.6 12.7 0.2 8.2 10.2 3.3 0.8 0.7 748.4 33.5 286.6 2.5 2.8 202.2 181.7 104.9 17.0 9.3 -198.7 238.3 -42.9 84.4 58.5
Dexing complex (Wang G.q et al., 2015 OGR 67 109-126)
Tongchang granodiorite
DX-60 64.4 0.5 15.0 6.7 0.0 2.5 3.2 3.4 1.8 0.3 1071 6.0 295.0 83.9 0.4 63.0 56.2 108.4 37.6 3.7 36.7 152.9 37.7 16.2 46.1 DX-132 64.1 0.5 15.7 4.5 0.0 2.4 2.5 2.8 2.7 0.2 1067 5.6 307.8 56.2 0.3 59.3 43.9 90.4 56.3 3.2 73.4 121.2 47.2 3.9 48.9 DX-133 64.3 0.5 16.0 4.5 0.0 2.8 2.3 3.2 2.4 0.2 1070 6.3 313.3 56.4 0.3 68.5 41.5 101.6 50.3 3.2 78.2 131.1 47.1 4.4 48.5 DX-134 65.4 0.5 15.8 4.0 0.0 2.7 2.9 2.2 2.9 0.2 1088 6.1 310.5 50.3 0.4 67.7 51.0 72.0 60.5 3.0 76.0 124.2 50.1 3.8 46.1 Zhushahong granodiorite
DX-260 58.8 0.6 14.3 5.5 0.0 4.3 4.9 2.7 3.4 0.5 978.9 8.0 279.9 69.3 0.6 105.5 87.2 86.5 73.0 6.6 -54.0 182.7 8.1 40.1 51.8 DX-261 65.0 0.4 14.9 2.8 0.0 2.2 2.7 3.0 5.0 0.2 1082 5.1 292.9 35.2 0.3 53.6 48.7 95.5 106.8 2.5 -6.8 93.9 20.6 16.0 63.5 DX-265 61.7 0.5 14.9 4.4 0.0 2.6 4.4 3.4 3.1 0.2 1026 6.4 291.3 55.6 0.4 63.5 78.5 108.7 65.2 3.4 -39.6 125.5 12.3 27.9 59.8 DX-287 68.5 0.4 14.0 2.8 0.0 2.1 2.3 2.8 4.6 0.2 1139 5.1 274.8 35.4 0.4 51.6 40.1 89.7 97.7 2.4 7.2 92.2 30.1 12.7 57.2 DX-290 64.8 0.5 15.4 4.5 0.0 2.3 3.1 3.5 2.8 0.2 1078 5.9 301.3 56.5 0.6 57.3 55.5 114.2 58.8 2.8 17.3 119.7 29.5 15.0 55.6 DX-297 63.6 0.5 14.7 5.3 0.1 3.0 3.3 3.3 3.3 0.2 1059 6.5 287.8 66.8 0.7 74.2 58.5 104.9 70.5 3.1 -4.6 147.5 23.1 23.7 53.2 DX-301 67.2 0.4 15.6 3.2 0.0 1.6 2.7 3.7 3.2 0.2 1119 4.9 306.0 40.1 0.4 38.7 48.9 120.4 67.3 2.5 20.6 83.7 30.4 8.7 61.0
Jatai basalts (Meng L; et al., 2012 Lithos 132-133 127-140)
07SC41-1 46.5 2.8 16.7 10.8 0.2 7.3 8.8 4.1 2.0 0.8 773.8 34.8 327.6 135.3 2.3 181.1 157.1 132.0 42.9 11.4 -161.5 351.2 -35.3 84.1 51.2 07SC41-3 46.7 2.8 16.8 10.9 0.2 7.3 8.8 3.8 2.0 0.8 777.2 35.2 329.5 136.5 2.3 179.9 157.1 122.0 42.9 11.5 -149.5 351.6 -31.2 82.1 49.1 07SC41-4 46.8 2.8 16.8 10.9 0.2 7.3 9.0 3.6 1.8 0.8 778.8 35.2 329.5 136.5 2.4 180.1 160.7 116.5 39.1 11.5 -147.3 351.8 -29.5 81.8 47.7 07SC41-7 46.7 2.8 16.8 10.9 0.2 7.2 9.2 3.4 2.0 0.8 777.2 34.9 329.5 136.5 2.3 179.4 164.2 110.7 41.8 11.4 -151.4 350.8 -30.4 82.6 47.8 07SC41-10 46.7 2.8 16.6 11.0 0.2 7.3 9.1 3.8 1.7 0.8 777.2 35.2 325.6 137.8 2.3 181.6 162.6 121.3 36.1 11.4 -157.1 354.6 -32.1 84.1 47.9 07SC41-11 46.5 2.8 16.7 10.9 0.2 7.2 8.9 4.4 1.7 0.8 773.8 34.8 327.6 136.5 2.3 179.4 157.8 141.3 36.9 11.3 -166.3 350.7 -36.8 84.9 52.0
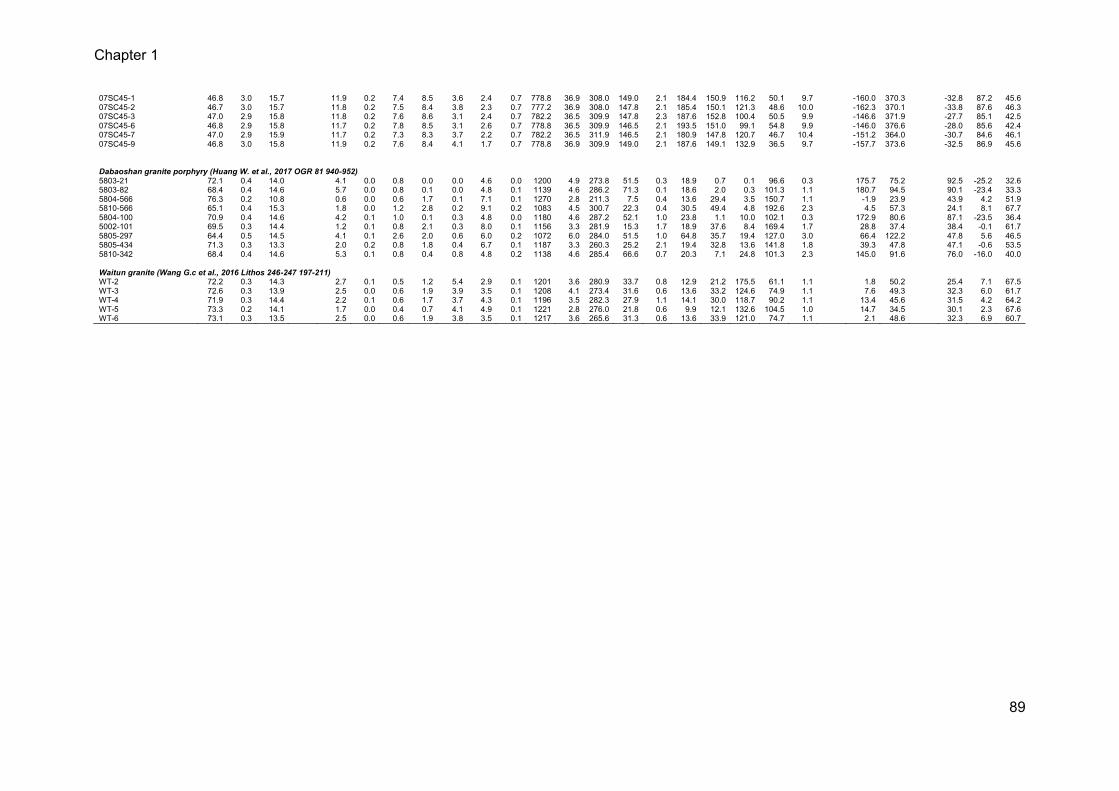
Chapter 1
89
07SC45-1 46.8 3.0 15.7 11.9 0.2 7.4 8.5 3.6 2.4 0.7 778.8 36.9 308.0 149.0 2.1 184.4 150.9 116.2 50.1 9.7 -160.0 370.3 -32.8 87.2 45.6 07SC45-2 46.7 3.0 15.7 11.8 0.2 7.5 8.4 3.8 2.3 0.7 777.2 36.9 308.0 147.8 2.1 185.4 150.1 121.3 48.6 10.0 -162.3 370.1 -33.8 87.6 46.3 07SC45-3 47.0 2.9 15.8 11.8 0.2 7.6 8.6 3.1 2.4 0.7 782.2 36.5 309.9 147.8 2.3 187.6 152.8 100.4 50.5 9.9 -146.6 371.9 -27.7 85.1 42.5 07SC45-6 46.8 2.9 15.8 11.7 0.2 7.8 8.5 3.1 2.6 0.7 778.8 36.5 309.9 146.5 2.1 193.5 151.0 99.1 54.8 9.9 -146.0 376.6 -28.0 85.6 42.4 07SC45-7 47.0 2.9 15.9 11.7 0.2 7.3 8.3 3.7 2.2 0.7 782.2 36.5 311.9 146.5 2.1 180.9 147.8 120.7 46.7 10.4 -151.2 364.0 -30.7 84.6 46.1 07SC45-9 46.8 3.0 15.8 11.9 0.2 7.6 8.4 4.1 1.7 0.7 778.8 36.9 309.9 149.0 2.1 187.6 149.1 132.9 36.5 9.7 -157.7 373.6 -32.5 86.9 45.6
Dabaoshan granite porphyry (Huang W. et al., 2017 OGR 81 940-952)
5803-21 72.1 0.4 14.0 4.1 0.0 0.8 0.0 0.0 4.6 0.0 1200 4.9 273.8 51.5 0.3 18.9 0.7 0.1 96.6 0.3 175.7 75.2 92.5 -25.2 32.6 5803-82 68.4 0.4 14.6 5.7 0.0 0.8 0.1 0.0 4.8 0.1 1139 4.6 286.2 71.3 0.1 18.6 2.0 0.3 101.3 1.1 180.7 94.5 90.1 -23.4 33.3 5804-566 76.3 0.2 10.8 0.6 0.0 0.6 1.7 0.1 7.1 0.1 1270 2.8 211.3 7.5 0.4 13.6 29.4 3.5 150.7 1.1 -1.9 23.9 43.9 4.2 51.9 5810-566 65.1 0.4 15.3 1.8 0.0 1.2 2.8 0.2 9.1 0.2 1083 4.5 300.7 22.3 0.4 30.5 49.4 4.8 192.6 2.3 4.5 57.3 24.1 8.1 67.7 5804-100 70.9 0.4 14.6 4.2 0.1 1.0 0.1 0.3 4.8 0.0 1180 4.6 287.2 52.1 1.0 23.8 1.1 10.0 102.1 0.3 172.9 80.6 87.1 -23.5 36.4 5002-101 69.5 0.3 14.4 1.2 0.1 0.8 2.1 0.3 8.0 0.1 1156 3.3 281.9 15.3 1.7 18.9 37.6 8.4 169.4 1.7 28.8 37.4 38.4 -0.1 61.7 5805-297 64.4 0.5 14.5 4.1 0.1 2.6 2.0 0.6 6.0 0.2 1072 6.0 284.0 51.5 1.0 64.8 35.7 19.4 127.0 3.0 66.4 122.2 47.8 5.6 46.5 5805-434 71.3 0.3 13.3 2.0 0.2 0.8 1.8 0.4 6.7 0.1 1187 3.3 260.3 25.2 2.1 19.4 32.8 13.6 141.8 1.8 39.3 47.8 47.1 -0.6 53.5 5810-342 68.4 0.4 14.6 5.3 0.1 0.8 0.4 0.8 4.8 0.2 1138 4.6 285.4 66.6 0.7 20.3 7.1 24.8 101.3 2.3 145.0 91.6 76.0 -16.0 40.0
Waitun granite (Wang G.c et al., 2016 Lithos 246-247 197-211)
WT-2 72.2 0.3 14.3 2.7 0.1 0.5 1.2 5.4 2.9 0.1 1201 3.6 280.9 33.7 0.8 12.9 21.2 175.5 61.1 1.1 1.8 50.2 25.4 7.1 67.5 WT-3 72.6 0.3 13.9 2.5 0.0 0.6 1.9 3.9 3.5 0.1 1208 4.1 273.4 31.6 0.6 13.6 33.2 124.6 74.9 1.1 7.6 49.3 32.3 6.0 61.7 WT-4 71.9 0.3 14.4 2.2 0.1 0.6 1.7 3.7 4.3 0.1 1196 3.5 282.3 27.9 1.1 14.1 30.0 118.7 90.2 1.1 13.4 45.6 31.5 4.2 64.2 WT-5 73.3 0.2 14.1 1.7 0.0 0.4 0.7 4.1 4.9 0.1 1221 2.8 276.0 21.8 0.6 9.9 12.1 132.6 104.5 1.0 14.7 34.5 30.1 2.3 67.6 WT-6 73.1 0.3 13.5 2.5 0.0 0.6 1.9 3.8 3.5 0.1 1217 3.6 265.6 31.3 0.6 13.6 33.9 121.0 74.7 1.1 2.1 48.6 32.3 6.9 60.7
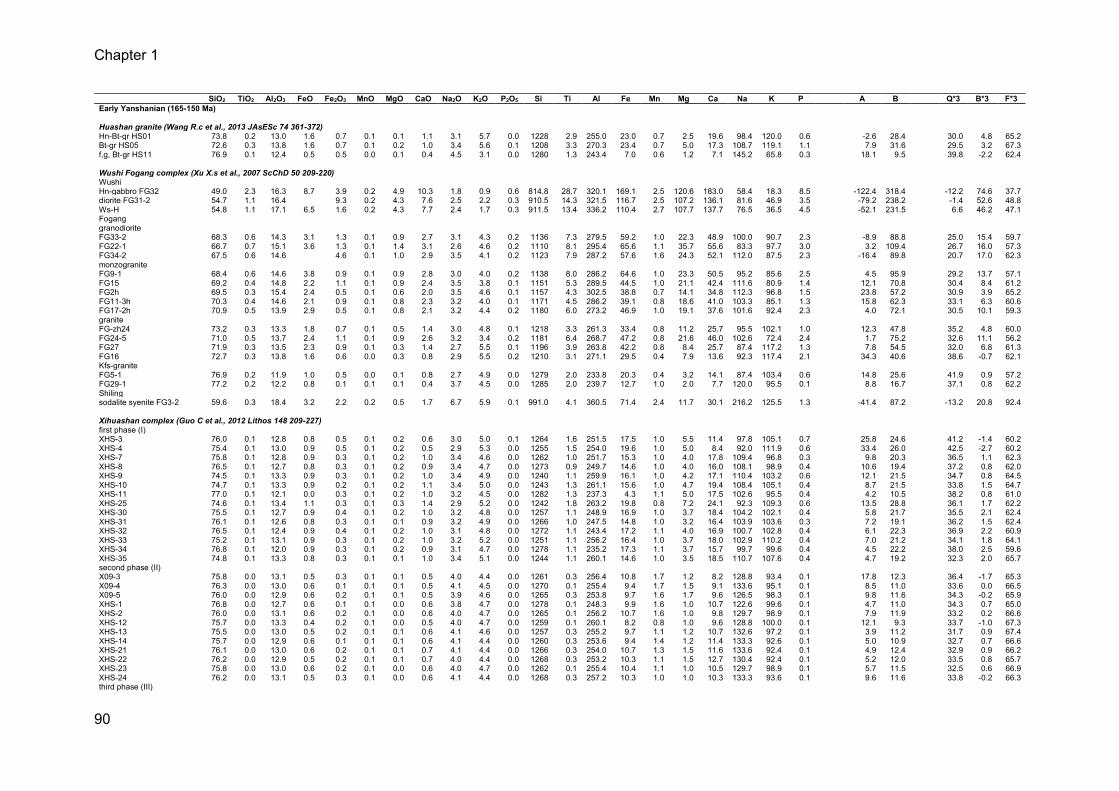
Chapter 1
90
SiO2 TiO2 Al2O3 FeO Fe2O3 MnO MgO CaO Na2O K2O P2O5 Si Ti Al Fe Mn Mg Ca Na K P A B Q*3 B*3 F*3 Early Yanshanian (165-150 Ma)
Huashan granite (Wang R.c et al., 2013 JAsESc 74 361-372)
Hn-Bt-gr HS01 73.8 0.2 13.0 1.6 0.7 0.1 0.1 1.1 3.1 5.7 0.0 1228 2.9 255.0 23.0 0.7 2.5 19.6 98.4 120.0 0.6 -2.6 28.4 30.0 4.8 65.2 Bt-gr HS05 72.6 0.3 13.8 1.6 0.7 0.1 0.2 1.0 3.4 5.6 0.1 1208 3.3 270.3 23.4 0.7 5.0 17.3 108.7 119.1 1.1 7.9 31.6 29.5 3.2 67.3 f,g, Bt-gr HS11 76.9 0.1 12.4 0.5 0.5 0.0 0.1 0.4 4.5 3.1 0.0 1280 1.3 243.4 7.0 0.6 1.2 7.1 145.2 65.8 0.3 18.1 9.5 39.8 -2.2 62.4
Wushi Fogang complex (Xu X.s et al., 2007 ScChD 50 209-220)
Wushi
Hn-gabbro FG32 49.0 2.3 16.3 8.7 3.9 0.2 4.9 10.3 1.8 0.9 0.6 814.8 28.7 320.1 169.1 2.5 120.6 183.0 58.4 18.3 8.5 -122.4 318.4 -12.2 74.6 37.7 diorite FG31-2 54.7 1.1 16.4 9.3 0.2 4.3 7.6 2.5 2.2 0.3 910.5 14.3 321.5 116.7 2.5 107.2 136.1 81.6 46.9 3.5 -79.2 238.2 -1.4 52.6 48.8 Ws-H 54.8 1.1 17.1 6.5 1.6 0.2 4.3 7.7 2.4 1.7 0.3 911.5 13.4 336.2 110.4 2.7 107.7 137.7 76.5 36.5 4.5 -52.1 231.5 6.6 46.2 47.1 Fogang
granodiorite
FG33-2 68.3 0.6 14.3 3.1 1.3 0.1 0.9 2.7 3.1 4.3 0.2 1136 7.3 279.5 59.2 1.0 22.3 48.9 100.0 90.7 2.3 -8.9 88.8 25.0 15.4 59.7 FG22-1 66.7 0.7 15.1 3.6 1.3 0.1 1.4 3.1 2.6 4.6 0.2 1110 8.1 295.4 65.6 1.1 35.7 55.6 83.3 97.7 3.0 3.2 109.4 26.7 16.0 57.3 FG34-2 67.5 0.6 14.6 4.6 0.1 1.0 2.9 3.5 4.1 0.2 1123 7.9 287.2 57.6 1.6 24.3 52.1 112.0 87.5 2.3 -16.4 89.8 20.7 17.0 62.3 monzogranite
FG9-1 68.4 0.6 14.6 3.8 0.9 0.1 0.9 2.8 3.0 4.0 0.2 1138 8.0 286.2 64.6 1.0 23.3 50.5 95.2 85.6 2.5 4.5 95.9 29.2 13.7 57.1 FG15 69.2 0.4 14.8 2.2 1.1 0.1 0.9 2.4 3.5 3.8 0.1 1151 5.3 289.5 44.5 1.0 21.1 42.4 111.6 80.9 1.4 12.1 70.8 30.4 8.4 61.2 FG2h 69.5 0.3 15.4 2.4 0.5 0.1 0.6 2.0 3.5 4.6 0.1 1157 4.3 302.5 38.8 0.7 14.1 34.8 112.3 96.8 1.5 23.8 57.2 30.9 3.9 65.2 FG11-3h 70.3 0.4 14.6 2.1 0.9 0.1 0.8 2.3 3.2 4.0 0.1 1171 4.5 286.2 39.1 0.8 18.6 41.0 103.3 85.1 1.3 15.8 62.3 33.1 6.3 60.6 FG17-2h 70.9 0.5 13.9 2.9 0.5 0.1 0.8 2.1 3.2 4.4 0.2 1180 6.0 273.2 46.9 1.0 19.1 37.6 101.6 92.4 2.3 4.0 72.1 30.5 10.1 59.3 granite
FG-zh24 73.2 0.3 13.3 1.8 0.7 0.1 0.5 1.4 3.0 4.8 0.1 1218 3.3 261.3 33.4 0.8 11.2 25.7 95.5 102.1 1.0 12.3 47.8 35.2 4.8 60.0 FG24-5 71.0 0.5 13.7 2.4 1.1 0.1 0.9 2.6 3.2 3.4 0.2 1181 6.4 268.7 47.2 0.8 21.6 46.0 102.6 72.4 2.4 1.7 75.2 32.6 11.1 56.2 FG27 71.9 0.3 13.5 2.3 0.9 0.1 0.3 1.4 2.7 5.5 0.1 1196 3.9 263.8 42.2 0.8 8.4 25.7 87.4 117.2 1.3 7.8 54.5 32.0 6.8 61.3 FG16 72.7 0.3 13.8 1.6 0.6 0.0 0.3 0.8 2.9 5.5 0.2 1210 3.1 271.1 29.5 0.4 7.9 13.6 92.3 117.4 2.1 34.3 40.6 38.6 -0.7 62.1 Kfs-granite
FG5-1 76.9 0.2 11.9 1.0 0.5 0.0 0.1 0.8 2.7 4.9 0.0 1279 2.0 233.8 20.3 0.4 3.2 14.1 87.4 103.4 0.6 14.8 25.6 41.9 0.9 57.2 FG29-1 77.2 0.2 12.2 0.8 0.1 0.1 0.1 0.4 3.7 4.5 0.0 1285 2.0 239.7 12.7 1.0 2.0 7.7 120.0 95.5 0.1 8.8 16.7 37.1 0.8 62.2 Shiling
sodalite syenite FG3-2 59.6 0.3 18.4 3.2 2.2 0.2 0.5 1.7 6.7 5.9 0.1 991.0 4.1 360.5 71.4 2.4 11.7 30.1 216.2 125.5 1.3 -41.4 87.2 -13.2 20.8 92.4
Xihuashan complex (Guo C et al., 2012 Lithos 148 209-227)
first phase (I)
XHS-3 76.0 0.1 12.8 0.8 0.5 0.1 0.2 0.6 3.0 5.0 0.1 1264 1.6 251.5 17.5 1.0 5.5 11.4 97.8 105.1 0.7 25.8 24.6 41.2 -1.4 60.2 XHS-4 75.4 0.1 13.0 0.9 0.5 0.1 0.2 0.5 2.9 5.3 0.0 1255 1.5 254.0 19.6 1.0 5.0 8.4 92.0 111.9 0.6 33.4 26.0 42.5 -2.7 60.2 XHS-7 75.8 0.1 12.8 0.9 0.3 0.1 0.2 1.0 3.4 4.6 0.0 1262 1.0 251.7 15.3 1.0 4.0 17.8 109.4 96.8 0.3 9.8 20.3 36.5 1.1 62.3 XHS-8 76.5 0.1 12.7 0.8 0.3 0.1 0.2 0.9 3.4 4.7 0.0 1273 0.9 249.7 14.6 1.0 4.0 16.0 108.1 98.9 0.4 10.6 19.4 37.2 0.8 62.0 XHS-9 74.5 0.1 13.3 0.9 0.3 0.1 0.2 1.0 3.4 4.9 0.0 1240 1.1 259.9 16.1 1.0 4.2 17.1 110.4 103.2 0.6 12.1 21.5 34.7 0.8 64.5 XHS-10 74.7 0.1 13.3 0.9 0.2 0.1 0.2 1.1 3.4 5.0 0.0 1243 1.3 261.1 15.6 1.0 4.7 19.4 108.4 105.1 0.4 8.7 21.5 33.8 1.5 64.7 XHS-11 77.0 0.1 12.1 0.0 0.3 0.1 0.2 1.0 3.2 4.5 0.0 1282 1.3 237.3 4.3 1.1 5.0 17.5 102.6 95.5 0.4 4.2 10.5 38.2 0.8 61.0 XHS-25 74.6 0.1 13.4 1.1 0.3 0.1 0.3 1.4 2.9 5.2 0.0 1242 1.8 263.2 19.8 0.8 7.2 24.1 92.3 109.3 0.6 13.5 28.8 36.1 1.7 62.2 XHS-30 75.5 0.1 12.7 0.9 0.4 0.1 0.2 1.0 3.2 4.8 0.0 1257 1.1 248.9 16.9 1.0 3.7 18.4 104.2 102.1 0.4 5.8 21.7 35.5 2.1 62.4 XHS-31 76.1 0.1 12.6 0.8 0.3 0.1 0.1 0.9 3.2 4.9 0.0 1266 1.0 247.5 14.8 1.0 3.2 16.4 103.9 103.6 0.3 7.2 19.1 36.2 1.5 62.4 XHS-32 76.5 0.1 12.4 0.9 0.4 0.1 0.2 1.0 3.1 4.8 0.0 1272 1.1 243.4 17.2 1.1 4.0 16.9 100.7 102.8 0.4 6.1 22.3 36.9 2.2 60.9 XHS-33 75.2 0.1 13.1 0.9 0.3 0.1 0.2 1.0 3.2 5.2 0.0 1251 1.1 256.2 16.4 1.0 3.7 18.0 102.9 110.2 0.4 7.0 21.2 34.1 1.8 64.1 XHS-34 76.8 0.1 12.0 0.9 0.3 0.1 0.2 0.9 3.1 4.7 0.0 1278 1.1 235.2 17.3 1.1 3.7 15.7 99.7 99.6 0.4 4.5 22.2 38.0 2.5 59.6 XHS-35 74.8 0.1 13.3 0.8 0.3 0.1 0.1 1.0 3.4 5.1 0.0 1244 1.1 260.1 14.6 1.0 3.5 18.5 110.7 107.6 0.4 4.7 19.2 32.3 2.0 65.7 second phase (II)
X09-3 75.8 0.0 13.1 0.5 0.3 0.1 0.1 0.5 4.0 4.4 0.0 1261 0.3 256.4 10.8 1.7 1.2 8.2 128.8 93.4 0.1 17.8 12.3 36.4 -1.7 65.3 X09-4 76.3 0.0 13.0 0.6 0.1 0.1 0.1 0.5 4.1 4.5 0.0 1270 0.1 255.4 9.4 1.7 1.5 9.1 133.6 95.1 0.1 8.5 11.0 33.6 0.0 66.5 X09-5 76.0 0.0 12.9 0.6 0.2 0.1 0.1 0.5 3.9 4.6 0.0 1265 0.3 253.8 9.7 1.6 1.7 9.6 126.5 98.3 0.1 9.8 11.6 34.3 -0.2 65.9 XHS-1 76.8 0.0 12.7 0.6 0.1 0.1 0.0 0.6 3.8 4.7 0.0 1278 0.1 248.3 9.9 1.6 1.0 10.7 122.6 99.6 0.1 4.7 11.0 34.3 0.7 65.0 XHS-2 76.0 0.0 13.1 0.6 0.2 0.1 0.0 0.6 4.0 4.7 0.0 1265 0.1 256.2 10.7 1.6 1.0 9.8 129.7 98.9 0.1 7.9 11.9 33.2 0.2 66.6 XHS-12 75.7 0.0 13.3 0.4 0.2 0.1 0.0 0.5 4.0 4.7 0.0 1259 0.1 260.1 8.2 0.8 1.0 9.6 128.8 100.0 0.1 12.1 9.3 33.7 -1.0 67.3 XHS-13 75.5 0.0 13.0 0.5 0.2 0.1 0.1 0.6 4.1 4.6 0.0 1257 0.3 255.2 9.7 1.1 1.2 10.7 132.6 97.2 0.1 3.9 11.2 31.7 0.9 67.4 XHS-14 75.7 0.0 12.9 0.6 0.1 0.1 0.1 0.6 4.1 4.4 0.0 1260 0.3 253.6 9.4 1.4 1.2 11.4 133.3 92.6 0.1 5.0 10.9 32.7 0.7 66.6 XHS-21 76.1 0.0 13.0 0.6 0.2 0.1 0.1 0.7 4.1 4.4 0.0 1266 0.3 254.0 10.7 1.3 1.5 11.6 133.6 92.4 0.1 4.9 12.4 32.9 0.9 66.2 XHS-22 76.2 0.0 12.9 0.5 0.2 0.1 0.1 0.7 4.0 4.4 0.0 1268 0.3 253.2 10.3 1.1 1.5 12.7 130.4 92.4 0.1 5.2 12.0 33.5 0.8 65.7 XHS-23 75.8 0.0 13.0 0.6 0.2 0.1 0.0 0.6 4.0 4.7 0.0 1262 0.1 255.4 10.4 1.1 1.0 10.5 129.7 98.9 0.1 5.7 11.5 32.5 0.6 66.9 XHS-24 76.2 0.0 13.1 0.5 0.3 0.1 0.0 0.6 4.1 4.4 0.0 1268 0.3 257.2 10.3 1.0 1.0 10.3 133.3 93.6 0.1 9.6 11.6 33.8 -0.2 66.3 third phase (III)
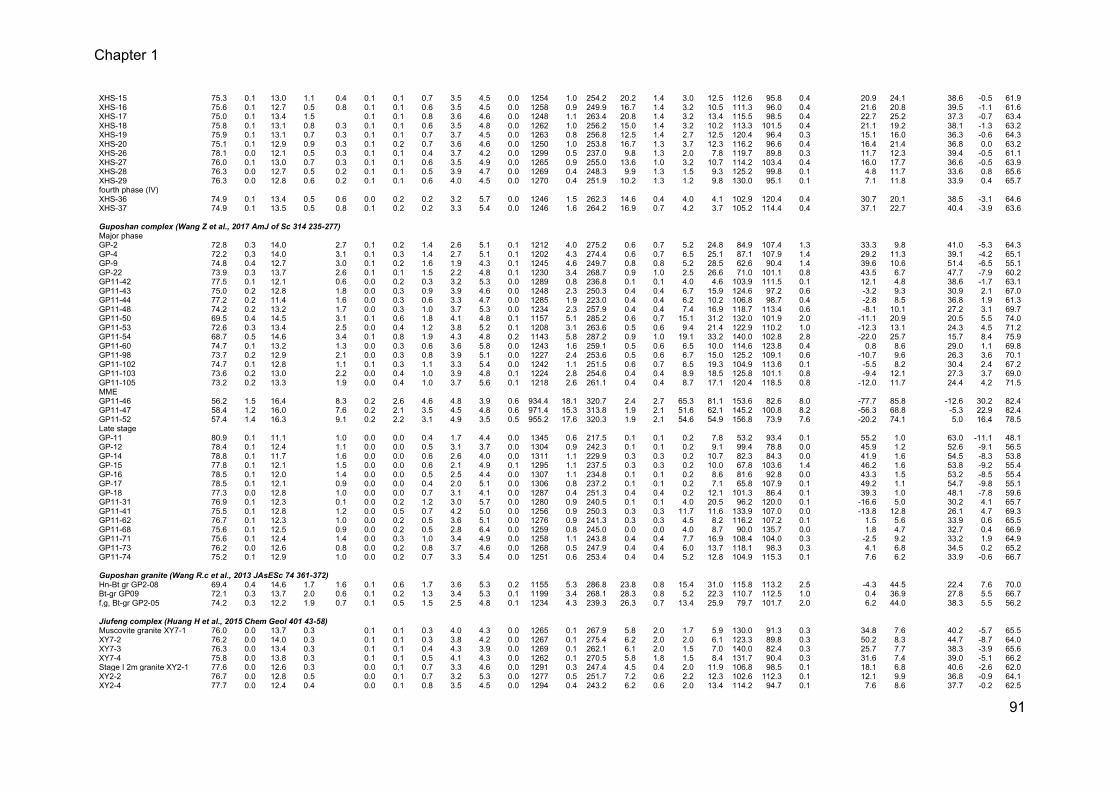
Chapter 1
91
XHS-15 75.3 0.1 13.0 1.1 0.4 0.1 0.1 0.7 3.5 4.5 0.0 1254 1.0 254.2 20.2 1.4 3.0 12.5 112.6 95.8 0.4 20.9 24.1 38.6 -0.5 61.9 XHS-16 75.6 0.1 12.7 0.5 0.8 0.1 0.1 0.6 3.5 4.5 0.0 1258 0.9 249.9 16.7 1.4 3.2 10.5 111.3 96.0 0.4 21.6 20.8 39.5 -1.1 61.6 XHS-17 75.0 0.1 13.4 1.5 0.1 0.1 0.8 3.6 4.6 0.0 1248 1.1 263.4 20.8 1.4 3.2 13.4 115.5 98.5 0.4 22.7 25.2 37.3 -0.7 63.4 XHS-18 75.8 0.1 13.1 0.8 0.3 0.1 0.1 0.6 3.5 4.8 0.0 1262 1.0 256.2 15.0 1.4 3.2 10.2 113.3 101.5 0.4 21.1 19.2 38.1 -1.3 63.2 XHS-19 75.9 0.1 13.1 0.7 0.3 0.1 0.1 0.7 3.7 4.5 0.0 1263 0.8 256.8 12.5 1.4 2.7 12.5 120.4 96.4 0.3 15.1 16.0 36.3 -0.6 64.3 XHS-20 75.1 0.1 12.9 0.9 0.3 0.1 0.2 0.7 3.6 4.6 0.0 1250 1.0 253.8 16.7 1.3 3.7 12.3 116.2 96.6 0.4 16.4 21.4 36.8 0.0 63.2 XHS-26 78.1 0.0 12.1 0.5 0.3 0.1 0.1 0.4 3.7 4.2 0.0 1299 0.5 237.0 9.8 1.3 2.0 7.8 119.7 89.8 0.3 11.7 12.3 39.4 -0.5 61.1 XHS-27 76.0 0.1 13.0 0.7 0.3 0.1 0.1 0.6 3.5 4.9 0.0 1265 0.9 255.0 13.6 1.0 3.2 10.7 114.2 103.4 0.4 16.0 17.7 36.6 -0.5 63.9 XHS-28 76.3 0.0 12.7 0.5 0.2 0.1 0.1 0.5 3.9 4.7 0.0 1269 0.4 248.3 9.9 1.3 1.5 9.3 125.2 99.8 0.1 4.8 11.7 33.6 0.8 65.6 XHS-29 76.3 0.0 12.8 0.6 0.2 0.1 0.1 0.6 4.0 4.5 0.0 1270 0.4 251.9 10.2 1.3 1.2 9.8 130.0 95.1 0.1 7.1 11.8 33.9 0.4 65.7 fourth phase (IV)
XHS-36 74.9 0.1 13.4 0.5 0.6 0.0 0.2 0.2 3.2 5.7 0.0 1246 1.5 262.3 14.6 0.4 4.0 4.1 102.9 120.4 0.4 30.7 20.1 38.5 -3.1 64.6 XHS-37 74.9 0.1 13.5 0.5 0.8 0.1 0.2 0.2 3.3 5.4 0.0 1246 1.6 264.2 16.9 0.7 4.2 3.7 105.2 114.4 0.4 37.1 22.7 40.4 -3.9 63.6
Guposhan complex (Wang Z et al., 2017 AmJ of Sc 314 235-277)
Major phase
GP-2 72.8 0.3 14.0 2.7 0.1 0.2 1.4 2.6 5.1 0.1 1212 4.0 275.2 0.6 0.7 5.2 24.8 84.9 107.4 1.3 33.3 9.8 41.0 -5.3 64.3 GP-4 72.2 0.3 14.0 3.1 0.1 0.3 1.4 2.7 5.1 0.1 1202 4.3 274.4 0.6 0.7 6.5 25.1 87.1 107.9 1.4 29.2 11.3 39.1 -4.2 65.1 GP-9 74.8 0.4 12.7 3.0 0.1 0.2 1.6 1.9 4.3 0.1 1245 4.6 249.7 0.8 0.8 5.2 28.5 62.6 90.4 1.4 39.6 10.6 51.4 -6.5 55.1 GP-22 73.9 0.3 13.7 2.6 0.1 0.1 1.5 2.2 4.8 0.1 1230 3.4 268.7 0.9 1.0 2.5 26.6 71.0 101.1 0.8 43.5 6.7 47.7 -7.9 60.2 GP11-42 77.5 0.1 12.1 0.6 0.0 0.2 0.3 3.2 5.3 0.0 1289 0.8 236.8 0.1 0.1 4.0 4.6 103.9 111.5 0.1 12.1 4.8 38.6 -1.7 63.1 GP11-43 75.0 0.2 12.8 1.8 0.0 0.3 0.9 3.9 4.6 0.0 1248 2.3 250.3 0.4 0.4 6.7 15.9 124.6 97.2 0.6 -3.2 9.3 30.9 2.1 67.0 GP11-44 77.2 0.2 11.4 1.6 0.0 0.3 0.6 3.3 4.7 0.0 1285 1.9 223.0 0.4 0.4 6.2 10.2 106.8 98.7 0.4 -2.8 8.5 36.8 1.9 61.3 GP11-48 74.2 0.2 13.2 1.7 0.0 0.3 1.0 3.7 5.3 0.0 1234 2.3 257.9 0.4 0.4 7.4 16.9 118.7 113.4 0.6 -8.1 10.1 27.2 3.1 69.7 GP11-50 69.5 0.4 14.5 3.1 0.1 0.6 1.8 4.1 4.8 0.1 1157 5.1 285.2 0.6 0.7 15.1 31.2 132.0 101.9 2.0 -11.1 20.9 20.5 5.5 74.0 GP11-53 72.6 0.3 13.4 2.5 0.0 0.4 1.2 3.8 5.2 0.1 1208 3.1 263.6 0.5 0.6 9.4 21.4 122.9 110.2 1.0 -12.3 13.1 24.3 4.5 71.2 GP11-54 68.7 0.5 14.6 3.4 0.1 0.8 1.9 4.3 4.8 0.2 1143 5.8 287.2 0.9 1.0 19.1 33.2 140.0 102.8 2.8 -22.0 25.7 15.7 8.4 75.9 GP11-60 74.7 0.1 13.2 1.3 0.0 0.3 0.6 3.6 5.8 0.0 1243 1.6 259.1 0.5 0.6 6.5 10.0 114.6 123.8 0.4 0.8 8.6 29.0 1.1 69.8 GP11-98 73.7 0.2 12.9 2.1 0.0 0.3 0.8 3.9 5.1 0.0 1227 2.4 253.6 0.5 0.6 6.7 15.0 125.2 109.1 0.6 -10.7 9.6 26.3 3.6 70.1 GP11-102 74.7 0.1 12.8 1.1 0.1 0.3 1.1 3.3 5.4 0.0 1242 1.1 251.5 0.6 0.7 6.5 19.3 104.9 113.6 0.1 -5.5 8.2 30.4 2.4 67.2 GP11-103 73.6 0.2 13.0 2.2 0.0 0.4 1.0 3.9 4.8 0.1 1224 2.8 254.6 0.4 0.4 8.9 18.5 125.8 101.1 0.8 -9.4 12.1 27.3 3.7 69.0 GP11-105 73.2 0.2 13.3 1.9 0.0 0.4 1.0 3.7 5.6 0.1 1218 2.6 261.1 0.4 0.4 8.7 17.1 120.4 118.5 0.8 -12.0 11.7 24.4 4.2 71.5 MME
GP11-46 56.2 1.5 16.4 8.3 0.2 2.6 4.6 4.8 3.9 0.6 934.4 18.1 320.7 2.4 2.7 65.3 81.1 153.6 82.6 8.0 -77.7 85.8 -12.6 30.2 82.4 GP11-47 58.4 1.2 16.0 7.6 0.2 2.1 3.5 4.5 4.8 0.6 971.4 15.3 313.8 1.9 2.1 51.6 62.1 145.2 100.8 8.2 -56.3 68.8 -5.3 22.9 82.4 GP11-52 57.4 1.4 16.3 9.1 0.2 2.2 3.1 4.9 3.5 0.5 955.2 17.6 320.3 1.9 2.1 54.6 54.9 156.8 73.9 7.6 -20.2 74.1 5.0 16.4 78.5 Late stage
GP-11 80.9 0.1 11.1 1.0 0.0 0.0 0.4 1.7 4.4 0.0 1345 0.6 217.5 0.1 0.1 0.2 7.8 53.2 93.4 0.1 55.2 1.0 63.0 -11.1 48.1 GP-12 78.4 0.1 12.4 1.1 0.0 0.0 0.5 3.1 3.7 0.0 1304 0.9 242.3 0.1 0.1 0.2 9.1 99.4 78.8 0.0 45.9 1.2 52.6 -9.1 56.5 GP-14 78.8 0.1 11.7 1.6 0.0 0.0 0.6 2.6 4.0 0.0 1311 1.1 229.9 0.3 0.3 0.2 10.7 82.3 84.3 0.0 41.9 1.6 54.5 -8.3 53.8 GP-15 77.8 0.1 12.1 1.5 0.0 0.0 0.6 2.1 4.9 0.1 1295 1.1 237.5 0.3 0.3 0.2 10.0 67.8 103.6 1.4 46.2 1.6 53.8 -9.2 55.4 GP-16 78.5 0.1 12.0 1.4 0.0 0.0 0.5 2.5 4.4 0.0 1307 1.1 234.8 0.1 0.1 0.2 8.6 81.6 92.8 0.0 43.3 1.5 53.2 -8.5 55.4 GP-17 78.5 0.1 12.1 0.9 0.0 0.0 0.4 2.0 5.1 0.0 1306 0.8 237.2 0.1 0.1 0.2 7.1 65.8 107.9 0.1 49.2 1.1 54.7 -9.8 55.1 GP-18 77.3 0.0 12.8 1.0 0.0 0.0 0.7 3.1 4.1 0.0 1287 0.4 251.3 0.4 0.4 0.2 12.1 101.3 86.4 0.1 39.3 1.0 48.1 -7.8 59.6 GP11-31 76.9 0.1 12.3 0.1 0.0 0.2 1.2 3.0 5.7 0.0 1280 0.9 240.5 0.1 0.1 4.0 20.5 96.2 120.0 0.1 -16.6 5.0 30.2 4.1 65.7 GP11-41 75.5 0.1 12.8 1.2 0.0 0.5 0.7 4.2 5.0 0.0 1256 0.9 250.3 0.3 0.3 11.7 11.6 133.9 107.0 0.0 -13.8 12.8 26.1 4.7 69.3 GP11-62 76.7 0.1 12.3 1.0 0.0 0.2 0.5 3.6 5.1 0.0 1276 0.9 241.3 0.3 0.3 4.5 8.2 116.2 107.2 0.1 1.5 5.6 33.9 0.6 65.5 GP11-68 75.6 0.1 12.5 0.9 0.0 0.2 0.5 2.8 6.4 0.0 1259 0.8 245.0 0.0 0.0 4.0 8.7 90.0 135.7 0.0 1.8 4.7 32.7 0.4 66.9 GP11-71 75.6 0.1 12.4 1.4 0.0 0.3 1.0 3.4 4.9 0.0 1258 1.1 243.8 0.4 0.4 7.7 16.9 108.4 104.0 0.3 -2.5 9.2 33.2 1.9 64.9 GP11-73 76.2 0.0 12.6 0.8 0.0 0.2 0.8 3.7 4.6 0.0 1268 0.5 247.9 0.4 0.4 6.0 13.7 118.1 98.3 0.3 4.1 6.8 34.5 0.2 65.2 GP11-74 75.2 0.1 12.9 1.0 0.0 0.2 0.7 3.3 5.4 0.0 1251 0.6 253.4 0.4 0.4 5.2 12.8 104.9 115.3 0.1 7.6 6.2 33.9 -0.6 66.7
Guposhan granite (Wang R.c et al., 2013 JAsESc 74 361-372)
Hn-Bt gr GP2-08 69.4 0.4 14.6 1.7 1.6 0.1 0.6 1.7 3.6 5.3 0.2 1155 5.3 286.8 23.8 0.8 15.4 31.0 115.8 113.2 2.5 -4.3 44.5 22.4 7.6 70.0 Bt-gr GP09 72.1 0.3 13.7 2.0 0.6 0.1 0.2 1.3 3.4 5.3 0.1 1199 3.4 268.1 28.3 0.8 5.2 22.3 110.7 112.5 1.0 0.4 36.9 27.8 5.5 66.7 f,g, Bt-gr GP2-05 74.2 0.3 12.2 1.9 0.7 0.1 0.5 1.5 2.5 4.8 0.1 1234 4.3 239.3 26.3 0.7 13.4 25.9 79.7 101.7 2.0 6.2 44.0 38.3 5.5 56.2
Jiufeng complex (Huang H et al., 2015 Chem Geol 401 43-58)
Muscovite granite XY7-1 76.0 0.0 13.7 0.3 0.1 0.1 0.3 4.0 4.3 0.0 1265 0.1 267.9 5.8 2.0 1.7 5.9 130.0 91.3 0.3 34.8 7.6 40.2 -5.7 65.5 XY7-2 76.2 0.0 14.0 0.3 0.1 0.1 0.3 3.8 4.2 0.0 1267 0.1 275.4 6.2 2.0 2.0 6.1 123.3 89.8 0.3 50.2 8.3 44.7 -8.7 64.0 XY7-3 76.3 0.0 13.4 0.3 0.1 0.1 0.4 4.3 3.9 0.0 1269 0.1 262.1 6.1 2.0 1.5 7.0 140.0 82.4 0.3 25.7 7.7 38.3 -3.9 65.6 XY7-4 75.8 0.0 13.8 0.3 0.1 0.1 0.5 4.1 4.3 0.0 1262 0.1 270.5 5.8 1.8 1.5 8.4 131.7 90.4 0.3 31.6 7.4 39.0 -5.1 66.2 Stage I 2m granite XY2-1 77.6 0.0 12.6 0.3 0.0 0.1 0.7 3.3 4.6 0.0 1291 0.3 247.4 4.5 0.4 2.0 11.9 106.8 98.5 0.1 18.1 6.8 40.6 -2.6 62.0 XY2-2 76.7 0.0 12.8 0.5 0.0 0.1 0.7 3.2 5.3 0.0 1277 0.5 251.7 7.2 0.6 2.2 12.3 102.6 112.3 0.1 12.1 9.9 36.8 -0.9 64.1 XY2-4 77.7 0.0 12.4 0.4 0.0 0.1 0.8 3.5 4.5 0.0 1294 0.4 243.2 6.2 0.6 2.0 13.4 114.2 94.7 0.1 7.6 8.6 37.7 -0.2 62.5
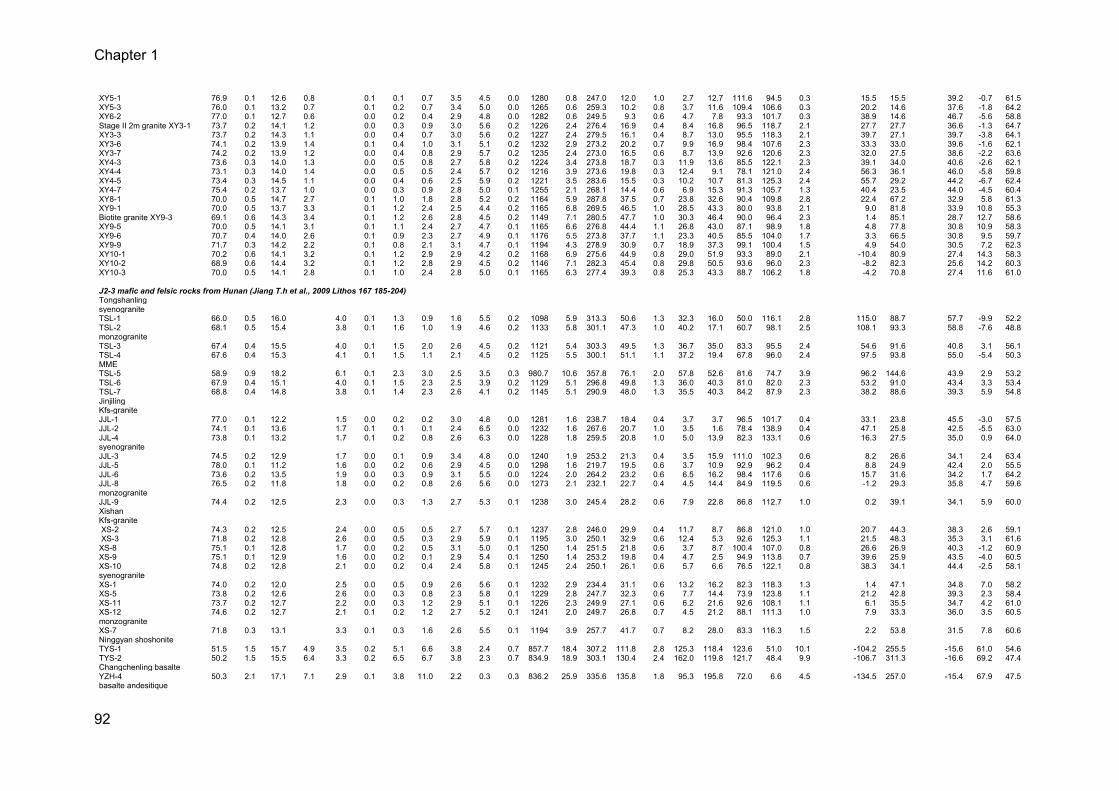
Chapter 1
92
XY5-1 76.9 0.1 12.6 0.8 0.1 0.1 0.7 3.5 4.5 0.0 1280 0.8 247.0 12.0 1.0 2.7 12.7 111.6 94.5 0.3 15.5 15.5 39.2 -0.7 61.5 XY5-3 76.0 0.1 13.2 0.7 0.1 0.2 0.7 3.4 5.0 0.0 1265 0.6 259.3 10.2 0.8 3.7 11.6 109.4 106.6 0.3 20.2 14.6 37.6 -1.8 64.2 XY6-2 77.0 0.1 12.7 0.6 0.0 0.2 0.4 2.9 4.8 0.0 1282 0.6 249.5 9.3 0.6 4.7 7.8 93.3 101.7 0.3 38.9 14.6 46.7 -5.6 58.8 Stage II 2m granite XY3-1 73.7 0.2 14.1 1.2 0.0 0.3 0.9 3.0 5.6 0.2 1226 2.4 276.4 16.9 0.4 8.4 16.8 96.5 118.7 2.1 27.7 27.7 36.6 -1.3 64.7 XY3-3 73.7 0.2 14.3 1.1 0.0 0.4 0.7 3.0 5.6 0.2 1227 2.4 279.5 16.1 0.4 8.7 13.0 95.5 118.3 2.1 39.7 27.1 39.7 -3.8 64.1 XY3-6 74.1 0.2 13.9 1.4 0.1 0.4 1.0 3.1 5.1 0.2 1232 2.9 273.2 20.2 0.7 9.9 16.9 98.4 107.6 2.3 33.3 33.0 39.6 -1.6 62.1 XY3-7 74.2 0.2 13.9 1.2 0.0 0.4 0.8 2.9 5.7 0.2 1235 2.4 273.0 16.5 0.6 8.7 13.9 92.6 120.6 2.3 32.0 27.5 38.6 -2.2 63.6 XY4-3 73.6 0.3 14.0 1.3 0.0 0.5 0.8 2.7 5.8 0.2 1224 3.4 273.8 18.7 0.3 11.9 13.6 85.5 122.1 2.3 39.1 34.0 40.6 -2.6 62.1 XY4-4 73.1 0.3 14.0 1.4 0.0 0.5 0.5 2.4 5.7 0.2 1216 3.9 273.6 19.8 0.3 12.4 9.1 78.1 121.0 2.4 56.3 36.1 46.0 -5.8 59.8 XY4-5 73.4 0.3 14.5 1.1 0.0 0.4 0.6 2.5 5.9 0.2 1221 3.5 283.6 15.5 0.3 10.2 10.7 81.3 125.3 2.4 55.7 29.2 44.2 -6.7 62.4 XY4-7 75.4 0.2 13.7 1.0 0.0 0.3 0.9 2.8 5.0 0.1 1255 2.1 268.1 14.4 0.6 6.9 15.3 91.3 105.7 1.3 40.4 23.5 44.0 -4.5 60.4 XY8-1 70.0 0.5 14.7 2.7 0.1 1.0 1.8 2.8 5.2 0.2 1164 5.9 287.8 37.5 0.7 23.8 32.6 90.4 109.8 2.8 22.4 67.2 32.9 5.8 61.3 XY9-1 70.0 0.5 13.7 3.3 0.1 1.2 2.4 2.5 4.4 0.2 1165 6.8 269.5 46.5 1.0 28.5 43.3 80.0 93.8 2.1 9.0 81.8 33.9 10.8 55.3 Biotite granite XY9-3 69.1 0.6 14.3 3.4 0.1 1.2 2.6 2.8 4.5 0.2 1149 7.1 280.5 47.7 1.0 30.3 46.4 90.0 96.4 2.3 1.4 85.1 28.7 12.7 58.6 XY9-5 70.0 0.5 14.1 3.1 0.1 1.1 2.4 2.7 4.7 0.1 1165 6.6 276.8 44.4 1.1 26.8 43.0 87.1 98.9 1.8 4.8 77.8 30.8 10.9 58.3 XY9-6 70.7 0.4 14.0 2.6 0.1 0.9 2.3 2.7 4.9 0.1 1176 5.5 273.8 37.7 1.1 23.3 40.5 85.5 104.0 1.7 3.3 66.5 30.8 9.5 59.7 XY9-9 71.7 0.3 14.2 2.2 0.1 0.8 2.1 3.1 4.7 0.1 1194 4.3 278.9 30.9 0.7 18.9 37.3 99.1 100.4 1.5 4.9 54.0 30.5 7.2 62.3 XY10-1 70.2 0.6 14.1 3.2 0.1 1.2 2.9 2.9 4.2 0.2 1168 6.9 275.6 44.9 0.8 29.0 51.9 93.3 89.0 2.1 -10.4 80.9 27.4 14.3 58.3 XY10-2 68.9 0.6 14.4 3.2 0.1 1.2 2.8 2.9 4.5 0.2 1146 7.1 282.3 45.4 0.8 29.8 50.5 93.6 96.0 2.3 -8.2 82.3 25.6 14.2 60.3 XY10-3 70.0 0.5 14.1 2.8 0.1 1.0 2.4 2.8 5.0 0.1 1165 6.3 277.4 39.3 0.8 25.3 43.3 88.7 106.2 1.8 -4.2 70.8 27.4 11.6 61.0
J2-3 mafic and felsic rocks from Hunan (Jiang T.h et al., 2009 Lithos 167 185-204)
Tongshanling
syenogranite
TSL-1 66.0 0.5 16.0 4.0 0.1 1.3 0.9 1.6 5.5 0.2 1098 5.9 313.3 50.6 1.3 32.3 16.0 50.0 116.1 2.8 115.0 88.7 57.7 -9.9 52.2 TSL-2 68.1 0.5 15.4 3.8 0.1 1.6 1.0 1.9 4.6 0.2 1133 5.8 301.1 47.3 1.0 40.2 17.1 60.7 98.1 2.5 108.1 93.3 58.8 -7.6 48.8 monzogranite
TSL-3 67.4 0.4 15.5 4.0 0.1 1.5 2.0 2.6 4.5 0.2 1121 5.4 303.3 49.5 1.3 36.7 35.0 83.3 95.5 2.4 54.6 91.6 40.8 3.1 56.1 TSL-4 67.6 0.4 15.3 4.1 0.1 1.5 1.1 2.1 4.5 0.2 1125 5.5 300.1 51.1 1.1 37.2 19.4 67.8 96.0 2.4 97.5 93.8 55.0 -5.4 50.3 MME
TSL-5 58.9 0.9 18.2 6.1 0.1 2.3 3.0 2.5 3.5 0.3 980.7 10.6 357.8 76.1 2.0 57.8 52.6 81.6 74.7 3.9 96.2 144.6 43.9 2.9 53.2 TSL-6 67.9 0.4 15.1 4.0 0.1 1.5 2.3 2.5 3.9 0.2 1129 5.1 296.8 49.8 1.3 36.0 40.3 81.0 82.0 2.3 53.2 91.0 43.4 3.3 53.4 TSL-7 68.8 0.4 14.8 3.8 0.1 1.4 2.3 2.6 4.1 0.2 1145 5.1 290.9 48.0 1.3 35.5 40.3 84.2 87.9 2.3 38.2 88.6 39.3 5.9 54.8 Jinjiling
Kfs-granite
JJL-1 77.0 0.1 12.2 1.5 0.0 0.2 0.2 3.0 4.8 0.0 1281 1.6 238.7 18.4 0.4 3.7 3.7 96.5 101.7 0.4 33.1 23.8 45.5 -3.0 57.5 JJL-2 74.1 0.1 13.6 1.7 0.1 0.1 0.1 2.4 6.5 0.0 1232 1.6 267.6 20.7 1.0 3.5 1.6 78.4 138.9 0.4 47.1 25.8 42.5 -5.5 63.0 JJL-4 73.8 0.1 13.2 1.7 0.1 0.2 0.8 2.6 6.3 0.0 1228 1.8 259.5 20.8 1.0 5.0 13.9 82.3 133.1 0.6 16.3 27.5 35.0 0.9 64.0 syenogranite
JJL-3 74.5 0.2 12.9 1.7 0.0 0.1 0.9 3.4 4.8 0.0 1240 1.9 253.2 21.3 0.4 3.5 15.9 111.0 102.3 0.6 8.2 26.6 34.1 2.4 63.4 JJL-5 78.0 0.1 11.2 1.6 0.0 0.2 0.6 2.9 4.5 0.0 1298 1.6 219.7 19.5 0.6 3.7 10.9 92.9 96.2 0.4 8.8 24.9 42.4 2.0 55.5 JJL-6 73.6 0.2 13.5 1.9 0.0 0.3 0.9 3.1 5.5 0.0 1224 2.0 264.2 23.2 0.6 6.5 16.2 98.4 117.6 0.6 15.7 31.6 34.2 1.7 64.2 JJL-8 76.5 0.2 11.8 1.8 0.0 0.2 0.8 2.6 5.6 0.0 1273 2.1 232.1 22.7 0.4 4.5 14.4 84.9 119.5 0.6 -1.2 29.3 35.8 4.7 59.6 monzogranite
JJL-9 74.4 0.2 12.5 2.3 0.0 0.3 1.3 2.7 5.3 0.1 1238 3.0 245.4 28.2 0.6 7.9 22.8 86.8 112.7 1.0 0.2 39.1 34.1 5.9 60.0 Xishan
Kfs-granite
XS-2 74.3 0.2 12.5 2.4 0.0 0.5 0.5 2.7 5.7 0.1 1237 2.8 246.0 29.9 0.4 11.7 8.7 86.8 121.0 1.0 20.7 44.3 38.3 2.6 59.1 XS-3 71.8 0.2 12.8 2.6 0.0 0.5 0.3 2.9 5.9 0.1 1195 3.0 250.1 32.9 0.6 12.4 5.3 92.6 125.3 1.1 21.5 48.3 35.3 3.1 61.6 XS-8 75.1 0.1 12.8 1.7 0.0 0.2 0.5 3.1 5.0 0.1 1250 1.4 251.5 21.8 0.6 3.7 8.7 100.4 107.0 0.8 26.6 26.9 40.3 -1.2 60.9 XS-9 75.1 0.1 12.9 1.6 0.0 0.2 0.1 2.9 5.4 0.1 1250 1.4 253.2 19.8 0.4 4.7 2.5 94.9 113.8 0.7 39.6 25.9 43.5 -4.0 60.5 XS-10 74.8 0.2 12.8 2.1 0.0 0.2 0.4 2.4 5.8 0.1 1245 2.4 250.1 26.1 0.6 5.7 6.6 76.5 122.1 0.8 38.3 34.1 44.4 -2.5 58.1 syenogranite
XS-1 74.0 0.2 12.0 2.5 0.0 0.5 0.9 2.6 5.6 0.1 1232 2.9 234.4 31.1 0.6 13.2 16.2 82.3 118.3 1.3 1.4 47.1 34.8 7.0 58.2 XS-5 73.8 0.2 12.6 2.6 0.0 0.3 0.8 2.3 5.8 0.1 1229 2.8 247.7 32.3 0.6 7.7 14.4 73.9 123.8 1.1 21.2 42.8 39.3 2.3 58.4 XS-11 73.7 0.2 12.7 2.2 0.0 0.3 1.2 2.9 5.1 0.1 1226 2.3 249.9 27.1 0.6 6.2 21.6 92.6 108.1 1.1 6.1 35.5 34.7 4.2 61.0 XS-12 74.6 0.2 12.7 2.1 0.1 0.2 1.2 2.7 5.2 0.1 1241 2.0 249.7 26.8 0.7 4.5 21.2 88.1 111.3 1.0 7.9 33.3 36.0 3.5 60.5 monzogranite
XS-7 71.8 0.3 13.1 3.3 0.1 0.3 1.6 2.6 5.5 0.1 1194 3.9 257.7 41.7 0.7 8.2 28.0 83.3 116.3 1.5 2.2 53.8 31.5 7.8 60.6 Ninggyan shoshonite
TYS-1 51.5 1.5 15.7 4.9 3.5 0.2 5.1 6.6 3.8 2.4 0.7 857.7 18.4 307.2 111.8 2.8 125.3 118.4 123.6 51.0 10.1 -104.2 255.5 -15.6 61.0 54.6 TYS-2 50.2 1.5 15.5 6.4 3.3 0.2 6.5 6.7 3.8 2.3 0.7 834.9 18.9 303.1 130.4 2.4 162.0 119.8 121.7 48.4 9.9 -106.7 311.3 -16.6 69.2 47.4 Changchenling basalte
YZH-4 50.3 2.1 17.1 7.1 2.9 0.1 3.8 11.0 2.2 0.3 0.3 836.2 25.9 335.6 135.8 1.8 95.3 195.8 72.0 6.6 4.5 -134.5 257.0 -15.4 67.9 47.5 basalte andesitique
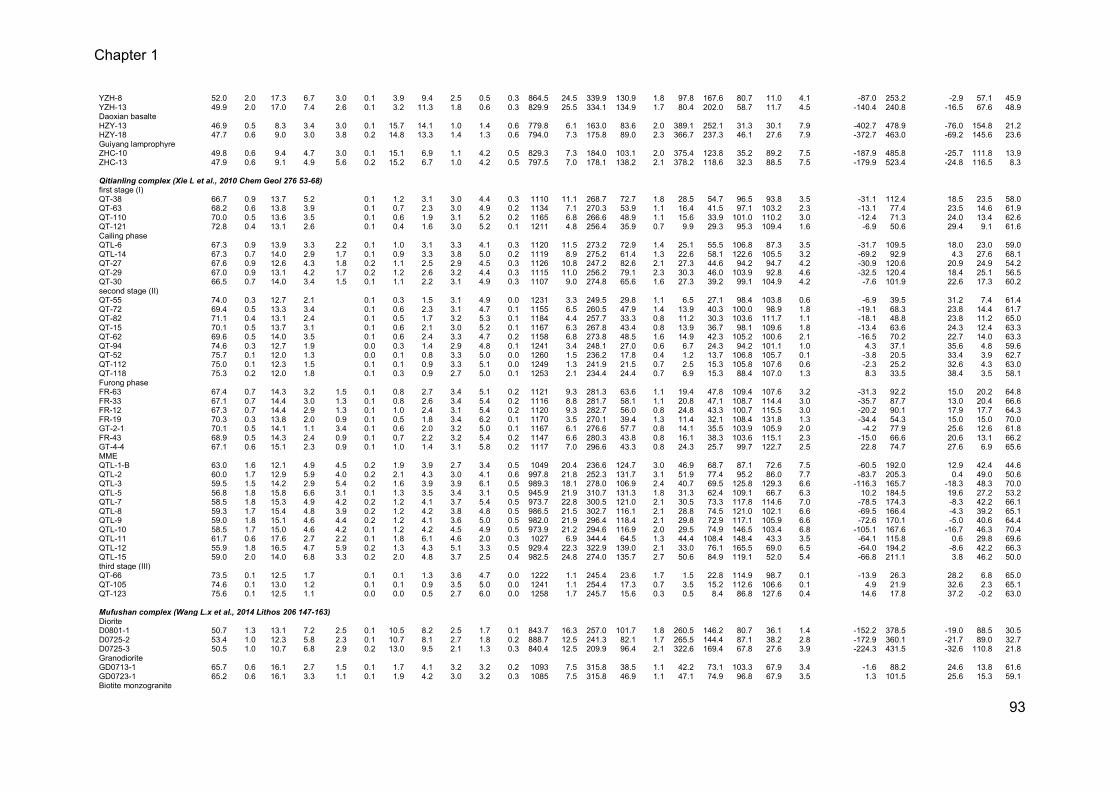
Chapter 1
93
YZH-8 52.0 2.0 17.3 6.7 3.0 0.1 3.9 9.4 2.5 0.5 0.3 864.5 24.5 339.9 130.9 1.8 97.8 167.6 80.7 11.0 4.1 -87.0 253.2 -2.9 57.1 45.9 YZH-13 49.9 2.0 17.0 7.4 2.6 0.1 3.2 11.3 1.8 0.6 0.3 829.9 25.5 334.1 134.9 1.7 80.4 202.0 58.7 11.7 4.5 -140.4 240.8 -16.5 67.6 48.9 Daoxian basalte
HZY-13 46.9 0.5 8.3 3.4 3.0 0.1 15.7 14.1 1.0 1.4 0.6 779.8 6.1 163.0 83.6 2.0 389.1 252.1 31.3 30.1 7.9 -402.7 478.9 -76.0 154.8 21.2 HZY-18 47.7 0.6 9.0 3.0 3.8 0.2 14.8 13.3 1.4 1.3 0.6 794.0 7.3 175.8 89.0 2.3 366.7 237.3 46.1 27.6 7.9 -372.7 463.0 -69.2 145.6 23.6 Guiyang lamprophyre
ZHC-10 49.8 0.6 9.4 4.7 3.0 0.1 15.1 6.9 1.1 4.2 0.5 829.3 7.3 184.0 103.1 2.0 375.4 123.8 35.2 89.2 7.5 -187.9 485.8 -25.7 111.8 13.9 ZHC-13 47.9 0.6 9.1 4.9 5.6 0.2 15.2 6.7 1.0 4.2 0.5 797.5 7.0 178.1 138.2 2.1 378.2 118.6 32.3 88.5 7.5 -179.9 523.4 -24.8 116.5 8.3
Qitianling complex (Xie L et al., 2010 Chem Geol 276 53-68)
first stage (I)
QT-38 66.7 0.9 13.7 5.2 0.1 1.2 3.1 3.0 4.4 0.3 1110 11.1 268.7 72.7 1.8 28.5 54.7 96.5 93.8 3.5 -31.1 112.4 18.5 23.5 58.0 QT-63 68.2 0.6 13.8 3.9 0.1 0.7 2.3 3.0 4.9 0.2 1134 7.1 270.3 53.9 1.1 16.4 41.5 97.1 103.2 2.3 -13.1 77.4 23.5 14.6 61.9 QT-110 70.0 0.5 13.6 3.5 0.1 0.6 1.9 3.1 5.2 0.2 1165 6.8 266.6 48.9 1.1 15.6 33.9 101.0 110.2 3.0 -12.4 71.3 24.0 13.4 62.6 QT-121 72.8 0.4 13.1 2.6 0.1 0.4 1.6 3.0 5.2 0.1 1211 4.8 256.4 35.9 0.7 9.9 29.3 95.3 109.4 1.6 -6.9 50.6 29.4 9.1 61.6 Cailing phase
QTL-6 67.3 0.9 13.9 3.3 2.2 0.1 1.0 3.1 3.3 4.1 0.3 1120 11.5 273.2 72.9 1.4 25.1 55.5 106.8 87.3 3.5 -31.7 109.5 18.0 23.0 59.0 QTL-14 67.3 0.7 14.0 2.9 1.7 0.1 0.9 3.3 3.8 5.0 0.2 1119 8.9 275.2 61.4 1.3 22.6 58.1 122.6 105.5 3.2 -69.2 92.9 4.3 27.6 68.1 QT-27 67.6 0.9 12.6 4.3 1.8 0.2 1.1 2.5 2.9 4.5 0.3 1126 10.8 247.2 82.6 2.1 27.3 44.6 94.2 94.7 4.2 -30.9 120.6 20.9 24.9 54.2 QT-29 67.0 0.9 13.1 4.2 1.7 0.2 1.2 2.6 3.2 4.4 0.3 1115 11.0 256.2 79.1 2.3 30.3 46.0 103.9 92.8 4.6 -32.5 120.4 18.4 25.1 56.5 QT-30 66.5 0.7 14.0 3.4 1.5 0.1 1.1 2.2 3.1 4.9 0.3 1107 9.0 274.8 65.6 1.6 27.3 39.2 99.1 104.9 4.2 -7.6 101.9 22.6 17.3 60.2 second stage (II)
QT-55 74.0 0.3 12.7 2.1 0.1 0.3 1.5 3.1 4.9 0.0 1231 3.3 249.5 29.8 1.1 6.5 27.1 98.4 103.8 0.6 -6.9 39.5 31.2 7.4 61.4 QT-72 69.4 0.5 13.3 3.4 0.1 0.6 2.3 3.1 4.7 0.1 1155 6.5 260.5 47.9 1.4 13.9 40.3 100.0 98.9 1.8 -19.1 68.3 23.8 14.4 61.7 QT-82 71.1 0.4 13.1 2.4 0.1 0.5 1.7 3.2 5.3 0.1 1184 4.4 257.7 33.3 0.8 11.2 30.3 103.6 111.7 1.1 -18.1 48.8 23.8 11.2 65.0 QT-15 70.1 0.5 13.7 3.1 0.1 0.6 2.1 3.0 5.2 0.1 1167 6.3 267.8 43.4 0.8 13.9 36.7 98.1 109.6 1.8 -13.4 63.6 24.3 12.4 63.3 QT-62 69.6 0.5 14.0 3.5 0.1 0.6 2.4 3.3 4.7 0.2 1158 6.8 273.8 48.5 1.6 14.9 42.3 105.2 100.6 2.1 -16.5 70.2 22.7 14.0 63.3 QT-94 74.6 0.3 12.7 1.9 0.0 0.3 1.4 2.9 4.8 0.1 1241 3.4 248.1 27.0 0.6 6.7 24.3 94.2 101.1 1.0 4.3 37.1 35.6 4.8 59.6 QT-52 75.7 0.1 12.0 1.3 0.0 0.1 0.8 3.3 5.0 0.0 1260 1.5 236.2 17.8 0.4 1.2 13.7 106.8 105.7 0.1 -3.8 20.5 33.4 3.9 62.7 QT-112 75.0 0.1 12.3 1.5 0.1 0.1 0.9 3.3 5.1 0.0 1249 1.3 241.9 21.5 0.7 2.5 15.3 105.8 107.6 0.6 -2.3 25.2 32.6 4.3 63.0 QT-118 75.3 0.2 12.0 1.8 0.1 0.3 0.9 2.7 5.0 0.1 1253 2.1 234.4 24.4 0.7 6.9 15.3 88.4 107.0 1.3 8.3 33.5 38.4 3.5 58.1 Furong phase
FR-63 67.4 0.7 14.3 3.2 1.5 0.1 0.8 2.7 3.4 5.1 0.2 1121 9.3 281.3 63.6 1.1 19.4 47.8 109.4 107.6 3.2 -31.3 92.2 15.0 20.2 64.8 FR-33 67.1 0.7 14.4 3.0 1.3 0.1 0.8 2.6 3.4 5.4 0.2 1116 8.8 281.7 58.1 1.1 20.8 47.1 108.7 114.4 3.0 -35.7 87.7 13.0 20.4 66.6 FR-12 67.3 0.7 14.4 2.9 1.3 0.1 1.0 2.4 3.1 5.4 0.2 1120 9.3 282.7 56.0 0.8 24.8 43.3 100.7 115.5 3.0 -20.2 90.1 17.9 17.7 64.3 FR-19 70.3 0.3 13.8 2.0 0.9 0.1 0.5 1.8 3.4 6.2 0.1 1170 3.5 270.1 39.4 1.3 11.4 32.1 108.4 131.8 1.3 -34.4 54.3 15.0 15.0 70.0 GT-2-1 70.1 0.5 14.1 1.1 3.4 0.1 0.6 2.0 3.2 5.0 0.1 1167 6.1 276.6 57.7 0.8 14.1 35.5 103.9 105.9 2.0 -4.2 77.9 25.6 12.6 61.8 FR-43 68.9 0.5 14.3 2.4 0.9 0.1 0.7 2.2 3.2 5.4 0.2 1147 6.6 280.3 43.8 0.8 16.1 38.3 103.6 115.1 2.3 -15.0 66.6 20.6 13.1 66.2 GT-4-4 67.1 0.6 15.1 2.3 0.9 0.1 1.0 1.4 3.1 5.8 0.2 1117 7.0 296.6 43.3 0.8 24.3 25.7 99.7 122.7 2.5 22.8 74.7 27.6 6.9 65.6 MME
QTL-1-B 63.0 1.6 12.1 4.9 4.5 0.2 1.9 3.9 2.7 3.4 0.5 1049 20.4 236.6 124.7 3.0 46.9 68.7 87.1 72.6 7.5 -60.5 192.0 12.9 42.4 44.6 QTL-2 60.0 1.7 12.9 5.9 4.0 0.2 2.1 4.3 3.0 4.1 0.6 997.8 21.8 252.3 131.7 3.1 51.9 77.4 95.2 86.0 7.7 -83.7 205.3 0.4 49.0 50.6 QTL-3 59.5 1.5 14.2 2.9 5.4 0.2 1.6 3.9 3.9 6.1 0.5 989.3 18.1 278.0 106.9 2.4 40.7 69.5 125.8 129.3 6.6 -116.3 165.7 -18.3 48.3 70.0 QTL-5 56.8 1.8 15.8 6.6 3.1 0.1 1.3 3.5 3.4 3.1 0.5 945.9 21.9 310.7 131.3 1.8 31.3 62.4 109.1 66.7 6.3 10.2 184.5 19.6 27.2 53.2 QTL-7 58.5 1.8 15.3 4.9 4.2 0.2 1.2 4.1 3.7 5.4 0.5 973.7 22.8 300.5 121.0 2.1 30.5 73.3 117.8 114.6 7.0 -78.5 174.3 -8.3 42.2 66.1 QTL-8 59.3 1.7 15.4 4.8 3.9 0.2 1.2 4.2 3.8 4.8 0.5 986.5 21.5 302.7 116.1 2.1 28.8 74.5 121.0 102.1 6.6 -69.5 166.4 -4.3 39.2 65.1 QTL-9 59.0 1.8 15.1 4.6 4.4 0.2 1.2 4.1 3.6 5.0 0.5 982.0 21.9 296.4 118.4 2.1 29.8 72.9 117.1 105.9 6.6 -72.6 170.1 -5.0 40.6 64.4 QTL-10 58.5 1.7 15.0 4.6 4.2 0.1 1.2 4.2 4.5 4.9 0.5 973.9 21.2 294.6 116.9 2.0 29.5 74.9 146.5 103.4 6.8 -105.1 167.6 -16.7 46.3 70.4 QTL-11 61.7 0.6 17.6 2.7 2.2 0.1 1.8 6.1 4.6 2.0 0.3 1027 6.9 344.4 64.5 1.3 44.4 108.4 148.4 43.3 3.5 -64.1 115.8 0.6 29.8 69.6 QTL-12 55.9 1.8 16.5 4.7 5.9 0.2 1.3 4.3 5.1 3.3 0.5 929.4 22.3 322.9 139.0 2.1 33.0 76.1 165.5 69.0 6.5 -64.0 194.2 -8.6 42.2 66.3 QTL-15 59.0 2.0 14.0 6.8 3.3 0.2 2.0 4.8 3.7 2.5 0.4 982.5 24.8 274.0 135.7 2.7 50.6 84.9 119.1 52.0 5.4 -66.8 211.1 3.8 46.2 50.0 third stage (III)
QT-66 73.5 0.1 12.5 1.7 0.1 0.1 1.3 3.6 4.7 0.0 1222 1.1 245.4 23.6 1.7 1.5 22.8 114.9 98.7 0.1 -13.9 26.3 28.2 6.8 65.0 QT-105 74.6 0.1 13.0 1.2 0.1 0.1 0.9 3.5 5.0 0.0 1241 1.1 254.4 17.3 0.7 3.5 15.2 112.6 106.6 0.1 4.9 21.9 32.6 2.3 65.1 QT-123 75.6 0.1 12.5 1.1 0.0 0.0 0.5 2.7 6.0 0.0 1258 1.7 245.7 15.6 0.3 0.5 8.4 86.8 127.6 0.4 14.6 17.8 37.2 -0.2 63.0
Mufushan complex (Wang L.x et al., 2014 Lithos 206 147-163)
Diorite
D0801-1 50.7 1.3 13.1 7.2 2.5 0.1 10.5 8.2 2.5 1.7 0.1 843.7 16.3 257.0 101.7 1.8 260.5 146.2 80.7 36.1 1.4 -152.2 378.5 -19.0 88.5 30.5 D0725-2 53.4 1.0 12.3 5.8 2.3 0.1 10.7 8.1 2.7 1.8 0.2 888.7 12.5 241.3 82.1 1.7 265.5 144.4 87.1 38.2 2.8 -172.9 360.1 -21.7 89.0 32.7 D0725-3 50.5 1.0 10.7 6.8 2.9 0.2 13.0 9.5 2.1 1.3 0.3 840.4 12.5 209.9 96.4 2.1 322.6 169.4 67.8 27.6 3.9 -224.3 431.5 -32.6 110.8 21.8 Granodiorite
GD0713-1 65.7 0.6 16.1 2.7 1.5 0.1 1.7 4.1 3.2 3.2 0.2 1093 7.5 315.8 38.5 1.1 42.2 73.1 103.3 67.9 3.4 -1.6 88.2 24.6 13.8 61.6 GD0723-1 65.2 0.6 16.1 3.3 1.1 0.1 1.9 4.2 3.0 3.2 0.3 1085 7.5 315.8 46.9 1.1 47.1 74.9 96.8 67.9 3.5 1.3 101.5 25.6 15.3 59.1 Biotite monzogranite
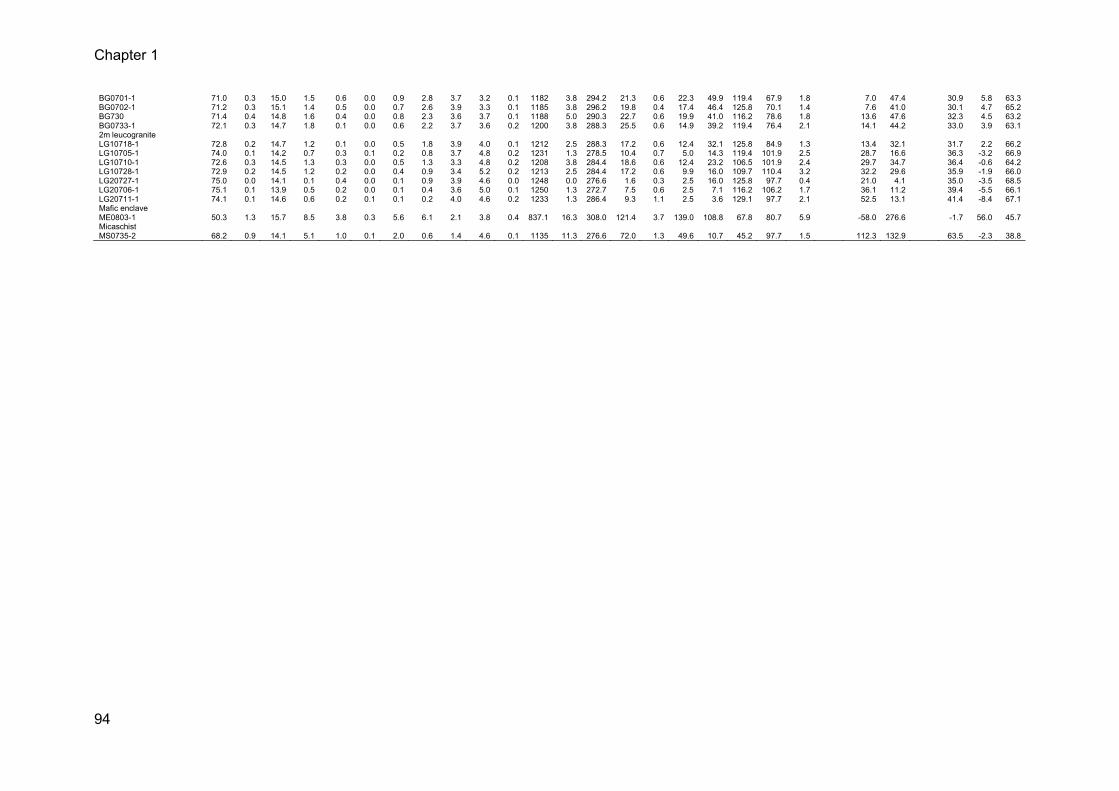
Chapter 1
94
BG0701-1 71.0 0.3 15.0 1.5 0.6 0.0 0.9 2.8 3.7 3.2 0.1 1182 3.8 294.2 21.3 0.6 22.3 49.9 119.4 67.9 1.8 7.0 47.4 30.9 5.8 63.3 BG0702-1 71.2 0.3 15.1 1.4 0.5 0.0 0.7 2.6 3.9 3.3 0.1 1185 3.8 296.2 19.8 0.4 17.4 46.4 125.8 70.1 1.4 7.6 41.0 30.1 4.7 65.2 BG730 71.4 0.4 14.8 1.6 0.4 0.0 0.8 2.3 3.6 3.7 0.1 1188 5.0 290.3 22.7 0.6 19.9 41.0 116.2 78.6 1.8 13.6 47.6 32.3 4.5 63.2 BG0733-1 72.1 0.3 14.7 1.8 0.1 0.0 0.6 2.2 3.7 3.6 0.2 1200 3.8 288.3 25.5 0.6 14.9 39.2 119.4 76.4 2.1 14.1 44.2 33.0 3.9 63.1 2m leucogranite
LG10718-1 72.8 0.2 14.7 1.2 0.1 0.0 0.5 1.8 3.9 4.0 0.1 1212 2.5 288.3 17.2 0.6 12.4 32.1 125.8 84.9 1.3 13.4 32.1 31.7 2.2 66.2 LG10705-1 74.0 0.1 14.2 0.7 0.3 0.1 0.2 0.8 3.7 4.8 0.2 1231 1.3 278.5 10.4 0.7 5.0 14.3 119.4 101.9 2.5 28.7 16.6 36.3 -3.2 66.9 LG10710-1 72.6 0.3 14.5 1.3 0.3 0.0 0.5 1.3 3.3 4.8 0.2 1208 3.8 284.4 18.6 0.6 12.4 23.2 106.5 101.9 2.4 29.7 34.7 36.4 -0.6 64.2 LG10728-1 72.9 0.2 14.5 1.2 0.2 0.0 0.4 0.9 3.4 5.2 0.2 1213 2.5 284.4 17.2 0.6 9.9 16.0 109.7 110.4 3.2 32.2 29.6 35.9 -1.9 66.0 LG20727-1 75.0 0.0 14.1 0.1 0.4 0.0 0.1 0.9 3.9 4.6 0.0 1248 0.0 276.6 1.6 0.3 2.5 16.0 125.8 97.7 0.4 21.0 4.1 35.0 -3.5 68.5 LG20706-1 75.1 0.1 13.9 0.5 0.2 0.0 0.1 0.4 3.6 5.0 0.1 1250 1.3 272.7 7.5 0.6 2.5 7.1 116.2 106.2 1.7 36.1 11.2 39.4 -5.5 66.1 LG20711-1 74.1 0.1 14.6 0.6 0.2 0.1 0.1 0.2 4.0 4.6 0.2 1233 1.3 286.4 9.3 1.1 2.5 3.6 129.1 97.7 2.1 52.5 13.1 41.4 -8.4 67.1 Mafic enclave
ME0803-1 50.3 1.3 15.7 8.5 3.8 0.3 5.6 6.1 2.1 3.8 0.4 837.1 16.3 308.0 121.4 3.7 139.0 108.8 67.8 80.7 5.9 -58.0 276.6 -1.7 56.0 45.7 Micaschist
MS0735-2 68.2 0.9 14.1 5.1 1.0 0.1 2.0 0.6 1.4 4.6 0.1 1135 11.3 276.6 72.0 1.3 49.6 10.7 45.2 97.7 1.5 112.3 132.9 63.5 -2.3 38.8
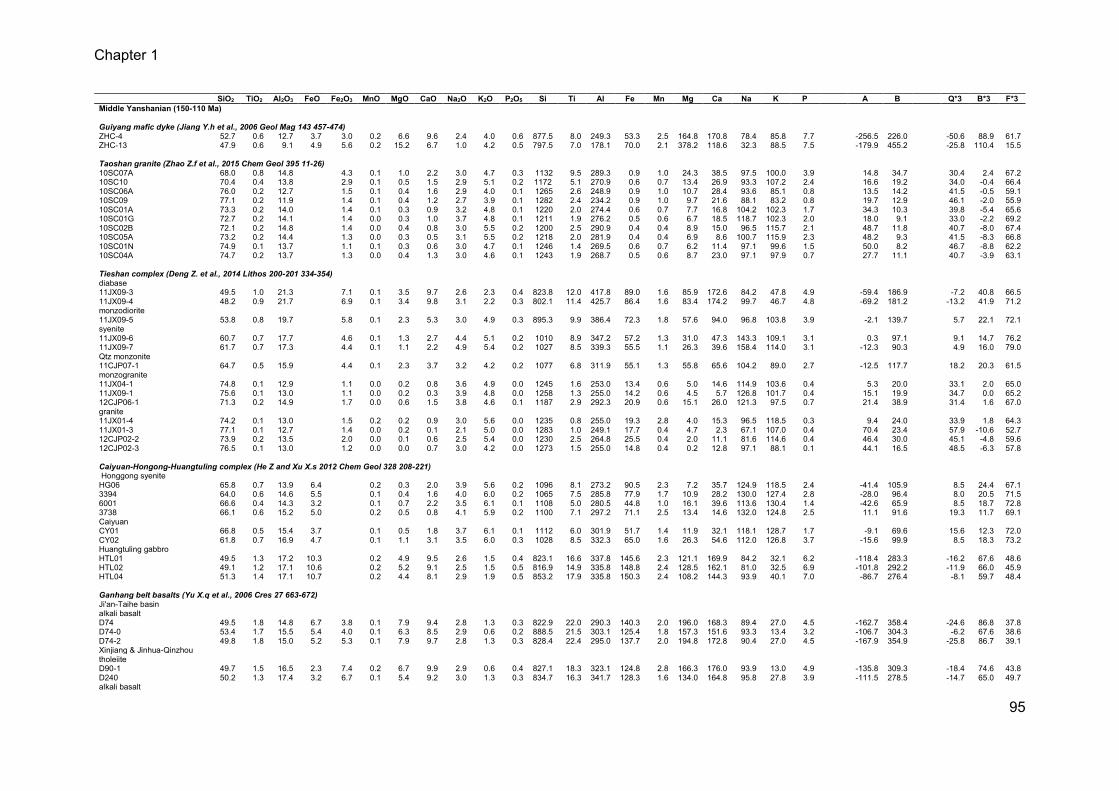
Chapter 1
95
SiO2 TiO2 Al2O3 FeO Fe2O3 MnO MgO CaO Na2O K2O P2O5 Si Ti Al Fe Mn Mg Ca Na K P A B Q*3 B*3 F*3 Middle Yanshanian (150-110 Ma)
Guiyang mafic dyke (Jiang Y.h et al., 2006 Geol Mag 143 457-474)
ZHC-4 52.7 0.6 12.7 3.7 3.0 0.2 6.6 9.6 2.4 4.0 0.6 877.5 8.0 249.3 53.3 2.5 164.8 170.8 78.4 85.8 7.7 -256.5 226.0 -50.6 88.9 61.7 ZHC-13 47.9 0.6 9.1 4.9 5.6 0.2 15.2 6.7 1.0 4.2 0.5 797.5 7.0 178.1 70.0 2.1 378.2 118.6 32.3 88.5 7.5 -179.9 455.2 -25.8 110.4 15.5
Taoshan granite (Zhao Z.f et al., 2015 Chem Geol 395 11-26)
10SC07A 68.0 0.8 14.8 4.3 0.1 1.0 2.2 3.0 4.7 0.3 1132 9.5 289.3 0.9 1.0 24.3 38.5 97.5 100.0 3.9 14.8 34.7 30.4 2.4 67.2 10SC10 70.4 0.4 13.8 2.9 0.1 0.5 1.5 2.9 5.1 0.2 1172 5.1 270.9 0.6 0.7 13.4 26.9 93.3 107.2 2.4 16.6 19.2 34.0 -0.4 66.4 10SC06A 76.0 0.2 12.7 1.5 0.1 0.4 1.6 2.9 4.0 0.1 1265 2.6 248.9 0.9 1.0 10.7 28.4 93.6 85.1 0.8 13.5 14.2 41.5 -0.5 59.1 10SC09 77.1 0.2 11.9 1.4 0.1 0.4 1.2 2.7 3.9 0.1 1282 2.4 234.2 0.9 1.0 9.7 21.6 88.1 83.2 0.8 19.7 12.9 46.1 -2.0 55.9 10SC01A 73.3 0.2 14.0 1.4 0.1 0.3 0.9 3.2 4.8 0.1 1220 2.0 274.4 0.6 0.7 7.7 16.8 104.2 102.3 1.7 34.3 10.3 39.8 -5.4 65.6 10SC01G 72.7 0.2 14.1 1.4 0.0 0.3 1.0 3.7 4.8 0.1 1211 1.9 276.2 0.5 0.6 6.7 18.5 118.7 102.3 2.0 18.0 9.1 33.0 -2.2 69.2 10SC02B 72.1 0.2 14.8 1.4 0.0 0.4 0.8 3.0 5.5 0.2 1200 2.5 290.9 0.4 0.4 8.9 15.0 96.5 115.7 2.1 48.7 11.8 40.7 -8.0 67.4 10SC05A 73.2 0.2 14.4 1.3 0.0 0.3 0.5 3.1 5.5 0.2 1218 2.0 281.9 0.4 0.4 6.9 8.6 100.7 115.9 2.3 48.2 9.3 41.5 -8.3 66.8 10SC01N 74.9 0.1 13.7 1.1 0.1 0.3 0.6 3.0 4.7 0.1 1246 1.4 269.5 0.6 0.7 6.2 11.4 97.1 99.6 1.5 50.0 8.2 46.7 -8.8 62.2 10SC04A 74.7 0.2 13.7 1.3 0.0 0.4 1.3 3.0 4.6 0.1 1243 1.9 268.7 0.5 0.6 8.7 23.0 97.1 97.9 0.7 27.7 11.1 40.7 -3.9 63.1
Tieshan complex (Deng Z. et al., 2014 Lithos 200-201 334-354)
diabase
11JX09-3 49.5 1.0 21.3 7.1 0.1 3.5 9.7 2.6 2.3 0.4 823.8 12.0 417.8 89.0 1.6 85.9 172.6 84.2 47.8 4.9 -59.4 186.9 -7.2 40.8 66.5 11JX09-4 48.2 0.9 21.7 6.9 0.1 3.4 9.8 3.1 2.2 0.3 802.1 11.4 425.7 86.4 1.6 83.4 174.2 99.7 46.7 4.8 -69.2 181.2 -13.2 41.9 71.2 monzodiorite
11JX09-5 53.8 0.8 19.7 5.8 0.1 2.3 5.3 3.0 4.9 0.3 895.3 9.9 386.4 72.3 1.8 57.6 94.0 96.8 103.8 3.9 -2.1 139.7 5.7 22.1 72.1 syenite
11JX09-6 60.7 0.7 17.7 4.6 0.1 1.3 2.7 4.4 5.1 0.2 1010 8.9 347.2 57.2 1.3 31.0 47.3 143.3 109.1 3.1 0.3 97.1 9.1 14.7 76.2 11JX09-7 61.7 0.7 17.3 4.4 0.1 1.1 2.2 4.9 5.4 0.2 1027 8.5 339.3 55.5 1.1 26.3 39.6 158.4 114.0 3.1 -12.3 90.3 4.9 16.0 79.0 Qtz monzonite
11CJP07-1 64.7 0.5 15.9 4.4 0.1 2.3 3.7 3.2 4.2 0.2 1077 6.8 311.9 55.1 1.3 55.8 65.6 104.2 89.0 2.7 -12.5 117.7 18.2 20.3 61.5 monzogranite
11JX04-1 74.8 0.1 12.9 1.1 0.0 0.2 0.8 3.6 4.9 0.0 1245 1.6 253.0 13.4 0.6 5.0 14.6 114.9 103.6 0.4 5.3 20.0 33.1 2.0 65.0 11JX09-1 75.6 0.1 13.0 1.1 0.0 0.2 0.3 3.9 4.8 0.0 1258 1.3 255.0 14.2 0.6 4.5 5.7 126.8 101.7 0.4 15.1 19.9 34.7 0.0 65.2 12CJP06-1 71.3 0.2 14.9 1.7 0.0 0.6 1.5 3.8 4.6 0.1 1187 2.9 292.3 20.9 0.6 15.1 26.0 121.3 97.5 0.7 21.4 38.9 31.4 1.6 67.0 granite
11JX01-4 74.2 0.1 13.0 1.5 0.2 0.2 0.9 3.0 5.6 0.0 1235 0.8 255.0 19.3 2.8 4.0 15.3 96.5 118.5 0.3 9.4 24.0 33.9 1.8 64.3 11JX01-3 77.1 0.1 12.7 1.4 0.0 0.2 0.1 2.1 5.0 0.0 1283 1.0 249.1 17.7 0.4 4.7 2.3 67.1 107.0 0.4 70.4 23.4 57.9 -10.6 52.7 12CJP02-2 73.9 0.2 13.5 2.0 0.0 0.1 0.6 2.5 5.4 0.0 1230 2.5 264.8 25.5 0.4 2.0 11.1 81.6 114.6 0.4 46.4 30.0 45.1 -4.8 59.6 12CJP02-3 76.5 0.1 13.0 1.2 0.0 0.0 0.7 3.0 4.2 0.0 1273 1.5 255.0 14.8 0.4 0.2 12.8 97.1 88.1 0.1 44.1 16.5 48.5 -6.3 57.8
Caiyuan-Hongong-Huangtuling complex (He Z and Xu X.s 2012 Chem Geol 328 208-221)
Honggong syenite
HG06 65.8 0.7 13.9 6.4 0.2 0.3 2.0 3.9 5.6 0.2 1096 8.1 273.2 90.5 2.3 7.2 35.7 124.9 118.5 2.4 -41.4 105.9 8.5 24.4 67.1 3394 64.0 0.6 14.6 5.5 0.1 0.4 1.6 4.0 6.0 0.2 1065 7.5 285.8 77.9 1.7 10.9 28.2 130.0 127.4 2.8 -28.0 96.4 8.0 20.5 71.5 6001 66.6 0.4 14.3 3.2 0.1 0.7 2.2 3.5 6.1 0.1 1108 5.0 280.5 44.8 1.0 16.1 39.6 113.6 130.4 1.4 -42.6 65.9 8.5 18.7 72.8 3738 66.1 0.6 15.2 5.0 0.2 0.5 0.8 4.1 5.9 0.2 1100 7.1 297.2 71.1 2.5 13.4 14.6 132.0 124.8 2.5 11.1 91.6 19.3 11.7 69.1 Caiyuan
CY01 66.8 0.5 15.4 3.7 0.1 0.5 1.8 3.7 6.1 0.1 1112 6.0 301.9 51.7 1.4 11.9 32.1 118.1 128.7 1.7 -9.1 69.6 15.6 12.3 72.0 CY02 61.8 0.7 16.9 4.7 0.1 1.1 3.1 3.5 6.0 0.3 1028 8.5 332.3 65.0 1.6 26.3 54.6 112.0 126.8 3.7 -15.6 99.9 8.5 18.3 73.2 Huangtuling gabbro
HTL01 49.5 1.3 17.2 10.3 0.2 4.9 9.5 2.6 1.5 0.4 823.1 16.6 337.8 145.6 2.3 121.1 169.9 84.2 32.1 6.2 -118.4 283.3 -16.2 67.6 48.6 HTL02 49.1 1.2 17.1 10.6 0.2 5.2 9.1 2.5 1.5 0.5 816.9 14.9 335.8 148.8 2.4 128.5 162.1 81.0 32.5 6.9 -101.8 292.2 -11.9 66.0 45.9 HTL04 51.3 1.4 17.1 10.7 0.2 4.4 8.1 2.9 1.9 0.5 853.2 17.9 335.8 150.3 2.4 108.2 144.3 93.9 40.1 7.0 -86.7 276.4 -8.1 59.7 48.4
Ganhang belt basalts (Yu X.q et al., 2006 Cres 27 663-672)
Ji'an-Taihe basin
alkali basalt
D74 49.5 1.8 14.8 6.7 3.8 0.1 7.9 9.4 2.8 1.3 0.3 822.9 22.0 290.3 140.3 2.0 196.0 168.3 89.4 27.0 4.5 -162.7 358.4 -24.6 86.8 37.8 D74-0 53.4 1.7 15.5 5.4 4.0 0.1 6.3 8.5 2.9 0.6 0.2 888.5 21.5 303.1 125.4 1.8 157.3 151.6 93.3 13.4 3.2 -106.7 304.3 -6.2 67.6 38.6 D74-2 49.8 1.8 15.0 5.2 5.3 0.1 7.9 9.7 2.8 1.3 0.3 828.4 22.4 295.0 137.7 2.0 194.8 172.8 90.4 27.0 4.5 -167.9 354.9 -25.8 86.7 39.1 Xinjiang & Jinhua-Qinzhou
tholeiite
D90-1 49.7 1.5 16.5 2.3 7.4 0.2 6.7 9.9 2.9 0.6 0.4 827.1 18.3 323.1 124.8 2.8 166.3 176.0 93.9 13.0 4.9 -135.8 309.3 -18.4 74.6 43.8 D240 50.2 1.3 17.4 3.2 6.7 0.1 5.4 9.2 3.0 1.3 0.3 834.7 16.3 341.7 128.3 1.6 134.0 164.8 95.8 27.8 3.9 -111.5 278.5 -14.7 65.0 49.7 alkali basalt
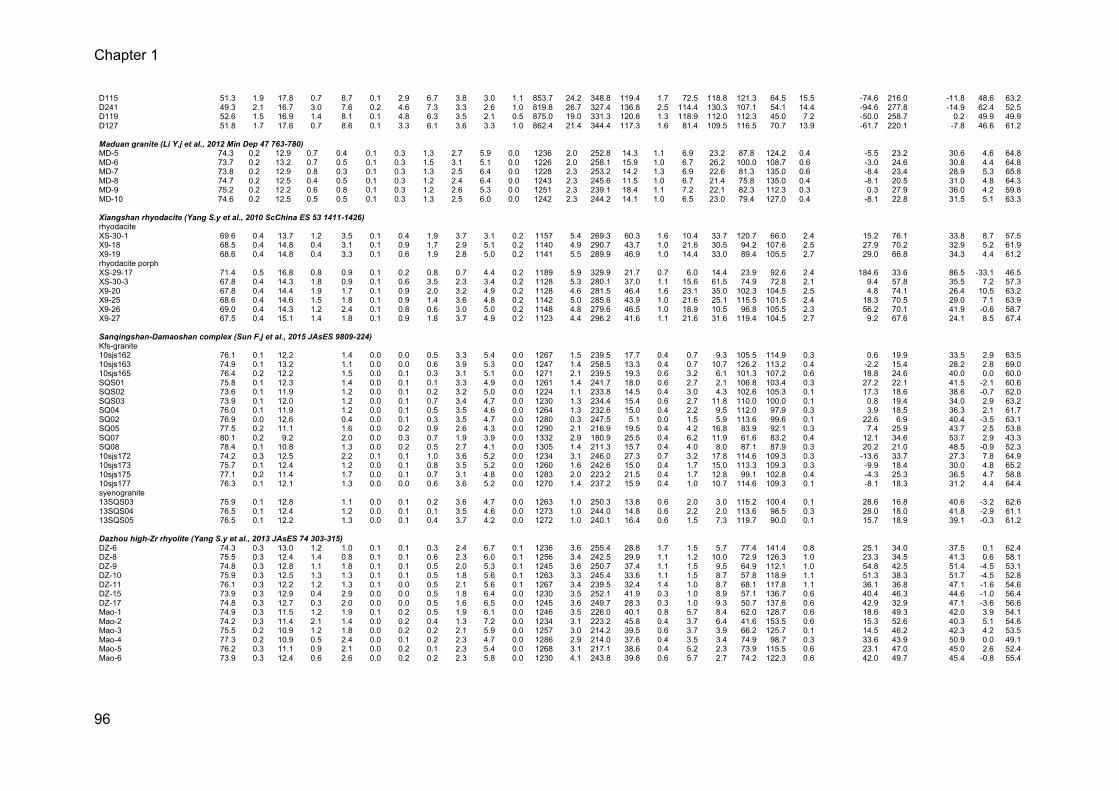
Chapter 1
96
D115 51.3 1.9 17.8 0.7 8.7 0.1 2.9 6.7 3.8 3.0 1.1 853.7 24.2 348.8 119.4 1.7 72.5 118.8 121.3 64.5 15.5 -74.6 216.0 -11.8 48.6 63.2 D241 49.3 2.1 16.7 3.0 7.6 0.2 4.6 7.3 3.3 2.6 1.0 819.8 26.7 327.4 136.8 2.5 114.4 130.3 107.1 54.1 14.4 -94.6 277.8 -14.9 62.4 52.5 D119 52.6 1.5 16.9 1.4 8.1 0.1 4.8 6.3 3.5 2.1 0.5 875.0 19.0 331.3 120.8 1.3 118.9 112.0 112.3 45.0 7.2 -50.0 258.7 0.2 49.9 49.9 D127 51.8 1.7 17.6 0.7 8.6 0.1 3.3 6.1 3.6 3.3 1.0 862.4 21.4 344.4 117.3 1.6 81.4 109.5 116.5 70.7 13.9 -61.7 220.1 -7.8 46.6 61.2
Maduan granite (Li Y.j et al., 2012 Min Dep 47 763-780)
MD-5 74.3 0.2 12.9 0.7 0.4 0.1 0.3 1.3 2.7 5.9 0.0 1236 2.0 252.8 14.3 1.1 6.9 23.2 87.8 124.2 0.4 -5.5 23.2 30.6 4.6 64.8 MD-6 73.7 0.2 13.2 0.7 0.5 0.1 0.3 1.5 3.1 5.1 0.0 1226 2.0 258.1 15.9 1.0 6.7 26.2 100.0 108.7 0.6 -3.0 24.6 30.8 4.4 64.8 MD-7 73.8 0.2 12.9 0.8 0.3 0.1 0.3 1.3 2.5 6.4 0.0 1228 2.3 253.2 14.2 1.3 6.9 22.6 81.3 135.0 0.6 -8.4 23.4 28.9 5.3 65.8 MD-8 74.7 0.2 12.5 0.4 0.5 0.1 0.3 1.2 2.4 6.4 0.0 1243 2.3 245.6 11.5 1.0 6.7 21.4 75.8 135.0 0.4 -8.1 20.5 31.0 4.8 64.3 MD-9 75.2 0.2 12.2 0.6 0.8 0.1 0.3 1.2 2.6 5.3 0.0 1251 2.3 239.1 18.4 1.1 7.2 22.1 82.3 112.3 0.3 0.3 27.9 36.0 4.2 59.8 MD-10 74.6 0.2 12.5 0.5 0.5 0.1 0.3 1.3 2.5 6.0 0.0 1242 2.3 244.2 14.1 1.0 6.5 23.0 79.4 127.0 0.4 -8.1 22.8 31.5 5.1 63.3
Xiangshan rhyodacite (Yang S.y et al., 2010 ScChina ES 53 1411-1426)
rhyodacite
XS-30-1 69.6 0.4 13.7 1.2 3.5 0.1 0.4 1.9 3.7 3.1 0.2 1157 5.4 269.3 60.3 1.6 10.4 33.7 120.7 66.0 2.4 15.2 76.1 33.8 8.7 57.5 X9-18 68.5 0.4 14.8 0.4 3.1 0.1 0.9 1.7 2.9 5.1 0.2 1140 4.9 290.7 43.7 1.0 21.6 30.5 94.2 107.6 2.5 27.9 70.2 32.9 5.2 61.9 X9-19 68.6 0.4 14.8 0.4 3.3 0.1 0.6 1.9 2.8 5.0 0.2 1141 5.5 289.9 46.9 1.0 14.4 33.0 89.4 105.5 2.7 29.0 66.8 34.3 4.4 61.2 rhyodacite porph
XS-29-17 71.4 0.5 16.8 0.8 0.9 0.1 0.2 0.8 0.7 4.4 0.2 1189 5.9 329.9 21.7 0.7 6.0 14.4 23.9 92.6 2.4 184.6 33.6 86.5 -33.1 46.5 XS-30-3 67.8 0.4 14.3 1.8 0.9 0.1 0.6 3.5 2.3 3.4 0.2 1128 5.3 280.1 37.0 1.1 15.6 61.5 74.9 72.8 2.1 9.4 57.8 35.5 7.2 57.3 X9-20 67.8 0.4 14.4 1.9 1.7 0.1 0.9 2.0 3.2 4.9 0.2 1128 4.6 281.5 46.4 1.6 23.1 35.0 102.3 104.5 2.5 4.8 74.1 26.4 10.5 63.2 X9-25 68.6 0.4 14.6 1.5 1.8 0.1 0.9 1.4 3.6 4.8 0.2 1142 5.0 285.6 43.9 1.0 21.6 25.1 115.5 101.5 2.4 18.3 70.5 29.0 7.1 63.9 X9-26 69.0 0.4 14.3 1.2 2.4 0.1 0.8 0.6 3.0 5.0 0.2 1148 4.8 279.6 46.5 1.0 18.9 10.5 96.8 105.5 2.3 56.2 70.1 41.9 -0.6 58.7 X9-27 67.5 0.4 15.1 1.4 1.8 0.1 0.9 1.8 3.7 4.9 0.2 1123 4.4 296.2 41.6 1.1 21.6 31.6 119.4 104.5 2.7 9.2 67.6 24.1 8.5 67.4
Sanqingshan-Damaoshan complex (Sun F.j et al., 2015 JAsES 9809-224)
Kfs-granite
10sjs162 76.1 0.1 12.2 1.4 0.0 0.0 0.5 3.3 5.4 0.0 1267 1.5 239.5 17.7 0.4 0.7 9.3 105.5 114.9 0.3 0.6 19.9 33.5 2.9 63.5 10sjs163 74.9 0.1 13.2 1.1 0.0 0.0 0.6 3.9 5.3 0.0 1247 1.4 258.5 13.3 0.4 0.7 10.7 126.2 113.2 0.4 -2.2 15.4 28.2 2.8 69.0 10sjs165 76.4 0.2 12.2 1.5 0.0 0.1 0.3 3.1 5.1 0.0 1271 2.1 239.5 19.3 0.6 3.2 6.1 101.3 107.2 0.6 18.8 24.6 40.0 0.0 60.0 SQS01 75.8 0.1 12.3 1.4 0.0 0.1 0.1 3.3 4.9 0.0 1261 1.4 241.7 18.0 0.6 2.7 2.1 106.8 103.4 0.3 27.2 22.1 41.5 -2.1 60.6 SQS02 73.6 0.1 11.9 1.2 0.0 0.1 0.2 3.2 5.0 0.0 1224 1.1 233.8 14.5 0.4 3.0 4.3 102.6 105.3 0.1 17.3 18.6 38.6 -0.7 62.0 SQS03 73.9 0.1 12.0 1.2 0.0 0.1 0.7 3.4 4.7 0.0 1230 1.3 234.4 15.4 0.6 2.7 11.8 110.0 100.0 0.1 0.8 19.4 34.0 2.9 63.2 SQ04 76.0 0.1 11.9 1.2 0.0 0.1 0.5 3.5 4.6 0.0 1264 1.3 232.6 15.0 0.4 2.2 9.5 112.0 97.9 0.3 3.9 18.5 36.3 2.1 61.7 SQ02 76.9 0.0 12.6 0.4 0.0 0.1 0.3 3.5 4.7 0.0 1280 0.3 247.5 5.1 0.0 1.5 5.9 113.6 99.6 0.1 22.6 6.9 40.4 -3.5 63.1 SQ05 77.5 0.2 11.1 1.6 0.0 0.2 0.9 2.6 4.3 0.0 1290 2.1 216.9 19.5 0.4 4.2 16.8 83.9 92.1 0.3 7.4 25.9 43.7 2.5 53.8 SQ07 80.1 0.2 9.2 2.0 0.0 0.3 0.7 1.9 3.9 0.0 1332 2.9 180.9 25.5 0.4 6.2 11.9 61.6 83.2 0.4 12.1 34.6 53.7 2.9 43.3 SQ08 78.4 0.1 10.8 1.3 0.0 0.2 0.5 2.7 4.1 0.0 1305 1.4 211.3 15.7 0.4 4.0 8.0 87.1 87.9 0.3 20.2 21.0 48.5 -0.9 52.3 10sjs172 74.2 0.3 12.5 2.2 0.1 0.1 1.0 3.6 5.2 0.0 1234 3.1 246.0 27.3 0.7 3.2 17.8 114.6 109.3 0.3 -13.6 33.7 27.3 7.8 64.9 10sjs173 75.7 0.1 12.4 1.2 0.0 0.1 0.8 3.5 5.2 0.0 1260 1.6 242.6 15.0 0.4 1.7 15.0 113.3 109.3 0.3 -9.9 18.4 30.0 4.8 65.2 10sjs175 77.1 0.2 11.4 1.7 0.0 0.1 0.7 3.1 4.8 0.0 1283 2.0 223.2 21.5 0.4 1.7 12.8 99.1 102.8 0.4 -4.3 25.3 36.5 4.7 58.8 10sjs177 76.3 0.1 12.1 1.3 0.0 0.0 0.6 3.6 5.2 0.0 1270 1.4 237.2 15.9 0.4 1.0 10.7 114.6 109.3 0.1 -8.1 18.3 31.2 4.4 64.4 syenogranite
13SQS03 75.9 0.1 12.8 1.1 0.0 0.1 0.2 3.6 4.7 0.0 1263 1.0 250.3 13.8 0.6 2.0 3.0 115.2 100.4 0.1 28.6 16.8 40.6 -3.2 62.6 13SQS04 76.5 0.1 12.4 1.2 0.0 0.1 0.1 3.5 4.6 0.0 1273 1.0 244.0 14.8 0.6 2.2 2.0 113.6 98.5 0.3 28.0 18.0 41.8 -2.9 61.1 13SQS05 76.5 0.1 12.2 1.3 0.0 0.1 0.4 3.7 4.2 0.0 1272 1.0 240.1 16.4 0.6 1.5 7.3 119.7 90.0 0.1 15.7 18.9 39.1 -0.3 61.2
Dazhou high-Zr rhyolite (Yang S.y et al., 2013 JAsES 74 303-315)
DZ-6 74.3 0.3 13.0 1.2 1.0 0.1 0.1 0.3 2.4 6.7 0.1 1236 3.6 255.4 28.8 1.7 1.5 5.7 77.4 141.4 0.8 25.1 34.0 37.5 0.1 62.4 DZ-8 75.5 0.3 12.4 1.4 0.8 0.1 0.1 0.6 2.3 6.0 0.1 1256 3.4 242.5 29.9 1.1 1.2 10.0 72.9 126.3 1.0 23.3 34.5 41.3 0.6 58.1 DZ-9 74.8 0.3 12.8 1.1 1.8 0.1 0.1 0.5 2.0 5.3 0.1 1245 3.6 250.7 37.4 1.1 1.5 9.5 64.9 112.1 1.0 54.8 42.5 51.4 -4.5 53.1 DZ-10 75.9 0.3 12.5 1.3 1.3 0.1 0.1 0.5 1.8 5.6 0.1 1263 3.3 245.4 33.6 1.1 1.5 8.7 57.8 118.9 1.1 51.3 38.3 51.7 -4.5 52.8 DZ-11 76.1 0.3 12.2 1.2 1.3 0.1 0.0 0.5 2.1 5.6 0.1 1267 3.4 239.5 32.4 1.4 1.0 8.7 68.1 117.8 1.1 36.1 36.8 47.1 -1.6 54.6 DZ-15 73.9 0.3 12.9 0.4 2.9 0.0 0.0 0.5 1.8 6.4 0.0 1230 3.5 252.1 41.9 0.3 1.0 8.9 57.1 136.7 0.6 40.4 46.3 44.6 -1.0 56.4 DZ-17 74.8 0.3 12.7 0.3 2.0 0.0 0.0 0.5 1.6 6.5 0.0 1245 3.6 249.7 28.3 0.3 1.0 9.3 50.7 137.6 0.6 42.9 32.9 47.1 -3.6 56.6 Mao-1 74.9 0.3 11.5 1.2 1.9 0.1 0.2 0.5 1.9 6.1 0.0 1246 3.5 226.0 40.1 0.8 5.7 8.4 62.0 128.7 0.6 18.6 49.3 42.0 3.9 54.1 Mao-2 74.2 0.3 11.4 2.1 1.4 0.0 0.2 0.4 1.3 7.2 0.0 1234 3.1 223.2 45.8 0.4 3.7 6.4 41.6 153.5 0.6 15.3 52.6 40.3 5.1 54.6 Mao-3 75.5 0.2 10.9 1.2 1.8 0.0 0.2 0.2 2.1 5.9 0.0 1257 3.0 214.2 39.5 0.6 3.7 3.9 66.2 125.7 0.1 14.5 46.2 42.3 4.2 53.5 Mao-4 77.3 0.2 10.9 0.5 2.4 0.0 0.1 0.2 2.3 4.7 0.0 1286 2.9 214.0 37.6 0.4 3.5 3.4 74.9 98.7 0.3 33.6 43.9 50.9 0.0 49.1 Mao-5 76.2 0.3 11.1 0.9 2.1 0.0 0.2 0.1 2.3 5.4 0.0 1268 3.1 217.1 38.6 0.4 5.2 2.3 73.9 115.5 0.6 23.1 47.0 45.0 2.6 52.4 Mao-6 73.9 0.3 12.4 0.6 2.6 0.0 0.2 0.2 2.3 5.8 0.0 1230 4.1 243.8 39.8 0.6 5.7 2.7 74.2 122.3 0.6 42.0 49.7 45.4 -0.8 55.4
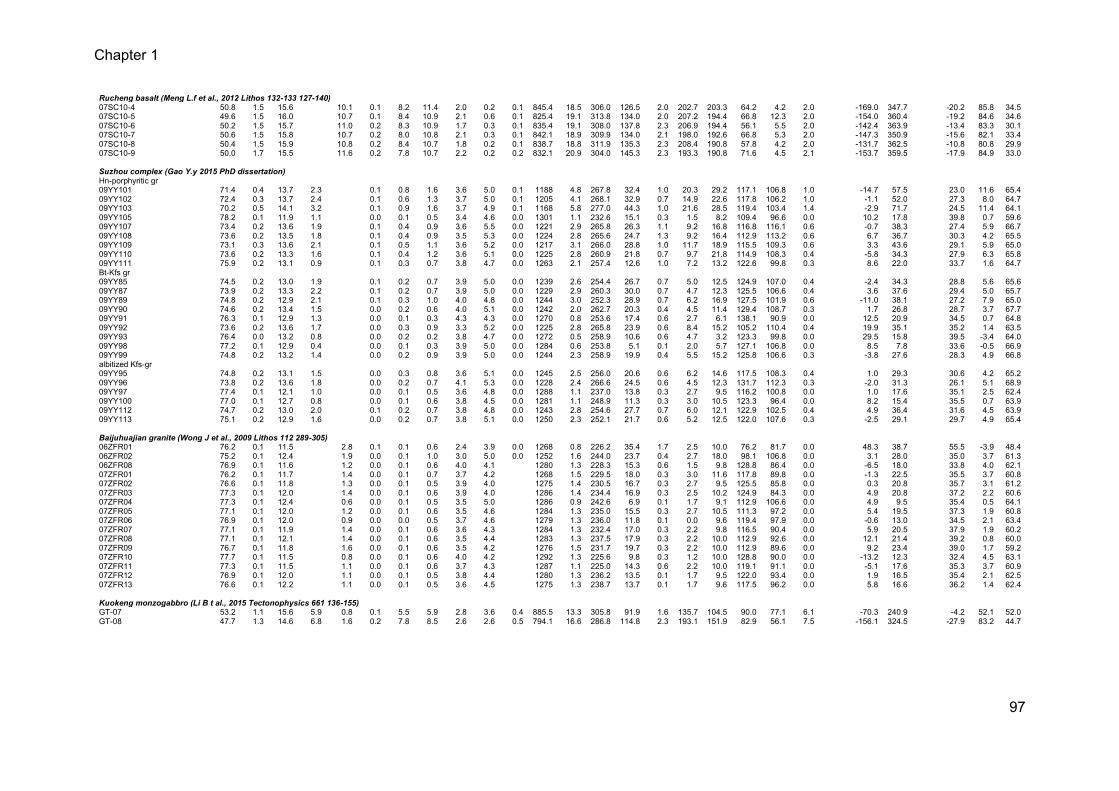
Chapter 1
97
Rucheng basalt (Meng L.f et al., 2012 Lithos 132-133 127-140)
07SC10-4 50.8 1.5 15.6 10.1 0.1 8.2 11.4 2.0 0.2 0.1 845.4 18.5 306.0 126.5 2.0 202.7 203.3 64.2 4.2 2.0 -169.0 347.7 -20.2 85.8 34.5 07SC10-5 49.6 1.5 16.0 10.7 0.1 8.4 10.9 2.1 0.6 0.1 825.4 19.1 313.8 134.0 2.0 207.2 194.4 66.8 12.3 2.0 -154.0 360.4 -19.2 84.6 34.6 07SC10-6 50.2 1.5 15.7 11.0 0.2 8.3 10.9 1.7 0.3 0.1 835.4 19.1 308.0 137.8 2.3 206.9 194.4 56.1 5.5 2.0 -142.4 363.9 -13.4 83.3 30.1 07SC10-7 50.6 1.5 15.8 10.7 0.2 8.0 10.8 2.1 0.3 0.1 842.1 18.9 309.9 134.0 2.1 198.0 192.6 66.8 5.3 2.0 -147.3 350.9 -15.6 82.1 33.4 07SC10-8 50.4 1.5 15.9 10.8 0.2 8.4 10.7 1.8 0.2 0.1 838.7 18.8 311.9 135.3 2.3 208.4 190.8 57.8 4.2 2.0 -131.7 362.5 -10.8 80.8 29.9 07SC10-9 50.0 1.7 15.5 11.6 0.2 7.8 10.7 2.2 0.2 0.2 832.1 20.9 304.0 145.3 2.3 193.3 190.8 71.6 4.5 2.1 -153.7 359.5 -17.9 84.9 33.0
Suzhou complex (Gao Y.y 2015 PhD dissertation)
Hn-porphyritic gr
09YY101 71.4 0.4 13.7 2.3 0.1 0.8 1.6 3.6 5.0 0.1 1188 4.8 267.8 32.4 1.0 20.3 29.2 117.1 106.8 1.0 -14.7 57.5 23.0 11.6 65.4 09YY102 72.4 0.3 13.7 2.4 0.1 0.6 1.3 3.7 5.0 0.1 1205 4.1 268.1 32.9 0.7 14.9 22.6 117.8 106.2 1.0 -1.1 52.0 27.3 8.0 64.7 09YY103 70.2 0.5 14.1 3.2 0.1 0.9 1.6 3.7 4.9 0.1 1168 5.8 277.0 44.3 1.0 21.6 28.5 119.4 103.4 1.4 -2.9 71.7 24.5 11.4 64.1 09YY105 78.2 0.1 11.9 1.1 0.0 0.1 0.5 3.4 4.6 0.0 1301 1.1 232.6 15.1 0.3 1.5 8.2 109.4 96.6 0.0 10.2 17.8 39.8 0.7 59.6 09YY107 73.4 0.2 13.6 1.9 0.1 0.4 0.9 3.6 5.5 0.0 1221 2.9 265.8 26.3 1.1 9.2 16.8 116.8 116.1 0.6 -0.7 38.3 27.4 5.9 66.7 09YY108 73.6 0.2 13.5 1.8 0.1 0.4 0.9 3.5 5.3 0.0 1224 2.8 265.6 24.7 1.3 9.2 16.4 112.9 113.2 0.6 6.7 36.7 30.3 4.2 65.5 09YY109 73.1 0.3 13.6 2.1 0.1 0.5 1.1 3.6 5.2 0.0 1217 3.1 266.0 28.8 1.0 11.7 18.9 115.5 109.3 0.6 3.3 43.6 29.1 5.9 65.0 09YY110 73.6 0.2 13.3 1.6 0.1 0.4 1.2 3.6 5.1 0.0 1225 2.8 260.9 21.8 0.7 9.7 21.8 114.9 108.3 0.4 -5.8 34.3 27.9 6.3 65.8 09YY111 75.9 0.2 13.1 0.9 0.1 0.3 0.7 3.8 4.7 0.0 1263 2.1 257.4 12.6 1.0 7.2 13.2 122.6 99.8 0.3 8.6 22.0 33.7 1.6 64.7 Bt-Kfs gr
09YY85 74.5 0.2 13.0 1.9 0.1 0.2 0.7 3.9 5.0 0.0 1239 2.6 254.4 26.7 0.7 5.0 12.5 124.9 107.0 0.4 -2.4 34.3 28.8 5.6 65.6 09YY87 73.9 0.2 13.3 2.2 0.1 0.2 0.7 3.9 5.0 0.0 1229 2.9 260.3 30.0 0.7 4.7 12.3 125.5 106.6 0.4 3.6 37.6 29.4 5.0 65.7 09YY89 74.8 0.2 12.9 2.1 0.1 0.3 1.0 4.0 4.8 0.0 1244 3.0 252.3 28.9 0.7 6.2 16.9 127.5 101.9 0.6 -11.0 38.1 27.2 7.9 65.0 09YY90 74.6 0.2 13.4 1.5 0.0 0.2 0.6 4.0 5.1 0.0 1242 2.0 262.7 20.3 0.4 4.5 11.4 129.4 108.7 0.3 1.7 26.8 28.7 3.7 67.7 09YY91 76.3 0.1 12.9 1.3 0.0 0.1 0.3 4.3 4.3 0.0 1270 0.8 253.6 17.4 0.6 2.7 6.1 138.1 90.9 0.0 12.5 20.9 34.5 0.7 64.8 09YY92 73.6 0.2 13.6 1.7 0.0 0.3 0.9 3.3 5.2 0.0 1225 2.8 265.8 23.9 0.6 8.4 15.2 105.2 110.4 0.4 19.9 35.1 35.2 1.4 63.5 09YY93 76.4 0.0 13.2 0.8 0.0 0.2 0.2 3.8 4.7 0.0 1272 0.5 258.9 10.6 0.6 4.7 3.2 123.3 99.8 0.0 29.5 15.8 39.5 -3.4 64.0 09YY98 77.2 0.1 12.9 0.4 0.0 0.1 0.3 3.9 5.0 0.0 1284 0.6 253.8 5.1 0.1 2.0 5.7 127.1 106.8 0.0 8.5 7.8 33.6 -0.5 66.9 09YY99 74.8 0.2 13.2 1.4 0.0 0.2 0.9 3.9 5.0 0.0 1244 2.3 258.9 19.9 0.4 5.5 15.2 125.8 106.6 0.3 -3.8 27.6 28.3 4.9 66.8 albitized Kfs-gr
09YY95 74.8 0.2 13.1 1.5 0.0 0.3 0.8 3.6 5.1 0.0 1245 2.5 256.0 20.6 0.6 6.2 14.6 117.5 108.3 0.4 1.0 29.3 30.6 4.2 65.2 09YY96 73.8 0.2 13.6 1.8 0.0 0.2 0.7 4.1 5.3 0.0 1228 2.4 266.6 24.5 0.6 4.5 12.3 131.7 112.3 0.3 -2.0 31.3 26.1 5.1 68.9 09YY97 77.4 0.1 12.1 1.0 0.0 0.1 0.5 3.6 4.8 0.0 1288 1.1 237.0 13.8 0.3 2.7 9.5 116.2 100.8 0.0 1.0 17.6 35.1 2.5 62.4 09YY100 77.0 0.1 12.7 0.8 0.0 0.1 0.6 3.8 4.5 0.0 1281 1.1 248.9 11.3 0.3 3.0 10.5 123.3 96.4 0.0 8.2 15.4 35.5 0.7 63.9 09YY112 74.7 0.2 13.0 2.0 0.1 0.2 0.7 3.8 4.8 0.0 1243 2.8 254.6 27.7 0.7 6.0 12.1 122.9 102.5 0.4 4.9 36.4 31.6 4.5 63.9 09YY113 75.1 0.2 12.9 1.6 0.0 0.2 0.7 3.8 5.1 0.0 1250 2.3 252.1 21.7 0.6 5.2 12.5 122.0 107.6 0.3 -2.5 29.1 29.7 4.9 65.4
Baijuhuajian granite (Wong J et al., 2009 Lithos 112 289-305)
06ZFR01 76.2 0.1 11.5 2.8 0.1 0.1 0.6 2.4 3.9 0.0 1268 0.8 226.2 35.4 1.7 2.5 10.0 76.2 81.7 0.0 48.3 38.7 55.5 -3.9 48.4 06ZFR02 75.2 0.1 12.4 1.9 0.0 0.1 1.0 3.0 5.0 0.0 1252 1.6 244.0 23.7 0.4 2.7 18.0 98.1 106.8 0.0 3.1 28.0 35.0 3.7 61.3 06ZFR08 76.9 0.1 11.6 1.2 0.0 0.1 0.6 4.0 4.1 1280 1.3 228.3 15.3 0.6 1.5 9.8 128.8 86.4 0.0 -6.5 18.0 33.8 4.0 62.1 07ZFR01 76.2 0.1 11.7 1.4 0.0 0.1 0.7 3.7 4.2 1268 1.5 229.5 18.0 0.3 3.0 11.6 117.8 89.8 0.0 -1.3 22.5 35.5 3.7 60.8 07ZFR02 76.6 0.1 11.8 1.3 0.0 0.1 0.5 3.9 4.0 1275 1.4 230.5 16.7 0.3 2.7 9.5 125.5 85.8 0.0 0.3 20.8 35.7 3.1 61.2 07ZFR03 77.3 0.1 12.0 1.4 0.0 0.1 0.6 3.9 4.0 1286 1.4 234.4 16.9 0.3 2.5 10.2 124.9 84.3 0.0 4.9 20.8 37.2 2.2 60.6 07ZFR04 77.3 0.1 12.4 0.6 0.0 0.1 0.5 3.5 5.0 1286 0.9 242.6 6.9 0.1 1.7 9.1 112.9 106.6 0.0 4.9 9.5 35.4 0.5 64.1 07ZFR05 77.1 0.1 12.0 1.2 0.0 0.1 0.6 3.5 4.6 1284 1.3 235.0 15.5 0.3 2.7 10.5 111.3 97.2 0.0 5.4 19.5 37.3 1.9 60.8 07ZFR06 76.9 0.1 12.0 0.9 0.0 0.0 0.5 3.7 4.6 1279 1.3 236.0 11.8 0.1 0.0 9.6 119.4 97.9 0.0 -0.6 13.0 34.5 2.1 63.4 07ZFR07 77.1 0.1 11.9 1.4 0.0 0.1 0.6 3.6 4.3 1284 1.3 232.4 17.0 0.3 2.2 9.8 116.5 90.4 0.0 5.9 20.5 37.9 1.9 60.2 07ZFR08 77.1 0.1 12.1 1.4 0.0 0.1 0.6 3.5 4.4 1283 1.3 237.5 17.9 0.3 2.2 10.0 112.9 92.6 0.0 12.1 21.4 39.2 0.8 60.0 07ZFR09 76.7 0.1 11.8 1.6 0.0 0.1 0.6 3.5 4.2 1276 1.5 231.7 19.7 0.3 2.2 10.0 112.9 89.6 0.0 9.2 23.4 39.0 1.7 59.2 07ZFR10 77.7 0.1 11.5 0.8 0.0 0.1 0.6 4.0 4.2 1292 1.3 225.6 9.8 0.3 1.2 10.0 128.8 90.0 0.0 -13.2 12.3 32.4 4.5 63.1 07ZFR11 77.3 0.1 11.5 1.1 0.0 0.1 0.6 3.7 4.3 1287 1.1 225.0 14.3 0.6 2.2 10.0 119.1 91.1 0.0 -5.1 17.6 35.3 3.7 60.9 07ZFR12 76.9 0.1 12.0 1.1 0.0 0.1 0.5 3.8 4.4 1280 1.3 236.2 13.5 0.1 1.7 9.5 122.0 93.4 0.0 1.9 16.5 35.4 2.1 62.5 07ZFR13 76.6 0.1 12.2 1.1 0.0 0.1 0.5 3.6 4.5 1275 1.3 238.7 13.7 0.1 1.7 9.6 117.5 96.2 0.0 5.8 16.6 36.2 1.4 62.4
Kuokeng monzogabbro (Li B t al., 2015 Tectonophysics 661 136-155)
GT-07 53.2 1.1 15.6 5.9 0.8 0.1 5.5 5.9 2.8 3.6 0.4 885.5 13.3 305.8 91.9 1.6 135.7 104.5 90.0 77.1 6.1 -70.3 240.9 -4.2 52.1 52.0 GT-08 47.7 1.3 14.6 6.8 1.6 0.2 7.8 8.5 2.6 2.6 0.5 794.1 16.6 286.8 114.8 2.3 193.1 151.9 82.9 56.1 7.5 -156.1 324.5 -27.9 83.2 44.7
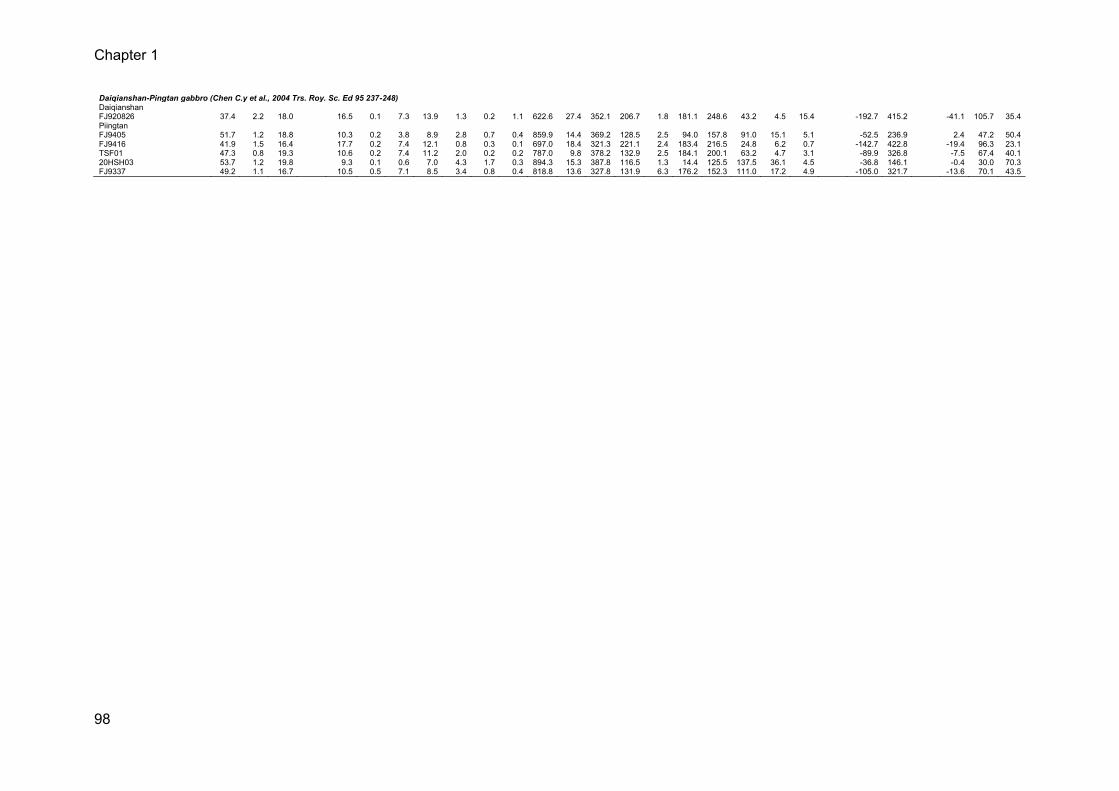
Chapter 1
98
Daiqianshan-Pingtan gabbro (Chen C.y et al., 2004 Trs. Roy. Sc. Ed 95 237-248)
Daiqianshan
FJ920826 37.4 2.2 18.0 16.5 0.1 7.3 13.9 1.3 0.2 1.1 622.6 27.4 352.1 206.7 1.8 181.1 248.6 43.2 4.5 15.4 -192.7 415.2 -41.1 105.7 35.4 Piingtan
FJ9405 51.7 1.2 18.8 10.3 0.2 3.8 8.9 2.8 0.7 0.4 859.9 14.4 369.2 128.5 2.5 94.0 157.8 91.0 15.1 5.1 -52.5 236.9 2.4 47.2 50.4 FJ9416 41.9 1.5 16.4 17.7 0.2 7.4 12.1 0.8 0.3 0.1 697.0 18.4 321.3 221.1 2.4 183.4 216.5 24.8 6.2 0.7 -142.7 422.8 -19.4 96.3 23.1 TSF01 47.3 0.8 19.3 10.6 0.2 7.4 11.2 2.0 0.2 0.2 787.0 9.8 378.2 132.9 2.5 184.1 200.1 63.2 4.7 3.1 -89.9 326.8 -7.5 67.4 40.1 20HSH03 53.7 1.2 19.8 9.3 0.1 0.6 7.0 4.3 1.7 0.3 894.3 15.3 387.8 116.5 1.3 14.4 125.5 137.5 36.1 4.5 -36.8 146.1 -0.4 30.0 70.3 FJ9337 49.2 1.1 16.7 10.5 0.5 7.1 8.5 3.4 0.8 0.4 818.8 13.6 327.8 131.9 6.3 176.2 152.3 111.0 17.2 4.9 -105.0 321.7 -13.6 70.1 43.5
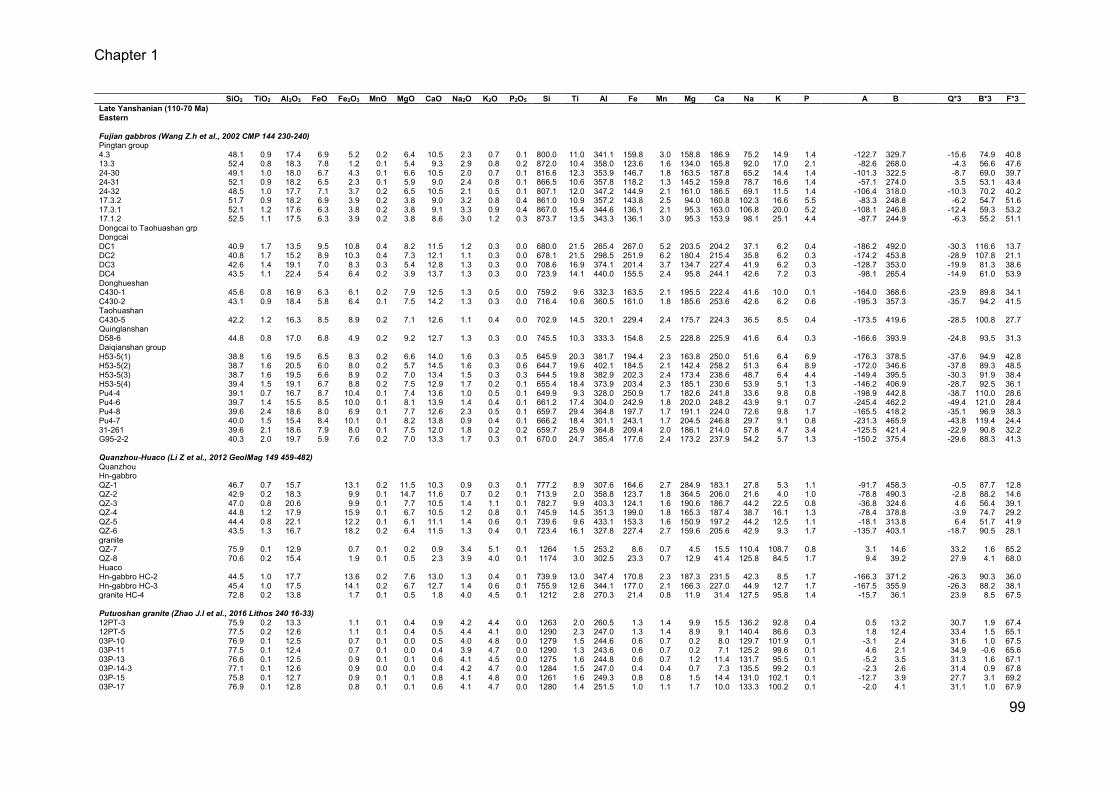
Chapter 1
99
SiO2 TiO2 Al2O3 FeO Fe2O3 MnO MgO CaO Na2O K2O P2O5 Si Ti Al Fe Mn Mg Ca Na K P A B Q*3 B*3 F*3 Late Yanshanian (110-70 Ma)
Eastern
Fujian gabbros (Wang Z.h et al., 2002 CMP 144 230-240)
Pingtan group
4.3 48.1 0.9 17.4 6.9 5.2 0.2 6.4 10.5 2.3 0.7 0.1 800.0 11.0 341.1 159.8 3.0 158.8 186.9 75.2 14.9 1.4 -122.7 329.7 -15.6 74.9 40.8 13.3 52.4 0.8 18.3 7.8 1.2 0.1 5.4 9.3 2.9 0.8 0.2 872.0 10.4 358.0 123.6 1.6 134.0 165.8 92.0 17.0 2.1 -82.6 268.0 -4.3 56.6 47.6 24-30 49.1 1.0 18.0 6.7 4.3 0.1 6.6 10.5 2.0 0.7 0.1 816.6 12.3 353.9 146.7 1.8 163.5 187.8 65.2 14.4 1.4 -101.3 322.5 -8.7 69.0 39.7 24-31 52.1 0.9 18.2 6.5 2.3 0.1 5.9 9.0 2.4 0.8 0.1 866.5 10.6 357.8 118.2 1.3 145.2 159.8 78.7 16.6 1.4 -57.1 274.0 3.5 53.1 43.4 24-32 48.5 1.0 17.7 7.1 3.7 0.2 6.5 10.5 2.1 0.5 0.1 807.1 12.0 347.2 144.9 2.1 161.0 186.5 69.1 11.5 1.4 -106.4 318.0 -10.3 70.2 40.2 17.3.2 51.7 0.9 18.2 6.9 3.9 0.2 3.8 9.0 3.2 0.8 0.4 861.0 10.9 357.2 143.8 2.5 94.0 160.8 102.3 16.6 5.5 -83.3 248.8 -6.2 54.7 51.6 17.3.1 52.1 1.2 17.6 6.3 3.8 0.2 3.8 9.1 3.3 0.9 0.4 867.0 15.4 344.6 136.1 2.1 95.3 163.0 106.8 20.0 5.2 -108.1 246.8 -12.4 59.3 53.2 17.1.2 52.5 1.1 17.5 6.3 3.9 0.2 3.8 8.6 3.0 1.2 0.3 873.7 13.5 343.3 136.1 3.0 95.3 153.9 98.1 25.1 4.4 -87.7 244.9 -6.3 55.2 51.1 Dongcai to Taohuashan grp
Dongcai
DC1 40.9 1.7 13.5 9.5 10.8 0.4 8.2 11.5 1.2 0.3 0.0 680.0 21.5 265.4 267.0 5.2 203.5 204.2 37.1 6.2 0.4 -186.2 492.0 -30.3 116.6 13.7 DC2 40.8 1.7 15.2 8.9 10.3 0.4 7.3 12.1 1.1 0.3 0.0 678.1 21.5 298.5 251.9 6.2 180.4 215.4 35.8 6.2 0.3 -174.2 453.8 -28.9 107.8 21.1 DC3 42.6 1.4 19.1 7.0 8.3 0.3 5.4 12.8 1.3 0.3 0.0 708.6 16.9 374.1 201.4 3.7 134.7 227.4 41.9 6.2 0.3 -128.7 353.0 -19.9 81.3 38.6 DC4 43.5 1.1 22.4 5.4 6.4 0.2 3.9 13.7 1.3 0.3 0.0 723.9 14.1 440.0 155.5 2.4 95.8 244.1 42.6 7.2 0.3 -98.1 265.4 -14.9 61.0 53.9 Donghueshan
C430-1 45.6 0.8 16.9 6.3 6.1 0.2 7.9 12.5 1.3 0.5 0.0 759.2 9.6 332.3 163.5 2.1 195.5 222.4 41.6 10.0 0.1 -164.0 368.6 -23.9 89.8 34.1 C430-2 43.1 0.9 18.4 5.8 6.4 0.1 7.5 14.2 1.3 0.3 0.0 716.4 10.6 360.5 161.0 1.8 185.6 253.6 42.6 6.2 0.6 -195.3 357.3 -35.7 94.2 41.5 Taohuashan
C430-5 42.2 1.2 16.3 8.5 8.9 0.2 7.1 12.6 1.1 0.4 0.0 702.9 14.5 320.1 229.4 2.4 175.7 224.3 36.5 8.5 0.4 -173.5 419.6 -28.5 100.8 27.7 Quinglanshan
D58-6 44.8 0.8 17.0 6.8 4.9 0.2 9.2 12.7 1.3 0.3 0.0 745.5 10.3 333.3 154.8 2.5 228.8 225.9 41.6 6.4 0.3 -166.6 393.9 -24.8 93.5 31.3 Daiqianshan group
H53-5(1) 38.8 1.6 19.5 6.5 8.3 0.2 6.6 14.0 1.6 0.3 0.5 645.9 20.3 381.7 194.4 2.3 163.8 250.0 51.6 6.4 6.9 -176.3 378.5 -37.6 94.9 42.8 H53-5(2) 38.7 1.6 20.5 6.0 8.0 0.2 5.7 14.5 1.6 0.3 0.6 644.7 19.6 402.1 184.5 2.1 142.4 258.2 51.3 6.4 8.9 -172.0 346.6 -37.8 89.3 48.5 H53-5(3) 38.7 1.6 19.5 6.6 8.9 0.2 7.0 13.4 1.5 0.3 0.3 644.5 19.8 382.9 202.3 2.4 173.4 238.6 48.7 6.4 4.4 -149.4 395.5 -30.3 91.9 38.4 H53-5(4) 39.4 1.5 19.1 6.7 8.8 0.2 7.5 12.9 1.7 0.2 0.1 655.4 18.4 373.9 203.4 2.3 185.1 230.6 53.9 5.1 1.3 -146.2 406.9 -28.7 92.5 36.1 Pu4-4 39.1 0.7 16.7 8.7 10.4 0.1 7.4 13.6 1.0 0.5 0.1 649.9 9.3 328.0 250.9 1.7 182.6 241.8 33.6 9.8 0.8 -198.9 442.8 -38.7 110.0 28.6 Pu4-6 39.7 1.4 15.5 8.5 10.0 0.1 8.1 13.9 1.4 0.4 0.1 661.2 17.4 304.0 242.9 1.8 202.0 248.2 43.9 9.1 0.7 -245.4 462.2 -49.4 121.0 28.4 Pu4-8 39.6 2.4 18.6 8.0 6.9 0.1 7.7 12.6 2.3 0.5 0.1 659.7 29.4 364.8 197.7 1.7 191.1 224.0 72.6 9.8 1.7 -165.5 418.2 -35.1 96.9 38.3 Pu4-7 40.0 1.5 15.4 8.4 10.1 0.1 8.2 13.8 0.9 0.4 0.1 666.2 18.4 301.1 243.1 1.7 204.5 246.8 29.7 9.1 0.8 -231.3 465.9 -43.8 119.4 24.4 31-261 39.6 2.1 18.6 7.9 8.0 0.1 7.5 12.0 1.8 0.2 0.2 659.7 25.9 364.8 209.4 2.0 186.1 214.0 57.8 4.7 3.4 -125.5 421.4 -22.9 90.8 32.2 G95-2-2 40.3 2.0 19.7 5.9 7.6 0.2 7.0 13.3 1.7 0.3 0.1 670.0 24.7 385.4 177.6 2.4 173.2 237.9 54.2 5.7 1.3 -150.2 375.4 -29.6 88.3 41.3
Quanzhou-Huaco (Li Z et al., 2012 GeolMag 149 459-482)
Quanzhou
Hn-gabbro
QZ-1 46.7 0.7 15.7 13.1 0.2 11.5 10.3 0.9 0.3 0.1 777.2 8.9 307.6 164.6 2.7 284.9 183.1 27.8 5.3 1.1 -91.7 458.3 -0.5 87.7 12.8 QZ-2 42.9 0.2 18.3 9.9 0.1 14.7 11.6 0.7 0.2 0.1 713.9 2.0 358.8 123.7 1.8 364.5 206.0 21.6 4.0 1.0 -78.8 490.3 -2.8 88.2 14.6 QZ-3 47.0 0.8 20.6 9.9 0.1 7.7 10.5 1.4 1.1 0.1 782.7 9.9 403.3 124.1 1.6 190.6 186.7 44.2 22.5 0.8 -36.8 324.6 4.6 56.4 39.1 QZ-4 44.8 1.2 17.9 15.9 0.1 6.7 10.5 1.2 0.8 0.1 745.9 14.5 351.3 199.0 1.8 165.3 187.4 38.7 16.1 1.3 -78.4 378.8 -3.9 74.7 29.2 QZ-5 44.4 0.8 22.1 12.2 0.1 6.1 11.1 1.4 0.6 0.1 739.6 9.6 433.1 153.3 1.6 150.9 197.2 44.2 12.5 1.1 -18.1 313.8 6.4 51.7 41.9 QZ-6 43.5 1.3 16.7 18.2 0.2 6.4 11.5 1.3 0.4 0.1 723.4 16.1 327.8 227.4 2.7 159.6 205.6 42.9 9.3 1.7 -135.7 403.1 -18.7 90.5 28.1 granite
QZ-7 75.9 0.1 12.9 0.7 0.1 0.2 0.9 3.4 5.1 0.1 1264 1.5 253.2 8.6 0.7 4.5 15.5 110.4 108.7 0.8 3.1 14.6 33.2 1.6 65.2 QZ-8 70.6 0.2 15.4 1.9 0.1 0.5 2.3 3.9 4.0 0.1 1174 3.0 302.5 23.3 0.7 12.9 41.4 125.8 84.5 1.7 9.4 39.2 27.9 4.1 68.0 Huaco
Hn-gabbro HC-2 44.5 1.0 17.7 13.6 0.2 7.6 13.0 1.3 0.4 0.1 739.9 13.0 347.4 170.8 2.3 187.3 231.5 42.3 8.5 1.7 -166.3 371.2 -26.3 90.3 36.0 Hn-gabbro HC-3 45.4 1.0 17.5 14.1 0.2 6.7 12.7 1.4 0.6 0.1 755.9 12.6 344.1 177.0 2.1 166.3 227.0 44.9 12.7 1.7 -167.5 355.9 -26.3 88.2 38.1 granite HC-4 72.8 0.2 13.8 1.7 0.1 0.5 1.8 4.0 4.5 0.1 1212 2.8 270.3 21.4 0.8 11.9 31.4 127.5 95.8 1.4 -15.7 36.1 23.9 8.5 67.5
Putuoshan granite (Zhao J.l et al., 2016 Lithos 240 16-33)
12PT-3 75.9 0.2 13.3 1.1 0.1 0.4 0.9 4.2 4.4 0.0 1263 2.0 260.5 1.3 1.4 9.9 15.5 136.2 92.8 0.4 0.5 13.2 30.7 1.9 67.4 12PT-5 77.5 0.2 12.6 1.1 0.1 0.4 0.5 4.4 4.1 0.0 1290 2.3 247.0 1.3 1.4 8.9 9.1 140.4 86.6 0.3 1.8 12.4 33.4 1.5 65.1 03P-10 76.9 0.1 12.5 0.7 0.1 0.0 0.5 4.0 4.8 0.0 1279 1.5 244.6 0.6 0.7 0.2 8.0 129.7 101.9 0.1 -3.1 2.4 31.6 1.0 67.5 03P-11 77.5 0.1 12.4 0.7 0.1 0.0 0.4 3.9 4.7 0.0 1290 1.3 243.6 0.6 0.7 0.2 7.1 125.2 99.6 0.1 4.6 2.1 34.9 -0.6 65.6 03P-13 76.6 0.1 12.5 0.9 0.1 0.1 0.6 4.1 4.5 0.0 1275 1.6 244.8 0.6 0.7 1.2 11.4 131.7 95.5 0.1 -5.2 3.5 31.3 1.6 67.1 03P-14-3 77.1 0.1 12.6 0.9 0.0 0.0 0.4 4.2 4.7 0.0 1284 1.5 247.0 0.4 0.4 0.7 7.3 135.5 99.2 0.1 -2.3 2.6 31.4 0.9 67.8 03P-15 75.8 0.1 12.7 0.9 0.1 0.1 0.8 4.1 4.8 0.0 1261 1.6 249.3 0.8 0.8 1.5 14.4 131.0 102.1 0.1 -12.7 3.9 27.7 3.1 69.2 03P-17 76.9 0.1 12.8 0.8 0.1 0.1 0.6 4.1 4.7 0.0 1280 1.4 251.5 1.0 1.1 1.7 10.0 133.3 100.2 0.1 -2.0 4.1 31.1 1.0 67.9
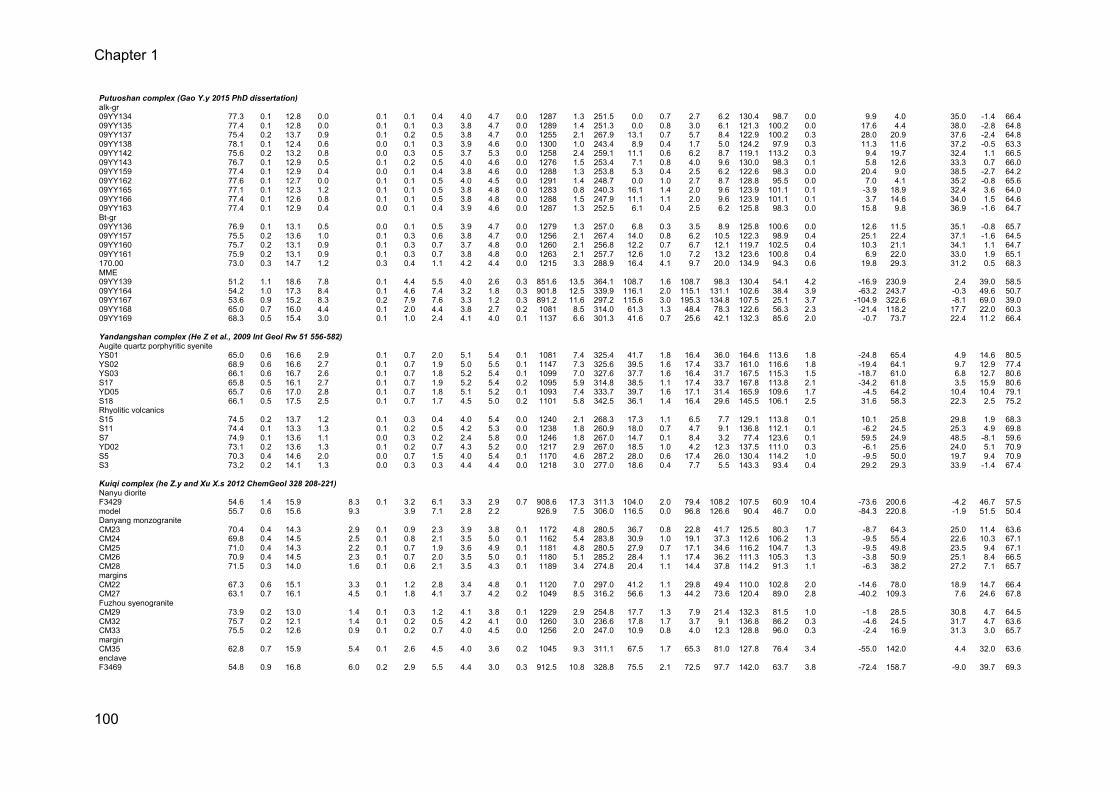
Chapter 1
100
Putuoshan complex (Gao Y.y 2015 PhD dissertation)
alk-gr
09YY134 77.3 0.1 12.8 0.0 0.1 0.1 0.4 4.0 4.7 0.0 1287 1.3 251.5 0.0 0.7 2.7 6.2 130.4 98.7 0.0 9.9 4.0 35.0 -1.4 66.4 09YY135 77.4 0.1 12.8 0.0 0.1 0.1 0.3 3.8 4.7 0.0 1289 1.4 251.3 0.0 0.8 3.0 6.1 121.3 100.2 0.0 17.6 4.4 38.0 -2.8 64.8 09YY137 75.4 0.2 13.7 0.9 0.1 0.2 0.5 3.8 4.7 0.0 1255 2.1 267.9 13.1 0.7 5.7 8.4 122.9 100.2 0.3 28.0 20.9 37.6 -2.4 64.8 09YY138 78.1 0.1 12.4 0.6 0.0 0.1 0.3 3.9 4.6 0.0 1300 1.0 243.4 8.9 0.4 1.7 5.0 124.2 97.9 0.3 11.3 11.6 37.2 -0.5 63.3 09YY142 75.6 0.2 13.2 0.8 0.0 0.3 0.5 3.7 5.3 0.0 1258 2.4 259.1 11.1 0.6 6.2 8.7 119.1 113.2 0.3 9.4 19.7 32.4 1.1 66.5 09YY143 76.7 0.1 12.9 0.5 0.1 0.2 0.5 4.0 4.6 0.0 1276 1.5 253.4 7.1 0.8 4.0 9.6 130.0 98.3 0.1 5.8 12.6 33.3 0.7 66.0 09YY159 77.4 0.1 12.9 0.4 0.0 0.1 0.4 3.8 4.6 0.0 1288 1.3 253.8 5.3 0.4 2.5 6.2 122.6 98.3 0.0 20.4 9.0 38.5 -2.7 64.2 09YY162 77.6 0.1 12.7 0.0 0.1 0.1 0.5 4.0 4.5 0.0 1291 1.4 248.7 0.0 1.0 2.7 8.7 128.8 95.5 0.0 7.0 4.1 35.2 -0.8 65.6 09YY165 77.1 0.1 12.3 1.2 0.1 0.1 0.5 3.8 4.8 0.0 1283 0.8 240.3 16.1 1.4 2.0 9.6 123.9 101.1 0.1 -3.9 18.9 32.4 3.6 64.0 09YY166 77.4 0.1 12.6 0.8 0.1 0.1 0.5 3.8 4.8 0.0 1288 1.5 247.9 11.1 1.1 2.0 9.6 123.9 101.1 0.1 3.7 14.6 34.0 1.5 64.6 09YY163 77.4 0.1 12.9 0.4 0.0 0.1 0.4 3.9 4.6 0.0 1287 1.3 252.5 6.1 0.4 2.5 6.2 125.8 98.3 0.0 15.8 9.8 36.9 -1.6 64.7 Bt-gr
09YY136 76.9 0.1 13.1 0.5 0.0 0.1 0.5 3.9 4.7 0.0 1279 1.3 257.0 6.8 0.3 3.5 8.9 125.8 100.6 0.0 12.6 11.5 35.1 -0.8 65.7 09YY157 75.5 0.2 13.6 1.0 0.1 0.3 0.6 3.8 4.7 0.0 1256 2.1 267.4 14.0 0.8 6.2 10.5 122.3 98.9 0.4 25.1 22.4 37.1 -1.6 64.5 09YY160 75.7 0.2 13.1 0.9 0.1 0.3 0.7 3.7 4.8 0.0 1260 2.1 256.8 12.2 0.7 6.7 12.1 119.7 102.5 0.4 10.3 21.1 34.1 1.1 64.7 09YY161 75.9 0.2 13.1 0.9 0.1 0.3 0.7 3.8 4.8 0.0 1263 2.1 257.7 12.6 1.0 7.2 13.2 123.6 100.8 0.4 6.9 22.0 33.0 1.9 65.1 170.00 73.0 0.3 14.7 1.2 0.3 0.4 1.1 4.2 4.4 0.0 1215 3.3 288.9 16.4 4.1 9.7 20.0 134.9 94.3 0.6 19.8 29.3 31.2 0.5 68.3 MME
09YY139 51.2 1.1 18.6 7.8 0.1 4.4 5.5 4.0 2.6 0.3 851.6 13.5 364.1 108.7 1.6 108.7 98.3 130.4 54.1 4.2 -16.9 230.9 2.4 39.0 58.5 09YY164 54.2 1.0 17.3 8.4 0.1 4.6 7.4 3.2 1.8 0.3 901.8 12.5 339.9 116.1 2.0 115.1 131.1 102.6 38.4 3.9 -63.2 243.7 -0.3 49.6 50.7 09YY167 53.6 0.9 15.2 8.3 0.2 7.9 7.6 3.3 1.2 0.3 891.2 11.6 297.2 115.6 3.0 195.3 134.8 107.5 25.1 3.7 -104.9 322.6 -8.1 69.0 39.0 09YY168 65.0 0.7 16.0 4.4 0.1 2.0 4.4 3.8 2.7 0.2 1081 8.5 314.0 61.3 1.3 48.4 78.3 122.6 56.3 2.3 -21.4 118.2 17.7 22.0 60.3 09YY169 68.3 0.5 15.4 3.0 0.1 1.0 2.4 4.1 4.0 0.1 1137 6.6 301.3 41.6 0.7 25.6 42.1 132.3 85.6 2.0 -0.7 73.7 22.4 11.2 66.4
Yandangshan complex (He Z et al., 2009 Int Geol Rw 51 556-582)
Augite quartz porphyritic syenite
YS01 65.0 0.6 16.6 2.9 0.1 0.7 2.0 5.1 5.4 0.1 1081 7.4 325.4 41.7 1.8 16.4 36.0 164.6 113.6 1.8 -24.8 65.4 4.9 14.6 80.5 YS02 68.9 0.6 16.6 2.7 0.1 0.7 1.9 5.0 5.5 0.1 1147 7.3 325.6 39.5 1.6 17.4 33.7 161.0 116.6 1.8 -19.4 64.1 9.7 12.9 77.4 YS03 66.1 0.6 16.7 2.6 0.1 0.7 1.8 5.2 5.4 0.1 1099 7.0 327.6 37.7 1.6 16.4 31.7 167.5 115.3 1.5 -18.7 61.0 6.8 12.7 80.6 S17 65.8 0.5 16.1 2.7 0.1 0.7 1.9 5.2 5.4 0.2 1095 5.9 314.8 38.5 1.1 17.4 33.7 167.8 113.8 2.1 -34.2 61.8 3.5 15.9 80.6 YD05 65.7 0.6 17.0 2.8 0.1 0.7 1.8 5.1 5.2 0.1 1093 7.4 333.7 39.7 1.6 17.1 31.4 165.9 109.6 1.7 -4.5 64.2 10.4 10.4 79.1 S18 66.1 0.5 17.5 2.5 0.1 0.7 1.7 4.5 5.0 0.2 1101 5.8 342.5 36.1 1.4 16.4 29.6 145.5 106.1 2.5 31.6 58.3 22.3 2.5 75.2 Rhyolitic volcanics
S15 74.5 0.2 13.7 1.2 0.1 0.3 0.4 4.0 5.4 0.0 1240 2.1 268.3 17.3 1.1 6.5 7.7 129.1 113.8 0.1 10.1 25.8 29.8 1.9 68.3 S11 74.4 0.1 13.3 1.3 0.1 0.2 0.5 4.2 5.3 0.0 1238 1.8 260.9 18.0 0.7 4.7 9.1 136.8 112.1 0.1 -6.2 24.5 25.3 4.9 69.8 S7 74.9 0.1 13.6 1.1 0.0 0.3 0.2 2.4 5.8 0.0 1246 1.8 267.0 14.7 0.1 8.4 3.2 77.4 123.6 0.1 59.5 24.9 48.5 -8.1 59.6 YD02 73.1 0.2 13.6 1.3 0.1 0.2 0.7 4.3 5.2 0.0 1217 2.9 267.0 18.5 1.0 4.2 12.3 137.5 111.0 0.3 -6.1 25.6 24.0 5.1 70.9 S5 70.3 0.4 14.6 2.0 0.0 0.7 1.5 4.0 5.4 0.1 1170 4.6 287.2 28.0 0.6 17.4 26.0 130.4 114.2 1.0 -9.5 50.0 19.7 9.4 70.9 S3 73.2 0.2 14.1 1.3 0.0 0.3 0.3 4.4 4.4 0.0 1218 3.0 277.0 18.6 0.4 7.7 5.5 143.3 93.4 0.4 29.2 29.3 33.9 -1.4 67.4
Kuiqi complex (he Z.y and Xu X.s 2012 ChemGeol 328 208-221)
Nanyu diorite
F3429 54.6 1.4 15.9 8.3 0.1 3.2 6.1 3.3 2.9 0.7 908.6 17.3 311.3 104.0 2.0 79.4 108.2 107.5 60.9 10.4 -73.6 200.6 -4.2 46.7 57.5 model 55.7 0.6 15.6 9.3 3.9 7.1 2.8 2.2 926.9 7.5 306.0 116.5 0.0 96.8 126.6 90.4 46.7 0.0 -84.3 220.8 -1.9 51.5 50.4 Danyang monzogranite
CM23 70.4 0.4 14.3 2.9 0.1 0.9 2.3 3.9 3.8 0.1 1172 4.8 280.5 36.7 0.8 22.8 41.7 125.5 80.3 1.7 -8.7 64.3 25.0 11.4 63.6 CM24 69.8 0.4 14.5 2.5 0.1 0.8 2.1 3.5 5.0 0.1 1162 5.4 283.8 30.9 1.0 19.1 37.3 112.6 106.2 1.3 -9.5 55.4 22.6 10.3 67.1 CM25 71.0 0.4 14.3 2.2 0.1 0.7 1.9 3.6 4.9 0.1 1181 4.8 280.5 27.9 0.7 17.1 34.6 116.2 104.7 1.3 -9.5 49.8 23.5 9.4 67.1 CM26 70.9 0.4 14.5 2.3 0.1 0.7 2.0 3.5 5.0 0.1 1180 5.1 285.2 28.4 1.1 17.4 36.2 111.3 105.3 1.3 -3.8 50.9 25.1 8.4 66.5 CM28 71.5 0.3 14.0 1.6 0.1 0.6 2.1 3.5 4.3 0.1 1189 3.4 274.8 20.4 1.1 14.4 37.8 114.2 91.3 1.1 -6.3 38.2 27.2 7.1 65.7 margins
CM22 67.3 0.6 15.1 3.3 0.1 1.2 2.8 3.4 4.8 0.1 1120 7.0 297.0 41.2 1.1 29.8 49.4 110.0 102.8 2.0 -14.6 78.0 18.9 14.7 66.4 CM27 63.1 0.7 16.1 4.5 0.1 1.8 4.1 3.7 4.2 0.2 1049 8.5 316.2 56.6 1.3 44.2 73.6 120.4 89.0 2.8 -40.2 109.3 7.6 24.6 67.8 Fuzhou syenogranite
CM29 73.9 0.2 13.0 1.4 0.1 0.3 1.2 4.1 3.8 0.1 1229 2.9 254.8 17.7 1.3 7.9 21.4 132.3 81.5 1.0 -1.8 28.5 30.8 4.7 64.5 CM32 75.7 0.2 12.1 1.4 0.1 0.2 0.5 4.2 4.1 0.0 1260 3.0 236.6 17.8 1.7 3.7 9.1 136.8 86.2 0.3 -4.6 24.5 31.7 4.7 63.6 CM33 75.5 0.2 12.6 0.9 0.1 0.2 0.7 4.0 4.5 0.0 1256 2.0 247.0 10.9 0.8 4.0 12.3 128.8 96.0 0.3 -2.4 16.9 31.3 3.0 65.7 margin
CM35 62.8 0.7 15.9 5.4 0.1 2.6 4.5 4.0 3.6 0.2 1045 9.3 311.1 67.5 1.7 65.3 81.0 127.8 76.4 3.4 -55.0 142.0 4.4 32.0 63.6 enclave
F3469 54.8 0.9 16.8 6.0 0.2 2.9 5.5 4.4 3.0 0.3 912.5 10.8 328.8 75.5 2.1 72.5 97.7 142.0 63.7 3.8 -72.4 158.7 -9.0 39.7 69.3
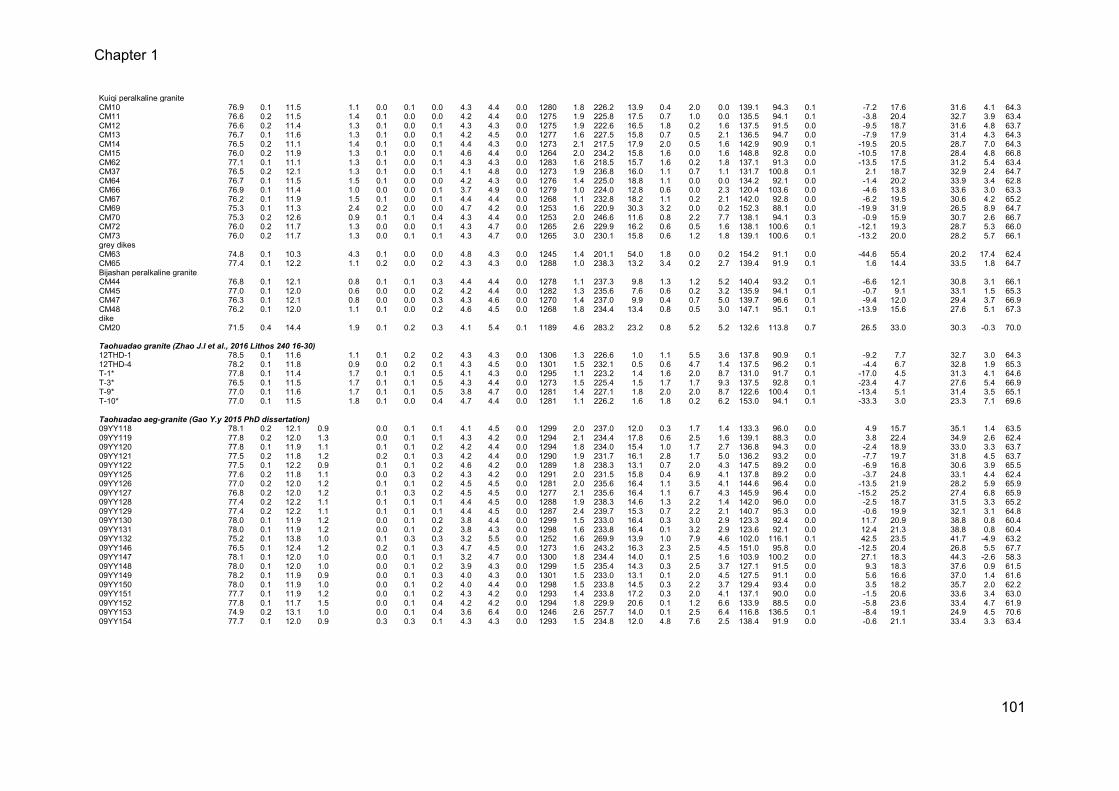
Chapter 1
101
Kuiqi peralkaline granite
CM10 76.9 0.1 11.5 1.1 0.0 0.1 0.0 4.3 4.4 0.0 1280 1.8 226.2 13.9 0.4 2.0 0.0 139.1 94.3 0.1 -7.2 17.6 31.6 4.1 64.3 CM11 76.6 0.2 11.5 1.4 0.1 0.0 0.0 4.2 4.4 0.0 1275 1.9 225.8 17.5 0.7 1.0 0.0 135.5 94.1 0.1 -3.8 20.4 32.7 3.9 63.4 CM12 76.6 0.2 11.4 1.3 0.1 0.0 0.1 4.3 4.3 0.0 1275 1.9 222.6 16.5 1.8 0.2 1.6 137.5 91.5 0.0 -9.5 18.7 31.6 4.8 63.7 CM13 76.7 0.1 11.6 1.3 0.1 0.0 0.1 4.2 4.5 0.0 1277 1.6 227.5 15.8 0.7 0.5 2.1 136.5 94.7 0.0 -7.9 17.9 31.4 4.3 64.3 CM14 76.5 0.2 11.1 1.4 0.1 0.0 0.1 4.4 4.3 0.0 1273 2.1 217.5 17.9 2.0 0.5 1.6 142.9 90.9 0.1 -19.5 20.5 28.7 7.0 64.3 CM15 76.0 0.2 11.9 1.3 0.1 0.0 0.1 4.6 4.4 0.0 1264 2.0 234.2 15.8 1.6 0.0 1.6 148.8 92.8 0.0 -10.5 17.8 28.4 4.8 66.8 CM62 77.1 0.1 11.1 1.3 0.1 0.0 0.1 4.3 4.3 0.0 1283 1.6 218.5 15.7 1.6 0.2 1.8 137.1 91.3 0.0 -13.5 17.5 31.2 5.4 63.4 CM37 76.5 0.2 12.1 1.3 0.1 0.0 0.1 4.1 4.8 0.0 1273 1.9 236.8 16.0 1.1 0.7 1.1 131.7 100.8 0.1 2.1 18.7 32.9 2.4 64.7 CM64 76.7 0.1 11.5 1.5 0.1 0.0 0.0 4.2 4.3 0.0 1276 1.4 225.0 18.8 1.1 0.0 0.0 134.2 92.1 0.0 -1.4 20.2 33.9 3.4 62.8 CM66 76.9 0.1 11.4 1.0 0.0 0.0 0.1 3.7 4.9 0.0 1279 1.0 224.0 12.8 0.6 0.0 2.3 120.4 103.6 0.0 -4.6 13.8 33.6 3.0 63.3 CM67 76.2 0.1 11.9 1.5 0.1 0.0 0.1 4.4 4.4 0.0 1268 1.1 232.8 18.2 1.1 0.2 2.1 142.0 92.8 0.0 -6.2 19.5 30.6 4.2 65.2 CM69 75.3 0.1 11.3 2.4 0.2 0.0 0.0 4.7 4.2 0.0 1253 1.6 220.9 30.3 3.2 0.0 0.2 152.3 88.1 0.0 -19.9 31.9 26.5 8.9 64.7 CM70 75.3 0.2 12.6 0.9 0.1 0.1 0.4 4.3 4.4 0.0 1253 2.0 246.6 11.6 0.8 2.2 7.7 138.1 94.1 0.3 -0.9 15.9 30.7 2.6 66.7 CM72 76.0 0.2 11.7 1.3 0.0 0.0 0.1 4.3 4.7 0.0 1265 2.6 229.9 16.2 0.6 0.5 1.6 138.1 100.6 0.1 -12.1 19.3 28.7 5.3 66.0 CM73 76.0 0.2 11.7 1.3 0.0 0.1 0.1 4.3 4.7 0.0 1265 3.0 230.1 15.8 0.6 1.2 1.8 139.1 100.6 0.1 -13.2 20.0 28.2 5.7 66.1 grey dikes
CM63 74.8 0.1 10.3 4.3 0.1 0.0 0.0 4.8 4.3 0.0 1245 1.4 201.1 54.0 1.8 0.0 0.2 154.2 91.1 0.0 -44.6 55.4 20.2 17.4 62.4 CM65 77.4 0.1 12.2 1.1 0.2 0.0 0.2 4.3 4.3 0.0 1288 1.0 238.3 13.2 3.4 0.2 2.7 139.4 91.9 0.1 1.6 14.4 33.5 1.8 64.7 Bijashan peralkaline granite
CM44 76.8 0.1 12.1 0.8 0.1 0.1 0.3 4.4 4.4 0.0 1278 1.1 237.3 9.8 1.3 1.2 5.2 140.4 93.2 0.1 -6.6 12.1 30.8 3.1 66.1 CM45 77.0 0.1 12.0 0.6 0.0 0.0 0.2 4.2 4.4 0.0 1282 1.3 235.6 7.6 0.6 0.2 3.2 135.9 94.1 0.1 -0.7 9.1 33.1 1.5 65.3 CM47 76.3 0.1 12.1 0.8 0.0 0.0 0.3 4.3 4.6 0.0 1270 1.4 237.0 9.9 0.4 0.7 5.0 139.7 96.6 0.1 -9.4 12.0 29.4 3.7 66.9 CM48 76.2 0.1 12.0 1.1 0.1 0.0 0.2 4.6 4.5 0.0 1268 1.8 234.4 13.4 0.8 0.5 3.0 147.1 95.1 0.1 -13.9 15.6 27.6 5.1 67.3 dike
CM20 71.5 0.4 14.4 1.9 0.1 0.2 0.3 4.1 5.4 0.1 1189 4.6 283.2 23.2 0.8 5.2 5.2 132.6 113.8 0.7 26.5 33.0 30.3 -0.3 70.0
Taohuadao granite (Zhao J.l et al., 2016 Lithos 240 16-30)
12THD-1 78.5 0.1 11.6 1.1 0.1 0.2 0.2 4.3 4.3 0.0 1306 1.3 226.6 1.0 1.1 5.5 3.6 137.8 90.9 0.1 -9.2 7.7 32.7 3.0 64.3 12THD-4 78.2 0.1 11.8 0.9 0.0 0.2 0.1 4.3 4.5 0.0 1301 1.5 232.1 0.5 0.6 4.7 1.4 137.5 96.2 0.1 -4.4 6.7 32.8 1.9 65.3 T-1* 77.8 0.1 11.4 1.7 0.1 0.1 0.5 4.1 4.3 0.0 1295 1.1 223.2 1.4 1.6 2.0 8.7 131.0 91.7 0.1 -17.0 4.5 31.3 4.1 64.6 T-3* 76.5 0.1 11.5 1.7 0.1 0.1 0.5 4.3 4.4 0.0 1273 1.5 225.4 1.5 1.7 1.7 9.3 137.5 92.8 0.1 -23.4 4.7 27.6 5.4 66.9 T-9* 77.0 0.1 11.6 1.7 0.1 0.1 0.5 3.8 4.7 0.0 1281 1.4 227.1 1.8 2.0 2.0 8.7 122.6 100.4 0.1 -13.4 5.1 31.4 3.5 65.1 T-10* 77.0 0.1 11.5 1.8 0.1 0.0 0.4 4.7 4.4 0.0 1281 1.1 226.2 1.6 1.8 0.2 6.2 153.0 94.1 0.1 -33.3 3.0 23.3 7.1 69.6
Taohuadao aeg-granite (Gao Y.y 2015 PhD dissertation)
09YY118 78.1 0.2 12.1 0.9 0.0 0.1 0.1 4.1 4.5 0.0 1299 2.0 237.0 12.0 0.3 1.7 1.4 133.3 96.0 0.0 4.9 15.7 35.1 1.4 63.5 09YY119 77.8 0.2 12.0 1.3 0.0 0.1 0.1 4.3 4.2 0.0 1294 2.1 234.4 17.8 0.6 2.5 1.6 139.1 88.3 0.0 3.8 22.4 34.9 2.6 62.4 09YY120 77.8 0.1 11.9 1.1 0.1 0.1 0.2 4.2 4.4 0.0 1294 1.8 234.0 15.4 1.0 1.7 2.7 136.8 94.3 0.0 -2.4 18.9 33.0 3.3 63.7 09YY121 77.5 0.2 11.8 1.2 0.2 0.1 0.3 4.2 4.4 0.0 1290 1.9 231.7 16.1 2.8 1.7 5.0 136.2 93.2 0.0 -7.7 19.7 31.8 4.5 63.7 09YY122 77.5 0.1 12.2 0.9 0.1 0.1 0.2 4.6 4.2 0.0 1289 1.8 238.3 13.1 0.7 2.0 4.3 147.5 89.2 0.0 -6.9 16.8 30.6 3.9 65.5 09YY125 77.6 0.2 11.8 1.1 0.0 0.3 0.2 4.3 4.2 0.0 1291 2.0 231.5 15.8 0.4 6.9 4.1 137.8 89.2 0.0 -3.7 24.8 33.1 4.4 62.4 09YY126 77.0 0.2 12.0 1.2 0.1 0.1 0.2 4.5 4.5 0.0 1281 2.0 235.6 16.4 1.1 3.5 4.1 144.6 96.4 0.0 -13.5 21.9 28.2 5.9 65.9 09YY127 76.8 0.2 12.0 1.2 0.1 0.3 0.2 4.5 4.5 0.0 1277 2.1 235.6 16.4 1.1 6.7 4.3 145.9 96.4 0.0 -15.2 25.2 27.4 6.8 65.9 09YY128 77.4 0.2 12.2 1.1 0.1 0.1 0.1 4.4 4.5 0.0 1288 1.9 238.3 14.6 1.3 2.2 1.4 142.0 96.0 0.0 -2.5 18.7 31.5 3.3 65.2 09YY129 77.4 0.2 12.2 1.1 0.1 0.1 0.1 4.4 4.5 0.0 1287 2.4 239.7 15.3 0.7 2.2 2.1 140.7 95.3 0.0 -0.6 19.9 32.1 3.1 64.8 09YY130 78.0 0.1 11.9 1.2 0.0 0.1 0.2 3.8 4.4 0.0 1299 1.5 233.0 16.4 0.3 3.0 2.9 123.3 92.4 0.0 11.7 20.9 38.8 0.8 60.4 09YY131 78.0 0.1 11.9 1.2 0.0 0.1 0.2 3.8 4.3 0.0 1298 1.6 233.8 16.4 0.1 3.2 2.9 123.6 92.1 0.0 12.4 21.3 38.8 0.8 60.4 09YY132 75.2 0.1 13.8 1.0 0.1 0.3 0.3 3.2 5.5 0.0 1252 1.6 269.9 13.9 1.0 7.9 4.6 102.0 116.1 0.1 42.5 23.5 41.7 -4.9 63.2 09YY146 76.5 0.1 12.4 1.2 0.2 0.1 0.3 4.7 4.5 0.0 1273 1.6 243.2 16.3 2.3 2.5 4.5 151.0 95.8 0.0 -12.5 20.4 26.8 5.5 67.7 09YY147 78.1 0.1 12.0 1.0 0.0 0.1 0.1 3.2 4.7 0.0 1300 1.8 234.4 14.0 0.1 2.5 1.6 103.9 100.2 0.0 27.1 18.3 44.3 -2.6 58.3 09YY148 78.0 0.1 12.0 1.0 0.0 0.1 0.2 3.9 4.3 0.0 1299 1.5 235.4 14.3 0.3 2.5 3.7 127.1 91.5 0.0 9.3 18.3 37.6 0.9 61.5 09YY149 78.2 0.1 11.9 0.9 0.0 0.1 0.3 4.0 4.3 0.0 1301 1.5 233.0 13.1 0.1 2.0 4.5 127.5 91.1 0.0 5.6 16.6 37.0 1.4 61.6 09YY150 78.0 0.1 11.9 1.0 0.0 0.1 0.2 4.0 4.4 0.0 1298 1.5 233.8 14.5 0.3 2.2 3.7 129.4 93.4 0.0 3.5 18.2 35.7 2.0 62.2 09YY151 77.7 0.1 11.9 1.2 0.0 0.1 0.2 4.3 4.2 0.0 1293 1.4 233.8 17.2 0.3 2.0 4.1 137.1 90.0 0.0 -1.5 20.6 33.6 3.4 63.0 09YY152 77.8 0.1 11.7 1.5 0.0 0.1 0.4 4.2 4.2 0.0 1294 1.8 229.9 20.6 0.1 1.2 6.6 133.9 88.5 0.0 -5.8 23.6 33.4 4.7 61.9 09YY153 74.9 0.2 13.1 1.0 0.0 0.1 0.4 3.6 6.4 0.0 1246 2.6 257.7 14.0 0.1 2.5 6.4 116.8 136.5 0.1 -8.4 19.1 24.9 4.5 70.6 09YY154 77.7 0.1 12.0 0.9 0.3 0.3 0.1 4.3 4.3 0.0 1293 1.5 234.8 12.0 4.8 7.6 2.5 138.4 91.9 0.0 -0.6 21.1 33.4 3.3 63.4
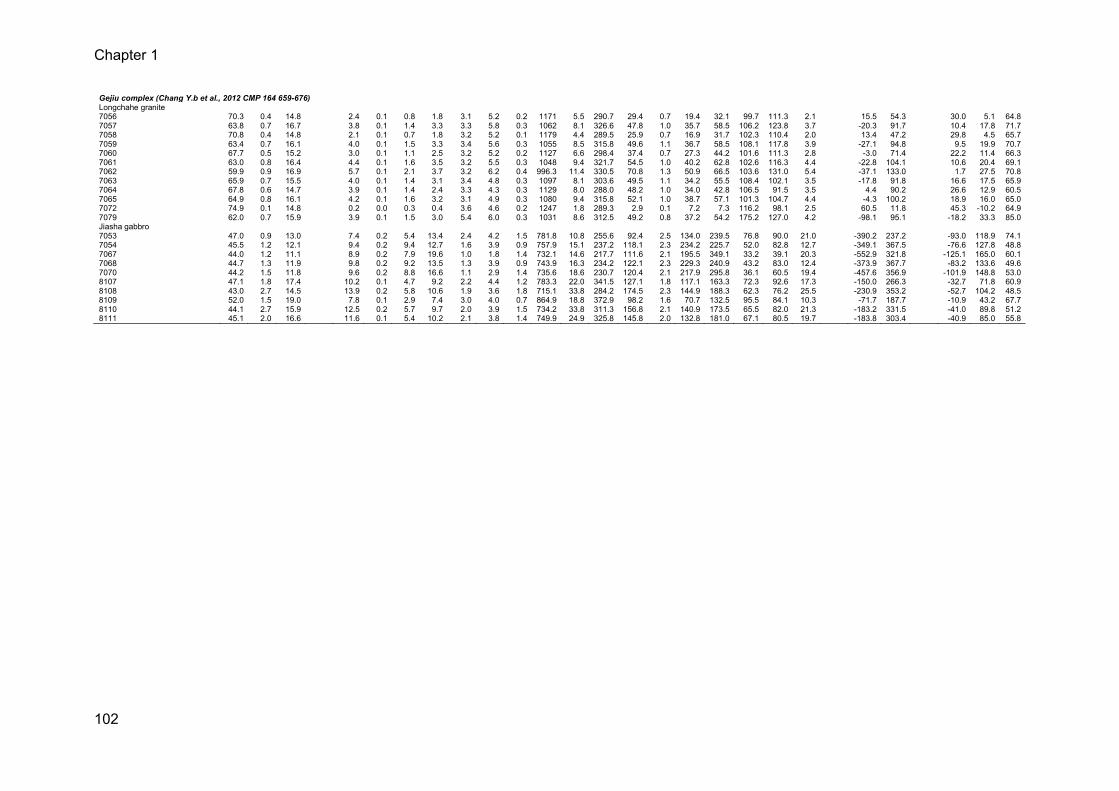
Chapter 1
102
Gejiu complex (Chang Y.b et al., 2012 CMP 164 659-676)
Longchahe granite
7056 70.3 0.4 14.8 2.4 0.1 0.8 1.8 3.1 5.2 0.2 1171 5.5 290.7 29.4 0.7 19.4 32.1 99.7 111.3 2.1 15.5 54.3 30.0 5.1 64.8 7057 63.8 0.7 16.7 3.8 0.1 1.4 3.3 3.3 5.8 0.3 1062 8.1 326.6 47.8 1.0 35.7 58.5 106.2 123.8 3.7 -20.3 91.7 10.4 17.8 71.7 7058 70.8 0.4 14.8 2.1 0.1 0.7 1.8 3.2 5.2 0.1 1179 4.4 289.5 25.9 0.7 16.9 31.7 102.3 110.4 2.0 13.4 47.2 29.8 4.5 65.7 7059 63.4 0.7 16.1 4.0 0.1 1.5 3.3 3.4 5.6 0.3 1055 8.5 315.8 49.6 1.1 36.7 58.5 108.1 117.8 3.9 -27.1 94.8 9.5 19.9 70.7 7060 67.7 0.5 15.2 3.0 0.1 1.1 2.5 3.2 5.2 0.2 1127 6.6 298.4 37.4 0.7 27.3 44.2 101.6 111.3 2.8 -3.0 71.4 22.2 11.4 66.3 7061 63.0 0.8 16.4 4.4 0.1 1.6 3.5 3.2 5.5 0.3 1048 9.4 321.7 54.5 1.0 40.2 62.8 102.6 116.3 4.4 -22.8 104.1 10.6 20.4 69.1 7062 59.9 0.9 16.9 5.7 0.1 2.1 3.7 3.2 6.2 0.4 996.3 11.4 330.5 70.8 1.3 50.9 66.5 103.6 131.0 5.4 -37.1 133.0 1.7 27.5 70.8 7063 65.9 0.7 15.5 4.0 0.1 1.4 3.1 3.4 4.8 0.3 1097 8.1 303.6 49.5 1.1 34.2 55.5 108.4 102.1 3.5 -17.8 91.8 16.6 17.5 65.9 7064 67.8 0.6 14.7 3.9 0.1 1.4 2.4 3.3 4.3 0.3 1129 8.0 288.0 48.2 1.0 34.0 42.8 106.5 91.5 3.5 4.4 90.2 26.6 12.9 60.5 7065 64.9 0.8 16.1 4.2 0.1 1.6 3.2 3.1 4.9 0.3 1080 9.4 315.8 52.1 1.0 38.7 57.1 101.3 104.7 4.4 -4.3 100.2 18.9 16.0 65.0 7072 74.9 0.1 14.8 0.2 0.0 0.3 0.4 3.6 4.6 0.2 1247 1.8 289.3 2.9 0.1 7.2 7.3 116.2 98.1 2.5 60.5 11.8 45.3 -10.2 64.9 7079 62.0 0.7 15.9 3.9 0.1 1.5 3.0 5.4 6.0 0.3 1031 8.6 312.5 49.2 0.8 37.2 54.2 175.2 127.0 4.2 -98.1 95.1 -18.2 33.3 85.0 Jiasha gabbro
7053 47.0 0.9 13.0 7.4 0.2 5.4 13.4 2.4 4.2 1.5 781.8 10.8 255.6 92.4 2.5 134.0 239.5 76.8 90.0 21.0 -390.2 237.2 -93.0 118.9 74.1 7054 45.5 1.2 12.1 9.4 0.2 9.4 12.7 1.6 3.9 0.9 757.9 15.1 237.2 118.1 2.3 234.2 225.7 52.0 82.8 12.7 -349.1 367.5 -76.6 127.8 48.8 7067 44.0 1.2 11.1 8.9 0.2 7.9 19.6 1.0 1.8 1.4 732.1 14.6 217.7 111.6 2.1 195.5 349.1 33.2 39.1 20.3 -552.9 321.8 -125.1 165.0 60.1 7068 44.7 1.3 11.9 9.8 0.2 9.2 13.5 1.3 3.9 0.9 743.9 16.3 234.2 122.1 2.3 229.3 240.9 43.2 83.0 12.4 -373.9 367.7 -83.2 133.6 49.6 7070 44.2 1.5 11.8 9.6 0.2 8.8 16.6 1.1 2.9 1.4 735.6 18.6 230.7 120.4 2.1 217.9 295.8 36.1 60.5 19.4 -457.6 356.9 -101.9 148.8 53.0 8107 47.1 1.8 17.4 10.2 0.1 4.7 9.2 2.2 4.4 1.2 783.3 22.0 341.5 127.1 1.8 117.1 163.3 72.3 92.6 17.3 -150.0 266.3 -32.7 71.8 60.9 8108 43.0 2.7 14.5 13.9 0.2 5.8 10.6 1.9 3.6 1.8 715.1 33.8 284.2 174.5 2.3 144.9 188.3 62.3 76.2 25.5 -230.9 353.2 -52.7 104.2 48.5 8109 52.0 1.5 19.0 7.8 0.1 2.9 7.4 3.0 4.0 0.7 864.9 18.8 372.9 98.2 1.6 70.7 132.5 95.5 84.1 10.3 -71.7 187.7 -10.9 43.2 67.7 8110 44.1 2.7 15.9 12.5 0.2 5.7 9.7 2.0 3.9 1.5 734.2 33.8 311.3 156.8 2.1 140.9 173.5 65.5 82.0 21.3 -183.2 331.5 -41.0 89.8 51.2 8111 45.1 2.0 16.6 11.6 0.1 5.4 10.2 2.1 3.8 1.4 749.9 24.9 325.8 145.8 2.0 132.8 181.0 67.1 80.5 19.7 -183.8 303.4 -40.9 85.0 55.8
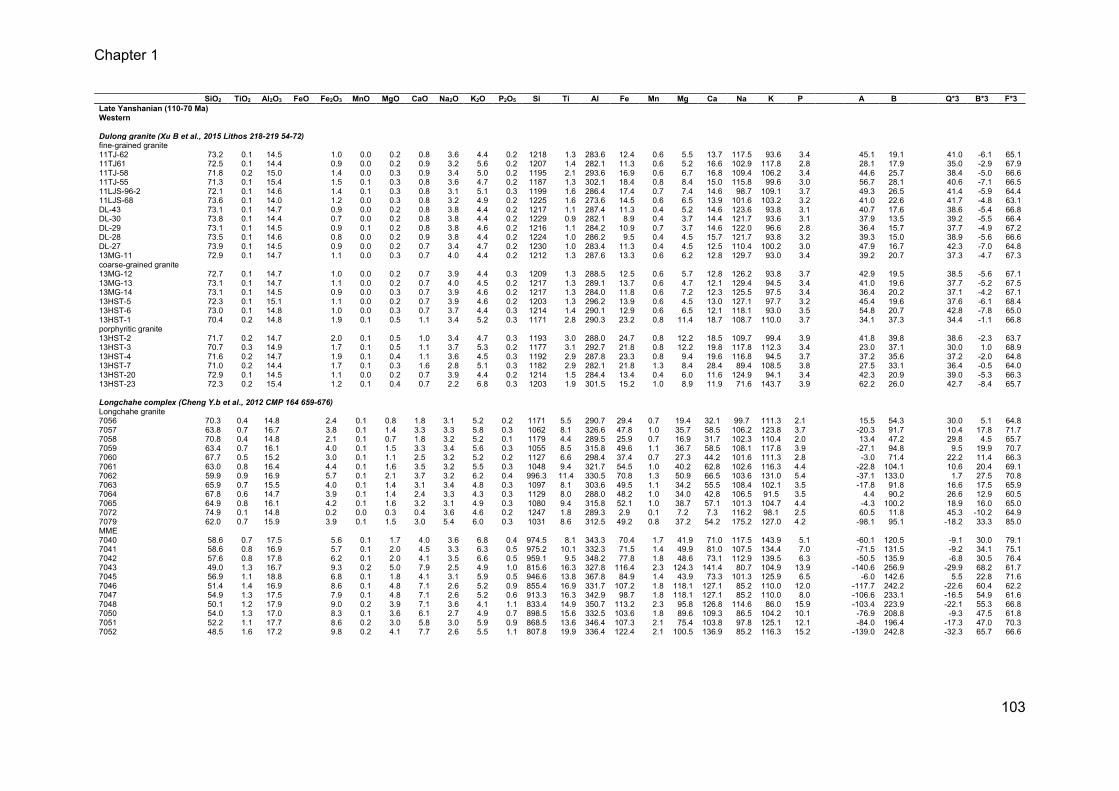
Chapter 1
103
SiO2 TiO2 Al2O3 FeO Fe2O3 MnO MgO CaO Na2O K2O P2O5 Si Ti Al Fe Mn Mg Ca Na K P A B Q*3 B*3 F*3 Late Yanshanian (110-70 Ma)
Western
Dulong granite (Xu B et al., 2015 Lithos 218-219 54-72)
fine-grained granite
11TJ-62 73.2 0.1 14.5 1.0 0.0 0.2 0.8 3.6 4.4 0.2 1218 1.3 283.6 12.4 0.6 5.5 13.7 117.5 93.6 3.4 45.1 19.1 41.0 -6.1 65.1 11TJ61 72.5 0.1 14.4 0.9 0.0 0.2 0.9 3.2 5.6 0.2 1207 1.4 282.1 11.3 0.6 5.2 16.6 102.9 117.8 2.8 28.1 17.9 35.0 -2.9 67.9 11TJ-58 71.8 0.2 15.0 1.4 0.0 0.3 0.9 3.4 5.0 0.2 1195 2.1 293.6 16.9 0.6 6.7 16.8 109.4 106.2 3.4 44.6 25.7 38.4 -5.0 66.6 11TJ-55 71.3 0.1 15.4 1.5 0.1 0.3 0.8 3.6 4.7 0.2 1187 1.3 302.1 18.4 0.8 8.4 15.0 115.8 99.6 3.0 56.7 28.1 40.6 -7.1 66.5 11LJS-96-2 72.1 0.1 14.6 1.4 0.1 0.3 0.8 3.1 5.1 0.3 1199 1.6 286.4 17.4 0.7 7.4 14.6 98.7 109.1 3.7 49.3 26.5 41.4 -5.9 64.4 11LJS-68 73.6 0.1 14.0 1.2 0.0 0.3 0.8 3.2 4.9 0.2 1225 1.6 273.6 14.5 0.6 6.5 13.9 101.6 103.2 3.2 41.0 22.6 41.7 -4.8 63.1 DL-43 73.1 0.1 14.7 0.9 0.0 0.2 0.8 3.8 4.4 0.2 1217 1.1 287.4 11.3 0.4 5.2 14.6 123.6 93.8 3.1 40.7 17.6 38.6 -5.4 66.8 DL-30 73.8 0.1 14.4 0.7 0.0 0.2 0.8 3.8 4.4 0.2 1229 0.9 282.1 8.9 0.4 3.7 14.4 121.7 93.6 3.1 37.9 13.5 39.2 -5.5 66.4 DL-29 73.1 0.1 14.5 0.9 0.1 0.2 0.8 3.8 4.6 0.2 1216 1.1 284.2 10.9 0.7 3.7 14.6 122.0 96.6 2.8 36.4 15.7 37.7 -4.9 67.2 DL-28 73.5 0.1 14.6 0.8 0.0 0.2 0.9 3.8 4.4 0.2 1224 1.0 286.2 9.5 0.4 4.5 15.7 121.7 93.8 3.2 39.3 15.0 38.9 -5.6 66.6 DL-27 73.9 0.1 14.5 0.9 0.0 0.2 0.7 3.4 4.7 0.2 1230 1.0 283.4 11.3 0.4 4.5 12.5 110.4 100.2 3.0 47.9 16.7 42.3 -7.0 64.8 13MG-11 72.9 0.1 14.7 1.1 0.0 0.3 0.7 4.0 4.4 0.2 1212 1.3 287.6 13.3 0.6 6.2 12.8 129.7 93.0 3.4 39.2 20.7 37.3 -4.7 67.3 coarse-grained granite
13MG-12 72.7 0.1 14.7 1.0 0.0 0.2 0.7 3.9 4.4 0.3 1209 1.3 288.5 12.5 0.6 5.7 12.8 126.2 93.8 3.7 42.9 19.5 38.5 -5.6 67.1 13MG-13 73.1 0.1 14.7 1.1 0.0 0.2 0.7 4.0 4.5 0.2 1217 1.3 289.1 13.7 0.6 4.7 12.1 129.4 94.5 3.4 41.0 19.6 37.7 -5.2 67.5 13MG-14 73.1 0.1 14.5 0.9 0.0 0.3 0.7 3.9 4.6 0.2 1217 1.3 284.0 11.8 0.6 7.2 12.3 125.5 97.5 3.4 36.4 20.2 37.1 -4.2 67.1 13HST-5 72.3 0.1 15.1 1.1 0.0 0.2 0.7 3.9 4.6 0.2 1203 1.3 296.2 13.9 0.6 4.5 13.0 127.1 97.7 3.2 45.4 19.6 37.6 -6.1 68.4 13HST-6 73.0 0.1 14.8 1.0 0.0 0.3 0.7 3.7 4.4 0.3 1214 1.4 290.1 12.9 0.6 6.5 12.1 118.1 93.0 3.5 54.8 20.7 42.8 -7.8 65.0 13HST-1 70.4 0.2 14.8 1.9 0.1 0.5 1.1 3.4 5.2 0.3 1171 2.8 290.3 23.2 0.8 11.4 18.7 108.7 110.0 3.7 34.1 37.3 34.4 -1.1 66.8 porphyritic granite
13HST-2 71.7 0.2 14.7 2.0 0.1 0.5 1.0 3.4 4.7 0.3 1193 3.0 288.0 24.7 0.8 12.2 18.5 109.7 99.4 3.9 41.8 39.8 38.6 -2.3 63.7 13HST-3 70.7 0.3 14.9 1.7 0.1 0.5 1.1 3.7 5.3 0.2 1177 3.1 292.7 21.8 0.8 12.2 19.8 117.8 112.3 3.4 23.0 37.1 30.0 1.0 68.9 13HST-4 71.6 0.2 14.7 1.9 0.1 0.4 1.1 3.6 4.5 0.3 1192 2.9 287.8 23.3 0.8 9.4 19.6 116.8 94.5 3.7 37.2 35.6 37.2 -2.0 64.8 13HST-7 71.0 0.2 14.4 1.7 0.1 0.3 1.6 2.8 5.1 0.3 1182 2.9 282.1 21.8 1.3 8.4 28.4 89.4 108.5 3.8 27.5 33.1 36.4 -0.5 64.0 13HST-20 72.9 0.1 14.5 1.1 0.0 0.2 0.7 3.9 4.4 0.2 1214 1.5 284.4 13.4 0.4 6.0 11.6 124.9 94.1 3.4 42.3 20.9 39.0 -5.3 66.3 13HST-23 72.3 0.2 15.4 1.2 0.1 0.4 0.7 2.2 6.8 0.3 1203 1.9 301.5 15.2 1.0 8.9 11.9 71.6 143.7 3.9 62.2 26.0 42.7 -8.4 65.7
Longchahe complex (Cheng Y.b et al., 2012 CMP 164 659-676)
Longchahe granite
7056 70.3 0.4 14.8 2.4 0.1 0.8 1.8 3.1 5.2 0.2 1171 5.5 290.7 29.4 0.7 19.4 32.1 99.7 111.3 2.1 15.5 54.3 30.0 5.1 64.8 7057 63.8 0.7 16.7 3.8 0.1 1.4 3.3 3.3 5.8 0.3 1062 8.1 326.6 47.8 1.0 35.7 58.5 106.2 123.8 3.7 -20.3 91.7 10.4 17.8 71.7 7058 70.8 0.4 14.8 2.1 0.1 0.7 1.8 3.2 5.2 0.1 1179 4.4 289.5 25.9 0.7 16.9 31.7 102.3 110.4 2.0 13.4 47.2 29.8 4.5 65.7 7059 63.4 0.7 16.1 4.0 0.1 1.5 3.3 3.4 5.6 0.3 1055 8.5 315.8 49.6 1.1 36.7 58.5 108.1 117.8 3.9 -27.1 94.8 9.5 19.9 70.7 7060 67.7 0.5 15.2 3.0 0.1 1.1 2.5 3.2 5.2 0.2 1127 6.6 298.4 37.4 0.7 27.3 44.2 101.6 111.3 2.8 -3.0 71.4 22.2 11.4 66.3 7061 63.0 0.8 16.4 4.4 0.1 1.6 3.5 3.2 5.5 0.3 1048 9.4 321.7 54.5 1.0 40.2 62.8 102.6 116.3 4.4 -22.8 104.1 10.6 20.4 69.1 7062 59.9 0.9 16.9 5.7 0.1 2.1 3.7 3.2 6.2 0.4 996.3 11.4 330.5 70.8 1.3 50.9 66.5 103.6 131.0 5.4 -37.1 133.0 1.7 27.5 70.8 7063 65.9 0.7 15.5 4.0 0.1 1.4 3.1 3.4 4.8 0.3 1097 8.1 303.6 49.5 1.1 34.2 55.5 108.4 102.1 3.5 -17.8 91.8 16.6 17.5 65.9 7064 67.8 0.6 14.7 3.9 0.1 1.4 2.4 3.3 4.3 0.3 1129 8.0 288.0 48.2 1.0 34.0 42.8 106.5 91.5 3.5 4.4 90.2 26.6 12.9 60.5 7065 64.9 0.8 16.1 4.2 0.1 1.6 3.2 3.1 4.9 0.3 1080 9.4 315.8 52.1 1.0 38.7 57.1 101.3 104.7 4.4 -4.3 100.2 18.9 16.0 65.0 7072 74.9 0.1 14.8 0.2 0.0 0.3 0.4 3.6 4.6 0.2 1247 1.8 289.3 2.9 0.1 7.2 7.3 116.2 98.1 2.5 60.5 11.8 45.3 -10.2 64.9 7079 62.0 0.7 15.9 3.9 0.1 1.5 3.0 5.4 6.0 0.3 1031 8.6 312.5 49.2 0.8 37.2 54.2 175.2 127.0 4.2 -98.1 95.1 -18.2 33.3 85.0 MME
7040 58.6 0.7 17.5 5.6 0.1 1.7 4.0 3.6 6.8 0.4 974.5 8.1 343.3 70.4 1.7 41.9 71.0 117.5 143.9 5.1 -60.1 120.5 -9.1 30.0 79.1 7041 58.6 0.8 16.9 5.7 0.1 2.0 4.5 3.3 6.3 0.5 975.2 10.1 332.3 71.5 1.4 49.9 81.0 107.5 134.4 7.0 -71.5 131.5 -9.2 34.1 75.1 7042 57.6 0.8 17.8 6.2 0.1 2.0 4.1 3.5 6.6 0.5 959.1 9.5 348.2 77.8 1.8 48.6 73.1 112.9 139.5 6.3 -50.5 135.9 -6.8 30.5 76.4 7043 49.0 1.3 16.7 9.3 0.2 5.0 7.9 2.5 4.9 1.0 815.6 16.3 327.8 116.4 2.3 124.3 141.4 80.7 104.9 13.9 -140.6 256.9 -29.9 68.2 61.7 7045 56.9 1.1 18.8 6.8 0.1 1.8 4.1 3.1 5.9 0.5 946.6 13.8 367.8 84.9 1.4 43.9 73.3 101.3 125.9 6.5 -6.0 142.6 5.5 22.8 71.6 7046 51.4 1.4 16.9 8.6 0.1 4.8 7.1 2.6 5.2 0.9 855.4 16.9 331.7 107.2 1.8 118.1 127.1 85.2 110.0 12.0 -117.7 242.2 -22.6 60.4 62.2 7047 54.9 1.3 17.5 7.9 0.1 4.8 7.1 2.6 5.2 0.6 913.3 16.3 342.9 98.7 1.8 118.1 127.1 85.2 110.0 8.0 -106.6 233.1 -16.5 54.9 61.6 7048 50.1 1.2 17.9 9.0 0.2 3.9 7.1 3.6 4.1 1.1 833.4 14.9 350.7 113.2 2.3 95.8 126.8 114.6 86.0 15.9 -103.4 223.9 -22.1 55.3 66.8 7050 54.0 1.3 17.0 8.3 0.1 3.6 6.1 2.7 4.9 0.7 898.5 15.6 332.5 103.6 1.8 89.6 109.3 86.5 104.2 10.1 -76.9 208.8 -9.3 47.5 61.8 7051 52.2 1.1 17.7 8.6 0.2 3.0 5.8 3.0 5.9 0.9 868.5 13.6 346.4 107.3 2.1 75.4 103.8 97.8 125.1 12.1 -84.0 196.4 -17.3 47.0 70.3 7052 48.5 1.6 17.2 9.8 0.2 4.1 7.7 2.6 5.5 1.1 807.8 19.9 336.4 122.4 2.1 100.5 136.9 85.2 116.3 15.2 -139.0 242.8 -32.3 65.7 66.6
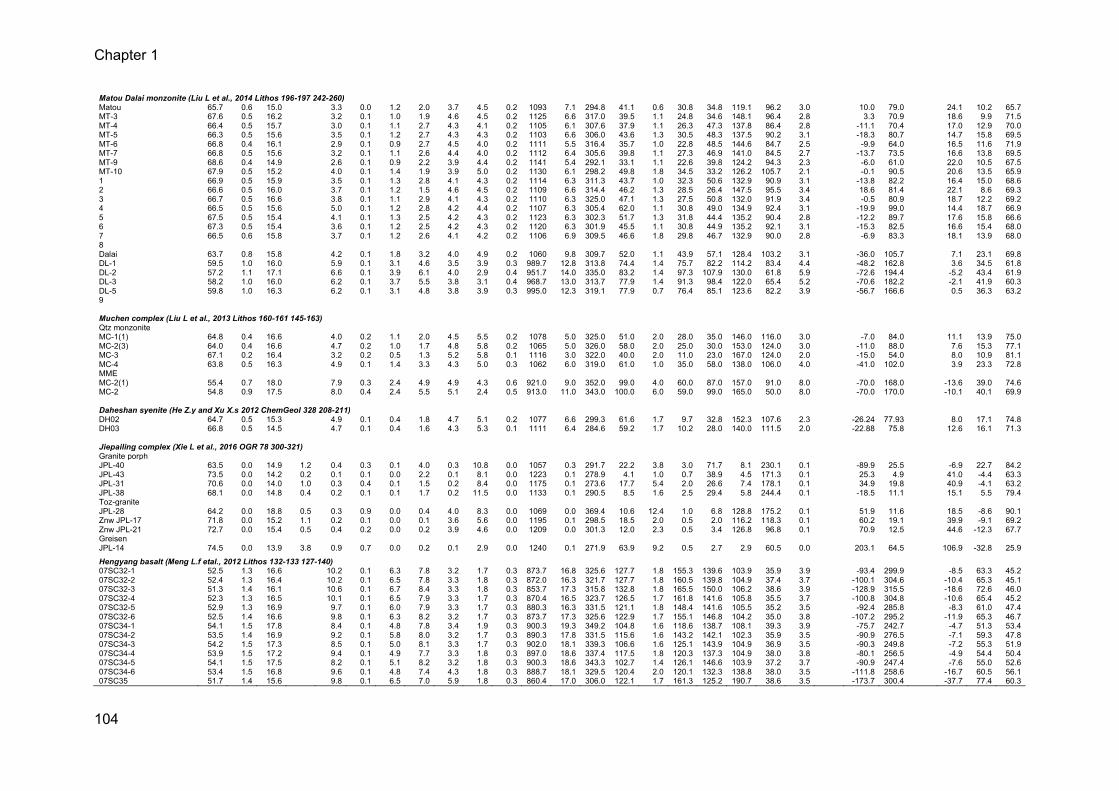
Chapter 1
104
Matou Dalai monzonite (Liu L et al., 2014 Lithos 196-197 242-260)
Matou 65.7 0.6 15.0 3.3 0.0 1.2 2.0 3.7 4.5 0.2 1093 7.1 294.8 41.1 0.6 30.8 34.8 119.1 96.2 3.0 10.0 79.0 24.1 10.2 65.7 MT-3 67.6 0.5 16.2 3.2 0.1 1.0 1.9 4.6 4.5 0.2 1125 6.6 317.0 39.5 1.1 24.8 34.6 148.1 96.4 2.8 3.3 70.9 18.6 9.9 71.5 MT-4 66.4 0.5 15.7 3.0 0.1 1.1 2.7 4.3 4.1 0.2 1105 6.1 307.6 37.9 1.1 26.3 47.3 137.8 86.4 2.8 -11.1 70.4 17.0 12.9 70.0 MT-5 66.3 0.5 15.6 3.5 0.1 1.2 2.7 4.3 4.3 0.2 1103 6.6 306.0 43.6 1.3 30.5 48.3 137.5 90.2 3.1 -18.3 80.7 14.7 15.8 69.5 MT-6 66.8 0.4 16.1 2.9 0.1 0.9 2.7 4.5 4.0 0.2 1111 5.5 316.4 35.7 1.0 22.8 48.5 144.6 84.7 2.5 -9.9 64.0 16.5 11.6 71.9 MT-7 66.8 0.5 15.6 3.2 0.1 1.1 2.6 4.4 4.0 0.2 1112 6.4 305.6 39.8 1.1 27.3 46.9 141.0 84.5 2.7 -13.7 73.5 16.6 13.8 69.5 MT-9 68.6 0.4 14.9 2.6 0.1 0.9 2.2 3.9 4.4 0.2 1141 5.4 292.1 33.1 1.1 22.6 39.8 124.2 94.3 2.3 -6.0 61.0 22.0 10.5 67.5 MT-10 67.9 0.5 15.2 4.0 0.1 1.4 1.9 3.9 5.0 0.2 1130 6.1 298.2 49.8 1.8 34.5 33.2 126.2 105.7 2.1 -0.1 90.5 20.6 13.5 65.9 1 66.9 0.5 15.9 3.5 0.1 1.3 2.8 4.1 4.3 0.2 1114 6.3 311.3 43.7 1.0 32.3 50.6 132.9 90.9 3.1 -13.8 82.2 16.4 15.0 68.6 2 66.6 0.5 16.0 3.7 0.1 1.2 1.5 4.6 4.5 0.2 1109 6.6 314.4 46.2 1.3 28.5 26.4 147.5 95.5 3.4 18.6 81.4 22.1 8.6 69.3 3 66.7 0.5 16.6 3.8 0.1 1.1 2.9 4.1 4.3 0.2 1110 6.3 325.0 47.1 1.3 27.5 50.8 132.0 91.9 3.4 -0.5 80.9 18.7 12.2 69.2 4 66.5 0.5 15.6 5.0 0.1 1.2 2.8 4.2 4.4 0.2 1107 6.3 305.4 62.0 1.1 30.8 49.0 134.9 92.4 3.1 -19.9 99.0 14.4 18.7 66.9 5 67.5 0.5 15.4 4.1 0.1 1.3 2.5 4.2 4.3 0.2 1123 6.3 302.3 51.7 1.3 31.8 44.4 135.2 90.4 2.8 -12.2 89.7 17.6 15.8 66.6 6 67.3 0.5 15.4 3.6 0.1 1.2 2.5 4.2 4.3 0.2 1120 6.3 301.9 45.5 1.1 30.8 44.9 135.2 92.1 3.1 -15.3 82.5 16.6 15.4 68.0 7 66.5 0.6 15.8 3.7 0.1 1.2 2.6 4.1 4.2 0.2 1106 6.9 309.5 46.6 1.8 29.8 46.7 132.9 90.0 2.8 -6.9 83.3 18.1 13.9 68.0 8
Dalai 63.7 0.8 15.8 4.2 0.1 1.8 3.2 4.0 4.9 0.2 1060 9.8 309.7 52.0 1.1 43.9 57.1 128.4 103.2 3.1 -36.0 105.7 7.1 23.1 69.8 DL-1 59.5 1.0 16.0 5.9 0.1 3.1 4.6 3.5 3.9 0.3 989.7 12.8 313.8 74.4 1.4 75.7 82.2 114.2 83.4 4.4 -48.2 162.8 3.6 34.5 61.8 DL-2 57.2 1.1 17.1 6.6 0.1 3.9 6.1 4.0 2.9 0.4 951.7 14.0 335.0 83.2 1.4 97.3 107.9 130.0 61.8 5.9 -72.6 194.4 -5.2 43.4 61.9 DL-3 58.2 1.0 16.0 6.2 0.1 3.7 5.5 3.8 3.1 0.4 968.7 13.0 313.7 77.9 1.4 91.3 98.4 122.0 65.4 5.2 -70.6 182.2 -2.1 41.9 60.3 DL-5 59.8 1.0 16.3 6.2 0.1 3.1 4.8 3.8 3.9 0.3 995.0 12.3 319.1 77.9 0.7 76.4 85.1 123.6 82.2 3.9 -56.7 166.6 0.5 36.3 63.2 9
Muchen complex (Liu L et al., 2013 Lithos 160-161 145-163)
Qtz monzonite
MC-1(1) 64.8 0.4 16.6 4.0 0.2 1.1 2.0 4.5 5.5 0.2 1078 5.0 325.0 51.0 2.0 28.0 35.0 146.0 116.0 3.0 -7.0 84.0 11.1 13.9 75.0 MC-2(3) 64.0 0.4 16.6 4.7 0.2 1.0 1.7 4.8 5.8 0.2 1065 5.0 326.0 58.0 2.0 25.0 30.0 153.0 124.0 3.0 -11.0 88.0 7.6 15.3 77.1 MC-3 67.1 0.2 16.4 3.2 0.2 0.5 1.3 5.2 5.8 0.1 1116 3.0 322.0 40.0 2.0 11.0 23.0 167.0 124.0 2.0 -15.0 54.0 8.0 10.9 81.1 MC-4 63.8 0.5 16.3 4.9 0.1 1.4 3.3 4.3 5.0 0.3 1062 6.0 319.0 61.0 1.0 35.0 58.0 138.0 106.0 4.0 -41.0 102.0 3.9 23.3 72.8 MME
MC-2(1) 55.4 0.7 18.0 7.9 0.3 2.4 4.9 4.9 4.3 0.6 921.0 9.0 352.0 99.0 4.0 60.0 87.0 157.0 91.0 8.0 -70.0 168.0 -13.6 39.0 74.6 MC-2 54.8 0.9 17.5 8.0 0.4 2.4 5.5 5.1 2.4 0.5 913.0 11.0 343.0 100.0 6.0 59.0 99.0 165.0 50.0 8.0 -70.0 170.0 -10.1 40.1 69.9
Daheshan syenite (He Z.y and Xu X.s 2012 ChemGeol 328 208-211)
DH02 64.7 0.5 15.3 4.9 0.1 0.4 1.8 4.7 5.1 0.2 1077 6.6 299.3 61.6 1.7 9.7 32.8 152.3 107.6 2.3 -26.24 77.93 8.0 17.1 74.8 DH03 66.8 0.5 14.5 4.7 0.1 0.4 1.6 4.3 5.3 0.1 1111 6.4 284.6 59.2 1.7 10.2 28.0 140.0 111.5 2.0 -22.88 75.8 12.6 16.1 71.3
Jiepailing complex (Xie L et al., 2016 OGR 78 300-321)
Granite porph
JPL-40 63.5 0.0 14.9 1.2 0.4 0.3 0.1 4.0 0.3 10.8 0.0 1057 0.3 291.7 22.2 3.8 3.0 71.7 8.1 230.1 0.1 -89.9 25.5 -6.9 22.7 84.2 JPL-43 73.5 0.0 14.2 0.2 0.1 0.1 0.0 2.2 0.1 8.1 0.0 1223 0.1 278.9 4.1 1.0 0.7 38.9 4.5 171.3 0.1 25.3 4.9 41.0 -4.4 63.3 JPL-31 70.6 0.0 14.0 1.0 0.3 0.4 0.1 1.5 0.2 8.4 0.0 1175 0.1 273.6 17.7 5.4 2.0 26.6 7.4 178.1 0.1 34.9 19.8 40.9 -4.1 63.2 JPL-38 68.1 0.0 14.8 0.4 0.2 0.1 0.1 1.7 0.2 11.5 0.0 1133 0.1 290.5 8.5 1.6 2.5 29.4 5.8 244.4 0.1 -18.5 11.1 15.1 5.5 79.4 Toz-granite
JPL-28 64.2 0.0 18.8 0.5 0.3 0.9 0.0 0.4 4.0 8.3 0.0 1069 0.0 369.4 10.6 12.4 1.0 6.8 128.8 175.2 0.1 51.9 11.6 18.5 -8.6 90.1 Znw JPL-17 71.8 0.0 15.2 1.1 0.2 0.1 0.0 0.1 3.6 5.6 0.0 1195 0.1 298.5 18.5 2.0 0.5 2.0 116.2 118.3 0.1 60.2 19.1 39.9 -9.1 69.2 Znw JPL-21 72.7 0.0 15.4 0.5 0.4 0.2 0.0 0.2 3.9 4.6 0.0 1209 0.0 301.3 12.0 2.3 0.5 3.4 126.8 96.8 0.1 70.9 12.5 44.6 -12.3 67.7 Greisen
JPL-14 74.5 0.0 13.9 3.8 0.9 0.7 0.0 0.2 0.1 2.9 0.0 1240 0.1 271.9 63.9 9.2 0.5 2.7 2.9 60.5 0.0 203.1 64.5 106.9 -32.8 25.9
Hengyang basalt (Meng L.f etal., 2012 Lithos 132-133 127-140)
07SC32-1 52.5 1.3 16.6 10.2 0.1 6.3 7.8 3.2 1.7 0.3 873.7 16.8 325.6 127.7 1.8 155.3 139.6 103.9 35.9 3.9 -93.4 299.9 -8.5 63.3 45.2 07SC32-2 52.4 1.3 16.4 10.2 0.1 6.5 7.8 3.3 1.8 0.3 872.0 16.3 321.7 127.7 1.8 160.5 139.8 104.9 37.4 3.7 -100.1 304.6 -10.4 65.3 45.1 07SC32-3 51.3 1.4 16.1 10.6 0.1 6.7 8.4 3.3 1.8 0.3 853.7 17.3 315.8 132.8 1.8 165.5 150.0 106.2 38.6 3.9 -128.9 315.5 -18.6 72.6 46.0 07SC32-4 52.3 1.3 16.5 10.1 0.1 6.5 7.9 3.3 1.7 0.3 870.4 16.5 323.7 126.5 1.7 161.8 141.6 105.8 35.5 3.7 -100.8 304.8 -10.6 65.4 45.2 07SC32-5 52.9 1.3 16.9 9.7 0.1 6.0 7.9 3.3 1.7 0.3 880.3 16.3 331.5 121.1 1.8 148.4 141.6 105.5 35.2 3.5 -92.4 285.8 -8.3 61.0 47.4 07SC32-6 52.5 1.4 16.6 9.8 0.1 6.3 8.2 3.2 1.7 0.3 873.7 17.3 325.6 122.9 1.7 155.1 146.8 104.2 35.0 3.8 -107.2 295.2 -11.9 65.3 46.7 07SC34-1 54.1 1.5 17.8 8.4 0.1 4.8 7.8 3.4 1.9 0.3 900.3 19.3 349.2 104.8 1.6 118.6 138.7 108.1 39.3 3.9 -75.7 242.7 -4.7 51.3 53.4 07SC34-2 53.5 1.4 16.9 9.2 0.1 5.8 8.0 3.2 1.7 0.3 890.3 17.8 331.5 115.6 1.6 143.2 142.1 102.3 35.9 3.5 -90.9 276.5 -7.1 59.3 47.8 07SC34-3 54.2 1.5 17.3 8.5 0.1 5.0 8.1 3.3 1.7 0.3 902.0 18.1 339.3 106.6 1.6 125.1 143.9 104.9 36.9 3.5 -90.3 249.8 -7.2 55.3 51.9 07SC34-4 53.9 1.5 17.2 9.4 0.1 4.9 7.7 3.3 1.8 0.3 897.0 18.6 337.4 117.5 1.8 120.3 137.3 104.9 38.0 3.8 -80.1 256.5 -4.9 54.4 50.4 07SC34-5 54.1 1.5 17.5 8.2 0.1 5.1 8.2 3.2 1.8 0.3 900.3 18.6 343.3 102.7 1.4 126.1 146.6 103.9 37.2 3.7 -90.9 247.4 -7.6 55.0 52.6 07SC34-6 53.4 1.5 16.8 9.6 0.1 4.8 7.4 4.3 1.8 0.3 888.7 18.1 329.5 120.4 2.0 120.1 132.3 138.8 38.0 3.5 -111.8 258.6 -16.7 60.5 56.1 07SC35 51.7 1.4 15.6 9.8 0.1 6.5 7.0 5.9 1.8 0.3 860.4 17.0 306.0 122.1 1.7 161.3 125.2 190.7 38.6 3.5 -173.7 300.4 -37.7 77.4 60.3
Chapter 1
105
References
Bai Z-J, Zhu W-G, Zhong H, Li C, Liao J-Q, Sun H-S (2015) Petrogenesis and tectonic
implications of the early Jurassic Fe–Ti oxide-bearing Xialan mafic intrusion in SE
China: Constraints from zircon Hf–O isotopes, mineral compositions and whole-rock
geochemistry. Lithos 212: 59-73.
Bao Z, Wang Q, Bai G, Zhao Z, Song Y, Liu X (2008) Geochronology and geochemistry of the
Fangcheng Neoproterozoic alkali-syenites in East Qinling orogen and its geodynamic
implications. Chinese Science Bulletin 53: 2050-2061.
Cai M-H, He L-Q, Liu G-Q, Wu D-C, Huang H-M (2006) SHRIMP zircon U-Pb dating of the
intrusive rocks in the Dachang tin-polymetallic ore field, Guangxi and their geological
significance. Geological Review 52: 409-414.
Cen T, Li W-X, Wang X-C, Pang C-J, Li Z-X, Xing G-F, Zhao X-L, Tao, J. (2016). Petrogenesis
of early Jurassic basalts in southern Jiangxi Province, South China: Implications for the
thermal state of the Mesozoic mantle beneath South China. Lithos, 256, 311-330.
Charvet J (2013) The Neoproterozoic-Early Paleozoic tectonic evolution of the South China
Block: an overview. Journal of Asian Earth Sciences 74: 198-209
Charvet J, Faure M, Caridroit M, Guidi A (1985) Some tectonic and tectonogenetic aspects of
SW Japan: an Alpine-type orogen in an island-arc position. N. Nasu (Ed.), Formation
of Active Ocean Margin, Terra Science Publication Company, Tokyo: 791-817.
Charvet J, Shu L, Shi Y, Guo L, Faure M (1996) The building of south China: collision of Yangzi
and Cathaysia blocks, problems and tentative answers. Journal of Southeast Asian
Earth Sciences 13: 223-235.
Charvet J, Lapierre H, Yu Y-W (1999) Geodynamic significance of the Mesozoic volcanism of
southeastern China. Journal of Southeast Asian Earth Sciences 9: 387-396.
Charvet J, Shu L-S, Faure M, Choulet F, Wang B, Lu H-F, Le Breton N (2010) Structural
development of the Lower Palaeozoic belt of South China: genesis of an
intracontinental orogeny. Journal of Asian Earth Sciences 39: 309-330
Che X-D, Wu F-Y, Wang R-C, Gerdes A, Ji W-Q, Zhao Z-H., Yang J-H, Zhu, Z-Y (2015) In
situ U–Pb isotopic dating of columbite–tantalite by LA–ICP–MS. Ore Geology Reviews,
65, 979-989.
Chen C-H, Lin W, Lan C-Y, Lee C-Y (2004) Geochemical, Sr and Nd isotopic characteristics
and tectonic implications for three stages of igneous rock in the Late Yanshanian
Chapter 1
106
(Cretaceous) orogeny, SE China. Earth and Environmental Science Transactions of
the Royal Society of Edinburgh 95: 237-248.
Chen C-H, Lee C-Y, Shinjo R-C (2008) Was there Jurassic paleo-Pacific subduction in South
China?: constraints from 40Ar-39Ar dating, elemental and Sr-Nd-Pb isotope
geochemistry of the Mesozoic basalts. Lithos 106: 83-92
Chen G, Shu L, Shu L, Zhang C, Ouyang Y (2016) Geological characteristics and
mineralization setting of the Zhuxi tungsten (copper) polymetallic deposit in the Eastern
Jiangnan Orogen. Science China Earth Sciences 59: 803-823.
Chen J, and Jahn, B.M, (1998). Crustal evolution of southeastern China: Nd and Sr isotopic
evidence. Tectonophysics, 284: 101-133.
Chen J-Y, Yang J-H, Zhang J-H, Sun J-F, Wilde S-A (2013) Petrogenesis of the Cretaceous
Zhangzhou batholith in southeastern China: zircon U–Pb age and Sr–Nd–Hf–O isotopic
evidence. Lithos 162 : 140-156.
Chen N-H, Dong J-J, Chen J-Y, Dong C-W, Shen Z-Y (2014) Geometry and emplacement of
the Late Cretaceous mafic dyke swarms on the islands in Zhejiang Province, Southeast
China: Insights from high-resolution satellite images. Journal of Asian Earth Sciences
79: 302-311.
Chen W-S, Yang H-C, Wang X, Huang H (2002) Tectonic setting and exhumation history of
the Pingtan-Dongshan metamorphic belt along the coastal area, Fujian Province,
Southeast China. Journal of Asian Earth Sciences 20: 829-840
Cheng Y, Spandler C, Mao J, Rusk B-G (2012) Granite, gabbro and mafic microgranular
enclaves in the Gejiu area, Yunnan Province, China: a case of two-stage mixing of
crust-and mantle-derived magmas. Contributions to Mineralogy and Petrology 164:
659-676.
Cheng Y, Mao J, Spandler C (2013). Petrogenesis and geodynamic implications of the Gejiu
igneous complex in the western Cathaysia block, South China. Lithos 175 : 213-229.
Cui J, Zhang Y, Dong S, Jahn B-M, Xu X, Ma L (2013) Zircon U–Pb geochronology of the
Mesozoic metamorphic rocks and granitoids in the coastal tectonic zone of SE China:
constraints on the timing of Late Mesozoic orogeny. Journal of Asian Earth Sciences
62: 237-252.
Debon F, and Le Fort P (1983). A chemical–mineralogical classification of common plutonic
rocks and associations. Earth and Environmental Science Transactions of The Royal
Society of Edinburgh, 73: 135-149.

Chapter 1
107
Deng Y-F, Zhang Z-J, Fan W-M, Pérez-Gussiniyé M (2014) Multitaperture spectral method to
estimate the elastic thickness of South China: implications for intracontinental
deformation. Geoscience Frontiers 5:193-203.
Deng Z, Liu S, Zhang L, Wang Z, Wang W, Yang P, Luo P, Guo B (2014) Geochemistry, zircon
U–Pb and Lu–Hf isotopes of an Early Cretaceous intrusive suite in northeastern Jiangxi
Province, South China Block: implications for petrogenesis, crust/mantle interactions
and geodynamic processes. Lithos 200: 334-354.
Ding X, Chen P, Chen W, Huang H, Zhou X (2006) Single zircon LA-ICPMS U-Pb dating of
Weishan granite (Hunan, South China) and its petrogenetic significance. Science in
China Series D: Earth Sciences 49: 816-827.
Du Q-D, Wang Z-J, Wang J, Qiu Y-S, Jiang X-S, Deng Q, Yang F (2013) Geochronology and
palaeoenvironment of the pre-Sturtian glacial strata: evidence from the Liantuo
Formation in the Nanhua rift basin of the Yangtze Block, South China. Precambrian
Research 233: 118-131
Faure M, Sun Y, Shu L, Monié P, Charvet, J, (1996). Extensional tectonics within a subduction-
type orogen. The case study of the Wugongshan dome (Jiangxi Province, southeastern
China). Tectonophysics, 263: 77-106.
Faure M, Shu L-S, Wang B, Charvet J, Choulet F, Monie P (2009) Intracontinental subduction:
a possible mechanism for the Early Palaeozoic orogeny of SE China. Terra Nova 21:
360-368
Feng C-Y, Huang F, Zeng Z-L, Qu W-J, Ding M (2011) Isotopic chronology of Jiulongnao
granite and Hongshuizhai greisens-type tungsten deposit in South Jiangxi Province. J.
Jilin Univ.(Earth Sci. Ed.) 41: 112-121.
Feng C, Zhao Z, Qu W, Zeng Z (2015) Temporal consistency between granite evolution and
tungsten mineralization in Huamei'ao, southern Jiangxi Province, China: Evidence from
precise zircon U–Pb, molybdenite Re–Os, and muscovite 40 Ar–39 Ar isotope
geochronology. Ore Geology Reviews 65: 1005-1020.
Gan X-C, Zhao F-Q, Li H-M, Tang X-X, Huang J-Z, 1993. Single zircon U–Pb age of Banxi
Group in Hunan. The Evolution of Crust and Mantle (ed. Isotope Geology Committee
of the Chinese Society of Geology). Seismology Press, Beijing, 10-11.
Gögüs O (2015) Rifting and subsidence following lithospheric removal in continental back arc.
Geology 43:3-6
Gao, Y. (2015). Origin of A-type granites in East China: evidence from Hf-O-Li isotopes. PhD
dissertation. 311p.
Chapter 1
108
Gao P, Zheng Y-F, Zhao Z-F (2016) Experimental melts from crustal rocks: A lithochemical
constraint on granite petrogenesis. Lithos 266: 133-157.
Geng H, Xu X, O’Reilly S-Y, Zhao M, Sun T (2006) Cretaceous volcanic-intrusive magmatism
in western Guangdong and its geological significance. Science in China Series D: Earth
Sciences 49: 696-713.
Guo C, Mao J, Bierlein F, Chen Z, Chen Y, Li C, Zeng Z (2011) SHRIMP U–Pb (zircon), Ar–Ar
(muscovite) and Re–Os (molybdenite) isotopic dating of the Taoxikeng tungsten
deposit, South China Block. Ore Geology Reviews 43: 26-39.
Guo C, Chen Y, Zeng Z, Lou F (2012) Petrogenesis of the Xihuashan granites in southeastern
China: Constraints from geochemistry and in-situ analyses of zircon U Pb Hf O
isotopes. Lithos 148: 209-227.
Guo F, Fan W-M, Li C-W, Zhao L, Li H-X, Yang J-H (2012) Multi-stage crust-mantle interaction
in SE China: temporal, thermal and compositional constraints from the Mesozoic felsic
rocks in eastern Guangdong-Fujian provinces. Lithos 150: 62-84
Harris C-R, Pettke T, Heinrich C-A, Rosu E, Woodland S, Fry B (2013) Tethyan mantle
metasomatism creates subduction geochemical signatures in non-arc Cu–Au–Te
mineralizing magmas, Apuseni Mountains (Romania). Earth and planetary science
letters 366: 122-136.
He Z, Xu X, Yu Y, Zou H (2009) Origin of the Late Cretaceous syenite from Yandangshan, SE
China, constrained by zircon U–Pb and Hf isotopes and geochemical data.
International Geology Review 51: 556-582.
He Z-Y, Xu X-S, Niu Y (2010) Petrogenesis and tectonic significance of a Mesozoic granite–
syenite–gabbro association from inland South China. Lithos 119: 621-641.
He Z-Y, Xu X-S (2012) Petrogenesis of the Late Yanshanian mantle-derived intrusions in
southeastern China: response to the geodynamics of paleo-Pacific plate subduction.
Chemical Geology 328:208-221
Hsieh P-S, Chen C-H, Yen C-M, Lee C-Y (2009) Origin of Mafic Microgranular Enclaves
(MMEs) and Their Host Rocks of the Cretaceous Xiaojiang-Liangnong Granitic
Complexes in the Southeast Coast Magmatic Belt, S China. Terrestrial, Atmospheric &
Oceanic Sciences, 20.
Hu R-Z and Zhou M-F (2012) Multiple Mesozoic mineralization events in South China—an
introduction to the thematic issue. Mineralium Deposita 47: 579-588.
Chapter 1
109
Hu R-Z, Chen W-T, Xu D-R, Zhou M-F (2017) Reviews and new metallogenic models of
mineral deposits in South China: an introduction. Journal of Asian Earth Sciences 137:
1-8.
Huang H-Q, Li X-H, Li Z-X, Li W-X (2013) Intraplate crustal remelting as the genesis of Jurassic
high-K granites in the coastal region of the Guangdong Province, SE China. Journal of
Asian Earth Sciences 74: 280-302.
Huang H-Q, Li X-H, Li Z-X, Li W-X (2015) Formation of the Jurassic South China Large Granitic
Province: insights from the genesis of the Jiufeng pluton. Chemical Geology 401: 43-
58.
Huang W, Liang H-Y, Wu J, Zou Y-Q, Zhang J (2017) Formation of porphyry Mo deposit in a
deep fault zone, example from the Dabaoshan porphyry Mo deposit in northern
Guangdong, South China. Ore Geology Reviews 81: 940-952.
Jiang Y-H, Jiang S-Y, Zhao K-D, Ling H-F (2006) Petrogenesis of Late Jurassic Qianlishan
granites and mafic dykes, Southeast China: implications for a back-arc extension
setting. Geological Magazine 143: 457-474.
Jiang Y-H, Jiang S-Y, Dai B-Z, Liao S-Y, Zhao K-D, Ling H-F (2009) Middle to late Jurassic
felsic and mafic magmatism in southern Hunana province, southeast China:
implications for a continental arc to rifting. Lithos 107:185-204
Lapierre H, Jahn B-M, Charvet J, Yu Y-W (1997) Mesozoic felsic arcs magmatism and
continental olivine tholeiites in Zhejiang Province and their relationship with the tectonic
activity in Southest China.Tectonophysics 274:321-338
La Roche H (1964) Sur l'expression graphique des relations entre la composition chimique et
la composition minéralogique quantitative des roches cristallines. Présentation d'un
diagramme destiné à l'étude chimico-minéralogique des massifs granitiques ou grano-
dioritiques. Application aux Vosges cristallines. Sciences de la Terre 9: 293-337.
Li B and Jiang S-Y (2014) Geochronology and geochemistry of Cretaceous Nanshanping
alkaline rocks from the Zijinshan district in Fujian Province, South China: implications
for crust–mantle interaction and lithospheric extension. Journal of Asian Earth Sciences
93: 253-274.
Li B and Jiang S-Y (2015) A subduction-related metasomatically enriched mantle origin for the
Luoboling and Zhongliao Cretaceous granitoids from South China: implications for
magma evolution and Cu–Mo mineralization. International Geology Review 57: 1239-
1266.
Chapter 1
110
Li B, Jiang S-Y, Zhang Q, Zhao H-X, Zhao K-D (2015) Cretaceous crust–mantle interaction
and tectonic evolution of Cathaysia Block in South China: Evidence from pulsed mafic
rocks and related magmatism. Tectonophysics 661: 136-155.
Li B, Jiang S-Y, Zhang Q, Zhao H-X, Zhao K-D (2016) Geochemistry, geochronology and Sr-
Nd-Pb-Hf isotopic composition of Middle to Late Jurassic syenite-granodiorites-dacite
in South China: petrogenesus and tectonic implications. Gondwana Research 35:217-
237
Li C, Zhang M, Fu P, Qian Z, Hu P, Ripley E-M (2012) The Kalatongke magmatic Ni–Cu
deposits in the Central Asian Orogenic Belt, NW China: product of slab window
magmatism?. Mineralium Deposita 47 51-67.
Li C-Y, Zhang H, Wang F-Y, Liu J-Q, Sun Y-L, Hao X-L., Li Y-L, Sun W (2012) The formation
of the Dabaoshan porphyry molybdenum deposit induced by slab rollback. Lithos 150:
101-110.
Li J-H, Zhang Y-Q, Dong S-W, Su J-B, Li Y, Cui J-J, W. Shi W (2013) The Hengshan low-angle
normal fault zone: structural and geochronological constraints on the Late Mesozoic
crustal extension in South China. Tectonophysics 606: 97-115.
Li J-H, Zhang Y-Q, Dong S-W, Johnston ST (2014) Cretaceous tectonic evolution of South
China: a preliminary synthesis. Earth Science Reviews 134: 98-136
Li L-M, Sun M, Wang Y-J, Xing G-F, Zhao G-C, Lin S-F, Xia X-P, Chan L-S, Zhang F-F, Wong
J (2011) U-Pb and Hf isotopic study of zircons from migmatised amphibolites in the
Cathaysia Block: implications for the early Paleozoic peak tectonothermal event in
Southeastern China. Gondwana Research 19: 191-201
Li Q-L, Li X-H, Lan Z-W, Guo C-L, Yang Y-N, Liu Y, Tang G-Q (2013) Monazite and xenotime
U–Th–Pb geochronology by ion microprobe: dating highly fractionated granites at
Xihuashan tungsten mine, SE China. Contributions to Mineralogy and Petrology 166:
65-80.
Li W-X, Li X-H, Li Z-X (2005) Neoproterozoic bimodal magmatism in the Cathaysia Block of
South China and its tectonic significance. Precambrian Research 136: 51-66.
Li W-X, Li X-H, Li Z-X, Lou F-S (2008) Obduction-type granites within the NE Jiangxi ophiolite:
implications for the final amalgamation between the Yangtze and Cathaysia Blocks.
Gonwana Research 13: 288-301
Li X-F, Huang C, Wang C-Z, Wang L (2016) Genesis of the Huangshaping W–Mo–Cu–Pb–Zn
polymetallic deposit in Southeastern Hunan Province, China: Constraints from fluid
inclusions, trace elements, and isotopes. Ore Geology Reviews 79: 1-25.
Chapter 1
111
Li X-H, Wang Y, Zhao Z, Chen D (1998) SHRIMP U-Pb zircon geochronology for amphibolite
from the Precambrian basement in SW Zhejiang and NW Fujian provinces (in Chinese).
Geochimica 27: 327–334.
Li X-H, Sun M, Wei G-J, Liu Y, Lee C-Y, Malpas J (2000) Geochemical and Sm-Nd isotopic
study of amphibolites in the Cathaysia Block, southeastern China: evidence for an
extremely depleted mantle in the Paleoproterozoic. Precambriaan Research 102: 251-
262
Li X-H, Li Z-X, Zhou H-W, Liu Y, Liang X-R, Li W-X (2003) SHRIMP U-Pb zircon age,
geochemistry and Nd isotope of the Guandaoshan pluton in SW Sichuan: Petrogenesis
and tectonic significance. Science in China Series D: Earth Sciences 46: 73-83.
Li X-H, Li Z-X, Li W-X, Liu Y, Yuan C, Wei G-J, Qi C-S (2007) U-Pb zircon, geochemical and
Sr-Nd-Hf isotopic constraints on age and origin of Jurassic I- and A-type granites from
central Guangdong, SE China: a major igneous event in response to foundering of a
subducted flat-slab? Lithos 96: 186-204
Li X-H, Li W-X, Li Z-X, Liu Y (2008) 850-790 bimodal volcanic and intrusive rocks in northern
Zhejiang, South China: a major episode of continental rift magmatism during the
breakup of Rodinia. Lithos 102: 341-357
Li X-H, Li W-X, Li Z-X, Lo C-H, Wang J, Ye M-F, Yang Y-H (2009) Amalgamation between the
Yangtze and Cathaysia Blocks in South China: constraints from SHRIMP U-Pb zircon
ages, geochemistry and Nd-Hf isotopes of the Shuangwixu volcanic rocks.
Precambrian Research 174: 117-12
Li X-H, Li Z-X, Li W-X (2014) Detrital zircon U–Pb age and Hf isotope constrains on the
generation and reworking of Precambrian continental crust in the Cathaysia Block,
South China: a synthesis. Gondwana Research 25: 1202-1215.
Li X-Y, Zheng J-P, Sun M, Pan S-K, Wang W, Xia Q-K (2014). The Cenozoic lithospheric
mantle beneath the interior of South China Block: Constraints from mantle xenoliths in
Guangxi Province. Lithos 210: 14-26.
Li Y, Ma C-Q, Xing G-F, Zhou H-W (2015) The Early Cretaceous evolution of SE China:
Insights from the Changle–Nan'ao Metamorphic Belt. Lithos 230: 94-104.
Li Z, Qiu J-S, Xu X-S (2012) Geochronological, geochemical and Sr-Nd-Hf isotopic constraints
on petrogenesis of Lata Mesozoic gabbro-granite complexes on the southeast coast of
Fujian , South China: insights into a depleted mantle source region and mantle-crust
interactions. Geological Magazine 149:459-482
Chapter 1
112
Li Z, Qiu J-S, Yang X-M (2014) A review of the geochronology and geochemistry of Late
Yanshanian (Cretaceous) plutons along the Fujian coastal area of southeastern China:
implications for magma evolution related to slab break-off. Earth Science Reviews 128:
232-248
Li Z-X, Li X-H, Kinny P-D, Wang J (1999) The breakup of Rodinia: did it start with a mantle
plume beneath South China?. Earth and Planetary Science Letters 173: 171-181.
Li Z-X, Li X-H, Kinny PD, Wang J, Zhang S, Zhou H (2003) Geochronology of Neoproterozoic
syn-rift magmatism in the Yangtze Craton, South China and correlations with other
continents: evidence for a mantle superplume that broke up Rodinia. Precambnrian
Research 122: 85-109
Li Z-X, Li X-H (2007) Formation of the 1300-km-wide intracontinental orogen and postorogenic
maagmatic province in Mesozoic South China: a flat-slab subduction model. Geology
35: 179-182
Li Z-X, Li X-H, Zhou H-W, Kinny PD (2002) Grenvillian continental collision in south China:
new SHRIMP U-Pb zircon results and implications for the configuration of Rodinia.
Geology 30, 163-1§§
Li Z-X, Wartho J-A, Occhipinti S, Zhang C-L, Li X-H, WXang J, Bao C-M (2007) Early history
of the eastern Sibao Orogen (South China) during the assembly of Rodinia: new mica
40Ar/39Ar dating and SHRIMP U-PB detrital zircon provenance constraints.
Precambrian Research 159: 79-94
Li Z-X, Li X-H, Li W-X, Ding S-J (2008) Was Cathaysia part of Proterozoic Laurentia? – new
data from Hainan Island, south China. Terra Nova 20: 154-164
Li Z-X, Li X-H, Wartho J-A, Clark C, Li W-X, Zhang C-L, Bao C-M (2010) Magmatic and
metamorphic events during the r-early Paleozoic Wuyi-Yunkai orogeny, southeastern
South China: new af-ge constraints and pressure-temperature conditions. Geological
Society of America Bulletin 122: 772-793
Li Z-X, Wang R-C, Jahn B-M (2013) Tectonic evolution, magmatism and metallogeny of the
South China Craton – an introduction. Journal of Asian Earth Sciences 74: 195-197
Liang X, Dong C, Jiang Y, Wu S, Zhou Y, Zhu H, Fu J, Wang C, Shan Y (2016) Zircon U–Pb,
molybdenite Re–Os and muscovite Ar–Ar isotopic dating of the Xitian W–Sn
polymetallic deposit, eastern Hunan Province, South China and its geological
significance. Ore Geology Reviews 78: 85-100.
Chapter 1
113
Lin W, Wang Q-C, Chen K (2008) Phanerozoic tectonics of South China block: new insights
from the polyphase deformation in the Yunkai massif. Tectonics 27: TC6007,
doi:10.1029/TC002207
Ling M-X, Wang F-Y, Ding X, Hu Y-H (2009) Cretaceous ridge subduction along the Lower
Yangtze River Belt, eastern China. Economic Geology 104: 303-321.
Linnen R-L, Cuney M (2005) Granite-related rare-element deposits and experimental
constraints on Ta-Nb-W-Sn-Zr-Hf mineralization, in Linnen R-L and Samson I-M, eds.,
rare-element geochemistry and mineral deposits. In Geological Association of Canada,
GAC, Short Course.
Liu C-S, Ling H-F, Xiong X-L, Shen W-Z, Wang D-Z, Huang X-L, Wang R-C (1999) An F-rich,
Sn-bearing volcanic-intrusive complex in Yanbei, South China. Economic Geology 94:
325-341.
Liu C-Z, Wu F-Y, Sun J, Chu Z-Y, Qiu Z-L (2012a) The Xinchang peridotite xenoliths reveal
mantle replacement and accretion in southeastern China. Lithos 150: 171-187
Liu L, Xu X, Zou H (2012) Episodic eruptions of the Late Mesozoic volcanic sequences in
southeastern Zhejiang, SE China: petrogenesis and implications for the geodynamics
of paleo-Pacific subduction. Lithos 154: 166-180.
Liu L, Qiu J-S, Li Z (2013) Origin of mafic microgranular enclaves (MMEs) and their host quartz
monzonites from the Muchen pluton in Zhejiang Province, Southeast China:
implications for magma mixing and crust–mantle interaction. Lithos 160: 145-163.
Liu L, Xu X-S, Xia Y (2014) Cretaceous Pacific plate movement beneath SE China: evidence
from episodic volcanism and related intrusions. Tectonophysics 614:170-184
Liu L, Qiu J-S, Zhao J-L, Yang Z-L (2014) Geochronological, geochemical, and Sr–Nd–Hf
isotopic characteristics of Cretaceous monzonitic plutons in western Zhejiang Province,
Southeast China: New insights into the petrogenesis of intermediate rocks. Lithos 196:
242-260.
Liu L, Qiu J-S, Zhao J-L (2016) A hybrid origin for two Cretaceous monzonitic plutons in eastern
Zhejiang Province, Southeast China: Geochronological, geochemical, and Sr–Nd–Hf
isotopic evidence. Journal of Asian Earth Sciences 115: 183-203.
Liu L, Xu X, Xia Y (2016) Asynchronizing paleo-Pacific slab rollback beneath SE China:
Insights from the episodic Late Mesozoic volcanism. Gondwana Research 37: 397-
407.
Chapter 1
114
Liu L-P, Li S-Z, Dai Li-M, Suo Y-H, Liu B, Zhang G-W, Wang Y-J, Liu E-S (2012b) Geometry
and timing of Mesozoic deformation in the western part of the Xuefeng tectonic belt,
South China: implications for intra-continental deformation. Journal of Asian Earth
Sciences 49: 330-338
Liu Q, Yu J-H, Wang Q, Su B, Zhou M-F, Xu H, Cui X (2012) Ages and geochemistry of granites
in the Pingtan–Dongshan Metamorphic Belt, Coastal South China: new constraints on
Late Mesozoic magmatic evolution. Lithos 150: 268-286.
Liu R, Zhou H-W, Zhang L, Zhong Z-Q, Zeng W, Xiang H, Jin S, Lu X-Q, Li C-Z (2010) Zircon
U-Pb ages and Hf isotope compositions of the Mayuan migmatite complex, NW Fujian
Province, Southeast China: constraints on the timing and nature of the regional
tectonothermal event associated with the Caledonian orogeny. Lithos 119: 163-180
Liu X, Xing H, Zhang D (2015) The mechanisms of the infill textures and its implications for the
five-floor zonation at the Dajishan vein-type tungsten deposit, China. Ore Geology
Reviews 65: 365-374.
Ma X, Shu L, Meert J-G, Li J (2014) The Paleozoic evolution of Central Tianshan: Geochemical
and geochronological evidence. Gondwana Research 25: 797-819.
Mao J, Ye H, Liu K, Li Z, Takahashi Y, Zhao X, Kee W-S (2013) The Indosinian collision–
extension event between the South China Block and the Palaeo-Pacific plate: evidence
from Indosinian alkaline granitic rocks in Dashuang, eastern Zhejiang, South China.
Lithos 172: 81-97.
Maruyama S, Isozaki Y, Kimura G, Terabayashi M (1997) Paleogeographic maps of the
Japanese islands: plate tectonic synthesis from 750 Ma to the present. The Island
Arc 6: 121-142.
Meng L, Li Z-X, Chen H, Li X-H, Wang X-C (2012) Geochronological and geochemical results
from Mesozoic basalts in southern South China Block support the flat-slab subduction
model. Lithos 132: 127-140.
Pan X, Shen Z, Roberts A-P, Heslop D, Shi L (2014) Syntectonic emplacement of Late
Cretaceous mafic dyke swarms in coastal southeastern China: Insights from magnetic
fabrics, rock magnetism and field evidence. Tectonophysics 637: 328-340.
Shi W, Dong S-W, Ratschbacher L, Tian M, Li J-H, Wu G-L (2012) Meso-Cenozoic tectonic
evolution of the Dangyang Basin, north-central Yangtze craton, central China.
International Geology Review 55: 382-396.
Shu L-S, Zhou X-M (2002) Late Mesozoic tectonism of Southeast China. Geological
Review 48: 249-260. (in Chinese with English abstract)
Chapter 1
115
Shu L-S, Deng P, Wang B, Tan Z-ZG, Yu X-Q, Sun Y (2004) Lithology, kinematics and
geochronology related to Late Mesozoic Basin-Mountain evolution in the Nanxiong-
Zhuguang Area, South China. Science in China 47: 673-688.
Shu L-S, Faure M, Wang B, Zhou X-M, Song B (2008) Late Palaeozoic –Early Mesozoic
geological features of South China: response to the Indosinian collision events in
Southeast Asia. Comptes Rendus Geoscience 340: 151-165
Shu L-S, Zhou X-M, Deng P, Wang B, Jiang S-Y, Yu J-H, Zhao X-X (2009) Mesozoic tectonic
evolution of the southeast china block: new insights from basin analysis. Journal of
Asian Earth Sciences 34: 376-391.
Shu X-J, Wang X-L, Sun T, Chen W-F, Shen W-Z (2013) Crustal formation in the Nanling
Range, South China Block: Hf isotope evidence of zircons from Phanerozoic granitoids.
Journal of Asian Earth Sciences 74: 210-224
Sun W-D, Yang X-Y, Fan W-M, Wu F-Y (2012) Mesozoic large scale magmatism and
mineralization in South China: Preface. Lithos 150:1-5
Su J, Zhang Y, Dong S, Chen X, Li Y, Cui J (2014) Geochronology and Hf isotopes of granite
gravel from Fanjingshan, South China: Implication for the precambrian tectonic
evolution of western Jiangnan orogen. Journal of Earth Science 25: 619-629.
Su H, Mao J, He X, Lu R (2013) Timing of the formation of the Tianhuashan Basin in northern
Wuyi as constrained by geochronology of volcanic and plutonic rocks. Science China
Earth Sciences 56: 940-955.
Sun F, Xu X, Zou H, Xia Y (2015) Petrogenesis and magmatic evolution of∼ 130Ma A-type
granites in Southeast China. Journal of Asian Earth Sciences 98: 209-224.
Tang S-L, Yan D-P, Qiu L, Gao J-F, Wang C-L (2013) Partitioning of the Cretaceous Pan-
Yangtze Basin in the central South China Block by exhumation of the Xuefeng
Mountains during a transition from extensional to compressional tectonics? Gondwana
Research 10.1016/j.gr.2013.06.014
Tian M, Shi W, Li J-H, Qu H-J (2010) Tectonic deformation analysis and paleostress field
sequence of the grabens in the northwestern Jianghan Basin. Acta Geologica
Sinica 84: 159-170. (in Chinese with English abstract)
Tong W-X and Tobisch O-T (1996) Deformation of granitoid plutons in the Dongshan area,
southeast China: constraints on the physical conditions and timing of movement along
the Changle-Nanao shear zone. Tectonophysics 267: 303-316.
Chapter 1
116
Wan Y-S, Liu D-N, Xu M-H, Zhuang J-M, Song B, Shi Y-R, Du L-L (2007) SHRIMP U-Pb zircon
geochronology and geochemistry of metavolcanic and metasedimentary rocks in
Northwestern Fujian, Cathaysia block, China. Tectonic implicationsand the need to
redefine lithostratigraphic units. Gondwana Research 12: 166-183
Wan Y-S, Liu D-N, Wilde SA, Cao J-J, Chen B, Dong C-N, Song B, Du L-L (2010) Evolution of
the Yunkai terrane, South China: evidence from SHRIMP zircon U-Pb dating,
geochemistry and Nd isotope. Journal of Asian Earth Sciences 37: 140-153
Wan Y, Liu D, Wang S, Yang E, Wang W, Dong C, Zhou H, Du L, Yang Y, Diwu C (2011) ∼
2.7 Ga juvenile crust formation in the North China Craton (Taishan-Xintai area, western
Shandong Province): further evidence of an understated event from U–Pb dating and
Hf isotopic composition of zircon. Precambrian Research 186: 169-180.
Wang B, Shu L, Faure M, Jahn B-M, Lo C-H, Charvet J, Liu H (2014) Phanerozoic Multistage
Tectonic Rejuvenation of the Continental Crust of the Cathaysia Block: Insights from
Structural Investigations and Combined Zircon U-Pb and Mica 40Ar/39Ar
Geochronology of the Granitoids in Southern Jiangxi Province. The Journal of Geology
122: 309-328.
Wang C, Zhang D, Wu G, Xu Y, Carranza E-J-M, Zhang Y, Li H, Geng J (2013) Zircon U–Pb
geochronology and geochemistry of rhyolitic tuff, granite porphyry and syenogranite in
the Lengshuikeng ore district, SE China: Implications for a continental arc to intra-arc
rift setting. Journal of earth system science 122: 809-830.
Wang D-Z and Shen W-Z (2003) Genesis of granitoids and crustal evolution in southeast
China. Earth Science Frontiers 10: 209-220.
Wang D-Z, Shu L-S, Faure M, Sheng W-Z (2001) Mesozoic magmatism and granitic dome in
the Wugongshan Massif, Jiangxi province and their genetical relationship to the
tectonic events in southeast China. Tectonophysics 339: 259-277.
Wang D, Wang X-L, Zhou J-C, Shu X-J (2013a) Unraveling the Precambrian crustal evolution
by Neoproterozoic conglomerates, Jingnan orogen: U-Pb and Hf isotopes of detrital
zircons. Precambrian Research 233: 223-236
Wang D-Z, Shu L-S (2012) Late Mesozoic basin and range tectonics and related magmatism
in Southeast China. Geoscience Frontiers 3: 109-124
Wang D-Z, Zhou X-M (2002) Genesis of Late Mesozoic Volcanic–Intrusive Complex of
Southeast China and Crustal Evolution. Science Press, Beijing: 1–295.
Chapter 1
117
Wang G-C, Jiang Y-H, Liu Z, Ni C-Y, Qing L, Zhang Q, Zhu S-Q (2016) Multiple origins for the
Middle Jurassic to Early Cretaceous high-K calc-alkaline I-type granites in northwestern
Fujian province, SE China and tectonic implications. Lithos 246: 197-211.
Wang G-G, Ni P, Zhao K-D, Wang X-L, Liu J-Q, Jiang S-Y, Chen H (2012) Petrogenesis of the
Middle Jurassic Yinshan volcanic-intrusive complex, SE China: Implications for tectonic
evolution and Cu-Au mineralization. Lithos 150: 135-154.
Wang G-G, Ni P, Yao J, Wang X-L, Zhao K-D, Zhu R-Z, Xu Y-F, Pan J-Y, Li L, Zhang Y-H
(2015) The link between subduction-modified lithosphere and the giant Dexing
porphyry copper deposit, South China: constraints from high-Mg adakitic rocks. Ore
Geology Reviews 67: 109-126.
Wang H-Z and Mo X-X (1995) An outline of the tectonic evolution of China. Episodes 18: 6-16.
Wang H-Z, Chen P-R, Sun L-Q, Ling H-F, Zhao Y-D, Lan H-F (2015) Magma mixing and crust–
mantle interaction in Southeast China during the Early Cretaceous: Evidence from the
Furongshan granite porphyry and mafic microgranular enclaves. Journal of Asian Earth
Sciences 111: 72-87.
Wang J, Li Z-X (2003) History of Neoproterozoic rift basins in South China: implications for
Rodinia break-up. Precambrian Research 122: 141-158
Wang J, Li X, Duan T, Liu D, Song B, Li Z, Gao Y (2003) Zircon SHRIMP U-Pb dating for the
Cangshuipu volcanic rocks and its implications for the lower boundary age of the
Nanhua strata in South China. Chinese Science Bulletin 48: 1663-1669.
Wang J, Zhou X, Deng Q, Fu X, Duan T, Guo X (2015) Sedimentary successions and the
onset of the Neoproterozoic Jiangnan sub-basin in the Nanhua rift, South China.
International Journal of Earth Sciences 104: 521-539.
Wang K-X, Chen W-F, Chen P-R, Ling H-F, Huang H (2015) Petrogenesis and geodynamic
implications of the Xiema and Ziyunshan plutons in Hunan Province, South China.
Journal of Asian Earth Sciences 111: 919-935.
Wang L-J, Yu J-H, O’Reilly SY, Griffith WL, Sun T, Wei Z-Y, Jiang S-Y, Shu L-S (2008)
Grenvillian orogeny in the Southern Cathaysia Block: constraints from U-Pb ages and
Lu-Hf isotopes in zircon from metamorphic basement. Chinese Science Bulletin 53:
3037-3050
Wang L-X, Ma C-Q, Zhang C, Zhang J-Y, Marks M-A (2014) Genesis of leucogranite by
prolonged fractional crystallization: a case study of the Mufushan complex, South
China. Lithos 206: 147-163.

Chapter 1
118
Wang L-X, Ma C-Q, Lai Z-X, Marks M-A, Zhang C, Zhong Y-F (2015) Early Jurassic mafic
dykes from the Xiazhuang ore district (South China): Implications for tectonic evolution
and uranium metallogenesis. Lithos 239: 71-85.
Wang R-C, Xie L, Chen J, Yu A, Wang L, Lu J, Zhu J (2013) Tin-carrier minerals in
metaluminous granites of the western Nanling Range (southern China): Constraints on
processes of tin mineralization in oxidized granites. Journal of Asian Earth Sciences
74: 361-372.
Wang W, Zhou M-F, Yan D-P, Li J-W (2012) Depositional age, provenance, and tectonic
setting of the Neoproterozoic Sibao Group, southeastern Yangtze Block, South China.
Precambrian Research 192-195: 107-124
Wang X, Chen J, Ren M (2016) Hydrothermal zircon geochronology: Age constraint on Nanling
Range tungsten mineralization (Southeast China). Ore Geology Reviews 74: 63-75.
Wang X-C, Li X-H, Li W-X, Li Z-X (2007) Ca. 825 Ma komatiitic basalts in South China: first
evidence for >1500°C mantle melts by a Rodinian mantle plume. Geology 35: 1103-
1106
Wang X-C, Li X-H, Li Z-X, Li Q-L, Tang G-Q, Gao Y-Y, Zhang Q-R, Liu Y (2012) Episodic
Precambrian crust growth: evidence from U–Pb ages and Hf–O isotopes of zircon in
the Nanhua Basin, central South China. Precambrian Research 222: 386-403.
Wang X-L, Zhou J-C, Qin J-S, Zhang W-L, Liu X-M, Zhang G-L (2006) LA-ICP-MS U-Pb zircon
geochronology of the Neoproterozoic igneous rocks from Northern Guangxi, South
China: implications for tectonic evolution. Precambrian Research 145: 111-130
Wang X-L, Zhou J-C, Griffin WL, Wang R-C, Qiu J-S, O’Reilly SY, Xu X-S, Liu X-M, Zhang G-
L (2007) Detrital zircon geochronology of Precambrian basement sequences in the
Jiangnan orogen: dating the assembly of the Yangtze and Cathaysia Blocks.
Precambrian Research 159: 117-131
Wang X-L, Shu L-S, Xing G-F, Zhou J-C, Tang M, Shu X-J, Qi L, Hu Y-H (2012) Post-orogenic
extension in the eastern part of the Jiangnan orogen: evidence from ca 800-760 Ma
volcanic rocks. Precambrian Research 222-223: 404-423
Wang X-L, Zhou J-C, Wan Y-S, Kitajima K, Wang D, Bonamici C, Qiu J-S, Sun T (2013)
Magmatic evolution and crustal recycling for Neoproterozoic strongly peraluminous
bgranitoids from southern China: Hf and O isotopes in zircon. Earth and Planetary
Science Letters 366: 71-82
Wang X-L, Zhou J-C, griffin WL, Zhao G-C, Yu J-H, Qiu J-S, Zhang Y-J, Xing G-F (2014)
Geochemical zonation across a Neoproterozoic orogenic belt: isotopic evidence from
Chapter 1
119
granitoids and metasedimentary rocks of the Jiangnan orogen, China. Precambrian
Research 242: 154-171
Wang Y, Fan W, Peng T, Guo F (2005) Elemental and Sr–Nd isotopic systematics of the early
Mesozoic volcanic sequence in southern Jiangxi Province, South China: petrogenesis
and tectonic implications. International Journal of Earth Sciences 94: 53-65.
Wang Y-J, Zhang A-M, Fan W-M, Zhao G-C, Zhang G-W, Zhang Y-Z, Zhang F-F, Li S-Z (2011)
Kwangsian crustal anatexis within the eastern South China Block: geochemical, zircon
U-Pb geochronological and Hf isotopic fingerprints from the gneissoid granites of
Wugong and Wuyi-Yunkai Domains. Lithos 127: 239-260
Wang Y-J, Wu C-M, Zhang A-M, Fan W-M, Zhang A-H, Zhang Y-Z, P T-P, Yin C-Q (2012)
Kwangsian and Indosinian reworking of the eastern South China Block: constraints on
zircon U-Pb geochronology and metamorphism of amphibolites and granites. Lithos
150: 227-242
Wang Y-J, Fan W-M, Zhang G-W, Zhang Y-H (2013) Phanerozoic tectonics of the South China
Block: key observations and controversies. Gondwana Research 23: 1273-1305
Wang Z-H, Lu H-F (2000) Ductile deformation and 40Ar/39Ar dating of the Changle-Nanao
ductile shear zone, Southeast China. Journal of Structural Geology 22: 561-570
Wang Z (2002) The origin of the Cretaceous gabbros in the Fujian coastal region of SE China:
implications for deformation-accompanied magmatism. Contributions to Mineralogy
and Petrology 144: 230-240.
Wang Z, Chen B, Ma X (2014) Petrogenesis of the Late Mesozoic Guposhan composite
plutons from the Nanling Range, South China: Implications for W-SN mineralization.
American Journal of Science 314: 235-277.
Wong J-A, Sun M, Xing G-F, Li X-H, Zhao G-C, Wong K, Yuan C, Xia X-P, Li L-M, Wu F-Y
(2009) Geochemical and zircon U-Pb and Hf isotopic studyof the Baijuhuajian
metaluminous A-type granite: extension at 125-100 Ma and its tectonic significance for
South China. Lithos 112:289-305
Xia Y, Xu X-S, Zhu K-Y (2012) Paleoproterozoic S- and A-type granites in southwestern
Zhejiang: magmatism, metamorphism and implications for the crustal evolution of the
Cathaysia basement. Precambrian Research 216-219: 177-207
Xia Y, Xu X-S, Zou H-B, Liu L (2014) Early Paleozoic crust-mantle interaction and lithosphere
delamination in South China Block: evidence from geochronology, geochemistry, and
Sr-Nd-Hf isotopes of granites. Lithos 184-187: 416-435
Chapter 1
120
Xie L, Wang R-C, Chen J, Zhu J-C (2010) Mineralogical evidence for magmatic and
hydrothermal processes in the Qitianling oxidized tin-bearing granite (Hunan, South
China): EMP and (MC)-LA-ICPMS investigations of three types of titanite. Chemical
Geology 276: 53-68.
Xie L, Wang R-C, Che X-D, Huang F-F, Erdmann S, Zhang W-L (2016) Tracking magmatic
and hydrothermal Nb–Ta–W–Sn fractionation using mineral textures and composition:
A case study from the late Cretaceous Jiepailing ore district in the Nanling Range in
South China. Ore Geology Reviews 78: 300-321.
Xie X, Xu X, Zou H, Jiang S, Ming Z, Qiu J (2006) Early J2 basalts in SE China: incipience of
large-scale late Mesozoic magmatism. Science in China Series D: Earth Sciences 49:
796-815.
Xu B, Jiang S-Y, Wang R, Ma L, Zhao K-D, Yan X (2015) Late Cretaceous granites from the
giant Dulong Sn-polymetallic ore district in Yunnan Province, South China:
Geochronology, geochemistry, mineral chemistry and Nd–Hf isotopic compositions.
Lithos 218: 54-72.
Xu X-B, Zhang Y-Q, Jia D, Shu L-S (2009) Early Mesozoic geotectonic processes in South
China. Geology of China 36: 573-593. (in Chinese with English abstract)
Xu X-B, Zhang Y-Q, Shu L-S, Jia D (2011) LA-ICPMS U-Pb and 40Ar/39Ar geochronology of
the sheared metamorphic rocks in the Wuyishan: constraints on the timing of Early
Paleozoic and Early Mesozoic tectono-thermal events in SE China. Tectonophysics
501: 71-86
Xu X-S, O’Reilly SY, Griffin WL, Deng P, Pearson NJ (2005) Relict Proterozoic basement in
the Nanling Mountains (SE China) and its tectonothermal overprint. Tectonics 24:
TC2003, doi:10.1029/2004TC001652
Xu X-S, O’Reilly SY, Griffin WL, Wang X-L, Pearson NJ, He Z-Y (2007) The crust of Cathaysia:
age, assembly and reworking of two terranes. Precambrian Research 158: 51-78
Xu X, Lu W, He Z (2007) Age and generation of Fogang granite batholith and Wushi diorite-
hornblende gabbro body. Science in China Series D: Earth Sciences 50: 209-220.
Xu Y-H, Sun Q-Q, Cai G-Q, Yin X-J, Chen J (2014) The U-Pb ages and Hf isotopes of detrital
zircons from Hainan Island, South China: implicationq for sediment provenance and
crustal evolution. Environmental Earth Sciences 71: 1619-1628
Yang D-S, Li X-H, Li W-X, Liang X-Q, Long W-G, Xiong X-L (2010) U-Pb and 40Ar-39Ar
geochronology of the Baiyushan gneiss (central Guangdong, south China): constraints
Chapter 1
121
on the timing of early Palaeozoic and Mesozoic tectonothermal events in the Wuyun
(Wuyi-Yunkai) orogeny. Geological Magazine 147: 481-496
Yang S, Jiang S, Jiang Y, Zhao K, Fan H (2010) Zircon U-Pb geochronology, Hf isotopic
composition and geological implications of the rhyodacite and rhyodacitic porphyry in
the Xiangshan uranium ore field, Jiangxi Province, China. Science China Earth
Sciences 53: 1411-1426.
Yang S-Y, Jiang S-Y, Zhao K-D, Jiang Y-H (2013) Petrogenesis and tectonic significance of
Early Cretaceous high-Zr rhyolite in the Dazhou uranium district, Gan-Hang Belt,
Southeast China. Journal of Asian Earth Sciences 74: 303-315.
Yao J-L, Shu L-S, Santosh M, Li J-Y (2013) Geochronology anf Hf isotope of detrital zircons
from Precambrian sequences in the eastern Jiangnan orogen: constraining the
assembly of Yangtze and Cathaysia Blocks in South China. Journal of Asian Earth
Sciences 74: 225-243
Yao J-L, Shu L-S, Santosh M, Xu Z-Q (2014b) Palaeozoic metamorphism of the
Neoproterozoic basement in NE Cathaysia: zircon U-Pb ages, Hf isotope and whole-
rock geochemistry from the Chencai Group. Journal of the Geological Society, London,
-*
Yao W-H, Li Z-X, Li W-X, Wang X-C, Li X-H, Yang J-H (2012) Post-kinematic lithospheric
delamination of the Wuyi-Yunkai orogeny in South China: evidence from ca. 435 Ma
high-Mg basalts. Lithos 154: 115-129
Ye H-M, Mao J-R, Zhao X-L, Liu K, Chen D-D (2013) Revisiting Early-Middle Jurassic igneous
activity in the Nanling Mountains, South China: geochemistry and implications for
regional geodynamics. Journal of Asian Earth Sciences 72: 108-117
Ye M-F, Li X-H, Li W-X, Liu Y, Li Z-X (2007) SHRIMP zircon U-Pb geochronological and whole-
rock geochemical evidence for an Early Neoproterozoic Siboan magmatic arc along
the southeastern margin of the Yangtze Block. Gondwana Research 12: 144-156
Yu J-H, Wang L, O’Reilly S-Y, Griffin W-L, Zhang M, Li C, Shu L (2009) A Paleoproterozoic
orogeny recorded in a long-lived cratonic remnant (Wuyishan terrane), eastern
Cathaysia Block, China. Precambrian Research 174: 347-363.
Yu J-H, O’Reilly S-Y, Wang L, Griffin W-L, Zhou MF, Zhang M, Shu L (2010) Components and
episodic growth of Precambrian crust in the Cathaysia Block, South China: evidence
from U–Pb ages and Hf isotopes of zircons in Neoproterozoic sediments. Precambrian
Research 181: 97-114.
Chapter 1
122
Yu J-H, O’Reilly S-Y, Zhou M-F, Griffin W-L, Wang L (2012) U–Pb geochronology and Hf–Nd
isotopic geochemistry of the Badu Complex, Southeastern China: implications for the
Precambrian crustal evolution and paleogeography of the Cathaysia Block.
Precambrian Research 222: 424-449.
Yu X, Wu G, Zhang D, Yan T, Di Y, Wang L (2006) Cretaceous extension of the Ganhang
Tectonic Belt, southeastern China: constraints from geochemistry of volcanic rocks.
Cretaceous Research 27: 663-672.
Yu X-Q, Wu G-G, Zhao X, Gao J-F, Di Y-J, Zheng Y, Dai Y-P, Li C-L, Qiu J-T (2010) The Early
Jurassic tectono-magmatic events in southern Jiangxi and northern Guangdong
provinces, SE China: Constraints from the SHRIMP zircon U–Pb dating. Journal of
Asian Earth Sciences 39: 408-422.
Yuan H, Liu X, Liu Y, Gao S, Ling W (2006) Geochemistry and U-Pb zircon geochronology of
Late-Mesozoic lavas from Xishan, Beijing. Science in China Series D: Earth Sciences
49: 50-67.
Yuan S, Peng J, Hao S, Li H, Geng J, Zhang D (2011) In situ LA-MC-ICP-MS and ID-TIMS U–
Pb geochronology of cassiterite in the giant Furong tin deposit, Hunan Province, South
China: New constraints on the timing of tin–polymetallic mineralization. Ore Geology
Reviews 43: 235-242.
Zaw K, Peters S-G, Cromie P, Burrett C, Hou Z (2007) Nature, diversity of deposit types and
metallogenic relations of South China. Ore Geology Reviews 31: 3-47.
Zhang K-J (1997) North and South China collision along the eastern and southern North China
margins. Tectonophysics 270: 145-156.
Zhang F-F, Wang Y-J, Zhang A-M, Fan W-M, Zhang Y-Z, Zi, J-W (2012) Geochronological
and geochemical constraints on the petrogensis of Middle Palaezoic (Kwangsian)
massive granites in the eastern South China Block. Lithos 150: 188-208
Zhang R-Q, Lu J-J, Zhu J-C, Yao Y, Gao J-F, Chen W-F, Zhao Z-J (2010) Zircon U-Pb
geochronology and Hf isotopic compositions of Hehuaping granite porphyry, southern
Hunan Province, and its geological significance. Geological Journal of China
Universities 16: 436-447.
Zhang S, Jiang G, Dong J, Han Y, Wu H (2008) New SHRIMP U-Pb age from the Wuqiangxi
Formation of Banxi Group: Implications for rifting and stratigraphic erosion associated
with the early Cryogenian (Sturtian) glaciation in South China. Science in China Series
D: Earth Sciences 51: 1537-1544.
Chapter 1
123
Zhang Y-Q, Xu X-B, Jia D, Shu L-S (2008) Deformation record of the change from Indosinian
collision-related tectonic system to Yanshanian subduction-related tectonic system in
South China during the Early Mesozoic Earth Science Frontiers 15: 1-14. (in Chinese
with English abstract)
Zhang Z-J, Xu T, Zhao B, Badal J (2013) Systematic variations is seismic velocity and
reflection in the crust of Cathaysia: new constraints on intraplate orogeny in the South
China continent. Gondwana Research 245: 902-917
Zhao G, Cawood P-A (2012) Precambrian geology of China. Precambrian Research 222: 13-
54.
Zhao J-H, Asimow P-D (2014) Neoproterozoic boninite-series rocks in South China: a
depleted-mantle source modified by sediment-derived melt. Chemical Geology 388:
98-111
Zhao J-H, Zhou M-F, Zheng J-P (2013) Constraints from zircon U-Pb ages, O and Hf isotopic
compositions on the origin of Neoproterozoic peraluminous granitoids from the
Jiangnan Fold Belt, South China. Contributions to Mineralogy and Petrology 166: 1505-
1519
Zhao J-L, Qiu J-S, Liu L, Wang R-Q (2016) The Late Cretaceous I-and A-type granite
association of southeast China: Implications for the origin and evolution of post-
collisional extensional magmatism. Lithos 240: 16-33.
Zhao P-L, Yuan S-D, Yuan Y-B (2016) Zircon LA-MC-ICP-MS U-Pb dating of the Xianglinpu
granites from the Weijia tungsten deposit in southern Hunan Province and its
implications for the Late Jurassic tungsten metallogenesis in the westernmost Nanling
W-Sn metallogenic belt. Geol China 43: 120-131.
Zhao Z, Bao Z, Zhang B (1998) Geochemistry of the Mesozoic basaltic rocks in southern
Hunan Province. Science in China Series D: Earth Sciences 41: 102-112.
Zhao Z-F, Gao P, Zheng Y-F (2015) The source of Mesozoic granitoids in South China:
Integrated geochemical constraints from the Taoshan batholith in the Nanling Range.
Chemical Geology 395: 11-26.
Zheng J, Griffin W-L, O’Reilly S-Y, Lu F, Yu C, Zhang M, Li H (2004) U–Pb and Hf-isotope
analysis of zircons in mafic xenoliths from Fuxian kimberlites: evolution of the lower
crust beneath the North China Craton. Contributions to Mineralogy and Petrology 148:
79-103.
Chapter 1
124
Zheng J-P, Griffin W-L, Li L-S, O’Reilly S-Y, Pearson N-J, Tang H-Y, Liu G-L, Zhao J-H, Yu C-
M, Su Y-P (2011) Highly evolved Archean basement beneath the western Cathaysia
Block, south China. Geochimica et Cosmochimica Acta 75: 242-255.
Zheng Y-F, Zhang S-B, Zhao Z-F, Wu Y-B, Li X-H, Li Z-X, Wu F-W (2007) Contrasting zircon
Hf and O isotopes in the two episodes of Neoproterozoic granitoids in South China:
implications for growwwth and reworking of continental crust. Lithos 96: 127-150
Zheng Y-F, Xiao W-J, Zhao G-C (2013) Introduction to tectonics of China. Gondwana
Research 23: 1189-1206
Zhong Y-F, Ma C-Q, Liu L, Zhao J-H, Zheng J-P, Nong J-N, Zhang Z-J (2014) Ordovician
appinites in the Wugongshan Domain of the Cathaysia Block, South China:
geochronological and geochemical evidence for intrusion into a local extensional zone
within an intracontinental regime. Lithos 198-199: 202-216
Zhou J, Jiang S, Wang X, Yang J, Zhang M (2005) Re-Os isochron age of Fankeng basalts
from Fujian of SE China and its geological significance. Geochemical Journal 39: 497-
502.
Zhou J-C, Jiang S-Y, Wang X-L, Yang J-H, Zhang M-Q (2006) Study on lithogeochemistry of
Middle Jurassic basalts from southern China represented by the Fankeng basalts from
Yongding of Fujian Province Science in China 49: 1020-1031.
Zhou H-W, Li X-H, Zhong Z-Q, Liu Y, Xu Q-D (1997) Geochemistry of amphibolites within the
Taihua complex from the Xiao Qinling area, western Henan and its tectonic implication.
Geochimica 26: 87-100.
Zhou X-M, Li W-X (2000) Origin of Late Mesozoic igneous rocks in Southeastern China:
implications for lithosphere subduction and underplating of mafic magmas.
Tectonophysics 326: 269-287.
Zhu W-G, Zhong H, Li X-H, He D-F, Song X-Y, Ren T, Chen Z-Q, Sun H-S, Liao J-Q (2010)
The early Jurassic mafic-ultramafic intrusion and A-type granite from Guangdong, SE
China: age, origin, and tectonic significance. Lithos 119: 313-329
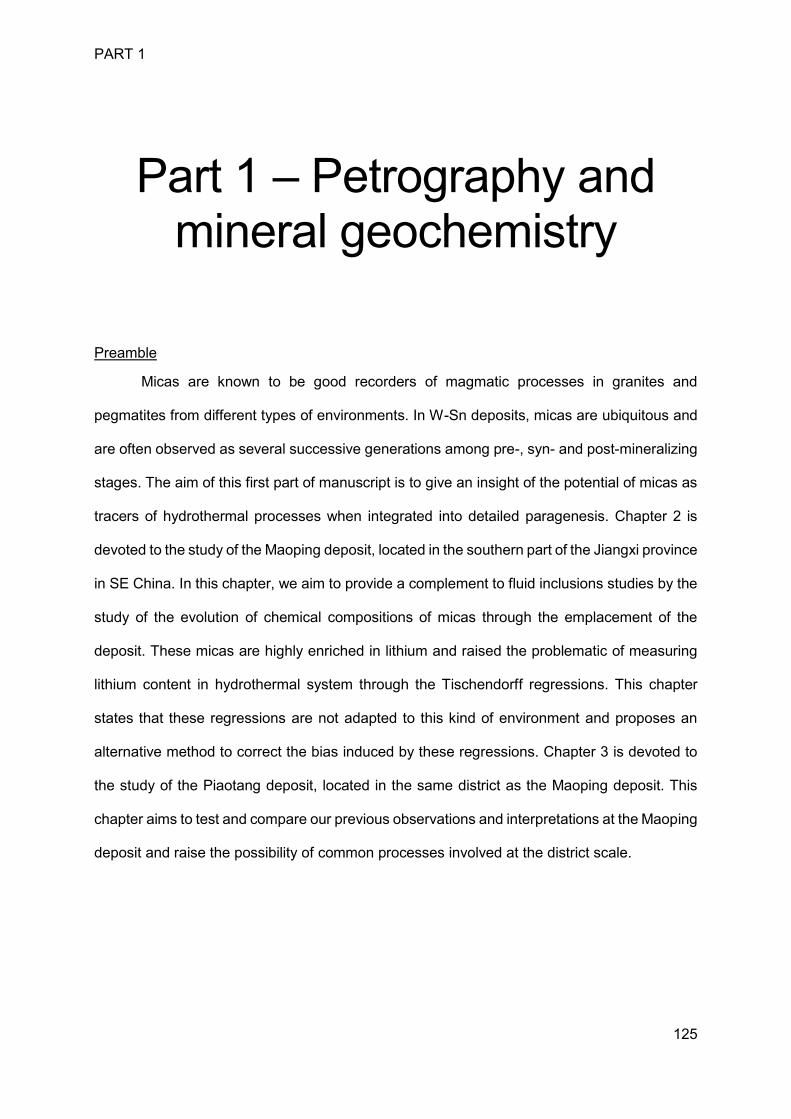
PART 1
125
Part 1 – Petrography and
mineral geochemistry
Preamble
Micas are known to be good recorders of magmatic processes in granites and
pegmatites from different types of environments. In W-Sn deposits, micas are ubiquitous and
are often observed as several successive generations among pre-, syn- and post-mineralizing
stages. The aim of this first part of manuscript is to give an insight of the potential of micas as
tracers of hydrothermal processes when integrated into detailed paragenesis. Chapter 2 is
devoted to the study of the Maoping deposit, located in the southern part of the Jiangxi province
in SE China. In this chapter, we aim to provide a complement to fluid inclusions studies by the
study of the evolution of chemical compositions of micas through the emplacement of the
deposit. These micas are highly enriched in lithium and raised the problematic of measuring
lithium content in hydrothermal system through the Tischendorff regressions. This chapter
states that these regressions are not adapted to this kind of environment and proposes an
alternative method to correct the bias induced by these regressions. Chapter 3 is devoted to
the study of the Piaotang deposit, located in the same district as the Maoping deposit. This
chapter aims to test and compare our previous observations and interpretations at the Maoping
deposit and raise the possibility of common processes involved at the district scale.

PART 1 – Chapter 2
127
Chapter 2: Detailed paragenesis and Li-mica compositions as recorders of the
magmatic-hydrothermal evolution of the Maoping W-Sn deposit (Jiangxi, China)
Article published in Lithos 264 (2016) 108-124.
Hélène Legros a, Christian Marignac a,b, Julien Mercadier a, Michel Cuney a, Antonin
Richard a, Ru-Cheng Wang c, Nicolas Charles d, Marc-Yves Lespinasse a
a Université de Lorraine, CNRS, CREGU, GeoRessources, Boulevard des Aiguillettes B.P. 70239, F-54506-
Vandoeuvre-lès-Nancy, France
b Ecole Nationale Supérieure des Mines de Nancy, Parc de Saurupt, F-54042 Nancy, France
c State Key Laboratory for Mineral Deposits Research, School of Earth Sciences and Engineering, Nanjing
University, Xianlin University Town, Nanjing 210046- China
d BRGM-French Geological Survey, 3, Av. Claude Guillemin, BP 36009, 45060 Orléans Cedex 2, France
Abstract
Li-micas have been used as indicators of the evolution of granites. However,
hydrothermal Li-micas are less documented. World-class W-Sn deposits associated with Early
Yanshanian granites (South Jiangxi, China) show magmatic and hydrothermal Li-micas which
could help unravelling the magmatic-hydrothermal evolution of rare metal deposits. Six types
of Li-micas have been identified in the vein system of the Maoping W-Sn deposit through
detailed petrography and EPMA and LA-ICP-MS analyses, by chronological order: (i) late-
magmatic Li-micas in feldspar veins, associated with late crystallization of a peraluminous
melt; (ii) hydrothermal Fe-Li micas (Fe-Li mica veins and selvages); (iii) hydrothermal Fe-Li
micas in W-Sn veins; (iv) Fe-Li micas in later banded quartz veins (v) Li-muscovite in the final
stages; and finally (vi) micas associated with alteration at each stage. Based on oscillatory
variations and trends in major elements composition, the chemical variations in Li-micas from
the successive stages and in hydrothermal micas that crystallized in the veins are interpreted
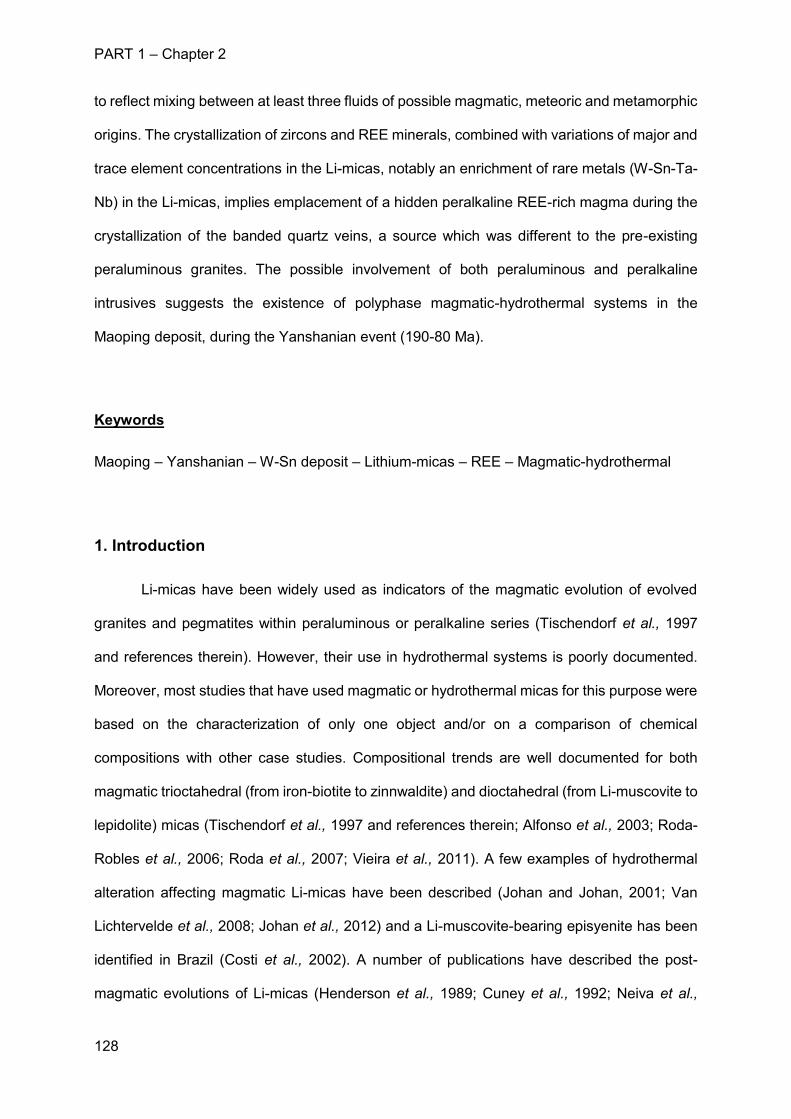
PART 1 – Chapter 2
128
to reflect mixing between at least three fluids of possible magmatic, meteoric and metamorphic
origins. The crystallization of zircons and REE minerals, combined with variations of major and
trace element concentrations in the Li-micas, notably an enrichment of rare metals (W-Sn-Ta-
Nb) in the Li-micas, implies emplacement of a hidden peralkaline REE-rich magma during the
crystallization of the banded quartz veins, a source which was different to the pre-existing
peraluminous granites. The possible involvement of both peraluminous and peralkaline
intrusives suggests the existence of polyphase magmatic-hydrothermal systems in the
Maoping deposit, during the Yanshanian event (190-80 Ma).
Keywords
Maoping – Yanshanian – W-Sn deposit – Lithium-micas – REE – Magmatic-hydrothermal
1. Introduction
Li-micas have been widely used as indicators of the magmatic evolution of evolved
granites and pegmatites within peraluminous or peralkaline series (Tischendorf et al., 1997
and references therein). However, their use in hydrothermal systems is poorly documented.
Moreover, most studies that have used magmatic or hydrothermal micas for this purpose were
based on the characterization of only one object and/or on a comparison of chemical
compositions with other case studies. Compositional trends are well documented for both
magmatic trioctahedral (from iron-biotite to zinnwaldite) and dioctahedral (from Li-muscovite to
lepidolite) micas (Tischendorf et al., 1997 and references therein; Alfonso et al., 2003; Roda-
Robles et al., 2006; Roda et al., 2007; Vieira et al., 2011). A few examples of hydrothermal
alteration affecting magmatic Li-micas have been described (Johan and Johan, 2001; Van
Lichtervelde et al., 2008; Johan et al., 2012) and a Li-muscovite-bearing episyenite has been
identified in Brazil (Costi et al., 2002). A number of publications have described the post-
magmatic evolutions of Li-micas (Henderson et al., 1989; Cuney et al., 1992; Neiva et al.,
PART 1 – Chapter 2
129
2012; Neiva et al., 2013; Marchal et al., 2014; Jin-Ung and Kideok, 2015). Hydrothermal
lepidolite is observed at Yellowstone (Bargar et al., 1973) and F-rich micas have been
described from acid leaching alteration in the Henderson Mo deposit (Gunow et al., 1980).
Finally, hydrothermal Li-micas in W-Sn deposits have been documented only in a few
occurrences in Portugal (Neiva, 1987).
Li-micas are common in W-Sn deposits, which are usually emplaced during multiple
magmatic and hydrothermal events that affect granites and their country rocks (Giuliani, 1985;
Tischendorff, 1997; Costi et al., 2002; Johan et al., 2012; Neiva, 2013). Here, we show that
the compositional variations of Li-micas can be correlated with the detailed paragenesis in
order to determine both magmatic and hydrothermal influences within a single system and
allow the identification of multiple magmas and fluid interactions throughout the history of a
rare metal deposit. The Maoping Sn-W deposit in the southern Jiangxi Metallogenic Province
(South China) provides an opportunity to (i) characterize magmatic and hydrothermal Li-micas
of various compositions present at the different stages of the paragenetic sequence defined in
the veins, (ii) relate the micas to the compositions of and interactions between the hydrothermal
fluids responsible for the deposition of wolframite and cassiterite, and (iii) to use, for the first
time, the evolution in hydrothermal Li-mica composition through the paragenetic stages to
characterize the fluids involved in terms of timing and interactions as well as to characterize
the magmatic influences present within the system.
2. Geological setting and sampling
2.1. The southern Jiangxi W-Sn Metallogenic Province
The southern Jiangxi W-Sn Metallogenic Province of southern China is located in the
Nanling range in the central part of the Cathaysia Block, which is separated from the Yangtze
Block to the northwest by the Jiangshan-Shaoxi fault zone (Figure 19) (Wang et al. 2013 and
references therein). The Cathaysia Block is a former Paleoproterozoic craton which stabilized
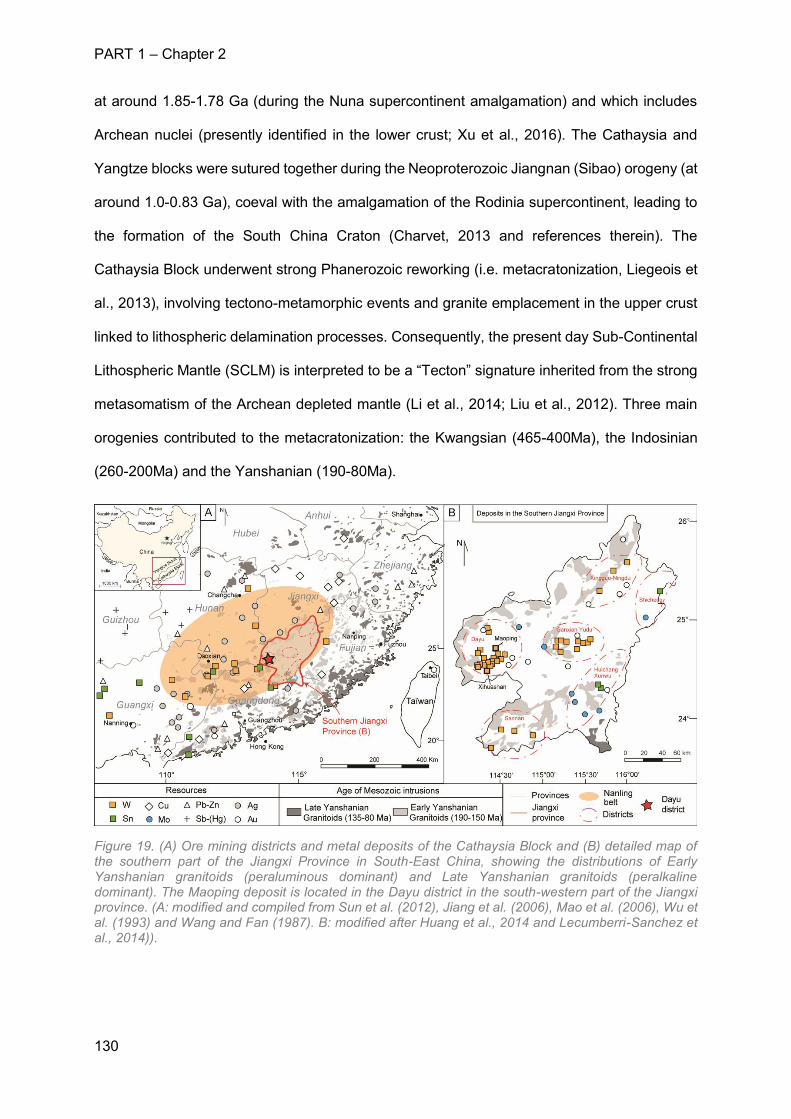
PART 1 – Chapter 2
130
at around 1.85-1.78 Ga (during the Nuna supercontinent amalgamation) and which includes
Archean nuclei (presently identified in the lower crust; Xu et al., 2016). The Cathaysia and
Yangtze blocks were sutured together during the Neoproterozoic Jiangnan (Sibao) orogeny (at
around 1.0-0.83 Ga), coeval with the amalgamation of the Rodinia supercontinent, leading to
the formation of the South China Craton (Charvet, 2013 and references therein). The
Cathaysia Block underwent strong Phanerozoic reworking (i.e. metacratonization, Liegeois et
al., 2013), involving tectono-metamorphic events and granite emplacement in the upper crust
linked to lithospheric delamination processes. Consequently, the present day Sub-Continental
Lithospheric Mantle (SCLM) is interpreted to be a “Tecton” signature inherited from the strong
metasomatism of the Archean depleted mantle (Li et al., 2014; Liu et al., 2012). Three main
orogenies contributed to the metacratonization: the Kwangsian (465-400Ma), the Indosinian
(260-200Ma) and the Yanshanian (190-80Ma).
Figure 19. (A) Ore mining districts and metal deposits of the Cathaysia Block and (B) detailed map of the southern part of the Jiangxi Province in South-East China, showing the distributions of Early Yanshanian granitoids (peraluminous dominant) and Late Yanshanian granitoids (peralkaline dominant). The Maoping deposit is located in the Dayu district in the south-western part of the Jiangxi province. (A: modified and compiled from Sun et al. (2012), Jiang et al. (2006), Mao et al. (2006), Wu et al. (1993) and Wang and Fan (1987). B: modified after Huang et al., 2014 and Lecumberri-Sanchez et al., 2014)).
PART 1 – Chapter 2
131
The Kwangsian orogen is interpreted to be the result of either the inversion of the
Neoproterozoic to Early Paleozoic Nanhua rift (Charvet, 2013) or intracontinental subduction
(Faure et al., 2009) under an overall Paleotethyan tectonic regime (Wang et al., 2012). The
orogen was associated with pervasive emplacement of peraluminous granites derived from
partial melting of the Cathaysia Block crust (Xia et al., 2014). The Indosinian event, which
overprinted the Kwangsian orogen, yielded both metaluminous and peraluminous granites, the
latter associated with Nb-Ta mineralization in the Nanling range (Mao et al., 2013) at around
390 Ma, according to the ages of Nanping pegmatites (U-Pb on columbite-tantalite; Che et al.,
2015). The Indosinian orogeny was characterized in particular by the formation of metamorphic
core complexes (Faure et al., 1996; Shu et al., 2008), and the orogeny might be considered a
far-field effect of the collision between the South and North China Cratons (Wang et al., 2003;
Shu et al., 2008).
After the late Triassic, the history of Cathaysia was dominated by the oblique
subduction of the Paleo-Pacific (Izanagi) plate beneath the South China Craton (e.g., Zhou et
al. 2002). This resulted: (i) in two extensional episodes (basin and range tectonics): the early
(190-150 Ma) and late (135-80 Ma) Yanshanian events, separated by a seemingly
compressional episode at the Jurassic-Cretaceous boundary (Shu et al. 2009, Liu et al. 2012,
Li et al. 2014) and (ii) in the emplacement of the giant Yanshanian igneous province (up to
1300 km wide), which spreads across the whole of the Cathaysia and into the Yangtze Block,
and is one of the largest granite provinces in the world (~ 180,000 km2; Chen et al. 2008).
The Early Yanshanian event, associated with flat slab subduction followed by slab
foundering (Li and Li, 2007; Chen et al. 2008, Wang et al. 2013), was by far the most significant
event in terms of both granite surface area (~ 100,000 km2) and the density of W-(Sn)
occurrences and deposits (including the Maoping deposit) at 160-150 Ma. In particular, three
E-W granite belts define the “Nanling Metallogenic Belt”, which includes most of the largest W-
(Sn) deposits of Southern China (Figure 19). With a total of 429 deposits amounting to 1.7 Mt
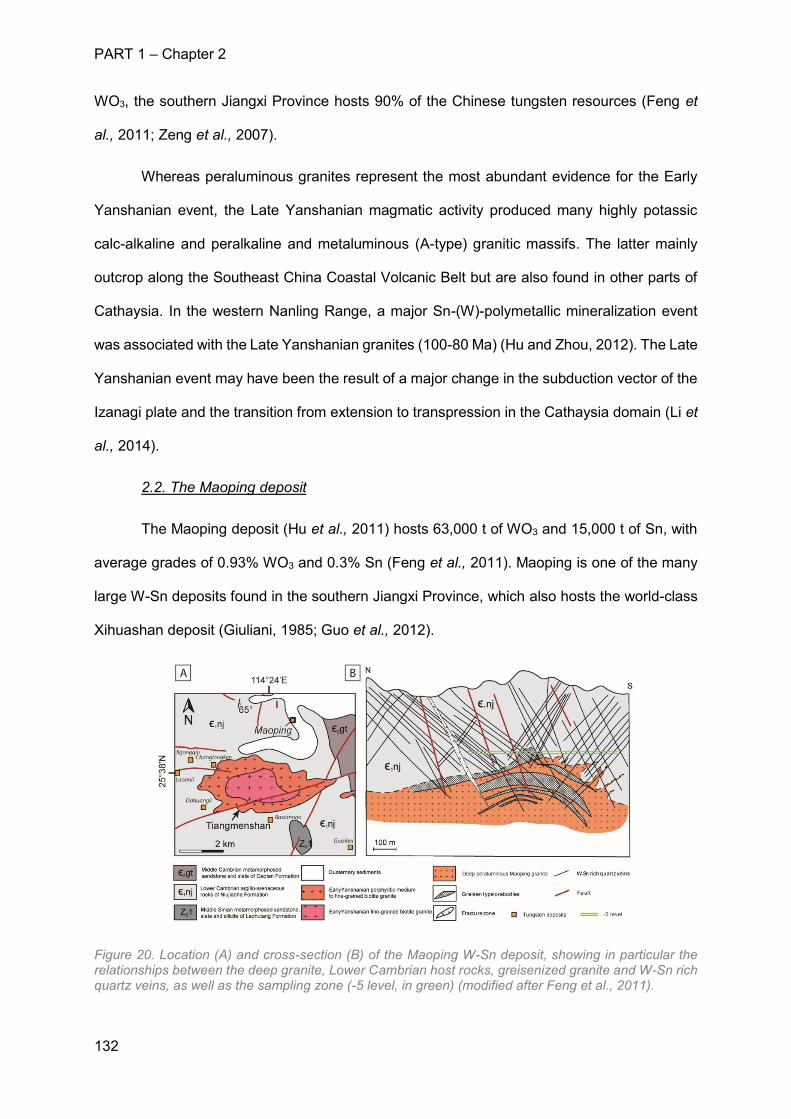
PART 1 – Chapter 2
132
WO3, the southern Jiangxi Province hosts 90% of the Chinese tungsten resources (Feng et
al., 2011; Zeng et al., 2007).
Whereas peraluminous granites represent the most abundant evidence for the Early
Yanshanian event, the Late Yanshanian magmatic activity produced many highly potassic
calc-alkaline and peralkaline and metaluminous (A-type) granitic massifs. The latter mainly
outcrop along the Southeast China Coastal Volcanic Belt but are also found in other parts of
Cathaysia. In the western Nanling Range, a major Sn-(W)-polymetallic mineralization event
was associated with the Late Yanshanian granites (100-80 Ma) (Hu and Zhou, 2012). The Late
Yanshanian event may have been the result of a major change in the subduction vector of the
Izanagi plate and the transition from extension to transpression in the Cathaysia domain (Li et
al., 2014).
2.2. The Maoping deposit
The Maoping deposit (Hu et al., 2011) hosts 63,000 t of WO3 and 15,000 t of Sn, with
average grades of 0.93% WO3 and 0.3% Sn (Feng et al., 2011). Maoping is one of the many
large W-Sn deposits found in the southern Jiangxi Province, which also hosts the world-class
Xihuashan deposit (Giuliani, 1985; Guo et al., 2012).
Figure 20. Location (A) and cross-section (B) of the Maoping W-Sn deposit, showing in particular the relationships between the deep granite, Lower Cambrian host rocks, greisenized granite and W-Sn rich quartz veins, as well as the sampling zone (-5 level, in green) (modified after Feng et al., 2011).
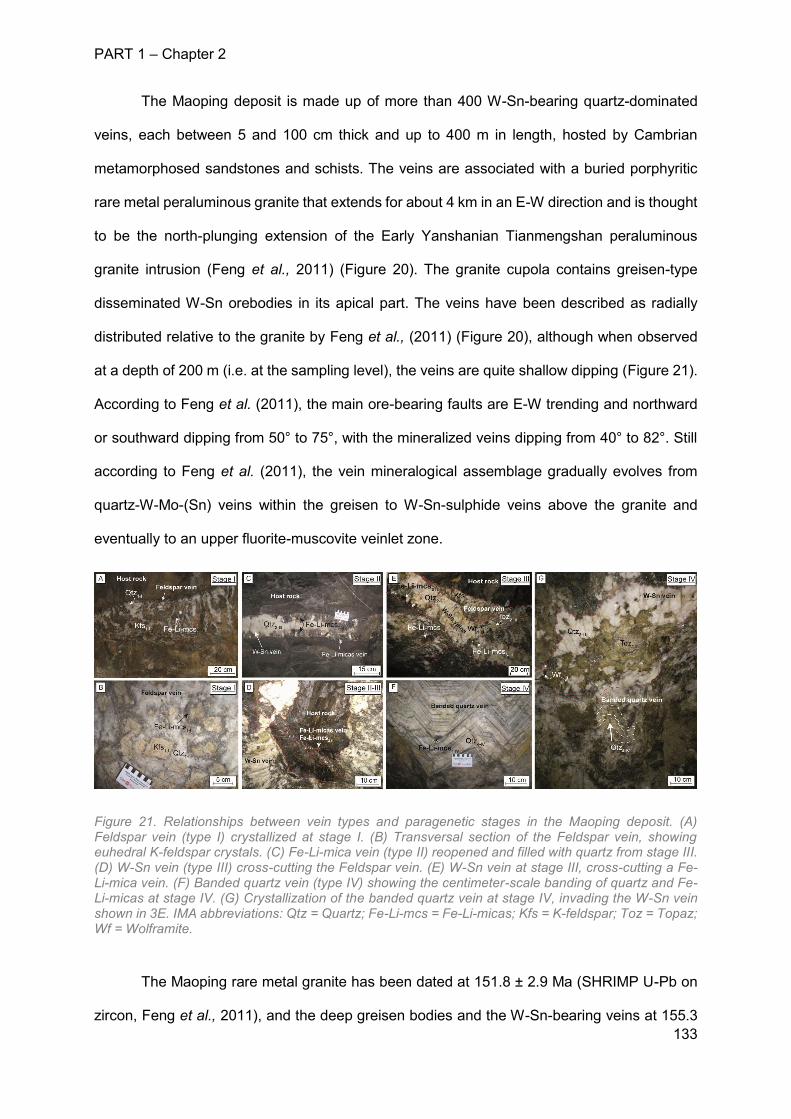
PART 1 – Chapter 2
133
The Maoping deposit is made up of more than 400 W-Sn-bearing quartz-dominated
veins, each between 5 and 100 cm thick and up to 400 m in length, hosted by Cambrian
metamorphosed sandstones and schists. The veins are associated with a buried porphyritic
rare metal peraluminous granite that extends for about 4 km in an E-W direction and is thought
to be the north-plunging extension of the Early Yanshanian Tianmengshan peraluminous
granite intrusion (Feng et al., 2011) (Figure 20). The granite cupola contains greisen-type
disseminated W-Sn orebodies in its apical part. The veins have been described as radially
distributed relative to the granite by Feng et al., (2011) (Figure 20), although when observed
at a depth of 200 m (i.e. at the sampling level), the veins are quite shallow dipping (Figure 21).
According to Feng et al. (2011), the main ore-bearing faults are E-W trending and northward
or southward dipping from 50° to 75°, with the mineralized veins dipping from 40° to 82°. Still
according to Feng et al. (2011), the vein mineralogical assemblage gradually evolves from
quartz-W-Mo-(Sn) veins within the greisen to W-Sn-sulphide veins above the granite and
eventually to an upper fluorite-muscovite veinlet zone.
Figure 21. Relationships between vein types and paragenetic stages in the Maoping deposit. (A) Feldspar vein (type I) crystallized at stage I. (B) Transversal section of the Feldspar vein, showing euhedral K-feldspar crystals. (C) Fe-Li-mica vein (type II) reopened and filled with quartz from stage III. (D) W-Sn vein (type III) cross-cutting the Feldspar vein. (E) W-Sn vein at stage III, cross-cutting a Fe-Li-mica vein. (F) Banded quartz vein (type IV) showing the centimeter-scale banding of quartz and Fe-Li-micas at stage IV. (G) Crystallization of the banded quartz vein at stage IV, invading the W-Sn vein shown in 3E. IMA abbreviations: Qtz = Quartz; Fe-Li-mcs = Fe-Li-micas; Kfs = K-feldspar; Toz = Topaz; Wf = Wolframite.
The Maoping rare metal granite has been dated at 151.8 ± 2.9 Ma (SHRIMP U-Pb on
zircon, Feng et al., 2011), and the deep greisen bodies and the W-Sn-bearing veins at 155.3
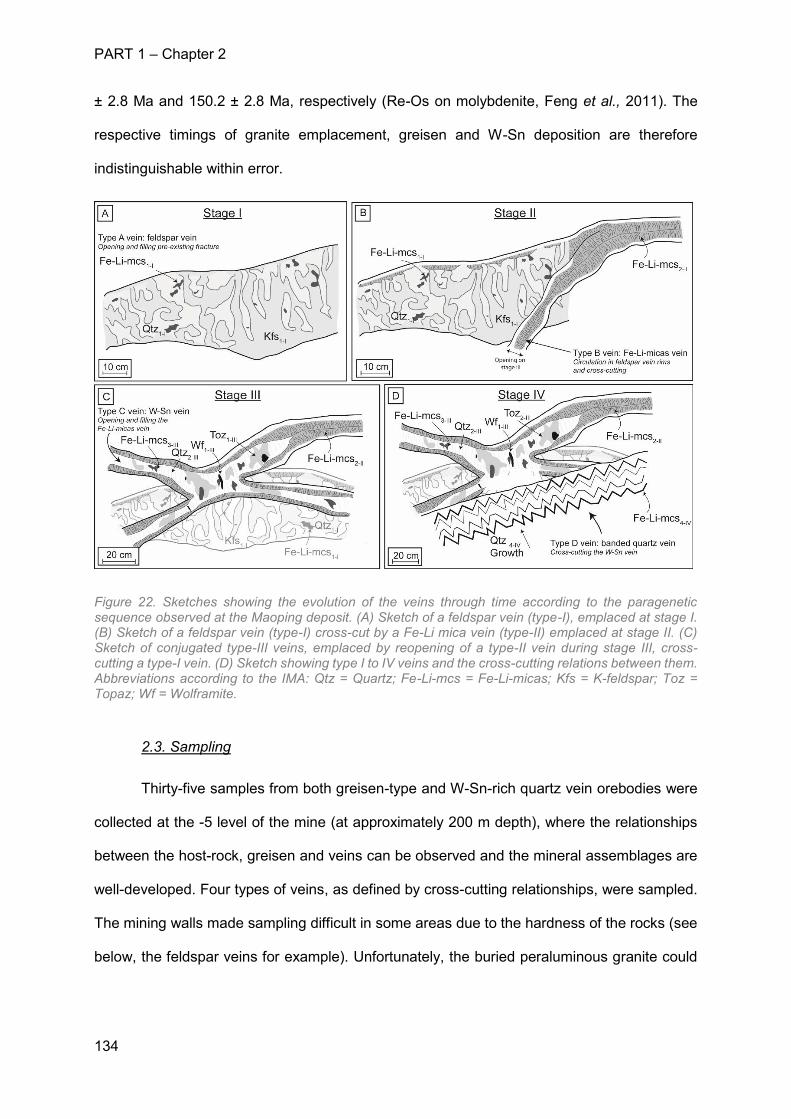
PART 1 – Chapter 2
134
± 2.8 Ma and 150.2 ± 2.8 Ma, respectively (Re-Os on molybdenite, Feng et al., 2011). The
respective timings of granite emplacement, greisen and W-Sn deposition are therefore
indistinguishable within error.
Figure 22. Sketches showing the evolution of the veins through time according to the paragenetic sequence observed at the Maoping deposit. (A) Sketch of a feldspar vein (type-I), emplaced at stage I. (B) Sketch of a feldspar vein (type-I) cross-cut by a Fe-Li mica vein (type-II) emplaced at stage II. (C) Sketch of conjugated type-III veins, emplaced by reopening of a type-II vein during stage III, cross-cutting a type-I vein. (D) Sketch showing type I to IV veins and the cross-cutting relations between them. Abbreviations according to the IMA: Qtz = Quartz; Fe-Li-mcs = Fe-Li-micas; Kfs = K-feldspar; Toz = Topaz; Wf = Wolframite.
2.3. Sampling
Thirty-five samples from both greisen-type and W-Sn-rich quartz vein orebodies were
collected at the -5 level of the mine (at approximately 200 m depth), where the relationships
between the host-rock, greisen and veins can be observed and the mineral assemblages are
well-developed. Four types of veins, as defined by cross-cutting relationships, were sampled.
The mining walls made sampling difficult in some areas due to the hardness of the rocks (see
below, the feldspar veins for example). Unfortunately, the buried peraluminous granite could
PART 1 – Chapter 2
135
not be sampled in situ and was therefore picked from the mine dumps. The origin of these
granite samples was certified by the local miners.
3. Analytical methods
All preparations and analyses described below were carried out at the GeoRessources
laboratory (Nancy, France).
Petrographic data were obtained from observations of polished thin-sections using
conventional transmitted and reflected light microscopy and a HITACHI FEG S4800 scanning
electron microscope (SEM) equipped with an energy dispersive spectrometer (EDS), using a
Si(Li) semi-conductor detector. Cathodoluminescence (CL) was also performed on thin-
sections, using a CITL cold cathode instrument CL8200 Mk4 (15 kV and 400 mA).
Electron microprobe analyses (EPMA) of Si, Al, Fe, Mn, Mg, Ca, Na, K, Ti, Rb and F
were performed on Li-bearing micas using a CAMECA SX100 instrument equipped with a
wavelength dispersive spectrometer (WDS) and calibrated using natural and synthetic oxides
and silicates (albite, olivine, Al2O3, orthose, andradite, MnTiO3, hematite, cassiterite, RbTiPO5,
topaz, scheelite, LiTaO3 and LiNbO3). A current of 12 nA and an accelerating voltage of 15 kV
was used for silicates (20kV and 20nA for W and Sn) with a counting time of 10 s per element.
Special attention was paid to the fluorine measurements and a spectrometer was used for this
element only (average detection limit of 1300 ppm). Total Fe is presented as FeO.
Major, minor and trace elements (7Li, 28Si, 39K, 43Ca, 85Rb, 88Sr, 89Y, 93Nb, 118Sn, 133Cs,
181Ta, 182W) were measured in Li-bearing micas using a LA-ICPMS instrumental setup similar
to that described in Leisen et al. (2012) and Lach et al. (2013), with a GeoLas excimer laser
(ArF, 193 nm, Microlas, Göttingen, Germany) (Günther et al., 1997) and an Agilent 7500c
quadrupole ICP-MS. The laser beam was focused onto the sample within a 24.5 cm3 cylindrical
ablation cell using a Schwarzschild reflective objective (magnification × 25; numerical aperture
0.4) mounted on an optical microscope (Olympus BX41) equipped with a X‒Y motorized stage
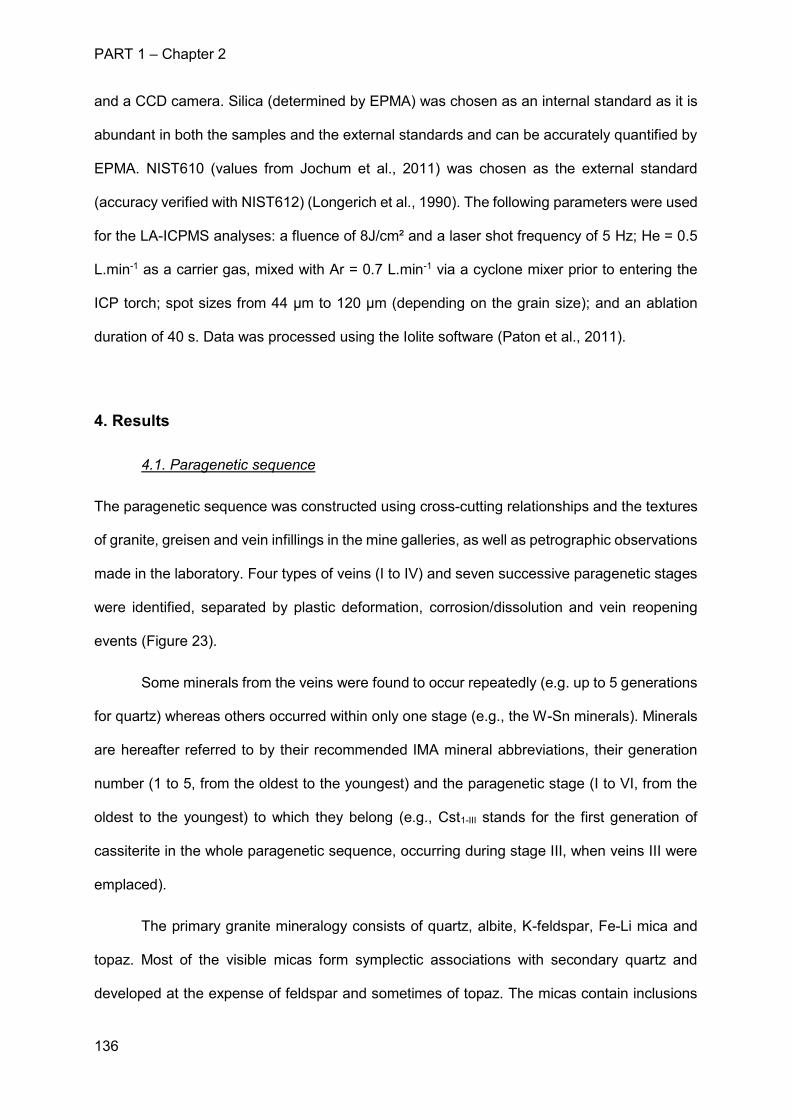
PART 1 – Chapter 2
136
and a CCD camera. Silica (determined by EPMA) was chosen as an internal standard as it is
abundant in both the samples and the external standards and can be accurately quantified by
EPMA. NIST610 (values from Jochum et al., 2011) was chosen as the external standard
(accuracy verified with NIST612) (Longerich et al., 1990). The following parameters were used
for the LA-ICPMS analyses: a fluence of 8J/cm² and a laser shot frequency of 5 Hz; He = 0.5
L.min-1 as a carrier gas, mixed with Ar = 0.7 L.min-1 via a cyclone mixer prior to entering the
ICP torch; spot sizes from 44 µm to 120 µm (depending on the grain size); and an ablation
duration of 40 s. Data was processed using the Iolite software (Paton et al., 2011).
4. Results
4.1. Paragenetic sequence
The paragenetic sequence was constructed using cross-cutting relationships and the textures
of granite, greisen and vein infillings in the mine galleries, as well as petrographic observations
made in the laboratory. Four types of veins (I to IV) and seven successive paragenetic stages
were identified, separated by plastic deformation, corrosion/dissolution and vein reopening
events (Figure 23).
Some minerals from the veins were found to occur repeatedly (e.g. up to 5 generations
for quartz) whereas others occurred within only one stage (e.g., the W-Sn minerals). Minerals
are hereafter referred to by their recommended IMA mineral abbreviations, their generation
number (1 to 5, from the oldest to the youngest) and the paragenetic stage (I to VI, from the
oldest to the youngest) to which they belong (e.g., Cst1-III stands for the first generation of
cassiterite in the whole paragenetic sequence, occurring during stage III, when veins III were
emplaced).
The primary granite mineralogy consists of quartz, albite, K-feldspar, Fe-Li mica and
topaz. Most of the visible micas form symplectic associations with secondary quartz and
developed at the expense of feldspar and sometimes of topaz. The micas contain inclusions
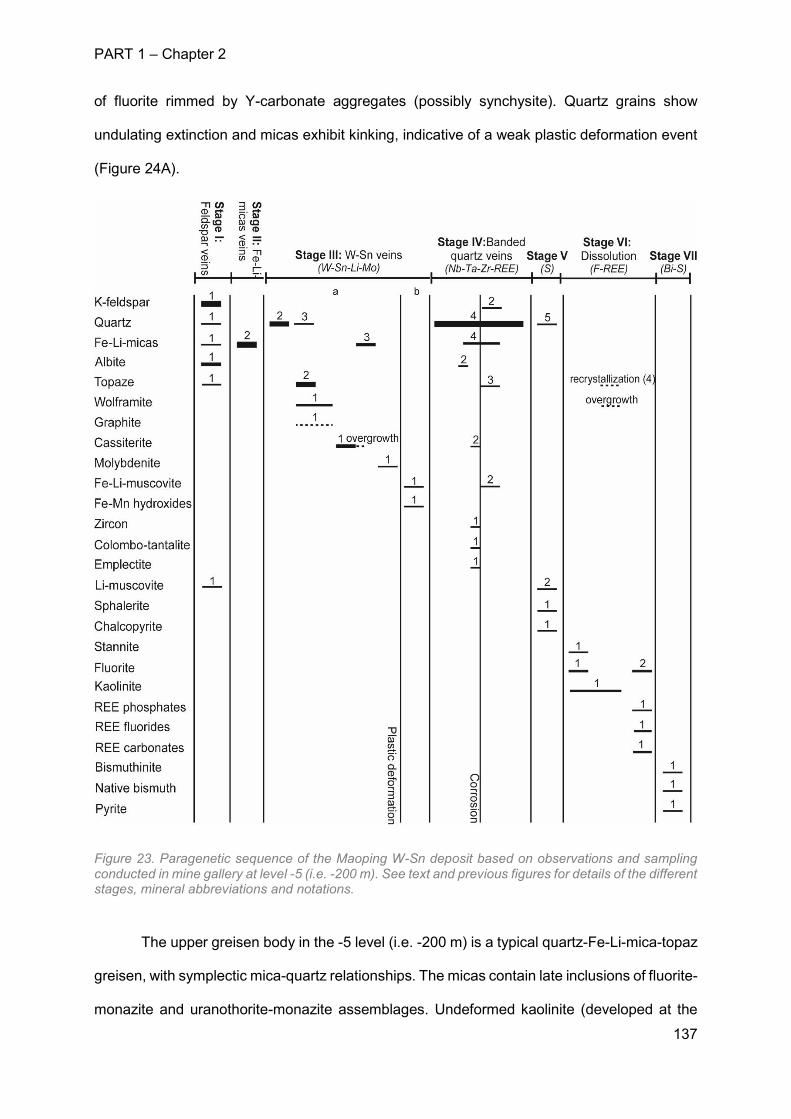
PART 1 – Chapter 2
137
of fluorite rimmed by Y-carbonate aggregates (possibly synchysite). Quartz grains show
undulating extinction and micas exhibit kinking, indicative of a weak plastic deformation event
(Figure 24A).
Figure 23. Paragenetic sequence of the Maoping W-Sn deposit based on observations and sampling conducted in mine gallery at level -5 (i.e. -200 m). See text and previous figures for details of the different stages, mineral abbreviations and notations.
The upper greisen body in the -5 level (i.e. -200 m) is a typical quartz-Fe-Li-mica-topaz
greisen, with symplectic mica-quartz relationships. The micas contain late inclusions of fluorite-
monazite and uranothorite-monazite assemblages. Undeformed kaolinite (developed at the
PART 1 – Chapter 2
138
expense of topaz) and fluorite are also present (Figure 24B). Like the granite, the greisen
underwent weak plastic deformation. The granite-greisen relationship could not be observed
but all granite samples display evidence for incipient greisenisation, consistent with the
development of the greisen at the expense of primary magmatic minerals in the peraluminous
granite (Figure 20B).
Stages I to IV are associated with veining, whereas stages V and VI correspond to
recrystallization, overgrowth, replacement of pre-existing minerals and cavity filling within the
veins. Vein-types II and III are ubiquitous in the sampling area.
Stage I consists of the early formed type I veins (feldspar veins). These are half a meter
thick and contain intergrown microcline (Kfs1-I), quartz (Qtz1-I) and Fe-Li-mica (Fe-Li-mcs1-I).
Feldspar crystals (up to 20 cm in size) are euhedral and show exsolution of Ab1,I and growth
zones marked by Qtz1-I, Toz1-I and Fe-Li-mcs1-I (Figure 21A,B, Figure 22 and Figure 24C).
Stage II consists of the type II veins (Fe-Li-micas veins), which cross-cut the type I
veins (Figure 22). The type II veins are composed of large (1 to 5 cm) feather-like Fe-Li-micas
(Fe-Li-mcs2-II; Figure 21C). The veins are sometimes crosscut by type III veins (Figure 21D)
but are mostly reopened and filled with Qtz2-III (Figure 21C, Figure 22 and Figure 24D).
Stage III consists of the ore-bearing type III veins (W-Sn veins). These are mostly sub-
horizontal and tens of centimetres to a metre in thickness, and occur as conjugated sets
(Figure 21E, Figure 22 and Figure 24F). Some type III veins are clearly observed in the field
as having formed from reopening of the type II veins. The stage III minerals are quartz (Qtz2-
III), wolframite (Wf1-III), cassiterite (Cst1-III), topaz (Toz2-III), Fe-Li-micas (Fe-Li-mcs3-III),
molybdenite (Mlb1-III), Fe-Li-muscovite (Li-Fe-ms1-III) and Fe-Mn hydroxides. Evidence for
plastic deformation within the type III veins allows two successive mineral assemblages (IIIa
and IIIb) to be distinguished.
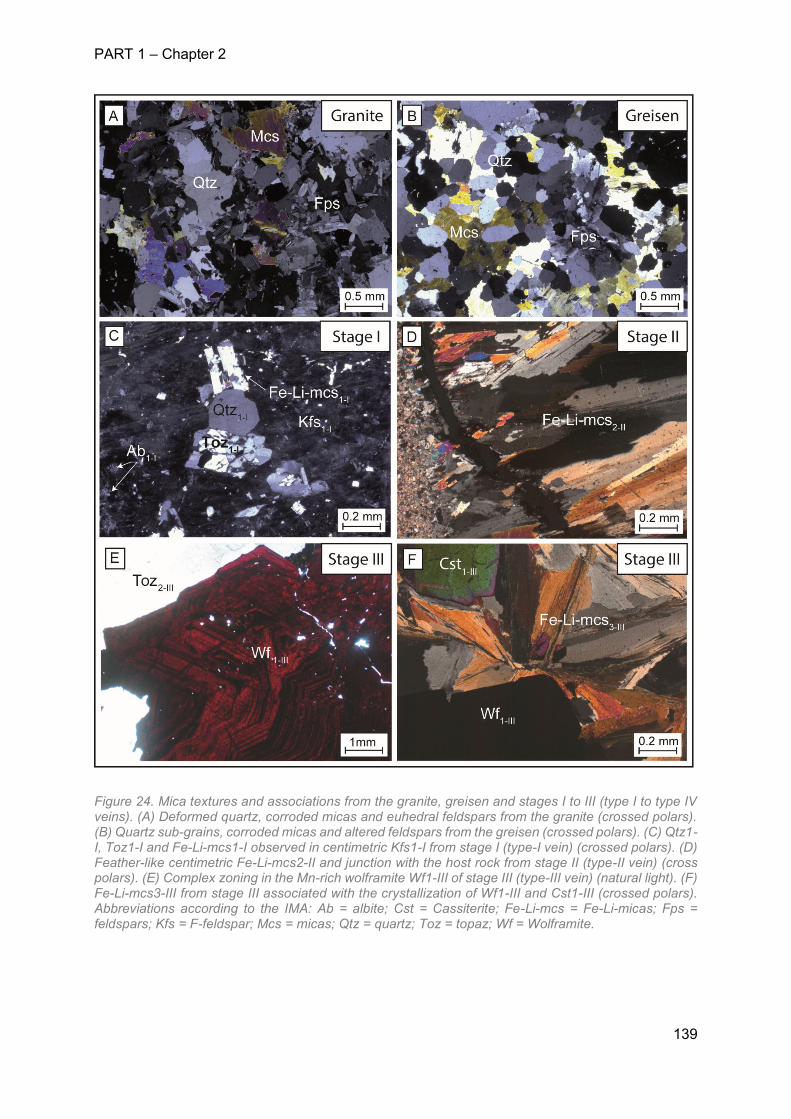
PART 1 – Chapter 2
139
Figure 24. Mica textures and associations from the granite, greisen and stages I to III (type I to type IV veins). (A) Deformed quartz, corroded micas and euhedral feldspars from the granite (crossed polars). (B) Quartz sub-grains, corroded micas and altered feldspars from the greisen (crossed polars). (C) Qtz1-I, Toz1-I and Fe-Li-mcs1-I observed in centimetric Kfs1-I from stage I (type-I vein) (crossed polars). (D) Feather-like centimetric Fe-Li-mcs2-II and junction with the host rock from stage II (type-II vein) (cross polars). (E) Complex zoning in the Mn-rich wolframite Wf1-III of stage III (type-III vein) (natural light). (F) Fe-Li-mcs3-III from stage III associated with the crystallization of Wf1-III and Cst1-III (crossed polars). Abbreviations according to the IMA: Ab = albite; Cst = Cassiterite; Fe-Li-mcs = Fe-Li-micas; Fps = feldspars; Kfs = F-feldspar; Mcs = micas; Qtz = quartz; Toz = topaz; Wf = Wolframite.
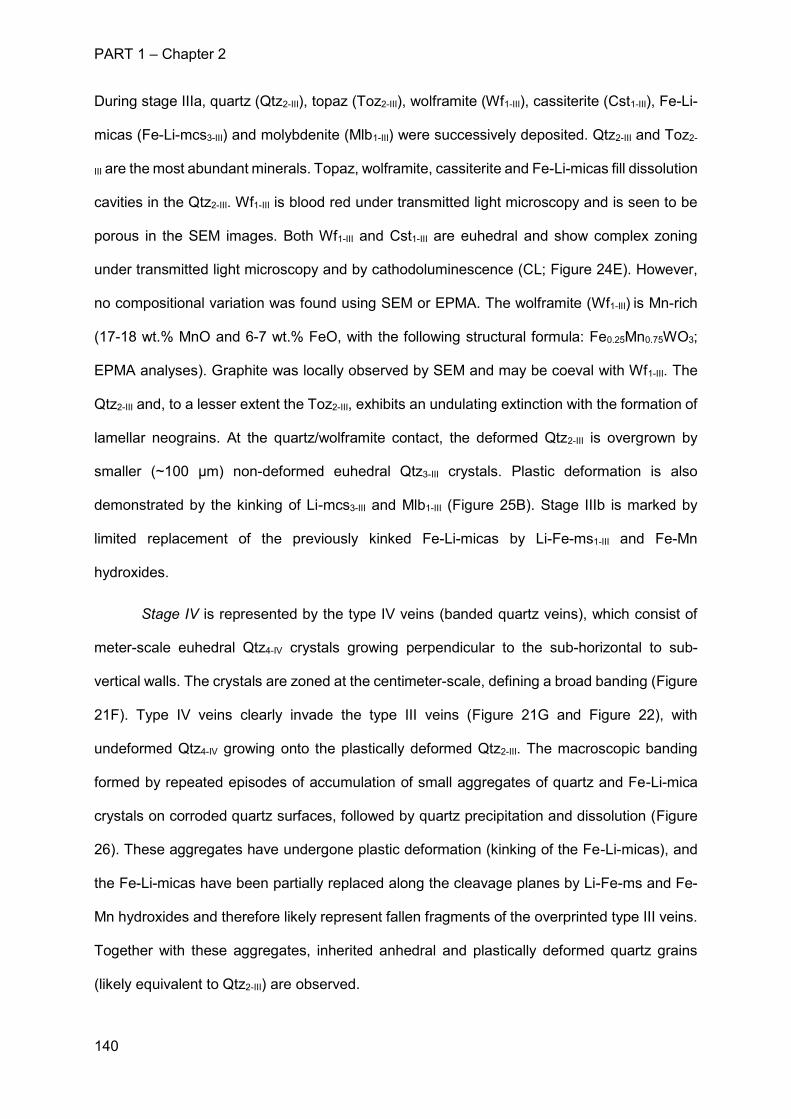
PART 1 – Chapter 2
140
During stage IIIa, quartz (Qtz2-III), topaz (Toz2-III), wolframite (Wf1-III), cassiterite (Cst1-III), Fe-Li-
micas (Fe-Li-mcs3-III) and molybdenite (Mlb1-III) were successively deposited. Qtz2-III and Toz2-
III are the most abundant minerals. Topaz, wolframite, cassiterite and Fe-Li-micas fill dissolution
cavities in the Qtz2-III. Wf1-III is blood red under transmitted light microscopy and is seen to be
porous in the SEM images. Both Wf1-III and Cst1-III are euhedral and show complex zoning
under transmitted light microscopy and by cathodoluminescence (CL; Figure 24E). However,
no compositional variation was found using SEM or EPMA. The wolframite (Wf1-III) is Mn-rich
(17-18 wt.% MnO and 6-7 wt.% FeO, with the following structural formula: Fe0.25Mn0.75WO3;
EPMA analyses). Graphite was locally observed by SEM and may be coeval with Wf1-III. The
Qtz2-III and, to a lesser extent the Toz2-III, exhibits an undulating extinction with the formation of
lamellar neograins. At the quartz/wolframite contact, the deformed Qtz2-III is overgrown by
smaller (~100 µm) non-deformed euhedral Qtz3-III crystals. Plastic deformation is also
demonstrated by the kinking of Li-mcs3-III and Mlb1-III (Figure 25B). Stage IIIb is marked by
limited replacement of the previously kinked Fe-Li-micas by Li-Fe-ms1-III and Fe-Mn
hydroxides.
Stage IV is represented by the type IV veins (banded quartz veins), which consist of
meter-scale euhedral Qtz4-IV crystals growing perpendicular to the sub-horizontal to sub-
vertical walls. The crystals are zoned at the centimeter-scale, defining a broad banding (Figure
21F). Type IV veins clearly invade the type III veins (Figure 21G and Figure 22), with
undeformed Qtz4-IV growing onto the plastically deformed Qtz2-III. The macroscopic banding
formed by repeated episodes of accumulation of small aggregates of quartz and Fe-Li-mica
crystals on corroded quartz surfaces, followed by quartz precipitation and dissolution (Figure
26). These aggregates have undergone plastic deformation (kinking of the Fe-Li-micas), and
the Fe-Li-micas have been partially replaced along the cleavage planes by Li-Fe-ms and Fe-
Mn hydroxides and therefore likely represent fallen fragments of the overprinted type III veins.
Together with these aggregates, inherited anhedral and plastically deformed quartz grains
(likely equivalent to Qtz2-III) are observed.
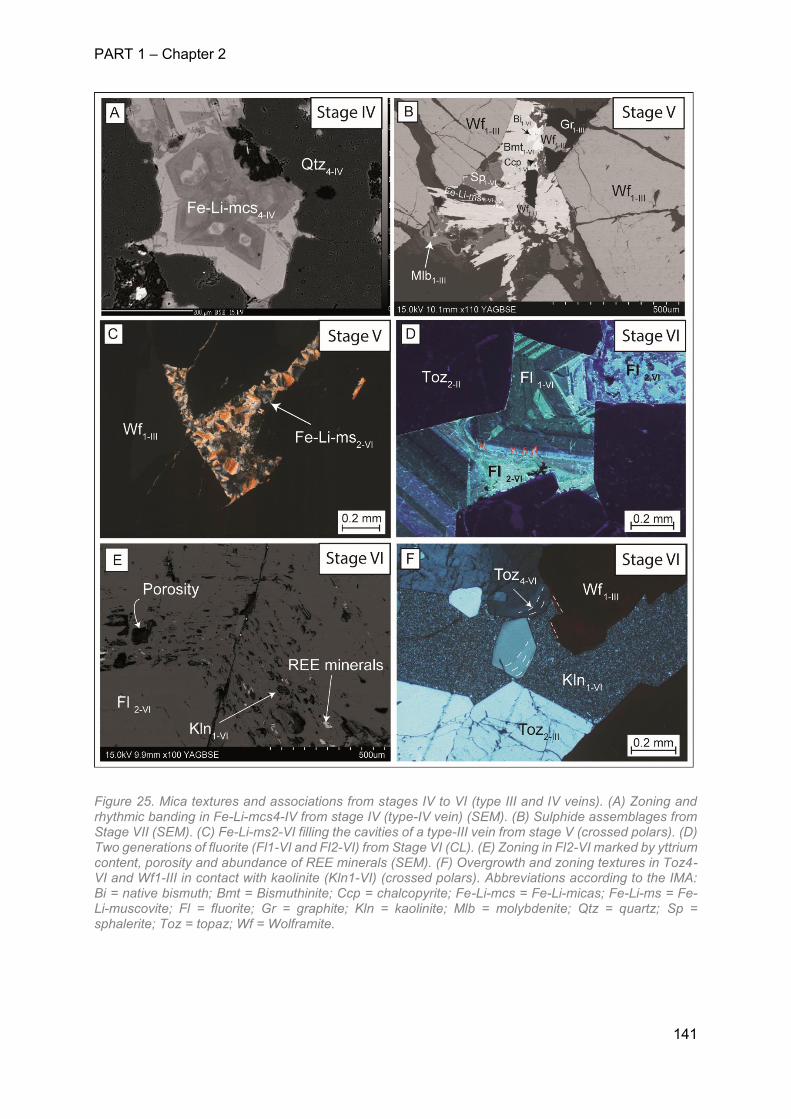
PART 1 – Chapter 2
141
Figure 25. Mica textures and associations from stages IV to VI (type III and IV veins). (A) Zoning and rhythmic banding in Fe-Li-mcs4-IV from stage IV (type-IV vein) (SEM). (B) Sulphide assemblages from Stage VII (SEM). (C) Fe-Li-ms2-VI filling the cavities of a type-III vein from stage V (crossed polars). (D) Two generations of fluorite (Fl1-VI and Fl2-VI) from Stage VI (CL). (E) Zoning in Fl2-VI marked by yttrium content, porosity and abundance of REE minerals (SEM). (F) Overgrowth and zoning textures in Toz4-VI and Wf1-III in contact with kaolinite (Kln1-VI) (crossed polars). Abbreviations according to the IMA: Bi = native bismuth; Bmt = Bismuthinite; Ccp = chalcopyrite; Fe-Li-mcs = Fe-Li-micas; Fe-Li-ms = Fe-Li-muscovite; Fl = fluorite; Gr = graphite; Kln = kaolinite; Mlb = molybdenite; Qtz = quartz; Sp = sphalerite; Toz = topaz; Wf = Wolframite.
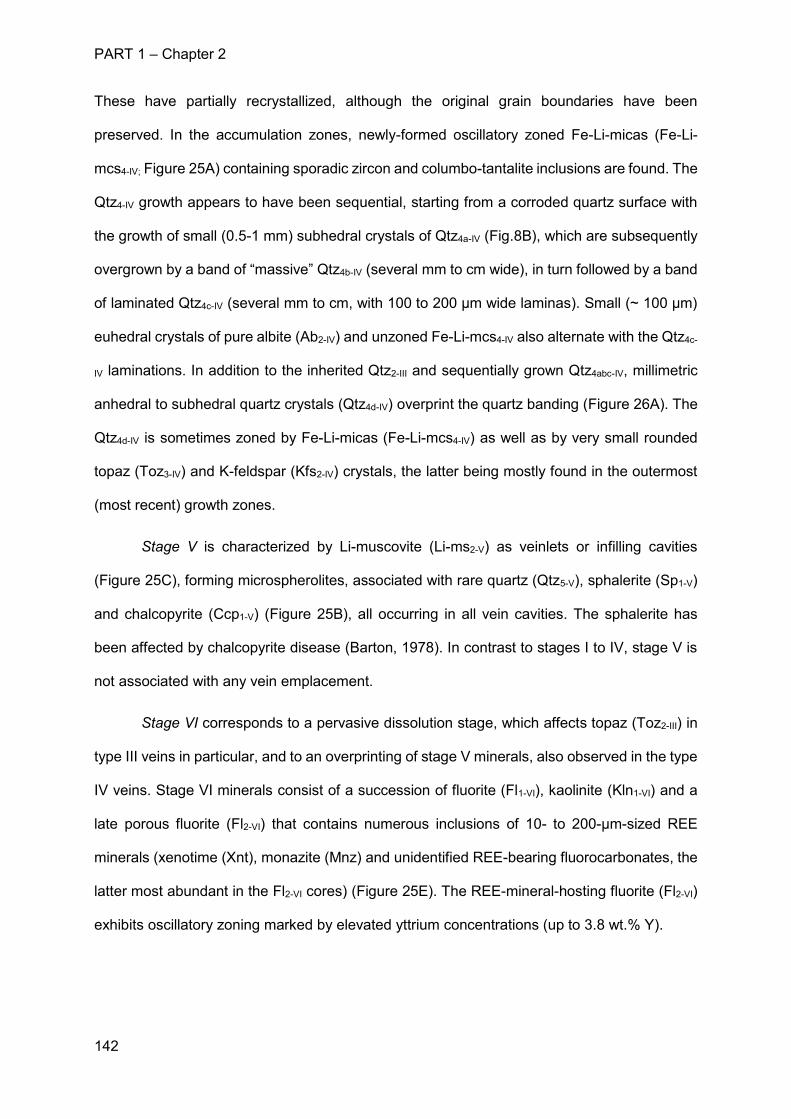
PART 1 – Chapter 2
142
These have partially recrystallized, although the original grain boundaries have been
preserved. In the accumulation zones, newly-formed oscillatory zoned Fe-Li-micas (Fe-Li-
mcs4-IV; Figure 25A) containing sporadic zircon and columbo-tantalite inclusions are found. The
Qtz4-IV growth appears to have been sequential, starting from a corroded quartz surface with
the growth of small (0.5-1 mm) subhedral crystals of Qtz4a-IV (Fig.8B), which are subsequently
overgrown by a band of “massive” Qtz4b-IV (several mm to cm wide), in turn followed by a band
of laminated Qtz4c-IV (several mm to cm, with 100 to 200 µm wide laminas). Small (~ 100 µm)
euhedral crystals of pure albite (Ab2-IV) and unzoned Fe-Li-mcs4-IV also alternate with the Qtz4c-
IV laminations. In addition to the inherited Qtz2-III and sequentially grown Qtz4abc-IV, millimetric
anhedral to subhedral quartz crystals (Qtz4d-IV) overprint the quartz banding (Figure 26A). The
Qtz4d-IV is sometimes zoned by Fe-Li-micas (Fe-Li-mcs4-IV) as well as by very small rounded
topaz (Toz3-IV) and K-feldspar (Kfs2-IV) crystals, the latter being mostly found in the outermost
(most recent) growth zones.
Stage V is characterized by Li-muscovite (Li-ms2-V) as veinlets or infilling cavities
(Figure 25C), forming microspherolites, associated with rare quartz (Qtz5-V), sphalerite (Sp1-V)
and chalcopyrite (Ccp1-V) (Figure 25B), all occurring in all vein cavities. The sphalerite has
been affected by chalcopyrite disease (Barton, 1978). In contrast to stages I to IV, stage V is
not associated with any vein emplacement.
Stage VI corresponds to a pervasive dissolution stage, which affects topaz (Toz2-III) in
type III veins in particular, and to an overprinting of stage V minerals, also observed in the type
IV veins. Stage VI minerals consist of a succession of fluorite (Fl1-VI), kaolinite (Kln1-VI) and a
late porous fluorite (Fl2-VI) that contains numerous inclusions of 10- to 200-µm-sized REE
minerals (xenotime (Xnt), monazite (Mnz) and unidentified REE-bearing fluorocarbonates, the
latter most abundant in the Fl2-VI cores) (Figure 25E). The REE-mineral-hosting fluorite (Fl2-VI)
exhibits oscillatory zoning marked by elevated yttrium concentrations (up to 3.8 wt.% Y).
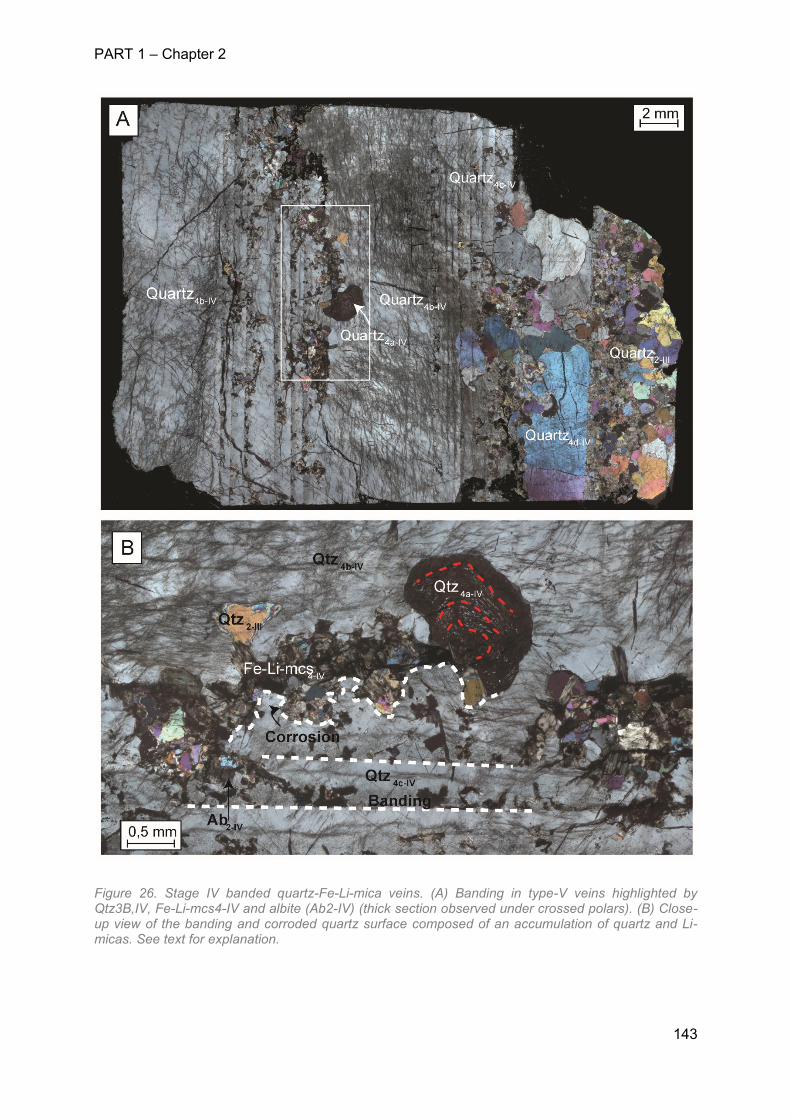
PART 1 – Chapter 2
143
Figure 26. Stage IV banded quartz-Fe-Li-mica veins. (A) Banding in type-V veins highlighted by Qtz3B,IV, Fe-Li-mcs4-IV and albite (Ab2-IV) (thick section observed under crossed polars). (B) Close-up view of the banding and corroded quartz surface composed of an accumulation of quartz and Li-micas. See text for explanation.
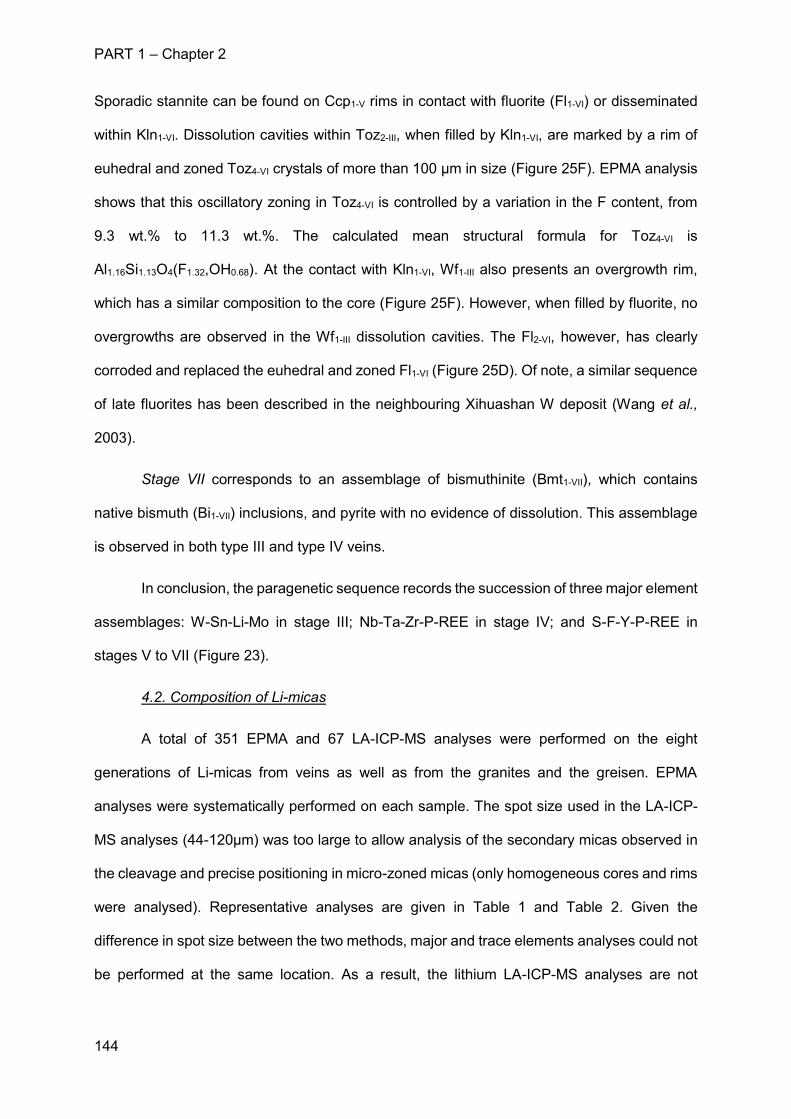
PART 1 – Chapter 2
144
Sporadic stannite can be found on Ccp1-V rims in contact with fluorite (Fl1-VI) or disseminated
within Kln1-VI. Dissolution cavities within Toz2-III, when filled by Kln1-VI, are marked by a rim of
euhedral and zoned Toz4-VI crystals of more than 100 µm in size (Figure 25F). EPMA analysis
shows that this oscillatory zoning in Toz4-VI is controlled by a variation in the F content, from
9.3 wt.% to 11.3 wt.%. The calculated mean structural formula for Toz4-VI is
Al1.16Si1.13O4(F1.32,OH0.68). At the contact with Kln1-VI, Wf1-III also presents an overgrowth rim,
which has a similar composition to the core (Figure 25F). However, when filled by fluorite, no
overgrowths are observed in the Wf1-III dissolution cavities. The Fl2-VI, however, has clearly
corroded and replaced the euhedral and zoned Fl1-VI (Figure 25D). Of note, a similar sequence
of late fluorites has been described in the neighbouring Xihuashan W deposit (Wang et al.,
2003).
Stage VII corresponds to an assemblage of bismuthinite (Bmt1-VII), which contains
native bismuth (Bi1-VII) inclusions, and pyrite with no evidence of dissolution. This assemblage
is observed in both type III and type IV veins.
In conclusion, the paragenetic sequence records the succession of three major element
assemblages: W-Sn-Li-Mo in stage III; Nb-Ta-Zr-P-REE in stage IV; and S-F-Y-P-REE in
stages V to VII (Figure 23).
4.2. Composition of Li-micas
A total of 351 EPMA and 67 LA-ICP-MS analyses were performed on the eight
generations of Li-micas from veins as well as from the granites and the greisen. EPMA
analyses were systematically performed on each sample. The spot size used in the LA-ICP-
MS analyses (44-120µm) was too large to allow analysis of the secondary micas observed in
the cleavage and precise positioning in micro-zoned micas (only homogeneous cores and rims
were analysed). Representative analyses are given in Table 1 and Table 2. Given the
difference in spot size between the two methods, major and trace elements analyses could not
be performed at the same location. As a result, the lithium LA-ICP-MS analyses are not
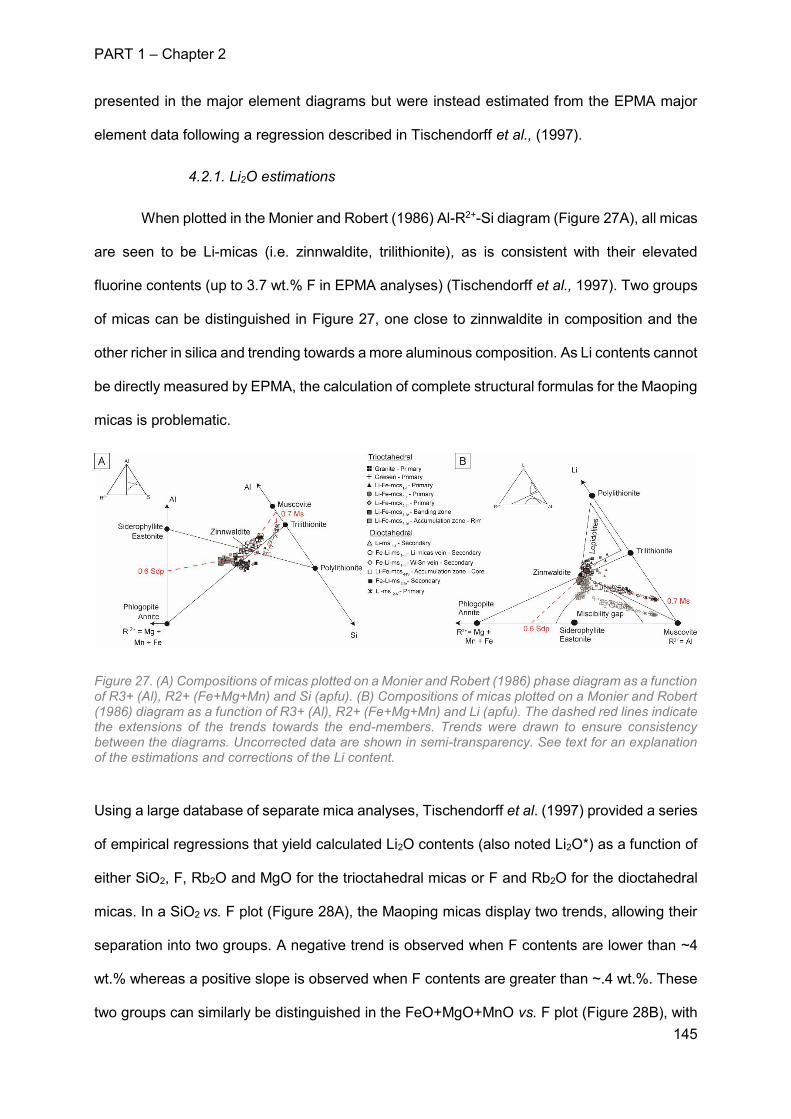
PART 1 – Chapter 2
145
presented in the major element diagrams but were instead estimated from the EPMA major
element data following a regression described in Tischendorff et al., (1997).
4.2.1. Li2O estimations
When plotted in the Monier and Robert (1986) Al-R2+-Si diagram (Figure 27A), all micas
are seen to be Li-micas (i.e. zinnwaldite, trilithionite), as is consistent with their elevated
fluorine contents (up to 3.7 wt.% F in EPMA analyses) (Tischendorff et al., 1997). Two groups
of micas can be distinguished in Figure 27, one close to zinnwaldite in composition and the
other richer in silica and trending towards a more aluminous composition. As Li contents cannot
be directly measured by EPMA, the calculation of complete structural formulas for the Maoping
micas is problematic.
Figure 27. (A) Compositions of micas plotted on a Monier and Robert (1986) phase diagram as a function of R3+ (Al), R2+ (Fe+Mg+Mn) and Si (apfu). (B) Compositions of micas plotted on a Monier and Robert (1986) diagram as a function of R3+ (Al), R2+ (Fe+Mg+Mn) and Li (apfu). The dashed red lines indicate the extensions of the trends towards the end-members. Trends were drawn to ensure consistency between the diagrams. Uncorrected data are shown in semi-transparency. See text for an explanation of the estimations and corrections of the Li content.
Using a large database of separate mica analyses, Tischendorff et al. (1997) provided a series
of empirical regressions that yield calculated Li2O contents (also noted Li2O*) as a function of
either SiO2, F, Rb2O and MgO for the trioctahedral micas or F and Rb2O for the dioctahedral
micas. In a SiO2 vs. F plot (Figure 28A), the Maoping micas display two trends, allowing their
separation into two groups. A negative trend is observed when F contents are lower than ~4
wt.% whereas a positive slope is observed when F contents are greater than ~.4 wt.%. These
two groups can similarly be distinguished in the FeO+MgO+MnO vs. F plot (Figure 28B), with
PART 1 – Chapter 2
146
a positive trend observed for FeO+MgO+MnO contents below ~13 wt.% and a negative trend
observed when FeO+MgO+MnO contents are greater than ~13 wt.%. The two groups thus
correspond to di- and trioctahedral-like structures, respectively.
Figure 28. Discriminant composition diagrams for trioctahedral and dioctahedral micas from the Maoping W-Sn deposit. (A) F-SiO2 covariation. (B) F and (FeO+MgO+MnO) diagram. See EPMA data in Table 1.
Li2O contents were first estimated using SiO2 regression for the dominantly
trioctahedral micas (Li2O=0.298xSiO2-9.658) and F regression for the dominantly dioctahedral
micas (Li2O=0.395x(F1.326)). However, for each regression proposed by Tischendorff et al.
(1997), when plotted in the Monier and Robert (1986) R2+-Al-Li diagram, most compositions
fall inside the miscibility gap defined experimentally by Monier and Robert (1986) (Figure 27B).
Because Li2O* therefore appears to be systematically underestimated using this method, a
correction needs to be applied to Li2O* in order to correctly estimate the Li2O contents. In
Figure 9, the Fe-Li (trioctahedral) micas trend towards an intermediate composition between
annite and siderophyllite (~0.6 siderophyllite mole fraction), while the dominantly dioctahedral
micas trend towards an intermediate composition between muscovite and trilithionite (~0.7
muscovite mole fraction). With these constraints, the best fit in the R2+-Al-Li diagram is
achieved by adding 1.5 wt.% to all Li2O* values in order to compensate for the bias (Figure
27B). The underestimation might be due to the mainly magmatic database used by Tischendorf
et al., (1997), which would therefore require adjustment for hydrothermal systems.
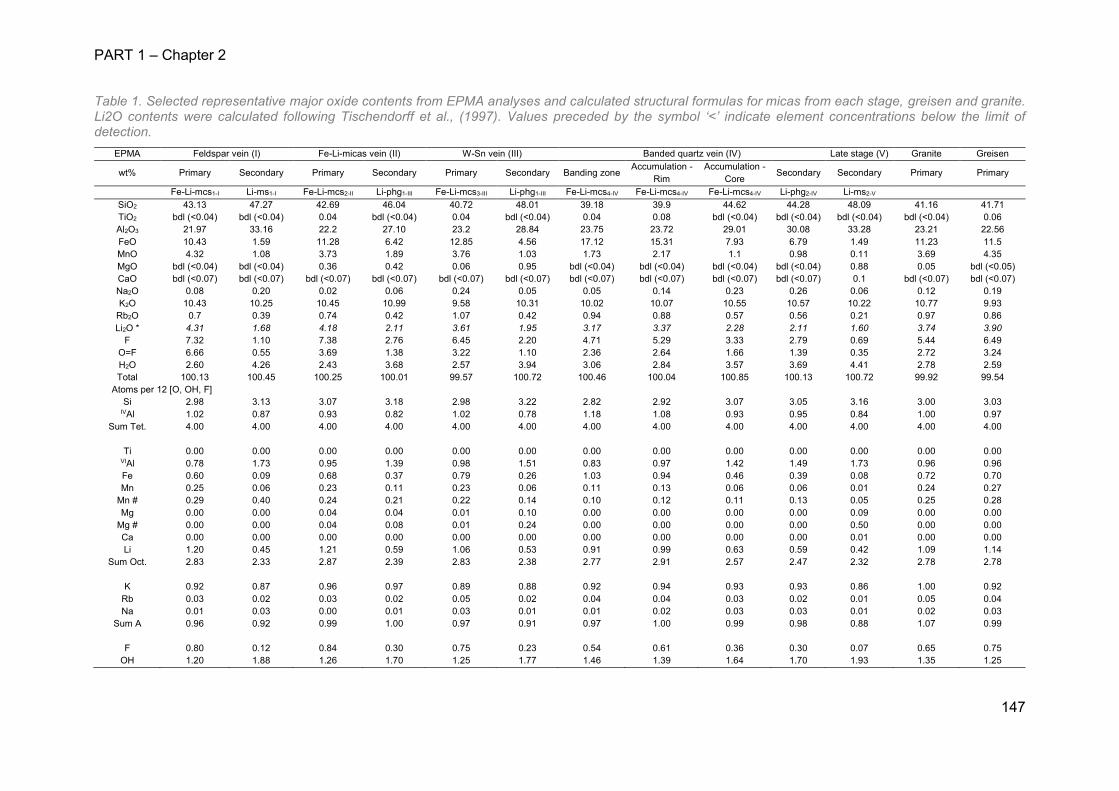
PART 1 – Chapter 2
147
Table 1. Selected representative major oxide contents from EPMA analyses and calculated structural formulas for micas from each stage, greisen and granite. Li2O contents were calculated following Tischendorff et al., (1997). Values preceded by the symbol ‘<’ indicate element concentrations below the limit of detection.
EPMA Feldspar vein (I) Fe-Li-micas vein (II) W-Sn vein (III) Banded quartz vein (IV) Late stage (V) Granite Greisen
wt% Primary Secondary Primary Secondary Primary Secondary Banding zone Accumulation -
Rim Accumulation -
Core Secondary Secondary Primary Primary
Fe-Li-mcs1-I Li-ms1-I Fe-Li-mcs2-II Li-phg1-III Fe-Li-mcs3-III Li-phg1-III Fe-Li-mcs4-IV Fe-Li-mcs4-IV Fe-Li-mcs4-IV Li-phg2-IV Li-ms2-V SiO2 43.13 47.27 42.69 46.04 40.72 48.01 39.18 39.9 44.62 44.28 48.09 41.16 41.71 TiO2 bdl (<0.04) bdl (<0.04) 0.04 bdl (<0.04) 0.04 bdl (<0.04) 0.04 0.08 bdl (<0.04) bdl (<0.04) bdl (<0.04) bdl (<0.04) 0.06 Al2O3 21.97 33.16 22.2 27.10 23.2 28.84 23.75 23.72 29.01 30.08 33.28 23.21 22.56 FeO 10.43 1.59 11.28 6.42 12.85 4.56 17.12 15.31 7.93 6.79 1.49 11.23 11.5 MnO 4.32 1.08 3.73 1.89 3.76 1.03 1.73 2.17 1.1 0.98 0.11 3.69 4.35 MgO bdl (<0.04) bdl (<0.04) 0.36 0.42 0.06 0.95 bdl (<0.04) bdl (<0.04) bdl (<0.04) bdl (<0.04) 0.88 0.05 bdl (<0.05) CaO bdl (<0.07) bdl (<0.07) bdl (<0.07) bdl (<0.07) bdl (<0.07) bdl (<0.07) bdl (<0.07) bdl (<0.07) bdl (<0.07) bdl (<0.07) 0.1 bdl (<0.07) bdl (<0.07) Na2O 0.08 0.20 0.02 0.06 0.24 0.05 0.05 0.14 0.23 0.26 0.06 0.12 0.19 K2O 10.43 10.25 10.45 10.99 9.58 10.31 10.02 10.07 10.55 10.57 10.22 10.77 9.93
Rb2O 0.7 0.39 0.74 0.42 1.07 0.42 0.94 0.88 0.57 0.56 0.21 0.97 0.86 Li2O * 4.31 1.68 4.18 2.11 3.61 1.95 3.17 3.37 2.28 2.11 1.60 3.74 3.90
F 7.32 1.10 7.38 2.76 6.45 2.20 4.71 5.29 3.33 2.79 0.69 5.44 6.49 O=F 6.66 0.55 3.69 1.38 3.22 1.10 2.36 2.64 1.66 1.39 0.35 2.72 3.24 H2O 2.60 4.26 2.43 3.68 2.57 3.94 3.06 2.84 3.57 3.69 4.41 2.78 2.59 Total 100.13 100.45 100.25 100.01 99.57 100.72 100.46 100.04 100.85 100.13 100.72 99.92 99.54
Atoms per 12 [O, OH, F] Si 2.98 3.13 3.07 3.18 2.98 3.22 2.82 2.92 3.07 3.05 3.16 3.00 3.03
IVAl 1.02 0.87 0.93 0.82 1.02 0.78 1.18 1.08 0.93 0.95 0.84 1.00 0.97 Sum Tet. 4.00 4.00 4.00 4.00 4.00 4.00 4.00 4.00 4.00 4.00 4.00 4.00 4.00
Ti 0.00 0.00 0.00 0.00 0.00 0.00 0.00 0.00 0.00 0.00 0.00 0.00 0.00
VIAl 0.78 1.73 0.95 1.39 0.98 1.51 0.83 0.97 1.42 1.49 1.73 0.96 0.96 Fe 0.60 0.09 0.68 0.37 0.79 0.26 1.03 0.94 0.46 0.39 0.08 0.72 0.70 Mn 0.25 0.06 0.23 0.11 0.23 0.06 0.11 0.13 0.06 0.06 0.01 0.24 0.27
Mn # 0.29 0.40 0.24 0.21 0.22 0.14 0.10 0.12 0.11 0.13 0.05 0.25 0.28 Mg 0.00 0.00 0.04 0.04 0.01 0.10 0.00 0.00 0.00 0.00 0.09 0.00 0.00
Mg # 0.00 0.00 0.04 0.08 0.01 0.24 0.00 0.00 0.00 0.00 0.50 0.00 0.00 Ca 0.00 0.00 0.00 0.00 0.00 0.00 0.00 0.00 0.00 0.00 0.01 0.00 0.00 Li 1.20 0.45 1.21 0.59 1.06 0.53 0.91 0.99 0.63 0.59 0.42 1.09 1.14
Sum Oct. 2.83 2.33 2.87 2.39 2.83 2.38 2.77 2.91 2.57 2.47 2.32 2.78 2.78
K 0.92 0.87 0.96 0.97 0.89 0.88 0.92 0.94 0.93 0.93 0.86 1.00 0.92 Rb 0.03 0.02 0.03 0.02 0.05 0.02 0.04 0.04 0.03 0.02 0.01 0.05 0.04 Na 0.01 0.03 0.00 0.01 0.03 0.01 0.01 0.02 0.03 0.03 0.01 0.02 0.03
Sum A 0.96 0.92 0.99 1.00 0.97 0.91 0.97 1.00 0.99 0.98 0.88 1.07 0.99
F 0.80 0.12 0.84 0.30 0.75 0.23 0.54 0.61 0.36 0.30 0.07 0.65 0.75 OH 1.20 1.88 1.26 1.70 1.25 1.77 1.46 1.39 1.64 1.70 1.93 1.35 1.25
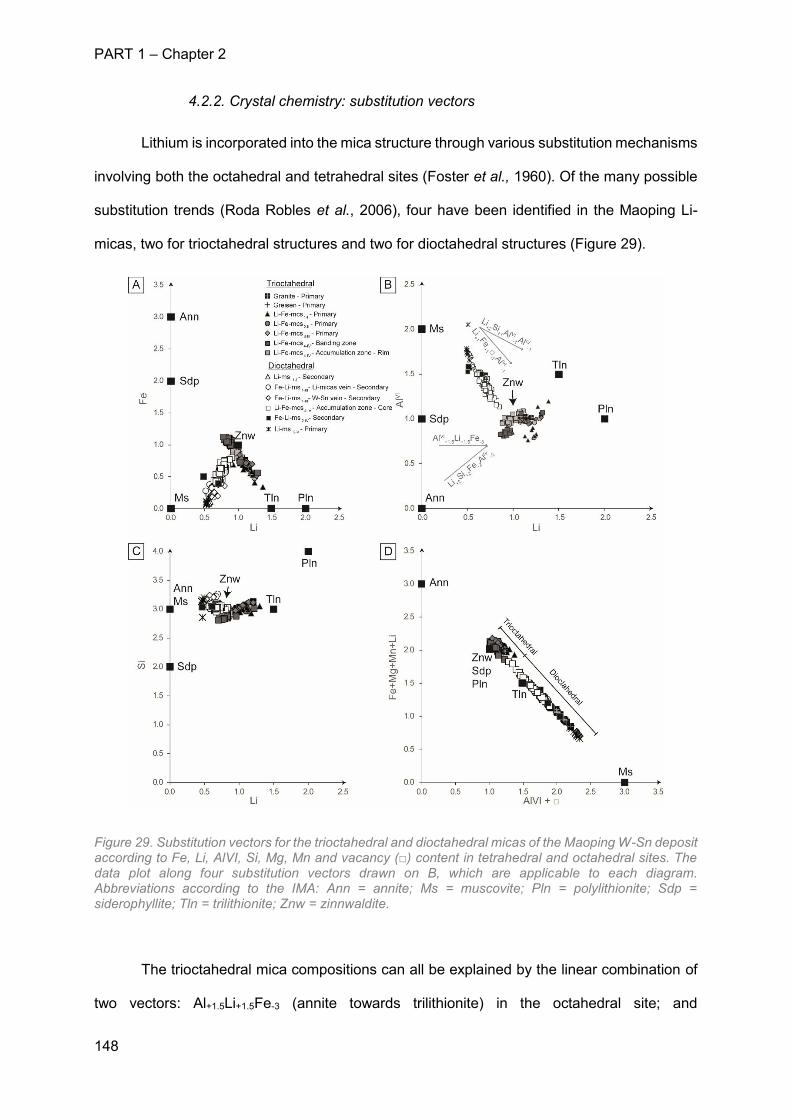
PART 1 – Chapter 2
148
4.2.2. Crystal chemistry: substitution vectors
Lithium is incorporated into the mica structure through various substitution mechanisms
involving both the octahedral and tetrahedral sites (Foster et al., 1960). Of the many possible
substitution trends (Roda Robles et al., 2006), four have been identified in the Maoping Li-
micas, two for trioctahedral structures and two for dioctahedral structures (Figure 29).
Figure 29. Substitution vectors for the trioctahedral and dioctahedral micas of the Maoping W-Sn deposit according to Fe, Li, AlVI, Si, Mg, Mn and vacancy (□) content in tetrahedral and octahedral sites. The data plot along four substitution vectors drawn on B, which are applicable to each diagram. Abbreviations according to the IMA: Ann = annite; Ms = muscovite; Pln = polylithionite; Sdp = siderophyllite; Tln = trilithionite; Znw = zinnwaldite.
The trioctahedral mica compositions can all be explained by the linear combination of
two vectors: Al+1.5Li+1.5Fe-3 (annite towards trilithionite) in the octahedral site; and
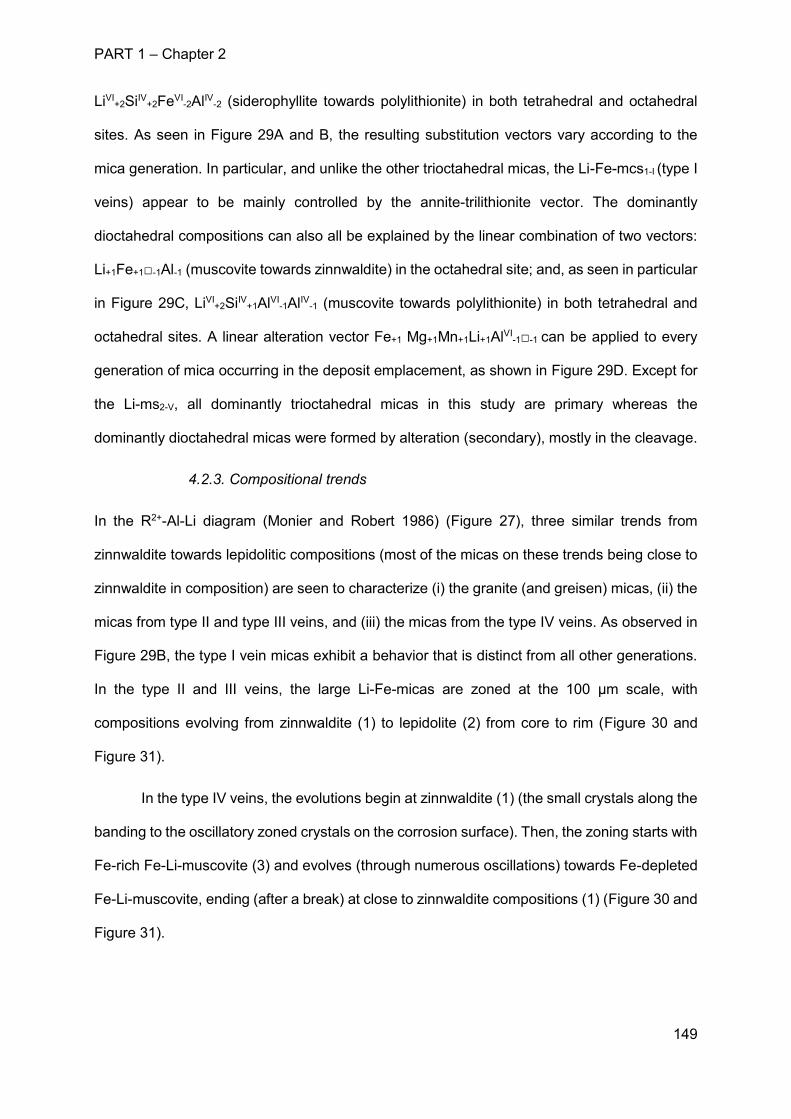
PART 1 – Chapter 2
149
LiVI+2SiIV+2FeVI
-2AlIV-2 (siderophyllite towards polylithionite) in both tetrahedral and octahedral
sites. As seen in Figure 29A and B, the resulting substitution vectors vary according to the
mica generation. In particular, and unlike the other trioctahedral micas, the Li-Fe-mcs1-I (type I
veins) appear to be mainly controlled by the annite-trilithionite vector. The dominantly
dioctahedral compositions can also all be explained by the linear combination of two vectors:
Li+1Fe+1□-1Al-1 (muscovite towards zinnwaldite) in the octahedral site; and, as seen in particular
in Figure 29C, LiVI+2SiIV+1AlVI
-1AlIV-1 (muscovite towards polylithionite) in both tetrahedral and
octahedral sites. A linear alteration vector Fe+1 Mg+1Mn+1Li+1AlVI-1□-1 can be applied to every
generation of mica occurring in the deposit emplacement, as shown in Figure 29D. Except for
the Li-ms2-V, all dominantly trioctahedral micas in this study are primary whereas the
dominantly dioctahedral micas were formed by alteration (secondary), mostly in the cleavage.
4.2.3. Compositional trends
In the R2+-Al-Li diagram (Monier and Robert 1986) (Figure 27), three similar trends from
zinnwaldite towards lepidolitic compositions (most of the micas on these trends being close to
zinnwaldite in composition) are seen to characterize (i) the granite (and greisen) micas, (ii) the
micas from type II and type III veins, and (iii) the micas from the type IV veins. As observed in
Figure 29B, the type I vein micas exhibit a behavior that is distinct from all other generations.
In the type II and III veins, the large Li-Fe-micas are zoned at the 100 µm scale, with
compositions evolving from zinnwaldite (1) to lepidolite (2) from core to rim (Figure 30 and
Figure 31).
In the type IV veins, the evolutions begin at zinnwaldite (1) (the small crystals along the
banding to the oscillatory zoned crystals on the corrosion surface). Then, the zoning starts with
Fe-rich Fe-Li-muscovite (3) and evolves (through numerous oscillations) towards Fe-depleted
Fe-Li-muscovite, ending (after a break) at close to zinnwaldite compositions (1) (Figure 30 and
Figure 31).
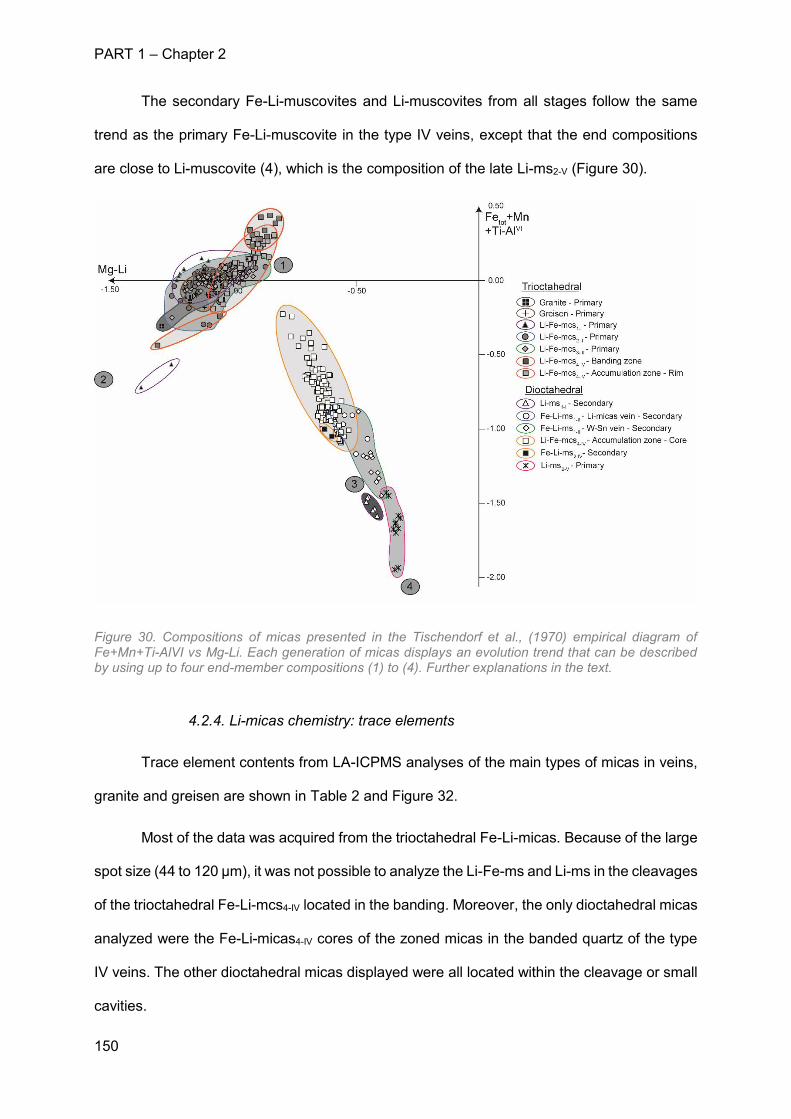
PART 1 – Chapter 2
150
The secondary Fe-Li-muscovites and Li-muscovites from all stages follow the same
trend as the primary Fe-Li-muscovite in the type IV veins, except that the end compositions
are close to Li-muscovite (4), which is the composition of the late Li-ms2-V (Figure 30).
Figure 30. Compositions of micas presented in the Tischendorf et al., (1970) empirical diagram of Fe+Mn+Ti-AlVI vs Mg-Li. Each generation of micas displays an evolution trend that can be described by using up to four end-member compositions (1) to (4). Further explanations in the text.
4.2.4. Li-micas chemistry: trace elements
Trace element contents from LA-ICPMS analyses of the main types of micas in veins,
granite and greisen are shown in Table 2 and Figure 32.
Most of the data was acquired from the trioctahedral Fe-Li-micas. Because of the large
spot size (44 to 120 µm), it was not possible to analyze the Li-Fe-ms and Li-ms in the cleavages
of the trioctahedral Fe-Li-mcs4-IV located in the banding. Moreover, the only dioctahedral micas
analyzed were the Fe-Li-micas4-IV cores of the zoned micas in the banded quartz of the type
IV veins. The other dioctahedral micas displayed were all located within the cleavage or small
cavities.
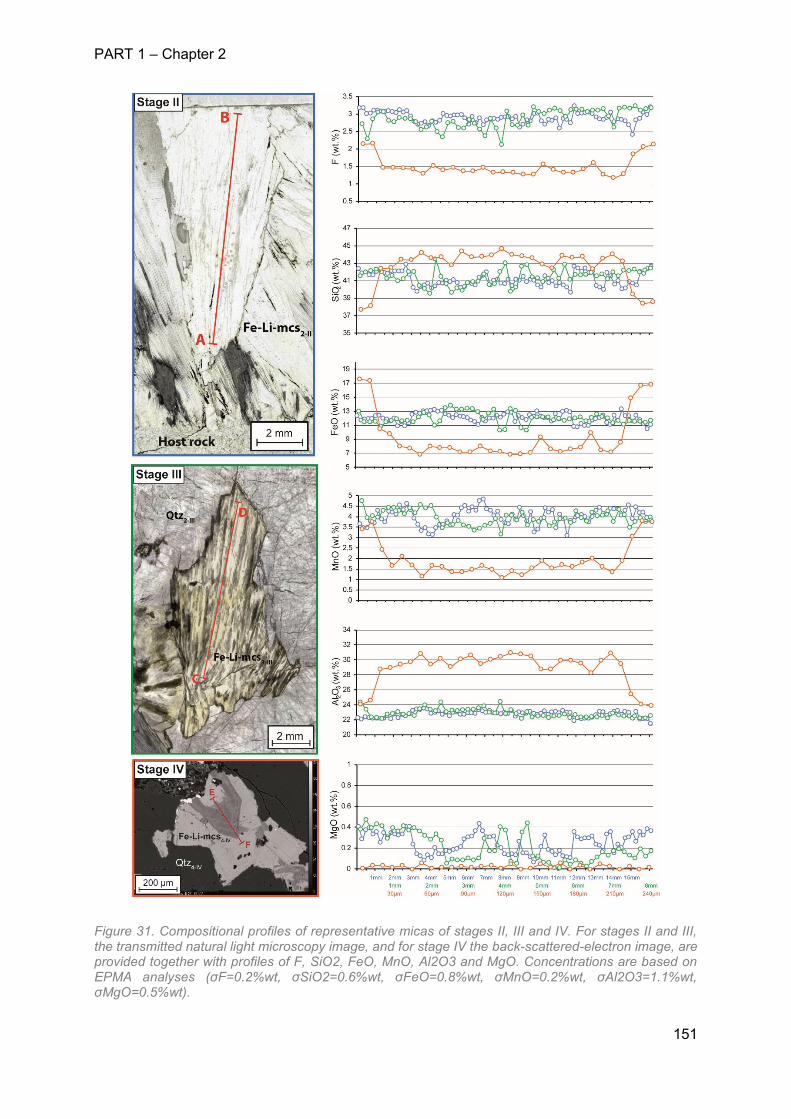
PART 1 – Chapter 2
151
Figure 31. Compositional profiles of representative micas of stages II, III and IV. For stages II and III, the transmitted natural light microscopy image, and for stage IV the back-scattered-electron image, are provided together with profiles of F, SiO2, FeO, MnO, Al2O3 and MgO. Concentrations are based on EPMA analyses (σF=0.2%wt, σSiO2=0.6%wt, σFeO=0.8%wt, σMnO=0.2%wt, σAl2O3=1.1%wt, σMgO=0.5%wt).
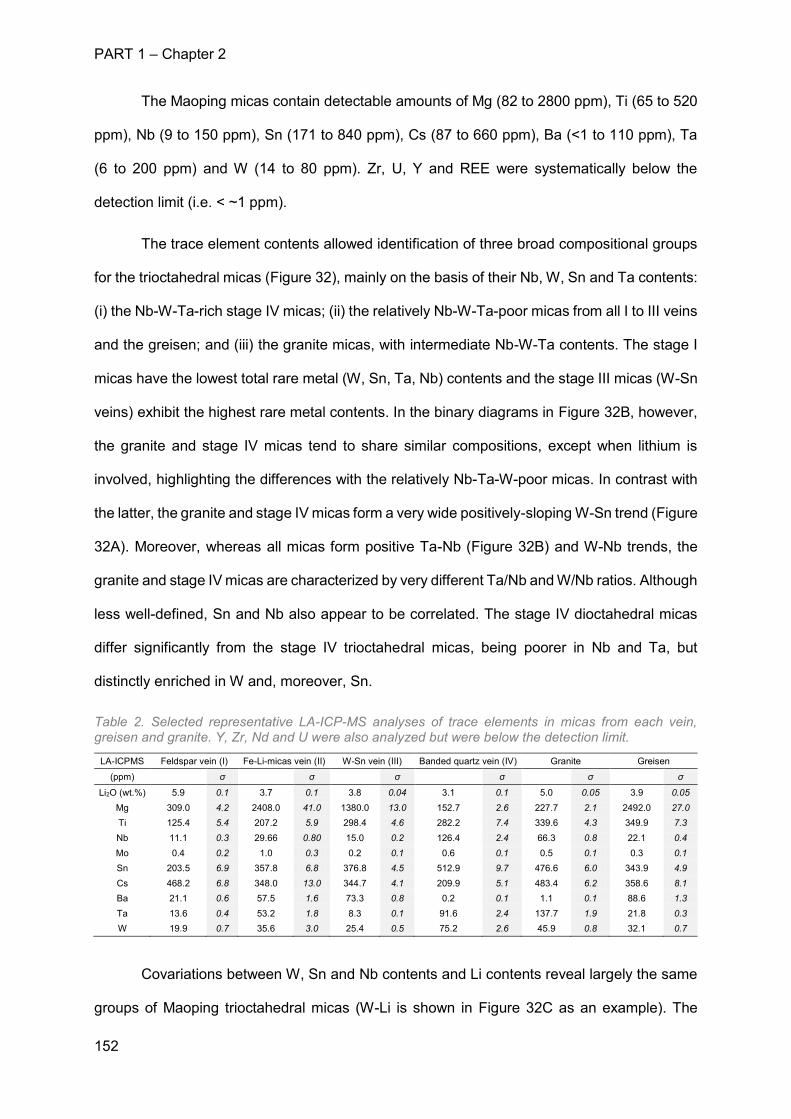
PART 1 – Chapter 2
152
The Maoping micas contain detectable amounts of Mg (82 to 2800 ppm), Ti (65 to 520
ppm), Nb (9 to 150 ppm), Sn (171 to 840 ppm), Cs (87 to 660 ppm), Ba (<1 to 110 ppm), Ta
(6 to 200 ppm) and W (14 to 80 ppm). Zr, U, Y and REE were systematically below the
detection limit (i.e. < ~1 ppm).
The trace element contents allowed identification of three broad compositional groups
for the trioctahedral micas (Figure 32), mainly on the basis of their Nb, W, Sn and Ta contents:
(i) the Nb-W-Ta-rich stage IV micas; (ii) the relatively Nb-W-Ta-poor micas from all I to III veins
and the greisen; and (iii) the granite micas, with intermediate Nb-W-Ta contents. The stage I
micas have the lowest total rare metal (W, Sn, Ta, Nb) contents and the stage III micas (W-Sn
veins) exhibit the highest rare metal contents. In the binary diagrams in Figure 32B, however,
the granite and stage IV micas tend to share similar compositions, except when lithium is
involved, highlighting the differences with the relatively Nb-Ta-W-poor micas. In contrast with
the latter, the granite and stage IV micas form a very wide positively-sloping W-Sn trend (Figure
32A). Moreover, whereas all micas form positive Ta-Nb (Figure 32B) and W-Nb trends, the
granite and stage IV micas are characterized by very different Ta/Nb and W/Nb ratios. Although
less well-defined, Sn and Nb also appear to be correlated. The stage IV dioctahedral micas
differ significantly from the stage IV trioctahedral micas, being poorer in Nb and Ta, but
distinctly enriched in W and, moreover, Sn.
Table 2. Selected representative LA-ICP-MS analyses of trace elements in micas from each vein, greisen and granite. Y, Zr, Nd and U were also analyzed but were below the detection limit.
LA-ICPMS Feldspar vein (I) Fe-Li-micas vein (II) W-Sn vein (III) Banded quartz vein (IV) Granite Greisen
(ppm) σ σ σ σ σ σ
Li2O (wt.%) 5.9 0.1 3.7 0.1 3.8 0.04 3.1 0.1 5.0 0.05 3.9 0.05 Mg 309.0 4.2 2408.0 41.0 1380.0 13.0 152.7 2.6 227.7 2.1 2492.0 27.0 Ti 125.4 5.4 207.2 5.9 298.4 4.6 282.2 7.4 339.6 4.3 349.9 7.3 Nb 11.1 0.3 29.66 0.80 15.0 0.2 126.4 2.4 66.3 0.8 22.1 0.4 Mo 0.4 0.2 1.0 0.3 0.2 0.1 0.6 0.1 0.5 0.1 0.3 0.1 Sn 203.5 6.9 357.8 6.8 376.8 4.5 512.9 9.7 476.6 6.0 343.9 4.9 Cs 468.2 6.8 348.0 13.0 344.7 4.1 209.9 5.1 483.4 6.2 358.6 8.1 Ba 21.1 0.6 57.5 1.6 73.3 0.8 0.2 0.1 1.1 0.1 88.6 1.3 Ta 13.6 0.4 53.2 1.8 8.3 0.1 91.6 2.4 137.7 1.9 21.8 0.3 W 19.9 0.7 35.6 3.0 25.4 0.5 75.2 2.6 45.9 0.8 32.1 0.7
Covariations between W, Sn and Nb contents and Li contents reveal largely the same
groups of Maoping trioctahedral micas (W-Li is shown in Figure 32C as an example). The
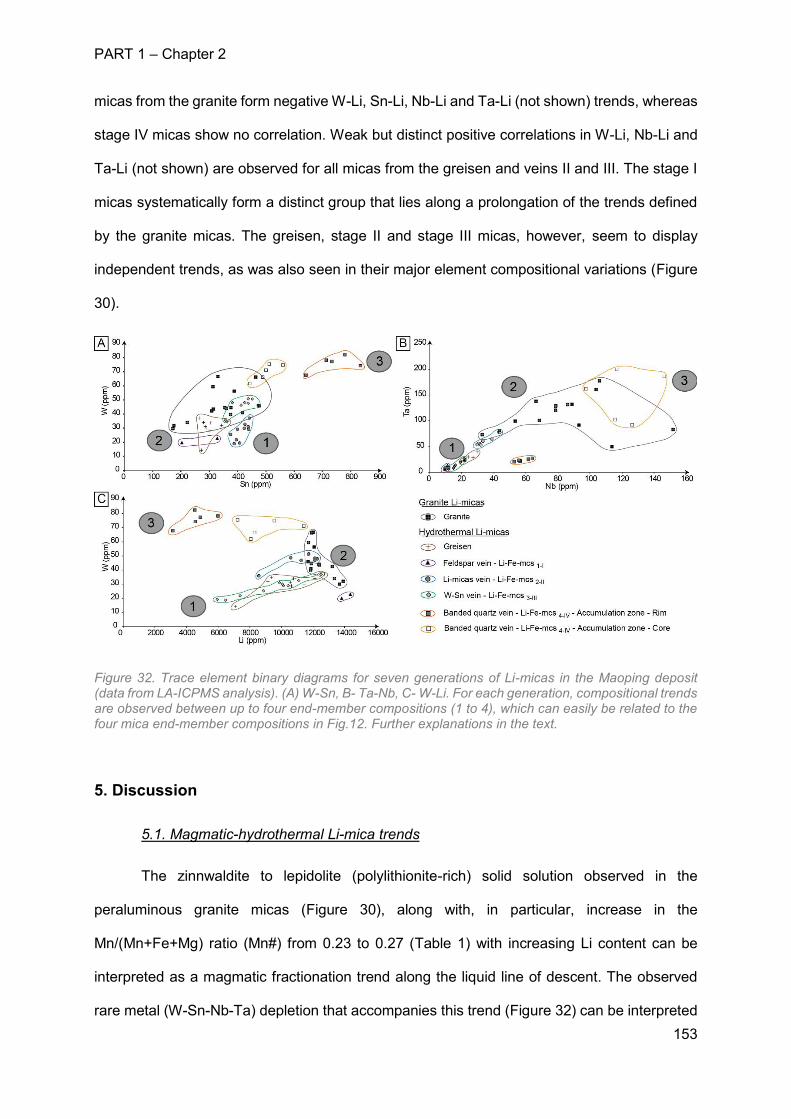
PART 1 – Chapter 2
153
micas from the granite form negative W-Li, Sn-Li, Nb-Li and Ta-Li (not shown) trends, whereas
stage IV micas show no correlation. Weak but distinct positive correlations in W-Li, Nb-Li and
Ta-Li (not shown) are observed for all micas from the greisen and veins II and III. The stage I
micas systematically form a distinct group that lies along a prolongation of the trends defined
by the granite micas. The greisen, stage II and stage III micas, however, seem to display
independent trends, as was also seen in their major element compositional variations (Figure
30).
Figure 32. Trace element binary diagrams for seven generations of Li-micas in the Maoping deposit (data from LA-ICPMS analysis). (A) W-Sn, B- Ta-Nb, C- W-Li. For each generation, compositional trends are observed between up to four end-member compositions (1 to 4), which can easily be related to the four mica end-member compositions in Fig.12. Further explanations in the text.
5. Discussion
5.1. Magmatic-hydrothermal Li-mica trends
The zinnwaldite to lepidolite (polylithionite-rich) solid solution observed in the
peraluminous granite micas (Figure 30), along with, in particular, increase in the
Mn/(Mn+Fe+Mg) ratio (Mn#) from 0.23 to 0.27 (Table 1) with increasing Li content can be
interpreted as a magmatic fractionation trend along the liquid line of descent. The observed
rare metal (W-Sn-Nb-Ta) depletion that accompanies this trend (Figure 32) can be interpreted
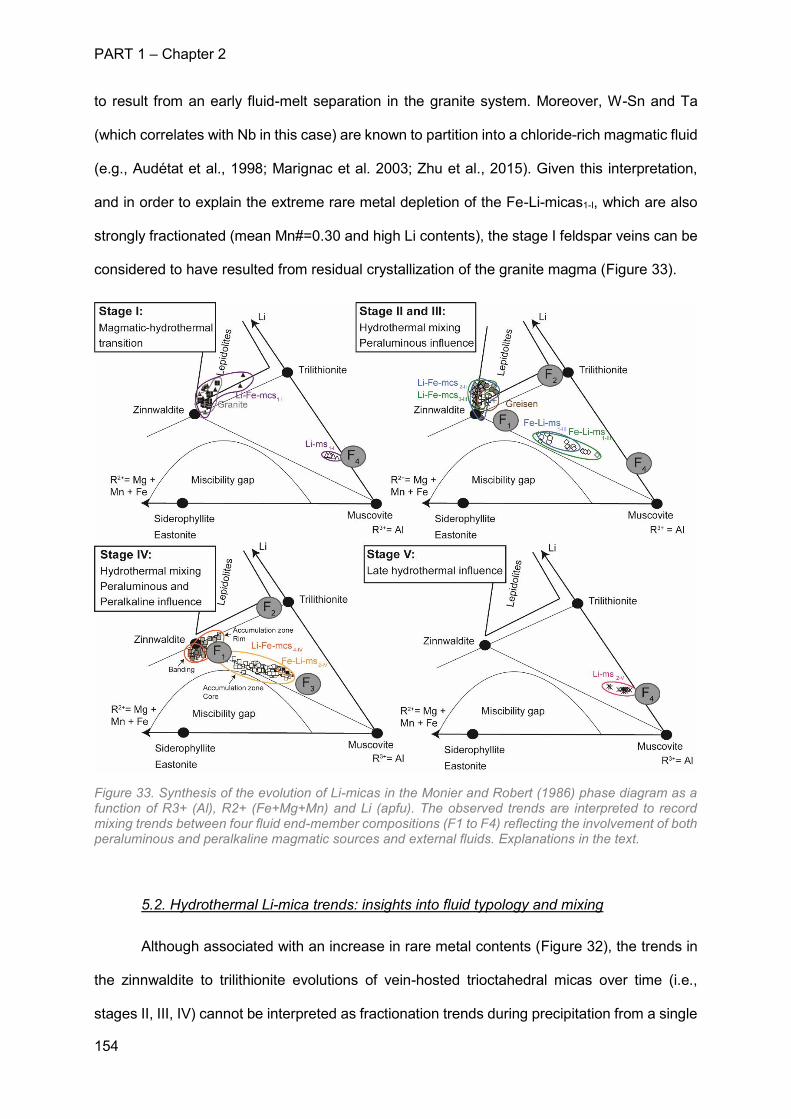
PART 1 – Chapter 2
154
to result from an early fluid-melt separation in the granite system. Moreover, W-Sn and Ta
(which correlates with Nb in this case) are known to partition into a chloride-rich magmatic fluid
(e.g., Audétat et al., 1998; Marignac et al. 2003; Zhu et al., 2015). Given this interpretation,
and in order to explain the extreme rare metal depletion of the Fe-Li-micas1-I, which are also
strongly fractionated (mean Mn#=0.30 and high Li contents), the stage I feldspar veins can be
considered to have resulted from residual crystallization of the granite magma (Figure 33).
Figure 33. Synthesis of the evolution of Li-micas in the Monier and Robert (1986) phase diagram as a function of R3+ (Al), R2+ (Fe+Mg+Mn) and Li (apfu). The observed trends are interpreted to record mixing trends between four fluid end-member compositions (F1 to F4) reflecting the involvement of both peraluminous and peralkaline magmatic sources and external fluids. Explanations in the text.
5.2. Hydrothermal Li-mica trends: insights into fluid typology and mixing
Although associated with an increase in rare metal contents (Figure 32), the trends in
the zinnwaldite to trilithionite evolutions of vein-hosted trioctahedral micas over time (i.e.,
stages II, III, IV) cannot be interpreted as fractionation trends during precipitation from a single
PART 1 – Chapter 2
155
hydrothermal fluid. Two longitudinal profiles, made along the cleavage from the base to the top
of the plumose crystals, were analyzed in apparently non-zoned mica crystals (SEM and
microscopy observations) from stages II (Fe-Li-Mcs2-II) and III (Fe-Li-Mcs3-III) (Figure 31).
Although clearly showing the large-scale (≥ 500 µm) variations that correspond to the zoning,
the profiles do not display the systematic trends (e.g., increasing Fe with decreasing Mg) that
would be expected in the case of continuous fractionation from a single fluid either within the
source or resulting from mica crystallization in a closed system. As seen in Figure 31, there
are significant variations (alternating increases and decreases) in element contents from core
to rim (i.e. over time) in the Fe-Li-Mcs2-II crystal, but no significant trend can be distinguished
at the crystal scale.
The observed Fe-rich to Fe-poor oscillatory bulk evolution of the dioctahedral core of
the stage IV Fe-Li-mcs4-IV is similarly incompatible with a fractionation process, especially as
no effects (such as an increasing Fe/Mg ratio) are observed at the scale of the growth zone
crystallization in a closed system (Figure 31).
The observed trends must therefore represent mica formation in compositionally
evolving fluids (Figure 30) that result from mixing between discrete hydrothermal end-
members. In order to fully explain the complex trends displayed in Figure 31, a minimum of
four end-members are required: an “F1”-fluid, corresponding to the zinnwaldite of composition
(1); an “F2-fluid”, recorded by the trilithionite micas of composition (2); an “F3-fluid”, expressed
in the crystallization of the Fe-rich dioctahedral micas cores in stage IV banded quartz, with
composition (3); and an “F4-fluid”, corresponding to the more trilithionitic dioctahedral
compositions, with composition (4) (Figure 30 and Figure 33). The observed trends for primary
micas correspond to either “F1”-“F2” or “F1”-“F3” mixing trends.
Considering the details of the paragenetic mica succession (Figure 23), it would thus
appear that bulk fluid evolution at Maoping was characterized by successive interplay of the
“F1” end-member, first with “F2” and then with “F3”, and the repetitive involvement of the “F4”
end-member.
PART 1 – Chapter 2
156
5.3. Interpretation of magma and fluid evolution
The changes in the mineral and metal assemblages through time, as defined by the
paragenetic sequence (Figure 23), may correlate with the fluid evolution described above.
The greisen and stages II and III correspond to a W-Sn-Li-(Mo) association (Figure
32B), which, being typical of peraluminous granite-related mineralization (Cerny et al., 2005),
would suggest the involvement of a peraluminous magma at this time. The “F1-F2” trend in
Figure 33 implies the existence of two fluids during these stages, both of which may be related
to the peraluminous granite. The “F1” end-member, as seen in Figure 33 and Figure 32C, is in
fact characterized by an elevated rare-metal content, as shown by the zinnwalditic greisen and
stage II and stage III micas, whereas the “F2” component, being poorer in rare metals (Figure
32C), likely represents a fluid better interpreted as an external fluid. Mixing of a magmatic and
a meteoric fluid could explain cassiterite and wolframite deposition, as described for instance
around the Mole granite in Australia (Audétat et al., 1998). In the Maoping case, “F1” could be
either a true magmatic-hydrothermal fluid or a fluid equilibrated under high temperature
subsolidus conditions with a peraluminous rare metal granite. “F2” on the other hand, could be
either a metamorphic fluid (derived for instance, from metamorphic contact aureoles) or a
meteoric fluid that has undergone variable degree of exchange with the crust. Unfortunately, it
is impossible here to distinguish diluted magmatic or metamorphic fluids from meteoric fluids
that may have percolated within the crust.
Stage IV zinnwalditic trioctahedral micas, with their elevated W-Nb-Sn-Ta contents,
may also be considered as having been deposited by a more-evolved “F1” end-member.
However, the micas in the stage IV banded quartz are characterized by a rare metal content
that is higher than that of the peraluminous granite micas (Figure 32). A micro-paragenesis
displaying Nb-F-REE associations and micas with Nb enrichment are associated with this
stage (Figure 32B) and would be more akin to a new peralkaline magmatic source involved in
the fluid composition of an “F3” fluid (Cerny et al., 2005). Given the elevated Ta content of the
primary dioctahedral micas from stage IV, a mixed influence from both peraluminous and
PART 1 – Chapter 2
157
peralkaline magmas seems most probable. In Figure 15, the “F2” and “F3” fluids are both seen
to mix with an “F1” component. In the banded quartz, this component is represented by the
small protolithionitic platelets that characterize the banding. This in turn suggests that the stage
IV quartz primarily grew from this “F1” fluid, with occasional influxes of fluids influenced by both
peraluminous and peralkaline magmas. Indeed, the absence of significant W-Sn mineralization
in stage IV might be explained by the prevalence of the “F3” fluid contribution during this part
of the evolution of the Maoping system. As demonstrated by the stage VI assemblage (F-P-
REE), the “F3” fluid may have also dominated the end of the depositional history. However,
unfortunately no mica proxies exist to support this, unless the Li-ms2-V can be considered as a
precursor, as is suggested by their positions in Figure 33 (it was not possible to perform any
trace element analyses on these because of their radial and zoned morphology).
Finally, the “F4” end-member, which is associated with the alteration of primary Fe-Li-
micas into Li-muscovite, may be interpreted by comparing it with similar types of alteration
found in the rare metal granite environment. For instance, at Beauvoir in the French Massif
Central, Li-muscovite overgrowth onto magmatic lepidolite was suggested to have been
related to high temperature sub-solidus ingress of meteoric fluids into the cooling granite
cupola (Cuney et al., 1992). In the Maoping veins, the late Li-muscovites may similarly be
interpreted as recording the involvement of a meteoric fluid, the “F4” end-member.
5.4. Temporal rather than spatial zoning
As mentioned in Section 2.2, a zonal distribution has previously been described at
Maoping by Feng et al. (2011), with a vein mineralogy that changes gradually from the greisen
to the surface, from quartz-W-Mo-(Sn) veins at depth to W-Sn sulphide veins and eventually
to an upper fluorite-muscovite veinlet zone. In light of the detailed paragenetic sequence
exposed previously, this zoning may essentially be temporal in nature, recording the
successive emplacement of granitic magmas, only one of which is apparently observed at the
present level of exposure. This granite, which in the previous sections was shown to be
associated with the earliest feldspar veins (stage I) and which is overprinted by mineralized
PART 1 – Chapter 2
158
quartz veins and the related greisen, cannot therefore be the peraluminous granite that
influenced the “F2” end-member. As shown in Figure 33 and Figure 32C, at least two more
successive magma pulses are required to provide the peraluminous-influenced fluids involved
in the greisen to stage III and stage IV micas, respectively. In addition, the presence of a
concealed peralkaline (A1-type) intrusion at depth is also required for the “F3” end-member.
Whereas the peraluminous granites were likely associated with the early Yanshanian
magmatic cycle, this peralkaline granite would be representative of the Late Yanshanian cycle
(Hu and Zhou 2012).
6. Conclusion
By correlating the geochemistry of Li-micas with the detailed paragenesis of the
Maoping deposit, we are able to obtain a number of constraints on the magmatic and
hydrothermal processes at the origin of the W-Sn deposits in the Nanling region, the richest
W-Sn province worldwide. Textures and compositions of Li-micas along successive
paragenetic stages allow to identify : (i) magmatic Fe-Li-micas from the granite and the feldspar
veins, which are thought to demonstrate an early fluid-melt separation; (ii) hydrothermal Fe-Li-
micas coeval with the greisenisation, which precipitated from the mixing of fluids that were
influenced to varying degrees by the underlying peraluminous magma source, (iii)
hydrothermal zoned Li-micas with compositions fluctuating between zinnwaldite and Fe-Li-
muscovite and influenced by a new peralkaline magma; and (iv) secondary Fe-Li-muscovites
and late Li-muscovites that reflect a late meteoritic influence at each stage. Coupled detailed
paragenesis and Li-mica composition are therefore powerful indicators of the magmatic-
hydrothermal evolution of the Maoping deposit, highlighting the various fluid types and magma
inputs involved in a single rare metal deposit.
PART 1 – Chapter 2
159
References
Alfonso, P., Melgarejo, J.C., Yusta, I., Velasco, F., 2003. Geochemistry of feldspars and
muscovite in granitic pegmatite from the Cap de Creus field, Catalonia, Spain. The
Canadian Mineralogist 41, 103-116.
Audétat, A., Günther, D., Heinrich, C.A., 1998. Formation of a Magmatic-Hydrothermal Ore
Deposit: Insights with LA-ICP-MS Analysis of Fluid Inclusions. Science 279, 2091.
Barton Jr., P.B., 1978. Some ore textures involving sphalerite from the Furutobe mine, Akita
Prefecture, Japan. Mining Geology 28, 293-300.
Bargar, K.E., Beeson, M.H., Fournier, R.O., Muffler, L.J.P, 1973. Present-day deposition of
lepidolite from thermal waters in Yellowstone National Park. American Mineralogist 58,
901-904.
Cerny, P., Blevin, P., Cuney, M., London, D., 2005. Granite-related ore deposits. Society of
economic geologists, 100th Anniversary Volume.
Charvet, J., 2013. The Neoproterozoic-Early Paleozoic tectonic evolution of the South China
Block: an overview. Journal of Asian Earth Sciences 74, 198-209.
Che, X-D., Wu, F-Y., Wang, R-C., Gerdes, A., Ji, W-Q., Zhao, Z-H., Yang, J-H., Zhu, Z-Y.,
2015. In situ U-Pb isotopic dating of columbite-tantalite by LA-ICP-MS. Ore Geology
Reviews 65, 979-989.
Chen, C.H., Lee, C.Y., Shinjo, R.C., 2008. Was there Jurassic paleo-Pacific subduction in
South China?: constraints from 40Ar-39Ar dating, elemental and Sr-Nd-Pb isotope
geochemistry of the Mesozoic basalts. Lithos 106, 83-92.
Costi, H.T., Dall’Agnol, R., Borges, R.M.K., Minuzzi, O.R.R., Teixeira, J.T., 2002. Tin-bearing
sodic episyenites associated with the Proterozoic A-type Agua Boa granite, Pitinga
Mine, Amazonian Craton, Brazil. Gondwana Research 5, 435-451.
Cuney, M., Marignac, C., Weisbrod, A., 1992. The Beauvoir topaz-lepidolite albite granite
(Massif Central, France); the disseminated magmatic Sn-Li-Ta-Nb-Be mineralization.
Economic Geology 87, 1766-1794.
Faure, M., Sun, Y., Shu, L., Monie, P., Charvet, J., 1996. Extensional tectonics within a
subduction-type orogen. The case study of the Wugongshan dome (Jiangxi Province,
southeastern China). Tectonophysics 263, 77-106.
PART 1 – Chapter 2
160
Faure, M., Shu, L.S., Wang, B., Charvet, J., Choulet, F., Monie, P., 2009. Intracontinental
subduction: a possible mechanism for the Early Palaeozoic orogeny of SE China. Terra
Nova 21, 360-368.
Feng, C., Zeng, Z., Zhang, D., Qu, W., Du, A., Li, D., She, H., 2011. SHRIMP zircon U–Pb and
molybdenite Re–Os isotopic dating of the tungsten deposits in the Tianmenshan–
Hongtaoling W–Sn orefield, southern Jiangxi Province, China, and geological
implications. Ore Geology Reviews 43, 8-25.
Foster, M.D., 1960. Interpretation of the composition of lithium micas. U.S. Geological Survey
Professional Paper 354-E, 115-47.
Giuliani, G., 1985. Le gisement de tungstène de Xihuashan (Sud-Jiangxi, Chine): Relations
granites, alterations deutériques-hydrothermales, minéralisations. Mineralium
Deposita 20, 107-115.
Gunow, Alexander J., Ludington, S., and Munoz, J.L., 1980. Fluorite in Micas from the
Henderson Molybdenite Deposit, Colorado. Economic Geology 75, 1127-1137.
Guo, F., Fan, W.M., Li, C.W., Zhao, L., Li, H.X., Yang, J.H. 2012. Multi-stage crust-mantle
interaction in SE China: temporal, thermal and compositional constraints from the
Mesozoic felsic rocks in eastern Guangdong-Fujian provinces. Lithos 150, 62-84.
Günther, D., Frischknecht, R., Heinrich, C.A., Kahlert, H.J., 1997. Capabilities of an argon
fluoride 193 nm excimer laser for laser ablation inductively coupled plasma mass
spectrometry microanalysis of geological materials. Journal of Analytical Atomic
Spectrometry 12, 939–944.
Henderson, C.M.B., and Martin, J.S., 1989. Compositional relations in Li-micas from S.W.
England and France: an ion- and electron- microprobe study. Mineralogical Magazine
53, 427-449.
Hu, D., Hua, R., Li, G., Wei, X., Huang, X., 2011. Study on the fluid inclusions of Maoping
tungsten deposit, southern Jiangxi Province. Geological Journal of China Universities
17, 327-336. (in Chinese with English abstract)
Hu, R.Z., Zhou, M.F. 2012. Multiple mesozoic mineralization events in South China-an
introduction to the thematic issue. Mineralium Deposita 47, 579-588.
Hua, R., Chen, P., Zhang, W., Lu, J., 2005. Three large-scale metallogenic events related to
the Yanshanian period in Southern China. Mineral Deposit Research: Meeting the
Global Challenge 4-13, 401-404.

PART 1 – Chapter 2
161
Huang, F., Wang, D., Santosh, M., Wang, C., Zeng, Z., Liu, S., Wang, L., Zhang, Y., 2014.
Genesis of the Yuanlingzhai porphyry molybdenum deposit, Jiangxi province, South
China: Constraints from petrochemistry and geochronology. Journal of Asian Earth
Sciences 79, 759-776.
Jiang, Y-H., Jiang, S.Y., Zhao, K.D., Ling, H.F., 2006. Petrogenesis of Late Jurassic Qianlishan
granites and mafic dykes, southeast China; implications for a back-arc extension
setting. Geology Magazine 143, 457-474.
Jin-Ung, C., Kideok, D.K., 2015. Effects of Fe Substitution on Lithium Incorporation into
Muscovite. Journal of the Mineralogical Society of Korea 28, 127-133.
Jochum, K.P., Weis, U., Stoll, B., Kuzmin, D., Yang, Q., Raczek, I., Jacob, D.E., Stracke, A.,
Birbaum, K., Frick, D.A., Gunther, D., Enzweiler, J., 2011. Determination of reference
values for NIST SRM 610-617 glasses following ISO guidelines. Geostandards and
Geoanalytical Research 35, 397-429.
Johan, Z., and Johan, V., 2001. Les micas de la coupole granitique de Cinovec (Zinnwald),
République tchèque: un nouvel aspect sur la métallogenèse de l’étain et du tungstène.
Earth and Planetary Sciences 332, 307-313.
Johan, Z., Strnad, L., Johan, V., 2012. Evolution of the Cinovec (Zinnwald) granite cupola,
Czech Republic: Composition of feldspars and micas, a clue to the origin of W, Sn
mineralization. The Canadian Mineralogist 50, 1131-1148.
Lach, P., Mercadier, J., Dubessy, J., Boiron, M.C., Cuney, M., 2013. In situ quantitative
measurement of rare earth elements in uranium oxides by laser ablation-inductively
coupled plasma-mass spectrometry. Geostandards and Geoanalytical Results 37, 1-
20.
Lecumberri-Sanchez, P., Romer, R.L., Luders, V., Bodnar, R.J., 2014. Genetic relationship
between silver-lead-zinc mineralization in the Wutong deposit, Guangxi Province and
Mesozoic granitic magmatism in the Nanling belt, southeast China. Mineralium
Deposita 49, 353-396.
Leisen, M., Boiron, M.C., Richard, A., Dubessy, J., 2012. Determination of Cl and Br
concentrations in individual fluid inclusions by combining microthermometry and LA-
ICPMS analysis: Implications for the origin of salinity in crustal fluids. Chemical geology
330-331, 197-206.
Li, J.H., Zhang, Y.Q., Dong, S.W., Johnston, S.T., 2014. Cretaceous tectonic evolution of
South China: a preliminary synthesis. Earth Science Reviews 134, 98-136.
PART 1 – Chapter 2
162
Li, Z.X., Li, X.H., 2007. Formation of the 1300-km-wide intracontinental orogen and
postorogenic magmatic province in Mesozoic South China: a flat-slab subduction
model. Geology 35, 179-182.
Liégeois, J.P., Abdelsalam, M.G., Ennih, N., Ouabadi, A., 2013. Metacraton: Nature, genesis
and behavior. Gondwana Research 23, 220-237.
Liu, Q., Yu, J.H., Wang, Q., Su, B., Zhou, M.F., Xu, H., Cui, X., 2012. Ages and geochemistry
of granites in the Pingtan-Dongshan metamorphic belt, Coastal South China: new
constraints on Late Mesozoic magmatic evolution. Lithos 150, 268-286.
Longerich, H.P., Jenner, G.A., Fryer, B.J., Jackson, S.E., 1990. Inductively coupled plasma-
mass spectrometric analysis of geological samples: a critical evaluation based on case
studies. Chemical Geology 83, 105-118.
Mao, J., Xie, G., Li, X., Zhang, C., Wang, Y., 2006. Mesozoic large-scale mineralization and
multiple lithospheric extensions in South China. Acta Geologica Sinica 80, 420-431.
Mao, Z., Cheng, Y., Liu, J., Yuan, S., Wu, S., Xiang, X., Luo, X., 2013. Geology and
molybdenite Re–Os age of the Dahutang granite-related veinlets-disseminated
tungsten ore field in the Jiangxin Province, China. Ore Geology Reviews 53, 422-433.
Marchal, K.L., Simmons, W.B., Falster, A.U., Webber, K.L., 2014. Geochemistry, mineralogy,
and evolution of Li-Al micas and feldspars from the mount mica pegmatite, maine, USA.
Canadian Mineralogist 52, 221-233.
Marignac, C., Diagana, B., Cathelineau, M., Boiron, M.C., Banks, D., Fourcade, S., Vallance,
J., 2003. Remobilization of base metals and gold by Variscan metamorphic fluids in the
south Iberian belt: evidence from the Tharsis VMS deposit. Chemical Geology 194,
143-165.
Marignac, C., and Cathelineau, M., 2009. The nature of ore-forming fluids in peri-batholitic Sn-
W deposits and a classification. In: Williams et al. (Eds.), Smart science for exploration
and mining. Proceedings Tenth Biennial SGA Meeting, Townsville, pp. 245-247.
Monier, G., and Robert, J.L, 1986. Evolution of the miscibility gap between muscovite and
biotite solid solutions with increasing lithium content: an experimental study in the
system K2O-Li2O-MgO-FeO-Al2O3-SiO2-H2O-HF at 600°C, 2kbar PH2O: comparison
with natural lithium micas. Mineralogical magazine 50, 641-651.
Neiva, A.M.R., 1987. Geochemistry of white micas from Portuguese tin and tungsten deposits.
Chemical Geology 63, 299-317.
PART 1 – Chapter 2
163
Neiva, A.M.R., 2013. Micas, feldspars and columbite–tantalite minerals from the zoned granitic
lepidolite-subtype pegmatite at Namivo, Alto Ligonha, Mozambique. European Journal
of Mineralogy 25, 967-985.
Neiva, A.M.R., Silva, B., Ramos, M.F., 2012. Geochemistry of granitic aplite-pegmatite veins
and sills and their minerals from the Sabugal area, central Portugal. Neues Jahrbuch
für Mineralogie - Abhandlungen: Journal of Mineralogy and Geochemistry 189, 49-74.
Paton, C., Hellstrom, J., Paul, B., Woodhead, J., Hergt, J., 2011. Iolite: Freeware for the
visualization and processing of mass spectrometric data. Journal of Analytical Atomic
Spectometry 26, 2508.
Roda, E., Keller, P., Pesquera, A., Fontan, F., 2007. Micas of the muscovite-lepidolite series
from Karibib pegmatites, Namibia. Mineralogical Magazine 71, 41-62.
Roda Robles, E., Pesquera A., Gil, P.P., Torres-Ruiz, J., De Parseval, P., 2006. Mineralogy
and geochemistry of micas from the Pinilla de fermoselle pegmatite (Zamora, Spain).
European journal of mineralogy 18, 369-377.
Romer, R., and Kroner, U., 2016. Phanerozoic tin and tungsten mineralization – Tectonic
controls on the distribution of enriched protoliths and heat sources for crustal melting.
Gondwana Research 31, 60-95
Shu, L.S., Faure, M., Wang, B., Zhou, X.M., Song, B., 2008. Late Palaeozoic–Early Mesozoic
geological features of South China: response to the Indosinian collision events in
Southeast Asia. Comptes Rendus Geoscience 340, 151-165.
Shu, L.S., Zhou, X.M., Deng, P., Wang, B., Jiang, S.Y., Yu, J.H., Zhao, X.X., 2009. Mesozoic
tectonic evolution of the Southeast China Block: new insights from basin analysis.
Journal of Asian Earth Sciences 34, 376-391.
Sun, W.D., Yang, X.Y., Fan, W.M., Wu, F.Y., 2012. Mesozoic large scale magmatism and
mineralization in South China: preface. Lithos 150, 1-5.
Tischendorff, G., Gottesmann, B., Forster, H.J., Trumbull, R.B., 1997. On Li-bearing micas:
estimating Li from electron microprobe analyses and an improved diagram for graphical
representation. Mineralogical magazine 61, 809-834.
Van Lichtervelde, M., Grégoire, M., Linnen, R.L., Beziat, D., Salvi, S., 2008. Trace element
geochemistry by laser abalation ICP-MS of micas associated with Ta mineralization in
the Tanco pegmatite, Manitoba, Canada. Contributions to Mineralogy and Petrology
155, 791-806.
PART 1 – Chapter 2
164
Vieira, R., Roda-Robles, E., Pesquera, A., Lima, A., 2011. Chemical variation and significance
of micas from the Freganeda-Almendra pegmatitic field (Central-Iberian Zone, Spain
and Portugal). American Mineralogist 96, 637-645.
Wang, D.Z. and Shu, L.S., 2012. Late Mesozoic basin and range tectonics and related
magmatism in Southeast China. Geoscience Frontiers 3, 109-124.
Wang, J. and Li, Z.X., 2003. History of Neoproterozoic rift basins in South China: implications
for Rodinia break-up. Precambrian Research 122, 141-158.
Wang, Y. and Fan, B., 1987. In: Guo, W. (Eds.), Metallogenic map of endogenic ore deposits
of China 1:4000000. Cartographic, Beijing.
Wang, Y.J., Fan, W.M., Zhang, G.W., Zhang, Y.H., 2013. Phanerozoic tectonics of the South
China Block: key observations and controversies. Gondwana Research 23, 1273-1305.
Wu, C.Y., Bai, G., Xu, L.M., 1993. Types and distribution of silver ore deposits in China.
Mineralium Deposita 28, 223-238.
Xia, Y., Xu, X.S., Zou, H.B., Liu, L., 2014. Early Paleozoic crust-mantle interaction and
lithosphere delamination in South China Block: evidence from geochronology,
geochemistry, and Sr-Nd-Hf isotopes of granites. Lithos 184-187, 416-435.
Xu, Y., Wang, C.Y., Zhao, T., 2016. Using detrital zircons from rivers sands to constrain major
tectono-thermal events of the Cathaysia Block, SE China. Journal of Asian Earth
Sciences 124, 1-13.
Zeng, Z.L., Zhu, X.P., Xu, J.X., 2007. Tungsten Reserves of Southern Jiangxi Province and
Prospecting Outlook. China Tungsten Industry 6, 16-24. (in Chinese with English
abstract)
Zhou, T., Goldfarb. R.J., Philips, G.N., 2002. Tectonics and distribution of gold deposits in
China – an overview. Mineralium Deposita 37, 249-282.
Zhu, Z.Y., Wang, R.C., Che, X.D., Zhu, J.C., Wei, X.L., Huang, X., 2015. Magmatic-
hydrothermal rare-element mineralization in the Songshugang granite (northeastern
Jiangxi, China): Insights from an electron-microprobe study of Nb-Ta-Zr minerals. Ore
Geology Reviews 65, 749-760.
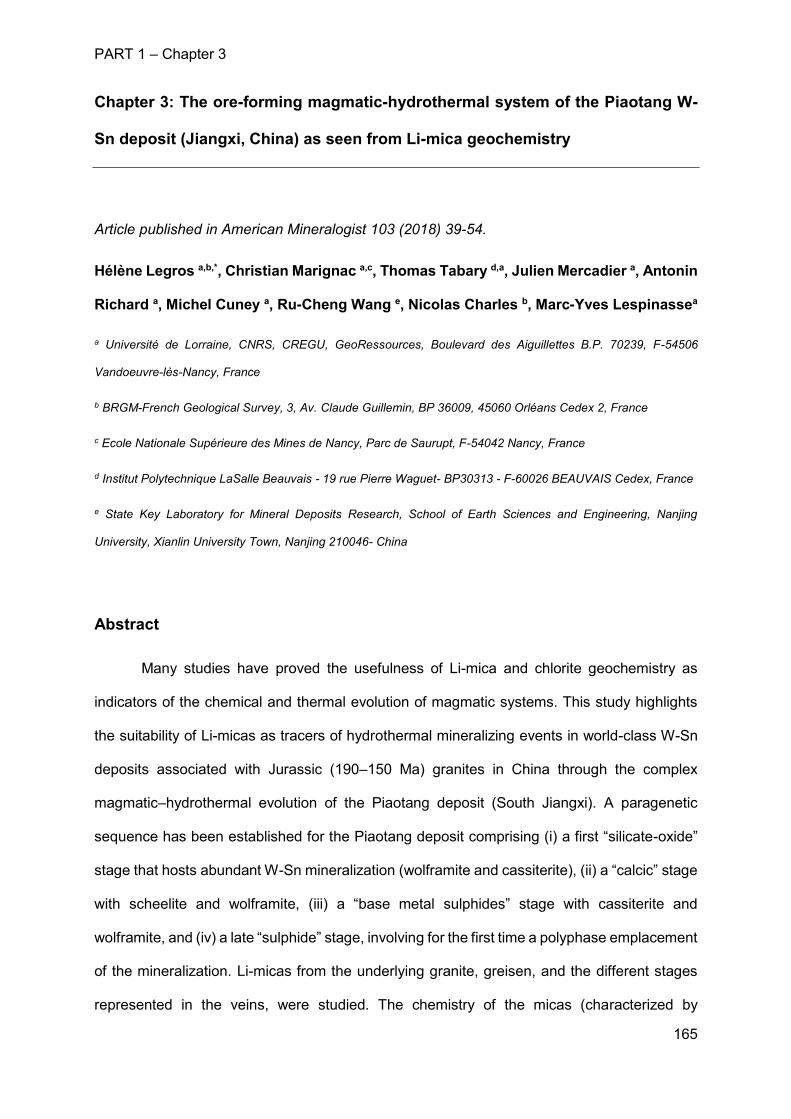
PART 1 – Chapter 3
165
Chapter 3: The ore-forming magmatic-hydrothermal system of the Piaotang W-
Sn deposit (Jiangxi, China) as seen from Li-mica geochemistry
Article published in American Mineralogist 103 (2018) 39-54.
Hélène Legros a,b,*, Christian Marignac a,c, Thomas Tabary d,a, Julien Mercadier a, Antonin
Richard a, Michel Cuney a, Ru-Cheng Wang e, Nicolas Charles b, Marc-Yves Lespinassea
a Université de Lorraine, CNRS, CREGU, GeoRessources, Boulevard des Aiguillettes B.P. 70239, F-54506
Vandoeuvre-lès-Nancy, France
b BRGM-French Geological Survey, 3, Av. Claude Guillemin, BP 36009, 45060 Orléans Cedex 2, France
c Ecole Nationale Supérieure des Mines de Nancy, Parc de Saurupt, F-54042 Nancy, France
d Institut Polytechnique LaSalle Beauvais - 19 rue Pierre Waguet- BP30313 - F-60026 BEAUVAIS Cedex, France
e State Key Laboratory for Mineral Deposits Research, School of Earth Sciences and Engineering, Nanjing
University, Xianlin University Town, Nanjing 210046- China
Abstract
Many studies have proved the usefulness of Li-mica and chlorite geochemistry as
indicators of the chemical and thermal evolution of magmatic systems. This study highlights
the suitability of Li-micas as tracers of hydrothermal mineralizing events in world-class W-Sn
deposits associated with Jurassic (190–150 Ma) granites in China through the complex
magmatic–hydrothermal evolution of the Piaotang deposit (South Jiangxi). A paragenetic
sequence has been established for the Piaotang deposit comprising (i) a first “silicate-oxide”
stage that hosts abundant W-Sn mineralization (wolframite and cassiterite), (ii) a “calcic” stage
with scheelite and wolframite, (iii) a “base metal sulphides” stage with cassiterite and
wolframite, and (iv) a late “sulphide” stage, involving for the first time a polyphase emplacement
of the mineralization. Li-micas from the underlying granite, greisen, and the different stages
represented in the veins, were studied. The chemistry of the micas (characterized by
PART 1 – Chapter 3
166
intermediate compositions between phlogopite-zinnwaldite-muscovite poles) demonstrates
the presence of end-members representing three different fluids that were involved in the
emplacement of the Piaotang deposit. These end-members can be linked to previous fluid
inclusion studies conducted on this deposit. The three fluids are identified to be magmatic,
meteoric (as previously reported in the literature), and also metamorphic, and are shown to
have mixed throughout the different stages. Moreover, it appears that the magmatic fluids
could not have been derived from the Piaotang biotite granite but rather must have originated
from a more evolved rare metal granite that is presently unidentified. These fluids were
responsible for the greisenization.
Finally, chlorite geochemistry reveals the occurrence of a heating process (from 200°C
in stage II to 300°C in stage III) during the post-mineralizing stages, which was responsible for
the precipitation of new generations of ore-bearing minerals (cassiterite and wolframite)
concomitant with a continuous gain of metals during the emplacement of the Piaotang deposit.
Keywords
Piaotang - W-Sn deposit – Yanshanian - Lithium-mica – Chlorite - Magmatic-hydrothermal
1. Introduction
Constraining the origin and evolution of mineralizing fluids in W-Sn-quartz vein-type
deposits remains challenging. Current models refer to (i) metal-rich magmatic fluids exsolved
from granitic magmas (e.g., Kamenetsky et al., 2004; Audétat et al., 1998; Thomas et al.,
2005), (ii) “external” fluids (metamorphic or meteoric) that circulate around cooling
peraluminous granitoids and leach metals from the peraluminous granitoid or the country rocks
(e.g., Wilkinson 1990; Blamart 1991; Smith et al. 1996; Zhao and Jiang, 2004), or (iii)
combinations of the two (e.g., Beuchat et al., 2004; Carruzzo et al., 2004; Marignac and
Cathelineau 2009; Wei et al., 2012; Chicharro et al., 2016). In association with stable isotope
PART 1 – Chapter 3
167
(O, H) studies of minerals (Beuchat et al., 2004; Carruzzo et al., 2004; Wei et al., 2012;
Chicharro et al., 2016), fluid inclusion studies have contributed greatly to these models in
recent years, by providing valuable information about the origins and physical–chemical
evolution of the mineralizing fluids (e.g., Audétat et al. 1998; Beuchat et al., 2004; Carruzzo et
al., 2004; Wei et al., 2012; Chicharro et al., 2016). However, fluid inclusion studies are
restricted to just a few favourable mineral species (e.g., topaz, quartz, wolframite, and
cassiterite) and even then, primary fluid inclusions are often hard to identify. Consequently,
several stages of the deposit formation cannot be studied by this approach, and can only be
investigated indirectly using detailed paragenetic successions and in-depth geochemical
analysis. In this perspective, Li-mica and chlorites, which are frequently found in W–Sn vein-
type deposits (Giuliani, 1985; Tischendorff et al., 1997; Costi et al., 2002; Johan et al., 2012;
Nieva, 2013) show interesting potential. The majority of chlorite species are sensitive to
temperature in hydrothermal and geothermal systems (Walshe, 1986), and thus provide a
useful geothermometer in many geological settings and, in particular, in hydrothermal
metallogenic systems. Moreover, Legros et al. (2016) showed that, in the case of the Maoping
deposit (Jiangxi, China), the detailed chemistry of magmatic and hydrothermal Li-mica can be
used to interpret the relative contributions of magmatic, meteoric and metamorphic fluids in the
formation and evolution of W-Sn deposits. Based on this work, the present study focuses on
the Piaotang W-Sn deposit, located in the southern Jiangxi Metallogenic Province (SE China),
the most important W-Sn province in the world (USGS, 2016). The Piaotang W–Sn deposit
exhibits several generations of magmatic and hydrothermal Li-mica, as well as two generations
of chlorite, that crystallized during multiple stages of the ore-forming system. This study uses
combined optical microscopy, SEM, EPMA and LA-ICPMS to establish for the first time a
detailed paragenetic succession for the Piaotang deposit and to determine the major and trace
element compositions of Li-mica and chlorite geothermometers, with the aim of providing new
constraints on the physical–chemical evolution of fluids involved in the formation of such
deposits.
PART 1 – Chapter 3
168
2. Geological Setting and sampling
2.1 The southern Jiangxi Metallogenic Province
The southern Jiangxi W-Sn province, also referred as Nanling metallogenic belt, is
located in the Cathaysia Block of the South China Craton (SCC) and is currently the main W
repository in China (90% of the reserves: Wang et al. 2016). The SCC resulted from late
Grenvillian suturing between two terranes: the Yangtze Block to the north and the Cathaysia
Block to the south, during the Jiangnan orogeny (Charvet 2013 and references therein). The
final age of the collision is still under debate, with estimates ranging between 900 and 800 Ma
(e.g., Li et al. 2009, Hu and Zhou 2012, Yao et al. 2013). Mostly coinciding with the southern
boundary of the orogen, the major Jiangshan-Shaoxi fault zone is considered the northern
boundary of the Cathaysia block (Figure 34).
Figure 34. (a) Ore mining districts and metal deposits of the Cathaysia Block, (b) Detailed map of the southern part of the Jiangxi Province, SE China, showing the distribution of Jurassic and Cretaceous granitoids. The Piaotang deposit is located in the Dayu district in the south-western part of the Jiangxi province (Modified after Legros et al. (2016) and references therein).
After the Neoproterozoic collage of the Yangtze and Cathaysia terranes, the newly
formed SCC was strongly reworked, becoming progressively metacratonized through a
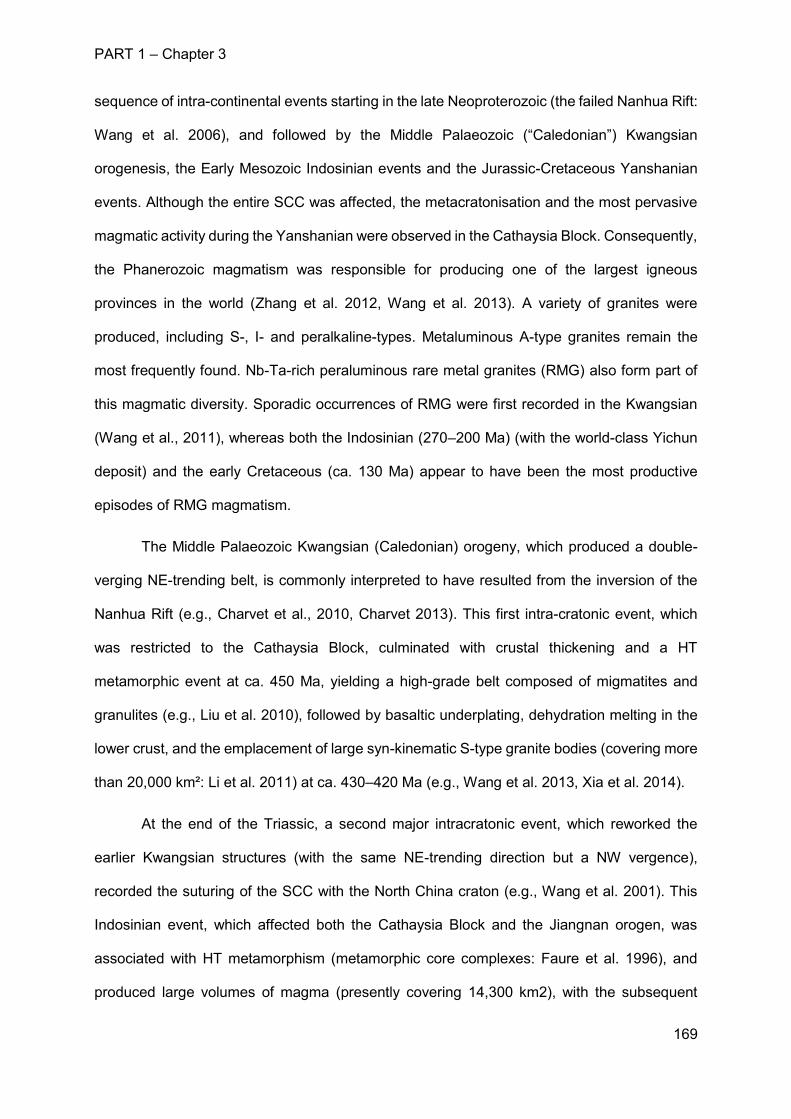
PART 1 – Chapter 3
169
sequence of intra-continental events starting in the late Neoproterozoic (the failed Nanhua Rift:
Wang et al. 2006), and followed by the Middle Palaeozoic (“Caledonian”) Kwangsian
orogenesis, the Early Mesozoic Indosinian events and the Jurassic-Cretaceous Yanshanian
events. Although the entire SCC was affected, the metacratonisation and the most pervasive
magmatic activity during the Yanshanian were observed in the Cathaysia Block. Consequently,
the Phanerozoic magmatism was responsible for producing one of the largest igneous
provinces in the world (Zhang et al. 2012, Wang et al. 2013). A variety of granites were
produced, including S-, I- and peralkaline-types. Metaluminous A-type granites remain the
most frequently found. Nb-Ta-rich peraluminous rare metal granites (RMG) also form part of
this magmatic diversity. Sporadic occurrences of RMG were first recorded in the Kwangsian
(Wang et al., 2011), whereas both the Indosinian (270–200 Ma) (with the world-class Yichun
deposit) and the early Cretaceous (ca. 130 Ma) appear to have been the most productive
episodes of RMG magmatism.
The Middle Palaeozoic Kwangsian (Caledonian) orogeny, which produced a double-
verging NE-trending belt, is commonly interpreted to have resulted from the inversion of the
Nanhua Rift (e.g., Charvet et al., 2010, Charvet 2013). This first intra-cratonic event, which
was restricted to the Cathaysia Block, culminated with crustal thickening and a HT
metamorphic event at ca. 450 Ma, yielding a high-grade belt composed of migmatites and
granulites (e.g., Liu et al. 2010), followed by basaltic underplating, dehydration melting in the
lower crust, and the emplacement of large syn-kinematic S-type granite bodies (covering more
than 20,000 km²: Li et al. 2011) at ca. 430–420 Ma (e.g., Wang et al. 2013, Xia et al. 2014).
At the end of the Triassic, a second major intracratonic event, which reworked the
earlier Kwangsian structures (with the same NE-trending direction but a NW vergence),
recorded the suturing of the SCC with the North China craton (e.g., Wang et al. 2001). This
Indosinian event, which affected both the Cathaysia Block and the Jiangnan orogen, was
associated with HT metamorphism (metamorphic core complexes: Faure et al. 1996), and
produced large volumes of magma (presently covering 14,300 km2), with the subsequent
PART 1 – Chapter 3
170
emplacement of I-type granites (245-230 Ma) and S-type granites (220-210 Ma) (Shu et al.
2008 and references therein). The first cycle of Nb–Ta granites occurred in the Nanling Range
(Mao et al. 2013).
The Yanshanian event (Late Jurassic-Cretaceous) was essentially marked by
magmatism that led to the generation of the large igneous province (Li et al., 2014). However,
the event was also associated with alternating transpressive and transtensional deformation
along the same NE-SW lineaments that controlled the Kwangsian and Indosinian events (Li et
al., 2014, Liu et al., 2012, Shu et al., 2009). The Yanshanian events are currently interpreted
as reflecting a major change in the overall plate tectonic regime, with a shift from a Palaeo-
Tethysian to a Pacific control, marked by the inception of subduction of the Paleo-Pacific
(Izanagi) plate under the SCC (e.g. Zhou et al., 2002). The Yanshanian is subdivided into the
Early (Jurassic) and Late (Cretaceous) Yanshanian. The Jurassic (190–150 Ma) is
characterized by extensive magmatic activity, today represented by the outcropping of granitic
rocks over an area of about 100,000 km2. The peak of magmatic activity is dated at 160–150
Ma, with several pulses, and the granitic province exhibits all the characteristics of a felsic
large igneous province. The majority of the Cathaysia W-Sn deposits were formed during the
same 160–150 Ma interval, although this was recently challenged (ca. 130 Ma ages proposed
by Wang et al. 2016). Coeval with this, the E-W trending Nanling Range, which is composed
of three roughly parallel granitic belts and associated wolframite deposits (Zhao et al. 2017),
was formed. The Cretaceous event (135–80 Ma) was characterized by granites (mainly
intruded in the Cathaysian interior) and rhyolites (mainly erupted along the coastal area).
Renewed rare-metal deposition occurred in the Nanling Range, characterized notably by large
magmatic-related Sn and U mineralizations, while Au-Cu-Pb-Zn-Ag mineralizations were
deposited along the southeastern coast (Hua et al., 2005).
PART 1 – Chapter 3
171
2.2 The Piaotang W-Sn deposit
The polymetallic W-Sn-(Nb) Piaotang deposit is one of several giant tungsten deposits
in the Nanling Range and produces 1,500 t WO3 per year, ranking it eighth in the top ten
reserves in China with 47,775 t WO3 (MB Company database: www.metalbulletin.com). The
deposit is composed of mineralised veins emplaced in Cambrian metasediments that lie above
the concealed Piaotang biotite granite (Figure 35). Two sets of faults can be observed in the
field: E-W-oriented faults intersecting NE-SW-oriented faults (Figure 35A). The granite was
emplaced during the Jurassic (159.8 ± 0.3 Ma, U-Pb zircon dating; Zhang et al., 2017), coeval
with the W mineralization (159.5±1.5 Ma, U-Pb cassiterite dating; Zhang et al., 2017). A
Kwangsian quartz diorite body (439 ± 2 Ma, U-Pb zircon dating; He et al. 2010) also occurs at
depth.
Figure 35. Simplified geological map (a) and cross-section with associated strikes (b) of the Piaotang W-Sn deposit, showing the relationships between the deep granite, Cambrian host rocks, and mineralized veins and the sampling levels ((a) modified after Tanelli 1982 and (b) modified after Ni et al., 2015).
PART 1 – Chapter 3
172
The vein system: The vein system extends vertically over 300 m, down to the Piaotang
biotite granite (Figure 35B). The vein system includes flat-lying and steep veins, associated
with evidence for brittle tectonics. Field observations at different levels show (i) a first
generation of, more or less lenticular, flat-lying (N80-90°E 30-40°N) quartz veins, displaying
some evidence of faint extensional tectonics, (ii) a second generation of similar flat-lying veins
(N0-30°E 30-40°W) corresponding to inverse faulting (as demonstrated by their intersections
with the first generation veins), and (iii) a third generation of steep veins, with clear evidence
for both faint inverse and sinistral strike-slip tectonics. Whereas the first generation of veins is
scarce and the second generation is moderately frequent, the third generation of veins is
ubiquitous. Only the third generation of veins shows mineralizations of economic interest. The
thickness of the veins increases from the bottom to the top, from a few centimetres at the 556
level, to more than one meter at the 268 level.
Relationship with the granite: At the bottom of the system, a fine-grained biotite granite
is observed. The interaction between this granite and the vein system appears to be complex.
- The granite exhibits a locally steep and sharp contact with the country rocks, striking
30°N. Outside the main body, several gently dipping dike-like expansions are observed, which
themselves present complex digitations in the form of crackle breccias. No ductile deformation
is observed along the contact between the granite and country rocks.
- Inside the granite body, a gently dipping vein system is observed. The veins show
borders composed of feather-like K-feldspars megacrysts, and a filling of greisenized fine-
grained rock that forms a cement around large quartz crystals (stockscheider).
- The granite overprints a generation of flat-lying quartz veins which likely represent the
first generation of veins. Some dike-like expansions appear to be associated with inverse brittle
faulting as they intersect earlier flat-lying quartz veins. These dikes are likely coeval with the
second generation of veins.
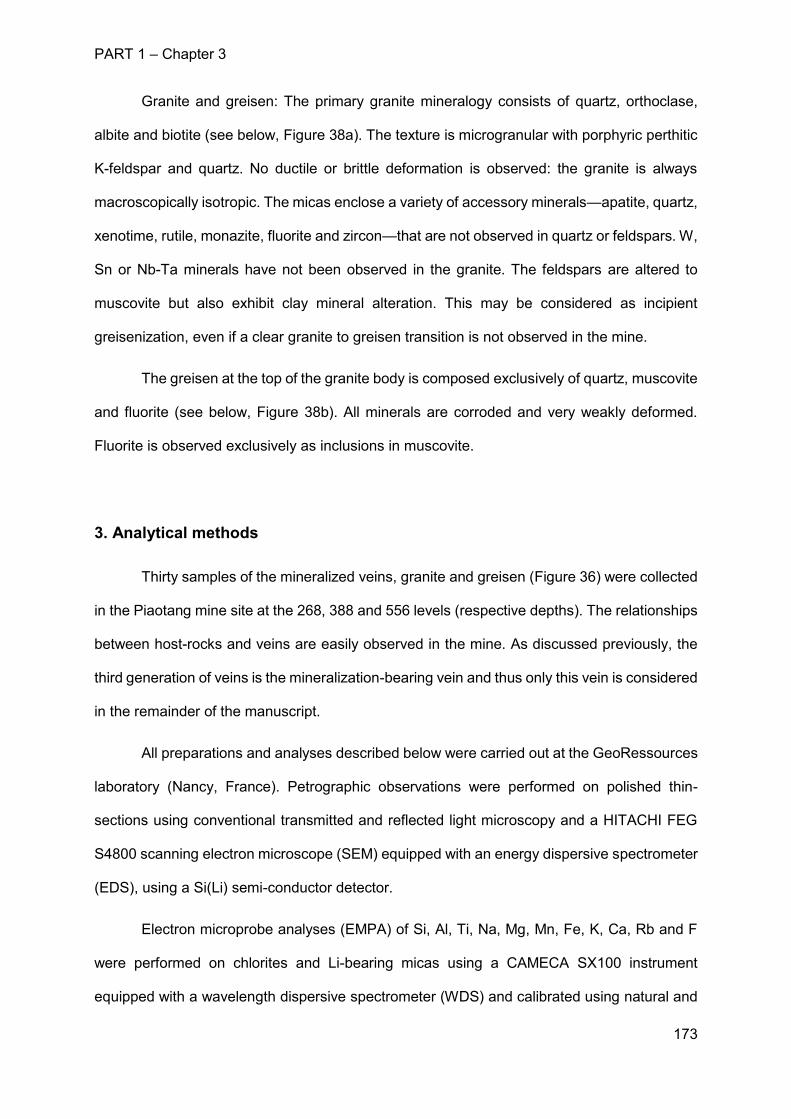
PART 1 – Chapter 3
173
Granite and greisen: The primary granite mineralogy consists of quartz, orthoclase,
albite and biotite (see below, Figure 38a). The texture is microgranular with porphyric perthitic
K-feldspar and quartz. No ductile or brittle deformation is observed: the granite is always
macroscopically isotropic. The micas enclose a variety of accessory minerals—apatite, quartz,
xenotime, rutile, monazite, fluorite and zircon—that are not observed in quartz or feldspars. W,
Sn or Nb-Ta minerals have not been observed in the granite. The feldspars are altered to
muscovite but also exhibit clay mineral alteration. This may be considered as incipient
greisenization, even if a clear granite to greisen transition is not observed in the mine.
The greisen at the top of the granite body is composed exclusively of quartz, muscovite
and fluorite (see below, Figure 38b). All minerals are corroded and very weakly deformed.
Fluorite is observed exclusively as inclusions in muscovite.
3. Analytical methods
Thirty samples of the mineralized veins, granite and greisen (Figure 36) were collected
in the Piaotang mine site at the 268, 388 and 556 levels (respective depths). The relationships
between host-rocks and veins are easily observed in the mine. As discussed previously, the
third generation of veins is the mineralization-bearing vein and thus only this vein is considered
in the remainder of the manuscript.
All preparations and analyses described below were carried out at the GeoRessources
laboratory (Nancy, France). Petrographic observations were performed on polished thin-
sections using conventional transmitted and reflected light microscopy and a HITACHI FEG
S4800 scanning electron microscope (SEM) equipped with an energy dispersive spectrometer
(EDS), using a Si(Li) semi-conductor detector.
Electron microprobe analyses (EMPA) of Si, Al, Ti, Na, Mg, Mn, Fe, K, Ca, Rb and F
were performed on chlorites and Li-bearing micas using a CAMECA SX100 instrument
equipped with a wavelength dispersive spectrometer (WDS) and calibrated using natural and
PART 1 – Chapter 3
174
synthetic oxides and silicates (albite, olivine, Al2O3, orthose, andradite, MnTiO3, hematite,
cassiterite, RbTiPO5, topaz, scheelite, LiTaO3 and LiNbO3). A current of 12nA and an
accelerating voltage of 15kV was used with a counting time of 10s per element. Special
attention was paid to fluorine determination by using a spectrometer dedicated to this element
(average detection limit of 1300 ppm). The analyses have a spatial resolution of 1 to 2 µm.
The reproducibility of standard analyses was 1% for each element analyzed. Total Fe is
presented as FeO.
Major, minor and trace elements (24Mg, 27Al, 28Si, 47Ti, 55Mn, 59Co, 93Nb, 95Mo,
118Sn, 137Ba, 181Ta, 182W) were measured in Li-bearing micas using a LA-ICPMS
instrumental setup described in Leisen et al. (2012) and Lach et al. (2013), composed of a
GeoLas excimer laser (ArF, 193 nm, Microlas, Göttingen, Germany) (Günther et al., 1997) and
an Agilent 7500c quadrupole ICPMS. The laser beam was focused onto the sample within a
24.5 cm3 cylindrical ablation cell with a Schwarzschild reflective objective (magnification ×25;
numerical aperture 0.4) mounted on an optical microscope (Olympus BX41), equipped with a
X‒Y motorized stage and a CCD camera. Si (determined by EPMA) was chosen as an internal
standard and precisely quantified by EPMA for all analysed micas. NIST SRM 610 (values
from Jochum et al., 2011) was chosen as the external standard (accuracy was verified by
analysing NIST SRM 612). The parameters used were a fluence of 8J/cm² and a laser shot
frequency of 5 Hz, He = 0.5 L.min-1 as a carrier gas mixed with Ar = 0.7 L.min-1 via a cyclone
mixer prior to entering the ICP torch, spot sizes of 120 µm, and an ablation duration of 40 s.
Quantifications were performed using Iolite software (Paton et al., 2011) and concentrations
were calculated following Longerich et al. (1996).
The temperature of chlorite formation was calculated using the graphical
geothermometer of Bourdelle and Cathelineau (2015) for each composition that plotted
between the sudoite, corundophilite and Al-free chlorite end-members on the Si-R2+ diagram
of Wiewiora and Weiss (1990). This method assumes that quartz and water activities are equal
to 1 and is valid for a temperature range of 50–350°C, which seems reasonable in the case of
PART 1 – Chapter 3
175
quartz-bearing rocks formed under low-grade metamorphic conditions, such as those in the
Piaotang deposit. All Fe was assumed to be ferrous in the calculations of the structural
formulas.
4. Paragenetic sequence
A paragenetic succession was previously established by Tanelli (1982), providing a
common chart for the Piaotang and Xihuashan deposits. According to Tanelli (1982), the
succession can be divided into three stages: (i) a first “oxide stage” with quartz, K-feldspar,
beryl, topaz, wolframite and cassiterite; (ii) a second “sulphide stage” with quartz, bismuthinite,
sphalerite, galena, cassiterite and wolframite; and (iii) a third “carbonate stage” with quartz,
chlorite, sericite, fluorite, calcite, pyrite and scheelite.
Figure 36. Mineralized veins as observed in the mine galleries at different levels of sampling. (a) Wolframite-cassiterite-quartz vein. (b) Fluorite-cassiterite-quartz vein. (c) Accumulated sulphides in the vein. (d) Fluorite accumulation in the vein.
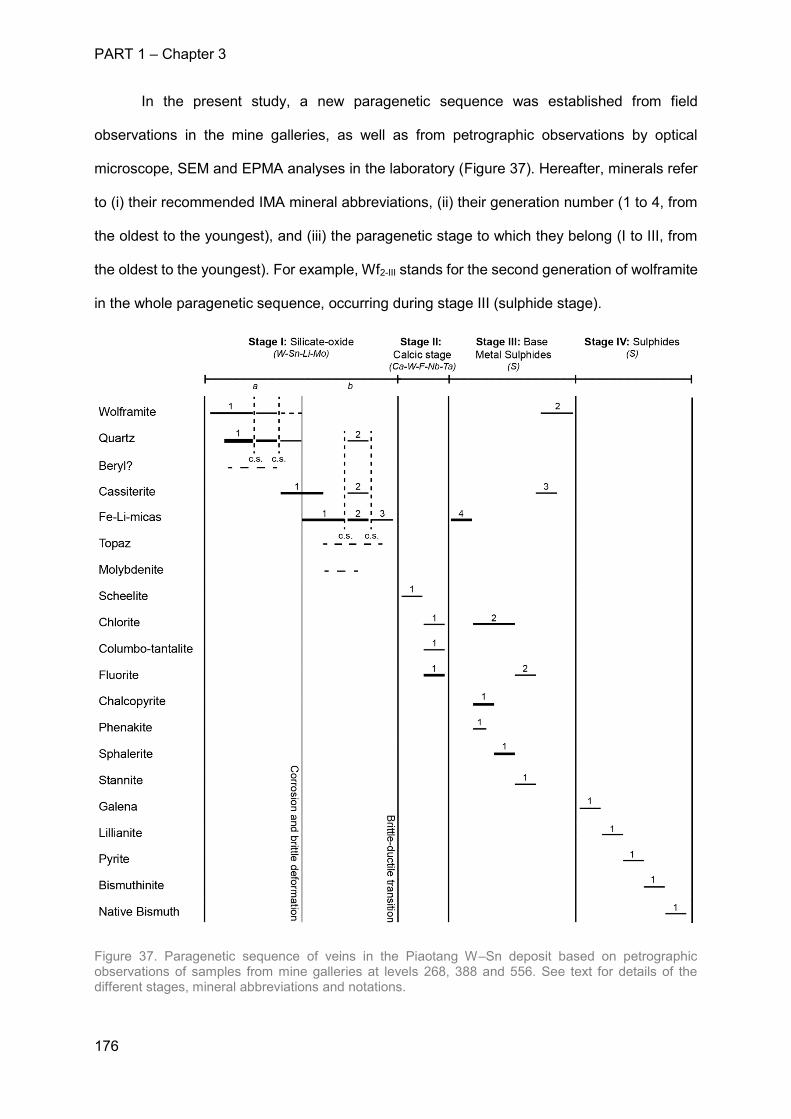
PART 1 – Chapter 3
176
In the present study, a new paragenetic sequence was established from field
observations in the mine galleries, as well as from petrographic observations by optical
microscope, SEM and EPMA analyses in the laboratory (Figure 37). Hereafter, minerals refer
to (i) their recommended IMA mineral abbreviations, (ii) their generation number (1 to 4, from
the oldest to the youngest), and (iii) the paragenetic stage to which they belong (I to III, from
the oldest to the youngest). For example, Wf2-III stands for the second generation of wolframite
in the whole paragenetic sequence, occurring during stage III (sulphide stage).
Figure 37. Paragenetic sequence of veins in the Piaotang W–Sn deposit based on petrographic observations of samples from mine galleries at levels 268, 388 and 556. See text for details of the different stages, mineral abbreviations and notations.
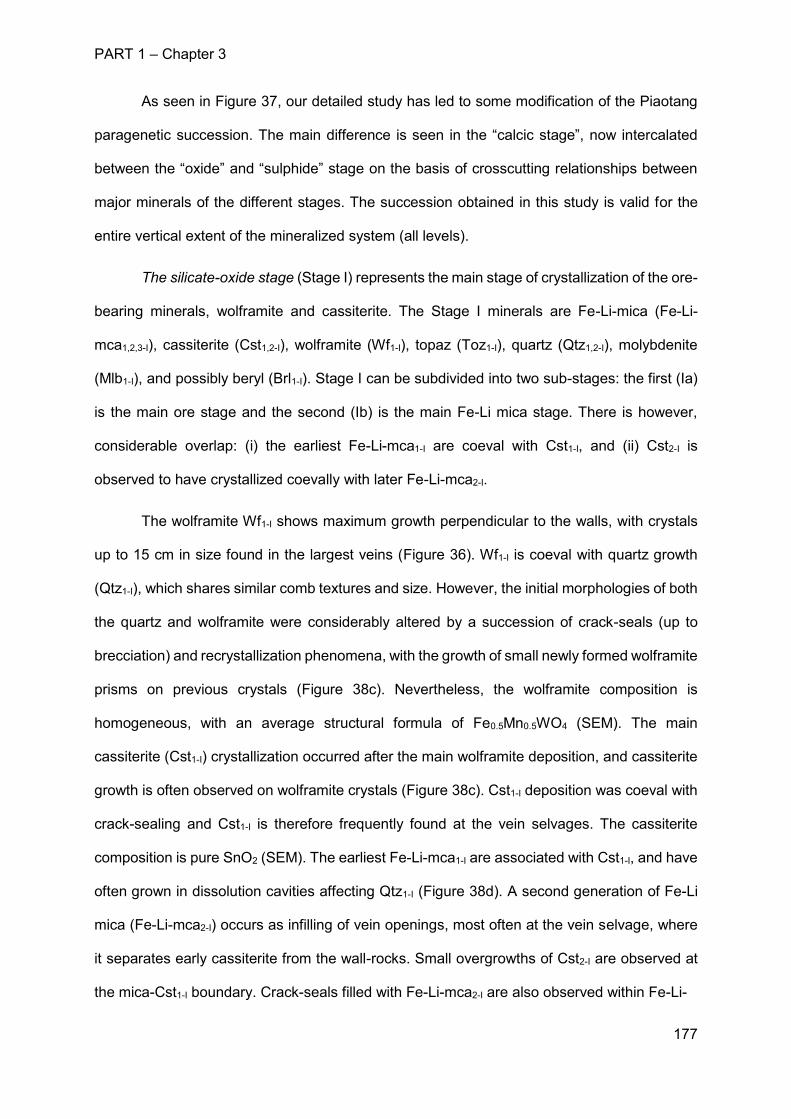
PART 1 – Chapter 3
177
As seen in Figure 37, our detailed study has led to some modification of the Piaotang
paragenetic succession. The main difference is seen in the “calcic stage”, now intercalated
between the “oxide” and “sulphide” stage on the basis of crosscutting relationships between
major minerals of the different stages. The succession obtained in this study is valid for the
entire vertical extent of the mineralized system (all levels).
The silicate-oxide stage (Stage I) represents the main stage of crystallization of the ore-
bearing minerals, wolframite and cassiterite. The Stage I minerals are Fe-Li-mica (Fe-Li-
mca1,2,3-I), cassiterite (Cst1,2-I), wolframite (Wf1-I), topaz (Toz1-I), quartz (Qtz1,2-I), molybdenite
(Mlb1-I), and possibly beryl (Brl1-I). Stage I can be subdivided into two sub-stages: the first (Ia)
is the main ore stage and the second (Ib) is the main Fe-Li mica stage. There is however,
considerable overlap: (i) the earliest Fe-Li-mca1-I are coeval with Cst1-I, and (ii) Cst2-I is
observed to have crystallized coevally with later Fe-Li-mca2-I.
The wolframite Wf1-I shows maximum growth perpendicular to the walls, with crystals
up to 15 cm in size found in the largest veins (Figure 36). Wf1-I is coeval with quartz growth
(Qtz1-I), which shares similar comb textures and size. However, the initial morphologies of both
the quartz and wolframite were considerably altered by a succession of crack-seals (up to
brecciation) and recrystallization phenomena, with the growth of small newly formed wolframite
prisms on previous crystals (Figure 38c). Nevertheless, the wolframite composition is
homogeneous, with an average structural formula of Fe0.5Mn0.5WO4 (SEM). The main
cassiterite (Cst1-I) crystallization occurred after the main wolframite deposition, and cassiterite
growth is often observed on wolframite crystals (Figure 38c). Cst1-I deposition was coeval with
crack-sealing and Cst1-I is therefore frequently found at the vein selvages. The cassiterite
composition is pure SnO2 (SEM). The earliest Fe-Li-mca1-I are associated with Cst1-I, and have
often grown in dissolution cavities affecting Qtz1-I (Figure 38d). A second generation of Fe-Li
mica (Fe-Li-mca2-I) occurs as infilling of vein openings, most often at the vein selvage, where
it separates early cassiterite from the wall-rocks. Small overgrowths of Cst2-I are observed at
the mica-Cst1-I boundary. Crack-seals filled with Fe-Li-mca2-I are also observed within Fe-Li-
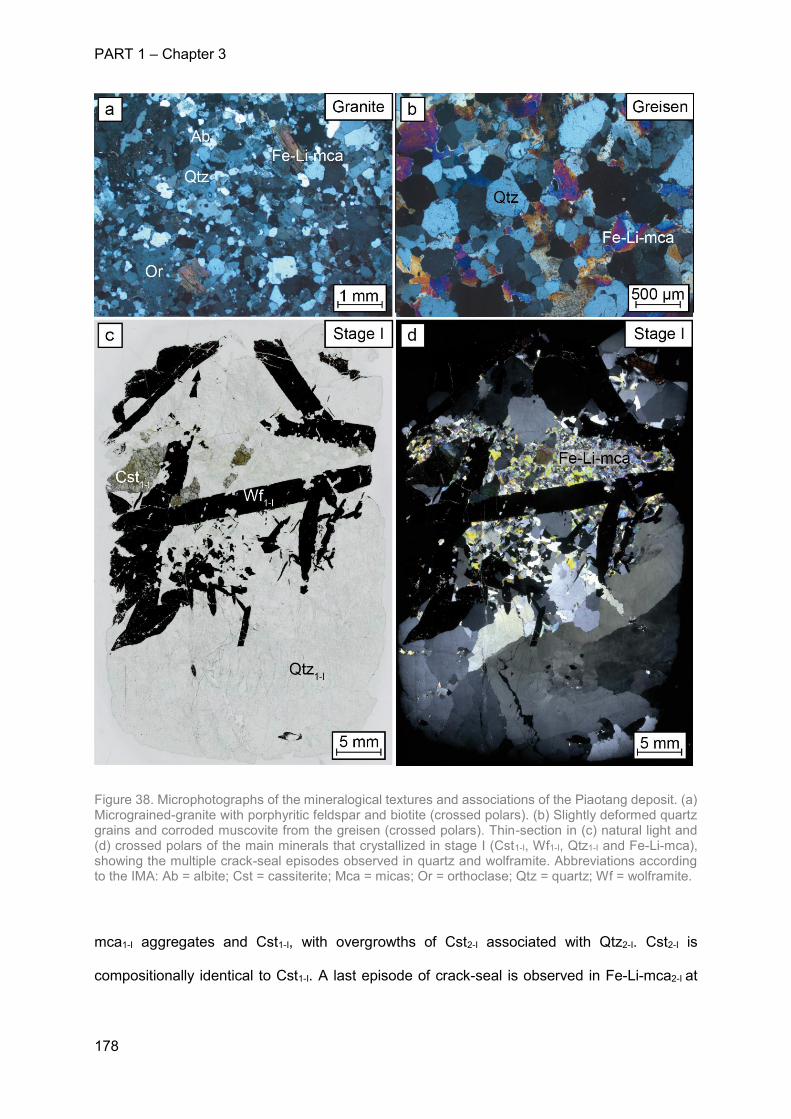
PART 1 – Chapter 3
178
Figure 38. Microphotographs of the mineralogical textures and associations of the Piaotang deposit. (a) Micrograined-granite with porphyritic feldspar and biotite (crossed polars). (b) Slightly deformed quartz grains and corroded muscovite from the greisen (crossed polars). Thin-section in (c) natural light and (d) crossed polars of the main minerals that crystallized in stage I (Cst1-I, Wf1-I, Qtz1-I and Fe-Li-mca), showing the multiple crack-seal episodes observed in quartz and wolframite. Abbreviations according to the IMA: Ab = albite; Cst = cassiterite; Mca = micas; Or = orthoclase; Qtz = quartz; Wf = wolframite.
mca1-I aggregates and Cst1-I, with overgrowths of Cst2-I associated with Qtz2-I. Cst2-I is
compositionally identical to Cst1-I. A last episode of crack-seal is observed in Fe-Li-mca2-I at
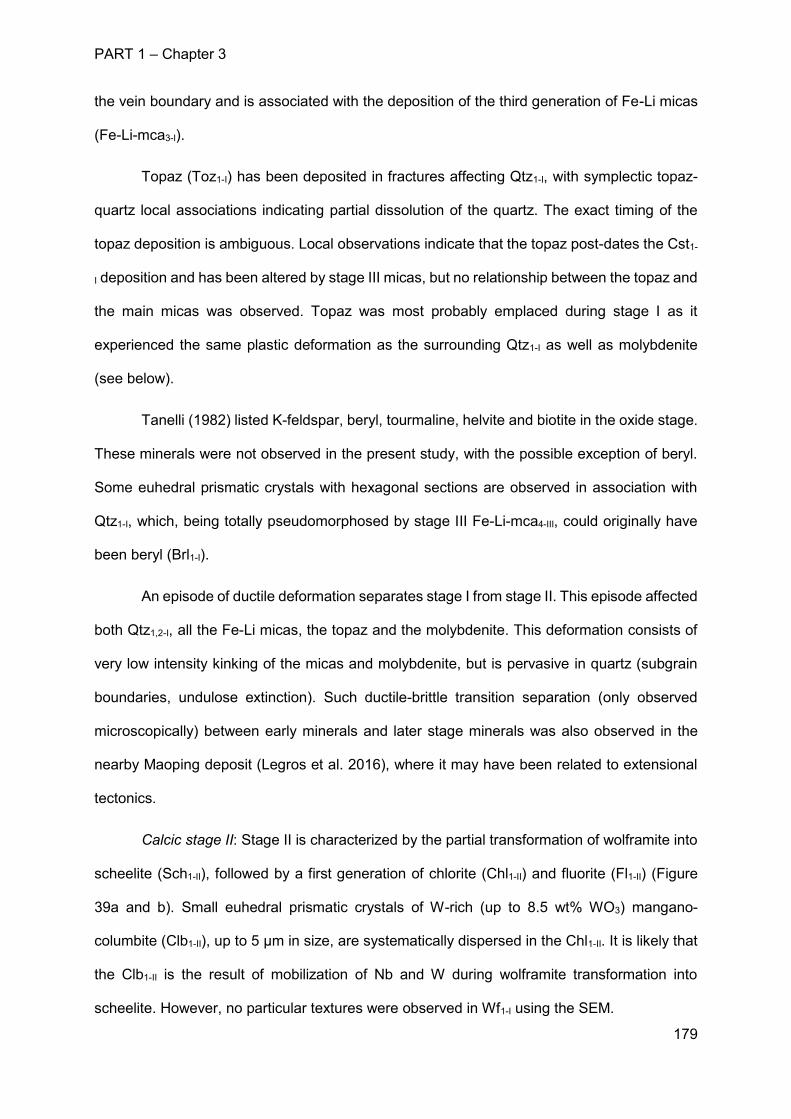
PART 1 – Chapter 3
179
the vein boundary and is associated with the deposition of the third generation of Fe-Li micas
(Fe-Li-mca3-I).
Topaz (Toz1-I) has been deposited in fractures affecting Qtz1-I, with symplectic topaz-
quartz local associations indicating partial dissolution of the quartz. The exact timing of the
topaz deposition is ambiguous. Local observations indicate that the topaz post-dates the Cst1-
I deposition and has been altered by stage III micas, but no relationship between the topaz and
the main micas was observed. Topaz was most probably emplaced during stage I as it
experienced the same plastic deformation as the surrounding Qtz1-I as well as molybdenite
(see below).
Tanelli (1982) listed K-feldspar, beryl, tourmaline, helvite and biotite in the oxide stage.
These minerals were not observed in the present study, with the possible exception of beryl.
Some euhedral prismatic crystals with hexagonal sections are observed in association with
Qtz1-I, which, being totally pseudomorphosed by stage III Fe-Li-mca4-III, could originally have
been beryl (Brl1-I).
An episode of ductile deformation separates stage I from stage II. This episode affected
both Qtz1,2-I, all the Fe-Li micas, the topaz and the molybdenite. This deformation consists of
very low intensity kinking of the micas and molybdenite, but is pervasive in quartz (subgrain
boundaries, undulose extinction). Such ductile-brittle transition separation (only observed
microscopically) between early minerals and later stage minerals was also observed in the
nearby Maoping deposit (Legros et al. 2016), where it may have been related to extensional
tectonics.
Calcic stage II: Stage II is characterized by the partial transformation of wolframite into
scheelite (Sch1-II), followed by a first generation of chlorite (Chl1-II) and fluorite (Fl1-II) (Figure
39a and b). Small euhedral prismatic crystals of W-rich (up to 8.5 wt% WO3) mangano-
columbite (Clb1-II), up to 5 µm in size, are systematically dispersed in the Chl1-II. It is likely that
the Clb1-II is the result of mobilization of Nb and W during wolframite transformation into
scheelite. However, no particular textures were observed in Wf1-I using the SEM.
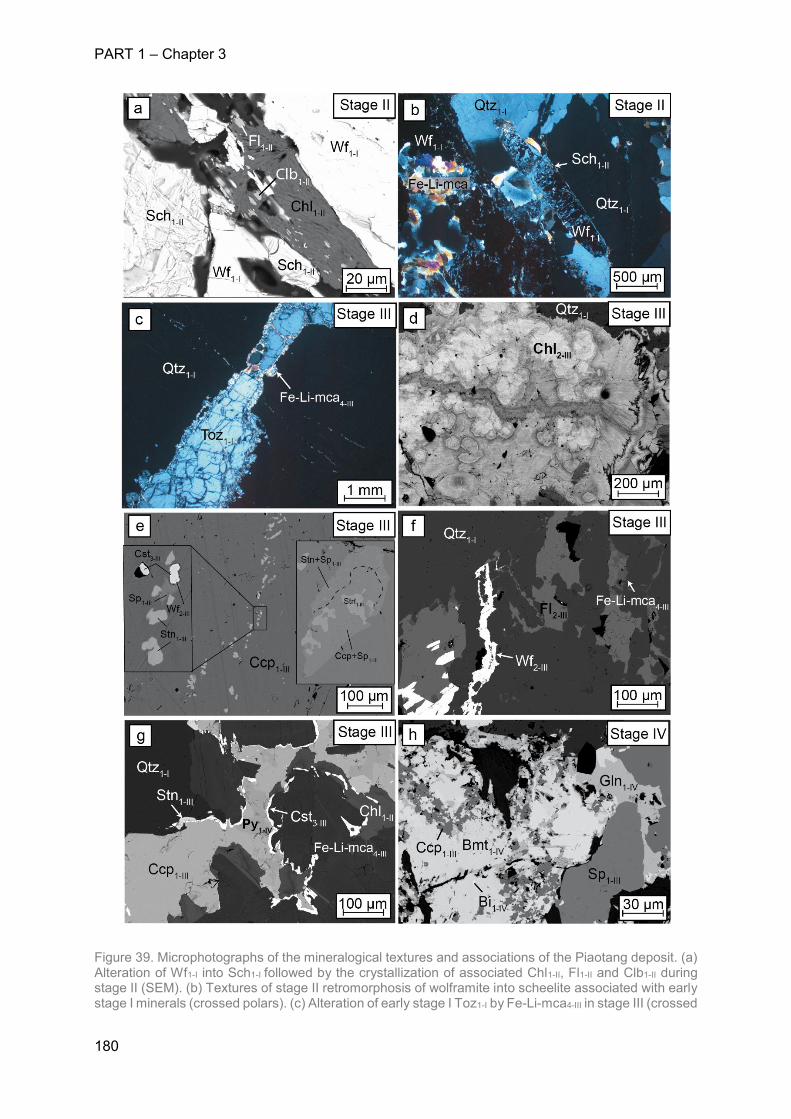
PART 1 – Chapter 3
180
Figure 39. Microphotographs of the mineralogical textures and associations of the Piaotang deposit. (a) Alteration of Wf1-I into Sch1-I followed by the crystallization of associated Chl1-II, Fl1-II and Clb1-II during stage II (SEM). (b) Textures of stage II retromorphosis of wolframite into scheelite associated with early stage I minerals (crossed polars). (c) Alteration of early stage I Toz1-I by Fe-Li-mca4-III in stage III (crossed
PART 1 – Chapter 3
181
polars). (d) Spherulites of chlorite that crystallized during the stage II (SEM). (e) Microcracks lining the Ccp1-IV boundary with inclusions of Cst3-III, Wf2-III, Stn1-III, and symplectic textures observed between Ccp1-III, Sp1-III and Stn1-III (SEM). (f) Association of the second generation of Wf2-III with Fl2-III and Fe-Li-mca4-III in stage III (SEM). (g) Association of a third generation of cassiterite Cst3-III and Stn1-III to stage IV sulphides (SEM) replacing second stage chlorite Chl1-II. (h) Texture and association of Ccp1-III, Sp1-III, Gln1-IV, Bmt1-IV, Bi1-IV in stage IV (SEM). Abbreviations according to the IMA: Bi = native bismuth; Bmt = bismuthinite; Ccp = chalcopyrite; Chl = chlorite; Clb = Colombo-tantalite; Cst = cassiterite; Fl = fluorite; Gln = galena; Mca = micas; Mlb = molybdenite; Py = pyrite; Qtz = quartz; Sch = scheelite; Sp = sphalerite; Stn = stannite Toz = topaz; Wf = wolframite.
Sulphide stage III: Although mainly marked at the macroscopic scale by sulphide
deposition, this stage is characterized by a complex succession of phyllosilicates, sulphides
and late wolframite and cassiterite. The Fe-Li-mica (Fe-Li-mca4-III) developed first, mainly at
the expense of a pervasively corroded Qtz1,2-I or in the form of small veinlets overprinting earlier
minerals as Chl1-II. Fe-Li-mca4-III is also observed in thin crack-seal re-openings at the vein
boundaries (exhibiting shearing features) and in alteration of Toz1-I (Figure 39c). Fe-Li-mca4-III
also appears as spherolites (up to 150 µm in diameter) in vuggy microcavities. Some
overgrowths on earlier micas (mainly Fe-Li-mca1-I) are associated with these spherolites. As
seen in Figure 40, these overgrowths (Z1 to Z4) are zoned and associated with reworking of
the early zinnwaldite/Li-Ms association, which is overprinted by micas similar to the first zone
of the overgrowth. The zones consist of an alternation of Li-Fe-Ms and Li-Ms. In the Monier
and Robert diagram (1986) (Figure 41c), these zones plot along the Fe-Li-mca4-III trend. The
end of the overgrowth is marked by distinctly Mg-rich (and Mn-poor) compositions, very similar
to those of the Fe-Li-mca4-III micas (Figure 40). Consequently, these overgrowths are
considered to be coeval with the latter (Fe-Li-mca4b-III). Sulphide deposition, coeval with a
second generation of chlorite (Chl2-III) (Figure 6d), follows chalcopyrite deposition (Ccp1-III).
Small euhedral prisms of a phenakite (Phk1-III) are found as inclusions in the chalcopyrite. This
phenakite could have trapped the beryllium leached from Brl1-I when replaced by Fe-Li-mca4-
III. Chl2-III deposition started with a Fe-chamosite composition and then evolved towards an Al-
Fe clinochlore composition. Sphalerite (Sp1-III) and stannite (Stn1-III) followed the chalcopyrite
deposition and appear as trails of more-or-less rounded inclusions (a few tens of µm in size).
In detail, the sphalerite inclusions are zoned, with a core that is spotted with multiple
PART 1 – Chapter 3
182
chalcopyrite micro-inclusions and a rim that exhibits symplectic stannite-sphalerite
associations (Figure 39e). Chalcopyrite micro-inclusions in sphalerite are known as
“chalcopyrite disease”, which is classically interpreted to result from a reaction between
sphalerite and a permeating Cu-rich fluid (Barton et al., 1978, Bortnikov et al., 1991). In the
present case, the texture could therefore be referred to as “sphalerite disease”, interpreted as
the healing of cracks affecting chalcopyrite. In systematic spatial association with sphalerite
and stannite in the chalcopyrite, small euhedral cassiterite crystals (Cst3-III) are observed, which
locally contain inclusions of Mn-wolframite (Fe0.43Mn0.57WO4, Wf2-III) (Figure 39f). Cst3-III is also
present in the form of microcracks lining the chalcopyrite boundary. Wf2-III microcracks of
hübneritic composition (from Fe0.20Mn0.80W04 to Fe0.12Mn0.88WO4) are also observed. A late
fluorite (Fl2-III) is coeval with Cst3-III and Wf2-III (Figure 38f and g).
Sulfosalt stage IV: Overprinting all preceding mineral assemblages, a late generation
of sulphured minerals has precipitated in the following sequence: galena (Bi-rich, up to 1 wt%),
members of the lillianite series (Ag0.8-1.1Pb1.6-1.3Bi2.6-2.7S6), lead-rich bismuthinite (up to 5 wt%),
and finally, native bismuth (Figure 39h).
5. Composition of micas
5.1 Major elements
All mica generations from the granite, greisen and the veins were studied by SEM and
analysed by EPMA for major elements and LA-ICPMS for minor and trace elements.
Representative EPMA analyses are presented in Table 3. A total of 170 EPMA and 98 LA-
ICPMS analyses were performed.
The problem of Li content: The LA-ICPMS analyses (Table 4) showed that all Piaotang
micas are Li-bearing micas. However, the micas appear to display complex internal patterns
(see below) and the diameter of the LA-ICPMS spots (44 to 120 µm) was not small enough to
measure most of the microstructures related to EPMA measurements (internal standardization
PART 1 – Chapter 3
183
for LA-ICPMS). Moreover, being a highly volatile element, lithium remains difficult to quantify
with precision by LA-ICPMS (up to 0.5 wt. % Li2O). To avoid this “lithium issue”, the empirical
regressions of Tischendorff et al. (1997) are used. The suitable regressions in our system
would be SiO2 for tri-octahedral micas and F for di-octahedral micas, and both were used in
the present study. However, the results were inconsistent: in the Li-Al-R2+ diagram of Foster
(1960), the Piaotang micas plot within the immiscibility gap determined by Monier and Robert
(1986), meaning that our calculated LiO2 contents (Li2O*) are underestimated. This problem
was also encountered by Legros et al. (2016) in a study of the Maoping deposit and was
resolved by adjusting the Li2O* contents (by adding a constant to the Li2O* values estimates
from the Tischendorff et al. (1997) regressions). However, this method would be very
complicated to apply in the case of the Piaotang deposit, where more trends are exhibited
(Figure 41). Consequently, the lithium content of the micas has been removed from the
diagrams.
Micas from granite: With an average Fe# (Fe/(Fe+Mg+Mn) ratio) of 0.55 and an
average R2+/(R2++Al) of 0.53, the granite micas plot between annite-phlogopite and eastonite-
siderophyllite compositions (Figure 41a) and may be classified as lithian biotite.
Fe-Li-mca1,2-I: The two first generations of micas appear as intergrowths of tri-
octahedral and di-octahedral components. Two converging trends are displayed in the Monier
and Robert (1986) diagram (Figure 41b): (i) a zinnwaldite-phlogopite trend (referred to as
zinnwaldite in the following) and (ii) a trend towards Li-muscovite (about 0.5 trilithionite),
referred to as Fe-Li muscovite in the following (Figure 41b). In detail, the micas consist of a
succession of alternating compositions between Fe-Li muscovite (Li-Fe-ms) and zinnwaldite
(Znw). Both Li-Fe-ms and Znw show a significant manganese content even though the
zinnwaldite components always exhibit higher Mn contents (up to 1.9 wt. % MnO). In addition,
the earliest Fe-Li-mca1-I are characterized by the development of a large overgrowth, on a core
formed by the complex intergrowths described above (Figure 40). This overgrowth is zoned,
showing a succession of Fe-Li-ms toward Li-ms trends with distinct Fe#, similar to the
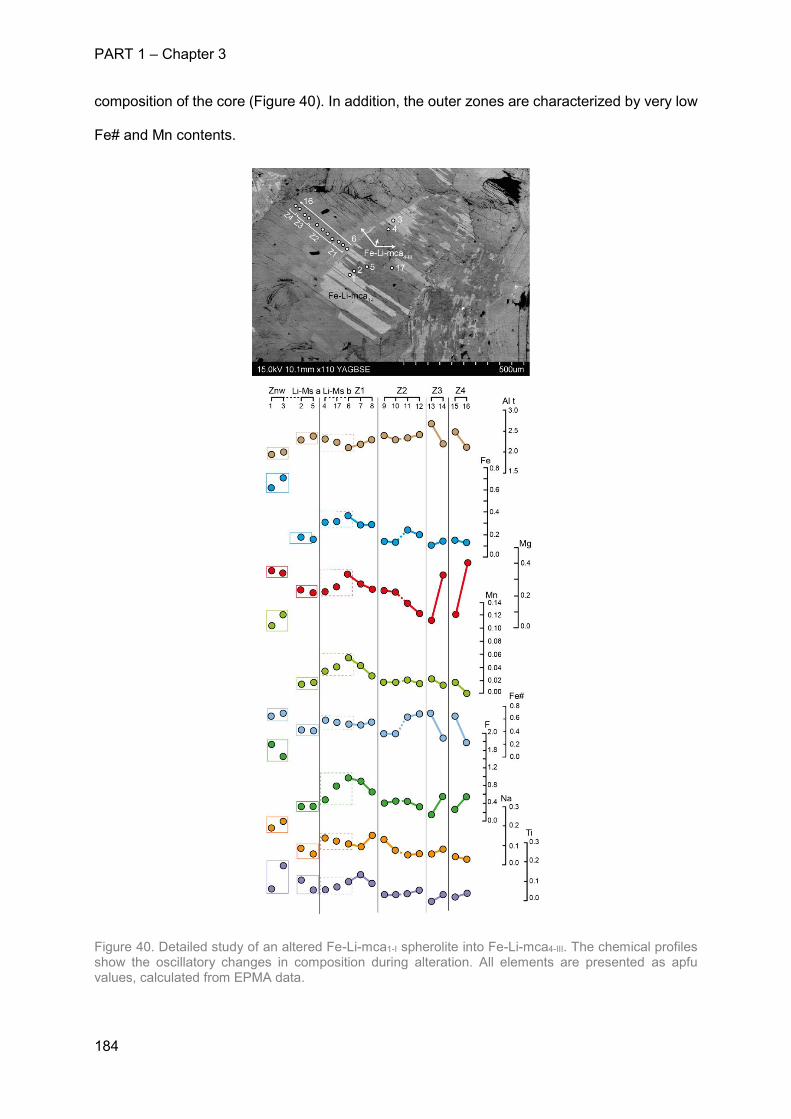
PART 1 – Chapter 3
184
composition of the core (Figure 40). In addition, the outer zones are characterized by very low
Fe# and Mn contents.
Figure 40. Detailed study of an altered Fe-Li-mca1-I spherolite into Fe-Li-mca4-III. The chemical profiles show the oscillatory changes in composition during alteration. All elements are presented as apfu values, calculated from EPMA data.
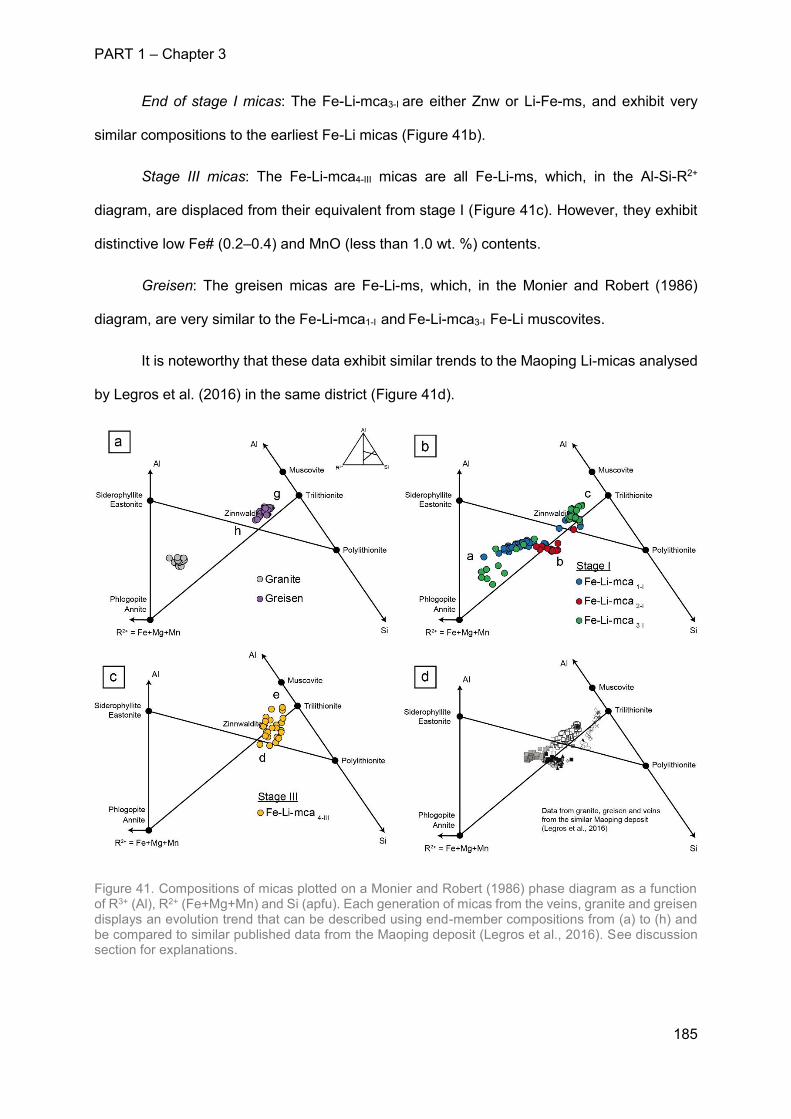
PART 1 – Chapter 3
185
End of stage I micas: The Fe-Li-mca3-I are either Znw or Li-Fe-ms, and exhibit very
similar compositions to the earliest Fe-Li micas (Figure 41b).
Stage III micas: The Fe-Li-mca4-III micas are all Fe-Li-ms, which, in the Al-Si-R2+
diagram, are displaced from their equivalent from stage I (Figure 41c). However, they exhibit
distinctive low Fe# (0.2–0.4) and MnO (less than 1.0 wt. %) contents.
Greisen: The greisen micas are Fe-Li-ms, which, in the Monier and Robert (1986)
diagram, are very similar to the Fe-Li-mca1-I and Fe-Li-mca3-I Fe-Li muscovites.
It is noteworthy that these data exhibit similar trends to the Maoping Li-micas analysed
by Legros et al. (2016) in the same district (Figure 41d).
Figure 41. Compositions of micas plotted on a Monier and Robert (1986) phase diagram as a function of R3+ (Al), R2+ (Fe+Mg+Mn) and Si (apfu). Each generation of micas from the veins, granite and greisen displays an evolution trend that can be described using end-member compositions from (a) to (h) and be compared to similar published data from the Maoping deposit (Legros et al., 2016). See discussion section for explanations.

PART 1 – Chapter 3
186
Table 3. Selected major oxide contents from EPMA analyses and calculated structural formulae for micas from each stage, granite and greisen. Li2O contents were calculated using Tischendorff et al. (1997). Values preceded by the symbol ‘<’ indicate element concentrations below the limit of detection.
EPMA (wt%)Fe-Li-micas1-I
(N=54)Fe-Li-micas2-I
(N=13)Fe-Li-micas3-I
(N=26)Fe-Li-micas4-III
(N=26)Granite (N=30) Greisen (N=20)
SiO2 35.42 44.44 45.36 47.46 35.54 43.79
TiO2 <0.05 0.06 <0.05 0.27 1.85 0.07
Al2O3 21.16 21.61 28.79 26.61 19.38 27.75
FeO 24.58 8.46 7.13 4.84 24.70 9.16
MnO 1.25 1.57 0.26 0.72 1.23 1.47
MgO 1.18 3.26 0.66 2.61 2.20 0.08
CaO <0.07 <0.07 <0.07 <0.07 <0.07 <0.07
Na2O 0.06 0.09 0.16 0.07 0.10 0.13
K2O 9.59 10.77 10.65 9.83 8.89 8.93
Rb2O 0.67 0.62 0.33 0.48 0.15 0.40
Li2O * 2.07 4.68 2.87 2.54 2.11 2.40
F 2.24 6.91 1.82 4.07 0.73 2.02
O=F 1.12 3.45 0.91 2.03 0.36 1.01
H2O 3.49 3.09 4.09 3.73 3.77 3.92
Total 100.12 100.65 100.83 100.34 100.14 99.63
Atoms per 12 [O. OH. F]
Si 2.64 2.8 3.01 3.03 2.70 2.99IVAl 1.36 1.2 0.99 0.97 1.30 1.01
Sum Tet. 4.00 4.00 4.00 4.00 4.00 4.00
Ti 0.00 0.00 0.00 0.01 0.11 0.00VIAl 0.50 0.43 1.26 1.04 0.43 1.22
Fe 1.53 0.45 0.40 0.26 1.57 0.52
Mn 0.08 0.08 0.01 0.04 0.08 0.08
Mg 0.13 0.31 0.07 0.25 0.25 0.01
Ca 0.00 0.00 0.00 0.00 0.00 0.00
Li 0.62 1.20 0.77 0.65 0.65 0.66
Sum Oct. 2.86 2.47 2.51 2.25 3.09 2.49
K 0.91 0.87 0.90 0.80 0.86 0.78
Rb 0.03 0.03 0.01 0.02 0.01 0.02
Na 0.01 0.01 0.02 0.01 0.01 0.02
Sum A 0.95 0.91 0.93 0.83 0.88 0.82
F 0.26 0.69 0.19 0.41 0.09 0.22
OH 1.74 1.31 1.81 1.59 1.81 1.78
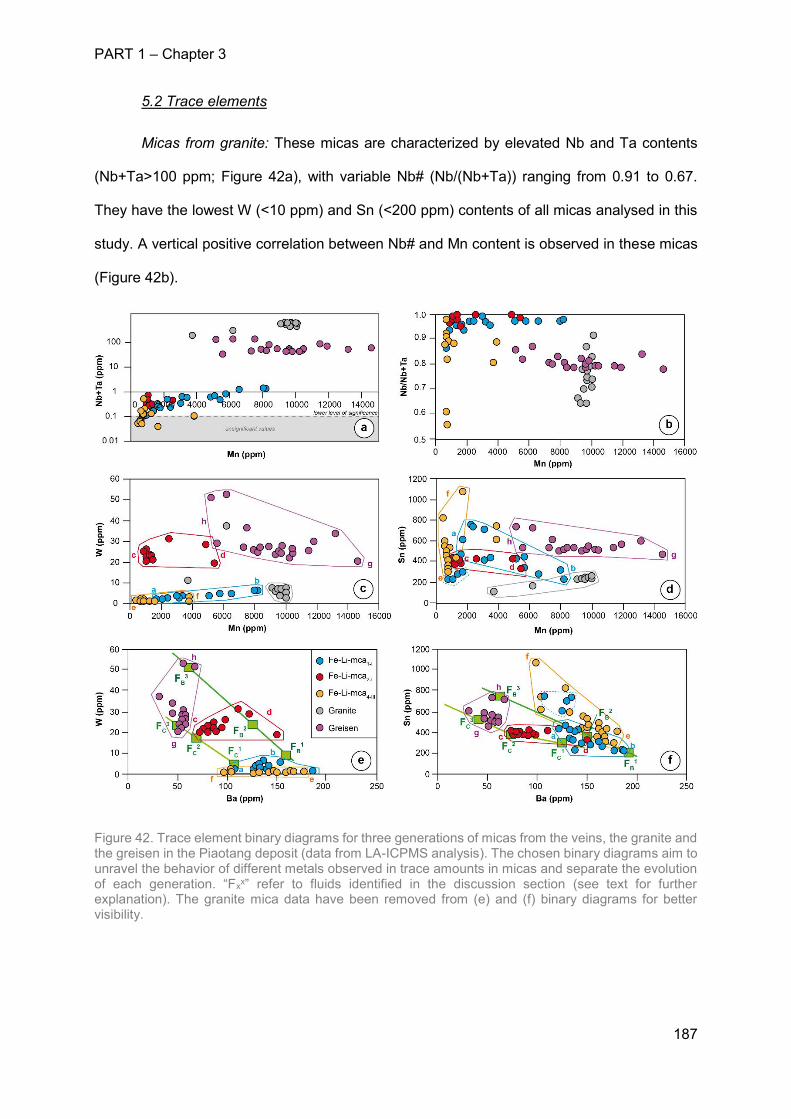
PART 1 – Chapter 3
187
5.2 Trace elements
Micas from granite: These micas are characterized by elevated Nb and Ta contents
(Nb+Ta>100 ppm; Figure 42a), with variable Nb# (Nb/(Nb+Ta)) ranging from 0.91 to 0.67.
They have the lowest W (<10 ppm) and Sn (<200 ppm) contents of all micas analysed in this
study. A vertical positive correlation between Nb# and Mn content is observed in these micas
(Figure 42b).
Figure 42. Trace element binary diagrams for three generations of micas from the veins, the granite and the greisen in the Piaotang deposit (data from LA-ICPMS analysis). The chosen binary diagrams aim to unravel the behavior of different metals observed in trace amounts in micas and separate the evolution of each generation. “Fxx” refer to fluids identified in the discussion section (see text for further explanation). The granite mica data have been removed from (e) and (f) binary diagrams for better visibility.
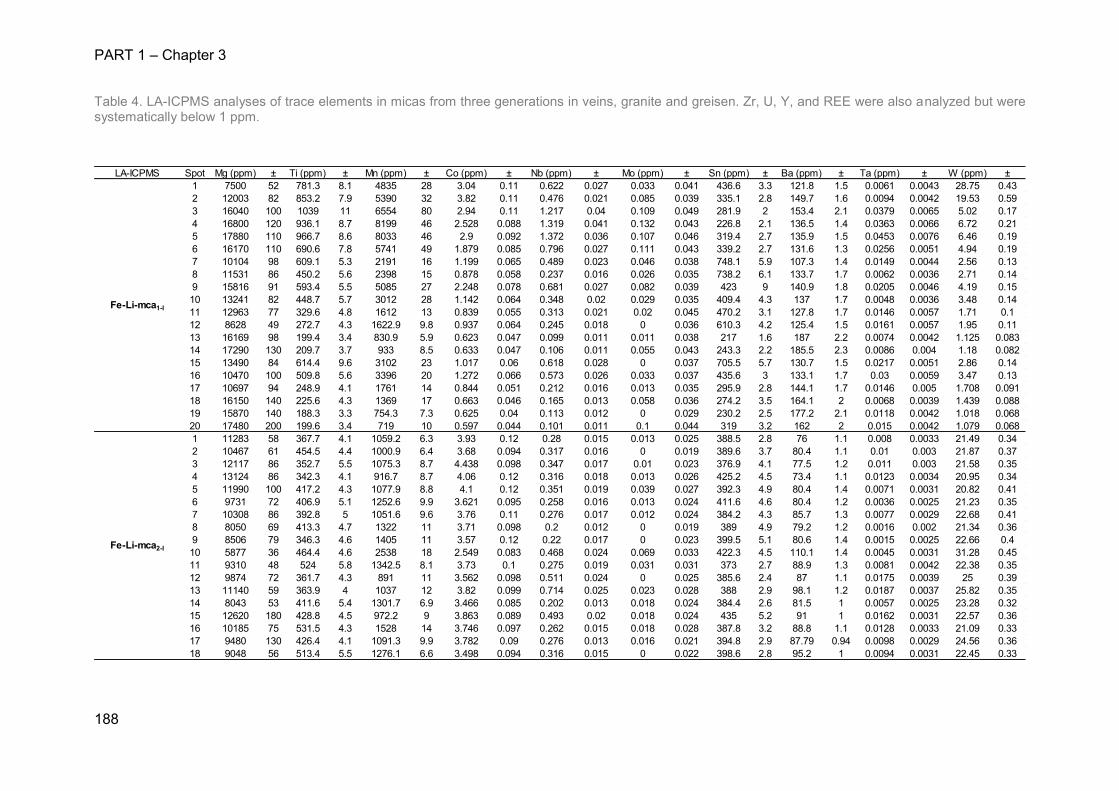
PART 1 – Chapter 3
188
Table 4. LA-ICPMS analyses of trace elements in micas from three generations in veins, granite and greisen. Zr, U, Y, and REE were also analyzed but were systematically below 1 ppm.
LA-ICPMS Spot Mg (ppm) ± Ti (ppm) ± Mn (ppm) ± Co (ppm) ± Nb (ppm) ± Mo (ppm) ± Sn (ppm) ± Ba (ppm) ± Ta (ppm) ± W (ppm) ±1 7500 52 781.3 8.1 4835 28 3.04 0.11 0.622 0.027 0.033 0.041 436.6 3.3 121.8 1.5 0.0061 0.0043 28.75 0.432 12003 82 853.2 7.9 5390 32 3.82 0.11 0.476 0.021 0.085 0.039 335.1 2.8 149.7 1.6 0.0094 0.0042 19.53 0.593 16040 100 1039 11 6554 80 2.94 0.11 1.217 0.04 0.109 0.049 281.9 2 153.4 2.1 0.0379 0.0065 5.02 0.174 16800 120 936.1 8.7 8199 46 2.528 0.088 1.319 0.041 0.132 0.043 226.8 2.1 136.5 1.4 0.0363 0.0066 6.72 0.215 17880 110 966.7 8.6 8033 46 2.9 0.092 1.372 0.036 0.107 0.046 319.4 2.7 135.9 1.5 0.0453 0.0076 6.46 0.196 16170 110 690.6 7.8 5741 49 1.879 0.085 0.796 0.027 0.111 0.043 339.2 2.7 131.6 1.3 0.0256 0.0051 4.94 0.197 10104 98 609.1 5.3 2191 16 1.199 0.065 0.489 0.023 0.046 0.038 748.1 5.9 107.3 1.4 0.0149 0.0044 2.56 0.138 11531 86 450.2 5.6 2398 15 0.878 0.058 0.237 0.016 0.026 0.035 738.2 6.1 133.7 1.7 0.0062 0.0036 2.71 0.149 15816 91 593.4 5.5 5085 27 2.248 0.078 0.681 0.027 0.082 0.039 423 9 140.9 1.8 0.0205 0.0046 4.19 0.1510 13241 82 448.7 5.7 3012 28 1.142 0.064 0.348 0.02 0.029 0.035 409.4 4.3 137 1.7 0.0048 0.0036 3.48 0.1411 12963 77 329.6 4.8 1612 13 0.839 0.055 0.313 0.021 0.02 0.045 470.2 3.1 127.8 1.7 0.0146 0.0057 1.71 0.112 8628 49 272.7 4.3 1622.9 9.8 0.937 0.064 0.245 0.018 0 0.036 610.3 4.2 125.4 1.5 0.0161 0.0057 1.95 0.1113 16169 98 199.4 3.4 830.9 5.9 0.623 0.047 0.099 0.011 0.011 0.038 217 1.6 187 2.2 0.0074 0.0042 1.125 0.08314 17290 130 209.7 3.7 933 8.5 0.633 0.047 0.106 0.011 0.055 0.043 243.3 2.2 185.5 2.3 0.0086 0.004 1.18 0.08215 13490 84 614.4 9.6 3102 23 1.017 0.06 0.618 0.028 0 0.037 705.5 5.7 130.7 1.5 0.0217 0.0051 2.86 0.1416 10470 100 509.8 5.6 3396 20 1.272 0.066 0.573 0.026 0.033 0.037 435.6 3 133.1 1.7 0.03 0.0059 3.47 0.1317 10697 94 248.9 4.1 1761 14 0.844 0.051 0.212 0.016 0.013 0.035 295.9 2.8 144.1 1.7 0.0146 0.005 1.708 0.09118 16150 140 225.6 4.3 1369 17 0.663 0.046 0.165 0.013 0.058 0.036 274.2 3.5 164.1 2 0.0068 0.0039 1.439 0.08819 15870 140 188.3 3.3 754.3 7.3 0.625 0.04 0.113 0.012 0 0.029 230.2 2.5 177.2 2.1 0.0118 0.0042 1.018 0.06820 17480 200 199.6 3.4 719 10 0.597 0.044 0.101 0.011 0.1 0.044 319 3.2 162 2 0.015 0.0042 1.079 0.0681 11283 58 367.7 4.1 1059.2 6.3 3.93 0.12 0.28 0.015 0.013 0.025 388.5 2.8 76 1.1 0.008 0.0033 21.49 0.342 10467 61 454.5 4.4 1000.9 6.4 3.68 0.094 0.317 0.016 0 0.019 389.6 3.7 80.4 1.1 0.01 0.003 21.87 0.373 12117 86 352.7 5.5 1075.3 8.7 4.438 0.098 0.347 0.017 0.01 0.023 376.9 4.1 77.5 1.2 0.011 0.003 21.58 0.354 13124 86 342.3 4.1 916.7 8.7 4.06 0.12 0.316 0.018 0.013 0.026 425.2 4.5 73.4 1.1 0.0123 0.0034 20.95 0.345 11990 100 417.2 4.3 1077.9 8.8 4.1 0.12 0.351 0.019 0.039 0.027 392.3 4.9 80.4 1.4 0.0071 0.0031 20.82 0.416 9731 72 406.9 5.1 1252.6 9.9 3.621 0.095 0.258 0.016 0.013 0.024 411.6 4.6 80.4 1.2 0.0036 0.0025 21.23 0.357 10308 86 392.8 5 1051.6 9.6 3.76 0.11 0.276 0.017 0.012 0.024 384.2 4.3 85.7 1.3 0.0077 0.0029 22.68 0.418 8050 69 413.3 4.7 1322 11 3.71 0.098 0.2 0.012 0 0.019 389 4.9 79.2 1.2 0.0016 0.002 21.34 0.369 8506 79 346.3 4.6 1405 11 3.57 0.12 0.22 0.017 0 0.023 399.5 5.1 80.6 1.4 0.0015 0.0025 22.66 0.410 5877 36 464.4 4.6 2538 18 2.549 0.083 0.468 0.024 0.069 0.033 422.3 4.5 110.1 1.4 0.0045 0.0031 31.28 0.4511 9310 48 524 5.8 1342.5 8.1 3.73 0.1 0.275 0.019 0.031 0.031 373 2.7 88.9 1.3 0.0081 0.0042 22.38 0.3512 9874 72 361.7 4.3 891 11 3.562 0.098 0.511 0.024 0 0.025 385.6 2.4 87 1.1 0.0175 0.0039 25 0.3913 11140 59 363.9 4 1037 12 3.82 0.099 0.714 0.025 0.023 0.028 388 2.9 98.1 1.2 0.0187 0.0037 25.82 0.3514 8043 53 411.6 5.4 1301.7 6.9 3.466 0.085 0.202 0.013 0.018 0.024 384.4 2.6 81.5 1 0.0057 0.0025 23.28 0.3215 12620 180 428.8 4.5 972.2 9 3.863 0.089 0.493 0.02 0.018 0.024 435 5.2 91 1 0.0162 0.0031 22.57 0.3616 10185 75 531.5 4.3 1528 14 3.746 0.097 0.262 0.015 0.018 0.028 387.8 3.2 88.8 1.1 0.0128 0.0033 21.09 0.3317 9480 130 426.4 4.1 1091.3 9.9 3.782 0.09 0.276 0.013 0.016 0.021 394.8 2.9 87.79 0.94 0.0098 0.0029 24.56 0.3618 9048 56 513.4 5.5 1276.1 6.6 3.498 0.094 0.316 0.015 0 0.022 398.6 2.8 95.2 1 0.0094 0.0031 22.45 0.33
Fe-Li-mca2-I
Fe-Li-mca1-I
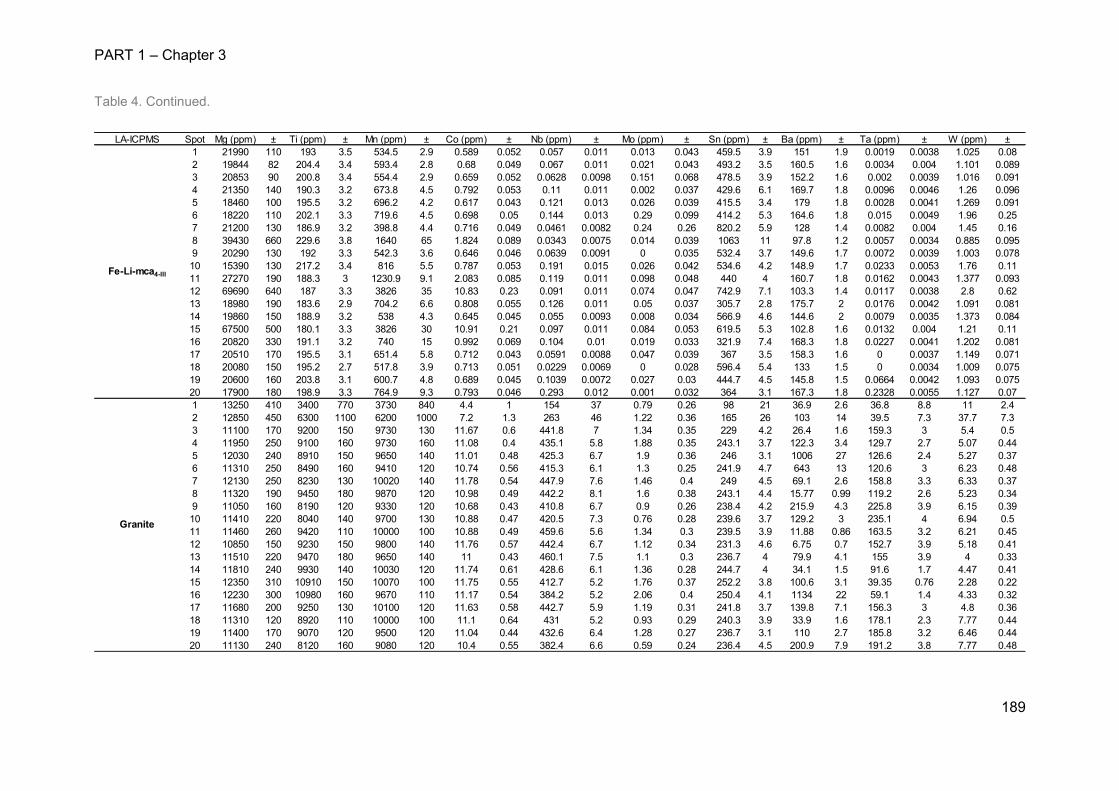
PART 1 – Chapter 3
189
Table 4. Continued.
LA-ICPMS Spot Mg (ppm) ± Ti (ppm) ± Mn (ppm) ± Co (ppm) ± Nb (ppm) ± Mo (ppm) ± Sn (ppm) ± Ba (ppm) ± Ta (ppm) ± W (ppm) ±1 21990 110 193 3.5 534.5 2.9 0.589 0.052 0.057 0.011 0.013 0.043 459.5 3.9 151 1.9 0.0019 0.0038 1.025 0.082 19844 82 204.4 3.4 593.4 2.8 0.68 0.049 0.067 0.011 0.021 0.043 493.2 3.5 160.5 1.6 0.0034 0.004 1.101 0.0893 20853 90 200.8 3.4 554.4 2.9 0.659 0.052 0.0628 0.0098 0.151 0.068 478.5 3.9 152.2 1.6 0.002 0.0039 1.016 0.0914 21350 140 190.3 3.2 673.8 4.5 0.792 0.053 0.11 0.011 0.002 0.037 429.6 6.1 169.7 1.8 0.0096 0.0046 1.26 0.0965 18460 100 195.5 3.2 696.2 4.2 0.617 0.043 0.121 0.013 0.026 0.039 415.5 3.4 179 1.8 0.0028 0.0041 1.269 0.0916 18220 110 202.1 3.3 719.6 4.5 0.698 0.05 0.144 0.013 0.29 0.099 414.2 5.3 164.6 1.8 0.015 0.0049 1.96 0.257 21200 130 186.9 3.2 398.8 4.4 0.716 0.049 0.0461 0.0082 0.24 0.26 820.2 5.9 128 1.4 0.0082 0.004 1.45 0.168 39430 660 229.6 3.8 1640 65 1.824 0.089 0.0343 0.0075 0.014 0.039 1063 11 97.8 1.2 0.0057 0.0034 0.885 0.0959 20290 130 192 3.3 542.3 3.6 0.646 0.046 0.0639 0.0091 0 0.035 532.4 3.7 149.6 1.7 0.0072 0.0039 1.003 0.07810 15390 130 217.2 3.4 816 5.5 0.787 0.053 0.191 0.015 0.026 0.042 534.6 4.2 148.9 1.7 0.0233 0.0053 1.76 0.1111 27270 190 188.3 3 1230.9 9.1 2.083 0.085 0.119 0.011 0.098 0.048 440 4 160.7 1.8 0.0162 0.0043 1.377 0.09312 69690 640 187 3.3 3826 35 10.83 0.23 0.091 0.011 0.074 0.047 742.9 7.1 103.3 1.4 0.0117 0.0038 2.8 0.6213 18980 190 183.6 2.9 704.2 6.6 0.808 0.055 0.126 0.011 0.05 0.037 305.7 2.8 175.7 2 0.0176 0.0042 1.091 0.08114 19860 150 188.9 3.2 538 4.3 0.645 0.045 0.055 0.0093 0.008 0.034 566.9 4.6 144.6 2 0.0079 0.0035 1.373 0.08415 67500 500 180.1 3.3 3826 30 10.91 0.21 0.097 0.011 0.084 0.053 619.5 5.3 102.8 1.6 0.0132 0.004 1.21 0.1116 20820 330 191.1 3.2 740 15 0.992 0.069 0.104 0.01 0.019 0.033 321.9 7.4 168.3 1.8 0.0227 0.0041 1.202 0.08117 20510 170 195.5 3.1 651.4 5.8 0.712 0.043 0.0591 0.0088 0.047 0.039 367 3.5 158.3 1.6 0 0.0037 1.149 0.07118 20080 150 195.2 2.7 517.8 3.9 0.713 0.051 0.0229 0.0069 0 0.028 596.4 5.4 133 1.5 0 0.0034 1.009 0.07519 20600 160 203.8 3.1 600.7 4.8 0.689 0.045 0.1039 0.0072 0.027 0.03 444.7 4.5 145.8 1.5 0.0664 0.0042 1.093 0.07520 17900 180 198.9 3.3 764.9 9.3 0.793 0.046 0.293 0.012 0.001 0.032 364 3.1 167.3 1.8 0.2328 0.0055 1.127 0.071 13250 410 3400 770 3730 840 4.4 1 154 37 0.79 0.26 98 21 36.9 2.6 36.8 8.8 11 2.42 12850 450 6300 1100 6200 1000 7.2 1.3 263 46 1.22 0.36 165 26 103 14 39.5 7.3 37.7 7.33 11100 170 9200 150 9730 130 11.67 0.6 441.8 7 1.34 0.35 229 4.2 26.4 1.6 159.3 3 5.4 0.54 11950 250 9100 160 9730 160 11.08 0.4 435.1 5.8 1.88 0.35 243.1 3.7 122.3 3.4 129.7 2.7 5.07 0.445 12030 240 8910 150 9650 140 11.01 0.48 425.3 6.7 1.9 0.36 246 3.1 1006 27 126.6 2.4 5.27 0.376 11310 250 8490 160 9410 120 10.74 0.56 415.3 6.1 1.3 0.25 241.9 4.7 643 13 120.6 3 6.23 0.487 12130 250 8230 130 10020 140 11.78 0.54 447.9 7.6 1.46 0.4 249 4.5 69.1 2.6 158.8 3.3 6.33 0.378 11320 190 9450 180 9870 120 10.98 0.49 442.2 8.1 1.6 0.38 243.1 4.4 15.77 0.99 119.2 2.6 5.23 0.349 11050 160 8190 120 9330 120 10.68 0.43 410.8 6.7 0.9 0.26 238.4 4.2 215.9 4.3 225.8 3.9 6.15 0.3910 11410 220 8040 140 9700 130 10.88 0.47 420.5 7.3 0.76 0.28 239.6 3.7 129.2 3 235.1 4 6.94 0.511 11460 260 9420 110 10000 100 10.88 0.49 459.6 5.6 1.34 0.3 239.5 3.9 11.88 0.86 163.5 3.2 6.21 0.4512 10850 150 9230 150 9800 140 11.76 0.57 442.4 6.7 1.12 0.34 231.3 4.6 6.75 0.7 152.7 3.9 5.18 0.4113 11510 220 9470 180 9650 140 11 0.43 460.1 7.5 1.1 0.3 236.7 4 79.9 4.1 155 3.9 4 0.3314 11810 240 9930 140 10030 120 11.74 0.61 428.6 6.1 1.36 0.28 244.7 4 34.1 1.5 91.6 1.7 4.47 0.4115 12350 310 10910 150 10070 100 11.75 0.55 412.7 5.2 1.76 0.37 252.2 3.8 100.6 3.1 39.35 0.76 2.28 0.2216 12230 300 10980 160 9670 110 11.17 0.54 384.2 5.2 2.06 0.4 250.4 4.1 1134 22 59.1 1.4 4.33 0.3217 11680 200 9250 130 10100 120 11.63 0.58 442.7 5.9 1.19 0.31 241.8 3.7 139.8 7.1 156.3 3 4.8 0.3618 11310 120 8920 110 10000 100 11.1 0.64 431 5.2 0.93 0.29 240.3 3.9 33.9 1.6 178.1 2.3 7.77 0.4419 11400 170 9070 120 9500 120 11.04 0.44 432.6 6.4 1.28 0.27 236.7 3.1 110 2.7 185.8 3.2 6.46 0.4420 11130 240 8120 160 9080 120 10.4 0.55 382.4 6.6 0.59 0.24 236.4 4.5 200.9 7.9 191.2 3.8 7.77 0.48
Fe-Li-mca4-III
Granite
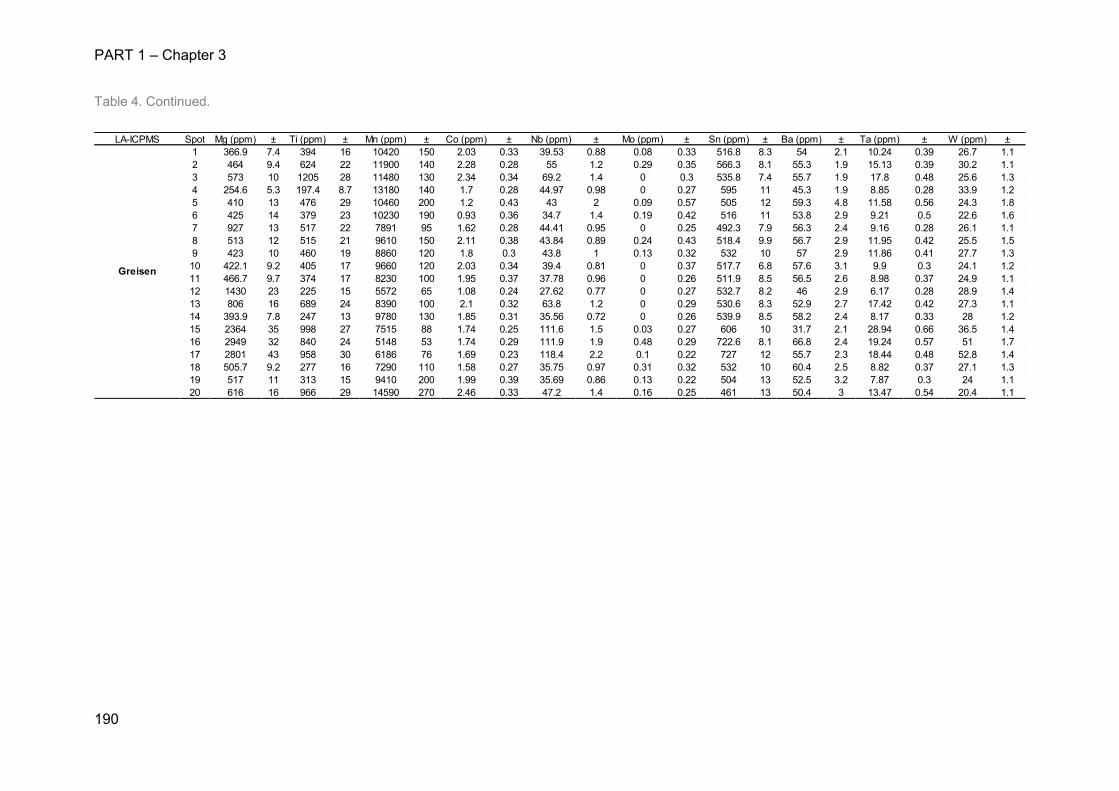
PART 1 – Chapter 3
190
Table 4. Continued.
LA-ICPMS Spot Mg (ppm) ± Ti (ppm) ± Mn (ppm) ± Co (ppm) ± Nb (ppm) ± Mo (ppm) ± Sn (ppm) ± Ba (ppm) ± Ta (ppm) ± W (ppm) ±1 366.9 7.4 394 16 10420 150 2.03 0.33 39.53 0.88 0.08 0.33 516.8 8.3 54 2.1 10.24 0.39 26.7 1.12 464 9.4 624 22 11900 140 2.28 0.28 55 1.2 0.29 0.35 566.3 8.1 55.3 1.9 15.13 0.39 30.2 1.13 573 10 1205 28 11480 130 2.34 0.34 69.2 1.4 0 0.3 535.8 7.4 55.7 1.9 17.8 0.48 25.6 1.34 254.6 5.3 197.4 8.7 13180 140 1.7 0.28 44.97 0.98 0 0.27 595 11 45.3 1.9 8.85 0.28 33.9 1.25 410 13 476 29 10460 200 1.2 0.43 43 2 0.09 0.57 505 12 59.3 4.8 11.58 0.56 24.3 1.86 425 14 379 23 10230 190 0.93 0.36 34.7 1.4 0.19 0.42 516 11 53.8 2.9 9.21 0.5 22.6 1.67 927 13 517 22 7891 95 1.62 0.28 44.41 0.95 0 0.25 492.3 7.9 56.3 2.4 9.16 0.28 26.1 1.18 513 12 515 21 9610 150 2.11 0.38 43.84 0.89 0.24 0.43 518.4 9.9 56.7 2.9 11.95 0.42 25.5 1.59 423 10 460 19 8860 120 1.8 0.3 43.8 1 0.13 0.32 532 10 57 2.9 11.86 0.41 27.7 1.310 422.1 9.2 405 17 9660 120 2.03 0.34 39.4 0.81 0 0.37 517.7 6.8 57.6 3.1 9.9 0.3 24.1 1.211 466.7 9.7 374 17 8230 100 1.95 0.37 37.78 0.96 0 0.26 511.9 8.5 56.5 2.6 8.98 0.37 24.9 1.112 1430 23 225 15 5572 65 1.08 0.24 27.62 0.77 0 0.27 532.7 8.2 46 2.9 6.17 0.28 28.9 1.413 806 16 689 24 8390 100 2.1 0.32 63.8 1.2 0 0.29 530.6 8.3 52.9 2.7 17.42 0.42 27.3 1.114 393.9 7.8 247 13 9780 130 1.85 0.31 35.56 0.72 0 0.26 539.9 8.5 58.2 2.4 8.17 0.33 28 1.215 2364 35 998 27 7515 88 1.74 0.25 111.6 1.5 0.03 0.27 606 10 31.7 2.1 28.94 0.66 36.5 1.416 2949 32 840 24 5148 53 1.74 0.29 111.9 1.9 0.48 0.29 722.6 8.1 66.8 2.4 19.24 0.57 51 1.717 2801 43 958 30 6186 76 1.69 0.23 118.4 2.2 0.1 0.22 727 12 55.7 2.3 18.44 0.48 52.8 1.418 505.7 9.2 277 16 7290 110 1.58 0.27 35.75 0.97 0.31 0.32 532 10 60.4 2.5 8.82 0.37 27.1 1.319 517 11 313 15 9410 200 1.99 0.39 35.69 0.86 0.13 0.22 504 13 52.5 3.2 7.87 0.3 24 1.120 616 16 966 29 14590 270 2.46 0.33 47.2 1.4 0.16 0.25 461 13 50.4 3 13.47 0.54 20.4 1.1
Greisen
PART 1 – Chapter 3
191
Vein micas: As seen in Figure 42a and Figure 42c, the first (Fe-Li-mca1-I) and fourth
(Fe-Li-mca4-III) generations of micas display positive correlations between Mn and W or Nb+Ta,
the Fe-Li-mca4-III being the most depleted. A group of Fe-Li-mca1-I analyses are displaced from
the overall trend and most likely represent the Fe-Li-mca4-III overgrowth (Z1 to Z4, Figure 40)
and, indeed, these micas plot with the Fe-Li-mca4-III micas in all diagrams. In contrast, the Fe-
Li-mca2-I micas plot as a cluster in all diagrams (Figure 42a, c and d). Compared to other
generations of micas, the Fe-Li-mca2-I micas are the most W-enriched (20 to 30 ppm), whereas
the Fe-Li-mca1-I micas are distinguished by higher Nb+Ta (up to 1.4 ppm). The Fe-Li-mca4-III
micas are characterized by elevated Sn contents (up to 820 ppm) and very low W and Nb+Ta
values. Due to the LA-ICPMS spot size, Fe-Li-mca3-I micas could not be analysed for trace
element contents.
Greisen micas: Compared to the micas analysed in veins, the greisen micas are
enriched in Nb and Ta (Figure 42a) and exhibit constant (close to the granite average) Nb#
(Figure 42b). In Figure 41a and b, the greisen micas also share some similarities with the stage
I micas.
6. Composition of chlorites
A total of 33 EMPA analyses were performed on chlorites (Chl1-II and Chl2-III) that
crystallized in the veins in stages II and III. Analyses were carried out on homogeneous Chl1-II
and 100-µm size spherolites of Chl2-III, perpendicular to their Fe-Mg zonation (Table 5, Figure
43). All of these chlorites were found to be tri/dioctahedral Fe–chlorites with compositions that
lie between ripidolite-brunsvigite and pycnochlorite fields. In the AlIV versus AlVI plot, both
generations of chlorite are displaced from the Tschermak line, which is always the case for
low-temperature chlorites (Figure 43c; Cathelineau and Nieva, 1985). The Chl2-III chlorites
present FeO contents of 17 to 35%, with Fe/(Fe+Mg) ratios of 0.3 to 0.8 (Table 5). From the
core to the margin of the spherolites, major elements, especially FeO and MgO concentrations,
show oscillatory variations (Figure 43a and b), but no general trend can be distinguished.
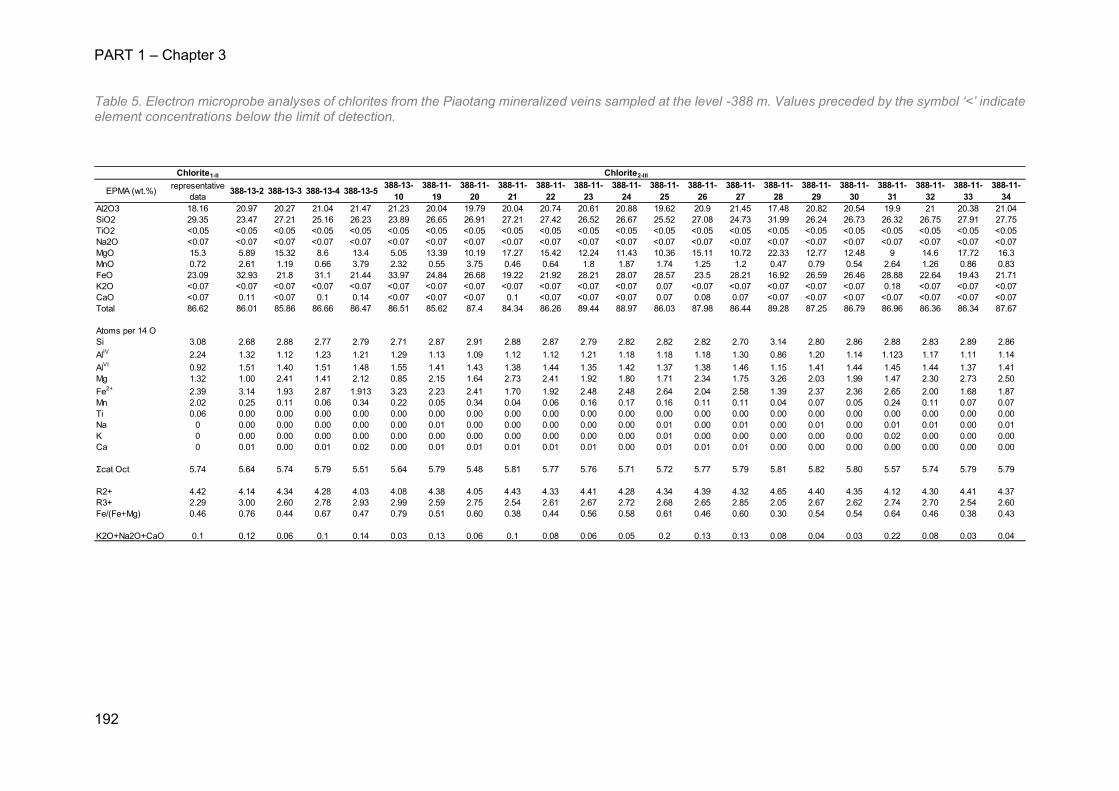
PART 1 – Chapter 3
192
Table 5. Electron microprobe analyses of chlorites from the Piaotang mineralized veins sampled at the level -388 m. Values preceded by the symbol ‘<’ indicate element concentrations below the limit of detection.
Chlorite1-II
EPMA (wt.%) representative data
388-13-2 388-13-3 388-13-4 388-13-5 388-13-10
388-11-19
388-11-20
388-11-21
388-11-22
388-11-23
388-11-24
388-11-25
388-11-26
388-11-27
388-11-28
388-11-29
388-11-30
388-11-31
388-11-32
388-11-33
388-11-34
Al2O3 18.16 20.97 20.27 21.04 21.47 21.23 20.04 19.79 20.04 20.74 20.61 20.88 19.62 20.9 21.45 17.48 20.82 20.54 19.9 21 20.38 21.04SiO2 29.35 23.47 27.21 25.16 26.23 23.89 26.65 26.91 27.21 27.42 26.52 26.67 25.52 27.08 24.73 31.99 26.24 26.73 26.32 26.75 27.91 27.75TiO2 <0.05 <0.05 <0.05 <0.05 <0.05 <0.05 <0.05 <0.05 <0.05 <0.05 <0.05 <0.05 <0.05 <0.05 <0.05 <0.05 <0.05 <0.05 <0.05 <0.05 <0.05 <0.05Na2O <0.07 <0.07 <0.07 <0.07 <0.07 <0.07 <0.07 <0.07 <0.07 <0.07 <0.07 <0.07 <0.07 <0.07 <0.07 <0.07 <0.07 <0.07 <0.07 <0.07 <0.07 <0.07MgO 15.3 5.89 15.32 8.6 13.4 5.05 13.39 10.19 17.27 15.42 12.24 11.43 10.36 15.11 10.72 22.33 12.77 12.48 9 14.6 17.72 16.3MnO 0.72 2.61 1.19 0.66 3.79 2.32 0.55 3.75 0.46 0.64 1.8 1.87 1.74 1.25 1.2 0.47 0.79 0.54 2.64 1.26 0.86 0.83FeO 23.09 32.93 21.8 31.1 21.44 33.97 24.84 26.68 19.22 21.92 28.21 28.07 28.57 23.5 28.21 16.92 26.59 26.46 28.88 22.64 19.43 21.71K2O <0.07 <0.07 <0.07 <0.07 <0.07 <0.07 <0.07 <0.07 <0.07 <0.07 <0.07 <0.07 0.07 <0.07 <0.07 <0.07 <0.07 <0.07 0.18 <0.07 <0.07 <0.07CaO <0.07 0.11 <0.07 0.1 0.14 <0.07 <0.07 <0.07 0.1 <0.07 <0.07 <0.07 0.07 0.08 0.07 <0.07 <0.07 <0.07 <0.07 <0.07 <0.07 <0.07Total 86.62 86.01 85.86 86.66 86.47 86.51 85.62 87.4 84.34 86.26 89.44 88.97 86.03 87.98 86.44 89.28 87.25 86.79 86.96 86.36 86.34 87.67
Atoms per 14 OSi 3.08 2.68 2.88 2.77 2.79 2.71 2.87 2.91 2.88 2.87 2.79 2.82 2.82 2.82 2.70 3.14 2.80 2.86 2.88 2.83 2.89 2.86AlIV 2.24 1.32 1.12 1.23 1.21 1.29 1.13 1.09 1.12 1.12 1.21 1.18 1.18 1.18 1.30 0.86 1.20 1.14 1.123 1.17 1.11 1.14AlVI 0.92 1.51 1.40 1.51 1.48 1.55 1.41 1.43 1.38 1.44 1.35 1.42 1.37 1.38 1.46 1.15 1.41 1.44 1.45 1.44 1.37 1.41Mg 1.32 1.00 2.41 1.41 2.12 0.85 2.15 1.64 2.73 2.41 1.92 1.80 1.71 2.34 1.75 3.26 2.03 1.99 1.47 2.30 2.73 2.50Fe2+ 2.39 3.14 1.93 2.87 1.913 3.23 2.23 2.41 1.70 1.92 2.48 2.48 2.64 2.04 2.58 1.39 2.37 2.36 2.65 2.00 1.68 1.87Mn 2.02 0.25 0.11 0.06 0.34 0.22 0.05 0.34 0.04 0.06 0.16 0.17 0.16 0.11 0.11 0.04 0.07 0.05 0.24 0.11 0.07 0.07Ti 0.06 0.00 0.00 0.00 0.00 0.00 0.00 0.00 0.00 0.00 0.00 0.00 0.00 0.00 0.00 0.00 0.00 0.00 0.00 0.00 0.00 0.00Na 0 0.00 0.00 0.00 0.00 0.00 0.01 0.00 0.00 0.00 0.00 0.00 0.01 0.00 0.01 0.00 0.01 0.00 0.01 0.01 0.00 0.01K 0 0.00 0.00 0.00 0.00 0.00 0.00 0.00 0.00 0.00 0.00 0.00 0.01 0.00 0.00 0.00 0.00 0.00 0.02 0.00 0.00 0.00Ca 0 0.01 0.00 0.01 0.02 0.00 0.01 0.01 0.01 0.01 0.01 0.00 0.01 0.01 0.01 0.00 0.00 0.00 0.00 0.00 0.00 0.00
Σcat Oct 5.74 5.64 5.74 5.79 5.51 5.64 5.79 5.48 5.81 5.77 5.76 5.71 5.72 5.77 5.79 5.81 5.82 5.80 5.57 5.74 5.79 5.79
R2+ 4.42 4.14 4.34 4.28 4.03 4.08 4.38 4.05 4.43 4.33 4.41 4.28 4.34 4.39 4.32 4.65 4.40 4.35 4.12 4.30 4.41 4.37R3+ 2.29 3.00 2.60 2.78 2.93 2.99 2.59 2.75 2.54 2.61 2.67 2.72 2.68 2.65 2.85 2.05 2.67 2.62 2.74 2.70 2.54 2.60Fe/(Fe+Mg) 0.46 0.76 0.44 0.67 0.47 0.79 0.51 0.60 0.38 0.44 0.56 0.58 0.61 0.46 0.60 0.30 0.54 0.54 0.64 0.46 0.38 0.43
K2O+Na2O+CaO 0.1 0.12 0.06 0.1 0.14 0.03 0.13 0.06 0.1 0.08 0.06 0.05 0.2 0.13 0.13 0.08 0.04 0.03 0.22 0.08 0.03 0.04
Chlorite2-III
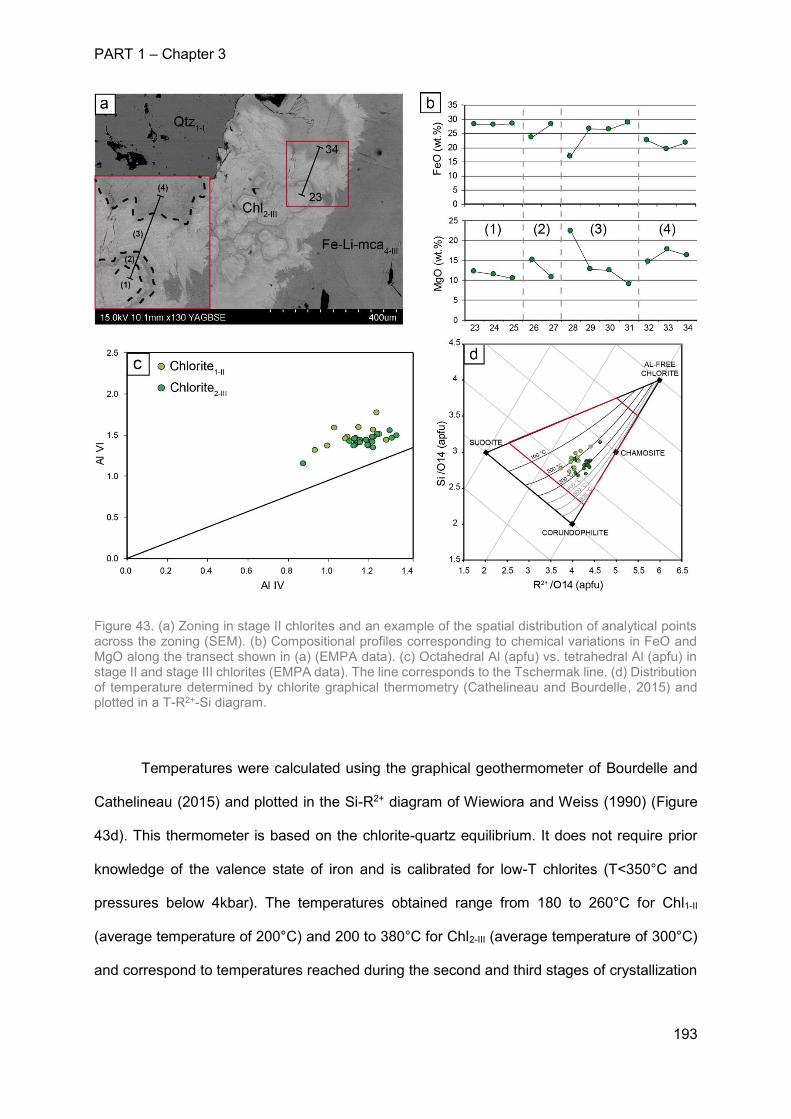
PART 1 – Chapter 3
193
Figure 43. (a) Zoning in stage II chlorites and an example of the spatial distribution of analytical points across the zoning (SEM). (b) Compositional profiles corresponding to chemical variations in FeO and MgO along the transect shown in (a) (EMPA data). (c) Octahedral Al (apfu) vs. tetrahedral Al (apfu) in stage II and stage III chlorites (EMPA data). The line corresponds to the Tschermak line. (d) Distribution of temperature determined by chlorite graphical thermometry (Cathelineau and Bourdelle, 2015) and plotted in a T-R2+-Si diagram.
Temperatures were calculated using the graphical geothermometer of Bourdelle and
Cathelineau (2015) and plotted in the Si-R2+ diagram of Wiewiora and Weiss (1990) (Figure
43d). This thermometer is based on the chlorite-quartz equilibrium. It does not require prior
knowledge of the valence state of iron and is calibrated for low-T chlorites (T<350°C and
pressures below 4kbar). The temperatures obtained range from 180 to 260°C for Chl1-II
(average temperature of 200°C) and 200 to 380°C for Chl2-III (average temperature of 300°C)
and correspond to temperatures reached during the second and third stages of crystallization
PART 1 – Chapter 3
194
of the veins. No correlation between the calculated temperatures and the petrographic zoning
in the Chl2-III or chemical composition was observed.
7. Discussion
7.1 Major elements in hydrothermal micas: evidence for fluid mixing
Fe-Li-mca1,2-I micas: In the Al-Si-R2+ diagram (Figure 41), the early Fe-Li-mca1,2-I
display two trends: a “phlogopite-zinnwaldite” trend between two poles a and b, and a
“zinnwaldite-muscovite” trend between the same b pole and a muscovite c pole (Figure 41b).
The systematic alternation between zinnwaldite and muscovite compositions during the
growth of Fe-Li-mca1,2-I indicates the coexistence, at this time in the Piaotang hydrothermal
system, of three distinct hydrothermal fluids responsible for the a-b and b-c trends. The b-c
trend may be interpreted as a mixing trend between two fluids, one richer in Fe and Mg and
the other, richer in Al, that co-precipitate in either Fe-Li-mca1-I or Fe-Li-mca2-I. By contrast, the
zinnwalditic a-b trend can be interpreted in terms of closed system crystallization (correlated
Fe and Mg contents). The a-pole is in fact associated with a primitive fluid end-member (FA),
whereas the b-pole is associated with the evolution of FA towards a FB composition by fractional
crystallization (closed system). Moreover, the b-c trend might be interpreted to be the result of
an opening of the system, with the arrival of a new FC fluid end-member (associated with the
c-pole), and a mixing of FC with the residual FB fluid. This trend is also observed in the greisen
micas (g-h trend). According to this interpretation, the complex structure of the Fe-Li-mca1,2-I
would result in a combination of alternating influxes of FA and FC, with repeated periods of
closure of the system, allowing the evolution of FA into FB. This is consistent with the continuous
presence of tectonic activity recorded during the hydrothermal process and the repetitive
occurrence of crack-seal phenomena. These early micas share similar compositions and
processes with early micas observed in the mineralizing stage of the Maoping deposit (also
from the Dayu district) by Legros et al. (2016).
PART 1 – Chapter 3
195
Fe-Li-mca3-I: The late stage I micas, either zinnwaldite, or Li-Fe-ms, display similar
trends to the other Piaotang micas (Figure 41b). The same pattern of a double trend
converging towards the same mica composition is observed. Fe-Li-mca3-I are therefore likely
to result from the same combination of closed system crystallization and mixing as the Fe-Li-
mca1,2-I micas.
Fe-Li-mca4-III: The Fe-Li-mca4-III display a single trend between a zinnwalditic d pole
and a muscovite e pole (Figure 41c), consistent with a scheme of fluid mixing between the two
end-members. Direct evidence for mixing is found in zoned overgrowths at the microscopic
scale, where compositional changes could not be caused by a fractional crystallization (closed
system) process (i.e., either Fe and Mg co-vary or Fe decreases when Mg increases) (Figure
40). The consistency between these d and e poles and the previous b and c poles will be
addressed in the following sections. These post-mineralization micas are similar in composition
to micas observed in the post-mineralizing stages of the Maoping deposit (also from the Dayu
district) (Legros et al. 2016).
7.2 Conditions of interpretation of trace element compositions
The chemical composition of a given hydrothermal mineral is a record of the fluid
composition, generally controlled by the partition coefficients of the incorporated elements
between the mineral and the fluid. These are in turn controlled by crystal chemistry constraints
and intensive parameters (P, T, pH, fO2, etc.). Crystal chemistry constraints are clear for major
elements, and may also be significant for trace elements. For instance, incorporation of Li
(likewise Nb and Ta) in trioctahedral micas depends on Al, due to the Li+1(Fe, Mg)+1Al-1
mechanism of incorporation. In the same way, Sn and W are incorporated by exchanges
involving Ti (and also Fe, Mg in the case of W) (Bos, 1990). Generally speaking, crystal
chemistry constraints are not well established for most trace elements in micas. Nevertheless,
it may be suggested that, at the 1000 ppm level (and below), the ability of sites and the major
elements needed for the substitution mechanisms are always sufficient to allow element
PART 1 – Chapter 3
196
incorporation. In this respect, the presence, or not, of a given trace element in a mica, is only
governed by the presence of the element in the hydrothermal fluid. The abundance of the
element in the mica is however controlled by the fluid-to-mica partition coefficient of the
element, and under a given set of intensive parameters, significant differences between the
partition coefficients of distinct trace elements might exist.
Experimental data related to mica-fluid partition coefficients are scarce and very limited
for hydrothermal conditions, experiments usually being conducted at high temperature (over
500°C). For instance, concerning F entry into micas, Zhu and Sverjensky (1991) conclude that
the higher the temperature, the lower the amount of fluorine that partitions into minerals. In
contrast, following the experimental results of Munoz and Ludington (1977), the F/(F+OH) ratio
of muscovite and phlogopite correlates positively with temperature (but only significantly at T
> 500°C). According to Munoz and Ludington (1977), when muscovite equilibrates with biotite,
it is systematically poorer in fluorine with no dependence upon octahedral occupancy (i.e., the
Al content). Nevertheless, both Li and Mg should increase F partitioning in muscovite.
Experiments on Rb and Cs partitioning between phlogopite and fluid performed at 800°C and
0.2 to 4 GPa by Melzer and Wunder (2001) show that while Rb partitions in the mineral, Cs
partitions into the fluid. Thus, the Rb/Cs ratio in phlogopite is not representative of the fluid
composition. However, from experiments on phlogopite at 650°C and 0.2 GPa, Bos (1990)
concluded that the Rb, Zn, Pb and Cu contents of the mica are only controlled by their
concentrations in the fluid. From these limited data, it may be estimated that the main control
on the incorporation of elements into a mica structure, is their abundance in the hydrothermal
fluids, and that their ratios in the mineral should therefore be close to their ratios in the fluids.
The large compositional differences between the different Piaotang mica generations may thus
be safely interpreted in terms of differences in the hydrothermal fluid compositions.
PART 1 – Chapter 3
197
7.3 Trace elements: characterization of fluid end-members
The data obtained from the Fe-Li-mca1-I and Fe-Li-mca2-I micas represent combinations
of both the a-b and b-c trends, depending on the local proportion of zinnwaldite and Fe-Li-ms
components at the spot site. Considering the mica structures, it seems that the Fe-Li-ms
components are statistically more abundant in the Fe-Li-mca1-I micas, which should
consequently yield more information on the b-c trend. Conversely, in the Fe-Li-mca2-I structure,
the zinnwaldite and Fe-Li-ms components are more equally distributed and are more likely
representative of the b pole. The data in Figure 41b are quite consistent with these
suggestions: the Fe-Li-mca1-I micas lie along trends suggestive of mixing, whereas the Fe-Li-
mca2-I data plot in a more homogeneous cluster, likely representing an average composition.
Given the trace element data for these micas, it is possible to simplify our interpretation
with a two-fluid model. Indeed, all hydrothermal mica generations (Fe-Li-mca1-I, Fe-Li-mca2-I,
Fe-Li-mca4-III and greisen) are characterized by trends in the trace element diagrams (Figure
42). According to major element interpretations, these trends may be considered as reflecting
mixing events and therefore may define four pairs of potential end-members (a and b for Fe-
Li-mca1-I, c and d for Fe-Li-mca2-I, e and f for Fe-Li-mca4-III, and g and h for greisen micas)
(Figure 42e and f). Owing to the fact that Mn is more abundant in zinnwaldite and other Fe-
rich micas, and in reference to the W-Mn diagram (Figure 42c), a and c correspond to the FB
end-member while b and d, reflect the FC end-member. The W-Ba and Sn-Ba diagrams allows
us to refine our interpretation of the trace element data. It appears (Figure 42e and f) that two
series of end-members (g, a, f and h, d, b, respectively) display well-defined trends,
connecting the earliest vein micas to the greisen micas. In contrast, the later Fe-Li-mca4-III
micas form their own trend and result from the FE-FF mixing process. Following this logic, the
greisen micas appear to result from the interaction of two series of fluids associated with the
stage I micas (FB and FC). These fluids evolve from a metal-poor to a metal-rich composition
with a constant fractionation vs mixing model (see section above).
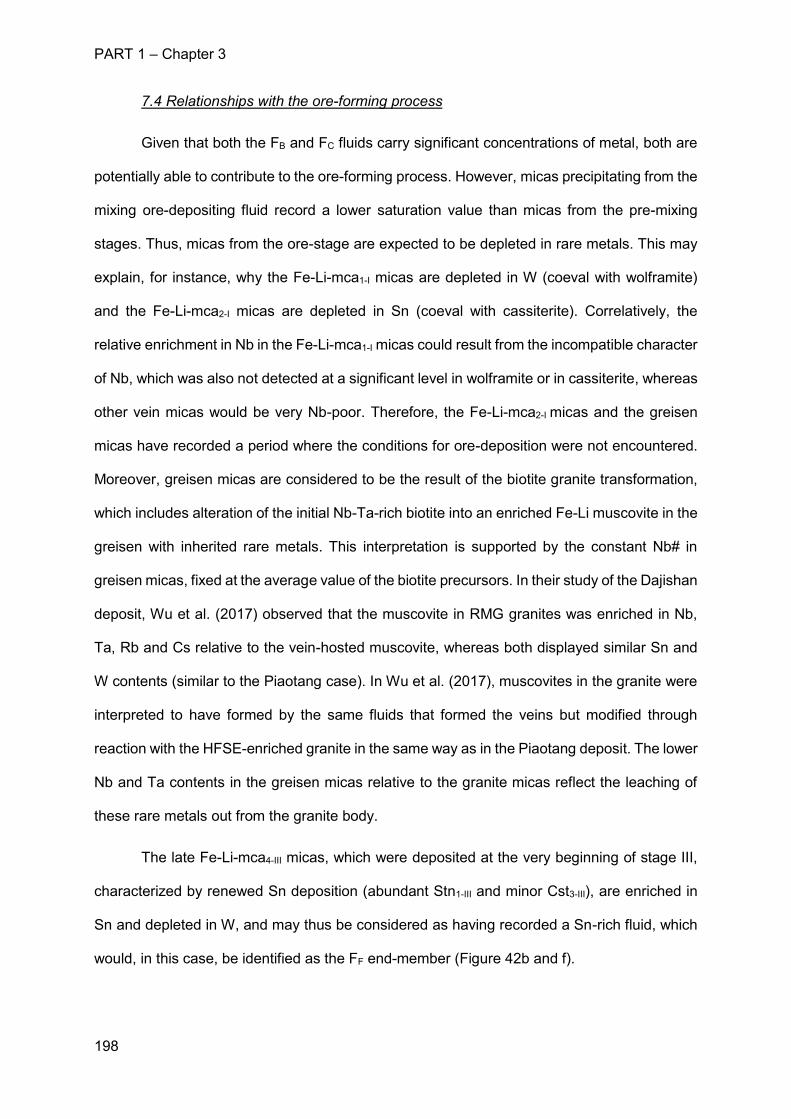
PART 1 – Chapter 3
198
7.4 Relationships with the ore-forming process
Given that both the FB and FC fluids carry significant concentrations of metal, both are
potentially able to contribute to the ore-forming process. However, micas precipitating from the
mixing ore-depositing fluid record a lower saturation value than micas from the pre-mixing
stages. Thus, micas from the ore-stage are expected to be depleted in rare metals. This may
explain, for instance, why the Fe-Li-mca1-I micas are depleted in W (coeval with wolframite)
and the Fe-Li-mca2-I micas are depleted in Sn (coeval with cassiterite). Correlatively, the
relative enrichment in Nb in the Fe-Li-mca1-I micas could result from the incompatible character
of Nb, which was also not detected at a significant level in wolframite or in cassiterite, whereas
other vein micas would be very Nb-poor. Therefore, the Fe-Li-mca2-I micas and the greisen
micas have recorded a period where the conditions for ore-deposition were not encountered.
Moreover, greisen micas are considered to be the result of the biotite granite transformation,
which includes alteration of the initial Nb-Ta-rich biotite into an enriched Fe-Li muscovite in the
greisen with inherited rare metals. This interpretation is supported by the constant Nb# in
greisen micas, fixed at the average value of the biotite precursors. In their study of the Dajishan
deposit, Wu et al. (2017) observed that the muscovite in RMG granites was enriched in Nb,
Ta, Rb and Cs relative to the vein-hosted muscovite, whereas both displayed similar Sn and
W contents (similar to the Piaotang case). In Wu et al. (2017), muscovites in the granite were
interpreted to have formed by the same fluids that formed the veins but modified through
reaction with the HFSE-enriched granite in the same way as in the Piaotang deposit. The lower
Nb and Ta contents in the greisen micas relative to the granite micas reflect the leaching of
these rare metals out from the granite body.
The late Fe-Li-mca4-III micas, which were deposited at the very beginning of stage III,
characterized by renewed Sn deposition (abundant Stn1-III and minor Cst3-III), are enriched in
Sn and depleted in W, and may thus be considered as having recorded a Sn-rich fluid, which
would, in this case, be identified as the FF end-member (Figure 42b and f).
PART 1 – Chapter 3
199
7.5 Comparison with published fluid inclusion studies
Fluid inclusion (FI) studies were performed at the Piaotang deposit on quartz (Wang et
al. 2013b; Ni et al. 2015), cassiterite (Zeng et al. 2002; Wang et al. 2013b) and wolframite (by
infrared microscopy; Ni et al. 2015). The corresponding data are summarized in Figure 44. For
each mineral presented in Figure 44, the primary FI were plotted. Secondary inclusions were
only analysed in quartz by Ni et al. (2015) and are referred to as “post stage I”. The FI display
a trend of decreasing temperature from wolframite (400 to 300°C) to cassiterite (350 to 300°C)
and finally to post-ore fluids trapped in quartz (300 to 150°C). Fluid mixing is attested to by
salinity variations in wolframite (between 4.6 and 8.9 wt. % eq. NaCl) and quartz (0 to 11 wt.
% eq. NaCl), whereas cassiterite trapped the most saline fluids (8.5 to 9.5 wt. % eq. NaCl).
Figure 44. Fluid inclusion data plotted on a binary salinity vs. homogenization temperature diagram after Ni et al., (2015), Wang et al., (2008) and Zeng et al., (2002).
The preceding interpretations of mica compositions are consistent with these results.
Moreover, the decrease in temperature revealed by the FI studies would explain why the Fe-
Li-mca2-I micas are not associated with wolframite deposition in that the temperature decrease
could have inhibited wolframite precipitation.
PART 1 – Chapter 3
200
7.6 Origin of the fluids
Stage I fluids: As discussed in the preceding sections, the FB fluid, or, more precisely,
its FA parent, are likely to be representative of the ore-forming fluids at stage I. The
interpretative model detailed in the previous section implies that each FBx should be associated
with an FAx fluid (Figure 42) involving a renewal of the source. According to the major and trace
element composition data, (except for their W (and Sn) content) the FA fluids are characterized
by high contents of F, Fe+Mg (Fe# of 0.75) and Mn. Such characteristics could be interpreted
as reflecting a magmatic-hydrothermal origin, involving a rare metal granite (RMG) with a high
F content. However, such fluids are unlikely to be Mg-rich as they are associated with evolved
granites. Moreover, the enrichment in F should be associated with Al enrichment. In any case,
this RMG could not be the Piaotang granite. Interaction of an evolved granite with an external
fluid, which (based on the Fe and Mg contents) could be of metamorphic origin, would be more
likely. However, no volatile component was observed in the FI studies (Zeng et al. 2002; Wang
et al. 2013b, Ni et al. 2015).
The FC fluid, poorer in F, represents the diluting fluid recorded in the FI studies. Wang
et al. (2009) characterize this fluid as a meteoric air-saturated fluid, interpreted to have
recorded downward infiltration of meteoric water through faults and fractures. This shallow
water could have infiltrated through tectonically-activated regional drains. However, the trace
element content of this Fc fluid, notably in terms of rare metals, suggests that this end-member
equally interacted with the same granite as the FA fluids.
Stage III fluids: The stage III FE and FF fluid end-members are interpreted in the same
terms as the stage I end-members, with FE being the Sn-rich ore-forming fluid (Figure 42f) and
FF, the external, diluting end-member.
PART 1 – Chapter 3
201
7.7 Geothermometry implications
Fluid inclusion analyses have only been performed on stage I wolframite, quartz and
cassiterite, as presented previously (Zeng et al., 2002, Wang et al., 2009, Ni et al., 2015).
Chlorite geothermometry allows us to constrain post-mineralization temperatures at the
Piaotang deposit. At the end of stage I, a brittle to ductile (based on microscopic observations
only) environment is recorded (Figure 37). According to Stöckhert et al. (1999), the
temperature of the brittle–plastic transition in quartz is between 310±30 and 350±50 °C.
Cassiterite was the last of the three minerals to crystallize (Figure 37) and recorded
homogenization temperatures of between 300 and 350°C (Zeng et al., 2002). Moreover, as
fluids were circulating, a hydrostatic gradient should be considered in our system. Given this,
even if a wide gradient of 30°C/km to 90°C/km is considered, the cassiterite crystallizing fluids
should have been at higher temperatures (at least 400°C). Thus, the fluids must have been
cooling at the end of stage I, supporting the idea of involvement of a meteoric fluid (Fc).
Stage II and III temperatures have not been constrained in the literature. However,
scheelite (Sch1-II) development at the expense of wolframite is usually interpreted as reflecting
a temperature decrease (Wood and Samson 2000). Moreover, Chl1-II compositions applied to
the Bourdelle and Cathelineau (2015) geothermometer indicate that the Piaotang system
cooled to a temperature of close to 200°C during stage II. Moreover, the Chl2-III
geothermometer indicates that the hydrothermal fluids were reheated to a temperature of at
least 300°C during stage III. The increase in temperature at this stage could explain the
crystallization of new generations of cassiterite and wolframite.
8. Implications
A new paragenesis of the Piaotang deposit has been established here, composed of
four stages of emplacement, three of which involve W-Sn minerals: (i) the “silicate-oxide” stage
, which hosts the main mineralization; (ii) a “calcic” stage with scheelite and columbo-tantalite;
PART 1 – Chapter 3
202
(iii) a “base metal sulphides” stage with wolframite and cassiterite; and finally (iv) a late
“sulphide” stage. This detailed paragenesis highlights for the first time the deposition of W-Sn
minerals during three successive stages with a complementary Nb-Ta occurrence during the
“calcic” stage.
Fe-Li-mica and chlorite are common in W-Sn deposits, which are usually emplaced
during multiple magmatic and hydrothermal events that affect granites and other country rocks.
In this work we have presented a detailed study of Fe-Li-mica and chlorites that can be
correlated with fluid inclusion studies in order to observe diverse magmatic and hydrothermal
influences. The correlation between the W-Sn content of Fe-Li-micas and its concordance with
the crystallization of wolframite and cassiterite confirms that Li-micas are good tracers of
mineralization in this kind of deposit.
Moreover, by correlating the geochemistry of micas and chlorite with the findings of
previous fluid inclusion studies, it appears that two mixing end-members (magmatic and
meteoric), clearly identified in both approaches, are associated with the deposition of
wolframite and cassiterite during the first stage. However, it should be noted that this study
also highlights involvement of a third fluid (external and possibly metamorphic) during
deposition of the mineralization and that the circulation of fluids during stage I is responsible
for the greisenization. More importantly, the now buried Piaotang biotite granite cannot be the
source of the mineralizing magmatic fluids and that the source should instead be linked to a
more evolved RMG granite that has not yet been identified.
Finally, our study of Fe-Li-mica and chlorite in the post-mineralizing stages has allowed,
for the first time, the different processes involved after the “silicate-oxide” stage to be
constrained. A new source of heat was induced into the system during stage III, enabling the
crystallization of new generations of minerals of economic interest (cassiterite and wolframite).
A fluid inclusion study of the post-mineralizing stages could help to identify the fluid at the origin
of this heat advection.
PART 1 – Chapter 3
203
References
Audétat, A., Gunther, D., and Heinrich, C.A. (1998) Formation of a magmatic-hydrothermal ore
deposit: insights with LA-ICPMS analysis of fluid inclusions. Science, 279, 2091.
Barton, Jr., P.B. (1978) Some ore textures involving sphalerite from the Furutobe mine, Akita
Prefecture, Japan. Mining Geology, 28, 293–300.
Beuchat, S., Moritz, R., and Pettke, T. (2004) Fluid evolution in the W–Cu–Zn–Pb San
Cristobal vein, Peru: fluid inclusion and stable isotope evidence. Chemical Geology,
210, 201-224.
Blamart, D. (1991) Les concentrations tungstifères et stannifères : caractérisation isotopique
des fluides minéralisateurs, sur l'exemple du gisement Sn-W de Walmès, 162 p. Ph.D.
thesis, INPL, Nancy.
Bortnikov, N.S., Genkin, A.D., Dobrovol’skaya, M.G., Muravitskaya, G.N., and Filimonova, A.A.
(1991) The nature of chalcopyrite inclusions in sphalerite; exsolution, coprecipitation,
or "disease"? Economic Geology, 86, 1070-1082.
Bos, A. (1990) Hydrothermal element distributions at high temperatures: an experimental study
on the partitioning of major and trace elements between phlogopite, haplogranitic melt
and vapour. 107p. Ph.D. thesis, Faculteit Aardwetenschappen.
Bourdelle, F., and Cathelineau, M. (2015) Low-temperature chlorite geothermometry: a
graphical representation based on a T–R 2+–Si diagram. European Journal of
Mineralogy, 27, 617-626.
Carruzzo, S., Kontak, D.J., Clarke, D.B., and Kyser, T.K. (2004) An integrated fluid–mineral
stable-isotope study of the granite-hosted mineral deposits of the New Ross area,
south mountain batholith, Nova Scotia, Canada: evidence for multiple reservoirs. The
Canadian Mineralogist, 42, 1425-1441.
Cathelineau, M., and Nieva, D. (1985) A chlorite solid solution geothermometer, the Los
Azufres (Mexico) geothermal system. Contributions to Mineralogy and Petrology, 91,
235-244.
Charvet, J. (2013) The Neoproterozoic-Early Paleozoic tectonic evolution of the South China
Block: an overview. Journal of Asian Earth Sciences, 74, 198-209.
Charvet J., Shu L-S., Faure M., Choulet F., Wang B., Lu H-F., and Le Breton N. (2010)
Structural development of the Lower Palaeozoic belt of South China: genesis of an
intracontinental orogeny. Journal of Asian Earth Sciences, 39, 309-330.
PART 1 – Chapter 3
204
Chicharro, E., Boiron, M.C., Lopez-Garcia, J.A., Barfod, D.N., and Villaseca, C. (2016) Origin,
ore forming fluid evolution and timing of the Logrosan Sn-(W) ore deposits (Central
Iberian Zone, Spain). Ore Geology Reviews, 72, 896-913.
Costi, H.T., Dall’Agnol, R., Borges, R.M.K., Minuzzi, O.R.R., and Teixeira, J.T. (2002) Tin-
bearing sodic episyenites associated with the Proterozoic A-type Agua Boa granite,
Pitinga Mine, Amazonian Craton, Brazil. Gondwana Research, 5, 435-451.
Faure, M., Sun, Y., Shu, L., Monie, P., and Charvet, J. (1996) Extensional tectonics within a
subduction-type orogen. The case study of the Wugongshan dome (Jiangxi Province,
southeastern China). Tectonophysics, 263, 77-106.
Giuliani, G. (1985) Le gisement de tungstène de Xihuashan (Sud-Jiangxi, Chine): Relations
granites, alterations deutériques-hydrothermales, minéralisations. Mineralium
Deposita, 20, 107-115.
Günther, D., Frischknecht, R., Heinrich, C.A., and Kahlert, H.J. (1997) Capabilities of an argon
fluoride 193 nm excimer laser for laser ablation inductively coupled plasma mass
spectrometry microanalysis of geological materials. Journal of Analytical Atomic
Spectrometry, 12, 939–944.
He, Z., Xu, X., Zou, H., Wang, X., and Yu, Y. (2010) Geochronology, petrogenesis and
metallogeny of Piaotang granitoids in the tungsten deposit region of South China.
Geochemical Journal, 44, 299-313.
Hua, R., Chen, P., Zhang, W., and Lu, J. (2005) Three large-scale metallogenic events related
to the Yanshanian Period in Southern China. In: Mineral Deposit Research: Meeting
the Global Challenge. Springer Berlin, Heidelberg, 401-404.
Hu, R.Z., and Zhou, M.F. (2012) Multiple mesozoic mineralization events in South China - an
introduction to the thematic issue. Mineralium Deposita, 47, 579-588.
Jochum, K.P., Weis, U., Stoll, B., Kuzmin, D., Yang, Q., Raczek, I., Jacob, D.E., Stracke, A.,
Birbaum, K., Frick, D.A., Gunther, D., and Enzweiler, J. (2011) Determination of
reference values for NIST SRM 610-617 glasses following ISO guidelines.
Geostandards and Geoanalytical Research, 35, 397-429.
Johan, Z., Strnad, L., and Johan, V. (2012) Evolution of the Cinovec (Zinnwald) granite cupola,
Czech Republic: Composition of feldspars and micas, a clue to the origin of W, Sn
mineralization. The Canadian Mineralogist, 50, 1131-1148.
Kamenetsky, V.S., Naumov, V.B., Davidson, P., Van Achtenbergh, E., and Ryan, C.G. (2004)
Immiscibility between silicate magmas and aqueous fluids: a melt inclusion pursuit into
PART 1 – Chapter 3
205
the magmatic-hydrothermal transition in the Omsukchan Granite (NE Russia).
Chemical Geology, 210, 73-90.
Lach, P., Mercadier, J., Dubessy, J., Boiron, M.C., and Cuney, M. (2013) In situ quantitative
measurement of rare earth elements in uranium oxides by laser ablation-inductively
coupled plasma-mass spectrometry. Geostandards and Geoanalytical Results, 37, 1-
20.
Legros, H., Marignac, C., Mercadier, J., Cuney, M., Richard, A., Wang, R-C., Charles, N., and
Lespinasse, M-Y. (2016) Detailed paragenesis and Li-mica compositions as recorders
of the magmatic-hydrothermal evolution of the Maoping W-Sn deposit (Jiangxi, China).
Lithos, 264, 108-124.
Leisen, M., Boiron, M.C., Richard, A., and Dubessy, J. (2012) Determination of Cl and Br
concentrations in individual fluid inclusions by combining microthermometry and LA-
ICPMS analysis: Implications for the origin of salinity in crustal fluids. Chemical
geology, 330-331, 197-206.
Li, X.H., Li, W.X., Li, Z.X., Lo, C.H., Wang, J., Ye, M.F., and Yang, Y. H. (2009) Amalgamation
between the Yangtze and Cathaysia Blocks in South China: constraints from SHRIMP
U–Pb zircon ages, geochemistry and Nd–Hf isotopes of the Shuangxiwu volcanic
rocks. Precambrian Research, 174, 117-128.
Li, H., Zhang, H., Ling, M. X., Wang, F. Y., Ding, X., Zhou, J. B., and Sun, W. (2011)
Geochemical and zircon U–Pb study of the Huangmeijian A-type granite: implications
for geological evolution of the Lower Yangtze River belt. International Geology Review,
53, 499-525.
Li, J.H., Zhang, Y.Q., Dong, S.W., and Johnson, S.T. (2014) Cretaceous tectonic evolution of
South China: a preliminary synthesis. Earth Science reviews, 134, 98-136.
Liu, R., Zhou, H., Zhang, L., Zhong, Z., Zeng, W., Xiang, H., and Li, C. (2010) Zircon U–Pb
ages and Hf isotope compositions of the Mayuan migmatite complex, NW Fujian
Province, Southeast China: constraints on the timing and nature of a regional
tectonothermal event associated with the Caledonian orogeny. Lithos, 119, 163-180.
Liu, Q., Yu, J.H.,Wang, Q., Su, B., Zhou, M.F., Xu, H., and Cui, X. (2012) Ages and
geochemistry of granites in the Pingtan-Dongshan metamorphic belt, coastal South
China: new constraints on Late Mesozoic magmatic evolution. Lithos, 150, 268–286.
Longerich, H.P., Günther, D., and Jackson, S.E. (1996) Elemental fractionation in laser
ablation inductively coupled plasma mass spectrometry. Fresenius' journal of analytical
chemistry, 355, 538-542.
PART 1 – Chapter 3
206
Mao, Z., Cheng, Y., Liu, J., Yuan, S., Wu, S., Xiang, X., and Luo, X. (2013) Geology and
molybdenite Re-Os age of the Dahutang granite-related veinlets-disseminated
tungsten ore field in the Jiangxi Province, China. Ore Geology Reviews, 53, 422-433.
Marignac, C., and Cathelineau, M. (2009) The nature of ore-forming fluids in peri-batholitic Sn-
W deposits and a classification. In: Williams et al. eds, Smart science for exploration
and mining, Proceedings Xth Biennial SGA Meeting, Townsville: 245-247
Melzer, S., and Wunder, B. (2001) K–Rb–Cs partitioning between phlogopite and fluid:
experiments and consequences for the LILE signatures of island arc basalts. Lithos,
59, 69-90.
Monier, G., and Robert, J.L (1986) Evolution of the miscibility gap between muscovite and
biotite solid solutions with increasing lithium content: an experimental study in the
system K2O-Li2O-MgO-FeO-Al2O3-SiO2-H2O-HF at 600°C, 2kbar PH2O: comparison
with natural lithium micas. Mineralogical magazine, 50, 641-651.
Munoz, J. L., and Ludington, S. (1977) Fluorine-hydroxyl exchange in synthetic muscovite and
its application to muscovite-biotite assemblages. American Mineralogist, 62, 304-308.
Ni, P., Wang, X.D., Wang, G.G., Huang, J.B., Pan, J.Y., and Wang, T.G. (2015) An infrared
microthermometric study of fluid inclusions in coexisting quartz and wolframite from
Late Mesozoic tungsten deposits in the Gannan metallogenic belt, South China. Ore
Geology Reviews, 65, 1062–1077.
Neiva, A.M.R. (2013) Micas, feldspars and columbite–tantalite minerals from the zoned granitic
lepidolite-subtype pegmatite at Namivo, Alto Ligonha, Mozambique. European Journal
of Mineralogy, 25, 967-985.
Paton, C., Hellstrom, J., Paul, B., Woodhead, J., and Hergt, J. (2011) Iolite: Freeware for the
visualization and processing of mass spectrometric data. Journal of Analytical Atomic
Spectometry, 26, 2508.
Shu, L., Faure, M., Wang, B., Zhou, X., and Song, B. (2008) Late Palaeozoic–Early Mesozoic
geological features of South China: response to the Indosinian collision events in
Southeast Asia. Comptes Rendus Geoscience, 340, 151-165.
Shu, L.S., Zhou, X.M., Deng, P., Wang, B., Jiang, S.Y., Yu, J.H., and Zhao, X.X. (2009)
Mesozoic tectonic evolution of the Southeast China Block: new insights from basin
analysis. Journal of Asian Earth Sciences, 34, 376–391.
Smith, M., Banks, D.A., Yardley, B.W.D., and Boyce, A. (1996) Fluid inclusion and stable
isotope constraints on the genesis of the Cligga Head Sn-W deposit, S.W. England.
European Journal of Mineralogy, 8, 961-974.
PART 1 – Chapter 3
207
Stöckhert, B., Brix, M. R., Kleinschrodt, R., Hurford, A. J., and Wirth, R. (1999)
Thermochronometry and microstructures of quartz—a comparison with experimental
flow laws and predictions on the temperature of the brittle–plastic transition. Journal of
Structural Geology, 21, 351-369.
Tanelli, G. (1982) Geological setting, mineralogy and genesis of tungsten mineralization in
Dayu district, Jiangxi (People’s Republic of China): an outline. Mineralium Deposita,
17, 279–294.
Tischendorff, G., Gottesmann, B., Forster, H.J., and Trumbull, R.B. (1997) On Li-bearing
micas: estimating Li from electron microprobe analyses and an improved diagram for
graphical representation. Mineralogical magazine, 61, 809-834.
Thomas, R., Förster, H.J., Rickers, K., and Webster, J. (2005) Formation of extremely F-rich
hydrous melt fractions and hydrothermal fluids during differentiation of highly evolved
tin-granite magmas: a melt-fluid inclusion study. Contributions to Mineralogy and
Petrology, 148, 582-641.
USGS, 2016. Tungsten. Mineral Commodity Summaries. 180-181.
Walsche, J.L. (1986) A six-component chlorite solid solution model and the conditions of
chlorite formation in hydrothermal and geothermal systems. Economic Geology, 81,
681-703.
Wang, D.Z., Shu, L.S., Faure, M., and Sheng, W.Z. (2001) Mesozoic magmatism and granitic
dome in the Wugongshan Massif, Jiangxi province and their genetical relationship to
the tectonic events in southeast China. Tectonophysics, 339, 259-277.
Wang, Z. Q., Yin, C. Y., Gao, L. Z., Tang, F., Liu, Y. Q., and Liu, P. J. (2006) The character of
the chemical index of alteration and discussion of subdivision and correlation of the
Nanhua System in Yichang area. Geological Review, 52, 577-585.
Wang, X-D., Ni, P., Jiang, S-Y., Zhao, K-D., and Wang, T-G. (2009) Origin of ore-forming fluid
in the Piaotang tungsten deposit in Jiangxi Province: Evidence from helium and argon
isotopes. Chinese Science Bulletin, 55, p. 628-634.
Wang, Y., Zhang, A., Fan, W., Zhao, G., Zhang, G., Zhang, Y., and Li, S. (2011) Kwangsian
crustal anatexis within the eastern South China Block: geochemical, zircon U–Pb
geochronological and Hf isotopic fingerprints from the gneissoid granites of Wugong
and Wuyi–Yunkai Domains. Lithos, 127, 239-260.
Wang, X-D., Ni, P., Yuan, S-D., and Wu, S-H. (2013b) Fluid inclusion studies on coexisting
cassiterite and quartz from the Piaotang tungsten deposit, Jiangxi Province, China.
Acta Geologica Sinica, 87, 850–859 In Chinese with English abstract.
PART 1 – Chapter 3
208
Wang, Y-J., Fan, W-M., Zhang, G-W., and Zhang, Y-H. (2013) Phanerozoic tectonics of the
South China Block: key observations and controversies. Gondwana Research, 23,
1273-1305.
Wang, X., Chen, J., and Ren, M. (2016) Hydrothermal zircon geochronology: age constraint
on Nanling range tungsten mineralization (Southeast China). Ore geology reviews, 74,
63-75.
Wei, W., Hu, R., Bi, X., Peng, J., Su, W., Song, S., and Shi, S. (2012). Infrared
microthermometric and stable isotopic study of fluid inclusions in wolframite at the
Xihuashan tungsten deposit, Jiangxi province, China. Mineralium Deposita, 47, 589-
605.
Wiewióra, A., and Weiss, Z. (1990) Crystallochemical classifications of phyllosilicates based
on the unified system of projection of chemical composition: II. The chlorite group. Clay
Minerals, 25, 83-92.
Wilkinson, J.J. (1990) The role of metamorphic fluids in the development of the Cornubian
Orefield: fluid inclusion evidence from south Cornwall. Mineralogical Magazine, 54,
219–230.
Wood, S., and Samson, I. (2000) The hydrothermal geochemistry of tungsten in granitoid
environments: I. Relative solubilites of ferbérite and scheelite as a function of T, P, pH,
and mNaCl. Economic Geology, 95, 43-182.
Wu, M., Samson, I. M., and Zhang, D. (2017) Textural and Chemical Constraints on the
Formation of Disseminated Granite-hosted W-Ta-Nb Mineralization at the Dajishan
Deposit, Nanling Range, Southeastern China. Economic Geology, 112, 855-887.
Xia, Y., Xu, X.S., Zou, H.B., and Liu, L. (2014) Early Paleozoic crust-mantle interaction and
lithosphere delamination in South China Block: evidence from geochronology,
geochemistry, and Sr-Nd-Hf isotopes of granites. Lithos, 184-187, 416-435.
Yao, J., Shu, L., Santosh, M., and Li, J. (2013) Geochronology and Hf isotope of detrital zircons
from Precambrian sequences in the eastern Jiangnan Orogen: Constraining the
assembly of Yangtze and Cathaysia Blocks in South China. Journal of Asian Earth
Sciences, 74, 225-243.
Zeng, Y., Liu, J., and Zhu, Y. (2002) Short-chain carboxylates in high-temperature ore fluids of
W-Sn deposits in south China. Geochemical Journal, 36, p. 219-234.
Zhang, C. L., Li, H. K., Santosh, M., Li, Z. X., Zou, H. B., Wang, H., and Ye, H. (2012)
Precambrian evolution and cratonization of the Tarim Block, NW China: Petrology,
geochemistry, Nd-isotopes and U–Pb zircon geochronology from Archaean gabbro-
PART 1 – Chapter 3
209
TTG–potassic granite suite and Paleoproterozoic metamorphic belt. Journal of Asian
Earth Sciences, 47, 5-20.
Zhang, R., Lu, J., Lehmann, B., Li, C., Li, G., Zhang, L., and Sun, W. (2017) Combined zircon
and cassiterite U–Pb dating of the Piaotang granite-related tungsten–tin deposit,
southern Jiangxi tungsten district, China. Ore Geology Reviews, 82, 268-284.
Zhao, K.D., and Jiang, S.Y. (2004) Mineral chemistry of the Qitianling granitoid and the Furong
tin ore deposit in Hunan province, south China: Implications for the genesis of granite
and related tin mineralization. EMPGX Symposium Abstract, Lithos, 73, S124.
Zhao, W.W., Zhou, M.F., Li, Y.H.M., Zhao, Z., and Gao, J.F. (2017) Genetic types,
mineralization styles, and geodynamic settings of Mesozoic tungsten deposits in South
China. Journal of Asian Earth Sciences, 137, 109-140.
Zhou, T., Goldfarb, R.J., and Philips, G.N. (2002) Tectonics and distribution of gold deposits
in China – an overview. Mineralium Deposita, 37, 249–282.
Zhu, C., and Sverjensky, D.A. (1991) Partitioning of F-Cl-OH between minerals and
hydrothermal fluids. Geochimica et Cosmochimica Acta, 55, 1837-1858.

PART 2
211
Part 2 – Fluid inclusions
Preamble
This second part aims to use fluid inclusions to complement the study of fluids by the
intermediate of lithium-micas described in the first part. Few fluid inclusion studies have been
carried out within the Nanling Range. Many approaches as microthermometry, Raman
spectrometry, stable isotopes (O, H, C, S) and noble gas isotopes in transparent and opaque
minerals have been performed. These studies point out that fluid inclusions observed in the
main quartz of the veins does not reflect the fluid inclusions of the main ore mineral which are
cassiterite and wolframite. However, interpretations from fluid inclusions observed in
transparent and opaque minerals agree on the implication a magmatic fluid exsolved from the
peraluminous magma and transporting the metals, mixing with a meteoric fluid infiltrated within
the crust. This mixing is believed to be the trigger process leading to ore mineral precipitation.
However, the Li-micas studies in part 1 lead on both Maoping and Piaotang deposits suggest
the implication of four fluid end-members. This Chapter 4 combines all fluid inclusion data
obtained for the Maoping and Piaotang deposits. The aim of this chapter is to demonstrate the
complexity of emplacement of these deposits through the implication of multiple successive
fluids determined by an integrated study of microthermometry, Raman spectrometry, stable
isotopes (O, H) and LA-ICPMS data.

PART 2 – Chapter 4
213
Chapter 4: Multiple fluids involved in granite-related W-Sn deposits from the
world-class Jiangxi Province (China)
Article submitted to Chemical Geology, ECROFI special issue
Hélène Legros a,b, Antonin Richard a, Alexandre Tarantola a, Kalin Kouzmanov c, Julien
Mercadier a, Torsten Vennemann d, Christian Marignac e, Michel Cuney a, Ru-Cheng
Wang f, Nicolas Charles b, Laurent Bailly b, Marc-Yves Lespinasse a
a Université de Lorraine, CNRS, CREGU, GeoRessources, Boulevard des Aiguillettes B.P. 70239, F-54506-
Vandoeuvre-lès-Nancy, France
b BRGM-French Geological Survey, 3, Av. Claude Guillemin, BP 36009, 45060 Orléans Cedex 2, France
c Department of Earth Sciences, University of Geneva, Rue des Maraîchers 13, 1205 Geneva, Switzerland
d Institut des Sciences de la Terre, Université de Lausanne, Quartier UNIL-Mouline, Bâtiment Géopolis, CH-1015
Lausanne, Switzerland
e Ecole Nationale Supérieure des Mines de Nancy, Parc de Saurupt, F-54042 Nancy, France
f State Key Laboratory for Mineral Deposits Research, School of Earth Sciences and Engineering, Nanjing
University, Xianlin University Town, Nanjing 210046- China
Abstract
Chinese granite-related W-Sn deposits represent the main resource of W and Sn in the
world. These deposits are believed to be the result of various magmatic and hydrothermal
processes that are still debated. Although W-Sn deposits worldwide have been widely
documented over the years, studies of mineralizing fluids in Chinese deposits need to be
complemented by integrated and trace element analysis of fluid inclusions. The Maoping and
Piaotang W-Sn deposits (South Jiangxi, China), genetically associated with the emplacement
of Jurassic granites, provide new insights into the ore processes in the richest W-Sn province
in the world through microthermometry, Raman spectrometry, LA-ICPMS of fluid inclusions
PART 2 – Chapter 4
214
and stable (O and H) isotope geochemistry. Four fluid end-members have been identified.
Three of them are involved in the main W-Sn stage: (i) a magmatic fluid (exsolved from a rather
primitive magma) associated with the crystallization of gangue minerals and unmixing
processes, (ii) a low-δD magmatic fluid (exsolved from a highly differentiated magma) involved
in the ore mineral deposition and, (iii) a meteoric fluid mixing with the two latter end-members.
The fourth and last end-member was identified in both deposits and is representative of a new
hydrothermal pulse, also mixing with the meteoric fluid. This end-member is associated with
higher temperatures and salinities, registered in late mineralization stages where other minor
ore minerals crystallize. Trace amounts of gases (mainly CO2) were observed in the two
magmatic end-members. This study raises evidences of: (i) a non-coeval crystallization of the
gangue and ore minerals, (ii) magma differentiation and fluid mixing as processes involved in
ore deposition, (iii) the first evidence of multiple fluids involved at different timing in Chinese
W-Sn deposits and, (iv) a common history for both deposits, implying regional processes
associated with one of the largest granitic provinces emplaced in the Jurassic-Cretaceous
period.
Keywords
W-Sn – deposits - fluid inclusions – Maoping – Piaotang - China
1. Introduction
In granite-related W-Sn deposits, the main resource of W and Sn in the world, magmatic
and hydrothermal activity are thought to have promoted the formation of ore minerals in and
around peraluminous granitic plutons (Burnham, 1979; Candela, 1997; Audétat et al., 2000;
Mao et al., 2007; Xi et al., 2007; Pirajno, 2009; Zhou et al., 2010). However, the nature and
the origin of the ore-forming fluids appear to be variable and are still debated (Marignac and
Cathelineau, 2009). Most models involve (i) high-salinity magmatic-hydrothermal fluids
PART 2 – Chapter 4
215
exsolved from the granitic magmas (Audétat et al., 2000; Kamenetsky et al., 2004; Thomas et
al., 2005) and/or (ii) “external” hydrothermal fluids of deep-seated or surficial origin, with
variable volatile and salt content and variably equilibrated with the granites and their
metamorphic hosts (Weisbrod 1988; Wilkinson 1990; Blamart 1991; Noronha et al., 1992;
Smith et al., 1996; Bebout et al., 1999; Polya et al., 2000; Burnard and Polya 2004; Cai et al.,
2007).
In the present study, two W-Sn deposits (Maoping and Piaotang) have been targeted
as representatives of the World’s richest W and Sn province: the Nanling Range, China
(USGS, 2017). The Nanling Range is a metallogenic belt where multiple and diverse economic
deposits (W, Sn, Cu, Pb-Zn, etc.) are associated with one of the largest granitic province
(100,000 km²), emplaced during Jurassic-Cretaceous times (Zaw et al., 2007).
Several fluid inclusion (FI) studies have been already carried out in W-Sn deposits from
the Nanling Range using microthermometry in transparent and opaque minerals, Raman
spectrometry, stable isotopes (O, H, S, C) and noble gas isotopes (He, Ar) (Giuliani et al.,
1988; Xuexin et al., 1990; Zeng et al., 2002; Xi et al., 2008; Cao et al., 2009; Wang et al., 2009;
Feng et al., 2012; Gong et al., 2015; Hu et al., 2012; Wang et al., 2012; Wei et al., 2012; Zhang
et al., 2012; Ni et al., 2015; Xiong et al., 2017). All studies point to a mixing between a magmatic
fluid exsolved from a peraluminous granitic magma and a meteoric fluid, as responsible for ore
minerals precipitation.
However, detailed petrographic and mineralogical studies coupled with Fe-Li-micas
geochemistry in the Maoping and Piaotang deposits suggest that at least, three to four types
of fluids showing variable degrees of mixing were involved (Legros et al. 2016 and in press).
The idea that multiple types of fluids could be involved, in contrast with single-fluid or two-fluids
models mentioned above, has motivated for the first time a detailed characterization of the
fluids by microthermometry (PVTx properties of FIs), Raman spectrometry (volatile content of
the FIs), stable isotope analysis (H and O isotopic composition of FIs and host minerals
respectively) and LA-ICPMS (major and trace element composition of FIs). Both ore minerals
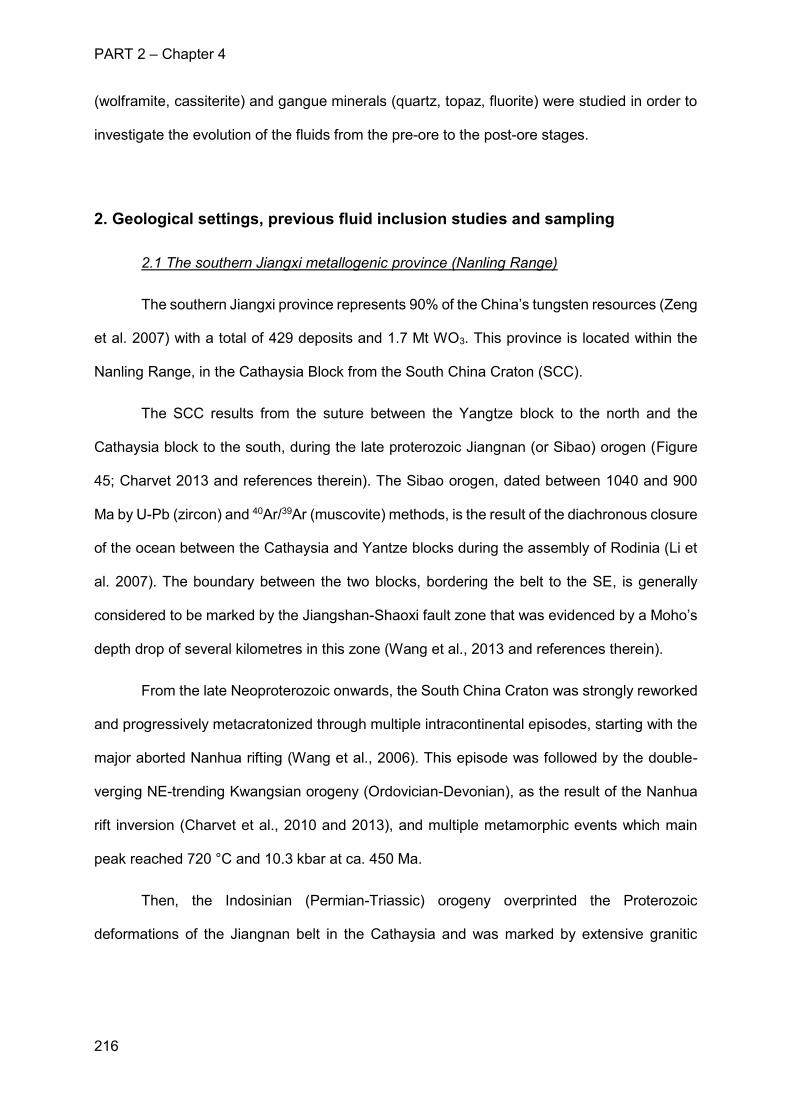
PART 2 – Chapter 4
216
(wolframite, cassiterite) and gangue minerals (quartz, topaz, fluorite) were studied in order to
investigate the evolution of the fluids from the pre-ore to the post-ore stages.
2. Geological settings, previous fluid inclusion studies and sampling
2.1 The southern Jiangxi metallogenic province (Nanling Range)
The southern Jiangxi province represents 90% of the China’s tungsten resources (Zeng
et al. 2007) with a total of 429 deposits and 1.7 Mt WO3. This province is located within the
Nanling Range, in the Cathaysia Block from the South China Craton (SCC).
The SCC results from the suture between the Yangtze block to the north and the
Cathaysia block to the south, during the late proterozoic Jiangnan (or Sibao) orogen (Figure
45; Charvet 2013 and references therein). The Sibao orogen, dated between 1040 and 900
Ma by U-Pb (zircon) and 40Ar/39Ar (muscovite) methods, is the result of the diachronous closure
of the ocean between the Cathaysia and Yantze blocks during the assembly of Rodinia (Li et
al. 2007). The boundary between the two blocks, bordering the belt to the SE, is generally
considered to be marked by the Jiangshan-Shaoxi fault zone that was evidenced by a Moho’s
depth drop of several kilometres in this zone (Wang et al., 2013 and references therein).
From the late Neoproterozoic onwards, the South China Craton was strongly reworked
and progressively metacratonized through multiple intracontinental episodes, starting with the
major aborted Nanhua rifting (Wang et al., 2006). This episode was followed by the double-
verging NE-trending Kwangsian orogeny (Ordovician-Devonian), as the result of the Nanhua
rift inversion (Charvet et al., 2010 and 2013), and multiple metamorphic events which main
peak reached 720 °C and 10.3 kbar at ca. 450 Ma.
Then, the Indosinian (Permian-Triassic) orogeny overprinted the Proterozoic
deformations of the Jiangnan belt in the Cathaysia and was marked by extensive granitic
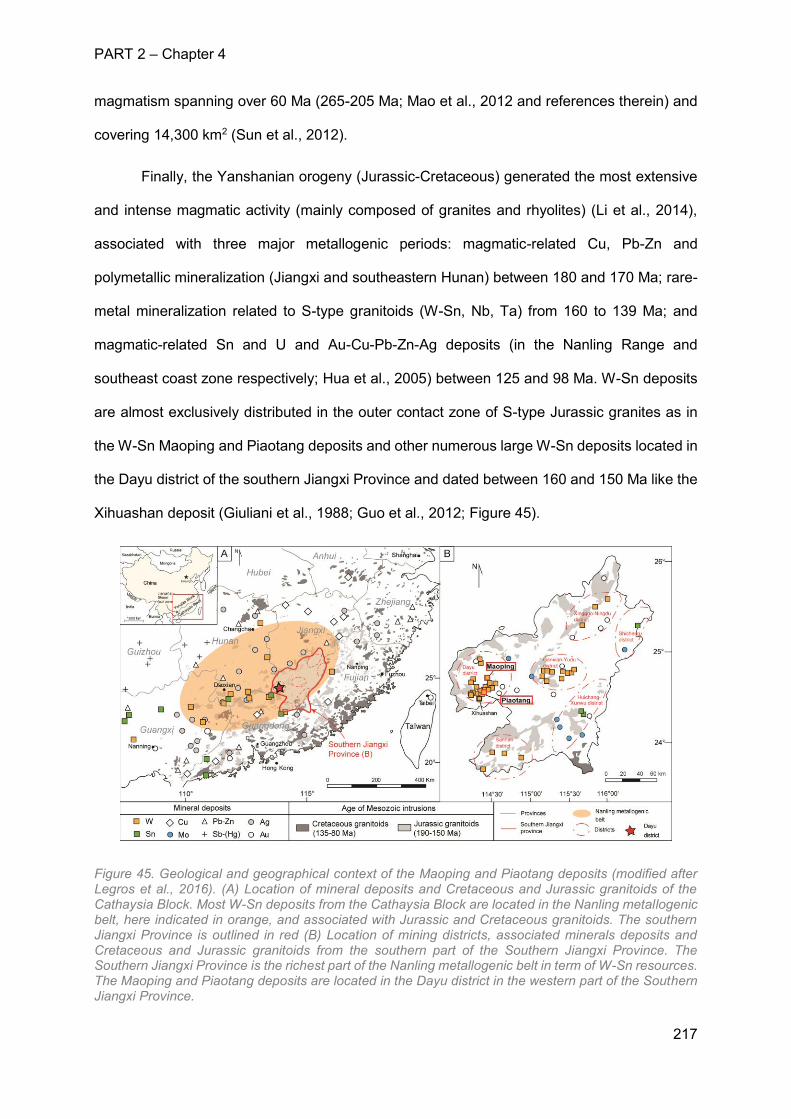
PART 2 – Chapter 4
217
magmatism spanning over 60 Ma (265-205 Ma; Mao et al., 2012 and references therein) and
covering 14,300 km2 (Sun et al., 2012).
Finally, the Yanshanian orogeny (Jurassic-Cretaceous) generated the most extensive
and intense magmatic activity (mainly composed of granites and rhyolites) (Li et al., 2014),
associated with three major metallogenic periods: magmatic-related Cu, Pb-Zn and
polymetallic mineralization (Jiangxi and southeastern Hunan) between 180 and 170 Ma; rare-
metal mineralization related to S-type granitoids (W-Sn, Nb, Ta) from 160 to 139 Ma; and
magmatic-related Sn and U and Au-Cu-Pb-Zn-Ag deposits (in the Nanling Range and
southeast coast zone respectively; Hua et al., 2005) between 125 and 98 Ma. W-Sn deposits
are almost exclusively distributed in the outer contact zone of S-type Jurassic granites as in
the W-Sn Maoping and Piaotang deposits and other numerous large W-Sn deposits located in
the Dayu district of the southern Jiangxi Province and dated between 160 and 150 Ma like the
Xihuashan deposit (Giuliani et al., 1988; Guo et al., 2012; Figure 45).
Figure 45. Geological and geographical context of the Maoping and Piaotang deposits (modified after Legros et al., 2016). (A) Location of mineral deposits and Cretaceous and Jurassic granitoids of the Cathaysia Block. Most W-Sn deposits from the Cathaysia Block are located in the Nanling metallogenic belt, here indicated in orange, and associated with Jurassic and Cretaceous granitoids. The southern Jiangxi Province is outlined in red (B) Location of mining districts, associated minerals deposits and Cretaceous and Jurassic granitoids from the southern part of the Southern Jiangxi Province. The Southern Jiangxi Province is the richest part of the Nanling metallogenic belt in term of W-Sn resources. The Maoping and Piaotang deposits are located in the Dayu district in the western part of the Southern Jiangxi Province.
PART 2 – Chapter 4
218
2.2. Previous fluid inclusion studies in Sn-W deposits from the Nanling Range
Several vein-type granite-related Sn-W deposits from the Nanling Range were the
subject of FI studies and more precisely within the southern Jiangxi and Hunan provinces:
Xihuashan (Wei et al., 2012), Yaogangxian (Hu et al., 2012), Dajishan, Dangping, Piaotang,
Pangushan (Ni et al., 2015), Taoxikeng (Wang et al., 2012), Shimenshi (Gong et al., 2015; Wei
et al., 2017), Baxiannao (Feng et al., 2012), Shizhuyuan and Yejiwei (Xuexin et al., 1990). FI
studies have been performed on various transparent and opaque minerals within the vein
systems such as beryl, quartz, wolframite, cassiterite, fluorite, and tourmaline. Fluids are
dominantly aqueous with some occurrences of CO2-rich FIs in quartz. Coexisting vapor-
dominated CO2-rich FIs with liquid-dominated aqueous FIs is commonly observed in quartz
and was interpreted as boiling and/or immiscibility (Wei et al., 2012; Giuliani et al., 1988; Ni et
al., 2015). Yet, only aqueous inclusions are observed in wolframite or cassiterite, unraveling
differences of fluid conditions between ore and gangue minerals (Piaotang, Dangping,
Dajishan, Pangushan, Ni et al., 2015; Xihuashan, Wei et al., 2012). Microthermometric
analyses show homogenization temperatures between 150 and 300 °C in gangue minerals,
significantly lower than in wolframite (250 and 400°C). Similarly, gangue minerals FIs have
lower salinity (0.5 to 9.0 wt.% equiv. NaCl) than in wolframite (3.0 to 14.0 wt.% equiv. NaCl)
(Xihuashan, Giuliani et al., 1988; Shizhuyuan, Yejiwie, Xuexin et al., 1990; Piaotang, Zeng et
al., 2002, Wang et al., 2009; Dajishan, Xi et al., 2008; Yaogangxian, Cao et al., 2009;
Baxiannao, Feng et al., 2012; Taoxikeng, Wang et al., 2012; Dangping, Pangushan, Ni et al.,
2015; Shimenshi, Wei et al., 2017). Within single deposits, FIs in wolframite usually display a
continuum between a high-salinity, high-temperature end-member and a low-salinity, low-
temperature end-member, interpreted as a mixing trend. The combination of mixing and
cooling processes are considered to be decisive for ore mineral precipitation (Wei et al., 2012;
Ni et al., 2015). Estimated PT conditions of FI entrapment in Xihuashan, Dajishan and
Taoxikeng deposits, assuming hydrostatic pressure conditions, range between 40 and 130
MPa and 320 to 400 °C (Wei et al., 2012; Xi et al., 2008; Wang et al., 2012). Pressure estimates
PART 2 – Chapter 4
219
define depths of emplacement between 1 and 4 km (Xuexin et al., 1990; Wang et al., 2012).
Stable isotope analyses (O-H-S) have been performed on quartz-hosted FIs of the Xihuashan,
Taoxikeng, Shimenshi and Baxiannao deposits. δ18O values of quartz range from -8.8 to 8.4
‰, δD of FIs in quartz range from -43 to 108 ‰ and δ34S of late sulphides range from -1.6 to
0.1 ‰ (Feng et al., 2012; Liu et al., 2002; Wang et al., 2012; Wei et al., 2012; Gong et al.,
2015; Wei et al., 2017). These isotopic compositions of the gangue minerals crystallizing within
the ore stage (mainly quartz), are interpreted as reflecting a mixing between a magmatic fluid
and a meteoric fluid. Helium and argon isotopes (R/Ra between 0.2 and 0.8 and 40Ar/36Ar
between 350 and 590) compositions of wolframite- and sulfide-hosted inclusions from the
Piaotang and Yaogangxian deposits are consistent with these interpretations (Wang et al.,
2009; Hu et al., 2012).
Collectively, previous FI studies of vein-type granite-related Sn-W in the Nanling Range
invoke either two fluids (magmatic dominant and meteoric minor) mixing or a single fluid
(magmatic) cooling, leading to the precipitation of ore minerals.
2.3. Sampling
2.3.1 Maoping deposit
The Maoping deposit is estimated to 63 kt WO3 and 15 kt Sn with average grades of
0.93% and 0.3% respectively (Feng et al., 2011) and is considered as one of the biggest W-
Sn deposits of the Nanling Range.
The Maoping deposit is associated with a buried peraluminous granite (ca. 300 m deep)
which contact with the surrounding Cambrian quartzite and schists can only be observed on
drill cores. The granite was emplaced during the Jurassic at 151.8 ± 2.9 Ma (SHRIMP U-Pb
zircon; Feng et al., 2011). Two types of mineralization, associated with this granite, are
described: wolframite-cassiterite-quartz veins and disseminated wolframite in the greisen.
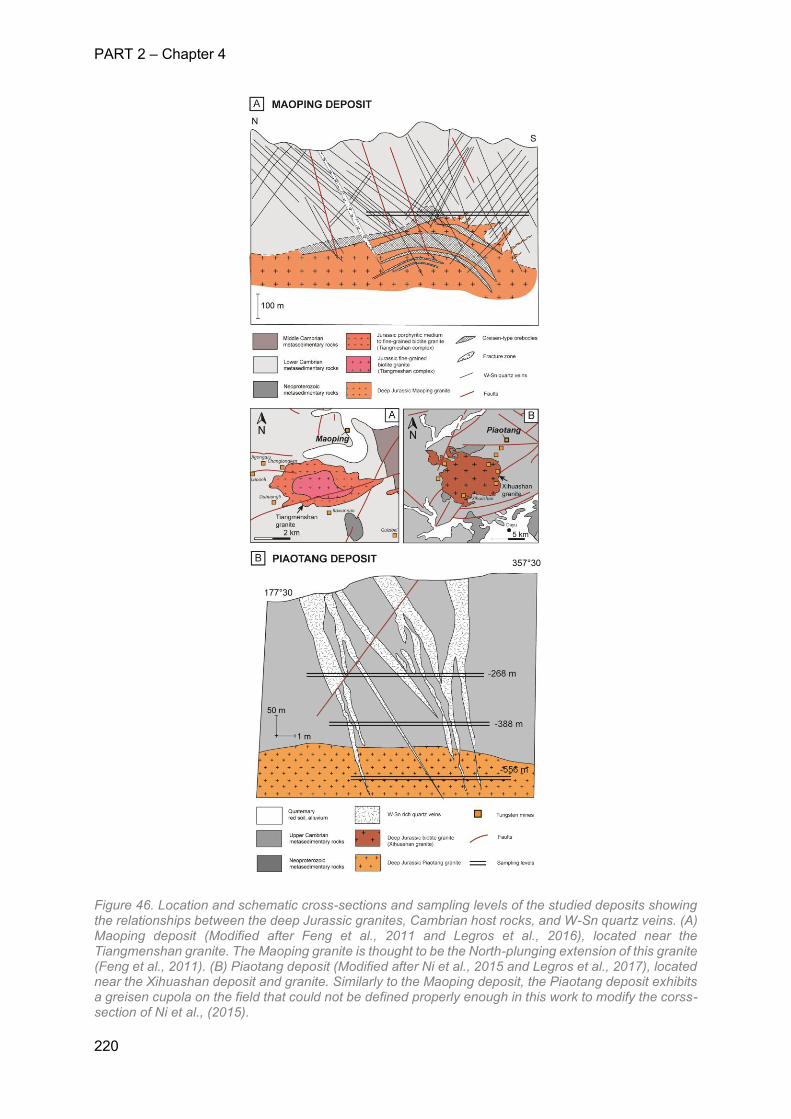
PART 2 – Chapter 4
220
Figure 46. Location and schematic cross-sections and sampling levels of the studied deposits showing the relationships between the deep Jurassic granites, Cambrian host rocks, and W-Sn quartz veins. (A) Maoping deposit (Modified after Feng et al., 2011 and Legros et al., 2016), located near the Tiangmenshan granite. The Maoping granite is thought to be the North-plunging extension of this granite (Feng et al., 2011). (B) Piaotang deposit (Modified after Ni et al., 2015 and Legros et al., 2017), located near the Xihuashan deposit and granite. Similarly to the Maoping deposit, the Piaotang deposit exhibits a greisen cupola on the field that could not be defined properly enough in this work to modify the corss-section of Ni et al., (2015).
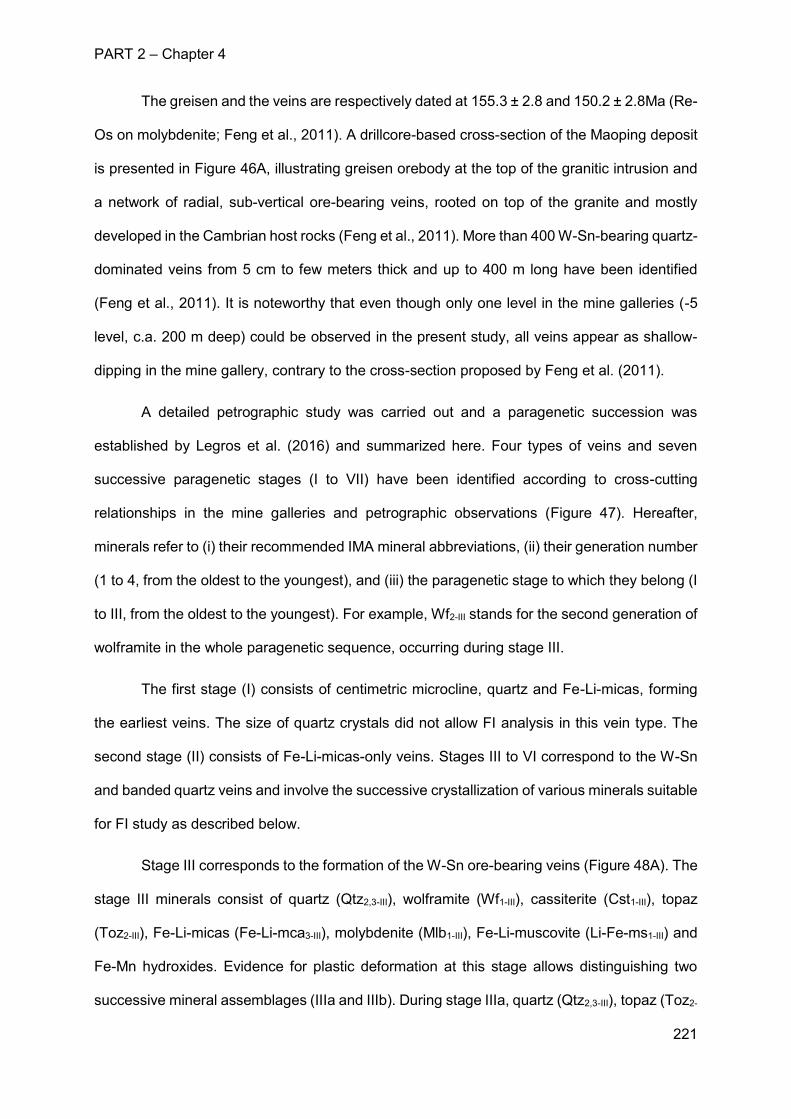
PART 2 – Chapter 4
221
The greisen and the veins are respectively dated at 155.3 ± 2.8 and 150.2 ± 2.8Ma (Re-
Os on molybdenite; Feng et al., 2011). A drillcore-based cross-section of the Maoping deposit
is presented in Figure 46A, illustrating greisen orebody at the top of the granitic intrusion and
a network of radial, sub-vertical ore-bearing veins, rooted on top of the granite and mostly
developed in the Cambrian host rocks (Feng et al., 2011). More than 400 W-Sn-bearing quartz-
dominated veins from 5 cm to few meters thick and up to 400 m long have been identified
(Feng et al., 2011). It is noteworthy that even though only one level in the mine galleries (-5
level, c.a. 200 m deep) could be observed in the present study, all veins appear as shallow-
dipping in the mine gallery, contrary to the cross-section proposed by Feng et al. (2011).
A detailed petrographic study was carried out and a paragenetic succession was
established by Legros et al. (2016) and summarized here. Four types of veins and seven
successive paragenetic stages (I to VII) have been identified according to cross-cutting
relationships in the mine galleries and petrographic observations (Figure 47). Hereafter,
minerals refer to (i) their recommended IMA mineral abbreviations, (ii) their generation number
(1 to 4, from the oldest to the youngest), and (iii) the paragenetic stage to which they belong (I
to III, from the oldest to the youngest). For example, Wf2-III stands for the second generation of
wolframite in the whole paragenetic sequence, occurring during stage III.
The first stage (I) consists of centimetric microcline, quartz and Fe-Li-micas, forming
the earliest veins. The size of quartz crystals did not allow FI analysis in this vein type. The
second stage (II) consists of Fe-Li-micas-only veins. Stages III to VI correspond to the W-Sn
and banded quartz veins and involve the successive crystallization of various minerals suitable
for FI study as described below.
Stage III corresponds to the formation of the W-Sn ore-bearing veins (Figure 48A). The
stage III minerals consist of quartz (Qtz2,3-III), wolframite (Wf1-III), cassiterite (Cst1-III), topaz
(Toz2-III), Fe-Li-micas (Fe-Li-mca3-III), molybdenite (Mlb1-III), Fe-Li-muscovite (Li-Fe-ms1-III) and
Fe-Mn hydroxides. Evidence for plastic deformation at this stage allows distinguishing two
successive mineral assemblages (IIIa and IIIb). During stage IIIa, quartz (Qtz2,3-III), topaz (Toz2-
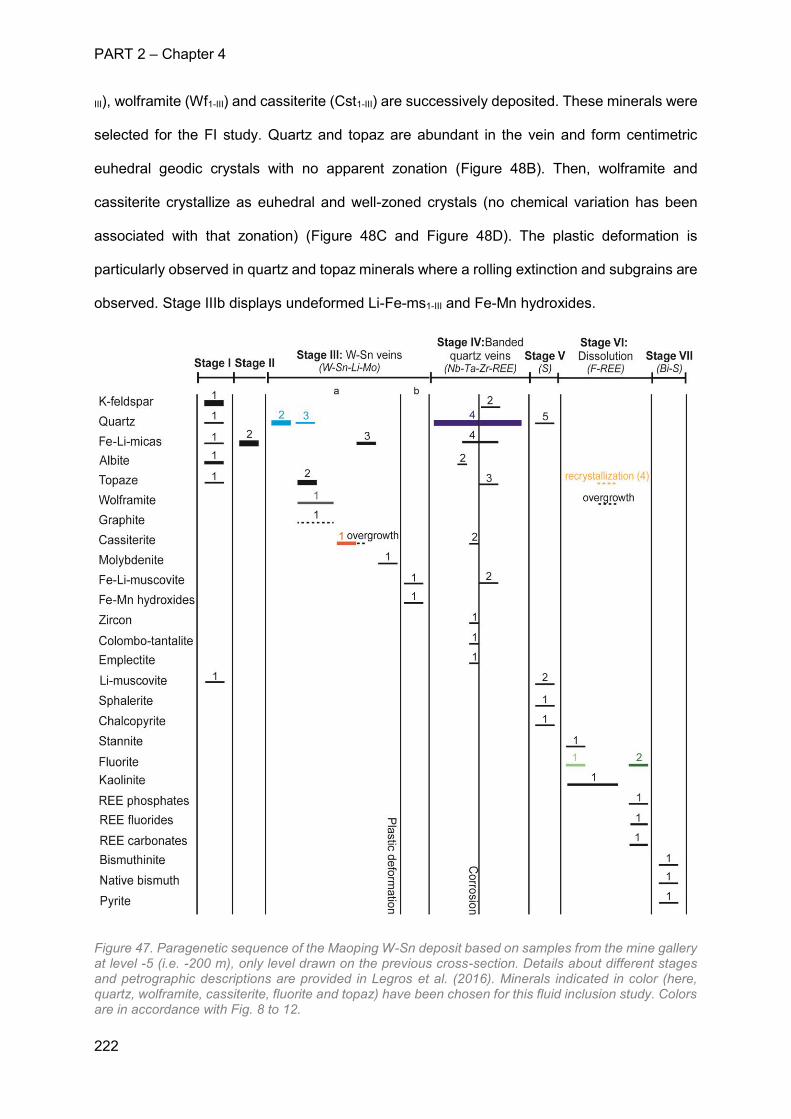
PART 2 – Chapter 4
222
III), wolframite (Wf1-III) and cassiterite (Cst1-III) are successively deposited. These minerals were
selected for the FI study. Quartz and topaz are abundant in the vein and form centimetric
euhedral geodic crystals with no apparent zonation (Figure 48B). Then, wolframite and
cassiterite crystallize as euhedral and well-zoned crystals (no chemical variation has been
associated with that zonation) (Figure 48C and Figure 48D). The plastic deformation is
particularly observed in quartz and topaz minerals where a rolling extinction and subgrains are
observed. Stage IIIb displays undeformed Li-Fe-ms1-III and Fe-Mn hydroxides.
Figure 47. Paragenetic sequence of the Maoping W-Sn deposit based on samples from the mine gallery at level -5 (i.e. -200 m), only level drawn on the previous cross-section. Details about different stages and petrographic descriptions are provided in Legros et al. (2016). Minerals indicated in color (here, quartz, wolframite, cassiterite, fluorite and topaz) have been chosen for this fluid inclusion study. Colors are in accordance with Fig. 8 to 12.
PART 2 – Chapter 4
223
Stage IV corresponds to the emplacement of the banded quartz veins (Figure 48E).
Four different types of undeformed quartz are distinguished. The banding is formed by a
repeated sequence consisting of (1) quartz corrosion; (2) accumulation of minerals (feldspars,
micas and quartz) interpreted as relics of previous stages together with precipitation of
disseminated Nb-Ta and REE minerals and Qtz4a-IV; (3) deposition of Qtz4b-IV and (4) deposition
of laminated Qtz4c-IV. A final generation of subhedral Qtz4d-IV overprints the quartz banding
(Figure 48F).
Stage V consists of very small quartz grains, Li-muscovite and sulfides and therefore
could not provide any mineral of interest for this FI study.
Stage VI consists of minerals filling the cavities of the W-Sn and banded quartz veins
by of a succession of fluorite (Fl1-VI), kaolinite (Kln1-VI) and late porous fluorite (Fl2-VI) (Figure
48G). Dissolution cavities within Toz2-III are marked by a rim of euhedral and zoned Toz4-VI
crystals (more than 100 μm in size) when filled by Kln1-VI (Figure 48H). This generation of topaz
was selected for the FI study. The first generation of Fl1-VI is coeval with the kaolinite, euhedral
and mineral inclusion-free while the second (Fl2-VI), which postdates the kaolinite, is anhedral
and zoned according to the yttrium content, kaolinite inclusions, REE mineral inclusions
(phosphates, fluorides and carbonates) and porosity. Both types of fluorite were selected for
the FI study.
Stages VII display sulfides (ie. bismuthinite and pyrite) that were not considered for the
FI study.
2.3.2 Piaotang deposit
The polymetallic W-Sn-(Nb) Piaotang deposit is one of the biggest W-Sn deposits that
belongs to the Nanling Range. The Piaotang mine produces 1,500 t WO3 per year and ranks
at the 8th position of China’s reserves with 47,775 t WO3 (MB Company database:
www.metalbulletin.com).
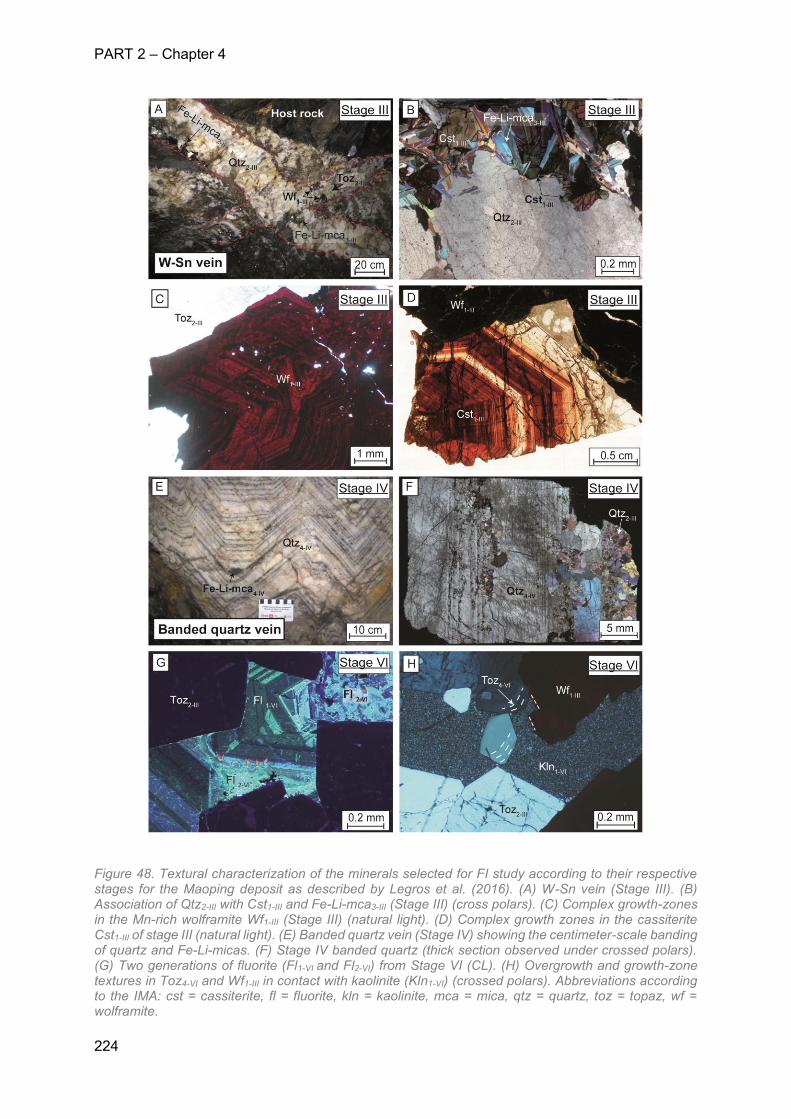
PART 2 – Chapter 4
224
Figure 48. Textural characterization of the minerals selected for FI study according to their respective stages for the Maoping deposit as described by Legros et al. (2016). (A) W-Sn vein (Stage III). (B) Association of Qtz2-III with Cst1-III and Fe-Li-mca3-III (Stage III) (cross polars). (C) Complex growth-zones in the Mn-rich wolframite Wf1-III (Stage III) (natural light). (D) Complex growth zones in the cassiterite Cst1-III of stage III (natural light). (E) Banded quartz vein (Stage IV) showing the centimeter-scale banding of quartz and Fe-Li-micas. (F) Stage IV banded quartz (thick section observed under crossed polars). (G) Two generations of fluorite (Fl1-VI and Fl2-VI) from Stage VI (CL). (H) Overgrowth and growth-zone textures in Toz4-VI and Wf1-III in contact with kaolinite (Kln1-VI) (crossed polars). Abbreviations according to the IMA: cst = cassiterite, fl = fluorite, kln = kaolinite, mca = mica, qtz = quartz, toz = topaz, wf = wolframite.
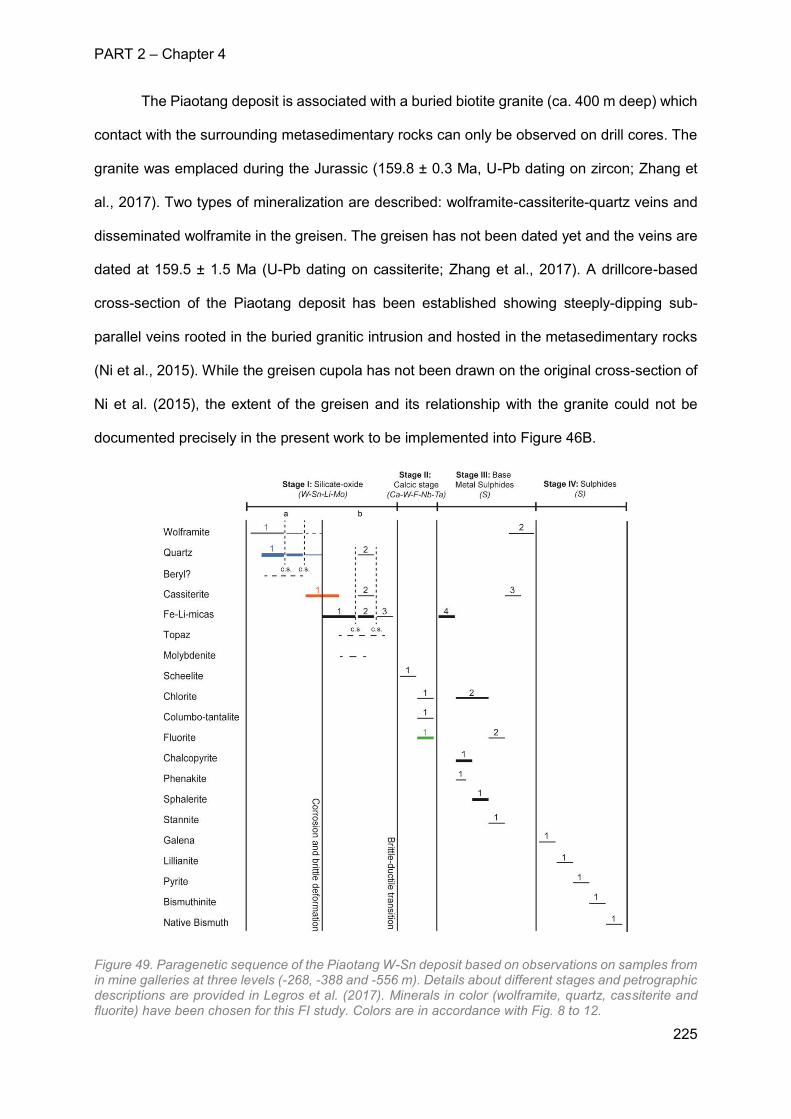
PART 2 – Chapter 4
225
The Piaotang deposit is associated with a buried biotite granite (ca. 400 m deep) which
contact with the surrounding metasedimentary rocks can only be observed on drill cores. The
granite was emplaced during the Jurassic (159.8 ± 0.3 Ma, U-Pb dating on zircon; Zhang et
al., 2017). Two types of mineralization are described: wolframite-cassiterite-quartz veins and
disseminated wolframite in the greisen. The greisen has not been dated yet and the veins are
dated at 159.5 ± 1.5 Ma (U-Pb dating on cassiterite; Zhang et al., 2017). A drillcore-based
cross-section of the Piaotang deposit has been established showing steeply-dipping sub-
parallel veins rooted in the buried granitic intrusion and hosted in the metasedimentary rocks
(Ni et al., 2015). While the greisen cupola has not been drawn on the original cross-section of
Ni et al. (2015), the extent of the greisen and its relationship with the granite could not be
documented precisely in the present work to be implemented into Figure 46B.
Figure 49. Paragenetic sequence of the Piaotang W-Sn deposit based on observations on samples from in mine galleries at three levels (-268, -388 and -556 m). Details about different stages and petrographic descriptions are provided in Legros et al. (2017). Minerals in color (wolframite, quartz, cassiterite and fluorite) have been chosen for this FI study. Colors are in accordance with Fig. 8 to 12.
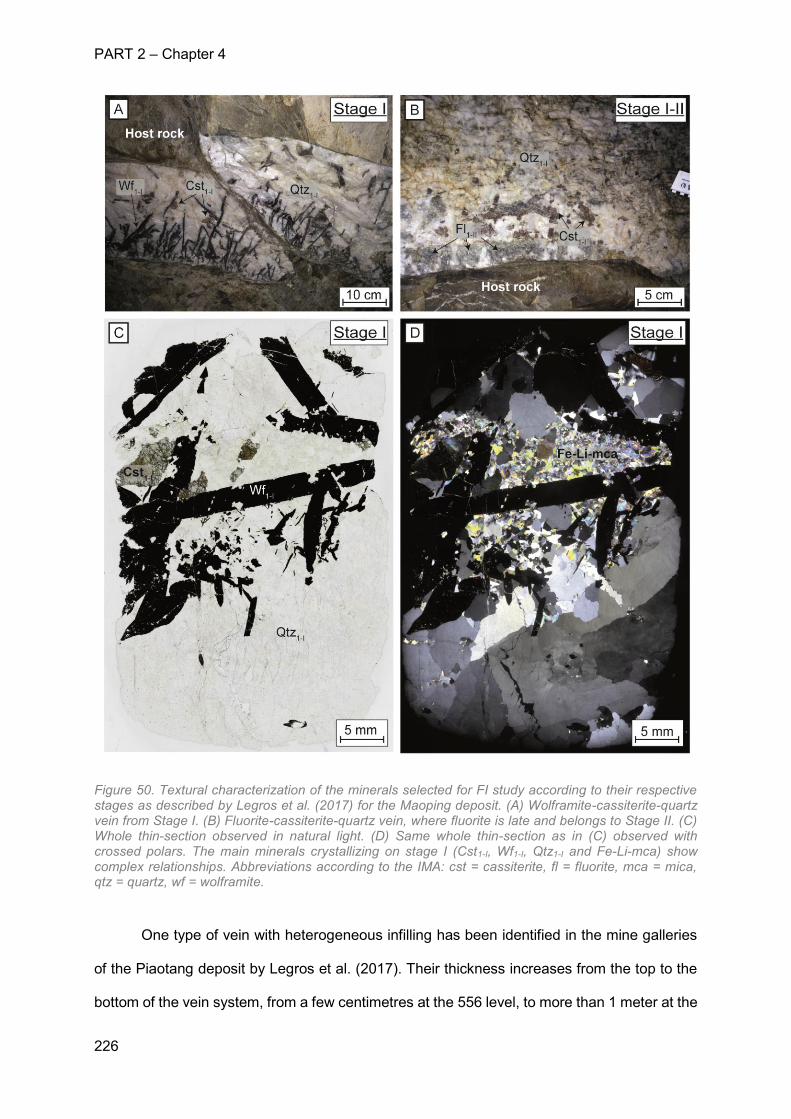
PART 2 – Chapter 4
226
Figure 50. Textural characterization of the minerals selected for FI study according to their respective stages as described by Legros et al. (2017) for the Maoping deposit. (A) Wolframite-cassiterite-quartz vein from Stage I. (B) Fluorite-cassiterite-quartz vein, where fluorite is late and belongs to Stage II. (C) Whole thin-section observed in natural light. (D) Same whole thin-section as in (C) observed with crossed polars. The main minerals crystallizing on stage I (Cst1-I, Wf1-I, Qtz1-I and Fe-Li-mca) show complex relationships. Abbreviations according to the IMA: cst = cassiterite, fl = fluorite, mca = mica, qtz = quartz, wf = wolframite.
One type of vein with heterogeneous infilling has been identified in the mine galleries
of the Piaotang deposit by Legros et al. (2017). Their thickness increases from the top to the
bottom of the vein system, from a few centimetres at the 556 level, to more than 1 meter at the
PART 2 – Chapter 4
227
268 level. Based on petrographic observations, Legros et al. (in press) distinguished four
paragenetic stages (I to IV) at the Piaotang deposit, as summarized below (Figure 49).
Stage I corresponds to the emplacement of the ore-minerals (Figure 50A and Figure
50B). Stage I consists of wolframite (Wf1-I), quartz (Qtz1-I), cassiterite (Cst1-I), Fe-Li-micas (Fe-
Li-mca1-I to 3-I), topaz (Toz1-I) and molybdenite (Mlb1-I). Quartz is the most abundant mineral in
the vein and displays centimetric euhedral crystals with no chemical zonation like those
observed in cassiterite (Figure 50C and Figure 50D). All three minerals were selected for the
FI study. Topaz is almost completely altered into clays and thus could not permit observing
FIs.
Stage II corresponds to the replacement of Wf1-I by scheelite (Sch1-II) and the
crystallization of chlorite (Chl1-II), columbo-tantalite (Clb1-II) and fluorite (Fl1-II). Fluorite displays
euhedral centimetric crystals with no zonation, mineral inclusions nor deformation and was
selected for the FI study (Figure 50B).
Stages III and IV are characterized by important sulfide precipitation together with new
generations of wolframite, cassiterite, Fe-Li-micas, chlorite and fluorite. All minerals of Stages
III and IV were too small to permit a FI study.
3. Analytical methods
3.1 Fluid inclusion petrography and microthermometry
Doubly polished thick sections (110 to 200 µm-thick) from quartz, cassiterite,
wolframite, fluorite and topaz samples were prepared at GeoRessources laboratory (Nancy,
France). Petrographic observations were carried out on transparent minerals (quartz, fluorite
and topaz) minerals using a Olympus BX-51 optical microscope at GeoRessources laboratory
(Nancy, France) and in opaque and semi-opaque minerals (wolframite, cassiterite) using an
Olympus BH-51 microscope, equipped with an Olympus XM-10 infrared camera at the
University of Geneva (Switzerland).
PART 2 – Chapter 4
228
FI microthermometry was performed on quartz-, fluorite- and topaz-hosted FIs using a Linkam
THMSG600 heating-cooling stage mounted on a Olympus BX-51 microscope at
GeoRessources laboratory (Nancy, France). The stage was calibrated with in-house and
certified standards by measuring the temperature of the final melting of pure water (0.0 °C) in
a silica glass capillary, the triple point of CO2 ± Ar in a synthetic FI (−56.9 °C), and of the liquid
+ vapor → liquid homogenization of a natural FI at 165 °C. The temperatures of phase changes
of aqueous FIs were measured for the following: final ice melting (Tm(ice)) and liquid + vapor →
liquid total homogenization (Th). Temperatures of final clathrate melting (Tm(cla)) and liquid +
vapor → vapor homogenization of the CO2-dominated carbonic phase (Th(CO2)) was also
measured in the case of aquo-carbonic FIs. The temperature of phase changes is reported
with an accuracy of about ±0.1 °C for Tm(ice) and Tm(cla) and ±1 °C for Th and Th(CO2).
FI microthermometry was carried out on wolframite at the University of Geneva
(Switzerland) with a Linkam FTIR 600 stage mounted on an Olympus BH-51 microscope,
equipped with an Olympus XM-10 infrared camera (Ortelli et al., submitted). An oriented
section of a single prismatic crystal, cut perpendicular to the cleavage, was used. It has been
demonstrated that the visible light absorbed by opaque minerals is partially converted into heat
(the more opaque the zone is, the more the absorption is important), thus potentially precluding
accurate microthermometric measurements (Moritz, 2006). In order to avoid this problem, a
voltmeter has been connected directly to the lamp of the microscope to control the intensity of
the incident light. It appears that sample heating is not sufficient to significantly affect
microthermometric measurements in the conditions of a 90% closed diaphragm and condenser
at 0.3, and a tension between 0 and 4 V according to the transparency of the different zones
of the crystals (Casanova et al., submitted).
As cassiterite is a semi-opaque mineral, the same protocol was applied in transparent
light at GeoRessources Laboratory (Nancy, France). Sample heating due to the light
absorption was minor compared to wolframite. Analyses were performed with a fully opened
PART 2 – Chapter 4
229
diaphragm and condenser and within a range of 0 to 6 V according to the transparency of the
different zones in the crystals.
The reported salinity data of CO2-rich FIs were calculated with the equation of state of
Duan et al., (1992) using the Q2 programs from Bakker (1997, 2003). First ice melting
temperature (i.e. eutectic temperature) could not be observed precisely, but the large range of
likely transition (-25 to -15 °C) are close to the eutectic temperatures of the H2O-NaCl and H2O-
KCl-NaCl systems (-21.2°C and -23.5°C respectively). The presence of potassium was
quantified by LA-ICPMS in almost all FIs. However, no hydrohalite could be observed by
microthermometry. Therefore, reported salinity of aqueous FIs was calculated in the H2O-NaCl
system with the Archer (1992) equation of state using Bulk program from Bakker (1997, 2003).
As relative proportions of Na and K calculated by LA-ICPMS mainly vary from 90% Na - 10%
K to 50% Na – 50% K and final ice melting temperatures vary from -5.5 °C to 0.0°C, the
maximum error that could be induced by salinity calculations in the H2O-NaCl system is
estimated to 1 wt.% equiv. NaCl lower than reality, for the more elevated values. Isochores
were calculated for aqueous and aquo-carbonic FIs with the ISOC program (Bakker, 1993)
using the empirical equations of state of Bodnar and Vityk (1994) and, Anderko and Pitzer
(1993a,b) and Duan et al., (1995) respectively.
3.2 Raman spectrometry
Raman spectrometry on aqueous (one-phase inclusions) and gas phases (two and
three-phase inclusions) from FIs was performed at GeoRessources laboratory (Nancy, France)
in order to detect possible traces of gases and their nature at room temperature. Raman
spectra were recorded using a LabRAM spectrometer (Horiba Jobin Yvon) equipped with a
600 gr.mm-1 grating and an edge filter. The confocal hole aperture is of 500 µm and the slit
aperture is of 100 µm. The excitation beam is provided by a Stabilite 2017 Ar+ laser (Spectra
Physics, Newport Corporation) at 514.53 nm and a power of 200 mW, focused on the sample
using a ×100 objective (Olympus). Acquisition time and number of accumulation are chosen
to optimize the signal-to-noise ratio (S/N), ideally lower than 1 %. Neither limits of detection
PART 2 – Chapter 4
230
nor absolute concentrations of trace gases, can be determined. However the relative
proportions of the different gas species identified with LabSpec software at room temperature
can be estimated qualitatively using the peak area, acquisition time and the specific scattering
cross-section of each peak (Schrotter and Klockner, 1979) as defined by Burke (2001).
3.3 LA-ICPMS analysis
Selected major, minor and trace elements were determined in FIs using a LA-ICPMS
instrumental setup at GeoRessources laboratory (Nancy, France) which is similar to that
described in Leisen et al. (2012) and Lach et al. (2013). It comprises a GeoLas excimer laser
(ArF, 193 nm, Microlas, Göttingen, Germany) (Günther et al., 1997) and an Agilent 7500c
quadrupole ICP-MS. The laser beam is focused onto the sample within a small-volume lozenge
shaped ablation cell dedicated to FIs analysis with a Schwarzschild reflective objective
(magnification ×25; numerical aperture 0.4) mounted on an optical microscope (Olympus
BX41) equipped with a X-Y motorized stage and a CCD camera. NIST610 glass (see
composition in Jochum et al., 2011) was chosen as the external standard (analytical accuracy
verified with NIST612 external standard) (Longerich et al., 1990). Used parameters are a
fluence of 8 J/cm² and laser shot frequency of 5 Hz, He = 0.5 L.min-1 as a carrier gas mixed
with Ar = 0.7 L.min-1 via a cyclone mixer prior to entering the ICP torch, spot sizes of 44 µm
and ablation duration of 40 s. The recorded isotopes are: 7Li, 23Na, 24Mg, 39K, 43Ca, 55Mn, 85Rb,
88Sr, 89Y, 93Nb, 95Mo, 118Sn, 133Cs, 138Ba, 181Ta and 182W with an integration time of 0.01 s per
mass channel. These elements have been chosen according to the paragenesis as they are
suspected to be present in the fluids according to the compositions of the successive minerals
in the paragenetic successions and/or because they are usually enriched in magmatic-
hydrothermal fluids in this context (e.g. Na, K, Cs, Rb). Calibration and signal-integration were
performed with the Matlab®-based SILLS program (Guillong et al., 2008). Absolute element
concentrations were calculated from analysed ratios relative to Na. The Na concentration was
obtained from the salinity estimated from microthermometry analysis (in wt.% NaCl equiv.)
using the charge-balance technique (Allan et al., 2005). This method corrects the modelled
PART 2 – Chapter 4
231
amount of Na (from the wt.% NaCl equiv.) for contributions from other chloride salts using the
analysed elemental ratios to Na. A matrix correction was applied for cassiterite and fluorite-
hosted inclusions using the SILLS program and using Sn and Ca respectively as internal
standards. Limits of detection (LODs) were calculated using the 3σ criterion (Longerich et al.,
1996). The analytical precision for most elements is within 15% relative standard deviation
(RSD). The analytical precision of the other elements is typically better than 30% RSD (Allan
et al., 2005).
3.4 Isotopic measurements
3.4.1 Oxygen isotopes of minerals and fluids
Oxygen isotope analyses on quartz, Fe-Li-micas, quartz, topaz and wolframite were
carried out at the Stable Isotope Laboratory of the University of Lausanne, Switzerland, using
a CO2-laser fluorination line coupled to a Finnigan MAT 253 mass spectrometer. Pure and
clean mineral separates were picked under a binocular microscope and crushed in an agate
mortar. For each acquisition, between 1.16 and 3.15 mg of sample was loaded with LS-1
reference material. The chamber was evacuated overnight under a vacuum better than 10-4
mbar before fluorination. Samples were heated with a CO2-laser in presence of F2 and the
liberated oxygen was purified on an overheated KCl salt in the extraction line. Oxygen was
absorbed on a molecular sieve (13x) held at liquid nitrogen temperature and then heated to
liberate the O2 into the mass spectrometer. For each acquisition, results are reported in per mil
(‰) relative to VSMOW (Vienna Standard Mean Ocean Water) and are normalized to the
quartz standard LS-1 (reference value: δ18O = 18.1 % vs. VSMOW). The precision, based on
replicate analyses of the samples (when possible) and the standard run together with the
samples, was generally better than 0.2 ‰. Oxygen isotope compositions of fluids were
calculated at selected temperatures using equilibrium equations of Zheng (1993a) for Fe-Li-
micas, Zheng (1993b) for quartz, Zheng (1991) for wolframite and Zheng (1993a) for topaz.
Cassiterite crystals did not permit oxygen isotope analysis due to complex zoning.
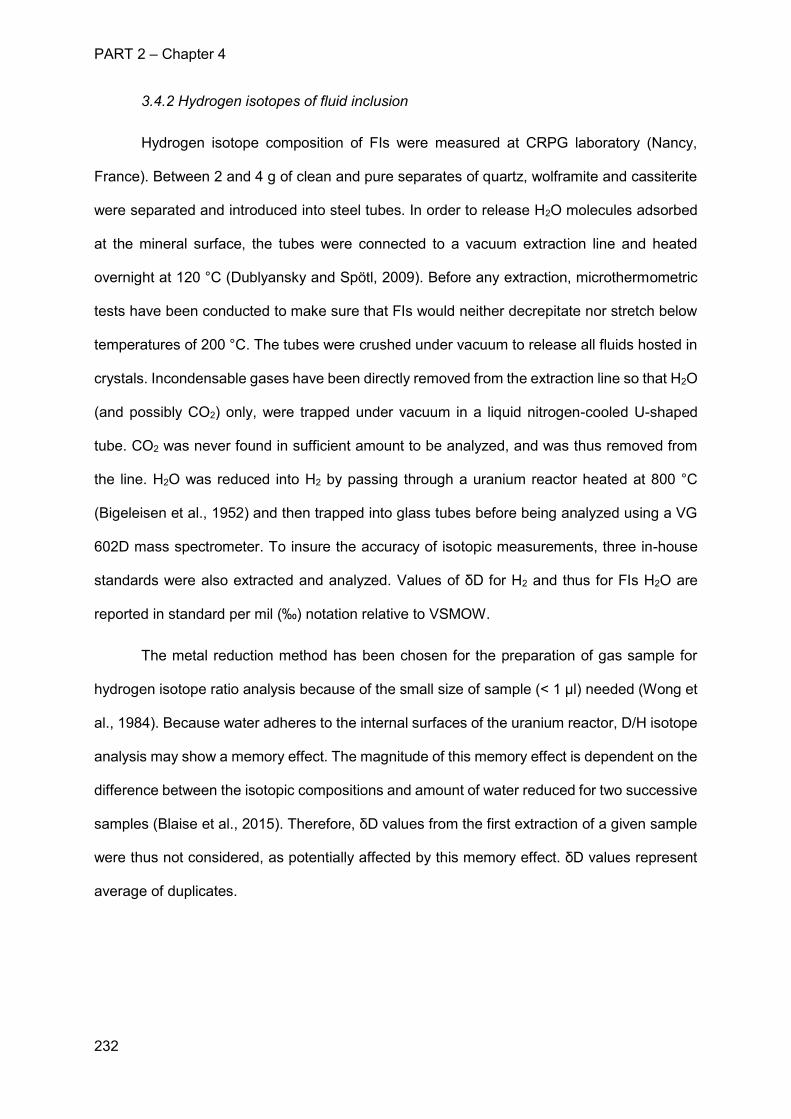
PART 2 – Chapter 4
232
3.4.2 Hydrogen isotopes of fluid inclusion
Hydrogen isotope composition of FIs were measured at CRPG laboratory (Nancy,
France). Between 2 and 4 g of clean and pure separates of quartz, wolframite and cassiterite
were separated and introduced into steel tubes. In order to release H2O molecules adsorbed
at the mineral surface, the tubes were connected to a vacuum extraction line and heated
overnight at 120 °C (Dublyansky and Spötl, 2009). Before any extraction, microthermometric
tests have been conducted to make sure that FIs would neither decrepitate nor stretch below
temperatures of 200 °C. The tubes were crushed under vacuum to release all fluids hosted in
crystals. Incondensable gases have been directly removed from the extraction line so that H2O
(and possibly CO2) only, were trapped under vacuum in a liquid nitrogen-cooled U-shaped
tube. CO2 was never found in sufficient amount to be analyzed, and was thus removed from
the line. H2O was reduced into H2 by passing through a uranium reactor heated at 800 °C
(Bigeleisen et al., 1952) and then trapped into glass tubes before being analyzed using a VG
602D mass spectrometer. To insure the accuracy of isotopic measurements, three in-house
standards were also extracted and analyzed. Values of δD for H2 and thus for FIs H2O are
reported in standard per mil (‰) notation relative to VSMOW.
The metal reduction method has been chosen for the preparation of gas sample for
hydrogen isotope ratio analysis because of the small size of sample (< 1 μl) needed (Wong et
al., 1984). Because water adheres to the internal surfaces of the uranium reactor, D/H isotope
analysis may show a memory effect. The magnitude of this memory effect is dependent on the
difference between the isotopic compositions and amount of water reduced for two successive
samples (Blaise et al., 2015). Therefore, δD values from the first extraction of a given sample
were thus not considered, as potentially affected by this memory effect. δD values represent
average of duplicates.
PART 2 – Chapter 4
233
4. Results
4.1 Fluid inclusion petrography
For both Maoping and Piaotang deposits, fluid inclusions (FIs) have been observed in
quartz (Figure 51A, B, C, F, J and K), wolframite (Figure 51E and L), cassiterite (Figure 51D
and M) and fluorite (Figure 51G, I and N) with the exception of topaz which was only observed
in Maoping (Figure 51H). FI petrographic observations are summarized in Table 6. Within the
quartz samples, the petrography of FIs is hampered by their high abundance which confers a
milky aspect to the crystals. Other minerals contain less abundant FIs and are therefore more
translucent, favoring petrographic characterization of FIs. According to the criteria of Roedder
(1984), the selected FIs are either pseudosecondary (i.e. distributed along intragranular FI
planes (FIPs)) or presumably primary (isolated or randomly distributed or clustered or aligned
and/or elongated along growth zones). In all selected samples, there is no optical or
compositional difference between pseudosecondary and presumably primary FIs and the two
types will not be further distinguished. Here, the application of the FI assemblage (FIA) concept
(Goldstein and Reynolds, 1994) is limited either by the milky aspect of the quartz and/or the
relatively small number of FIs above 5 µm in size (and therefore, not suitable for
microthermometric study in a given FIA). The majority of analyzed FIs show two phases (liquid
+ vapor) at room temperature and typically range from 5 to 40 µm in size. FIs display rounded,
elongated, irregular or negative crystal shapes regardless of their location. Optical estimation
of the volumetric fraction of the vapor phase at room temperature (φvap), as deduced from area
fractions (α), ranges from 10 to 50 %. α values are always randomly distributed in single
crystals and possible FIAs. However, as φvap, as deduced from α values, are subjected to
apparent variation due to two-dimensional projection of the FIs under the petrographic
microscope, apparent variation of φvap should be considered with caution (Bakker and
Diamond, 2006). Accordingly, there is no evidence for heterogeneous trapping of the fluid
within a same type of inclusions (two-phase of three-phase).

PART 2 – Chapter 4
234
Figure 51. Petrography and phase filling of FIs studied at the Maoping and Piaotang deposits at room temperature. FIs from Maoping are shown in (A) to (I). FIs from Piaotang are shown in (J) to (N). (A) Two-phase liquid (Laq) + vapor (Vaq) aqueous FI as isolated irregular inclusions and intragranular FIPs (dotted red lines) in Qtz2-III. Detailed view on the isolated FI is shown in the inset. (B) Intragranular FIPs (dotted red lines) of two-phase liquid (Laq) + vapor (Vaq) aqueous FI and isolated irregular three-phase liquid H2O (Laq) + liquid CO2 (LCO2)+ vapor CO2 (VCO2) aquo-carbonic FI in Qtz2-III. Detailed view on the isolated FI is shown in the inset. (C) Intragranular FIPs of two-phase liquid (Laq) + vapor (Vaq) aqueous FI and isolated irregular one-phase liquid (Laq) aqueous FI in Qtz2-III. Detailed view on the isolated FI is
PART 2 – Chapter 4
235
shown in the inset. (D) Two-phase liquid (Laq) + vapor (Vaq) aqueous FIs as isolated regular inclusion parallel to growth zones and intragranular FIPs oblique to the growth zones in Cst1-III. Detailed view on the isolated FI is shown in the inset. (E) Two-phase liquid (Laq) + vapor (Vaq) aqueous FI as isolated irregular inclusions and intragranular FIP in Wf1-III. Detailed view on an isolated FI is shown in the inset. (F) Two-phase liquid (Laq) + vapor (Vaq) aqueous FI as isolated negative crystal-shape inclusions and intragranular FIP in Qtz4-IV. Detailed view on the isolated FI is shown in the inset. (G) Two-phase liquid (Laq) + vapor (Vaq) aqueous FI as isolated regular inclusions and intragranular FIP displayed parallel to the growth zone in Fl1-VI. Detailed view on the FI is shown in the inset. (H) Two-phase liquid (Laq) + vapor (Vaq) aqueous FI as isolated regular inclusions and intragranular FIP displayed along a Toz4-VI growth zones. Detailed view on the FI is shown in the inset. (I) Two-phase liquid (Laq) + vapor (Vaq) aqueous FI as isolated regular inclusions and intragranular FIP displayed along the Fl2-VI growth zones. Detailed view on the FI is shown in the inset. (J) Two-phase liquid (Laq) + vapor (Vaq) aqueous FI as isolated irregular inclusions and intragranular FIP in Qtz1-I. Detailed view on the FI is shown in the inset. (K) One-phase liquid (Laq) aqueous FI as isolated irregular inclusions and intragranular FIP in Qtz1-I. (L) Two-phase liquid (Laq) + vapor (Vaq) aqueous FI as isolated regular inclusions displayed along the Wf1-I c-axis and in secondary FIP crossing the Wf1-I c-axis. Detailed view on the FI is shown in the inset. (M) Two-phase liquid (Laq) + vapor (Vaq) aqueous FI as isolated regular inclusions displayed along a Cst1-I growth zones and secondary FIP crossing the Cst1-I growth zones. Detailed view on the FI is shown in the inset. (N) Two-phase liquid (Laq) + vapor (Vaq) aqueous FI as isolated regular inclusions and intragranular FIP in Fl1-II. Detailed view on the FI is shown in the inset. Abbreviations according to the IMA: cst = cassiterite, fl = fluorite, qtz = quartz, toz = topaz, wf = wolframite.
Some rare (< 10%) one-phase (liquid) FIs have been randomly observed in Qtz2-III and
Qtz1-I from both Maoping and Piaotang deposits. One-phase FIs are usually isolated or
randomly displayed in FIA, associated with two-phase FIs. In the same way, very rare (< 5%)
three-phase (liquid H2O + liquid CO2 + vapor CO2) inclusions have been observed in the Qtz2-
III of the Maoping deposit, clustered together and isolated from other types of inclusions.
Despite some ductile deformation and subgrains observed in Qtz2-III and topaz of the Maoping
deposit at the crystal scale, FIs do not show any sign of stretching or necking-down.
4.2 Microthermometry and Raman spectrometry data
Microthermometric and Raman spectrometry data of the Maoping and Piaotang FIs are
summarized in Table 6 and Figure 52. Th and salinity data are plotted in a binary diagram for
two-phase aqueous inclusions (Figure 52A and B). Traces of CO2, CH4 and N2 gases were
detected by Raman spectrometry in the vapor phase of the two-phase aqueous FIs of Qtz2-III,
Cst1-III, Qtz4-IV, Toz4-VI in Maoping and Cst1-I in Piaotang but no corresponding phase transitions
were observed during microthermometry analyses (Figure 52C). Therefore, salinity and
isochore reconstructions were carried out considering volatile-free FIs. No dissolved gases
were observed in the one-phase aqueous liquid FIs from the Maoping deposit. CO2 only was
detected in the rare three-phase inclusions observed in Qtz2-III in Maoping.
PART 2 – Chapter 4
236
Salinity values display a continuum in both deposits: 0.0 to 12.6 wt% equiv. NaCl for
Maoping and 0.4 to 8.3 wt% equiv. NaCl for Piaotang. Salinity variation within single minerals
are within 2 to 8 wt% equiv. NaCl. Two groups of Th values can be distinguished in both
deposits: a low-Th group between 150 and 250 °C and higher Th group between 300 and 350
°C (Figure 52A and B). In both deposits, similarities are observed: inclusions in the quartz of
the main mineralizing events (Qtz2-III at Maoping and Qtz1-I at Piaotang) show distinctively lower
salinity values than other studied minerals (0.0 to ca. 6 wt% equiv. NaCl) and share similarities
with very late fluorite as described below. These quartz also show lower Th values similarly to
late fluorite. Wolframite and cassiterite display much higher salinity (twice the value of the
quartz). At Maoping, both Wf1-III- and Cst1-III-hosted FIs display a narrow range of high Th. At
Piaotang, Cst1-I-hosted FIs show the same range of high Th as Maoping values while Wf1-I-
hosted FIs display much lower values (180 and 230 °C) close to Qtz1-I values (150 to 180 °C).
Cassiterite-hosted FIs trace gases are dominated by CO2 in both deposits (Figure 52C). In
late-stage minerals (Qtz4-IV, Fl1-VI and Toz4-VI at Maoping and Fl1-II at Piaotang), salinity is
generally comparable to those of cassiterite- and wolframite-hosted FIs and even sometimes
higher in Qtz4-IV at Maoping. FIs observed in late-stage minerals at Maoping can be divided
into two groups: Qtz4-IV- and Fl2-VI-hosted FIs which display a similar range as in Qtz2-III and Fl1-
VI, and Toz4-VI-hosted FIs that show a narrow range of Th as in Wf1-III- and Cst1-III. The total
salinity of rare three-phase aquo-carbonic FIs is lower than in the majority of two-phase
aqueous FIs (around 0.5 wt% NaCl equiv.) and share a similar range as two-phase aqueous
FIs in the same host mineral (Qtz2-III). Moreover, the salinity of the aqueous phase of three-
phase inclusions also shares a similar range of values (3.3 to 4.0 wt%. NaCl equiv.).
PART 2 – Chapter 4
237
Table 6. Petrography, Raman Spectrometry and microthermometry data on fluid inclusions from the Maoping and Piaotang deposits. Values in parentheses indicate modes.
Mineral Phases at 25 °C Proportion within a crystal Morphology Size α (%) N
(trace gases after Raman spectrometry)
(visual estimation) (µm) (25°C) T m(ice) Th(CO2) T h
MAOPING (to vapor) (to liquid)
Laq-Vaq + trace CO2, CH4 and N2 85% irregular 5-30 20-50 96 -4.5 to -0.2 (-0.7) - 157 to 287 (220)
Laq-LCO2-VCO2 5% irregular 10-20 85-95 6 -1.7 to -0.9 (-1.2) 29.4 to 30.6 (30.3) 200 to 252 (230)
Laq 10% irregular 5-30 20-50 c - - -
Wolframite1-IIILaq-Vaq a 100% regular 5-25 20-50 30 -5.2 to -3.7 (-4.4) - 284 to 346 (340)
Cassiterite1-IIILaq-Vaq + trace CO2, CH4 and N2 100% irregular 10-20 30-60 25 -5.5 to -3.0 (-3.8) - 299 to 338 (340)
Quartz4-IV Laq-Vaq + trace CO2 100% regular 5-15 20-30 41 -6.1 to -1.3 (-4.2) - 148 to 291 (240)
Fluorite1-VI Laq-Vaq b 100% regular 5-15 30-60 20 -5.4 to -4.3 (-4.5) - 195 to 325 (340)
Topaze4-VI Laq-Vaq + trace CO2 100% irregular 5-30 10-50 46 -4.2 to -3.3 (-3.9) - 307 to 346 (340)
Fluorite2-VI Laq-Vaq b 100% regular 5-20 10-20 15 -0.9 to -0.1 (-0.1) - 136 to 292 (230)
PIAOTANG
Laq-Vaq 100% irregular 5-15 10-30 20 -2.2 to -0.2 (-2.2) - 144 to 175 (160)
Laq 10% irregular 5-15 10-30 c - - -
Wolframite1-I Laq-Vaq a 100% regular 5-15 10-40 18 -5.3 to -3.1 (-4.2) - 173 to 222 (210)
Cassiterite1-I Laq-Vaq + trace CO2, CH4 and N2 100% regular 5-20 10-40 24 -3.7 to -1.4 (-3.5) - 283 to 349 (340)
Fluorite1-II Laq-Vaq b 100% regular 15-40 10-30 23 -5.0 to 0.0 (0) - 142 to 185 (170)
c Phase transitions could not be observed in one-phase liquid inclusions
Abbreviations: α = vapor phase, L = liquid, V = vapor, aq = aqueous, FIP = fluid inclusion plan, Tm = melting temperature, Th = homogenization temperature, cla = clathrate
a Wolframite is an opaque mineral and therefore, could not be analyzed by Raman spectrometryb Due to fluorescence, gas peaks were impossible to observe by Raman spectrometry
Stage II: Calcic stage
intragranular FIP or isolated - 0 to 7.7
FIP along growth zone - 5.6 to 8.3 (6.5)
FIP along growth zone or intragranular - 2.4 to 6.2 (5.8)
Quartz1-I
intragranular FIP or isolated - 0.4 to 3.8 (2.2)
intragranular FIP or isolated - -
Stage I: Silicate-oxide
FIP along growth zone or clusters - 5.6 to 7.0 (6.1)
FIP along growth zone - 0 to 1.6 (0.1)
Stage VI: Late phases
FIP along growth zone or intragranular - 8.1 to 11.1 (9.0)
Stage IV: Banded quartz veins
intragranular FIP - 7.7 to 12.6 (9.0)
FIP along growth zone or intragranular - 7.2 to 10.5 (8.7)
FIP along growth zone or isolated - 5.8 to 11.2 (7.5)
Quartz2-III
intragranular FIP or isolated - 0.4 to 9.0 (1.3)
isolated or cluster 7.7 to 8.1 (8.0) 0.4 to 0.5 (0.4)
intragranular FIP or isolated - -
Stage III: W-Sn veins
Petrography Microthermometry Salinity
Tm(cla) (wt.% NaCl equiv.)
PART 2 – Chapter 4
238
Figure 52. Microthermometric and Raman spectrometry data on two-phase aqueous FIs for the Maoping and Piaotang deposits. (A) Binary salinity vs. homogenization temperature diagram for Maoping FIs at all stages in quartz, cassiterite and wolframite from the W-Sn mineralized stage III, quartz crystallized in the banded quartz veins on stage IV and fluorite and topaz in late stage VI. Possible fluid end-members are indicated. Serrated sides of the boxes indicate the direction along which the exact position of the actual end-member is uncertain. (B) Binary salinity vs. homogenization temperature diagram for Piaotang FIs at all stages in quartz, cassiterite and wolframite from the silicate-oxide mineralizing stage I and late fluorite from the carbonate stage II. Possible fluid end-members are indicated. Serrated sides of the boxes indicate the direction along which the exact position of the actual end-member is uncertain. (C) Gas concentrations obtained by Raman spectrometry on in the vapor phase of FIs in quartz and cassiterite of stage III at Maoping and cassiterite from stage I at Piaotang (no gases detected in quartz) represented in ternary diagram showing relative molar proportions of CO2, CH4 and N2.
Isochore estimates were calculated from microthermometry measurements in every
mineral of interest of the Maoping and Piaotang deposit (Figure 53). In the Maoping deposit,
Qtz2-III is the only mineral were PT conditions could be constrained by both two-phase aqueous
inclusions and three-phase aquo-carbonic inclusions. Estimates indicate hydrostatic
conditions with a very high gradient (above 90°C/km) and temperature and pressure ranging
from 150 °C to 300 °C and 5 to 40 MPa respectively. No petrographic observations could
indicate a change from hydrostatic to lithostatic conditions in our systems. Therefore, all other
minerals were considered under hydrostatic conditions. No PT constraints (besides
microthermometry measurements) could be apply to these minerals and therefore a very large
PART 2 – Chapter 4
239
Figure 53. Calculated isochores for representative homogenization temperature ranges for FIs from the different minerals studied for the Maoping and Piaotang deposits, and their intersection with possible thermal gradients assuming hydrostatic conditions. (A) Qtz2-III, Wf1-III and Cst1-III of stage III the Maoping deposit. (B) Qtz4-IV of stage IV the Maoping deposit. (C) Fl1-VI, Toz4-VI and Fl2-VI of the late stage VI of the Maoping deposit. (D) Qtz1-I, Wf1-I, Cst1-I and Fl1-II of stages I and II of the Piaotang deposit. Wet-saturated solidus of granitic magmas after Vigneresse et al. (1995).
PART 2 – Chapter 4
240
range of possible hydrostatic gradients (from 30°C/km and above) were considered for our
estimates. Overall, two groups can be distinguished in both deposits (reflecting previous Th
groups). First group is composed of Qtz2-III, Qtz4-IV and Fl1-VI FIs in Maoping and Qtz1-I, Wf1-I
and Fl1-II FIs in Piaotang with pressures between 5 and 160 MPa and temperatures from 140
to 400 °C. The second group is composed of Wf1-III, Cst1-III, Fl1-VI and Toz4-VI FIs in Maoping
and Cst1-I in Piaotang with pressures from 5 to 250 MPa and associated temperatures between
300 °C and 700 °C.
4.3 LA-ICPMS data
Two-phase aqueous FIs from the Maoping and Piaotang deposits were selected for
LA-ICPMS analyses according to (i) previous characterization by optical microscopy and
microthermometry; (ii) relatively large-size (10-30 µm) and (iii) appropriate distance to the
polished thick section surface (< 15 µm). From Maoping, a total of thirty-two FIs were selected
from quartz (N = 11), cassiterite (N = 7), fluorite (N = 4) and topaz (N = 10). From Piaotang, a
total of twenty-nine FIs were selected from quartz (N = 8), cassiterite (N = 11) and fluorite (N
= 10). LA-ICPMS data are reported in Table 7, Figure 54 and Figure 55. As the results are
similar for FIs from equivalent host minerals at Maoping and Piaotang, LA-ICPMS data will be
further described without distinction between the deposits.
Due to the relatively small size of FIs combined with their relatively low-salinity, many
data lie below LODs. Generally speaking, LODs vary from one analysis to another as a function
of the amount of the given element in the matrix, the magnitude of the signal for the inclusions
and the background intensity. Here, the proportion of analyses quantified above the LOD
values is of: Na (100%), Cs (92%), Li (90%), K (87%), Rb (85%), Mn (64%), Sn (54%), Mg
(48%), W (48%), Sr (25%), Ba (25%), Mo (20%), Ta (20%), Nb (18%), Y (16%) and Ca (13%).
For FIs with concentration <LOD, LODs show similar range to measured values on other
inclusions from the same mineral.
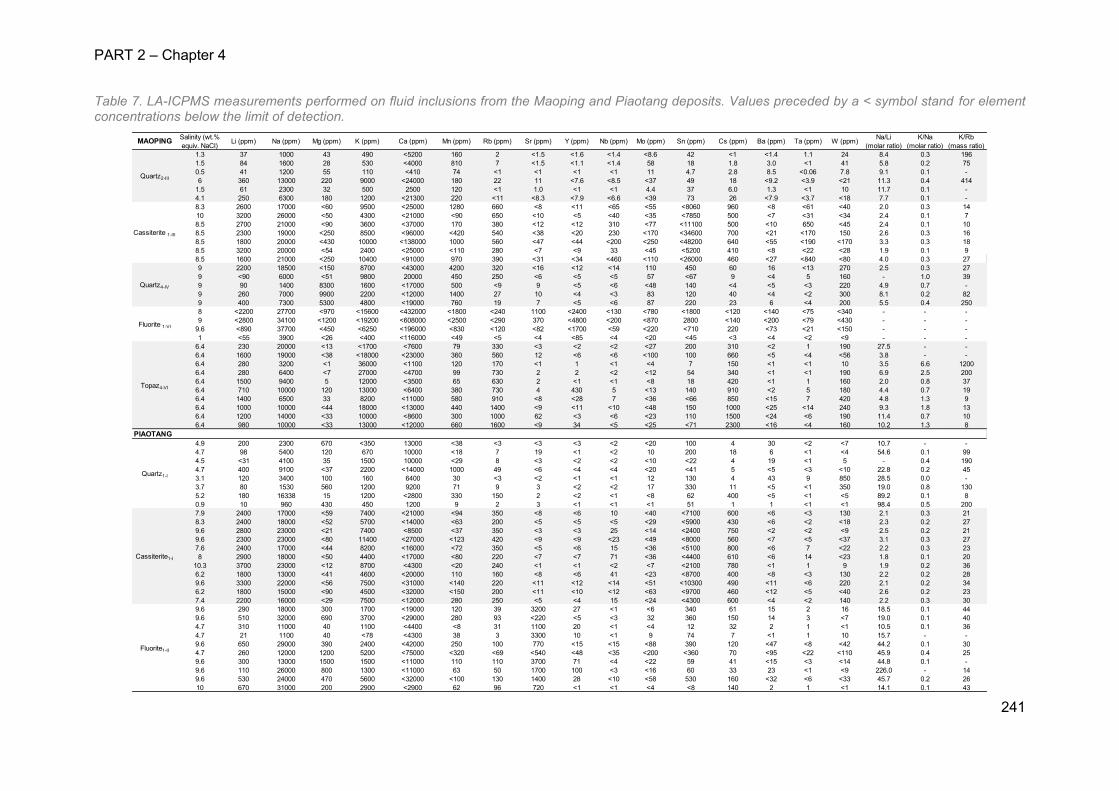
PART 2 – Chapter 4
241
Table 7. LA-ICPMS measurements performed on fluid inclusions from the Maoping and Piaotang deposits. Values preceded by a < symbol stand for element concentrations below the limit of detection.
MAOPING Salinity (wt.% equiv. NaCl)
Li (ppm) Na (ppm) Mg (ppm) K (ppm) Ca (ppm) Mn (ppm) Rb (ppm) Sr (ppm) Y (ppm) Nb (ppm) Mo (ppm) Sn (ppm) Cs (ppm) Ba (ppm) Ta (ppm) W (ppm) Na/Li (molar ratio)
K/Na (molar ratio)
K/Rb (mass ratio)
1.3 37 1000 43 490 <5200 160 2 <1.5 <1.6 <1.4 <8.6 42 <1 <1.4 1.1 24 8.4 0.3 1961.5 84 1600 28 530 <4000 810 7 <1.5 <1.1 <1.4 58 18 1.8 3.0 <1 41 5.8 0.2 750.5 41 1200 55 110 <410 74 <1 <1 <1 <1 11 4.7 2.8 8.5 <0.06 7.8 9.1 0.1 -6 360 13000 220 9000 <24000 180 22 11 <7.6 <8.5 <37 49 18 <9.2 <3.9 <21 11.3 0.4 414
1.5 61 2300 32 500 2500 120 <1 1.0 <1 <1 4.4 37 6.0 1.3 <1 10 11.7 0.1 -4.1 250 6300 180 1200 <21300 220 <11 <8.3 <7.9 <6.6 <39 73 26 <7.9 <3.7 <18 7.7 0.1 -8.3 2600 17000 <60 9500 <25000 1280 660 <8 <11 <65 <55 <8060 960 <8 <61 <40 2.0 0.3 1410 3200 26000 <50 4300 <21000 <90 650 <10 <5 <40 <35 <7850 500 <7 <31 <34 2.4 0.1 78.5 2700 21000 <90 3600 <37000 170 380 <12 <12 310 <77 <11100 500 <10 650 <45 2.4 0.1 108.5 2300 19000 <250 8500 <96000 <420 540 <38 <20 230 <170 <34600 700 <21 <170 150 2.6 0.3 168.5 1800 20000 <430 10000 <138000 1000 560 <47 <44 <200 <250 <48200 640 <55 <190 <170 3.3 0.3 188.5 3200 20000 <54 2400 <25000 <110 280 <7 <9 33 <45 <5200 410 <8 <22 <28 1.9 0.1 98.5 1600 21000 <250 10400 <91000 970 390 <31 <34 <460 <110 <26000 460 <27 <840 <80 4.0 0.3 279 2200 18500 <150 8700 <43000 4200 320 <16 <12 <14 110 450 60 16 <13 270 2.5 0.3 279 <90 6000 <51 9800 20000 450 250 <6 <5 <5 57 <67 9 <4 5 160 - 1.0 399 90 1400 8300 1600 <17000 500 <9 9 <5 <6 <48 140 <4 <5 <3 220 4.9 0.7 -9 260 7000 9900 2200 <12000 1400 27 10 <4 <3 83 120 40 <4 <2 300 8.1 0.2 829 400 7300 5300 4800 <19000 760 19 7 <5 <6 87 220 23 6 <4 200 5.5 0.4 2508 <2200 27700 <970 <15600 <432000 <1800 <240 1100 <2400 <130 <780 <1800 <120 <140 <75 <340 - - -9 <2800 34100 <1200 <19200 <608000 <2500 <290 370 <4800 <200 <870 2800 <140 <200 <79 <430 - - -
9.6 <890 37700 <450 <6250 <196000 <830 <120 <82 <1700 <59 <220 <710 220 <73 <21 <150 - - -1 <55 3900 <26 <400 <116000 <49 <5 <4 <85 <4 <20 <45 <3 <4 <2 <9 - - -
6.4 230 20000 <13 <1700 <7600 79 330 <3 <2 <2 <27 200 310 <2 1 190 27.5 - -6.4 1600 19000 <38 <18000 <23000 360 560 12 <6 <6 <100 100 660 <5 <4 <56 3.8 - -6.4 280 3200 <1 36000 <1100 120 170 <1 1 <1 <4 7 150 <1 <1 10 3.5 6.6 12006.4 280 6400 <7 27000 <4700 99 730 2 2 <2 <12 54 340 <1 <1 190 6.9 2.5 2006.4 1500 9400 5 12000 <3500 65 630 2 <1 <1 <8 18 420 <1 1 160 2.0 0.8 376.4 710 10000 120 13000 <6400 380 730 4 430 5 <13 140 910 <2 5 180 4.4 0.7 196.4 1400 6500 33 8200 <11000 580 910 <8 <28 7 <36 <66 850 <15 7 420 4.8 1.3 96.4 1000 10000 <44 18000 <13000 440 1400 <9 <11 <10 <48 150 1000 <25 <14 240 9.3 1.8 136.4 1200 14000 <33 10000 <8600 300 1000 62 <3 <6 <23 110 1500 <24 <6 190 11.4 0.7 106.4 980 10000 <33 13000 <12000 660 1600 <9 34 <5 <25 <71 2300 <16 <4 160 10.2 1.3 8
PIAOTANG4.9 200 2300 670 <350 13000 <38 <3 <3 <3 <2 <20 100 4 30 <2 <7 10.7 - -4.7 98 5400 120 670 10000 <18 7 19 <1 <2 10 200 18 6 <1 <4 54.6 0.1 994.5 <31 4100 35 1500 10000 <29 8 <3 <2 <2 <10 <22 4 19 <1 5 - 0.4 1904.7 400 9100 <37 2200 <14000 1000 49 <6 <4 <4 <20 <41 5 <5 <3 <10 22.8 0.2 453.1 120 3400 100 160 6400 30 <3 <2 <1 <1 12 130 4 43 9 850 28.5 0.0 -3.7 80 1530 560 1200 9200 71 9 3 <2 <2 17 330 11 <5 <1 350 19.0 0.8 1305.2 180 16338 15 1200 <2800 330 150 2 <2 <1 <8 62 400 <5 <1 <5 89.2 0.1 80.9 10 960 430 450 1200 9 2 3 <1 <1 <1 51 1 1 <1 <1 98.4 0.5 2007.9 2400 17000 <59 7400 <21000 <94 350 <8 <6 10 <40 <7100 600 <6 <3 130 2.1 0.3 218.3 2400 18000 <52 5700 <14000 <63 200 <5 <5 <5 <29 <5900 430 <6 <2 <18 2.3 0.2 279.6 2800 23000 <21 7400 <8500 <37 350 <3 <3 25 <14 <2400 750 <2 <2 <9 2.5 0.2 219.6 2300 23000 <80 11400 <27000 <123 420 <9 <9 <23 <49 <8000 560 <7 <5 <37 3.1 0.3 277.6 2400 17000 <44 8200 <16000 <72 350 <5 <6 15 <36 <5100 800 <6 7 <22 2.2 0.3 238 2900 18000 <50 4400 <17000 <80 220 <7 <7 71 <36 <4400 610 <6 14 <23 1.8 0.1 20
10.3 3700 23000 <12 8700 <4300 <20 240 <1 <1 <2 <7 <2100 780 <1 1 9 1.9 0.2 366.2 1800 13000 <41 4600 <20000 110 160 <8 <6 41 <23 <8700 400 <8 <3 130 2.2 0.2 289.6 3300 22000 <56 7500 <31000 <140 220 <11 <12 <14 <51 <10300 490 <11 <6 220 2.1 0.2 346.2 1800 15000 <90 4500 <32000 <150 200 <11 <10 <12 <63 <9700 460 <12 <5 <40 2.6 0.2 237.4 2200 16000 <29 7500 <12000 280 250 <5 <4 15 <24 <4300 600 <4 <2 140 2.2 0.3 309.6 290 18000 300 1700 <19000 120 39 3200 27 <1 <6 340 61 15 2 16 18.5 0.1 449.6 510 32000 690 3700 <29000 280 93 <220 <5 <3 32 360 150 14 3 <7 19.0 0.1 404.7 310 11000 40 1100 <4400 <8 31 1100 20 <1 <4 12 32 2 1 <1 10.5 0.1 364.7 21 1100 40 <78 <4300 38 3 3300 10 <1 9 74 7 <1 1 10 15.7 - -9.6 650 29000 390 2400 <42000 250 100 770 <15 <15 <88 390 120 <47 <8 <42 44.2 0.1 304.7 260 12000 1200 5200 <75000 <320 <69 <540 <48 <35 <200 <360 70 <95 <22 <110 45.9 0.4 259.6 300 13000 1500 1500 <11000 110 110 3700 71 <4 <22 59 41 <15 <3 <14 44.8 0.1 -9.6 110 26000 800 1300 <11000 63 50 1700 100 <3 <16 60 33 23 <1 <9 226.0 - 149.6 530 24000 470 5600 <32000 <100 130 1400 28 <10 <58 530 160 <32 <6 <33 45.7 0.2 2610 670 31000 200 2900 <2900 62 96 720 <1 <1 <4 <8 140 2 1 <1 14.1 0.1 43
Cassiterite1-I
Fluorite1-II
Quartz2-III
Cassiterite 1-III
Quartz4-IV
Fluorite 1-VI
Topaz4-VI
Quartz1-I
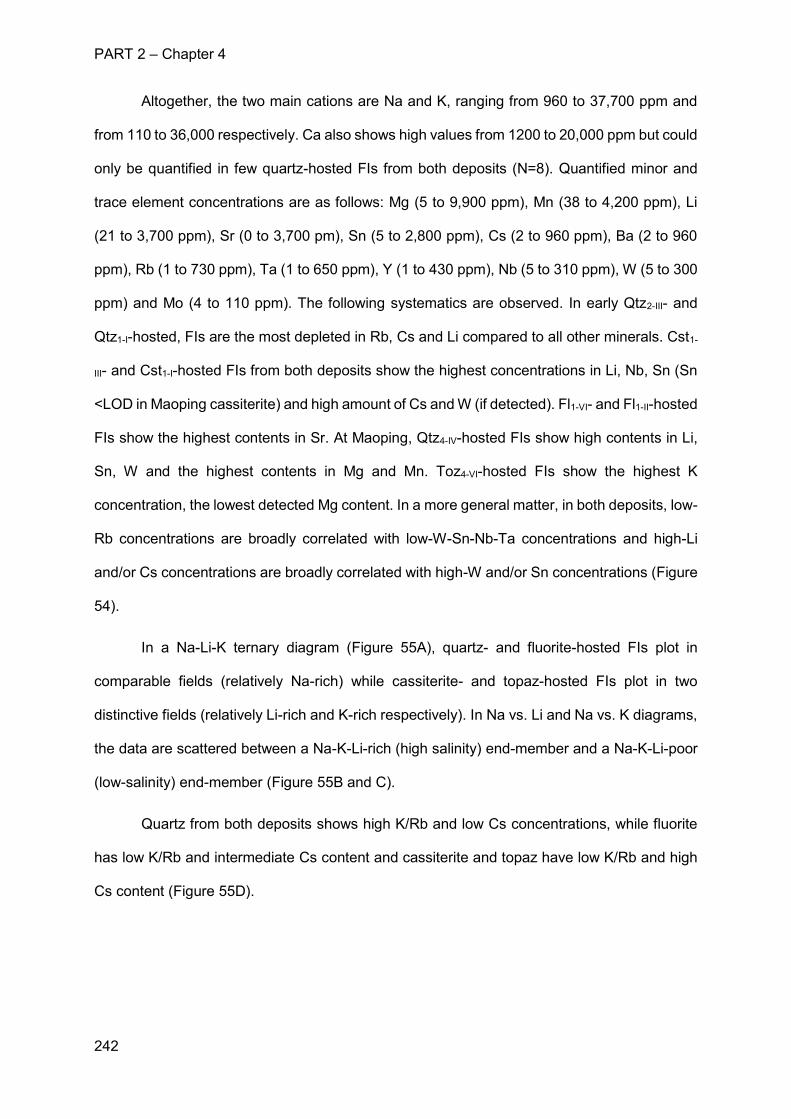
PART 2 – Chapter 4
242
Altogether, the two main cations are Na and K, ranging from 960 to 37,700 ppm and
from 110 to 36,000 respectively. Ca also shows high values from 1200 to 20,000 ppm but could
only be quantified in few quartz-hosted FIs from both deposits (N=8). Quantified minor and
trace element concentrations are as follows: Mg (5 to 9,900 ppm), Mn (38 to 4,200 ppm), Li
(21 to 3,700 ppm), Sr (0 to 3,700 pm), Sn (5 to 2,800 ppm), Cs (2 to 960 ppm), Ba (2 to 960
ppm), Rb (1 to 730 ppm), Ta (1 to 650 ppm), Y (1 to 430 ppm), Nb (5 to 310 ppm), W (5 to 300
ppm) and Mo (4 to 110 ppm). The following systematics are observed. In early Qtz2-III- and
Qtz1-I-hosted, FIs are the most depleted in Rb, Cs and Li compared to all other minerals. Cst1-
III- and Cst1-I-hosted FIs from both deposits show the highest concentrations in Li, Nb, Sn (Sn
<LOD in Maoping cassiterite) and high amount of Cs and W (if detected). Fl1-VI- and Fl1-II-hosted
FIs show the highest contents in Sr. At Maoping, Qtz4-IV-hosted FIs show high contents in Li,
Sn, W and the highest contents in Mg and Mn. Toz4-VI-hosted FIs show the highest K
concentration, the lowest detected Mg content. In a more general matter, in both deposits, low-
Rb concentrations are broadly correlated with low-W-Sn-Nb-Ta concentrations and high-Li
and/or Cs concentrations are broadly correlated with high-W and/or Sn concentrations (Figure
54).
In a Na-Li-K ternary diagram (Figure 55A), quartz- and fluorite-hosted FIs plot in
comparable fields (relatively Na-rich) while cassiterite- and topaz-hosted FIs plot in two
distinctive fields (relatively Li-rich and K-rich respectively). In Na vs. Li and Na vs. K diagrams,
the data are scattered between a Na-K-Li-rich (high salinity) end-member and a Na-K-Li-poor
(low-salinity) end-member (Figure 55B and C).
Quartz from both deposits shows high K/Rb and low Cs concentrations, while fluorite
has low K/Rb and intermediate Cs content and cassiterite and topaz have low K/Rb and high
Cs content (Figure 55D).
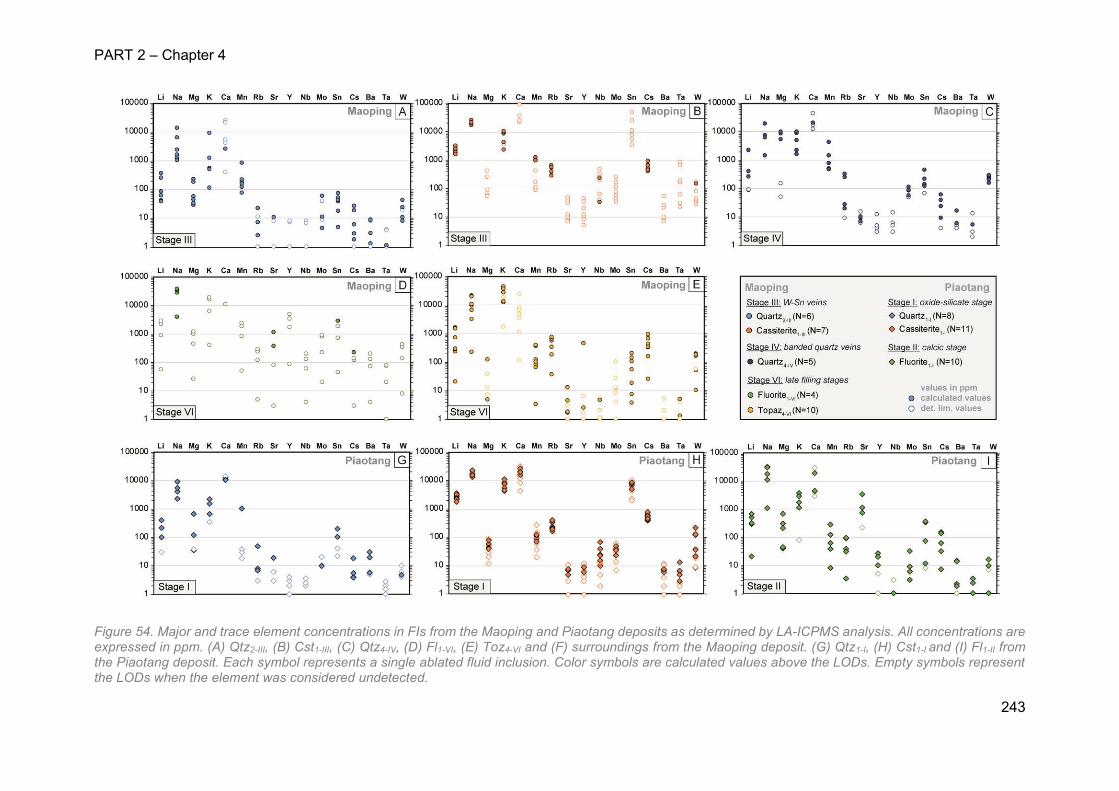
PART 2 – Chapter 4
243
Figure 54. Major and trace element concentrations in FIs from the Maoping and Piaotang deposits as determined by LA-ICPMS analysis. All concentrations are expressed in ppm. (A) Qtz2-III, (B) Cst1-III, (C) Qtz4-IV, (D) Fl1-VI, (E) Toz4-VI and (F) surroundings from the Maoping deposit. (G) Qtz1-I, (H) Cst1-I and (I) Fl1-II from the Piaotang deposit. Each symbol represents a single ablated fluid inclusion. Color symbols are calculated values above the LODs. Empty symbols represent the LODs when the element was considered undetected.
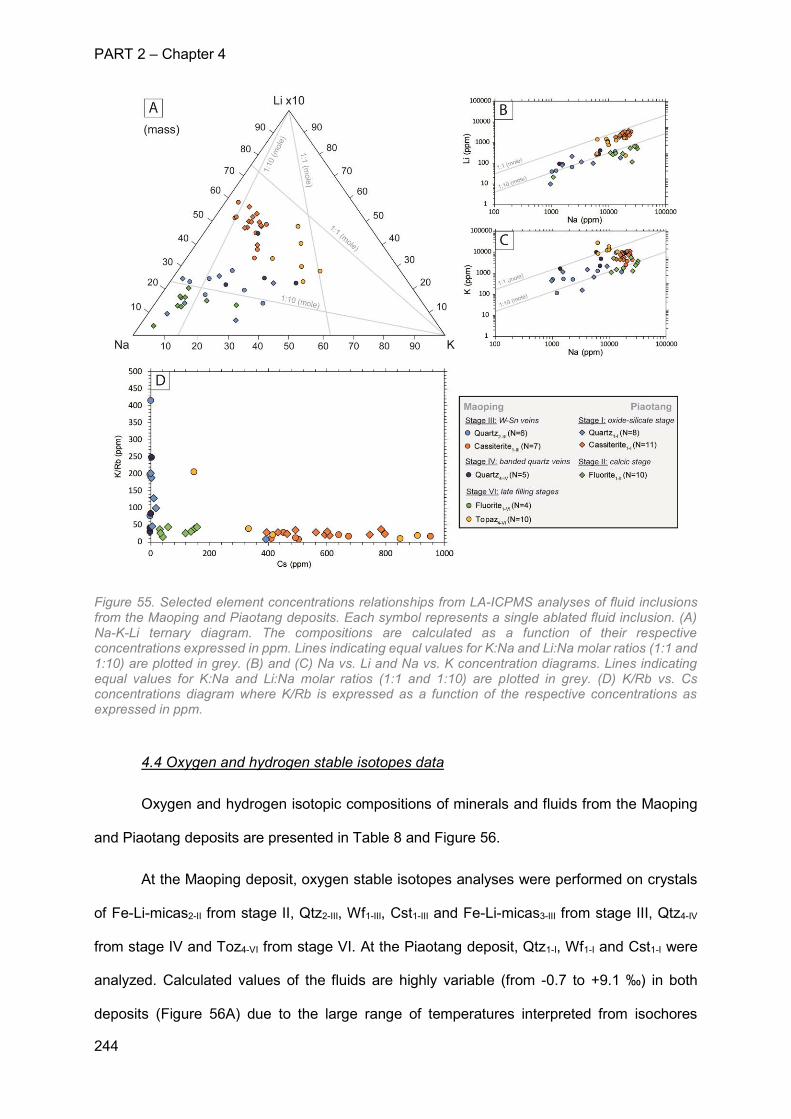
PART 2 – Chapter 4
244
Figure 55. Selected element concentrations relationships from LA-ICPMS analyses of fluid inclusions from the Maoping and Piaotang deposits. Each symbol represents a single ablated fluid inclusion. (A) Na-K-Li ternary diagram. The compositions are calculated as a function of their respective concentrations expressed in ppm. Lines indicating equal values for K:Na and Li:Na molar ratios (1:1 and 1:10) are plotted in grey. (B) and (C) Na vs. Li and Na vs. K concentration diagrams. Lines indicating equal values for K:Na and Li:Na molar ratios (1:1 and 1:10) are plotted in grey. (D) K/Rb vs. Cs concentrations diagram where K/Rb is expressed as a function of the respective concentrations as expressed in ppm.
4.4 Oxygen and hydrogen stable isotopes data
Oxygen and hydrogen isotopic compositions of minerals and fluids from the Maoping
and Piaotang deposits are presented in Table 8 and Figure 56.
At the Maoping deposit, oxygen stable isotopes analyses were performed on crystals
of Fe-Li-micas2-II from stage II, Qtz2-III, Wf1-III, Cst1-III and Fe-Li-micas3-III from stage III, Qtz4-IV
from stage IV and Toz4-VI from stage VI. At the Piaotang deposit, Qtz1-I, Wf1-I and Cst1-I were
analyzed. Calculated values of the fluids are highly variable (from -0.7 to +9.1 ‰) in both
deposits (Figure 56A) due to the large range of temperatures interpreted from isochores
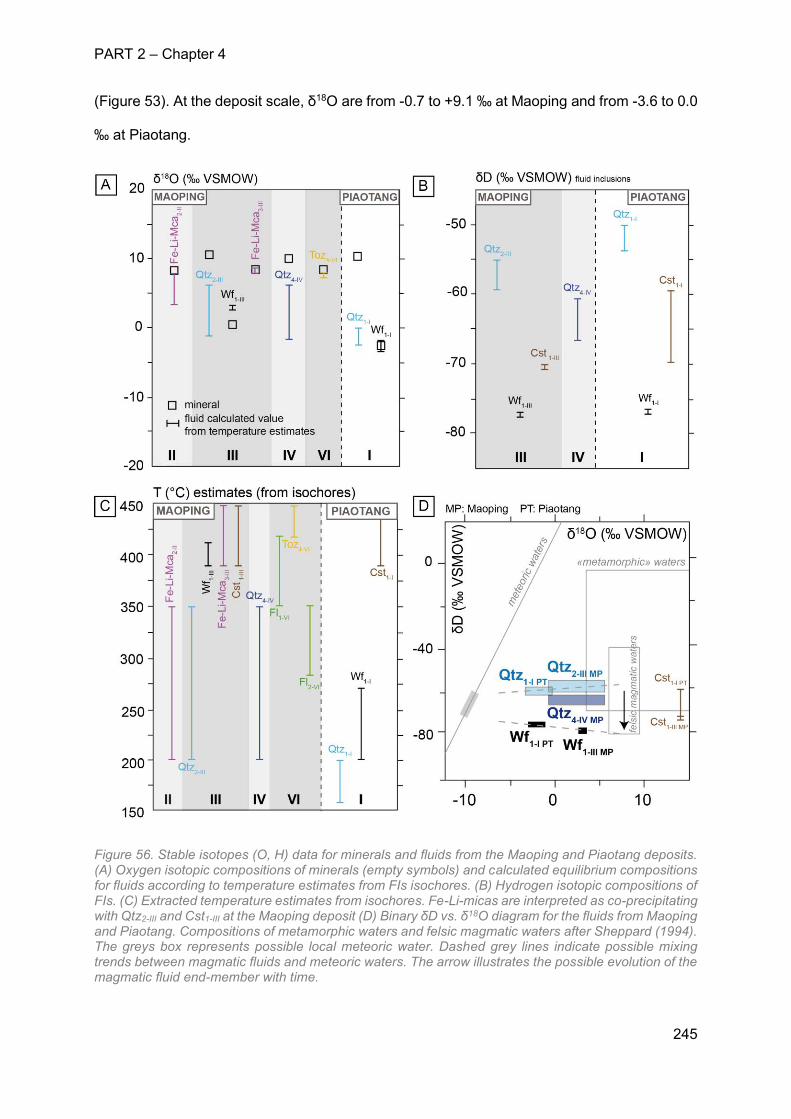
PART 2 – Chapter 4
245
(Figure 53). At the deposit scale, δ18O are from -0.7 to +9.1 ‰ at Maoping and from -3.6 to 0.0
‰ at Piaotang.
Figure 56. Stable isotopes (O, H) data for minerals and fluids from the Maoping and Piaotang deposits. (A) Oxygen isotopic compositions of minerals (empty symbols) and calculated equilibrium compositions for fluids according to temperature estimates from FIs isochores. (B) Hydrogen isotopic compositions of FIs. (C) Extracted temperature estimates from isochores. Fe-Li-micas are interpreted as co-precipitating with Qtz2-III and Cst1-III at the Maoping deposit (D) Binary δD vs. δ18O diagram for the fluids from Maoping and Piaotang. Compositions of metamorphic waters and felsic magmatic waters after Sheppard (1994). The greys box represents possible local meteoric water. Dashed grey lines indicate possible mixing trends between magmatic fluids and meteoric waters. The arrow illustrates the possible evolution of the magmatic fluid end-member with time.
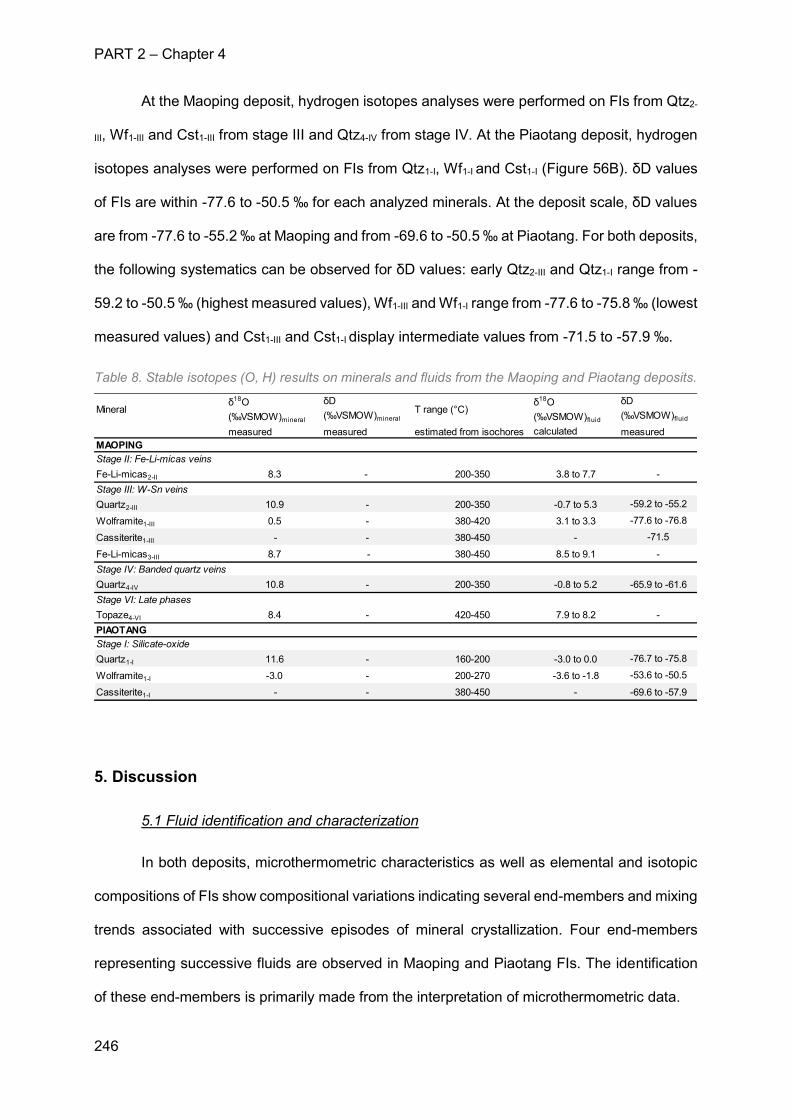
PART 2 – Chapter 4
246
At the Maoping deposit, hydrogen isotopes analyses were performed on FIs from Qtz2-
III, Wf1-III and Cst1-III from stage III and Qtz4-IV from stage IV. At the Piaotang deposit, hydrogen
isotopes analyses were performed on FIs from Qtz1-I, Wf1-I and Cst1-I (Figure 56B). δD values
of FIs are within -77.6 to -50.5 ‰ for each analyzed minerals. At the deposit scale, δD values
are from -77.6 to -55.2 ‰ at Maoping and from -69.6 to -50.5 ‰ at Piaotang. For both deposits,
the following systematics can be observed for δD values: early Qtz2-III and Qtz1-I range from -
59.2 to -50.5 ‰ (highest measured values), Wf1-III and Wf1-I range from -77.6 to -75.8 ‰ (lowest
measured values) and Cst1-III and Cst1-I display intermediate values from -71.5 to -57.9 ‰.
Table 8. Stable isotopes (O, H) results on minerals and fluids from the Maoping and Piaotang deposits.
5. Discussion
5.1 Fluid identification and characterization
In both deposits, microthermometric characteristics as well as elemental and isotopic
compositions of FIs show compositional variations indicating several end-members and mixing
trends associated with successive episodes of mineral crystallization. Four end-members
representing successive fluids are observed in Maoping and Piaotang FIs. The identification
of these end-members is primarily made from the interpretation of microthermometric data.
Mineralδ18O (‰VSMOW)mineral
δD (‰VSMOW)mineral
T range (°C)δ18O (‰VSMOW)fluid
measured measured estimated from isochores measuredMAOPING
Fe-Li-micas2-II 8.3 - 200-350 3.8 to 7.7
Quartz2-III 10.9 - 200-350 -0.7 to 5.3
Wolframite1-III 0.5 - 380-420 3.1 to 3.3
Cassiterite1-III - - 380-450 -
Fe-Li-micas3-III 8.7 - 380-450 8.5 to 9.1Stage IV: Banded quartz veinsQuartz4-IV 10.8 - 200-350 -0.8 to 5.2
Topaze4-VI 8.4 - 420-450 7.9 to 8.2PIAOTANG
Quartz1-I 11.6 - 160-200 -3.0 to 0.0
Wolframite1-I -3.0 - 200-270 -3.6 to -1.8
Cassiterite1-I - - 380-450 -
-
δD (‰VSMOW)fluid
calculated
Stage II: Fe-Li-micas veins
Stage III: W-Sn veins-59.2 to -55.2
-77.6 to -76.8
-71.5
-
-65.9 to -61.6Stage VI: Late phases
-
Stage I: Silicate-oxide
-53.6 to -50.5
-76.7 to -75.8
-69.6 to -57.9
PART 2 – Chapter 4
247
The scattering of Th and salinity values (Figure 52A and B) suggest the involvement of
four possible fluid end-member in each deposits. The data plot between a low-salinity low-
temperature end-member (A), an intermediate-salinity high-temperature end-member (B), a
high-salinity high-temperature end-member (C) and a high-salinity low-temperature end-
member (D). The continuum of data between the possible end-member suggest mixing trends
between (A) and (B), (B) and (C), and possibly (B)-(C) and (D) at Maoping and between (A)
and (D), and (C) and (D) at Piaotang.
The first end-member (A) is identified from quartz- and fluorite-hosted FIs. Qtz2-III in
contrast to other minerals of this FI study, display three-phase aquo-carbonic inclusions in
addition to the mainly observed two-phase aqueous FIs (Figure 51). This end-member is
characterized by low salinity (between 0 and 6 wt% NaCl equiv.) and homogenization
temperatures between 100 and 250 °C (Figure 52). Reconstructed PT conditions for trapping
using isochores and a very large range of hydrostatic gradients suggest temperatures of
emplacement of Qtz2-III and Qtz1-I between 150 and 300°C and associated pressure below 100
MPa for the (A) end-member (Figure 53). According to LA-ICPMS results, this end-member is
associated with lower Li/Na and K/Na ratios, low salinity, and low Li and K contents (below 100
and 1,000 ppm respectively). In the binary diagrams (Figure 55B and C), the extrapolation of
the (A) end-member to the most depleted Li and K contents do not reach the origin of the
diagram, implying a remaining Na content. The (A) end-member is also depleted in most
incompatible elements such as rare metals, Cs and Rb (Figure 54 and Figure 55) in
comparison to other mineral FIs.
Two other end-members called (B) and (C) can also be identified and are mostly
associated to ore minerals. They are defined as the two extremities of the trend formed by
microthermometric data of wolframite, cassiterite, topaz and fluorite at Maoping and cassiterite
at Piaotang. These trends are characterized by a nearly constant range of homogenization
temperature (270-350 °C), which is higher than what observed for the previous (A) end-
member (Figure 52). Values display a wide range of salinity values (from 5.0 to 12.0 wt.%
equiv. NaCl at Maoping and 2.0 to 7.0 wt.% equiv. NaCl at Piaotang). These two end-members
PART 2 – Chapter 4
248
are characterized by minerals where aqueous two-phase FIs were observed only.
Reconstructed PT conditions for trapping using isochores indicate temperatures of trapping
between 350 and 600°C and pressures of trapping between 20 and 300 MPa (Figure 53). The
(B) and (C) end-members are discriminated by their salinity: the (B) end-member represents
the low-salinity high-temperature end-member while (C) represents the high-salinity high-
temperature end-member (Figure 52). These end-members are both characterized by higher
Li/Na and K/Na contents (above 7,000, 100 and 1,000 ppm for Na, Li and K respectively).
Moreover, they show very low K/Rb ratios and an enrichment in incompatible elements such
as rare metals and Cs compared to the (A) end-member.
Therefore, it appears that FIs in the main gangue mineral (quartz) do not reflect either
wolframite- or cassiterite-forming fluids. Moreover, in the case of the Piaotang deposit,
wolframite-forming fluids seems to be distinct from cassiterite-forming fluids.
The last end-member (D) is identified through two-phase aqueous quartz-hosted FIs at
Maoping (Qtz4-IV) and wolframite- and fluorite-hosted FIs at Piaotang and is characterized by
homogenization temperatures equivalent to the (A) end-member and salinity similar to the (C)
end-member (Figure 52). Reconstructed PT conditions for trapping conditions using isochores
indicate temperatures between 150 and 400 °C and pressures below 150 MPa (Figure 53).
The (D) end-member is defined by intermediate Li/Na and K/Na ratios and incompatible
elements content compared to the (A) and (B)-(C) end-members (Figure 55).
It is noteworthy that, although Maoping and Piaotang do not share exactly the same
timing of end-members involvement as described by the paragenesis, the same four fluid types
seem to have been involved.
Moreover, it is remarkable that in every FIs analyzed from each deposits, tungsten as
well as other rare metals (Sn Nb, Ta) have been quantified. This observation demonstrates
that tungsten, in particular, is still present in the fluids at all stages without precipitating
systematically. Therefore, P-T-x conditions must have been varying through stages. From pre-
to post-mineralizing stages, the following parameters are varying: salinity, temperature, cation
ratios (Na, K) and gaseous content of FIs. As tungsten remains in the fluid during these
PART 2 – Chapter 4
249
contrasting conditions and do not precipitate at all stages, these parameters must not play a
major role in ore mineral crystallization. An alternative hypothesis would be that tungsten
saturation in the fluid was only reached during wolframite crystallization while tungsten was
preferentially incorporated into other mineral structure during other stages (e.g. cassiterite,
micas…).
5.2 Nature and origin of fluids
Major ore minerals in the Maoping and Piaotang deposits are characterized by
wolframite and cassiterite that mainly crystallize in association with quartz during one early
mineralization stage that follows the magmatic-hydrothermal transition (Legros et al., 2016 and
in press). Stable isotopes analyses (oxygen and hydrogen) allow us to distinguish three end-
members during the mineralizing stage among quartz and wolframite FIs data from both
deposits. Both wolframite and quartz display a mixing trend toward a meteoric end-member
(Figure 56D). This latter would likely represent the (A) end-member defined previously with
low salinity and low temperature. On the other hand, the high-temperature fluids involved in
the quartz and wolframite crystallization are characterized by two distinct δD values. The high
δD end-member, associated with quartz crystallization, is likely to represent the (B) end-
member while the low δD end-member, associated with wolframite crystallization, is likely to
be the (C) or (D) end-member (at Maoping and Piaotang respectively). Given this observation,
it is clear that quartz and wolframite did not coprecipitate in either Maoping or Piaotang
deposits.
Stable isotope compositions (oxygen and hydrogen) of both deposits, displayed in a binary
diagram (Figure 56D), tend to suggest a possible magmatic or metamorphic origin of the (B)
end-member while the (C) and (D) end-member (associated to wolframite crystallization) are
likely to represent a magmatic fluid.
On one hand, as quartz-wolframite-cassiterite succession seems to display a
consistent evolution in both deposits, the hypothesis of a high-temperature rare-metal common
end-member evolving in composition from quartz crystallization through wolframite and finally
PART 2 – Chapter 4
250
cassiterite precipitation, can be suggested. Moreover, the hypothesis of a magmatic fluid is
consistent with the high salinity, high temperature and rare metal content observed for these
end-members even if the Maoping and Piaotang deposits do not display such high
temperatures (>600 °C) and salinity as often observed in the case of magmatic fluids (Audétat
et al., 2000; Webster et al., 2004; Rickers et al., 2006). Indeed, the FIs observed in our study
reflect an intermediate composition which has already been diluted by the meteoric fluid ((A)
end-member).
On the other hand, few three-phase aquo-carbonic inclusions and traces of CO2 gases
were observed in quartz and cassiterite. The observation of such inclusions is usually
associated with a metamorphic origin as interpreted in multiple deposits from the Variscan belt
(Weisbrod, 1988; Norohna et al., 1992 and 1999; Vindel et al., 1995). This criteria was
established according to Papale et al. (2006) who demonstrated that low-pressure water-rich
granitic melts have very low-CO2 content by definition and thus, could not provide for these
gas-rich fluids. Yet, magmatic fluids can also host CO2 gases. Solubility of CO2 in silicate melts
is usually one magnitude order lower than H2O. Thus, CO2 will preferentially partition into the
fluid phase, decreasing the CO2/H2O ratio of the remaining melt (Yoshimura, 2015). In that
case, the rare abundance of CO2-rich fluids during quartz crystallization could still be of
magmatic origin as noticed by Vigneresse (2006). Moreover, no relation with the host rock was
observed in the mine. Therefore, both (B) and (C)-(D) end-members crystallizing quartz and
ore minerals respectively would be of magmatic origin. In that case, some parameters of the
evolving magmatic fluid must be changing between the quartz and ore mineral crystallization.
Wolframite at the Maoping and Piaotang deposit crystallizes at different ranges of
temperatures and do not show any gas content in FIs. Therefore, temperature as well as the
presence of gas does not play an important role for the metal transporting capacities of the
fluid. Moreover, comparing the Maoping and Piaotang (B) and (C)-(D) end-members, the
salinity is also fluctuating.
In our case, the difference between the quartz and ore mineral crystallizing fluids could
be explained by the differentiation of the granite. Indeed, the decrease of the K/Rb ratio is a
PART 2 – Chapter 4
251
good indicator of differentiation (Shaw, 1968; Klemm et al., 2008; Luders et al., 2009). In our
case, quartz K/Rb ratios are significantly higher than ratios observed for ore mineral FIs (Figure
55D). Moreover, FIs in ore minerals show higher content in incompatible elements as Cs and
rare metals (Figure 54 and Figure 55) that could have been enriched in the residual melt during
differentiation. The decreasing δD range between quartz and ore mineral FIs could be
explained by a degassing of water from the magma (Taylor et al., 1983; France-Lanord et al.,
1988). Moreover, FIs in quartz display two different contents (aqueous and aquo-carbonic)
with two different vapor fractions (from 10 to 95 vol %) but similar salinity and temperature.
Unmixing could also explain the vapor separation process, and thus give an alternative
explanation to this low δD remaining ore-crystallizing fluid (Koděra et al., 2005; Yoo et al.,
2010; Wei et al., 2012).
In both deposits, late stages are associated with fluorine and more or less metals
depending on the source. Those stages are associated with a new heat input between 200 °C
and more than 400 °C ((D) end-member). This input could be due to the supposed hidden
second intrusion proposed by Legros et al. (2016) at Maoping. K/Rb vs Cs binary diagram of
LA-ICPMS FI data of Qtz4-IV at Maoping and fluorite at Piaotang show that this fluid would be
a new magmatic fluid from a low differentiated intrusion. However, this intrusion was described
as a peralkaline source providing for the Nb-Ta-Zr-REE mineralization and no FI data this far
can infirm this hypothesis besides an abnormal amount of calcium in FIs.
5.3 Processes involved in W-Sn deposits
5.3.1 Fluid evolution in the Maoping and Piaotang deposits
This study is focused on the early crystallization of hydrothermal veins after the
magmatic-hydrothermal transition.
The emplacement starts under hydrostatic conditions, ca. 150 and 250 °C and pressure
below 100 MPa. The granitic melt is providing fluids with low metal content (because of early
differentiation) that form the veins ((B) end-member). Temperature and pressure are enforced
by the granite emplacement as well as chloride complexes in fluids. The emplacement of the
PART 2 – Chapter 4
252
granite in the crust, mobilizes external fluids (meteoric (A) fluid equilibrated with the
surroundings) which start mixing with early magmatic fluids ((B) end-member). Evidences of
unmixing of the early magmatic fluid observed in quartz FIs as well as degassing explains the
low δD in the residual fluid observed in ore minerals ((C) end-member in Maoping and (D) end-
member in Piaotang). Through the crystallization and differentiation of the melt, magmatic
fluids are becoming predominant, involving higher temperature, higher salinity and higher
metal content associated with the crystallization of ore minerals.
At the Maoping deposit, another type of vein (banded quartz veins, stage IV) crystallizes
during cooling under the same conditions. FIs in Qtz4-IV do not provide any suspicion of any
more changes in the system at that time. Ore components are still present in the fluid ((D) end-
member) but do not reach precipitation conditions. As wolframite do not crystallize in the
following stage but cassiterite does, the limiting factor could be the available amount of Fe and
Mn leached from the host rocks.
5.3.2 Comparison to other deposits from the Nanling Range and worldwide
FI studies have been performed on eleven deposits from the Jiangxi and Hunan
provinces from the Nanling Range (as described previously) and many deposits worldwide
(e.g. Norohna et al., 1992; Luders et al., 2009; Ni et al., 2015). Aqueous inclusions are
predominantly observed but early quartz FIs often show varying amounts of gases (mostly
CO2) as observed in our case (e.i. Norohna et al., 1992; Wei et al., 2012; Ni et al., 2015;
Chicharro et al., 2016). In the literature, those FIs often show variable proportions of the vapor
fraction that could indicate boiling (not observed in our case). This processes was however
described as not decisive for W-Sn mineralization by demonstrating the effects of boiling on
δ18O isotopic composition at different temperatures (Wei et al., 2012, Wei et al., 2017) and was
in fact, never observed in wolframite nor cassiterite.
Microthermometric data from the literature, as well as our study, define different
conditions of trapping of gangue and W-Sn minerals (Wei et al., 2012; Ni et al., 2015) with
higher trapping temperature and salinity associated with ore fluids. Here, we demonstrate for
PART 2 – Chapter 4
253
the first time that these conditions and mixing process are maintained during post-mineralizing
stages while tungsten is still present in the fluids. Our stable isotope study (oxygen and
hydrogen) agrees with proposed origins of fluids: magmatic and meteoric (Beuchat et al., 2004;
Carruzzo et al., 2004; Wei et al., 2012; Liu et al., 2002; Wang et al., 2012; Gong et al., 2015;
Feng et al., 2012). The trace element content of FIs permitted us to give some complementary
information on the meteoric end-member by showing an equilibration of the fluid with the
surroundings prior to mixing and permitted to propose magma differentiation as a prequisite
process involved in the formation of W-Sn in this region. Such processes were already
proposed in some few deposits (e.g. Audétat et al., 2000; Luders et al., 2009). Finally, all
analytical methods raise the evidence of similarities between the Maoping and Piaotang
deposits. Such similarities as well as similar timing of mineral phases, must involve regional
fluid processes associated with this giant granitic province emplaced between 160 and 150
Ma.
6. Conclusion
Microthermometry, Raman spectrometry, LA-ICPMS and stable isotope (O and H)
analysis of fluid inclusions from the Maoping and Piaotang deposits from the Nanling Range
allow us to complement our knowledge on processes involved in W-Sn deposit of the richest
region of the world:
- Quartz and ore-bearing minerals of early mineralizing stages indicate mixing
processes between a magmatic fluid exsolution from the associated granite and a meteoric
fluid that already interacted with the surrounding rocks. Post-mineralizing stages share these
conditions without crystallizing any ore-bearing minerals.
- The timing of crystallization of ore-bearing minerals (wolframite and cassiterite) in
early mineralization stages depends on the differentiation of the granite. Early fluids
crystallizing quartz after the magmatic-hydrothermal transition will be more depleted in metals
PART 2 – Chapter 4
254
compared to later fluids, exsolved from a melt enriched in incompatible elements as metals.
Therefore, quartz crystallizing fluids do not reflect ore-bearing fluids.
- Both deposits show a second heat input postponing the mineralizing stage where
other type of mineralizations occur, implying a second unknown event at the regional scale
which was never described before. Tungsten is still present in the fluid as these stages but do
not precipitate wolframite, implying other parameters than mixing (as usually proposed)
involved in ore-bearing minerals crystallization.
- Such similarities between all mineralogical and fluid inclusion studies of W-Sn
deposits from the same Nanling Range and timing, point to regional fluid processes involved
during the emplacement of the giant associated granitic province between 160 and 150 Ma.
Finally, this study shows that the world-class deposits from the Nanling Range are
complex polyphased deposits where differentiation of the magma source of ore minerals is the
only decisive parameter of wolframite and cassiterite crystallization.
PART 2 – Chapter 4
255
References
Allan, M.M., Yardley, B.W.D., Forbes, L.J., Shmulovich, K.I., Banks, D.A., Shepherd, T.J.,
2005. Validation of LA-ICP-MS fluid inclusion analysis with synthetic fluid inclusions.
American Mineralogist 90, 1767–1775.
Anderko, A. and Pitzer, K.S., 1993a. Equation-of-state representation of phase equilibria and
volumetric properties of the system NaCl-H2O above 573 K. Geochimica et
Cosmochimica Acta 57, 1657-1680.
Anderko, A. and Pitzer, K.S., 1993b. Phase equilibria and volumetric properties of the systems
KCl-H2O and NaCl-KCl-H2O above 573 K: Equation of state representation.
Geochimica et Cosmochimica Acta 57, 4885-4897.
Archer, D.G., 1992. Thermodynamic properties of the NaCl+ H2O system. II. Thermodynamic
properties of NaCl (aq), NaCl⋅ 2H2 (cr), and phase equilibria. Journal of Physical and
Chemical Reference Data 21, 793-829.
Audétat, A., Günther, D., Heinrich, C.A., 2000. Magmatic-hydrothermal evolution in a
fractionating granite: insights with LA-ICP-MS analysis of fluid inclusions. Science 279,
2091-2094.
Bakker, R.J. and Diamond, L.W., 2006. Estimation of volume fractions of liquid and vapor
phases in fluid inclusions, and definition of inclusion shapes. American Mineralogist 91,
635-657.
Bakker, R. J. and Jansen, J. B. H., 1993. Calculated fluid evolution path versus fluid inclusion
data in the COHN system as exemplified by metamorphic rocks from Rogaland, south‐
west Norway. Journal of Metamorphic Geology 11, 357-370.
Bakker, R.J., 1997. Clathrates: Computer programs to calculate fluid inclusion V-X properties
using clathrate melting temperatures. Computers & Geosciences, 23, 1-18.
Bakker, R.J., 2003. Package FLUIDS 1. Computer programs for analysis of fluid inclusion data
and for modelling bulk fluid properties Chemical Geology 194, 3-23.
Bebout, G.E., Cooper, D.C., Bradley, A.D., Sadofsky, S.J., 1999. Nitrogen isotope record of
fluid-rock interactions in the Skiddaw aureole and granite, English Lake district.
American Mineralogist 84, 1495-1505.
Beuchat, S., Moritz, R., Pettke, T., 2004. Fluid evolution in the W–Cu–Zn–Pb San Cristobal
vein, Peru: fluid inclusion and stable isotope evidence. Chemical Geology 210, 201-
224.
PART 2 – Chapter 4
256
Bigeleisen, J., Perlman, M.L., Prosser, H.C., 1952. Conversion of hydrogenic materials to
hydrogen for isotopic analysis. Analytical Chemistry 24, 1356-1357.
Blaise, T., Tarantola, A., Cathelineau, M., Boulvais, P., Techer, I., Rigaudier, T., Boiron, M.C.,
Pierron, O., Landrein, P., 2015. Evolution of porewater composition through time in
limestone aquifers: Salinity and D/H of fluid inclusion water in authigenic minerals
(Jurassic of the eastern Paris Basin, France). Chemical Geology 417, 210-227.
Blamart, D., 1991. Les concentrations tungstifères et stannifères : caractérisation isotopique
des fluides minéralisateurs, sur l'exemple du gisement Sn-W de Walmès. Unpublished
Doctoral Thesis, INPL (Nancy, France).
Bodnar, R.J., 1993. Revised equation and table for determining the freezing point depression
of H2O-NaCl solutions. Geochimica et Cosmochimica Acta 57, 683-684.
Bodnar, R.J., Vityk, M.O., 1994. Interpretation of microthermometric data for H2O-NaCl fluid
inclusions. In: De Vivo, B. and Frezzotti, M.L., Eds., Fluid Inclusions in Minerals:
Methods and Application, Pontignsno-Siena, p.117-130.
Burke, E.A., 2001. Raman microspectrometry of fluid inclusions. Lithos 55, 139-158.
Burnard, P.G. and Polya, D.A. 2004. Importance of mantle derived fluids during granite
associated hydrothermal circulation: He and Ar isotopes of ore minerals from
Panasqueira. Geochimica et Cosmochimica Acta 68, 1607-1615.
Burnham, C.W., 1979. Magmas and hydrothermal fluids. In: Barnes, H.L. (Ed.), Geochemistry
of Hydrothermal ore Deposits. John Wiley and Sons, New York, pp. 71–136.
Cai, M.H., Mao, J.W., Liang, T., Pirajno, F., Huang, H.L., 2007. The origin of the Tongkeng-
Changpo tin deposit, Dachang metal district, Guanxi, China: clues from fluid inclusions
and He isotope systematics. Mineralium Deposita 42, 613-626.
Candela, P.A., 1997. A review of shallow, ore-related granites: textures, volatiles and ore
metals. Journal of Petrology 38, 1619–1633.
Cao, X. F., Lü, X. B., He, M. C., Niu, H., Du, B. F., Mei, W., 2009. An infrared microscope
investigation of fluid inclusions in coexisting quartz and wolframite: a case study of
Yaogangxian quartz-vein wolframite deposit. Mineralium Deposita 28, 611-620.
Carignan, J., Hild, P., Mevelle, G., Morel, J., Yeghicheyan, D., 2001. Routine analyses of trace
elements in geological samples using flow injection and low pressure on‐line liquid
chromatography coupled to ICP‐MS: a study of geochemical reference materials BR,
DR‐N, UB‐N, AN‐G and GH. Geostandards and Geoanalytical Research 25, 187-198.
PART 2 – Chapter 4
257
Carruzzo, S., Kontak, D.J., Clarke, D.B., Kyser, T.K., 2004. An integrated fluid–mineral stable-
isotope study of the granite-hosted mineral deposits of the New Ross area, South
Mountain Batholith, Nova Scotia, Canada: evidence for multiple reservoirs. The
Canadian Mineralogist 42, 1425-1441.
Casanova, V., Kouzmanov, K., Audétat, A., Wälle, M., Ubrig, N., Ortelli, M., Fontboté, L.,
submitted, Fluid inclusion studies in opaque ore minerals: II. A comparative study of
synthetic fluid inclusions hosted in quartz and opaque minerals. Economic Geology,
submitted.
Charvet, J., 2013. The Neoproterozoic-Early Paleozoic tectonic evolution of the South China
Block: an overview. Journal of Asian Earth Sciences 74, 198-209.
Charvet, J., Shu, L-S., Faure, M., Choulet, F., Wang, B., Lu, H-F., Le Breton, N., 2010.
Sructural development of the Lower Palaeozoic belt of South China: genesis of an
intracontinental orogeny. Journal of Asian Earth Sciences 39, 309-330.
Chen, Z.S., Zhang, L.G., 1990. Hydrogen and oxygen isotope study on altered rocks and it’s
geological significance: with the example of Xihuashan tungsten ore deposit (in
Chinese with English abstract). Contributions to Geology and Mineral Resources
Research 5, 69-79.
Chicharro, E., Boiron, M. C., López-García, J. Á., Barfod, D. N., Villaseca, C., 2016. Origin,
ore forming fluid evolution and timing of the Logrosán Sn–(W) ore deposits (Central
Iberian Zone, Spain). Ore Geology Reviews 72, 896-913.
Duan, Z., Møller, N., Weare, J. H., 1992. An equation of state for the CH4-CO2-H2O system:
II. Mixtures from 50 to 1000 C and 0 to 1000 bar. Geochimica et Cosmochimica Acta
56, 2619-2631.
Duan, Z., Møller, N., Weare, J.H., 1995. Equation of state for the NaCl-H2O-CO2 system:
prediction of phase equilibria and volumetric properties. Geochimica et Cosmochimica
Acta 59, 2869-2882.
Dublyansky, Y. V., Spötl, C., 2009. Hydrogen and oxygen isotopes of water from inclusions in
minerals: design of a new crushing system and on‐line continuous‐flow isotope ratio
mass spectrometric analysis. Rapid Communications in Mass Spectrometry 23, 2605-
2613.
Feng, C., Zeng, Z., Zhang, D., Qu, W., Du, A., Li, D., She, H., 2011. SHRIMP zircon U–Pb and
molybdenite Re–Os isotopic dating of the tungsten deposits in the Tianmenshan–
Hongtaoling W–Sn orefield, southern Jiangxi Province, China, and geological
implications. Ore Geology Reviews 43, 8-25.
PART 2 – Chapter 4
258
Feng, C.Y., Wang, S., Zeng, Z.L., Zhang, D.H., Li, D.X., She, H.Q., 2012. Fluid inclusion and
chronology studies of Baxiannao mineralized fractured zone-type tungsten polymetallic
deposit, southern Jiangxi Province, China. Acta Petrologica Sinica 28, 52-64 (in
Chinese with English abstract).
France-Lanord, C., Sheppard, S.M., Le Fort, P., 1988. Hydrogen and oxygen isotope variations
in the High Himalaya peraluminous Manaslu leucogranite: evidence for heterogeneous
sedimentary source. Geochimica et Cosmochimica Acta 52, 513-526.
Giuliani, G., Li, Y.D., Sheng, T.F., 1988. Fluid inclusion study of Xihuashan tungsten deposit
in the southern Jiangxi province, China. Mineralium Deposita 23, 24–33.
Goldstein, R.H. and Reynolds, T.J., 1994. Systematics of fluid inclusions in diagenetic
minerals: SEPM Short Course, v. 31, p. 199.
Gong, X. D., Yan, G. S., Ye, T. Z., Zhu, X. Y., Li, Y. S., Zhang, Z. H., Jia, W. B., Yao, X. F.,
2015. A study of ore-forming fluids in the Shimensi Tungsten Deposit, Dahutang
Tungsten Polymetallic Ore Field, Jiangxi Province, China. Acta Geologica Sinica 89,
822-835.
Guillong, M., Meier, D.L., Allan, M., Heinrich, C.A., Yardley, B.W.D., 2008. SILLS: A Matlab-
based program for the reduction of laser ablation ICP-MS data of homogeneous
materials and inclusions. In: Sylvester P (ed.), Laser Ablation ICP–MS in the Earth
Sciences: Current Practices and Outstanding Issues. Mineralogical Association of
Canada Short Course Series 40, pp. 328–333.
Günther, D., Frischknecht, R., Heinrich, C.A., Kahlert, H.J., 1997. Capabilities of an argon
fluoride 193 nm excimer laser for laser ablation inductively coupled plasma mass
spectrometry microanalysis of geological materials. Journal of Analytical Atomic
Spectrometry 12, 939-944.
Guo, C., Chen, Y., Zeng, Z., Lou, F., 2012. Petrogenesis of the Xihuashan granites in
southeastern China: Constraints from geochemistry and in-situ analyses of zircon U Pb
Hf O isotopes. Lithos 148, 209-227.
Hu, R.Z., Bi, X.W., Jiang, G.H., Chen, H.W., Peng, J.T., Qi, Y.Q., Wu, L.Y., Wei, W.F., 2012.
Mantle-derived noble gases in ore-forming fluids of the granite-related Yaogangxian
tungsten deposit, Southeastern China. Mineralium Deposita 47, 623-632.
Hua, R., Chen, P., Zhang, W., Lu, J., 2005. Three large-scale metallogenic events related to
the Yanshanian Period in Southern China. In: Mineral Deposit Research: Meeting the
Global Challenge. Springer Berlin, Heidelberg, 401-404.
PART 2 – Chapter 4
259
Jochum, K.P., Weis, U., Stoll, B., Kuzmin, D., Yang, Q., Raczek, I., Jacob, D.E., Stracke, A.,
Birbaum, K., Frick, D.A., Gunther, D., Enzweiler, J., 2011. Determination of reference
values for NIST SRM 610-617 glasses following ISO guidelines. Geostandards and
Geoanalytical Research 35, 397-429.
Kamenetsky, V.S., Naumov, V.B., Davidson, P., van Achtenbergh, E., Ryan, C.G., 2004.
Immiscibility between silicate magmas and aqueous fluids: a melt inclusion pursuit into
the magmatic-hydrothermal transition in the Omsukchan Granite (NE Russia).
Chemical Geology 210, 73-90.
Klemm, L. M., Pettke, T., Heinrich, C. A., 2008. Fluid and source magma evolution of the
Questa porphyry Mo deposit, New Mexico, USA. Mineralium Deposita, 43, 533.
Koděra, P., Lexa, J., Rankin, A.H., Fallick, A.E., 2005. Epithermal gold veins in a caldera
setting: Banská Hodruša, Slovakia. Mineralium Deposita 39, 921–943.
Lach, P., Mercadier, J., Dubessy, J., Boiron, M.C., Cuney, M., 2013. In situ quantitative
measurement of rare earth elements in uranium oxides by laser ablation-inductively
coupled plasma-mass spectrometry. Geostandards and Geoanalytical Results 37, 1-
20.
Legros, H., Marignac, C., Mercadier, J., Cuney, M., Richard, A., Wang, R-C., Charles, N.,
Lespinasse, M-Y., 2016. Detailed paragenesis and Li-mica compositions as recorders
of the magmatic-hydrothermal evolution of the Maoping W-Sn deposit (Jiangxi, China).
Lithos 264, 108-124.
Legros, H., Marignac, C., Tabary, T., Mercadier, J., Richard, A., Cuney, M., Wang, R-C.,
Charles, N., Lespinasse, M-Y., in press. The ore-forming magmatic-hydrothermal
system of the Piaotang W-Sn deposit (Jiangxi, China) as seen from Li-mica
geochemistry. American Mineralogist, in press. https://doi.org/10.2138/am-2018-6196
Leisen, M., Boiron, M.C., Richard, A., Dubessy, J., 2012. Determination of Cl and Br
concentrations in individual fluid inclusions by combining microthermometry and LA-
ICPMS analysis: Implications for the origin of salinity in crustal fluids. Chemical geology
330-331, 197-206.
Li, Z-X., Qiu, J-S., Yang, X-M., 2014. A review of the geochronology and geochemistry of Late
Yanshanian (Cretaceous) plutons along the Fujian coastal area of southeastern China:
Implications for magma evolution related to slab break-off and rollback in the
Cretaceous. Earth Sciences Reviews 128, 232–248.
Li, Z-X., Wartho, J-A., Occhipinti, S., Zhang, C-L., Li, X-H., Wang, J., Bao, C-M., 2007. Early
history of the eastern Sibao Orogen (South China) during the assembly of Rodinia: new
PART 2 – Chapter 4
260
mica 40Ar/39Ar dating and SHRIMP U-PB detrital zircon provenance constraints.
Precambrian Research 159, 79-94.
Liu, J.Q., Wang, X.W., Zeng, Y.S., Wang, X.D., 2002. Xihuashan granite and evolution of ore-
forming fluid of tungsten-tin-beryllium ore field. Geology and Mineral Resources of
South China 3, 91-96.
Longerich, H.P., Jenner, G.A., Fryer, B.J., Jackson, S.E., 1990. Inductively coupled plasma-
mass spectrometric analysis of geological samples: a critical evaluation based on case
studies. Chemical Geology 83, 105-118.
Longerich, H.P., Jackson, S.E., Günther, D., 1996. Laser ablation inductively coupled plasma
mass spectrometric transient signal data acquisition and analyte concentration
calculation. Journal of Analytical Atomic Spectrometry 11, 899-904.
Lüders, V., Romer, R. L., Gilg, H. A., Bodnar, R. J., Pettke, T., Misantoni, D., 2009. A
geochemical study of the Sweet Home Mine, Colorado Mineral Belt, USA: hydrothermal
fluid evolution above a hypothesized granite cupola. Mineralium deposita, 44, 415.
Mao, J.W., Xie, G.Q., Guo, C.L., Chen, Y.C., 2007. Large-scale tungsten–tin mineralization in
the Nanling region, South China: metallogenic ages and corresponding geodynamic
processes. Acta Petrologica Sinica 23, 2329-2338 (in Chinese with English abstract).
Mao, X-L., Wang, Q., Liu, S., Xu, M., Wang, L., 2012. Effective elastic thickness and
mechanical anisotropy of South China and surrounding regions. Tectonophysics 550-
553, 47–56.
Marignac, C. and Cathelineau, M., 2009. The nature of ore-forming fluids in peri-batholitic Sn-
W deposits and a classification. In: Williams et al. eds, Smart science for exploration
and mining, Proceedings Xth Biennial SGA Meeting, Townsville: 245-247.
Ni, P., Wang, X.D., Wang, G.G., Huang, J.B., Pan, J.Y., Wang, T.G., 2015. An infrared
microthermometric study of fluid inclusions in coexisting quartz and wolframite from
Late Mesozoic tungsten deposits in the Gannan metallogenic belt, South China. Ore
Geological Reviews 65, 1062-1077.
Noronha, F., Doria, A., Dubessy, J., Charoy, B., 1992. Characterization and timing of the
different types of fluids present in the barren and ore veins of the W-Sn deposit of
Panasqueira, Central Portugal. Mineralium Deposita 27, 72-79.
Noronha, F., Vindel Catena, E., López García, J.Á., Dória, A., García, E., Boiron, M.C.,
Cathelineau, M., 1999. Fluids related to tungsten ore deposits in northern Portugal and
Spanish central system: a comparative study. Revista - Sociedad Geologica de Espana
12, 397-403.
PART 2 – Chapter 4
261
Ortelli, M., Kouzmanov, K., Wälle, M., Ubrig, N., Casanova, V., submitted, Fluid inclusion
studies in opaque ore minerals: I. Trace element content and physical properties of ore
minerals controlling textural features in transmitted near-infrared light microscopy.
Economic Geology, submitted.
Papale, P., Moretti, R., Barbato, D., 2006. The compositional dependence of the saturation
surface of H2O+CO2 fluids in silicate melts. Chemical Geology 229, 78-95.
Pirajno, F., 2009. Hydrothermal Processes and Mineral Systems. Springer (1250 pp.).
Polya, D.A., Foxford, K.A., Stuart, F., Boyce, A., Fallick, A.E., 2000. Evolution and paragenetic
context of low δD hydrothermal fluids from the Panasqueira W-Sn deposit, Portugal:
New evidence from microthermometric, stable isotope, noble gas and halogen
analyses of primary fluid inclusions. Geochimica et Cosmochimica Acta 64, 3357-3371.
Rickers, K., Thomas, R., Heinrich, W., 2006. The behavior of trace elements during the
chemical evolution of the H2O-, B-, and F-rich granite-pegmatite-hydrothermal system
at Ehrenfriedensdorf, Germany: a SXRF study of melt and fluid inclusions. Mineralium
Deposita 41, 229-245.
Roedder, E., 1984. Fluid Inclusions. Reviews in Mineralogy 12. Michigan. Ed. Mineralogical
Society America, 644 p.
Schrötter, H.W., and Klöckner, H.W., 1979. Raman scattering cross sections in gases and
liquids. In Raman spectroscopy of gases and liquids, 123-166. Springer Berlin
Heidelberg.
Shaw, D. M., 1968. A review of K-Rb fractionation trends by covariance analysis. Geochimica
et Cosmochimica Acta, 32, 573-601.
Sheppard, S.M.F., 1994. Stable isotope and fluid inclusion evidence for the origin and evolution
of Hercynian mineralizing fluids. In: Seltmann R, Kämpf H, Möller P (eds) Metallogeny
of collisional orogens. Czech Geological Survey, Prague, pp. 49-60.
Smith, M., Banks, D.A., Yardley, B.W.D., Boyce, A., 1996. Fluid inclusion and stable isotope
constraints on the genesis of the Cligga Head Sn-W deposit, S.W. England. European
Journal of Mineralogy 8, 961-974.
Sun, W.D., Yang, X.Y., Fan, W.M., Wu, F.Y., 2012. Mesozoic large scale magmatism and
mineralization in South China: preface. Lithos 150, 1-5.
Taylor, B.E., Eichelberger, J.C., Westrich, H.R., 1983. Hydrogen isotopic evidence of rhyolitic
magma degassing during shallow intrusion and eruption. Nature 306, 541-545.
PART 2 – Chapter 4
262
Thomas, R., Förster, H.J., Rickers, K., Webster, J., 2005. Formation of extremely F-rich
hydrous melt fractions and hydrothermal fluids during differentiation of highly evolved
tin-granite magmas: a melt-fluid inclusion study. Contributions to Mineralogy and
Petrology 148, 582-641.
USGS, 2017. Tungsten. Mineral Commodity Summaries. 180-181.
Vigneresse, J.L., 1995. Crustal regime of deformation and ascent of granitic magma.
Tectonophysics 249, 187-202.
Vigneresse, J.L., 2006. Element Mobility in Melts during Successive Intrusions of Crustal‐
derived Magmas and Sn‐W Mineralization. Resource Geology 56, 293-314.
Vindel, E., Lopez, J.A., Boiron, M-C., Cathelineau, M., Prieto, A.C., 1995. PV- T-X-fO2
evolution from wolframite to sulphide depositional stage in intragranitic W-veins. An
example from the Spanish Central System. European Journal of Mineralogy 7, 675-
688.
Wang, Z.Q., Yin, C.Y., Gao, L.Z., Tang, F., Liu, Y.Q., Liu, P.J., 2006. The character of the
chemical index of alteration and discussion of subdivision and correlation of the
Nanhua System in Yichang area. Geological Review 52, 577-585.
Wang, X-D., Ni, P., Jiang, S-Y., Zhao, K-D., Wang, T-G., 2009. Origin of ore-forming fluid in
the Piaotang tungsten deposit in Jiangxi Province: Evidence from helium and argon
isotopes. Chinese Science Bulletin 55, 628-634.
Wang, Q.Y., Lu, Y.F., Chen, Z.H., Peng, X.L., Xiong, X.F., 2012. Fluid inclusion characteristic
and its geological implication of the Taoxikeng tungsten deposit, southern Jiangxi
Province. Geology and Mineral Resources of South China 1, 006.
Wang, Y-J., Fan, W-M., Zhang, G-W., Zhang, Y-H., 2013. Phanerozoic tectonics of the South
China Block: key observations and controversies. Gondwana Research 23, 1273-1305.
Webster, J.D., Thomas, R., Förster, H.J., Seltmann, R., Tappen, C., 2004. Geochemical
evolution of halogen-enriched, granite magmas and mineralising fluids of the Zinnwald
tin-tungsten mining district, Erzgebirge, Germany. Mineralium Deposita 39, 452-472.
Wei, W., Hu, R., Bi, X., Peng, J., Su, W., Song, S., Shi, S., 2012. Infrared microthermometric
and stable isotopic study of fluid inclusions in wolframite at the Xihuashan tungsten
deposit, Jiangxi province, China. Mineralium Deposita 47, 589-605.
Wei, W-F., Yan, B., Shen, N-P., Liu, L., Zhang, Y., Xiang, X-K., 2017. Muscovite 40Ar/39Ar
age and H-O-S isotopes of the Shimenshi tungsten deposit (Northern Jiangxi Province,
South China) and their metallogenic implications. Minerals 7, 162.
PART 2 – Chapter 4
263
Weisbrod, A., 1988. Caractères généraux des phases fluides dans les indices et gisements de
tungstène et d'étain. In: Johan Z, Ohnenstetter D (eds), Gisements métallifères dans
leur contexte géologique, Documents du BRGM 158-1: 9-14.
Wilkinson, J.J., 1990. The role of metamorphic fluids in the development of the Cornubian
Orefield: fluid inclusion evidence from south Cornwall. Mineralogical Magazine 54, 219-
230.
Wong, W.W., Cabreara, M.P., Klein, P.D., 1984. Evaluation of a dual mass spectrometer
system for rapid simultaneous determination of hydrogen-2/hydrogen-1 and oxygen-
18/oxygen-16 ratios in aqueous samples. Analytical Chemistry 56, 1852–1858.
Xi, B.B., Zhang, D.H., Zhou, L.M., 2007. Magmatic evolutions of several granite plutons related
to Sn (W) mineralization in the Nanling region, China. Geological Bulletin China 26,
1591-1599 (in Chinese with English abstract).
Xi, B., Zhang, D., Zhou, L., Zhang, W., Wang, C., 2008. Characteristics of Ore forming Fluid
Evolution in Dajishan Tungsten Deposit, Quannan County, Jiangxi. Acta Geologica
Sinica 82, 956-966.
Xiong, Y.Q., Shao, Y.J., Zhou, H.D., Wu, Q.H., Liu, J.P., Wei, H.T., Zhao, R.C., Cao, J.Y.,
2017. Ore-forming mechanism of quartz-vein-type W-Sn deposits of the Xitian district
in SE China: Implications from the trace element analysis of wolframite and
investigation of fluid inclusions. Ore Geology Reviews 83, 152-173.
Xuexin, S., Jingkai, Z., 1990. Study of fluid inclusions of the Shizhuyuan-Yejiwei W-Sn-Mo-Bi-
polymetallic deposit in southern Hunan. Mineral Deposits 4, 004.
Yoo, B., Lee, H., White, N., 2010. Mineralogical, fluid inclusion, and stable isotope constraints
on mechanisms of ore deposition at the Samgwang mine (Republic of Korea) - a
mesothermal, vein-hosted gold–silver deposit. Mineralium Deposita 45, 161-187.
Yoshimura, S., 2015. Diffusive fractionation of H2O and CO2 during magma degassing.
Chemical Geology 411, 172-181.
Zaw, K., Peters, S. G., Cromie, P., Burrett, C., Hou, Z., 2007. Nature, diversity of deposit types
and metallogenic relations of South China. Ore Geology Reviews 31, 3-47.
Zeng, Y., Liu, J., Zhu, Y., 2002. Short-chain carboxylates in high-temperature ore fluids of W-
Sn deposits in south China. Geochemical Journal 36, 219-234.
Zeng, Z.L., Zhu, X.P., Xu, J.X., 2007. Tungsten Reserves of Southern Jiangxi Province and
Prospecting Outlook. China Tungsten Industry 6, 16-24. (in Chinese with English
abstract)
PART 2 – Chapter 4
264
Zhang, D.Q., Feng, C.Y., Li, D.X., Chen, Y.C., Zeng, Z.L., 2012. Fluid Inclusions
Characteristics and Ore Genesis of Taoxikeng Tungsten and Tin Deposit in Chongyi
County, Jiangxi Province. Journal of Jilin University (Earth Science Edition) 42, 374-
383.
Zhang, R., Lu, J., Lehmann, B., Li, C., Li, G., Zhang, L., Sun, W., 2017. Combined zircon and
cassiterite U–Pb dating of the Piaotang granite-related tungsten–tin deposit, southern
Jiangxi tungsten district, China. Ore Geology Reviews 82, 268-284.
Zheng, Y.F., 1991. Calculation of oxygen isotope fractionation in metal oxides. Geochimica et
Cosmochimica Acta 55, 2299-2307.
Zheng, Y. F., 1993a. Calculation of oxygen isotope fractionation in hydroxyl-bearing silicates.
Earth and Planetary Science Letters 120, 247-263.
Zheng, Y.F., 1993b. Calculation of oxygen isotope fractionation in anhydrous silicate minerals.
Geochimica et Cosmochimica Acta 57, 1079-1079.
Zhou, Y.Z., Gao, C.S., Hong, Y.L., Han, Z.X., Wen, L.H., 2010. Diagenesis-mineralizatio
process and mineralization models of Xihuashan granite. China Tungsten Industry 25,
12-1 (in Chinese with English abstract).
PART 3
265
Part 3 – Geochronology
Preamble
In the Nanling metallogenic province, most W-Sn deposits are associated to Jurassic-
Cretaceous granitoids that are believed to be the source of the metals. The 160-150 Ma period
appears to be the peak of this magmatic-related “W-Sn event”. A lot of dating approaches have
been performed on these deposits, on the granites but also on greisen and minerals of the
veins. However, taking the case of few deposits, the relation and timing between the granite
and veins crystallization stays ambiguous. A recent model was recently published by Wang et
al. (2016), indicating that these veins belong to a much later undefined event at ca. 130 Ma
coevally to the crystallization of muscovite granites. Yet, very few direct dating have been
performed on minerals from the veins. The major problem lies in the lack of adequate
standards to perform in situ dating analysis of minerals such as wolframite (W), cassiterite (Sn)
and columbo-tantalite (Nb-Ta). Fortunately, wolframite and columbo-tantalite are good
candidates for ID-TIMS dating but cassiterite remains difficult to dissolve. However, some few
article are recently developing methods of cassiterite dating by LA-ICPMS (i.e. Che et al.,
2015). Chapter 5 is dedicated to the application of multiple dating approaches (Ar-Ar on micas,
U-Pb on wolframite and U-Pb on xenotimes). The aim of this chapter is to provide the first age
on wolframite for the richest W-Sn province in the world and discuss the age of this “W-Sn”
event. Chapter 6 is focused on analytical developments through a collaborative project
dedicated to define new standards for in situ direct dating. This chapter is dedicated to
columbo-tantalite, using ID-TIMS and SIMS techniques.

PART 3 – Chapter 5
267
Chapter 5 - Multiple hydrothermal pulses in the Nanling metallogenic belt:
Constraints from the W-Sn Maoping deposit (Jiangxi, China)
Article in preparation for Ore Geology Reviews
Hélène Legros a,b,*, Julien Mercadier a, Rolf L. Romer c, Marc Poujol d, Matthieu Harlaux
a,e, Alfred Camacho f, Christian Marignac a,g, Michel Cuney a, Ru-Cheng Wang h, Nicolas
Charles b, Marc-Yves Lespinasse a
a Université de Lorraine, CNRS, CREGU, GeoRessources, Boulevard des Aiguillettes B.P. 70239, F-54506 Vandoeuvre-lès-Nancy, France
b BRGM-French Geological Survey, 3, Av. Claude Guillemin, BP 36009, 45060 Orléans Cedex 2, France
c GFZ German Research Centre for Geosciences, Telegrafenberg, 14473 Potsdam, Germany
d UMR CNRS 6118 Géosciences Rennes, OSUR, Université de Rennes 1, 35042 Rennes Cedex, France
e Present Address: Department of Earth Sciences, University of Geneva, CH-1205 Geneva, Switzerland
f Department of Geological Sciences, University of Manitoba, Winnipeg, Manitoba R3T 2N2, Canada
g Ecole Nationale Supérieure des Mines de Nancy, Parc de Saurupt, F-54042 Nancy, France
h State Key Laboratory for Mineral Deposits Research, School of Earth Sciences and Engineering, Nanjing
University, Xianlin University Town, Nanjing 210046- China
Abstract
The Nanling metallogenic belt is the richest province worldwide in term of W-Sn
resources. The mineralized veins as well as their associated granitic intrusions have been
widely dated and give a large spectrum of ages within the Jurassic and Cretaceous periods.
At this day, dating analysis performed on minerals from the veins are mainly focused on
molybdenite, micas, hydrothermal zircons and quartz fluid inclusions. Few dating results were
recently published on cassiterite crystals but no direct dating of wolframite remains available
although recent fluid inclusion studies suggest different fluid circulations and processes
responsible for the crystallization of gangue and ore minerals.
PART 3 – Chapter 5
268
In this study, multiple dating methods including 40Ar-39Ar on micas, U-Pb direct dating
of wolframite and U-Pb-Th on xenotime, were performed on multiple stages of crystallization
of the veins, the granite and the greisen. Results yield a continuum of ages reflecting
perturbations of the isotopic systems by the circulations of multiple fluids. Four fluid circulations
could be identified: (i) W-Sn mineralizing fluids at ca. 160 Ma, (ii) fluids associated to the
greisenization at ca. 156 Ma, (iii) REE mineralizing fluids associated with late sulfides at ca.
152 Ma and, and (iv) REE- and Zr-rich fluids circulating at ca. 130 Ma.
This study highlights an early crystallization of ore tungsten minerals by the first direct
measurements performed on wolframite in the Nanling Range and the necessity to
complement studies on other deposits from this region where gangue minerals where not
necessarily formed with the same processes nor at the same timing as ore minerals.
Keywords
Maoping - U-Pb dating - Ar-Ar dating – wolframite – xenotime - tungsten deposit - Nanling
1. Introduction
The Nanling Range is the world’s richest metallogenic belt in term of tungsten resources
(Wang et al., 2016). Yet, no direct dating of wolframite minerals exists at this day in this region.
In the Nanling range, fractional crystallization of granitic magmas is thought to have
promoted ore-forming processes leading to ore minerals crystallization along fractures during
and/or after the solidification of the granites (Mao et al., 2007; Xi et al., 2007; Pirajno, 2009;
Zhou et al., 2010). Ore-forming processes include either two fluids (magmatic dominant and
meteoric minor) mixing or a single fluid (magmatic) cooling, leading to the precipitation of ore
minerals (Wei et al., 2012). Tungsten is believed to be transported by fluids exsolved from the
granitic intrusion and gangue mineral dating analyses usually match the granite age, these
minerals have been used as a proxy to determine the age of W-Sn mineralizations.
PART 3 – Chapter 5
269
The widely accepted range of the main W-Sn mineralization in the Nanling Range is
defined between 150 and 160 Ma. However, recent fluid inclusion studies performed on W-Sn
deposits from the Nanling Range highlight different hydrothermal processes involved in
gangue and ore minerals, raising the evidence of non-coeval crystallization and polyphase fluid
circulations (Legros, submitted; Wei et al., 2012; Ni et al., 2015). These studies raise several
questions: (i) can gangue mineral dating studies be used as a proxy to determine the age of
ore minerals? and (ii) do such fluid circulations may induce perturbations in the isotopic
systems of the studied minerals? Recent studies started to address this problematic in the
case of the Piaotang and Xihuashan deposits and performed U-Pb measurements on
cassiterite crystals from the veins (Bai et al., 2011; Zhang et al., 2017). These studies yield
ages at ca. 160 Ma, interpreting an earlier stage of emplacement of the ore minerals.
Previous studies including detailed petrography, mineralogical studies of Fe-Li-micas
and fluid inclusions in the Maoping deposit suggest that at least four types of fluid showing
variable rates of mixing are involved (Legros et al., 2016; Legros et al., submitted). This study
uses the Maoping deposit as a proxy to unravel the timing of multiple fluid circulations that
could have also circulated in the Nanling Range. To address this matter, multiple dating
methods were performed: U-Pb direct dating of wolframite to unravel the timing of the
mineralization, 40Ar-39Ar dating on several generations of Fe-Li-micas from the mineralizing
and post-ore stages, granite and greisen, and U-Th-Pb dating of xenotime associated with
rare-earth minerals and fluorite in late filling stages.
2. Geological setting and sampling
2.1 The Jiangxi metallogenic province
The southern Jiangxi W-Sn province is part of the Nanling metallogenic belt which hosts
the main W reserves in China (90%, ca. a million tons: Wang et al., 2016). This belt is located
in the Cathaysia Block, which is part of the South China Craton (SCC).
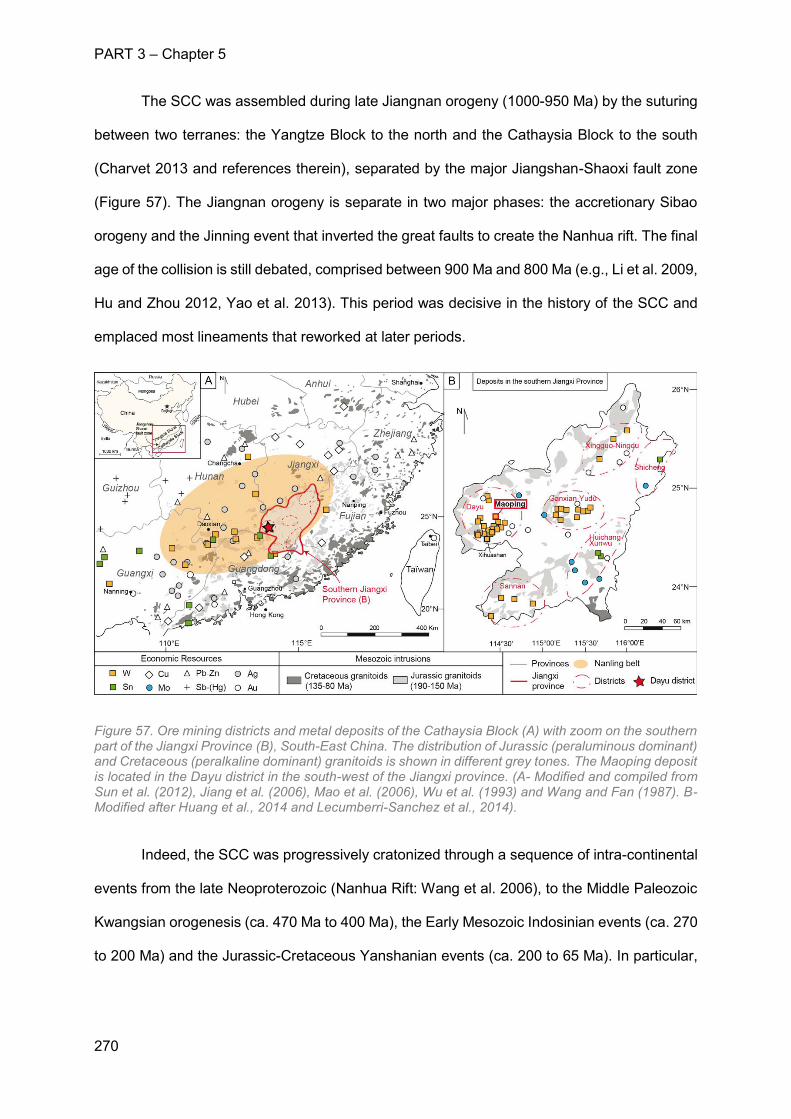
PART 3 – Chapter 5
270
The SCC was assembled during late Jiangnan orogeny (1000-950 Ma) by the suturing
between two terranes: the Yangtze Block to the north and the Cathaysia Block to the south
(Charvet 2013 and references therein), separated by the major Jiangshan-Shaoxi fault zone
(Figure 57). The Jiangnan orogeny is separate in two major phases: the accretionary Sibao
orogeny and the Jinning event that inverted the great faults to create the Nanhua rift. The final
age of the collision is still debated, comprised between 900 Ma and 800 Ma (e.g., Li et al. 2009,
Hu and Zhou 2012, Yao et al. 2013). This period was decisive in the history of the SCC and
emplaced most lineaments that reworked at later periods.
Figure 57. Ore mining districts and metal deposits of the Cathaysia Block (A) with zoom on the southern part of the Jiangxi Province (B), South-East China. The distribution of Jurassic (peraluminous dominant) and Cretaceous (peralkaline dominant) granitoids is shown in different grey tones. The Maoping deposit is located in the Dayu district in the south-west of the Jiangxi province. (A- Modified and compiled from Sun et al. (2012), Jiang et al. (2006), Mao et al. (2006), Wu et al. (1993) and Wang and Fan (1987). B- Modified after Huang et al., 2014 and Lecumberri-Sanchez et al., 2014).
Indeed, the SCC was progressively cratonized through a sequence of intra-continental
events from the late Neoproterozoic (Nanhua Rift: Wang et al. 2006), to the Middle Paleozoic
Kwangsian orogenesis (ca. 470 Ma to 400 Ma), the Early Mesozoic Indosinian events (ca. 270
to 200 Ma) and the Jurassic-Cretaceous Yanshanian events (ca. 200 to 65 Ma). In particular,
PART 3 – Chapter 5
271
the Cathaysia Block was by far the most affected by the metacratonization and registered the
most pervasive magmatic activity in the Yanshanian.
The Middle Palaezoic Kwangsian orogeny (ca. 470 Ma to 400 Ma) is currently
interpreted as resulting from the inversion of the NE-trending Nanhua Rift (e.g., Charvet et al.,
2010, Charvet, 2013). The first intra-cratonic event yielded a high-grade belt of migmatites and
granulites due to crustal thickening and HT metamorphism at ca. 450 Ma (e.g., Liu et al.
2010a). This episode was followed by basaltic underplating, dehydration melting in the lower
crust, and the emplacement of large syn-kinematic S-type granitic bodies (more than 20,000
km²: Li et al. 2011a) at ca. 430-420 Ma (e.g., Wang et al. 2011, Xia et al. 2014).
At the end of the Trias (ca. 245 to 210 Ma; Indosinian), the suturing of the SCC with the
North China Craton marks a second major intracratonic event, reworking the Kwangsian
structures (e.g., Wang et al. 2001). This Indosinian event, is associated with HT metamorphism
(metamorphic core complexes: Faure et al. 1996), and produced large volumes of granitic
bodies (presently covering 14,300 km2). These bodies were emplaced in two stages: I-types
(245-230 Ma), and S-types (220-210 Ma) (Shu et al. 2008 and references therein) associated
with Nb-Ta granites in the Nanling Range (e.g. Dahutang deposit, Mao et al. 2013).
The Yanshanian event (ca. 200 to 65 Ma), is known to be at the origin of a giant granitic
(and rhyolitic) province (Li et al., 2014). This period is associated with successive transpression
and transtension settings along the same NE-SW lineaments that controlled the Kwangsian
and Indosinian tectonics (Li et al., 2014, Liu et al., 2012, Shu et al., 2009). Four periods are
commonly interpreted: the J1 period from 200-165 Ma, the J2-3 period between 165-150 Ma,
the K1 period from 150-110 Ma and the K2 period between 110-65 Ma.
The J1 period (200-165 Ma) starts with the progressive replacement of the tethysian
tectonic settings by the Paleo-Pacific regime and the initiation of Basin and Range tectonics
associated with the flat subduction of the Paleo-pacific plate under the SCC (Wang and Mo,
1995; Wang and Zhou, 2002; Li and Li, 2007). In the Nanling belt, E-W trending zones of S-
PART 3 – Chapter 5
272
type granitoids are emplaced and believed to be issued from the Tethysian settings or the post-
collisional Tethysian belt (Zhou et al., 2006; Shu et al., 2009). The subduction settings have
led to the remobilization of intracontinental faults and magmatism. At ca. 190 Ma, the
production of A-type granites was interpreted as originated from the slab break-off and evolved
into anorogenic magmatism (Li and Li, 2007). Following the delamination of the slab, the
settings changed from Tethysian compressional regime to Paleo-Pacific extension (Li and Li,
2007). During the J1 period, a stage of large-scale magmatism was emplaced from 180 to 160
Ma, caused by the underplating of basaltic magmas.
During the J2 and J3 periods (165-150 Ma), a second stage of NE-trending magmatism
is expressed and constrained by the Paleo-Pacific plate subduction settings (Wang and Shu,
2012). The magmatism is characterized by I-type granites associated with A-type granites and
rift-type syenite, issued from the slab rollback (Li and Li, 2007). W-Sn deposits in the Cathaysia
are believed to be associated with this 160-150 Ma event, although a recent study challenged
this hypothesis (Wang et al., 2016). Three parallel granitic belts associated with W-Sn deposits
are formed in the E-W trending Nanling range during this period (Zhao et al. 2017).
During the K1 period (150-110 Ma), intracontinental deformation and metamorphism
associated with the subduction introduced a wide fold-and-thrust belt (Lin et al., 2008; Zhang
et al., 2008; Xu et al., 2009). From 140 Ma, back-arc extensional settings are emplaced in the
SCC and induced partial melting of the upper slab, crustal thinning and basalt underplating in
association with mixed crust-mantle magmas (Wang and Zhou, 2002; Shu and Zhou, 2002;
Zhou and Li, 2000; Zhou et al., 2006a). From 136 to 118 Ma, the SCC is under extensional
settings, followed by tectonic inversion from 117 to 108 Ma and alternating again at ca. 107
Ma (Li et al., 2014).
The K2 period (110-65 Ma) starts with an uplift of the coastal areas due to the collision
of the SCC with the Philippine plate (Charvet et al., 1985, 1999; Maruyama et al., 1997; Shu
et al., 2004, 2009). The Pacific Plate then started to rotate eastward and generated extensional
settings, introducing NE-NNE basins associated to A-type granites and bimodal volcanism
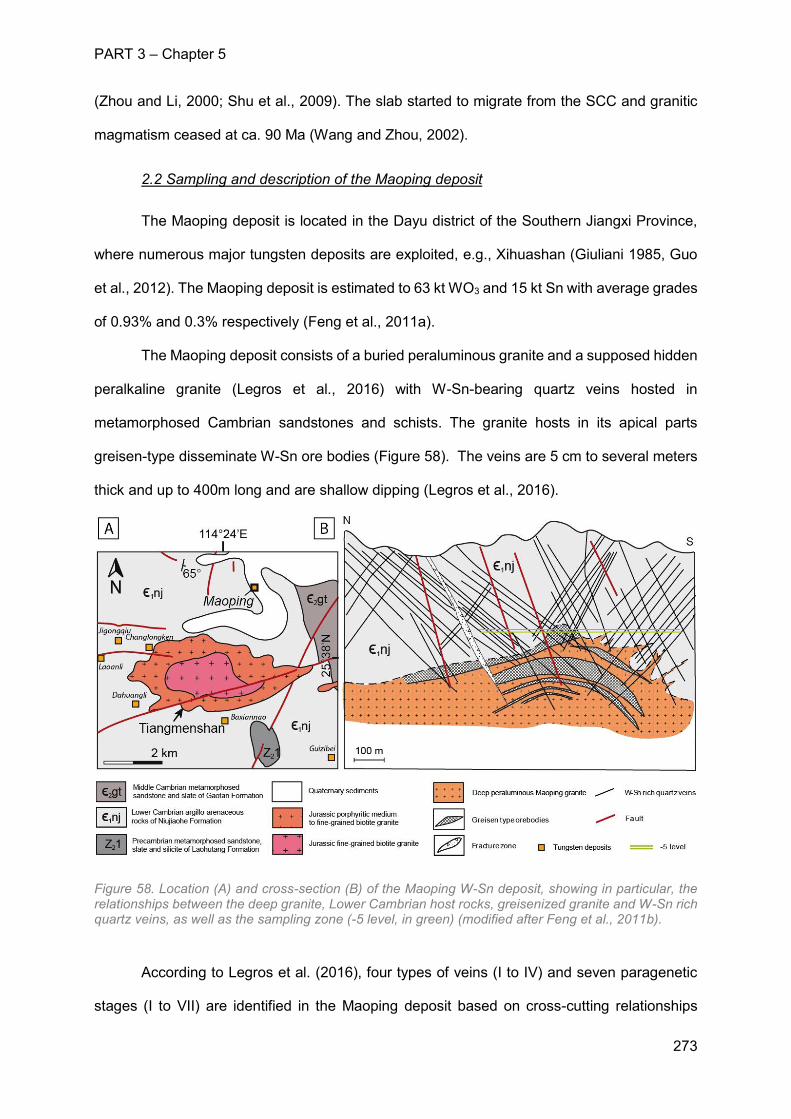
PART 3 – Chapter 5
273
(Zhou and Li, 2000; Shu et al., 2009). The slab started to migrate from the SCC and granitic
magmatism ceased at ca. 90 Ma (Wang and Zhou, 2002).
2.2 Sampling and description of the Maoping deposit
The Maoping deposit is located in the Dayu district of the Southern Jiangxi Province,
where numerous major tungsten deposits are exploited, e.g., Xihuashan (Giuliani 1985, Guo
et al., 2012). The Maoping deposit is estimated to 63 kt WO3 and 15 kt Sn with average grades
of 0.93% and 0.3% respectively (Feng et al., 2011a).
The Maoping deposit consists of a buried peraluminous granite and a supposed hidden
peralkaline granite (Legros et al., 2016) with W-Sn-bearing quartz veins hosted in
metamorphosed Cambrian sandstones and schists. The granite hosts in its apical parts
greisen-type disseminate W-Sn ore bodies (Figure 58). The veins are 5 cm to several meters
thick and up to 400m long and are shallow dipping (Legros et al., 2016).
Figure 58. Location (A) and cross-section (B) of the Maoping W-Sn deposit, showing in particular, the relationships between the deep granite, Lower Cambrian host rocks, greisenized granite and W-Sn rich quartz veins, as well as the sampling zone (-5 level, in green) (modified after Feng et al., 2011b).
According to Legros et al. (2016), four types of veins (I to IV) and seven paragenetic
stages (I to VII) are identified in the Maoping deposit based on cross-cutting relationships
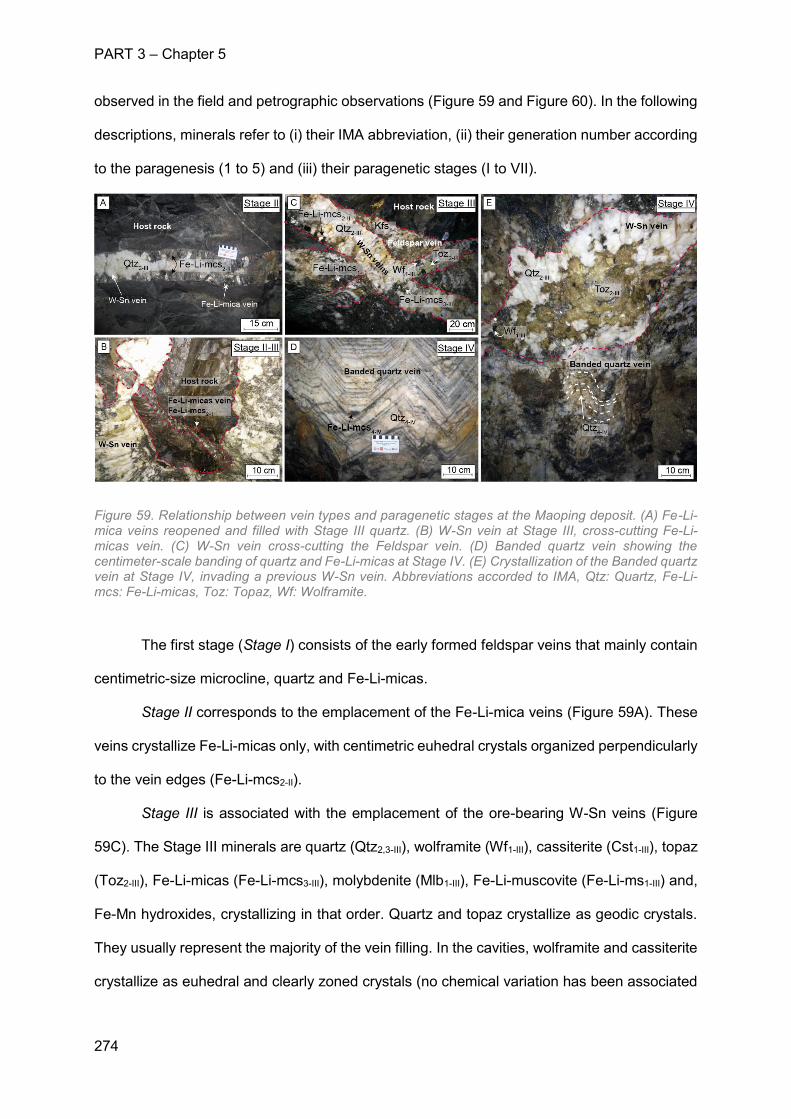
PART 3 – Chapter 5
274
observed in the field and petrographic observations (Figure 59 and Figure 60). In the following
descriptions, minerals refer to (i) their IMA abbreviation, (ii) their generation number according
to the paragenesis (1 to 5) and (iii) their paragenetic stages (I to VII).
Figure 59. Relationship between vein types and paragenetic stages at the Maoping deposit. (A) Fe-Li-mica veins reopened and filled with Stage III quartz. (B) W-Sn vein at Stage III, cross-cutting Fe-Li-micas vein. (C) W-Sn vein cross-cutting the Feldspar vein. (D) Banded quartz vein showing the centimeter-scale banding of quartz and Fe-Li-micas at Stage IV. (E) Crystallization of the Banded quartz vein at Stage IV, invading a previous W-Sn vein. Abbreviations accorded to IMA, Qtz: Quartz, Fe-Li-mcs: Fe-Li-micas, Toz: Topaz, Wf: Wolframite.
The first stage (Stage I) consists of the early formed feldspar veins that mainly contain
centimetric-size microcline, quartz and Fe-Li-micas.
Stage II corresponds to the emplacement of the Fe-Li-mica veins (Figure 59A). These
veins crystallize Fe-Li-micas only, with centimetric euhedral crystals organized perpendicularly
to the vein edges (Fe-Li-mcs2-II).
Stage III is associated with the emplacement of the ore-bearing W-Sn veins (Figure
59C). The Stage III minerals are quartz (Qtz2,3-III), wolframite (Wf1-III), cassiterite (Cst1-III), topaz
(Toz2-III), Fe-Li-micas (Fe-Li-mcs3-III), molybdenite (Mlb1-III), Fe-Li-muscovite (Fe-Li-ms1-III) and,
Fe-Mn hydroxides, crystallizing in that order. Quartz and topaz crystallize as geodic crystals.
They usually represent the majority of the vein filling. In the cavities, wolframite and cassiterite
crystallize as euhedral and clearly zoned crystals (no chemical variation has been associated
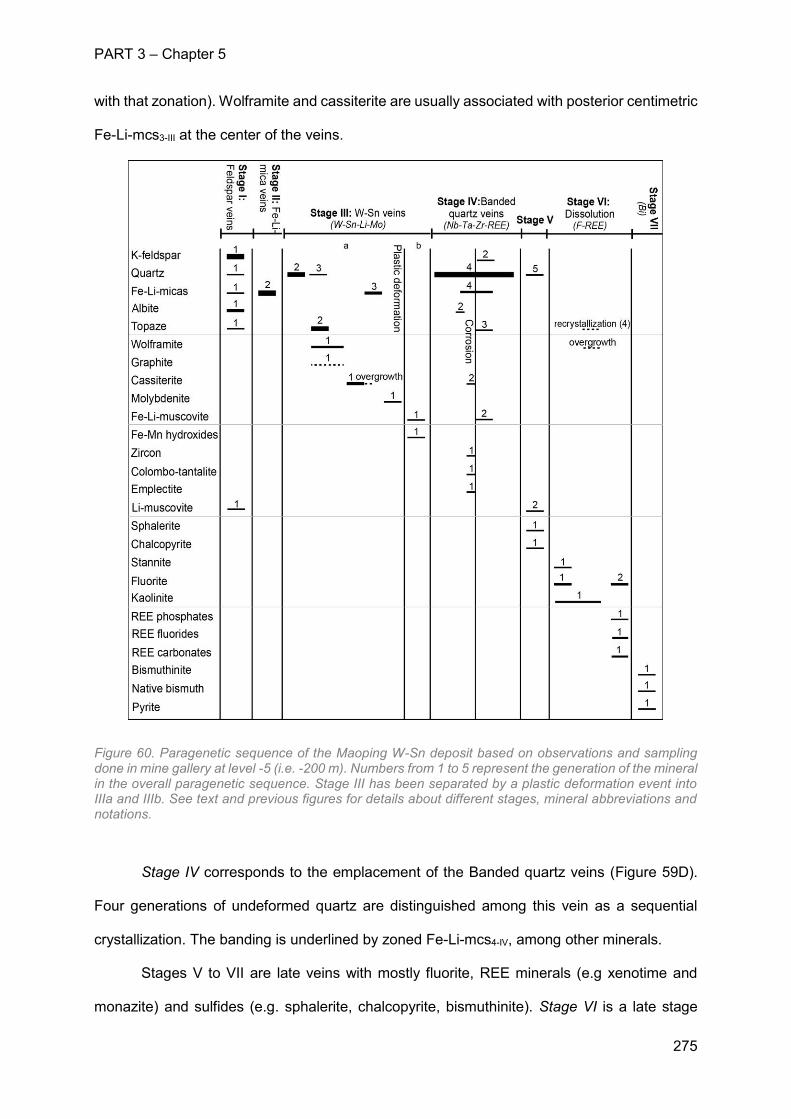
PART 3 – Chapter 5
275
with that zonation). Wolframite and cassiterite are usually associated with posterior centimetric
Fe-Li-mcs3-III at the center of the veins.
Figure 60. Paragenetic sequence of the Maoping W-Sn deposit based on observations and sampling done in mine gallery at level -5 (i.e. -200 m). Numbers from 1 to 5 represent the generation of the mineral in the overall paragenetic sequence. Stage III has been separated by a plastic deformation event into IIIa and IIIb. See text and previous figures for details about different stages, mineral abbreviations and notations.
Stage IV corresponds to the emplacement of the Banded quartz veins (Figure 59D).
Four generations of undeformed quartz are distinguished among this vein as a sequential
crystallization. The banding is underlined by zoned Fe-Li-mcs4-IV, among other minerals.
Stages V to VII are late veins with mostly fluorite, REE minerals (e.g xenotime and
monazite) and sulfides (e.g. sphalerite, chalcopyrite, bismuthinite). Stage VI is a late stage
PART 3 – Chapter 5
276
composed of cavities-filling minerals within the W-Sn and Banded quartz veins. Stage VI
minerals consist of a succession of fluorite (Fl1-VI), kaolinite (Kln1-VI) and a late porous fluorite
(Fl2-VI). The first generation of Fl1-VI is euhedral and inclusion-free while the second (Fl2-VI), is
anhedral and zoned. This zonation displays many REE minerals inclusions as phosphates (i.e.
xenotime Xnt1-VI and monazite Mnz1-VI), fluorides and carbonates.
The granite emplacement was dated at 151.8 ± 2.9 Ma by SHRIMP U-Pb on zircon
(Feng et al., 2011b), whereas the greisen and the tungsten-bearing veins yielded Re-Os
molybdenite ages at 155.3 ± 2.8 Ma and 150.2 ± 2.8 Ma, respectively, the latter have been
interpreted as the emplacement age of the W mineralization (Feng et al., 2011a).
3. Analytical methods
Petrographic data were obtained from observations of polished thin-sections using
conventional transmitted and reflected light microscopy and a HITACHI FEG S4800 scanning
electron microscope (SEM) equipped with an energy dispersive spectrometer (EDS), using a
Si(Li) semi-conductor detector, at the GeoRessources laboratory (Nancy, France).
Cathodoluminescence (CL) was also performed on thin-sections, using a CITL cold cathode
instrument CL8200 Mk4 (15 kV and 400 mA).
3.1 EMPA analysis
Electron microprobe analyses (EMPA) of Nb, W, Mn, Fe and Ta were performed on
wolframite samples and P, Ca, Y, La, Ce, Nd, Sm, Gd, Pr, Dy, Er, Yb on xenotime samples
using a CAMECA SX100 instrument equipped with a wavelength dispersive spectrometer
(WDS) at the GeoRessources laboratory (Nancy, France). Calibration was performed using
natural and synthetic oxides and silicates (olivine, MnTiO3, scheelite, Fe2O3, LiTaO3 and
LiNbO3, monazite). A current of 20 nA and an accelerating voltage of 15 kV was used with a
counting time of 10 s per element. Total Fe is presented as FeO.
3.2 LA-ICPMS analysis
PART 3 – Chapter 5
277
Minor and trace elements (7Li, 24Mg, 45Sc, 47Ti, 51V, 55Mn, 57Fe, 59Co, 60Ni, 63Cu, 66Zn,
69Ga, 72Ge, 85Rb, 88Sr, 89Y, 90Zr, 93Nb, 95Mo, 111Cd, 115In, 118Sn, 139La, 140Ce, 141Pr, 146Nd, 147Sm,
153Eu, 157Gd, 159Tb, 163Dy, 165Ho, 166Er, 169Tm, 172Yb, 175Lu, 178Hf, 181Ta, 208Pb, 209Bi, 232Th, 238U)
were measured in wolframites using a LA-ICPMS instrumental setup similar to that described
in Leisen et al. (2012) and Lach et al. (2013), with a GeoLas excimer laser (ArF, 193 nm,
Microlas, Göttingen, Germany) (Günther et al., 1997) and an Agilent 7500c quadrupole ICP-
MS at the GeoRessources laboratory (Nancy, France). The laser beam was focused onto the
sample within a 24.5 cm3 cylindrical ablation cell using a Schwarzschild reflective objective
(magnification × 25; numerical aperture 0.4) mounted on an optical microscope (Olympus
BX41) equipped with a X‒Y motorized stage and a CCD camera. Tungsten (determined by
EPMA) was chosen as an internal standard as it is abundant in both the samples and the
external standards and can be accurately quantified by EMPA. NIST610 (values from Jochum
et al., 2011) was chosen as the external standard (accuracy verified with NIST612) (Longerich
et al., 1990). The following parameters were used for the LA-ICPMS analyses: a fluence of
6J/cm² and a laser shot frequency of 5 Hz; He = 0.5 L.min-1 as a carrier gas, mixed with Ar =
1.0 L.min-1 via a cyclone mixer prior to entering the ICP torch. Ablation lines of 60 µm diameter
and 200 µm length were analysed at a 2 µm/s speed. Each isotope was acquired during a
dwell time of 10 ms. Data was processed using the Iolite software (Paton et al., 2011).
3.3 40Ar/39Ar Fe-Li-micas dating
40Ar/39Ar analytical work was performed at the University of Manitoba (Canada) using a multi-
collector Thermo Fisher Scientific ARGUS VI mass spectrometer, linked to a stainless steel
Thermo Fisher Scientific extraction/purification line, Photon Machines (55 W) Fusions 10.6
CO2 laser, and Photon Machines (Analyte Excite) 193 nm laser. Argon isotopes (from mass
40 to 37) were measured using Faraday detectors with low noise 1 x 10¹² Ω resistors and mass
36 was measured using a compact discrete dynode (CDD) detector. All specimens (samples
and standard) were irradiated in the Cadmium-lined, in-core CLICIT facility of the TRIGA
reactor at the Oregon State University (USA). Standard used was the GA1550 biotite (Spell
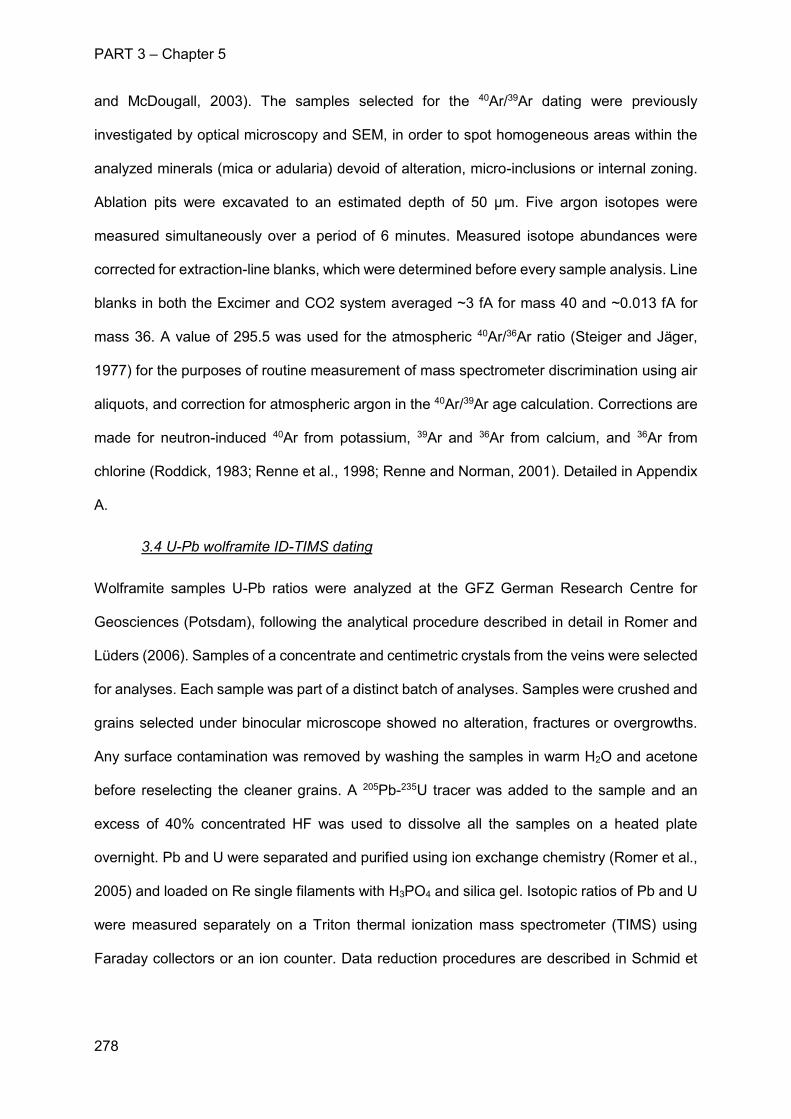
PART 3 – Chapter 5
278
and McDougall, 2003). The samples selected for the 40Ar/39Ar dating were previously
investigated by optical microscopy and SEM, in order to spot homogeneous areas within the
analyzed minerals (mica or adularia) devoid of alteration, micro-inclusions or internal zoning.
Ablation pits were excavated to an estimated depth of 50 µm. Five argon isotopes were
measured simultaneously over a period of 6 minutes. Measured isotope abundances were
corrected for extraction-line blanks, which were determined before every sample analysis. Line
blanks in both the Excimer and CO2 system averaged ~3 fA for mass 40 and ~0.013 fA for
mass 36. A value of 295.5 was used for the atmospheric 40Ar/36Ar ratio (Steiger and Jäger,
1977) for the purposes of routine measurement of mass spectrometer discrimination using air
aliquots, and correction for atmospheric argon in the 40Ar/39Ar age calculation. Corrections are
made for neutron-induced 40Ar from potassium, 39Ar and 36Ar from calcium, and 36Ar from
chlorine (Roddick, 1983; Renne et al., 1998; Renne and Norman, 2001). Detailed in Appendix
A.
3.4 U-Pb wolframite ID-TIMS dating
Wolframite samples U-Pb ratios were analyzed at the GFZ German Research Centre for
Geosciences (Potsdam), following the analytical procedure described in detail in Romer and
Lüders (2006). Samples of a concentrate and centimetric crystals from the veins were selected
for analyses. Each sample was part of a distinct batch of analyses. Samples were crushed and
grains selected under binocular microscope showed no alteration, fractures or overgrowths.
Any surface contamination was removed by washing the samples in warm H2O and acetone
before reselecting the cleaner grains. A 205Pb-235U tracer was added to the sample and an
excess of 40% concentrated HF was used to dissolve all the samples on a heated plate
overnight. Pb and U were separated and purified using ion exchange chemistry (Romer et al.,
2005) and loaded on Re single filaments with H3PO4 and silica gel. Isotopic ratios of Pb and U
were measured separately on a Triton thermal ionization mass spectrometer (TIMS) using
Faraday collectors or an ion counter. Data reduction procedures are described in Schmid et
PART 3 – Chapter 5
279
al. (2003). The concordia plot and age calculations were carried out using the Isoplot/Ex add-
in for Excel (Ludwig 2008).
3.5 U-Th-Pb xenotime LA-ICPMS dating
Ablation of xenotime was performed at the Université de Rennes (Géosciences Rennes,
France) using a ESI NWR193UC Excimer laser system coupled to an Agilent 7700x
quadrupole ICPMS. A spot diameter of 25µm was chosen with a repetition rates of 3Hz. The
ablated material was transported to the mass spectrometer in He, before mixing with N
(Paquette et al., 2014) and Ar and introduced in the ICP source of an Agilent 7700x quadrupole
ICP-MS equipped with a dual pumping system to enhance sensitivity. NIST SRM 612 reference
glass was used for mass calibration at the beginning and end of each batch. 204Pb, 206Pb, 207Pb,
208Pb, 232Th and 238U signals were analyzed. For each analyses, 20s of background was
integrated, followed by 60s of laser-firing acquisition. Each analysis was separated by a 10s
delay to wash out. The Weinsberg xenotime (Klötzli et al. 2007; 317.3±2.0 Ma) standard was
used to correct for Pb/U and Pb/Th laser-induced elemental fractionation and instrumental
mass discrimination. More information on the dating protocol can be found in Boutin et al.
(2016). Data reduction was carried out with the GLITTER software package (Van Achterbergh
et al. 2001; Jackson et al. 2004). The Wetherill concordia plot and age calculations were
carried out using the Isoplot/Ex add-in for Excel (Ludwig 2008). Uncertainties are reported at
1σ.
4. Sample descriptions
Thirty-five samples were collected at the -5 underground level of the Maoping mine (i.e.
approximately 200 m below current surface). This sampling yielded to a representative set of
samples from the mineralized, greisen and granite.
Among the seven paragenetic stages identified at the Maoping deposit (Legros et al.,
2016; Figure 60), four of them display a mineralogical diversity permitting multiple dating: the
Stage II Fe-Li-micas veins, the Stage III W-Sn veins, the Stage IV banded quartz veins and
PART 3 – Chapter 5
280
the Stage VI late filling stage (Figure 60). Three types of minerals have been selected for
multiple dating: Fe-Li-micas in order to compare ages of the granite, greisen and three distinct
hydrothermal stages, wolframite to date the tungsten mineralization and xenotime to evaluate
the age of crystallization of the late filling stages.
4.1 Fe-Li micas grains
Five samples containing Fe-Li-micas were selected from the greisen, granite and three
paragenetic stages (II, III and IV; Figure 61) for 40Ar-39Ar dating. For detailed major and trace
element content, refer to Legros et al., (2016).
The Fe-Li-micas2-II and the Fe-Li-micas3-III are centimetric palisadic crystals from the W-
Sn veins crystallizing respectively on stage II and III. The Fe-Li-micas2-II were sampled at the
edge of the vein while the Fe-Li-micas3-III are observed at the center of the vein. Paragenetically
speaking, the Fe-Li-micas3-III only are associated with the ore-bearing minerals (wolframite and
cassiterite). Both types of crystals show some alteration into Fe-Li-ms within the cleavages,
sometimes associated with Fe-Mn hydroxides (Figure 61).
The Fe-Li-micas4-IV correspond to millimetric crystals underlining the centimetric quartz
zonation of the banded quartz veins of Stage IV. This vein does not present particular
enrichment in ore-bearing minerals. These crystals are oscillatory zoned and contain rare
inclusions of zircon and columbo-tantalite (Figure 61). The fine oscillatory zoning alternates
between trioctahedral and dioctahedral compositions while the larger rim is of homogeneous
zinnwalditic composition.
The greisen Fe-Li-micas are millimetric crystals that are the result of the alteration of
the granite. Most of the selected grains display alteration on the rim and in fractures
(transformation from trioctahedral to dioctahedral structure). Micas show symplectic texture
with quartz grains and present some rare inclusions of late fluorite-monazite and uranothorite-
monazite assemblages (Figure 61).
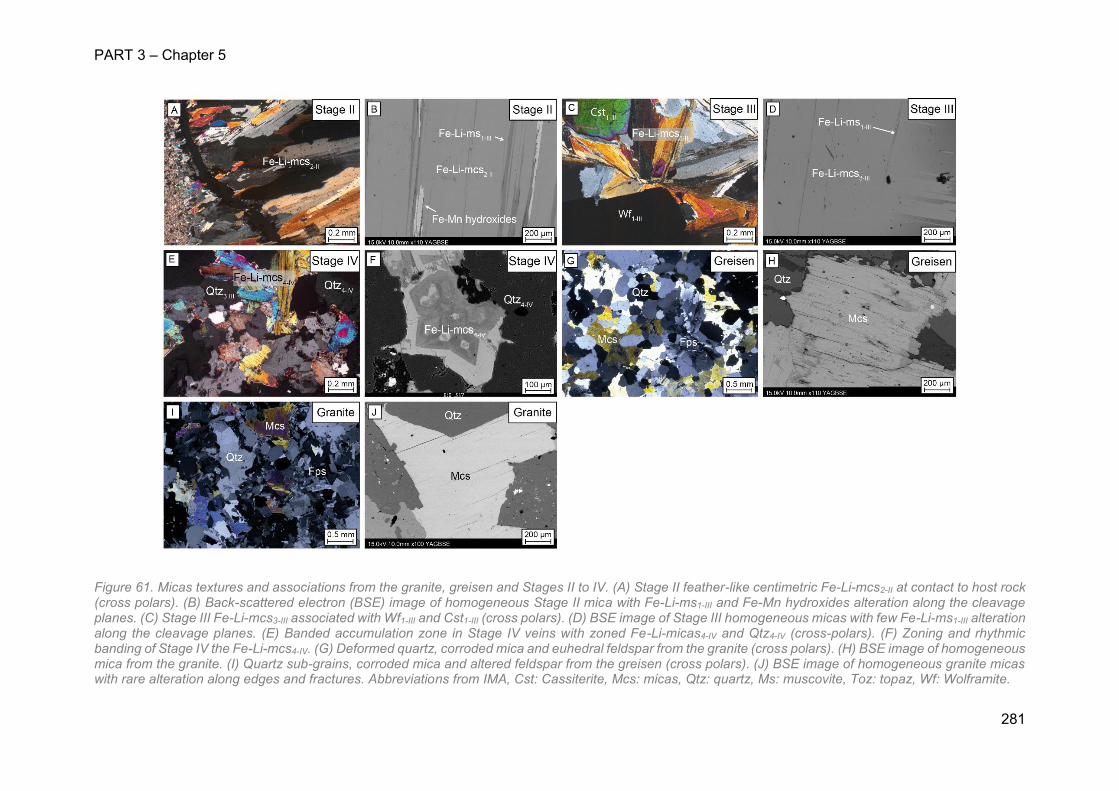
PART 3 – Chapter 5
281
Figure 61. Micas textures and associations from the granite, greisen and Stages II to IV. (A) Stage II feather-like centimetric Fe-Li-mcs2-II at contact to host rock (cross polars). (B) Back-scattered electron (BSE) image of homogeneous Stage II mica with Fe-Li-ms1-III and Fe-Mn hydroxides alteration along the cleavage planes. (C) Stage III Fe-Li-mcs3-III associated with Wf1-III and Cst1-III (cross polars). (D) BSE image of Stage III homogeneous micas with few Fe-Li-ms1-III alteration along the cleavage planes. (E) Banded accumulation zone in Stage IV veins with zoned Fe-Li-micas4-IV and Qtz4-IV (cross-polars). (F) Zoning and rhythmic banding of Stage IV the Fe-Li-mcs4-IV. (G) Deformed quartz, corroded mica and euhedral feldspar from the granite (cross polars). (H) BSE image of homogeneous mica from the granite. (I) Quartz sub-grains, corroded mica and altered feldspar from the greisen (cross polars). (J) BSE image of homogeneous granite micas with rare alteration along edges and fractures. Abbreviations from IMA, Cst: Cassiterite, Mcs: micas, Qtz: quartz, Ms: muscovite, Toz: topaz, Wf: Wolframite.
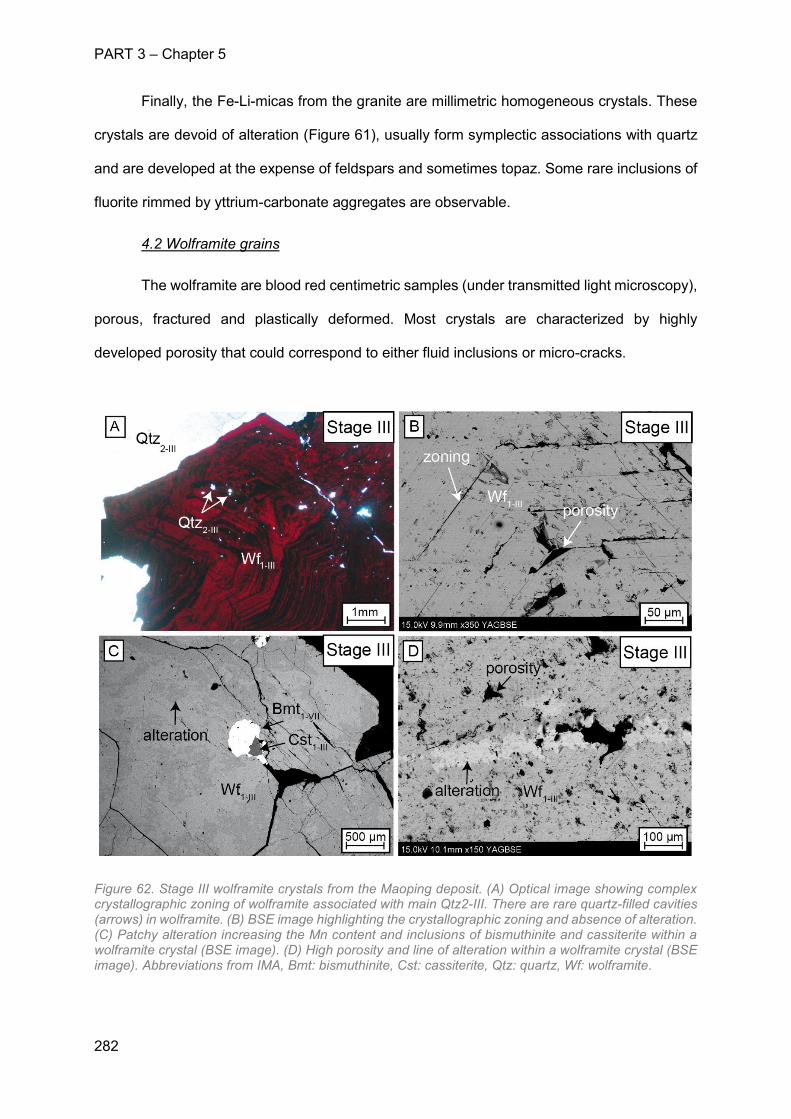
PART 3 – Chapter 5
282
Finally, the Fe-Li-micas from the granite are millimetric homogeneous crystals. These
crystals are devoid of alteration (Figure 61), usually form symplectic associations with quartz
and are developed at the expense of feldspars and sometimes topaz. Some rare inclusions of
fluorite rimmed by yttrium-carbonate aggregates are observable.
4.2 Wolframite grains
The wolframite are blood red centimetric samples (under transmitted light microscopy),
porous, fractured and plastically deformed. Most crystals are characterized by highly
developed porosity that could correspond to either fluid inclusions or micro-cracks.
Figure 62. Stage III wolframite crystals from the Maoping deposit. (A) Optical image showing complex crystallographic zoning of wolframite associated with main Qtz2-III. There are rare quartz-filled cavities (arrows) in wolframite. (B) BSE image highlighting the crystallographic zoning and absence of alteration. (C) Patchy alteration increasing the Mn content and inclusions of bismuthinite and cassiterite within a wolframite crystal (BSE image). (D) High porosity and line of alteration within a wolframite crystal (BSE image). Abbreviations from IMA, Bmt: bismuthinite, Cst: cassiterite, Qtz: quartz, Wf: wolframite.
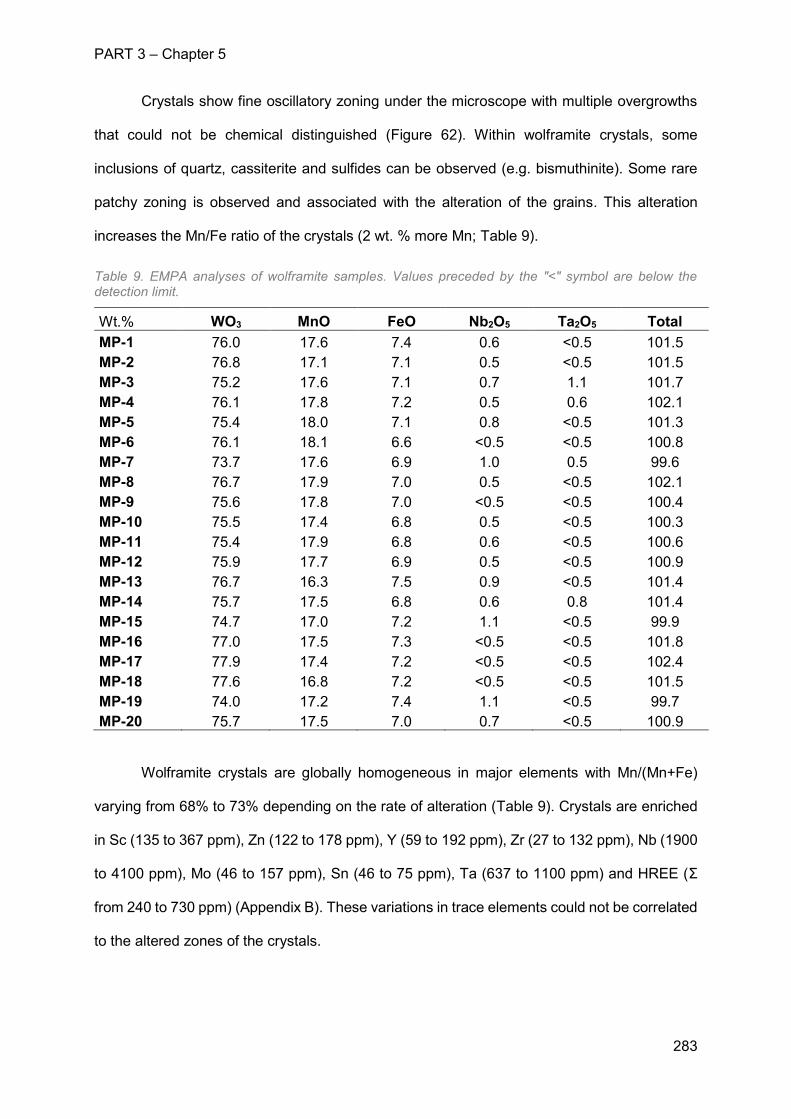
PART 3 – Chapter 5
283
Crystals show fine oscillatory zoning under the microscope with multiple overgrowths
that could not be chemical distinguished (Figure 62). Within wolframite crystals, some
inclusions of quartz, cassiterite and sulfides can be observed (e.g. bismuthinite). Some rare
patchy zoning is observed and associated with the alteration of the grains. This alteration
increases the Mn/Fe ratio of the crystals (2 wt. % more Mn; Table 9).
Table 9. EMPA analyses of wolframite samples. Values preceded by the "<" symbol are below the detection limit.
Wt.% WO3 MnO FeO Nb2O5 Ta2O5 Total MP-1 76.0 17.6 7.4 0.6 <0.5 101.5 MP-2 76.8 17.1 7.1 0.5 <0.5 101.5 MP-3 75.2 17.6 7.1 0.7 1.1 101.7 MP-4 76.1 17.8 7.2 0.5 0.6 102.1 MP-5 75.4 18.0 7.1 0.8 <0.5 101.3 MP-6 76.1 18.1 6.6 <0.5 <0.5 100.8 MP-7 73.7 17.6 6.9 1.0 0.5 99.6 MP-8 76.7 17.9 7.0 0.5 <0.5 102.1 MP-9 75.6 17.8 7.0 <0.5 <0.5 100.4 MP-10 75.5 17.4 6.8 0.5 <0.5 100.3 MP-11 75.4 17.9 6.8 0.6 <0.5 100.6 MP-12 75.9 17.7 6.9 0.5 <0.5 100.9 MP-13 76.7 16.3 7.5 0.9 <0.5 101.4 MP-14 75.7 17.5 6.8 0.6 0.8 101.4 MP-15 74.7 17.0 7.2 1.1 <0.5 99.9 MP-16 77.0 17.5 7.3 <0.5 <0.5 101.8 MP-17 77.9 17.4 7.2 <0.5 <0.5 102.4 MP-18 77.6 16.8 7.2 <0.5 <0.5 101.5 MP-19 74.0 17.2 7.4 1.1 <0.5 99.7 MP-20 75.7 17.5 7.0 0.7 <0.5 100.9
Wolframite crystals are globally homogeneous in major elements with Mn/(Mn+Fe)
varying from 68% to 73% depending on the rate of alteration (Table 9). Crystals are enriched
in Sc (135 to 367 ppm), Zn (122 to 178 ppm), Y (59 to 192 ppm), Zr (27 to 132 ppm), Nb (1900
to 4100 ppm), Mo (46 to 157 ppm), Sn (46 to 75 ppm), Ta (637 to 1100 ppm) and HREE (Σ
from 240 to 730 ppm) (Appendix B). These variations in trace elements could not be correlated
to the altered zones of the crystals.
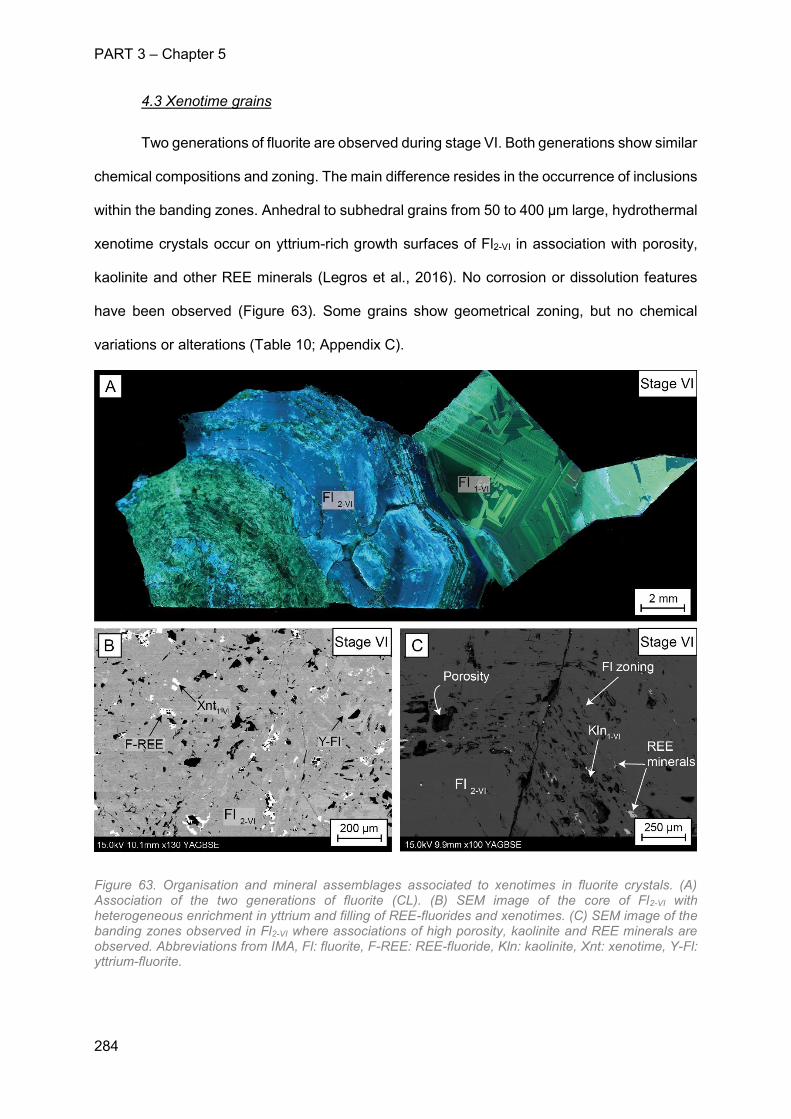
PART 3 – Chapter 5
284
4.3 Xenotime grains
Two generations of fluorite are observed during stage VI. Both generations show similar
chemical compositions and zoning. The main difference resides in the occurrence of inclusions
within the banding zones. Anhedral to subhedral grains from 50 to 400 µm large, hydrothermal
xenotime crystals occur on yttrium-rich growth surfaces of Fl2-VI in association with porosity,
kaolinite and other REE minerals (Legros et al., 2016). No corrosion or dissolution features
have been observed (Figure 63). Some grains show geometrical zoning, but no chemical
variations or alterations (Table 10; Appendix C).
Figure 63. Organisation and mineral assemblages associated to xenotimes in fluorite crystals. (A) Association of the two generations of fluorite (CL). (B) SEM image of the core of Fl2-VI with heterogeneous enrichment in yttrium and filling of REE-fluorides and xenotimes. (C) SEM image of the banding zones observed in Fl2-VI where associations of high porosity, kaolinite and REE minerals are observed. Abbreviations from IMA, Fl: fluorite, F-REE: REE-fluoride, Kln: kaolinite, Xnt: xenotime, Y-Fl: yttrium-fluorite.
PART 3 – Chapter 5
285
Xenotime grains have variable amounts of CaO (0.1 to 13.5 wt.%), Y2O3 (30.0 to 44
wt.%), Gd2O3 (2.5 to 6.3 wt.%), Dy2O3 ( 4.5 to 9.7 wt.%), Er2O3 (3.5 to 5.2 wt.%) and Yb2O3
(4.0 to 11.4 wt.%). These chemical variations are not correlated to the shape of the xenotime
grains, their organization within the fluorite zoning nor the zoning of the grains. All EMPA
analyses were performed on grains that were used for age calculation and when possible, in
the core and rim of the grains but no chemical distinction is observed.
5. Results
5.1 40Ar-39Ar Fe-Li-micas dating
Five samples containing Fe-Li-micas were selected from the greisen, granite and three
paragenetic stages (II, III and IV; Figure 61) for 40Ar-39Ar dating, as described previously. 40Ar-
39Ar dating results are shown on Figure 64. Associated errors are quoted at the 1σ level (Table
11).
The Fe-Li-micas2-II and the Fe-Li-micas3-III are centimetric crystals sampled from the W-
Sn veins. The Fe-Li-micas2-II were sampled at the edge of the vein while the Fe-Li-micas3-III
were sampled at the center of the vein.
The Fe-Li-micas2-II calculated apparent ages range from 150.4 to 160.5 Ma. Among six
measurements, two groups of ages are observable on Figure 64 (including errors): (i) from 146
to 157 Ma and (ii) from 155 to 163 Ma. Integration of all data (n=6) yields an age of 157±2 Ma
(1σ, MSWD=1.33; Figure 64). No petrological evidences seem to be related to the large range
of ages from 146 to 163 Ma. Laser spots digging and reaching alteration zones could be an
explanation.
The Fe-Li-micas3-III calculated apparent ages range from 151.9 to 166.5 Ma. All
calculated ages overlap within errors in a range from 145 to 163 Ma similarly to Fe-Li-micas2-II
calculated ages at the exception of one measurement which yields an older age. The latter
could reflect the occurrence of a mineral inclusions that could not be defined optically.
Integration of the data (n=5) yields an age of 155±2 Ma (1σ, MSWD=0.74; Figure 64).
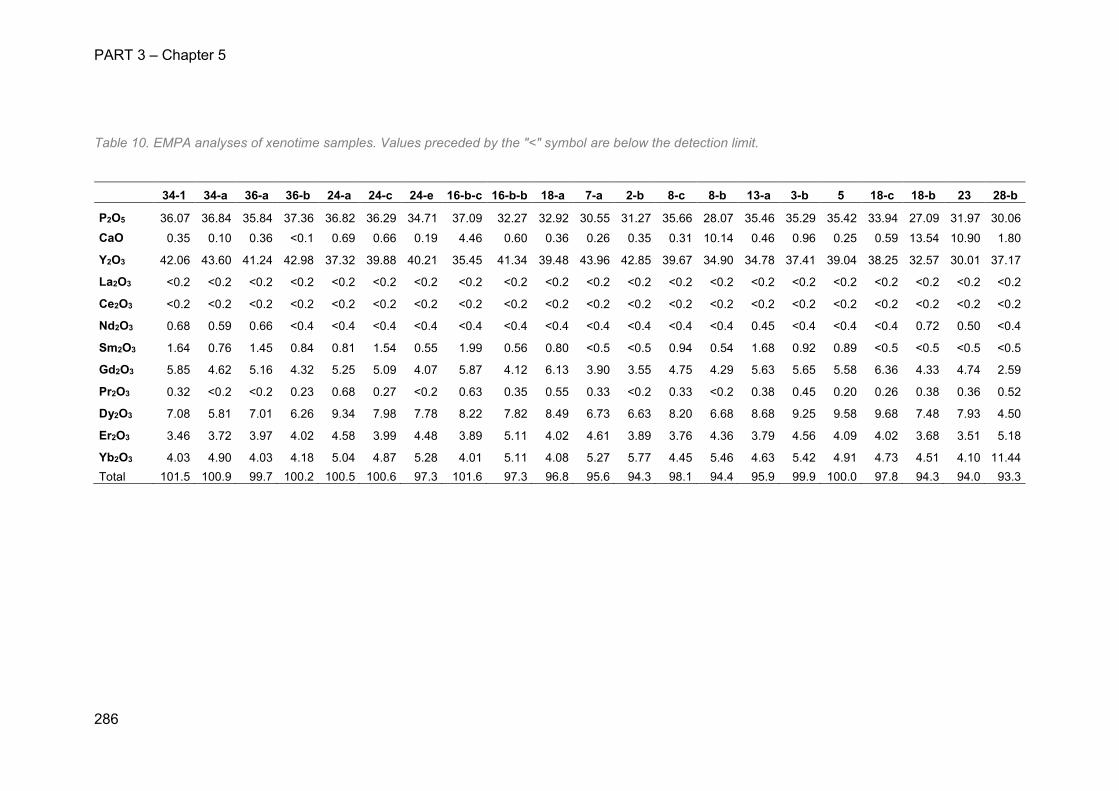
PART 3 – Chapter 5
286
Table 10. EMPA analyses of xenotime samples. Values preceded by the "<" symbol are below the detection limit.
34-1 34-a 36-a 36-b 24-a 24-c 24-e 16-b-c 16-b-b 18-a 7-a 2-b 8-c 8-b 13-a 3-b 5 18-c 18-b 23 28-b
P2O5 36.07 36.84 35.84 37.36 36.82 36.29 34.71 37.09 32.27 32.92 30.55 31.27 35.66 28.07 35.46 35.29 35.42 33.94 27.09 31.97 30.06 CaO 0.35 0.10 0.36 <0.1 0.69 0.66 0.19 4.46 0.60 0.36 0.26 0.35 0.31 10.14 0.46 0.96 0.25 0.59 13.54 10.90 1.80
Y2O3 42.06 43.60 41.24 42.98 37.32 39.88 40.21 35.45 41.34 39.48 43.96 42.85 39.67 34.90 34.78 37.41 39.04 38.25 32.57 30.01 37.17
La2O3 <0.2 <0.2 <0.2 <0.2 <0.2 <0.2 <0.2 <0.2 <0.2 <0.2 <0.2 <0.2 <0.2 <0.2 <0.2 <0.2 <0.2 <0.2 <0.2 <0.2 <0.2
Ce2O3 <0.2 <0.2 <0.2 <0.2 <0.2 <0.2 <0.2 <0.2 <0.2 <0.2 <0.2 <0.2 <0.2 <0.2 <0.2 <0.2 <0.2 <0.2 <0.2 <0.2 <0.2
Nd2O3 0.68 0.59 0.66 <0.4 <0.4 <0.4 <0.4 <0.4 <0.4 <0.4 <0.4 <0.4 <0.4 <0.4 0.45 <0.4 <0.4 <0.4 0.72 0.50 <0.4
Sm2O3 1.64 0.76 1.45 0.84 0.81 1.54 0.55 1.99 0.56 0.80 <0.5 <0.5 0.94 0.54 1.68 0.92 0.89 <0.5 <0.5 <0.5 <0.5
Gd2O3 5.85 4.62 5.16 4.32 5.25 5.09 4.07 5.87 4.12 6.13 3.90 3.55 4.75 4.29 5.63 5.65 5.58 6.36 4.33 4.74 2.59
Pr2O3 0.32 <0.2 <0.2 0.23 0.68 0.27 <0.2 0.63 0.35 0.55 0.33 <0.2 0.33 <0.2 0.38 0.45 0.20 0.26 0.38 0.36 0.52
Dy2O3 7.08 5.81 7.01 6.26 9.34 7.98 7.78 8.22 7.82 8.49 6.73 6.63 8.20 6.68 8.68 9.25 9.58 9.68 7.48 7.93 4.50
Er2O3 3.46 3.72 3.97 4.02 4.58 3.99 4.48 3.89 5.11 4.02 4.61 3.89 3.76 4.36 3.79 4.56 4.09 4.02 3.68 3.51 5.18
Yb2O3 4.03 4.90 4.03 4.18 5.04 4.87 5.28 4.01 5.11 4.08 5.27 5.77 4.45 5.46 4.63 5.42 4.91 4.73 4.51 4.10 11.44 Total 101.5 100.9 99.7 100.2 100.5 100.6 97.3 101.6 97.3 96.8 95.6 94.3 98.1 94.4 95.9 99.9 100.0 97.8 94.3 94.0 93.3
PART 3 – Chapter 5
287
The Fe-Li-micas4-IV correspond to millimetric crystals underlining the centimetric quartz
zonation of the banded quartz veins of Stage IV. The Fe-Li-micas4-IV zoning is too thin to place
spots along the growth zonation (Figure 61F). Analyzed data reflect analysis performed in the
large and homogeneous rims of the grains. The calculated apparent ages range from 144.4 to
161.5 Ma. One group of calculated ages can be defined with a range between 153 and 163
Ma. Two other measurements show younger ages at ca. 143 and 152 Ma that could reflect
alteration. No particular petrological evidence could be associated with these two distinct
measurements. Integration of the data (n=5) yields an age of 158±2 Ma (1σ, MSWD=1.14;
Figure 64).
The greisen Fe-Li-micas from sample 14-MP-20 are millimetric crystals that are the
result of the alteration of the granite. Most of the selected grains display alteration on the rim
and in fractures. These zones have been avoid during analyses. The calculated apparent ages
range from 149.8 to 160.9 Ma. Three measurements are grouped within a range between 153
and 159 Ma. Three other measurements yield an older age between 157 and 163 Ma and two
younger ages between 147 and 155 Ma. These measurements are likely to reflect alteration
or the occurrence of inclusions. Integration of the data (n=5) yields an age of 155±1 Ma (1σ,
MSWD=1.29; Figure 64).
Finally, the Fe-Li-micas from granite sample MP-5-21 are millimetric homogeneous
crystals. These selected crystals are devoid of alteration or inclusions. The calculated apparent
ages of these Fe-Li-micas range from 145.5 to 160.4 Ma. Seven among nine measurement
display a continuum of ages between 151 and 163 Ma. Two other measurements display
younger ages between 143 and 149 Ma that could indicate alteration. Integration of the data
(n=7) yields an age of 156±1 Ma (1σ, MSWD=0.35; Figure 64).
From overall measurements among samples, a global continuum of calculated ages is
observed from 163 to 142 Ma and could reflect common processes among samples.
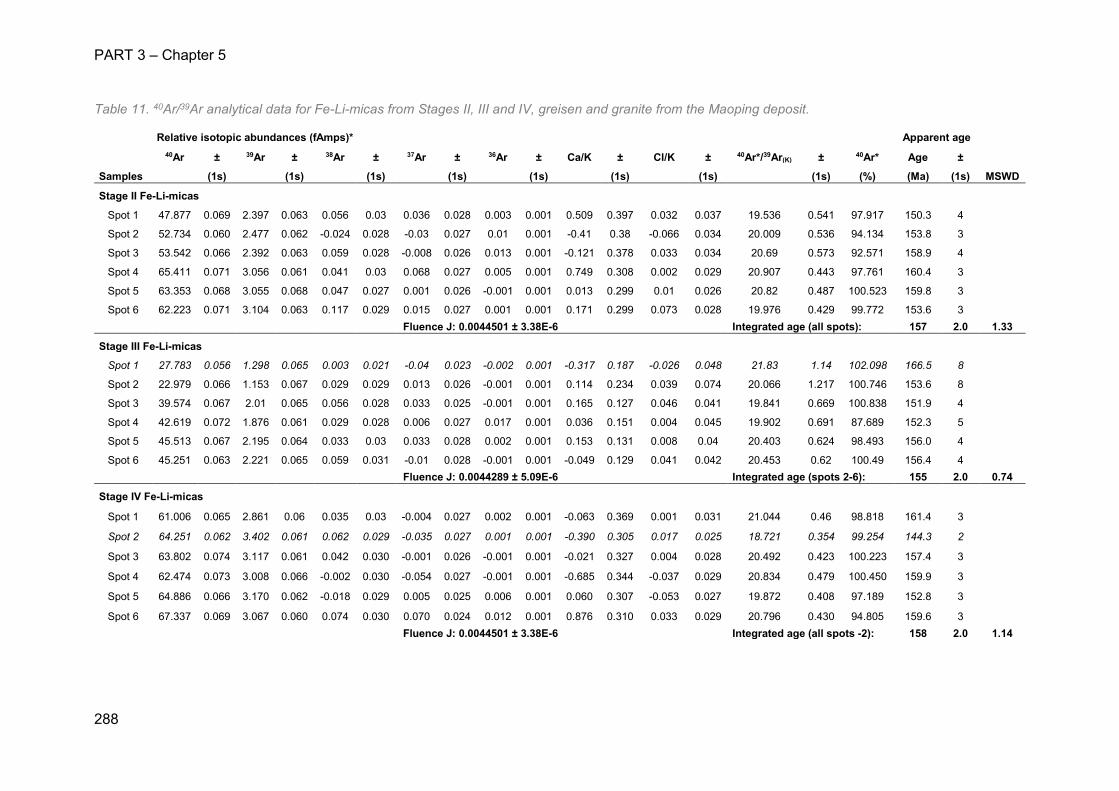
PART 3 – Chapter 5
288
Table 11. 40Ar/39Ar analytical data for Fe-Li-micas from Stages II, III and IV, greisen and granite from the Maoping deposit.
Relative isotopic abundances (fAmps)* Apparent age
40Ar ± 39Ar ± 38Ar ± 37Ar ± 36Ar ± Ca/K ± Cl/K ± 40Ar*/39Ar(K) ± 40Ar* Age ±
Samples (1s) (1s) (1s) (1s) (1s) (1s) (1s) (1s) (%) (Ma) (1s) MSWD
Stage II Fe-Li-micas
Spot 1 47.877 0.069 2.397 0.063 0.056 0.03 0.036 0.028 0.003 0.001 0.509 0.397 0.032 0.037 19.536 0.541 97.917 150.3 4
Spot 2 52.734 0.060 2.477 0.062 -0.024 0.028 -0.03 0.027 0.01 0.001 -0.41 0.38 -0.066 0.034 20.009 0.536 94.134 153.8 3
Spot 3 53.542 0.066 2.392 0.063 0.059 0.028 -0.008 0.026 0.013 0.001 -0.121 0.378 0.033 0.034 20.69 0.573 92.571 158.9 4
Spot 4 65.411 0.071 3.056 0.061 0.041 0.03 0.068 0.027 0.005 0.001 0.749 0.308 0.002 0.029 20.907 0.443 97.761 160.4 3
Spot 5 63.353 0.068 3.055 0.068 0.047 0.027 0.001 0.026 -0.001 0.001 0.013 0.299 0.01 0.026 20.82 0.487 100.523 159.8 3
Spot 6 62.223 0.071 3.104 0.063 0.117 0.029 0.015 0.027 0.001 0.001 0.171 0.299 0.073 0.028 19.976 0.429 99.772 153.6 3 Fluence J: 0.0044501 ± 3.38E-6 Integrated age (all spots): 157 2.0 1.33
Stage III Fe-Li-micas
Spot 1 27.783 0.056 1.298 0.065 0.003 0.021 -0.04 0.023 -0.002 0.001 -0.317 0.187 -0.026 0.048 21.83 1.14 102.098 166.5 8
Spot 2 22.979 0.066 1.153 0.067 0.029 0.029 0.013 0.026 -0.001 0.001 0.114 0.234 0.039 0.074 20.066 1.217 100.746 153.6 8
Spot 3 39.574 0.067 2.01 0.065 0.056 0.028 0.033 0.025 -0.001 0.001 0.165 0.127 0.046 0.041 19.841 0.669 100.838 151.9 4
Spot 4 42.619 0.072 1.876 0.061 0.029 0.028 0.006 0.027 0.017 0.001 0.036 0.151 0.004 0.045 19.902 0.691 87.689 152.3 5
Spot 5 45.513 0.067 2.195 0.064 0.033 0.03 0.033 0.028 0.002 0.001 0.153 0.131 0.008 0.04 20.403 0.624 98.493 156.0 4
Spot 6 45.251 0.063 2.221 0.065 0.059 0.031 -0.01 0.028 -0.001 0.001 -0.049 0.129 0.041 0.042 20.453 0.62 100.49 156.4 4 Fluence J: 0.0044289 ± 5.09E-6 Integrated age (spots 2-6): 155 2.0 0.74
Stage IV Fe-Li-micas
Spot 1 61.006 0.065 2.861 0.06 0.035 0.03 -0.004 0.027 0.002 0.001 -0.063 0.369 0.001 0.031 21.044 0.46 98.818 161.4 3
Spot 2 64.251 0.062 3.402 0.061 0.062 0.029 -0.035 0.027 0.001 0.001 -0.390 0.305 0.017 0.025 18.721 0.354 99.254 144.3 2
Spot 3 63.802 0.074 3.117 0.061 0.042 0.030 -0.001 0.026 -0.001 0.001 -0.021 0.327 0.004 0.028 20.492 0.423 100.223 157.4 3
Spot 4 62.474 0.073 3.008 0.066 -0.002 0.030 -0.054 0.027 -0.001 0.001 -0.685 0.344 -0.037 0.029 20.834 0.479 100.450 159.9 3
Spot 5 64.886 0.066 3.170 0.062 -0.018 0.029 0.005 0.025 0.006 0.001 0.060 0.307 -0.053 0.027 19.872 0.408 97.189 152.8 3
Spot 6 67.337 0.069 3.067 0.060 0.074 0.030 0.070 0.024 0.012 0.001 0.876 0.310 0.033 0.029 20.796 0.430 94.805 159.6 3 Fluence J: 0.0044501 ± 3.38E-6 Integrated age (all spots -2): 158 2.0 1.14
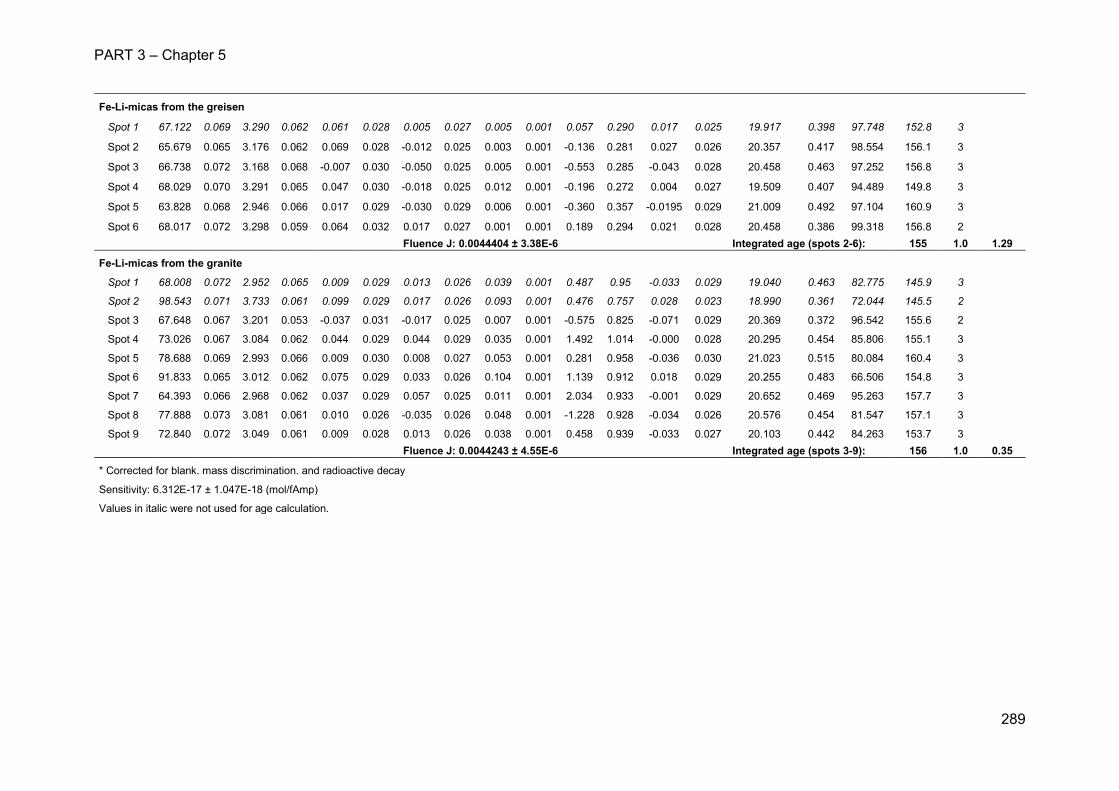
PART 3 – Chapter 5
289
Fe-Li-micas from the greisen
Spot 1 67.122 0.069 3.290 0.062 0.061 0.028 0.005 0.027 0.005 0.001 0.057 0.290 0.017 0.025 19.917 0.398 97.748 152.8 3
Spot 2 65.679 0.065 3.176 0.062 0.069 0.028 -0.012 0.025 0.003 0.001 -0.136 0.281 0.027 0.026 20.357 0.417 98.554 156.1 3
Spot 3 66.738 0.072 3.168 0.068 -0.007 0.030 -0.050 0.025 0.005 0.001 -0.553 0.285 -0.043 0.028 20.458 0.463 97.252 156.8 3
Spot 4 68.029 0.070 3.291 0.065 0.047 0.030 -0.018 0.025 0.012 0.001 -0.196 0.272 0.004 0.027 19.509 0.407 94.489 149.8 3
Spot 5 63.828 0.068 2.946 0.066 0.017 0.029 -0.030 0.029 0.006 0.001 -0.360 0.357 -0.0195 0.029 21.009 0.492 97.104 160.9 3
Spot 6 68.017 0.072 3.298 0.059 0.064 0.032 0.017 0.027 0.001 0.001 0.189 0.294 0.021 0.028 20.458 0.386 99.318 156.8 2 Fluence J: 0.0044404 ± 3.38E-6 Integrated age (spots 2-6): 155 1.0 1.29
Fe-Li-micas from the granite
Spot 1 68.008 0.072 2.952 0.065 0.009 0.029 0.013 0.026 0.039 0.001 0.487 0.95 -0.033 0.029 19.040 0.463 82.775 145.9 3
Spot 2 98.543 0.071 3.733 0.061 0.099 0.029 0.017 0.026 0.093 0.001 0.476 0.757 0.028 0.023 18.990 0.361 72.044 145.5 2
Spot 3 67.648 0.067 3.201 0.053 -0.037 0.031 -0.017 0.025 0.007 0.001 -0.575 0.825 -0.071 0.029 20.369 0.372 96.542 155.6 2
Spot 4 73.026 0.067 3.084 0.062 0.044 0.029 0.044 0.029 0.035 0.001 1.492 1.014 -0.000 0.028 20.295 0.454 85.806 155.1 3
Spot 5 78.688 0.069 2.993 0.066 0.009 0.030 0.008 0.027 0.053 0.001 0.281 0.958 -0.036 0.030 21.023 0.515 80.084 160.4 3
Spot 6 91.833 0.065 3.012 0.062 0.075 0.029 0.033 0.026 0.104 0.001 1.139 0.912 0.018 0.029 20.255 0.483 66.506 154.8 3
Spot 7 64.393 0.066 2.968 0.062 0.037 0.029 0.057 0.025 0.011 0.001 2.034 0.933 -0.001 0.029 20.652 0.469 95.263 157.7 3
Spot 8 77.888 0.073 3.081 0.061 0.010 0.026 -0.035 0.026 0.048 0.001 -1.228 0.928 -0.034 0.026 20.576 0.454 81.547 157.1 3
Spot 9 72.840 0.072 3.049 0.061 0.009 0.028 0.013 0.026 0.038 0.001 0.458 0.939 -0.033 0.027 20.103 0.442 84.263 153.7 3 Fluence J: 0.0044243 ± 4.55E-6 Integrated age (spots 3-9): 156 1.0 0.35
* Corrected for blank. mass discrimination. and radioactive decay
Sensitivity: 6.312E-17 ± 1.047E-18 (mol/fAmp)
Values in italic were not used for age calculation.
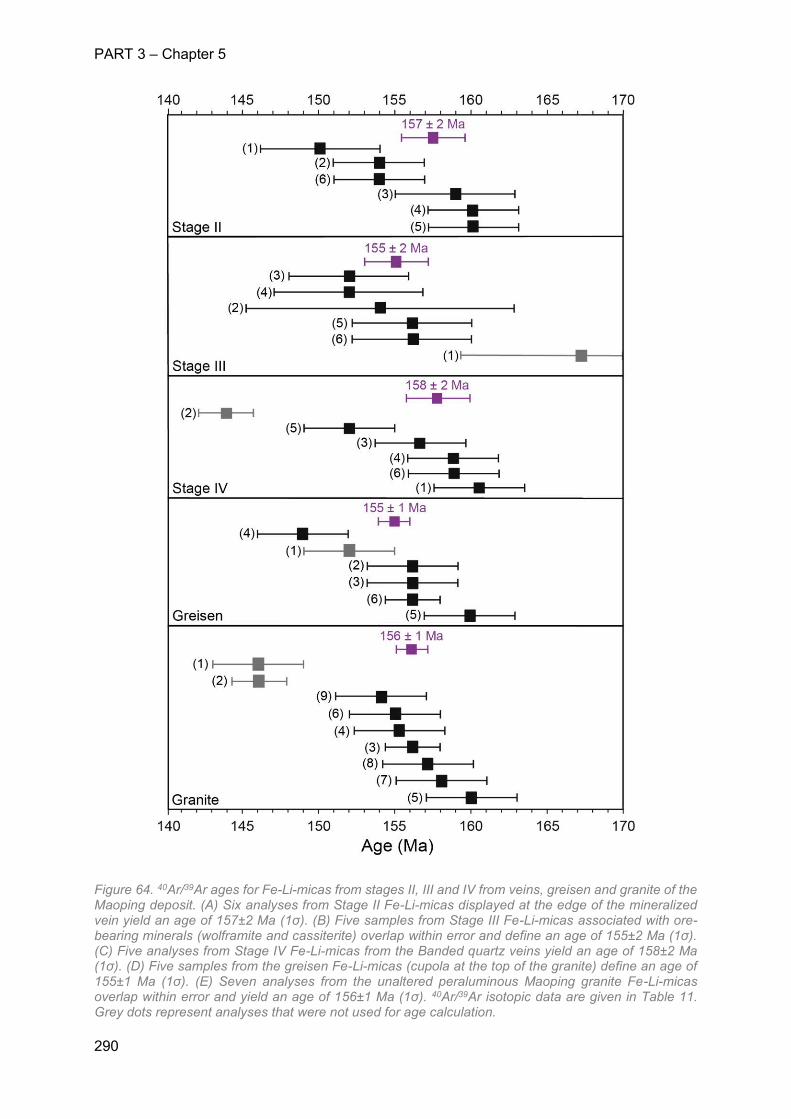
PART 3 – Chapter 5
290
Figure 64. 40Ar/39Ar ages for Fe-Li-micas from stages II, III and IV from veins, greisen and granite of the Maoping deposit. (A) Six analyses from Stage II Fe-Li-micas displayed at the edge of the mineralized vein yield an age of 157±2 Ma (1σ). (B) Five samples from Stage III Fe-Li-micas associated with ore-bearing minerals (wolframite and cassiterite) overlap within error and define an age of 155±2 Ma (1σ). (C) Five analyses from Stage IV Fe-Li-micas from the Banded quartz veins yield an age of 158±2 Ma (1σ). (D) Five samples from the greisen Fe-Li-micas (cupola at the top of the granite) define an age of 155±1 Ma (1σ). (E) Seven analyses from the unaltered peraluminous Maoping granite Fe-Li-micas overlap within error and yield an age of 156±1 Ma (1σ). 40Ar/39Ar isotopic data are given in Table 11. Grey dots represent analyses that were not used for age calculation.
PART 3 – Chapter 5
291
5.2 U-Pb wolframite dating
The wolframite samples of the two series have U contents from 14 to 22 ppm
(concentrate) and from 8 to 12 ppm (vein sample), whereas Pb contents are below 1.5 ppm
with variable contributions of common lead (Table 12). The variable contributions of common
lead account for the large range of measured 206Pb/204Pb ratios from 55 to 420. The wolframite
samples show essentially no variation in 208Pb/204Pb (37.90 – 39.96) with 206Pb/204Pb, which
indicates the Th contents are low in comparison to the amounts of common Pb present (0.05
to 0.72 ppm). Only sample 9 (Table 12) has a high 208Pb/204Pb at a high 206Pb/204Pb. Using
208Pbrad/206Pbrad, the measured U contents, and an age of 160 Ma indicates that this sample
had a Th content ca. 120 ppm. As Th content in wolframite typically are low, this high Th
content indicates that this sample hosted micro-inclusions of a mineral with high Th contents
and slightly enhanced common Pb contents. Monazite might be such an inclusion. Sample 13
(Table 12) has a high Pb (29.4 ppm) content, which may be due to small sulfide inclusions,
and in situ growth of radiogenic Pb contributed only insignificantly to the Pb budget of this
sample. Therefore, we used the U and Pb concentration and the measured Pb isotopic
composition of this sample to estimate the initial Pb isotopic composition for an age of 160 Ma
and used this Pb isotopic composition to calculate the 206Pb/238U and 207Pb/235U ratios of the
other samples.
The 206Pb/238U vs 207Pb/235U diagram with all data from each sample both show two
clusters of ages defined around 160 and 155 Ma (Figure 65A and B). Two samples are
displayed over these clusters with higher Pb content in the concentrate sample (4 and 5) and
could be due to micro-inclusions (Figure 65A). Five samples of the concentrate wolframite
define a concordia age of 160.37 ± 0.36 Ma (1σ, MSWD = 0.29; Figure 65C) and three samples
of the vein wolframite define a concordia age of 156.28 ± 0.46 Ma (1σ, MSWD = 0.27; Figure
8D).
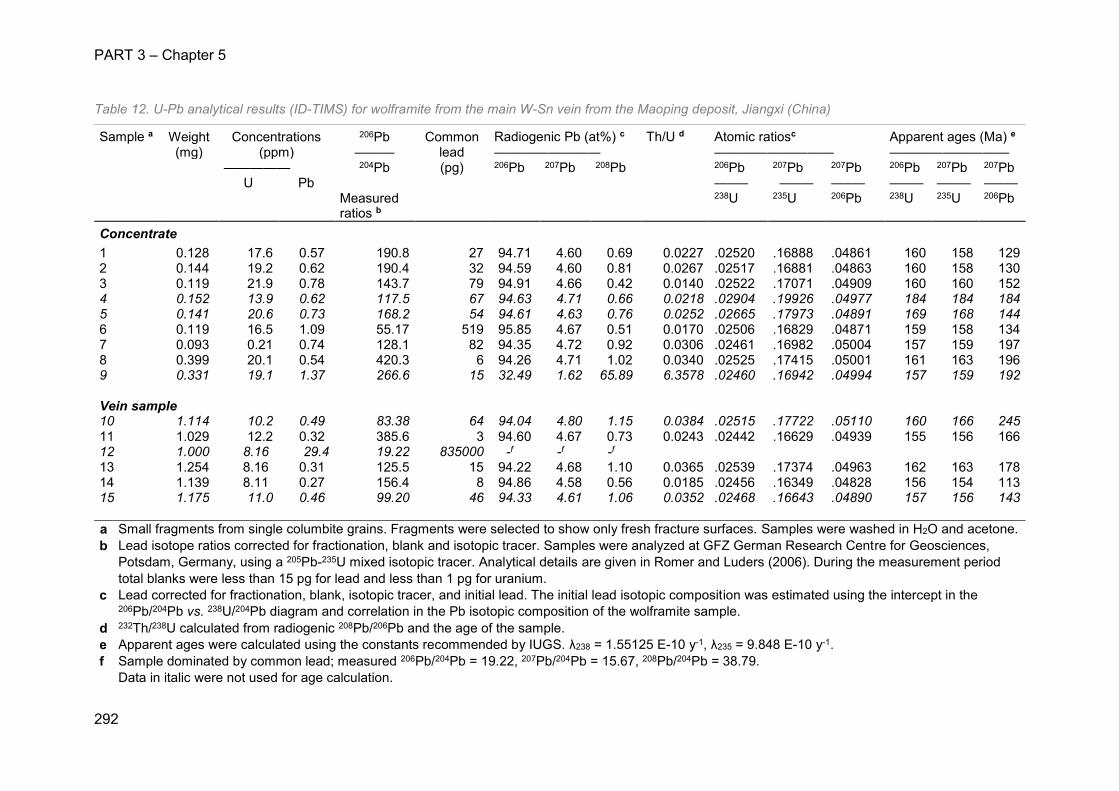
PART 3 – Chapter 5
292
Table 12. U-Pb analytical results (ID-TIMS) for wolframite from the main W-Sn vein from the Maoping deposit, Jiangxi (China)
Sample a Weight Concentrations 206Pb Common Radiogenic Pb (at%) c Th/U d Atomic ratiosc Apparent ages (Ma) e (mg) (ppm) ——— lead ———————— ————————— ————————— ————— 204Pb (pg) 206Pb 207Pb 208Pb 206Pb 207Pb 207Pb 206Pb 207Pb 207Pb U Pb —–— —–— —–— —–— —–— —–— Measured
ratios b 238U 235U 206Pb 238U 235U 206Pb
Concentrate 1 0.128 17.6 0.57 190.8 27 94.71 4.60 0.69 0.0227 .02520 .16888 .04861 160 158 129 2 0.144 19.2 0.62 190.4 32 94.59 4.60 0.81 0.0267 .02517 .16881 .04863 160 158 130 3 0.119 21.9 0.78 143.7 79 94.91 4.66 0.42 0.0140 .02522 .17071 .04909 160 160 152 4 0.152 13.9 0.62 117.5 67 94.63 4.71 0.66 0.0218 .02904 .19926 .04977 184 184 184 5 0.141 20.6 0.73 168.2 54 94.61 4.63 0.76 0.0252 .02665 .17973 .04891 169 168 144 6 0.119 16.5 1.09 55.17 519 95.85 4.67 0.51 0.0170 .02506 .16829 .04871 159 158 134 7 0.093 0.21 0.74 128.1 82 94.35 4.72 0.92 0.0306 .02461 .16982 .05004 157 159 197 8 0.399 20.1 0.54 420.3 6 94.26 4.71 1.02 0.0340 .02525 .17415 .05001 161 163 196 9 0.331 19.1 1.37 266.6 15 32.49 1.62 65.89 6.3578 .02460 .16942 .04994 157 159 192
Vein sample 10 1.114 10.2 0.49 83.38 64 94.04 4.80 1.15 0.0384 .02515 .17722 .05110 160 166 245 11 1.029 12.2 0.32 385.6 3 94.60 4.67 0.73 0.0243 .02442 .16629 .04939 155 156 166 12 1.000 8.16 29.4 19.22 835000 -f -f -f 13 1.254 8.16 0.31 125.5 15 94.22 4.68 1.10 0.0365 .02539 .17374 .04963 162 163 178 14 1.139 8.11 0.27 156.4 8 94.86 4.58 0.56 0.0185 .02456 .16349 .04828 156 154 113 15 1.175 11.0 0.46 99.20 46 94.33 4.61 1.06 0.0352 .02468 .16643 .04890 157 156 143 a Small fragments from single columbite grains. Fragments were selected to show only fresh fracture surfaces. Samples were washed in H2O and acetone. b Lead isotope ratios corrected for fractionation, blank and isotopic tracer. Samples were analyzed at GFZ German Research Centre for Geosciences,
Potsdam, Germany, using a 205Pb-235U mixed isotopic tracer. Analytical details are given in Romer and Luders (2006). During the measurement period total blanks were less than 15 pg for lead and less than 1 pg for uranium.
c Lead corrected for fractionation, blank, isotopic tracer, and initial lead. The initial lead isotopic composition was estimated using the intercept in the 206Pb/204Pb vs. 238U/204Pb diagram and correlation in the Pb isotopic composition of the wolframite sample.
d 232Th/238U calculated from radiogenic 208Pb/206Pb and the age of the sample. e Apparent ages were calculated using the constants recommended by IUGS. λ238 = 1.55125 E-10 y-1, λ235 = 9.848 E-10 y-1. f Sample dominated by common lead; measured 206Pb/204Pb = 19.22, 207Pb/204Pb = 15.67, 208Pb/204Pb = 38.79.
Data in italic were not used for age calculation.
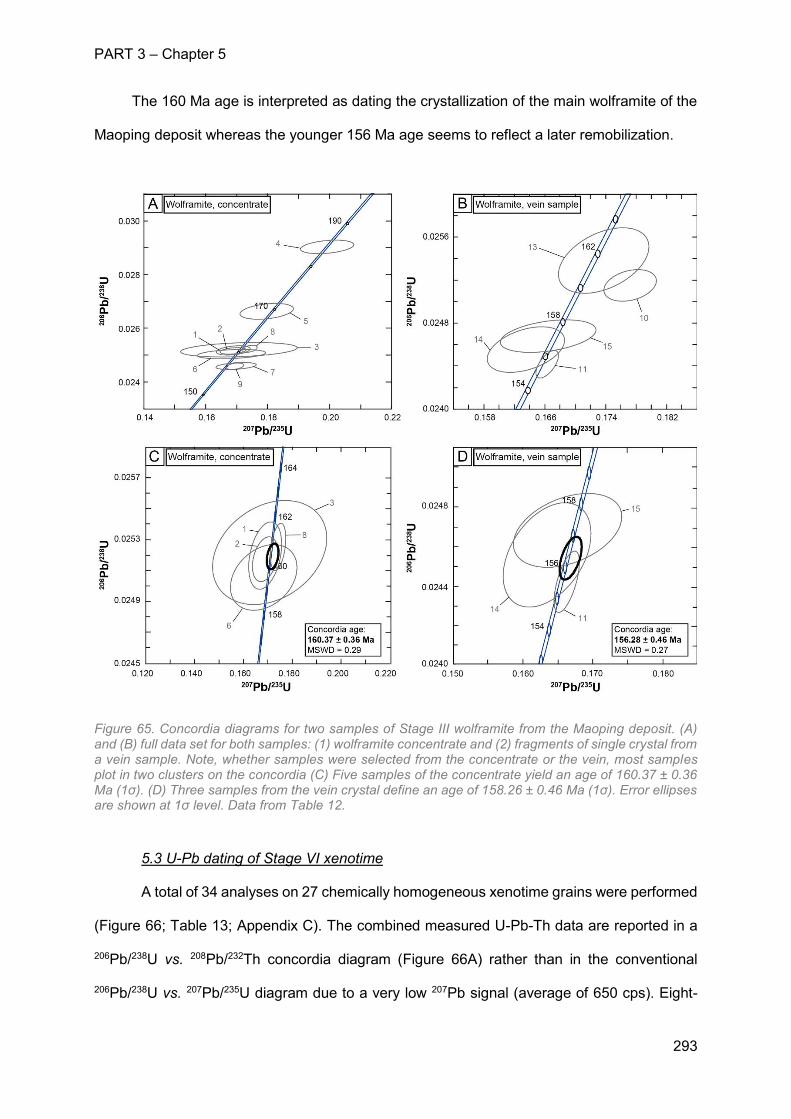
PART 3 – Chapter 5
293
The 160 Ma age is interpreted as dating the crystallization of the main wolframite of the
Maoping deposit whereas the younger 156 Ma age seems to reflect a later remobilization.
Figure 65. Concordia diagrams for two samples of Stage III wolframite from the Maoping deposit. (A) and (B) full data set for both samples: (1) wolframite concentrate and (2) fragments of single crystal from a vein sample. Note, whether samples were selected from the concentrate or the vein, most samples plot in two clusters on the concordia (C) Five samples of the concentrate yield an age of 160.37 ± 0.36 Ma (1σ). (D) Three samples from the vein crystal define an age of 158.26 ± 0.46 Ma (1σ). Error ellipses are shown at 1σ level. Data from Table 12.
5.3 U-Pb dating of Stage VI xenotime
A total of 34 analyses on 27 chemically homogeneous xenotime grains were performed
(Figure 66; Table 13; Appendix C). The combined measured U-Pb-Th data are reported in a
206Pb/238U vs. 208Pb/232Th concordia diagram (Figure 66A) rather than in the conventional
206Pb/238U vs. 207Pb/235U diagram due to a very low 207Pb signal (average of 650 cps). Eight-
PART 3 – Chapter 5
294
teen concordant analyses cluster in two main groups. Nine concordant analyses overlap within
error and yield an age of 152.5±1.3 Ma (1σ, MSWD = 1.9), whereas another nine samples
yield an age of 130.1±1.2 Ma (1σ, MSWD = 2.1; Figure 66C and D). The two generations could
not be distinguished by shapes, position in the fluorite zoning nor chemical composition.
Moreover, ages do not represent the core and rim timing.
Between the two clusters, ellipses spread a continuum of measurements broadly
aligned on the concordia line. These measurements seem to represent a mixing between two
distinct end-members. Two ellipses are also located on the concordia line but yield younger
ages compared to the two clusters (10 and 4 measurements). These ellipses could reflect
alteration of the grains although no alteration textures were observed by SEM. The same thing
applies to the two ellipses that are isolated, far from the concordia line with high 208Pb/232Th
ratios (15 and 28). These measurements could reflect the occurrence of inclusions in xenotime
crystals (i.e. sulphides) that were not previously observed by SEM but could have been
revealed by laser ablation.
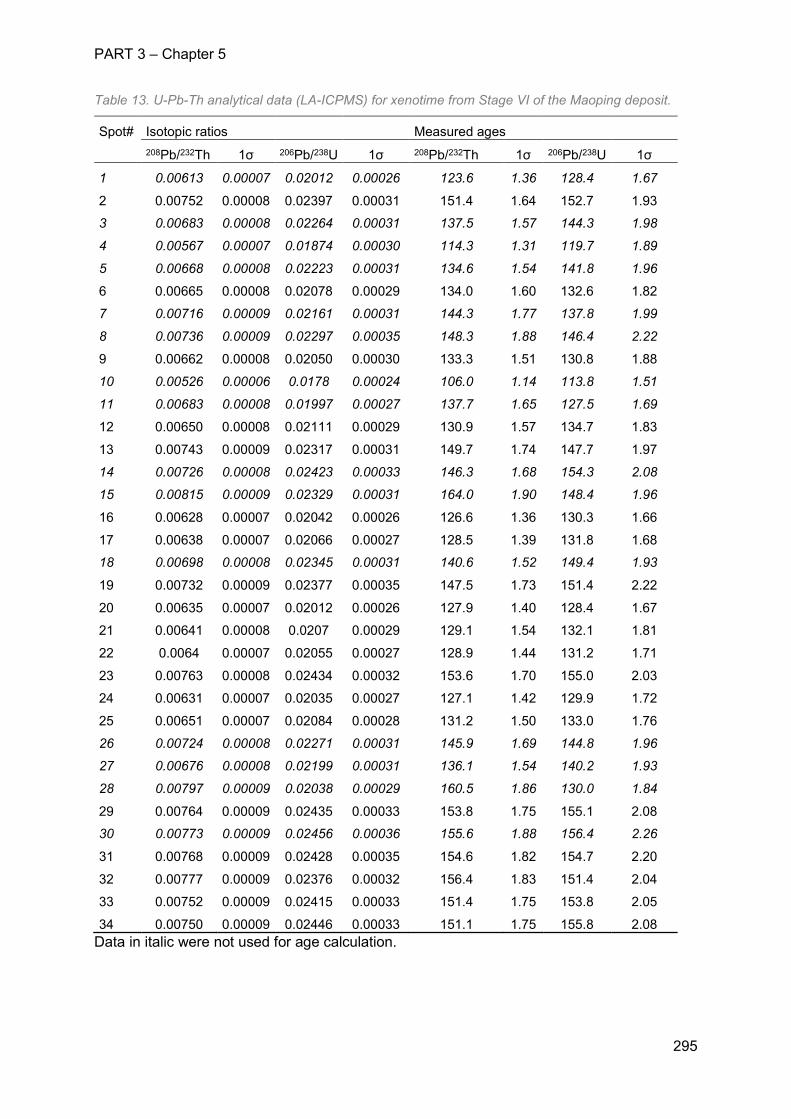
PART 3 – Chapter 5
295
Table 13. U-Pb-Th analytical data (LA-ICPMS) for xenotime from Stage VI of the Maoping deposit.
Spot# Isotopic ratios Measured ages
208Pb/232Th 1σ 206Pb/238U 1σ 208Pb/232Th 1σ 206Pb/238U 1σ
1 0.00613 0.00007 0.02012 0.00026 123.6 1.36 128.4 1.67
2 0.00752 0.00008 0.02397 0.00031 151.4 1.64 152.7 1.93
3 0.00683 0.00008 0.02264 0.00031 137.5 1.57 144.3 1.98
4 0.00567 0.00007 0.01874 0.00030 114.3 1.31 119.7 1.89
5 0.00668 0.00008 0.02223 0.00031 134.6 1.54 141.8 1.96
6 0.00665 0.00008 0.02078 0.00029 134.0 1.60 132.6 1.82
7 0.00716 0.00009 0.02161 0.00031 144.3 1.77 137.8 1.99
8 0.00736 0.00009 0.02297 0.00035 148.3 1.88 146.4 2.22
9 0.00662 0.00008 0.02050 0.00030 133.3 1.51 130.8 1.88
10 0.00526 0.00006 0.0178 0.00024 106.0 1.14 113.8 1.51
11 0.00683 0.00008 0.01997 0.00027 137.7 1.65 127.5 1.69
12 0.00650 0.00008 0.02111 0.00029 130.9 1.57 134.7 1.83
13 0.00743 0.00009 0.02317 0.00031 149.7 1.74 147.7 1.97
14 0.00726 0.00008 0.02423 0.00033 146.3 1.68 154.3 2.08
15 0.00815 0.00009 0.02329 0.00031 164.0 1.90 148.4 1.96
16 0.00628 0.00007 0.02042 0.00026 126.6 1.36 130.3 1.66
17 0.00638 0.00007 0.02066 0.00027 128.5 1.39 131.8 1.68
18 0.00698 0.00008 0.02345 0.00031 140.6 1.52 149.4 1.93
19 0.00732 0.00009 0.02377 0.00035 147.5 1.73 151.4 2.22
20 0.00635 0.00007 0.02012 0.00026 127.9 1.40 128.4 1.67
21 0.00641 0.00008 0.0207 0.00029 129.1 1.54 132.1 1.81
22 0.0064 0.00007 0.02055 0.00027 128.9 1.44 131.2 1.71
23 0.00763 0.00008 0.02434 0.00032 153.6 1.70 155.0 2.03
24 0.00631 0.00007 0.02035 0.00027 127.1 1.42 129.9 1.72
25 0.00651 0.00007 0.02084 0.00028 131.2 1.50 133.0 1.76
26 0.00724 0.00008 0.02271 0.00031 145.9 1.69 144.8 1.96
27 0.00676 0.00008 0.02199 0.00031 136.1 1.54 140.2 1.93
28 0.00797 0.00009 0.02038 0.00029 160.5 1.86 130.0 1.84
29 0.00764 0.00009 0.02435 0.00033 153.8 1.75 155.1 2.08
30 0.00773 0.00009 0.02456 0.00036 155.6 1.88 156.4 2.26
31 0.00768 0.00009 0.02428 0.00035 154.6 1.82 154.7 2.20
32 0.00777 0.00009 0.02376 0.00032 156.4 1.83 151.4 2.04
33 0.00752 0.00009 0.02415 0.00033 151.4 1.75 153.8 2.05
34 0.00750 0.00009 0.02446 0.00033 151.1 1.75 155.8 2.08 Data in italic were not used for age calculation.
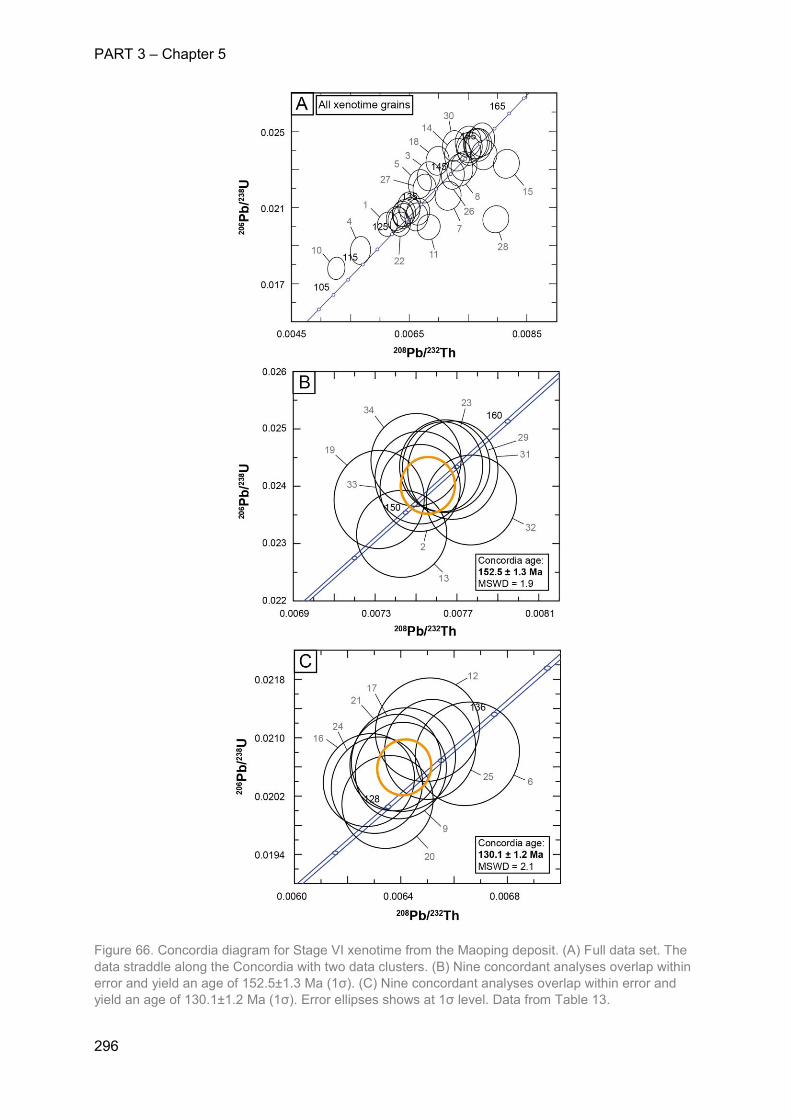
PART 3 – Chapter 5
296
Figure 66. Concordia diagram for Stage VI xenotime from the Maoping deposit. (A) Full data set. The data straddle along the Concordia with two data clusters. (B) Nine concordant analyses overlap within error and yield an age of 152.5±1.3 Ma (1σ). (C) Nine concordant analyses overlap within error and yield an age of 130.1±1.2 Ma (1σ). Error ellipses shows at 1σ level. Data from Table 13.
PART 3 – Chapter 5
297
6. Discussion
6.1 Definition of multiple fluid circulations in the Maoping deposit and the Dayu district
Three types of dating methods including 40Ar-39Ar on micas, U-Pb on wolframite and U-
Pb-Th on xenotime were performed on multiple generations of minerals from the granite,
greisen and veins from the Maoping deposit.
40Ar-39Ar measurements on micas from the granite, greisen and the veins yield a
continuum of ages from 163 and 142 Ma (considering errors). This range is observed on every
sample and indicates perturbations of the 40Ar-39Ar isotopic system of the grains. These
perturbations are likely to represent the circulation of hydrothermal fluids in our system as
observed by Legros et al. (2016). Two hypothesis can be drawn: (i) the isotopic system is
completely reset and the calculated age indicates the age of the fluid circulation, or (ii) the
calculated ages reflect a mixed age between the initial stage of crystallization and the
circulation of the fluid. Considering the continuum of ages observed, the second hypothesis
appears to be more likely. In that case, the minimum age of crystallization of micas would be
at ca. 160 Ma while the maximum age of circulation of the remobilizing fluid would be at ca.
145 Ma. Therefore, the crystallization of the granitic intrusion cannot be constrained by this
study.
Concerning, the U-Pb measurements on wolframite and xenotime, perturbations are
also observed. Both wolframite and xenotime samples yield two concordant distinct ages that
could reflect both crystallization and fluid circulation ages that also affected the micas. Knowing
that wolframite, micas and xenotime from the veins all crystallize from hydrothermal fluids
circulating after the magmatic-hydrothermal transition, this hypothesis allows to propose four
distinct stages of fluid circulation.
The first stage is constrained by the age of crystallization of the wolframite at ca. 160
Ma. This stage is also constrained by U-Pb measurements on cassiterite samples from the
Xihuashan and Piaotang deposits, located in the same district (Bai et al., 2011; Zhang et al.,

PART 3 – Chapter 5
298
2017). Therefore, this stage defined in the Maoping deposit could reflect the circulation of W-
Sn-rich fluids in association with the district scale magmatism.
Figure 67. Comparison and compilation of multiple dating data from this study and Feng et al. (2011b) on the Maoping deposit and multiple authors in the Dayu district. [1] Feng et al., 2011b, [2] Hu et al., 2012a, [3] Bai et al., 2011, [4] Zhang et al., 2017, [5] Zhang et al., 2009.
The second stage is defined by U-Pb measurements on wolframite and is interpreted
as the timing of wolframite alteration. This stage is constrained at ca. 156 Ma. This age
corresponds to the Re-Os measurements performed on molybdenite from the greisen of the
Maoping deposit by Feng et al. (2011). The alteration of the wolframite as well as micas could
partially be due to the fluid circulations associated with the greisenization of the granite. Fluid
circulation during this period is also observed by Re-Os measurements performed on
molybdenite from the veins of the Baxiannao, Niuling and Xihuashan deposits from the same
district (Feng et al., 2011b; Hu et al., 2012a).
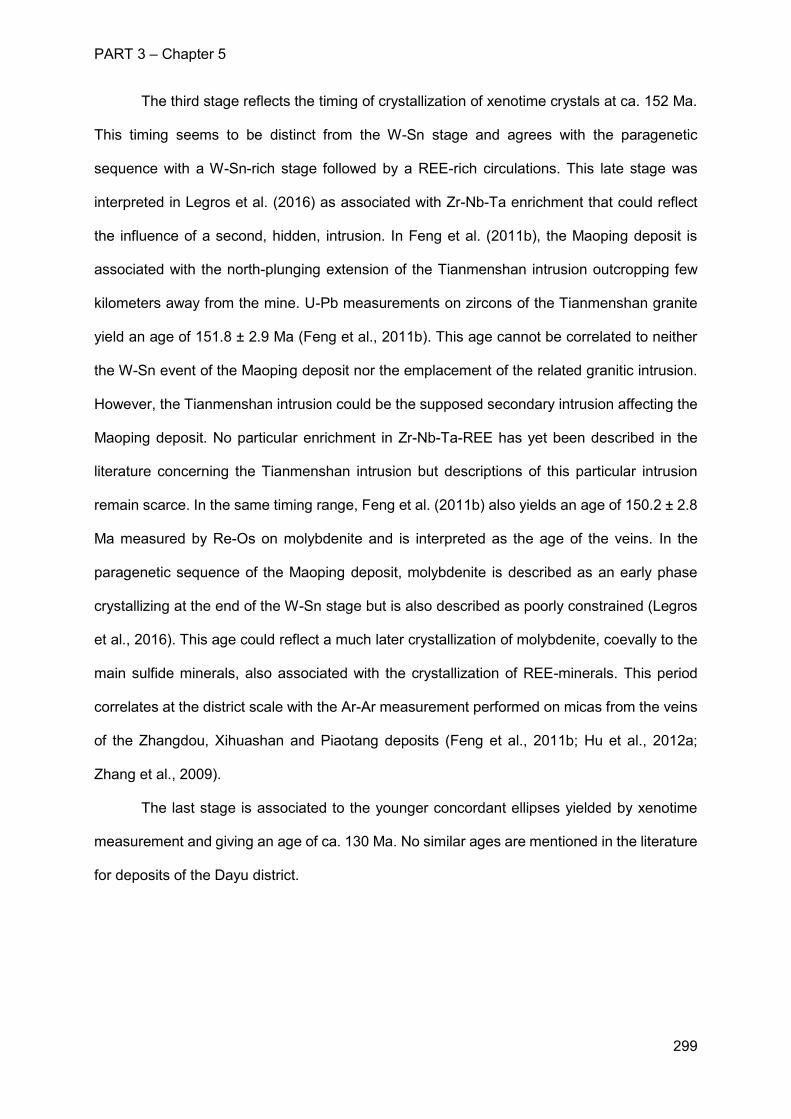
PART 3 – Chapter 5
299
The third stage reflects the timing of crystallization of xenotime crystals at ca. 152 Ma.
This timing seems to be distinct from the W-Sn stage and agrees with the paragenetic
sequence with a W-Sn-rich stage followed by a REE-rich circulations. This late stage was
interpreted in Legros et al. (2016) as associated with Zr-Nb-Ta enrichment that could reflect
the influence of a second, hidden, intrusion. In Feng et al. (2011b), the Maoping deposit is
associated with the north-plunging extension of the Tianmenshan intrusion outcropping few
kilometers away from the mine. U-Pb measurements on zircons of the Tianmenshan granite
yield an age of 151.8 ± 2.9 Ma (Feng et al., 2011b). This age cannot be correlated to neither
the W-Sn event of the Maoping deposit nor the emplacement of the related granitic intrusion.
However, the Tianmenshan intrusion could be the supposed secondary intrusion affecting the
Maoping deposit. No particular enrichment in Zr-Nb-Ta-REE has yet been described in the
literature concerning the Tianmenshan intrusion but descriptions of this particular intrusion
remain scarce. In the same timing range, Feng et al. (2011b) also yields an age of 150.2 ± 2.8
Ma measured by Re-Os on molybdenite and is interpreted as the age of the veins. In the
paragenetic sequence of the Maoping deposit, molybdenite is described as an early phase
crystallizing at the end of the W-Sn stage but is also described as poorly constrained (Legros
et al., 2016). This age could reflect a much later crystallization of molybdenite, coevally to the
main sulfide minerals, also associated with the crystallization of REE-minerals. This period
correlates at the district scale with the Ar-Ar measurement performed on micas from the veins
of the Zhangdou, Xihuashan and Piaotang deposits (Feng et al., 2011b; Hu et al., 2012a;
Zhang et al., 2009).
The last stage is associated to the younger concordant ellipses yielded by xenotime
measurement and giving an age of ca. 130 Ma. No similar ages are mentioned in the literature
for deposits of the Dayu district.
PART 3 – Chapter 5
300
6.2 Comparison to the Nanling Range
Multiple dating ages on W-Sn vein-type deposits have been synthetized on Figure 68
at the Nanling metallogenic belt scale (details in Appendix D and E). The probability repartition
of ages between 50 and 250 Ma (Figure 68B) is consistent with previous published data
interpreting three epochs of fluid circulation in the Nanling region in which the 150-160 Ma
range was the most developed. However, the probability repartition of ages in the 130-170 Ma
range (Figure 68C) meets our previous observations in the Dayu district of a multiple
circulations in these deposits in the 150-160 Ma period. Similarly to observations made in the
Dayu district, the repartition is developed in three peaks of fluid circulations although periods
need to be adjusted. Moreover, another range of ages appears between 130 and 140 Ma as
observed at Maoping, mostly controlled by the work of Wang et al. (2016) by U-Pb
measurements of hydrothermal zircons. The significance and consistency of these ages with
our study will be further discussed in the following.
6.2.1 The tungsten mineralization
Within the Nanling Range and more specifically in the southern Jiangxi and Hunan
provinces, multiple fluid inclusion studies have been carried on several deposits as Xihuashan
(Wei et al., 2012), Yaogangxian (Hu et al., 2012b), Dajishan, Dangping, Piaotang, Pangushan
(Ni et al., 2015), Taoxikeng (Wang et al., 2012b), Shimenshi (Gong et al., 2015; Wei et al.,
2017), Baxiannao (Feng et al., 2012), Shizhuyuan and Yejiwei (Xuexin et al., 1990). Fluid
inclusion studies have been performed on both transparent and opaque minerals and allow to
distinguish different processes for gangue and W-Sn minerals. The commonly interpreted
model invoke either two fluids (magmatic dominant and meteoric minor) mixing or a single fluid
(magmatic) cooling, leading to the precipitation of ore minerals. In the Maoping and Piaotang
deposits, fluid circulation posterior to the W-Sn mineralization has also been interpreted in
association with the emplacement of a second intrusion. In conclusion, it is known that multiple
fluid circulations exist in W-Sn deposits from the Nanling Range and that fluids associated to
the W-Sn mineralization usually display different characteristics compared to gangue minerals.
PART 3 – Chapter 5
301
Owing that, the timing of W-Sn deposition in the Nanling Range can only be constrained
by the three ages on cassiterite and wolframite previously described in the Dayu district at ca.
160 Ma. Other ages are subjected to reflect either: (i) mixing ages of fluid circulations, (ii) reset
ages or, (iii) the age of crystallization the analyzed gangue minerals that does not necessarily
reflects the age of W-Sn mineralization.
6.2.2 The 130 Ma event
In the literature, very few geodynamic or metallogenic events have been described in the 130
Ma period in the Nanling range. However, Wang et al. (2016 and references therein) underlines
a similar event around 130 Ma in the Nanling range as a new proxy for the tungsten
mineralization, interpreted as disconnected from the granite crystallization. The event has been
dated by U-Pb method on hydrothermal zircons under the principle that zircons coexist with
the ore minerals and thus should form from the same hydrothermal fluids (Wang et al., 2016).
In the Maoping deposit, hydrothermal zircons have also been described but coevally to the
banded quartz veins on Stage IV and petrologically postdating the tungsten mineralization.
The mineralogical assemblage presented by Wang et al. (2016) is very similar to our
observations on the Maoping deposit associating hydrothermal zircons to REE minerals and
fluorites. This event is not related to the crystallization of the ore minerals but is associated
with another metallogenic assemblage enriched in Nb-Ta-Zr-REE. This signature could
unravel another magmatic and mineralizing event in the Nanling metallogenic belt that would
relate to a peralkaline source emplaced around 130 Ma as interpreted in Legros et al. (2016).
Such a source could explain the renewal of fluid circulations at ca. 130 Ma in the Nanling
Range and appears to affect the previously formed W-Sn deposits.
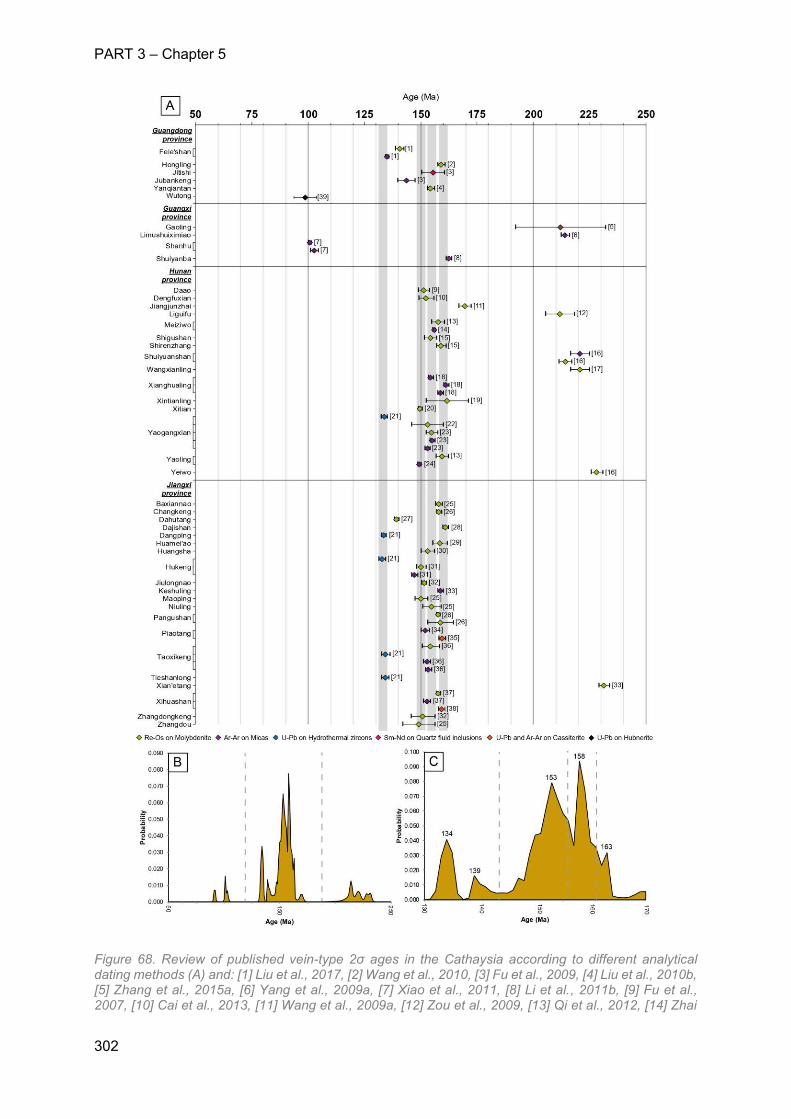
PART 3 – Chapter 5
302
Figure 68. Review of published vein-type 2σ ages in the Cathaysia according to different analytical dating methods (A) and: [1] Liu et al., 2017, [2] Wang et al., 2010, [3] Fu et al., 2009, [4] Liu et al., 2010b, [5] Zhang et al., 2015a, [6] Yang et al., 2009a, [7] Xiao et al., 2011, [8] Li et al., 2011b, [9] Fu et al., 2007, [10] Cai et al., 2013, [11] Wang et al., 2009a, [12] Zou et al., 2009, [13] Qi et al., 2012, [14] Zhai

PART 3 – Chapter 5
303
et al., 2010, [15] Fu et al., 2008, [16] Zhang et al., 2015b, [17] Zhang et al., 2013, [18] Yuan et al., 2007, [19] Yuan et al., 2012, [20] Liang et al., 2016, [21] Wang et al., 2016, [22] Wang et al., 2008, [23] Peng et al., 2006, [24] Zhai et al., 2011, [25] Feng et al., 2011b, [26] Zeng et al., 2011, [27] Mao et al., 2013 [28] Zhang et al., 2011, [29] Feng et al., 2015, [30] Huang et al., 2011, [31] Liu et al., 2011, [32] Feng et al., 2011a, [33] Liu et al., 2008, [34] Zhang et al., 2009, [35] Zhang et al., 2017, [36] Guo et al., 2011a, [37] Hu et al., 2012a, [38] Bai et al., 2011, [39] Lecumberri-Sanchez et al., 2014. (B) Probability diagram of all ages from W-Sn vein-type deposits collected in the literature and zoom (C) on the 130-170 Ma most productive period.
7. Conclusion
This study raises evidences of multiple fluid circulations in the Nanling Range and in particular
in the Maoping deposit. These circulations induce perturbations of the 40Ar-39Ar and U-Pb
systems of both gangue and W-Sn minerals. The deconvolution of measurements performed
on micas, wolframite and xenotime allow to propose four timing of fluid circulations in the
Maoping deposit: (i) fluids responsible for the W-Sn mineralization at ca. 160 Ma, (ii) fluid
circulation at ca. 156 Ma associated with the greisenization and responsible for the alteration
wolframite samples, (iii) fluids crystallizing the late filling stages in association with REE-
minerals and sulfides at ca. 152 Ma, and (iv) REE- and Zr-rich fluids circulating at ca. 130 Ma.
These observations are corroborated by measurements performed at the district scale but also
at the scale of the Nanling Range where cassiterite U-Pb dating confirm an early emplacement
of W-Sn deposit at ca. 160 Ma. As fluids crystallizing gangue minerals do not necessarily reflect
the ore-forming fluids, more direct dating analyses of ore minerals in the Nanling Range need
to be performed.

PART 3 – Chapter 5
305
References
Bai, X.J., Wang, M., Lu, K.H., Fang, J.L., Pu, Z.P., Qiu, H.N., 2011. Direct dating of cassiterite
by 40Ar/39Ar progressive crushing. Chinese Science Bulletin 56, 1899–1904 (in
Chinese).
Best, M.G., Christiansen, E.H., Deino, A.L., Grommé, C.S., Tingey, D.G., 1995. Correlation
and emplacement of a large, zoned, discontinuously exposed ash flow sheet; the
40Ar/39Ar chronology, paleomagnetism, and petrology of the Pahranagat Formation,
Nevada. Journal of Geophysical Research 100, 24593-24609.
Boutin, A., de Saint Blanquat, M., Poujol, M., Boulvais, P., de Parseval, P., Rouleau, C.,
Robert, J.-F. (2016). Succession of Permian and Mesozoic metasomatic events in the
eastern Pyrenees with emphasis on the Trimouns talc-chlorite deposit. International
Journal of Earth Sciences, 105, 747–770. DOI 10.1007/s00531-015-1223-x.
Cai, Y., Lu, J.J., Ma, D.S., Huang, H., Zhang, H.F., 2013. Chronology and geochemical
characteristics of Late Indosinian Dengfuxian two-mica granite in eastern Hunan
Province, China, and its significance. Acta Petrologica Sinica 29, 4215–4231 (in
Chinese).
Charvet, J., 2013. The Neoproterozoic-Early Paleozoic tectonic evolution of the South China
Block: an overview. Journal of Asian Earth Sciences 74, 198-209.
Charvet, J., Faure, M, Caridroit, M., Guidi, A., 1985. Some tectonic and tectonogenetic aspects
of SW Japan: an Alpine-type orogen in an island-arc position. N. Nasu (Ed.), Formation
of Active Ocean Margin, Terra Science Publication Company, Tokyo, 791-817.
Charvet, J., Lapierre, H., Yu, Y.W., 1999. Geodynamic significance of the Mesozoic volcanism
of southeastern China. Journal of Southeast Asian Earth Sciences 9, 387-396.
Charvet, J., Shu, L-S., Faure, M., Choulet, F., Wang, B., Lu, H-F., Le Breton, N., 2010.
Structural development of the Lower Palaeozoic belt of South China: genesis of an
intracontinental orogeny. Journal of Asian Earth Sciences 39, 309-330.
Dazé, A., Lee, J.K., Villeneuve, M., 2003. An intercalibration study of the Fish Canyon sanidine
and biotite 40Ar/39Ar standards and some comments on the age of the Fish Canyon
Tuff. Chemical Geology 199, 111-127.
Faure, M., Sun, Y., Shu, L., Monie, P., Charvet, J., 1996. Extensional tectonics within a
subduction-type orogen. The case study of the Wugongshan dome (Jiangxi Province,
southeastern China). Tectonophysics 263, 77-106.
PART 3 – Chapter 5
306
Feng, C., Fan, H., Qu, W., Zeng, Z., Ding, M., 2011a. Molybdenite Re-Os isotopic dating on
different types of tungsten deposits in southeast of Jiulongnao ore field and its
geological significances. China tungsten industry 26, 6-11 (in Chinese with English
abstract).
Feng, C., Zeng, Z., Zhang, D., Qu, W., Du, A., Li, D., She, H., 2011b. SHRIMP zircon U–Pb
and molybdenite Re–Os isotopic dating of the tungsten deposits in the Tianmenshan–
Hongtaoling W–Sn orefield, southern Jiangxi Province, China, and geological
implications. Ore Geology Reviews 43, 8-25.
Feng, C.Y., Wang, S., Zeng, Z.L., Zhang, D.H., Li, D.X., She, H.Q., 2012. Fluid inclusion and
chronology studies of Baxiannao mineralized fractured zone-type tungsten polymetallic
deposit, southern Jiangxi Province, China. Acta Petrologica Sinica 28, 52-64 (in
Chinese with English abstract).
Feng, C., Zhao, Z., Qu, W., Zeng, Z., 2015. Temporal consistency between granite evolution
and tungsten mineralization in the Huamei'ao, southern Jiangxi Province, China:
Evidence from precise zircon U-Pb, molybdenite Re-Os, and muscovite 40Ar-39Ar
isotope geochronology. Ore Geology Reviews 65, 1005-1020.
Fu, J., Li, H., Qu, W., Yang, X., Wei, J., Liu, G., Ma, L., 2007. Re-Os isotope dating for the
Daao tungsten-tin deposit in Jiuyishan area, southern Hunan province. Geology in
China 34, 651-656 (in Chinese with English abstract).
Fu, J., Li, H., Qu, W., Ma, L., Yang, X., Wei, J., Liu, G., 2008. Determination mineralization
epoch of quartz-vein type tungsten deposits in shixing region, northern Guangdong and
its geological significance. Geotectonica et metallogenia 32, 57-62 (in Chinese with
English abstract).
Fu, J.M., Li, X.N., Cheng, S.B., Xu, D.M., Ma, L.Y., Chen, X.Q., 2009. Metallogenic ages of
tungsten-tin polymetallic deposits in Lianping area, northern Guangdong
Province. Geology of China 36, 1331-1339.
Giuliani, G., 1985. Le gisement de tungstène de Xihuashan (Sud-Jiangxi, Chine): Relations
granites, alterations deutériques-hydrothermales, minéralisations. Mineralium
Deposita 20, 107-115.
Gong, X. D., Yan, G. S., Ye, T. Z., Zhu, X. Y., Li, Y. S., Zhang, Z. H., Jia, W. B., Yao, X. F.,
2015. A study of ore-forming fluids in the Shimensi Tungsten Deposit, Dahutang
Tungsten Polymetallic Ore Field, Jiangxi Province, China. Acta Geologica Sinica 89,
822-835.
PART 3 – Chapter 5
307
Günther, D., Frischknecht, R., Heinrich, C.A., Kahlert, H.J., 1997. Capabilities of an argon
fluoride 193 nm excimer laser for laser ablation inductively coupled plasma mass
spectrometry microanalysis of geological materials. Journal of Analytical Atomic
Spectrometry 12, 939–944.
Guo, C., Mao, J., Bierlein, F., Chen, Z., Chen, Y., Li, C., Zeng, Z., 2011a. SHRIMP U-Pb
(zircon), Ar-Ar (muscovite) and Re-Os (molybdenite) isotopic dating of the Taoxikeng
tungsten deposit, South China Block. Ore Geology Reviews 43, 26-39.
Guo, F., Fan, W.M., Li, C.W., Zhao, L., Li, H.X., Yang, J.H., 2012. Multi-stage crust-mantle
interaction in SE China: temporal, thermal and compositional constraints from the
Mesozoic felsic rocks in eastern Guangdong-Fujian provinces. Lithos 150, 62-84.
Hu, R.Z., and Zhou, M.F., 2012. Multiple Mesozoic mineralization events in South China—an
introduction to the thematic issue. Mineralium Deposita 47, 579-588.
Hu, R.Z., Wei, W.F., Bi, X.W., Peng, J.T., Qi, Y.Q., Wu, L.Y., Chen, Y.W., 2012a. Molybdenite
Re–Os and muscovite 40Ar/39Ar dating of the Xihuashan tungsten deposit, central
Nanling district, South China. Lithos 150, 111-118.
Hu, R.Z., Bi, X.W., Jiang, G.H., Chen, H.W., Peng, J.T., Qi, Y.Q., Wu, L.Y., Wei, W.F., 2012b.
Mantle-derived noble gases in ore-forming fluids of the granite-related Yaogangxian
tungsten deposit, Southeastern China. Mineralium Deposita 47, 623-632.
Huang, F., Feng, C., Chen, Y., Ying, L., Chen, Z., Zeng, Z., Qu, W., 2011. Isotopic
chronological study on Huangsha-Tieshalong quartz vein type tungstan deposit and
timescale of molybdenum mineralization in southern Jiangxi Province, China. Acta
geologica sinica (English edition) 85, 1434-1447.
Huang, F., Wang, D., Santosh, M., Wang, C., Zeng, Z., Liu, S., Wang, L., Zhang, Y., 2014.
Genesis of the Yuanlingzhai porphyry molybdenum deposit, Jiangxi province, South
China: Constraints from petrochemistry and geochronology. Journal of Asian Earth
Sciences 79, 759-776.
Jackson, S.E., Pearson, N.J., Griffin, W.L., Belousova, E.A., 2004. The application of laser
ablation-inductively coupled plasma-mass spectrometry to in situ U-Pb zircon
geochronology. Chemical Geology 211, 47–69.
Jiang, Y-H., Jiang, S.Y., Zhao, K.D., Ling, H.F., 2006. Petrogenesis of Late Jurassic Qianlishan
granites and mafic dykes, southeast China; implications for a back-arc extension
setting. Geology Magazine 143, 457-474.
Jochum, K.P., Weis, U., Stoll, B., Kuzmin, D., Yang, Q., Raczek, I., Jacob, D.E., Stracke, A.,
Birbaum, K., Frick, D.A., Gunther, D., Enzweiler, J., 2011. Determination of reference
PART 3 – Chapter 5
308
values for NIST SRM 610-617 glasses following ISO guidelines. Geostandards and
Geoanalytical Research 35, 397-429.
Klötzli, E., Klötzli, U., Kosler, J. 2007. A possible laser ablation xenotime U-Pb age standard:
reproducibility and accuracy. Geochimica et Cosmochimica Acta 71, A495.
Kuiper, K.F., Deino, A., Hilgen, F.J., Krijgsman, W., Renne, R., Wijbrans, J.R., 2008.
Synchronizing Rock Clocks of Earth History. Science 320, 500-504.
Lach, P., Mercadier, J., Dubessy, J., Boiron, M.C., Cuney, M., 2013. In situ quantitative
measurement of rare earth elements in uranium oxides by laser ablation-inductively
coupled plasma-mass spectrometry. Geostandards and Geoanalytical Results 37, 1-
20.
Lecumberri-Sanchez, P., Romer, R.L., Luders, V., Bodnar, R.J., 2014. Genetic relationship
between silver-lead-zinc mineralization in the Wutong deposit, Guangxi Province and
Mesozoic granitic magmatism in the Nanling belt, southeast China. Mineralium
Deposita 49, 353-396.
Leisen, M., Boiron, M.C., Richard, A., Dubessy, J., 2012. Determination of Cl and Br
concentrations in individual fluid inclusions by combining microthermometry and LA-
ICPMS analysis: Implications for the origin of salinity in crustal fluids. Chemical geology
330-331, 197-206.
Legros, H., Marignac, C., Mercadier, J., Cuney, M., Richard, A., Wang, R-C., Charles, N.,
Lespinasse, M-Y., 2016. Detailed paragenesis and Li-mica compositions as recorders
of the magmatic-hydrothermal evolution of the Maoping W-Sn deposit (Jiangxi, China).
Lithos 264, 108-124.
Legros, H., Richard, A., Tarantola, A., Kouzmanov, K., Mercadier, J., Vennemann, T.,
Marignac, C., Cuney, M., Wang, R-C., Charles, N., Bailly, L., Lespinasse, M-Y.,
submitted. Multiple fluids involved in granite-related W-Sn deposits from the world-
class Jiangxi Province (China). Chemical Geology.
Li, X.H., Li, W.X., Li, Z.X., Lo, C.H., Wang, J., Ye, M.F., Yang, Y. H., 2009. Amalgamation
between the Yangtze and Cathaysia Blocks in South China: constraints from SHRIMP
U–Pb zircon ages, geochemistry and Nd–Hf isotopes of the Shuangxiwu volcanic
rocks. Precambrian Research 174, 117-128.
Li, H., Zhang, H., Ling, M.X., Wang, F.Y., Ding, X., Zhou, J.B., Sun, W., 2011a. Geochemical
and zircon U–Pb study of the Huangmeijian A-type granite: implications for geological
evolution of the Lower Yangtze River belt. International Geology Review 53, 499-525.
PART 3 – Chapter 5
309
Li, X., Xiao, R., Feng, Z., 2011b. Major types and metallogenic epoch of metallic deposits in
northeastern Guangxi, and its geological significances. Acta Mineralogica Sinica 31,
610-611 (in Chinese).
Li, J.H., Zhang, Y.Q., Dong, S.W., Johnson, S.T., 2014. Cretaceous tectonic evolution of South
China: a preliminary synthesis. Earth Science reviews 134, 98-136.
Li, Z.X., Li, X.H., 2007. Formation of the 1300-km-wide intracontinental orogen and
postorogenic maagmatic province in Mesozoic South China: a flat-slab subduction
model. Geology 35, 179-182.
Liang, X., Dong, C., Jiang, Y., Wu, S., Zhou, Y., Zhu, H., Fu, J., Wang, C., Shan, Y., 2016.
Zircon U-Pb, molybdenite Re-Os and muscovite Ar-Ar isotopic dating of the Xitian W-
Sn polymetallic deposit, eastern Hunan Province, South China and its geological
significance. Ore Geology Reviews 78, 85-100.
Lin, W., Wang, Q.C., Chen, K., 2008. Phanerozoic tectonics of South China block: new insights
from the polyphase deformation in the Yunkai massif. Tectonics 27, TC6007,
doi:10.1029/TC002207
Liu, S., Wang, DH., Chen, Y., Li, J., Ying, L., Xu, J., Zeng, Z., 2008. 40Ar/39Ar ages of
muscovite from the different types tungsten-bearing quartz veins in the Chong-Yu-You
concentrated mineral area in gannan region and its geological significance. Acta
geologica sinica 82, 932-940. (in Chinese with English abstract)
Liu, S., Chen, Y., Fan, S., Xu, J., Qu, W., Ying, L., 2010b. The second ore-prospecting space
in the eastern and central parts of the Nanling metallogenic belt: evidence from isotopic
chronology. Geology in China 37, 1034-1049 (in Chinese with English abstract)
Liu, J., Mao, J., Ye, H., Zhang, W., 2011. Geology, geochemistry and age of the Hukeng
tungsten deposit, Southern China. Mesozoic metallogeny in East China 43, 50-61.
Liu, Q., Yu, J.H.,Wang, Q., Su, B., Zhou, M.F., Xu, H., Cui, X., 2012. Ages and geochemistry
of granites in the Pingtan-Dongshan metamorphic belt, coastal South China: new
constraints on Late Mesozoic magmatic evolution. Lithos 150, 268–286.
Liu, P., Mao, J., Cheng, Y., Yao, W., Wang, X., Hao, D., 2017. An early cretaceous W-Sn
deposit and its implications in southeast coastal metallogenic belt: Constraints from U-
Pb, Re-Os, Ar-Ar geochronology at the Feie'shan W-Sn deposit, SE China. Ore
Geology Reviews 81, 112-122.
Longerich, H.P., Jenner, G.A., Fryer, B.J., Jackson, S.E., 1990. Inductively coupled plasma-
mass spectrometric analysis of geological samples: a critical evaluation based on case
studies. Chemical Geology 83, 105-118.
PART 3 – Chapter 5
310
Ludwig, K.R., 2008. Isoplot/Ex Version 3.70: A Geochronological Toolkit for Microsoft Excel.
Berkeley Geochronology Center, Spec Pub 4, 73 pp.
Mao, J., Xie, G., Li, X., Zhang, C., Wang, Y., 2006. Mesozoic large-scale mineralization and
multiple lithospheric extensions in South China. Acta Geologica Sinica 80, 420-431.
Mao, J.W., Xie, G.Q., Guo, C.L., Chen, Y.C., 2007. Large-scale tungsten–tin mineralization in
the Nanling region, South China: metallogenic ages and corresponding geodynamic
processes. Acta Petrologica Sinica 23, 2329–2338 (in Chinese with English abstract).
Mao, Z., Cheng, Y., Liu, J., Yuan, S., Wu, S., Xiang, X., Luo, X., 2013. Geology and
molybdenite Re-Os age of the Dahutang granite-related veinlets-disseminated
tungsten ore field in the Jiangxi Province, China. Ore Geology Reviews 53, 422-433.
Maruyama, S., Isozaki, Y., Kimura, G., Terabayashi, M., 1997. Paleogeographic maps of the
Japanese islands: plate tectonic synthesis from 750 Ma to the present. The Island
Arc 6, 121-142.
Ni, P., Wang, X.D., Wang, G.G., Huang, J.B., Pan, J.Y., Wang, T.G., 2015. An infrared
microthermometric study of fluid inclusions in coexisting quartz and wolframite from
Late Mesozoic tungsten deposits in the Gannan metallogenic belt, South China. Ore
Geological Reviews 65, 1062-1077.
Paquette JL, Piro JL, Devidal JL, Bosse V, Didier A, Sanac S, Abdelnour Y (2014) Sensitivity
enhancement in LA-ICP-MS by N2 addition to carrier gas: Application to radiometric
dating of U-Th-bearing minerals. Agilent ICP-MS Journal 58,1-5.
Paton, C., Hellstrom, J., Paul, B., Woodhead, J., Hergt, J., 2011. Iolite: Freeware for the
visualization and processing of mass spectrometric data. Journal of Analytical Atomic
Spectometry 26, 2508.
Peng, J.T., Zhou, M.F., Hu, R.Z., Shen, N.P., Yuan, S.D., Bi, X.W., Du, A.D., Qu, W.J. 2006.
Precise molybdenite Re-Os and mica Ar-Ar dating of the mesozoic Yaogangxian
tungsten deposit, central Nanling district, South China. Mineralium deposita 41, 661-
670.
Pirajno, F., 2009. Hydrothermal Processes and Mineral Systems. Springer (1250 pp).
Qi, H-W., Hu, R-Z., Wang, X-F., Qu, W-J., Bi, X-W., Peng, J-T., 2012. Molybdenite Re-Os and
muscovite 40Ar/39Ar dating of quartz vein-type W-Sn polymetallic deposits in Northern
Guangdong, South China. Mineralium Deposita 47, 607-622.
PART 3 – Chapter 5
311
Renne, P.R., Swisher, C.C., Deino, A.L., Karner, D.B., Owens, T.L., DePaolo, D.J., 1998.
Intercalibration of standards, absolute ages and uncertainties in 40Ar/39Ar dating.
Chemical Geology 145, 117-152.
Renne, P.R., Cassata, W.S., Morgan, L.E., 2009. The isotopic composition of atmospheric
argon and 40Ar/39Ar geochronology: time for a change? Quaternary Geochronology
4, 288-298.
Renne, P.R., and Norman, E.B., 2001. Determination of the half-life of 37Ar by mass
spectrometry. Physical Review C 63, 047302.
Roddick, J.C., 1983. High precision intercalibration of 40Ar-39Ar standards. Geochimica et
Cosmochimica Acta 47, 887-898.
Romer, R.L., Heinrich, W., Schröder-Smeibidl, B., Meixner, A., Fischer, C.O., Schulz, C., 2005.
Elemental dispersion and stable isotope fractionation during reactive fluid-flow and fluid
immiscibility in the Bufa del Diente aureole, NE-Mexico: Evidence from radiographies
and Li, B, Sr, Nd, and Pb isotope systematics. Contributions to Mineralogy and
Petrology 149, 400-429.
Romer, R.L., and Lüders, V., 2006. Direct dating of hydrothermal W mineralization: U-Pb age
for hübnerite (MnWO4), Sweet Home Mine, Colorado. Geochimica et Cosmochimica
Acta 70, 4725-4733.
Schmid, R., Romer, R.L., Franz, L., Oberhänsli, R., Martinotti, G., 2003. Basement-cover
sequences within the UHP unit of the Dabie Shan. Journal of Metamorphic Geology
21, 531–538.
Shu, L., Faure, M., Wang, B., Zhou, X., Song, B., 2008. Late Palaeozoic–Early Mesozoic
geological features of South China: response to the Indosinian collision events in
Southeast Asia. Comptes Rendus Geoscience 340, 151-165.
Shu, L.S., Zhou, X.M., 2002. Late Mesozoic tectonism of Southeast China. Geological
Review 48, 249-260. (in Chinese with English abstract)
Shu, L.S., Deng, P., Wang, B., Tan, Z.Z., Yu, X.Q., Sun, Y., 2004. Lithology, kinematics and
geochronology related to Late Mesozoic Basin-Mountain evolution in the Nanxiong-
Zhuguang Area, South China. Science in China 47, 673-688.
Shu, L.S., Zhou, X.M., Deng, P., Wang, B., Jiang, S.Y., Yu, J.H., Zhao, X.X., 2009. Mesozoic
tectonic evolution of the Southeast China Block: new insights from basin analysis.
Journal of Asian Earth Sciences 34, 376–391.
PART 3 – Chapter 5
312
Spell, T.L., and McDougall, I., 2003. Characterization and calibration of 40Ar/39Ar dating
standards. Chemical Geology 198, 189-211.
Steiger, R.H., and Jäger, E., 1977. Subcommission on geochronology: convention on the use
of decay constants in geo- and cosmochronology. Earth and Planetary Science Letters
36, 359-362.
Sun, W.D., Yang, X.Y., Fan, W.M., Wu, F.Y., 2012. Mesozoic large scale magmatism and
mineralization in South China: preface. Lithos 150, 1-5.
Van Achterbergh, E., Ryan, C.G., Jackson, S.E., Griffin, W., 2001. Data reduction software for
LA-ICP-MS. In: Sylvester P (ed) Laser Ablation-ICPMS in the Earth Sciences.
Mineralogical Association of Canada, vol. 29, 239–243.
Wang, Y., and Fan, B., 1987. In: Guo, W. (Eds.), Metallogenic map of endogenic ore deposits
of China 1:4000000. Cartographic, Beijing.
Wang, D.Z., and Shu, L.S., 2012. Late Mesozoic basin and range tectonics and related
magmatism in Southeast China. Geoscience Frontiers 3, 109-124.
Wang, D.Z., and Zhou, X.M., 2002. Genesis of Late Mesozoic Volcanic–Intrusive Complex of
Southeast China and Crustal Evolution. Science Press, Beijing, 1–295.
Wang, D.Z., Shu, L.S., Faure, M., Sheng, W.Z., 2001. Mesozoic magmatism and granitic dome
in the Wugongshan Massif, Jiangxi province and their genetical relationship to the
tectonic events in southeast China. Tectonophysics 339, 259-277.
Wang, Q.Y., Lu, Y.F., Chen, Z.H., Peng, X.L., Xiong, X.F., 2012b. Fluid inclusion characteristic
and its geological implication of the Taoxikeng tungsten deposit, southern Jiangxi
Province. Geology and Mineral Resources of South China 1, 006.
Wang, Z.Q., Yin, C.Y., Gao, L.Z., Tang, F., Liu, Y.Q., Liu, P.J., 2006. The character of the
chemical index of alteration and discussion of subdivision and correlation of the
Nanhua System in Yichang area. Geological Review 52, 577-585.
Wang, Y., Pei, R., Li, J., Qu, W., Li, L., Wang, H., Du, A., 2008. Re-Os dating of molybdenite
from the Yaogangxian tungsten deposit, South China, and its geological significance.
Acta Geologica Sinica 82, 820-825.
Wang, Y.L., Pei, R.F., Li, J.W., Wang, H.L., Liu, X.F., 2009a. Geochemical characteristics of
granites from the Jiangjunzhai tungsten deposit of Southeast Hunan province and its
Re-Os isotopic dating. Rock and Mineral Analysis 28, 274-278.
Wang, X., Qi, H., Hu, R., Qu, W., Peng, J., Bi, X., 2010. Re-Os isotopic chronology of
molybdenites from Hongling tungsten deposit of Guangdong province and its
PART 3 – Chapter 5
313
geological significance. Mineral Deposits 29, 415-426. (in Chinese with English
abstract)
Wang, H.Z., and Mo, X.X., 1995. An outline of the tectonic evolution of China. Episodes 18, 6-
16.
Wang, Y., Zhang, A., Fan, W., Zhao, G., Zhang, G., Zhang, Y., Li, S., 2011. Kwangsian crustal
anatexis within the eastern South China Block: geochemical, zircon U–Pb
geochronological and Hf isotopic fingerprints from the gneissoid granites of Wugong
and Wuyi–Yunkai Domains. Lithos 127, 239-260.
Wang, X., Chen, J., Ren, M., 2016. Hydrothermal zircon geochronology: Age constraint on
Nanling Range tungsten mineralization (Southeast China). Ore Geology Reviews 74,
63-75.
Wei, W., Hu, R., Bi, X., Peng, J., Su, W., Song, S., Shi, S., 2012. Infrared microthermometric
and stable isotopic study of fluid inclusions in wolframite at the Xihuashan tungsten
deposit, Jiangxi province, China. Mineralium Deposita 47, 589-605.
Wei, W.F., Yan, B., Shen, N.P., Liu, L., Zhang, Y., Xiang, X.K., 2017. Muscovite 40Ar/39Ar age
and H-O-S isotopes of the Shimenshi tungsten deposit (Northern Jiangxi Province,
South China) and their metallogenic implications. Minerals 7, 162.
Wu, C.Y., Bai, G., Xu, L.M., 1993. Types and distribution of silver ore deposits in China.
Mineralium Deposita 28, 223-238.
Xi, B.B., Zhang, D.H., Zhou, L.M., 2007. Magmatic evolutions of several granite plutons related
to Sn (W) mineralization in the Nanling region, China. Geological Bulletin of China 26,
1591–1599 (in Chinese with English abstract).
Xia, Y., Xu, X.S., Zou, H.B., Liu, L., 2014. Early Paleozoic crust-mantle interaction and
lithosphere delamination in South China Block: evidence from geochronology,
geochemistry, and Sr-Nd-Hf isotopes of granites. Lithos 184-187, 416-435.
Xiao, R., Li, X., Feng, Z., Yang, F., Song, C., 2011. 40Ar-39Ar dating of muscovite from
tungsten-quartz veins in Shanhu tungsten-tin deposit and its geological significance.
Mineral deposits 30, 488-496. (in Chinese with English abstract)
Xu, X.B., Zhang, Y.Q., Jia, D., Shu, L.S., 2009. Early Mesozoic geotectonic processes in South
China. Geology of China 36, 573-593. (in Chinese with English abstract)
Xuexin, S., Jingkai, Z., 1990. Study of fluid inclusions of the Shizhuyuan-Yejiwei W-Sn-Mo-Bi-
polymetallic deposit in southern Hunan. Mineral Deposits 4, 004.
PART 3 – Chapter 5
314
Yang, F., Li, X., Feng, Z., Bai, Y., 2009a. 40Ar/39Ar dating of muscovite from greisenized
granite and geological significance in Limu tin deposit. Journal of Giulin University of
Technology 29, 21-24. (in Chinese with English abstract)
Yao, J., Shu, L., Santosh, M., Li, J., 2013. Geochronology and Hf isotope of detrital zircons
from Precambrian sequences in the eastern Jiangnan Orogen: Constraining the
assembly of Yangtze and Cathaysia Blocks in South China. Journal of Asian Earth
Sciences 74, 225-243.
Yuan, S., Peng, J., Shen, N., Hu, R., Dai, T., 2007. 40Ar-39Ar isotopic dating of the
Xianghualing Sn-polymetallic orefield insouthern Hunan and its geological implications.
Acta geological sinica 81, 278-286 (in Chinese with English abstract).
Yuan, S., Zhang, D., Shuang, Y., Du, A., Qu, W., 2012. Re-Os dating of molybdenite from the
Xintianling giant tungsten-molybdenum deposit in southern Hunan province, China and
its geological implications. Acta petrologica sinica 28, 27-38 (in Chinese with English
abstract)
Zeng, Z., Zhang, Y., Chen, Z., Chen, Y., Zhu, X., Tong, Q., Zheng, B., Zhou, Y., 2011.
Geological characteristics and metallogenic epoch of pangushan W-Bi(Te) ore deposit
in Yudu County, Jiangxi, Province. Mineral deposits 30, 949-958 (in Chinese with
English abstract)
Zhai, W., Sun, X., Wu, Y., Sun, H., Hua, R., Yang, Y., Li, W., Li, S., 2010. SHRIMP U-Pb zircon
ages of buried granodiorite, muscovite 40Ar/39Ar mineralization age and their
geological implications of Meiziwo tungsten deposit, north Guangdong Province, China.
Geological Journal of China Universities 16, 177-185 (in Chinese with English
abstract).
Zhai, W., Sun, X., Wu, Y., Sun, H., Hua, R., Li, W., 2011. 40Ar-39Ar dating of the Yaoling
tungsten deposit in the northern Guangdong Province and SHRIMP U-Pb zircon age
of related granites. Mineral deposits 30, 21-32 (in Chinese with English abstract).
Zhang, Y.Q., Xu, X.B., Jia, D., Shu, L.S., 2008. Deformation record of the change from
Indosinian collision-related tectonic system to Yanshanian subduction-related tectonic
system in South China during the Early Mesozoic Earth Science Frontiers 15, 1-14. (in
Chinese with English abstract)
Zhang, W.L., Hua, R.M., Wang, R.C., Li, H.M., Qu, W.J., Ji, J.Q., 2009. New dating of the
Piaotang granite and related tungsten mineralization in Southern Jiangxi. Acta
Geologica Sinica 83, 659-670.
PART 3 – Chapter 5
315
Zhang, S., Chen, Z., Shi, G., Li, L., Qu, W., Li, C., 2011. Re-Os isotopic dating of molybdenite
from dajishan tungsten deposit in Jiangxi province. Mineral deposits 30, 1113-1121 (in
Chinese with English abstract).
Zhang, R., Lu, J., Wang, R., Lu, X., Guo, J., Li, F., Lehmann, B., Yao, Y., Guo, W., 2013.
Contrasting W-Sn mineralization events and related granitoids in Wangxianling-
Hehuaping area, Nanling range, South China. 12th SGA Biennial Meeting 2013.
Proceedings, Volume 3, 1343-1346.
Zhang, D., Zhang, W.L., Wang, R.C., Chu, Z.Y., Gong, M.W., Jiang, G.X. (2015a). Quartz-vein
type Tungsten mineralization associated with the Indosinian (Triassic) Gaoling Granite,
Miao'ershan area, Northern Guangxi. Geological Review 61, 817-834.
Zhang, R-Q., Lu, J-J., Wang, R-C., Yang, P., Zhu, J-C., Yao, Y., Gao, J-F., Li, C., Lei, Z-H.,
Zhang, W-L., Guo, W-M., 2015b. Constraints of in situ zircon and cassiterite U-Pb,
molybdenite Re-Os and muscovite 40Ar-39Ar ages on multiple generations of granitic
magmatism and related W-Sn mineralization in the Wangxianling area, Nanling Range,
South China. Ore geology Reviews 65, 1021-1042.
Zhang, R-Q., Lu, J-J., Lehmann, B., Li, C., Li, G., Zhang, L., Guo, J., Sun, W., 2017. Combined
zircon and cassiterite U-Pb dating of the Piaotang granite-related tungsten-tin deposit,
southern Jiangxi tungsten district, China. Ore Geology Reviews 82, 268-284
Zhao, W.W., Zhou, M.F., Li, Y.H.M., Zhao, Z., Gao, J.F., 2017. Genetic types, mineralization
styles, and geodynamic settings of Mesozoic tungsten deposits in South China. Journal
of Asian Earth Sciences 137, 109-140.
Zhou, X.M., and Li, W.X., 2000. Origin of Late Mesozoic igneous rocks in Southeastern China: implications for lithosphere subduction and underplating of mafic magmas. Tectonophysics 326, 269-287.
Zhou, J.C., Jiang, S.Y., Wang, X.L., Yang, J.H., Zhang, M.Q., 2006. Study on
lithogeochemistry of Middle Jurassic basalts from southern China represented by the
Fankeng basalts from Yongding of Fujian Province Science in China 49, 1020-1031.
Zhou, X.M., Sun, T., Shen, W.Z., Shu, L.S., Niu, Y.L., 2006. Petrogenesis of granitoids and
volcanic rocks in South China: a response to tectonic evolution. Episodes 29, 26–33.
Zhou, Y.Z., Gao, C.S., Hong, Y.L., Han, Z.X., Wen, L.H., 2010. Diagenesis-mineralization
process and mineralization models of Xihuashan granite. China Tungsten Industry 25,
12–1 (in Chinese with English abstract).
PART 3 – Chapter 5
316
Zou, X., Cui, S., Qu, W., Bai, Y., Chen, X., 2009. Re-Os isotope dating of the Liguifu tungsten-
tin polymetallic deposit in Dupangling area, Guanxi. Geology in China 36, 837-844 (in
Chinese with English abstract).
PART 3 – Chapter 5
317
Appendix A – Detailed analitycal 40Ar-39Ar dating procedure on Fe-Li-micas
40Ar/39Ar analytical work was performed at the University of Manitoba (Canada) using a multi-
collector Thermo Fisher Scientific ARGUS VI mass spectrometer, linked to a stainless steel
Thermo Fisher Scientific extraction/purification line, Photon Machines (55 W) Fusions 10.6
CO2 laser, and Photon Machines (Analyte Excite) 193 nm laser. Argon isotopes (from mass
40 to 37) were measured using Faraday detectors with low noise 1 x 10¹² Ω resistors and mass
36 was measured using a compact discrete dynode (CDD) detector. The sensitivity for argon
measurements is ~6.312 x 10¹⁷ moles/fA as determined from measured aliquots of Fish
Canyon Sanidine (Dazé et al., 2003; Kuiper et al., 2008). Standards and samples were placed
in 2 mm deep wells in 18 mm diameter aluminium disks, with standards placed strategically so
that the lateral neutron flux gradients across the disk could be evaluated. Planar regressions
were fit to the standard data, and the 40Ar/39Ar neutron fluence parameter (J) interpolated for
the unknowns. Uncertainties in J are estimated at 0.1 - 0.2% (1σ), based on Monte Carlo error
analysis of the planar regressions (Best et al., 1995). All specimens were irradiated in the
Cadmium-lined, in-core CLICIT facility of the TRIGA reactor at the Oregon State University
(USA). The duration of irradiation was 17 hours. Standard used was the GA1550 biotite (Spell
and McDougall, 2003). Standards for 40Ar/39Ar measurements were placed in a Cu sample
tray, with a KBr cover slip, in a stainless steel chamber with a differentially pumped ZnS
viewport attached to a Thermo Fisher Scientific extraction/purification line and baked with an
infrared lamp for 24 hours. Single crystals were fused using the CO2 laser. The samples
selected for the 40Ar/39Ar dating were previously investigated by optical microscopy and SEM,
in order to spot homogeneous areas within the analyzed minerals (mica or adularia) devoid of
alteration, micro-inclusions or internal zoning. Discs of 5 mm in diameter and ~150 µm thick
were cut from the same polished thick section (150 - 200 µm thick). The discs were mounted
using a ceramic adhesive (PELCO) on a quartz slide placed in a stainless steel chamber with
a sapphire viewport attached to the same stainless steel high vacuum extraction system as
PART 3 – Chapter 5
318
the CO2 laser, and baked with an infrared lamp for 48 hours. For this study, a raster size of
about 100 x 100 µm was used and ablation pits were excavated to an estimated depth of 50
µm. Reactive gases were removed for both the standard and unknown, after 3 minutes, by
three GP-50 SAES getters (two at room temperature and one at 450 °C) prior to being admitted
to an ARGUS VI mass spectrometer by expansion. Five argon isotopes were measured
simultaneously over a period of 6 minutes. Measured isotope abundances were corrected for
extraction-line blanks, which were determined before every sample analysis. Line blanks in
both the Excimer and CO2 system averaged ~3 fA for mass 40 and ~0.013 fA for mass 36.
Mass discrimination was monitored by online analysis of air pipettes based on a power law
relationship (Renne et al., 2009), which gave D = 1.0081 ± 0.0002 per amu, based on 71
aliquots interspersed with the unknowns. A value of 295.5 was used for the atmospheric
40Ar/36Ar ratio (Steiger and Jäger, 1977) for the purposes of routine measurement of mass
spectrometer discrimination using air aliquots, and correction for atmospheric argon in the
40Ar/39Ar age calculation. Corrections are made for neutron-induced 40Ar from potassium, 39Ar
and 36Ar from calcium, and 36Ar from chlorine (Roddick, 1983; Renne et al., 1998; Renne and
Norman, 2001).
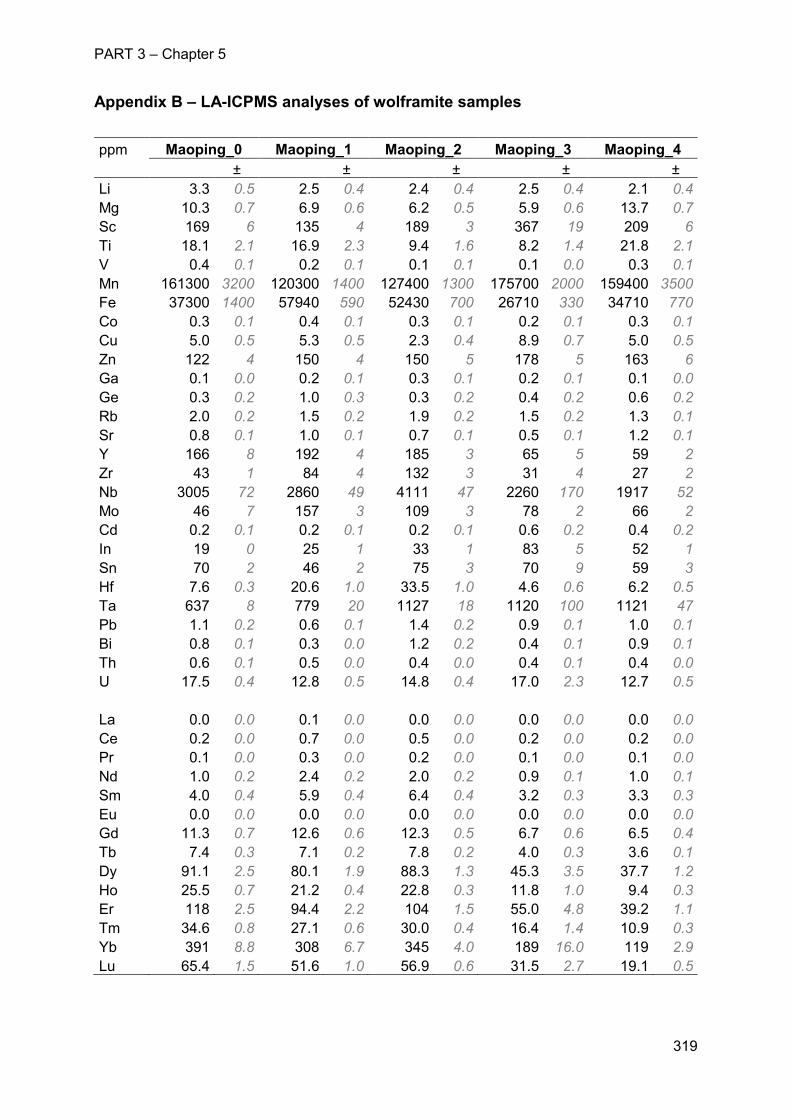
PART 3 – Chapter 5
319
Appendix B – LA-ICPMS analyses of wolframite samples
ppm Maoping_0 Maoping_1 Maoping_2 Maoping_3 Maoping_4 ± ± ± ± ± Li 3.3 0.5 2.5 0.4 2.4 0.4 2.5 0.4 2.1 0.4 Mg 10.3 0.7 6.9 0.6 6.2 0.5 5.9 0.6 13.7 0.7 Sc 169 6 135 4 189 3 367 19 209 6 Ti 18.1 2.1 16.9 2.3 9.4 1.6 8.2 1.4 21.8 2.1 V 0.4 0.1 0.2 0.1 0.1 0.1 0.1 0.0 0.3 0.1 Mn 161300 3200 120300 1400 127400 1300 175700 2000 159400 3500 Fe 37300 1400 57940 590 52430 700 26710 330 34710 770 Co 0.3 0.1 0.4 0.1 0.3 0.1 0.2 0.1 0.3 0.1 Cu 5.0 0.5 5.3 0.5 2.3 0.4 8.9 0.7 5.0 0.5 Zn 122 4 150 4 150 5 178 5 163 6 Ga 0.1 0.0 0.2 0.1 0.3 0.1 0.2 0.1 0.1 0.0 Ge 0.3 0.2 1.0 0.3 0.3 0.2 0.4 0.2 0.6 0.2 Rb 2.0 0.2 1.5 0.2 1.9 0.2 1.5 0.2 1.3 0.1 Sr 0.8 0.1 1.0 0.1 0.7 0.1 0.5 0.1 1.2 0.1 Y 166 8 192 4 185 3 65 5 59 2 Zr 43 1 84 4 132 3 31 4 27 2 Nb 3005 72 2860 49 4111 47 2260 170 1917 52 Mo 46 7 157 3 109 3 78 2 66 2 Cd 0.2 0.1 0.2 0.1 0.2 0.1 0.6 0.2 0.4 0.2 In 19 0 25 1 33 1 83 5 52 1 Sn 70 2 46 2 75 3 70 9 59 3 Hf 7.6 0.3 20.6 1.0 33.5 1.0 4.6 0.6 6.2 0.5 Ta 637 8 779 20 1127 18 1120 100 1121 47 Pb 1.1 0.2 0.6 0.1 1.4 0.2 0.9 0.1 1.0 0.1 Bi 0.8 0.1 0.3 0.0 1.2 0.2 0.4 0.1 0.9 0.1 Th 0.6 0.1 0.5 0.0 0.4 0.0 0.4 0.1 0.4 0.0 U 17.5 0.4 12.8 0.5 14.8 0.4 17.0 2.3 12.7 0.5
La 0.0 0.0 0.1 0.0 0.0 0.0 0.0 0.0 0.0 0.0 Ce 0.2 0.0 0.7 0.0 0.5 0.0 0.2 0.0 0.2 0.0 Pr 0.1 0.0 0.3 0.0 0.2 0.0 0.1 0.0 0.1 0.0 Nd 1.0 0.2 2.4 0.2 2.0 0.2 0.9 0.1 1.0 0.1 Sm 4.0 0.4 5.9 0.4 6.4 0.4 3.2 0.3 3.3 0.3 Eu 0.0 0.0 0.0 0.0 0.0 0.0 0.0 0.0 0.0 0.0 Gd 11.3 0.7 12.6 0.6 12.3 0.5 6.7 0.6 6.5 0.4 Tb 7.4 0.3 7.1 0.2 7.8 0.2 4.0 0.3 3.6 0.1 Dy 91.1 2.5 80.1 1.9 88.3 1.3 45.3 3.5 37.7 1.2 Ho 25.5 0.7 21.2 0.4 22.8 0.3 11.8 1.0 9.4 0.3 Er 118 2.5 94.4 2.2 104 1.5 55.0 4.8 39.2 1.1 Tm 34.6 0.8 27.1 0.6 30.0 0.4 16.4 1.4 10.9 0.3 Yb 391 8.8 308 6.7 345 4.0 189 16.0 119 2.9 Lu 65.4 1.5 51.6 1.0 56.9 0.6 31.5 2.7 19.1 0.5
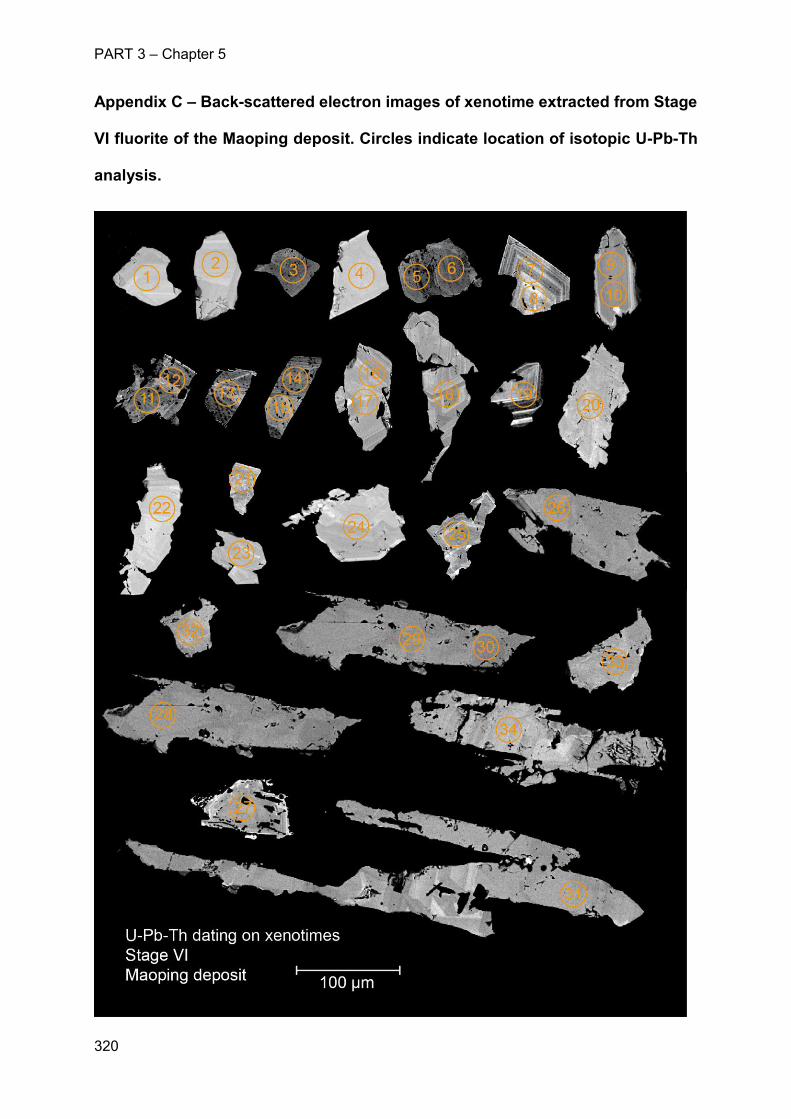
PART 3 – Chapter 5
320
Appendix C – Back-scattered electron images of xenotime extracted from Stage
VI fluorite of the Maoping deposit. Circles indicate location of isotopic U-Pb-Th
analysis.
PART 3 – Chapter 5
321
Appendix D – Table of dating data from the literature on W-Sn veins in the
Cathaysia
Province Deposit Age 2σ Analytical method Reference associated with figure
12
Guangdong
Feie'shan 135.1 0.8 40Ar-39Ar on micas 1 140.6 1.9 Re-Os on molybdenite 1
Hongling 159.1 1.5 Re-Os on molybdenite 2 Jitishi 155.4 5.1 Sm-Nd on quartz FI 3
Jubankeng 143.6 3.9 40Ar-39Ar on micas 3 Yanqiantan 154.4 1.6 Re-Os on molybdenite 4
Wutong 92.3 to 104.4 U-Pb on hubnerite 39
Guangxi
Gaoling 212.0 20 Sm-Nd on scheelite 5
Limushuiximiao 214.1 1.9 40Ar-39Ar on micas 6
Shanhu 100.8 0.7 40Ar-39Ar on micas 7
102.7 1.7 40Ar-39Ar on micas 7
Shuiyanba 162.5 1.2 40Ar-39Ar on micas 8
Hunan
Daao 151.3 2.4 Re-Os on molybdenite 9
Dengfuxian 152.4 3.3 Re-Os on molybdenite 10
Jiangjunzhai 169.6 2.7 Re-Os on molybdenite 11
Liguifu 211.9 6.4 Re-Os on molybdenite 12
Meiziwo 157.7 2.8 Re-Os on molybdenite 13
155.9 0.6 40Ar-39Ar on micas 14
Shigushan 154.2 2.7 Re-Os on molybdenite 15
Shirenzhang 159.1 2.2 Re-Os on molybdenite 15
Shuiyuanshan 214.2 2.9 40Ar-39Ar on micas 16
220.7 4.1 Re-Os on molybdenite 16
Wangxianling 220.7 4.1 Re-Os on molybdenite 17
Xianghualing
154.4 1.1 40Ar-39Ar on micas 18
158.7 1.2 40Ar-39Ar on micas 18
161.3 1.1 40Ar-39Ar on micas 18
Xintianling 161.7 9.3 Re-Os on molybdenite 19
Xitian 149.7 0.9 Re-Os on molybdenite 20
Yaogangxian
133.7 1.3 U-Pb hydrothermal zircon 21
153.0 7.0 Re-Os on molybdenite 22
153.0 1.1 40Ar-39Ar on micas 23
154.9 2.6 Re-Os on molybdenite 23
155.1 1.1 40Ar-39Ar on micas 23
Yaoling 159.5 2.8 Re-Os on molybdenite 13
PART 3 – Chapter 5
322
149.4 0.7 40Ar-39Ar on micas 24
Yeiwo 228.1 2.6 Re-Os on molybdenite 16
Jiangxi
Baxiannao 157.9 1.5 Re-Os on molybdenite 25
Changkeng 158.1 1.2 Re-Os on molybdenite 26
Dahutang 139.2 1.0 Re-Os on molybdenite 27
Dajishan 161.0 1.3 Re-Os on molybdenite 28
Dangping 133.6 1.0 U-Pb hydrothermal zircon 21
Huamei'ao 158.5 3.3 Re-Os on molybdenite 29
Huangsha 153.0 3.0 Re-Os on molybdenite 30
Hukeng
132.9 1.5 U-Pb hydrothermal zircon 21
147.2 1.4 40Ar-39Ar on micas 31
150.2 2.2 Re-Os on molybdenite 31
Jiulongnao 151.5 1.1 Re-Os on molybdenite 32
Keshuling 158.8 1.2 40Ar-39Ar on micas 33
Maoping 150.2 2.8 Re-Os on molybdenite 25
Niuling 154.9 4.1 Re-Os on molybdenite 25
Pangushan 157.8 0.8 Re-Os on molybdenite 26
158.8 5.7 Re-Os on molybdenite 26
Piaotang 152.0 1.9 40Ar-39Ar on micas 34
159.5 1.5 U-Pb on cassiterite 35
Taoxikeng
134.4 1.9 U-Pb hydrothermal zircon 21
152.7 1.5 40Ar-39Ar on micas 36
153.4 1.3 40Ar-39Ar on micas 36
154.4 3.8 Re-Os on molybdenite 36
Tieshanlong 134.2 1.6 U-Pb hydrothermal zircon 21
Xian'etang 231.4 2.4 40Ar-39Ar on micas 33
Xihuashan
152.8 1.6 40Ar-39Ar on micas 37
157.8 0.9 Re-Os on molybdenite 37
158.6 2.9 40Ar-39Ar on cassiterite 38
Zhangdongkeng 150.9 5.3 Re-Os on molybdenite 32
Zhangdou 149.1 7.1 Re-Os on molybdenite 25
PART 3 – Chapter 5
323
Appendix E – Map of the W-Sn deposits associated with W-Sn vein dating in the Cathaysia (details in Appendix D and Figure
68)

PART 3 – Chapter 6
325
Chapter 6 – New columbo-tantalite reference materials for SIMS U-Pb
geochronology
Article in preparation for Chemical Geology.
Hélène Legros a,b,*, Julien Mercadier a, Johan Villeneuve c, Rolf L. Romer d, Stijn Dewaele
e,f, XuDong Che g
a Université de Lorraine, CNRS, CREGU, GeoRessources, Boulevard des Aiguillettes B.P. 70239, F-54506 Vandoeuvre-lès-Nancy, France
b BRGM-French Geological Survey, 3, Av. Claude Guillemin, BP 36009, 45060 Orléans Cedex 2, France
c CRPG, CNRS, Université de Lorraine, UMR 7358, Vandoeuvre-les-Nancy F-54501, France
d GFZ German Research Centre for Geosciences, Telegrafenberg, 14473 Potsdam, Germany
e Department of Geology and Mineralogy, Royal Museum for Central Africa (RMCA), Leuvensesteenweg 13, 3080 Tervuren, Belgium
f Mineralogy and Petrology, Department of Geology, Ghent University, Krijgslaan 281 S8, 9000 Ghent, Belgium
g State Key Laboratory for Mineral Deposits Research, School of Earth Sciences and Engineering, Nanjing University, Xianlin University Town, Nanjing 210046- China
Abstract
Columbo-tantalite is the most common Nb-Ta mineral. It mostly occurs in granite and
pegmatites but also in hydrothermal systems associated to other rare metals as W-Sn. This
mineral is particularly suitable for U-Pb dating due to its high U and low Pb content. However,
no reference material is, at this day, available for in situ dating. In order to evaluate the
accuracy of our samples for in situ U-Pb dating, ID-TIMS was performed to determine the age
of each sample. Correlation lines for SIMS calculations were drawn according to the chemical
composition of the samples. It appears that ferrotapiolite, ferrocolumbite and ferrotantalite
display three distinct lines of calibration and therefore that the Ta# (Ta/(Ta+Nb)) can induce a
significant matrix effect during SIMS U-Pb dating. Therefore, a sample was selected among
each range of chemical composition as an external standard: CT1 (Ivory Coast) for
ferrotapiolite, Rongi (Rwanda) for ferrocolumbite and NP2 (China) for ferrotantalite. Ages are
consistent with ID-TIMS calculations and confirm the absence of analytical bias. This study
PART 3 – Chapter 6
326
proposes five samples as reference material for U-Pb SIMS dating: three ferrotapiolite, CT1
(2046.8 ± 1.1 Ma), CT3 (2053 ± 1.3 Ma) and CT4 (2044.5 ± 1.6 Ma) all originated from Ivory
Coast, two ferrocolumbite, Rongi (931.5 ± 2.5 Ma) and Buranga (905.2 ± 3.2 Ma) both
originated from Rwanda and two ferrotantalite, NP2 (380.3 ± 2.4 Ma) from China and NT-2
(372.0 ± 2.3 Ma) from Altai. Age calculation of younger samples still need testing to measure
the possible bias induced.
Keywords
Columbite – Tantalite – U-Pb – SIMS – ID-TIMS - Geochronology
1. Introduction
Niobium and tantalum are considered as critical resources due to their wide
applications in the electronic industry (Mineral profiles by BGS; www.bgs.ac.uk). These
economic elements are mostly exploited under the form of columbo-tantalite minerals
[(Fe,Mn)(Nb,Ta)2O5] (termed coltan). Columbo-tantalite minerals are considered as promising
material for U-Pb dating due to their high U and low Pb contents (Romer and Lehmann, 1995;
Romer and Smeds, 1994; Romer and Wright, 1992; Smith et al., 2004). Columbo-tantalites
are encountered in rare metal granites, alkaline and carbonatitic rocks, pegmatites and
hydrothermal veins. Coltan U-Pb dating could help constrain the emplacement of these rocks
as well as the possibly associated magmatic-hydrothermal transition that is often observed in
these deposits and could not be defined by U-Pb zircon dating. Moreover, the Nb-Ta ratios are
known to be good indicators of magmatic differentiation and the dating of several generations
could constrain such magmatic evolutions.
Coltan U-Pb dating have already been reported using isotope dilution thermal ionisation
mass-spectrometry (IDTIMS). In situ laser ablation inductively-coupled plasma mass
spectrometry (LA-ICPMS) and secondary ion mass spectrometry (SIMS) techniques could
PART 3 – Chapter 6
327
provide an alternative. However, no appropriate coltan standard has yet been published.
Indeed, the columbo-tantalite group mineral has the particularity to own four chemical poles
based on Nb-Ta and Mn-Fe ratios. Many studies by in situ laser ablation inductively-coupled
plasma mass spectrometry (LA-ICPMS) and secondary ion mass spectrometry (SIMS)
techniques have proven that standardisation with an inappropriate material that do not share
the same matrix components could lead to so-called “matrix effects” and thus alter the
subsequent dating results (e.i. Zhu et al., 1998; Che et al., 2015). The question of the need to
identify four coltan potential standards remain.
This contribution tends to complement the results of U-Pb coltan dating by IDTIMS by
providing new standards for in situ U-Pb dating methods as SIMS. In this view, several coltan
samples from deposits worldwide have been collected and analysed by the two methods after
identifying their chemical ratios. This paper discusses the potential matrix effects between the
different coltan chemical poles and introduces seven new standards for in situ U-Pb dating
methods by SIMS.
2. Sample location
2.1 CT and ISSIA, Ivory Coast
All columbo-tantalite products from Ivory Coast are associated with placer
accumulations in soils in central-west of the country. Soils are directly associated to the
weathering of subsequent granites and pegmatites under the surface. Most accumulations are
interpreted as directly reflecting the composition of respective pegmatite at each location. Our
samples are located next to the ISSIA granite, described as a non-oriented muscovite-
dominated porphyroid peraluminous granite, associated to Nb-Ta-Be-Li pegmatites (Allou et
al., 2005).
PART 3 – Chapter 6
328
2.2 Rongi and Buranga, Rwanda
Rongi and Buranga samples were both sampled from pegmatites from the Karagwe-
Ankole belt of Central Africa. Both pegmatites are located in the Gatumba, 50 km west of Kigali
(Rwanda) and hosted in dolerites. These samples have been already studied by Dewaele et
al. (2011) and Melcher et al. (2015) with multiple dating techniques.
2.4 NT-2 and A-1, Altai
These samples were collected from the Altai No. 3 pegmatite, located near Koktokay
town in Xinjiang Province, China. This pegmatite is one of the most differentiated intrusions
among more than 10 thousand pegmatites in the area. Petrographic details are given in Zhang
et al. (2004) and Wang et al. (2012) and LA-ICPMS dating in Che et al. (2015).
2.5 NP2, Fujian, China
NP2 was sampled from the Nanping No. 31 pegmatite. This pegmatite is located in the
Northern Fujian Province at 8 km to the west from the Nanping city. The No. 31 pegmatite is
evolved and mineralized in Nb, Ta and Sn. More petrographic details are given in Rao et al.
(2009) and LA-ICPMS dating in Che et al. (2015).
2.6 CC1716, France
CC1716 samples are grains extracted from the Epesses hercynian granite located in
Vendée, not far from the Chateaumur and Chateliers cities (France). Several granitic facies
are described in the sampling area (Guérangé et al., 1971) and all contain disseminated
amount of columbo-tantalite.
3. Analytical techniques
Petrographic images were obtained from observations of polished sections using
reflected light microscopy and a HITACHI FEG S4800 scanning electron microscope (SEM)
PART 3 – Chapter 6
329
equipped with an energy dispersive spectrometer (EDS), using a Si(Li) semi-conductor
detector.
3.1 EPMA
Electron microprobe analyses (EPMA) for Ti, Mn, Fe, Nb, Sn, Zr, Ta, W, Pb, Th, U were
performed on columbotantalite samples, using a CAMECA SX100 instrument equipped with a
wavelength dispersive spectrometer (WDS) and calibrated using natural and synthetic oxides
(MnTiO3, Fe2O3, LiNbO3, cassiterite, zircon, LiTaO3, scheelite, galena, ThO2, UO2). The
analytical conditions were: current of 20 nA and accelerating voltage of 20 kV (20kV and 100nA
for Pb, U and Th) and a counting time of 10 s per element. Total Fe is presented as FeO. W,
Pb, Th and U were measured below the limit of detection and were removed from the EPMA
results.
3.2 TIMS
Columbo-tantalite samples U-Pb ratios were analyzed at the GFZ German Research
Centre for Geosciences (Potsdam), according to the analytical procedure described in Romer
and Lüders (2006). Samples were crushed and picked carefully under the binocular
microscope to avoid alteration, filled fractures or recrystallization zones. Grains were picked
as small as possible in order to minimalize the risk of nanoinclusions. Any contamination on
surfaces of the grains were washed through 20% HF, 6N HCl, 7N HNO3, H2O and acetone. A
second selection of the cleaner grains at that point was also performed. A 205Pb-235U tracer
was also included before dissolving grains between 0.200 mg and 0.500 mg in 40% HF on a
hot plate overnight. For each samples, a first batch of six analyses were performed before
adjusting given the first analyses. Pb and U were separated by ion exchange chemistry (Romer
et al., 2005) for distinct measurements for each samples. Each Pb and U samples were loaded
on Re single filaments with H3PO4 and silicate gel. Isotopic ratios of Pb and U were analyzed
on a Triton thermal ionization mass spectrometer (TIMS) using a Faraday collector or an ion
counter given the intensity of the signal. Data reduction was performed according to Schmid
et al. (2003). Mass fractionation, U-Pb blanks and tracer were corrected. All data are
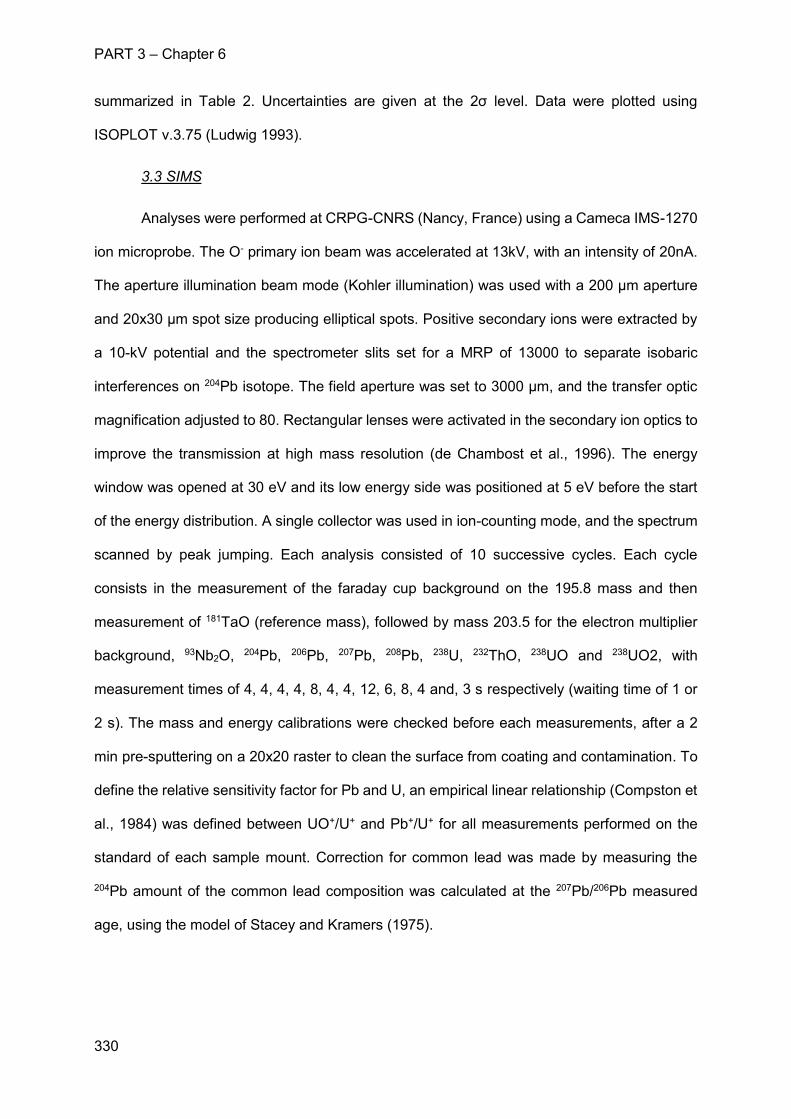
PART 3 – Chapter 6
330
summarized in Table 2. Uncertainties are given at the 2σ level. Data were plotted using
ISOPLOT v.3.75 (Ludwig 1993).
3.3 SIMS
Analyses were performed at CRPG-CNRS (Nancy, France) using a Cameca IMS-1270
ion microprobe. The O- primary ion beam was accelerated at 13kV, with an intensity of 20nA.
The aperture illumination beam mode (Kohler illumination) was used with a 200 µm aperture
and 20x30 µm spot size producing elliptical spots. Positive secondary ions were extracted by
a 10-kV potential and the spectrometer slits set for a MRP of 13000 to separate isobaric
interferences on 204Pb isotope. The field aperture was set to 3000 µm, and the transfer optic
magnification adjusted to 80. Rectangular lenses were activated in the secondary ion optics to
improve the transmission at high mass resolution (de Chambost et al., 1996). The energy
window was opened at 30 eV and its low energy side was positioned at 5 eV before the start
of the energy distribution. A single collector was used in ion-counting mode, and the spectrum
scanned by peak jumping. Each analysis consisted of 10 successive cycles. Each cycle
consists in the measurement of the faraday cup background on the 195.8 mass and then
measurement of 181TaO (reference mass), followed by mass 203.5 for the electron multiplier
background, 93Nb2O, 204Pb, 206Pb, 207Pb, 208Pb, 238U, 232ThO, 238UO and 238UO2, with
measurement times of 4, 4, 4, 4, 8, 4, 4, 12, 6, 8, 4 and, 3 s respectively (waiting time of 1 or
2 s). The mass and energy calibrations were checked before each measurements, after a 2
min pre-sputtering on a 20x20 raster to clean the surface from coating and contamination. To
define the relative sensitivity factor for Pb and U, an empirical linear relationship (Compston et
al., 1984) was defined between UO+/U+ and Pb+/U+ for all measurements performed on the
standard of each sample mount. Correction for common lead was made by measuring the
204Pb amount of the common lead composition was calculated at the 207Pb/206Pb measured
age, using the model of Stacey and Kramers (1975).
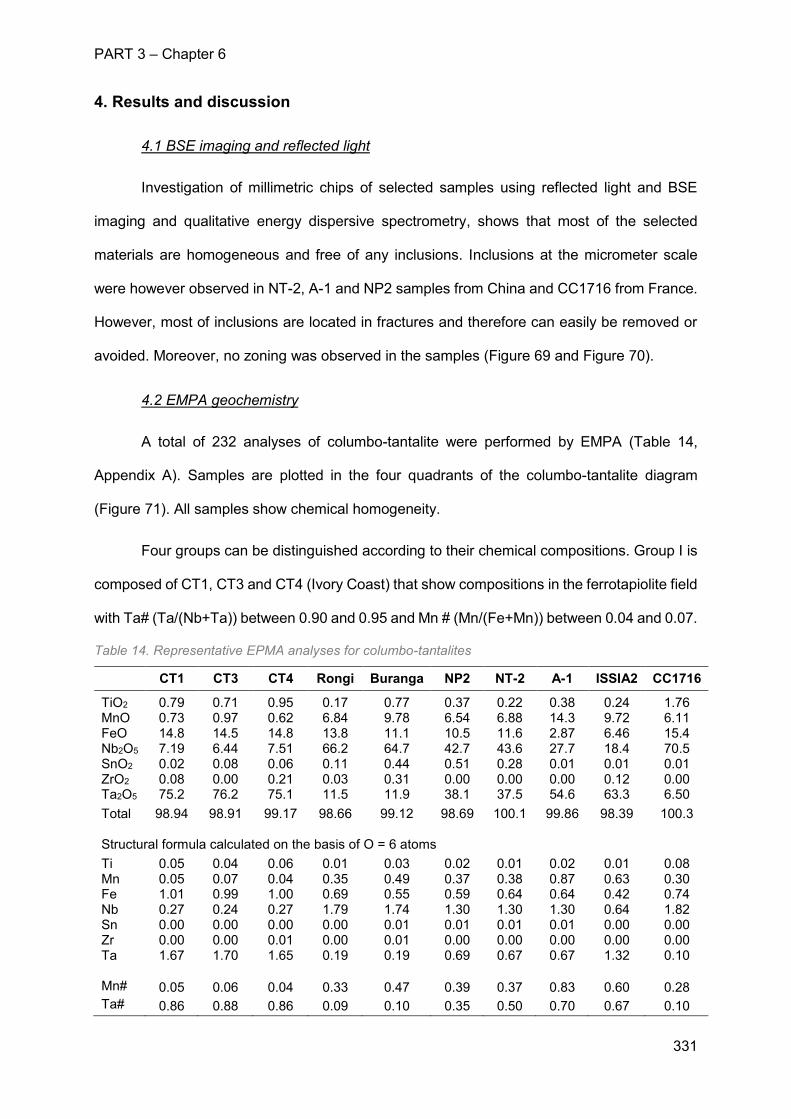
PART 3 – Chapter 6
331
4. Results and discussion
4.1 BSE imaging and reflected light
Investigation of millimetric chips of selected samples using reflected light and BSE
imaging and qualitative energy dispersive spectrometry, shows that most of the selected
materials are homogeneous and free of any inclusions. Inclusions at the micrometer scale
were however observed in NT-2, A-1 and NP2 samples from China and CC1716 from France.
However, most of inclusions are located in fractures and therefore can easily be removed or
avoided. Moreover, no zoning was observed in the samples (Figure 69 and Figure 70).
4.2 EMPA geochemistry
A total of 232 analyses of columbo-tantalite were performed by EMPA (Table 14,
Appendix A). Samples are plotted in the four quadrants of the columbo-tantalite diagram
(Figure 71). All samples show chemical homogeneity.
Four groups can be distinguished according to their chemical compositions. Group I is
composed of CT1, CT3 and CT4 (Ivory Coast) that show compositions in the ferrotapiolite field
with Ta# (Ta/(Nb+Ta)) between 0.90 and 0.95 and Mn # (Mn/(Fe+Mn)) between 0.04 and 0.07.
Table 14. Representative EPMA analyses for columbo-tantalites
CT1 CT3 CT4 Rongi Buranga NP2 NT-2 A-1 ISSIA2 CC1716
TiO2 0.79 0.71 0.95 0.17 0.77 0.37 0.22 0.38 0.24 1.76 MnO 0.73 0.97 0.62 6.84 9.78 6.54 6.88 14.3 9.72 6.11 FeO 14.8 14.5 14.8 13.8 11.1 10.5 11.6 2.87 6.46 15.4 Nb2O5 7.19 6.44 7.51 66.2 64.7 42.7 43.6 27.7 18.4 70.5 SnO2 0.02 0.08 0.06 0.11 0.44 0.51 0.28 0.01 0.01 0.01 ZrO2 0.08 0.00 0.21 0.03 0.31 0.00 0.00 0.00 0.12 0.00 Ta2O5 75.2 76.2 75.1 11.5 11.9 38.1 37.5 54.6 63.3 6.50 Total 98.94 98.91 99.17 98.66 99.12 98.69 100.1 99.86 98.39 100.3 Structural formula calculated on the basis of O = 6 atoms Ti 0.05 0.04 0.06 0.01 0.03 0.02 0.01 0.02 0.01 0.08 Mn 0.05 0.07 0.04 0.35 0.49 0.37 0.38 0.87 0.63 0.30 Fe 1.01 0.99 1.00 0.69 0.55 0.59 0.64 0.64 0.42 0.74 Nb 0.27 0.24 0.27 1.79 1.74 1.30 1.30 1.30 0.64 1.82 Sn 0.00 0.00 0.00 0.00 0.01 0.01 0.01 0.01 0.00 0.00 Zr 0.00 0.00 0.01 0.00 0.01 0.00 0.00 0.00 0.00 0.00 Ta 1.67 1.70 1.65 0.19 0.19 0.69 0.67 0.67 1.32 0.10 Mn# 0.05 0.06 0.04 0.33 0.47 0.39 0.37 0.83 0.60 0.28 Ta# 0.86 0.88 0.86 0.09 0.10 0.35 0.50 0.70 0.67 0.10
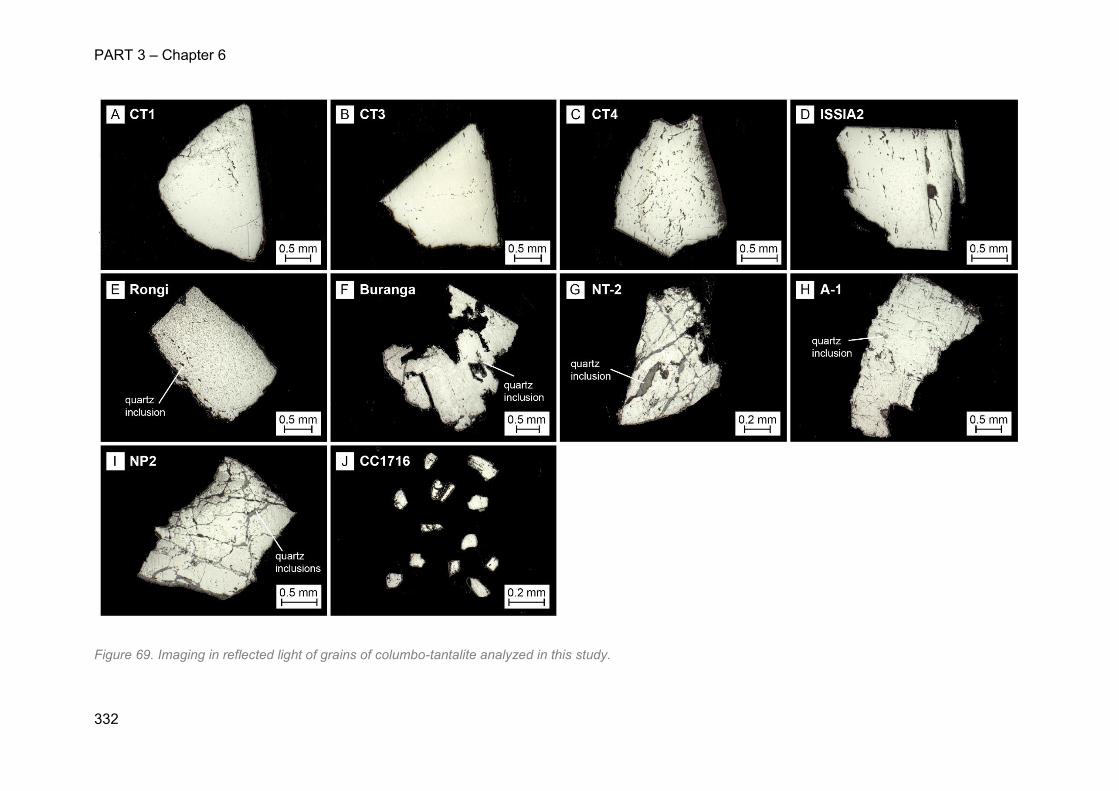
PART 3 – Chapter 6
332
Figure 69. Imaging in reflected light of grains of columbo-tantalite analyzed in this study.
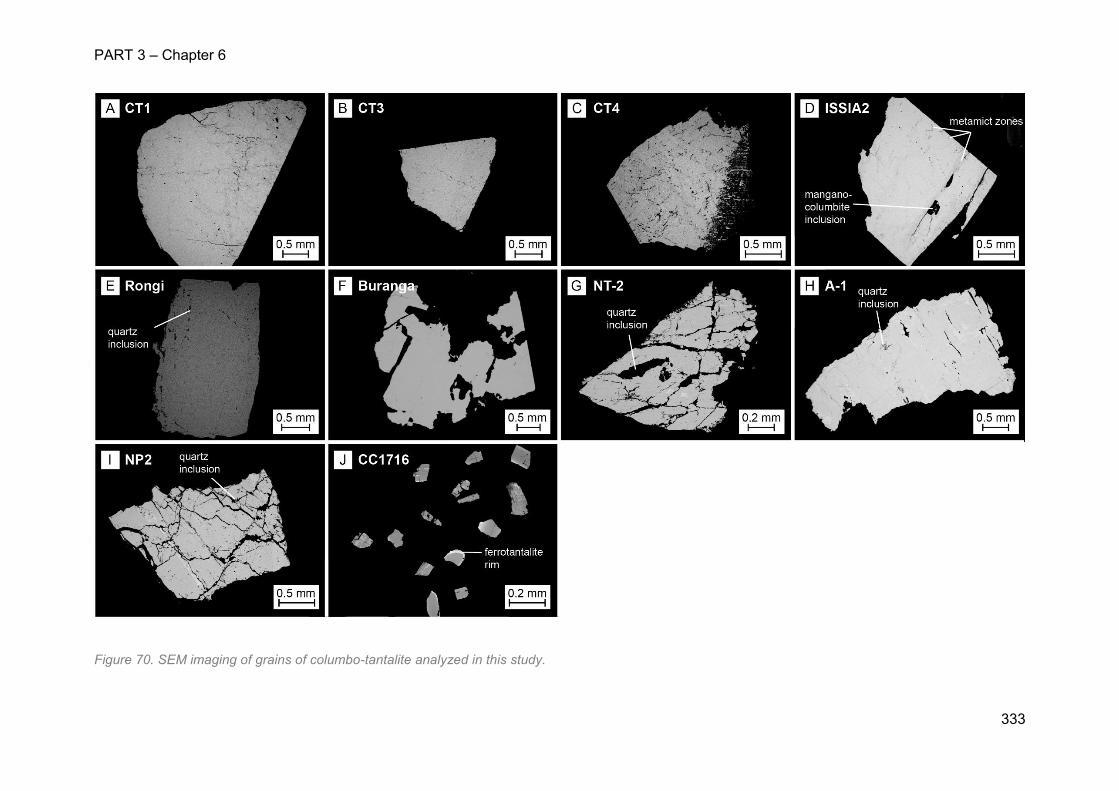
PART 3 – Chapter 6
333
Figure 70. SEM imaging of grains of columbo-tantalite analyzed in this study.
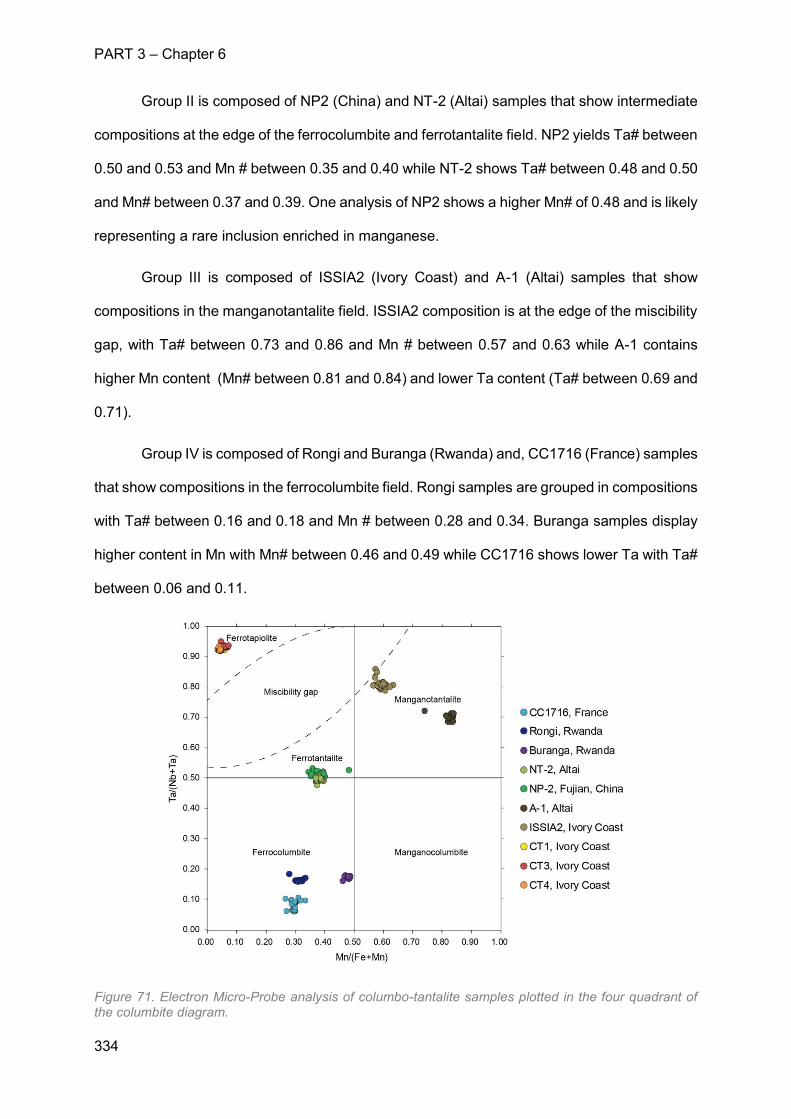
PART 3 – Chapter 6
334
Group II is composed of NP2 (China) and NT-2 (Altai) samples that show intermediate
compositions at the edge of the ferrocolumbite and ferrotantalite field. NP2 yields Ta# between
0.50 and 0.53 and Mn # between 0.35 and 0.40 while NT-2 shows Ta# between 0.48 and 0.50
and Mn# between 0.37 and 0.39. One analysis of NP2 shows a higher Mn# of 0.48 and is likely
representing a rare inclusion enriched in manganese.
Group III is composed of ISSIA2 (Ivory Coast) and A-1 (Altai) samples that show
compositions in the manganotantalite field. ISSIA2 composition is at the edge of the miscibility
gap, with Ta# between 0.73 and 0.86 and Mn # between 0.57 and 0.63 while A-1 contains
higher Mn content (Mn# between 0.81 and 0.84) and lower Ta content (Ta# between 0.69 and
0.71).
Group IV is composed of Rongi and Buranga (Rwanda) and, CC1716 (France) samples
that show compositions in the ferrocolumbite field. Rongi samples are grouped in compositions
with Ta# between 0.16 and 0.18 and Mn # between 0.28 and 0.34. Buranga samples display
higher content in Mn with Mn# between 0.46 and 0.49 while CC1716 shows lower Ta with Ta#
between 0.06 and 0.11.
Figure 71. Electron Micro-Probe analysis of columbo-tantalite samples plotted in the four quadrant of the columbite diagram.
PART 3 – Chapter 6
335
4.3 U-Pb ID-TIMS dating
4.3.1 CT1 (Ivory Coast)
In a 206Pb/238U vs. 207Pb/235U diagram, all data from the CT1 ferrotapiolite are
concordant or very close to the concordia line. Two samples only are displayed along the
discordia line (samples 1 and 7) with variable 207Pb/235U ratios. 6 samples yield an age of
2046.8 ± 1.1 Ma, calculated using a 207Pb-206Pb isochron (2σ, MSWD = 2.2).
The samples have homogeneous U contents of ca. 200 ppm and variable Pb contents
from 70 to 314 ppm due to variable contribution of common lead (0 to 216 ppm). The variable
contributions of common lead account for the large range of measured 206Pb/204Pb ratios from
38 to 47700. However, 207Pb/206Pb are homogeneous at ca. 0.126. The samples show
essentially no variation in U and Pb contents at the exception of one extreme value (sample 4)
with very high common lead (216 ppm), correlated to lower amounts of 206Pb (78 at%) and
207Pb (9.5 at%) and higher content in 208Pb (13 at%) associated with high Th content (105 ppm)
that could indicate sulphide inclusions This sample has not been taken into account for age
calculations.
4.3.2 CT3 (Ivory Coast)
In a 206Pb/238U vs. 207Pb/235U diagram, all data from the CT3 ferrotapiolite are
concordant or very close to the concordia line as previously observed with CT1 sample. One
sample only is displayed along the discordia line (samples 9) with a higher 207Pb/235U ratio. 6
samples yield an age of 2053.2 ± 1.3 Ma, calculated using a 207Pb-206Pb isochron (2σ, MSWD
= 2.2).
The samples have elevated homogeneous U content (294 to 321 ppm). Same applies
to Pb values (107 to 118 ppm), which show variable contributions of common lead (0.08 to
2.40 ppm). The large range of 206Pb/204Pb ratios (2770 to 83700) is associated to the variable
contribution of common lead. However, 207Pb/206Pb are homogeneous at ca. 0.127. One
sample (sample 9) shows elevated ratios associated to higher 206Pb/204Pb (84000),
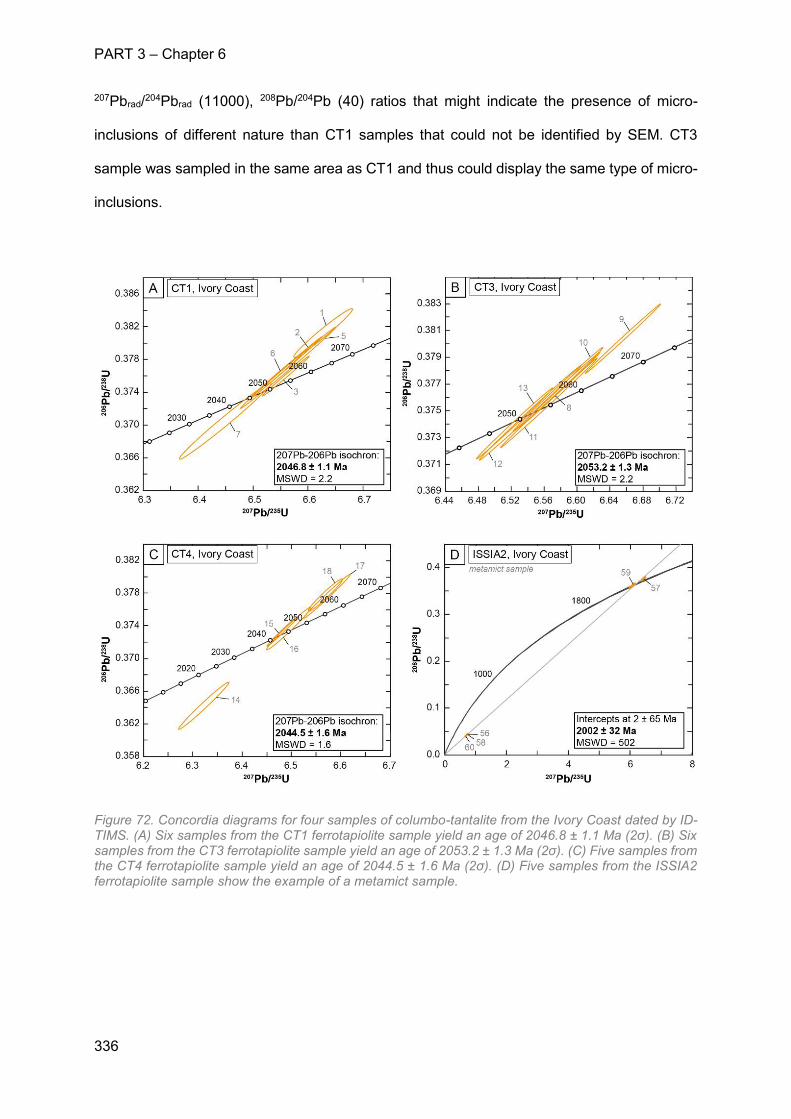
PART 3 – Chapter 6
336
207Pbrad/204Pbrad (11000), 208Pb/204Pb (40) ratios that might indicate the presence of micro-
inclusions of different nature than CT1 samples that could not be identified by SEM. CT3
sample was sampled in the same area as CT1 and thus could display the same type of micro-
inclusions.
Figure 72. Concordia diagrams for four samples of columbo-tantalite from the Ivory Coast dated by ID-TIMS. (A) Six samples from the CT1 ferrotapiolite sample yield an age of 2046.8 ± 1.1 Ma (2σ). (B) Six samples from the CT3 ferrotapiolite sample yield an age of 2053.2 ± 1.3 Ma (2σ). (C) Five samples from the CT4 ferrotapiolite sample yield an age of 2044.5 ± 1.6 Ma (2σ). (D) Five samples from the ISSIA2 ferrotapiolite sample show the example of a metamict sample.
PART 3 – Chapter 6
337
4.3.3 CT4 (Ivory Coast)
In a 206Pb/238U vs. 207Pb/235U diagram, all data from the CT4 ferrotapiolite are on the
discordia line which inclination is influenced by the anomalic sample 14. 5 samples yield an
age of 2044 ± 1.6 Ma, calculated using a 207Pb-206Pb isochron (2σ, MSWD = 1.6).
The samples have homogeneous U contents (169 to 181 ppm) as well as Pb contents
(62 to 68 ppm) with variable contents in common lead (0.3 to 4.2 ppm). The large range of
common lead values is correlated to the variable 206Pb/204Pb ratios (910 to 11100). All samples
are clustered while sample 14 shows elevated common lead (4.2 ppm). However, 207Pb/206Pb
ratios are homogeneous at ca. 0.126.
4.3.4 ISSIA2 (Ivory Coast)
The samples have highly variable U and Pb contents (172 to 990 ppm and 10 to 469
ppm respectively). These variations in Pb are correlated to a variable common lead
contribution between 2 to 17 ppm. 206Pb/204Pb ratios are also very variable but anticorrelated
to previous parameters (141 to 1290). Moreover, samples display a variable enrichment in Th
(3 to 890 ppm). This sample is an example of metamictization.
In a 206Pb/238U vs. 207Pb/235U diagram, the samples displays two groups: two samples
(samples 57 and 59) close to the concordia line and three samples (samples 56, 58 and 60)
on the discordia line, closer to the origin. The discordia is rooted at the origin of the diagram.
The high variability of content correlates to the poor metallic aspect of grains after cleaning.
Grains clearly reflect metamict zones in the grains in the form of alteration and overgrowths of
mangano-columbite. The metamictization allows lead to migrate, increasing common lead
content. It has already been observed in columbo-tantalite but also wolframite and zircons
(Mezger et al., 1997; Harlaux et al., 2017). Due to the mobilization of lead, the MSWD is very
high and the intercept is probably too low. This sample comes from the same area as CT1,
CT3 and CT4. The metamictization and the associated incertitudes might involve the
calculation of an age younger than reality.
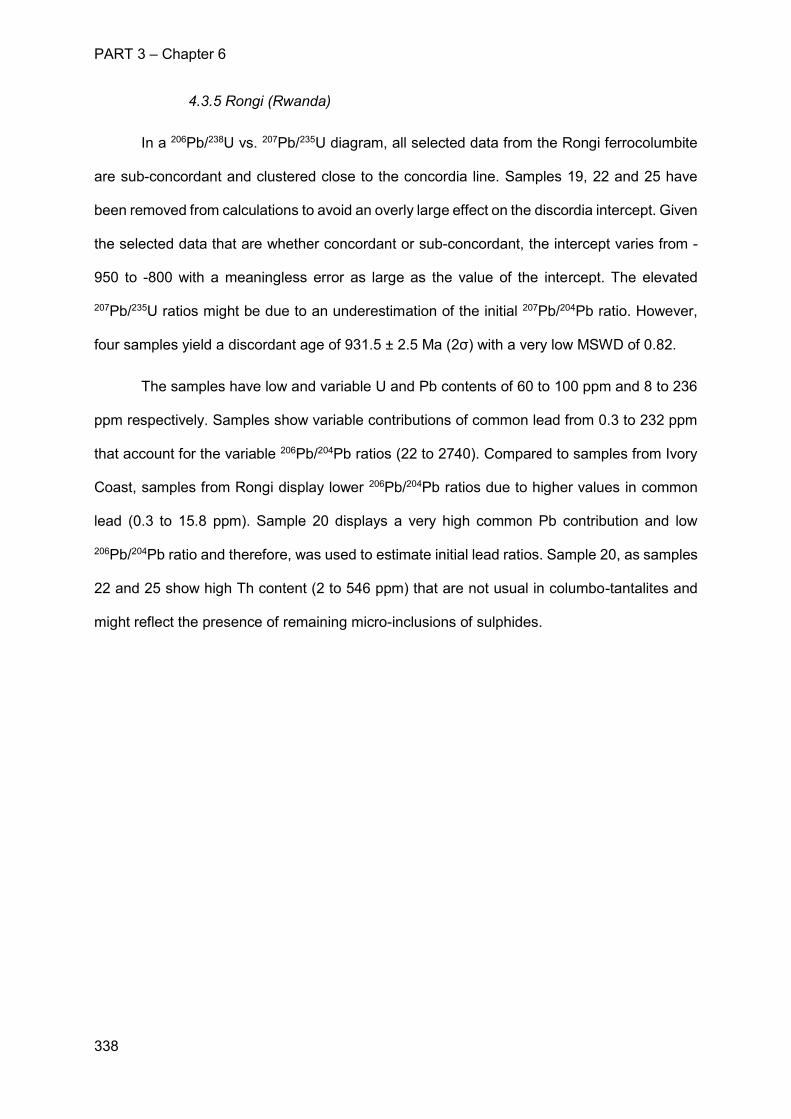
PART 3 – Chapter 6
338
4.3.5 Rongi (Rwanda)
In a 206Pb/238U vs. 207Pb/235U diagram, all selected data from the Rongi ferrocolumbite
are sub-concordant and clustered close to the concordia line. Samples 19, 22 and 25 have
been removed from calculations to avoid an overly large effect on the discordia intercept. Given
the selected data that are whether concordant or sub-concordant, the intercept varies from -
950 to -800 with a meaningless error as large as the value of the intercept. The elevated
207Pb/235U ratios might be due to an underestimation of the initial 207Pb/204Pb ratio. However,
four samples yield a discordant age of 931.5 ± 2.5 Ma (2σ) with a very low MSWD of 0.82.
The samples have low and variable U and Pb contents of 60 to 100 ppm and 8 to 236
ppm respectively. Samples show variable contributions of common lead from 0.3 to 232 ppm
that account for the variable 206Pb/204Pb ratios (22 to 2740). Compared to samples from Ivory
Coast, samples from Rongi display lower 206Pb/204Pb ratios due to higher values in common
lead (0.3 to 15.8 ppm). Sample 20 displays a very high common Pb contribution and low
206Pb/204Pb ratio and therefore, was used to estimate initial lead ratios. Sample 20, as samples
22 and 25 show high Th content (2 to 546 ppm) that are not usual in columbo-tantalites and
might reflect the presence of remaining micro-inclusions of sulphides.
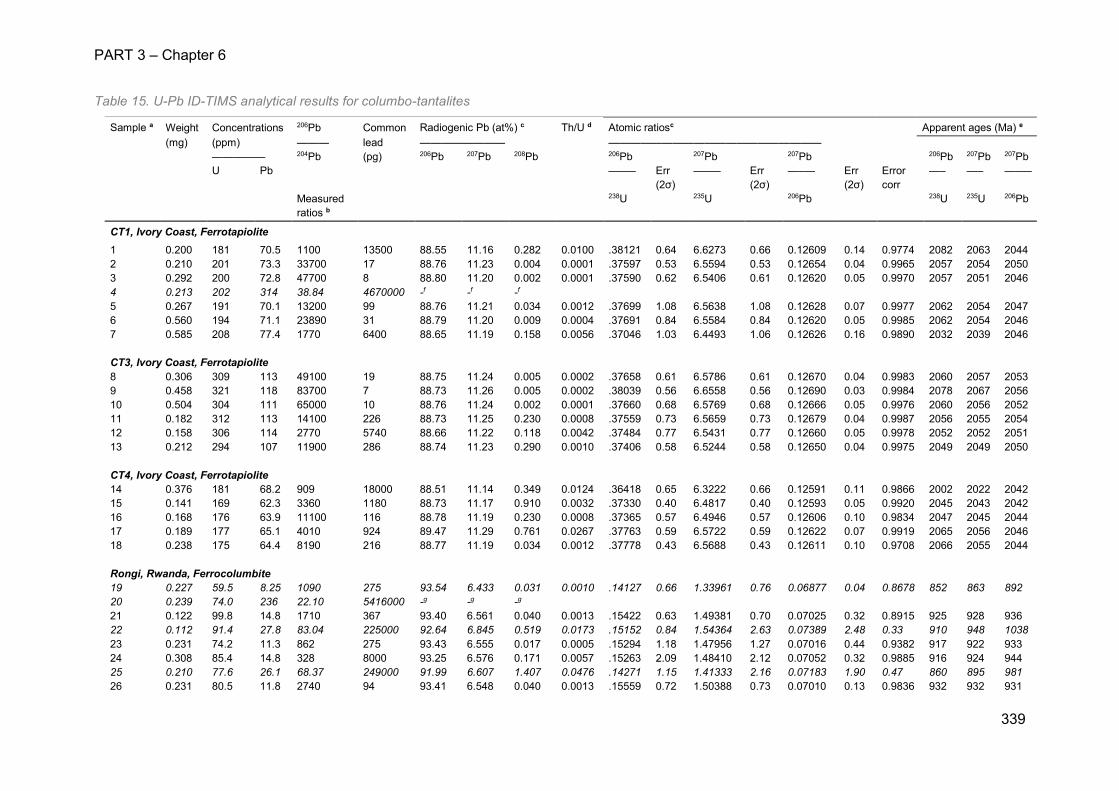
PART 3 – Chapter 6
339
Table 15. U-Pb ID-TIMS analytical results for columbo-tantalites
Sample a Weight Concentrations 206Pb Common Radiogenic Pb (at%) c Th/U d Atomic ratiosc Apparent ages (Ma) e (mg) (ppm) ——— lead ———————— ———————————————————— ————— 204Pb (pg) 206Pb 207Pb 208Pb 206Pb 207Pb 207Pb 206Pb 207Pb 207Pb U Pb —–— Err
(2σ) —–— Err
(2σ) —–— Err
(2σ) Error corr
—– —– —–—
Measured ratios b
238U 235U 206Pb 238U 235U 206Pb
CT1, Ivory Coast, Ferrotapiolite
1 0.200 181 70.5 1100 13500 88.55 11.16 0.282 0.0100 .38121 0.64 6.6273 0.66 0.12609 0.14 0.9774 2082 2063 2044 2 0.210 201 73.3 33700 17 88.76 11.23 0.004 0.0001 .37597 0.53 6.5594 0.53 0.12654 0.04 0.9965 2057 2054 2050 3 0.292 200 72.8 47700 8 88.80 11.20 0.002 0.0001 .37590 0.62 6.5406 0.61 0.12620 0.05 0.9970 2057 2051 2046 4 0.213 202 314 38.84 4670000 -f -f -f 5 0.267 191 70.1 13200 99 88.76 11.21 0.034 0.0012 .37699 1.08 6.5638 1.08 0.12628 0.07 0.9977 2062 2054 2047 6 0.560 194 71.1 23890 31 88.79 11.20 0.009 0.0004 .37691 0.84 6.5584 0.84 0.12620 0.05 0.9985 2062 2054 2046 7 0.585 208 77.4 1770 6400 88.65 11.19 0.158 0.0056 .37046 1.03 6.4493 1.06 0.12626 0.16 0.9890 2032 2039 2046
CT3, Ivory Coast, Ferrotapiolite 8 0.306 309 113 49100 19 88.75 11.24 0.005 0.0002 .37658 0.61 6.5786 0.61 0.12670 0.04 0.9983 2060 2057 2053 9 0.458 321 118 83700 7 88.73 11.26 0.005 0.0002 .38039 0.56 6.6558 0.56 0.12690 0.03 0.9984 2078 2067 2056 10 0.504 304 111 65000 10 88.76 11.24 0.002 0.0001 .37660 0.68 6.5769 0.68 0.12666 0.05 0.9976 2060 2056 2052 11 0.182 312 113 14100 226 88.73 11.25 0.230 0.0008 .37559 0.73 6.5659 0.73 0.12679 0.04 0.9987 2056 2055 2054 12 0.158 306 114 2770 5740 88.66 11.22 0.118 0.0042 .37484 0.77 6.5431 0.77 0.12660 0.05 0.9978 2052 2052 2051 13 0.212 294 107 11900 286 88.74 11.23 0.290 0.0010 .37406 0.58 6.5244 0.58 0.12650 0.04 0.9975 2049 2049 2050
CT4, Ivory Coast, Ferrotapiolite 14 0.376 181 68.2 909 18000 88.51 11.14 0.349 0.0124 .36418 0.65 6.3222 0.66 0.12591 0.11 0.9866 2002 2022 2042 15 0.141 169 62.3 3360 1180 88.73 11.17 0.910 0.0032 .37330 0.40 6.4817 0.40 0.12593 0.05 0.9920 2045 2043 2042 16 0.168 176 63.9 11100 116 88.78 11.19 0.230 0.0008 .37365 0.57 6.4946 0.57 0.12606 0.10 0.9834 2047 2045 2044 17 0.189 177 65.1 4010 924 89.47 11.29 0.761 0.0267 .37763 0.59 6.5722 0.59 0.12622 0.07 0.9919 2065 2056 2046 18 0.238 175 64.4 8190 216 88.77 11.19 0.034 0.0012 .37778 0.43 6.5688 0.43 0.12611 0.10 0.9708 2066 2055 2044
Rongi, Rwanda, Ferrocolumbite 19 0.227 59.5 8.25 1090 275 93.54 6.433 0.031 0.0010 .14127 0.66 1.33961 0.76 0.06877 0.04 0.8678 852 863 892 20 0.239 74.0 236 22.10 5416000 -g -g -g 21 0.122 99.8 14.8 1710 367 93.40 6.561 0.040 0.0013 .15422 0.63 1.49381 0.70 0.07025 0.32 0.8915 925 928 936 22 0.112 91.4 27.8 83.04 225000 92.64 6.845 0.519 0.0173 .15152 0.84 1.54364 2.63 0.07389 2.48 0.33 910 948 1038 23 0.231 74.2 11.3 862 275 93.43 6.555 0.017 0.0005 .15294 1.18 1.47956 1.27 0.07016 0.44 0.9382 917 922 933 24 0.308 85.4 14.8 328 8000 93.25 6.576 0.171 0.0057 .15263 2.09 1.48410 2.12 0.07052 0.32 0.9885 916 924 944 25 0.210 77.6 26.1 68.37 249000 91.99 6.607 1.407 0.0476 .14271 1.15 1.41333 2.16 0.07183 1.90 0.47 860 895 981 26 0.231 80.5 11.8 2740 94 93.41 6.548 0.040 0.0013 .15559 0.72 1.50388 0.73 0.07010 0.13 0.9836 932 932 931
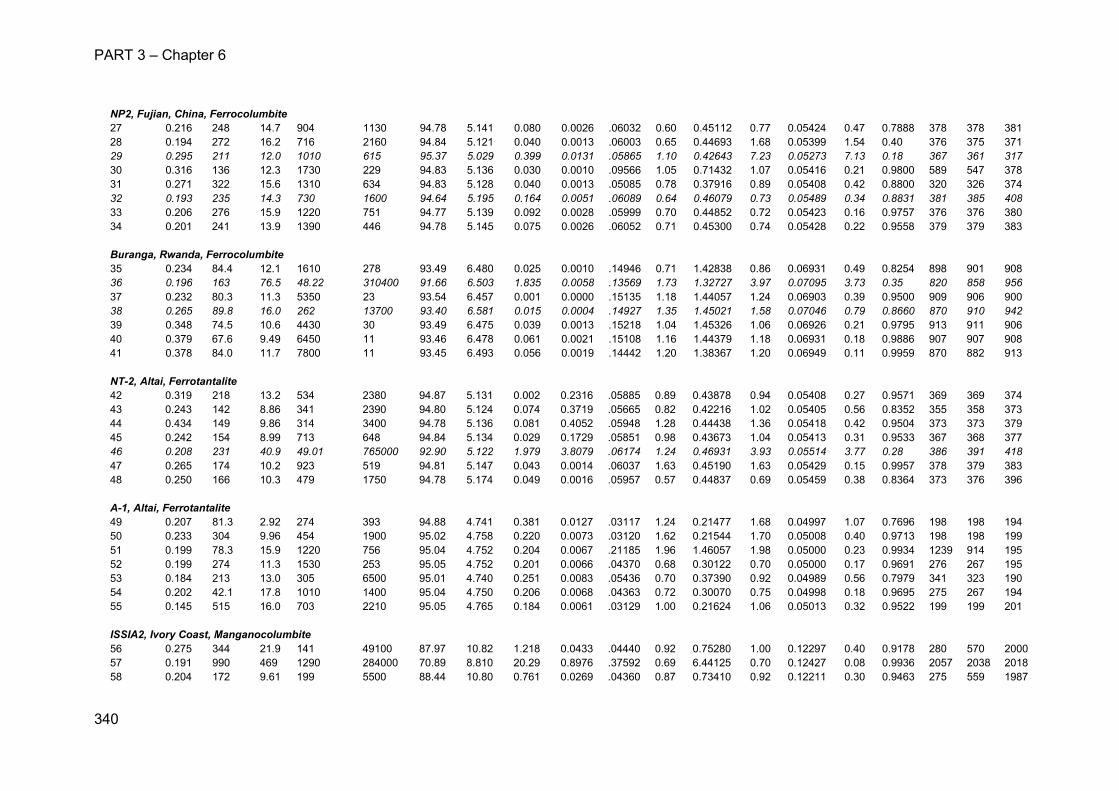
PART 3 – Chapter 6
340
NP2, Fujian, China, Ferrocolumbite 27 0.216 248 14.7 904 1130 94.78 5.141 0.080 0.0026 .06032 0.60 0.45112 0.77 0.05424 0.47 0.7888 378 378 381 28 0.194 272 16.2 716 2160 94.84 5.121 0.040 0.0013 .06003 0.65 0.44693 1.68 0.05399 1.54 0.40 376 375 371 29 0.295 211 12.0 1010 615 95.37 5.029 0.399 0.0131 .05865 1.10 0.42643 7.23 0.05273 7.13 0.18 367 361 317 30 0.316 136 12.3 1730 229 94.83 5.136 0.030 0.0010 .09566 1.05 0.71432 1.07 0.05416 0.21 0.9800 589 547 378 31 0.271 322 15.6 1310 634 94.83 5.128 0.040 0.0013 .05085 0.78 0.37916 0.89 0.05408 0.42 0.8800 320 326 374 32 0.193 235 14.3 730 1600 94.64 5.195 0.164 0.0051 .06089 0.64 0.46079 0.73 0.05489 0.34 0.8831 381 385 408 33 0.206 276 15.9 1220 751 94.77 5.139 0.092 0.0028 .05999 0.70 0.44852 0.72 0.05423 0.16 0.9757 376 376 380 34 0.201 241 13.9 1390 446 94.78 5.145 0.075 0.0026 .06052 0.71 0.45300 0.74 0.05428 0.22 0.9558 379 379 383
Buranga, Rwanda, Ferrocolumbite 35 0.234 84.4 12.1 1610 278 93.49 6.480 0.025 0.0010 .14946 0.71 1.42838 0.86 0.06931 0.49 0.8254 898 901 908 36 0.196 163 76.5 48.22 310400 91.66 6.503 1.835 0.0058 .13569 1.73 1.32727 3.97 0.07095 3.73 0.35 820 858 956 37 0.232 80.3 11.3 5350 23 93.54 6.457 0.001 0.0000 .15135 1.18 1.44057 1.24 0.06903 0.39 0.9500 909 906 900 38 0.265 89.8 16.0 262 13700 93.40 6.581 0.015 0.0004 .14927 1.35 1.45021 1.58 0.07046 0.79 0.8660 870 910 942 39 0.348 74.5 10.6 4430 30 93.49 6.475 0.039 0.0013 .15218 1.04 1.45326 1.06 0.06926 0.21 0.9795 913 911 906 40 0.379 67.6 9.49 6450 11 93.46 6.478 0.061 0.0021 .15108 1.16 1.44379 1.18 0.06931 0.18 0.9886 907 907 908 41 0.378 84.0 11.7 7800 11 93.45 6.493 0.056 0.0019 .14442 1.20 1.38367 1.20 0.06949 0.11 0.9959 870 882 913 NT-2, Altai, Ferrotantalite 42 0.319 218 13.2 534 2380 94.87 5.131 0.002 0.2316 .05885 0.89 0.43878 0.94 0.05408 0.27 0.9571 369 369 374 43 0.243 142 8.86 341 2390 94.80 5.124 0.074 0.3719 .05665 0.82 0.42216 1.02 0.05405 0.56 0.8352 355 358 373 44 0.434 149 9.86 314 3400 94.78 5.136 0.081 0.4052 .05948 1.28 0.44438 1.36 0.05418 0.42 0.9504 373 373 379 45 0.242 154 8.99 713 648 94.84 5.134 0.029 0.1729 .05851 0.98 0.43673 1.04 0.05413 0.31 0.9533 367 368 377 46 0.208 231 40.9 49.01 765000 92.90 5.122 1.979 3.8079 .06174 1.24 0.46931 3.93 0.05514 3.77 0.28 386 391 418 47 0.265 174 10.2 923 519 94.81 5.147 0.043 0.0014 .06037 1.63 0.45190 1.63 0.05429 0.15 0.9957 378 379 383 48 0.250 166 10.3 479 1750 94.78 5.174 0.049 0.0016 .05957 0.57 0.44837 0.69 0.05459 0.38 0.8364 373 376 396 A-1, Altai, Ferrotantalite 49 0.207 81.3 2.92 274 393 94.88 4.741 0.381 0.0127 .03117 1.24 0.21477 1.68 0.04997 1.07 0.7696 198 198 194 50 0.233 304 9.96 454 1900 95.02 4.758 0.220 0.0073 .03120 1.62 0.21544 1.70 0.05008 0.40 0.9713 198 198 199 51 0.199 78.3 15.9 1220 756 95.04 4.752 0.204 0.0067 .21185 1.96 1.46057 1.98 0.05000 0.23 0.9934 1239 914 195 52 0.199 274 11.3 1530 253 95.05 4.752 0.201 0.0066 .04370 0.68 0.30122 0.70 0.05000 0.17 0.9691 276 267 195 53 0.184 213 13.0 305 6500 95.01 4.740 0.251 0.0083 .05436 0.70 0.37390 0.92 0.04989 0.56 0.7979 341 323 190 54 0.202 42.1 17.8 1010 1400 95.04 4.750 0.206 0.0068 .04363 0.72 0.30070 0.75 0.04998 0.18 0.9695 275 267 194 55 0.145 515 16.0 703 2210 95.05 4.765 0.184 0.0061 .03129 1.00 0.21624 1.06 0.05013 0.32 0.9522 199 199 201 ISSIA2, Ivory Coast, Manganocolumbite 56 0.275 344 21.9 141 49100 87.97 10.82 1.218 0.0433 .04440 0.92 0.75280 1.00 0.12297 0.40 0.9178 280 570 2000 57 0.191 990 469 1290 284000 70.89 8.810 20.29 0.8976 .37592 0.69 6.44125 0.70 0.12427 0.08 0.9936 2057 2038 2018 58 0.204 172 9.61 199 5500 88.44 10.80 0.761 0.0269 .04360 0.87 0.73410 0.92 0.12211 0.30 0.9463 275 559 1987
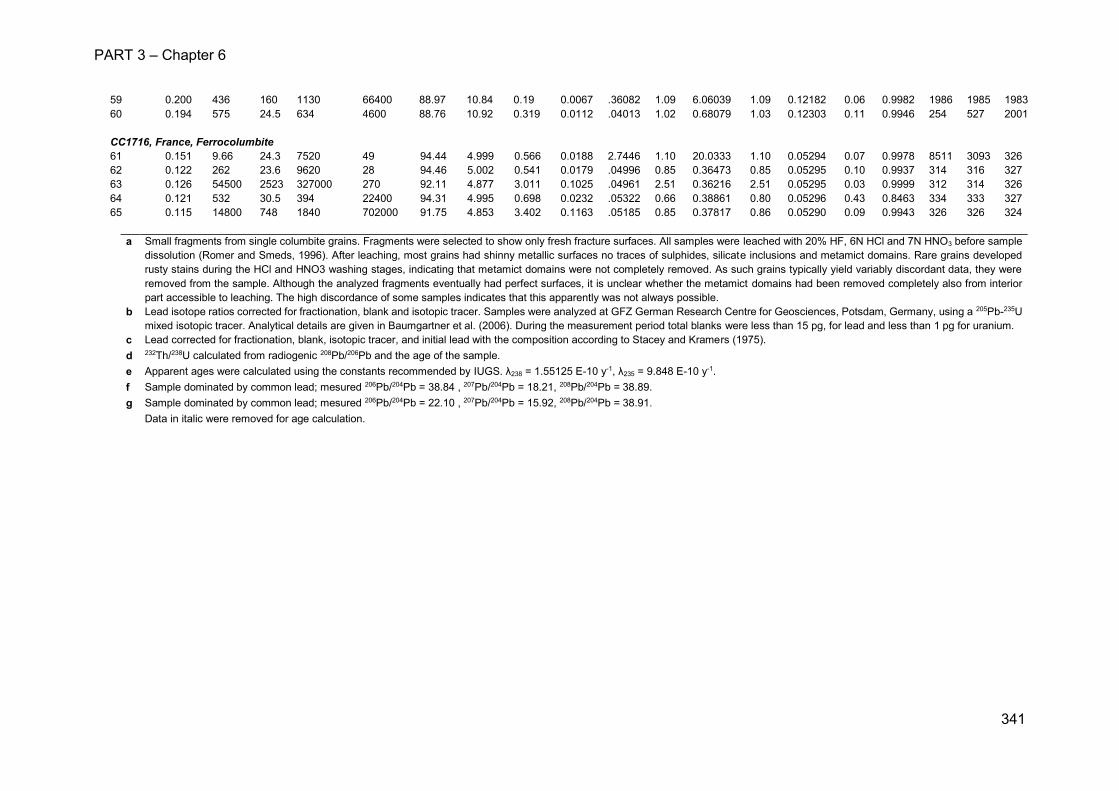
PART 3 – Chapter 6
341
59 0.200 436 160 1130 66400 88.97 10.84 0.19 0.0067 .36082 1.09 6.06039 1.09 0.12182 0.06 0.9982 1986 1985 1983 60 0.194 575 24.5 634 4600 88.76 10.92 0.319 0.0112 .04013 1.02 0.68079 1.03 0.12303 0.11 0.9946 254 527 2001 CC1716, France, Ferrocolumbite 61 0.151 9.66 24.3 7520 49 94.44 4.999 0.566 0.0188 2.7446 1.10 20.0333 1.10 0.05294 0.07 0.9978 8511 3093 326 62 0.122 262 23.6 9620 28 94.46 5.002 0.541 0.0179 .04996 0.85 0.36473 0.85 0.05295 0.10 0.9937 314 316 327 63 0.126 54500 2523 327000 270 92.11 4.877 3.011 0.1025 .04961 2.51 0.36216 2.51 0.05295 0.03 0.9999 312 314 326 64 0.121 532 30.5 394 22400 94.31 4.995 0.698 0.0232 .05322 0.66 0.38861 0.80 0.05296 0.43 0.8463 334 333 327 65 0.115 14800 748 1840 702000 91.75 4.853 3.402 0.1163 .05185 0.85 0.37817 0.86 0.05290 0.09 0.9943 326 326 324
a Small fragments from single columbite grains. Fragments were selected to show only fresh fracture surfaces. All samples were leached with 20% HF, 6N HCl and 7N HNO3 before sample dissolution (Romer and Smeds, 1996). After leaching, most grains had shinny metallic surfaces no traces of sulphides, silicate inclusions and metamict domains. Rare grains developed rusty stains during the HCl and HNO3 washing stages, indicating that metamict domains were not completely removed. As such grains typically yield variably discordant data, they were removed from the sample. Although the analyzed fragments eventually had perfect surfaces, it is unclear whether the metamict domains had been removed completely also from interior part accessible to leaching. The high discordance of some samples indicates that this apparently was not always possible.
b Lead isotope ratios corrected for fractionation, blank and isotopic tracer. Samples were analyzed at GFZ German Research Centre for Geosciences, Potsdam, Germany, using a 205Pb-235U mixed isotopic tracer. Analytical details are given in Baumgartner et al. (2006). During the measurement period total blanks were less than 15 pg, for lead and less than 1 pg for uranium.
c Lead corrected for fractionation, blank, isotopic tracer, and initial lead with the composition according to Stacey and Kramers (1975). d 232Th/238U calculated from radiogenic 208Pb/206Pb and the age of the sample. e Apparent ages were calculated using the constants recommended by IUGS. λ238 = 1.55125 E-10 y-1, λ235 = 9.848 E-10 y-1. f Sample dominated by common lead; mesured 206Pb/204Pb = 38.84 , 207Pb/204Pb = 18.21, 208Pb/204Pb = 38.89. g Sample dominated by common lead; mesured 206Pb/204Pb = 22.10 , 207Pb/204Pb = 15.92, 208Pb/204Pb = 38.91. Data in italic were removed for age calculation.
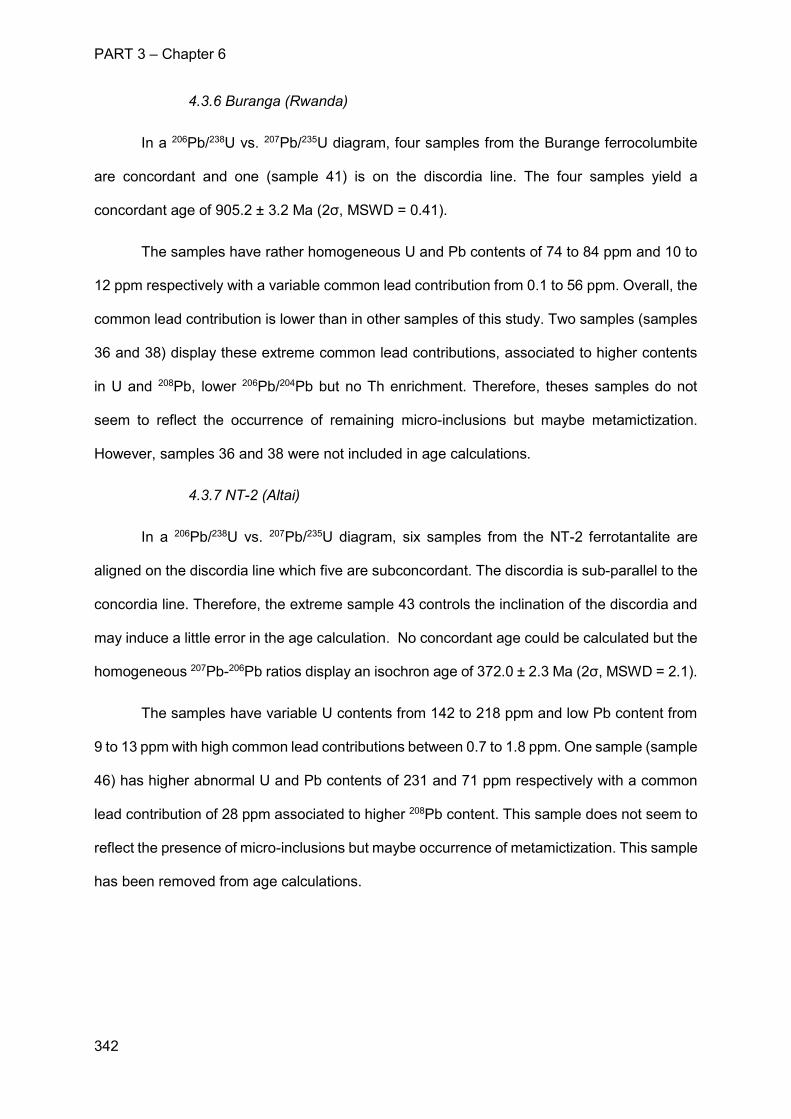
PART 3 – Chapter 6
342
4.3.6 Buranga (Rwanda)
In a 206Pb/238U vs. 207Pb/235U diagram, four samples from the Burange ferrocolumbite
are concordant and one (sample 41) is on the discordia line. The four samples yield a
concordant age of 905.2 ± 3.2 Ma (2σ, MSWD = 0.41).
The samples have rather homogeneous U and Pb contents of 74 to 84 ppm and 10 to
12 ppm respectively with a variable common lead contribution from 0.1 to 56 ppm. Overall, the
common lead contribution is lower than in other samples of this study. Two samples (samples
36 and 38) display these extreme common lead contributions, associated to higher contents
in U and 208Pb, lower 206Pb/204Pb but no Th enrichment. Therefore, theses samples do not
seem to reflect the occurrence of remaining micro-inclusions but maybe metamictization.
However, samples 36 and 38 were not included in age calculations.
4.3.7 NT-2 (Altai)
In a 206Pb/238U vs. 207Pb/235U diagram, six samples from the NT-2 ferrotantalite are
aligned on the discordia line which five are subconcordant. The discordia is sub-parallel to the
concordia line. Therefore, the extreme sample 43 controls the inclination of the discordia and
may induce a little error in the age calculation. No concordant age could be calculated but the
homogeneous 207Pb-206Pb ratios display an isochron age of 372.0 ± 2.3 Ma (2σ, MSWD = 2.1).
The samples have variable U contents from 142 to 218 ppm and low Pb content from
9 to 13 ppm with high common lead contributions between 0.7 to 1.8 ppm. One sample (sample
46) has higher abnormal U and Pb contents of 231 and 71 ppm respectively with a common
lead contribution of 28 ppm associated to higher 208Pb content. This sample does not seem to
reflect the presence of micro-inclusions but maybe occurrence of metamictization. This sample
has been removed from age calculations.
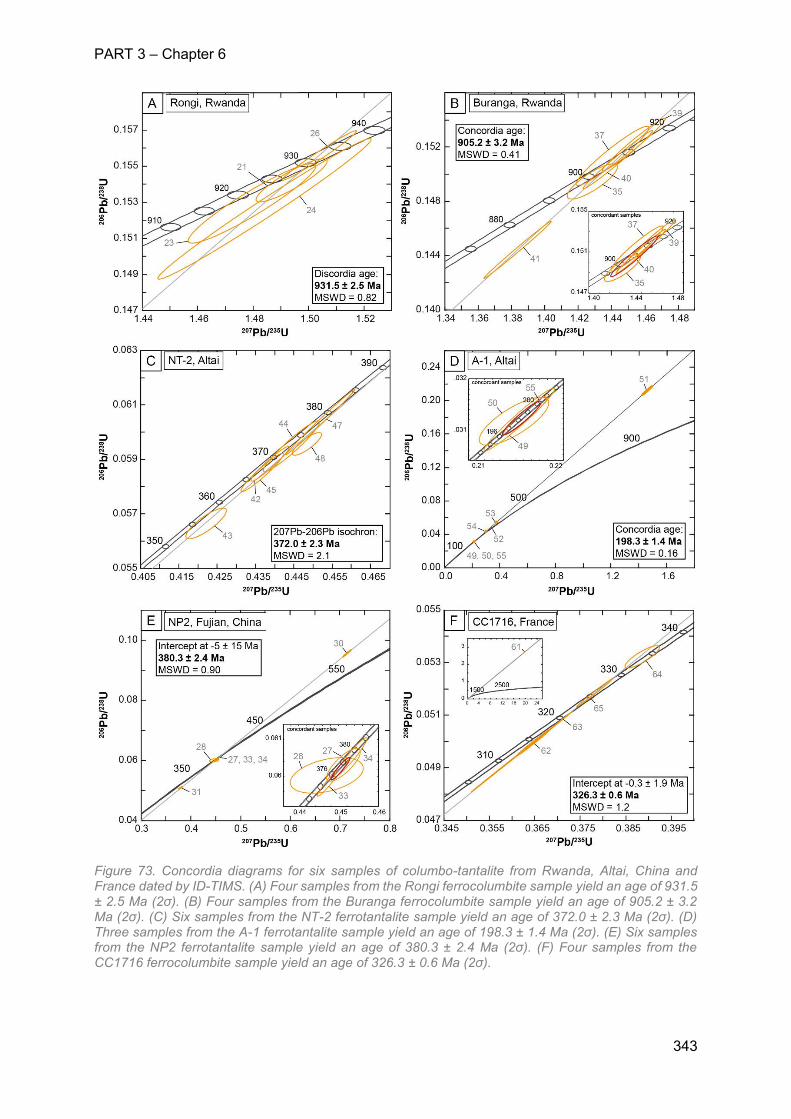
PART 3 – Chapter 6
343
Figure 73. Concordia diagrams for six samples of columbo-tantalite from Rwanda, Altai, China and France dated by ID-TIMS. (A) Four samples from the Rongi ferrocolumbite sample yield an age of 931.5 ± 2.5 Ma (2σ). (B) Four samples from the Buranga ferrocolumbite sample yield an age of 905.2 ± 3.2 Ma (2σ). (C) Six samples from the NT-2 ferrotantalite sample yield an age of 372.0 ± 2.3 Ma (2σ). (D) Three samples from the A-1 ferrotantalite sample yield an age of 198.3 ± 1.4 Ma (2σ). (E) Six samples from the NP2 ferrotantalite sample yield an age of 380.3 ± 2.4 Ma (2σ). (F) Four samples from the CC1716 ferrocolumbite sample yield an age of 326.3 ± 0.6 Ma (2σ).
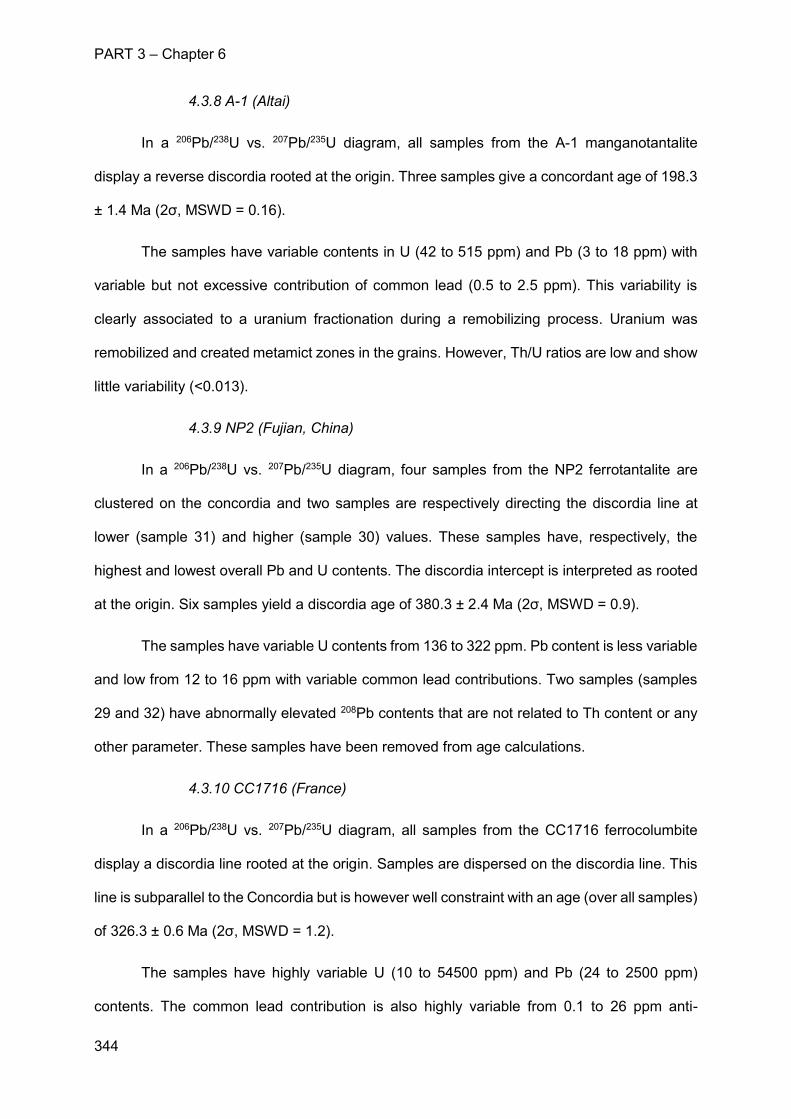
PART 3 – Chapter 6
344
4.3.8 A-1 (Altai)
In a 206Pb/238U vs. 207Pb/235U diagram, all samples from the A-1 manganotantalite
display a reverse discordia rooted at the origin. Three samples give a concordant age of 198.3
± 1.4 Ma (2σ, MSWD = 0.16).
The samples have variable contents in U (42 to 515 ppm) and Pb (3 to 18 ppm) with
variable but not excessive contribution of common lead (0.5 to 2.5 ppm). This variability is
clearly associated to a uranium fractionation during a remobilizing process. Uranium was
remobilized and created metamict zones in the grains. However, Th/U ratios are low and show
little variability (<0.013).
4.3.9 NP2 (Fujian, China)
In a 206Pb/238U vs. 207Pb/235U diagram, four samples from the NP2 ferrotantalite are
clustered on the concordia and two samples are respectively directing the discordia line at
lower (sample 31) and higher (sample 30) values. These samples have, respectively, the
highest and lowest overall Pb and U contents. The discordia intercept is interpreted as rooted
at the origin. Six samples yield a discordia age of 380.3 ± 2.4 Ma (2σ, MSWD = 0.9).
The samples have variable U contents from 136 to 322 ppm. Pb content is less variable
and low from 12 to 16 ppm with variable common lead contributions. Two samples (samples
29 and 32) have abnormally elevated 208Pb contents that are not related to Th content or any
other parameter. These samples have been removed from age calculations.
4.3.10 CC1716 (France)
In a 206Pb/238U vs. 207Pb/235U diagram, all samples from the CC1716 ferrocolumbite
display a discordia line rooted at the origin. Samples are dispersed on the discordia line. This
line is subparallel to the Concordia but is however well constraint with an age (over all samples)
of 326.3 ± 0.6 Ma (2σ, MSWD = 1.2).
The samples have highly variable U (10 to 54500 ppm) and Pb (24 to 2500 ppm)
contents. The common lead contribution is also highly variable from 0.1 to 26 ppm anti-
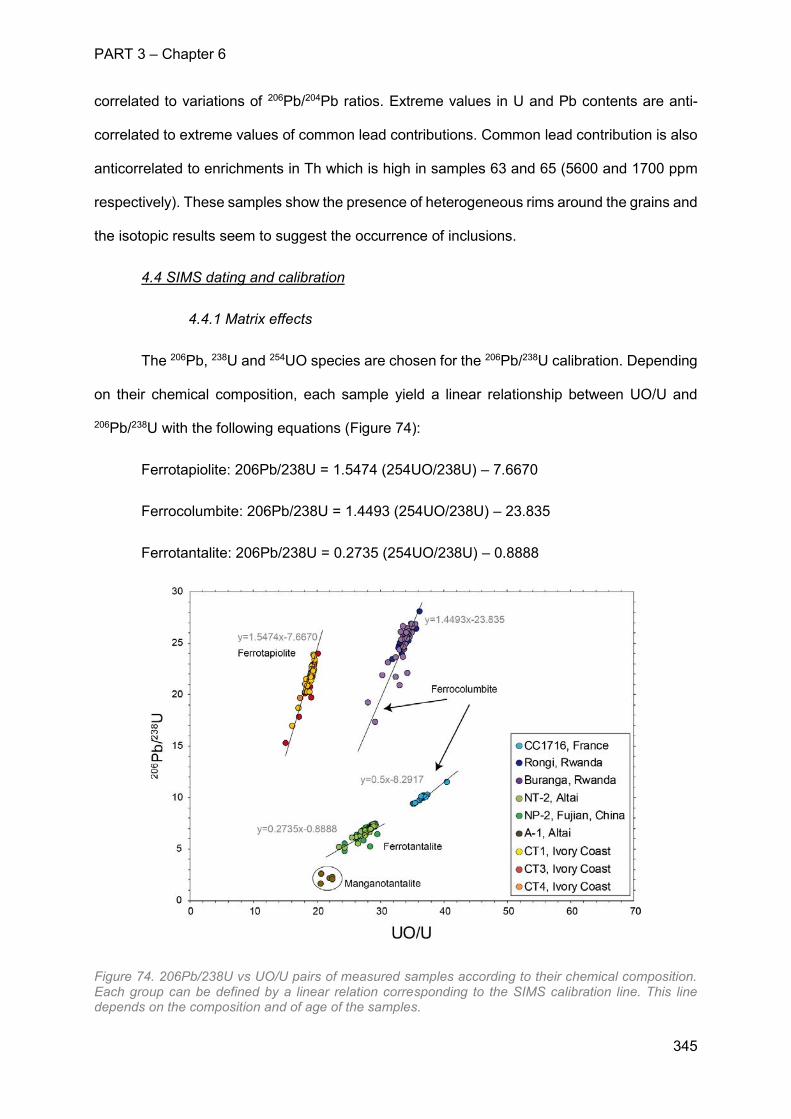
PART 3 – Chapter 6
345
correlated to variations of 206Pb/204Pb ratios. Extreme values in U and Pb contents are anti-
correlated to extreme values of common lead contributions. Common lead contribution is also
anticorrelated to enrichments in Th which is high in samples 63 and 65 (5600 and 1700 ppm
respectively). These samples show the presence of heterogeneous rims around the grains and
the isotopic results seem to suggest the occurrence of inclusions.
4.4 SIMS dating and calibration
4.4.1 Matrix effects
The 206Pb, 238U and 254UO species are chosen for the 206Pb/238U calibration. Depending
on their chemical composition, each sample yield a linear relationship between UO/U and
206Pb/238U with the following equations (Figure 74):
Ferrotapiolite: 206Pb/238U = 1.5474 (254UO/238U) – 7.6670
Ferrocolumbite: 206Pb/238U = 1.4493 (254UO/238U) – 23.835
Ferrotantalite: 206Pb/238U = 0.2735 (254UO/238U) – 0.8888
Figure 74. 206Pb/238U vs UO/U pairs of measured samples according to their chemical composition. Each group can be defined by a linear relation corresponding to the SIMS calibration line. This line depends on the composition and of age of the samples.
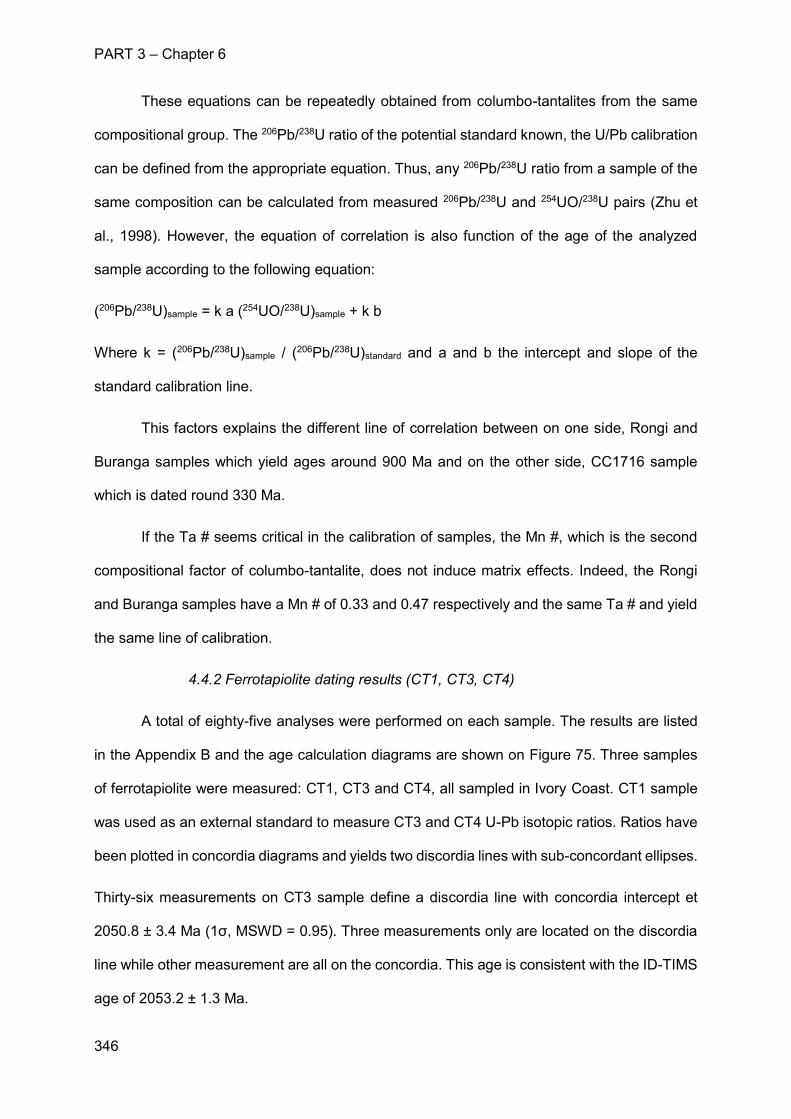
PART 3 – Chapter 6
346
These equations can be repeatedly obtained from columbo-tantalites from the same
compositional group. The 206Pb/238U ratio of the potential standard known, the U/Pb calibration
can be defined from the appropriate equation. Thus, any 206Pb/238U ratio from a sample of the
same composition can be calculated from measured 206Pb/238U and 254UO/238U pairs (Zhu et
al., 1998). However, the equation of correlation is also function of the age of the analyzed
sample according to the following equation:
(206Pb/238U)sample = k a (254UO/238U)sample + k b
Where k = (206Pb/238U)sample / (206Pb/238U)standard and a and b the intercept and slope of the
standard calibration line.
This factors explains the different line of correlation between on one side, Rongi and
Buranga samples which yield ages around 900 Ma and on the other side, CC1716 sample
which is dated round 330 Ma.
If the Ta # seems critical in the calibration of samples, the Mn #, which is the second
compositional factor of columbo-tantalite, does not induce matrix effects. Indeed, the Rongi
and Buranga samples have a Mn # of 0.33 and 0.47 respectively and the same Ta # and yield
the same line of calibration.
4.4.2 Ferrotapiolite dating results (CT1, CT3, CT4)
A total of eighty-five analyses were performed on each sample. The results are listed
in the Appendix B and the age calculation diagrams are shown on Figure 75. Three samples
of ferrotapiolite were measured: CT1, CT3 and CT4, all sampled in Ivory Coast. CT1 sample
was used as an external standard to measure CT3 and CT4 U-Pb isotopic ratios. Ratios have
been plotted in concordia diagrams and yields two discordia lines with sub-concordant ellipses.
Thirty-six measurements on CT3 sample define a discordia line with concordia intercept et
2050.8 ± 3.4 Ma (1σ, MSWD = 0.95). Three measurements only are located on the discordia
line while other measurement are all on the concordia. This age is consistent with the ID-TIMS
age of 2053.2 ± 1.3 Ma.
PART 3 – Chapter 6
347
Figure 75. Concordia diagrams for two samples of Ferrotapiolite CT3 and CT4 calculated with CT1 as external standard. (A) Thirty-six measurements of the CT3 ferrotapiolite sample yield an age of 2050.8 ± 3.4 Ma (1σ). (B) Ten measurements of the CT4 ferrotapiolite sample yield an age of 2042.3 ± 4.0 Ma (1σ). Concordia diagrams for two samples of Ferrocolumbite Buranga and CC1716 calculated with Rongi as external standard. (C) Fifteen measurements of the Buranga ferrocolumbite sample yield an age of 901.0 ± 5.4 Ma (1σ). (D) Twelve measurements of the CC1716 ferrocolumbite sample yield an age of 333.8 ± 2.0 Ma (1σ). (E) Concordia diagram of the NT-2 Ferrotantalite calculated with NP2 as external standard and yielding an age of 372.8 ± 5.6 Ma (1σ). (F) Weighted age diagram of the NT-2 Ferrotantalite calculated from all analyses with NP2 as external standard and yielding an age of 369.1 ± 4.4 Ma (1σ).
PART 3 – Chapter 6
348
Ten measurements were performed on the CT4 sample and are displayed along a discordia
line which intercepts the concordia at 2042 ± 4.0 (1σ, MSWD = 0.55). One measurement is
located on the concordia line while the nine others are sub-concordant, above the concordia
line. This age matches the ID-TIMS measurements that yielded an age of 2044.5 ± 1.6 Ma.
4.4.3 Ferrocolumbite dating results
A total of sixty-three analyses were performed on each sample. The results are listed in the
Appendix B and the age calculation diagrams are shown on Figure 75. Three samples of
ferrocolumbite were analysed: Rongi, Burang and CC1716. The Rongi sample was used as
an external standard to calibrate and calculate the isotopic ratios of Buranga and CC1716
samples. Both samples yield concordia ages.
Fifteen measurement of the Buranga sample (over seventeen) yield an age of 901.0 ± 5.4 Ma
(1σ, MSWD = 2.0) in accordance with ID-TIMS measurements (905.2 ± 3.2 Ma). The two
discriminated measurement did not permit to calculate a concordia age but are subconcordant.
The totality of the measurements also yield a discordia age of 901.0 ± 5.4 Ma (1σ, MSWD =
0.90).
Twelve measurements (over fifteen) of the CC1716 sample yield an age of 333.8 ± 2.0 Ma
(1σ, MSWD = 0.33). All measurement display sub-concordant ellipses. Among the two
discrimated measurements, one was too low under the concordia line to calculate a concordant
age and the second had a very large error. However, the totally of the measurement also yield
a discordia age of 334.7 ± 1.7 Ma (1σ, MSWD = 1.3). This age is a little older than the ID-TIMS
calculated age (326.3 ± 0.6 Ma). This error can be due to younger age of this sample compared
to the Rongi standard.
4.4.2 Ferrotantalite dating results
A total of forty-five analyses were performed on each sample. The results are listed in the
Appendix B and the age calculation diagrams are shown on Figure 75. Two samples of
ferrotantalite were measured: NP2 and NT-2. NP2 was used as external standard to calculate
PART 3 – Chapter 6
349
the NT-2 isotopic ratios. Both sample have low 207Pb content which induces a large error in a
concordia diagram. Therefore, nearly half measurement could not be used for age calculation
in this kind of diagram.
Nine measurements (over twenty) of the NT-2 sample are subconcordant and yield an age of
372.8 ± 5.6 Ma (1σ, MSWD = 0.85). This age is in accordance with ID-TIMS measurements
(372.0 ± 2.3 Ma). Nevertheless, a weighted age calculation including all analyses seems more
adequate for this sample and yields an age of 369.1 ± 4.4 Ma (1σ, MSWD = 4.6) which is also
consistent with ID-TIMS measurements.
5. Conclusion
We conducted comprehensive U-Pb measurement with multiple techniques (ID-TIMS and
SIMS) to evaluate columbo-tantalites from multiple locations. The data show age and
compositional homogeneity in the scale of centimetric grains. Columbo-tantalite isotopic ratios
are subjected to matrix effects which limit the accuracy of SIMS calibration. These matrix
effects are controlled by the Ta/(Nb+Ta) ratio of the samples and the range of age calculated.
Therefore, the CT1, CT3 and CT4 chemical and isotopically homogeneous ferrotapiolite are
considered as suitable natural reference material for SIMS U-Pb analysis as well as Rongi and
Buranga samples in the range of ferrocolumbite. NP2 and NT-2 ferrotantalite samples can also
be considered as valuable reference materials with mean 206Pb/238U age calculations.

PART 3 – Chapter 6
350
PART 3 – Chapter 6
351
References
Allou, B.A., Lu, H.Z., Guha, J., Carignan, J., Naho, J., Pothin, K., Yobou, R., 2005. Une
Corrélation Génétique entre les Roches Granitiques, et les Dépôts Éluvionnaires,
Colluvionnaires et Alluvionnaires de Columbo-Tantalite d’Issia, Centre-Ouest de la
Côte d’Ivoire. Exploration and Mining Geology 14, 61-77.
Che, X.D., Wu, F.Y., Wang, R.C., Gerdes, A., Ji, W.Q., Zhao, Z.H., Yang, J.H., Zhu, Z.Y., 2015.
In situ U–Pb isotopic dating of columbite–tantalite by LA–ICP–MS. Ore Geology
Reviews 65, 979-989.
Compston, W., Williams, I.S., Meyer, C., 1984. U–Pb geochronology of zircons from lunar
breccia 73217 using a sensitive high mass-resolution ion probe.
Proceedings of the fourteenth lunar and planetary science conference,
Part 2, Journal of Geophysical research, Vol. 89, B525–B534.
De Chambost, E., Schuhmacher, M., Lovestam, G., Claesson, S., 1996. Achieving high
transmission with the Cameca IMS-1270. Secondary ion mass spectrometry, SIMS X.
Wiley, Chichester, 1003-1006.
Dewaele, S., Henjes-Kunst, F., Melcher, F., Sitnikova, M., Burgess, R., Gerdes, A., Fernandez,
M.A., De Clercq, F., Muchez, P., Lehmann, B., 2011. Late Neoproterozoic overprinting
of the cassiterite and columbite-tantalite bearing pegmatites of the Gatumba area,
Rwanda (Central Africa). Journal of African Earth Sciences 61, 10-26.
Guérangé, B., Guigues J., Moussu, R., Parfenoff, A., 1971. Un granite niobo-tantalifère : le
massif des épesses (Massif Armoricain, Vendée, France). Colloque scientifique du
Bureau de Recherche Géologiques et Minières, 130-138.
Harlaux, M., Romer, R. L., Mercadier, J., Morlot, C., Marignac, C., Cuney, M., 2017. 40 Ma
years of hydrothermal W mineralization during the Variscan orogenic evolution of the
French Massif Central revealed by U-Pb dating of wolframite. Mineralium Deposita, 1-
31.
Ludwig, K.R., 1993. ISOPLOT: a plotting and regression program for radiogenic-isotope data.
U.S. Geological Survey, Open File Report, 91–445, 1–42.
Melcher, F., Graupner, T., Gäbler, H. E., Sitnikova, M., Henjes-Kunst, F., Oberthür, T., Gerdes,
A., Dewaele, S., 2015. Tantalum–(niobium–tin) mineralisation in African pegmatites
and rare metal granites: Constraints from Ta–Nb oxide mineralogy, geochemistry and
U–Pb geochronology. Ore Geology Reviews 64, 667-719.
PART 3 – Chapter 6
352
Mezger, K., and Krogstad, E. J., 1997. Interpretation of discordant U‐Pb zircon ages: an
evaluation. Journal of metamorphic Geology 15, 127-140.
Rao, C., Wang, R.C., Hu, H., Zhang, W.L., 2009. Complex internal textures in oxide minerals
from the Nanping No. 31 dyke of granitic pegmatite, Fujian Province, southeastern
China. Canadian Mineralogist 47, 1195–1212.
Romer, R.L., and Lüders, V., 2006. Direct dating of hydrothermal W mineralization: U-Pb age
for hübnerite (MnWO4), Sweet Home Mine, Colorado. Geochimica et Cosmochimica
Acta 70, 4725-4733.
Romer, R.L., Heinrich, W., Schröder-Smeibidl, B., Meixner, A., Fischer, C.O., Schulz, C., 2005.
Elemental dispersion and stable isotope fractionation during reactive fluid-flow and fluid
immiscibility in the Bufa del Diente aureole, NE-Mexico: Evidence from radiographies
and Li, B, Sr, Nd, and Pb isotope systematics. Contributions to Mineralogy and
Petrology 149, 400-429.
Schmid, R., Romer, R.L., Franz, L., Oberhänsli, R., Martinotti, G., 2003. Basement-cover
sequences within the UHP unit of the Dabie Shan. Journal of Metamorphic Geology
21, 531–538.
Stacey, J.S., and Kramers, J.D. (1975). Approximation of terrestrial lead isotope evolution by
a two-stage model. Earth and planetary science letters 26, 207-221.
Wang, R.C., Che, X.D., Zhang, W.L., Zhang, A.C., Zhang, H., 2012. Geochemical evolution
and late re-equilibration of Na–Cs-rich beryl from the Koktokay #3 pegmatite (Altai, NW
China). European Journal of Mineralogy 21, 795–809.
Zhang, A.C., Wang, R.C., Hu, H., Zhang, H., Zhu, J.C., Chen, X.M., 2004. Chemical evolution
of Nb–Ta oxides and zircon from the Koktokay No. 3 granitic pegmatite, Altai,
northwestern China. Mineralogical Magazine 68, 739–756.
Zhu, X.K., O'Nions, R.K., Gibb, A.J., 1998. SIMS analysis of U–Pb isotopes in monazite: matrix
effects. Chemical geology 144, 305-312.
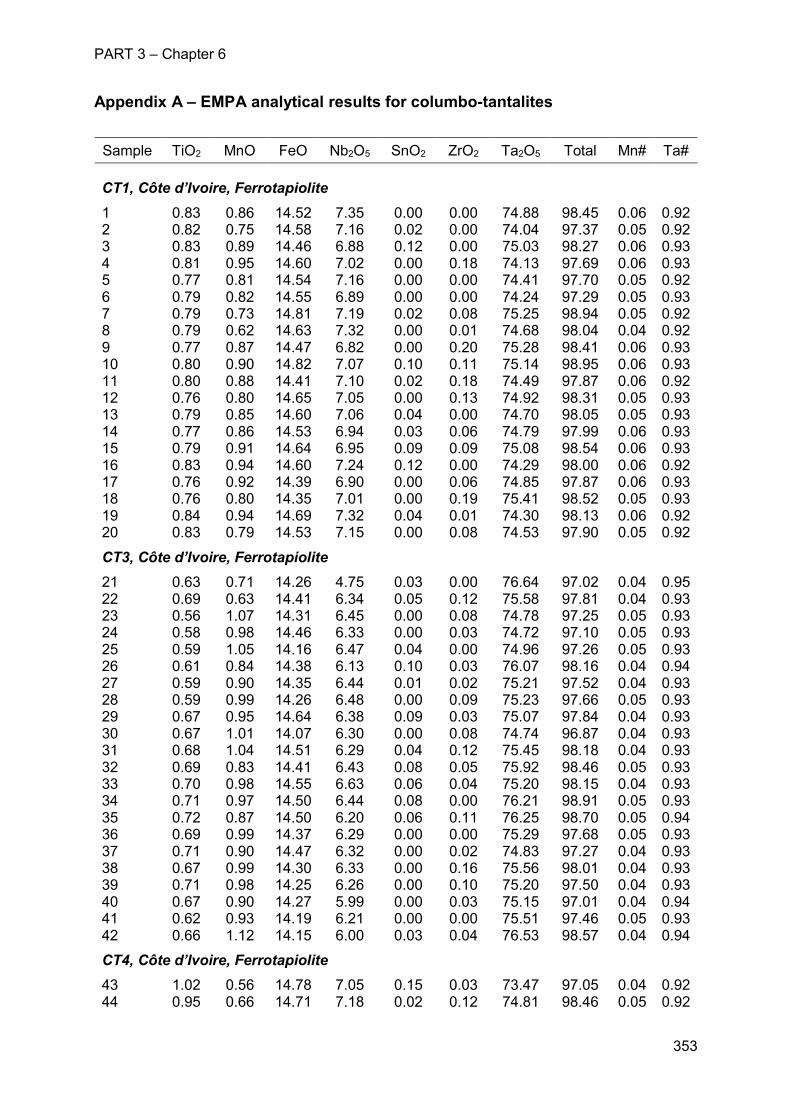
PART 3 – Chapter 6
353
Appendix A – EMPA analytical results for columbo-tantalites
Sample TiO2 MnO FeO Nb2O5 SnO2 ZrO2 Ta2O5 Total Mn# Ta#
CT1, Côte d’Ivoire, Ferrotapiolite
1 0.83 0.86 14.52 7.35 0.00 0.00 74.88 98.45 0.06 0.92 2 0.82 0.75 14.58 7.16 0.02 0.00 74.04 97.37 0.05 0.92 3 0.83 0.89 14.46 6.88 0.12 0.00 75.03 98.27 0.06 0.93 4 0.81 0.95 14.60 7.02 0.00 0.18 74.13 97.69 0.06 0.93 5 0.77 0.81 14.54 7.16 0.00 0.00 74.41 97.70 0.05 0.92 6 0.79 0.82 14.55 6.89 0.00 0.00 74.24 97.29 0.05 0.93 7 0.79 0.73 14.81 7.19 0.02 0.08 75.25 98.94 0.05 0.92 8 0.79 0.62 14.63 7.32 0.00 0.01 74.68 98.04 0.04 0.92 9 0.77 0.87 14.47 6.82 0.00 0.20 75.28 98.41 0.06 0.93 10 0.80 0.90 14.82 7.07 0.10 0.11 75.14 98.95 0.06 0.93 11 0.80 0.88 14.41 7.10 0.02 0.18 74.49 97.87 0.06 0.92 12 0.76 0.80 14.65 7.05 0.00 0.13 74.92 98.31 0.05 0.93 13 0.79 0.85 14.60 7.06 0.04 0.00 74.70 98.05 0.05 0.93 14 0.77 0.86 14.53 6.94 0.03 0.06 74.79 97.99 0.06 0.93 15 0.79 0.91 14.64 6.95 0.09 0.09 75.08 98.54 0.06 0.93 16 0.83 0.94 14.60 7.24 0.12 0.00 74.29 98.00 0.06 0.92 17 0.76 0.92 14.39 6.90 0.00 0.06 74.85 97.87 0.06 0.93 18 0.76 0.80 14.35 7.01 0.00 0.19 75.41 98.52 0.05 0.93 19 0.84 0.94 14.69 7.32 0.04 0.01 74.30 98.13 0.06 0.92 20 0.83 0.79 14.53 7.15 0.00 0.08 74.53 97.90 0.05 0.92
CT3, Côte d’Ivoire, Ferrotapiolite
21 0.63 0.71 14.26 4.75 0.03 0.00 76.64 97.02 0.04 0.95 22 0.69 0.63 14.41 6.34 0.05 0.12 75.58 97.81 0.04 0.93 23 0.56 1.07 14.31 6.45 0.00 0.08 74.78 97.25 0.05 0.93 24 0.58 0.98 14.46 6.33 0.00 0.03 74.72 97.10 0.05 0.93 25 0.59 1.05 14.16 6.47 0.04 0.00 74.96 97.26 0.05 0.93 26 0.61 0.84 14.38 6.13 0.10 0.03 76.07 98.16 0.04 0.94 27 0.59 0.90 14.35 6.44 0.01 0.02 75.21 97.52 0.04 0.93 28 0.59 0.99 14.26 6.48 0.00 0.09 75.23 97.66 0.05 0.93 29 0.67 0.95 14.64 6.38 0.09 0.03 75.07 97.84 0.04 0.93 30 0.67 1.01 14.07 6.30 0.00 0.08 74.74 96.87 0.04 0.93 31 0.68 1.04 14.51 6.29 0.04 0.12 75.45 98.18 0.04 0.93 32 0.69 0.83 14.41 6.43 0.08 0.05 75.92 98.46 0.05 0.93 33 0.70 0.98 14.55 6.63 0.06 0.04 75.20 98.15 0.04 0.93 34 0.71 0.97 14.50 6.44 0.08 0.00 76.21 98.91 0.05 0.93 35 0.72 0.87 14.50 6.20 0.06 0.11 76.25 98.70 0.05 0.94 36 0.69 0.99 14.37 6.29 0.00 0.00 75.29 97.68 0.05 0.93 37 0.71 0.90 14.47 6.32 0.00 0.02 74.83 97.27 0.04 0.93 38 0.67 0.99 14.30 6.33 0.00 0.16 75.56 98.01 0.04 0.93 39 0.71 0.98 14.25 6.26 0.00 0.10 75.20 97.50 0.04 0.93 40 0.67 0.90 14.27 5.99 0.00 0.03 75.15 97.01 0.04 0.94 41 0.62 0.93 14.19 6.21 0.00 0.00 75.51 97.46 0.05 0.93 42 0.66 1.12 14.15 6.00 0.03 0.04 76.53 98.57 0.04 0.94
CT4, Côte d’Ivoire, Ferrotapiolite
43 1.02 0.56 14.78 7.05 0.15 0.03 73.47 97.05 0.04 0.92 44 0.95 0.66 14.71 7.18 0.02 0.12 74.81 98.46 0.05 0.92
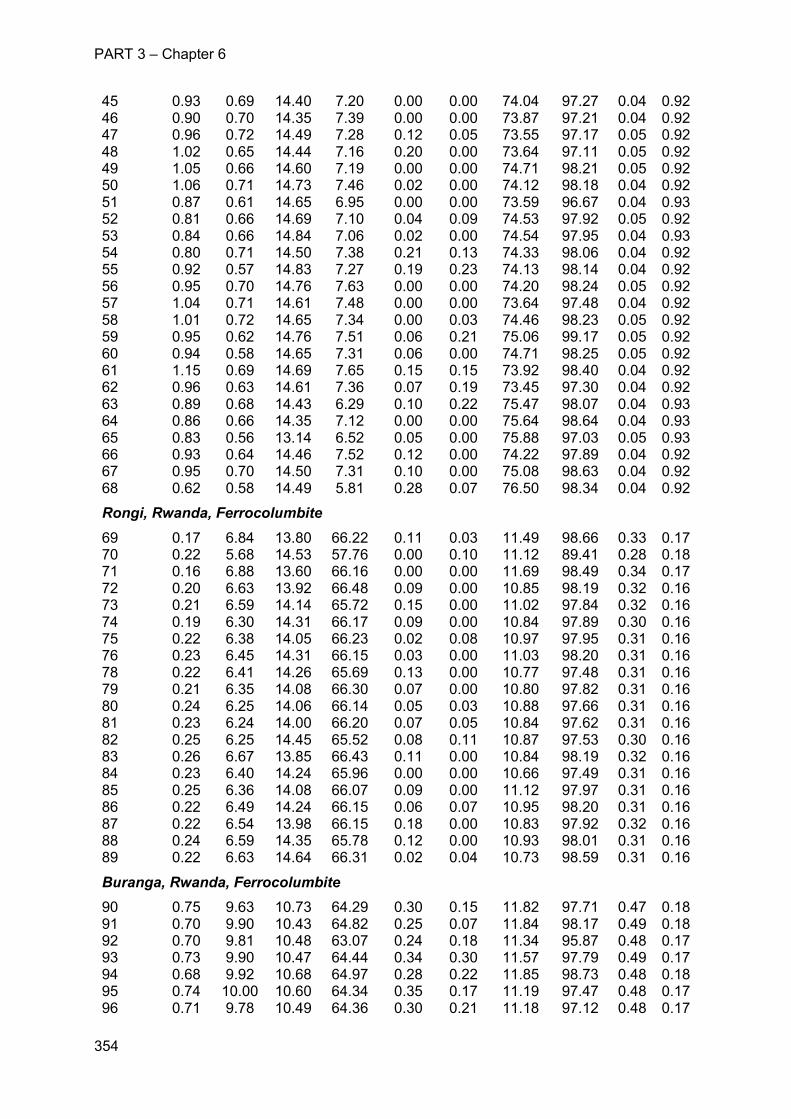
PART 3 – Chapter 6
354
45 0.93 0.69 14.40 7.20 0.00 0.00 74.04 97.27 0.04 0.92 46 0.90 0.70 14.35 7.39 0.00 0.00 73.87 97.21 0.04 0.92 47 0.96 0.72 14.49 7.28 0.12 0.05 73.55 97.17 0.05 0.92 48 1.02 0.65 14.44 7.16 0.20 0.00 73.64 97.11 0.05 0.92 49 1.05 0.66 14.60 7.19 0.00 0.00 74.71 98.21 0.05 0.92 50 1.06 0.71 14.73 7.46 0.02 0.00 74.12 98.18 0.04 0.92 51 0.87 0.61 14.65 6.95 0.00 0.00 73.59 96.67 0.04 0.93 52 0.81 0.66 14.69 7.10 0.04 0.09 74.53 97.92 0.05 0.92 53 0.84 0.66 14.84 7.06 0.02 0.00 74.54 97.95 0.04 0.93 54 0.80 0.71 14.50 7.38 0.21 0.13 74.33 98.06 0.04 0.92 55 0.92 0.57 14.83 7.27 0.19 0.23 74.13 98.14 0.04 0.92 56 0.95 0.70 14.76 7.63 0.00 0.00 74.20 98.24 0.05 0.92 57 1.04 0.71 14.61 7.48 0.00 0.00 73.64 97.48 0.04 0.92 58 1.01 0.72 14.65 7.34 0.00 0.03 74.46 98.23 0.05 0.92 59 0.95 0.62 14.76 7.51 0.06 0.21 75.06 99.17 0.05 0.92 60 0.94 0.58 14.65 7.31 0.06 0.00 74.71 98.25 0.05 0.92 61 1.15 0.69 14.69 7.65 0.15 0.15 73.92 98.40 0.04 0.92 62 0.96 0.63 14.61 7.36 0.07 0.19 73.45 97.30 0.04 0.92 63 0.89 0.68 14.43 6.29 0.10 0.22 75.47 98.07 0.04 0.93 64 0.86 0.66 14.35 7.12 0.00 0.00 75.64 98.64 0.04 0.93 65 0.83 0.56 13.14 6.52 0.05 0.00 75.88 97.03 0.05 0.93 66 0.93 0.64 14.46 7.52 0.12 0.00 74.22 97.89 0.04 0.92 67 0.95 0.70 14.50 7.31 0.10 0.00 75.08 98.63 0.04 0.92 68 0.62 0.58 14.49 5.81 0.28 0.07 76.50 98.34 0.04 0.92
Rongi, Rwanda, Ferrocolumbite
69 0.17 6.84 13.80 66.22 0.11 0.03 11.49 98.66 0.33 0.17 70 0.22 5.68 14.53 57.76 0.00 0.10 11.12 89.41 0.28 0.18 71 0.16 6.88 13.60 66.16 0.00 0.00 11.69 98.49 0.34 0.17 72 0.20 6.63 13.92 66.48 0.09 0.00 10.85 98.19 0.32 0.16 73 0.21 6.59 14.14 65.72 0.15 0.00 11.02 97.84 0.32 0.16 74 0.19 6.30 14.31 66.17 0.09 0.00 10.84 97.89 0.30 0.16 75 0.22 6.38 14.05 66.23 0.02 0.08 10.97 97.95 0.31 0.16 76 0.23 6.45 14.31 66.15 0.03 0.00 11.03 98.20 0.31 0.16 78 0.22 6.41 14.26 65.69 0.13 0.00 10.77 97.48 0.31 0.16 79 0.21 6.35 14.08 66.30 0.07 0.00 10.80 97.82 0.31 0.16 80 0.24 6.25 14.06 66.14 0.05 0.03 10.88 97.66 0.31 0.16 81 0.23 6.24 14.00 66.20 0.07 0.05 10.84 97.62 0.31 0.16 82 0.25 6.25 14.45 65.52 0.08 0.11 10.87 97.53 0.30 0.16 83 0.26 6.67 13.85 66.43 0.11 0.00 10.84 98.19 0.32 0.16 84 0.23 6.40 14.24 65.96 0.00 0.00 10.66 97.49 0.31 0.16 85 0.25 6.36 14.08 66.07 0.09 0.00 11.12 97.97 0.31 0.16 86 0.22 6.49 14.24 66.15 0.06 0.07 10.95 98.20 0.31 0.16 87 0.22 6.54 13.98 66.15 0.18 0.00 10.83 97.92 0.32 0.16 88 0.24 6.59 14.35 65.78 0.12 0.00 10.93 98.01 0.31 0.16 89 0.22 6.63 14.64 66.31 0.02 0.04 10.73 98.59 0.31 0.16
Buranga, Rwanda, Ferrocolumbite
90 0.75 9.63 10.73 64.29 0.30 0.15 11.82 97.71 0.47 0.18 91 0.70 9.90 10.43 64.82 0.25 0.07 11.84 98.17 0.49 0.18 92 0.70 9.81 10.48 63.07 0.24 0.18 11.34 95.87 0.48 0.17 93 0.73 9.90 10.47 64.44 0.34 0.30 11.57 97.79 0.49 0.17 94 0.68 9.92 10.68 64.97 0.28 0.22 11.85 98.73 0.48 0.18 95 0.74 10.00 10.60 64.34 0.35 0.17 11.19 97.47 0.48 0.17 96 0.71 9.78 10.49 64.36 0.30 0.21 11.18 97.12 0.48 0.17
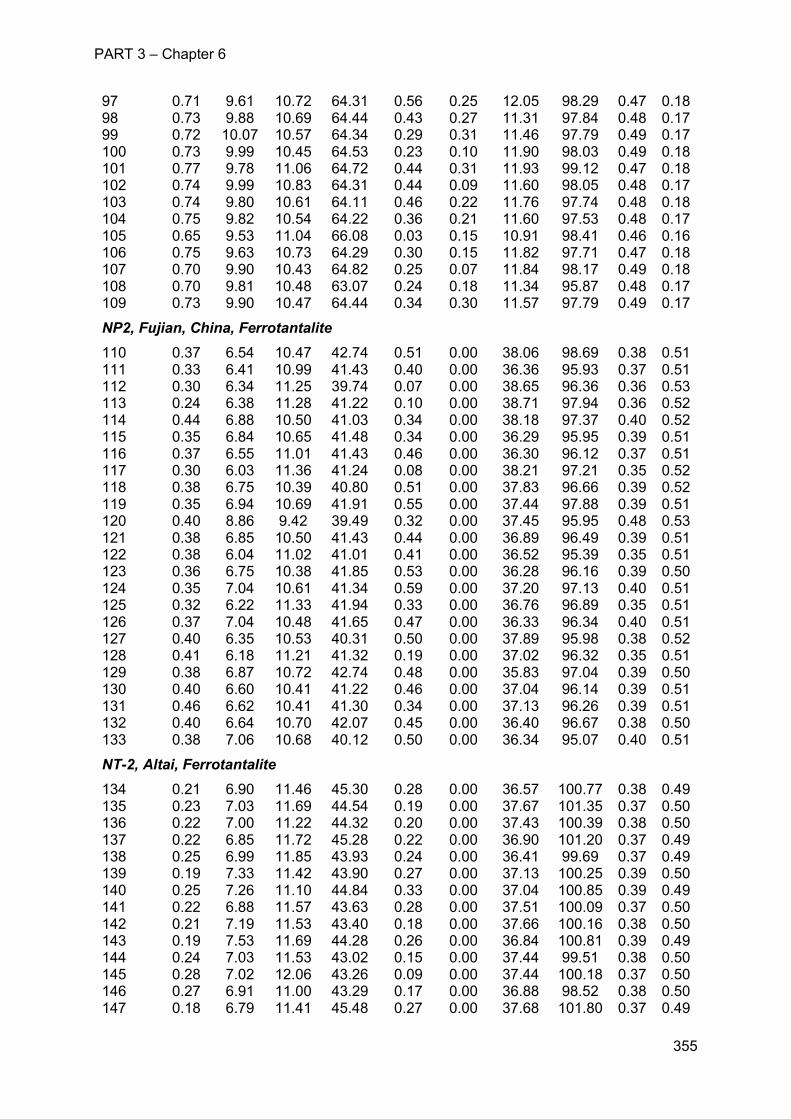
PART 3 – Chapter 6
355
97 0.71 9.61 10.72 64.31 0.56 0.25 12.05 98.29 0.47 0.18 98 0.73 9.88 10.69 64.44 0.43 0.27 11.31 97.84 0.48 0.17 99 0.72 10.07 10.57 64.34 0.29 0.31 11.46 97.79 0.49 0.17 100 0.73 9.99 10.45 64.53 0.23 0.10 11.90 98.03 0.49 0.18 101 0.77 9.78 11.06 64.72 0.44 0.31 11.93 99.12 0.47 0.18 102 0.74 9.99 10.83 64.31 0.44 0.09 11.60 98.05 0.48 0.17 103 0.74 9.80 10.61 64.11 0.46 0.22 11.76 97.74 0.48 0.18 104 0.75 9.82 10.54 64.22 0.36 0.21 11.60 97.53 0.48 0.17 105 0.65 9.53 11.04 66.08 0.03 0.15 10.91 98.41 0.46 0.16 106 0.75 9.63 10.73 64.29 0.30 0.15 11.82 97.71 0.47 0.18 107 0.70 9.90 10.43 64.82 0.25 0.07 11.84 98.17 0.49 0.18 108 0.70 9.81 10.48 63.07 0.24 0.18 11.34 95.87 0.48 0.17 109 0.73 9.90 10.47 64.44 0.34 0.30 11.57 97.79 0.49 0.17
NP2, Fujian, China, Ferrotantalite
110 0.37 6.54 10.47 42.74 0.51 0.00 38.06 98.69 0.38 0.51 111 0.33 6.41 10.99 41.43 0.40 0.00 36.36 95.93 0.37 0.51 112 0.30 6.34 11.25 39.74 0.07 0.00 38.65 96.36 0.36 0.53 113 0.24 6.38 11.28 41.22 0.10 0.00 38.71 97.94 0.36 0.52 114 0.44 6.88 10.50 41.03 0.34 0.00 38.18 97.37 0.40 0.52 115 0.35 6.84 10.65 41.48 0.34 0.00 36.29 95.95 0.39 0.51 116 0.37 6.55 11.01 41.43 0.46 0.00 36.30 96.12 0.37 0.51 117 0.30 6.03 11.36 41.24 0.08 0.00 38.21 97.21 0.35 0.52 118 0.38 6.75 10.39 40.80 0.51 0.00 37.83 96.66 0.39 0.52 119 0.35 6.94 10.69 41.91 0.55 0.00 37.44 97.88 0.39 0.51 120 0.40 8.86 9.42 39.49 0.32 0.00 37.45 95.95 0.48 0.53 121 0.38 6.85 10.50 41.43 0.44 0.00 36.89 96.49 0.39 0.51 122 0.38 6.04 11.02 41.01 0.41 0.00 36.52 95.39 0.35 0.51 123 0.36 6.75 10.38 41.85 0.53 0.00 36.28 96.16 0.39 0.50 124 0.35 7.04 10.61 41.34 0.59 0.00 37.20 97.13 0.40 0.51 125 0.32 6.22 11.33 41.94 0.33 0.00 36.76 96.89 0.35 0.51 126 0.37 7.04 10.48 41.65 0.47 0.00 36.33 96.34 0.40 0.51 127 0.40 6.35 10.53 40.31 0.50 0.00 37.89 95.98 0.38 0.52 128 0.41 6.18 11.21 41.32 0.19 0.00 37.02 96.32 0.35 0.51 129 0.38 6.87 10.72 42.74 0.48 0.00 35.83 97.04 0.39 0.50 130 0.40 6.60 10.41 41.22 0.46 0.00 37.04 96.14 0.39 0.51 131 0.46 6.62 10.41 41.30 0.34 0.00 37.13 96.26 0.39 0.51 132 0.40 6.64 10.70 42.07 0.45 0.00 36.40 96.67 0.38 0.50 133 0.38 7.06 10.68 40.12 0.50 0.00 36.34 95.07 0.40 0.51
NT-2, Altai, Ferrotantalite
134 0.21 6.90 11.46 45.30 0.28 0.00 36.57 100.77 0.38 0.49 135 0.23 7.03 11.69 44.54 0.19 0.00 37.67 101.35 0.37 0.50 136 0.22 7.00 11.22 44.32 0.20 0.00 37.43 100.39 0.38 0.50 137 0.22 6.85 11.72 45.28 0.22 0.00 36.90 101.20 0.37 0.49 138 0.25 6.99 11.85 43.93 0.24 0.00 36.41 99.69 0.37 0.49 139 0.19 7.33 11.42 43.90 0.27 0.00 37.13 100.25 0.39 0.50 140 0.25 7.26 11.10 44.84 0.33 0.00 37.04 100.85 0.39 0.49 141 0.22 6.88 11.57 43.63 0.28 0.00 37.51 100.09 0.37 0.50 142 0.21 7.19 11.53 43.40 0.18 0.00 37.66 100.16 0.38 0.50 143 0.19 7.53 11.69 44.28 0.26 0.00 36.84 100.81 0.39 0.49 144 0.24 7.03 11.53 43.02 0.15 0.00 37.44 99.51 0.38 0.50 145 0.28 7.02 12.06 43.26 0.09 0.00 37.44 100.18 0.37 0.50 146 0.27 6.91 11.00 43.29 0.17 0.00 36.88 98.52 0.38 0.50 147 0.18 6.79 11.41 45.48 0.27 0.00 37.68 101.80 0.37 0.49
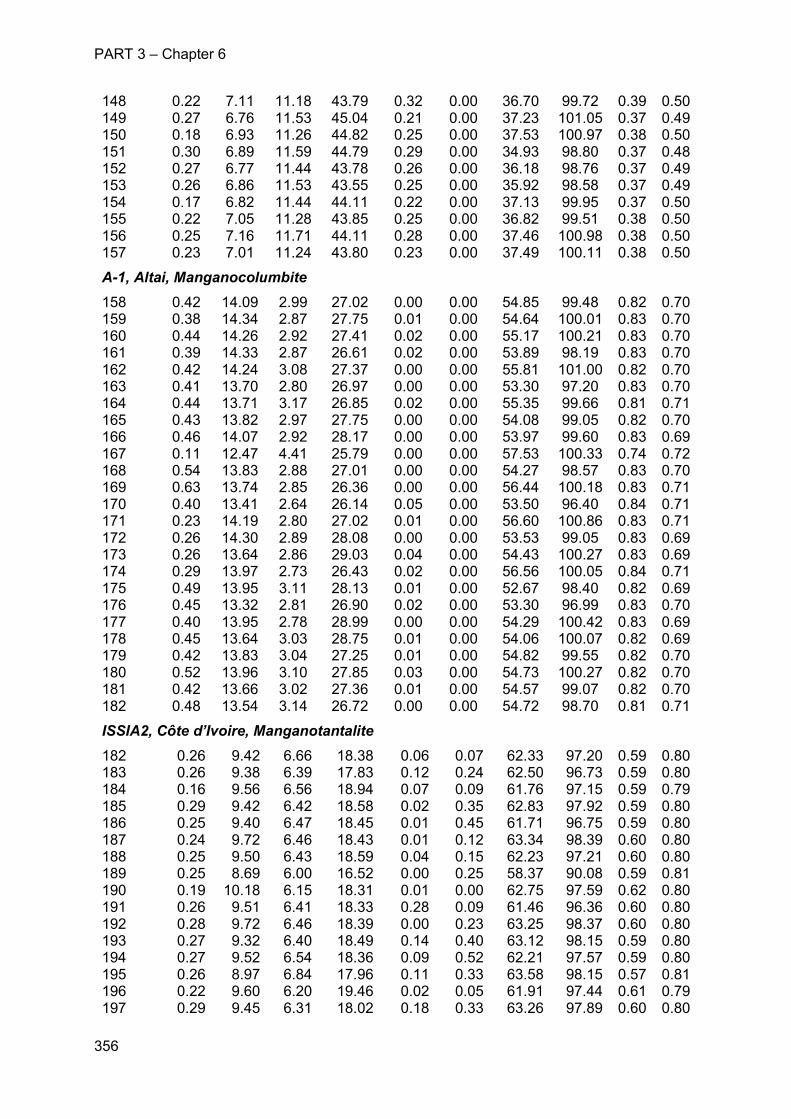
PART 3 – Chapter 6
356
148 0.22 7.11 11.18 43.79 0.32 0.00 36.70 99.72 0.39 0.50 149 0.27 6.76 11.53 45.04 0.21 0.00 37.23 101.05 0.37 0.49 150 0.18 6.93 11.26 44.82 0.25 0.00 37.53 100.97 0.38 0.50 151 0.30 6.89 11.59 44.79 0.29 0.00 34.93 98.80 0.37 0.48 152 0.27 6.77 11.44 43.78 0.26 0.00 36.18 98.76 0.37 0.49 153 0.26 6.86 11.53 43.55 0.25 0.00 35.92 98.58 0.37 0.49 154 0.17 6.82 11.44 44.11 0.22 0.00 37.13 99.95 0.37 0.50 155 0.22 7.05 11.28 43.85 0.25 0.00 36.82 99.51 0.38 0.50 156 0.25 7.16 11.71 44.11 0.28 0.00 37.46 100.98 0.38 0.50 157 0.23 7.01 11.24 43.80 0.23 0.00 37.49 100.11 0.38 0.50
A-1, Altai, Manganocolumbite
158 0.42 14.09 2.99 27.02 0.00 0.00 54.85 99.48 0.82 0.70 159 0.38 14.34 2.87 27.75 0.01 0.00 54.64 100.01 0.83 0.70 160 0.44 14.26 2.92 27.41 0.02 0.00 55.17 100.21 0.83 0.70 161 0.39 14.33 2.87 26.61 0.02 0.00 53.89 98.19 0.83 0.70 162 0.42 14.24 3.08 27.37 0.00 0.00 55.81 101.00 0.82 0.70 163 0.41 13.70 2.80 26.97 0.00 0.00 53.30 97.20 0.83 0.70 164 0.44 13.71 3.17 26.85 0.02 0.00 55.35 99.66 0.81 0.71 165 0.43 13.82 2.97 27.75 0.00 0.00 54.08 99.05 0.82 0.70 166 0.46 14.07 2.92 28.17 0.00 0.00 53.97 99.60 0.83 0.69 167 0.11 12.47 4.41 25.79 0.00 0.00 57.53 100.33 0.74 0.72 168 0.54 13.83 2.88 27.01 0.00 0.00 54.27 98.57 0.83 0.70 169 0.63 13.74 2.85 26.36 0.00 0.00 56.44 100.18 0.83 0.71 170 0.40 13.41 2.64 26.14 0.05 0.00 53.50 96.40 0.84 0.71 171 0.23 14.19 2.80 27.02 0.01 0.00 56.60 100.86 0.83 0.71 172 0.26 14.30 2.89 28.08 0.00 0.00 53.53 99.05 0.83 0.69 173 0.26 13.64 2.86 29.03 0.04 0.00 54.43 100.27 0.83 0.69 174 0.29 13.97 2.73 26.43 0.02 0.00 56.56 100.05 0.84 0.71 175 0.49 13.95 3.11 28.13 0.01 0.00 52.67 98.40 0.82 0.69 176 0.45 13.32 2.81 26.90 0.02 0.00 53.30 96.99 0.83 0.70 177 0.40 13.95 2.78 28.99 0.00 0.00 54.29 100.42 0.83 0.69 178 0.45 13.64 3.03 28.75 0.01 0.00 54.06 100.07 0.82 0.69 179 0.42 13.83 3.04 27.25 0.01 0.00 54.82 99.55 0.82 0.70 180 0.52 13.96 3.10 27.85 0.03 0.00 54.73 100.27 0.82 0.70 181 0.42 13.66 3.02 27.36 0.01 0.00 54.57 99.07 0.82 0.70 182 0.48 13.54 3.14 26.72 0.00 0.00 54.72 98.70 0.81 0.71
ISSIA2, Côte d’Ivoire, Manganotantalite
182 0.26 9.42 6.66 18.38 0.06 0.07 62.33 97.20 0.59 0.80 183 0.26 9.38 6.39 17.83 0.12 0.24 62.50 96.73 0.59 0.80 184 0.16 9.56 6.56 18.94 0.07 0.09 61.76 97.15 0.59 0.79 185 0.29 9.42 6.42 18.58 0.02 0.35 62.83 97.92 0.59 0.80 186 0.25 9.40 6.47 18.45 0.01 0.45 61.71 96.75 0.59 0.80 187 0.24 9.72 6.46 18.43 0.01 0.12 63.34 98.39 0.60 0.80 188 0.25 9.50 6.43 18.59 0.04 0.15 62.23 97.21 0.60 0.80 189 0.25 8.69 6.00 16.52 0.00 0.25 58.37 90.08 0.59 0.81 190 0.19 10.18 6.15 18.31 0.01 0.00 62.75 97.59 0.62 0.80 191 0.26 9.51 6.41 18.33 0.28 0.09 61.46 96.36 0.60 0.80 192 0.28 9.72 6.46 18.39 0.00 0.23 63.25 98.37 0.60 0.80 193 0.27 9.32 6.40 18.49 0.14 0.40 63.12 98.15 0.59 0.80 194 0.27 9.52 6.54 18.36 0.09 0.52 62.21 97.57 0.59 0.80 195 0.26 8.97 6.84 17.96 0.11 0.33 63.58 98.15 0.57 0.81 196 0.22 9.60 6.20 19.46 0.02 0.05 61.91 97.44 0.61 0.79 197 0.29 9.45 6.31 18.02 0.18 0.33 63.26 97.89 0.60 0.80
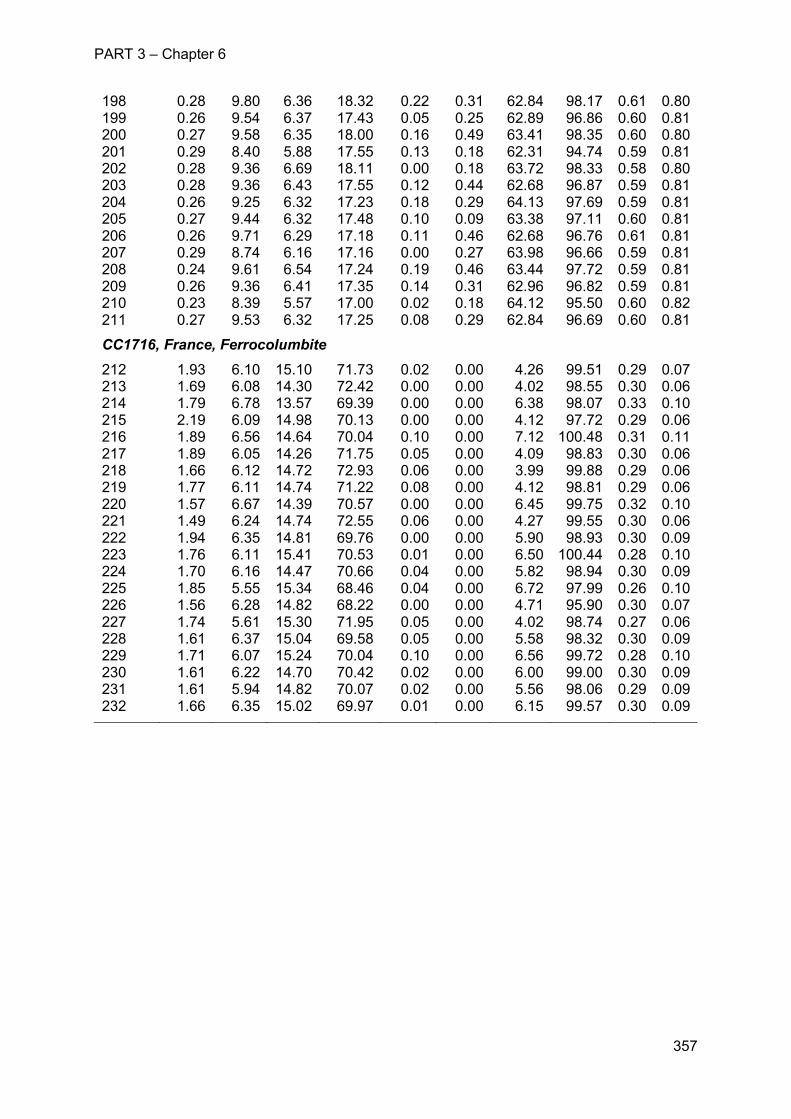
PART 3 – Chapter 6
357
198 0.28 9.80 6.36 18.32 0.22 0.31 62.84 98.17 0.61 0.80 199 0.26 9.54 6.37 17.43 0.05 0.25 62.89 96.86 0.60 0.81 200 0.27 9.58 6.35 18.00 0.16 0.49 63.41 98.35 0.60 0.80 201 0.29 8.40 5.88 17.55 0.13 0.18 62.31 94.74 0.59 0.81 202 0.28 9.36 6.69 18.11 0.00 0.18 63.72 98.33 0.58 0.80 203 0.28 9.36 6.43 17.55 0.12 0.44 62.68 96.87 0.59 0.81 204 0.26 9.25 6.32 17.23 0.18 0.29 64.13 97.69 0.59 0.81 205 0.27 9.44 6.32 17.48 0.10 0.09 63.38 97.11 0.60 0.81 206 0.26 9.71 6.29 17.18 0.11 0.46 62.68 96.76 0.61 0.81 207 0.29 8.74 6.16 17.16 0.00 0.27 63.98 96.66 0.59 0.81 208 0.24 9.61 6.54 17.24 0.19 0.46 63.44 97.72 0.59 0.81 209 0.26 9.36 6.41 17.35 0.14 0.31 62.96 96.82 0.59 0.81 210 0.23 8.39 5.57 17.00 0.02 0.18 64.12 95.50 0.60 0.82 211 0.27 9.53 6.32 17.25 0.08 0.29 62.84 96.69 0.60 0.81
CC1716, France, Ferrocolumbite
212 1.93 6.10 15.10 71.73 0.02 0.00 4.26 99.51 0.29 0.07 213 1.69 6.08 14.30 72.42 0.00 0.00 4.02 98.55 0.30 0.06 214 1.79 6.78 13.57 69.39 0.00 0.00 6.38 98.07 0.33 0.10 215 2.19 6.09 14.98 70.13 0.00 0.00 4.12 97.72 0.29 0.06 216 1.89 6.56 14.64 70.04 0.10 0.00 7.12 100.48 0.31 0.11 217 1.89 6.05 14.26 71.75 0.05 0.00 4.09 98.83 0.30 0.06 218 1.66 6.12 14.72 72.93 0.06 0.00 3.99 99.88 0.29 0.06 219 1.77 6.11 14.74 71.22 0.08 0.00 4.12 98.81 0.29 0.06 220 1.57 6.67 14.39 70.57 0.00 0.00 6.45 99.75 0.32 0.10 221 1.49 6.24 14.74 72.55 0.06 0.00 4.27 99.55 0.30 0.06 222 1.94 6.35 14.81 69.76 0.00 0.00 5.90 98.93 0.30 0.09 223 1.76 6.11 15.41 70.53 0.01 0.00 6.50 100.44 0.28 0.10 224 1.70 6.16 14.47 70.66 0.04 0.00 5.82 98.94 0.30 0.09 225 1.85 5.55 15.34 68.46 0.04 0.00 6.72 97.99 0.26 0.10 226 1.56 6.28 14.82 68.22 0.00 0.00 4.71 95.90 0.30 0.07 227 1.74 5.61 15.30 71.95 0.05 0.00 4.02 98.74 0.27 0.06 228 1.61 6.37 15.04 69.58 0.05 0.00 5.58 98.32 0.30 0.09 229 1.71 6.07 15.24 70.04 0.10 0.00 6.56 99.72 0.28 0.10 230 1.61 6.22 14.70 70.42 0.02 0.00 6.00 99.00 0.30 0.09 231 1.61 5.94 14.82 70.07 0.02 0.00 5.56 98.06 0.29 0.09 232 1.66 6.35 15.02 69.97 0.01 0.00 6.15 99.57 0.30 0.09

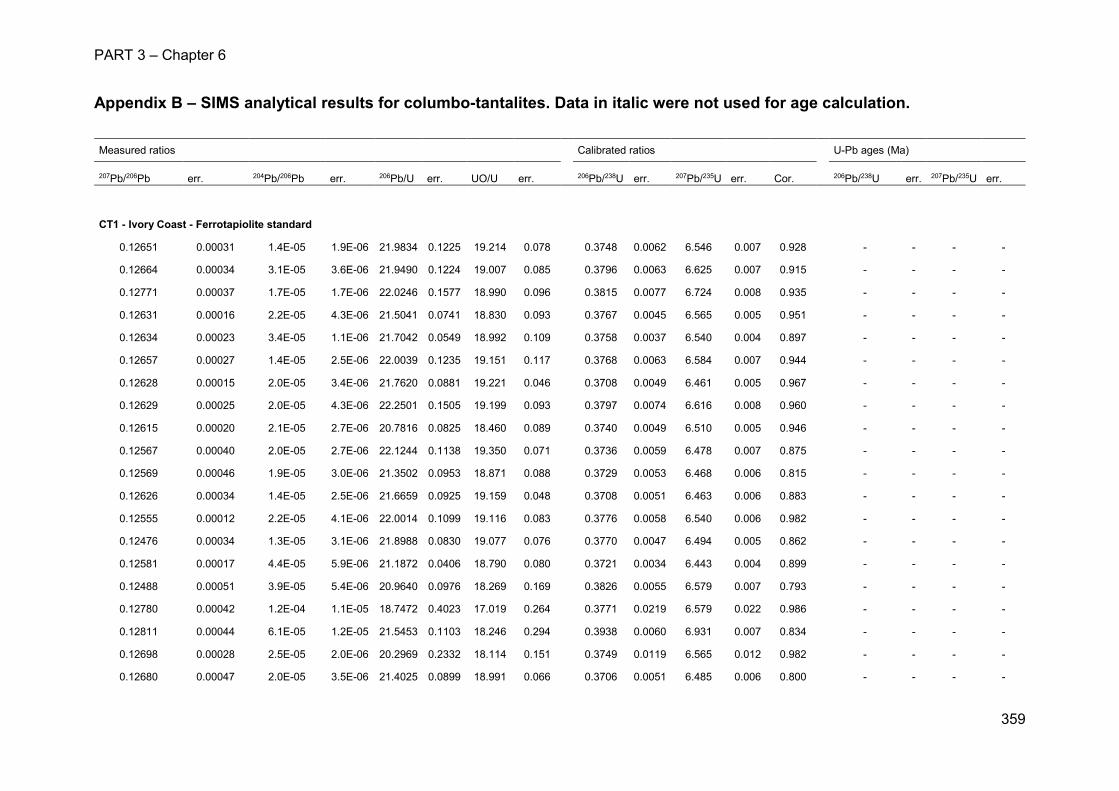
PART 3 – Chapter 6
359
Appendix B – SIMS analytical results for columbo-tantalites. Data in italic were not used for age calculation.
Measured ratios Calibrated ratios U-Pb ages (Ma)
207Pb/206Pb err. 204Pb/206Pb err. 206Pb/U err. UO/U err. 206Pb/238U err. 207Pb/235U err. Cor. 206Pb/238U err. 207Pb/235U err.
CT1 - Ivory Coast - Ferrotapiolite standard
0.12651 0.00031 1.4E-05 1.9E-06 21.9834 0.1225 19.214 0.078 0.3748 0.0062 6.546 0.007 0.928 - - - -
0.12664 0.00034 3.1E-05 3.6E-06 21.9490 0.1224 19.007 0.085 0.3796 0.0063 6.625 0.007 0.915 - - - -
0.12771 0.00037 1.7E-05 1.7E-06 22.0246 0.1577 18.990 0.096 0.3815 0.0077 6.724 0.008 0.935 - - - -
0.12631 0.00016 2.2E-05 4.3E-06 21.5041 0.0741 18.830 0.093 0.3767 0.0045 6.565 0.005 0.951 - - - -
0.12634 0.00023 3.4E-05 1.1E-06 21.7042 0.0549 18.992 0.109 0.3758 0.0037 6.540 0.004 0.897 - - - -
0.12657 0.00027 1.4E-05 2.5E-06 22.0039 0.1235 19.151 0.117 0.3768 0.0063 6.584 0.007 0.944 - - - -
0.12628 0.00015 2.0E-05 3.4E-06 21.7620 0.0881 19.221 0.046 0.3708 0.0049 6.461 0.005 0.967 - - - -
0.12629 0.00025 2.0E-05 4.3E-06 22.2501 0.1505 19.199 0.093 0.3797 0.0074 6.616 0.008 0.960 - - - -
0.12615 0.00020 2.1E-05 2.7E-06 20.7816 0.0825 18.460 0.089 0.3740 0.0049 6.510 0.005 0.946 - - - -
0.12567 0.00040 2.0E-05 2.7E-06 22.1244 0.1138 19.350 0.071 0.3736 0.0059 6.478 0.007 0.875 - - - -
0.12569 0.00046 1.9E-05 3.0E-06 21.3502 0.0953 18.871 0.088 0.3729 0.0053 6.468 0.006 0.815 - - - -
0.12626 0.00034 1.4E-05 2.5E-06 21.6659 0.0925 19.159 0.048 0.3708 0.0051 6.463 0.006 0.883 - - - -
0.12555 0.00012 2.2E-05 4.1E-06 22.0014 0.1099 19.116 0.083 0.3776 0.0058 6.540 0.006 0.982 - - - -
0.12476 0.00034 1.3E-05 3.1E-06 21.8988 0.0830 19.077 0.076 0.3770 0.0047 6.494 0.005 0.862 - - - -
0.12581 0.00017 4.4E-05 5.9E-06 21.1872 0.0406 18.790 0.080 0.3721 0.0034 6.443 0.004 0.899 - - - -
0.12488 0.00051 3.9E-05 5.4E-06 20.9640 0.0976 18.269 0.169 0.3826 0.0055 6.579 0.007 0.793 - - - -
0.12780 0.00042 1.2E-04 1.1E-05 18.7472 0.4023 17.019 0.264 0.3771 0.0219 6.579 0.022 0.986 - - - -
0.12811 0.00044 6.1E-05 1.2E-05 21.5453 0.1103 18.246 0.294 0.3938 0.0060 6.931 0.007 0.834 - - - -
0.12698 0.00028 2.5E-05 2.0E-06 20.2969 0.2332 18.114 0.151 0.3749 0.0119 6.565 0.012 0.982 - - - -
0.12680 0.00047 2.0E-05 3.5E-06 21.4025 0.0899 18.991 0.066 0.3706 0.0051 6.485 0.006 0.800 - - - -
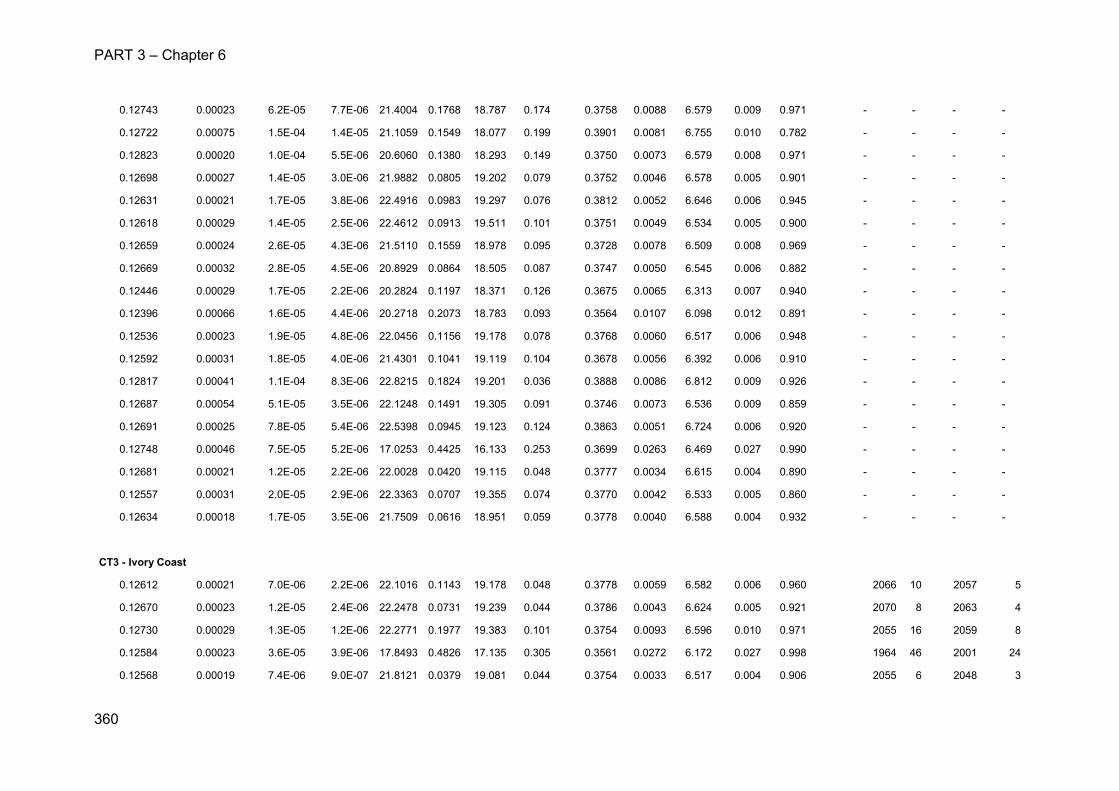
PART 3 – Chapter 6
360
0.12743 0.00023 6.2E-05 7.7E-06 21.4004 0.1768 18.787 0.174 0.3758 0.0088 6.579 0.009 0.971 - - - -
0.12722 0.00075 1.5E-04 1.4E-05 21.1059 0.1549 18.077 0.199 0.3901 0.0081 6.755 0.010 0.782 - - - -
0.12823 0.00020 1.0E-04 5.5E-06 20.6060 0.1380 18.293 0.149 0.3750 0.0073 6.579 0.008 0.971 - - - -
0.12698 0.00027 1.4E-05 3.0E-06 21.9882 0.0805 19.202 0.079 0.3752 0.0046 6.578 0.005 0.901 - - - -
0.12631 0.00021 1.7E-05 3.8E-06 22.4916 0.0983 19.297 0.076 0.3812 0.0052 6.646 0.006 0.945 - - - -
0.12618 0.00029 1.4E-05 2.5E-06 22.4612 0.0913 19.511 0.101 0.3751 0.0049 6.534 0.005 0.900 - - - -
0.12659 0.00024 2.6E-05 4.3E-06 21.5110 0.1559 18.978 0.095 0.3728 0.0078 6.509 0.008 0.969 - - - -
0.12669 0.00032 2.8E-05 4.5E-06 20.8929 0.0864 18.505 0.087 0.3747 0.0050 6.545 0.006 0.882 - - - -
0.12446 0.00029 1.7E-05 2.2E-06 20.2824 0.1197 18.371 0.126 0.3675 0.0065 6.313 0.007 0.940 - - - -
0.12396 0.00066 1.6E-05 4.4E-06 20.2718 0.2073 18.783 0.093 0.3564 0.0107 6.098 0.012 0.891 - - - -
0.12536 0.00023 1.9E-05 4.8E-06 22.0456 0.1156 19.178 0.078 0.3768 0.0060 6.517 0.006 0.948 - - - -
0.12592 0.00031 1.8E-05 4.0E-06 21.4301 0.1041 19.119 0.104 0.3678 0.0056 6.392 0.006 0.910 - - - -
0.12817 0.00041 1.1E-04 8.3E-06 22.8215 0.1824 19.201 0.036 0.3888 0.0086 6.812 0.009 0.926 - - - -
0.12687 0.00054 5.1E-05 3.5E-06 22.1248 0.1491 19.305 0.091 0.3746 0.0073 6.536 0.009 0.859 - - - -
0.12691 0.00025 7.8E-05 5.4E-06 22.5398 0.0945 19.123 0.124 0.3863 0.0051 6.724 0.006 0.920 - - - -
0.12748 0.00046 7.5E-05 5.2E-06 17.0253 0.4425 16.133 0.253 0.3699 0.0263 6.469 0.027 0.990 - - - -
0.12681 0.00021 1.2E-05 2.2E-06 22.0028 0.0420 19.115 0.048 0.3777 0.0034 6.615 0.004 0.890 - - - -
0.12557 0.00031 2.0E-05 2.9E-06 22.3363 0.0707 19.355 0.074 0.3770 0.0042 6.533 0.005 0.860 - - - -
0.12634 0.00018 1.7E-05 3.5E-06 21.7509 0.0616 18.951 0.059 0.3778 0.0040 6.588 0.004 0.932 - - - -
CT3 - Ivory Coast
0.12612 0.00021 7.0E-06 2.2E-06 22.1016 0.1143 19.178 0.048 0.3778 0.0059 6.582 0.006 0.960 2066 10 2057 5
0.12670 0.00023 1.2E-05 2.4E-06 22.2478 0.0731 19.239 0.044 0.3786 0.0043 6.624 0.005 0.921 2070 8 2063 4
0.12730 0.00029 1.3E-05 1.2E-06 22.2771 0.1977 19.383 0.101 0.3754 0.0093 6.596 0.010 0.971 2055 16 2059 8
0.12584 0.00023 3.6E-05 3.9E-06 17.8493 0.4826 17.135 0.305 0.3561 0.0272 6.172 0.027 0.998 1964 46 2001 24
0.12568 0.00019 7.4E-06 9.0E-07 21.8121 0.0379 19.081 0.044 0.3754 0.0033 6.517 0.004 0.906 2055 6 2048 3

PART 3 – Chapter 6
361
0.12624 0.00013 6.3E-06 1.3E-06 21.9119 0.0964 18.983 0.080 0.3798 0.0052 6.624 0.005 0.981 2075 9 2062 5
0.12598 0.00021 9.4E-06 2.3E-06 21.6332 0.0370 18.959 0.067 0.3756 0.0033 6.535 0.004 0.889 2055 6 2051 3
0.12625 0.00011 9.9E-06 1.6E-06 21.8099 0.1157 19.115 0.070 0.3745 0.0060 6.529 0.006 0.989 2050 11 2050 5
0.12583 0.00018 1.7E-05 2.8E-06 21.8584 0.0720 19.067 0.041 0.3765 0.0043 6.538 0.005 0.949 2060 8 2051 4
0.12637 0.00020 6.4E-06 1.5E-06 15.2913 0.3649 15.045 0.199 0.3685 0.0240 6.433 0.024 0.998 2022 42 2037 21
0.12740 0.00023 1.1E-05 2.1E-06 22.4424 0.0807 19.181 0.053 0.3835 0.0046 6.747 0.005 0.929 2093 8 2079 4
0.12678 0.00013 6.9E-06 1.7E-06 22.6794 0.1098 19.466 0.058 0.3800 0.0056 6.655 0.006 0.984 2076 10 2067 5
0.12702 0.00021 7.7E-06 2.1E-06 22.6683 0.0701 19.375 0.034 0.3822 0.0042 6.706 0.004 0.927 2086 7 2073 4
0.12730 0.00012 1.2E-05 1.8E-06 22.4396 0.1349 19.315 0.082 0.3799 0.0066 6.677 0.007 0.990 2076 12 2070 6
0.12666 0.00049 5.1E-06 7.0E-07 21.6311 0.2100 18.735 0.157 0.3817 0.0101 6.680 0.011 0.935 2084 18 2070 10
0.12368 0.00035 2.0E-05 2.8E-06 19.7558 0.1547 19.061 0.078 0.3404 0.0083 5.809 0.009 0.948 1889 14 1948 8
0.12751 0.00036 1.3E-05 1.7E-06 22.8978 0.1628 19.271 0.077 0.3888 0.0076 6.846 0.008 0.938 2117 14 2092 7
0.12699 0.00027 4.6E-06 1.7E-06 22.2191 0.0905 19.098 0.062 0.3820 0.0049 6.703 0.005 0.919 2085 9 2073 5
0.12674 0.00026 1.2E-05 2.1E-06 23.1580 0.1960 19.602 0.103 0.3844 0.0089 6.727 0.009 0.974 2097 16 2076 8
0.12625 0.00018 1.0E-05 2.0E-06 23.9915 0.1760 20.142 0.073 0.3841 0.0079 6.697 0.008 0.984 2095 14 2072 7
0.12698 0.00018 8.9E-06 1.5E-06 21.7602 0.0861 18.992 0.035 0.3769 0.0048 6.610 0.005 0.962 2062 9 2061 4
0.12669 0.00044 8.4E-06 2.1E-06 20.1090 0.1192 18.090 0.060 0.3722 0.0066 6.513 0.007 0.882 2040 11 2048 7
0.12712 0.00048 1.0E-05 2.1E-06 21.7446 0.1379 19.102 0.046 0.3737 0.0069 6.560 0.008 0.879 2047 12 2054 7
0.12663 0.00025 7.5E-06 1.7E-06 21.6901 0.0771 18.930 0.064 0.3773 0.0045 6.601 0.005 0.916 2064 8 2059 4
0.12679 0.00017 1.1E-05 1.9E-06 21.9707 0.0910 19.087 0.135 0.3779 0.0050 6.618 0.005 0.967 2067 9 2062 5
0.12623 0.00032 1.9E-05 2.1E-06 21.2331 0.1876 18.816 0.089 0.3723 0.0093 6.485 0.010 0.964 2040 16 2044 8
0.12674 0.00033 2.1E-05 3.2E-06 20.5110 0.1487 18.405 0.144 0.3707 0.0078 6.481 0.008 0.948 2033 14 2043 7
0.12683 0.00011 5.9E-06 1.2E-06 21.5918 0.0497 18.994 0.060 0.3739 0.0036 6.553 0.004 0.971 2048 6 2053 3
0.12697 0.00039 1.5E-05 2.2E-06 21.7179 0.0986 19.098 0.075 0.3733 0.0053 6.543 0.006 0.867 2045 9 2052 5
0.12623 0.00056 7.9E-06 2.1E-06 22.1547 0.1174 19.201 0.087 0.3781 0.0060 6.593 0.007 0.804 2067 11 2058 7
0.12762 0.00033 8.9E-06 1.7E-06 22.2458 0.1575 19.451 0.088 0.3731 0.0076 6.577 0.008 0.946 2044 13 2056 7
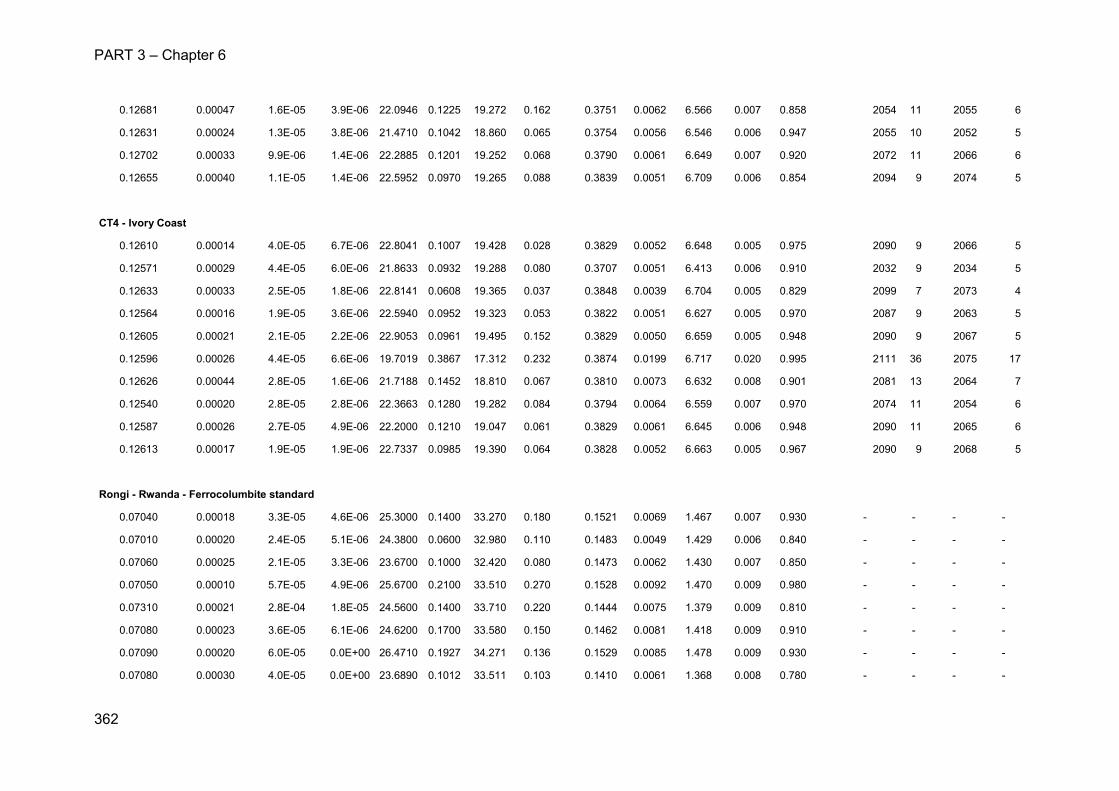
PART 3 – Chapter 6
362
0.12681 0.00047 1.6E-05 3.9E-06 22.0946 0.1225 19.272 0.162 0.3751 0.0062 6.566 0.007 0.858 2054 11 2055 6
0.12631 0.00024 1.3E-05 3.8E-06 21.4710 0.1042 18.860 0.065 0.3754 0.0056 6.546 0.006 0.947 2055 10 2052 5
0.12702 0.00033 9.9E-06 1.4E-06 22.2885 0.1201 19.252 0.068 0.3790 0.0061 6.649 0.007 0.920 2072 11 2066 6
0.12655 0.00040 1.1E-05 1.4E-06 22.5952 0.0970 19.265 0.088 0.3839 0.0051 6.709 0.006 0.854 2094 9 2074 5
CT4 - Ivory Coast
0.12610 0.00014 4.0E-05 6.7E-06 22.8041 0.1007 19.428 0.028 0.3829 0.0052 6.648 0.005 0.975 2090 9 2066 5
0.12571 0.00029 4.4E-05 6.0E-06 21.8633 0.0932 19.288 0.080 0.3707 0.0051 6.413 0.006 0.910 2032 9 2034 5
0.12633 0.00033 2.5E-05 1.8E-06 22.8141 0.0608 19.365 0.037 0.3848 0.0039 6.704 0.005 0.829 2099 7 2073 4
0.12564 0.00016 1.9E-05 3.6E-06 22.5940 0.0952 19.323 0.053 0.3822 0.0051 6.627 0.005 0.970 2087 9 2063 5
0.12605 0.00021 2.1E-05 2.2E-06 22.9053 0.0961 19.495 0.152 0.3829 0.0050 6.659 0.005 0.948 2090 9 2067 5
0.12596 0.00026 4.4E-05 6.6E-06 19.7019 0.3867 17.312 0.232 0.3874 0.0199 6.717 0.020 0.995 2111 36 2075 17
0.12626 0.00044 2.8E-05 1.6E-06 21.7188 0.1452 18.810 0.067 0.3810 0.0073 6.632 0.008 0.901 2081 13 2064 7
0.12540 0.00020 2.8E-05 2.8E-06 22.3663 0.1280 19.282 0.084 0.3794 0.0064 6.559 0.007 0.970 2074 11 2054 6
0.12587 0.00026 2.7E-05 4.9E-06 22.2000 0.1210 19.047 0.061 0.3829 0.0061 6.645 0.006 0.948 2090 11 2065 6
0.12613 0.00017 1.9E-05 1.9E-06 22.7337 0.0985 19.390 0.064 0.3828 0.0052 6.663 0.005 0.967 2090 9 2068 5
Rongi - Rwanda - Ferrocolumbite standard
0.07040 0.00018 3.3E-05 4.6E-06 25.3000 0.1400 33.270 0.180 0.1521 0.0069 1.467 0.007 0.930 - - - -
0.07010 0.00020 2.4E-05 5.1E-06 24.3800 0.0600 32.980 0.110 0.1483 0.0049 1.429 0.006 0.840 - - - -
0.07060 0.00025 2.1E-05 3.3E-06 23.6700 0.1000 32.420 0.080 0.1473 0.0062 1.430 0.007 0.850 - - - -
0.07050 0.00010 5.7E-05 4.9E-06 25.6700 0.2100 33.510 0.270 0.1528 0.0092 1.470 0.009 0.980 - - - -
0.07310 0.00021 2.8E-04 1.8E-05 24.5600 0.1400 33.710 0.220 0.1444 0.0075 1.379 0.009 0.810 - - - -
0.07080 0.00023 3.6E-05 6.1E-06 24.6200 0.1700 33.580 0.150 0.1462 0.0081 1.418 0.009 0.910 - - - -
0.07090 0.00020 6.0E-05 0.0E+00 26.4710 0.1927 34.271 0.136 0.1529 0.0085 1.478 0.009 0.930 - - - -
0.07080 0.00030 4.0E-05 0.0E+00 23.6890 0.1012 33.511 0.103 0.1410 0.0061 1.368 0.008 0.780 - - - -
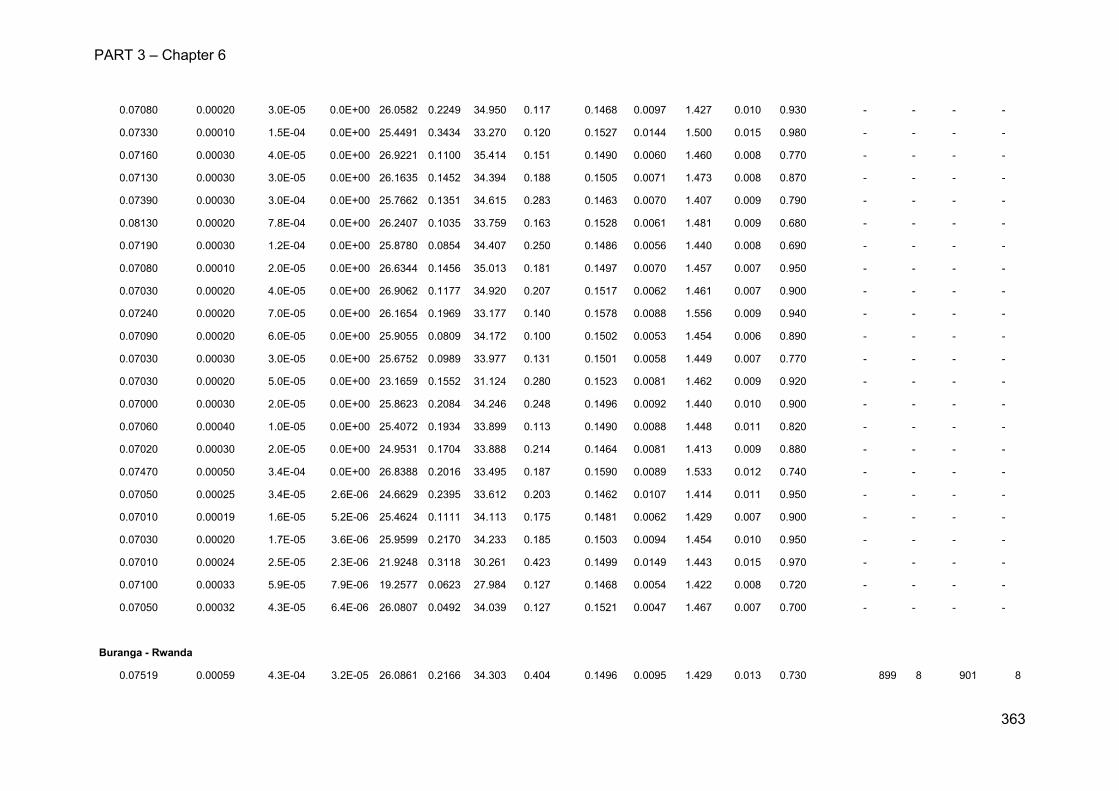
PART 3 – Chapter 6
363
0.07080 0.00020 3.0E-05 0.0E+00 26.0582 0.2249 34.950 0.117 0.1468 0.0097 1.427 0.010 0.930 - - - -
0.07330 0.00010 1.5E-04 0.0E+00 25.4491 0.3434 33.270 0.120 0.1527 0.0144 1.500 0.015 0.980 - - - -
0.07160 0.00030 4.0E-05 0.0E+00 26.9221 0.1100 35.414 0.151 0.1490 0.0060 1.460 0.008 0.770 - - - -
0.07130 0.00030 3.0E-05 0.0E+00 26.1635 0.1452 34.394 0.188 0.1505 0.0071 1.473 0.008 0.870 - - - -
0.07390 0.00030 3.0E-04 0.0E+00 25.7662 0.1351 34.615 0.283 0.1463 0.0070 1.407 0.009 0.790 - - - -
0.08130 0.00020 7.8E-04 0.0E+00 26.2407 0.1035 33.759 0.163 0.1528 0.0061 1.481 0.009 0.680 - - - -
0.07190 0.00030 1.2E-04 0.0E+00 25.8780 0.0854 34.407 0.250 0.1486 0.0056 1.440 0.008 0.690 - - - -
0.07080 0.00010 2.0E-05 0.0E+00 26.6344 0.1456 35.013 0.181 0.1497 0.0070 1.457 0.007 0.950 - - - -
0.07030 0.00020 4.0E-05 0.0E+00 26.9062 0.1177 34.920 0.207 0.1517 0.0062 1.461 0.007 0.900 - - - -
0.07240 0.00020 7.0E-05 0.0E+00 26.1654 0.1969 33.177 0.140 0.1578 0.0088 1.556 0.009 0.940 - - - -
0.07090 0.00020 6.0E-05 0.0E+00 25.9055 0.0809 34.172 0.100 0.1502 0.0053 1.454 0.006 0.890 - - - -
0.07030 0.00030 3.0E-05 0.0E+00 25.6752 0.0989 33.977 0.131 0.1501 0.0058 1.449 0.007 0.770 - - - -
0.07030 0.00020 5.0E-05 0.0E+00 23.1659 0.1552 31.124 0.280 0.1523 0.0081 1.462 0.009 0.920 - - - -
0.07000 0.00030 2.0E-05 0.0E+00 25.8623 0.2084 34.246 0.248 0.1496 0.0092 1.440 0.010 0.900 - - - -
0.07060 0.00040 1.0E-05 0.0E+00 25.4072 0.1934 33.899 0.113 0.1490 0.0088 1.448 0.011 0.820 - - - -
0.07020 0.00030 2.0E-05 0.0E+00 24.9531 0.1704 33.888 0.214 0.1464 0.0081 1.413 0.009 0.880 - - - -
0.07470 0.00050 3.4E-04 0.0E+00 26.8388 0.2016 33.495 0.187 0.1590 0.0089 1.533 0.012 0.740 - - - -
0.07050 0.00025 3.4E-05 2.6E-06 24.6629 0.2395 33.612 0.203 0.1462 0.0107 1.414 0.011 0.950 - - - -
0.07010 0.00019 1.6E-05 5.2E-06 25.4624 0.1111 34.113 0.175 0.1481 0.0062 1.429 0.007 0.900 - - - -
0.07030 0.00020 1.7E-05 3.6E-06 25.9599 0.2170 34.233 0.185 0.1503 0.0094 1.454 0.010 0.950 - - - -
0.07010 0.00024 2.5E-05 2.3E-06 21.9248 0.3118 30.261 0.423 0.1499 0.0149 1.443 0.015 0.970 - - - -
0.07100 0.00033 5.9E-05 7.9E-06 19.2577 0.0623 27.984 0.127 0.1468 0.0054 1.422 0.008 0.720 - - - -
0.07050 0.00032 4.3E-05 6.4E-06 26.0807 0.0492 34.039 0.127 0.1521 0.0047 1.467 0.007 0.700 - - - -
Buranga - Rwanda
0.07519 0.00059 4.3E-04 3.2E-05 26.0861 0.2166 34.303 0.404 0.1496 0.0095 1.429 0.013 0.730 899 8 901 8
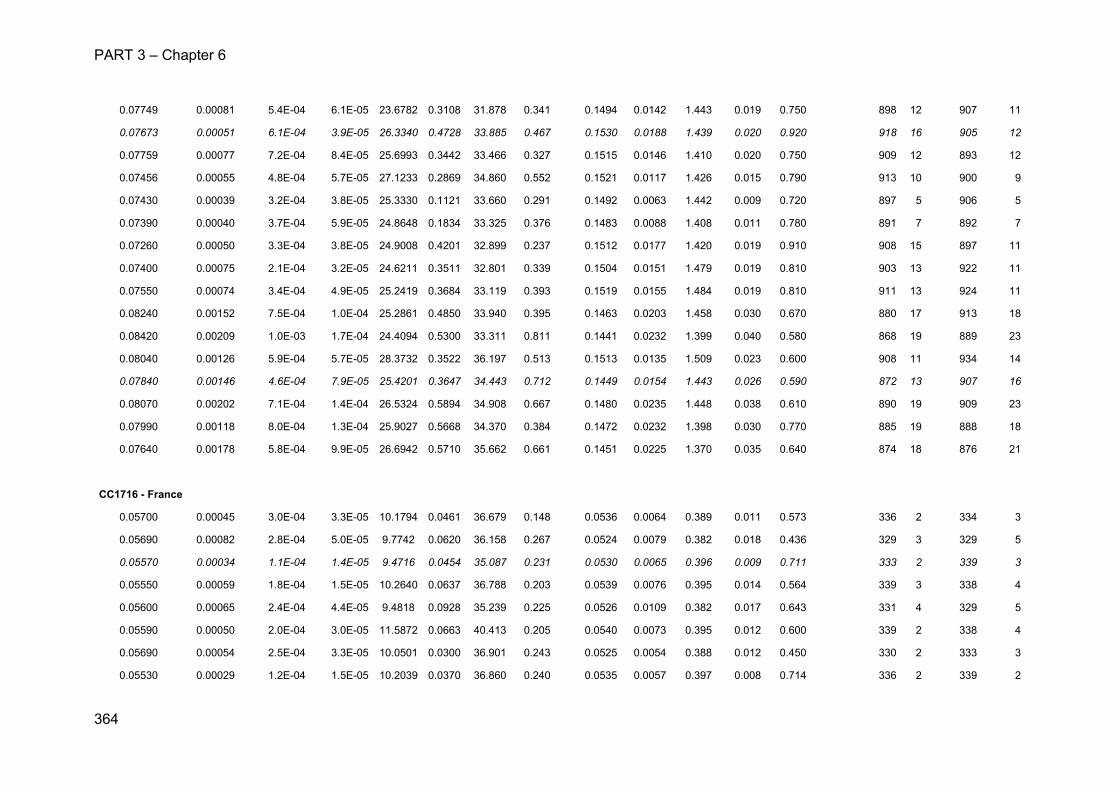
PART 3 – Chapter 6
364
0.07749 0.00081 5.4E-04 6.1E-05 23.6782 0.3108 31.878 0.341 0.1494 0.0142 1.443 0.019 0.750 898 12 907 11
0.07673 0.00051 6.1E-04 3.9E-05 26.3340 0.4728 33.885 0.467 0.1530 0.0188 1.439 0.020 0.920 918 16 905 12
0.07759 0.00077 7.2E-04 8.4E-05 25.6993 0.3442 33.466 0.327 0.1515 0.0146 1.410 0.020 0.750 909 12 893 12
0.07456 0.00055 4.8E-04 5.7E-05 27.1233 0.2869 34.860 0.552 0.1521 0.0117 1.426 0.015 0.790 913 10 900 9
0.07430 0.00039 3.2E-04 3.8E-05 25.3330 0.1121 33.660 0.291 0.1492 0.0063 1.442 0.009 0.720 897 5 906 5
0.07390 0.00040 3.7E-04 5.9E-05 24.8648 0.1834 33.325 0.376 0.1483 0.0088 1.408 0.011 0.780 891 7 892 7
0.07260 0.00050 3.3E-04 3.8E-05 24.9008 0.4201 32.899 0.237 0.1512 0.0177 1.420 0.019 0.910 908 15 897 11
0.07400 0.00075 2.1E-04 3.2E-05 24.6211 0.3511 32.801 0.339 0.1504 0.0151 1.479 0.019 0.810 903 13 922 11
0.07550 0.00074 3.4E-04 4.9E-05 25.2419 0.3684 33.119 0.393 0.1519 0.0155 1.484 0.019 0.810 911 13 924 11
0.08240 0.00152 7.5E-04 1.0E-04 25.2861 0.4850 33.940 0.395 0.1463 0.0203 1.458 0.030 0.670 880 17 913 18
0.08420 0.00209 1.0E-03 1.7E-04 24.4094 0.5300 33.311 0.811 0.1441 0.0232 1.399 0.040 0.580 868 19 889 23
0.08040 0.00126 5.9E-04 5.7E-05 28.3732 0.3522 36.197 0.513 0.1513 0.0135 1.509 0.023 0.600 908 11 934 14
0.07840 0.00146 4.6E-04 7.9E-05 25.4201 0.3647 34.443 0.712 0.1449 0.0154 1.443 0.026 0.590 872 13 907 16
0.08070 0.00202 7.1E-04 1.4E-04 26.5324 0.5894 34.908 0.667 0.1480 0.0235 1.448 0.038 0.610 890 19 909 23
0.07990 0.00118 8.0E-04 1.3E-04 25.9027 0.5668 34.370 0.384 0.1472 0.0232 1.398 0.030 0.770 885 19 888 18
0.07640 0.00178 5.8E-04 9.9E-05 26.6942 0.5710 35.662 0.661 0.1451 0.0225 1.370 0.035 0.640 874 18 876 21
CC1716 - France
0.05700 0.00045 3.0E-04 3.3E-05 10.1794 0.0461 36.679 0.148 0.0536 0.0064 0.389 0.011 0.573 336 2 334 3
0.05690 0.00082 2.8E-04 5.0E-05 9.7742 0.0620 36.158 0.267 0.0524 0.0079 0.382 0.018 0.436 329 3 329 5
0.05570 0.00034 1.1E-04 1.4E-05 9.4716 0.0454 35.087 0.231 0.0530 0.0065 0.396 0.009 0.711 333 2 339 3
0.05550 0.00059 1.8E-04 1.5E-05 10.2640 0.0637 36.788 0.203 0.0539 0.0076 0.395 0.014 0.564 339 3 338 4
0.05600 0.00065 2.4E-04 4.4E-05 9.4818 0.0928 35.239 0.225 0.0526 0.0109 0.382 0.017 0.643 331 4 329 5
0.05590 0.00050 2.0E-04 3.0E-05 11.5872 0.0663 40.413 0.205 0.0540 0.0073 0.395 0.012 0.600 339 2 338 4
0.05690 0.00054 2.5E-04 3.3E-05 10.0501 0.0300 36.901 0.243 0.0525 0.0054 0.388 0.012 0.450 330 2 333 3
0.05530 0.00029 1.2E-04 1.5E-05 10.2039 0.0370 36.860 0.240 0.0535 0.0057 0.397 0.008 0.714 336 2 339 2
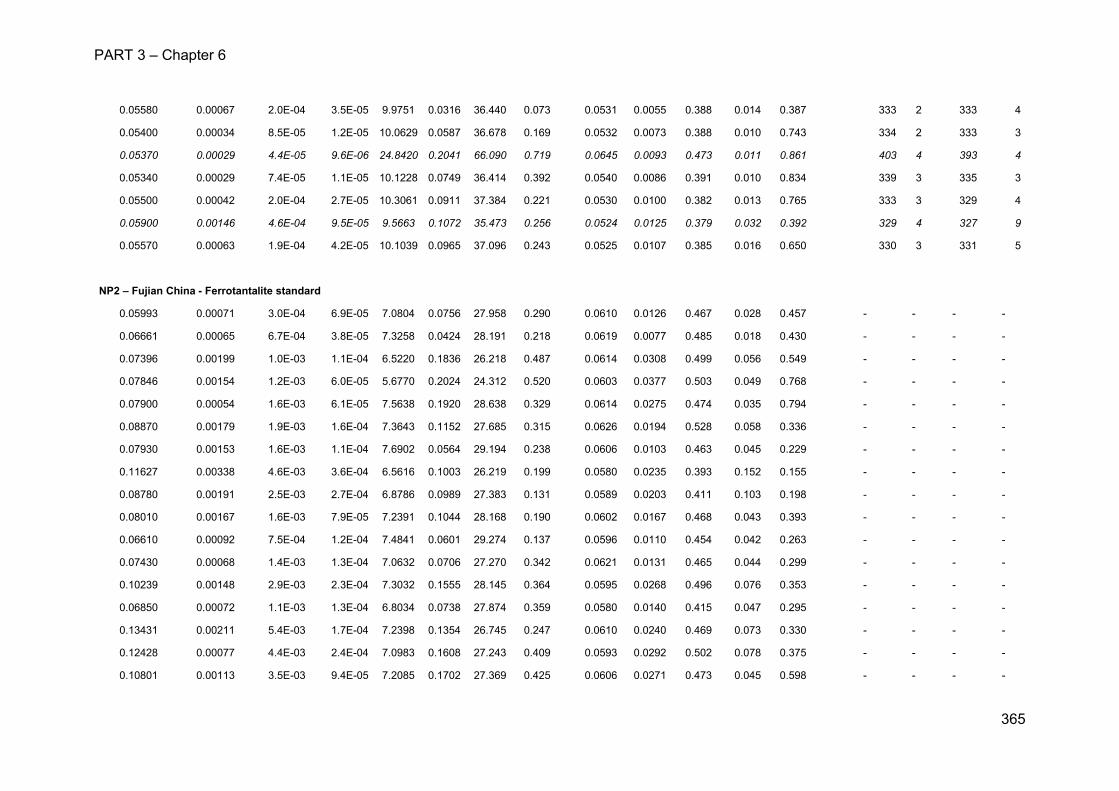
PART 3 – Chapter 6
365
0.05580 0.00067 2.0E-04 3.5E-05 9.9751 0.0316 36.440 0.073 0.0531 0.0055 0.388 0.014 0.387 333 2 333 4
0.05400 0.00034 8.5E-05 1.2E-05 10.0629 0.0587 36.678 0.169 0.0532 0.0073 0.388 0.010 0.743 334 2 333 3
0.05370 0.00029 4.4E-05 9.6E-06 24.8420 0.2041 66.090 0.719 0.0645 0.0093 0.473 0.011 0.861 403 4 393 4
0.05340 0.00029 7.4E-05 1.1E-05 10.1228 0.0749 36.414 0.392 0.0540 0.0086 0.391 0.010 0.834 339 3 335 3
0.05500 0.00042 2.0E-04 2.7E-05 10.3061 0.0911 37.384 0.221 0.0530 0.0100 0.382 0.013 0.765 333 3 329 4
0.05900 0.00146 4.6E-04 9.5E-05 9.5663 0.1072 35.473 0.256 0.0524 0.0125 0.379 0.032 0.392 329 4 327 9
0.05570 0.00063 1.9E-04 4.2E-05 10.1039 0.0965 37.096 0.243 0.0525 0.0107 0.385 0.016 0.650 330 3 331 5
NP2 – Fujian China - Ferrotantalite standard
0.05993 0.00071 3.0E-04 6.9E-05 7.0804 0.0756 27.958 0.290 0.0610 0.0126 0.467 0.028 0.457 - - - -
0.06661 0.00065 6.7E-04 3.8E-05 7.3258 0.0424 28.191 0.218 0.0619 0.0077 0.485 0.018 0.430 - - - -
0.07396 0.00199 1.0E-03 1.1E-04 6.5220 0.1836 26.218 0.487 0.0614 0.0308 0.499 0.056 0.549 - - - -
0.07846 0.00154 1.2E-03 6.0E-05 5.6770 0.2024 24.312 0.520 0.0603 0.0377 0.503 0.049 0.768 - - - -
0.07900 0.00054 1.6E-03 6.1E-05 7.5638 0.1920 28.638 0.329 0.0614 0.0275 0.474 0.035 0.794 - - - -
0.08870 0.00179 1.9E-03 1.6E-04 7.3643 0.1152 27.685 0.315 0.0626 0.0194 0.528 0.058 0.336 - - - -
0.07930 0.00153 1.6E-03 1.1E-04 7.6902 0.0564 29.194 0.238 0.0606 0.0103 0.463 0.045 0.229 - - - -
0.11627 0.00338 4.6E-03 3.6E-04 6.5616 0.1003 26.219 0.199 0.0580 0.0235 0.393 0.152 0.155 - - - -
0.08780 0.00191 2.5E-03 2.7E-04 6.8786 0.0989 27.383 0.131 0.0589 0.0203 0.411 0.103 0.198 - - - -
0.08010 0.00167 1.6E-03 7.9E-05 7.2391 0.1044 28.168 0.190 0.0602 0.0167 0.468 0.043 0.393 - - - -
0.06610 0.00092 7.5E-04 1.2E-04 7.4841 0.0601 29.274 0.137 0.0596 0.0110 0.454 0.042 0.263 - - - -
0.07430 0.00068 1.4E-03 1.3E-04 7.0632 0.0706 27.270 0.342 0.0621 0.0131 0.465 0.044 0.299 - - - -
0.10239 0.00148 2.9E-03 2.3E-04 7.3032 0.1555 28.145 0.364 0.0595 0.0268 0.496 0.076 0.353 - - - -
0.06850 0.00072 1.1E-03 1.3E-04 6.8034 0.0738 27.874 0.359 0.0580 0.0140 0.415 0.047 0.295 - - - -
0.13431 0.00211 5.4E-03 1.7E-04 7.2398 0.1354 26.745 0.247 0.0610 0.0240 0.469 0.073 0.330 - - - -
0.12428 0.00077 4.4E-03 2.4E-04 7.0983 0.1608 27.243 0.409 0.0593 0.0292 0.502 0.078 0.375 - - - -
0.10801 0.00113 3.5E-03 9.4E-05 7.2085 0.1702 27.369 0.425 0.0606 0.0271 0.473 0.045 0.598 - - - -
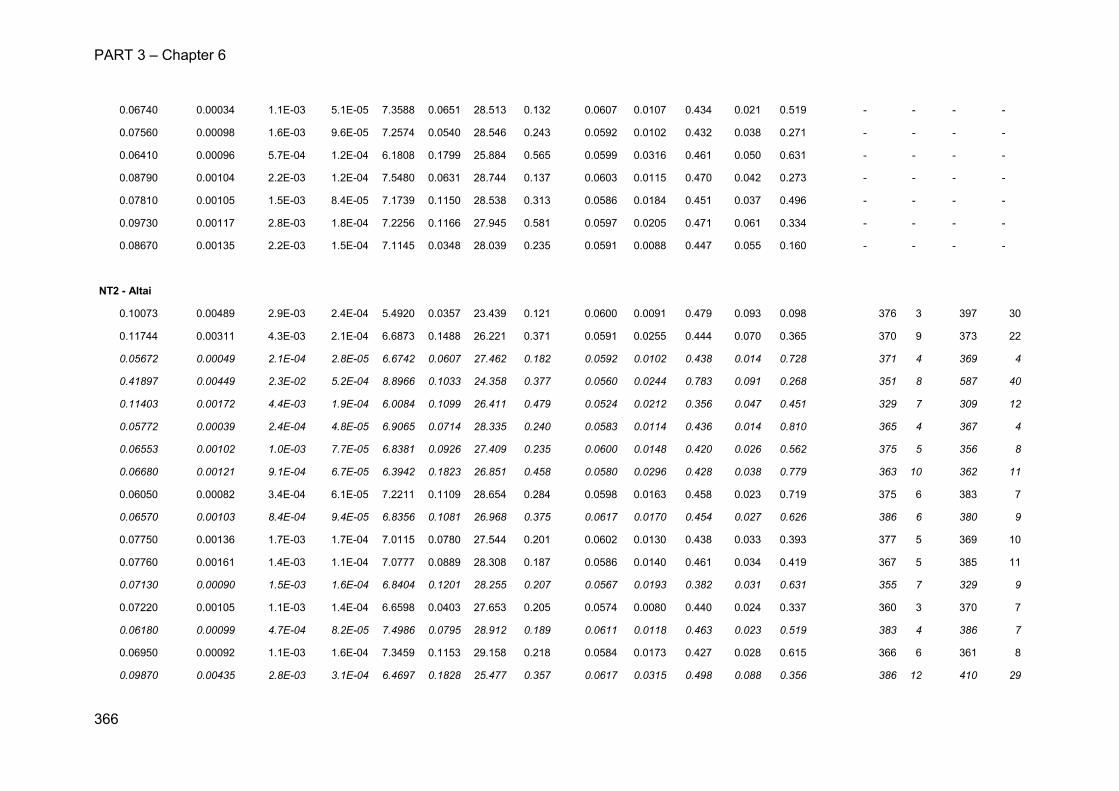
PART 3 – Chapter 6
366
0.06740 0.00034 1.1E-03 5.1E-05 7.3588 0.0651 28.513 0.132 0.0607 0.0107 0.434 0.021 0.519 - - - -
0.07560 0.00098 1.6E-03 9.6E-05 7.2574 0.0540 28.546 0.243 0.0592 0.0102 0.432 0.038 0.271 - - - -
0.06410 0.00096 5.7E-04 1.2E-04 6.1808 0.1799 25.884 0.565 0.0599 0.0316 0.461 0.050 0.631 - - - -
0.08790 0.00104 2.2E-03 1.2E-04 7.5480 0.0631 28.744 0.137 0.0603 0.0115 0.470 0.042 0.273 - - - -
0.07810 0.00105 1.5E-03 8.4E-05 7.1739 0.1150 28.538 0.313 0.0586 0.0184 0.451 0.037 0.496 - - - -
0.09730 0.00117 2.8E-03 1.8E-04 7.2256 0.1166 27.945 0.581 0.0597 0.0205 0.471 0.061 0.334 - - - -
0.08670 0.00135 2.2E-03 1.5E-04 7.1145 0.0348 28.039 0.235 0.0591 0.0088 0.447 0.055 0.160 - - - -
NT2 - Altai
0.10073 0.00489 2.9E-03 2.4E-04 5.4920 0.0357 23.439 0.121 0.0600 0.0091 0.479 0.093 0.098 376 3 397 30
0.11744 0.00311 4.3E-03 2.1E-04 6.6873 0.1488 26.221 0.371 0.0591 0.0255 0.444 0.070 0.365 370 9 373 22
0.05672 0.00049 2.1E-04 2.8E-05 6.6742 0.0607 27.462 0.182 0.0592 0.0102 0.438 0.014 0.728 371 4 369 4
0.41897 0.00449 2.3E-02 5.2E-04 8.8966 0.1033 24.358 0.377 0.0560 0.0244 0.783 0.091 0.268 351 8 587 40
0.11403 0.00172 4.4E-03 1.9E-04 6.0084 0.1099 26.411 0.479 0.0524 0.0212 0.356 0.047 0.451 329 7 309 12
0.05772 0.00039 2.4E-04 4.8E-05 6.9065 0.0714 28.335 0.240 0.0583 0.0114 0.436 0.014 0.810 365 4 367 4
0.06553 0.00102 1.0E-03 7.7E-05 6.8381 0.0926 27.409 0.235 0.0600 0.0148 0.420 0.026 0.562 375 5 356 8
0.06680 0.00121 9.1E-04 6.7E-05 6.3942 0.1823 26.851 0.458 0.0580 0.0296 0.428 0.038 0.779 363 10 362 11
0.06050 0.00082 3.4E-04 6.1E-05 7.2211 0.1109 28.654 0.284 0.0598 0.0163 0.458 0.023 0.719 375 6 383 7
0.06570 0.00103 8.4E-04 9.4E-05 6.8356 0.1081 26.968 0.375 0.0617 0.0170 0.454 0.027 0.626 386 6 380 9
0.07750 0.00136 1.7E-03 1.7E-04 7.0115 0.0780 27.544 0.201 0.0602 0.0130 0.438 0.033 0.393 377 5 369 10
0.07760 0.00161 1.4E-03 1.1E-04 7.0777 0.0889 28.308 0.187 0.0586 0.0140 0.461 0.034 0.419 367 5 385 11
0.07130 0.00090 1.5E-03 1.6E-04 6.8404 0.1201 28.255 0.207 0.0567 0.0193 0.382 0.031 0.631 355 7 329 9
0.07220 0.00105 1.1E-03 1.4E-04 6.6598 0.0403 27.653 0.205 0.0574 0.0080 0.440 0.024 0.337 360 3 370 7
0.06180 0.00099 4.7E-04 8.2E-05 7.4986 0.0795 28.912 0.189 0.0611 0.0118 0.463 0.023 0.519 383 4 386 7
0.06950 0.00092 1.1E-03 1.6E-04 7.3459 0.1153 29.158 0.218 0.0584 0.0173 0.427 0.028 0.615 366 6 361 8
0.09870 0.00435 2.8E-03 3.1E-04 6.4697 0.1828 25.477 0.357 0.0617 0.0315 0.498 0.088 0.356 386 12 410 29
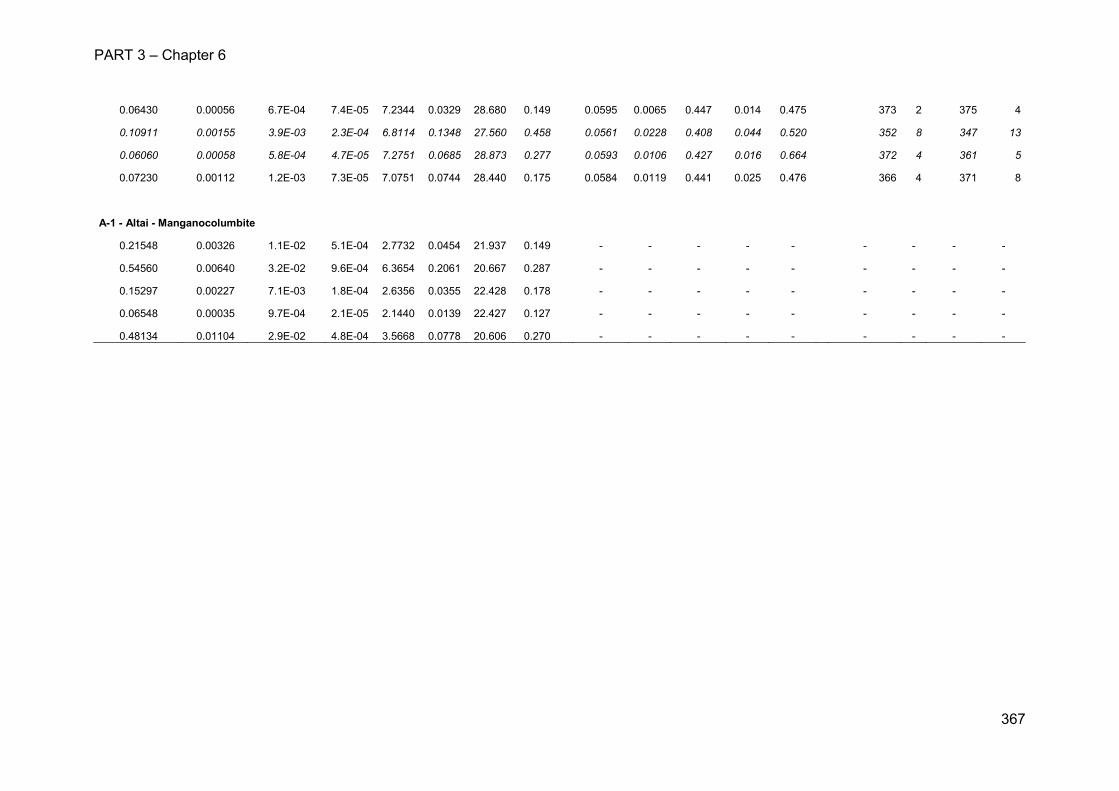
PART 3 – Chapter 6
367
0.06430 0.00056 6.7E-04 7.4E-05 7.2344 0.0329 28.680 0.149 0.0595 0.0065 0.447 0.014 0.475 373 2 375 4
0.10911 0.00155 3.9E-03 2.3E-04 6.8114 0.1348 27.560 0.458 0.0561 0.0228 0.408 0.044 0.520 352 8 347 13
0.06060 0.00058 5.8E-04 4.7E-05 7.2751 0.0685 28.873 0.277 0.0593 0.0106 0.427 0.016 0.664 372 4 361 5
0.07230 0.00112 1.2E-03 7.3E-05 7.0751 0.0744 28.440 0.175 0.0584 0.0119 0.441 0.025 0.476 366 4 371 8
A-1 - Altai - Manganocolumbite
0.21548 0.00326 1.1E-02 5.1E-04 2.7732 0.0454 21.937 0.149 - - - - - - - - -
0.54560 0.00640 3.2E-02 9.6E-04 6.3654 0.2061 20.667 0.287 - - - - - - - - -
0.15297 0.00227 7.1E-03 1.8E-04 2.6356 0.0355 22.428 0.178 - - - - - - - - -
0.06548 0.00035 9.7E-04 2.1E-05 2.1440 0.0139 22.427 0.127 - - - - - - - - -
0.48134 0.01104 2.9E-02 4.8E-04 3.5668 0.0778 20.606 0.270 - - - - - - - - -

Discussion - Conclusion
369
General discussion, conclusions and perspectives
This discussion aims to involve all interpretations and thoughts that were developed
during this thesis. Three main questions are addressed: (i) How do W-Sn deposits formed in
the Nanling Range?, (ii) Why is there that much deposits in the Nanling Range at this period?
and, (iii) Comparing to the FMC, why is the Nanling Range richer in W-Sn resources?
These three questions are successively addressed in each of the three parts of this
discussion. Each part firstly develops the current models invoked in the literature and then
proposes a discussion in the light of the results of this thesis.
This discussion tries to integrate this work in a broader perspective which is the
common understanding of W-Sn hydrothermal deposits and the settings that could have been
involved in the Nanling Range compared to other provinces.
1. Integrated model for W-Sn hydrothermal deposits
In the W-Sn literature, two models are proposed to explain the source of metals and
processes able to transport and concentrate them.
The first and widely accepted model involves a magmatic source from which metal-
enriched magmatic fluids are exsolved from a granitic intrusion. This model is supported by a
wide range of fluid inclusion studies performed on W-Sn deposits worldwide (e.g. Beuchat et
al., 2004; Carruzzo et al., 2004; Luders et al., 2009; Wei et al., 2012). The main arguments in
favor of a magmatic origin of W-Sn are: δ18O and δD values on quartz yielding in the commonly
defined “magmatic” box (e.g. Chicharro et al., 2016; Wei et al., 2017), δ34S values of pyrite and
arsenopyrite yielding magmatic values (e.g. Wang et al., 2012) and the evidence of coexisting
melt and fluid inclusions in quartz crystals (e.g. Hulsbosch et al., 2016). However, very few of
these studies clearly demonstrated that these gangue minerals were strictly coeval with the
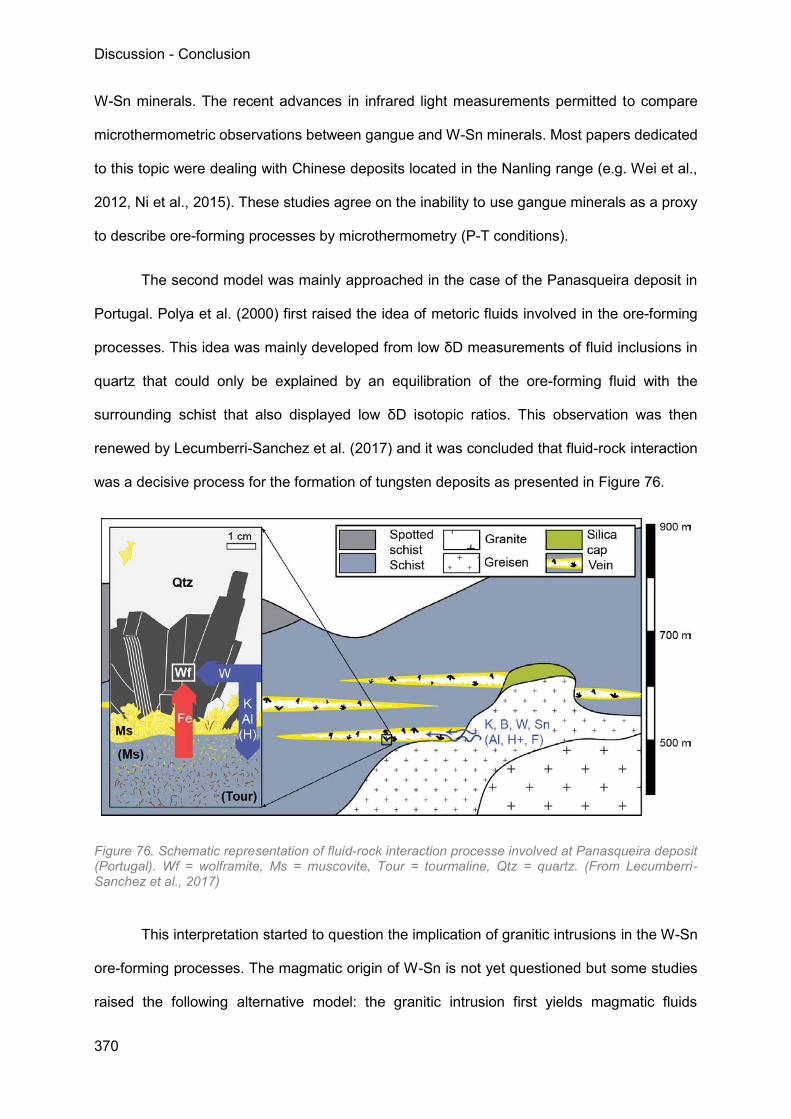
Discussion - Conclusion
370
W-Sn minerals. The recent advances in infrared light measurements permitted to compare
microthermometric observations between gangue and W-Sn minerals. Most papers dedicated
to this topic were dealing with Chinese deposits located in the Nanling range (e.g. Wei et al.,
2012, Ni et al., 2015). These studies agree on the inability to use gangue minerals as a proxy
to describe ore-forming processes by microthermometry (P-T conditions).
The second model was mainly approached in the case of the Panasqueira deposit in
Portugal. Polya et al. (2000) first raised the idea of metoric fluids involved in the ore-forming
processes. This idea was mainly developed from low δD measurements of fluid inclusions in
quartz that could only be explained by an equilibration of the ore-forming fluid with the
surrounding schist that also displayed low δD isotopic ratios. This observation was then
renewed by Lecumberri-Sanchez et al. (2017) and it was concluded that fluid-rock interaction
was a decisive process for the formation of tungsten deposits as presented in Figure 76.
Figure 76. Schematic representation of fluid-rock interaction processe involved at Panasqueira deposit (Portugal). Wf = wolframite, Ms = muscovite, Tour = tourmaline, Qtz = quartz. (From Lecumberri-Sanchez et al., 2017)
This interpretation started to question the implication of granitic intrusions in the W-Sn
ore-forming processes. The magmatic origin of W-Sn is not yet questioned but some studies
raised the following alternative model: the granitic intrusion first yields magmatic fluids
Discussion - Conclusion
371
enriching the perigranitic cover, then local metamorphic settings activate the circulation of
external fluids in the crust in the shape of convective cells and finally leach the rare metals
from the cover to concentrate them within fractures to form the veins (e.g. Wilkinson, 1990;
Blamart, 1991; Zhao and Jiang, 2004; Vallance et al., 2001; Harlaux, 2017). This model is
particularly developed in the case of Variscan deposits.
In both models, the prevailing process invoked for the W-Sn minerals precipitation is
the mixing of the rare-metal-enriched fluid with a meteoric fluid (e.g. Wilkinson, 1990; Luders
et al., 2009; Dolnicek et al., 2012). Other processes such as unmixing and boiling were also
observed but interpreted as non-decisive for the ore mineral precipitation (e.g. Wei et al., 2012;
Wei et al., 2017). However, such processes were interpreted from the observation of
heterogeneous gas contents that were never observed in wolframite fluid inclusions (e.g. Wei
et al., 2012; Ni et al., 2015).
This thesis agrees with the first model in the case of the Maoping and Piaotang deposits
by multiple and integrated approaches performed on both gangue and ore minerals (see
Chapter 2, 3 and 4). The differences between gangue and ore minerals could be enlighten and
confirmed by other approaches than microthermometry such as stable isotopes (O, H) and LA-
ICPMS. These complementary approaches permitted to propose an explanation for the
inconsistence between measurements in gangue and ore minerals. These differences include,
from the quartz to ore minerals crystallization: an increase in temperature, salinity,
incompatible elements including metals and a decrease of the δD value. These characteristics
were interpreted in this thesis as characteristic of two magmatic fluid pulses exsolved at
different grades of differentiation of the granitic intrusion. The low δD isotopic ratio was
interpreted as a possible H2O degassing from the magma (see Chapter 4). Lecumberri-
Sanchez et al. (2017) recently proposed an explanation for the wide interaction of ore-forming
fluids with the surrounding rocks in Panasqueira as a necessary process providing for the iron
contained in ferberite and explaining the heterogeneous filling in the veins. In the case of
Maoping and Piaotang, wolframite crystallizes in the form of hubnerite. Due to the lack of fluid-
Discussion - Conclusion
372
rock observations in the respective mines, this theory could not be inferred in our case.
However, both the peraluminous granite and the schists in Maoping are manganese-depleted
and could not have provided the necessary manganese to form hubnerite. Moreover, multiple
deposits in the Nanling Range show veins crosscutting very differentiated granites that could
not have provided for the iron and manganese content necessary to the crystallization of
wolframite.
2. The W-Sn Jurassic-Cretaceous event in the Nanling Range
2.1 The timing of W-Sn mineralizations
W-Sn deposits are widely emplaced in the Nanling Range during the Trias-Cretaceous
period with multiple pulses. However, it is believed that one great episode accounted for the
emplacement of most of these deposits. Two models concerning this peak of emplacement
granites and related W-Sn deposits in the Nanling Range are proposed at this day.
Most authors agree on a timing between 150 and 160 Ma. These range is associated
with multiple dating analysis performed on gangue minerals as Re-Os on molybdenite (e.g.
Feng et al., 2011; Zeng et al., 2011; Zhang et al., 2011), Ar-Ar on micas (e.g. Peng et al., 2006;
Yuan et al., 2007; Zhai et al., 2010) and Sm-Nd on quartz fluid inclusions (Fu et al., 2009). Few
studies also proposed a similar age by measuring U-Pb isotopic ratios in cassiterite (Bai et al.,
2011; Zhang et al., 2017) but in the absence of appropriate external standard, the accuracy of
this technique is still debated. This timing of emplacement is dated coevally to the associated
biotite granites that are believed to be the source of tungsten and therefore, is commonly
accepted as accurate.
Recently, Wang et al., (2016) raised some questions and inconsistencies about the
current model adopted in the Nanling Range. This author proposes that the prevailing dating
methods have some limitations such as low closure temperatures, low isotopic contents and
dispersed initial isotopic values that induced errors in interpretation. Therefore, this author
Discussion - Conclusion
373
provides new ages by dating hydrothermal zircons (U-Pb) as a new proxy to evaluate the timing
of hydrothermal fluids transporting tungsten and proposes a new range of emplacement
between 130 and 135 Ma. In the light of these findings, a new source of tungsten is proposed:
the muscovite granites (Wang et al., 2017).
This thesis proposes (i) tangible arguments permitting to increment this discussion by
the first direct dating measurements of wolframite in the Nanling range and yielding ages of
ca. 160 Ma (see Chapter 5). This age is consistent with very recent attempts of U-Pb dating of
cassiterite that also suggest a very early emplacement of the mineralization comparing to most
dating results performed on gangue minerals. (ii) Multiple dating associated to the detailed
paragenesis of the Maoping deposit raised evidences of a major resetting and/or alteration of
isotopic systems in gangue minerals of these deposits due the multiple and overlapping fluid
circulations. These major fluid events were dated at ca. 155 Ma as many studies before but
clearly postdate the W-Sn mineralizing events. (iii) Dating of late filling phases such as
xenotime yield an age of ca. 130 Ma, similarly to the hydrothermal zircons analyzed by Wang
et al. (2016). At the Maoping deposit, a secondary event was identified as postponing the W-
Sn event and crystallizing Nb-Ta-Zr-REE minerals in association with a supposed buried
peralkaline intrusion. In their study, Wang et al. (2016) shows hydrothermal zircons pictures in
association with fluorite, xenotime, monazite and sulphides. These phases and hydrothermal
zircons are clearly identified in the Maoping deposit and are interpreted as posterior to the W-
Sn mineralizing event (Legros et al., 2016). It is clear that two episodes are defined: a W-Sn
episode at ca. 160 Ma in association with biotite granites and a second episode where mainly
Rare Earth Elements mineralizations occur in association with Zr-Nb-Ta affinities that define
another pulse of magmatism that is not of peraluminous affinity.
Considering a ca. 160 Ma timing for the W-Sn mineralizing event, the question raises
of the consistency of the current orthomagmatic models in association with the emplacement
of biotite granitoids. As suggested by Wang et al. (2016), these models are mostly based on
dating results where gangue minerals are dated coevally to these granites. This thesis does
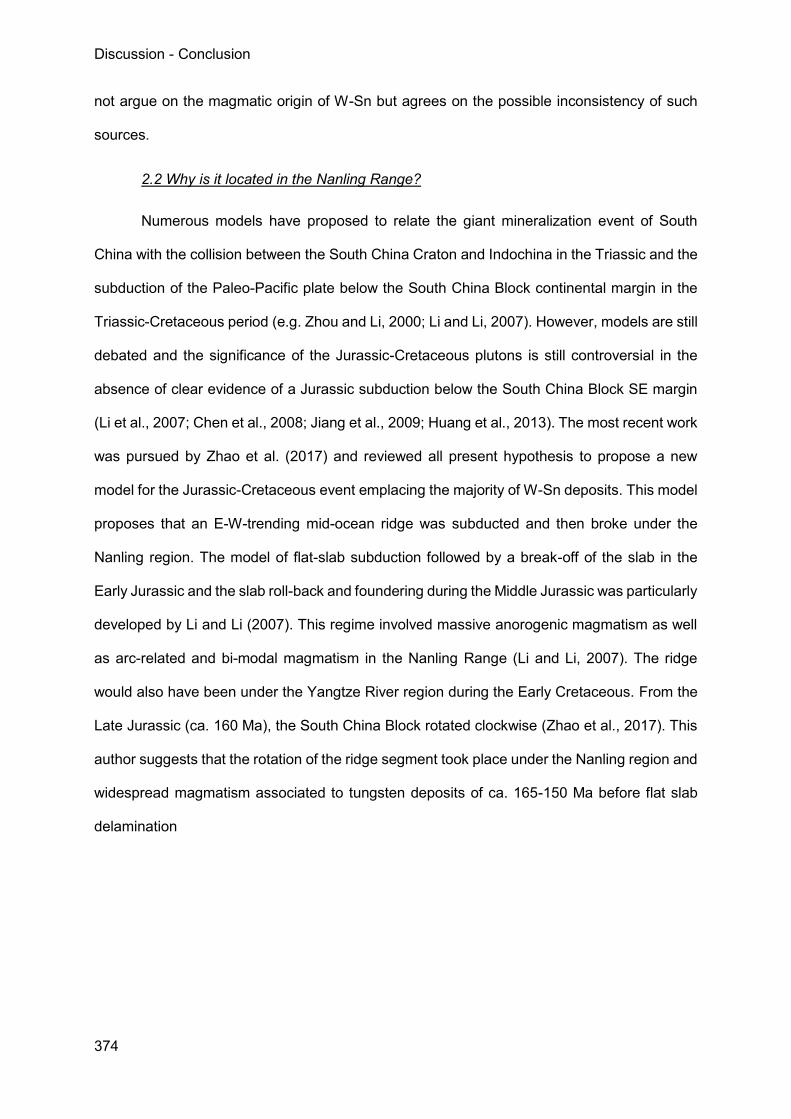
Discussion - Conclusion
374
not argue on the magmatic origin of W-Sn but agrees on the possible inconsistency of such
sources.
2.2 Why is it located in the Nanling Range?
Numerous models have proposed to relate the giant mineralization event of South
China with the collision between the South China Craton and Indochina in the Triassic and the
subduction of the Paleo-Pacific plate below the South China Block continental margin in the
Triassic-Cretaceous period (e.g. Zhou and Li, 2000; Li and Li, 2007). However, models are still
debated and the significance of the Jurassic-Cretaceous plutons is still controversial in the
absence of clear evidence of a Jurassic subduction below the South China Block SE margin
(Li et al., 2007; Chen et al., 2008; Jiang et al., 2009; Huang et al., 2013). The most recent work
was pursued by Zhao et al. (2017) and reviewed all present hypothesis to propose a new
model for the Jurassic-Cretaceous event emplacing the majority of W-Sn deposits. This model
proposes that an E-W-trending mid-ocean ridge was subducted and then broke under the
Nanling region. The model of flat-slab subduction followed by a break-off of the slab in the
Early Jurassic and the slab roll-back and foundering during the Middle Jurassic was particularly
developed by Li and Li (2007). This regime involved massive anorogenic magmatism as well
as arc-related and bi-modal magmatism in the Nanling Range (Li and Li, 2007). The ridge
would also have been under the Yangtze River region during the Early Cretaceous. From the
Late Jurassic (ca. 160 Ma), the South China Block rotated clockwise (Zhao et al., 2017). This
author suggests that the rotation of the ridge segment took place under the Nanling region and
widespread magmatism associated to tungsten deposits of ca. 165-150 Ma before flat slab
delamination
Discussion - Conclusion
375
Figure 77. 3D diagram of the geodynamical settings during the Jurassic period and more precisely at ca. 160 Ma, in the South China Block (modified after Li and Li, 2007; Legros et al., 2016 and Zhao et al., 2017)
Discussion - Conclusion
376
3. Comparison to the French Massif Central, an example from the Variscan belt
The French Massif Central (FMC) is part of the Variscan belt and hosts many W-Sn
hydrothermal deposits that are specially associated to Carboniferous granitoids emplaced
through the syn-orogenic compression and post-orogenic extension of the West European
Variscan belt. Resources of at least 45,000 t WO3 are estimated (Audion and Labbé, 2012).
2.1 Geodynamic settings
The Variscan belt extends from the Bohemian Massif to the east to Iberia and Morocco
to west. The complex shape of the Variscan belt is due to the interaction of low-strain and high-
strain domains of continental crust during the Laurussia and Gondwana collision. Low-strain
domains are composed of thick continental crust poorly deformed during the Variscan orogeny
while high-strain domain composed of thin continental crust endured extensive Variscan
deformation (Kroner and Romer, 2013). The collision of thick continental crust induced new
subduction settings emplaced behind the colliding block. Both the thinned continental crust
and the sedimentary cover were involved in this intra-continental subduction. Part of the rocks
involved were exhumed and preserved in high-strained domains such as the FMC (Romer and
Kroner, 2010 and 2013). The transition from compressional to extensional tectonics possibly
started around 300-310 Ma (e.g. Wilson et al., 2004; Kroner and Romer, 2013). Magmatism is
associated to the emplacement of the high-strain domains, the late crustal melts emplaced
posteriorly to the metamorphic units and to the post-variscan crustal extension (Kroner and
Romer, 2013). These magmatic events respectively yielded peraluminous cordierite-biotite
granites (Gueret-type, Margeride), two-peraluminous leucogranites (Limousin-type), the Velay
granitic and migmatitic dome and highly fractionated peraluminous rare metal granites (e.g.
Cuney et al., 2001; Melleton et al., 2015; Figure 78).
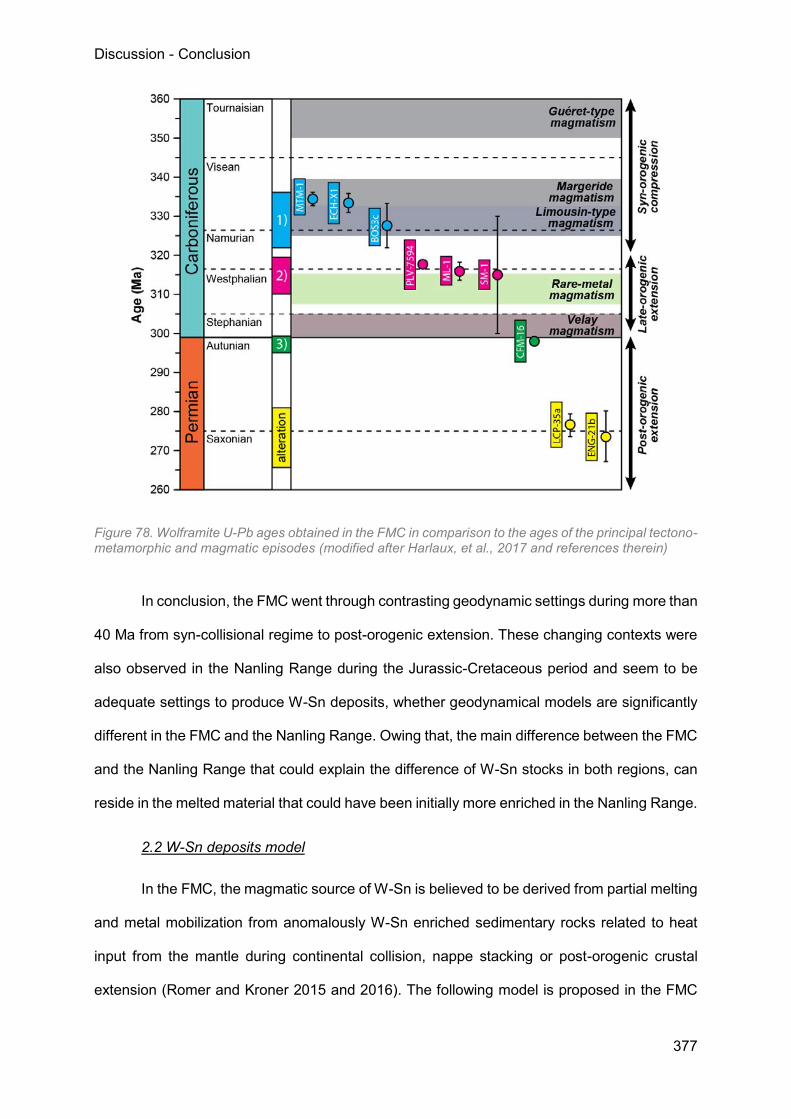
Discussion - Conclusion
377
Figure 78. Wolframite U-Pb ages obtained in the FMC in comparison to the ages of the principal tectono-metamorphic and magmatic episodes (modified after Harlaux, et al., 2017 and references therein)
In conclusion, the FMC went through contrasting geodynamic settings during more than
40 Ma from syn-collisional regime to post-orogenic extension. These changing contexts were
also observed in the Nanling Range during the Jurassic-Cretaceous period and seem to be
adequate settings to produce W-Sn deposits, whether geodynamical models are significantly
different in the FMC and the Nanling Range. Owing that, the main difference between the FMC
and the Nanling Range that could explain the difference of W-Sn stocks in both regions, can
reside in the melted material that could have been initially more enriched in the Nanling Range.
2.2 W-Sn deposits model
In the FMC, the magmatic source of W-Sn is believed to be derived from partial melting
and metal mobilization from anomalously W-Sn enriched sedimentary rocks related to heat
input from the mantle during continental collision, nappe stacking or post-orogenic crustal
extension (Romer and Kroner 2015 and 2016). The following model is proposed in the FMC
Discussion - Conclusion
378
(applied to the case of intermediate depth intrusions): a primary migration of the metals from
the granite to the metasedimentary cover to create a metal-rich perigranitic stock through
magmatic fluids and a second migration provoked by regional prograde metamorphism that
remobilizes the perigranitic stock into drains as fractures until reaching a trap (Harlaux, 2017).
Tungsten precipitation is believed to be due to the dilution of metamorphic metal-rich fluids by
low-salinity cooler fluids (e.g. Vindel et al., 1995; Norohna et al., 1999).
It appears that the ore-processes involved in the FMC and the Nanling Range are
similar: metal are believed to be of magmatic origin and dilution by a meteoric fluid would be
the predominant precipitating process. The main difference in the models invoked resides in
the implication of one or several migration processes. In the FMC as well as in the Variscan
belt in general, a secondary migration by metamorphic fluids is enlighten by the lack of obvious
magmatic fluids, tourmalinization, C-O-H-N-NaCl fluids, a rare-metal halo around the deposit
and regional metamorphism widely observed in the surrounding rocks (Vallance et al., 2001;
Harlaux, 2017). However, most fluid inclusion studies from the Variscan belt show the same
microthermometric and isotopic values as in the Nanling Range: intermediate values between
meteoric and metamorphic-magmatic values due to mixing. In this work, no such
metamorphism as seen in the FMC could be observed nor does contact halo near the veins or
the granite.
The question remains to know if such metamorphism is present in the Nanling Range
but not observed due to the difficult visibility induced by lateritization or underground work or if
it was absent and unnecessary in the context of the Nanling Range. The Variscan belt would
appear as a special case of W-Sn deposit emplacement where the present metal stock
contained in the melt was not sufficient to directly saturate the fluid and precipitation the veins
and needed posterior remobilization to acquire a sufficient concentration of metals. The
principal difference between the FMC and Nanling Range would therefore be the rate of pre-
enrichment of the melt prior to the granite emplacement.
Discussion - Conclusion
379
4. Conclusions
This thesis permitted to develop a petrological, mineralogical, fluid and timing view of
hydrothermal W-Sn systems located in the southern Jiangxi province and give some new input
in order to provide new elements of response in the field of W-Sn deposits.
(i) How do hydrothermal W-Sn deposits formed in the Nanling Range?
W-Sn vein-type deposits of the Nanling Range are all associated to granitic intrusions
that are largely described as peraluminous. The veins, generally rooted in these granites,
experience magmatic to hydrothermal conditions. During the hydrothermal settings, multiple
fluids are identified and characterized as magmatic and meteoric. The main process involved
is mixing (as often described). In this study, we defined that through time, multiple magmatic
pulses of fluids with different P-T-x characteristics take turn and induce the crystallization of
different mineral phases. These different magmatic pulses are believed to either be, from a
magmatic source evolving through time, or exsolved from distinct intrusions (if the associated
mineralogical assemblage varies). In our case, two magmatic fluids are defined as involved
during the W-Sn mineralizing stage and discriminate the crystallization of gangue minerals
from the crystallization of W-Sn minerals. These two magmatic fluids were identified as
exsolved from the same peraluminous source that provided two pulses: a fluid exsolved from
a low differentiated intrusion crystallizing the gangue minerals, and a fluid exsolved from a
highly differentiated intrusion crystallizing W-Sn minerals.
(ii) Why is there that much deposits in the Nanling Range at this period?
The location and the timing of the W-Sn mineralizations in the Nanling Range are
triggered by the geodynamical settings during the Jurassic-Cretaceous period. The W-Sn
tungsten deposits are emplaced in a subduction context where the Paleo-Pacific plate is
subducted under the Eurasia continent in the form of a flat-slab subduction. During the
Jurassic, the slab broke-off and delamination under the Nanling range created a window
Discussion - Conclusion
380
between the slab roll-back and slab foundering on each side and developed convective cells
that enforced the rise of mixed magmas (crustal and asthenospheric components) within the
crust.
(iii) Comparing to the FMC, why is the Nanling Range richer in W-Sn resources?
In term of hydrothermal processes involved in the formation of the W-Sn veins, only
one process differs between the FMC and the Nanling Range which is the involvement of
external fluids remobilizing tungsten widespread in the crust, within the veins. The absence of
evidences concerning a possible remobilization within the crust in the Nanling Range may be
explained by the timing of emplacement of both regions. Indeed, the FMC W-Sn deposits were
emplaced in an immature crust where remobilization and concentration of rare metals was
possible while the Nanling W-Sn deposits appear at a timing where the crust is already mature
and underwent multiple metamorphism event that already remobilized these elements from
the crust. This hypothesis could explain the lack the boron and therefore, tourmaline, in most
deposits of the Nanling Range. However, these processes do not explain the wide difference
of resources between the two regions.
Giving this study, the difference between the Nanling Range and the FMC resides in
pre- granite emplacement processes. As granites associated to W-Sn deposits in the Nanling
do not seem to drastically differ from the peraluminous granites emplaced in the FMC, the key
of understanding the differences between these two provinces would reside in the
characterization of the enriched melts that emplaced the granites, and their sources.
Discussion - Conclusion
381
5. Perspectives
In the light of this work, further studies would be needed to enhance our knowledge of
W-Sn deposits and particularly in the Nanling Range.
Firstly, further work in and around the mines is needed and particularly in term of
structure. This work could not be done during this thesis due to a lack of time but could help
constraint the conditions of emplacement of these deposit as exposed in the case of the
Panasqueira mine by Jacques et al. (2017).
Secondly, very rare articles at this day provide substantial petrographic and
mineralogical descriptive work. It would be interesting to compare detailed paragenesis at the
scale of the province in order to provide some possible regional observations. Moreover,
detailed paragenesis are a prequisite to geochemical, fluid inclusion and dating studies. A lot
of data are provided in the literature without any mineralogical chronology and may need to be
context.
It would also be interesting to find and study melt inclusions to constraint the magmatic
processes before the transition toward hydrothermal conditions. In term of fluid inclusions, it
would be necessary to increment the number of fluid inclusion study in the Nanling Range with
systematic study of opaque minerals such as wolframite and integrated studies gathering
multiple approaches. Moreover, the need of experimental work seems crucial to our
understanding of processes able to transport and precipitate W-Sn minerals.
Finally, as concluded in the discussion, further little scale work needs to be done on the
granitic intrusions associated to the W-Sn veins in order to characterize the very first step of
concentration of these metals in the melt and in particular in the Nanling Range.
Discussion - Conclusion
382
Discussion - Conclusion
383
References
Audion, A.S., and Labbé, J.F., 2012. Panorama mondial 2011 du marché du tungstène.
Rapport Public BRGM, RP-61341-FR, 108p.
Bai, X.J., Wang, M., Lu, K.H., Fang, J.L., Pu, Z.P., Qiu, H.N., 2011. Direct dating of cassiterite
by 40Ar/39Ar progressive crushing. Chinese Science Bulletin 56, 1899–1904 (in
Chinese).
Blamart, D., 1991. Les concentrations tungstifères et stannifères: caractérisation isotopique
(O-H) des fluides minéralisateurs, sur l'exemple du gisement Sn-W de Walmès (Maroc
Central)". Détermination de quelques fractionnements isotopiques (H-O) entre
minéraux et eau. Doctoral thesis.
Beuchat, S., Moritz, R., Pettke, T., 2004. Fluid evolution in the W–Cu–Zn–Pb San Cristobal
vein, Peru: fluid inclusion and stable isotope evidence. Chemical Geology 210, 201-
224.
Carruzzo, S., Kontak, D.J., Clarke, D.B., Kyser, T.K., 2004. An integrated fluid–mineral stable-
isotope study of the granite-hosted mineral deposits of the New Ross area, South
Mountain Batholith, Nova Scotia, Canada: evidence for multiple reservoirs. The
Canadian Mineralogist 42, 1425-1441.
Chen, C.H., Lee, C.Y., Shinjo, R.C., 2008. Was there Jurassic paleo-Pacific subduction in
South China?: constraints from 40Ar-39Ar dating, elemental and Sr-Nd-Pb isotope
geochemistry of the Mesozoic basalts. Lithos 106, 83-92
Chicharro, E., Boiron, M.C., López-García, J.Á., Barfod, D.N., Villaseca, C., 2016. Origin, ore
forming fluid evolution and timing of the Logrosán Sn–(W) ore deposits (Central Iberian
Zone, Spain). Ore Geology Reviews 72, 896-913.
Cuney, M., Brouand, M., Stussi, J.M., 2001. Le magmatisme hercynien en Vendée.
Corrélations avec le socle du Poitou et l'Ouest du Massif Central français. Géologie de
la France 1-2, 117-142.
Dolníček, Z., René, M., Prochaska, W., Kovář, M., 2012. Fluid evolution of the Hub Stock,
Horní Slavkov–Krásno Sn–W ore district, Bohemian Massif, Czech Republic.
Mineralium Deposita 47, 821-833.
Feng, C., Zeng, Z., Zhang, D., Qu, W., Du, A., Li, D., She, H., 2011b. SHRIMP zircon U–Pb
and molybdenite Re–Os isotopic dating of the tungsten deposits in the Tianmenshan–
Hongtaoling W–Sn orefield, southern Jiangxi Province, China, and geological
implications. Ore Geology Reviews 43, 8-25.
Discussion - Conclusion
384
Fu, J.M., Li, X.N., Cheng, S.B., Xu, D.M., Ma, L.Y., Chen, X.Q., 2009. Metallogenic ages of
tungsten-tin polymetallic deposits in Lianping area, northern Guangdong
Province. Geology of China 36, 1331-1339.
Harlaux, M., 2017. Tungsten and rare-metal (Nb, Ta, Sn) hydrothermal metallogenic systems
in the late-Variscan orogenic context: example of the French Massif Central. Doctoral
thesis.
Harlaux, M., Romer, R. L., Mercadier, J., Morlot, C., Marignac, C., Cuney, M. (2017). 40 Ma
years of hydrothermal W mineralization during the Variscan orogenic evolution of the
French Massif Central revealed by U-Pb dating of wolframite. Mineralium Deposita, 1-
31.
Huang, H.Q., Li, X.H., Li, Z.X., Li, W.X., 2013. Intraplate crustal remelting as the genesis of
Jurassic high-K granites in the coastal region of the Guangdong Province, SE China.
Journal of Asian Earth Sciences 74, 280-302.
Hulsbosch, N., Boiron, M.C., Dewaele, S., Muchez, P., 2016. Fluid fractionation of tungsten
during granite–pegmatite differentiation and the metal source of peribatholitic W quartz
veins: Evidence from the Karagwe-Ankole Belt (Rwanda). Geochimica et
Cosmochimica Acta 175, 299-318.
Jacques, D., Vieira, R., Muchez, P., Sintubin, M., 2017. Transpressional folding and associated
cross-fold jointing controlling the geometry of post-orogenic vein-type W-Sn
mineralization: examples from Minas da Panasqueira, Portugal. Mineralium Deposita,
1-24.
Jiang, Y.H., Jiang, S.Y., Dai, B.Z., Liao, S.Y., Zhao, K.D., Ling, H.F., 2009. Middle to late
Jurassic felsic and mafic magmatism in southern Hunan province, southeast China:
implications for a continental arc to rifting. Lithos 107, 185-204.
Kroner, U., and Romer, R.L., 2010. The Saxo-Thuringian Zone – tip of the Armorican spur and
part of the Gondwana plate. In Pre-Mesozoic Geology of Saxo-Thuringia – From the
Cadomian Active Margin to the Variscan Orogen (eds. U. Linnemann and R. L. Romer).
Schweizerbart, Stuttgart, 371-394.
Kroner, U., and Romer, R.L., 2013. Two plates - many subduction zones: the Variscan orogeny
reconsidered. Gondwana Research 24, 298-329.
Lecumberri-Sanchez, P., Vieira, R., Heinrich, C.A., Pinto, F., Wӓlle, M., 2017. Fluid-rock
interaction is decisive for the formation of tungsten deposits. Geology 45, 579-582.
Legros, H., Marignac, C., Mercadier, J., Cuney, M., Richard, A., Wang, R-C., Charles, N.,
Lespinasse, M-Y., 2016. Detailed paragenesis and Li-mica compositions as recorders
Discussion - Conclusion
385
of the magmatic-hydrothermal evolution of the Maoping W-Sn deposit (Jiangxi, China).
Lithos 264, 108-124.
Li, Z.X., Li, X.H., 2007. Formation of the 1300-km-wide intracontinental orogen and
postorogenic maagmatic province in Mesozoic South China: a flat-slab subduction
model. Geology 35, 179-182.
Li, Z-X., Wartho, J-A., Occhipinti, S., Zhang, C-L., Li, X-H., Wang, J., Bao, C-M., 2007. Early
history of the eastern Sibao Orogen (South China) during the assembly of Rodinia: new
mica 40Ar/39Ar dating and SHRIMP U-PB detrital zircon provenance constraints.
Precambrian Research 159, 79-94.
Lüders, V., Romer, R.L., Gilg, H.A., Bodnar, R.J., Pettke, T., Misantoni, D., 2009. A
geochemical study of the Sweet Home Mine, Colorado Mineral Belt, USA: hydrothermal
fluid evolution above a hypothesized granite cupola. Mineralium deposita 44, 415-434.
Melleton, J., Gloaguen, E., Frei, D., 2015. Rare-elements (Li-Be-Ta-Sn-Nb) magmatism in the
European Variscan Belt, a review. In Proceedings of the 13th Biennial SGA Meeting,
24–27 August 2015, Nancy, France (eds. A. S. André-Mayer, M. Cathelineau, P.
Muchez, E. Pirard and S. Sindern), Vol. 2, 807-810.
Ni, P., Wang, X.D., Wang, G.G., Huang, J.B., Pan, J.Y., Wang, T.G., 2015. An infrared
microthermometric study of fluid inclusions in coexisting quartz and wolframite from
Late Mesozoic tungsten deposits in the Gannan metallogenic belt, South China. Ore
Geology Reviews 65, 1062-1077.
Noronha, F., Vindel, E., López García, J.Á., Dória, A., García García, E., Boiron, M.C.,
Cathelineau, M., 1999. Fluids related to tungsten ore deposits in Northern Portugal and
Spanish Central System: a comparative study. Revista de la Sociedad Geológica de
España 12, 397-403.
Peng, J.T., Zhou, M.F., Hu, R.Z., Shen, N.P., Yuan, S.D., Bi, X.W., Du, A.D., Qu, W.J. 2006.
Precise molybdenite Re-Os and mica Ar-Ar dating of the mesozoic Yaogangxian
tungsten deposit, central Nanling district, South China. Mineralium deposita 41, 661-
670.
Polya, D.A., Foxford, K.A., Stuart, F., Boyce, A., Fallick, A.E., 2000. Evolution and paragenetic
context of low δD hydrothermal fluids from the Panasqueira W-Sn deposit, Portugal:
new evidence from microthermometric, stable isotope, noble gas and halogen analyses
of primary fluid inclusions. Geochimica et Cosmochimica Acta 64, 3357-3371.
Romer, R.L., and Kroner, U., 2015. Sediment and weathering control on the distribution of
Paleozoic magmatic tin-tungsten mineralization. Mineralium Deposita 50, 327-338.
Discussion - Conclusion
386
Romer, R.L., and Kroner, U., 2016. Phanerozoic tin and tungsten mineralization – tectonic
controls on the distribution of enriched protoliths and heat sources for crustal melting.
Gondwana Research 31, 60-95.
Vallance, J., Cathelineau, M., Marignac, C., Boiron, M.C., Fourcade, S., Martineau, F., Fabre,
C., 2001. Microfracturing and fluid mixing in granites: W-(Sn) ore deposition at Vaulry
(NW French Massif Central). Tectonophysics 336, 43-61.
Vindel, E., Lopez, J.A., Boiron, M.C., Cathelineau, M., Prieto, A.C., 1995. P-V-T-X-fO2
evolution from wolframite to sulphide depositional stages in intragranitic W-veins. An
example from the Spanish Central System. European Journal of Mineralogy 7, 675-
688.
Wang, Q.Y., Lu, Y.F., Chen, Z.H., Peng, X.L., Xiong, X.F., 2012. Fluid inclusion characteristic
and its geological implication of the Taoxikeng tungsten deposit, southern Jiangxi
Province. Geology and Mineral Resources of South China 1, 006.
Wang, X., Chen, J., Ren, M., 2016. Hydrothermal zircon geochronology: Age constraint on
Nanling Range tungsten mineralization (Southeast China). Ore Geology Reviews 74,
63-75.
Wang, X., Ren, M., Chen, J., 2017. The muscovite granites: Parental rocks to the Nanling
Range tungsten mineralization in South China. Ore Geology Reviews 88, 702-717.
Wei, W., Hu, R., Bi, X., Peng, J., Su, W., Song, S., Shi, S., 2012. Infrared microthermometric
and stable isotopic study of fluid inclusions in wolframite at the Xihuashan tungsten
deposit, Jiangxi province, China. Mineralium Deposita 47, 589-605.
Wei, W.F., Yan, B., Shen, N.P., Liu, L., Zhang, Y., Xiang, X.K., 2017; Muscovite 40Ar-39Ar
age and H-O-S isotopes of the Shimenshi tungsten deposit (Northern Jiangxi province,
South China) and their metallogenic implications. Minerals 162.
Wilkinson, J.J., 1990. The role of metamorphic fluids in the development of the Cornubian
orefield: fluid inclusion evidence from south Cornwall. Mineralogical Magazine 54, 219-
230.
Wilson, M., Neumann, E.R., Davies, G.R., Timmerman, M.J., Heeremans, M., Larsen, B.T.,
2004. Permo-Carboniferous magmatism and rifting in Europe: introduction. In Permo-
Carboniferous Magmatism and Rifting in Europe (eds. M. Wilson, E. R. Neumann, G.
R. Davies, M. J. Timmerman, M. Heeremans and B. T. Larsen). Geological Society of
London, Special Publications 223, 1-10.
Discussion - Conclusion
387
Yuan, S., Peng, J., Shen, N., Hu, R., Dai, T., 2007. 40Ar-39Ar isotopic dating of the
Xianghualing Sn-polymetallic orefield insouthern Hunan and its geological implications.
Acta geological sinica 81, 278-286 (in Chinese with English abstract).
Zeng, Z., Zhang, Y., Chen, Z., Chen, Y., Zhu, X., Tong, Q., Zheng, B., Zhou, Y., 2011.
Geological characteristics and metallogenic epoch of pangushan W-Bi(Te) ore deposit
in Yudu County, Jiangxi, Province. Mineral deposits 30, 949-958 (in Chinese with
English abstract).
Zhai, W., Sun, X., Wu, Y., Sun, H., Hua, R., Yang, Y., Li, W., Li, S., 2010. SHRIMP U-Pb zircon
ages of buried granodiorite, muscovite 40Ar/39Ar mineralization age and their
geological implications of Meiziwo tungsten deposit, north Guangdong Province, China.
Geological Journal of China Universities 16, 177-185 (in Chinese with English
abstract).
Zhang, S., Chen, Z., Shi, G., Li, L., Qu, W., Li, C., 2011. Re-Os isotopic dating of molybdenite
from dajishan tungsten deposit in Jiangxi province. Mineral deposits 30, 1113-1121 (in
Chinese with English abstract).
Zhang, R-Q., Lu, J-J., Lehmann, B., Li, C., Li, G., Zhang, L., Guo, J., Sun, W., 2017. Combined
zircon and cassiterite U-Pb dating of the Piaotang granite-related tungsten-tin deposit,
southern Jiangxi tungsten district, China. Ore Geology Reviews 82, 268-284
Zhao, K.D. and Jiang S.Y., 2004. Mineral chemistry of the Qitianling granitoid and the Furong
tin ore deposit in Hunan province, south China: Implications for the genesis of granite
and related tin mineralization. EMPGX Symposium Abstract, Lithos 73, S124.
Zhou, X.M., and Li, W.X., 2000. Origin of Late Mesozoic igneous rocks in Southeastern China: implications for lithosphere subduction and underplating of mafic magmas. Tectonophysics 326, 269-287.

List of figures
389
List of figures
Figure 1. Carte de localisation des gisements à tungstène et/ou étain et pegmatites de type
LCT (Li-Cs-Ta), modifié d’après Romer et Kroner (2016). ....................................19
Figure 2. Diagramme binaire indiquant la criticité de différents matériaux en fonction de leur
importance économique et leur risque d'approvisionnement (modifié d'après La
Commission Européenne 2014). ..........................................................................20
Figure 3. Diagrammes représentant la répartition des réserves (USGS, 2017), des pays
producteurs (USGS, 2017) et consommateurs (Vital Metals, 2011) de tungstène.20
Figure 4. Représentation schématique de la morphologie des gisements à W-Sn de type
"veines" (modifié d'après Pirajno, 2009). ..............................................................23
Figure 5. Index de peraluminosité (A = AL-[Na+K+2Ca]) en fonction e l'index de différentiation
(B = Fe+Mg+Ti) d'après le diagramme de Debon et Lefort (1988) et discrimination
es trends de fractionnement magmatiques parmi les roches ignées peralumineuses,
metalumineuses et peralcalines (modifié d’après Cuney, 2014). ..........................24
Figure 6. Données microthermométriques, pression-température et compositionnelles
compilées par Naumov et al. (2011) concernant tout type de gisement à W-Sn et
tout type de minéraux hôtes. ................................................................................27
Figure 7. Représentation des données microthermométriques, pression-température et
compositionnelles interprétées comme représentatives des fluides minéralisateurs
dans des gisements à W-Sn en Chine et dans le Monde, superposé sur la
compilation de Naumov et al., 2011. [1] Wang et al., 2012; [2] Ni et al., 2015 ; [3]
Wei et al., 2012 ; [4] Hu et al., 2012 ; [5] Smith et al., 1996 ; [6] Moura et al., 2014 ;
[7] Davis et Williams-Jones, 1985 ; [8] Bettencourt et al., 2005 ; [9] So et Yun, 1994 ;
[10] Krylova et al., 2012 ; [11] Deen et al., 1994 ; [12] Macey et Harris, 2006 ; [13]
Chicharro et al., 2016, Vindel et al., 1995 ; [14] Pohl et Gunther, 1991 ; [15] Landis
et Rye, 1974 ; [16] Lüders et al., 2009 ; [17] Norohna et al., 1992 ; [18] Beuchat et
al., 2004. ..............................................................................................................28
Figure 8. Répartition des types de minéraux aillant fait l'objet d'études d'inclusions fluides dans
les gisements à W-Sn, d'après les données de Naumov et al. (2011). .................29
Figure 9. Diagramme δD-δ18O simplifié des fluides associés aux gisements à W-Sn dans le
monde (modifié d’après Marignac et Cathelineau, 2009, voir détails dans publication
citée). Les zones grisées indiquent des champs de compositions isotopiques de
fluides analysées dans des inclusions fluides de minéraux de gangue cristallisés
dans des gisements à W-Sn. ................................................................................30
List of figures
390
Figure 10. Maps of the granitic rocks emplaced in the South China Craton between the
Neoproterozoic to the Cretaceous period (modified from Wang Y. et al., 2013). ...38
Figure 11. Map of South China showing the remaining evidences of formations dated from the
Paleoproterozoic to the Neoproterozoic (modified after Zhao J.h and Asimow P.d,
2014) ....................................................................................................................40
Figure 12. Architecture and major faults in the South China Craton (compiled from Yang D.s
et al., 2010; Charvet et al., 1996; Wang Y.j et al., 2013; Wang L.j et al., 2008; Du
Q.d et al., 2013; Li H.h et al., 2014 ; Li X.h et al., 2009 ; Xu X.s et al., 2007). .......47
Figure 13. Compilation of dating results concerning the 880-760 Ma period in the South China
Craton ..................................................................................................................51
Figure 14. Theorical diagrams used to combine bulk-rock and mineralogical analysis. (A) A-B
binary diagram constructed by Debon and Lefort (1983), (B) (QBF)*3 ternary
diagram constructed by de La Roche et al., 1964. ................................................68
Figure 15. Schematic representation of the whole-rock analysis compilation dated between
200 and 165 Ma. See details in Appendix B1. ......................................................70
Figure 16. Schematic representation of the whole-rock analysis compilation dated between
165-150 Ma. See details in Appendix B2. .............................................................72
Figure 17. Schematic representation of the whole-rock analysis compilation dated between
150-110 Ma. See details in Appendix B3. .............................................................74
Figure 18. Schematic representation of the whole-rock analysis compilation dated between
110-70 Ma. See details in Appendix B4 and B5. ...................................................76
Figure 19. (A) Ore mining districts and metal deposits of the Cathaysia Block and (B) detailed
map of the southern part of the Jiangxi Province in South-East China, showing the
distributions of Early Yanshanian granitoids (peraluminous dominant) and Late
Yanshanian granitoids (peralkaline dominant). The Maoping deposit is located in the
Dayu district in the south-western part of the Jiangxi province. (A: modified and
compiled from Sun et al. (2012), Jiang et al. (2006), Mao et al. (2006), Wu et al.
(1993) and Wang and Fan (1987). B: modified after Huang et al., 2014 and
Lecumberri-Sanchez et al., 2014)). ..................................................................... 130
Figure 20. Location (A) and cross-section (B) of the Maoping W-Sn deposit, showing in
particular the relationships between the deep granite, Lower Cambrian host rocks,
greisenized granite and W-Sn rich quartz veins, as well as the sampling zone (-5
level, in green) (modified after Feng et al., 2011). ............................................... 132
Figure 21. Relationships between vein types and paragenetic stages in the Maoping deposit.
(A) Feldspar vein (type I) crystallized at stage I. (B) Transversal section of the
Feldspar vein, showing euhedral K-feldspar crystals. (C) Fe-Li-mica vein (type II)
reopened and filled with quartz from stage III. (D) W-Sn vein (type III) cross-cutting
List of figures
391
the Feldspar vein. (E) W-Sn vein at stage III, cross-cutting a Fe-Li-mica vein. (F)
Banded quartz vein (type IV) showing the centimeter-scale banding of quartz and
Fe-Li-micas at stage IV. (G) Crystallization of the banded quartz vein at stage IV,
invading the W-Sn vein shown in 3E. IMA abbreviations: Qtz = Quartz; Fe-Li-mcs =
Fe-Li-micas; Kfs = K-feldspar; Toz = Topaz; Wf = Wolframite. ............................ 133
Figure 22. Sketches showing the evolution of the veins through time according to the
paragenetic sequence observed at the Maoping deposit. (A) Sketch of a feldspar
vein (type-I), emplaced at stage I. (B) Sketch of a feldspar vein (type-I) cross-cut by
a Fe-Li mica vein (type-II) emplaced at stage II. (C) Sketch of conjugated type-III
veins, emplaced by reopening of a type-II vein during stage III, cross-cutting a type-
I vein. (D) Sketch showing type I to IV veins and the cross-cutting relations between
them. Abbreviations according to the IMA: Qtz = Quartz; Fe-Li-mcs = Fe-Li-micas;
Kfs = K-feldspar; Toz = Topaz; Wf = Wolframite. ................................................ 134
Figure 23. Paragenetic sequence of the Maoping W-Sn deposit based on observations and
sampling conducted in mine gallery at level -5 (i.e. -200 m). See text and previous
figures for details of the different stages, mineral abbreviations and notations. ... 137
Figure 24. Mica textures and associations from the granite, greisen and stages I to III (type I
to type IV veins). (A) Deformed quartz, corroded micas and euhedral feldspars from
the granite (crossed polars). (B) Quartz sub-grains, corroded micas and altered
feldspars from the greisen (crossed polars). (C) Qtz1-I, Toz1-I and Fe-Li-mcs1-I
observed in centimetric Kfs1-I from stage I (type-I vein) (crossed polars). (D)
Feather-like centimetric Fe-Li-mcs2-II and junction with the host rock from stage II
(type-II vein) (cross polars). (E) Complex zoning in the Mn-rich wolframite Wf1-III of
stage III (type-III vein) (natural light). (F) Fe-Li-mcs3-III from stage III associated with
the crystallization of Wf1-III and Cst1-III (crossed polars). Abbreviations according
to the IMA: Ab = albite; Cst = Cassiterite; Fe-Li-mcs = Fe-Li-micas; Fps = feldspars;
Kfs = F-feldspar; Mcs = micas; Qtz = quartz; Toz = topaz; Wf = Wolframite. ...... 139
Figure 25. Mica textures and associations from stages IV to VI (type III and IV veins). (A)
Zoning and rhythmic banding in Fe-Li-mcs4-IV from stage IV (type-IV vein) (SEM).
(B) Sulphide assemblages from Stage VII (SEM). (C) Fe-Li-ms2-VI filling the cavities
of a type-III vein from stage V (crossed polars). (D) Two generations of fluorite (Fl1-
VI and Fl2-VI) from Stage VI (CL). (E) Zoning in Fl2-VI marked by yttrium content,
porosity and abundance of REE minerals (SEM). (F) Overgrowth and zoning
textures in Toz4-VI and Wf1-III in contact with kaolinite (Kln1-VI) (crossed polars).
Abbreviations according to the IMA: Bi = native bismuth; Bmt = Bismuthinite; Ccp =
chalcopyrite; Fe-Li-mcs = Fe-Li-micas; Fe-Li-ms = Fe-Li-muscovite; Fl = fluorite; Gr
List of figures
392
= graphite; Kln = kaolinite; Mlb = molybdenite; Qtz = quartz; Sp = sphalerite; Toz =
topaz; Wf = Wolframite. ...................................................................................... 141
Figure 26. Stage IV banded quartz-Fe-Li-mica veins. (A) Banding in type-V veins highlighted
by Qtz3B,IV, Fe-Li-mcs4-IV and albite (Ab2-IV) (thick section observed under
crossed polars). (B) Close-up view of the banding and corroded quartz surface
composed of an accumulation of quartz and Li-micas. See text for explanation. 143
Figure 27. (A) Compositions of micas plotted on a Monier and Robert (1986) phase diagram
as a function of R3+ (Al), R2+ (Fe+Mg+Mn) and Si (apfu). (B) Compositions of micas
plotted on a Monier and Robert (1986) diagram as a function of R3+ (Al), R2+
(Fe+Mg+Mn) and Li (apfu). The dashed red lines indicate the extensions of the
trends towards the end-members. Trends were drawn to ensure consistency
between the diagrams. Uncorrected data are shown in semi-transparency. See text
for an explanation of the estimations and corrections of the Li content. .............. 145
Figure 28. Discriminant composition diagrams for trioctahedral and dioctahedral micas from
the Maoping W-Sn deposit. (A) F-SiO2 covariation. (B) F and (FeO+MgO+MnO)
diagram. See EPMA data in Table 1. .................................................................. 146
Figure 29. Substitution vectors for the trioctahedral and dioctahedral micas of the Maoping W-
Sn deposit according to Fe, Li, AlVI, Si, Mg, Mn and vacancy (□) content in
tetrahedral and octahedral sites. The data plot along four substitution vectors drawn
on B, which are applicable to each diagram. Abbreviations according to the IMA:
Ann = annite; Ms = muscovite; Pln = polylithionite; Sdp = siderophyllite; Tln =
trilithionite; Znw = zinnwaldite. ............................................................................ 148
Figure 30. Compositions of micas presented in the Tischendorf et al., (1970) empirical diagram
of Fe+Mn+Ti-AlVI vs Mg-Li. Each generation of micas displays an evolution trend
that can be described by using up to four end-member compositions (1) to (4).
Further explanations in the text........................................................................... 150
Figure 31. Compositional profiles of representative micas of stages II, III and IV. For stages II
and III, the transmitted natural light microscopy image, and for stage IV the back-
scattered-electron image, are provided together with profiles of F, SiO2, FeO, MnO,
Al2O3 and MgO. Concentrations are based on EPMA analyses (σF=0.2%wt,
σSiO2=0.6%wt, σFeO=0.8%wt, σMnO=0.2%wt, σAl2O3=1.1%wt, σMgO=0.5%wt).
........................................................................................................................... 151
Figure 32. Trace element binary diagrams for seven generations of Li-micas in the Maoping
deposit (data from LA-ICPMS analysis). (A) W-Sn, B- Ta-Nb, C- W-Li. For each
generation, compositional trends are observed between up to four end-member
compositions (1 to 4), which can easily be related to the four mica end-member
compositions in Fig.12. Further explanations in the text. .................................... 153
List of figures
393
Figure 33. Synthesis of the evolution of Li-micas in the Monier and Robert (1986) phase
diagram as a function of R3+ (Al), R2+ (Fe+Mg+Mn) and Li (apfu). The observed
trends are interpreted to record mixing trends between four fluid end-member
compositions (F1 to F4) reflecting the involvement of both peraluminous and
peralkaline magmatic sources and external fluids. Explanations in the text. ....... 154
Figure 34. (a) Ore mining districts and metal deposits of the Cathaysia Block, (b) Detailed map
of the southern part of the Jiangxi Province, SE China, showing the distribution of
Jurassic and Cretaceous granitoids. The Piaotang deposit is located in the Dayu
district in the south-western part of the Jiangxi province (Modified after Legros et al.
(2016) and references therein). .......................................................................... 168
Figure 35. Simplified geological map (a) and cross-section with associated strikes (b) of the
Piaotang W-Sn deposit, showing the relationships between the deep granite,
Cambrian host rocks, and mineralized veins and the sampling levels ((a) modified
after Tanelli 1982 and (b) modified after Ni et al., 2015). .................................... 171
Figure 36. Mineralized veins as observed in the mine galleries at different levels of sampling.
(a) Wolframite-cassiterite-quartz vein. (b) Fluorite-cassiterite-quartz vein. (c)
Accumulated sulphides in the vein. (d) Fluorite accumulation in the vein. ........... 175
Figure 37. Paragenetic sequence of veins in the Piaotang W–Sn deposit based on petrographic
observations of samples from mine galleries at levels 268, 388 and 556. See text for
details of the different stages, mineral abbreviations and notations. ................... 176
Figure 38. Microphotographs of the mineralogical textures and associations of the Piaotang
deposit. (a) Micrograined-granite with porphyritic feldspar and biotite (crossed
polars). (b) Slightly deformed quartz grains and corroded muscovite from the greisen
(crossed polars). Thin-section in (c) natural light and (d) crossed polars of the main
minerals that crystallized in stage I (Cst1-I, Wf1-I, Qtz1-I and Fe-Li-mca), showing the
multiple crack-seal episodes observed in quartz and wolframite. Abbreviations
according to the IMA: Ab = albite; Cst = cassiterite; Mca = micas; Or = orthoclase;
Qtz = quartz; Wf = wolframite. ............................................................................ 178
Figure 39. Microphotographs of the mineralogical textures and associations of the Piaotang
deposit. (a) Alteration of Wf1-I into Sch1-I followed by the crystallization of associated
Chl1-II, Fl1-II and Clb1-II during stage II (SEM). (b) Textures of stage II retromorphosis
of wolframite into scheelite associated with early stage I minerals (crossed polars).
(c) Alteration of early stage I Toz1-I by Fe-Li-mca4-III in stage III (crossed polars). (d)
Spherulites of chlorite that crystallized during the stage II (SEM). (e) Microcracks
lining the Ccp1-IV boundary with inclusions of Cst3-III, Wf2-III, Stn1-III, and symplectic
textures observed between Ccp1-III, Sp1-III and Stn1-III (SEM). (f) Association of the
second generation of Wf2-III with Fl2-III and Fe-Li-mca4-III in stage III (SEM). (g)
List of figures
394
Association of a third generation of cassiterite Cst3-III and Stn1-III to stage IV sulphides
(SEM) replacing second stage chlorite Chl1-II. (h) Texture and association of Ccp1-III,
Sp1-III, Gln1-IV, Bmt1-IV, Bi1-IV in stage IV (SEM). Abbreviations according to the IMA:
Bi = native bismuth; Bmt = bismuthinite; Ccp = chalcopyrite; Chl = chlorite; Clb =
Colombo-tantalite; Cst = cassiterite; Fl = fluorite; Gln = galena; Mca = micas; Mlb =
molybdenite; Py = pyrite; Qtz = quartz; Sch = scheelite; Sp = sphalerite; Stn =
stannite Toz = topaz; Wf = wolframite. ................................................................ 180
Figure 40. Detailed study of an altered Fe-Li-mca1-I spherolite into Fe-Li-mca4-III. The chemical
profiles show the oscillatory changes in composition during alteration. All elements
are presented as apfu values, calculated from EPMA data. ................................ 184
Figure 41. Compositions of micas plotted on a Monier and Robert (1986) phase diagram as a
function of R3+ (Al), R2+ (Fe+Mg+Mn) and Si (apfu). Each generation of micas from
the veins, granite and greisen displays an evolution trend that can be described
using end-member compositions from (a) to (h) and be compared to similar
published data from the Maoping deposit (Legros et al., 2016). See discussion
section for explanations. ..................................................................................... 185
Figure 42. Trace element binary diagrams for three generations of micas from the veins, the
granite and the greisen in the Piaotang deposit (data from LA-ICPMS analysis). The
chosen binary diagrams aim to unravel the behavior of different metals observed in
trace amounts in micas and separate the evolution of each generation. “Fxx” refer to
fluids identified in the discussion section (see text for further explanation). The
granite mica data have been removed from (e) and (f) binary diagrams for better
visibility. .............................................................................................................. 187
Figure 43. (a) Zoning in stage II chlorites and an example of the spatial distribution of analytical
points across the zoning (SEM). (b) Compositional profiles corresponding to
chemical variations in FeO and MgO along the transect shown in (a) (EMPA data).
(c) Octahedral Al (apfu) vs. tetrahedral Al (apfu) in stage II and stage III chlorites
(EMPA data). The line corresponds to the Tschermak line. (d) Distribution of
temperature determined by chlorite graphical thermometry (Cathelineau and
Bourdelle, 2015) and plotted in a T-R2+-Si diagram............................................. 193
Figure 44. Fluid inclusion data plotted on a binary salinity vs. homogenization temperature
diagram after Ni et al., (2015), Wang et al., (2008) and Zeng et al., (2002). ....... 199
Figure 45. Geological and geographical context of the Maoping and Piaotang deposits
(modified after Legros et al., 2016). (A) Location of mineral deposits and Cretaceous
and Jurassic granitoids of the Cathaysia Block. Most W-Sn deposits from the
Cathaysia Block are located in the Nanling metallogenic belt, here indicated in
orange, and associated with Jurassic and Cretaceous granitoids. The southern
List of figures
395
Jiangxi Province is outlined in red (B) Location of mining districts, associated
minerals deposits and Cretaceous and Jurassic granitoids from the southern part of
the Southern Jiangxi Province. The Southern Jiangxi Province is the richest part of
the Nanling metallogenic belt in term of W-Sn resources. The Maoping and Piaotang
deposits are located in the Dayu district in the western part of the Southern Jiangxi
Province. ............................................................................................................ 217
Figure 46. Location and schematic cross-sections and sampling levels of the studied deposits
showing the relationships between the deep Jurassic granites, Cambrian host rocks,
and W-Sn quartz veins. (A) Maoping deposit (Modified after Feng et al., 2011 and
Legros et al., 2016), located near the Tiangmenshan granite. The Maoping granite
is thought to be the North-plunging extension of this granite (Feng et al., 2011). (B)
Piaotang deposit (Modified after Ni et al., 2015 and Legros et al., 2017), located near
the Xihuashan deposit and granite. Similarly to the Maoping deposit, the Piaotang
deposit exhibits a greisen cupola on the field that could not be defined properly
enough in this work to modify the corss-section of Ni et al., (2015). .................... 220
Figure 47. Paragenetic sequence of the Maoping W-Sn deposit based on samples from the
mine gallery at level -5 (i.e. -200 m), only level drawn on the previous cross-section.
Details about different stages and petrographic descriptions are provided in Legros
et al. (2016). Minerals indicated in color (here, quartz, wolframite, cassiterite, fluorite
and topaz) have been chosen for this fluid inclusion study. Colors are in accordance
with Fig. 8 to 12. ................................................................................................. 222
Figure 48. Textural characterization of the minerals selected for FI study according to their
respective stages for the Maoping deposit as described by Legros et al. (2016). (A)
W-Sn vein (Stage III). (B) Association of Qtz2-III with Cst1-III and Fe-Li-mca3-III (Stage
III) (cross polars). (C) Complex growth-zones in the Mn-rich wolframite Wf1-III (Stage
III) (natural light). (D) Complex growth zones in the cassiterite Cst1-III of stage III
(natural light). (E) Banded quartz vein (Stage IV) showing the centimeter-scale
banding of quartz and Fe-Li-micas. (F) Stage IV banded quartz (thick section
observed under crossed polars). (G) Two generations of fluorite (Fl1-VI and Fl2-VI) from
Stage VI (CL). (H) Overgrowth and growth-zone textures in Toz4-VI and Wf1-III in
contact with kaolinite (Kln1-VI) (crossed polars). Abbreviations according to the IMA:
cst = cassiterite, fl = fluorite, kln = kaolinite, mca = mica, qtz = quartz, toz = topaz,
wf = wolframite. .................................................................................................. 224
Figure 49. Paragenetic sequence of the Piaotang W-Sn deposit based on observations on
samples from in mine galleries at three levels (-268, -388 and -556 m). Details about
different stages and petrographic descriptions are provided in Legros et al. (2017).
List of figures
396
Minerals in color (wolframite, quartz, cassiterite and fluorite) have been chosen for
this FI study. Colors are in accordance with Fig. 8 to 12. .................................... 225
Figure 50. Textural characterization of the minerals selected for FI study according to their
respective stages as described by Legros et al. (2017) for the Maoping deposit. (A)
Wolframite-cassiterite-quartz vein from Stage I. (B) Fluorite-cassiterite-quartz vein,
where fluorite is late and belongs to Stage II. (C) Whole thin-section observed in
natural light. (D) Same whole thin-section as in (C) observed with crossed polars.
The main minerals crystallizing on stage I (Cst1-I, Wf1-I, Qtz1-I and Fe-Li-mca) show
complex relationships. Abbreviations according to the IMA: cst = cassiterite, fl =
fluorite, mca = mica, qtz = quartz, wf = wolframite. ............................................. 226
Figure 51. Petrography and phase filling of FIs studied at the Maoping and Piaotang deposits
at room temperature. FIs from Maoping are shown in (A) to (I). FIs from Piaotang
are shown in (J) to (N). (A) Two-phase liquid (Laq) + vapor (Vaq) aqueous FI as
isolated irregular inclusions and intragranular FIPs (dotted red lines) in Qtz2-III.
Detailed view on the isolated FI is shown in the inset. (B) Intragranular FIPs (dotted
red lines) of two-phase liquid (Laq) + vapor (Vaq) aqueous FI and isolated irregular
three-phase liquid H2O (Laq) + liquid CO2 (LCO2)+ vapor CO2 (VCO2) aquo-carbonic
FI in Qtz2-III. Detailed view on the isolated FI is shown in the inset. (C) Intragranular
FIPs of two-phase liquid (Laq) + vapor (Vaq) aqueous FI and isolated irregular one-
phase liquid (Laq) aqueous FI in Qtz2-III. Detailed view on the isolated FI is shown in
the inset. (D) Two-phase liquid (Laq) + vapor (Vaq) aqueous FIs as isolated regular
inclusion parallel to growth zones and intragranular FIPs oblique to the growth zones
in Cst1-III. Detailed view on the isolated FI is shown in the inset. (E) Two-phase liquid
(Laq) + vapor (Vaq) aqueous FI as isolated irregular inclusions and intragranular FIP
in Wf1-III. Detailed view on an isolated FI is shown in the inset. (F) Two-phase liquid
(Laq) + vapor (Vaq) aqueous FI as isolated negative crystal-shape inclusions and
intragranular FIP in Qtz4-IV. Detailed view on the isolated FI is shown in the inset. (G)
Two-phase liquid (Laq) + vapor (Vaq) aqueous FI as isolated regular inclusions and
intragranular FIP displayed parallel to the growth zone in Fl1-VI. Detailed view on the
FI is shown in the inset. (H) Two-phase liquid (Laq) + vapor (Vaq) aqueous FI as
isolated regular inclusions and intragranular FIP displayed along a Toz4-VI growth
zones. Detailed view on the FI is shown in the inset. (I) Two-phase liquid (Laq) +
vapor (Vaq) aqueous FI as isolated regular inclusions and intragranular FIP displayed
along the Fl2-VI growth zones. Detailed view on the FI is shown in the inset. (J) Two-
phase liquid (Laq) + vapor (Vaq) aqueous FI as isolated irregular inclusions and
intragranular FIP in Qtz1-I. Detailed view on the FI is shown in the inset. (K) One-
phase liquid (Laq) aqueous FI as isolated irregular inclusions and intragranular FIP
List of figures
397
in Qtz1-I. (L) Two-phase liquid (Laq) + vapor (Vaq) aqueous FI as isolated regular
inclusions displayed along the Wf1-I c-axis and in secondary FIP crossing the Wf1-I c-
axis. Detailed view on the FI is shown in the inset. (M) Two-phase liquid (Laq) + vapor
(Vaq) aqueous FI as isolated regular inclusions displayed along a Cst1-I growth zones
and secondary FIP crossing the Cst1-I growth zones. Detailed view on the FI is
shown in the inset. (N) Two-phase liquid (Laq) + vapor (Vaq) aqueous FI as isolated
regular inclusions and intragranular FIP in Fl1-II. Detailed view on the FI is shown in
the inset. Abbreviations according to the IMA: cst = cassiterite, fl = fluorite, qtz =
quartz, toz = topaz, wf = wolframite. ................................................................... 234
Figure 52. Microthermometric and Raman spectrometry data on two-phase aqueous FIs for
the Maoping and Piaotang deposits. (A) Binary salinity vs. homogenization
temperature diagram for Maoping FIs at all stages in quartz, cassiterite and
wolframite from the W-Sn mineralized stage III, quartz crystallized in the banded
quartz veins on stage IV and fluorite and topaz in late stage VI. Possible fluid end-
members are indicated. Serrated sides of the boxes indicate the direction along
which the exact position of the actual end-member is uncertain. (B) Binary salinity
vs. homogenization temperature diagram for Piaotang FIs at all stages in quartz,
cassiterite and wolframite from the silicate-oxide mineralizing stage I and late fluorite
from the carbonate stage II. Possible fluid end-members are indicated. Serrated
sides of the boxes indicate the direction along which the exact position of the actual
end-member is uncertain. (C) Gas concentrations obtained by Raman spectrometry
on in the vapor phase of FIs in quartz and cassiterite of stage III at Maoping and
cassiterite from stage I at Piaotang (no gases detected in quartz) represented in
ternary diagram showing relative molar proportions of CO2, CH4 and N2. ........... 238
Figure 53. Calculated isochores for representative homogenization temperature ranges for FIs
from the different minerals studied for the Maoping and Piaotang deposits, and their
intersection with possible thermal gradients assuming hydrostatic conditions. (A)
Qtz2-III, Wf1-III and Cst1-III of stage III the Maoping deposit. (B) Qtz4-IV of stage IV the
Maoping deposit. (C) Fl1-VI, Toz4-VI and Fl2-VI of the late stage VI of the Maoping
deposit. (D) Qtz1-I, Wf1-I, Cst1-I and Fl1-II of stages I and II of the Piaotang deposit.
Wet-saturated solidus of granitic magmas after Vigneresse et al. (1995). ........... 239
Figure 54. Major and trace element concentrations in FIs from the Maoping and Piaotang
deposits as determined by LA-ICPMS analysis. All concentrations are expressed in
ppm. (A) Qtz2-III, (B) Cst1-III, (C) Qtz4-IV, (D) Fl1-VI, (E) Toz4-VI and (F) surroundings
from the Maoping deposit. (G) Qtz1-I, (H) Cst1-I and (I) Fl1-II from the Piaotang deposit.
Each symbol represents a single ablated fluid inclusion. Color symbols are
List of figures
398
calculated values above the LODs. Empty symbols represent the LODs when the
element was considered undetected. ................................................................. 243
Figure 55. Selected element concentrations relationships from LA-ICPMS analyses of fluid
inclusions from the Maoping and Piaotang deposits. Each symbol represents a
single ablated fluid inclusion. (A) Na-K-Li ternary diagram. The compositions are
calculated as a function of their respective concentrations expressed in ppm. Lines
indicating equal values for K:Na and Li:Na molar ratios (1:1 and 1:10) are plotted in
grey. (B) and (C) Na vs. Li and Na vs. K concentration diagrams. Lines indicating
equal values for K:Na and Li:Na molar ratios (1:1 and 1:10) are plotted in grey. (D)
K/Rb vs. Cs concentrations diagram where K/Rb is expressed as a function of the
respective concentrations as expressed in ppm. ................................................ 244
Figure 56. Stable isotopes (O, H) data for minerals and fluids from the Maoping and Piaotang
deposits. (A) Oxygen isotopic compositions of minerals (empty symbols) and
calculated equilibrium compositions for fluids according to temperature estimates
from FIs isochores. (B) Hydrogen isotopic compositions of FIs. (C) Extracted
temperature estimates from isochores. Fe-Li-micas are interpreted as co-
precipitating with Qtz2-III and Cst1-III at the Maoping deposit (D) Binary δD vs. δ18O
diagram for the fluids from Maoping and Piaotang. Compositions of metamorphic
waters and felsic magmatic waters after Sheppard (1994). The greys box represents
possible local meteoric water. Dashed grey lines indicate possible mixing trends
between magmatic fluids and meteoric waters. The arrow illustrates the possible
evolution of the magmatic fluid end-member with time. ...................................... 245
Figure 57. Ore mining districts and metal deposits of the Cathaysia Block (A) with zoom on the
southern part of the Jiangxi Province (B), South-East China. The distribution of
Jurassic (peraluminous dominant) and Cretaceous (peralkaline dominant) granitoids
is shown in different grey tones. The Maoping deposit is located in the Dayu district
in the south-west of the Jiangxi province. (A- Modified and compiled from Sun et al.
(2012), Jiang et al. (2006), Mao et al. (2006), Wu et al. (1993) and Wang and Fan
(1987). B- Modified after Huang et al., 2014 and Lecumberri-Sanchez et al., 2014).
........................................................................................................................... 270
Figure 58. Location (A) and cross-section (B) of the Maoping W-Sn deposit, showing in
particular, the relationships between the deep granite, Lower Cambrian host rocks,
greisenized granite and W-Sn rich quartz veins, as well as the sampling zone (-5
level, in green) (modified after Feng et al., 2011b). ............................................. 273
Figure 59. Relationship between vein types and paragenetic stages at the Maoping deposit.
(A) Fe-Li-mica veins reopened and filled with Stage III quartz. (B) W-Sn vein at Stage
III, cross-cutting Fe-Li-micas vein. (C) W-Sn vein cross-cutting the Feldspar vein.
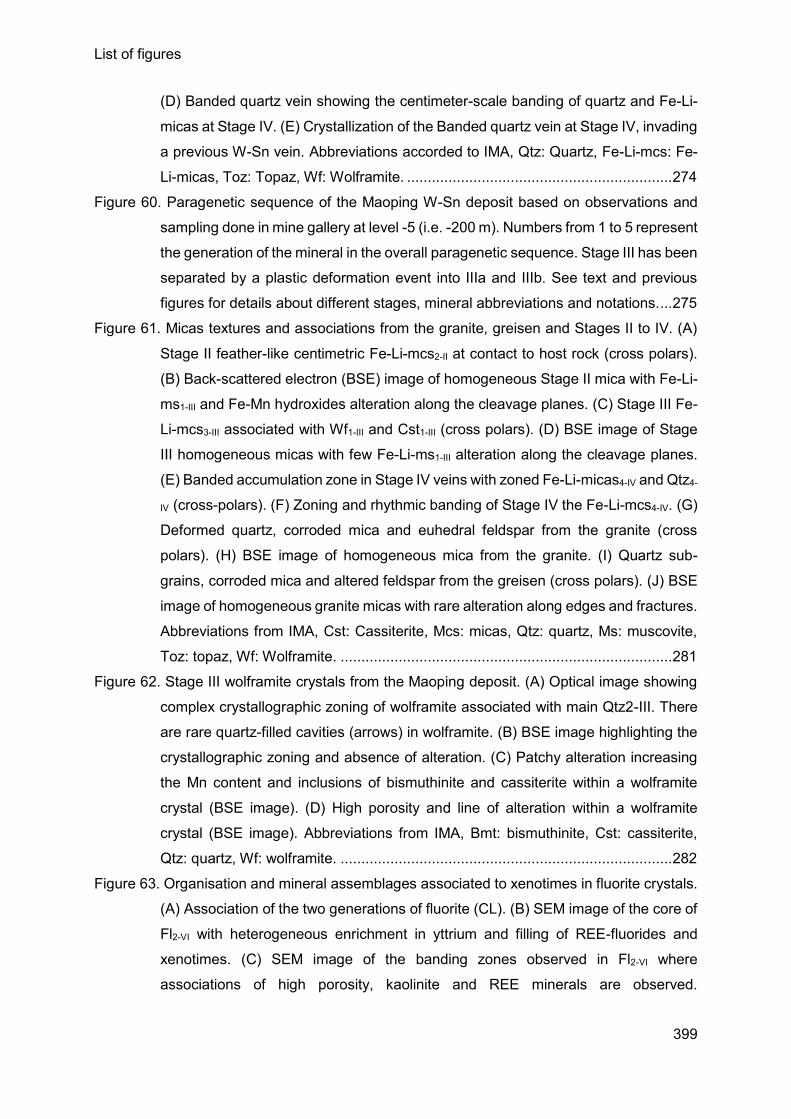
List of figures
399
(D) Banded quartz vein showing the centimeter-scale banding of quartz and Fe-Li-
micas at Stage IV. (E) Crystallization of the Banded quartz vein at Stage IV, invading
a previous W-Sn vein. Abbreviations accorded to IMA, Qtz: Quartz, Fe-Li-mcs: Fe-
Li-micas, Toz: Topaz, Wf: Wolframite. ................................................................ 274
Figure 60. Paragenetic sequence of the Maoping W-Sn deposit based on observations and
sampling done in mine gallery at level -5 (i.e. -200 m). Numbers from 1 to 5 represent
the generation of the mineral in the overall paragenetic sequence. Stage III has been
separated by a plastic deformation event into IIIa and IIIb. See text and previous
figures for details about different stages, mineral abbreviations and notations. ... 275
Figure 61. Micas textures and associations from the granite, greisen and Stages II to IV. (A)
Stage II feather-like centimetric Fe-Li-mcs2-II at contact to host rock (cross polars).
(B) Back-scattered electron (BSE) image of homogeneous Stage II mica with Fe-Li-
ms1-III and Fe-Mn hydroxides alteration along the cleavage planes. (C) Stage III Fe-
Li-mcs3-III associated with Wf1-III and Cst1-III (cross polars). (D) BSE image of Stage
III homogeneous micas with few Fe-Li-ms1-III alteration along the cleavage planes.
(E) Banded accumulation zone in Stage IV veins with zoned Fe-Li-micas4-IV and Qtz4-
IV (cross-polars). (F) Zoning and rhythmic banding of Stage IV the Fe-Li-mcs4-IV. (G)
Deformed quartz, corroded mica and euhedral feldspar from the granite (cross
polars). (H) BSE image of homogeneous mica from the granite. (I) Quartz sub-
grains, corroded mica and altered feldspar from the greisen (cross polars). (J) BSE
image of homogeneous granite micas with rare alteration along edges and fractures.
Abbreviations from IMA, Cst: Cassiterite, Mcs: micas, Qtz: quartz, Ms: muscovite,
Toz: topaz, Wf: Wolframite. ................................................................................ 281
Figure 62. Stage III wolframite crystals from the Maoping deposit. (A) Optical image showing
complex crystallographic zoning of wolframite associated with main Qtz2-III. There
are rare quartz-filled cavities (arrows) in wolframite. (B) BSE image highlighting the
crystallographic zoning and absence of alteration. (C) Patchy alteration increasing
the Mn content and inclusions of bismuthinite and cassiterite within a wolframite
crystal (BSE image). (D) High porosity and line of alteration within a wolframite
crystal (BSE image). Abbreviations from IMA, Bmt: bismuthinite, Cst: cassiterite,
Qtz: quartz, Wf: wolframite. ................................................................................ 282
Figure 63. Organisation and mineral assemblages associated to xenotimes in fluorite crystals.
(A) Association of the two generations of fluorite (CL). (B) SEM image of the core of
Fl2-VI with heterogeneous enrichment in yttrium and filling of REE-fluorides and
xenotimes. (C) SEM image of the banding zones observed in Fl2-VI where
associations of high porosity, kaolinite and REE minerals are observed.
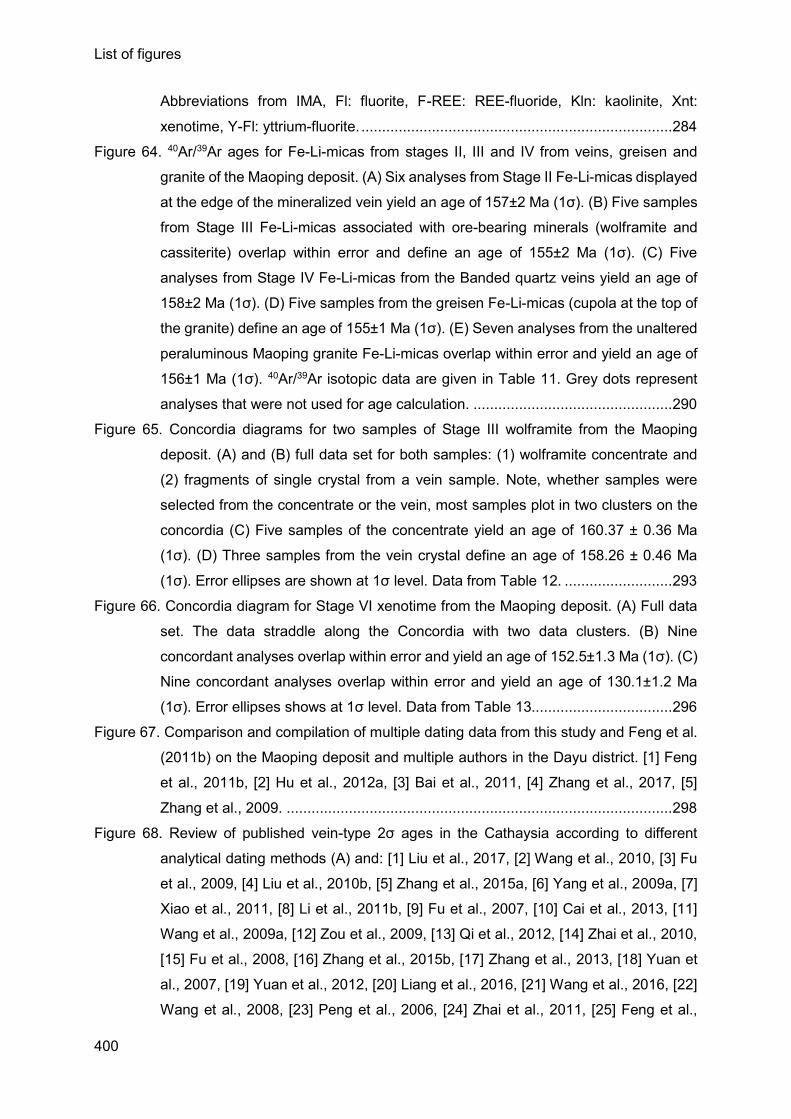
List of figures
400
Abbreviations from IMA, Fl: fluorite, F-REE: REE-fluoride, Kln: kaolinite, Xnt:
xenotime, Y-Fl: yttrium-fluorite. ........................................................................... 284
Figure 64. 40Ar/39Ar ages for Fe-Li-micas from stages II, III and IV from veins, greisen and
granite of the Maoping deposit. (A) Six analyses from Stage II Fe-Li-micas displayed
at the edge of the mineralized vein yield an age of 157±2 Ma (1σ). (B) Five samples
from Stage III Fe-Li-micas associated with ore-bearing minerals (wolframite and
cassiterite) overlap within error and define an age of 155±2 Ma (1σ). (C) Five
analyses from Stage IV Fe-Li-micas from the Banded quartz veins yield an age of
158±2 Ma (1σ). (D) Five samples from the greisen Fe-Li-micas (cupola at the top of
the granite) define an age of 155±1 Ma (1σ). (E) Seven analyses from the unaltered
peraluminous Maoping granite Fe-Li-micas overlap within error and yield an age of
156±1 Ma (1σ). 40Ar/39Ar isotopic data are given in Table 11. Grey dots represent
analyses that were not used for age calculation. ................................................ 290
Figure 65. Concordia diagrams for two samples of Stage III wolframite from the Maoping
deposit. (A) and (B) full data set for both samples: (1) wolframite concentrate and
(2) fragments of single crystal from a vein sample. Note, whether samples were
selected from the concentrate or the vein, most samples plot in two clusters on the
concordia (C) Five samples of the concentrate yield an age of 160.37 ± 0.36 Ma
(1σ). (D) Three samples from the vein crystal define an age of 158.26 ± 0.46 Ma
(1σ). Error ellipses are shown at 1σ level. Data from Table 12. .......................... 293
Figure 66. Concordia diagram for Stage VI xenotime from the Maoping deposit. (A) Full data
set. The data straddle along the Concordia with two data clusters. (B) Nine
concordant analyses overlap within error and yield an age of 152.5±1.3 Ma (1σ). (C)
Nine concordant analyses overlap within error and yield an age of 130.1±1.2 Ma
(1σ). Error ellipses shows at 1σ level. Data from Table 13.................................. 296
Figure 67. Comparison and compilation of multiple dating data from this study and Feng et al.
(2011b) on the Maoping deposit and multiple authors in the Dayu district. [1] Feng
et al., 2011b, [2] Hu et al., 2012a, [3] Bai et al., 2011, [4] Zhang et al., 2017, [5]
Zhang et al., 2009. ............................................................................................. 298
Figure 68. Review of published vein-type 2σ ages in the Cathaysia according to different
analytical dating methods (A) and: [1] Liu et al., 2017, [2] Wang et al., 2010, [3] Fu
et al., 2009, [4] Liu et al., 2010b, [5] Zhang et al., 2015a, [6] Yang et al., 2009a, [7]
Xiao et al., 2011, [8] Li et al., 2011b, [9] Fu et al., 2007, [10] Cai et al., 2013, [11]
Wang et al., 2009a, [12] Zou et al., 2009, [13] Qi et al., 2012, [14] Zhai et al., 2010,
[15] Fu et al., 2008, [16] Zhang et al., 2015b, [17] Zhang et al., 2013, [18] Yuan et
al., 2007, [19] Yuan et al., 2012, [20] Liang et al., 2016, [21] Wang et al., 2016, [22]
Wang et al., 2008, [23] Peng et al., 2006, [24] Zhai et al., 2011, [25] Feng et al.,
List of figures
401
2011b, [26] Zeng et al., 2011, [27] Mao et al., 2013 [28] Zhang et al., 2011, [29] Feng
et al., 2015, [30] Huang et al., 2011, [31] Liu et al., 2011, [32] Feng et al., 2011a,
[33] Liu et al., 2008, [34] Zhang et al., 2009, [35] Zhang et al., 2017, [36] Guo et al.,
2011a, [37] Hu et al., 2012a, [38] Bai et al., 2011. (B) Probability diagram of all ages
from W-Sn vein-type deposits collected in the literature and zoom (C) on the 130-
170 Ma most productive period........................................................................... 302
Figure 69. Imaging in reflected light of grains of columbo-tantalite analyzed in this study. .. 332
Figure 70. SEM imaging of grains of columbo-tantalite analyzed in this study. ................... 333
Figure 71. Electron Micro-Probe analysis of columbo-tantalite samples plotted in the four
quadrant of the columbite diagram. .................................................................... 334
Figure 72. Concordia diagrams for four samples of columbo-tantalite from the Ivory Coast
dated by ID-TIMS. (A) Six samples from the CT1 ferrotapiolite sample yield an age
of 2046.8 ± 1.1 Ma (2σ). (B) Six samples from the CT3 ferrotapiolite sample yield an
age of 2053.2 ± 1.3 Ma (2σ). (C) Five samples from the CT4 ferrotapiolite sample
yield an age of 2044.5 ± 1.6 Ma (2σ). (D) Five samples from the ISSIA2 ferrotapiolite
sample show the example of a metamict sample. ............................................... 336
Figure 73. Concordia diagrams for six samples of columbo-tantalite from Rwanda, Altai, China
and France dated by ID-TIMS. (A) Four samples from the Rongi ferrocolumbite
sample yield an age of 931.5 ± 2.5 Ma (2σ). (B) Four samples from the Buranga
ferrocolumbite sample yield an age of 905.2 ± 3.2 Ma (2σ). (C) Six samples from the
NT-2 ferrotantalite sample yield an age of 372.0 ± 2.3 Ma (2σ). (D) Three samples
from the A-1 ferrotantalite sample yield an age of 198.3 ± 1.4 Ma (2σ). (E) Six
samples from the NP2 ferrotantalite sample yield an age of 380.3 ± 2.4 Ma (2σ). (F)
Four samples from the CC1716 ferrocolumbite sample yield an age of 326.3 ± 0.6
Ma (2σ). .............................................................................................................. 343
Figure 74. 206Pb/238U vs UO/U pairs of measured samples according to their chemical
composition. Each group can be defined by a linear relation corresponding to the
SIMS calibration line. This line depends on the composition and of age of the
samples. ............................................................................................................. 345
Figure 75. Concordia diagrams for two samples of Ferrotapiolite CT3 and CT4 calculated with
CT1 as external standard. (A) Thirty-six measurements of the CT3 ferrotapiolite
sample yield an age of 2050.8 ± 3.4 Ma (1σ). (B) Ten measurements of the CT4
ferrotapiolite sample yield an age of 2042.3 ± 4.0 Ma (1σ). Concordia diagrams for
two samples of Ferrocolumbite Buranga and CC1716 calculated with Rongi as
external standard. (C) Fifteen measurements of the Buranga ferrocolumbite sample
yield an age of 901.0 ± 5.4 Ma (1σ). (D) Twelve measurements of the CC1716
ferrocolumbite sample yield an age of 333.8 ± 2.0 Ma (1σ). (E) Concordia diagram
List of figures
402
of the NT-2 Ferrotantalite calculated with NP2 as external standard and yielding an
age of 372.8 ± 5.6 Ma (1σ). ................................................................................ 347
Figure 76. Schematic representation of fluid-rock interaction processe involved at Panasqueira
deposit (Portugal). Wf = wolframite, Ms = muscovite, Tour = tourmaline, Qtz = quartz.
(From Lecumberri-Sanchez et al., 2017) ............................................................ 370
Figure 77. 3D diagram of the geodynamical settings during the Jurassic period and more
precisely at ca. 160 Ma, in the South China Block (modified after Li and Li, 2007;
Legros et al., 2016 and Zhao et al., 2017) .......................................................... 375
Figure 78. Wolframite U-Pb ages obtained in the FMC in comparison to the ages of the
principal tectono-metamorphic and magmatic episodes (modified after Harlaux, et
al., 2017 and references therein) ........................................................................ 377
List of tables
403
List of tables
Table 1. Selected representative major oxide contents from EPMA analyses and calculated
structural formulas for micas from each stage, greisen and granite. Li2O contents
were calculated following Tischendorff et al., (1997), using equations (1) and (2).
Values preceded by the symbol ‘<’ indicate element concentrations below the limit of
detection. .............................................................................................................. 147
Table 2. Selected representative LA-ICP-MS analyses of trace elements in micas from each
vein, greisen and granite. Y, Zr, Nd and U were also analyzed but were below the
detection limit. ....................................................................................................... 152
Table 3. Selected major oxide contents from EPMA analyses and calculated structural
formulae for micas from each stage, granite and greisen. Li2O contents were
calculated using Tischendorff et al. (1997). Values preceded by the symbol ‘<’ indicate
element concentrations below the limit of detection. ............................................. 186
Table 4. LA-ICPMS analyses of trace elements in micas from three generations in veins,
granite and greisen. Zr, U, Y, and REE were also analyzed but were systematically
below 1 ppm. ........................................................................................................ 188
Table 5. Electron microprobe analyses of chlorites from the Piaotang mineralized veins
sampled at the level -388 m. Values preceded by the symbol ‘<’ indicate element
concentrations below the limit of detection. ........................................................... 192
Table 6. Petrography, Raman Spectrometry and microthermometry data on fluid inclusions
from the Maoping and Piaotang deposits. Values in parentheses indicate modes.237
Table 7. LA-ICPMS measurements performed on fluid inclusions from the Maoping and
Piaotang deposits. Values preceded by a < symbol stand for element concentrations
below the limit of detection. ................................................................................... 241
Table 8. Stable isotopes (O, H) results on minerals and fluids from the Maoping and Piaotang
deposits. ............................................................................................................... 246
Table 9. EMPA analyses of wolframite samples. Values preceded by the "<" symbol are below
the detection limit. ................................................................................................. 283
Table 10. EMPA analyses of xenotime samples. Values preceded by the "<" symbol are below
the detection limit. ................................................................................................. 286
Table 11. 40Ar/39Ar analytical data for Fe-Li-micas from Stages II, III and IV, greisen and granite
from the Maoping deposit. .................................................................................... 288
Table 12. U-Pb analytical results (ID-TIMS) for wolframite from the main W-Sn vein from the
Maoping deposit, Jiangxi (China) .......................................................................... 292
Table 13. U-Pb-Th analytical data (LA-ICPMS) for xenotime from Stage VI of the Maoping
deposit. ................................................................................................................. 295
List of tables
404
Table 14. Representative EPMA analyses for columbo-tantalites ....................................... 331
Table 15. U-Pb ID-TIMS analytical results for columbo-tantalites ....................................... 339

Résumé
Le tungstène est défini comme “ressource minérale critique” par la Commission Européenne. La province de Jiangxi, située au sud-est de la Chine, dans le bloc Cathaysia, représente 90 % des réserves en tungstène chinoises. Ce travail est basé sur l’étude des gisements hydrothermaux à W-Sn de Maoping et Piaotang, tous deux situés dans le district de Dayu (sud de la province de Jiangxi). Cette thèse a permis de (i) développer des traceurs pétrographiques et minéralogiques de processus minéralisateurs à travers des études paragénétiques détaillées et la géochimie des micas lithinifères et donc d’apporter un modèle impliquant des fluides multiples se chevauchant dans le temps et associés à plusieurs épisodes distincts de mise en place de minéralisations en métaux rares, (ii) définir par l’étude d’inclusions fluides deux processus fluides comme seul responsables de la précipitation de la minéralisation dans ces gisements « géants » : la différenciation magmatique de granites peralumineux et des processus de mélange, et (iii) de développer des approches de datation associés à ces systèmes montrant que la minéralisation en tungstène se met en place aux alentours de 160 Ma, antérieurement à la plupart des âges obtenus sur les minéraux de gangue datés dans cette zone et défini alors une remise à zéro majeure des systèmes isotopiques par de multiples circulations fluides entre 150 et 155 Ma. De plus, les stades post-minéralisations ont pu être définis pour la première fois et révèlent l’implication de magmatisme peralcalin impliqué dans la précipitation de minéralisations à Nb-Ta-Y-REE aux alentours de 130 Ma. A la lumière de cette observation, cette thèse s’est aussi tournée vers le développement de méthodes de datation in situ sur columbo-tantalite.
Abstract
Tungsten is defined as a “critical mineral resource” by the European Commission. The Jiangxi province, located in the southeastern part of China, in the Cathaysia block, represents 90% of the Chinese tungsten resources. This work is based on the study of the Maoping and Piaotang W-Sn hydrothermal deposits located in the Dayu district (southern Jiangxi). This thesis managed to (i) develop mineralogical and petrological tracers of ore-forming processes through detailed paragenetic sequences and geochemistry of Li-micas and shows that multiple overlapping fluids associated to several and distinct rare-metal mineralizing stages, (ii) distinguish by fluid inclusions studies that peraluminous magmatic differentiation and mixing processes are the only prequisite for the formation of these giant deposits, and (iii) develop dating approaches associated to these systems to demonstrate that the W mineralization formed at ca. 160 Ma, prior to most ages obtained on gangue minerals in the area, defining a major resetting of isotopic systems due to multiple fluid circulations around 150-155 Ma. Moreover, post-“silicate-oxide” stages have been defined for the first time and reveal the implication of peralkaline new fluid sources involved in the precipitation of Nb-Ta-Y-REE minerals at ca. 130 Ma. In the light of these results, this thesis gives new developments for in situ direct dating of ore-bearing minerals such as columbo-tantalite.