LEGO Product Design and Manufacturing Simulations for ...
15
LEGO Product Design and Manufacturing Simulations for Engineering Design and Systems Engineering Education The MIT Faculty has made this article openly available. Please share how this access benefits you. Your story matters. Citation Grogan, Paul and de Weck, Olivier. 2019. "LEGO Product Design and Manufacturing Simulations for Engineering Design and Systems Engineering Education." ASEE Annual Conference and Exposition, Conference Proceedings. As Published 10.18260/1-2--33056 Publisher ASEE Conferences Version Final published version Citable link https://hdl.handle.net/1721.1/137206 Terms of Use Article is made available in accordance with the publisher's policy and may be subject to US copyright law. Please refer to the publisher's site for terms of use.
-
Upload
khangminh22 -
Category
Documents
-
view
1 -
download
0
Transcript of LEGO Product Design and Manufacturing Simulations for ...
LEGO Product Design and Manufacturing Simulations forEngineering Design and Systems Engineering Education
The MIT Faculty has made this article openly available. Please share how this access benefits you. Your story matters.
Citation Grogan, Paul and de Weck, Olivier. 2019. "LEGO Product Design andManufacturing Simulations for Engineering Design and SystemsEngineering Education." ASEE Annual Conference and Exposition,Conference Proceedings.
As Published 10.18260/1-2--33056
Publisher ASEE Conferences
Version Final published version
Citable link https://hdl.handle.net/1721.1/137206
Terms of Use Article is made available in accordance with the publisher'spolicy and may be subject to US copyright law. Please refer to thepublisher's site for terms of use.

Paper ID #25703
LEGO Product Design and Manufacturing Simulations for Engineering De-sign and Systems Engineering Education
Dr. Paul T. Grogan, Stevens Institute of Technology
Paul Grogan is an Assistant Professor in the School of Systems and Enterprises at Stevens Institute ofTechnology. He holds a Ph.D. degree in Engineering Systems (2014) and an S.M. degree in Aeronauticsand Astronautics (2010) from Massachusetts Institute of Technology and a B.S. degree in EngineeringMechanics (2008) from University of Wisconsin-Madison. His research interests develop and study inter-active modeling, simulation, and gaming for collaborative design of infrastructure systems.
Dr. Olivier Ladislas de Weck, Massachusetts Institute of Technology
Olivier de Weck is a Professor of Aeronautics and Astronautics and Engineering Systems at MIT. Hisresearch focuses on the technological evolution of complex systems over time, both on Earth and in Space. He is a Fellow of INCOSE and served as Editor-in-Chief for the Systems Engineering journal from 2013to 2018.
c©American Society for Engineering Education, 2019

LEGO Product Design and Manufacturing Simulations
for Engineering Design and Systems Engineering Education
Abstract
This paper describes a hands-on classroom activity to introduce students to engineering design
and systems engineering concepts by simulating product design and manufacturing processes
using LEGO bricks. Classroom simulations, especially those involving simple physical
components, help to engage students and communicate abstract concepts. The proposed
simulation platform requires modest one-time capital investment, supports real-time data
collection, analysis, and visualization, and can be tailored to suit a variety of educational
objectives and audiences ranging from pre-college to professional education. The activity models
a three-tier vehicle manufacturing logistics system with suppliers, manufacturers, and customers.
A simple software product lifecycle management system implemented using Google Forms and
Google Sheets allows participants to record time-stamped events such as purchases or sales using
phones, tablets, or laptops. Applications focus on specific topics such as product platforms,
commonality, and design for manufacturing where participants experience tradeoffs between
speed and quality, standardization and product variety, monotony and specialization,
manufacturing learning curves, and how to identify and improve bottlenecks in production lines.
1. Introduction
Systems engineering deals with abstract concepts such as requirements, architecture, design
processes, and configuration management. These features make the discipline difficult to
communicate to a broad audience, despite providing critical competencies for the design,
operation, and sustainment of complex products. Engineering education incorporates some
systems-oriented concepts through initiatives such as design and systems thinking [1] and
conceiving-designing-implementing-operating [2], both of which emphasize elements of
synthesis and taking a systems-level perspective in design applications.
Transitioning design-oriented lessons to short-duration classroom activities is challenging due to
long timescales and high costs typically associated with real-world product lifecycles. This paper
introduces a series of hands-on classroom activities to introduce participants to systems
engineering concepts by simulating product design and manufacturing processes using LEGO
bricks. Classroom simulations provide an opportunity for play—“a fun, voluntary activity that
often involves make-believe, invention, and innovation” [3]—that encourages participants to
immerse themselves in a contextual environment, make decisions in pursuit of objectives, and
experiment with the freedom to fail [4].
Applied to systems engineering, classroom simulations, especially those involving physical
artifacts, engage participants and help communicate abstract concepts common in engineering,
product design, manufacturing, and management. Activities also benefit from real-time data
collection, analysis, and visualization using online platforms to strengthen the connection
between educational objectives and activities. LEGO brick-based simulations require modest
capital investment and can be tailored to suit a variety of educational objectives and audiences.

This paper describes two such activities developed by the authors over the past 10 years for
groups of 15 to 60 participants ranging from pre-college to professional education.
2. Background
There is a long history of applying simulations and games for educational purposes [5] including
a reemergence over the past decade coinciding with increasing access to digital and online media
[6]. Part of the educational philosophy behind simulations and games builds on a constructivist
theory that participants create knowledge through action [7]. Games provide a simulated
environment for a participant to experience a problem, test solution strategies, and learn about
their effects in a feedback loop. Other main drivers behind game design include storytelling,
game balance, and directing participants' cognitive load towards learning objectives [8].
Designing games for educational purposes is difficult due to numerous competing dimensions.
Harteveld [9] describes the triadic design principles of reality, meaning, and play. Reality
captures the relationship between the game world and the real world. Meaning highlights the
purpose of a game to meet learning objectives. Finally, play helps engage participants within an
activity by providing enjoyment and fun. Although digital platforms provide an opportunity to
increase realism of learning environments, they may do so at the cost of meaning (confusing or
losing sight of the key learning objective) or play (losing engagement and enjoyment through
over-complicated interfaces or activities). Some researchers have recently returned to low-tech
physical games to help focus research games on the most important issues [10].
In specific domains such as management and supply chain logistics, well-known classroom
activities such as the Beer Distribution Game started using highly-simplified physical forms to
emphasize the key learning objectives [11]. Later computerization considerably reduces the time
required to play without losing key learning objectives [12]. This perspective uses physical
simulations to focus on key learning objectives with technology support to mediate time-
consuming (but not value-added) activities such as record-keeping.
In the engineering domain, LEGO bricks are a dominant form of classroom activities in pre-
college programs focusing on robotics [13]. In systems engineering, LEGO bricks have most
commonly been applied to teach lean principles [14]. In particular, the work of McManus et al.
[15] has been influential to structure the activity discussed herein. The remainder of this paper
focuses on how similar LEGO brick-based simulations can be adapted to multiple learning
applications and how technology platforms can support some of the data collection and analysis
without disrupting the core physical activity of building and managing LEGO brick vehicles.
3. Simulation Platform
This section introduces a LEGO brick-based simulation as a general-purpose platform extensible
to a variety of application cases. This section provides a brief overview of the proposed platform,
introduces necessary physical and software components, and describes a typical game session.

Figure 1. The three-tier logistics system includes suppliers, manufacturers, and customers.
3.1 Platform Overview
The simulation activities model a three-tier manufacturing logistics system in Figure 1 where
student manufacturing teams purchase raw materials from a supplier, assemble LEGO brick
vehicles, and sell completed vehicles to customers subject to a time constraint. The supplier role
is more passive than other roles and can be fulfilled by support staff (i.e. teaching assistants) or
volunteers. In the case of teams larger than seven or eight members, some participants can be
delegated to supplier and customer roles; however, it is recommended to mix members across
teams to avoid conflicts of interest and to rotate roles in between game rounds. Each
manufacturing teams includes four to eight team members who self-organize into specific roles
such as task-specific workers, runners to purchase/sell chassis or vehicles, quality control, etc.
One participant per team serves as a customer for other teams to incentivize truthful quality
inspection when purchasing completed vehicles.
Each team starts with a fixed amount of money at the start of a round and must remain cash
positive which presents a challenge to carefully manage cash flow while maximizing production.
Play money helps to enforce the financial constraints. Teams compete to have the highest
amount of cash on hand at the end of a round, typically timed to about 20-30 minutes, with no
residual value for unsold inventory. Vehicles intended to be sold must identically match a master
or blueprint provided to each team at the start of a round. The customer can reject a sale for any
quality defects such as missing components, misplaced components, or incompletely attached
components. The penalty for non-quality should be quite large as it reflects warranty costs in the
real world which can be very significant [16]. Quality defects can lead either to confiscation,
financial penalty, or return of the vehicle to the manufacturer for warranty service.
3.2 Physical Components: LEGO Brick Vehicles
Vehicles require about 20-40 individual LEGO brick parts and 1-2 person minutes to assemble.
For example, the vehicle in Figure 2 requires 25 parts (16 unique) which model the undercarriage
(one 4x6 chassis, two 1x4 plates with bearings, and four 8x9mm wheels with 14x9mm tires),
front bumper (one 1x2-1x2 bracket with two 1x1 tiles for lights), rear bumper (one 1x2-1x4
bracket with two 1x1 tiles for lights and a 1x2 tile for a license plate), interior (steering wheel
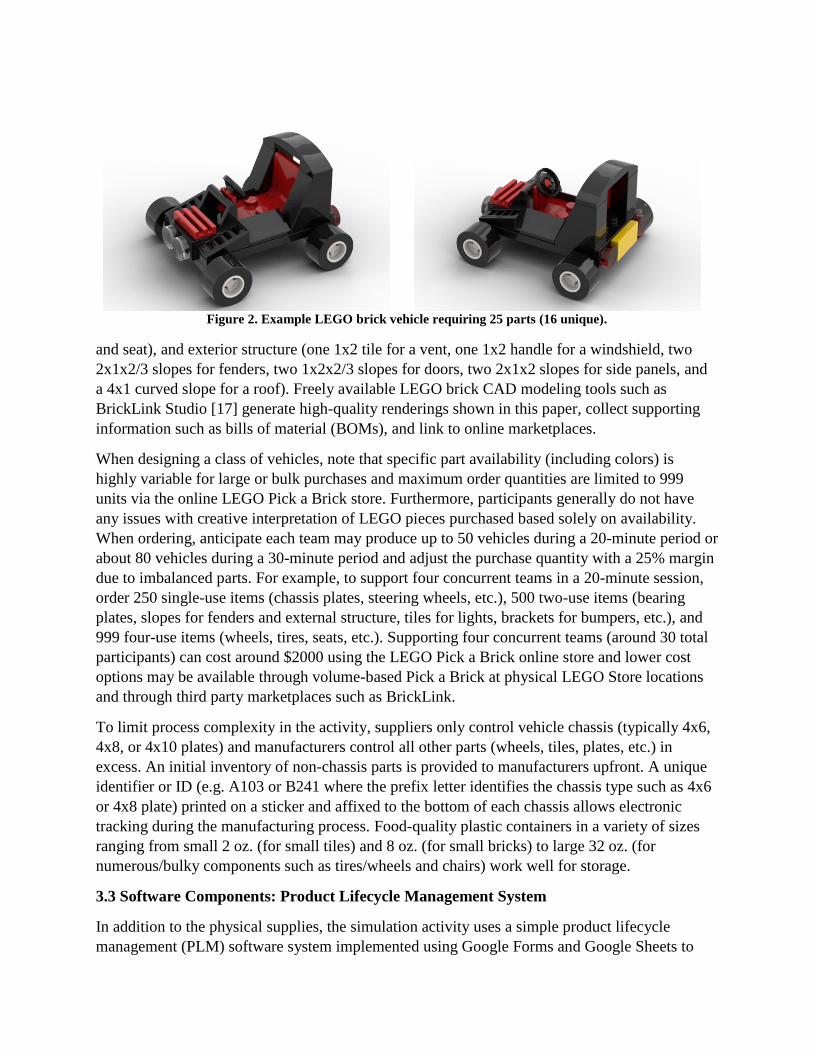
Figure 2. Example LEGO brick vehicle requiring 25 parts (16 unique).
and seat), and exterior structure (one 1x2 tile for a vent, one 1x2 handle for a windshield, two
2x1x2/3 slopes for fenders, two 1x2x2/3 slopes for doors, two 2x1x2 slopes for side panels, and
a 4x1 curved slope for a roof). Freely available LEGO brick CAD modeling tools such as
BrickLink Studio [17] generate high-quality renderings shown in this paper, collect supporting
information such as bills of material (BOMs), and link to online marketplaces.
When designing a class of vehicles, note that specific part availability (including colors) is
highly variable for large or bulk purchases and maximum order quantities are limited to 999
units via the online LEGO Pick a Brick store. Furthermore, participants generally do not have
any issues with creative interpretation of LEGO pieces purchased based solely on availability.
When ordering, anticipate each team may produce up to 50 vehicles during a 20-minute period or
about 80 vehicles during a 30-minute period and adjust the purchase quantity with a 25% margin
due to imbalanced parts. For example, to support four concurrent teams in a 20-minute session,
order 250 single-use items (chassis plates, steering wheels, etc.), 500 two-use items (bearing
plates, slopes for fenders and external structure, tiles for lights, brackets for bumpers, etc.), and
999 four-use items (wheels, tires, seats, etc.). Supporting four concurrent teams (around 30 total
participants) can cost around $2000 using the LEGO Pick a Brick online store and lower cost
options may be available through volume-based Pick a Brick at physical LEGO Store locations
and through third party marketplaces such as BrickLink.
To limit process complexity in the activity, suppliers only control vehicle chassis (typically 4x6,
4x8, or 4x10 plates) and manufacturers control all other parts (wheels, tiles, plates, etc.) in
excess. An initial inventory of non-chassis parts is provided to manufacturers upfront. A unique
identifier or ID (e.g. A103 or B241 where the prefix letter identifies the chassis type such as 4x6
or 4x8 plate) printed on a sticker and affixed to the bottom of each chassis allows electronic
tracking during the manufacturing process. Food-quality plastic containers in a variety of sizes
ranging from small 2 oz. (for small tiles) and 8 oz. (for small bricks) to large 32 oz. (for
numerous/bulky components such as tires/wheels and chairs) work well for storage.
3.3 Software Components: Product Lifecycle Management System
In addition to the physical supplies, the simulation activity uses a simple product lifecycle
management (PLM) software system implemented using Google Forms and Google Sheets to
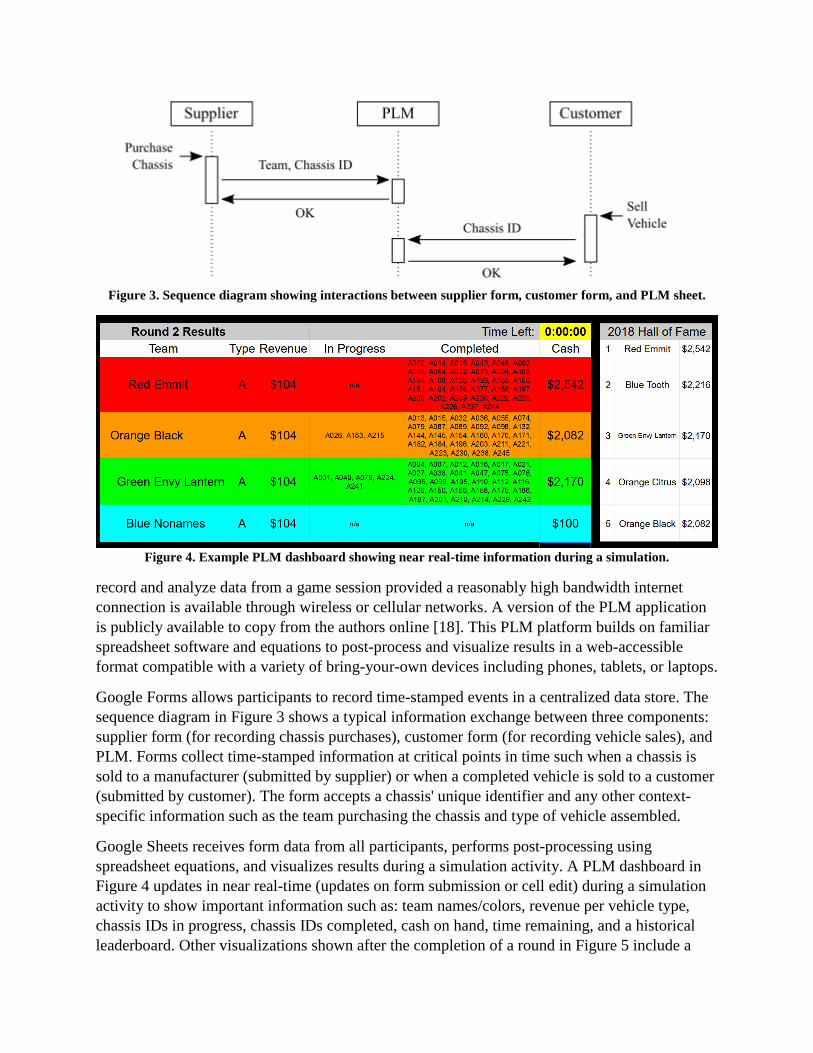
Figure 3. Sequence diagram showing interactions between supplier form, customer form, and PLM sheet.
Figure 4. Example PLM dashboard showing near real-time information during a simulation.
record and analyze data from a game session provided a reasonably high bandwidth internet
connection is available through wireless or cellular networks. A version of the PLM application
is publicly available to copy from the authors online [18]. This PLM platform builds on familiar
spreadsheet software and equations to post-process and visualize results in a web-accessible
format compatible with a variety of bring-your-own devices including phones, tablets, or laptops.
Google Forms allows participants to record time-stamped events in a centralized data store. The
sequence diagram in Figure 3 shows a typical information exchange between three components:
supplier form (for recording chassis purchases), customer form (for recording vehicle sales), and
PLM. Forms collect time-stamped information at critical points in time such when a chassis is
sold to a manufacturer (submitted by supplier) or when a completed vehicle is sold to a customer
(submitted by customer). The form accepts a chassis' unique identifier and any other context-
specific information such as the team purchasing the chassis and type of vehicle assembled.
Google Sheets receives form data from all participants, performs post-processing using
spreadsheet equations, and visualizes results during a simulation activity. A PLM dashboard in
Figure 4 updates in near real-time (updates on form submission or cell edit) during a simulation
activity to show important information such as: team names/colors, revenue per vehicle type,
chassis IDs in progress, chassis IDs completed, cash on hand, time remaining, and a historical
leaderboard. Other visualizations shown after the completion of a round in Figure 5 include a
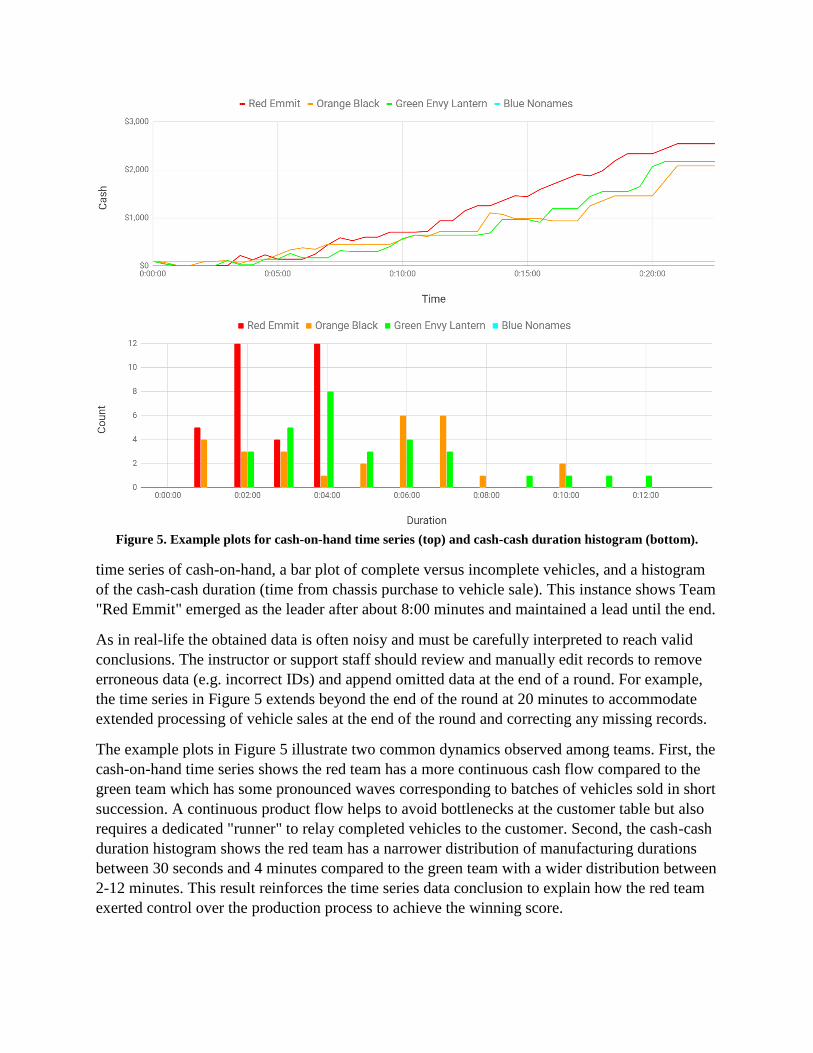
Figure 5. Example plots for cash-on-hand time series (top) and cash-cash duration histogram (bottom).
time series of cash-on-hand, a bar plot of complete versus incomplete vehicles, and a histogram
of the cash-cash duration (time from chassis purchase to vehicle sale). This instance shows Team
"Red Emmit" emerged as the leader after about 8:00 minutes and maintained a lead until the end.
As in real-life the obtained data is often noisy and must be carefully interpreted to reach valid
conclusions. The instructor or support staff should review and manually edit records to remove
erroneous data (e.g. incorrect IDs) and append omitted data at the end of a round. For example,
the time series in Figure 5 extends beyond the end of the round at 20 minutes to accommodate
extended processing of vehicle sales at the end of the round and correcting any missing records.
The example plots in Figure 5 illustrate two common dynamics observed among teams. First, the
cash-on-hand time series shows the red team has a more continuous cash flow compared to the
green team which has some pronounced waves corresponding to batches of vehicles sold in short
succession. A continuous product flow helps to avoid bottlenecks at the customer table but also
requires a dedicated "runner" to relay completed vehicles to the customer. Second, the cash-cash
duration histogram shows the red team has a narrower distribution of manufacturing durations
between 30 seconds and 4 minutes compared to the green team with a wider distribution between
2-12 minutes. This result reinforces the time series data conclusion to explain how the red team
exerted control over the production process to achieve the winning score.

3.4 Simulation Game Session
Putting the physical and software simulation components together, a game session includes a
series of one or more rounds, each approximately one hour in total duration, with individual
sections for introduction, design, build, disassembly, and debriefing. The 20-minute live play
session shown in Figure 5 is a subset of the one-hour round.
The introduction addresses background information specific to the learning objectives and
explains the roles, rules, objectives, and constraints for the simulation activity. Participants split
into teams and pick a unique team name to establish a common identity.
The 10-20-minute design period focuses on the LEGO vehicle(s) to be assembled. Based on the
application, teams either review the master/blueprint or create a new vehicle design using
support tools such as cost models or customer. In addition to product design, teams also consider
process design to identify roles and arrange the workstation or assembly time.
The main body of each simulation round includes a timed period of approximately 20-30 minutes
during which teams manage cash flows and produce vehicles. Starting from an empty production
queue, the first five or ten minutes are typically cash-constrained and emphasize minimizing the
cash-cash time and purchasing as many chassis as possible. After teams enter a steady-state
production process, the focus shifts to quality control and managing continuous product flow.
Depending on the length of this period, teams may learn and adjust their process and achieve a
learning curve effect. Figure 6 shows a clear instance of learning (in this case reflected by two
discrete steps to reduce assembly time across three rounds) which can also be visualized using
the recorded data and discussed during the debriefing period.
Figure 6. Example scatter plot of assembly duration versus vehicle number illustrating learning curve
achieved during LEGO vehicle assembly. Data is noisy as in real-life manufacturing operations.
Towards the end of the time period, teams stop purchasing chassis to minimize the number of
incomplete vehicles. To accommodate large selling queues at the end of a simulation, any
vehicles on the customer table can be considered complete at the end of the building round.
At the end of the timed round, a 20-minute deconstruction and discussion period allows teams to
disassemble completed vehicles and refill component supply stocks. During this time, the
instructor can discuss immediate reflections on outcomes with each team and prepare outcome
metrics. It can also be helpful to appoint neutral peer observers who report out on the dynamics
and strengths and weaknesses. After disassembly is complete, the instructor leads a debriefing
session to congratulate the leading teams and discuss the advantages and disadvantages observed
by each team as pertaining to the learning objectives. Thorough discussion helps to solidify
learning objectives, especially across teams exhibiting different dynamics.
4. Application Cases
This section introduces two applications which build on the simulation platform. The first
application is from a short course on product platform and product family design, focusing on
issues of commonality in product architectures [19]. The second application is from an
introductory industrial and systems engineering module, focusing on the difference between
product and process engineering and introducing concepts of design-for-manufacturing.
4.1 Product Platforms and Commonality
This first simulation application focuses on commonality as a design strategy to enable product
diversity while maintaining process efficiency of a common platform [20]. The activity
nominally proceeds over a series of three or four one-hour rounds.
The first round represents a mass production paradigm where all teams assemble a single
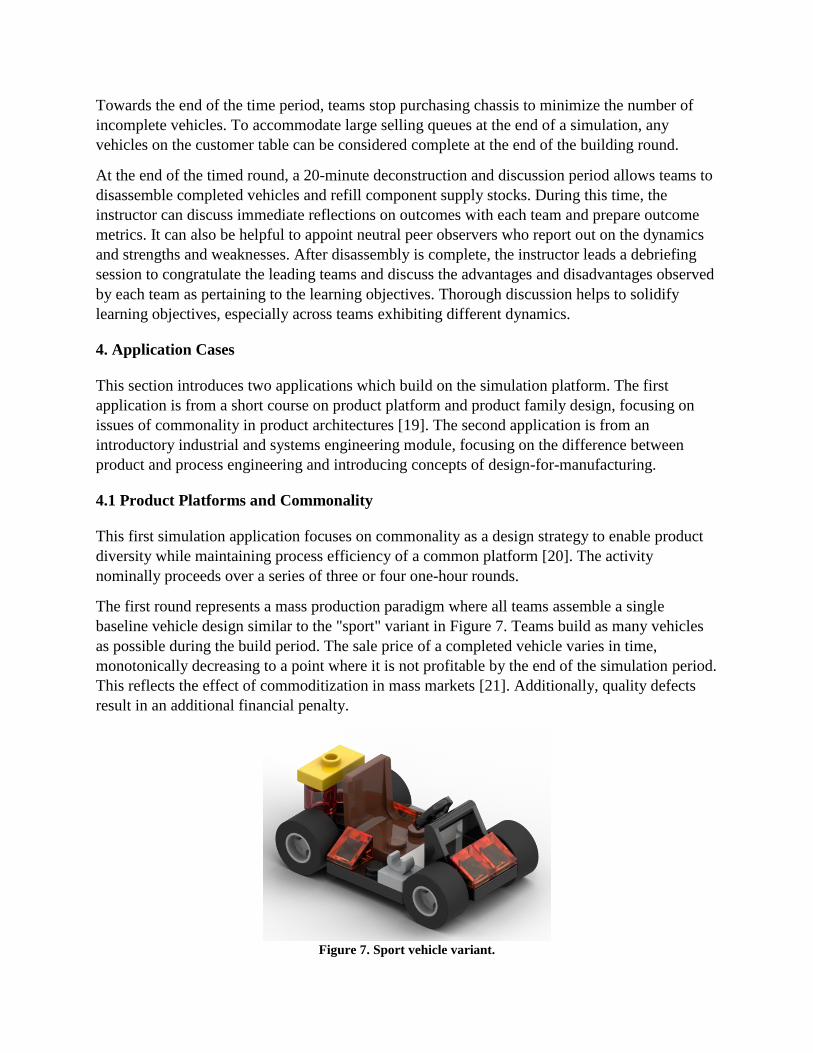
baseline vehicle design similar to the "sport" variant in Figure 7. Teams build as many vehicles
as possible during the build period. The sale price of a completed vehicle varies in time,
monotonically decreasing to a point where it is not profitable by the end of the simulation period.
This reflects the effect of commoditization in mass markets [21]. Additionally, quality defects
result in an additional financial penalty.
Figure 7. Sport vehicle variant.
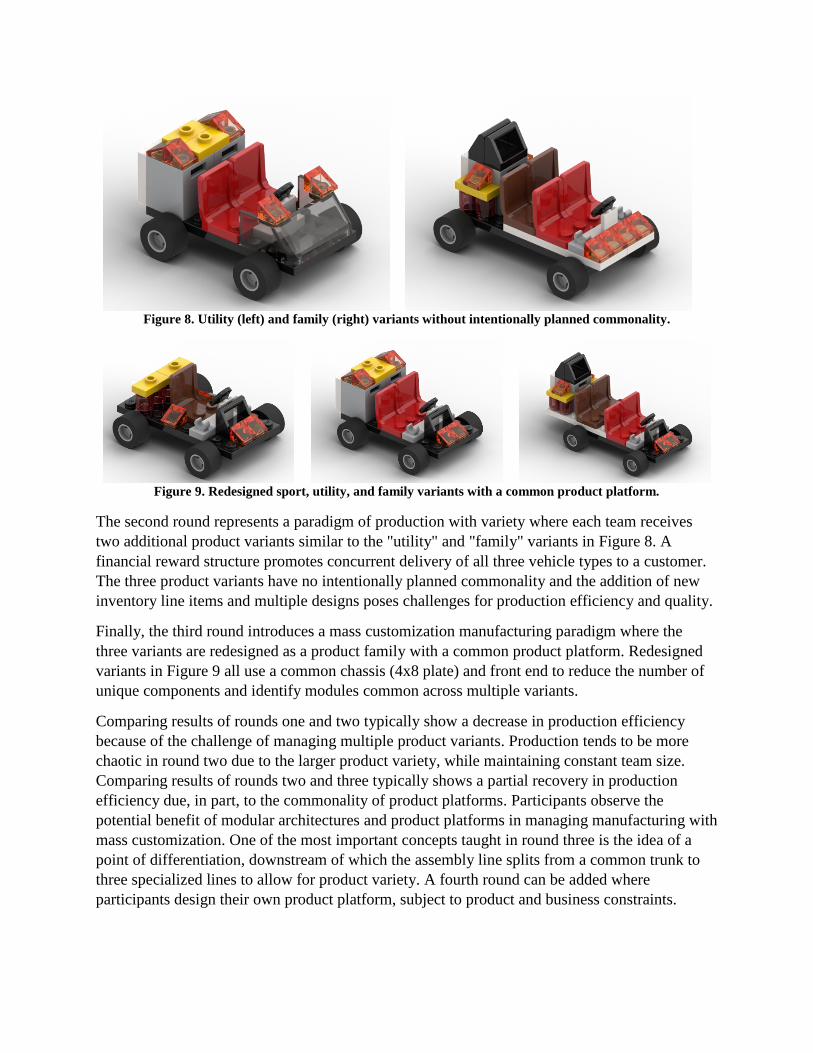
Figure 8. Utility (left) and family (right) variants without intentionally planned commonality.
Figure 9. Redesigned sport, utility, and family variants with a common product platform.
The second round represents a paradigm of production with variety where each team receives
two additional product variants similar to the "utility" and "family" variants in Figure 8. A
financial reward structure promotes concurrent delivery of all three vehicle types to a customer.
The three product variants have no intentionally planned commonality and the addition of new
inventory line items and multiple designs poses challenges for production efficiency and quality.
Finally, the third round introduces a mass customization manufacturing paradigm where the
three variants are redesigned as a product family with a common product platform. Redesigned
variants in Figure 9 all use a common chassis (4x8 plate) and front end to reduce the number of
unique components and identify modules common across multiple variants.
Comparing results of rounds one and two typically show a decrease in production efficiency
because of the challenge of managing multiple product variants. Production tends to be more
chaotic in round two due to the larger product variety, while maintaining constant team size.
Comparing results of rounds two and three typically shows a partial recovery in production
efficiency due, in part, to the commonality of product platforms. Participants observe the
potential benefit of modular architectures and product platforms in managing manufacturing with
mass customization. One of the most important concepts taught in round three is the idea of a
point of differentiation, downstream of which the assembly line splits from a common trunk to
three specialized lines to allow for product variety. A fourth round can be added where
participants design their own product platform, subject to product and business constraints.

4.2 Design for Manufacturing
This second simulation application differentiates between process design as the basis for
industrial engineering and product design as the basis of systems engineering and introduces
design-for-manufacturing as a philosophy to use downstream factors and lifecycle costs to
inform upstream design decisions [22]. The activity nominally proceeds over two rounds.
The first round provides teams with a baseline vehicle design in Figure 2. Like the prior
application case, teams build as many vehicles as possible during the build period; however, sale
prices are fixed for the entire round duration. Teams focus on cashflow management and
manufacturing process improvement during the round.
After the first round, teams propose vehicle design changes to reduce manufacturing effort,
reduce costs, or increase revenue. To support the design activity, participants use a web-
accessible design page hosting a requirements document, cost model, and revenue model to
quantitatively compare design concepts. The example interface in Figure 10 shows the set of
parts for the default vehicle in Figure 2, indicating it uses the type "A" chassis which costs $30,
meets all requirements, and earns $104 in net revenue after costs. Participants input design
decisions to automatically update estimates of product lifecycle cost used in the following round.
The requirements document presents a set of functional requirements to constrain the design
space, largely for safety, similar to the role of a government transportation agency. For example:
there must be at least one seat facing forward, at least two clear lights must be visible from the
front, at least two red lights must be visible from the rear, and only one chassis may be used.
Some requirements may be automatically checked based on a bill of materials (BOM) but others
must be visually inspected by the instructor for each proposed design.
Figure 10. Design model inputs (bill of materials) for the default type A vehicle.
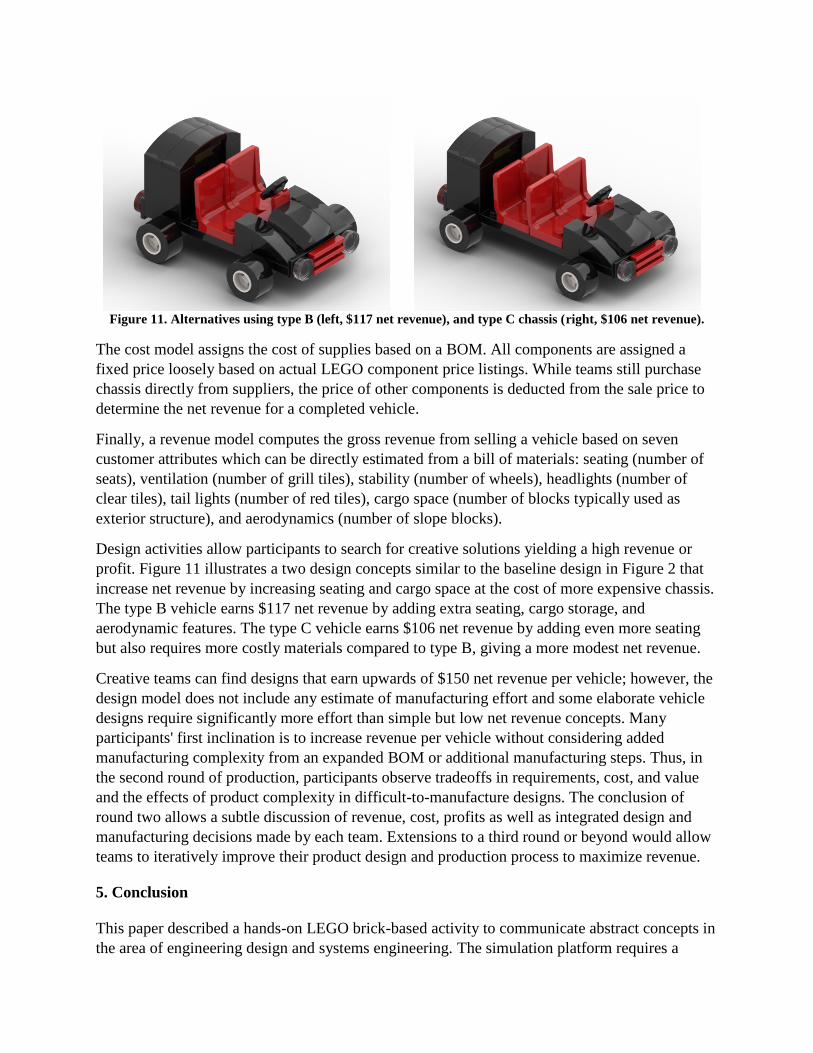
Figure 11. Alternatives using type B (left, $117 net revenue), and type C chassis (right, $106 net revenue).
The cost model assigns the cost of supplies based on a BOM. All components are assigned a
fixed price loosely based on actual LEGO component price listings. While teams still purchase
chassis directly from suppliers, the price of other components is deducted from the sale price to
determine the net revenue for a completed vehicle.
Finally, a revenue model computes the gross revenue from selling a vehicle based on seven
customer attributes which can be directly estimated from a bill of materials: seating (number of
seats), ventilation (number of grill tiles), stability (number of wheels), headlights (number of
clear tiles), tail lights (number of red tiles), cargo space (number of blocks typically used as
exterior structure), and aerodynamics (number of slope blocks).
Design activities allow participants to search for creative solutions yielding a high revenue or
profit. Figure 11 illustrates a two design concepts similar to the baseline design in Figure 2 that
increase net revenue by increasing seating and cargo space at the cost of more expensive chassis.
The type B vehicle earns $117 net revenue by adding extra seating, cargo storage, and
aerodynamic features. The type C vehicle earns $106 net revenue by adding even more seating
but also requires more costly materials compared to type B, giving a more modest net revenue.
Creative teams can find designs that earn upwards of $150 net revenue per vehicle; however, the
design model does not include any estimate of manufacturing effort and some elaborate vehicle
designs require significantly more effort than simple but low net revenue concepts. Many
participants' first inclination is to increase revenue per vehicle without considering added
manufacturing complexity from an expanded BOM or additional manufacturing steps. Thus, in
the second round of production, participants observe tradeoffs in requirements, cost, and value
and the effects of product complexity in difficult-to-manufacture designs. The conclusion of
round two allows a subtle discussion of revenue, cost, profits as well as integrated design and
manufacturing decisions made by each team. Extensions to a third round or beyond would allow
teams to iteratively improve their product design and production process to maximize revenue.
5. Conclusion
This paper described a hands-on LEGO brick-based activity to communicate abstract concepts in
the area of engineering design and systems engineering. The simulation platform requires a
modest one-time cost for LEGO bricks, storage, online PLM system, and play money supplies
which are completely reusable. Lightweight digital components building on common web-
accessible spreadsheet-based data management systems such as Google Forms and Google
Sheets avoid time-consuming record keeping and post-processing and provide near real-time
visual feedback.
Variations of the simulation have been used in pre-college and professional education programs
to meet learning objectives in product platforms and commonality and design-for-manufacturing
applications. Participants experience tradeoffs between speed and quality, standardization and
product variety, monotony and specialization in task assignments, manufacturing learning curves
and the need for identifying and improving bottlenecks in manufacturing flow lines. These
lessons are highly engaging for participants of all ages and give a firsthand experience with good
and bad design decisions without real-world pressures of economic failure or personal losses.
Insights reflect on differing design decisions and levels of performance across competing teams.
Although the authors have not formally studied inter-participant dynamics such as role allocation
or engagement, framing the activity as an informal competition tends to motivate through peer
recognition without requiring any other external incentives. Future work may explore methods to
engage specific populations including underrepresented groups and promote equal participation.
Other areas of improvement include faster or easier input of chassis unique identifiers (e.g.
barcode readers, scanners, or even radio-frequency identification (RFID) chips thus bringing in
aspects of industry 4.0 and the internet-of-things), higher fidelity data collection including
logging individual manufacturing steps, more detailed automated cost and value models to
provide participants with a rich trade space for proposing new designs, and developing new
application cases to study new and emerging issues in engineering design and systems
engineering. There are also opportunities to extend this activity to consider full system lifecycle
properties by formalizing the processes of disassembly and recycling within the scoring of each
round. Overall these sets of active learning activities tend to be highly regarded and highly
scored during class evaluations, provided they are properly executed and tied in with the deeper
more abstract foundational principles.
References
[1] C.L. Dym, A.M. Agogino, O. Eris, D.D. Frey, and L.J. Leifer, "Engineering design thinking,
teaching, and learning," Journal of Engineering Education, vol. 94, no. 1, pp. 103-120, 2005.
[2] E.F. Crawley, J. Malmqvist, S. Östlund, D.R. Brodeur, and K. Edström, Rethinking
Engineering Education: The CDIO Approach (2nd ed.), New York: Springer, 2014.
[3] M. Honey and D.E. Kanter (Eds.), Design, Make, Play: Growing the Next Generation of
STEM Innovators, New York: Routledge, 2013.
[4] E. Klopfer, S. Osterweil, and K. Salen, Moving Learning Games Forward: Obstacles,
Opportunities, and Openness, Cambridge, MA: The Education Arcade, 2009.
[5] C.C. Abt, Serious Games. New York: Viking Press, 1970.
[6] National Research Council, Learning Science through Computer Games and Simulations,
Committee on Science Learning: Computer Games, Simulations, and Education. M.A. Honey

and M.L. Hilton (Eds.). Board on Science Education, Division of Behavioral and Social Sciences
and Education, Washington, D.C: The National Academies Press, 2011.
[7] W.C. Kriz, "A Systemic-Constructivist Approach to the Facilitation and Debriefing of
Simulations and Games," Simulation & Gaming, vol. 41, no. 5, pp. 663-680, 2010.
[8] K. Kiili, "Digital game-based learning: Towards and experiential gaming model," Internet
and Higher Education, vol. 8, no. 1, pp. 15-23, 2005.
[9] C. Harteveld, Triadic Game Design: Balancing Reality, Meaning and Play, London:
Springer, 2011.
[10] S. Meijer, "The Power of Sponges: Comparing High-tech and Low-tech Gaming for
Innovation," Simulation & Gaming, vol. 46, no. 5, pp. 512-535, 2015.
[11] J.D. Sterman, "Modeling Managerial Behavior: Misperceptions of Feedback in a Dynamic
Decision Making Experiment," Management Science, vol. 35, no. 3, pp. 321-339, 1989.
[12] F.R. Jacobs, "Playing the Beer Distribution Game Over the Internet," Production and
Operations Management, vol. 9, no. 1, pp. 31-39, 2000.
[13] S. Brophy, S. Klein, M. Portsmore, and C. Rogers, "Advancing Engineering Education in P-
12 Classrooms," Journal of Engineering Education, vol. 97, no. 3, pp. 369-387, 2008.
[14] F.P. Badurdeen, P. Marksberry, A. Hall, and B. Gregory, "Teaching Lean Manufacturing
with Simulations and Games: A Survey and Future Directions," Simulation & Gaming, vol. 41,
no. 4, pp. 465-486, 2010.
[15] H.L. McManus, E. Rebentisch, E.M. Murman, and A. Stanke, "Teaching Learn Thinking
Principles through Hands-on Simulations," Proceedings of the 3rd International CDIO
Conference, Cambridge, MA, June 11-14, 2007.
[16] D. Fan, D. Geddes, and F. Flory, "The Toyota Recall Crisis: Media Impact on Toyota's
Corporate Brand Reputation," Corporate Reputation Review, vol. 16, no. 2, pp. 99-117, 2013.
[17] BrickLink, "BrickLink Studio 2.0," 2019. [Online]. Available: https://studio.bricklink.com
[18] P.T. Grogan, "Product Lifecycle Management (PLM) Tool," 2019. [Online]. Available:
https://drive.google.com/drive/folders/1Yj2XRAcGzfXGrU_W6lKie76BfqzIzm0u
[19] Massachusetts Institute of Technology, "Product Platform and Product Family Design:
From Strategy to Implementation," Short Course. [Online]. Available:
https://professional.mit.edu/programs/short-programs/product-platform-product-family-design
[20] R.S. Farrell and T.W. Simpson, "Product platform design to improve commonality in
custom products," Journal of Intelligent Manufacturing, vol. 14, no. 6, pp. 541-556, 2003.
[21] F. Alizon, S.B. Shooter, and T.W. Simpson, "Henry Ford and the Model T: Lessons for
product platforming and mass customization," Design Studies, vol. 30, no. 5, pp. 588-605, 2009.
[22] J.W. Hermann, J. Cooper, S.K. Gupta, C.C. Hayes, K. Ishii, D. Kazmer, P.A. Sandborn, and
W.H. Wood, "New Directions in Design for Manufacturing," Proceedings of the ASME 2004
Design Engineering Technical Conferences and Computers and Information in Engineering
Conference, Salt Lake City, UT, September 28-October 2, 2004.