Legal Protection, Corruption and Private Equity Returns in Asia
21
Legal Protection, Corruption and Private Equity Returns in Asia Douglas Cumming Grant Fleming Sofia Johan Mai Takeuchi ABSTRACT. This article examines how private equity returns in Asia are related to levels of legal protection and corruption. We utilize a unique data set comprising over 750 returns to private equity transactions across 20 developing and developed countries in Asia. The data indicate that legal protections are an important determi- nant of private equity returns in Asia, but also that private equity managers are able to mitigate the potential for corruption. The quality of legal system (including legal protections) is positively related to returns. Inefficient legal protections negatively impact transaction structures and economic certainty when exiting investments. We also find that private equity managers, irrespective of the quality of legal system they are operating within, can mitigate the potential impact of corruption. Private equity returns are higher in countries with higher levels of cor- ruption, controlling for legal systems. This finding is consistent with the view that private equity managers bring about organizational change to alleviate the costs of corruption. Our findings are robust to inclusion of con- trols for Hofstede cultural variables, economic conditions, and transaction specific characteristics, as well as consid- eration of econometric sample selection methods for unexited investments. KEY WORDS: corruption, law and finance, buyouts, returns Introduction Institutional capital flows into Asian private equity have increased substantially over the last 10 years. Strong economic growth in Asian economies has encouraged many investors to allocate capital to the region, on the belief that Asian private equity returns will be the same, if not higher, than returns available in developed markets such as the United States or Western Europe (Fleming, 2004). However, Asian private equity markets are, at many levels, still in their infancy and investors are faced with making investment decisions where there is a diverse set of opportunities across financial market structures, legal and political systems, and business culture and lan- guage. While the internationalization of leveraged buyout (LBO) activity has resulted in the transmis- sion of investment practices and financial technology to new markets in Asia, there is as yet little evidence that private equity can be successfully executed over the long term in countries where legal protection is less clear, corruption is more commonplace, and the economic rents from private equity can be expro- priated by the state. This article provides the first quantitative analysis of the relationship between legal protection, cor- ruption, and private equity returns in Asia. Our work is related to a growing body of work consistent with the view that legal protections are important in explaining the size, structure, and success of private equity markets, albeit with some differences in findings depending on datasets examined (Cao and Lerner, 2009; Cumming et al., 2006; Cressy et al., 2007; Johan, 2011; Lerner and Schoar, 2005). 1 However, none of this research considers the interplay between corruption across markets and the financial returns to private equity investments. On one hand, we may conjecture that countries with worse levels of corruption have lower returns to private equity investments due to the economic inefficiencies inherent with corrupt economies. On the other hand, private equity returns may be higher in more corrupt countries as activist private equity funds that bring about organization change in their investees are able to make companies more efficient Journal of Business Ethics (2010) 95:173–193 Ó Springer 2011 DOI 10.1007/s10551-011-0853-6 123 57 Reprinted from the journal
Transcript of Legal Protection, Corruption and Private Equity Returns in Asia

Legal Protection, Corruption and Private
Equity Returns in Asia
Douglas CummingGrant Fleming
Sofia JohanMai Takeuchi
ABSTRACT. This article examines how private equity
returns in Asia are related to levels of legal protection and
corruption. We utilize a unique data set comprising over
750 returns to private equity transactions across 20
developing and developed countries in Asia. The data
indicate that legal protections are an important determi-
nant of private equity returns in Asia, but also that private
equity managers are able to mitigate the potential for
corruption. The quality of legal system (including legal
protections) is positively related to returns. Inefficient
legal protections negatively impact transaction structures
and economic certainty when exiting investments. We
also find that private equity managers, irrespective of the
quality of legal system they are operating within, can
mitigate the potential impact of corruption. Private equity
returns are higher in countries with higher levels of cor-
ruption, controlling for legal systems. This finding is
consistent with the view that private equity managers
bring about organizational change to alleviate the costs of
corruption. Our findings are robust to inclusion of con-
trols for Hofstede cultural variables, economic conditions,
and transaction specific characteristics, as well as consid-
eration of econometric sample selection methods for
unexited investments.
KEY WORDS: corruption, law and finance, buyouts,
returns
Introduction
Institutional capital flows into Asian private equity
have increased substantially over the last 10 years.
Strong economic growth in Asian economies has
encouraged many investors to allocate capital to the
region, on the belief that Asian private equity returns
will be the same, if not higher, than returns available
in developed markets such as the United States or
Western Europe (Fleming, 2004). However, Asian
private equity markets are, at many levels, still in
their infancy and investors are faced with making
investment decisions where there is a diverse set of
opportunities across financial market structures, legal
and political systems, and business culture and lan-
guage. While the internationalization of leveraged
buyout (LBO) activity has resulted in the transmis-
sion of investment practices and financial technology
to new markets in Asia, there is as yet little evidence
that private equity can be successfully executed over
the long term in countries where legal protection is
less clear, corruption is more commonplace, and the
economic rents from private equity can be expro-
priated by the state.
This article provides the first quantitative analysis
of the relationship between legal protection, cor-
ruption, and private equity returns in Asia. Our
work is related to a growing body of work consistent
with the view that legal protections are important in
explaining the size, structure, and success of private
equity markets, albeit with some differences in
findings depending on datasets examined (Cao and
Lerner, 2009; Cumming et al., 2006; Cressy et al.,
2007; Johan, 2011; Lerner and Schoar, 2005).1
However, none of this research considers the
interplay between corruption across markets and the
financial returns to private equity investments. On
one hand, we may conjecture that countries with
worse levels of corruption have lower returns to
private equity investments due to the economic
inefficiencies inherent with corrupt economies. On
the other hand, private equity returns may be higher
in more corrupt countries as activist private equity
funds that bring about organization change in their
investees are able to make companies more efficient
Journal of Business Ethics (2010) 95:173–193 � Springer 2011DOI 10.1007/s10551-011-0853-6
12357Reprinted from the journal

and mitigate the economic costs of corruption,
thereby facilitating higher returns. We provide a
direct test of these competing hypotheses, made
possible with an international sample of Asian private
equity investments spanning 21 years (1989–2009)
and 20 countries.
Our empirical analysis begins with the first
comprehensive description of the financial returns to
Asian LBOs and growth investments by geography
and type of exit. We compare and contrast the key
features of these returns to those available in the
United States and European markets. We then
present evidence on governance and operational
change in Asian private equity transactions. Finally,
we explicitly test our hypotheses on corruption, legal
protection and private equity returns. Our results
show that legal protections are an important deter-
minant of private equity returns in Asia, but also that
private equity managers are able to mitigate the
potential for corruption. The quality of legal system
(including legal protections) is positively related
to returns. Inefficient legal protections negatively
impact transaction structures and economic cer-
tainty when exiting investments, thereby negatively
impacting returns. We also find that private equity
managers, irrespective of the quality of legal system
they are operating within, can mitigate the potential
impact of corruption. We find that private equity
returns are higher in countries with higher levels of
corruption, controlling for legal systems. This find-
ing is consistent with the view that private equity
managers bring about organizational change to
alleviate the costs of corruption, thereby generating
higher returns. Both findings are robust to inclusion
of controls covering economic conditions, Hofstede
cultural factors, and transaction specific characteris-
tics. As well, we consider econometric sample
selection methods for unexited investments.
Our analysis contributes to the growing literature
on ethics, corruption, private equity, and leverage
buyouts. While there have been comparatively few
papers on this topic, there are related studies exam-
ining institutional investment in socially responsible
private equity funds (Cumming and Johan, 2007), as
well as the ethics of private equity fund relationships
with investee firms (Filatochev et al., 1994; Houston
and Howe, 1997; Jones and Hunt, 1991; Schadler
and Kahns, 1990). Prior work has not, however,
considered the role of private equity funds in
alleviating corruption and how these actions impact
on financial returns. Our paper also adds to the
international comparative literature on private equity
(see Cumming et al., 2006, 2007; Kaplan and
Stromberg, 2009; Wright, 2007b; Wright et al.,
2003, 2005).
The article is organized as follows. The first sec-
tion develops testable hypotheses. The second and
third sections describe the institutional context for
Asian private equity and our dataset. Multivariate
empirical tests follow the presentation of the data
and summary statistics. The last section provides
a discussion of future research and concluding
remarks.
Testable hypotheses
In this article, we focus on two central hypotheses
relating to how private equity returns are potentially
influenced by the level of legal protections in an
economy and levels of corruption. We also identify
control factors which have been shown to impact
private equity returns (and which are important to
consider in empirical tests).
There is a developed body of literature which
examines how legal institutions impact economic
growth and equity returns. The literature categorizes
countries by differences in law quality, such as the
efficiency of the judiciary and adherence to the rule
of law, enforcement of contracts and legal structures
that matter for private equity transactions. Under the
‘‘law matters’’ view (La Porta et al., 1998b), coun-
tries with better legal environments enable private
equity funds to more efficiently provide advice and
effect organization change to bring about higher
returns in their investee firms. This is the basis of our
first hypothesis.
The law and finance factors (based on La Porta
et al., 1998a, b) include the efficiency of the judicial
system, the rule of law, risk of expropriation, risk of
contract repudiation, and shareholder rights. These
various rights deal with the substantive content of
laws pertaining to investing and the likelihood and
quality of their enforcement. Because the index
values for different substantive areas of law are highly
collinear, we focus on a weighted average Legality
Douglas Cumming et al.
123 58 Reprinted from the journal

index in our regressions. We expect that Legality
matters for buyout returns for a number of reasons.
Higher legality implies stronger investor protection,
and therefore a more active stock market which
affords an exit outcome for venture capital deals.
Furthermore, better legal conditions facilitate better
enforcement of private equity contracts, and help to
alleviate information asymmetry between transacting
parties, both at the time of initial investment and at
the time of exit (consistent with La Porta et al.,
1998a, b). Private equity funds see to maximize re-
turns, and new owner(s) will pay more when
information asymmetries are lowest, which is in
countries with better legal conditions. IPOs are
more likely in countries with better legal conditions,
and buybacks are more likely in countries with
worse legal conditions (Cumming et al., 2006).
Therefore, all else being equal, higher returns are
expected in countries with better legal conditions.
Hypothesis 1: Buyout returns are higher in countries
with superior law quality.
While legal systems may matter, it is also possible
that private equity managers can mitigate the
potential costs of inefficient legal systems (and thus
the likelihood of expropriation of rents) by actively
changing the governance and incentive structures
inside private companies. This hypothesis is based on
the argument that private equity funds are active
investors which seek to generate absolute returns in
excess of those available through public equity
investments. An important part of the private equity
investment process is initiating, where possible,
organizational change in their investee firms with a
view to increasing profitability, enterprise value,
and equity returns (Gompers and Lerner, 1999;
Cumming and Johan, 2009). As a result, active pri-
vate equity fund managers that bring about organi-
zational change in their investees can alleviate the
expected costs of corruption in a country and
thereby generate higher returns than that which
would otherwise would be expected (Cressy et al.,
2007; Cumming, 2008; Nikoskelainen and Wright,
2007). By contrast, non-active private equity funds
that do not bring about organizational change to
alleviate the expected costs of corruption would
likely experience lower returns in countries with
higher levels of corruption.
Hypothesis 2: Buyout returns are higher in countries
with higher levels of corruption.
In effect, the positive association between cor-
ruption and private equity returns is a test of the
extent to which private equity funds are able to
mitigate the expected costs of corruption through
changing the organizational and governance arrange-
ment inside the firm.2
A number of other transaction specific factors can
influence private equity returns. First, it is natural to
expect that the actual changes brought about in the
organization post investment, such as further
acquisitions or divestitures, will influence returns.
Second, the ownership held by the private equity
fund, and relatedly, the extent of leverage in the
transaction, might influence returns (Nikoskelainen
and Wright, 2007). Third, whether or not the pri-
vate equity fund syndicates the deal with other pri-
vate equity funds could affect returns through either
greater value added provided by the syndicate and/
or improved deal selection. Fourth, whether or not
the management team is replaced by the private
equity fund manager could influence returns. Each
of these and other deal specific items might be
endogenous to expected returns as, for example, the
decision to syndicate in the first place depends on the
expected profits from the investment. In our
empirical tests, we consider these possibilities
and robustness to including or excluding these
variables.
In assessing private equity returns, it is also
important to consider both exited and unexited
investments. Private equity funds are limited part-
nerships that last for 10–13 years. Investments often
take anywhere from 2–7 years to come to fruition
for sale in an IPO, acquisition, management buyback
or write-off. Private equity funds might sell their
better investments earlier on in their life-cycle in
order to fund raise for their follow-on funds
(Cumming and Walz, 2010). As such, in empirically
assessing realized private returns, we control for the
non-random decision to exit an investment in the
first place. These econometric methods and control
variables used in our empirical analyses of our test-
able hypotheses are described in detail below after
we explain the institutional context in which the
data are derived and provide summary statistics from
the dataset.
Legal Protection, Corruption and Private Equity Returns in Asia
12359Reprinted from the journal
Institutional context: the Asian buyout
market
Our study draws upon data from Asian private equity
transactions over the last 20 years, covering a period of
rapid change in the nature and structure of the market.
Therefore, it is important to chart broad changes in
Asian private equity as background to our empirical
tests. The development of the Asian LBO market can
be charted from the mid-to-late 1990s when private
equity firms successfully raised dedicated pools of
capital to attempt control-oriented investments in
private companies in the region. Prior to this, the first
wave of buyouts in the US (and then Europe) did not
spill over to the Asian region to any great degree
(Kaplan, 1997; Kaplan and Stromberg, 2009).
Demand for private capital in Asian markets was
motivated by first generation entrepreneurs seeking
venture or growth capital, with a strong preference
from the founders to maintain equity (and opera-
tional) control over their companies. Private equity in
Asia in the late 1980s and early 1990s was predomi-
nantly the provision of growth financing to small and
mid-sized companies which were the engine of eco-
nomic development in newly industrialized countries
(e.g. South East Asia) (Naqi and Hettihewa, 2007). In
more developed economies, private equity played a
niche role filling financing gaps in formal capital
markets (e.g. financing small companies in Australia;
see Ferris, 2001).
The first wave of private equity fund raising for
Asian LBOs took place between 1998 and 2001, and
was associated with a coincidence of regional buyout
funds (and specialist local teams) being established by
leading US and European LBO firms (e.g., The
Carlyle Group; Texas Pacific Group (TPG)); several
larger Asian economies offering corporate restruc-
turing investment opportunities following the Asian
currency crisis (specifically, South Korea, Japan); and
institutional investor appetite for alternative asset
exposure in the Asian region, which increased the
growth rate of new fund management firms offering
investment services in private equity.
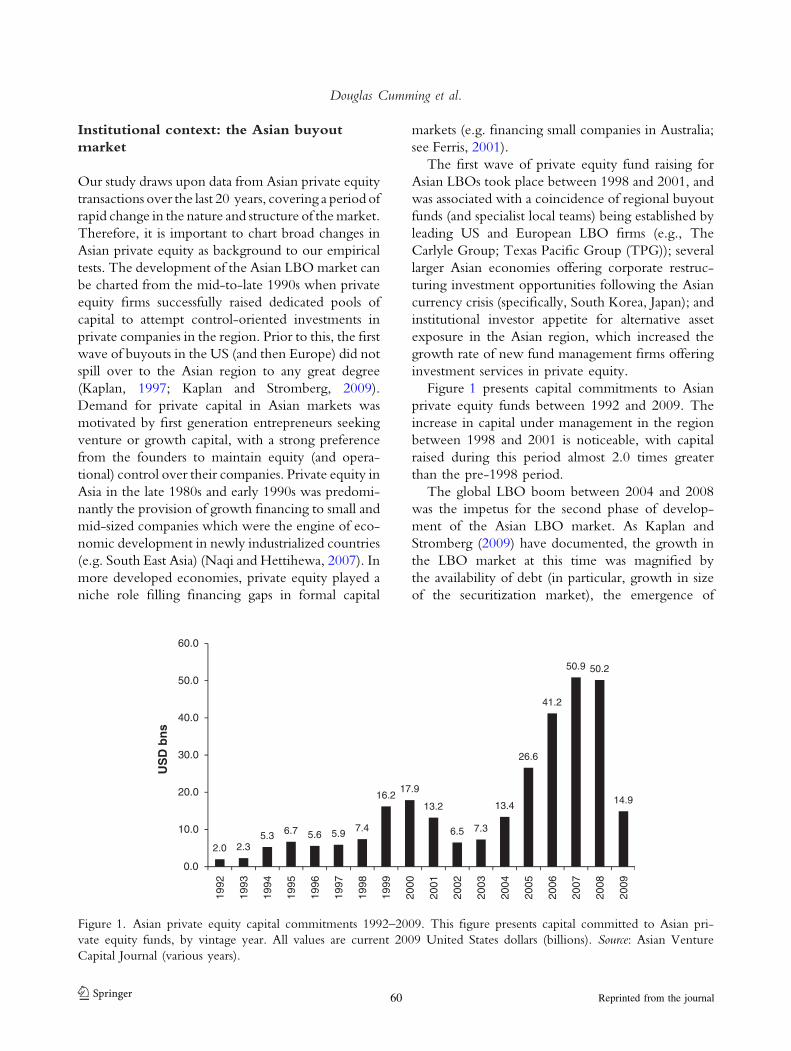
Figure 1 presents capital commitments to Asian
private equity funds between 1992 and 2009. The
increase in capital under management in the region
between 1998 and 2001 is noticeable, with capital
raised during this period almost 2.0 times greater
than the pre-1998 period.
The global LBO boom between 2004 and 2008
was the impetus for the second phase of develop-
ment of the Asian LBO market. As Kaplan and
Stromberg (2009) have documented, the growth in
the LBO market at this time was magnified by
the availability of debt (in particular, growth in size
of the securitization market), the emergence of
2.0 2.35.3 6.7 5.6 5.9 7.4
16.217.9
13.2
6.5 7.3
13.4
26.6
41.2
50.9 50.2
14.9
0.0
10.0
20.0
30.0
40.0
50.0
60.0
1992
1993
1994
1995
1996
1997
1998
1999
2000
2001
2002
2003
2004
2005
2006
2007
2008
2009
US
D b
ns
Figure 1. Asian private equity capital commitments 1992–2009. This figure presents capital committed to Asian pri-
vate equity funds, by vintage year. All values are current 2009 United States dollars (billions). Source: Asian Venture
Capital Journal (various years).
Douglas Cumming et al.
123 60 Reprinted from the journal

secondary buyouts and an increase in the number of
public-to-private transactions. In addition, LBOs in
‘‘less traditional’’ industries such as ‘‘non-manufac-
turing continued to grow in relative importance, and
private equity spread to new parts of the world,
particularly Asia’’ (2009, p. 128). Capital committed
to Asian private equity increased over threefold
between 1998–2001 and 2004–2008.
The institutional development of the Asian LBO
market between 1998 and 2008 was concentrated on
the developed economies of Japan, Australia, and
(in the first phase) South Korea. As historical com-
parative studies have shown, it was these economies
which attracted the earliest attention from investors in
terms of capital flows (see Wright, 2007a on LBOs;
Jeng and Wells, 2000; Mayer et al., 2005 on venture
capital). Japanese economic performance during the
1990s and the pressure for corporate restructuring
resulted in the emergence of a small LBO industry (see
Wright and Kitamura, 2003; Wright et al., 2003,
2005). While commentators believe that the Japanese
market did not reach its potential, attitudes toward
LBOs and private equity as a form of governance
changed in the late 1990s and 2000s. In particular,
LBOs became more accepted as a form of ownership
due to global competitive pressures on Japanese cor-
porations, shareholder demands for higher equity re-
turns, excessive debt burdens of conglomerates,
divestment of inefficient subsidiaries, and a change in
attitude toward mergers and acquisitions (M&A)
given the breakdown of the implicit contract of life-
time employment (Wright, 2007a, pp. 284–292;
Wright et al., 2003).
The Australian LBO market grew for different
reasons. A small, open developed economy with
established finance markets provided a conducive
environment for the growth of LBO transactions.
Koh (2005), Wright and Bruining (2008), and
Kaplan and Stromberg (2009) identified the Aus-
tralian market as benefiting most from the increased
internationalization of the LBO industry during the
mid-2000s. Transaction technology developed in
the US or Europe could more easily be transferred to
the Australian market, where institutional structure
(laws, language and culture values) and availability of
debt financing was more in tune with developed
LBO markets. Martin (1999) and Ferris (2001)
document the growth of the Australian market from
the earliest LBOs in the mid-1980s to the increasing
role of government in supporting the Australian
market through policy initiatives and a robust pen-
sion system. As Cumming (2007) noted, the Aus-
tralian market also increased in professionalization
and scale due, in large part, to government policies
facilitating investment in private companies.
The second phase of development also saw the
re-emergence of growth capital as an important part
of the Asian private equity landscape (Naqi and
Hettihewa, 2007). These investments were primarily
located in China and India, where rapid macroeco-
nomic growth, demographic change, and legal and
financial reforms were providing opportunities for
entrepreneurs to create new businesses and markets,
or expand existing companies.3 Fang and Leeds
(2008a, b and associated cases) illustrate that growth
transactions involved substantial minority equity
positions and the use of ‘‘negative control’’ clauses
in shareholders agreements (including meaningful
board participation, veto on key decisions, right to
hire senior executives and so forth).4 Lerner et al.
(2008) observe that companies in these countries do
not require leverage (as in more traditional LBO
markets) as much as strategic advice and operational
support from growth capital investors.
The Chinese and Indian private equity markets
combined grew between 2004 and 2008 to provide
60% of investments (by number), with a corre-
sponding increase in investment value (as measured
by invested capital) (49%). In absolute terms, Chi-
nese investments increased from 61 transactions in
2004 to 303 transactions in 2008, a fivefold increase
(similarly, Indian investments increased from 45
transactions in 2004 to 262 transactions in 2008, a
sixfold increase). By comparison, the total number of
Asian transactions increased three-fold during the
period (311 transactions to 939 transactions), with
more developed markets such as Japan and Australia
growing less rapidly (by 200 and 127% respec-
tively).5
Where do we stand today? Asian private equity
has continued to experience strong capital inflows,
especially into the growth economies of China and
India. This inflow of capital into Asia has led to
renewed questions about whether private equity can
be executed within different legal and economic
structures. As we have seen, the early development
Legal Protection, Corruption and Private Equity Returns in Asia
12361Reprinted from the journal
of the market was located in developed economies in
the region, which possess larger debt and equity
markets, certainty over creditor rights, tax transpar-
ency and an acceptance of change in control. This is
consistent with the law and economics view (and
our first hypothesis) which highlights the importance
of legal institutions in the development of finance
markets and economic growth (Cao et. al. 2010; La
Porta et al., 1998b, 2002). By contrast, the recent
development of private equity in the growth equity
markets of China and India supports the notion
that private equity investors have the ability to miti-
gate impediments in the institutional environment,
including the potential for corruption (our second
hypothesis). Clearly, an empirical examination of the
relationship between legal protection, corruption
and private equity returns across the Asian region is
warranted to improve our understanding of the
market and its operation. We turn next to the data
used in our study, and summary statistics.
Data and summary statistics
The data in this article are derived from proprietary
information obtained by a leading international
fund-of-funds manager, from a population of pri-
vate equity managers operating in Asia. The data
were provided by private equity managers on a
confidential basis and have been sensitized for this
study. In order to avoid sample selection bias, we
have drawn upon data from all managers operating
in the region and who provided data, not just
those which were ultimately invested in by the
fund-of-funds or its clients. The data comprise
information on 756 private equity investments
over 21 years (1989–2009), covering investments
in Australia (260 investments), China (147), Hong
Kong (22), India (108), Indonesia (6), Japan (82),
Korea (46), Malaysia (6), New Zealand (13),
Philippines (6), Singapore (18), Sri Lanka (1),
Taiwan (12), Thailand (14) and Vietnam (1), as
well as these funds investments overseas in Canada
(1), Germany (1), Spain (1), the UK (3), and the
US (8). The main variables available in the dataset
are defined in Table I and summarized in Table II.
Although information is not available for each
variable for each investment, coverage is quite
complete.
Financial returns statistics
Table III reports return on investment (ROI) and
internal rate of return (IRR) for fully realized Asian
LBOs and control-oriented investments for 289
private equity backed companies between 1989 and
2009 (the remaining investments were not yet fully
exited as at March 2010, the time of this study).6
Consistent with US and European studies, Asian
LBOs generate positive returns to investors, on
average. However, the return data also exhibits
skewness, with high ROI/IRR observations posi-
tively impacting average returns (most notably in the
case of China). The median returns show that risk-
unadjusted returns are relatively consistent across
different Asian companies. Australia, China, India,
Japan, New Zealand, Taiwan and Thailand have
median returns ranging between 1.75 and 3.0 times
cost, although hold periods are relative shorter in
some countries (e.g. India) which increases the IRR.
Given that economic and stock market growth rates
varied greatly across countries over the sample per-
iod (1989–2009), the data show that positive private
equity returns can be generated in a range of insti-
tutional and financial environments.
Trade sales to strategic buyers are the most com-
mon form of exit for Asian LBOs, consistent with
larger US and European data sets reviewed by Kaplan
and Stromberg (2009, p. 129). Trade sales make up
50% of all exits, with IPO (18%) being the second
most common exit strategy. Secondary sales (5%) are
relatively less common than that observed in US and
European data. Kaplan and Stromberg report 24% of
all exits were due to secondary buyouts between 1970
and 2007, although there was large variation across
time. The lower incidence of secondary buyouts in
Asia is most likely due to the less developed nature of
private equity markets and the fewer number of
managers operating in the region. Write-offs com-
prised 17% of all exits, higher than in more developed
countries due to the inclusion of growth LBOs and
control-oriented minority investments.
Asian LBOs which were exited via IPOs provided
the highest returns to investors, generating a median
IRR of 61% per annum (and median ROI of 3.2
times cost). Secondary sales (although only 5% of total
exits) also performed well, followed by the sale of
private investments in public entities (PIPEs) back into
the market, trade sales and management buybacks.
Douglas Cumming et al.
123 62 Reprinted from the journal

TABLE I
Variable definitions
Definition
Returns
IRR The internal rate of return of the investment, in decimals
Realized exit A dummy variable equal to 1 for a fully realized investment
Cultural and legal factors
Corruption perception index The corruption perception index from transparency international. Ranges from 0
to 10. Higher numbers indicate less corrupt countries
Power distance index The Hofstede power distance index. Ranges from 0 to 100. Higher numbers
indicate higher power distance. The index measures how much the less powerful
members of institutions and organizations expect and accept that power is dis-
tributed unequally. In cultures with small power distance (e.g., Australia, Austria,
Denmark, Ireland, New Zealand), people expect and accept power relations that
are more consultative or democratic. People relate to one another more as equals
regardless of formal positions. Subordinates are more comfortable with and
demand the right to contribute to and critique the decisions of those in power. In
cultures with large power distance (e.g., Malaysia), the less powerful accept power
relations that are autocratic or paternalistic. Subordinates acknowledge the power
of others based on their formal, hierarchical positions. Thus, small vs. large
power distance does not measure or attempt to measure a culture’s objective,
‘‘real’’ power distribution, but rather the way people perceive power differences
Masculinity index The Hofstede masculinity index. Ranges from 0 to 100. Higher numbers indicate
higher Masculinity. The value placed on traditionally male or female values
(as understood in most Western cultures). In so-called ‘masculine’ cultures, people
(whether male or female) value competitiveness, assertiveness, ambition, and the
accumulation of wealth and material possessions. In so-called ‘feminine’ cultures,
people (again whether male or female) value relationships and quality of life. This
dimension is often renamed by users of Hofstede’s work, e.g., to Quantity of Life
vs. Quality of Life. Another reading of the same dimension holds that in ‘M’
cultures, the differences between gender roles are more dramatic and less fluid
than in ‘F’ cultures; but this strongly depends on other dimensions as well
Uncertainty avoidance index The Hofstede uncertainty avoidance index. Ranges from 0 to 100. Higher
numbers indicate higher uncertainty avoidance. How much members of a society
are anxious about the unknown, and as a consequence, attempt to cope with
anxiety by minimizing uncertainty. In cultures with strong uncertainty avoidance,
people prefer explicit rules (e.g., about religion and food) and formally structured
activities, and employees tend to remain longer with their present employer. In
cultures with weak uncertainty avoidance, people prefer implicit or flexible rules
or guidelines and informal activities. Employees tend to change employers more
frequently
Legality The weighted average of the La Porta et al. (1998b) legal variables. Weights used
are as in Berkowitz et al. (2003). The index includes the Rule of Law, Efficiency
of the Judiciary, Contract Repudiation, and Expropriation, but does not include
corruption (it is assessed separately herein). Higher numbers indicate better legal
systems. Values range from 8.73 to 19.44 in the data
Economic conditions
GDP per capita The country’s GDP per capita in constant 2009 USD
MSCI return (%) The annualized return over the contemporaneous MSCI investment period from
investment date to exit date
Legal Protection, Corruption and Private Equity Returns in Asia
12363Reprinted from the journal

The higher returns to IPOs is consistent with US and
European studies which show that private equity
investors aim to list only their best investments.
Cumming and MacIntosh (2003) argue that the
probability of an IPO exit is positively associated with
the quality of the investment. Firm quality is evident
in the low levels of information asymmetry between
buyers and sellers in the IPO process (the need for
earnings history, public company accounting and
governance standards, and so forth), stable, established
management team and significant growth potential.
The priority of IPO returns is also supported by a
reputation argument, first applied to venture capital.
Private equity firms (like their venture counterparts)
wish to generate a reputation for presenting high
quality firms to public markets (Barry et al., 1990;
Megginson and Weis, 1991). We find that financial
returns to Asian LBOs are consistent with the asym-
metric information and reputation arguments.
Governance and operation change statistics
Governance changes and operational engineering
associated with private equity ownership has not been
studied to any great degree in Asian companies. Until
TABLE I
continued
Definition
Transaction specific characteristics
Post investment acquisitions A dummy variable equal to 1 for investments which involved subsequent
acquisitions by the investee firm
Post investment divestitures A dummy variable equal to 1 for investments which involved subsequent
divestitures of the investee firm
Syndication A dummy variable equal to 1 for syndicated investments
Enterprise value at investment The pre-money valuation of the investment in $m USD
Cost of investment ($m USD) The amount invested by the PE fund in $m USD
Equity share of PE Fund
Managers
The equity share (in decimals) held by all of the PE fund investors
Managerial replacement A dummy variable equal to 1 if the PE investor(s) replaced the management
(CEO, CFO, COO) of the investee
GP office in country of company A dummy variable equal to 1 if the PE investor(s) had an office in the same
country as the investee
Multinational division A dummy variable equal to 1 if the PE fund bought the investment from a
multinational division
Domestic conglomerate division A dummy variable equal to 1 if the PE fund bought the investment from a
domestic conglomerate division
Founder A dummy variable equal to 1 if the PE fund bought the investment from a founder
Sponsor to Sponsor A dummy variable equal to 1 if the PE fund bought the investment from a sponsor
Receiver A dummy variable equal to 1 if the PE fund bought the investment from a receiver
Public to private A dummy variable equal to 1 if the PE fund bought the investment from a public-
to-private transaction
Government A dummy variable equal to 1 if the PE fund bought the investment from a
government office
PIPE A dummy variable equal to 1 if the PE fund bought the investment from a PIPE
deal
Industry dummy variables Dummy variables equal to 1 for a dozen different industry categories
This table defines the variables used in the dataset. The data comprise 756 observations from 20 countries. Dollar amounts
are all expressed in constant 2009 USD. Sources: Wilshire Private Markets, MSCI http://www.mscibarra.com/, http://
www.geerthofstede.nl/, La Porta et al. (1998b), Berkowitz et al. (2003), Transparency International http://www.
transparency.org/.
Douglas Cumming et al.
123 64 Reprinted from the journal

recently, researchers have not possessed firm-level
data on Asian companies other than that available
through individual case studies (see Fang and Leeds,
2008a, b). The international literature shows that
active private equity ownership improves managerial
behavior and accountability (Acharya et al., 2009;
Kaplan and Stromberg, 2009, p. 131). Private equity
owners are also more active in operational engi-
neering – initiating operational and strategic change
such as value creation plans, acquisitions, divestitures,
strategic repositioning, new product development,
and so forth (Acharya et al., 2009; Bernstein et al.,
2009; Nikoskelainen and Wright, 2007).
The equity ownership of Asian private equity-
backed companies is reported in Table IV for a
sample of 528 companies for which we have
definitive information. The Table differentiates
between countries in which private equity own-
ership, on average, tends to be majority equity
positions (LBO-centric economies), and countries
where private equity funds have, on average,
minority equity ownership (growth-centric econ-
omies). We also show the extent to which
minority equity ownership has control features
(that is, the private equity fund holds at least 20%
equity and is able to exert influence, and block,
TABLE II
Summary statistics
No of observations Mean Median SD Min Max
Returns
IRR 273 0.496 0.31 1.275 -1 8.3146
Realized exit 756 0.394 0 0.489 0 1
Cultural and legal factors
Corruption perception index 756 6.247 7.3 2.519 2.2 9.6
Power distance index 756 57.763 58 19.592 22 104
Masculinity index 756 62.221 61 13.773 34 95
Uncertainty avoidance index 756 50.504 51 20.698 8 92
Legality 756 18.266 19.53 3.158 8.51 21.55
Economic conditions
GDP per capita 756 16,126 17,500 9212 300 31,490
MSCI return (%) 756 0.052 0.002 0.454 -0.877 8.825
Transaction specific characteristics
Post investment acquisitions 758 0.047 0 0.213 0 1
Post investment divestitures 756 0.265 0 0.560 0 10
Syndication 756 0.265 0 0.560 0 10
Enterprise value at investment 258 394.671 67.7 1589.337 0 15,300
Cost of investment ($m USD) 749 33.049 13.395 63.929 0.003 770
Equity share of PE fund managers 528 0.493 0 0.312 0.0001 1
Managerial replacement 756 0.193 0 0.395 0 1
GP office in country of company 756 0.919 1 0.273 0 1
Multinational division 756 0.049 0 0.216 0 1
Domestic conglomerate division 756 0.142 0 0.349 0 1
Founder 756 0.454 0 0.498 0 1
Sponsor to sponsor 756 0.029 0 0.168 0 1
Receiver 756 0.013 0 0.114 0 1
Public to private 756 0.082 0 0.275 0 1
Government 756 0.020 0 0.140 0 1
PIPE 756 0.009 0 0.096 0 1
This table reports number of observations, as well as the mean, median, standard deviation, minimum and maximum
values of each variable in the data. Variables are as defined in Table 1.
Legal Protection, Corruption and Private Equity Returns in Asia
12365Reprinted from the journal

decisions which may be against minority equity
holders’ interests).7
Australia and Japan are the two largest developed
economy LBO markets in the Asian region, and
transactions in those markets are characterized by
control equity positions. The average equity own-
ership of majority equity transactions in the LBO-
centric economies is between 77 and 91%, with the
remainder held by the management team (and in
some cases the original seller). Growth transactions
in these markets are also more likely to be substantial
minority positions and have blocking stakes in the
company. With the exception of Hong Kong, most
minority equity deals have blocking stakes and can
be regarded as control oriented. Asian LBOs,
therefore, feature many of the characteristics of LBO
transactions in the US and Europe. Sponsors hold
the majority of equity and management have equity
interest via shares and/or options. In minority deals,
control is provided by blocking stakes and the use of
negative control features such as veto rights on key
decisions, multiple board seats etc. The similarities
suggest that LBO structuring technology can be
transmitted across different business cultures and
legal jurisdictions.
Private equity ownership in the growth-centric
economies of China and India is usually minority
equity (87% of Chinese private equity deals; 71% of
Indian deals). Furthermore, the equity positions are,
on average, below 30% and very often do not
involve blocking states. This is consistent with the
evidence we have reviewed previously in this paper,
TABLE III
Realized returns and exit statistics
N % ROI N % IRR
Average Median Average (%) Median %
Country
Australia 136 47 2.72 2.10 136 50 46 37
China 28 10 11.98 1.76 27 10 87 33
Hong Kong 12 4 0.52 0.06 10 4 -52 -83
India 30 10 3.71 3.00 20 7 133 76
Japan 24 8 3.86 2.01 24 9 89 55
New Zealand 22 8 2.40 2.72 21 8 18 24
Singapore 8 3 4.70 4.04 8 3 78 66
South Korea 3 1 1.46 1.04 3 1 30 1
Taiwan 2 1 2.62 2.62 2 1 34 34
Thailand 7 2 2.66 1.91 7 3 6 13
Other 17 6 1.07 0.23 15 5 -38 -47
Total 289 273
Type of exit
IPO 43 18 5.60 3.18 43 18 142 61
Mgmt buyback 10 4 1.59 1.65 10 4 12 20
PIPE 16 7 3.17 2.85 14 6 122 101
Secondary sale 12 5 3.43 3.32 11 5 41 37
Trade sale 117 49 2.81 2.17 117 50 50 33
Write-off 41 17 0.09 0.00 41 17 -75 -100
Total 239 236
This table reports return on investment (ROI) and internal rate of return (IRR) for fully realized Asian LBOs and growth
capital investments by country and by type of exit. Country is defined as the primary location of the LBO company. ROI
is defined as the multiple of total return to cost. IRR is the internal rate of return for the investment, using the cash flows
of the private equity investor, as reported by the investor. In cases where the IRR was not provided, we have calculated
the IRR using the holding period (month and year of entry and exit), the cost and total return. PIPE is defined as a private
equity investment in a public company.
Douglas Cumming et al.
123 66 Reprinted from the journal

where the demand for private equity in growth-
centric economies is from founder entrepreneurs
who are not seeking to exit their companies to a
private equity buyer. Taiwan and South Korea are
also growth-centric markets where private equity has
played an important role in financing the growth and
development of small and medium sized enterprises.
Equity ownership in Taiwan and South Korea is
between 27–37%, on average, with median equity
holdings in Taiwan substantially smaller than other
markets. It is also less likely that minority private
equity in Taiwan has a blocking stake.
Overall, the Asian private equity market presents
two types of control-oriented private equity: ‘‘tra-
ditional’’ LBO transactions, and growth control-
oriented transactions. Transaction structures are
similar across traditional Asian LBOs and take their
lead from the US and Europe. However, in growth
economies equity investments often do not involve
equity control. Private equity investors rely on
agreement and alliance with the founder/entrepre-
neur on key decisions and strategies to ensure that an
investment generates the required return (see Fang
and Leeds 2008a, b for examples). The transaction
structure of control-oriented growth equity in Asia
provides researchers with a valuable institutional
variation to other private equity markets.
Recent studies have found that private equity
owners hold company management accountable for
financial and operational performance. As a result, it
is not uncommon for LBO companies to have
turnover at senior management positions due to
poor performance. LBO owners (typically) are active
in corporate governance and are able to make
management changes because they have majority
equity ownership and the majority of board seats.
Acharya et al. (2009) studied private equity trans-
actions in the UK between 1996 and 2004, and
found that one third of CEOs are replaced in the first
100 days of an LBO, and two-thirds are replaced at
some point over a 4-year period.
Table V reports managerial change in Asian LBOs
in our data. Managerial turnover is lower in Asian
LBOs than that recorded by Acharya et al. (2009).
Only one third of LBOs experienced a change in
senior management (CEO, chief financial officer,
and/or chief operating officer), even though the
average hold period (4.2 years) for Asian LBOs is
similar to the UK study. Indeed, given the wider
definition of management change used herein
TABLE IV
Governance statistics
Equity
ownership
N Equity holding % Deals
with majority
equity
Average
equity
ownership
(%)
% Deals with
minority
equity
Average
equity
ownership
(%)
% of Minority
deals with
‘‘Blocking’’ stakeAverage
(%)
Median (%)
Australia 147 65 70 69 79 31 37 91
Hong Kong 13 50 60 54 79 46 18 33
Japan 80 64 71 70 82 30 23 50
New Zealand 11 74 91 73 91 27 31 67
Singapore 14 59 66 71 77 29 16 50
Thailand 14 58 69 57 85 43 23 50
China 133 28 27 13 66 87 23 58
India 49 32 27 29 67 71 18 43
South Korea 33 37 32 30 73 70 23 43
Taiwan 10 27 18 20 85 80 13 25
Other 24 48 49 50 79 50 17 42
Total 528
This table reports equity ownership by LBO and growth capital funds in Asian companies. Equity ownership is measured
as the percentage of equity held by the private equity owner (or in club deals the total equity held by all private equity
investors). Minority equity is defined as equity positions of 49% or less. Minority ‘‘Blocking Stakes’’ is defined as equity
ownership between 20 and 49%.
Legal Protection, Corruption and Private Equity Returns in Asia
12367Reprinted from the journal

(i.e. including three senior officers), we believe that
it is highly possible that Asian LBOs are distinctive
from LBOs in the US and Europe in this regard.
It should also be noted that the incidence of
senior management change is not significantly dif-
ferent across countries, including Japan. Private
equity ownership is active ownership despite the
structure of the local labor market, or other cultural
factors which may a priori lead one to believe that
removal of senior management is difficult. For
example, Wright et al. (2005) believe that the
receptiveness of private equity in Japan has been
associated with a change in attitude toward M&A
and the breakdown of the implicit contract of life-
time employment. Consistent with this view, it does
not appear the labor market rigidities in the Japanese
economy make it any more difficult for Japanese
private equity investors to remove management,
than in other Asian markets.
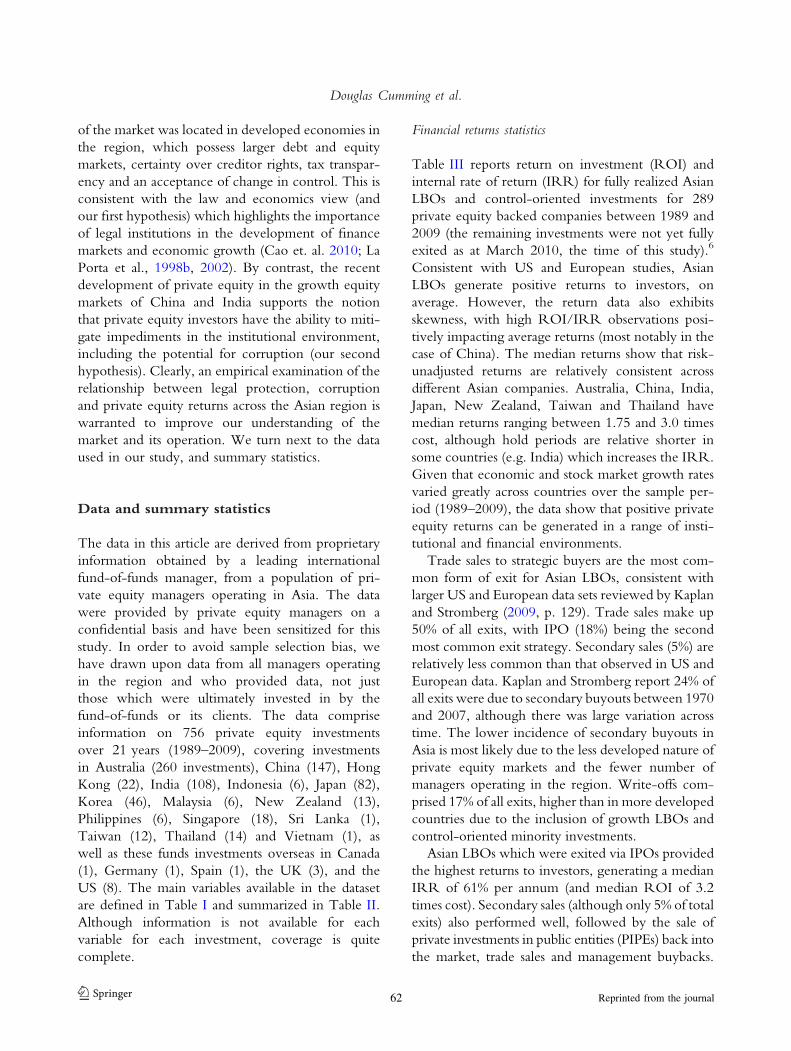
Table VI provides the first data on operational
change instigated by private equity owners in Asian
companies. Two types of operational changes were
analyzed – acquisitions and divestitures. Asian LBOs
are more likely to involve acquisitions than divesti-
tures, with companies operating in the growth
markets of China, India, South Korea and Taiwan
most active in acquisitions. These observations can
likely be explained by the growth opportunities
which face established businesses in economies
undergoing rapid economic growth. Private equity
helps these companies improve their competitive
position, and acquisition is a strategic (and perhaps
more rapid) approach to increasing market share
(over and above organic growth). Lerner et al.
(2008) describe how operational and strategic skills
are highly valued by private equity-backed compa-
nies in these markets. Divestitures in these countries
are less common.
Leveraged buyouts in the established markets of
Japan, Australia (and New Zealand) are more likely
to be associated with restructuring, where both
acquisitions and divestitures are undertaken by com-
panies. Acquisitions are less common in Australia
(52%) and New Zealand (58%) than Japan (93%),
while divestitures rates are similar. Japanese LBO
deal flow goes some way to explaining why acqui-
sitions are common as a growth strategy in this
market. Wright (2007a) notes that divestments by
corporations of non-core divisions have consistently
provided the largest source of deal flow in Japan.
Private equity investors help ‘‘orphan’’ divisions
leave their corporate parent and position themselves
TABLE V
Managerial change statistics
Country N Hold period Senior management
Years No change (%) Change (%)
Australia 157 3.4 67 33
China 48 3.8 60 40
Hong Kong 16 5.4 63 38
India 23 3.3 48 52
Japan 82 5.3 68 32
New Zealand 11 2.6 82 18
Singapore 21 3.5 67 33
South Korea 27 4.8 63 37
Taiwan 14 4.2 79 21
Thailand 11 5.0 73 27
Other 14 5.7 57 43
Total 424 4.2 66 34
This table reports managerial change in Asian LBOs during the period in which a private equity fund was an owner. The
data derives from company reports and private equity manager fund reports on company management composition and
key changes of senior management reported each quarter/year. A change in senior management is defined as the departure
of any of the Chief Executive Officer (CEO), Chief Financial Officer (CFO) or Chief Operating Officer (COO).
Douglas Cumming et al.
123 68 Reprinted from the journal
as independent companies. This structural (and
financing) freedom may also provide the company
with opportunities to increase market position by
acquisition, a strategy stifled inside the wider cor-
porate grouping.
Finally, operational change can involve changes to
the capital-labor mix. Internationally, there is no
conclusive evidence that LBOs are associated with
lower employment levels (Cumming et al., 2007)
and may be associated with higher total factor pro-
ductivity (Kaplan and Stromberg, 2009). Li and
Rozelle (2003) found no difference in employment
growth between government-owned Chinese firms
taken private by management and government-
owned firms. Westcott (2009) reviews recent argu-
ments in Australia that private equity owners would
seek to generate financial returns by reducing
employment costs. Westcott argues that employ-
ment was not reduced, suggesting that private equity
seeks to improve a range of financial and operational
areas of the company in order to maximize equity
returns.
These summary statistics provide a context for our
empirical analyses of the two central hypotheses
introduced above. The data cover a wide scope of
buyout transactions across many countries and over
time. The empirical tests are presented in the next
section.
Empirical tests
In this section, we test the two central hypotheses
introduced in the first section of this paper pertain-
ing to legality and returns (Hypothesis 1) and cor-
ruption and returns (Hypothesis 2). Table VII
provides univariate tests in the form of a correlation
matrix.8 The correlations provide useful preliminary
insights into the relations observed in the data. IRRs
and legality are positively correlated (0.011), con-
sistent with Hypothesis 1, albeit the correlation is
not statistically significant. IRRs and corruption are
significantly negatively correlated (-0.24), consis-
tent with Hypothesis 2. We also note that a number
of the other country level variables are highly cor-
related, such as the Hofstede cultural measures and
GDP per capita. As such, in our econometric tests
below we are careful to show our central results with
different sets of explanatory variables.
The correlations in Table VII further show that
IRRs are positively associated with MSCI returns
over the same investment horizon, confirming the
TABLE VI
Operational change statistics
Country N Acquisition N Divestiture
Yes (%) No (%) Yes (%) No (%)
Australia 157 52 48 141 11 89
China 34 85 15 34 9 91
Hong Kong 15 80 20 16 13 88
India 20 70 30 17 6 94
Japan 82 93 7 82 12 88
New Zealand 12 58 42 11 9 91
Singapore 13 69 31 13 0 100
South Korea 27 85 15 27 4 96
Taiwan 11 73 27 10 0 100
Thailand 14 93 7 14 7 93
Other 21 76 24 21 10 90
Total 406 386
This table reports acquisition and divestment activity by Asian LBOs during the period in which a private equity fund was
an owner. The data derives from company reports and private equity manager fund reports on company performance and
strategic change each quarter/year.
Legal Protection, Corruption and Private Equity Returns in Asia
12369Reprinted from the journal

TA
BLE
VII
Corr
elat
ion
mat
rix
(1)
(2)
(3)
(4)
(5)
(6)
(7)
(8)
(9)
(10)
(11)
(12)
(13)
(14)
(15)
(16)
(17)
(18)
(19)
(20)
(21)
(1)
IRR
1.0
0
(2)
Corr
uption
per
ception
index
-0.2
41.0
0
(3)
Pow
erdis
tance
index
0.2
0-
0.8
91.0
0
(4)
Mas
culinity
index
0.1
10.2
9-
0.1
91.0
0
(5)
Unce
rtai
nty
avoid
ance
index
-0.0
10.2
3-
0.3
10.4
31.0
0
(6)
Leg
ality
0.0
11
0.7
0-
0.5
90.4
90.5
11.0
0
(7)
GD
Pper
capita
-0.1
40.6
6-
0.5
20.7
40.3
70.8
41.0
0
(8)
MSC
Ire
turn
(%)
0.0
7-
0.0
60.0
50.1
80.1
4-
0.0
50.0
61.0
0
(9)
Post
inves
tmen
tac
quis
itio
ns
-0.0
10.1
4-
0.1
0-
0.0
1-
0.0
10.1
20.1
50.0
01.0
0
(10)
Post
inves
tmen
tdiv
estitu
res
0.1
50.0
6-
0.0
70.1
10.0
90.0
40.0
4-
0.1
3-
0.0
11.0
0
(11)
Syndic
atio
n-
0.2
00.2
5-
0.2
5-
0.0
10.0
90.2
20.1
8-
0.0
6-
0.1
00.0
01.0
0
(12)
Ente
rpri
seval
ue
atin
ves
tmen
t0.2
10.0
80.0
0-
0.0
2-
0.1
30.0
0-
0.0
20.1
00.2
90.2
7-
0.0
41.0
0
(13)
Cost
of
inves
tmen
t($
mU
SD
)0.1
6-
0.0
80.0
60.0
80.0
8-
0.1
0-
0.0
70.2
10.2
50.2
7-
0.1
00.8
01.0
0
(14)
Equity
shar
eof
PE
fund
man
ager
s-
0.0
2-
0.3
90.3
10.0
3-
0.0
8-
0.2
8-
0.2
20.1
3-
0.0
40.1
1-
0.1
60.0
50.2
81.0
0
(15)
Man
ager
ial
repla
cem
ent
-0.1
4-
0.1
50.1
0-
0.0
50.4
3-
0.1
80.0
00.0
20.2
1-
0.0
8-
0.0
20.0
40.1
4-
0.1
11.0
0
(16)
GP
offi
cein
countr
yof
com
pan
y
0.1
60.1
4-
0.1
10.0
80.0
40.2
80.2
0-
0.0
6-
0.0
20.0
80.1
40.1
00.0
70.0
7-
0.0
51.0
0
(17)
Multin
atio
nal
div
isio
n-
0.0
60.1
90.0
4-
0.1
0-
0.1
80.1
30.0
5-
0.0
80.0
7-
0.1
0-
0.0
50.2
0-
0.0
3-
0.1
1-
0.0
20.0
61.0
0
(18)
Dom
estic
conglo
mer
ate
div
isio
n
0.1
50.2
1-
0.1
90.3
00.4
60.2
10.3
20.2
60.1
3-
0.1
40.0
50.0
60.0
3-
0.0
20.2
00.0
9-
0.1
21.0
0
(19)
Founder
-0.2
0-
0.1
70.1
1-
0.1
3-
0.1
3-
0.0
7-
0.0
2-
0.0
20.2
60.0
3-
0.0
4-
0.0
80.0
70.1
80.0
2-
0.3
8-
0.1
7-
0.2
31.0
0
(20)
Sponso
rto
sponso
r-
0.0
70.1
0-
0.1
5-
0.1
10.0
30.0
5-
0.0
20.1
0-
0.0
10.0
40.1
10.1
10.1
6-
0.1
6-
0.0
80.0
8-
0.1
0-
0.1
4-
0.2
01.0
0
(21)
Rec
eiver
-0.0
9-
0.0
20.0
30.2
50.4
50.0
10.1
9-
0.1
9-
0.1
40.1
60.0
3-
0.0
8-
0.0
1-
0.0
10.4
00.0
5-
0.0
6-
0.0
9-
0.1
3-
0.0
81.0
0
(22)
Public
topri
vat
e0.1
7-
0.1
30.0
9-
0.0
5-
0.0
8-
0.1
5-
0.1
70.1
90.0
20.1
60.0
30.0
0-
0.0
40.1
20.0
50.0
5-
0.0
6-
0.0
9-
0.1
3-
0.0
8-
0.0
5
This
table
report
sP
ears
on
corr
elat
ion
coef
fici
ents
acro
ssse
lect
edvar
iable
sin
the
dat
a.V
aria
ble
sar
edefi
ned
inT
able
1.C
orr
elat
ions
gre
ater
than
0.1
1,0.1
3,an
d0.1
7in
abso
lute
val
ue
are
stat
istica
lly
signifi
cant
atth
e10,
5,
and
1%
level
s,re
spec
tivel
y.
Douglas Cumming et al.
123 70 Reprinted from the journal
basic intuition that returns are better when public
markets are performing better. IRRs are likewise
positively associated with domestic investments,
suggesting a value to proximity and local bias. IRRs
are negatively associated with syndication and mana-
gerial replacement, which suggests that private equity
funds replace management when they are expected
to underperform, and do not share equity in high
expected value projects with other private equity
fund sponsors. The correlations further show that the
source of the transaction matters, where IRRs are
higher for purchases from domestic conglomerate
divisions, and public-to-private transactions but
lower for multinational divisions, founder sales,
sponsor-to-sponsor sales, and receiver sales.
Our multivariate analyses of Hypotheses 1 and 2
are presented in Table VIII. Table VIII shows both
OLS regressions on the subsample of fully exited
investments (Models 4–6), as well as Heckman
(1976, 1979) corrected investments (Models 1–3).
Models 1–3 account for the fact that the decision to
exit is not a random event. For example, there is
evidence that private equity funds tend to hang on to
poorer performing investments in order to facili-
tate fundraising activity (e.g., Cumming and Walz,
2010). The Heckman corrected regressions use the
sample set of variables as reported in Table VIII in
the second step regressions, but further include
additional first step dummy variable for the year of
first investment.
Specifically, our sample selection corrections
procedure involves two steps. The first step involves
determining the probability of an exit. The second
step is the linear regression explaining returns with
the sample selection correction based on steps one
and two (based on Heckman, 1976, 1979). It is
noteworthy that our results are quite robust to
alternative specifications of the sample selection
corrections (alternative specifications not specifically
reported are available upon request), but not as ro-
bust relative to the standard OLS estimates on the
subsample of fully realized exits. Specifically, our
econometric specifications are the function of the
following variables:
(1) Probability of observing an actual exit =
f{date of investment, legal and cultural vari-
ables, economic conditions, transaction spe-
cific characteristics}
(2) Realized returns = f{legal and cultural vari-
ables, economic conditions, transaction spe-
cific characteristics | Actual Exit [regression
(1)]}
The particular variables are defined in Table I and
summarized in Table II. Other variables present in
the data were considered but deemed less relevant.
We present regressions in which the left- and right-
hand-side variables are in levels. We also considered
the regressions in logs; those results were very sim-
ilar, and are available upon request.
Table VIII provides strong support for Hypothesis
1 in Models 2, 3 and 5 for the Legality index. The
effect is marginally statistically insignificant (t-statis-
tics between 1.20 and 1.54) in the other models, and
the statistical significance is largely influence by the
inclusion of cultural variables for power distance and
masculinity. We note that the variance inflation
factor is around 2.70 for the models, and hence not
influenced by the other variables; albeit the variance
inflation factors are indicative of collinearity issues in
models with some of the other cultural variables
included in Models 1 and 4. On average, from
Models 2, 3 and 5 we would estimate that a 1-point
improvement in legality is associated with a 17.5%
increase in IRRs. For example, moving from
Malaysia (legality 15.506) to Singapore (Legality
18.291) gives rise to an estimated 48.7% increase in
expected returns, which illustrates that the legality
effect is economically large.
Table VIII also provides strong support for
Hypothesis 2 (indeed, across all six regression
models). Higher levels of corruption (indicated by
lower values of the Corruption Perception Index)
are associated with higher IRRs, and this effect is
statistically significant at the 5% level in Models 1,
2, and 6, and at the 1% level in Models 3, 4, and
5. The economic significance is fairly robust in the
reported models whereby a 1-point increase in
corruption is associated with a drop in returns
by 30%. We note that for more parsimonious
models, the statistical significance of corruption is
similar and the economic significance can go
down to -7.4% (as reported in an earlier draft of
this paper).
The statistical and economic significance associ-
ated with Hypotheses 1 and 2 is graphically illus-
trated in Figure 2 which presents the results for
Legal Protection, Corruption and Private Equity Returns in Asia
12371Reprinted from the journal

TA
BLE
VII
I
Reg
ress
ion
anal
yse
s
Model
1:
Hec
km
an2nd
step
Model
2:
Hec
km
an2nd
step
Model
3:
Hec
km
an2nd
step
Model
4:
OLS
Model
5:
OLS
Model
6:
OLS
Coef
fici
ent
tSta
tist
icC
oef
fici
ent
tSta
tist
icC
oef
fici
ent
tSta
tist
icC
oef
fici
ent
tSta
tist
icC
oef
fici
ent
tSta
tist
icC
oef
fici
ent
tSta
tist
ic
Const
ant
-4.0
20
-1.0
5-
4.3
16
-1.9
8**
-3.6
27
-1.7
3*
-0.2
81
-0.1
1-
0.8
54
-0.5
2-
3.5
84
-1.2
5C
ultura
lan
dle
gal
fact
ors
Corr
uption
per
ception
index
-0.3
25
-2.0
2**
-0.3
18
-2.2
0**
-0.3
67
-2.6
4***
-0.3
02
-2.9
5***
-0.3
21
-3.8
2***
-0.3
81
-2.0
9**
Leg
ality
0.3
36
1.4
90.3
48
1.8
2*
0.0
28
2.2
1**
0.1
84
1.2
00.2
49
1.9
7**
0.3
94
1.5
4P
ow
erdis
tance
index
-0.0
02
-0.0
9-
0.0
06
-0.4
3
Mas
culinity
index
0.0
26
1.0
50.0
25
1.0
80.0
15
1.0
1U
nce
rtai
nty
avoid
ance
index
0.0
23
1.3
40.0
24
1.8
5*
0.3
87
2.0
5**
0.0
00
0.0
30.0
05
0.6
60.0
30
1.9
2*
Eco
nom
icco
nditio
ns
GD
Pper
capita
-1.0
96E
-04
-2.1
3**
-1.1
14E
-04
-2.3
2**
-8.4
40E
-05
-2.0
3**
-4.3
50E
-05
-1.2
3-
3.7
00E
-05
-1.2
-8.5
20E
-05
-1.5
0M
SC
Ire
turn
0.0
07
0.0
10.0
01
00.1
34
0.1
91.7
60
3.4
0***
1.8
02
3.5
1***
0.0
84
0.0
9T
ransa
ctio
nsp
ecifi
cch
arac
teri
stic
sP
ost
inves
tmen
tac
quis
itio
ns
0.3
49
1.1
40.3
49
1.1
40.3
83
1.2
40.3
86
1.5
90.4
10
1.7
2*
0.3
61
0.8
7
Post
inves
tmen
tdiv
estitu
res
0.7
15
1.6
00.7
11
1.5
90.7
54
1.6
9*
0.4
29
1.2
10.4
59
1.3
0.7
40
1.2
1
Syndic
atio
n-
0.1
52
-0.5
5-
0.1
49
-0.5
4-
0.1
86
-0.6
7-
0.2
96
-1.4
5-
0.2
84
-1.4
-0.1
79
-0.4
7E
nte
rpri
seval
ue
atin
ves
tmen
t0.0
01
1.6
8*
0.0
01
1.7
3*
0.0
01
1.6
6*
0.0
01
1.4
5
Equity
Shar
eof
PE
Fund
Man
ager
s-
1.4
11
-2.8
3***
-1.4
06
-2.8
4***
-1.2
11
-2.5
4**
-0.8
12
-2.3
4-
0.7
56
-2.2
2**
-1.2
53
-1.9
9**
Man
ager
ial
repla
cem
ent
-0.9
21
-1.9
9**
-0.9
23
-1.9
9**
-1.0
64
-2.3
6**
-0.1
36
-0.5
1-
0.1
72
-0.6
5-
1.0
54
-1.7
1*
GP
offi
cein
countr
yof
com
pan
y0.6
33
0.7
80.6
15
0.7
80.2
53
0.3
50.2
65
0.6
30.1
31
0.3
40.2
43
0.2
5
Multin
atio
nal
div
isio
n0.3
17
0.5
10.2
83
0.5
60.2
17
0.4
30.1
47
0.3
30.0
68
0.1
60.1
79
0.2
6D
om
estic
conglo
mer
ate
div
isio
n0.9
18
1.8
0.9
05
1.8
5*
0.9
07
1.8
1*
0.2
87
0.9
0.2
44
0.7
80.8
58
1.3
1
Founder
0.5
13
1.1
30.5
12
1.1
30.3
01
0.7
3-
0.1
31
-0.4
5-
0.2
23
-0.8
10.3
18
0.5
6Sponso
rto
sponso
r-
0.1
52
-0.3
1-
0.1
60
-0.3
4-
0.1
81
-0.3
6-
0.2
10
-0.4
6-
0.2
83
-0.6
3-
0.2
57
-0.4
3R
ecei
ver
0.5
49
0.6
40.5
33
0.6
40.7
93
0.9
30.0
79
0.1
0.1
05
0.1
40.6
52
0.6
4P
ublic
topri
vat
e0.9
61
1.5
60.9
66
1.5
70.8
81
1.3
5-
0.4
53
-1.1
2-
0.4
90
-1.2
30.9
71
1.2
0G
over
nm
ent
-1.3
43
-1.1
5-
1.4
62
-1.2
7
PIP
E1.9
79
1.6
31.7
70
1.4
9
Indust
rydum
my
var
iable
s?Y
esY
esY
esY
esY
esY
esN
um
ber
of
obse
rvat
ions
229
229
229
161
161
64
v2(F
for
OLS)
88.0
1***
87.9
5***
85.3
2***
2.4
9***
2.6
3***
1.5
8*
Adju
sted
R2
for
OLS
0.2
41
0.2
46
0.2
11
This
table
report
sH
eckm
anco
rrec
ted
(Model
s1–3)
and
OLS
(Model
s4–6)
estim
ates
of
the
det
erm
inan
tsof
IRR
s.T
he
Hec
km
anco
rrec
tion
inth
efirs
tst
epfo
rM
odel
s1–3
are
not
report
edfo
rco
nci
senes
s,but
incl
ude
allofth
ein
cluded
var
iable
sin
the
2nd
step
asw
ellas
inves
tmen
tyea
rdum
mie
sfo
rid
entifica
tion.V
aria
ble
sar
eas
defi
ned
inT
able
2.*,**,***Sig
nifi
cant
atth
e10,5,an
d1%
level
s,re
spec
tivel
y.
Douglas Cumming et al.
123 72 Reprinted from the journal

median levels by country. Figure 2 shows a negative
relation between the corruption index and returns,
consistent with Hypothesis 2 and the regressions in
Table VIII, and a positive relation between cor-
ruption and legality, consistent with the Hypothesis
1 and the regressions in Table VIII.
There is further evidence in Table VIII that the
control variables are significant in ways consistent
with expectations. Hofstede’s cultural factors are
generally insignificant. The control variables for
market conditions include GDP per capital, as well
as the MSCI return over the contemporaneous
investment period. GDP is negative and significant
in Models 1–3. That effect, however, is not robust in
Models 4–6 and influences by collinearity in the
other models. MSCI returns are positive and sig-
nificant in Models 4 and 5, but not Models 1–3 with
the Heckman correction for the decision to exit
(which is largely due to the first step variables for the
year of investment). In Models 4–6, the pseudo beta
is estimated to be 1.76–1.80, which is consistent
with other work estimating the beta of venture
capital and private equity investments (Cochrane,
2005; Cumming and Walz, 2010).
Some of the transaction specific factors are sta-
tistically significant as well in Table VIII. There is
evidence that post investment acquisitions are posi-
tively related to IRRs in Model 5, and post invest-
ment divestitures are positively related to IRRs in
Model 3, but these effects are not robust. Enterprise
value at the time of investment is positively associ-
ated with IRRs in Models 1–3. Equity share of the
Figure 2. Country-level relation between corruption, legality and buyout returns. This figure presents country levels
for legal and corruption plotted against median IRRs in the country. Investments in the UK and the US are cross-
border deals, and the slope of the plot lines is not materially affected by inclusion or exclusion of such cross-border
deals. As defined in Table 1, higher levels of the corruption index mean less corruption, while higher levels of the
legality index mean better legal systems.
Legal Protection, Corruption and Private Equity Returns in Asia
12373Reprinted from the journal

PE manager(s) is negatively associated with IRRs in
all the Models, which is likely attributable to the
reduced incentives for the other equity holders and
the lower levels of leverage in such transactions.
Finally, managerial replacement is negatively related
to IRRs in Models 1–3 and 6, which is likely
attributable to the fact that private equity funds are
more likely to replace management when expected
returns are lower. We note that some of these
transaction specific variables are endogenous, and we
do not have viable instruments to control for end-
ogeneity. Nevertheless, the results pertaining to the
central hypotheses are not significantly influenced by
the inclusion or exclusion of these transaction spe-
cific variables.
Concluding remarks
In this article, we have considered, for the first time,
the relationship between legal protection, corruption
and private equity returns in Asia, using transaction
data spanning 20 countries between 1989 and 2009.
We have found that private equity returns are pos-
itively associated with legality and negatively asso-
ciated with corruption. Investors in the region
should be cognizant of this relationship. Legal sys-
tems matter for private equity returns in Asia. In
addition, investors should explicitly examine how
private equity managers add value to their portfolio
companies. Our findings suggest that private equity
managers are active investors who can mitigate the
expected costs of corruption and hence generate
higher returns in more corrupt countries (controlling
for legal system). In addition to these central results,
we noted that private equity fund returns in part
depend on cultural factors, economic conditions and
deal specific characteristics such as equity shares held
by the private equity funds, syndication and mana-
gerial replacement.
Research on the Asian LBO and growth equity
market is in its infancy. This is not surprising as the
institutional history of the market is substantially
younger than the US or Europe. Existing literature
has focused on the institutional development of
particular countries or on topics where public data is
available (e.g., public-to-private transactions). Insti-
tutional investors have not, until recently, been able
to draw upon empirical analysis to improve their
understanding of the impact of legal and political
systems on private equity returns in Asia. Our paper
is a first contribution to what we hope is a growing
body of work on this topic.
Notes
1 The interplay between law and private equity has
likewise attracted much attention in political and eco-
nomic debate. For a representative discussion of the
regulatory debate on private equity funds after the mid-
2007 financial crisis, see The Economist, 19 November
2009, ‘‘Europe’s War on Hedge Funds’’.2 We acknowledge that an alternative interpretation of
a positive association between corruption and private
equity returns could be that private equity fund manag-
ers are themselves ‘‘corrupt’’ (i.e., expropriate rents) and
able to take advantage of investee firms in more corrup-
tion economies. However, we include a number of
transaction specific variables in our empirical tests that
account for this view.3 Practitioner publications have led the commentary
on the development of these markets. See, for example,
Bruton et al. (1999) and Ippolito (2007).4 The emergence of venture capital markets in these
countries has also been documented. On China see
Ahlstrom et al. (2007), and Wright (2007b). On India
see Pruthi et al. (2003).5 As Lerner et al. (2008) note, LBOs in China are
being transacted with ‘‘uniquely Chinese characteristics
that reflect the country’s legal and economic realities’’.
Li and Rozelle (2003, 2004) and Li et al. (2005) exam-
ine Chinese privatizations and management buyouts in
more detail.6 The IRR data uses the cash flows of the private
equity investor, as reported by the investor. The authors
have completed reasonableness checks on the IRR cal-
culations. In cases where the IRR was not provided,
the authors calculated the IRR using the holding peri-
od (month and year of entry and exit), investment cost
and total return. This method biases the IRR down-
wards, by assuming all cashflows into the company oc-
cur on the first day of the investment, and are returned
to the investor on the last day (i.e., it does not allow
for interim cashflows which could increase the IRR).7 Private equity-backed companies do not tend to suf-
fer from the separation of voting rights from cash flows
rights which has been a common feature of Asian cor-
porations (see Claessens et al., 2000).
Douglas Cumming et al.
123 74 Reprinted from the journal

8 Comparison of means and medians statistics yielded
similar univariate inferences and are available on re-
quest.
Acknowledgments
For helpful comments and suggestions, we owe thanks
to Bernie Black, Robert Cressy and Christine Mallin
and to the seminar participants at the Canadian Law and
Economics Association (September 2010) and the Law,
Ethics and Finance Conference at York University
(September 2010).
References
Acharya, V., M. Hahn and C. Kehoe: 2009, ‘Corporate
Governance and Value Creation: Evidence from Pri-
vate Equity’. NYU Working Paper No. FIN-08-032,
http://ssrn.com/abstract=1354519.
Ahlstrom, D., G. Bruton and K. Yeh: 2007, ‘Venture
Capital in China: Past, Present, and Future’, Asia Pacific
Journal of Management 24, 247–268.
Barry, C., C. Muscarella, J. Peavey and M. Vetsuypens:
1990, ‘The Role of Venture Capital in the Creation of
Public Companies: Evidence from the Going Public
Process’, Journal of Financial Economics 27, 447–471.
Berkowitz, D., K. Pistor and J. F. Richard: 2003, ‘Eco-
nomic Development, Legality, and the Transplant
Effect’, European Economic Review 47, 165–195.
Bernstein, S., J. Lerner,M.Sorenson andP. Stromberg: 2009,
‘Private Equity, Industry Performance and Cyclicality’, in
Globalization of Alternative Investments Working Papers Vol-
ume 3: The Global Economic Impact of Private Equity Report
2010 (World Economic Forum, Geneva), pp. 3–22.
Bruton, G., M. Dattani, M. Fung, C. Chow and
D. Ahlstrom: 1999, ‘Private Equity in China: Differ-
ences and Similarities with the Western Model’, Journal
of Private Equity 2(2), 7–13.
Cao, J., D. Cumming, M. Qian and X. Wang: 2010,
‘Creditor Rights and LBOs’, http://ssrn.com/abstract=
1086775.
Cao, J. and J. Lerner: 2009, ‘The Performance of Reverse
Leveraged Buyouts’, Journal of Financial Economics
91(2), 139–157.
Claessens, S., S. Djankov and L. Lang: 2000, ‘The Sepa-
ration of Ownership and Control in East Asian Cor-
porations’, Journal of Financial Economics 58, 81–112.
Cochrane, J.: 2005, ‘The Risk and Return to Venture
Capital’, Journal of Financial Economics 75, 3–52.
Cressy, R., F. Munari and A. Malipiero: 2007, ‘Playing to
their Strengths? Evidence that Specialization in the
Private Equity Industry Confers Competitive Advan-
tage’, Journal of Corporate Finance 13, 647–669.
Cumming, D.: 2007, ‘Government Policy Towards
Entrepreneurial Finance: Innovation Investment
Funds’, Journal of Business Venturing 22(2), 193–235.
Cumming, D.: 2008, ‘Contracts and Exits in Venture
Capital Finance’, Review of Financial Studies 21(5),
1947–1982.
Cumming, D., G. Fleming and A. Schwienbacher: 2006,
‘Legality and Venture Capital Exits’, Journal of Corpo-
rate Finance 12, 214–245.
Cumming, D. and S. Johan: 2007, ‘Socially Responsible
Institutional Investment in Private Equity’, Journal of
Business Ethics 75, 395–416.
Cumming, D. and S. Johan: 2009, ‘Legality and Fund
Manager Compensation’, Venture Capital: An Interna-
tional Journal of Entrepreneurial Finance 11, 23–54.
Cumming, D. and J. MacIntosh: 2003, ‘Venture Capital
Exits in Canada and the United States’, University of
Toronto Law Journal 51, 101–200.
Cumming, D., D. Siegel and M. Wright: 2007, ‘Private
Equity, Leveraged Buyouts and Governance’, Journal of
Corporate Finance 13(4), 439–460.
Cumming, D. and U. Walz: 2010, ‘Private Equity Re-
turns and Disclosure Around the World’, Journal of
International Business Studies 41(4), 727–754.
Fang, L. and R. Leeds: 2008a, ‘Chinese Private Equity
Cases: Introduction’, in Globalization of Alternative
Investments Working Papers Volume 1: The Global Eco-
nomic Impact of Private Equity Report 2008 (World
Economic Forum, Geneva), pp. 113–114.
Fang, L. and R. Leeds: 2008b, ‘Indian Private Equity
Cases: Introduction’, in Globalization of Alternative
Investments Working Papers Volume 1: The Global Eco-
nomic Impact of Private Equity Report 2008 (World
Economic Forum, Geneva), pp. 141–142.
Ferris, W.: 2001, ‘Australia Chooses: Venture Capital and
a Future Australia’, Australian Journal of Management 26,
45–64.
Filatotchev, I., K. Starkey and M. Wright: 1994, ‘The
Ethical Challenge of Management Buyouts as a Form
of Privatization in Central and Eastern Europe’, Journal
of Business Ethics 13, 523–532.
Fleming, G.: 2004, ‘Venture Capital Returns in Austra-
lia’, Venture Capital 6(1), 23–45.
Gompers, P. A. and J. Lerner: 1999, The Venture Capital
Cycle (MIT Press, Cambridge, MA).
Heckman, J.: 1976, ‘The common structure of statistical models
of truncation, sample selection, and limited dependent
variables and a simple estimator for such models’, Annals of
Economic and Social Measurement 5, 475–492.
Heckman, J.: 1979, ‘Sample selection bias as a specifica-
tion error’, Econometrica 47, 153–161.
Legal Protection, Corruption and Private Equity Returns in Asia
12375Reprinted from the journal

Ippolito, R.: 2007, ‘Private Equity in China and India’,
Journal of Private Equity 10(4), 36–41.
Jeng, L. and P. Wells: 2000, ‘The Determinants of
Venture Capital Fundraising: Evidence Across Coun-
tries’, Journal of Corporate Finance 6, 241–289.
Johan, S. A. and D. Najar: 2011, ‘The Role of Corrup-
tion, Culture, and Law in Investment Fund Manager
Fees’, Journal of Business Ethics. doi:10.1007/s10551-
011-0852-7.
Jones, T. and R. Hunt: 1991, ‘The Ethics of Manage-
ment Buyouts Revisited’, Journal of Business Ethics 10,
833–840.
Kaplan, S.: 1997, ‘The Evolution of U.S. Corporate
Governance: We Are All Henry Kravis Now’, Journal
of Private Equity 1(1), 7–14.
Kaplan, S. and P. Stromberg: 2009, ‘Leveraged Buyouts
and Private Equity’, Journal of Economic Perspectives
23(1), 121–146.
Koh, W.: 2005, ‘Corporate Restructuring and Manage-
ment Buyouts in the Asia-Pacific and Europe’, Journal
of Restructuring Finance 2(1), 1–8.
Kuroki, M., M. Rice and P. Abetti: 2000, ‘Emerging
Trends in the Japanese Venture Capital Industry’,
Journal of Private Equity 4, 39–39.
La Porta, R., F. Lopez-De-Silanes, A. Shleifer and
R. Vishny: 1998a, ‘Legal Determinants of External
Finance’, Journal of Finance 52, 1131–1150.
La Porta, R., F. Lopez-de-Silanes, A. Shleifer and
R. Vishny: 1998b, ‘Law and Finance’, Journal of
Political Economy 106(6), 1113–1155.
La Porta, R., F. Lopez-de-Silanes, A. Shleifer and
R. Vishny: 2002, ‘Investor Protection and Corpo-
rate Valuation’, Journal of Finance 57(3), 1147–1170.
Lerner, J. and A. Gurung: 2008, ‘Executive Summary’, in
Globalization of Alternative Investments Working Papers Vol-
ume 1: The Global Economic Impact of Private Equity Report
2008 (World Economic Forum, Geneva), pp. vii–xi.
Lerner, J. and A. Schoar: 2005, ‘Does Legal Enforcement
Affect Financial Transactions? The Contractual
Channel in Private Equity’, The Quarterly Journal Eco-
nomics 120(1), 223–246.
Li, H. and S. Rozelle: 2003, ‘Privatizing Rural China:
Insider Privatization, Innovative Contracts, and the
Performance of Township Enterprises’, China Quar-
terly 174, 981–1005.
Li, H. and S. Rozelle: 2004, ‘Insider Privatization with a
Tail: The Screening Contract and Performance of
Privatized Firms in Rural China’, Journal of Develop-
ment Economics 75, 1–26.
Li, H. and Q. Wang: 2005, ‘Management Buyout,
Information, and Firm Performance: How Has Pri-
vatization Worked in China?’, Journal of Restructuring
Finance 2(1), 55–67.
Lin, T. and R. Smith: 1998, ‘Insider Reputation and
Selling Decisions: The Unwinding of Venture Capital
Investments During Equity IPOs’, Journal of Corporate
Finance 4, 241–263.
Martin, T.: 1999, ‘Australian Buyout Market – History
and Potential’, Journal of Private Equity 2(2), 15–30.
Mayer, C., K. Schoors and Y. Yafeh: 2005, ‘Sources of
Funds and Investment Activities of Venture Capital
Funds: Evidence from Germany, Israel, Japan, and
the United Kingdom’, Journal of Corporate Finance 11,
586–608.
Megginson, W. and K. Weiss: 1991, ‘Venture Capital
Certification in Initial Public Offerings’, Journal of
Finance 46, 879–893.
Naqi, S. A. and H. Samanthala: 2007, ‘Venture Capital or
Private Equity? The Asian Experience’, Business Hori-
zons 50(4), 335–344.
Nikoskelainen, E. and M. Wright: 2007, ‘The Impact of
Corporate Governance Mechanisms on Value Increase
in Leveraged Buyouts’, Journal of Corporate Finance
13(4), 511–537.
Pruthi, S., M. Wright and A. Lockett: 2003, ‘Do Foreign
and Domestic Venture Capital Firms Differ in Their
Monitoring of Investees?’, Asia Pacific Journal of Man-
agement 20, 175–204.
Schadler, F. and J. Kahns: 1990, ‘The Unethical Exploi-
tation of Shareholders in Management Buyout
Transactions’, Journal of Business Ethics 9, 595–602.
UBS Private Funds Group: 2009, Asia Private Equity
Market Overview (UBS Investment Bank).
Westcott, M.: 2009, ‘Private Equity in Australia’, Journal
of Industrial Relations 51(4), 529–542.
Wright, M.: 2007a, ‘Private Equity and Management
Buy-outs’, in H. Landstrom (ed.), Handbook of Research
on Venture Capital (Edward Elgar, Cheltenham),
pp. 281–312.
Wright, M.: 2007b, ‘Venture Capital in China: A View
from Europe’, Asia Pacific Journal of Management 24,
269–281.
Wright, M. and H. Bruining: 2008, ‘Private Equity and
Management Buyouts: International Trends, Evidence
and Policy Implications’, in M. Wright and H. Bru-
ining (eds.), Private Equity and Management Buyouts
(Edward Elgar, Cheltenham), pp. 3–80.
Wright, M. and M. Kitamura: 2003, ‘Management
Buyouts in Japan’, Journal of Private Equity 6(2), 86–95.
Wright, M., M. Kitamura and A. Burrows: 2005,
‘Management Buyouts: From Europe to Japan’, Journal
of Restructuring Finance 2(1), 39–54.
Wright, M., M. Kitamura and R. Hoskisson: 2003,
‘Management Buyouts and Restructuring Japanese
Corporations’, Long Range Planning 36(4), 355–
373.
Douglas Cumming et al.
123 76 Reprinted from the journal

Douglas Cumming
York University Schulich School of Business,
Toronto, ON M3J 1P3, Canada
E-mail: [email protected]
Grant Fleming
Continuity Capital Partners, Level 8,
12 Moore Street, Canberra, ACT 2601, Australia
E-mail: [email protected]
School of Finance, Actuarial Studies & Applied Statistics,
College of Business and Economics,
Australian National University,
Canberra, ACT 0200, Australia
Sofia Johan
Tilburg Law and Economics Center,
Postbus 90153, 5000 LE Tilburg, The Netherlands
E-mail: [email protected]
Mai Takeuchi
Wilshire Private Markets, Wilshire Japan K.K.,
4th Floor, East Tower, Otemachi First Square, 1-5-1
Otemachi, Chiyoda-ku, Tokyo 100-0004, Japan
E-mail: [email protected]
Legal Protection, Corruption and Private Equity Returns in Asia
12377Reprinted from the journal