Left ventricular ejection fraction and volumes: It depends on the imaging method
14
REVIEW ARTICLES Left Ventricular Ejection Fraction and Volumes: It Depends on the Imaging Method Peter W. Wood, B.AppSc.,* Jonathan B. Choy, M.D., F.R.C.P.C., F.A.C.C., F.A.S.E.,* Navin C. Nanda, M.D., F.A.C.C.,† and Harald Becher, M.D., Ph.D., F.R.C.P.* *Division of Cardiology, Mazankowski Alberta Heart Institute, Edmonton, Alberta, Canada; and †Division of Cardiovascular Disease, University of Alabama at Birmingham, Birmingham, Alabama Background and Methods: In order to provide guidance for using measurements of left ventricular (LV) volume and ejection fraction (LVEF) from different echocardiographic methods a PubMed review was performed on studies that reported reference values in normal populations for two-dimensional (2D ECHO) and three-dimensional (3D ECHO) echocardiography, nuclear imaging, cardiac computed tomography, and cardiac magnetic resonance imaging (CMR). In addition all studies (2 multicenter, 16 single center) were reviewed, which included at least 30 patients, and the results compared of noncon- trast and contrast 2D ECHO, and 3D ECHO with those of CMR. Results: The lower limits for normal LVEF and the normal ranges for end-diastolic (EDV) and end-systolic (ESV) volumes were different in each method. Only minor differences in LVEF were found in studies comparing CMR and 2D contrast echocardiography or noncontrast 3D echocardiography. However, EDV and ESV measured with all echocardiographic methods were smaller and showed greater variability than those derived from CMR. Regarding agreement with CMR and reproducibility, all studies showed superiority of contrast 2D ECHO over noncontrast 2D ECHO and 3D ECHO over 2D ECHO. No final judgment can be made about the comparison between contrast 2D ECHO and noncontrast or contrast 3D ECHO. Conclusion: Contrast 2D ECHO and noncontrast 3D ECHO show good reproducibility and good agreement with CMR measurements of LVEF. The agreement of volumes is worse. Further studies are required to assess the clinical value of contrast 3D ECHO as noncontrast 3D ECHO is only reliable in patients with good acous- tic windows. (Echocardiography 2014;31:87–100) Key words: echocardiography, contrast imaging, three-dimensional transthoracic echocardiography, left ventricular ejection fraction, left ventricular function Assessment of left ventricular (LV) function and volumes is the corner stone of cardiac diag- nostics. Several imaging methods are in clinical practice and one would assume that these meth- ods would provide the same results. However, if the same patient with stable conditions is investi- gated with different methods, different results are obtained which may have an impact on patient management. This review gives an over- view on comparative studies between echocar- diographic modalities and cardiac magnetic resonance imaging (CMR), which is regarded as the reference method for LV volumes and ejec- tion fraction (LVEF). 1 It will cover the normal val- ues, comparative studies with CMR and a critical assessment of the reproducibility data. A recent article by Dorosz et al. 2 has provided an exten- sive overview and a meta-analysis on studies comparing 2D and 3D echocardiography with CMR. Our review is complementary as it includes contrast echocardiography and provides a more comprehensive section on reproducibility, which has a major impact for clinical use. Methods: Normal values were selected from the guideline papers of the echocardiographic and radiological scientific societies or from articles which estab- lished the normal values. A pubmed review was carried out—including 18 studies, encompassing 1299 patients—comparing studies which included patients with abnormal LV function. Unlike the Dorosz article, the following review had an inclusion criteria of 30 patients or more per study and included contrast echocardiography and several more recent investigations in which Address for correspondence and reprint requests: Peter W. Wood, B.AppSc., ABACUS, Mazankowski Alberta Heart Insti- tute, University of Alberta Hospital, 0A8.32, 8440 - 112 Street, Edmonton, Alberta T6G 2B7, Canada. Fax: 780-407-3489; E-mail: [email protected] This is an open access article under the terms of the Creative Commons Attribution License, which permits use, distribution and reproduction in any medium, provided the original work is properly cited. 87 © 2013 The Authors. Echocardiography published by Wiley Periodicals, Inc. DOI: 10.1111/echo.12331 Echocardiography
-
Upload
independent -
Category
Documents
-
view
1 -
download
0
Transcript of Left ventricular ejection fraction and volumes: It depends on the imaging method

REVIEW ARTICLES
Left Ventricular Ejection Fraction and Volumes:It Depends on the Imaging Method
Peter W. Wood, B.AppSc.,* Jonathan B. Choy, M.D., F.R.C.P.C., F.A.C.C., F.A.S.E.,*Navin C. Nanda, M.D., F.A.C.C.,† and Harald Becher, M.D., Ph.D., F.R.C.P.*
*Division of Cardiology, Mazankowski Alberta Heart Institute, Edmonton, Alberta, Canada; and †Division ofCardiovascular Disease, University of Alabama at Birmingham, Birmingham, Alabama
Background and Methods: In order to provide guidance for using measurements of left ventricular (LV)volume and ejection fraction (LVEF) from different echocardiographic methods a PubMed review wasperformed on studies that reported reference values in normal populations for two-dimensional (2DECHO) and three-dimensional (3D ECHO) echocardiography, nuclear imaging, cardiac computedtomography, and cardiac magnetic resonance imaging (CMR). In addition all studies (2 multicenter, 16single center) were reviewed, which included at least 30 patients, and the results compared of noncon-trast and contrast 2D ECHO, and 3D ECHO with those of CMR. Results: The lower limits for normalLVEF and the normal ranges for end-diastolic (EDV) and end-systolic (ESV) volumes were different ineach method. Only minor differences in LVEF were found in studies comparing CMR and 2D contrastechocardiography or noncontrast 3D echocardiography. However, EDV and ESV measured with allechocardiographic methods were smaller and showed greater variability than those derived from CMR.Regarding agreement with CMR and reproducibility, all studies showed superiority of contrast 2D ECHOover noncontrast 2D ECHO and 3D ECHO over 2D ECHO. No final judgment can be made about thecomparison between contrast 2D ECHO and noncontrast or contrast 3D ECHO. Conclusion: Contrast2D ECHO and noncontrast 3D ECHO show good reproducibility and good agreement with CMRmeasurements of LVEF. The agreement of volumes is worse. Further studies are required to assess theclinical value of contrast 3D ECHO as noncontrast 3D ECHO is only reliable in patients with good acous-tic windows. (Echocardiography 2014;31:87–100)
Key words: echocardiography, contrast imaging, three-dimensional transthoracic echocardiography,left ventricular ejection fraction, left ventricular function
Assessment of left ventricular (LV) functionand volumes is the corner stone of cardiac diag-nostics. Several imaging methods are in clinicalpractice and one would assume that these meth-ods would provide the same results. However, ifthe same patient with stable conditions is investi-gated with different methods, different resultsare obtained which may have an impact onpatient management. This review gives an over-view on comparative studies between echocar-diographic modalities and cardiac magneticresonance imaging (CMR), which is regarded asthe reference method for LV volumes and ejec-tion fraction (LVEF).1 It will cover the normal val-
ues, comparative studies with CMR and a criticalassessment of the reproducibility data. A recentarticle by Dorosz et al.2 has provided an exten-sive overview and a meta-analysis on studiescomparing 2D and 3D echocardiography withCMR. Our review is complementary as it includescontrast echocardiography and provides a morecomprehensive section on reproducibility, whichhas a major impact for clinical use.
Methods:Normal values were selected from the guidelinepapers of the echocardiographic and radiologicalscientific societies or from articles which estab-lished the normal values. A pubmed review wascarried out—including 18 studies, encompassing1299 patients—comparing studies whichincluded patients with abnormal LV function.Unlike the Dorosz article, the following review hadan inclusion criteria of 30 patients or more perstudy and included contrast echocardiographyand several more recent investigations in which
Address for correspondence and reprint requests: Peter W.Wood, B.AppSc., ABACUS, Mazankowski Alberta Heart Insti-tute, University of Alberta Hospital, 0A8.32, 8440 - 112 Street,Edmonton, Alberta T6G 2B7, Canada. Fax: 780-407-3489;E-mail: [email protected] is an open access article under the terms of the CreativeCommons Attribution License, which permits use, distributionand reproduction in any medium, provided the original workis properly cited.
87
© 2013 The Authors. Echocardiography published by Wiley Periodicals, Inc.DOI: 10.1111/echo.12331 Echocardiography

Bland–Altman (BA) analysis was used as themethod of calculating agreement with CMR in dif-ferent patient groups. In these studies bothpatients with normal and abnormal hearts wereincluded. In abnormal hearts the differencesbetween the different imaging methods maybecome evenmore relevant.
BA analysis provides 2 parameters which allowto assess the agreement between different meth-ods which measure the same parameter—biasand limits of agreement (LOA). Bias means themeasurements with a specific echocardiographictechnique are systematically different from theCMR measurements, which are regarded as thereference standard. A bias can be positive (= over-estimation compared with the CMR measure-ments) or negative (= underestimation comparedwith the CMR measurements). For example, abias of 5% means that the echocardiographicmethod overestimates the CMR measurementson an average by 5%. The LOA represent thedegree of accuracy between the echocardio-graphic measurements and the CMR measure-ments. The LOA are calculated by 2 (or 1.96)standard deviations (SD) of the differences andcovers the range of values which includes 95% ofall the differences between the echocardiographic
and CMRmeasurements. For example, with a biasof –5% and 2 SD = 10% the range is �15 to+5%. The smaller the LOA range the better is theagreement of the echocardiographic methodwhen compared with CMR.3 In the review, wealso included studies which used other methodfor assessment of the inter- and intra-observer var-iability such as intra-class correlation coefficients(ICC), and coefficient of variability (CV).
Results:Normal Values:The normal values for LV volumes and LVEF areshown in Tables I–III which have been extrapo-lated from different references (mean � 2SD),with particular importance placed on the lowerlimits of LVEF, as these are clinical indicators forLV impairment. There are major discrepanciesbetween modalities and processing techniques.There are also differences between gender andvarious ethnicities.4–15
Studies Comparing EchocardiographicMethods with CMR:Only 2 multicenter studies have been performedto compare CMR with echocardiographic
TABLE I
Normal Values for Left Ventricular Ejection Fraction
Article N Mode Male EF Lower Limit (%) Female Lower Limit (%)
Alfakih et al.4 60 MRI TGE 57.0 58.0Alfakih et al.4 60 MRI SSFP 55.0 54.0Cain et al.5 96 MRI gradient echo* 49.0 (61–80 years) 53.0 (61–80 years)Nikitin et al.6 95 MRI SSFP 66.0 (<65 years) 68.0 (>65 years)
70.0 (>65 years) 72.0 (>65 years)Lang et al. (ASE guidelines)7 510 2D ECHO 55.0 55.0Aune et al.8 166 3D ECHO 49.0 49.0Fukuda et al.9 – Japanese 410 3D ECHO (QLAB, TomTec) 51.0 (60–69 years) 53.0 (60–69 years)Chahal et al.10 – European white 499 3D ECHO 50.0 (35–44 years) 52.0 (35–44 years)
52.0 (45–54 years) 51.0 (45–54 years)48.0 (55–64 years) 53.0 (55–64 years)47.0 (65–75 years) 55.0 (65–75 years)
Chahal et al.10 – Indian Asian 479 3D ECHO 50.0 (35–44 years) 53.0 (35–44 years)51.0 (45–54 years) 52.0 (45–54 years)51.0 (55–64 years) 53.0 (55–64 years)53.0 (65–75 years) 55.0 (65–75 years)
Wang et al.11 140 gSPECT QGS 51.1 57.6Wang et al.11 140 gSPECT 4D-MSPECT 57.1 51.5Nakajima et al.12 268 gSPECT QGS 48.7 55.5Hor et al.13 585 RNV 49.0 49.0Pfisterer et al.14 1200 RNV 45.0 45.0Jongjirasiri et al.15 115 320-CT 47.4 53.1
ASE = american society of echocardiography; MRI = magnetic resonance imaging; TGE = turbo gradient echo; SSFP = steady-state free procession; 2D = two-dimensional; 3D = three-dimensional; ECHO = echocardiography; gSPECT = gated single photonemission computed tomography; QGS = quantitative gated single photon emission computed tomography software; 4D-MSPECT = four-dimensional myocardial single photon emission computed tomography; RNV = radionuclide ventriculography;320-CT = 320 slice computed tomography.*Sequence not specified.
88
Wood, et al.

imaging modalities (marked by a † in Figs. 1–3). Hoffman et al. investigated 120 patientswith variable levels of LV function, of which 55patients had CMR as well as standard and con-trast two-dimensional echocardiography (2DECHO). They showed in BA analysis for unen-hanced 2D ECHO (Simpson’s biplane) LVEF tohave a good agreement (bias = 0.8%;LOA = �20.0% to 21.6%) with CMR. Contrast-enhanced 2D ECHO (Simpson’s biplane)showed a similar agreement (bias = 4.6%; LOAsof �12.4% to 21.6%). End-diastolic volume(EDV) and end-systolic volume (ESV) in unen-hanced 2D ECHO showed a bias of �72.3 mL(LOA = �150.3 to 5.7 mL) and �35.7 mL(LOA = �99.4 to 28 mL), respectively, com-pared with �42.3 mL (LOA = �114.6 to30 mL) and �27.2 mL (LOA = �80.9 to26.5 mL) using contrast 2D ECHO. Variouscombinations of 3 readers (1 onsite and 2 off-
site) produced mean percentage errors (MPE)and confidence intervals (95% CI) for 2D ECHO(12.8, 10.9–14.8; 11.7, 10.1–13.4; 12.6, 10.4–14.8) and for contrast 2D ECHO (8.9, 7.5–10.3;8.8, 7.5–10.2; 4.1, 3.1–5.0). These showed aclear improved agreement when contrast echo-cardiographic agents were used.16 The secondmulticenter study, consisting of 92 patients withvarious degrees of LV function as assessed bySimpson’s biplane LVEF assessment, was carriedout by Mor-Avi et al. investigating the accuracyand reproducibility of three-dimensional echo-cardiography (3D ECHO) (5 beat volume acqui-sition; QLAB, Philips Ultrasound Ltd., Bothell,Washington, USA). The bias (LOAs) were �3%(LOA = �22%), �67 mL (LOA = �90 mL), and�41 mL (LOA = �90 mL) for LVEF, EDV, andESV, respectively. The degree of bias in the vol-ume calculations was attributed to the lessexperienced centers in 3D ECHO utilization,
TABLE II
Normal Values for Left Ventricular End-Diastolic Volume Index from the Literature
Article N ModeMale EDV Lower
Limit (mL)Male EDV Upper
Limit (mL)Female EDV Lower
Limit (mL)Female EDV Upper
Limit (mL)
Alfakih et al.4 60 MRI TGE 45.0 (40–65 years) 104.0 (40–65 years) 48.0 (40–65 years) 94.0 (40–65 years)Alfakih et al.4 60 MRI SSFP 53.0 (40–65 years) 112.0 (40–65 years) 56.0 (40–65 years) 99.0 (40–65 years)Cain et al.5 96 MRI gradient
echo†48.0 (51–60 years) 97.0 (51–60 years) 46.0 (51–60 years) 87.0 (51–60 years)43.0 (61–70 years) 92.0 (61–70 years) 45.0 (61–70 years) 86.0 (61–70 years)36.0 (71–80 years) 88.0 (71–80 years) 44.0 (71–80 years) 87.0 (71–80 years)
Nikitin et al.6 95 MRI SSFP 63.0 (<65 years) 73.0 (<65 years) 63.0 (<65 years) 73.0 (<65 years)54.0 (>65 years) 67.0 (>65 years) 56.0 (>65 years) 69.0 (>65 years)
Lang et al. (ASEguidelines)7
510 2D ECHO 35.0 75.0 35.0 75.0
Aune et al.8 166 3D ECHO 46.0 86.0 42.0 74.0Fukuda et al.9 –Japanese
410 3D ECHO(QLAB,TomTec)
21.0 (50–59 years) 69.0 (50–59 years) 28.0 (50–59 years) 60.0 (50–59 years)20.0 (60–69 years) 68.0 (60–69 years) 25.0 (60–69 years) 57.0 (60–69 years)
Chahal et al.10 –European White
499 3D ECHO N/A 72.0 (35–44 years) 64.0 (35–44 years)71.0 (45–54 years) 59.0 (45–54 years)64.0 (55–64 years) 56.0 (55–64 years)62.0 (65–75 years) 52.0 (65–75 years)
Chahal et al.10 –Indian Asian
479 3D ECHO N/A 63.0 (35–44 years) N/A 59.0 (35–44 years)57.0 (45–54 years) 53.0 (45–54 years)55.0 (55–64 years) 49.0 (55–64 years)56.0 (65–75 years) 60.0 (65–75 years)
Wang et al.11 140 gSPECT QGS 17.6 62.4 14.7 51.1Wang et al.11 140 gSPECT 4D-
MSPECT15.4 60.2 12.8 53.2
Nakajima et al.12 268 gSPECT QGS 27.5 74.1 17.9 60.7Hor et al.13* 585 RNV 130.0 160.0 130.0 160.0Jongjirasiri et al.15* 115 320-CT 88.0 157.2 61.7 128.1
Values are indexed to body surface area. ASE = american society of echocardiography; MRI = magnetic resonance imaging;TGE = turbo gradient ECHO; SSFP = steady-state free procession; 2D = two-dimensional; 3D = three-dimensional; ECHO = echo-cardiography; gSPECT = gated single photon emission computed tomography; QGS = quantitative gated single photon emissioncomputed tomography software; 4D-MSPECT = four-dimensional myocardial single photon emission computed tomography;RNV = radionuclide ventriculography; 320-CT = 320 slice computed tomography.*Values were not indexed.†Sequence not specified.
89
Assessment of LV Function

which highlights the importance of adequatetraining in the utilization of 3D ECHO for LVfunction assessment.17
There are 16 single center studies whichsatisfy the inclusion criteria of this review; 3 ofwhich included ≥100 patients (highlighted by abox in Figs. 1–3). Whereas native and contrastechocardiography can be performed with allstate of the art scanners, there are currently only4 commercially available systems for 3D ECHOwith their specific analysis software (Philips Ultra-sound Ltd., Bothell, WA, USA, GE Healthcare, SaltLake City, UT, USA, Siemens Healthcare, Erlan-gen, Germany, and Toshiba America MedicalSystems Inc., California, USA). In addition, thereis one commercially available software for off lineanalysis (TomTec Imaging Systems, Untershleis-sheim, Germany). No studies have been per-formed to compare measurements obtained onscanners from different manufacturers. Thesingle center studies included a total of 1087
patients and healthy volunteers. The bias andLOA for measurements of LVEF, EDV, and ESV areshown in Figures 1–3.16–33 The findings in singleand multicenter studies can be concluded asfollows:
1 2D contrast echocardiography is superiorto 2D noncontrast echocardiographyregarding agreement of volume and LVEFmeasurements. The volumes measuredwith 2D contrast echocardiography arecloser to the corresponding CMR measure-ments than those obtained with noncon-trast echocardiography. Contrast 2Dechocardiography is particularly useful inpatients with poor acoustic win-dows.16,19,20
2 Most studies showed the superiority ofnoncontrast 3D over noncontrast 2DECHO.16–33 In particular the measuredvolumes deviated less from the CMR
TABLE III
Normal Values for Left Ventricular End-Systolic Volume Index from the Literature
Article N ModeMale ESV Lower
Limit (mL)Male ESV Upper
Limit (mL)Female ESV Lower
Limit (mL)Female ESV Upper
Limit (mL)
Alfakih et al.4* 60 MRI TGE 19.7 (40–65 years) 78.9 (40–65 years) 22.0 (40–65 years) 56.0 (40–65 years)Alfakih et al.4* 60 MRI SSFP 26.1 (40–65 years) 89.7 (40–65 years) 26.8 (40–65 years) 68.8 (40–65 years)Cain et al.5 96 MRI gradient
echo†14.0 (51–60 years) 46.0 (51–60 years) 13.0 (51–60 years) 37.0 (51–60 years)12.0 (61–70 years) 44.0 (61–70 years) 14.0 (61–70 years) 38.0 (61–70 years)8.0 (71–80 years) 43.0 (71–80 years) 14.0 (71–80 years) 39.0 (71–80 years)
Nikitin et al.6 95 MRI SSFP 19.0 (<65 years) 24.0 (<65 years) 19.0 (<65 years) 23.0 (<65 years)15.0 (>65 years) 20.0 (>65 years) 13.0 (>65 years) 20.0 (>65 years)
Lang et al.(ASE guidelines)7
510 2D ECHO 12.0 30.0 12.0 30.0
Aune et al.8 166 3D ECHO 17.0 41.0 13.0 33.0Fukuda et al.9 –Japanese
410 3D ECHO 7.0 (50–59 years) 27.0 (50–59 years) 8.0 (50–59 years) 24.0 (50–59 years)7.0 (60–69 years) 27.0 (60–69 years) 7.0 (60–69 years) 23.0 (60–69 years)
Chahal et al.10 –EuropeanWhite
499 3D ECHO 30.0 (35–44 years) N/A 26.0 (35–44 years) N/A32.0 (45–54 years) 26.0 (45–54 years)29.0 (55–64 years) 21.0 (55–64 years)26.0 (65–75 years) 20.0 (65–75 years)
Chahal et al.10 –Indian Asian
479 3D ECHO 28.0 (35–44 years) N/A 23.0 (35–44 years) N/A24.0 (45–54 years) 21.0 (45–54 years)23.0 (55–64 years) 19.0 (55–64 years)24.0 (65–75 years) 22.0 (65–75 years)
Wang et al.11 140 gSPECT QGS 26.6 17.3Wang et al.11 140 gSPECT 4D-
MSPECT20.4 20.1
Nakajima et al.12 268 gSPECT QGS 33.2 23.7Hor et al.13* 585 RNV 50.0 60.0 50.0 60.0Jongjirasiri et al.15* 115 320-CT 28.4 68.0 15.9 52.3
Values are indexed to body surface area. ASE = american society of echocardiography; MRI = magnetic resonance imaging;TGE = turbo gradient ECHO; SSFP = steady-state free procession; 2D = two-dimensional; 3D = three-dimensional; ECHO = echo-cardiography; gSPECT = gated single photon emission computed tomography; QGS = quantitative gated single photon emissioncomputed tomography software; 4D-MSPECT = four-dimensional myocardial single photon emission computed tomography;RNV = radionuclide ventriculography; 320-CT = 320 slice computed tomography.*Values were not indexed.†Sequence not specified.
90
Wood, et al.

measurements using noncontrast 3D ECHOcompared with noncontrast 2D ECHO.Only one study specifically focused onpatients with LV aneurysms and seemed toshow similar results compared with theother studies.22
3 There are several studies exploring differ-ent recording and analysis protocols fornoncontrast 3D ECHO. The most fre-quently used technique for 3D ECHO vol-ume measurements is voxel count. Theborders of the LV cavity are traced semi-
automatically and the voxels (known vol-ume) inside the traced volume arecounted. The difference between theanalysis software from different manufac-turers is the number of 2D slices, whichare used for the initial tracing of theendocardium. Whereas, QLAB uses 2orthogonal views, TomTec uses at least 3planes, however, after segmentation allfurther measurements are performed viavoxel count. Jacobs et al.21 showed bet-ter results using the 3D voxel counting
Figure 1. Comparison of echocardiographic techniques with cardiacmagnetic resonance imaging formeasurement of ejection frac-tion(%).Redsquarebox indicatesbias comparedwithmagnetic resonance imaging.Blue lineateachendof theplots indicates the lowerandupper limitsofagreementcalculatedbyBland–Altman.2DECHO = two-dimensionalechocardiography;3DECHO = three-dimen-sionalechocardiography;NSR = normalsinusrhythm;MOD = methodofdisks;QLAB = PhilipsonlineandofflineLVvolumecalculationtool; TomTec = offline left ventricular volume calculation tool.† indicatesmulticenter studies. Values in squarebrackets are thepercent-ageofpatientswithoutdiseasewithineachstudy.
91
Assessment of LV Function

method compared with biplane Simpsonobtained from a 3D dataset. Voxel countwas also superior to multiplane measure-ments of LVEF.23,25 There was no signifi-cant difference in LVEF estimationbetween the QLAB and TomTec voxelmethods.29,31 However, the TomTec vol-ume measurements were closer to CMRthan the QLAB measurements.24
4 Most 3D studies used a multibeat acquisi-tion: that means that the 3D dataset isacquired by small datasets, which areacquired during 4 or more consecutivebeats and are electronically stitchedtogether. A study by Macron et al. investi-gated the impact of single beat acquisition(which is associated with limited temporaland spatial resolution) versus multibeat 3DECHO image acquisition. The single beatacquisition resulted in significantly smallerand more variable measurements of ejec-tion fraction (bias 5%) compared with4 beat acquisitions.32 Thavendiranathan
et al.33 used a real time scanner (Siemens,CA, USA), which provides high volumerates and showed good agreement withCMR. They also were able to scan patientswith atrial fibrillation. The authors went onto report the effect of adding variousamounts of adjustments to the endocardialborder of the contour algorithm, demon-strating a closer relationship with CMR inLVEF measurements when the contourfinding algorithm is moved slightly outsidethe initially traced contour so as to includethe small LV trabeculations.
5 No final judgment can be made about thecomparison between 2D contrast and 3Dnoncontrast and contrast studies. No studyyet fulfilled the inclusion criteria for thisreview, but there is a European multicenterstudy completed, which will be availablewithin a year. Caiani et al. compared 3DECHO with 2D ECHO (Simpson’s biplane)and CMR in a population of 46 patients ofwhich a subset of 14 consented for contrast
Figure 2. Comparison of echocardiographic techniques with cardiac magnetic resonance imaging for measurement of end-dia-stolic volume (mL). Red square box indicates bias compared with magnetic resonance imaging. Blue line at each end of the plotsindicates the lower and upper limits of agreement calculated by Bland–Altman. MRI = magnetic resonance imaging; 2DECHO = two-dimensional echocardiography; 3D ECHO = three-dimensional echocardiography; NSR = normal sinus rhythm;MOD = method of disks; QLAB = Philips online and offline LV volume calculation tool; TomTec = offline left ventricular volumecalculation tool.
92
Wood, et al.

infusion during 3D ECHO acquisition. TheLVEF was not different with both methods,but the agreement of EDV and ESV becameworse when a contrast agent was used, thebias (LOA) for contrast EDV was �34 mLcompared to �5.7 mL for native 3D ECHO.It was suggested by the authors that thisnegative impact of values relative to thereference method may have been due tobubble destruction, resulting from the highdensity of scanlines required for full volu-metric acquisition.26 In a recent study ofThavendiranathan and colleagues thereproducibility of noncontrast 3D ECHOexceeded that of 2D and 3D contrast echo-cardiography. But, this study included onlypatients with good image quality and noCMR measurements were performed.34
Observer Variability in the ComparativeStudies:Different methods of statistical analysis were usedto assess the reproducibility of tests between 2
different observers and of repeat tests for thesame observer; ICC, BA method, CV, andpercentage difference of the mean (MD).3,35
Pearson’s correlation coefficient was also used inone article. Generally, using ICC as the statisticaltest for assessing reproducibility, 3D ECHO wasmore reproducible than 2D ECHO. With BA anal-ysis there was an obvious difference between the2 methods, although, BA was not used very oftenfor comparison in 3D ECHO. The most frequentlyused test for 3D ECHO was MD, defined as theabsolute difference between correspondingrepeated measurements expressed in percentageof their mean, which showed an improvementof 3D ECHO as compared with 2D ECHO(Tables IV–VI).
The reproducibility of CMR measurements isbetter than that measured with noncontrast 2DECHO in most studies. But with contrast echocar-diography there are only minor differences in par-ticular for LVEF—in the multicenter study ofHoffman et al. contrast 2D ECHO had a better var-iability using ICC than did CMR (0.91 vs. 0.86,respectively) when the onsite reader and 2 offsite
Figure 3. Comparison of echocardiographic techniques with cardiac magnetic resonance imaging for measurement of end-sys-tolic volume (mL). Red square box indicates bias compared with magnetic resonance imaging. Blue line at each end of the plotsindicates the lower and upper limits of agreement calculated by Bland–Altman. MRI = magnetic resonance imaging; 2DECHO = two-dimensional echocardiography; 3D ECHO = three-dimensional echocardiography; NSR = normal sinus rhythm;MOD = method of disks; QLAB = Philips online and offline LV volume calculation tool; TomTec = offline left ventricular volumecalculation tool.
93
Assessment of LV Function

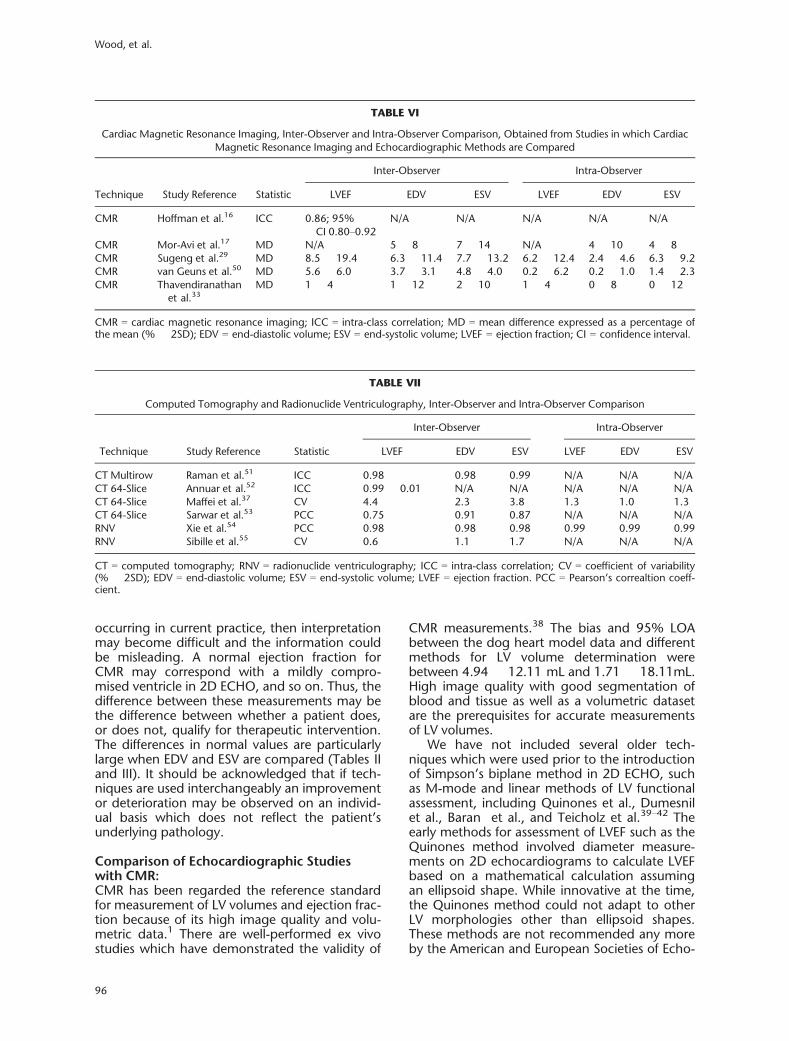
readers were compared.16 The inter- and intra-observer variability of CMR measurements aredependent on the expertise of the readers.36 Theinter-observer variability of LVEF measurementscan be improved from 7.2% to 3.7% after train-ing.36 In Table VI the studies are listed in whichthe reproducibility was reported for CMR. The var-iability of computed tomography (CT) and radio-nuclide ventriculography (RNV) reported byseparate studies are listed in Table VII; all of whichreported excellent variability except one studywhich reported a correlation coefficient of 0.6 forLVEF by RNV. This is not surprising as CT utilizesthe same methods for border delineation and vol-ume calculation as CMR using images with higherspatial resolution.37
Discussion:This is the most comprehensive review onechocardiographic methods for measurementof ejection fraction. We have indeed includedthe entire spectrum of available echocardio-graphic methods for assessment of LV function.A recent review and meta-analysis of Dorosz etal.2 provided an excellent summary of native2D and 3D ECHO, but did not include otherfrequently used technologies such as contrastechocardiography. There are only 2 more
recent articles comparing 2D and 3D ECHOwith CMR (Chang et al. and Thavendiranathanet al.27,33). That warrants no new meta-analysison this topic. For the comparison of contrastechocardiography or M mode echocardiogra-phy with CMR there were not enough studiesto justify a meta-analysis.
Normal Values:It is important to have a reference point fromwhich to compare values. In a perfect world onenormal range should apply for all cardiac imagingtools in calculating ejection fraction and volumet-ric measurements. However, it is becoming appar-ent that due to the differences in methodologyand algorithms between diagnostic modalities afixed value is not possible, and so it is necessary todevelop a range of normal values correspondingto specific modalities. This may even be the casefor various software packages used in the samediagnostic tool (Tables I–III). The reference valuesare based on studies involving cohorts as low as60 patients ranging up to 1200.
In circumstances such as monitoring of treat-ment with potentially cardiotoxic drugs (trastu-zumab), accurate assessment of LVEF is crucial.However, if measurements are used interchange-ably between different tests, which may be
TABLE IV
Two-Dimensional Echocardiography, Inter-Observer and Intra-Observer Comparison
Technique Study Reference Statistic
Inter-Observer Intra-Observer
LVEF EDV ESV LVEF EDV ESV
Simpson’sbiplane
Malm et al.20* BA �15.4% �25.7 mL �20 mL �9.45% N/A N/A
Simpson’sbiplane
Jacobs et al.21 MD 14 � 17 19 � 20 24 � 21 13 � 11 13 � 21 24 � 24BA �18% �42 mL �20 mL �12% �46 mL �24 mL
Simpson’sbiplane
Caiani et al.26 CV 14.2† 26.4† 37.7†
ICC N/A 0.91 0.92Simpson’sbiplane
Gutierrez-Chico et al.23
ICC 0.94 0.58 0.83 0.92 0.80 0.89
Simpson’sbiplane
Hoffman et al.16 ICC 0.79 N/A N/A N/A N/A N/A
Simpsonsbiplanecontrast
Hoffman et al.16 ICC 0.91 N/A N/A N/A N/A N/A
Simpsonsbiplanecontrast
Malm et al.20* BA �6.4% �20.7 mL �15.2 mL �3.95% N/A N/A
3D ECHObiplane(TomTec)
Gutierrez-Chico et al.23
ICC 0.96 0.97 0.99 0.97 0.98 0.97
ICC = intra-class correlation coefficient; CV = coefficient of variability (%); BA = Bland–Altman (limits of agreement � 2SD);MD = mean difference expressed as a percentage of the mean (% � 2SD); EDV = end-diastolic volume; ESV = end-systolic vol-ume; LVEF = ejection fraction; CI = confidence interval.*Bias not made available.†Standard deviation not reported.
94
Wood, et al.

TABLE
V
Three-Dim
ension
alEcho
cardiograp
hyInter-Observeran
dIntra-ObserverCom
parison
oftheLiterature
with
VaryingMetho
dsof
Statistic
alAna
lysis
Tech
niqu
eStud
yRe
ferenc
eStatistic
Inter-Observer
Intra-Observer
LVEF
EDV
ESV
LVEF
EDV
ESV
5Bt
(QLA
B)Mor-Aviet
al.17
CV
N/A
8�
1613
�28
N/A
5�
1010
�22
4Bt
(QLA
B)Jaco
bset
al.21
MD
5�
410
�8
11�
610
�5
10�
611
�5
BA3�
4%14
�20
mL
7�
10mL
6�
6%13
�14
mL
6�
6mL
4Bt
(Tom
Tec)
Suge
nget
al.29
MD
10.5
�16
.611
.2�
17.2
14.2
�23
.65.6�
6.8
3.9�
45.6�
7.8
4Bt
(QLA
B)So
liman
etal.31
MD
9.7�
8.8
12.2
�10
.113
.6�
11.2
7.3�
9.1
7.2�
8.1
9.1�
7.2
4Bt
(Tom
Tec)
Solim
anet
al.31
MD
7.1�
6.9
6.4�
7.8
7.8�
9.7
6.6�
7.4
4.7�
3.2
6.1�
5.8
1Bt
(Ech
oPAC)
Macronet
al.32
MD
8.6�
23.2
9.2�
11.2
11.9
�16
.86.8�
8.8
3.4�
7.4
8.0�
10.2
2Bt
(Ech
oPAC)
Macronet
al.32
MD
6.6�
7.8
4.6�
8.4
9.0�
13.8
4.5�
7.8
3.2�
6.6
3.2�
4.8
4Bt
(Ech
oPAC)
Macronet
al.32
MD
9.2�
9.6
5.6�
7.2
9.6�
14.8
6.4�
12.8
3.1�
5.4
4.2�
10.6
1Bt,O
nline
Cha
nget
al.27
ICC
0.99
0.99
0.99
0.99
BAN/A
�1.62�
8.78
mL
�0.32�
10.0
mL
N/A
�7.91�
33.06mL
�1.62�
6.85
mL
4Pl
(Tom
Tec)
Gutierrez-Chico
etal.23
ICC
0.98
0.99
0.99
0.99
0.99
0.99
8Pl
(Tom
Tec)
Gutierrez-Chico
etal.23
ICC
0.99
0.99
0.99
0.99
0.99
0.99
4Bt
(Tom
Tec)
Qietal.30
PCC
0.98
0.99
50.99
80.94
80.94
70.98
23to
5Bt
(Siemen
s)Th
aven
dirana
than
etal.33
MD
1�
169�
149�
162�
205�
203�
22
PCC
=Pe
arson’sco
rrelationco
efficien
t;Bt
=be
at;P
l=plan
e;ICC
=intra-classco
rrelation;
CV=co
efficien
tof
varia
bility(%
�2S
D);BA
=Blan
d–Altm
an(Bias�
2SD);MD
=meandif-
ferenc
eex
pressedas
ape
rcen
tage
ofthemean(%
�2S
D);ED
V=en
d-diastolic
volume;
ESV=en
d-systolicvo
lume;
LVEF
=ejectio
nfractio
n.
95
Assessment of LV Function
occurring in current practice, then interpretationmay become difficult and the information couldbe misleading. A normal ejection fraction forCMR may correspond with a mildly compro-mised ventricle in 2D ECHO, and so on. Thus, thedifference between these measurements may bethe difference between whether a patient does,or does not, qualify for therapeutic intervention.The differences in normal values are particularlylarge when EDV and ESV are compared (Tables IIand III). It should be acknowledged that if tech-niques are used interchangeably an improvementor deterioration may be observed on an individ-ual basis which does not reflect the patient’sunderlying pathology.
Comparison of Echocardiographic Studieswith CMR:CMR has been regarded the reference standardfor measurement of LV volumes and ejection frac-tion because of its high image quality and volu-metric data.1 There are well-performed ex vivostudies which have demonstrated the validity of
CMR measurements.38 The bias and 95% LOAbetween the dog heart model data and differentmethods for LV volume determination werebetween 4.94 � 12.11 mL and 1.71 � 18.11mL.High image quality with good segmentation ofblood and tissue as well as a volumetric datasetare the prerequisites for accurate measurementsof LV volumes.
We have not included several older tech-niques which were used prior to the introductionof Simpson’s biplane method in 2D ECHO, suchas M-mode and linear methods of LV functionalassessment, including Quinones et al., Dumesnilet al., Baran et al., and Teicholz et al.39–42 Theearly methods for assessment of LVEF such as theQuinones method involved diameter measure-ments on 2D echocardiograms to calculate LVEFbased on a mathematical calculation assumingan ellipsoid shape. While innovative at the time,the Quinones method could not adapt to otherLV morphologies other than ellipsoid shapes.These methods are not recommended any moreby the American and European Societies of Echo-
TABLE VI
Cardiac Magnetic Resonance Imaging, Inter-Observer and Intra-Observer Comparison, Obtained from Studies in which CardiacMagnetic Resonance Imaging and Echocardiographic Methods are Compared
Technique Study Reference Statistic
Inter-Observer Intra-Observer
LVEF EDV ESV LVEF EDV ESV
CMR Hoffman et al.16 ICC 0.86; 95%CI 0.80–0.92
N/A N/A N/A N/A N/A
CMR Mor-Avi et al.17 MD N/A 5 � 8 7 � 14 N/A 4 � 10 4 � 8CMR Sugeng et al.29 MD 8.5 � 19.4 6.3 � 11.4 7.7 � 13.2 6.2 � 12.4 2.4 � 4.6 6.3 � 9.2CMR van Geuns et al.50 MD 5.6 � 6.0 3.7 � 3.1 4.8 � 4.0 0.2 � 6.2 0.2 � 1.0 1.4 � 2.3CMR Thavendiranathan
et al.33MD 1 � 4 1 � 12 2 � 10 1 � 4 0 � 8 0 � 12
CMR = cardiac magnetic resonance imaging; ICC = intra-class correlation; MD = mean difference expressed as a percentage ofthe mean (% � 2SD); EDV = end-diastolic volume; ESV = end-systolic volume; LVEF = ejection fraction; CI = confidence interval.
TABLE VII
Computed Tomography and Radionuclide Ventriculography, Inter-Observer and Intra-Observer Comparison
Technique Study Reference Statistic
Inter-Observer Intra-Observer
LVEF EDV ESV LVEF EDV ESV
CT Multirow Raman et al.51 ICC 0.98 0.98 0.99 N/A N/A N/ACT 64-Slice Annuar et al.52 ICC 0.99 � 0.01 N/A N/A N/A N/A N/ACT 64-Slice Maffei et al.37 CV 4.4 2.3 3.8 1.3 1.0 1.3CT 64-Slice Sarwar et al.53 PCC 0.75 0.91 0.87 N/A N/A N/ARNV Xie et al.54 PCC 0.98 0.98 0.98 0.99 0.99 0.99RNV Sibille et al.55 CV 0.6 1.1 1.7 N/A N/A N/A
CT = computed tomography; RNV = radionuclide ventriculography; ICC = intra-class correlation; CV = coefficient of variability(% � 2SD); EDV = end-diastolic volume; ESV = end-systolic volume; LVEF = ejection fraction. PCC = Pearson’s correaltion coeff-cient.
96
Wood, et al.

cardiography.7,43 This is due to proven inaccura-cies in ventricles with abnormal shapes and regio-nal wall-motion abnormalities. To our knowledgethere are no studies comparing these methodswith CMR.
One of the difficulties facing LV functionalassessment is that LVEF may be a moving targetas a beat to beat variability has been reported upto 5.8 � 1.7%. LVEF varies with BP, inotropicstate and heart rate. To obtain reliable compari-son of LVEF measurements from 2 different meth-ods it is mandatory to examine the patient underthe same hemodynamic conditions. The effect of
the beat to beat variation can only be minimizedby taking multiple measurements and averagingthe results.44,45 However, in reality this is oftennot carried out due to time constraints and highclinical loads.
There is no systematic difference in the mea-sured ejection fraction between the echocardio-graphic methods and CMR (Fig. 1). As alreadyreported for the normal values there are major dif-ferences in volumes between echocardiographicmethods and CMR. With the use of contrastagents these differences in volume measurementhave reduced, however, this is still not to the level
TABLE VIII
Advantages and Limitations of Echocardiographic Techniques Used for Ventricular Functional Assessment
MethodAssessment
TypeGeometricalAssumption Advantages Limitations
Linear M-mode Yes ● Quick and easy to perform ● Assumes an ellipsoid shaped ventricle● Needs perpendicular parasternal imaging● Depends on acoustic window● Therefore, least accurate method
2D Simpson’sbiplane
Yes ● More accurate and reproduciblethan M-mode.
● Assumes an ellipsoid shaped ventricle● Needs unforeshortened orthogonal views● Depends on acoustic window and operatorexperience● Endocardium often not fully visualized in asingle frame used for manual tracing
2D contrast Simpson’sbiplane
Yes ● More accurate and reproduciblethan 2D● Less susceptible to poor imagequality
● As 2D; but less susceptible to poor imagequality
3D biplane Simpson’sbiplane
Yes ● 2 orthogonal planes from thesame beat● Avoids off-axis views andforeshortening
● Assumes an ellipsoid shaped ventricle● Depends on acoustic window and operatorexperience● Full volume recordings require stable heartrhythm and breath hold (usually 4 beats)otherwise stitching artifacts● Real time acquisition reduces image quality● Lower spatial and temporal resolution than2D
3D Voxel count Partial ● Avoids off-axis views andforeshortening● Automatic border delineationfollowing minimal landmarkallocations● More accurate than 2D and3D biplane
● Depends on acoustic window and operatorexperience● Full volume recordings require stable heartrhythm and breath hold (usually 4 beats)otherwise stitching artifacts● Real time acquisition reduces image quality● Lower spatial and temporal resolution than2D● Has problems fitting to some abnormal LVshapes (i.e. apical infarcts)
3D contrast Voxel count Partial ● Best agreement with CMR andCT angiography
● Few studies available● Artifacts from apical contrast destruction andattenuation● Lowest spatial and temporal resolution● Not all software packages can perform LVassessment with the addition of contrast
LV = left ventricle; 2D = two-dimensional; 3D = three-dimensional; CMR = cardiac magnetic resonance imaging; CT = computedtomography.
97
Assessment of LV Function

where results can be considered interchangeable.Regarding volumes 3D ECHO has been demon-strated to show a large improvement toward thevalues of CMR, and as such, is the most accurateultrasound technique for determining LV func-tion, although the total number of patientsincluded in trials is still small and very good acous-tic windows are needed.46 The most promisingtechnique in echocardiography is certainly con-trast 3D, however, the excellent results demon-strated by the Jenkins group in 2009 could not bereproduced by Caiani et al., and so further inves-tigation is required.47 Table VIII summarizes theadvantages and limitations of the different echo-cardiographic methods.
The reproducibility of the echocardiographytechniques showed a marked improvement withthe introduction of contrast 2D ECHO and 3DECHO in both intra-observer and inter-observermethods and comes close to CMR. However, wethink there is not yet enough data to providebenchmarks for quality assessment. The differingtests used for variability assessments make itdifficult for a reliable assessment to be made—inparticular as some studies do not include eitherintra- or inter-observer calculations. Consideringthe importance of accurate assessment of LVfunction it is remarkable that there has been onlya limited body of comprehensive studies whichallow to define the differences between the differ-ent imaging methods. In particular, the data onthe reproducibility are not satisfactory. The scien-tific societies should encourage studies or regis-tries to broaden the database and to provideguidelines on how to perform validation studies.The BA analysis appears to be an ideal test to ana-lyze differences between methods or betweenobservers. Based on the available studies the dif-ferent imaging techniques for assessment of LVEFand volumes are not interchangeable. If follow-up measurements are necessary they should beperformed with the same method.
In this review, only 2 of the 18 studiesreviewed as validation studies for echocardiogra-phy were multicenter studies. Most of the dataare from single center studies, which are subjectto referral bias. Thus, the reproducibility may beoverestimated. Further investigation from largercohorts is needed.
Is Visual Assessment an Alternative?Visual assessment of LV function on 2D echocar-diograms has been used in many hospitals; forexample, by estimating the LVEF in 5% stepssuch as 30–35% or just classifying the LV func-tion as normal, mildly, moderately, or severelyimpaired. The reason for using a visual ratherthan a quantitative assessment is the extra timeneeded to calculate LV volumes and difficulties to
trace the endocardial borders on still frames. Toour knowledge no studies using visual assessmenthave been published in contrast echocardiogra-phy, where endocardial borders usually are wellseen. Although visual assessment of global LVfunction has been reported to be “reasonable”among experienced readers, the actual inter-observer variability was 5.8%.48 This does notallow the use of visual assessment for follow-upstudies of LVEF and volumes. In CMR a compari-son of visual and quantitative assessment of LVEFshowed a major underestimation (8.4%) withvisual assessment. Therefore, it was recom-mended to use quantitative analysis for accurateassessment of LV function.49
Acknowledgments: Harald Becher received financial supportthrough an endowed chair of the Heart and Stroke Founda-tion of Alberta, Northwest Territories and Nunavut. PeterWood receives a salary from this endowment.
References1. Zamorano JL, Bax JJ, Rademakers FE, et al: Evaluation of
Systolic and Diastolic LV Function. The ESC Textbook of Car-diovascular Imaging. New York: Springer, 2010, pp. 307–320.
2. Dorosz JL, Lezotte DC, Weitzenkamp DA, et al: Perfor-mance of 3-dimensional echocardiography in measuringleft ventricular volumes and ejection fraction: A system-atic review and meta-analysis. J Am Coll Cardiol2012;59:1799–1808.
3. Myles PS, Cui JI: Using the Bland–Altman method tomeasure agreement with repeated measures. Br J Anaesth2007;99:309–311.
4. Alfakih K, Plein S, Thiele H, et al: Normal human left andright ventricular dimensions for MRI as assessed by turbogradient echo and steady-state free precession imagingsequences. J Magn Reson Imaging 2003;17:323–329.
5. Cain PA, Ahl R, Hedstrom E, et al: Age and genderspecific normal values of left ventricular mass, volumeand function for gradient echo magnetic resonanceimaging: A cross sectional study. BMC Med Imaging2009;9:2.
6. Nikitin NP, Huan Loh P, de Silva R, et al: Left ventricularmorphology, global and longitudinal function in normalolder individuals: A cardiac magnetic resonance study.Int J Cardiol 2006;108:76–83.
7. Lang RM, Bierig M, Devereux RB, et al: Recommenda-tions for chamber quantification: a report from the Amer-ican Society of Echocardiography’s Guidelines andStandards Committee and the Chamber QuantificationWriting Group, developed in conjunction with the Euro-pean Association of Echocardiography, a branch of theEuropean Society of Cardiology. J Am Soc Echocardiogr2005;18:1440–1463.
8. Aune E, Bækkevar M, Rødevand O, et al: Reference valuesfor left ventricular volumes with real-time 3-dimensionalechocardiography. Scand Cardiovasc J 2010;44:24–30.
9. Fukuda S, Watanabe H, Daimon M, et al: Normal valuesof real-time 3-dimensional echocardiographic parametersin a Healthy Japanese Population: The JAMP-3D Study.Circ J 2012;76:1177–1181.
10. Chahal NS, Lim TK, Jain P, et al: Population-based refer-ence values for 3D echocardiographic LV volumes andejection fraction. JACC Cardiovasc Imaging 2012;5:1191–1197.
98
Wood, et al.

11. Wang SY, Cheng MF, Hwang JJ, et al: Sex-specific normallimits of left ventricular ejection fraction and volumes esti-mated by gated myocardial perfusion imaging in adultpatients in Taiwan: A comparison between two quantita-tive methods. Nucl Med Commun 2011;32:113–120.
12. Nakajima K, Kusuoka H, Nishimura S, et al: Normal limitsof ejection fraction and volumes determined by gatedSPECT in clinically normal patients without cardiacevents: A study based on the J-ACCESS database. Eur JNucl Med Mol Imaging 2007;34:1088–1096.
13. Hor G, Schicha H, Standke R: Normal values in equilib-rium radionuclide ventriculography. Results of a multi-center study. Nuklearmedizin 1990;29:186–194.
14. Pfisterer ME, Battler A, Zaret BL: Range of normal valuesfor left and right ventricular ejection fraction at rest andduring exercise assessed by radionuclide angiocardiogra-phy. Eur Heart J 1985;6:647–655.
15. Jongjirasiri S, Sritara C, Waeosak P, et al: Normal data ofleft ventricular parameters in non-hypertensive patientsusing 320-slice cardiac CT: A study on intra- and interob-server variability. J Med Assoc Thai 2011;94:1053–1060.
16. Hoffmann R, von Bardeleben S, ten Cate F, et al:Assessment of systolic left ventricular function: A multi-centre comparison of cineventriculography, cardiacmagnetic resonance imaging, unenhanced and contrast-enhanced echocardiography. Eur Heart J 2005;26:607–616.
17. Mor-Avi V, Jenkins C, K€uhl HP, et al: Real-time 3-dimen-sional echocardiographic quantification of left ventricularvolumes: Multicenter study for validation with magneticresonance imaging and investigation of sources of error.JACC Cardiovasc Imaging 2008;1:413–423.
18. Bellenger NG, Burgess MI, Ray SG, et al: Comparison ofleft ventricular ejection fraction and volumes in heart fail-ure by echocardiography, radionuclide ventriculographyand cardiovascular magnetic resonance. Are they inter-changeable? Eur Heart J 2000;21:1387–1396.
19. Mistry N, Halvorsen S, Hoffmann P, et al: Assessment ofleft ventricular function with magnetic resonance imag-ing vs. echocardiography, contrast echocardiography,and single-photon emission computed tomography inpatients with recent ST-elevation myocardial infarction.Eur J Echocardiogr 2010;11:793–800.
20. Malm S, Frigstad S, Sagberg E, et al: Accurate and repro-ducible measurement of left ventricular volume and ejec-tion fraction by contrast echocardiography: Acomparison with magnetic resonance imaging. J Am CollCardiol 2004;44:1030–1035.
21. Jacobs LD, Salgo IS, Goonewardena S, et al: Rapid onlinequantification of left ventricular volume from real-timethree-dimensional echocardiographic data. Eur Heart J2006;27:460–468.
22. Marsan NA, Westenberg JJ, Roes SD, et al: Three-dimen-sional echocardiography for the preoperative assessmentof patients with left ventricular aneurysm. Ann ThoracSurg 2011;91:113–121.
23. Gutierrez-Chico JL, Zamorano JL, Perez de Isla L, et al:Comparison of left ventricular volumes and ejectionfractions measured by three-dimensional echocardiogra-phy versus by two-dimensional echocardiography andcardiac magnetic resonance in patients with various car-diomyopathies. Am J Cardiol 2005;95:809–813.
24. Jenkins C, Chan J, Hanekom L, et al: Accuracy and feasi-bility of online 3-dimensional echocardiography for mea-surement of left ventricular parameters. J Am SocEchocardiogr 2006;19:1119–1128.
25. Chukwu EO, Barasch E, Mihalatos DG, et al: Relativeimportance of errors in left ventricular quantitation bytwo-dimensional echocardiography: Insights from three-dimensional echocardiography and cardiac magnetic res-onance imaging. J Am Soc Echocardiogr 2008;21:990–997.
26. Caiani EG, Corsi C, Zamorano J, et al: Improved semiau-tomated quantification of left ventricular volumes andejection fraction using 3-dimensional echocardiographywith a full matrix-array transducer: Comparison withmagnetic resonance imaging. J Am Soc Echocardiogr2005;18:779–788.
27. Chang S, Lee S, Kim E, et al: Feasibility of single-beat full-volume capture real-time three-dimensional echocardi-ography and auto-contouring algorithm for quantifica-tion of left ventricular volume: Validation with cardiacmagnetic resonance imaging. J Am Soc Echocardiogr2011;24:853–859.
28. Pouleur AC, le Polain de Waroux JB, Pasquet A, et al:Assessment of left ventricular mass and volumes by three-dimensional echocardiography in patients with or with-out wall motion abnormalities: Comparison against cinemagnetic resonance imaging. Heart 2008;94:1050–1057.
29. Sugeng L, Mor-Avi V, Weinert L, et al: Quantitativeassessment of left ventricular size and function: Side-by-side comparison of real-time three-dimensionalechocardiography and computed tomography withmagnetic resonance reference. Circulation 2006;114:654–661.
30. Qi X, Cogar B, Hsiung MC, et al: Live/real time three-dimensional transthoracic echocardiographic assessmentof left ventricular volumes, ejection fraction, and masscompared with magnetic resonance imaging. Echocardi-ography 2007;24:166–173.
31. Soliman OI, Krenning BJ, Geleijnse ML, et al: A compari-son between QLAB and TomTec full volume reconstruc-tion for real time three-dimensional echocardiographicquantification of left ventricular volumes. Echocardiogra-phy 2007;24:967–974.
32. Macron L, Lim P, Bensaid A, et al: Single-beat versus mul-tibeat real-time 3D echocardiography for assessing leftventricular volumes and ejection fraction: A comparisonstudy with cardiac magnetic resonance. Circ CardiovascImaging 2010;3:450–455.
33. Thavendiranathan P, Liu S, Verhaert D, et al: Feasibility,accuracy, and reproducibility of real-time full-volume 3Dtransthoracic echocardiography to measure LV volumesand systolic function: A fully automated endocardial con-touring algorithm in sinus rhythm and atrial fibrillation.JACC Cardiovascular Imaging 2012;5:239–251.
34. Thavendiranathan P, Grant AD, Negishi T, et al: Repro-ducibility of echocardiographic techniques for sequentialassessment of left ventricular ejection fraction and vol-umes: Application to patients undergoing cancer chemo-therapy. J Am Coll Cardiol 2013;61:77–84.
35. Forthover RN, Lee SL, Hernandez M. Biostatistics: A Guideto Design, Analysis, and Discovery. 2nd ed. San Diego:Academic Press, 2007, pp. 50–51, 60–62, 425.
36. Karamitsos TD, Hudsmith LE, Selvanayagam JB, et al:Operator induced variability in left ventricular measure-ments with cardiovascular magnetic resonance isimproved after training. J Cardiovasc Magn Reson2007;9:777–783.
37. Maffei E, Messalli G, Martini C, et al: Left and right ventri-cle assessment with Cardiac CT: Validation study vs car-diac MR. Eur Radiol 2012;22:1041–1049.
38. Childs H, Ma L, Ma M, et al: Comparison of long andshort axis quantification of left ventricular volume param-eters by cardiovascular magnetic resonance, with ex-vivovalidation. J Cardiovasc Magn Reson 2011;13:40. doi: 10.1186/1532-429X-13-40.
39. Quinones MA, Waggoner AD, Reduto LA, et al: A new,simplified and accurate method for determining ejectionfraction with two-dimensional echocardiography. Circula-tion 1981;64:744–753.
40. Dumesnil JG, Dion D, Yvorchuk K, et al: A new, simpleand accurate method for determining ejection fraction
99
Assessment of LV Function

by Doppler echocardiography. Can J Cardiol1995;11:1007–1014.
41. Baran AO, Rogal GJ, Nanda NC: Ejection fraction deter-mination without planimetry by two-dimensional echo-cardiography: A new method. J Am Coll Cardiol1983;1:1471–1478.
42. Teichholz LE, Kreulen T, Herman MV, et al: Problems inechocardiographic volume determinations: Echocardio-graphic-angiographic correlations in the presence ofabsence of asynergy. Am J Cardiol 1976;37:7–11.
43. Lang RM, Bierig M, Devereux RB, et al: Recommenda-tions for chamber quantification. Eur J Echocardiogr2006;7:79–108.
44. Lin C, Kuo C, Wang C, et al: Left ventricular systolic func-tion is sensitive to cycle-length irregularity in patientswith atrial fibrillation and systolic dysfunction. Acta Car-diol Sin 2012;28:103–110.
45. Bull SC, Main ML, Stevens GR, et al: Cardiac toxicityscreening by echocardiography in healthy volunteers: Astudy of the effects of diurnal variation and use of acore laboratory on the reproducibility of left ventricularfunction measurement. Echocardiography 2011;28:502–507.
46. Yamani H, Cai Q, Ahmad M: Three-dimensional echocar-diography in evaluation of left ventricular indices. Echo-cardiography 2012;29:66–75.
47. Jenkins C, Moir S, Chan J, et al: Left ventricular volumemeasurement with echocardiography: A comparison ofleft ventricular opacification, three-dimensional echocar-diography, or both with magnetic resonance imaging.Eur Heart J 2009;30:98–106.
48. Blondheim DS, Beeri R, Feinberg MS, et al: Reliability ofvisual assessment of global and segmental left ventricularfunction: A multicenter study by the Israeli Echocardiog-
raphy Research Group. J Am Soc Echocardiogr2010;23:258–264.
49. Holloway CJ, Edwards LM, Rider OJ, et al: A comparisonof visual and quantitative assessment of left ventricularejection fraction by cardiac magnetic resonance. Int JCardiovasc Imaging 2011;27:563–569.
50. van Geuns RJ, Baks T, Gronenschild EH, et al: Automaticquantitative left ventricular analysis of cine MR images byusing three-dimensional information for contour detec-tion. Radiology 2006;240:215–221.
51. Raman SV, Shah M, McCarthy B, et al: Multi-detectorrow cardiac computed tomography accurately quantifiesright and left ventricular size and function comparedwith cardiac magnetic resonance. Am Heart J2006;151:736–744.
52. Annuar BR, Liew CK, Chin SP, et al: Assessment of globaland regional left ventricular function using 64-slice multi-slice computed tomography and 2D echocardiography:A comparison with cardiac magnetic resonance. Eur JRadiol 2008;65:112–119.
53. Sarwar A, Shapiro MD, Nasir K, et al: Evaluating globaland regional left ventricular function in patients withreperfused acute myocardial infarction by 64-slicemultidetector CT: A comparison to magnetic resonanceimaging. J Cardiovasc Comput Tomogr 2009;3:170–177.
54. Xie BQ, Tian YQ, Zhang J, et al: Evaluation of left andright ventricular ejection fraction and volumes fromgated blood-pool SPECT in patients with dilated cardio-myopathy: Comparison with cardiac MRI. J Nucl Med2012;53:584–591.
55. Sibille L, Bouallegue FB, Bourdon A, et al: Comparativevalues of gated blood-pool SPECT and CMR for ejectionfraction and volume estimation. Nucl Med Commun2011;32:121–128.
100
Wood, et al.