Lecture-3 - FACULTY OF COMMERCE & MANAGEMENT
20
FACULTY OF COMMERCE & MANAGEMENT COURSE: B.COM 3 rd SEMESTER SUBJECT: MANAGEMENT ACCOUNTING SUBJECT CODE: BCH 302 LECTURE: 3 NAME OF FACULTY: DR. R. S. BISARIYA
-
Upload
khangminh22 -
Category
Documents
-
view
1 -
download
0
Transcript of Lecture-3 - FACULTY OF COMMERCE & MANAGEMENT

FACULTY OF COMMERCE & MANAGEMENT COURSE: B.COM 3rd SEMESTER SUBJECT: MANAGEMENT ACCOUNTING
SUBJECT CODE: BCH 302 LECTURE: 3 NAME OF FACULTY: DR. R. S. BISARIYA

Lecture-3 Analysis of Financial Statement

Analysis of Financial Statements Notes
Contents Objectives Introduction 3.1 Meaning and Concept of Financial Statement Analysis 3.2 Tools for Analysis and Interpretation of Financial Statement 3.3 Common-size Statements 3.4 Comparative Statements 3.4.1 Comparative Balance Sheet 3.4.2 Comparative (Income) Financial Statement Analysis 3.5 Trend Analysis 3.6 Summary 3.7 Keywords 3.8 Review Questions 3.9 Further Readings
Objectives After studying this Chapter, you will be able to:
Identify the tools of financial statement analysis Prepare common size statement Construct comparative financial statements Illustrate trend analysis
Introduction Financial statement analysis is the process of examining relationships among financial statement elements and making comparisons with relevant information. It is a valuable tool used by investors and creditors, financial analysts, and others in their decision-making processes related to stocks, bonds, and other financial instruments. The goal in analyzing financial statements is to assess past performance and current financial position and to make predictions about the future performance of a company. Investors who buy stock are primarily interested in a company’s profitability and their prospects for earning a return on their investment by receiving dividends and/or increasing the market value of their stock holdings. Creditors and investors who buy debt securities, such as bonds, are more interested in liquidity and solvency: the company’s short-and long-run ability to pay its debts. Financial analysts, who frequently specialize in following certain industries, routinely assess the profitability, liquidity, and solvency of companies in order to make recommendations about the purchase or sale of securities, such as stocks and bonds.
RAMA UNIVERSITY, KANPUR 27

Management Accounting
Notes 3.1 Meaning and Concept of Financial Statement Analysis Analysts can obtain useful information by comparing a company’s most recent financial
statements with its results in previous years and with the results of other companies in the same industry. Three primary types of financial statement analysis are commonly known as horizontal analysis, vertical analysis, and ratio analysis.
Horizontal Analysis When an analyst compares financial information for two or more years for a single company,
the process is referred to as horizontal analysis, since the analyst is reading across the page to compare any single line item, such as sales revenues.
Vertical Analysis When using vertical analysis, the analyst calculates each item on a single financial statement as
a percentage of a total. The term vertical analysis applies because each year’s figures are listed vertically on a financial statement. The total used by the analyst on the income statement is net sales revenue, while on the balance sheet it is total assets.
Ratio Analysis Ratio analysis enables the analyst to compare items on a single financial statement or to
examine the relationships between items on two financial statements. After calculating ratios for each year’s financial data, the analyst can then examine trends for the company across years. Since ratios adjust for size, using this analytical tool facilitates inter-company as well as intra-company comparisons.
Notes The entire financial statement analysis can be classified into various categories:
Comparative financial statements Common size financial statementsTrend percentages
Fund flow statementsCash flow statements andRatio analysis
Self Assessment Fill in the blanks: When an analyst compares financial information for two or more years for a single
company, the process is referred to as ………………… analysis. ………………… enables the analyst to compare items on a single financial statement or to examine the relationships between items on two financial statements. When using …………………, the analyst calculates each item on a single financial statement as a percentage of a total.
28 RAMA UNIVERSITY, KANPUR

Chapter 3: Analysis of Financial Statements 3.2 Tools for Analysis and Interpretation of Financial Statement Notes In assessing the significance of various financial data, experts engage in ratio analyses, the process of determining and evaluating financial ratios. A financial ratio is a relationship that indicates something about a company’s activities, such as the ratio between the company’s current assets, current liabilities or between its accounts receivable and its annual sales. The basic sources for these ratios are the company’s financial statements that contain figures on assets, liabilities, profits, or losses. Financial ratios are only meaningful when compared with other information. Since they are most often compared with industry data, ratios help an individual understand a company’s performance relative to that of competitors; they are often used to trace performance over time. Ratio analysis can reveal much about a company and its operations. However, there are several points to keep in mind about ratios. First, financial statement ratios are “flags” indicating areas of strength or weakness. One or even several ratios might be misleading, but when combined with other knowledge of a company’s management and economic circumstances, ratio analysis can tell much about a corporation. Second, there is no single correct value for a ratio. The observation that the value of a particular ratio is too high, too low, or just right depends on the perspective of the analyst and on the company’s competitive strategy. Third, a ratio is meaningful only when it is compared with some standard, such as an industry trend, ratio trend, a ratio trend for the specific company being analyzed, or a stated management objective. In trend analysis, financial ratios are compared over time, typically years. Year-to-year comparisons can highlight trends, pointing to the need for action. Trend analysis works best with five years of data. The second type of ratio analysis, cross-sectional analysis, compares the ratios of two or more companies in similar lines of business. One of the most popular forms of cross-sectional analysis compares a company’s financial ratios to industry ratio averages. Your report containing the analysis of the financial statements is broken down into the various ratio categories: 1. Predictor Ratios indicate the potential for growth or failure.
2. Profitability Ratios which use margin analysis and show the return on sales and capital employed.
3. Asset Management Ratios which use turnover measures to show how efficient a company is in its operations and use of assets.
4. Liquidity Ratios which give a picture of a company’s short-term financial situation or solvency.
5. Debt Management Ratios which show the extent that debt is used in a company’s capital structure.
Notes 1. Tools employed in the horizontal analysis are Comparative statements and Trend
percentages. 2. Tools employed in the vertical analysis are Common-size financial statements and
financial ratios.
RAMA UNIVERSITY, KANPUR 29

Management Accounting
Notes Self Assessment
Fill in the blanks: In trend analysis, ……………… are compared over time, typically years. Financial ……………… are only meaningful when compared with other information. Tools employed in the ……………… analysis are Common-size financial statements and financial ratios.
3.3 Common-size Statements A company financial statement that displays all items as percentages of a common base figure
is known as common size financial statement. This type of financial statement allows for easy analysis between companies or between time periods of a company. The values on the common size statement are expressed as percentages of a statement component such as revenue. While most firms don’t report their statements in common size, it is beneficial to compute if you want to analyze two or more companies of differing size against each other. Formatting financial statements in this way reduces the bias that can occur when analyzing companies of differing sizes. It also allows for the analysis of a company over various time periods, revealing,
Example: What percentage of sales is cost of goods sold and how that value has changed over time.
Common size financial statements put all numbers in context, since the act of producing them involves calculating a ratio for each number on the statements. Without common sizing the statements, it is difficult to attach meaning to the numbers or to pick up trends. That is why common size financial statements are used for financial analysis instead of the actual statements themselves. !
Caution For Balance sheet, total volume of assets and liabilities are taken into consideration for the computation of a share of each financial factor available under the heading of assets and liabilities.
Example: Prepare the common size statement analysis for the firm ABC Ltd. Liabilities 2008 (`) 2009 (`) Assets 2008 (`) 2009 (`)
Share capital 2,00,000 3,00,000 Fixed assets 2,25,000 4,00,000
Reserves and surpluses 1,00,000 2,00,000 Stock 1,29,000 2,00,000
Bank overdraft 60,000 2,00,000 Quick assets 46,000 2,00,000
Quick liabilities 40,000 1,00,000 4,00,000 8,00,000 4,00,000 8,00,000 Solution: Common size statement analysis of the Balance sheet of the firm ABC Ltd.
Particulars Amount % of Balance sheet total Assets
2008 (`) 2009 (`) 2008 (`) 2009 (`) Fixed assets 2,25,000 4,00,000 56.25 50 Contd…
30 RAMA UNIVERSITY, KANPUR

Chapter 3: Analysis of Financial Statements
Stock
1,29,000
2,00,000
32.25
25 Notes
Quick assets 46,000 2,00,000 11.5 25 4,00,000 8,00,000 100 100 Liabilities Share capital 2,00,000 3,00,000 50 37.5 Reserves and surpluses 1,00,000 2,00,000 25 25 Bank overdraft 60,000 2,00,000 15 25 Quick liabilities 40,000 1,00,000 10 12.5 4,00,000 8,00,000 100 100 The above illustration highlights the share of every component in the balance sheet out of the total volume of assets and liabilities. This will certainly facilitate the firm to easily understand not only the share of every component but also facilitates to have a meaningful and relevant comparison with various time horizons. Self Assessment State whether the following statements are true or false: Common-size financial statements are a widely used vertical analysis technique. A common-size income statement usually shows each revenue or expense item as a
percentage of net sales. 3.4 Comparative Statements Comparative statements are the financial statements which follow a consistent format but which cover different periods of time. Comparative statements are very useful for spotting trends. Objectives of Comparative Financial Statements Changes taken place in the financial performance are taken into consideration for further
analysis. To reveal qualitative information about the firm in terms of solvency, liquidity profitability and so on are extracted from the analysis of financial statements. With reference to yester financial data of the enterprise, the firm is facilitated to undergo for the preparation of forecasting and planning. The major part of financial statement analysis is mainly focused on the comparative analysis.
3.4.1 Comparative Balance Sheet The first and foremost important step is to have the following information and should take preparatory steps: While preparing the comparative statement of balance sheet, the particulars for the
financial factors are required. The second most important for the preparation of the comparative balance sheet is yester financial data extracted from the balance sheet or balance sheets. The next most important requirement to have an effective comparison with the yester financial data is current year information extracted from the balance sheet or balance sheet of the firms.
RAMA UNIVERSITY, KANPUR 31

Management Accounting
Notes 4. After having been procured the financial data pertaining to various time periods are ready for comparison; to determine or identify the level of increase or decrease taken place in the financial position of the firms To determine the level of increase or decrease in financial position, the percentage analysis to carried out in between them.
Example: From the following information, prepare comparative Balance Sheet of X Ltd. Particulars 31st Mar, 2004 31st Mar, 2005
Equit share capital 50,00,000 50,00,000
Fixed assets 60,00,000 72,00,000
Reserves and surpluses 10,00,000 12,00,000
Investments 10,00,000 10,00,000
Long-term loans 30,00,000 30,00,000
Current assets 30,00,000 21,00,000
Current liabilities 10,00,000 11,00,000 Solution: As the first step, we have to segregate the available information into two different categories, viz. Assets and Liabilities.
Particulars 2004 (`) 2005 (`) Absolute % Increase % Decrease Change (`) Fixed Assets 60,00,000 72,00,000 12,00,000 20 -
Investments 10,00,000 10,00,000 N.C - -
Current assets 30,00,000 21,00,000 (9,00,000) 30
Total Assets 1,00,00,000 1,03,00,000 3,00,000 3 -
Equity share capital 50,00,000 50,00,000 N.C - -
Reserves and surpluses 10,00,000 12,00,000 2,00,000 20 -
Long-term loans 30,00,000 30,00,000 N.C - -
Current liabilities 10,00,000 11,00,000 1,00,000 10 -
Total Liabilities 1,00,00,000 1,03,00,000 3,00,000 3 - N.C = No change in the position during the two years Formula to Calcalate (%) Increase/Decrease in Statement
=Absolute change
× 100Value of Asset/Liability in Previous year where: Absolute change = Value of Asset/Lability in current year – Value of Asset/Lability in previous year. From the above table, the following are basic inferences: The fixed assets volume got increased 20% from the year 2004 to 2005, amounted ` 12,00,000. ` 9,00,000 worth of current assets decrease from the year 2004 to 2005 recorded 30%. The total volume of assets recorded 3% increase from the year 2004 to 2005. It obviously understood that 20% increase taken place on the reserves and surpluses. It clearly evidenced that the current liabilities of the firm increased 10% from the year
2004 to 2005. 32 RAMA UNIVERSITY, KANPUR

Chapter 3: Analysis of Financial Statements
6. The firm has not recorded any changes in the investments, equity share capital and Notes long-term loans. 3.4.2 Comparative (Income) Financial Statement Analysis This analysis is being carried out in between the income statements of the various accounting durations of the firm, with other firms in the industry and with the industrial average. This will facilitate the firm to know about the stature of itself regarding the financial performance. It facilitates to understand about the changes pertaining to various financial data which closely relevantly connected with the financial performance: Change in the gross sales Change in the net sales Change in gross profit and net profit Change in operating profit Change in operating expenses Change in the volume of non-operating income Change in the non operating expenses. The ultimate purpose of the comparative (income) financial statement analysis is as follows: To study the income earning and expenditure spending pattern of the firm for two or more
years. To identify the changing pattern of the income and expenditure of the firms. The preparatory steps for the preparation of the comparative financial statement (income) analysis The first and foremost important step is to have the following information and should take
preparatory steps While preparing the comparative statement of Profit & Loss Account, the particulars for the financial factors are required. The second most important for the preparation of the comparative Profit & Loss account is yester financial data extracted from the Profit and Loss A/c or Profit and Loss Accounts. The next most important requirement to have an effective comparison with the yester financial data is current year information extracted from the balance sheet of the firm or of the other firms. After having been procured the financial data pertaining to various time periods are ready for comparison; to determine or identify the level of increase or decrease taken place in the operating financial performance of the firms. To determine the level of increase or decrease in financial performance, the percentage analysis to be carried out in between them.
Example: Prepare the comparative income statement from the following: Particulars 2004 (`) 2005 (`)
Sales 2,00,000 2,50,000
(–) Cost of goods sold 1,00,000 1,30,000 Contd… RAMA UNIVERSITY, KANPUR 33 Management Accounting

Notes
1,00,000 1,20,000 (–) Operating expenses 10,000 10,000 Net profit 90,000 1,10,000 Solution:
Particulars 2004 (`) 2005 (`) Absolute % Increase % Decrease Change (`) Sales 2,00,000 2,50,000 50,000 25 -
(–) Cost of goods sold 1,00,000 1,30,000 30,000 30 - 1,00,000 1,20,000 20,000 20 -
(–) Operating expenses 10,000 10,000 N.C - -
Net profit 90,000 1,10,000 20,000 22.22 From the above table, the following inferences can be had: The firm has registered 25% increase in sales from the year 2004 to 2005. Cost of goods sold raised 30% from the year 2004 to 2005. There is no change in the level of operating expenses. The firm has got 22.22% increase in the level of net profits from the year 2004 to 2005.
34 RAMA UNIVERSITY, KANPUR

Chapter 3: Analysis of Financial Statements 13. Computation of ratios for an accounting period is a form of horizontal analysis. Notes Generally, the last concern of a financial analyst is a firm’s liquidity. 3.5 Trend Analysis The next important tool of analysis is trend percentage which plays significant role in analyzing the financial stature of the enterprise through base years’ performance ratio computation. This not only reveals the trend movement of the financial performance of the enterprise but also highlights the strengths and weaknesses of the enterprise. The following ratio is being used to compute the trend percentage Current year ¥ 100
Base year This trend ratio is being computed for every component for many numbers of years which not only facilitates comparison but also guides the firm to understand the trend path of the firm. In the analysis of financial information, trend analysis is the presentation of amounts as a percentage of a base year.
Example: If I want to see the trend of a company’s revenues, net income, and number of clients during the years 2001 through 2007, trend analysis will present 2001 as the base year and the 2001 amounts will be restated to be 100. The amounts for the years 2002 through 2007 will be presented as the percentages of the 2001 amounts. In other words, each year’s amounts will be divided by the 2001 amounts and the resulting percentage will be presented. If revenues for the years 2001 through 2007 might have been ` 31,691,000; ` 40,930,000; ` 50,704,00; ` 63,891,000; ` 79,341,000; ` 101,154,000; ` 120,200,000. These revenue amounts will be restated to be 100, 129, 160, 202, 250, 319, and 379. From this trend analysis we can see that revenues in 2007 were 379% of the 2001 revenues, net income in 2007 was 467% of the 2001 net income, and the number of clients in 2007 was 317% of the number in 2001. Let’s assume that the net income amounts divided by the 2001 amount ended up as 100, 147, 206, 253, 343, 467, and 423. The number of clients when divided by the base year amount are 100, 122, 149, 184, 229, 277, and 317.
Example: In the following example, 2005 has been taken as a base year for the calculation of the sales trend. According to the trend shown below, determine whether the company has made an overall growth or not. Trend Percentages 2009 2008 2007 2006 2005 Historical Data Inventory $ 12,309 $12,202 $12,102 $11,973 $11,743
Property & equipment 74,422 78,938 64,203 65,239 68,450
Current liabilities 27,945 30,347 27,670 28,259 26,737
Sales 129,000 97,000 95,000 87,000 81,000
Cost of goods sold 70,950 59,740 48,100 47,200 45,500
Operating expenses 42,600 38,055 32,990 29,690 27,050
Net income (loss) 8,130 (1,400) 7,869 5,093 3,812 Contd… RAMA UNIVERSITY, KANPUR 35

Management Accounting Notes
Trend Percentages Inventory 104.8 103.9 103.1 102.0 100.0 Property & equipment 108.7 115.3 93.8 95.3 100.0 Current liabilities 104.5 113.5 103.5 105.7 100.0 Sales 159.3 119.8 117.3 107.4 100.0 Cost of goods sold 155.9 131.3 105.7 103.7 100.0 Operating expenses 157.5 140.7 122.0 109.8 100.0 Net income (loss) 213.3 (36.7) 206.4 133.6 100.0 Solution: We have to remember that the base year trend percentage is always 100.0%. A trend
percentage of less than 100.0% means the balance has decreased below the base year level in that particular year. A trend percentage greater than 100.0% means the balance in that year has increased over the base year. A negative trend percentage represents a negative number. Also, if the base year is zero or negative, the trend percentage calculated will not be meaningful. In this example, the sales have increased 59.3% over the five-year period while the cost of goods sold has increased only 55.9% and the operating expenses have increased only 57.5%. The trends look different if evaluated after four years. At the end of 2008, the sales had increased almost 20%, but the cost of goods sold had increased 31%, and the operating expenses had increased almost 41%. These 2008 trend percentages reflect an unfavorable impact on net income because costs increased at a faster rate than sales. On an overall basis, the trend percentages for net income appear to be higher because the base year amount is much smaller than the other balances. Using the restated amounts from trend analysis makes it much easier to see how effective and efficient the company has been during the recent years. Trends may be categorized as: Short-term trends capture rapidly emerging trends. Mid-term trends capture trends developing in between. Long-term trends capture trends developing over long periods. Trend analysis is also advantageous for (short-term) sales forecasting, growth rates, growth percentages, trend significance, trending types, and so on. Use of trend analysis includes: Sales trend analysis – revenue and volume analysis. Product sales trend analysis. Market trend analysis. Equity (share) price trend analysis. Accounting trend analysis. Work force recruit forecasting. Healthcare fraud detection and so on. Timely identification of newly emerging trends is very important to businesses. Trend analysis can also include the monitoring of a company’s financial ratios over a period of many years.
Self Assessment Fill in the blanks: In the analysis of financial information, trend analysis is the presentation of amounts as a ……………… of a base year. Trend analysis can also include the monitoring of a company’s ……………… over a
period of many years. 36 RAMA UNIVERSITY, KANPUR

Chapter 3: Analysis of Financial Statements
Notes Task In financial statement analysis, what is the basic objective of observing trends in
data and ratios? Suggest some other standards of comparison. Case Study Evaluation of Ford on the basis of Accounting Trends The success of Ford Motor Company, as well as other corporations, can be measured by analyzing the two most important goals of management, maintaining adequate liquidity and achieving satisfactory profitability. Liquidity can be defined as having enough money on hand to pay bills when they are due and to take care of unexpected needs for cash, while profitability refers to the ability of business to earn a satisfactory income. To enable investors and creditors to analyze these goals, Ford Motor Company distributes annual financial statements. With these financial statements, liquidity of Ford Motor Company is measured by analyzing factors such as working capitol, current ratio, quick ratio, receivable turnover, average days’ sales uncollected, inventory turnover and average days’ inventory on hand; whereas profitability analyzes the profit margin, asset turnover, return on assets, debt to equity, and return on equity factors. Liquidity Working Capital Ford Motor Company’s working capital fluctuated significantly in the years 1991-1995.
This phenomenon is directly attributable to the fact that Financial Services current assets and current liabilities are not included in the total company current asset and current liability accounts. For example, the fluctuation from 1994 ($1.4 billion) to 1995 (-$1.5 billion) of $2.5 billion would suggest that Ford would be unable to pay liabilities during the current period. However, examination of the Financial Services side of the business reveals that surpluses of $13.6 billion existed in both 1994 and 1995, convincingly mitigating the figures indicating negative working capital. Current Ratio & Quick Ratio The current ratio in the years 1991-1995 has remained stable, fluctuating between 0.9 and 1.1. The quick ratio has also remained stable, fluctuating between 0.5 and 0.6. The larger fluctuation in the current ratio versus the quick ratio is caused by inventories being included in the asset side of the equation. Although inventories were significantly higher in both 1994 and 1995, current liabilities were also higher. In addition, marketable securities decreased substantially in 1994 and 1995. These factors resulted in the stability of both the current ratio and quick ratio. Receivable Turnover & Average Days’ Sales Uncollected An examination of trends in Ford Motor Company’s receivable turnover and average days’ sales uncollected ratios reveal positive indicators of Ford’s liquidity position. The receivable turnover, a function of net sales and average accounts receivable, has nearly doubled in the years 1993-1995 versus 1991-1992. This trend indicates an extensive increase of net sales in relation to accounts receivable. Receivables were relatively higher in 1994 than in any other of the five years, affecting the ratio for both 1994 and 1995. However, net sales increased 30% in 1994 and 34% in 1995 over the average net sales of 1991-1993. The average days’ sales uncollected ratio has decreased significantly over the same period, from 16.9 days in Contd…
RAMA UNIVERSITY, KANPUR 37
Management Accounting
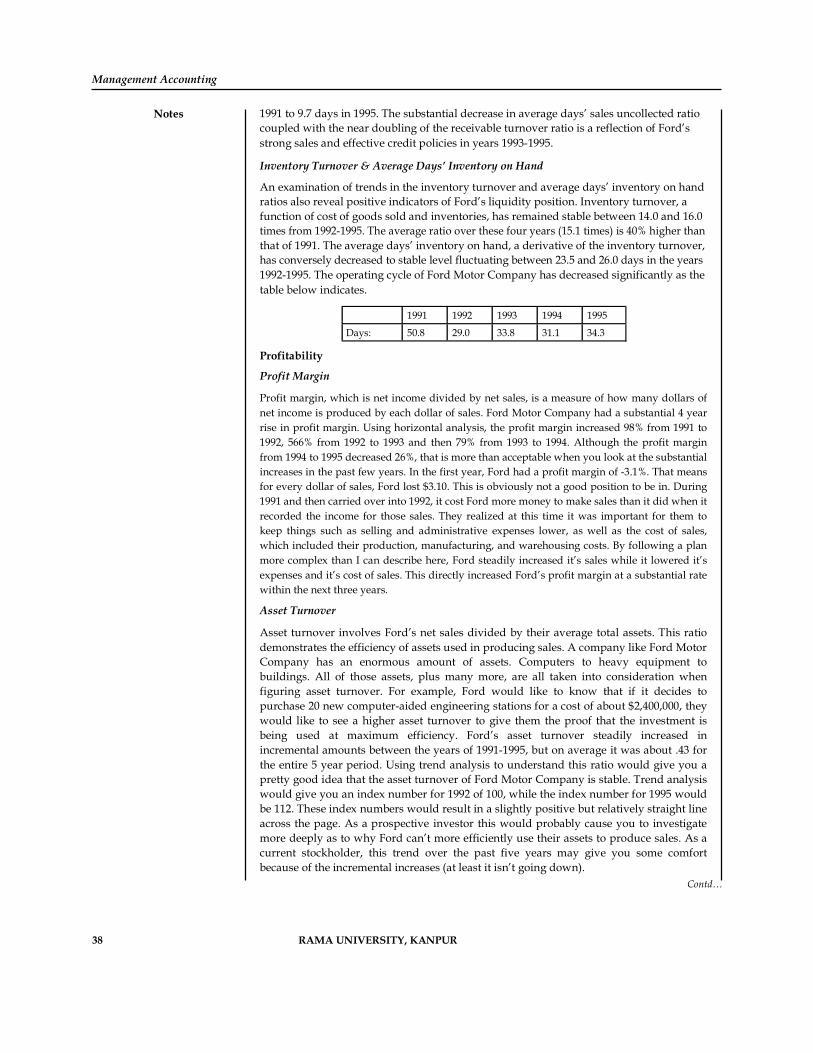
Notes 1991 to 9.7 days in 1995. The substantial decrease in average days’ sales uncollected ratio coupled with the near doubling of the receivable turnover ratio is a reflection of Ford’s strong sales and effective credit policies in years 1993-1995. Inventory Turnover & Average Days’ Inventory on Hand An examination of trends in the inventory turnover and average days’ inventory on hand ratios also reveal positive indicators of Ford’s liquidity position. Inventory turnover, a function of cost of goods sold and inventories, has remained stable between 14.0 and 16.0 times from 1992-1995. The average ratio over these four years (15.1 times) is 40% higher than that of 1991. The average days’ inventory on hand, a derivative of the inventory turnover, has conversely decreased to stable level fluctuating between 23.5 and 26.0 days in the years 1992-1995. The operating cycle of Ford Motor Company has decreased significantly as the table below indicates. 1991 1992 1993 1994 1995 Days: 50.8 29.0 33.8 31.1 34.3
Profitability Profit Margin Profit margin, which is net income divided by net sales, is a measure of how many dollars of net income is produced by each dollar of sales. Ford Motor Company had a substantial 4 year rise in profit margin. Using horizontal analysis, the profit margin increased 98% from 1991 to 1992, 566% from 1992 to 1993 and then 79% from 1993 to 1994. Although the profit margin from 1994 to 1995 decreased 26%, that is more than acceptable when you look at the substantial increases in the past few years. In the first year, Ford had a profit margin of -3.1%. That means for every dollar of sales, Ford lost $3.10. This is obviously not a good position to be in. During 1991 and then carried over into 1992, it cost Ford more money to make sales than it did when it recorded the income for those sales. They realized at this time it was important for them to keep things such as selling and administrative expenses lower, as well as the cost of sales, which included their production, manufacturing, and warehousing costs. By following a plan more complex than I can describe here, Ford steadily increased it’s sales while it lowered it’s expenses and it’s cost of sales. This directly increased Ford’s profit margin at a substantial rate within the next three years. Asset Turnover Asset turnover involves Ford’s net sales divided by their average total assets. This ratio demonstrates the efficiency of assets used in producing sales. A company like Ford Motor Company has an enormous amount of assets. Computers to heavy equipment to buildings. All of those assets, plus many more, are all taken into consideration when figuring asset turnover. For example, Ford would like to know that if it decides to purchase 20 new computer-aided engineering stations for a cost of about $2,400,000, they would like to see a higher asset turnover to give them the proof that the investment is being used at maximum efficiency. Ford’s asset turnover steadily increased in incremental amounts between the years of 1991-1995, but on average it was about .43 for the entire 5 year period. Using trend analysis to understand this ratio would give you a pretty good idea that the asset turnover of Ford Motor Company is stable. Trend analysis would give you an index number for 1992 of 100, while the index number for 1995 would be 112. These index numbers would result in a slightly positive but relatively straight line across the page. As a prospective investor this would probably cause you to investigate more deeply as to why Ford can’t more efficiently use their assets to produce sales. As a current stockholder, this trend over the past five years may give you some comfort because of the incremental increases (at least it isn’t going down). Contd…
38 RAMA UNIVERSITY, KANPUR

Chapter 3: Analysis of Financial Statements Return on Assets Notes Return on assets is a very good profitability ratio. It is comprehensive when compared to profit margin and asset turnover. Return on assets overcomes the deficiency of profit margin by relating the assets necessary to produce income and it overcomes the deficiency of asset turnover by taking into account the amount of income produced. Mathematically, return on assets is equal to net income divided by average total assets, or more simply put, profit margin times asset turnover. Ford can improve it’s overall profitability by increasing it’s profit margin, the asset turnover, or both. Looking at the numbers, it was actually Ford’s increase in profit margin that really gave it the boost it needed to raise the return on assets from the black to the red. A steady increase in return on assets from -1.3% in 1991 to an acceptable 2.2% in 1994 is a good sign to investors. This steady climb of 169% resulted in an overall increase in the earning power of Ford Motor Company. Ford’s increase in profitability shows satisfactory earning power which results in investors continuing to provide capital to it. Debt to Equity The debt to equity ratio shows the portion of the company financed by creditors in comparison to that financed by the stockholders. It is total liabilities divided by stockholder’s equity. Ford’s debt to equity ratio is relatively high. When measuring profitability, a high debt to equity ratio means the company has high debt and must earn more profit to protect the payment of interest to it’s creditors. This high debt to equity ratio would also interest stockholders because it shows what part of the business is financed through borrowing or in other words, is debt financed. Of the five years we analyzed, the lowest debt to equity ratio was during 1991 (6.65) and the highest was in 1993 (11.71). In comparison to return on assets, a higher creditor financed year such as 1991 did not have an positive effect on profitability. It seemed that through increased borrowing in 1993, a higher debt to equity ratio was produced, but overall profitability also went up. Debt to equity is only one part in a full profitability analysis. The only real information that the debt to equity ratio can produce is it can show how much expansion is possible through the borrowing of long-term funds; basically it show’s a company’s long-term solvency. A higher debt to equity ratio essentially means that the company will be able to borrow less money. The company must rely more on stockholder investment. Ford was able to lower it’s borrowing of funds from 1993 through 1994 and into 1995, while still effectively increasing it’s profit margin and return on assets. This means Ford was able to use stockholder’s investments to increase it’s profitability rather than borrow the funds to do it. Return on Equity Return on equity is the ratio of net income divided by the average stockholder’s equity. This ratio is of great interest to stockholders because it shows how much they have earned on their investment in the business. In the years of 1991 and 1992, stockholders lost money on their investment in Ford Motor Company. No one likes to lose money, even if it is a couple of cents on the dollar. A major stockholder could incur quite a loss because of this. In the next three years, return on equity was on the positive side, the peak being in 1994 when stockholders earned about 28% on every dollar invested. Quite a good return considering some investors are happy with a steady 8% return. Considering the previous years, the return on equity for Ford seems to be positive. Common knowledge dictates that most companies experience a downturn every now and then. Ford’s investors are able to remain invested in the company because it’s overall 5 year return on equity is high enough to give investors the high returns they seek. A return on equity consistently above 16% with a few negative years mixed in is certainly lucrative enough to maintain a strong profitability measurement and project a positive image to the investors of Ford Motor Company. Contd…
RAMA UNIVERSITY, KANPUR 39

Management Accounting Notes Conclusion Although Ford Motor Company is one of the largest companies in the world, we can still attribute accounting trends to some of the key events in Ford’s history. In 1990, Ford acquired Jaguar Cars, Ltd. Jaguar was a company suffering terrible loses due to poor quality, and lack of sales. Jaguar has been in the black since Ford purchased them until 1994. It is important to note that Ford’s net income trend from 1991 to 1995 illustrates this. In 1992, the Ford Taurus became the number one selling car in the Chaptered States, which helped increase 1992 net earnings, and in 1994 the Ford Falcon was the top selling car in Australia, helping maintain the trend of increasing net income. It is important to note that Ford’s net income has increased from 1991 to 1994, and then decreased in 1995. There are several possible causes for this change in the trend. In 1995, Ford acquired 20% equity in a major Chinese truck manufacturer, and launched several new vehicles; including the Ford Contour, Ford Mondeo, Mercury Mystique, Ford F-150, and Ford Taurus. These additional investments and expenses help explain the decrease in net income in 1995. Overall, the company has done well, and with reorganization in 1996 to decrease spending and increase efficiency, Ford is striving for future periods of growth. Questions What do you see as the main cause behind the result of trend analysis at Ford? “Ford was able to use stockholder’s investments to increase it’s profitability rather
than borrow the funds to do it”. Justify the statement on the basis of the case. Source: www.ghostpapers.com 3.6 Summary
Financial statement analysis can be explained as a method used by interested parties such as investors, creditors, and management to evaluate the past, current, and projected conditions and performance of the firm.
Under the financial statement analysis, the information available are grouped together in order to cull out the meaningful relationship which is already available among them; for interpretation and analysis.
Three primary types of financial statement analysis are commonly known as horizontal analysis, vertical analysis, and ratio analysis.
To reveal qualitative information about the firm in terms of solvency, liquidity, profitability, etc., are extracted from the analysis of financial statements.
Comparative (income) financial statement analysis is being carried out in between the income statements of the various accounting durations of the firm, with other firms in the industry and with the industrial average.
After having been procured the financial data pertaining to various time periods are ready for comparison; to determine or identify the level of increase or decrease taken place in the operating financial performance of the firms.
Trend analysis involves calculating each year’s financial statement balances as percentages of the first year, also known as the base year. When expressed as percentages, the base year figures are always 100 percent, and percentage changes from the base year can be determined.
40 RAMA UNIVERSITY, KANPUR

Chapter 3: Analysis of Financial Statements 3.7 Keywords Notes Assets: Assets are economic resources owned by business or company. Balance Sheet: A balance sheet or statement of financial position is a summary of a person’s or organization’s balances. Comparative Statements: Comparative statements are the financial statements which follow a consistent format but which cover different periods of time. Comparative statements are very useful for spotting trends. Financial Statement: A written report which quantitatively describes the financial health of a company. Trend analysis: In trend analysis, financial ratios are compared over time, typically years. 3.8 Review Questions From the following information, prepare a comparative income statement: Particulars 2001 (`) 2002 (`) Sales 10,00,000 8,00,000 Cost of goods sold 6,00,000 4,00,000 Administration Expenses 2,00,000 1,40,000 Other Income 40,000 20,000 Income tax 1,20,000 1,40,000
2. From the following table, prepare the common size statement analysis: 2000 (`) 2001 (`) Sales 20,00,000 24,00,000 Miscellaneous Income 20,000 16,000 20,20,000 24,16,000 Materials consumed 11,00,000 12,96,000 Wages 3,00,000 4,08,000 Factory expenses 2,00,000 2,16,000 Office expenses 90,000 1,00,000 Interest 1,00,000 1,20,000 Depreciation 1,40,000 1,50,000 Profit 90,000 1,26,000 20,20,000 24,16,000 A company has owner’s equity of ` 1,00,000. It has supplied the following accounting
ratios: Current Debt to Total Debt = 0.40 Total Debt to Owner’s Equity = 0.60 Fixed Assets to Owner’s Equity = 0.60 Total Assets Turnover = 2 times Inventory Turnover = 8 times With the information given above, you are required to prepare a summarised Balance Sheet of the company. How is an available-for-sale investment recorded on the financial statements?
RAMA UNIVERSITY, KANPUR 41

Management Accounting Notes 5. Comment on the following statements: (a) An increase in money sales should always be viewed favorably. (b) The influence of price-level changes cannot be detected by using a comparative statement. (c) An expansion of plant, property, and equipment should be financed by sales of capital stock. (d) Intangible assets should be eliminated when the balance sheet is reconstructed for analytical purposes. (e) An increase in liabilities should be viewed with alarm. 6. Is the trend of total liabilities of significance in analyzing the financial condition of a business? If so, what other trends should be used in connection therewith? 7. Write a report in which you list and discuss favorable and unfavorable financial and operating tendencies 8. Analysis shows that Zodiac Corporation incurred the following five-year gross margin and cost histories in serving customer number 128. Year 1 Year 2 Year 3 Year 4 Year 5 Gross Margin 602,000 638,000 636,000 652,000 670,000 Cost of engineering changes 6,600 12,120 7,000 7,200 80,250 Special packaging 66,200 73,360 82,600 78,100 80,400
Prepare a trend analysis (in terms of percentage of gross margin) for these two customer relate costs. 9. What different conclusions might the management draw about the behavior of the two costs in question 8? 10. Which is the better analysis horizontal or vertical and why? Which is better between vertical or horizontal ratio and why? 11. The comparative balance sheet of Oak and Tile Flooring Co. for June 30, 2008 and 2007, is as follows: June 30, 2008 June 30, 2007 Cash $24,700 $23,500 Accounts receivable (net) 101,600 92,300 Inventories 146,300 142,100 Investments 0 0 Land 145,000 0 Equipment 215,000 175,500 Accumulated depreciation (48,600) (41,300) $594,000 $442,100 Liabilities and Stockholders Equity Accounts payable (merchandise creditors) $100,900 $95,200 Accrued expenses (operating expenses) 15,000 13,200 Dividends payable 12,500 10,000 Common stock, $1 par 56,000 50,000 Paid-in capital in excess of par-common stock 220,000 100,000 Retained earnings 189,600 173,700 $594,000 $442,100
42 RAMA UNIVERSITY, KANPUR

Chapter 3: Analysis of Financial Statements The following additional information was taken from the records of Oak and Tile Flooring Notes Co: (a) Equipment and land were acquired for cash. (b) There were no disposals of equipment during the year. (c) The investments were sold for $45,000 cash. (d) The common stock was issued for cash. (e) There was a $65,900 credit to retain earnings for net income. (f) There was a $50,000 debit to Retained Earnings for cash dividends declared. Prepare a statement of cash flow, using the indirect method of presenting cash flows from operating activates. Ȁ ȀĀ Ā Ā Ā Ā here is a contract with a customer reported on the balance sheet and why?
Answers: Self Assessment 1. horizontal 2. Ratio analysis 3. vertical analysis 4. financial ratios 5. ratios 6. vertical 7. True 8. True 9. (iv) 10. (iv) 11. (iv) 12. True 13. True 14. False 15. percentage 16. financial ratios 3.9 Further Readings
Books Khan and Jain, Management Accounting. M. Pandey, Financial Management, Vikas Publishing, New Delhi. Nitin Balwani, Accounting & Finance for Managers, Excel Books, New Delhi. Prasanna Chandra, Financial Management — Theory and Practice, Tata McGraw Hill, New Delhi (1994). R. L. Gupta and Radhaswamy, Advanced Accountancy. S. Bhat, Financial Management, Excel Books, New Delhi. S.N. Maheswari, Management Accounting. V.K. Goyal, Financial Accounting, Excel Books, New Delhi. Online link www.managementstudyguide.com RAMA UNIVERSITY, KANPUR 43