Cap 32 -COMPANIES ORDINANCE Chapter: 32 COMPANIES ORDINANCE Gazette Number Version Date
Upload
khangminh22Category
view
0download
0
REPORT | OCTOBER 2020
LEBANESEGREEN ENERGY COMPANIESCHALLENGES AND OPPORTUNITIES

Copyright © 2020 by UNDP and ICU
All right reserved. Any reproduction, publication and reprint in the form of a different publication, whether printed or
produced electronically, in whole or in part, is permitted only with the explicit written authorisation of the UNDP or ICU or
the authors.
Reproduction is authorized provided the source is acknowledged and provided reproduction is not sold. The United Nations
Development Programme (UNDP) is the UN’s principle provider of development, advice advocacy and grant support. With
170 country offices, it has long enjoyed the trust and confidence of government and NGOs in many parts of the developing
as well as the developed world. It is typically regarded as a partner rather than as an adversary, and its commitment to
universal presence proved especially useful in post – conflict situations and with states that have been otherwise isolated
from the international community.
For further information:
- United Nations Development Programme (UNDP): www.undp.org.lb
- Istituto per la Cooperazione Universitaria (ICU): www.icu.it
- CEDRO 5 Project: www.cedro-undp.org
- REESTART Project: www.reestart.eu
- Lebanese Solar Energy Society (LSES): www.lses-lb.org
This report can be downloaded from http://www.reestart.eu or from ww.cedro-undp.org

This market survey is performed under the mandate of REESTART and UNDP CEDRO 5, funded by the European Union as part
of the ENI program within the initiative “Promote innovation and entrepreneurship in support of Lebanon’s clean energy
transition”, under the EU’s effort to promote innovation, entrepreneurship and job creation in support of Lebanon’s clean
energy transition and INDCs for the energy sector, Local business, energy service companies, SMEs, industrial facilities, and
corporations can receive technical and financial support to implement sustainable energy solutions and environmentally-
friendly technologies.
CONTRIBUTORS- Jad Taha-El Baba – Energy Innovation Analyst, CEDRO 5 - UNDP
- Mohamad Ismail – Energy Engineer, REESTART - ICU
- Nader Hajj Shehadeh – Senior Energy Consultant & Vice President, Lebanese Solar Energy Society
REVIEWERS- Hassan Harajli – Project Manager, CEDRO 5 - UNDP
- Gabriella Esposito –Project Manager, REESTART - ICU
- Jean Paul Sfeir – Senior Energy Consultant & Treasurer, Lebanese Solar Energy Society

PREFACE
This report presents the results of a market survey conducted jointly by REESTART and UNDP CEDRO 5 projects, both funded by the EU and working to promote innovation, entrepreneurship and job creation in support of Lebanon’s clean energy transition.
The survey targeted the clean energy companies active within the Lebanese market, offering energy efficiency and renewable energy services in the form of consultancy, design, supply, contracting, and/or turnkey solution integration.
Conducted through an online platform in June to July 2020, the survey reached 184 companies and businesses that are, or have been, active in the RE and EE sector over the past decade.
A total of 59 responded and completed the survey, contributing to the results presented in this report, that presents a comprehensive overview of the market, the key players, and the existing potential.
The 59 respondents present the most active renewable energy and energy efficiency players in the Lebanese market by the year 2020, but might not include companies or business that were recently established or are no longer active. Thus, this survey cannot be considered 100% inclusive of all the market.
The outcomes of the survey are collected, examined, and treated by a team of experts to validate, verify, and analyze the results, through which the project team conducted fact checking, follow-up meetings with respondents, and benchmark analysis to ensure accuracy and representativeness of the survey.
This report presents the analyzed in aggregate and anonymous forms, disclosing no company-specific or confidential information, in an aim to provide a comprehensive overview of the market status and build an action roadmap to promote cleaner technologies and remove barriers to energy efficiency and renewable energy ventures.

DISCLAIMER
The information presented in this report is a result of an open national survey that was designed to best represent the energy efficiency and renewable energy market in Lebanon.
The numbers, figures, and results presented in the report are based on the input provided by the surveyed companies, with only minor modifications and alterations based on verified information and responders’ follow-up.
The authors assume no responsibility for the topicality, correctness, completeness or quality of information provided.
Liability claims against the authors which relate to material or immaterial nature caused by the use or misuse of any information provided through the use of incorrect or incomplete information are excluded.
Reuse and reproduction of any information provided in this report is permitted, but shall acknowledge the authors and clearly disclaim data sensitivity and representativeness.
TABLE OF CONTENTSPreface
Disclaimer
Table of Contents
List of Figures
List of Acronyms & Abbreviations
1. The PlayersCompany Classification
Company Size
Company Scope of Service
Company Age
Geographical Location
Company Human Capital
Human Power
Analysis by Profession
Gender Analysis
2. The MarketMarket Dynamics
Company Evolution
Company Size Growth
Market Activities
RE&EE Revenue Contribution
The Energy Audit Market
Business and Financing
Contract Types
Contract Signing
Project Financing
3. The CapacitiesTechnical Qualifications
ESCO Accreditations
Management Certifications
Staff Credentials & Accreditations
Technology Expertise
Computerized Design Knowledge
Tools and Machines
Machinery and Equipment
Power and Measurement Tools
4. Annex 1 - NotesMachinery & Equipment Grouping
Energy Audit Tools & Equipment Grouping
About The projects
Renewable Energy and Energy Efficiency for Sustainable Energy Transition And Reinforced Trust (REESTART)
Country Entrepreneurship for Distributed Renewables Opportunities (CEDRO 5)
5
6
7
8
9
1010
10
11
12
13
14
14
15
17
2222
22
23
24
24
26
27
27
28
28
3333
33
35
35
37
38
40
40
41
43
43
44
45
45
46

LIST OF FIGURES
Figure 1: RE&EE companies’ classification by size as of 2020
Figure 2: RE&EE companies’ classification by scope of service and size as of 2020
Figure 3: Average company age by size as of 2020
Figure 4: Average company age by type as of 2020
Figure 5: RE&EE Companies geographic presence as of 2020
Figure 6: Average number of employees by company type and size
Figure 7: Employees split by profession in different company types
Figure 8: Employees split by profession in different company types and sizes
Figure 9: Average employees and female to male ratio per company for different types and sizes
Figure 10: Employees gender distribution by profession (Left: total; Right: average per company)
Figure 11: Employees gender distribution by company type (Left: total; Right: average per company)
Figure 12: Employees gender profession distribution by company type
Figure 13: Evolution of current RE&EE companies over the past 3 decades
Figure 14: Company establishment and year of entrance into the RE&EE market on an annual basis
Figure 15: Company size breakdown and progression over the past 3 years
Figure 16: RE&EE share of companies’ revenue (Left: average individual; Right: size-factored average)
Figure 17: RE&EE share of companies› revenue by company size
Figure 18: Figure 17: RE&EE share of companies› revenue by company type (scope of service)
Figure 19: Energy audits performed between 2017 and 2019 by Company Type
Figure 20: Contract offerings by company type
Figure 21: Average time to sign a contract
Figure 22: Overall source of project financing
Figure 23: Source of project financing by company size
Figure 24: Source of project financing by company type (scope of service)
Figure 25: Management certification availability and requirement by company type
Figure 26: Individual energy-related certification availability and requirement
Figure 27: Individual energy-related certification availability and requirement by company type
Figure 28: Company technology-specific expertise and requirement
Figure 29: Company technology-specific expertise and requirement by company type
Figure 30: Software-specific expertise and requirement
Figure 31: Software-specific expertise and requirement by company type
Figure 32: Machinery and equipment availability by company type
Figure 33: Energy audit equipment availability by company type
10
11
12
13
13
14
16
17
17
18
18
20
22
23
24
24
25
25
26
27
28
29
30
31
35
36
36
37
38
39
39
40
41

LIST OF ACRONYMS & ABBREVIATIONS
BREEAM Building Research Establishment Environmental Assessment Method
CEA Certified Energy Audit
CEDRO Country Entrepreneurship for Distributed Renewables Opportunities
CEM Certified Energy Manager
CMVP Certified Measurement and Verification Professional
EDGE Excellence in Design for Greater Efficiencies
EE Energy Efficiency
ENI European Neighborhood Instrument
EPC Energy Performance Contracting
ESCO Energy Service Company
EU European Union
HR Human Resources
ICU Istituto per la Cooperazione Universitaria
ISO International Organization for Standardization
LBP Lebanese Pounds
LCEC Lebanese Center for Energy Conservation
LCEC Lebanese Center for Energy Conservation
LEED Leadership in Energy and Environmental Design
LSES Lebanese Solar Energy Society
OHSAS Occupational Health and Safety Assessment
PMP Project Management Professional
PV Photovoltaics
RE Renewable Energy
REESTART Renewable Energy and Energy Efficiency for Sustainable Energy TransitionAnd Reinforced Trust
SWH Solar Water Heating
UN United Nations
UNDP United Nations Development Programme
US United States
USD United States Dollars

1. THE PLAYERS
COMPANY CLASSIFICATION
The Lebanese energy service market involved a wide range of companies and service providers, ranging from energy consultants, to system installers (system integrators), to turnkey solution providers including companies offering the widest range of service including design, consultancy, and execution. These companies range by size from micro companies with annual revenue of a few tens of thousands of US dollars, to extra-large companies with annual revenue in millions of US dollars.
COMPANY SIZE
The Lebanese RE&EE market is driven by small and medium enterprises, with 79.6% of the companies in 2019 falling under an annual revenue of $1M. Applied to analyze the different market trends among different company sizes, company classification by size (in terms of revenue) follows the following manner:• Small: Companies with annual revenue of less than $250,000 • Medium: Companies with annual revenue between $250,000 and $1,000,000• Large: Companies with annual revenue above $1,000,000
Figure 1: RE&EE companies’ classification by size as of 2020
-10-
COMPANY SCOPE OF SERVICE
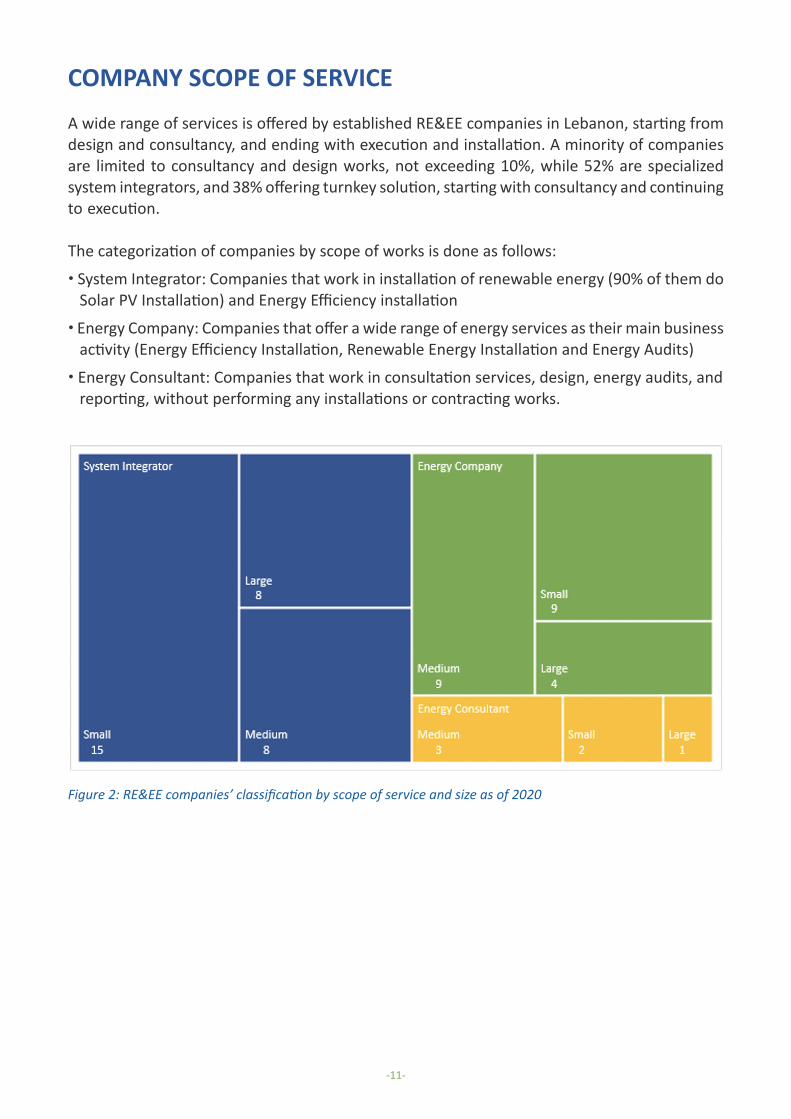
A wide range of services is offered by established RE&EE companies in Lebanon, starting from design and consultancy, and ending with execution and installation. A minority of companies are limited to consultancy and design works, not exceeding 10%, while 52% are specialized system integrators, and 38% offering turnkey solution, starting with consultancy and continuing to execution.
The categorization of companies by scope of works is done as follows:
• System Integrator: Companies that work in installation of renewable energy (90% of them do Solar PV Installation) and Energy Efficiency installation
• Energy Company: Companies that offer a wide range of energy services as their main business activity (Energy Efficiency Installation, Renewable Energy Installation and Energy Audits)
• Energy Consultant: Companies that work in consultation services, design, energy audits, and reporting, without performing any installations or contracting works.
Figure 2: RE&EE companies’ classification by scope of service and size as of 2020
-11-
COMPANY AGE
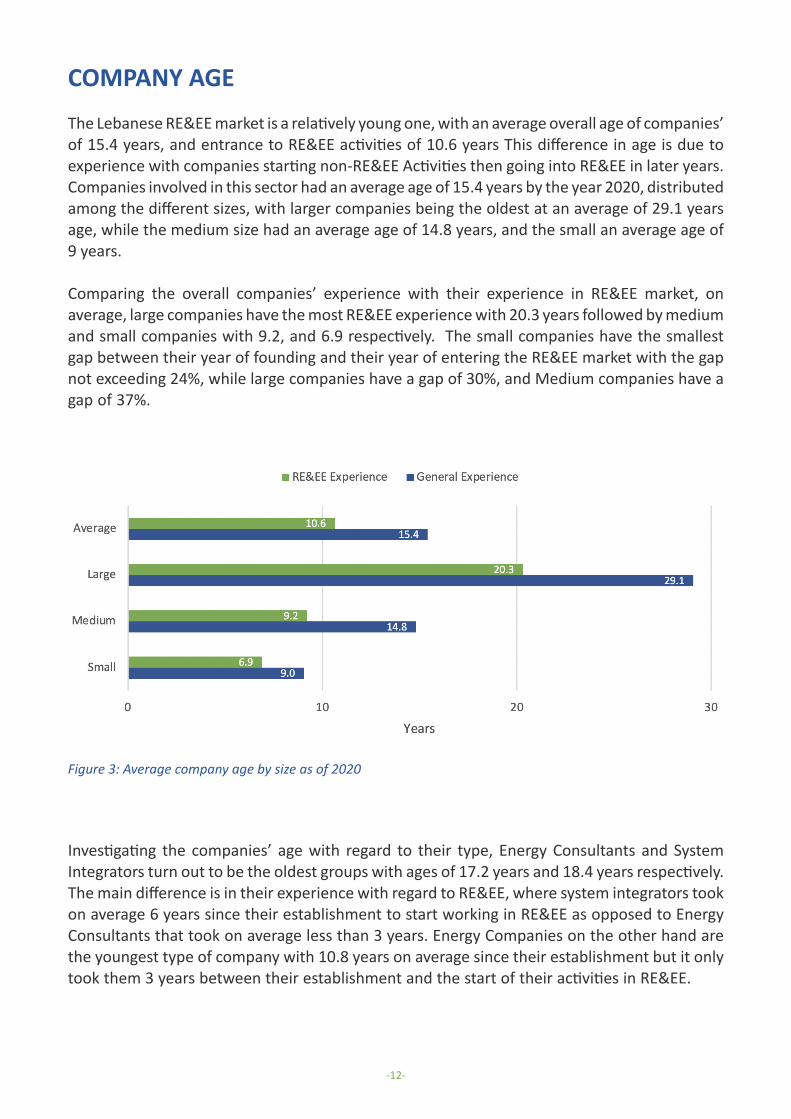
The Lebanese RE&EE market is a relatively young one, with an average overall age of companies’ of 15.4 years, and entrance to RE&EE activities of 10.6 years This difference in age is due to experience with companies starting non-RE&EE Activities then going into RE&EE in later years. Companies involved in this sector had an average age of 15.4 years by the year 2020, distributed among the different sizes, with larger companies being the oldest at an average of 29.1 years age, while the medium size had an average age of 14.8 years, and the small an average age of 9 years.
Comparing the overall companies’ experience with their experience in RE&EE market, on average, large companies have the most RE&EE experience with 20.3 years followed by medium and small companies with 9.2, and 6.9 respectively. The small companies have the smallest gap between their year of founding and their year of entering the RE&EE market with the gap not exceeding 24%, while large companies have a gap of 30%, and Medium companies have a gap of 37%.
Figure 3: Average company age by size as of 2020
Investigating the companies’ age with regard to their type, Energy Consultants and System Integrators turn out to be the oldest groups with ages of 17.2 years and 18.4 years respectively. The main difference is in their experience with regard to RE&EE, where system integrators took on average 6 years since their establishment to start working in RE&EE as opposed to Energy Consultants that took on average less than 3 years. Energy Companies on the other hand are the youngest type of company with 10.8 years on average since their establishment but it only took them 3 years between their establishment and the start of their activities in RE&EE.
-12-
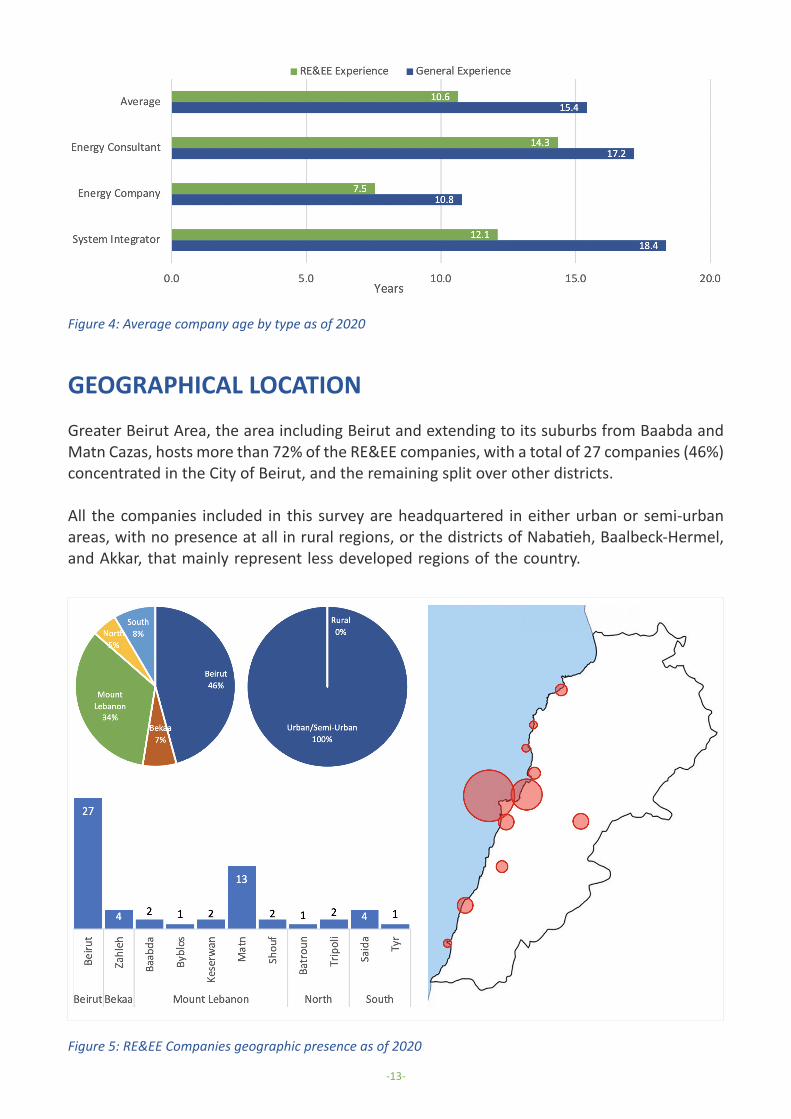
Figure 4: Average company age by type as of 2020
Figure 5: RE&EE Companies geographic presence as of 2020
GEOGRAPHICAL LOCATION
Greater Beirut Area, the area including Beirut and extending to its suburbs from Baabda and Matn Cazas, hosts more than 72% of the RE&EE companies, with a total of 27 companies (46%) concentrated in the City of Beirut, and the remaining split over other districts.
All the companies included in this survey are headquartered in either urban or semi-urban areas, with no presence at all in rural regions, or the districts of Nabatieh, Baalbeck-Hermel, and Akkar, that mainly represent less developed regions of the country.
-13-

COMPANY HUMAN CAPITAL
HUMAN POWER
RE&EE companies have a total workforce of 898 employees, at an average of 15 employees per company, with major variations by type and scope of service. Small companies operate with an average of 7 employees, medium companies with 17, and large companies with 28 employees on average.
In terms of company “type” (scope of service), System Integrators have the highest number of employees on their payroll, reaching an average of 17 employees, while Energy Companies have an average of 11 employees.
Energy Consultants have a reported average number of employees of 17 employees, but this number has been highly affected by one outlier, which is a 59-employee large consulting firm that offers a wider range of service part of which energy consulting is. Excluding this company from the analysis, the average number of employees drastically drops to 9 employees.
Focusing on size by revenue, Large energy consultants have the highest number of employed staff of 59 members (representing one large company) compared to 28 employees for large system integrators and 22 for large energy companies. Medium system integrators have 24 employees on average, 11 for medium energy consultants and 9 for medium energy companies. For small companies the average employee is 8 for system integrators, 7 for energy companies and 6 for energy consultants.
Figure 6: Average number of employees by company type and size
-14-
ANALYSIS BY PROFESSION
Human power is analyzed by profession and role, splitting employees into four 4 categories: 1. Engineers2. Skilled Technicians3. Administration & Finance4. Other Staff Members (Logistics, clerks, office personnel, AutoCAD operator, marketing, etc.)
There is a total of 315 engineers working with companies involved in the RE&EE field, with an average of more than 5 engineers per company. This value widely varies among companies, ranging from no engineers at all at some companies, to companies employing more than 45 engineers. On average, large companies have an average of 10 engineers per company, medium companies 6, and small companies only 2 engineers.
The average number of skilled technicians employed at the 59 companies is 5 per company, with large companies employing almost 11 technicians, medium companies employing 5 and small companies employing 2 technicians.
In terms of admin and finance the 59 companies employ on average 3 employees per company, with large companies employing almost 6 employees, medium companies employing 3 and small companies 2. Additionally, there is an average of 2 other staff members per companies, offering various services in different domains, with large companies employing 2, medium companies employing 3 and small companies 1. In terms of company type, energy consultants have the highest average of engineers per company with almost 12 engineers on average. Again, this number is drastically affected by the one outlier engineering consultancy company falling under this category, that alone employs 45 engineers. If excluding this outlier, the average number of engineers per energy consultant company drop to 5 engineers per company, which remains very close to other company types, with System Integrators having almost 6 engineers, and Energy Companies 4 engineers on average. In contrast, Energy Consultants employ the least technicians with an average of only 1 technician per company, while System Integrators and Energy Companies maintain close values to engineers with 6 and 5 technicians per company respectively. System Integrators have the highest presence of admin and finance personnel with almost 4, followed by Energy Consultants and Energy Companies with 3 and 2 respectively. For the other staff members, the companies follow the same trend with 3, 2, and 1 other staff per company for System integrators, Energy Consultants, and Energy Companies.
-15-

Figure 7: Employees split by profession in different company types
When analyzed based on company type and size, economy of scale effect is evident. The size of company in terms of employees is directly proportional to its size in terms of revenue. Correctly stated, it is the other way around. Company revenue is directly proportional to the human power available at the company as they are the company’s biggest assets.
This proportional correlation applies to the majority of professions, increasing almost in all company types, Energy Consultant, System Integrator, or Energy Company.
This Correlation still stands within each type, noting that the drop in engineers for System Integrators is compensated for by a doubly in employed technicians, while the opposite happens for Energy Consultants, where the drop in technicians is compensated for with a drastic increase in number of engineers. This is understandable for these companies, with the first relying more on technicians and site workers as it grows, while the latter relying more on engineers and design staff as it grows.
-16-

Figure 8: Employees split by profession in different company types and sizes
Figure 9: Average employees and female to male ratio per company for different types and sizes
Average Employees by Company Type and Size
GENDER ANALYSIS
Gender balance remains a critical aspect that is yet to be overcome. According to the survey, the RE&EE sector suffers from a low female to male labor participation rate estimated at 24%, which is lower than the national average of 32% as reported by the World Bank IN 2020, in a country with 50% female to male population ratio.
In total, the number of employees in the 59 Surveyed Companies is 898, with 683 male employees (76%) and 215 female employees (24%). This ratio varies by profession, company size, and company type.
-17-
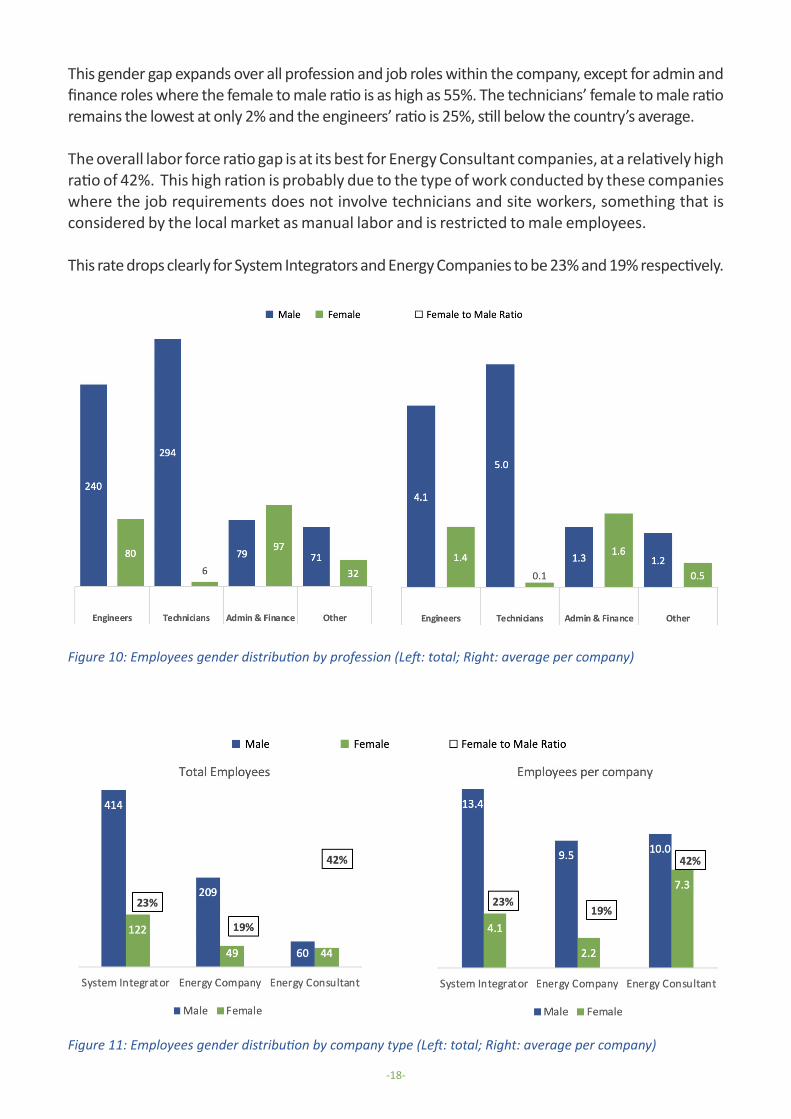
This gender gap expands over all profession and job roles within the company, except for admin and finance roles where the female to male ratio is as high as 55%. The technicians’ female to male ratio remains the lowest at only 2% and the engineers’ ratio is 25%, still below the country’s average.
The overall labor force ratio gap is at its best for Energy Consultant companies, at a relatively high ratio of 42%. This high ration is probably due to the type of work conducted by these companies where the job requirements does not involve technicians and site workers, something that is considered by the local market as manual labor and is restricted to male employees.
This rate drops clearly for System Integrators and Energy Companies to be 23% and 19% respectively.
Figure 10: Employees gender distribution by profession (Left: total; Right: average per company)
Figure 11: Employees gender distribution by company type (Left: total; Right: average per company)
-18-

-19-
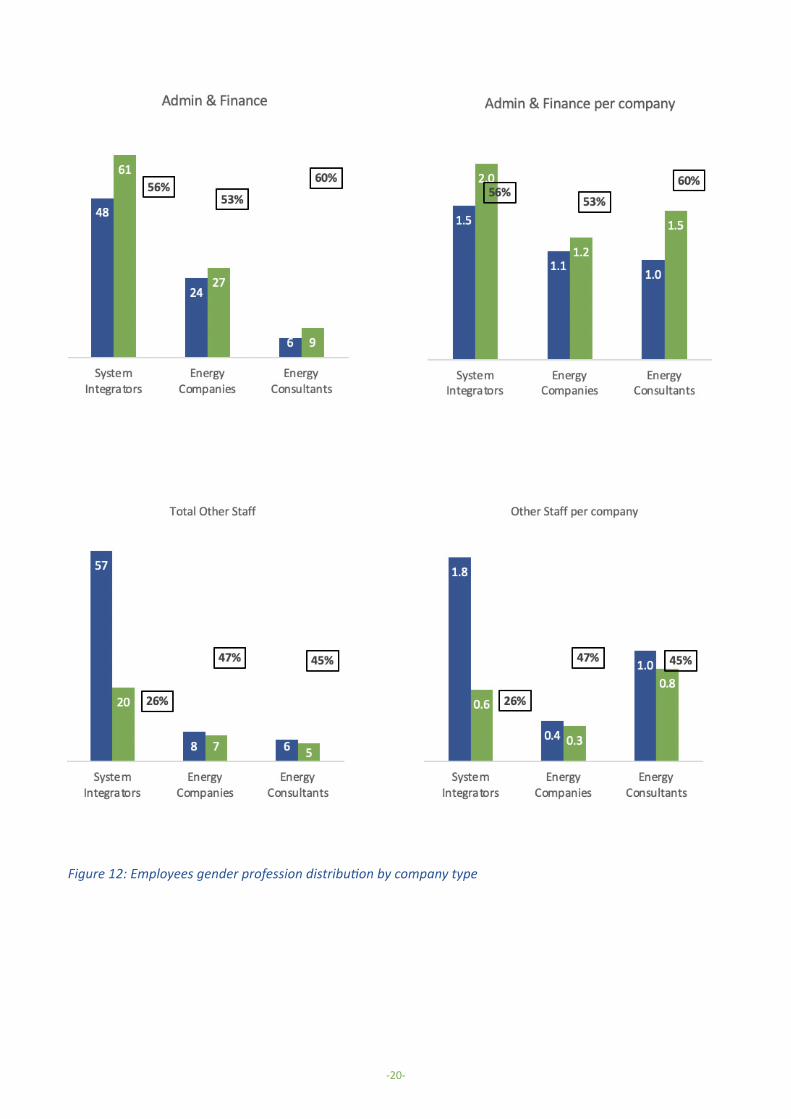
Figure 12: Employees gender profession distribution by company type
-20-
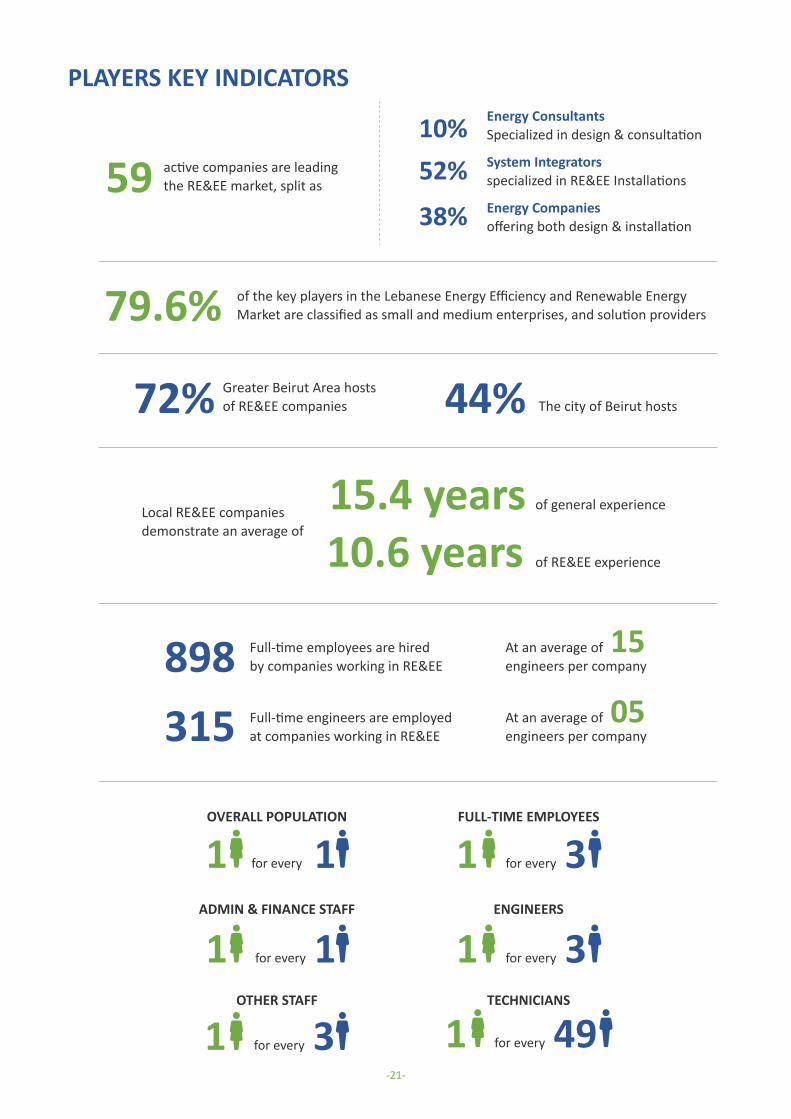
PLAYERS KEY INDICATORS
5910%52%
38%
active companies are leading the RE&EE market, split as
Energy ConsultantsSpecialized in design & consultation
System Integrators specialized in RE&EE Installations
Energy Companiesoffering both design & installation
79.6% of the key players in the Lebanese Energy Efficiency and Renewable Energy Market are classified as small and medium enterprises, and solution providers
72% 44%Greater Beirut Area hostsof RE&EE companies The city of Beirut hosts
15.4 years10.6 years
Local RE&EE companiesdemonstrate an average of
of general experience
of RE&EE experience
898315
15Full-time employees are hiredby companies working in RE&EE
Full-time engineers are employedat companies working in RE&EE
At an average ofengineers per company
05At an average ofengineers per company
OVERALL POPULATION
ADMIN & FINANCE STAFF
OTHER STAFF
FULL-TIME EMPLOYEES
ENGINEERS
TECHNICIANS
1 1 for every
1 1 for every
1 3for every
1 3for every
1 3for every
1 49for every
-21-
2. THE MARKET
MARKET DYNAMICS
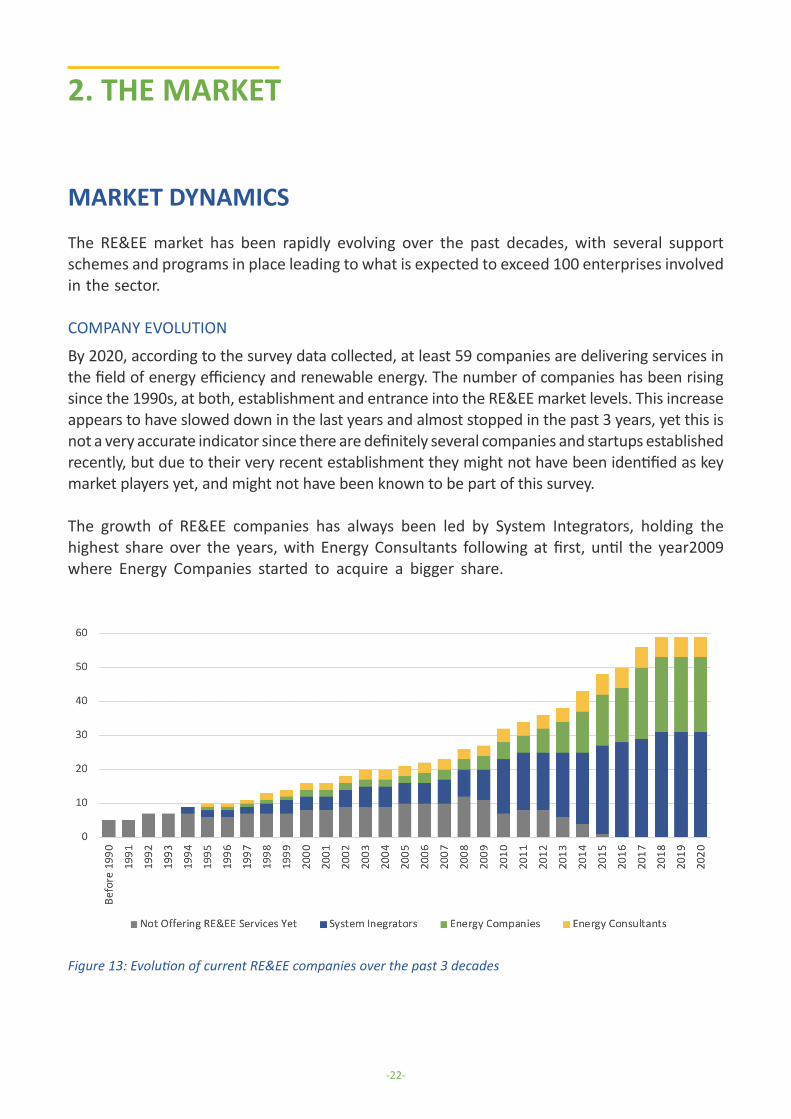
The RE&EE market has been rapidly evolving over the past decades, with several support schemes and programs in place leading to what is expected to exceed 100 enterprises involved in the sector.
COMPANY EVOLUTION
By 2020, according to the survey data collected, at least 59 companies are delivering services in the field of energy efficiency and renewable energy. The number of companies has been rising since the 1990s, at both, establishment and entrance into the RE&EE market levels. This increase appears to have slowed down in the last years and almost stopped in the past 3 years, yet this is not a very accurate indicator since there are definitely several companies and startups established recently, but due to their very recent establishment they might not have been identified as key market players yet, and might not have been known to be part of this survey.
The growth of RE&EE companies has always been led by System Integrators, holding the highest share over the years, with Energy Consultants following at first, until the year2009 where Energy Companies started to acquire a bigger share.
Figure 13: Evolution of current RE&EE companies over the past 3 decades
-22-
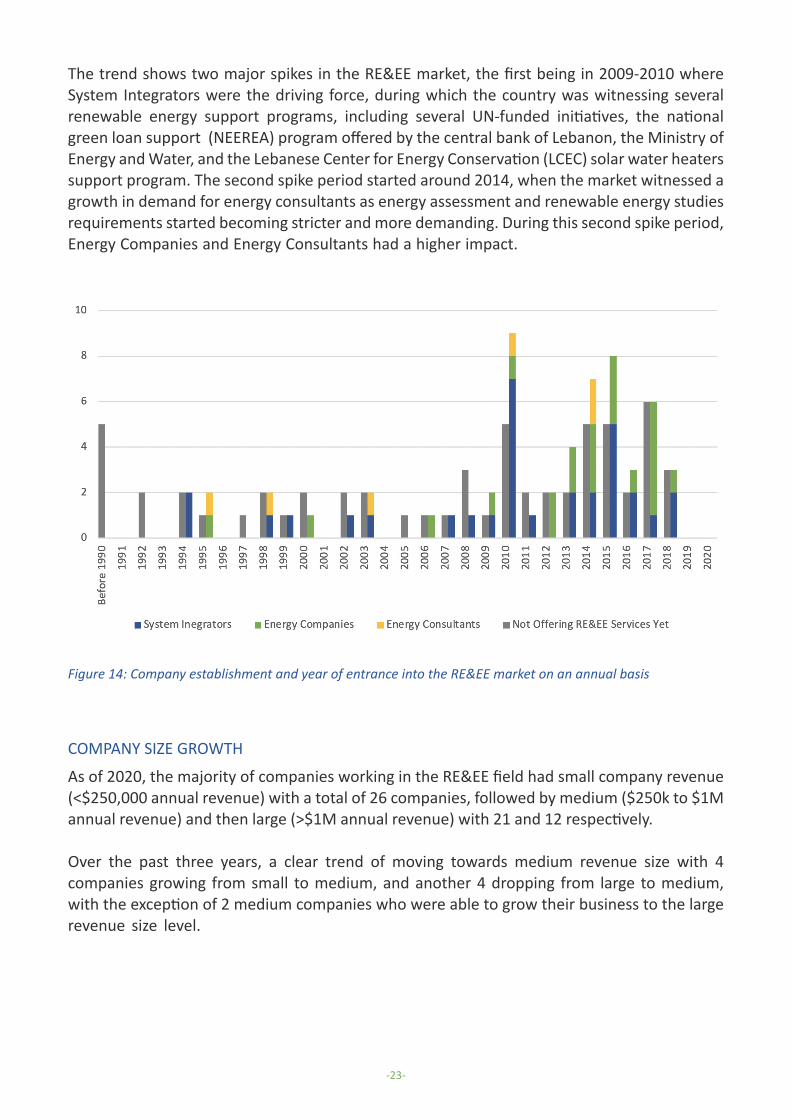
The trend shows two major spikes in the RE&EE market, the first being in 2009-2010 where System Integrators were the driving force, during which the country was witnessing several renewable energy support programs, including several UN-funded initiatives, the national green loan support (NEEREA) program offered by the central bank of Lebanon, the Ministry of Energy and Water, and the Lebanese Center for Energy Conservation (LCEC) solar water heaters support program. The second spike period started around 2014, when the market witnessed a growth in demand for energy consultants as energy assessment and renewable energy studies requirements started becoming stricter and more demanding. During this second spike period, Energy Companies and Energy Consultants had a higher impact.
Figure 14: Company establishment and year of entrance into the RE&EE market on an annual basis
COMPANY SIZE GROWTH
As of 2020, the majority of companies working in the RE&EE field had small company revenue (<$250,000 annual revenue) with a total of 26 companies, followed by medium ($250k to $1M annual revenue) and then large (>$1M annual revenue) with 21 and 12 respectively.
Over the past three years, a clear trend of moving towards medium revenue size with 4 companies growing from small to medium, and another 4 dropping from large to medium, with the exception of 2 medium companies who were able to grow their business to the large revenue size level.
-23-

Figure 15: Company size breakdown and progression over the past 3 years (2017-2019)
Figure 16: RE&EE share of companies’ revenue (Left: average individual; Right: size-factored average)
MARKET ACTIVITIESCompanies involved in the RE&EE market are not established for this specific purpose. Many of the companies currently doing business are originally established in other fields of work such as general engineering consultancy, contracting, and trading.
RE&EE REVENUE CONTRIBUTION
On average, by the year 2017, when considered individually, RE&EE activities contributed to around 70% of the surveyed companies’ overall revenue, dropping to 68% in 2018 and 66% in 2019. When combining the reported RE&EE revenue share with the company size and its estimated overall annual revenue, the figures change to show a 2017 share of 78%, dropping to 73% in 2018, and picking up slightly to 74% in 2019.
-24-

Factoring in the company size and its overall annual revenue caused clear changes to the trend, this is a result of the fact that large companies have witnessed a rapid increase in their RE&EE revenue between 2018 and 2019, leaving the highest impact on the overall average when factoring in the revenue volume.
Considering the share of renewable energy and energy efficiency activities from total revenues between 2017 and 2019 by company type (scope of service), the overall trend is on the rise for energy consultants only, hitting 71% by 2019, while it drops between 2017 and 2019 for both system integrators and energy companies, with 75% to 68% for the first, and 66% to 62% for the second.
Figure 17: RE&EE share of companies’ revenue by company size
Figure 18: Figure 17: RE&EE share of companies’ revenue by company type (scope of service)
-25-
THE ENERGY AUDIT MARKET
In 2016, the central bank of Lebanon and the LCEC published a requirement for green loan applicants wishing to benefit from a subsidized loan for solar PV installations exceeding 60 kWp, demanding a mandatory energy audit to be conducted by qualified companies.
This had a major effect on the energy audit market, although creating a higher demand on Level I energy audits as compared to previous years where Level II and Level III energy audits were more common.
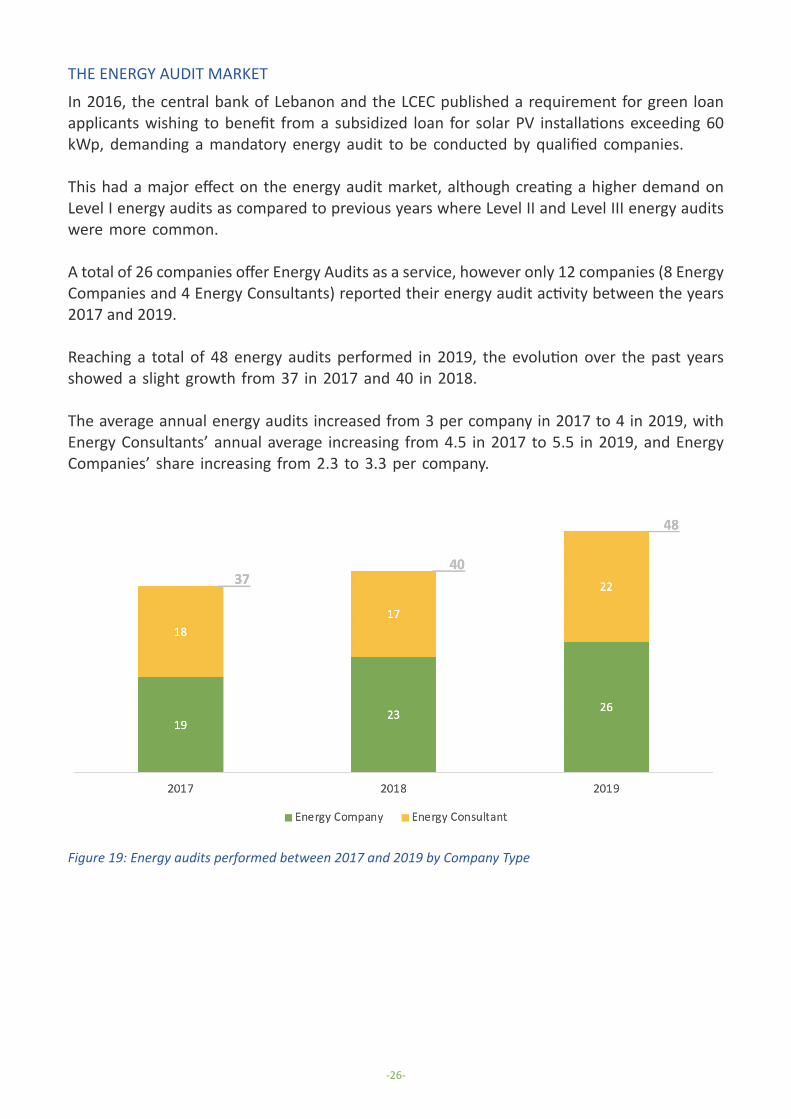
A total of 26 companies offer Energy Audits as a service, however only 12 companies (8 Energy Companies and 4 Energy Consultants) reported their energy audit activity between the years 2017 and 2019.
Reaching a total of 48 energy audits performed in 2019, the evolution over the past years showed a slight growth from 37 in 2017 and 40 in 2018.
The average annual energy audits increased from 3 per company in 2017 to 4 in 2019, with Energy Consultants’ annual average increasing from 4.5 in 2017 to 5.5 in 2019, and Energy Companies’ share increasing from 2.3 to 3.3 per company.
Figure 19: Energy audits performed between 2017 and 2019 by Company Type
-26-
BUSINESS AND FINANCING
Lebanon does not offer the smoothest business process, nor does it rank top on the world’s ease of doing business indicator. In fact, in 2019, Lebanon ranked 143rd among 190 economies in the ease of doing business, according to the latest World Bank annual ratings. Yet, the country offers some supportive schemes especially when it comes to RE&EE, such green loans, energy audit promotion, international RE&EE support programs, and several others.
CONTRACT TYPES
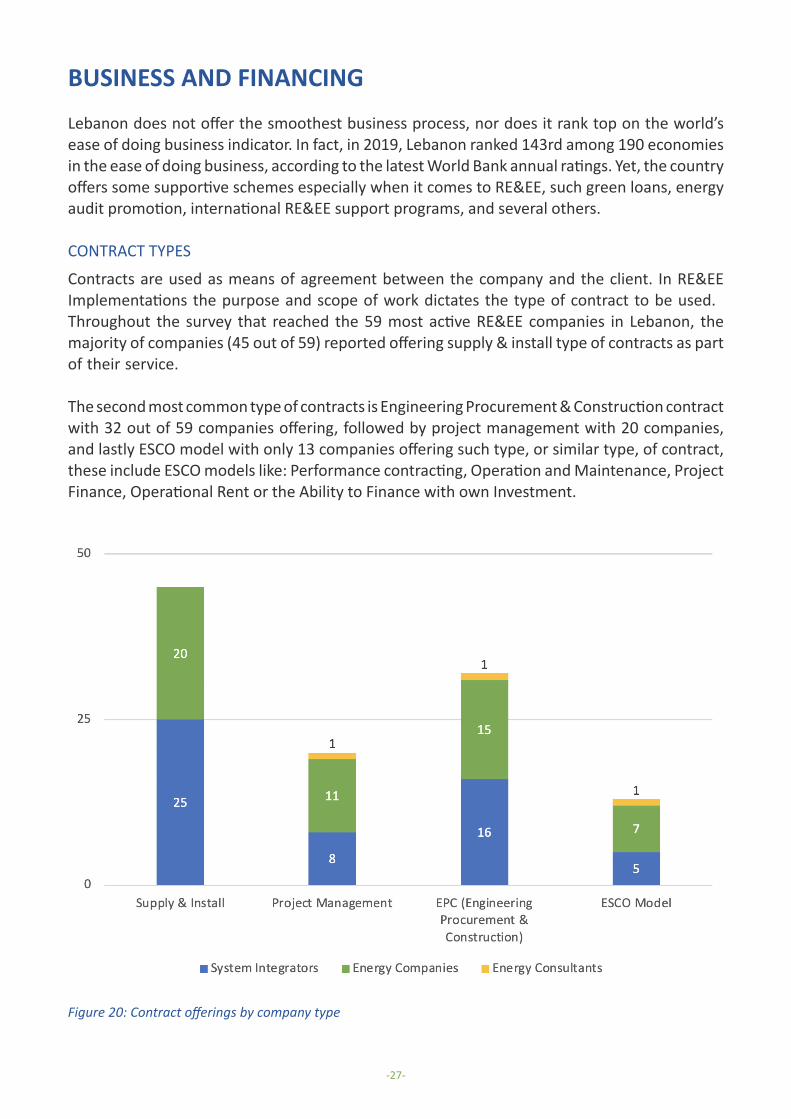
Contracts are used as means of agreement between the company and the client. In RE&EE Implementations the purpose and scope of work dictates the type of contract to be used. Throughout the survey that reached the 59 most active RE&EE companies in Lebanon, the majority of companies (45 out of 59) reported offering supply & install type of contracts as part of their service.
The second most common type of contracts is Engineering Procurement & Construction contract with 32 out of 59 companies offering, followed by project management with 20 companies, and lastly ESCO model with only 13 companies offering such type, or similar type, of contract, these include ESCO models like: Performance contracting, Operation and Maintenance, Project Finance, Operational Rent or the Ability to Finance with own Investment.
Figure 20: Contract offerings by company type
-27-
CONTRACT SIGNING
Many challenges and obstacles can stand in front of signing of contract, obstacles such as parties’ commitment, engagement, protracted negotiations, poor follow-up, etc... And so, a longer period of time might be needed to overcome these challenges.
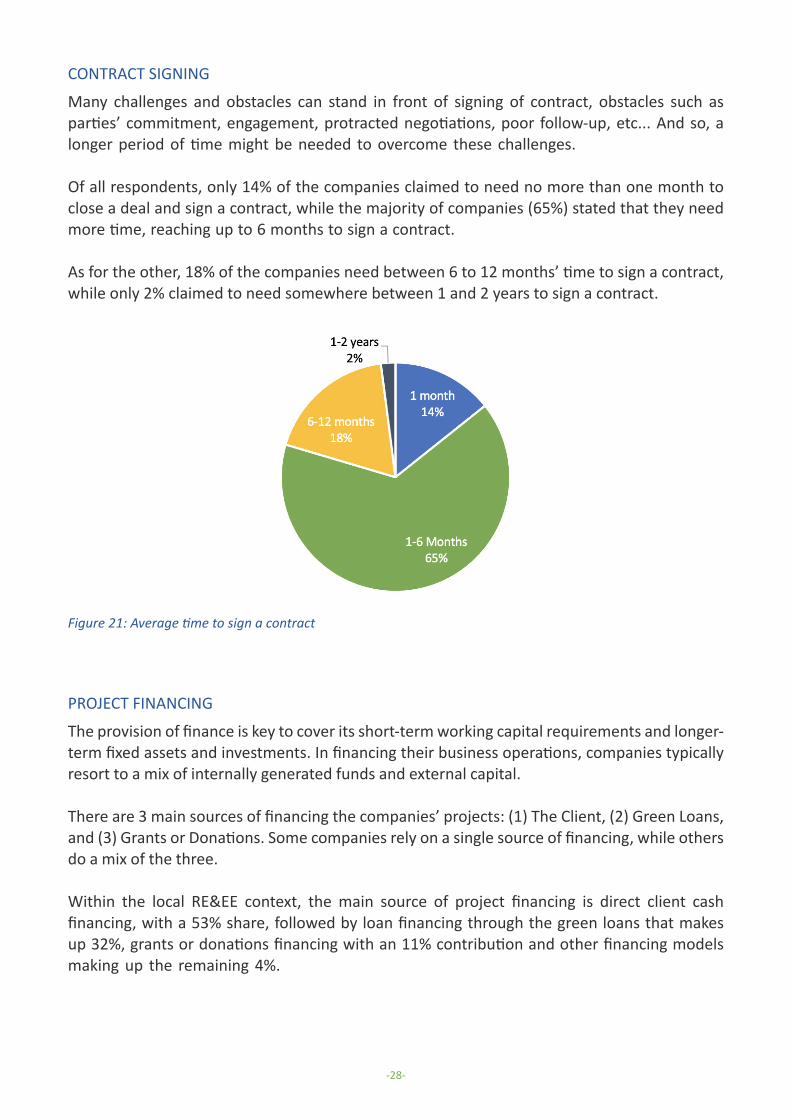
Of all respondents, only 14% of the companies claimed to need no more than one month to close a deal and sign a contract, while the majority of companies (65%) stated that they need more time, reaching up to 6 months to sign a contract.
As for the other, 18% of the companies need between 6 to 12 months’ time to sign a contract, while only 2% claimed to need somewhere between 1 and 2 years to sign a contract.
Figure 21: Average time to sign a contract
PROJECT FINANCING
The provision of finance is key to cover its short-term working capital requirements and longer-term fixed assets and investments. In financing their business operations, companies typically resort to a mix of internally generated funds and external capital.
There are 3 main sources of financing the companies’ projects: (1) The Client, (2) Green Loans, and (3) Grants or Donations. Some companies rely on a single source of financing, while others do a mix of the three.
Within the local RE&EE context, the main source of project financing is direct client cash financing, with a 53% share, followed by loan financing through the green loans that makes up 32%, grants or donations financing with an 11% contribution and other financing models making up the remaining 4%.
-28-

Figure 22: Overall source of project financing
Considering financing options by company size, smaller companies rely more heavily on direct client financing, with approximately 65% of their projects being financed this way, while they rely less heavily on green loan financing and grants with shares of 22% and 7% respectively.
Larger companies also rely heavily on direct client financing with an average share of 57%, and less on financing from green loans and grants with average shares of 34% and 8% respectively. Medium-sized companies rely the least on direct client financing with an average share of 37%, and around 42% on green loans and 17% grant financing. A new financing model is executed by some medium-sized companies, with around 4% of the projects done through co-financing together with the client or other entities.
-29-

Figure 23: Source of project financing by company size
In terms of company types, System Integrators rely most heavily on client financing with 57% of the funds being invested by the client. The remaining projects are funded with a rate of 27% from loans, 13% from grants and the remaining 3% share is divided between client co-financing and other modes. Energy companies have 50% of their projects funded by their clients, almost 28% being funded with green loans, 6% only by grants and the remaining shares is divided between co-financing by the clients and other modes. Finally, energy consultants rely the least on client funding with only 10% of the projects being funded this way, almost half the project rely on funding from green loans and the remaining 40% covered by grants.
-30-

Figure 24: Source of project financing by company type (scope of service)
In conclusion medium-sized companies appear to be more versatile in terms of funding options, small and large companies rely heavily on direct client financing with a lesser degree for large companies.
System Integrators on the other hand are heavily reliant on direct client funding, energy companies have more versatile sources of funding and Energy Consultants have a very low reliance on client funding.
In terms of resiliency, System Integrators need to invest more in aligning with loans application requirements and maybe apply for more grant financing opportunities and Energy Consultants need to work on more innovative business models to attract more client financing.
-31-
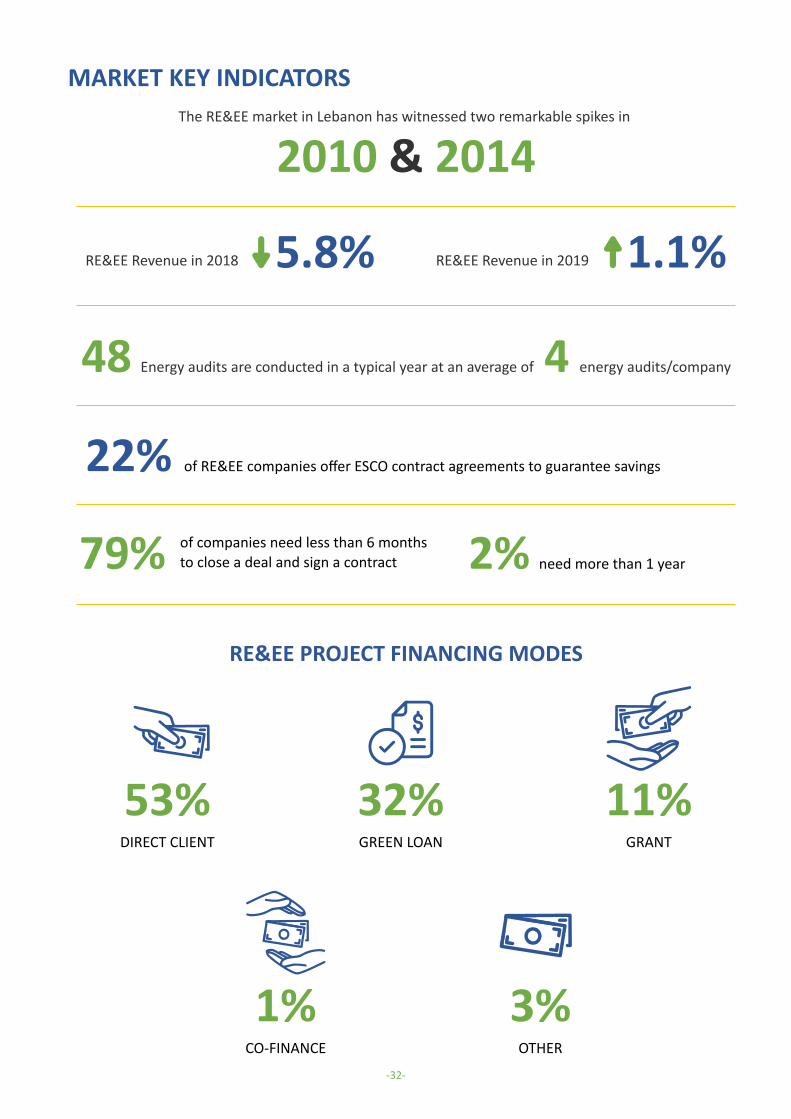
MARKET KEY INDICATORSThe RE&EE market in Lebanon has witnessed two remarkable spikes in
2010 & 2014
5.8%
22%
RE&EE Revenue in 2018 1.1%RE&EE Revenue in 2019
48
79%
4Energy audits are conducted in a typical year at an average of energy audits/company
of RE&EE companies offer ESCO contract agreements to guarantee savings
of companies need less than 6 monthsto close a deal and sign a contract 2% need more than 1 year
RE&EE PROJECT FINANCING MODES
53% 32% 11%DIRECT CLIENT GREEN LOAN GRANT
1%CO-FINANCE
3%OTHER
-32-

3. THE CAPACITIES
TECHNICAL QUALIFICATIONS
Although relatively young, the Lebanese RE&EE is rich with highly qualified companies and individuals, equipped with valuable skills, credentials, and working tools and equipment.
ESCO ACCREDITATIONS
Several regional ESCO qualification schemes are in place, set to accredit and qualify energy companies for eligibility to conduct energy audits and perform ESCO contracts.
The process is normally launched and monitored by a national or regulatory authority, with a pre-identified set of requirements that applicants need to meet to be listed as a qualified or accredited ESCO.
LEBANON
LCEC QUALIFIED ENERGY SERVICE COMPANIES
Launched by: Lebanese Center for Energy Conservation (LCEC) in 2016
Description: Qualification of Lebanese energy audit companies for eligibility to conduct energy audits for PV installations above 60 kWp applying for green loan financing by the Central Bank of Lebanon
UNITED ARAB EMIRATES
DUBAI RSB ESCO ACCREDITATION
Launched by: Regulatory and Supervisory Bureau in 2014
Description: Accreditation of energy service companies to conduct retrofitting of existing buildings and delivery of retrofit activities that require an energy services market with sufficient capability and capacity
ADEWA ESCO PREQUALIFICAITON
Launched by: Abu Dhabi Water & Electricity Authority in 2014
Description: Prequalification of Energy Service Companies to participate in energy service tenders for government and private buildings, including retrofit, commissioning, and measurement and verification.
-33-
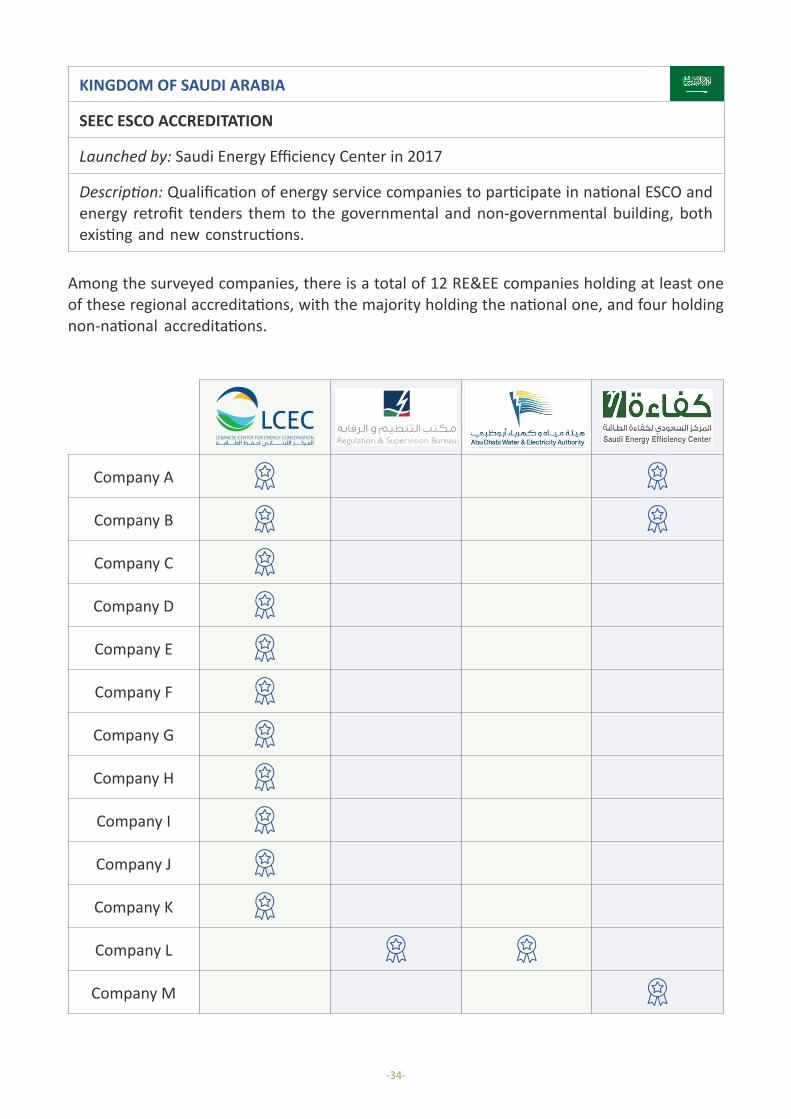
KINGDOM OF SAUDI ARABIA
SEEC ESCO ACCREDITATION
Launched by: Saudi Energy Efficiency Center in 2017
Description: Qualification of energy service companies to participate in national ESCO and energy retrofit tenders them to the governmental and non-governmental building, both existing and new constructions.
Among the surveyed companies, there is a total of 12 RE&EE companies holding at least one of these regional accreditations, with the majority holding the national one, and four holding non-national accreditations.
Company A
Company B
Company C
Company D
Company E
Company F
Company G
Company H
Company I
Company J
Company K
Company L
Company M
-34-
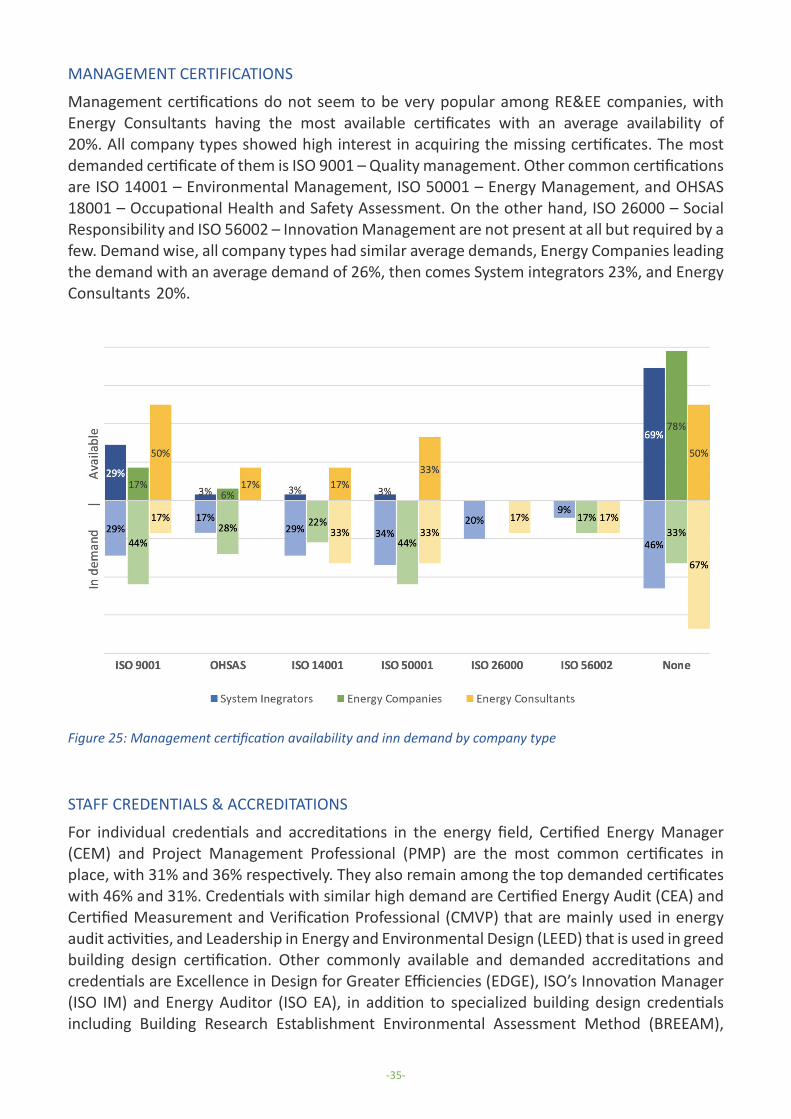
MANAGEMENT CERTIFICATIONS
Management certifications do not seem to be very popular among RE&EE companies, with Energy Consultants having the most available certificates with an average availability of 20%. All company types showed high interest in acquiring the missing certificates. The most demanded certificate of them is ISO 9001 – Quality management. Other common certifications are ISO 14001 – Environmental Management, ISO 50001 – Energy Management, and OHSAS 18001 – Occupational Health and Safety Assessment. On the other hand, ISO 26000 – Social Responsibility and ISO 56002 – Innovation Management are not present at all but required by a few. Demand wise, all company types had similar average demands, Energy Companies leading the demand with an average demand of 26%, then comes System integrators 23%, and Energy Consultants 20%.
Figure 25: Management certification availability and inn demand by company type
STAFF CREDENTIALS & ACCREDITATIONS
For individual credentials and accreditations in the energy field, Certified Energy Manager (CEM) and Project Management Professional (PMP) are the most common certificates in place, with 31% and 36% respectively. They also remain among the top demanded certificates with 46% and 31%. Credentials with similar high demand are Certified Energy Audit (CEA) and Certified Measurement and Verification Professional (CMVP) that are mainly used in energy audit activities, and Leadership in Energy and Environmental Design (LEED) that is used in greed building design certification. Other commonly available and demanded accreditations and credentials are Excellence in Design for Greater Efficiencies (EDGE), ISO’s Innovation Manager (ISO IM) and Energy Auditor (ISO EA), in addition to specialized building design credentials including Building Research Establishment Environmental Assessment Method (BREEAM),
-35-
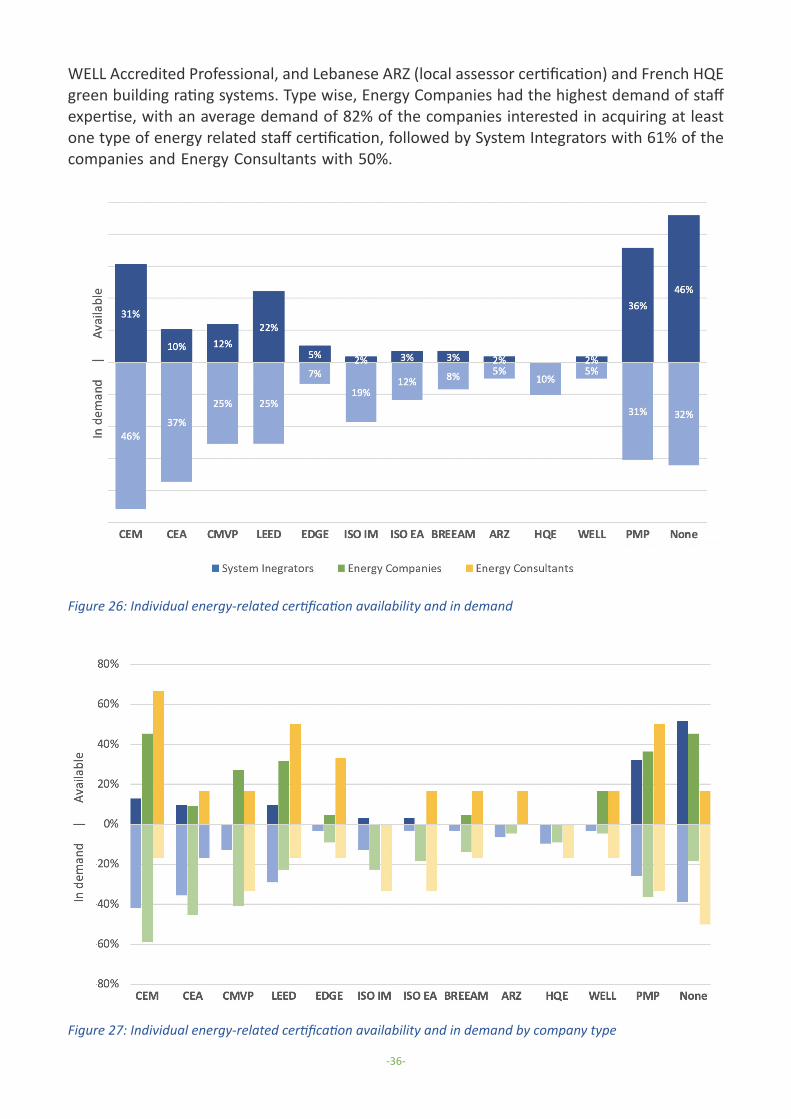
WELL Accredited Professional, and Lebanese ARZ (local assessor certification) and French HQE green building rating systems. Type wise, Energy Companies had the highest demand of staff expertise, with an average demand of 82% of the companies interested in acquiring at least one type of energy related staff certification, followed by System Integrators with 61% of the companies and Energy Consultants with 50%.
Figure 26: Individual energy-related certification availability and in demand
Figure 27: Individual energy-related certification availability and in demand by company type
-36-

TECHNOLOGY EXPERTISE
RE&EE companies demonstrate good level of expertise in basic energy efficiency and renewable energy activities, with more than 54% of these companies having sufficient solar PV knowledge, and more than 36% demonstrating good lighting, solar water heating, and residential energy efficiency experience.
Type wise, Energy Companies have the highest available Technology Expertise and the highest required demand for further Expertise, with an average of available expertise 38% and an average demand of 39%.
Energy consultants are next in available expertise with an average of 31%, yet showing a low demand for such expertise with an average of 24%.
System Integrators on the other hand, have the lowest available Technology expertise with an average available expertise of 23%, and a medium demand for such expertise of 34% average demand.
Yet, there is still demand for further knowledge development to cover the gaps (between available and in demand technology expertise) identified by these companies, with high demands for residential energy efficiency skills and renewable energy applications excluding solar water heating.
A big gap in energy audit, performance contracting, other renewables (Wind, Biogas and Concentrated Solar) and monitoring and control knowledge, with demand for development coming from different company types including System Integrators, Energy Companies, and Energy Consultants
Figure 28: Company technology-specific expertise and in demand
-37-
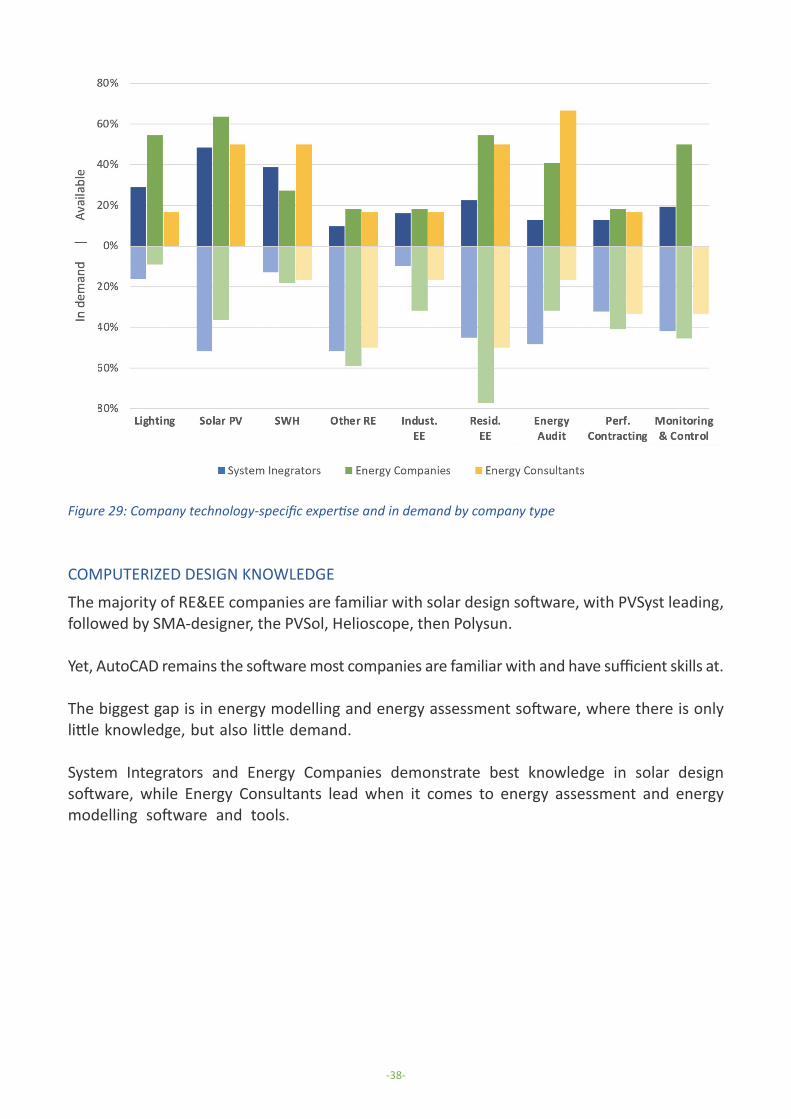
Figure 29: Company technology-specific expertise and in demand by company type
COMPUTERIZED DESIGN KNOWLEDGE
The majority of RE&EE companies are familiar with solar design software, with PVSyst leading, followed by SMA-designer, the PVSol, Helioscope, then Polysun.
Yet, AutoCAD remains the software most companies are familiar with and have sufficient skills at.
The biggest gap is in energy modelling and energy assessment software, where there is only little knowledge, but also little demand.
System Integrators and Energy Companies demonstrate best knowledge in solar design software, while Energy Consultants lead when it comes to energy assessment and energy modelling software and tools.
-38-

Figure 30: Software-specific expertise and in demand
Figure 31: Software-specific expertise and in demand by company type
-39-
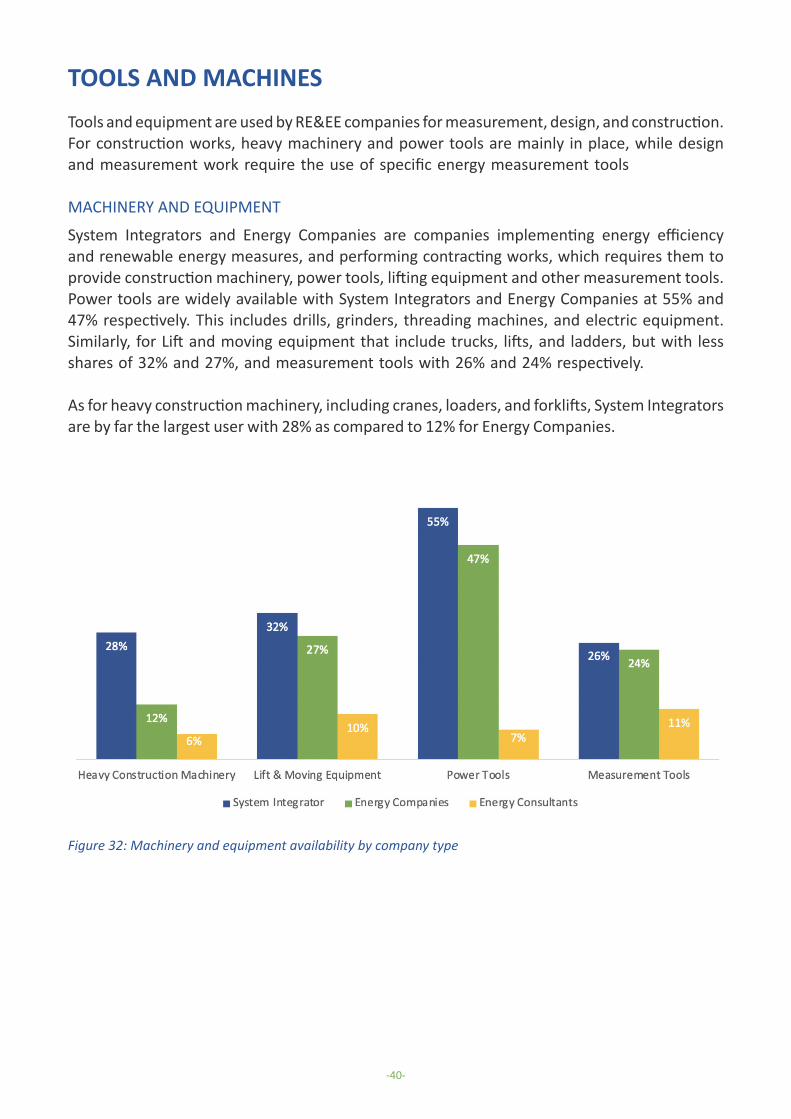
TOOLS AND MACHINESTools and equipment are used by RE&EE companies for measurement, design, and construction.For construction works, heavy machinery and power tools are mainly in place, while design and measurement work require the use of specific energy measurement tools
MACHINERY AND EQUIPMENT
System Integrators and Energy Companies are companies implementing energy efficiency and renewable energy measures, and performing contracting works, which requires them to provide construction machinery, power tools, lifting equipment and other measurement tools.Power tools are widely available with System Integrators and Energy Companies at 55% and 47% respectively. This includes drills, grinders, threading machines, and electric equipment. Similarly, for Lift and moving equipment that include trucks, lifts, and ladders, but with less shares of 32% and 27%, and measurement tools with 26% and 24% respectively.
As for heavy construction machinery, including cranes, loaders, and forklifts, System Integrators are by far the largest user with 28% as compared to 12% for Energy Companies.
Figure 32: Machinery and equipment availability by company type
-40-
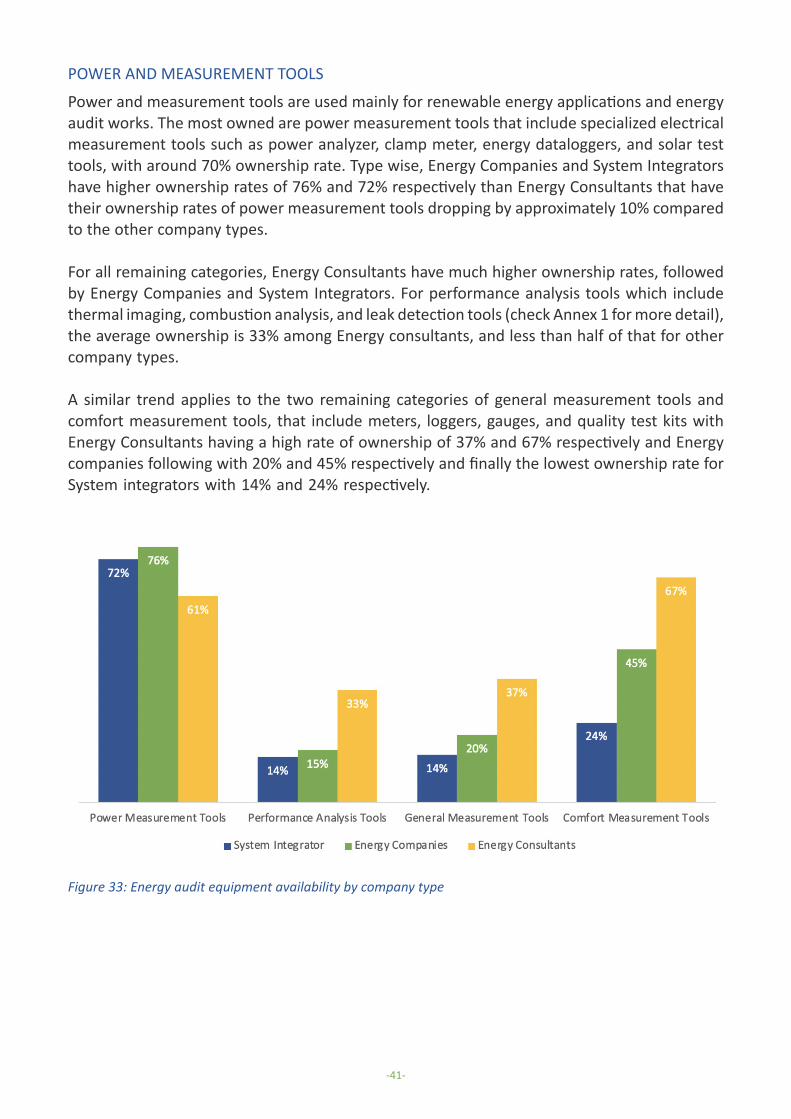
POWER AND MEASUREMENT TOOLS
Power and measurement tools are used mainly for renewable energy applications and energy audit works. The most owned are power measurement tools that include specialized electrical measurement tools such as power analyzer, clamp meter, energy dataloggers, and solar test tools, with around 70% ownership rate. Type wise, Energy Companies and System Integrators have higher ownership rates of 76% and 72% respectively than Energy Consultants that have their ownership rates of power measurement tools dropping by approximately 10% compared to the other company types.
For all remaining categories, Energy Consultants have much higher ownership rates, followed by Energy Companies and System Integrators. For performance analysis tools which include thermal imaging, combustion analysis, and leak detection tools (check Annex 1 for more detail), the average ownership is 33% among Energy consultants, and less than half of that for other company types.
A similar trend applies to the two remaining categories of general measurement tools and comfort measurement tools, that include meters, loggers, gauges, and quality test kits with Energy Consultants having a high rate of ownership of 37% and 67% respectively and Energy companies following with 20% and 45% respectively and finally the lowest ownership rate for System integrators with 14% and 24% respectively.
Figure 33: Energy audit equipment availability by company type
-41-
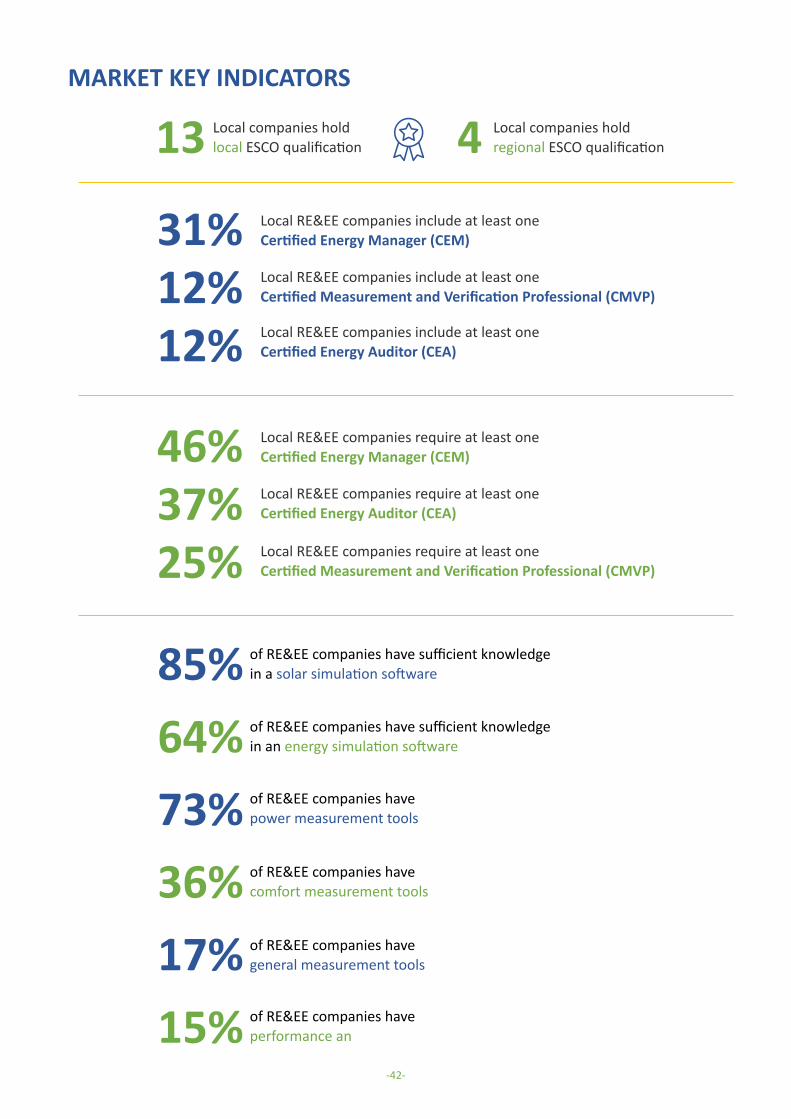
MARKET KEY INDICATORS
Local companies holdlocal ESCO qualification13 Local companies hold
regional ESCO qualification4
31%12%12%
Local RE&EE companies include at least oneCertified Energy Manager (CEM)
Local RE&EE companies include at least oneCertified Measurement and Verification Professional (CMVP)
Local RE&EE companies include at least oneCertified Energy Auditor (CEA)
46%37%25%
Local RE&EE companies require at least oneCertified Energy Manager (CEM)
Local RE&EE companies require at least oneCertified Energy Auditor (CEA)
Local RE&EE companies require at least oneCertified Measurement and Verification Professional (CMVP)
85% of RE&EE companies have sufficient knowledgein a solar simulation software
64% of RE&EE companies have sufficient knowledgein an energy simulation software
73% of RE&EE companies havepower measurement tools
36% of RE&EE companies havecomfort measurement tools
17% of RE&EE companies havegeneral measurement tools
15% of RE&EE companies haveperformance analysis tools
-42-

4 ANNEX 1 - NOTES
MACHINERY & EQUIPMENT GROUPING
HEAVY CONSTRUCTION MACHINERY• Crane• Loader• Forklift
LIFT & MOVING EQUIPMENT• Truck • Scissor Lift• Boom Lift• Manlift• Ladder
POWER TOOLS• Electric drills• Electric grinders• Pipe threading machines• Welding machine• Electric Hammer
MEASUREMENT TOOLS• Hydraulic pressure test tools• Aeraulic measurement tools• Compressed Air Tools
-43-
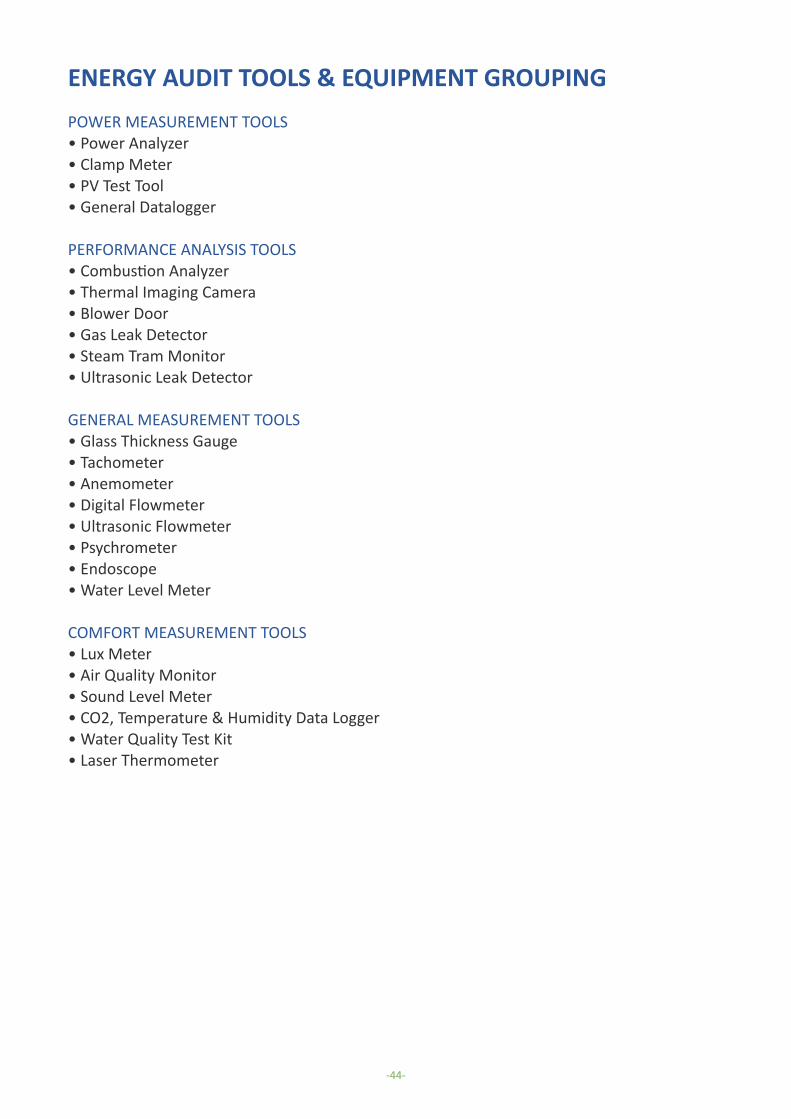
ENERGY AUDIT TOOLS & EQUIPMENT GROUPINGPOWER MEASUREMENT TOOLS• Power Analyzer• Clamp Meter • PV Test Tool• General Datalogger
PERFORMANCE ANALYSIS TOOLS• Combustion Analyzer• Thermal Imaging Camera• Blower Door• Gas Leak Detector• Steam Tram Monitor• Ultrasonic Leak Detector
GENERAL MEASUREMENT TOOLS• Glass Thickness Gauge• Tachometer• Anemometer• Digital Flowmeter• Ultrasonic Flowmeter• Psychrometer• Endoscope• Water Level Meter
COMFORT MEASUREMENT TOOLS• Lux Meter• Air Quality Monitor• Sound Level Meter• CO2, Temperature & Humidity Data Logger• Water Quality Test Kit• Laser Thermometer
-44-

The European Union and Lebanon are strategic partners cooperating closely on joint challenges. The close political relations between the EU and Lebanon are guided by an Association Agreement which has been in force since April 2006. The partnership is based on common values and interests, regular political, security, economic and social dialogue, wide-ranging people-to-people contacts, and substantial development and humanitarian assistance. Under the European Commission’s efforts, ENI program promotes innovation, entrepreneurship and job creation in support of Lebanon’s clean energy transition and INDCs for the energy sector. The global objective of this call for proposals is: to address job creation and growth in support of Lebanon’s stagnated economy (in line with the first priority sector of the Single Support Framework for EU Support to Lebanon 2017-2020), while supporting Climate Change Mitigation in Lebanon. REESTART and CEDRO 5 Project are funded by EU and are part of ENI Program.
RENEWABLE ENERGY AND ENERGY EFFICIENCY FOR SUSTAINABLE ENERGY TRANSITION AND REINFORCED TRUST (REESTART)REESTART (Renewable Energy and Energy Efficiency for Sustainable Energy Transition And Reinforced Trust) Encourages the private sector, including Energy Services Companies (ESCOs) investing in alternative sources of energy to adopt effective and sustainable energy policies; Contributes to promote entrepreneurship, innovation and job creation in support of Lebanon’s clean energy transition; Increases levels of investment in Renewable Energy and Energy Efficiency through the creation of a more enabling environment for ESCOs to operate and grow. REESTART project consists in four main pillars: 1. Capacity Building Program to reach the Lebanese Energy Service Companies in order to train on the technical, financial and legal framework to develop own Energy Business; 2. Call for Proposal to select 35 SMEs in order to give them a partially subsidize for Energy Audit; and to select 10 ESCOs in order to give them access to sustainable energy finance to implement the energy efficiency and renewable energy interventions; 3. Selection, implementation and monitoring of 6 Pilot Projects at SMEs plant; 4. Creation of Lebanese Federation of ESCOs in order to be able in the long term to rely on a sustainable and guaranteed business ground. REESTART is a Country committed Project, so our goal is to reach different sectors and cover different areas of the country. The final pilot projects will be the successful best practices to be replicated in the future, so the selection will take in consideration the variability and the diversification of geographical area and Enterprises sectors.
PROJECT PARTNERS
CONTACT DETAILSHekmet Building 5th floor, Baabda, Lebanon+961 76 139573 | +961 5 [email protected]
ABOUT THE PROJECTS
-45-
COUNTRY ENTREPRENEURSHIP FOR DISTRIBUTED RENEWABLES OPPORTUNITIES (CEDRO 5)The United Nations Development Programme, in support of the Ministry of Energy and Water, has initiated the implementation of the CEDRO 5 project funded by the European Union. The CEDRO 5 project, a 4-year project 2019 – 2023 - is implemented in partnership with the Association of Lebanese Industrialists (ALI), The Lebanon Green Building Council (LGBC), and the International Renewable Energy Credits (I-REC) Institution. The European Commission (EC) is encouraging innovation and entrepreneurship in Lebanon to support a clean energy transition. The overall aim of the EC is to address job creation and growth in support of Lebanon’s economy, in line with the first priority sector of the Single Support Framework for EU Support to Lebanon (2017-2020), while supporting Climate Change Mitigation in Lebanon. The specific objective is to promote innovation, entrepreneurship, and job creation in support of Lebanon’s clean energy transition and Nationally Determined Contributions (NDCs) for the energy sector. The EC proposes the gradual shift towards a clean energy transition (gradual phasing out from fossil fuels by switching to renewable energy sources) and circular economy principles, paving the way for (1) tapping into the potential for green jobs and growth (in particular in the energy sector), (2) alleviating financial and economic burden of the current energy system on the various sectors and sub-sectors of Lebanon, (3) facilitating access to financing, and (4) improving the linkages amongst green entrepreneurship, small-and-medium sized enterprises (SMEs), industries and research/technology centers. The CEDRO 5 project aims to achieve the objectives outlined above through enhancing innovation, entrepreneurship and research, assisting in technology transfer and the creation of new value chains in the renewable energy and energy efficiency sector, supporting and initiating enabling policy, training, and capacity building, and targeting effective awareness initiatives on renewable energy (RE) and energy efficiency (EE).
PROJECT PARTNERS
CONTACT DETAILS5th floor, Centre Ville 1341 SAL bldg, Howayek Street+961 1 981 [email protected]
-46-

© Any reproduction, publication and reprint in the form of a different publication, whether printed or produced electronically,
in whole or in part, is permitted only with the explicit written authorization of the UNDP or ICU or the authors; and it must
mention the full title and authors.
Lebanese Green Energies Companies: Challenges and Opportunities
Report October 2020
www.cedro-undp.org
www.reestart.eu
Copyright © 2022 FDOKUMEN