the assimilation of (shia) lebanese-origin youth into canada
Upload
khangminh22Category
view
2download
0
HAL Id: tel-03702029https://tel.archives-ouvertes.fr/tel-03702029
Submitted on 22 Jun 2022
HAL is a multi-disciplinary open accessarchive for the deposit and dissemination of sci-entific research documents, whether they are pub-lished or not. The documents may come fromteaching and research institutions in France orabroad, or from public or private research centers.
L’archive ouverte pluridisciplinaire HAL, estdestinée au dépôt et à la diffusion de documentsscientifiques de niveau recherche, publiés ou non,émanant des établissements d’enseignement et derecherche français ou étrangers, des laboratoirespublics ou privés.
Tracking trace elements from soil to Lebanese bread andPopulations Exposure
Nada Lebbos
To cite this version:Nada Lebbos. Tracking trace elements from soil to Lebanese bread and Populations Expo-sure. Environmental and Society. Université Bourgogne Franche-Comté, 2021. English. �NNT :2021UBFCK061�. �tel-03702029�

Doctoral thesis
to obtain the degree of Doctor issued by
Burgundy Franche-Comté university
and prepared at Agrosup Dijon
Doctoral School of Environments and Health n°554
Specialty: Food Sciences and Nutrition
Presented and publicly supported by
Nada Lebbos Harfouche
on the 22nd of October 2021
Tracking Trace Elements from Soil to Lebanese Bread
and Populations Exposure
Jury members
Mr. Kass Georges, Professor of Toxicology, University of Surrey, United Kingdom Reviewer
Mr. Lteif Roger, Professor, Health and Technology Pole, Saint Joseph university, Lebanon Reviewer
Ms. Daou Claude, Associate Professor, Lebanese University, Faculty of Science II, Lebanon Examiner
Mr. Khairallah Georges, Analytical Platform Manager, Melbourne University, Australia Examiner
Mr. Curmi Pierre, Emeritus Professor, UMR Biogéosciences, Agrosup Dijon, France Director
Mr. Bou-Maroun Élias, Associate Professor, UMR PAM, Agrosup Dijon - UBFC, France Co-Director

Preface
i
PREFACE
This work was carried out in the laboratories of LARI (Lebanese Agricultural Research Institute)
Beirut - Lebanon, CEREGE Aix-Marseille University and Agrosup Dijon, University of Burgundy
- Franche Comté under the supervision of Professor Pierre CURMI and the co-supervision of
Professor Elias BOU-MAROUN in a project "Cèdre", in a collaboration with the Lebanese
University - Faculty of Sciences II).
This work has led to the following:
PUBLICATION IN SCIENTIFIC JOURNAL
N. Lebbos, E. Bou-Maroun, C. Daou, R. Ouaini, H. Chebib, C. Keller, M. Afram, P. Curmi, M-C. Chagnon.
Chemical analysis of metallic trace elements of toxicological concern in Lebanese pita and risk
characterization for the consumers. Toxicology Letters Volume 295, Supplement 1, 10 October 2018,
Pages S165-S166. https://doi.org/10.1016/j.toxlet.2018.06.791.
N. Lebbos, C. Daou, R. Ouaini, H. Chebib, M. Afram, P. Curmi, L. Dujourdy, E. Bou-Maroun, and Marie-
Christine Chagnon. Lebanese Population Exposure to Trace Elements via White Bread Consumption,
Foods, 2019. Foods 2019, 8, 574; https://doi.org/10.3390/foods8110574.
N. Lebbos, C. Keller, L. Dujourdy, M. Afram, P. Curmi, T. Darwish, C. Daou, E. Bou-Maroun. Validation
of a new method for monitoring trace elements in Mediterranean cereal soils. International Journal
of Environmental Analytical Chemistry. https://doi.org/10.1080/03067319.2021.1953000. Published
online on the 10th of August 2021.
POSTER IN INTERNATIONAL CONFERENCES
N. Lebbos, E. Bou -Maroun, C. Daou, R. Ouaini, H. Chebib, M.C. Chagnon, M. Afram, C. Keller and P.
Curmi. Metallic contamination of wheat - cultivated soils in the Bekaa flatland of Lebanon. The 14th
ICOBTE Conference 16-20 July 2017, Zurich.
N. Lebbos, E. Bou-Maroun, C. Daou, R. Ouaini, H. Chebib, C. Keller, M. Afram, P. Curmi, M.C. Chagnon.
Chemical analysis of trace elements of toxicological concern in white Lebanese pita and risk
characterization for the consumers. The 54th Congress of the European Societies of Toxicology
(EUROTOX 2018) 2-5 September, 2018, Brussels.
I. Séverin, E. Bou-Maroun, R. Akiki, G. Zoghbi, N. Lebbos, R. Ouaini, H. Chebib, M. Afram, P. Curmi, C.
Daou and M-C. Chagnon. Lebanese pita extracts with presence of trace elements: hazard assessment.
47th Meeting of the European Environmental Mutagenesis and Genomics Society (EEMGS) 19-23 May
2019, France.

ACKNOWLEDGMENT
ii
To my father's soul

ACKNOWLEDGMENT
iii
ACKNOWLEDGMENT
The harder the Goal, the greater the Victory
With few words, I would like to thank all who have contributed in one way or another to
the successful achievement of this work. My thanks to the University of Burgundy Franche-
Comté for giving me the chance to integrate my PhD.
To my thesis supervisor, Pr Pierre CURMI, it’s the time to say that I have been lucky to work
under his supervision, to profit from his great experience and his scientific professionalism.
I really appreciate the time he devoted to me and without him, this thesis would never
have seen the light of day.
A special thanks to Dr Elias BOU-MAROUN, my co-supervisor who was always the
motivator, the supporter and the leader, who played the role of an idol by his scientific as
well managerial talent and gave me the opportunity to prove myself in several professional
ways.
As well, I address my deep thanks to the special director, Dr Michel AFRAM, for supporting
me and allowing me to carry out this work in the laboratories of the Lebanese Agricultural
Research Institute (LARI).
I would particularly like to thank the thesis committee, Pr Marie-Christine CHAGNON and
Pr Catherine KELLER, who encouraged me all the time and helped me with everything that
can advance the work.
Also big thanks to the members of jury, who agreed to judge this thesis.
I would like to say a countless thank you to Professor Hanna CHEBIB and Professor Rosette
OUWAINI for been always ready to share their scientific and human qualities. I express my
appreciation and gratitude for the time they have given me throughout this time.
I am very grateful and would like to thank Dr. Myriam TRABOULSI and Dr. Talal DARWISH,
who did not hesitate to help me for a moment.
My sincere thanks to my friend Dr Claude DAOU, for her moral and scientific support for
her availability, and her patient.

ACKNOWLEDGMENT
iv
Special thanks from the bottom of my heart to my friend Dr Wadih SKAFF, my cousins
Associate Professor Joseph BEJJANI and Mrs Jacqueline SAAD HARFOUCHE, for being kind
enough to help me on different levels and for giving me good encouragements.
I also thank my dear Maryse OBEID for her endless help and big heart, my colleagues at
LARI, especially Dr Ihab JOMAA, Dr Yara KHAIRALLAH, and Dr Dany ROUMANOS.
My deepest thanks to my colleague Engineer Rabih KABALAN for his infinite help at any
time during the thesis and especially in the choice of studied sites.
I deeply want to thank my parents for bringing me up to be open-minded, for always
uplifting and encouraging me. Mom, thank you for believing in me. I am extremely grateful
to you for helping me become the person I am. To my other half, my dear lovely sister
Nagham, who catches up with me when I fall, and sacrifices a lot of her time to help me, I
don't know if words are enough to say thank you.
To my husband John!!! I owe him everything and wouldn't be here without him. He always
pushed me to do better! I am infinitely grateful for the sacrifices he made all those years,
and for his ongoing support on a daily basis.
Finally, a very big thank to my adorable heroes Adriel and Kael for their patience with a
"student mom".
And finally, to my dad, I know very well that his soul is always here with me and proud
with what I have achieved today.
Table of Contents
v
TABLE OF CONTENTS
PREFACE
ACKNOWLEDGMENT
TABLE OF CONTENTS
LIST OF TABLES
LIST OF FIGURES
LIST OF ABBREVIATIONS AND ACRONYMS
INTRODUCTION
PART I – BIBLIOGRAPHY
i
ii
v
x
xiii
xvi
1
4
CHAPTER I-1 Trace Elements Contamination of Soils and Wheat Plants 5
I-1.1 Origin of trace elements contamination of soils 7
I-1.1.1 Natural origin 8
I-1.1.2 Anthropogenic origin 8
I-1.1.2.1 Agricultural practices
I-1.1.2.1.1 Organic Fertilizers
I-1.1.2.1.2 Inorganic Fertilizers
I-1.1.2.1.3 Pesticides
I.1.1.2.1.4 Irrigation water
9
9
12
15
16
I-1.1.2.2 Industrial stress 17
I-1.2 Mobility of trace elements in soils 18
I-1.2.1 Factors affecting the mobility of trace elements in soils 19
I-1.2.1.1 Soil parameters : soil pH, potential redox, and CEC 19
I-1.2.1.2 Soil constituents : Soil Organic Matter and Clay 20
I-1.2.2 Processes affecting trace elements mobility in soils 21
I-1.2.3 Trace elements uptake and translocation in plants 23
I-1.2.4 Effects of trace elements in wheat plants 24
I-1.3 The essential role of the element silicon in trace elements bioaccumulation in
wheat plants
25
CHAPTER I-2 Bread and Trace Elements Exposure of the Lebanese Population via
Lebanese White Bread
28
I-2.1 Challenges of trace elements food contamination 29
I-2.1.1 Challenges of trace elements food contamination worldwide 29
I-2.1.2 Challenges of food contamination in Lebanon and food safety 31
I-2.2 Lebanese bread Industry and trace elements contamination 32
Table of Contents
vi
I-2.2.1 Lebanese white bread composition 32
I-2.2.2 Lebanese white bread processing 34
I-2.2.2.1 Description and manufacturing process of Lebanese white bread 34
I-2.2.2.2 Packaging of Lebanese white bread 36
I-2.3 Nutritional benefits of Lebanese bread 36
I-2.4 Trace elements contamination of Lebanese bread 37
I-2.5 Potential Exposure and Risk Associated to TEs exposure of the Lebanese
population via the daily consumption of the Lebanese white bread
39
I-2.5.1 Potential exposure to chemical compounds and associated risk 39
I-2.5.2 Potential exposure to trace elements in food and associated risk 41
I-2.5.3 Thresholds of trace elements in food and their monitoring
41
CHAPTER I-3 The international and national legislations of soil, wheat plant and
bread
45
I-3.1 Standardization and regulatory aspect 46
I-3.1.1 Allowable limits of TEs in soil 46
I-3.1.2 Allowable limits of TEs in Inorganic Fertilizers 46
I-3.1.3 Allowable limits of TEs in Irrigation water 47
I-3.1.4 Allowable amounts of TEs in sewage sludge 47
I-3.1.5 Allowable limits of TEs in Cereal plants 48
I-3.1.6 Allowable limits of TEs in foodstuff and Bread 49
PART II – MATERIAL AND METHODS 50
CHAPTER II-1 Geological, hydrogeological, hydrological and climatic context of the
Bekaa valley
51
II–1.1 Geology 52
II-1.2 Climate 53
II-1.3 The Litani River Basin 55
II-1-4 Site locations 58
II-1-5 Climate of the Central Bekaa valley
60
CHAPTER II-2 The studied matrices 61
II-2.1 Soil samples 62
II-2.1.1 Sampling 62
II-2.1.2 Physico chemical parameters of soil 62
II-2.1.2.1 Determination of soil pH 62
II-2.1.2.2 Determination of electrical conductivity EC 63
II-2.1.2.3 Soil texture 63
II-2.1.2.4 Determination of soil organic matter content (SOM) 63
Table of Contents
vii
II-2.1.2.5 Determination of total limestone 64
II-2.1.2.6 Determination of active limestone content 64
II-2.1.2.7 Determination of the available phosphorus content (Olsen method) 64
II-2.1.2.8 Determination of exchangeable bases : K+, Na+, Ca2+ and Mg2+ 65
II-2.1.3 Trace elements determination in soil samples 66
II-2.1.4 Silicon determination 67
II-2.2 Wheat samples 67
II-2.2.1 Wheat plant production 67
II-2.2.1 Sampling 68
II-2.2.2 Trace elements determination of the different wheat plant organs 68
II-2.3 Irrigation water samples 69
II-2.4 Bread samples 70
II-2.4.1 Survey of Lebanese bread consumption 70
II-2.4.2 Trace elements determination in bread samples 71
II-2.4.3 Exposure determination
72
PART III – RESULTS AND DISCUSSION 73
CHAPTER III-1 Validation of a new method for monitoring trace elements in
Mediterranean cereal soils
75
III-1.1 Introduction 76
III-1.2 Material and methods 79
III-1.2.1 Chemicals 79
III-1.2.2 Sites and sampling 79
III-1.2.3 Samples pretreatment and digestion 80
III-1.2.4 Apparatus for trace elements analysis 81
III-1.2.5 Official or reference methods for trace element analysis 82
III-1.2.6. Statistical analysis 83
III-1.3 Results and Discussion 83
III-1.3.1 Choice of the best digestion method using the soil Certified Reference
Material CMR (SQC001)
83
III-1.3.2 Validation of the microwave sulphuric digestion method followed by AAS
using the soil Certified Reference Material CMR (SQC001)
85
III-1.3.2.1 Working range, linearity domain, limit of detection (LOD) and limit of
quantification (LOQ)
85
III-1.3.2.2 Precision including repeatability and intermediate precision 87
III-1.3.2.3 Specificity 89
III-2.3.2.4 Comparison between the validated method (MSD + AAS) and the RTD
method (HF-based digestion + ICP/ICPMS) of TE analysis. Accuracy or trueness
90
III-1.4 Conclusion
97
Table of Contents
viii
CHAPTER III-2 Geogenic and anthropogenic origin of trace elements in the Central
Bekaa soils
98
III-2.1 Geogenic context 99
III-2.1.1 Soils in the landscape 99
III-2.1.2 Physicochemical characterization of the studied sites 105
III-2.2 Anthropogenic context 110
III-2.2.1 Trace elements provided by fertilization and amendments 110
III-2.2.2 Trace Elements contributions related to irrigation 111
III-2.2.2.1 Deep well water 111
III-2.2.2.2 Pathway of contaminants carried by surface water used for irrigation 115
III-2.2.2.3 Other contributions 117
III -2.3 Quantification and origin of trace elements available in the soil
III-2.4 Conclusion
119
122
CHAPTER III-3 Transfer of trace elements to wheat plant Analysis according to soil
types, silicon status and origin of trace elements
124
III-3.1 Introduction 125
III-3.2 Trace element concentrations in soils 125
III-3.3 Trace elements and silicon availability in the 8 studied soils 128
III-3.4 The transfer of Pb, As and Cd from soil to wheat 131
III-3.5 Factors responsible for concentrations in grain 135
III-3.6 Conclusion
137
CHAPTER III-4 Lebanese Population Exposure to Trace Elements via White Bread
consumption
138
III-4.1 Introduction 140
III-4.2 Materials and Methods 142
III-4.2.1 Survey 142
III-4.2.2 Chemicals 144
III-4.2.3 Sampling for Trace Elements Analysis 144
III-4.2.4 Sample Digestion for Trace Elements Analysis 144
III-4.2.5 Analysis of Trace Elements 145
III-4.2.6 Exposure Determination 145
III-4.2.7 Statistical Analysis 145
III-4.3 Results 146
III-4.3.1 Survey Results 146
III-4.3.2 Trace Element Contents in Pita 151
III-4.3.3 Trace Element Exposures 153
III-4.3.4 Risk Characterization (Intake Excess of TEs via Bread Consumption) 154
Table of Contents
ix
III-4.4 Discussion 159
III-4.4.1 Survey 159
III-4.4.2 Risk Characterization 159
III-4.5 Conclusions
167
GENERAL CONCLUSION
168
REFERENCES
ABSTRACT
RÉSUMÉ
172
194
196
ANNEX a1
ANNEX 1 Survey and questionnaire related to Lebanese bread consumption a2
ANNEX 2 Toxicological data sheet for As a9
ANNEX 3 Toxicological data sheet for Cd a19
ANNEX 4 Toxicological data sheet for Co a27
ANNEX 5 Toxicological data sheet for Cr a32
ANNEX 6 Toxicological data sheet for Pb
a39
PUBLISHED ARTICLES a54 ARTICLE 1 Lebanese population exposure to trace elements via white bread consumption, Foods.
ARTICLE 2 Validation of a new method for monitoring trace elements in Mediterranean
cereal soils, International Journal of Environmental Analytical Chemistry.
List of Tables
x
LIST OF TABLES
Table I-1. 1: World cereal production (2010) 6
Table I-1. 2: Concentration of As, Cd and Pb in P fertilizers marketed in China,
European countries, Chile and Lebanon
13
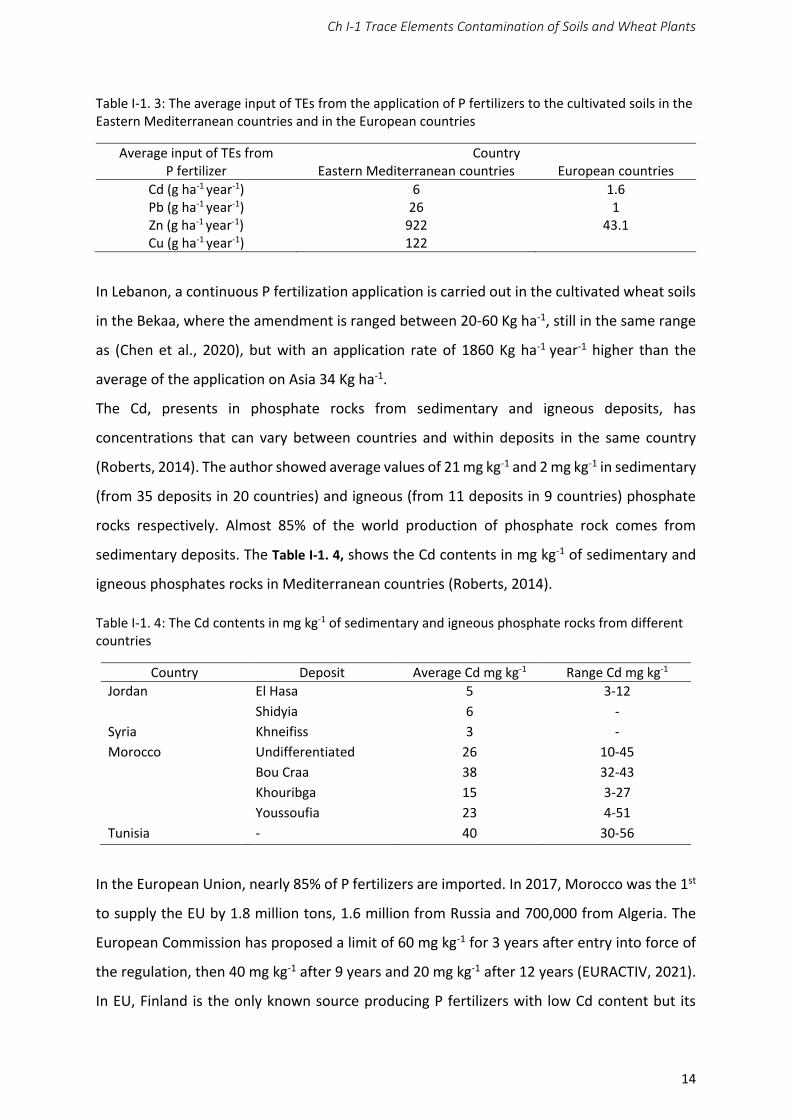
Table I-1. 3: The average input of TEs from the application of P fertilizers to the
cultivated soils in the Eastern Mediterranean countries and in the European countries
14
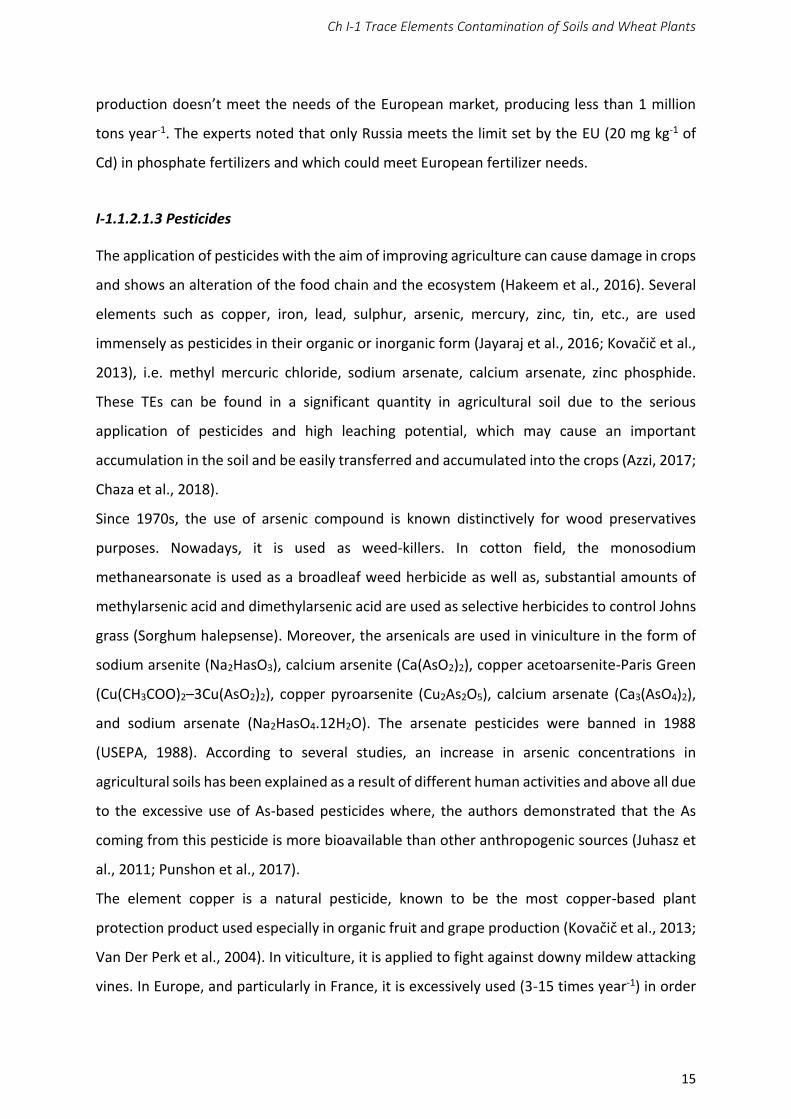
Table I-1. 4: The Cd contents in mg kg-1 of sedimentary and igneous phosphate rocks
from different countries
4
Table I-2. 1: The main ingredients and manufacturing of different types of Lebanese
bread
34
Table I-2. 2: The calorific values and nutrition facts of Lebanese breads 37
Table I-3. 1: Max allowable concentrations of trace elements (mg kg−1) in soil
according to EU, WHO, NJDEP, CEQCs, MACs, and MEF.
46
Table I-3. 2: Maximum allowable concentrations of TEs in inorganic fertilizers TEs (mg
kg−1)
47
Table I-3. 3: Maximum allowable concentrations of TEs (mg L−1) in irrigation water 47
Table I-3. 4: Limit values of TEs (mg kg-1 DM) in sewage sludge used in agricultural soil 48
Table I-3. 5: The limit values for TEs amounts which may be added annually to
agricultural soil
48
Table I-3. 6: The concentrations of Cd, Pb and As (mg kg−1) in cereal plants as per EU,
Germany regulations, FAO/WHO, China, and Australia/New Zealand
49
Table I-3. 7: The concentrations of TEs (mg kg−1) in foodstuffs and bread as per (NL
240, 2010) - Libnor and EC (No 1881, 2006)
Table II-1.1: The nine studied sites locations in the Bekaa Plain, their altitudes and
annual rainfall
Table II-2. 1: The type and variety of wheat grown in the studied sites of the Bekaa
region, and the different supplemental irrigation sources
49
59
68
Table III-1. 1: Comparison of the heating 3 acid digestion method (HAD) and the
microwave sulphuric digestion method (MSD) using their relative recovery
percentage of the soil Certified Reference Material CMR (SQC001)
84
Table III-1. 2: Calibration curves of the measured elements 86
Table III-1. 3: Working ranges, regression equations, limit of detection (LOD) and limit
of quantification (LOQ) of the measured elements
Table III-1.3bis: LOQ/(Threshold value) ratio according to element and land use *
87
87
Table III-1. 4: Repeatability and intermediate precision results obtained after TE
analysis of CRM soil using the microwave sulphuric digestion method (n = 9 for both
operators)
89
Table III-1. 5: Specificity results expressed as mean recovery percentage and standard
deviation. Three samples were analysed: CRM soil alone and CRM after the addition
of two concentration levels for each element (n = 9)
90
List of Tables
xi
Table III-1. 6: Comparison between the MSD method (H2SO4 + H2O2 digestion) being
validated and the RTD method (HF + HClO4 digestion) for TEs in soil samples from the
Bekaa governorate sites.
92
Table III-2. 1: Physicochemical characterization of the studied soils 106
Table III-2. 2: Total trace elements content of the studied sites 107
Table III-2. 3: The limits of TEs content (mg kg-1) in phosphate fertilizers and their
contribution to soils
111
Table III-2. 4: TEs contents (µg L-1) in ultrafiltered irrigation water samples in the Bekaa
studied sites
112
Table III-2. 5: The quantity of TEs carried by deep tube well irrigation water (338 mm
yr-1) to soil per year and per 100 years
115
Table III-2.6: The total and the available TEs (DTPA extraction) concentrations in the
studied soil samples (mg kg-1)
119
Table III-3. 1: Phytoavailable concentrations of trace elements (assessed by DTPA
extraction) and silicon (assessed by CaCl2 extraction) in the soils of the 8 studied sites.
130
Table III-3. 2: As, Cd and Pb concentrations in stem, leaves and grain of wheat grown
on the 8 soils
132
Table III-3. 3: Translocation ratios (factor) for the various plant parts and As, Cd and
Pb
134
Table III-3. 4: plant parts-soil ratios. Bioaccumulation factors were calculated with
total Pb, As and Cd concentrations in soil and with DTPA-extractable Pb, As and Cd
concentrations for grain. S=stem; L=leaves; G=grain
135
Table III-4. 1: Sampling strategy according to the population distribution 143
Table III-4. 2: Pearson correlation matrix of the Principal Component Analysis 147
Table III-4. 3: Daily white pita consumption according to population categories and
repartition by brands
148
Table III-4. 4: Trace element contents in white pita bread for the three major brands
on the Lebanese market
151
Table III-4. 5: Pearson correlation matrix of the Principal Component Analysis 153
Table III-4. 6: Population categories exposure to Cd, Hg, Cr, Co, Ni, Pb & As trace
elements via white pita consumption according the most consumed brands
154
Table III-4. 7: Population categories’ exposure to Cd and Hg trace elements via B3
white pita consumption and comparison with the tolerable weekly intake (TWI)
Exposure values are expressed in µg/kg body weight/week
157
Table III-4. 8: Population categories exposure to Cr, Co, and Ni trace elements via
white pita consumption and comparison with the tolerable daily intake (TDI) Exposure
values are expressed in µg/kg body weight/day
157
List of Tables
xii
Table III-4. 9: Margin of exposure (MOE) to Pb and As trace elements via white pita
consumption for the Lebanese population categories
Table III-2.1 Annex: Soil site classification according World Reference Base 2014
Table III-2.2 Annex: The type and variety of wheat grown in the studied sites with the
methods of fertilization and irrigation applied
Table III-2.3 Annex: Wheat -Potato crop rotation in the studied sites, irrigation and
fertilizers
Table III-3.1: Correlation TEs in wheat plants and soil – Si (soil) – Physico-chemical
parameters in soil
Table III-3.2 Annex: DTPA-extractable Pb, Cr, Co, Ni, Cu, Zn, As and Cd as a function of
total
Table III-4.1 Annex: The trace elements contents in studied soils in the Bekaa region
and the three most consumed white Lebanese bread
158
a48
a49
a50
a51
a52
a53
List of Figures
xiii
LIST OF FIGURES
Figure I-1. 1 : The different sources of soil TEs contamination 8
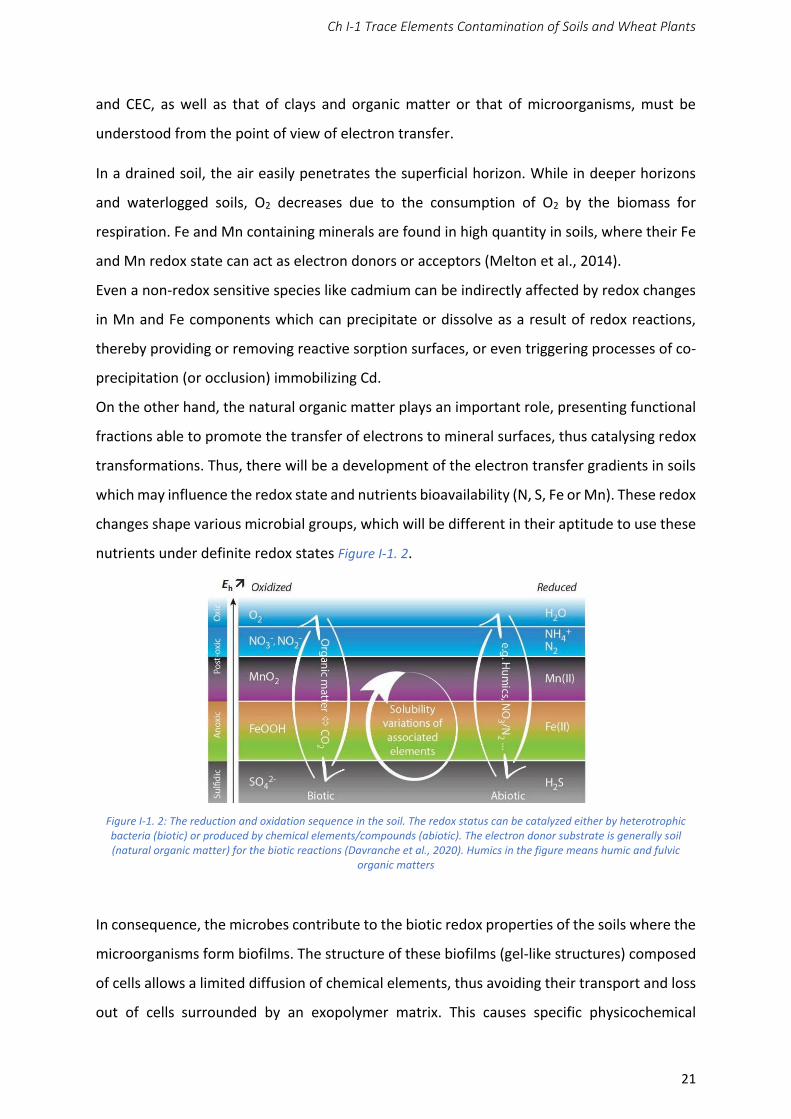
Figure I-1. 2 : The reduction and oxidation sequence in the soil. The redox status can be
catalyzed either by heterotrophic bacteria (biotic) or produced by chemical
elements/compounds (abiotic). The electron donor substrate is generally soil (natural
organic matter) for the biotic reactions (Davranche et al., 2020). Humics in the figure
means humic and fulvic organic matters
21
Figure I-2. 1 : The most popular Lebanese bread from the left : white pita bread (white
flour, loaf of two layers), brown bread (whole wheat grain flour, loaf of two layers), and
saj bread (brown and whole wheat flour, with one layer)
33
Figure I-2. 2 : The different steps of Lebanese white pita bread manufacturing 35
Figure I-2. 3 : The plastic bag containing Lebanese white pita bread 36
Figure I-2. 4 : The TEs in the environment (soil, water, air and plants), arriving to the
food chain and then enter human body through the consumption of food and
vegetables and cause potentially harmful effects for the health
40
Figure II-1. 1 : Bloc diagram of the geological fabric of Bekaa Valley (Lateef, 2007) 52
Figure II-1. 2 : Geological map of the Litani river basin (Shaban and Hamzé, 2018) 53
Figure II-1. 3 : Rainfall map of Lebanon 1950-1970 CNRS 54
Figure II-1. 4 : Space view showing Mount Lebanon Range facing Bekaa valley and
Qaraaoun reservoir. Sources Tannouri 2010, in Shaban et al., 2018
54
Figure II-1. 5 : The geomorphology of the two sub-basins of the Litani River Basin : The
Upper Litani River Basin from Baalbek to Qaraaoun (ULRB) and the Lower Litani River
Basin from Qaraaoun reservoir to the Mediterranean Sea at Kasmieh (LLRB) (Nehme et
al., 2014)
55
Figure II-1. 6 : Litani river sub-basins hydrological characteristics, ULRB : Upper Litani
River Basin, LLRB : Lower Litani River Basin (Shaban and Hamzé, 2018)
56
Figure II-1. 7 : Drainage system of the Litani River Basin 57
Figure II-1. 8 : Upper Litani River Basin groundwater annual budget (Molle et al., 2017) 58
Figure II-1. 9 : The nine studied sites distributed in the Bekaa Plain along a transect
crossing the Litani
59
Figure II-1. 10 : Average monthly precipitation and temperature in the Litani River Basin 60
Figure III-1. 1 : The location of the soil samples collected from Zahleh and western Bekaa
administrative districts Lebanon : Mazraat Zahleh (B1), Tcheflik Qiqano (B2), Marj (B3),
Haouch El Oumaraa (B4ab and B5), Maalaqah (B6), Dalhamiyeh (B7), Haouch El-Aamara
(B8). Satellite Images © CNES/Airbus, Maxar Technologies, Map data © 2021
80
Figure III-1. 2 : Cartography by universal krieging of topsoil Pb distribution in Central
Central Bekaa plain showing : (i) above a low geogenic background, an anthropic
contamination along the roads with heavy traffic including the plume effect was
controlled by the main northeast wind and (ii) a surface runoff gradient from the slopes
near the town of Zahleh towards the Litani river
94
List of Figures
xiv
Figure III-2. 1 : Left Central Bekaa soil map (Gèze, 1956 in Nasser, 2018). Right Coverage
of the Gèze soil reconnaissance map on the administrative map of untreated
municipalities outlet and the position of the sites studied
100
Figure III-2. 2 : Light chestnut soils on western slope (B1, B2) and recent alluvium (B3) 101
Figure III-2. 3 : Light chestnut soils in recent alluvium (B4) and in an alluvial fan on
Western slope (B5)
102
Figure III-2. 4 : Red soils developed on the eastern slope 103
Figure III-2. 5 : Dark chestnut soils in the Bekaa plain leaning against the anti-Lebanon
range (B6 & B7)
104
Figure III-2. 6 : Site location on the satellite image of central Bekaa. Images© Landsat
2021, Google maps
104
Figure III-2. 7 : Variables correlation plots with principal components 1 and 2. The first
two axes accounted for 71.32% of variance
107
Figure III-2. 8 : Sites repartition chart. Factor scores of the observations plotted on the
first and third components. The first and the third axes accounted for 69.47% of
variance
108
Figure III-2. 9 : The Litani river and its perennial tributaries in the upper Litani river
catchment with location of the untreated municipality outlets
109
Figure III-2. 10 : The ARAYBY factory, installed on 2 ha in the industrial zone of Taanayel
produces lead ingots and polypropylene chips since 1990 by recycling lead acid battery
waste and is located 3 km from B4 and 5 Km from B3
113
Figure III-2. 11 : Variables correlation plots with principal components 1 and 2. The first
two axes accounted for 67.69% of variance
114
Figure III-2. 12 : The Litani river and its perennial tributaries in the upper Litani river
catchment with location of the untreated municipality outlets
Figure III-2. 13 : The ARAYBY factory, installed on 2 ha in the industrial zone of Taanayel
produces lead ingots and polypropylene chips since 1990 by recycling lead acid battery
waste and is located 3 km from B4 and 5 Km from B3
Figure III-2. 14 : Variables correlation plots with principal components 1 and 2. The first
two axes accounted for 67.69% of variance
Figure III-2. 15 : Sites repartition chart. Factor scores of the observations plotted on the
first and second components. The first and the third axes accounted for 67.69% of
variance
116
118
120
120
Figure III-3. 1 : PCA performed for the 8 sites with soil physico-chemical properties,
environmental characteristics and total trace elements (As, Pb and Cd) concentrations.
For B9, the CEC (S), EC and pH missing values were replaced by the average calculated
on the other 7 sites
127
Figure III-3. 2 : Same as (Figure III-3.1) but without total trace elements concentrations.
For B9, the CEC (S), EC and pH missing values were replaced by the average calculated
on the other 7 sites
127
List of Figures
xv
Figure III-3. 3 : DTPA-extractable Pb, As and Cd as a function of total concentrations.
Please note that total Cd concentrations were multiplied by 10 to fit the x axis
130
Figure III-3. 4 : PCA performed on the 8 sites with total and DTPA-extractable
concentrations as variables
131
Figure III-3. 5 : PCA on the 8 sites with As, Cd and Pb concentrations in wheat parts 132
Figure III-3. 6 : ACP including all soils parameters and plant As, Cd and Pb concentrations 134
Figure III-3. 7 : Relationship between DTPA-extractable As concentration and As
concentrations in the different parts of the wheat plant. Removing B3 improves greatly
the relation between concentrations in the soil and grain
135
Figure III-3. 8 : Relationship between DTPA-extractable Cd concentration and Cd
concentrations in the different parts of the wheat plant
136
Figure III-3. 9 : Relationship between DTPA-extractable Pb concentration and Pb
concentrations in the different parts of the wheat plant
136
Figure III-4. 1 : Location of the fifty surveyed supermarkets in Lebanon within the five
administrative regions according to population density
143
Figure III-4. 2 : Lebanese white pita consumption according to region. Letters represent
homogeneous groups determined by a Kruskal–Wallis test and post-hoc Fisher’s test
for least significant difference
148
Figure III-4. 3 : Results of crossings between regions, consumption, smoker or not, type
of physical activity, socio-professional category, and area (urban or rural), using the
most specific modalities as key views. Consumption is represented here by categories :
less than 200 g/day (−200) ; from 200 to 400 g/day ; from 400 to 600 g/day ; and more
than 600 g/day (600+). Sizes of circles are proportional to the number of observations
by region
149
Figure III-4. 4 : Distribution of physical activity intensity by gender in adult population 150
Figure III-4. 5 : Principal component analysis showing trace element signatures of the
B1, B2, and B3 pita brands
152
List of Abbreviations and Acronyms
xvi
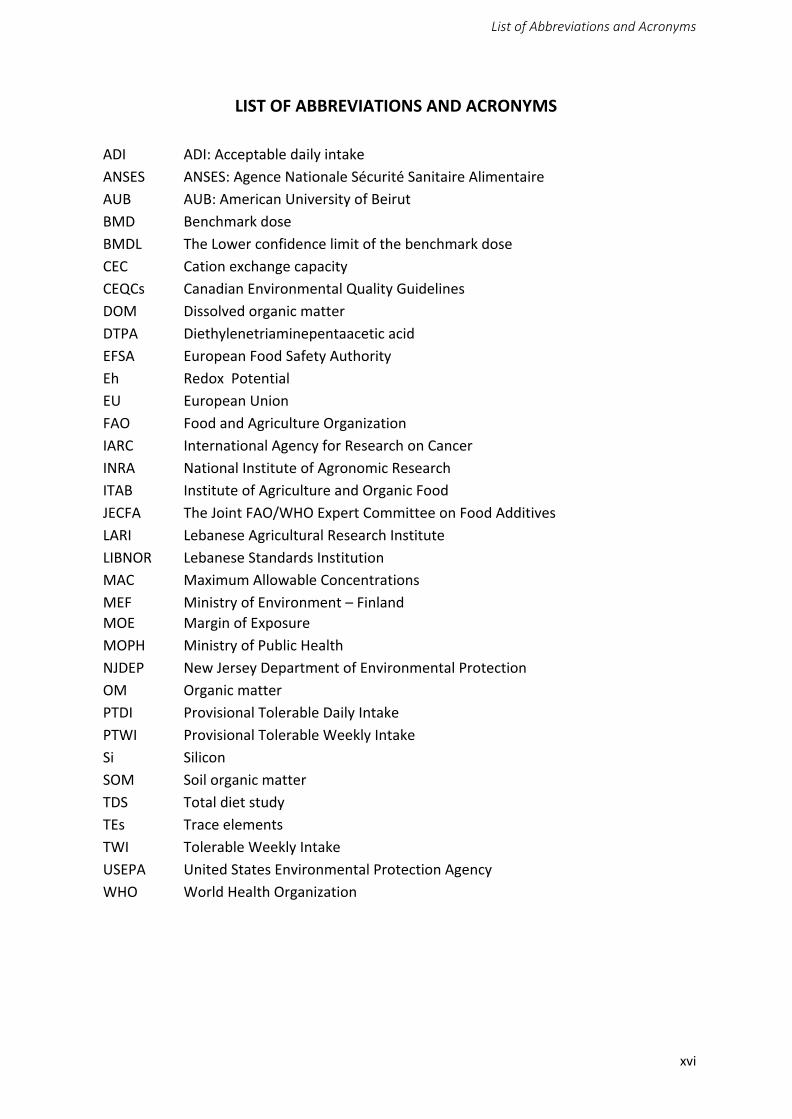
LIST OF ABBREVIATIONS AND ACRONYMS
ADI ADI: Acceptable daily intake
ANSES ANSES: Agence Nationale Sécurité Sanitaire Alimentaire
AUB AUB: American University of Beirut
BMD Benchmark dose
BMDL The Lower confidence limit of the benchmark dose
CEC Cation exchange capacity
CEQCs Canadian Environmental Quality Guidelines
DOM Dissolved organic matter
DTPA Diethylenetriaminepentaacetic acid
EFSA European Food Safety Authority
Eh Redox Potential
EU European Union
FAO Food and Agriculture Organization
IARC International Agency for Research on Cancer
INRA National Institute of Agronomic Research
ITAB Institute of Agriculture and Organic Food
JECFA The Joint FAO/WHO Expert Committee on Food Additives
LARI Lebanese Agricultural Research Institute
LIBNOR Lebanese Standards Institution
MAC Maximum Allowable Concentrations
MEF Ministry of Environment – Finland
MOE Margin of Exposure MOPH Ministry of Public Health
NJDEP New Jersey Department of Environmental Protection
OM Organic matter
PTDI Provisional Tolerable Daily Intake
PTWI Provisional Tolerable Weekly Intake
Si Silicon
SOM Soil organic matter
TDS Total diet study
TEs Trace elements
TWI Tolerable Weekly Intake
USEPA United States Environmental Protection Agency
WHO World Health Organization
INTRODUCTION
1
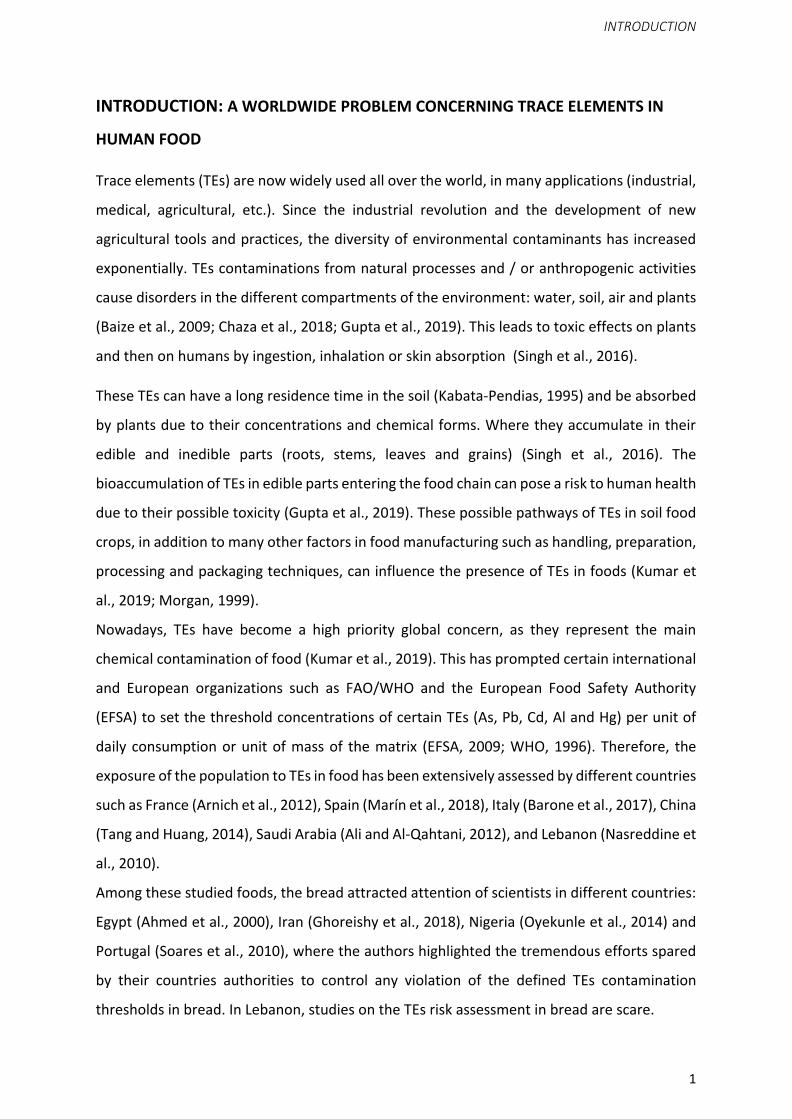
INTRODUCTION: A WORLDWIDE PROBLEM CONCERNING TRACE ELEMENTS IN
HUMAN FOOD
Trace elements (TEs) are now widely used all over the world, in many applications (industrial,
medical, agricultural, etc.). Since the industrial revolution and the development of new
agricultural tools and practices, the diversity of environmental contaminants has increased
exponentially. TEs contaminations from natural processes and / or anthropogenic activities
cause disorders in the different compartments of the environment: water, soil, air and plants
(Baize et al., 2009; Chaza et al., 2018; Gupta et al., 2019). This leads to toxic effects on plants
and then on humans by ingestion, inhalation or skin absorption (Singh et al., 2016).
These TEs can have a long residence time in the soil (Kabata-Pendias, 1995) and be absorbed
by plants due to their concentrations and chemical forms. Where they accumulate in their
edible and inedible parts (roots, stems, leaves and grains) (Singh et al., 2016). The
bioaccumulation of TEs in edible parts entering the food chain can pose a risk to human health
due to their possible toxicity (Gupta et al., 2019). These possible pathways of TEs in soil food
crops, in addition to many other factors in food manufacturing such as handling, preparation,
processing and packaging techniques, can influence the presence of TEs in foods (Kumar et
al., 2019; Morgan, 1999).
Nowadays, TEs have become a high priority global concern, as they represent the main
chemical contamination of food (Kumar et al., 2019). This has prompted certain international
and European organizations such as FAO/WHO and the European Food Safety Authority
(EFSA) to set the threshold concentrations of certain TEs (As, Pb, Cd, Al and Hg) per unit of
daily consumption or unit of mass of the matrix (EFSA, 2009; WHO, 1996). Therefore, the
exposure of the population to TEs in food has been extensively assessed by different countries
such as France (Arnich et al., 2012), Spain (Marín et al., 2018), Italy (Barone et al., 2017), China
(Tang and Huang, 2014), Saudi Arabia (Ali and Al-Qahtani, 2012), and Lebanon (Nasreddine et
al., 2010).
Among these studied foods, the bread attracted attention of scientists in different countries:
Egypt (Ahmed et al., 2000), Iran (Ghoreishy et al., 2018), Nigeria (Oyekunle et al., 2014) and
Portugal (Soares et al., 2010), where the authors highlighted the tremendous efforts spared
by their countries authorities to control any violation of the defined TEs contamination
thresholds in bread. In Lebanon, studies on the TEs risk assessment in bread are scare.
INTRODUCTION
2
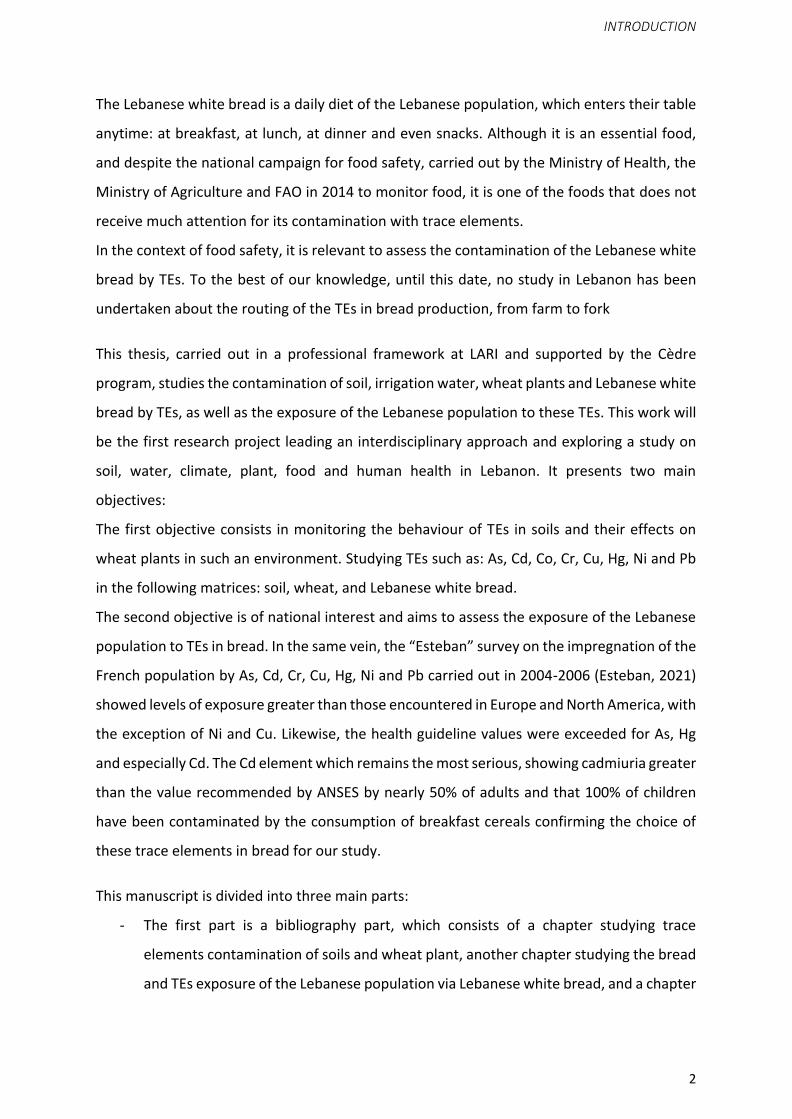
The Lebanese white bread is a daily diet of the Lebanese population, which enters their table
anytime: at breakfast, at lunch, at dinner and even snacks. Although it is an essential food,
and despite the national campaign for food safety, carried out by the Ministry of Health, the
Ministry of Agriculture and FAO in 2014 to monitor food, it is one of the foods that does not
receive much attention for its contamination with trace elements.
In the context of food safety, it is relevant to assess the contamination of the Lebanese white
bread by TEs. To the best of our knowledge, until this date, no study in Lebanon has been
undertaken about the routing of the TEs in bread production, from farm to fork
This thesis, carried out in a professional framework at LARI and supported by the Cèdre
program, studies the contamination of soil, irrigation water, wheat plants and Lebanese white
bread by TEs, as well as the exposure of the Lebanese population to these TEs. This work will
be the first research project leading an interdisciplinary approach and exploring a study on
soil, water, climate, plant, food and human health in Lebanon. It presents two main
objectives:
The first objective consists in monitoring the behaviour of TEs in soils and their effects on
wheat plants in such an environment. Studying TEs such as: As, Cd, Co, Cr, Cu, Hg, Ni and Pb
in the following matrices: soil, wheat, and Lebanese white bread.
The second objective is of national interest and aims to assess the exposure of the Lebanese
population to TEs in bread. In the same vein, the “Esteban” survey on the impregnation of the
French population by As, Cd, Cr, Cu, Hg, Ni and Pb carried out in 2004-2006 (Esteban, 2021)
showed levels of exposure greater than those encountered in Europe and North America, with
the exception of Ni and Cu. Likewise, the health guideline values were exceeded for As, Hg
and especially Cd. The Cd element which remains the most serious, showing cadmiuria greater
than the value recommended by ANSES by nearly 50% of adults and that 100% of children
have been contaminated by the consumption of breakfast cereals confirming the choice of
these trace elements in bread for our study.
This manuscript is divided into three main parts:
- The first part is a bibliography part, which consists of a chapter studying trace
elements contamination of soils and wheat plant, another chapter studying the bread
and TEs exposure of the Lebanese population via Lebanese white bread, and a chapter
INTRODUCTION
3
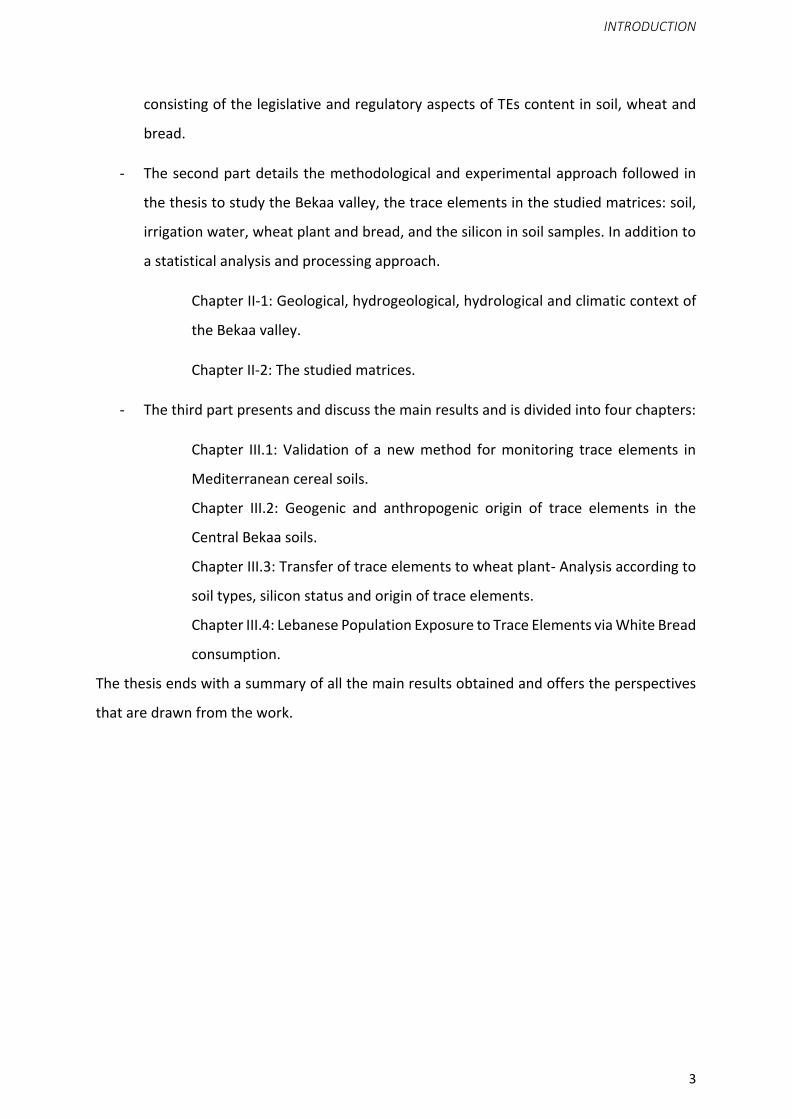
consisting of the legislative and regulatory aspects of TEs content in soil, wheat and
bread.
- The second part details the methodological and experimental approach followed in
the thesis to study the Bekaa valley, the trace elements in the studied matrices: soil,
irrigation water, wheat plant and bread, and the silicon in soil samples. In addition to
a statistical analysis and processing approach.
Chapter II-1: Geological, hydrogeological, hydrological and climatic context of
the Bekaa valley.
Chapter II-2: The studied matrices.
- The third part presents and discuss the main results and is divided into four chapters:
Chapter III.1: Validation of a new method for monitoring trace elements in
Mediterranean cereal soils.
Chapter III.2: Geogenic and anthropogenic origin of trace elements in the
Central Bekaa soils.
Chapter III.3: Transfer of trace elements to wheat plant- Analysis according to
soil types, silicon status and origin of trace elements.
Chapter III.4: Lebanese Population Exposure to Trace Elements via White Bread
consumption.
The thesis ends with a summary of all the main results obtained and offers the perspectives
that are drawn from the work.

PART I – BIBLIOGRAPHY
4
PART I – BIBLIOGRAPHY
Ch I-1 Trace Elements Contamination of Soils and Wheat Plants
5
CHAPTER I-1
Trace Elements Contamination of
Soils and Wheat Plants
Ch I-1 Trace Elements Contamination of Soils and Wheat Plants
6
In the earth’s crust, there are two types of chemical elements depending on their
abundance: major elements and trace elements. The “major elements” (O, Si, Al, Fe, Ca, Na,
K, Mn, Mg, P, Ti and H) represent more than 99% by mass of the earth’s crust, while the “trace
elements” (Cd, Cr, Cu, Co, As, Zn, Hg, Ni, Pb, V, Sb, Zn and B) represent only 1%. The latter
were called also in the literature “metallic trace elements” (MTEs) or “heavy metals” (HM)
because of their metallic nature and their relatively high densities, atomic weights or atomic
numbers. But some elements as As, Sb and B are classified as metalloids, this is why the term
“trace elements” (TEs) will be used here to name all of these metals and metalloids. Several
trace elements are physiologically essential for living organisms but when present in excessive
concentrations, they can have harmful effects on microorganisms, animals, plants and
humans (Antoniadis et al., 2019a). Other TEs are toxic regardless of their concentrations (As,
Cd, Hg and Pb). Following previous studies based on the determination of TEs in the Bekaa
soils, the choice of the following elements: As, Cd, Co, Cr, Cu, Hg, Ni, and Pb was made
(Darwish, 2008, 2018; Kanbar et al., 2014; Roukoz and Issa, 2004).
The wheat plants are considered as staple food worldwide (Awika, 2011; Giraldo et al., 2019).
It is the most domesticated food crops from ancient time, with great agronomic adaptability
and ease of storage and conversion into different nutritional foods. It provides 20% of the
daily protein and food calories in human nutrition (Giraldo et al., 2019). Wheat crops occupy
the first place with 226 million ha cultivated in 2010 or 35% of the world surface in cereals,
and only 27% of the grain production placing it behind corn and rice due to its lower yield per
ha Table I-1. 1 (Awika, 2011).
Table I-1. 1: World cereal production (2010)
Cereal Cultivated area Relative cultivated
area
Grain production Relative
production
Mean Yield
(Million ha) (%) (Million T) (%) (T ha-1)
Maize 160 25 825 35 5.2
Wheat 226 35 650 27 2.9
Rice 162 25 680 29 4.2
Barley 54 8 150 6 2.8
Sorghum 40 6 60 3 1.5
Total 642 100 2365 100
Ch I-1 Trace Elements Contamination of Soils and Wheat Plants
7
Wheat comprises two species, durum wheat (Triticum turgidum) and soft wheat (Triticum
aestivum) and a large number of cultivars adapted by humans to different environments and
for different uses. Durum wheat is cultivated in various regions of the world and in the
majority of the Middle East countries such as Egypt, Jordan, Syria and Lebanon (Almeselmani
et al., 2011; Rawashdeh et al., 2007; Saab et al., 2019; Sall et al., 2019; Xynias et al., 2020).
Soft wheat is mainly imported from countries such as Russia, Kazakhstan, Canada, Ukraine,
Australia and USA, where it is used mostly for bread production (Mikhael, 2016).
The wheat grain accumulates more TEs such as Cd, Cr, As, Pb, Cu than other cereals like corn
(Wang et al., 2018) Durum wheat has a great tendency to accumulate Cd in grains than
common wheat and other cereals (Grant et al., 2008). In laboratory conditions, the
accumulation of TEs depends on the cultivar and the organ of the plant (Vergine et al., 2017).
Furthermore a same variety of wheat grown on different types of soil will accumulate more
or less TEs in the grain depending on the soil characteristics (Baize et al., 2009).
The soil is composed of three phases (solid, liquid and gaseous) and can be divided in two
functional compartments: the first known as the “TEs accumulator compartment” and formed
of the solid phase, and the second known as “TEs vector compartment” and constituted by
the liquid and gaseous phases (Azzi et al., 2017). The solid phase being composed of mineral
constituents (primary minerals, oxides, hydroxides, sulfates, etc.) and organic constituents
which can temporarily fix TEs. These trace elements coming from lithogenic or anthropogenic
sources can be found in the different soil phases, thus making it possible to assess their
mobility.
I-1.1 Origin of trace elements contamination of soils
One of the main challenges in the environmental pollution assessment is to understand how
various TEs can reach the soil and whether they are of natural (lithogenic) and/or
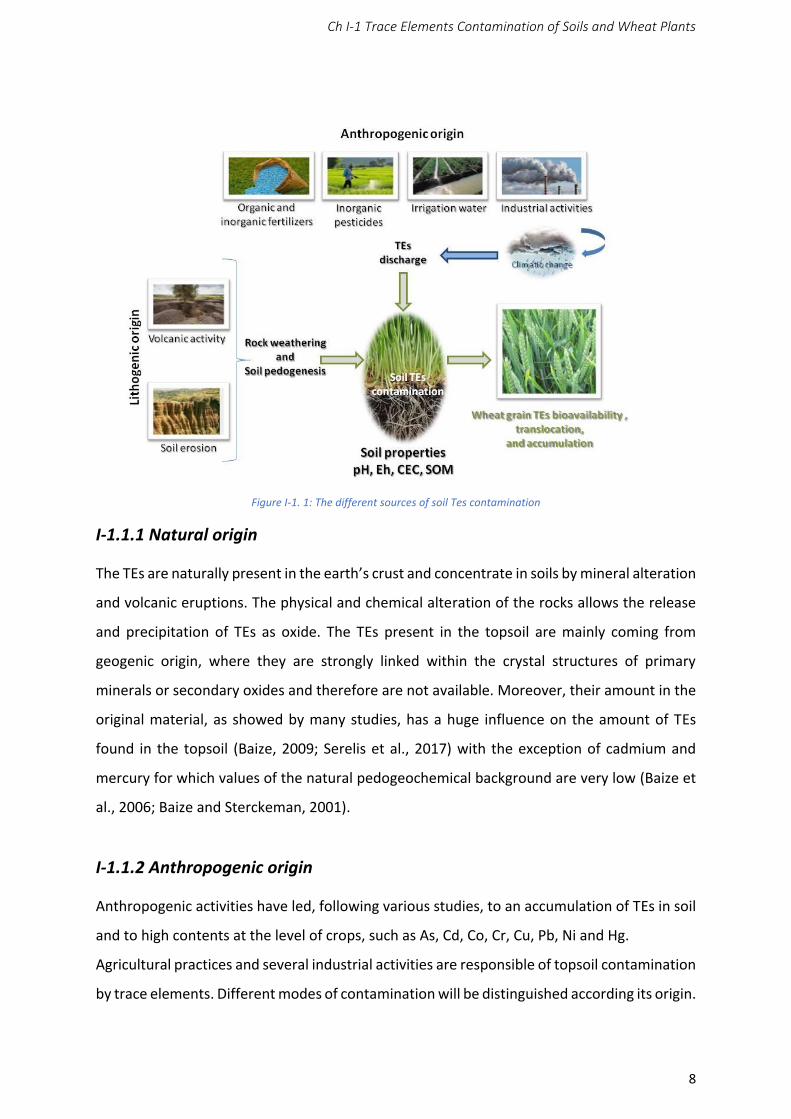
anthropogenic origin Figure I-1. 1 (Serelis et al., 2017). In fact, special emphasis was paid for
potentially toxic elements because their accumulation in soils and plants can easily
threatened the human health through the food chain and drinking water.
Ch I-1 Trace Elements Contamination of Soils and Wheat Plants
8
Figure I-1. 1: The different sources of soil Tes contamination
I-1.1.1 Natural origin
The TEs are naturally present in the earth’s crust and concentrate in soils by mineral alteration
and volcanic eruptions. The physical and chemical alteration of the rocks allows the release
and precipitation of TEs as oxide. The TEs present in the topsoil are mainly coming from
geogenic origin, where they are strongly linked within the crystal structures of primary
minerals or secondary oxides and therefore are not available. Moreover, their amount in the
original material, as showed by many studies, has a huge influence on the amount of TEs
found in the topsoil (Baize, 2009; Serelis et al., 2017) with the exception of cadmium and
mercury for which values of the natural pedogeochemical background are very low (Baize et
al., 2006; Baize and Sterckeman, 2001).
I-1.1.2 Anthropogenic origin
Anthropogenic activities have led, following various studies, to an accumulation of TEs in soil
and to high contents at the level of crops, such as As, Cd, Co, Cr, Cu, Pb, Ni and Hg.
Agricultural practices and several industrial activities are responsible of topsoil contamination
by trace elements. Different modes of contamination will be distinguished according its origin.
Ch I-1 Trace Elements Contamination of Soils and Wheat Plants
9
Agricultural practices intended to improve crop yields, such as organic and inorganic
fertilizers, pesticides treatments and use of wastewaters for irrigation, lead to a “diffuse”
contamination which is of moderate type. While the localized pollution within industrial areas
causes a massive punctual contamination of a few hectares or tens of hectares. Finally,
atmospheric contamination from point sources such industrial sites, heating or incineration
plants and automobile traffic causes “proximity” contamination (Robert, 2001) whose
intensity decreases with the distance from the source.
I-1.1.2.1 Agricultural practices
Agricultural practices, which are usually applied for farm production processes, help farmers
to get better agricultural products. Sowing, weeding, manuring, harvesting, storing and other
several methods usually focused on crop yields at a local scale. Many efforts are deployed
nowadays to focus on a sustainable production at a global scale through a better soil
management strategy. Despite all these efforts, most agricultural systems rely on the
excessive and/or uncontrolled use of fertilizers, pesticides, and untreated wastewater, which
are the main sources of contamination and accumulation of TEs in the soils and groundwaters
(Atafar et al., 2010; Darwish and Jomaa, 2008; Schaeffer et al., 2016).
I-1.1.2.1.1 Organic Fertilizers
The organic fertilization is important for crop growth, allowing the development of plant roots
in a healthy environment (Barłóg et al., 2020; Thomas et al., 2019). It consists of manure,
slurry, methanization digestates and sewage sludges.
Manures and Slurry
The animal manure is well known as a crucial amendment to improve agricultural soil quality,
and constitutes the main economically valuable source of plant nutrients (Barłóg et al., 2020;
Thomas et al., 2019). The slurry defined as the excreta produced by livestock and mixed with
rainwater and/or wash water, is a well-used fertilizer worldwide and one of the most
profitable means of manage this waste (Font-Palma, 2019; Formentini et al., 2015). While
addressing the land manure application as the best suitable solution for organic material
recycling and soil enrichment, the risk of TEs soil contamination should be considered since

Ch I-1 Trace Elements Contamination of Soils and Wheat Plants
10
the animal manure might be rich in such pollutants. (Mantovi et al., 2003), demonstrated that
the accumulation of Cu and Zn in agricultural soils and crop plants is resulting from the
spreading of slurry in the soil. These TEs may originate from their excessive addition into the
animal feed in order to prevent animal disease and gain weight (Baize et al., 2006; Burton and
Turner, 2003). A four-years field monitoring study conducted by (Qian et al., 2018), on the
land application of swine manure show a gradual increase of TEs (As, Hg, Cr, Cu, Zn and Mn)
in land fields with the application duration, predicting an exceeding level of Cr, Cu and Zn
according to the permissible thresholds for Chinese agricultural soils in the next 10-50 years.
Digestates
Svane and Karring, (2019) found that an intensive application of these fertilizers leads to a
highly soil contamination with these TEs, while their levels in cereal crops still luckily remain
below the regulatory standards. Unfortunately, these types of fertilizers might also contain
potentially toxic elements such as Hg, Cd, Pb which may lead to their transfer to cereal crops
(winter wheat and spring barley) as shown by (Barłóg et al., 2020) with a highly accumulation
of Cd (below standards) and Pb (exceeded the European Union limits) in the grain of winter
wheat.
Sewage Sludges
The sewage sludge resulting from domestic wastewater treatment plants are rich in nutrients
and organic matter, where they are thoroughly used as low cost-effective fertilizers whilst
responding to environmental regulatory pressure (Baize et al., 2006). Although its application,
leads to high agricultural production, may cause a continuous introduction of potentially toxic
TEs into the soil, mainly Cd (Baize et al., 2006; Kominko et al., 2017). Unluckily, the TEs present
in the sewage sludge matrix, mainly due to wastewater, are more mobile hence available form
than those coming from contamination of lithogenic origin (Kouchou et al., 2020; Merrington
et al., 2003; Wuana and Okieimen, 2011). Sewage sludge provides soil with OM, fertilizing
elements, as well as TEs in variable quantities depending on their origin, which may lead to soil
contamination. And leads to norms for the products liable to be spread and on the soil liable
to receive them.
Ch I-1 Trace Elements Contamination of Soils and Wheat Plants
11
Baize et al. (2006), focused in their study on the element cadmium in sludge, given its high
toxicity, mobility and phyto-availability. A screening over 30 years showed a decrease in the
Cd content of the sludge over time, due to different efforts in the treatment and purification
of the sludge. Where the concentrations of Cd in the sludge of the studied station reported a
value of 160 milligrams of dry matter in 1978, which decreases until reaching a value of 5.8 in
2002. The maximum limits of Cd concentrations in sludge are 85 mg kg-1 according to the
regulatory limits US EPA, 1993. The maximum Cd concentrations in sludge amended soils is
3mg kg-1 following an average annual application over a period of 10 years of 0.15 kg ha-1 year-
1 for soil with pH > 5 (DoE, 1996).
The concentrations of TEs were studied by (Merrington et al., 2003) in sewage sludge in 6
regions: Australia, Sweden, United Kingdom, New Zealand and United States. The authors
reported values between 1.6 and 26 mg kg-1, and between 20 and 60 mg kg-1 of dry solids of
Cd and Ni respectively in the United Kingdom and Australia. New Zealand and the United
States have shown values between 311 and 700 mg kg-1 of dry solids of Cu. And values
between 99 and 480 mg kg-1 and 559 and 2200 mg kg-1 of dry solids of Pb and Zn respectively
in the UK and USA. In soils amended by sewage sludge, the degradation of sludge OM can
stimulate the diffusion of TEs in soils as demonstrated by several studies. The importance of
dissolved organic matter (DOM) derived from anaerobically digested sewage sludge as a
vehicle for TEs mobility.
The sludge organic matter has an influence on the bioavailability of TEs and varies according
to its quantity and its quality (chemical structure). The chemical structure of sludge is
changeable varying rapidly in a short period of time. Knowing that the organic matter of
sludge is different from the organic matter of the soil. Many studies are being carried out to
find out the relationships between the chemistry of organic matter in sludge. Other studies
have been carried out to find the relationships between organic material chemistry in sludge,
inputs and sludge treatment and inputs and treatment of sludge. Bioavailability
measurements and C-NMR studies may allow us to determine the effect of organic matter
quality in sludge on TEs availability.
Ch I-1 Trace Elements Contamination of Soils and Wheat Plants
12
I-1.1.2.1.2 Inorganic Fertilizers
The mineral fertilizers NPK, constitute: i) Nitrogenous fertilizers in liquid and solid forms, the
most common of which are ammonia (NH3), ammonium nitrate and urea. ii) Potash fertilizers
from potash mines are generally potassium chloride, potassium sulfate, potassium carbonate
or potassium nitrate, and iii) Phosphate fertilizers which are extracted from rock phosphates.
These rocks, either of sedimentary or of igneous origin, contain TEs (Kratz et al., 2016) where
those of sedimentary origin are the main origin of TEs in mineral fertilizers, which make up at
least 85% of the raw material used for mineral P fertilizer production (Kratz et al., 2011), with
mainly high Cd content as in Morocco, comparing to the igneous rocks.
However, these P fertilizers are essential for plant production used for food and feed, they
are posing the main problems containing TEs such as As, Pb and especially Cd which can be
transmitted in the soil, plants and thus in food (Jiao et al., 2012; Kratz et al., 2016; Molina-
Roco et al., 2018; Spiegel et al., 2019). Few countries, especially Morocco and Western
Sahara, China, Algeria, Syria and South Africa hold most of the P rock reserves (USGS, 2018).
The majority of these phosphate reserves have already mined, and those that remain are of
poor quality with low ore content and high concentrations of toxic TEs (Sverdrup and
Ragnarsdóttir, 2014). According to FAO, 2017, Morocco is the largest exporter of rock
phosphate in the world, constituting more than 50% of the world’s phosphate reserves. The
P fertilizers exported by Morocco to EU, New Zealand and Australia contain high levels of Cd,
accounting for up to 60% of current cadmium emissions in EU soil and crops, according to the
Policy Department of the European Parliament, 2017; WSRW, 2017 (Policy Dpt EU, 2017).
According to (Kratz et al., 2016), Cd was the only one that caused serious problems, with P
fertilizers especially (superphosphate, triple superphosphate and rock phosphates) exceeding
the current limit of 50 mg Cd per kg P2O5. The contributions of TEs to the soil through P-
fertilizers have been well demonstrated in the literature (Molina-Roco et al., 2018; Spiegel et
al., 2019; Thawornchaisit and Polprasert, 2009). A long-term fertilization with very high
amounts of superphosphate (175 kg P ha−1 year−1) in a calcareous soil in Austria, led to
significantly higher concentrations of Cd in topsoil (0-25cm) as per (Spiegel et al., 2019).
Where the authors showed that Cd increased by + 25% in 0-25 cm soil depth from zero P, for
a long-term fertilization of 175 kg P ha−1 year-1. In addition, the highest concentrations of Cd
in the winter wheat grain were showed in the superphosphate fertilization. Basic slag
Ch I-1 Trace Elements Contamination of Soils and Wheat Plants
13
fertilization significantly enriched Cr concentrations in 0–25 cm with high fertilization. Cr
increased by +32% in 0–25 cm soil depth with long-term basic slag fertilization of 175 kg P
ha−1 year-1 compared to zero P. Even though, the literature shown that TEs accumulation in
agricultural soils depends not only on the fertilization (type, amount and input frequency),
but also on soil properties (pH, matrix) and climate conditions which vary between regions
(Azzi et al., 2017; Barłóg et al., 2020; Spiegel et al., 2019).
In Lebanon, the majority of P-fertilizers are mainly imported from China, Turkey and Jordan,
in the last decade The elements Cd, Pb and Cr had average values of 20.02 mg kg-1, 42mg kg-
1 and 27.40 mg kg-1 respectively (LARI, 2020). The Cd and Pb mean values exceeding the
European standard limits (Cd: 6.26 mg kg-1, Pb: 4.2 mg kg-1, Cr: 70 mg kg-1) (Verbeeck et al.,
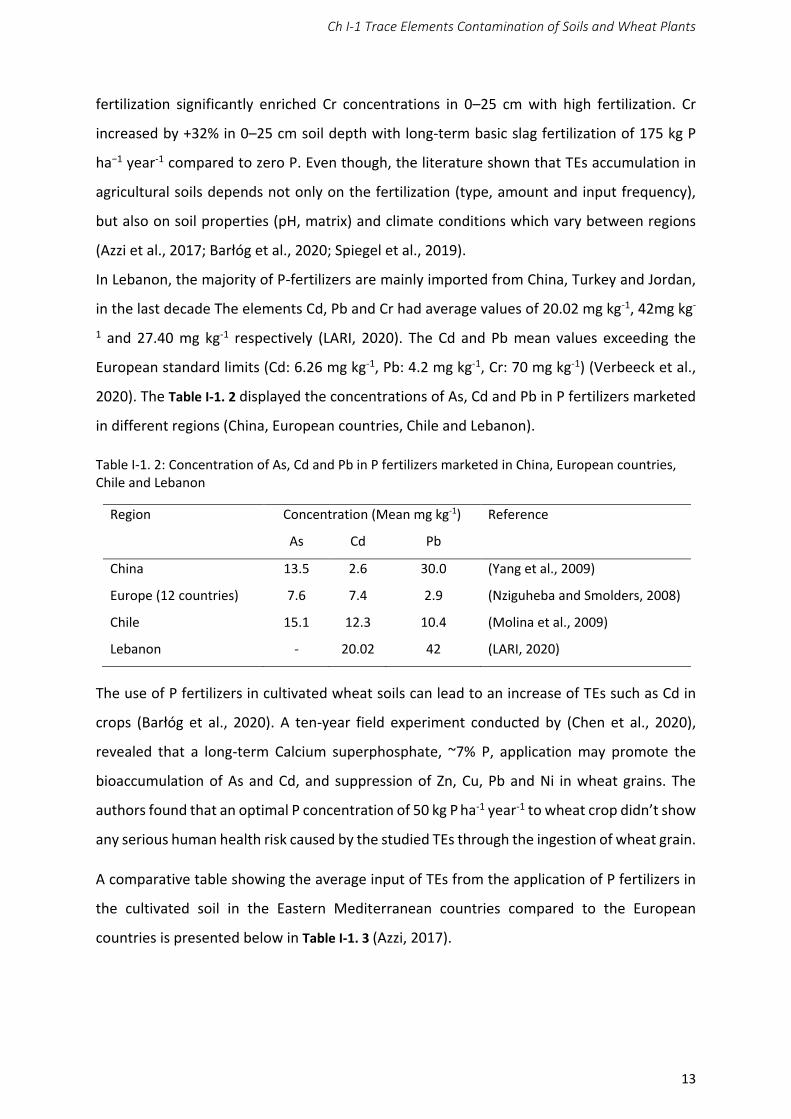
2020). The Table I-1. 2 displayed the concentrations of As, Cd and Pb in P fertilizers marketed
in different regions (China, European countries, Chile and Lebanon).
Table I-1. 2: Concentration of As, Cd and Pb in P fertilizers marketed in China, European countries, Chile and Lebanon
Region Concentration (Mean mg kg-1) Reference
As Cd Pb
China 13.5 2.6 30.0 (Yang et al., 2009)
Europe (12 countries) 7.6 7.4 2.9 (Nziguheba and Smolders, 2008)
Chile 15.1 12.3 10.4 (Molina et al., 2009)
Lebanon - 20.02 42 (LARI, 2020)
The use of P fertilizers in cultivated wheat soils can lead to an increase of TEs such as Cd in
crops (Barłóg et al., 2020). A ten-year field experiment conducted by (Chen et al., 2020),
revealed that a long-term Calcium superphosphate, ~7% P, application may promote the
bioaccumulation of As and Cd, and suppression of Zn, Cu, Pb and Ni in wheat grains. The
authors found that an optimal P concentration of 50 kg P ha-1 year-1 to wheat crop didn’t show
any serious human health risk caused by the studied TEs through the ingestion of wheat grain.
A comparative table showing the average input of TEs from the application of P fertilizers in
the cultivated soil in the Eastern Mediterranean countries compared to the European
countries is presented below in Table I-1. 3 (Azzi, 2017).
Ch I-1 Trace Elements Contamination of Soils and Wheat Plants
14
Table I-1. 3: The average input of TEs from the application of P fertilizers to the cultivated soils in the Eastern Mediterranean countries and in the European countries
Average input of TEs from P fertilizer
Country Eastern Mediterranean countries European countries
Cd (g ha-1 year-1) 6 1.6 Pb (g ha-1 year-1) 26 1 Zn (g ha-1 year-1) 922 43.1 Cu (g ha-1 year-1) 122
In Lebanon, a continuous P fertilization application is carried out in the cultivated wheat soils
in the Bekaa, where the amendment is ranged between 20-60 Kg ha-1, still in the same range
as (Chen et al., 2020), but with an application rate of 1860 Kg ha-1 year-1 higher than the
average of the application on Asia 34 Kg ha-1.
The Cd, presents in phosphate rocks from sedimentary and igneous deposits, has
concentrations that can vary between countries and within deposits in the same country
(Roberts, 2014). The author showed average values of 21 mg kg-1 and 2 mg kg-1 in sedimentary
(from 35 deposits in 20 countries) and igneous (from 11 deposits in 9 countries) phosphate
rocks respectively. Almost 85% of the world production of phosphate rock comes from
sedimentary deposits. The Table I-1. 4, shows the Cd contents in mg kg-1 of sedimentary and
igneous phosphates rocks in Mediterranean countries (Roberts, 2014).
Table I-1. 4: The Cd contents in mg kg-1 of sedimentary and igneous phosphate rocks from different countries
Country Deposit Average Cd mg kg-1 Range Cd mg kg-1
Jordan El Hasa 5 3-12
Shidyia 6 -
Syria Khneifiss 3 -
Morocco Undifferentiated 26 10-45
Bou Craa 38 32-43
Khouribga 15 3-27
Youssoufia 23 4-51
Tunisia - 40 30-56
In the European Union, nearly 85% of P fertilizers are imported. In 2017, Morocco was the 1st
to supply the EU by 1.8 million tons, 1.6 million from Russia and 700,000 from Algeria. The
European Commission has proposed a limit of 60 mg kg-1 for 3 years after entry into force of
the regulation, then 40 mg kg-1 after 9 years and 20 mg kg-1 after 12 years (EURACTIV, 2021).
In EU, Finland is the only known source producing P fertilizers with low Cd content but its
Ch I-1 Trace Elements Contamination of Soils and Wheat Plants
15
production doesn’t meet the needs of the European market, producing less than 1 million
tons year-1. The experts noted that only Russia meets the limit set by the EU (20 mg kg-1 of
Cd) in phosphate fertilizers and which could meet European fertilizer needs.
I-1.1.2.1.3 Pesticides
The application of pesticides with the aim of improving agriculture can cause damage in crops
and shows an alteration of the food chain and the ecosystem (Hakeem et al., 2016). Several
elements such as copper, iron, lead, sulphur, arsenic, mercury, zinc, tin, etc., are used
immensely as pesticides in their organic or inorganic form (Jayaraj et al., 2016; Kovačič et al.,
2013), i.e. methyl mercuric chloride, sodium arsenate, calcium arsenate, zinc phosphide.
These TEs can be found in a significant quantity in agricultural soil due to the serious
application of pesticides and high leaching potential, which may cause an important
accumulation in the soil and be easily transferred and accumulated into the crops (Azzi, 2017;
Chaza et al., 2018).
Since 1970s, the use of arsenic compound is known distinctively for wood preservatives
purposes. Nowadays, it is used as weed-killers. In cotton field, the monosodium
methanearsonate is used as a broadleaf weed herbicide as well as, substantial amounts of
methylarsenic acid and dimethylarsenic acid are used as selective herbicides to control Johns
grass (Sorghum halepsense). Moreover, the arsenicals are used in viniculture in the form of
sodium arsenite (Na2HasO3), calcium arsenite (Ca(AsO2)2), copper acetoarsenite-Paris Green
(Cu(CH3COO)2–3Cu(AsO2)2), copper pyroarsenite (Cu2As2O5), calcium arsenate (Ca3(AsO4)2),
and sodium arsenate (Na2HasO4.12H2O). The arsenate pesticides were banned in 1988
(USEPA, 1988). According to several studies, an increase in arsenic concentrations in
agricultural soils has been explained as a result of different human activities and above all due
to the excessive use of As-based pesticides where, the authors demonstrated that the As
coming from this pesticide is more bioavailable than other anthropogenic sources (Juhasz et
al., 2011; Punshon et al., 2017).
The element copper is a natural pesticide, known to be the most copper-based plant
protection product used especially in organic fruit and grape production (Kovačič et al., 2013;
Van Der Perk et al., 2004). In viticulture, it is applied to fight against downy mildew attacking
vines. In Europe, and particularly in France, it is excessively used (3-15 times year-1) in order
Ch I-1 Trace Elements Contamination of Soils and Wheat Plants
16
to avoid any mildew resistance development and as well, it is known to be an essential TEs
for the soil. This excessive use of copper fungicides may lead to an increase of Cu levels in
soils (total content and bioavailable fractions of Cu) in layer 20-40 cm and even lower layers,
and high Cu residues in grapes thus affecting the wine quality (Casali et al., 2008; Kovačič et
al., 2013). According to (Adriano, 1986), the content of Cu in soils should not exceed the limits
of 50 mg kg-1. Due to this fact, around 12% of winegrowers have switched to organic farming
recently in France. In 2018, the Institute of Agriculture and Organic Food (ITAB) and the
National Institute of Agronomic Research (INRA) presented a scientific opinion on the use of
copper, and showed that it is impossible to stop using Cu in organic farming but you have to
go to half the dose usually used. Accordingly, nowadays the restrictions of use of Cu fungicides
in agricultural soils showed a lot of importance, where the Commission Regulation EC No.
473/2002, requested the decrease of the Cu input levels from 8 to 6 kg ha-1.
The element sulfur, since 1990s, was hardly used in crop protection in several countries such
as United States, China, Europe and others (Gammon et al., 2010; Lamichhane et al., 2016).
Nowadays, it continues to be used as fungicide and is commonly applied to grapes, tomatoes,
and sugar beet, against fungus. As well as Cu, it can be used in “organic” farming (Gammon
et al., 2010; Weitbrecht et al., 2021). A study conducted by (Kwasniewski et al., 2014), showed
that following an SO spraying, the concentrations of SO residues are low in white wine
making, while the residue concentrations in red fermentations are high (application during
the 8 weeks following harvest), which even exceed those associated to an application of H2S.
The excessive application of all mentioned above pesticides may cause TEs accumulation in
soil, and a high contamination of water and crops (Gammon et al., 2010; Kanda et al., 2012).
I-1.1.2.1.4 Irrigation waters
The irrigation water is a serious and crucial constituent for the agriculture (Darwish et al.,
2011). Climate change and the subsequent change in agricultural conditions raise the
susceptibility of agricultural water use. Due to the changing in the agricultural environment,
the wastewater is considered as a substitute water resource around the world, which may be
rich in TEs (Cu, As, Cd, Zn, Pb, Cd). Several researchers reported high concentrations of these
elements in soil and in vegetables, where, they cause damage in leaves, roots, fruits and
productivity, due to wastewater use (Gupta et al., 2019; Jeong et al., 2016).
Ch I-1 Trace Elements Contamination of Soils and Wheat Plants
17
Lente et al. (2014), showed in their study high concentrations of Pb on vegetables due to the
irrigation by waste water coming from the effluents of the industries in an industrial studied
area in Accra, Ghana. Another study conducted on tomatoes plants showed also a very high
level of TEs accumulation in tomatoes due to the irrigation by sewage water (Manzoor et al.,
2018). In wheat and barley crops, the shoots and roots showed an increase in Cu, Pb and Cd
contents, although treated wastewater was used according to Werfelli et al. (2021). Where
the authors demonstrated that such continuous irrigation may lead to TEs accumulation
specifically in the roots of plants. In addition, a research conducted by kanwal et al. (2020), to
study the bioaccumulation of Pb in wheat, using wastewater irrigation (7 treatments : 0-1000
mg kg-1 of Pb), showed that Pb is highly accumulated in grains (> threshold in the cultivated
part) with the highest Pb concentrations. Therefore, many research showed that the TEs
accumulation in crops become harmful to human body (Gupta et al., 2019; Singh et al., 2011;
Woldetsadik et al., 2017).
Since the use of wastewater for irrigation can be source of these TEs in crops, the WHO has
controlled and set limits on use, where it does not recommend using wastewater containing
an excessive amount of industrial wastewater, especially since it may contain TEs such as Cd,
Pb, Mn, Cu, Zn, Cr, Hg, As, Fe and Ni (WHO, 2006). In Addition to (WHO, 2006), the (USEPA,
2012), and (Australia, 2006) have recommended guidelines for the safe reuse of wastewater
as agricultural water, in other terms of water quality. Furthermore, Cyprus, France, Greece,
Italy, Portugal, Spain and South Korea have revised and changed their quality standards with
the aim of widely using treated wastewater for agriculture (Agrafioti and Diamadopoulos,
2012; Angelakis, 2001, 2001; Korea, 2011; Ortega and Iglesias, 2009; Paranychianakis et al.,
2015).
In Lebanon, urban discharges, rich in TEs, can also be mixed with irrigation water. Where raw
wastewater is mainly used for irrigation, and in particular in large agricultural areas such as
Bekaa plain and Akkar plain (Darwish, 2008; Moustafa and Hamze, 2019).
I-1.1.2.2 Industrial stress
Industrial activities can be sources of TEs in the atmosphere. Thus, the atmospheric solid
depositions and precipitation spread pollutants from industrial areas to rural areas.
Consequently, the accumulation of these elements depends mainly on the intensity of
Ch I-1 Trace Elements Contamination of Soils and Wheat Plants
18
industrial activities and its duration. In the developed countries, the TEs accumulation as
recently decline due to strict legislation and good law enforcement, unlike in developing
regions (Cherfi et al., 2014).
A study carried out by Zhou and Wang (2019), showed that agricultural soils close to industries
are contaminated with Hg and the level of this contamination largely depended on the
number of industries present within the 5 km radius of the studied site. Other studies have
shown that crops such as cereals and vegetables, grown in soils contaminated with industrial
pollutants can contain a significant amount of TEs (Kabata-Pendias, 1995; Zwolak et al., 2019).
Thus, Safari et al. (2018), studying Cd contamination of winter wheat cultivated in an alkaline
soil near a large metallurgical plant in Zing Town of Zanjan (ZTZ) in Iran, shoved that 22% of
the study area, around ZTZ, was covered by polluted soils with Cd exceeding the permissible
concentration of 5 mg kg-1. While 29% of the sampled wheat grain plants had a Cd
concentration above the threshold value of 0.2 mg kg-1, 42% of them were grown in non-
polluted soils, hence the need to consider the sensitivity of the crop to TEs uptake from the
soil.
Since different studies have shown significant loads of TEs in agricultural soil and crops, due
to industrial sources, regular monitoring of TEs in soil and crops is necessary near industrial
areas.
I-1.2 Mobility of trace elements in soils
The mobility of an element designates its ability to be transferred from a soil compartment
where it is retained with a certain energy into another one where it is retained with less
energy (Juste, 1988). The ultimate compartment will be the soil solution (liquid phase). We
can thus define two large compartments in the soil: the solid matrix and the aqueous phase.
The mineral and organic fraction constitute the solid matrix. While the aqueous phase or soil
solution is composed by ions and organic and inorganic colloids.
In the solid matrix, the mineral fraction consists of primary minerals, secondary minerals
(kaolinite, illite, montmorillonite) and oxides and hydroxides of Fe, Mn, and Al. The organic
fraction is formed by complex and biodegradable substances: humin, humic acids and fulvic
acids which differ in their molecular weight, CEC, pH, as well as their contents in C, N, and O.
Ch I-1 Trace Elements Contamination of Soils and Wheat Plants
19
The TEs in soil are non-degradable, stable and persistent. They are found in different chemical
forms which can influence their activity, mobility, and bioavailability. For instance, they can
be exchangeable on the clay-humic complex, precipitated in mineral form, adsorbed on or
occluded in the Fe, Al, and Mn oxides-hydroxides or included in organic molecules, as well as
in crystalline networks of primary and secondary minerals (Baize, 1997).
The mobility and bioavailability of trace elements depend strongly on their chemical
speciation in soils. In order to define their behavior, it is essential to know their total
concentration, their chemical speciation, the properties of the soil as well as the
environmental factors (Violante et al., 2010).
I-1.2.1 Factors affecting the mobility of trace elements in soils
I-1.2.1.1 Soil parameters: soil pH, potential redox, and CEC
The soil pH is the main factor affecting the solubility of TEs in soil, and playing a key role in
TEs bioavailability and toxicity in soil and plants (Antoniadis et al., 2017; Gupta et al., 2019;
Likar et al., 2015; Teng et al., 2015).
The redox potential (Eh) is a measure of the tendency of an environment to oxidize or reduce
substrates. The degree of soil aeration is determined by soil characteristics (texture, biological
activity, etc.), cultural practices and climatic conditions (such as rainfall). These factors
contribute to the lack of oxygen, thus modifying the mobility of certain TEs such as Mn and
Fe, where their reduced forms are more mobile in the soil than the oxidized ones. In addition,
it acts on the soil components, which have the ability to fix TEs. Thus, under satisfactory
aeration conditions of the soil, the ferric and manganic compounds are very poorly soluble
and therefore immobilize the TEs associated with them. Conversely, under limiting aeration
conditions, the Fe and Mn compounds are reduced and dissolved; they therefore release the
trace elements associated with them.
The pH and the potential redox (Eh) of the soil, influence directly and indirectly the chemical
processes involving TEs, thus determining their behaviours in the soil. The “pH + Eh” effects
on TEs mobility are complex and element specific. This is explained by several factors:
a. Competition for sorption
b. Decrease in negative charge depending on the pH of the sorption complex

Ch I-1 Trace Elements Contamination of Soils and Wheat Plants
20
c. Dissolution of soil components.
When the soil solution pH decreases, the activity of cations (H+, Fe3+, Al3+) as well as their
positively charged hydroxide in the soil solution, will increase. Thus, these cations will
compete with the TEs for a negative sorption of the sites.
As the pH decreases, the total amount of negative sorption sites decreases. The negative
charges on the solid phase which depend on pH are neutralized by protonation. In addition,
positive charges appear (covalent bond of H+ on hydrated oxides of Fe and Mn, or organic
functional groups). Therefore, the overall negative charges on the sorption complex
decreases.
I-1.2.1.2 Soil constituents: Soil Organic Matter and Clay
The soil organic matter (SOM) plays a key role in the sorption and retention of TEs from the
soil and therefore the transfer of their complexed forms into plants (Antoniadis et al., 2017;
Partey et al., 2016; Pérez-Esteban et al., 2013). In fact, it can affect the mobility of TEs in the
soil and thus their availability (Antoniadis et al., 2017; Azzi et al., 2017; Cambier et al., 2014).
An increase in the soil pH allows the dissociation of the groups: carboxyl, phenolic, alcoholic
and carbonyl, in the SOM of the soil, favouring an increase in the affinity of ligand ions for the
positively charged element.
The clay fraction is mostly composed of aluminum silicates, more or less hydrated, with a leafy
or fibrous structure. The interstices between the sheets may contain water molecules and/or
ions.
Clay minerals have large specific surfaces and high cation exchange capacities (depending on
the clay type). Consequently, they can retain a large amount of TEs by adsorption. Thus, all of
the negative charges located on the internal and external surfaces and at the edge of the
sheets represent as many exchange sites on which the cations metals will be able to be
adsorbed.
I-1.2.2 Processes affecting trace elements mobility in soils
Davranche et al. (2020) in a unifying framework show that “the transfer of electrons drives
metal cycling in the soil”. This means that the role of parameters such as pH, redox potential
Ch I-1 Trace Elements Contamination of Soils and Wheat Plants
21
and CEC, as well as that of clays and organic matter or that of microorganisms, must be
understood from the point of view of electron transfer.
In a drained soil, the air easily penetrates the superficial horizon. While in deeper horizons
and waterlogged soils, O2 decreases due to the consumption of O2 by the biomass for
respiration. Fe and Mn containing minerals are found in high quantity in soils, where their Fe
and Mn redox state can act as electron donors or acceptors (Melton et al., 2014).
Even a non-redox sensitive species like cadmium can be indirectly affected by redox changes
in Mn and Fe components which can precipitate or dissolve as a result of redox reactions,
thereby providing or removing reactive sorption surfaces, or even triggering processes of co-
precipitation (or occlusion) immobilizing Cd.
On the other hand, the natural organic matter plays an important role, presenting functional
fractions able to promote the transfer of electrons to mineral surfaces, thus catalysing redox
transformations. Thus, there will be a development of the electron transfer gradients in soils
which may influence the redox state and nutrients bioavailability (N, S, Fe or Mn). These redox
changes shape various microbial groups, which will be different in their aptitude to use these
nutrients under definite redox states Figure I-1. 2.
Figure I-1. 2: The reduction and oxidation sequence in the soil. The redox status can be catalyzed either by heterotrophic
bacteria (biotic) or produced by chemical elements/compounds (abiotic). The electron donor substrate is generally soil
(natural organic matter) for the biotic reactions (Davranche et al., 2020). Humics in the figure means humic and fulvic
organic matters
In consequence, the microbes contribute to the biotic redox properties of the soils where the
microorganisms form biofilms. The structure of these biofilms (gel-like structures) composed
of cells allows a limited diffusion of chemical elements, thus avoiding their transport and loss
out of cells surrounded by an exopolymer matrix. This causes specific physicochemical
Ch I-1 Trace Elements Contamination of Soils and Wheat Plants
22
properties (such as pH) of micro-environments, which influence the local redox properties of
the biofilm and produce redox hot spots in the soil. In the mineral soil phases, the cycling of
redox-sensitive elements is dependent on the redox-active minerals presence, particularly in
environments exposed to varied redox conditions.
Among these minerals, the Mn (IV) oxides, one of the strongest oxidants in nature, play an
important role, by controlling the redox state of Cr (hardly oxidizable) and releasing the toxic
form Cr (VI) in nature (Tebo et al., 2004).
The Fe-bearing minerals can also be highly reactive. Mixed-valence Fe minerals carrying both
Fe (II) and Fe (III) present strong redox properties. They are highly reactive, mainly in redox
transition zones of the soil, where they are acting as durable reducing agents for: nitrites,
chlorine compounds, nitroaromatics and Cr (VI) (Alowitz and Scherer, 2002).
Therefore, the Fe-oxyhydroxides and SOM are known as strong sorbents of metal(loid)s due
to their high density of binding sites. Their nano-aggregate forms are the main phases that
lead to TEs transport.
In SOM, the electron transfer activities of the dissolved and solid phase humic substances are
commonly attributed to quinone-hydroquinone fractions.
In reduced environments, the humic substances, dissolved or adsorbed to solid phases, can
act as redox buffers by receiving electrons from respiratory microbes and transferring these
electrons to poorly accessible minerals, mediating electron transfer between microbes and
electron acceptors (Macalady and Walton-Day, 2011).
According to a study by Zhou et al. (2015), the role played by electron transfer in
biogeochemical cycles is better explained when acidic humic complexes – metal ions can be
oxidized by oxidizing microbes Fe (II) and reduced by reducing microbes Fe (III).
I-1.2.3 Trace elements uptake and translocation in plants
In this part studying the plant, the elements As, Cd and Pb are presented since in our study
only these elements were treated at the level of the wheat plant. Each plant has a specific
physiology, morphology and anatomy. This diversity allows each plant to absorb and
accumulate TEs in different ways (Yadav et al., 2018). In foliar uptake, small particles can
diffuse through the stomatal and cuticular pathways to penetrate the interior of the plant leaf
Ch I-1 Trace Elements Contamination of Soils and Wheat Plants
23
(Xiong et al., 2014). Leaf area, size and density of stomata can affect leaf uptake of TEs (Shahid
et al., 2016).
In root uptake, Chandran et al. (2012) showed that plants with many fine roots accumulate
more TEs than those with few thick roots . In plant, the root absorbs the TEs available in the
soil, where a quantity passes into the transpiration flow through the xylem vessels, arriving
at the aerial part where they accumulate under the transpiration effect. The plants may
accumulate more TEs when transpiration is flourishing (Hao et al., 2012). In this passive
transport, the xylem sap is raised upwards by the transpiration stream and allows the
distribution of TEs in the aerial tissues. At leaf level, these TEs can be redistributed or
accumulate in photosynthetically active leaves. These TEs can pass from the leaves through
the phloem to finally arrive in the growing vegetative part or the maturing fruits.
In wheat plant, the roots play an essential role in active uptake of metal ions. This root
adsorption allows cations to bind to the negative cell wall of the roots due to the presence of
cellulose, pectins and glycoproteins which in turn play a specific role of ion exchangers (Arif
et al., 2016). Cations such as: Cd2+, Fe2+, Mn2+, Ni2+ ,Pb2+, Zn2+, are found available at the level
of the root surface from the dissociation of their complex forms and strongly accumulated in
the apoplast of the root (Krzesłowska, 2011).
When cations build up in the root apoplast, they can: (i) be retained in the root cells, (ii) move
to the root stele, and then to the xylem and phloem tissues. Two ways are known for their
passage through the xylem and phloem: passive uptake, and active uptake (Hossain, 2012).
In passive transport, metal ions from the soil solution are diffused into the root cell through
the intercellular spaces, whereas active transport consists of the passage of metal ions using
different carriers and transporters in the mediated plasma membrane (Barberon and Geldner,
2014).
I-1.2.4 Effects of trace elements in wheat plants
The presence of trace elements affects the availability of others whether in soil or at plant
level (Chibuike and Obiora, 2014). In plant, the elements Ni and Cd compete for the same
membrane supports (Clarkson and Lüttge, 1989).
Trace elements may have direct effects on the plant, such as inhibiting the cytoplasmic
enzymes, or causing oxidative stress which leads to cell damage (Jadia and Fulekar, 2009).
Ch I-1 Trace Elements Contamination of Soils and Wheat Plants
24
Trace elements may also have indirect effects on plants, where they can substitute essential
nutrients at cation exchange sites (Taiz and Zeiger, 2002). These TEs, easily absorbed by the
roots of plants, are accumulated at any level of the plant and can be transferred to the edible
part (Jolly et al., 2013).
In wheat plants, the P fertilizers application may increase the As contents in soil solution and
in root and shoot of wheat plants (Tao et al., 2006). The As uptake in wheat plant varies from
one variety to another as demonstrated by Zhang et al. (2009), where the authors showed a
positive correlation between As content in soil and As content in wheat plant tissues, where
the As concentrations in plant tissues were as follows: roots > stems > leaves and rachises >
grains > glumes > awns. Another study conducted by Shi et al. (2019), showed a decrease in
As concentrations in wheat plant roots in the period from tillering to maturity, as well as a
decrease in its accumulation in plants. Showing that accumulation of As in wheat grain is
influenced by the remobilization of the As from the leaves and stem to the ear.
The bioavailability of Pb is attributed to physico-chemical soil properties as per
Wijayawardena et al. (2015). The use of waste water, fertilizers and pesticides resulted in high
concentrations of Pb in studied wheat cultivars by Guo et al. (2018). The element Pb is
considered as toxic element, affecting the growth and the development of crop plants and
causing their death (Khan et al., 2015). In wheat plants, a Pb exposure can reduce the growth
of wheat plant organs such as root and shoot length, as well as the fresh weight and the dry
weight of the shoots. In addition, it can be accumulated in several parts of the plant and in
particular in wheat grains (Khan et al., 2015). In wheat plants, a maximum reduction in
stomatal conductance (82%) and transpiration rate (72%) was observed at high Pb
concentration treatment (1000 mg Pb kg-1) in a study conducted by Kanwal et al. (2020),
concerning the bioaccumulation of Pb in the wheat plant following experimental trials where
Pb treatments of (0 to 1000 mg Pb kg-1) were applied.
The element Cd is mobile in acidic soil and will accumulate in wheat crops (Liu et al., 2015).
Moreover, high exposure concentrations of Cd, even at short exposure times, may cause
stress and complex phenomena in wheat plants (Stolt et al., 2003). During the period from
tillering to maturity, the Cd levels in the roots of wheat plants decrease, in addition, the
accumulation of Cd in roots decreased considerably at the lengthening stage, as well as in
Ch I-1 Trace Elements Contamination of Soils and Wheat Plants
25
stems because of the uptake and transport of Cd over time did not keep pace with biomass
accumulation (Shi et al., 2019). Furthermore, wheat plants may accumulate above permissible
levels of Cd in grains if grown on Cd contaminated soils (0.11 – 1.37 mg kg-1), and consequently
wheat contaminated plants may transmit Cd to humans through ingestion (Liu et al., 2015).
I-1.3 The essential role of the element silicon in trace elements
bioaccumulation in wheat plants
Silicon is a major constituent of the earth’s crust (Tubaña et al., 2016). The silicon content of
earth’s rocks varies between 40 and 70%. In its soluble form, it is present as silicic acid Si(OH)4.
Before its transfer to surface water, silicic acid dissolved in soil solutions will be trapped by
plants roots which play an active role in the accumulation of silica in plant and in the storage
of Si. The plant absorbs the silicon trapped by their roots under the form of Si(OH)4 acid and
transports it to the other parts of the plant. After the transfer of Si in all plant parts, the plant
precipitates the Si in their aerial organs by forming the phytoliths (SiO2.nH2O). After the plant
death, the phytoliths are released by degradation of organic matter in the litter giving
biogenic Si(Bsi) which again dissociates into Si(OH)4, allowing the storage in the soil to at
concentrations varying from 0.09 to 23.4 mg L-1 depending on soil types (Khan et al., 2021;
Meunier et al., 2018). Due to the intensification of agriculture, the soil solution becomes
depleted of silicic acid. In the past 20 years, research has demonstrated that Si fertilization is
well used given the benefits of silicon for crops (Tubaña et al., 2016). Accordingly, Si
bioavailability increases with increasing silicon application in soil and varies with soil type.
This will help the increase of Si absorption in stems, leaves and straws (Coskun et al., 2019).
In crops, Si causes an increase in growth, development and reproduction of plants, under
difficult conditions such as drought and salt stress, as per the Association of US Plant Food
Control Officials (AAPFCO). Rice, sugarcane and wheat are known to be high-Si accumulating
plants. Accordingly, the wheat biomass increased by 17% at vegetative stage, under drought
and salt stress conditions, after Si fertilization (Tubaña et al., 2016). Wheat plants exposed to
drought and treated with Si showed a maintenance of higher stomatal conductance, relative
water content, and water potential than other non-treated plants (Guntzer et al., 2012).
Ch I-1 Trace Elements Contamination of Soils and Wheat Plants
26
The surface of the mineral-Si can carry a big quantity of exchangeable cations, while a small
quantity of exchangeable H+, resulting in hydrolysis of exchangeable cations in the soil, then
making a large amount of NaOH in the soil solution and increases the soil pH.
Several studies indicated that the increase in soil pH allows the decrease of the cation
availability like: Cd, Pb, Zn and others. This was demonstrated by Khan et al. (2021), where
the authors showed that the Si in the soil allows a decrease in the available Cd in the soil and
thus its transport and its accumulation in rice grains.
In wheat plants, an increase of the application of Si available to plants in the soil, contributes
to a decrease in the concentrations of Cd in shoots, while they showed an increase at the root
level (Rizwan et al., 2012). Accordingly, The Si application found to decrease Cd translocation
from root to shoots and then to grains (Naeem et al., 2015).
The total As, studied in rice plants showed a decrease of concentrations in different rice
organs, between 24.1% and 51.9% after Si application, while the inorganic As concentrations
showed a reduction between 20.1% and 52.3% (Li et al., 2018). In wheat plants, the Si may
play an essential role in the detoxification of As (Hossain et al., 2018). According to authors,
under an arsenic stress, the addition of Si to soil showed a significant increase in As in the
roots but not in the shoots. The results of another study conducted in Norway by Kaur and
Greger (2019), indicated that Si application in soil increases 10 times the available Si and lead
to an increase of Si content in wheat grains by 12-18%, and decrease the As content in the
same plant organ by 20-40%.
In China, the application of Si showed an attenuation of the toxicity of Cd and Pb in wheat
plants and increased the grain yield by almost 44% as per Huang et al. (2019). This application
increased the absorption of Si in roots and shoots, thereby reducing the build-up of Cd (13%)
and Pb (63%) in wheat shoots and bran.
Wheat crops showed grain Cd contamination and low productivity in Cd-contaminated soil
due to Cd stress (Yanardağ et al., 2016). The Si-soil application caused a decrease in plant
available Cd fraction by coprecipitation and also by increasing soil pH. Furthermore, a
decrease of Cd in wheat tissues was explained by the reduction in Cd-plant availability and
also xylem Cd translocation to shoots (Naeem et al., 2015).
Zhou et al. (2021) studied a foliar Si and soil Si applications to wheat plants, in a neutral sandy
loam soil, with a pH 7.15 and contaminated by Cd. They found a significant attenuation of Cd
Ch I-1 Trace Elements Contamination of Soils and Wheat Plants
27
toxicity through the regulation of Cd transport genes, which was expressed by an increase of
grain yield and enzyme antioxidant activities in wheat tissues.
Ch I-2 Bread and Trace Elements Exposure of the Lebanese Population via Lebanese White Bread
28
CHAPTER I-2
Bread and Trace Elements Exposure
of the Lebanese Population via
Lebanese White Bread
Ch I-2 Bread and Trace Elements Exposure of the Lebanese Population via Lebanese White Bread
29
I-2.1 Challenges of trace elements food contamination
Trace elements show two faces, where they can be beneficial and/or toxic. Minerals are part
of the human diet and are essential for normal health and function. The essentiality and
toxicity of these elements show no relationship, while toxicity is a question of dose or
exposure. In recent years, considerable researches have been carried out to better
understand the physiological role and health consequences of TEs, below the challenges of
TEs food contamination around the world and in Lebanon are well detailed.
I-2.1.1 Challenges of trace elements food contamination worldwide
Unfortunately, these elements enter the human food chain and may pose serious problems
and cause risks for human health as showed by various studies in a number of developed
countries such as Spain, Belgium, England and the United States. For instance, several studies
have shown that element Pb may be excessive in some foods like tubers, legumes and cereals
(Akinyele and Shokunbi, 2015), cereals (Brizio et al., 2016; Pirsaheb et al., 2016), and rice
(Abtahi et al., 2017).
The latter also presented the highest level of As among the cereal group analysed in a study
carried out by Marín et al. (2018) on twelve selected foodstuff groups representing the most
consumed food in the region of Valencia – Spain, with an average value of 0.147 mg kg-1.
These values were higher than those detected in France – (ANSES, 2011a) following a TDS
study: 0.016 mg kg-1 for white rice, and lower than those detected in Catalonia – Spain, where
the average value of total As in rice was higher by 0.18 mg kg-1 and also lower than the values
found in Canada (average value of 1.240 mg kg-1). This issue is underlined in the Middle
Eastern countries and Saudi Arabia where populations consume rice on daily bases. Shraim
(2017) showed the As levels content in rice product sold in Saudi Arabia markets and Brisbane
– Australia, and rice produced in Bangaldesh (in an As contaminated area). Noting that, this
element values were above the threshold (0.2 mg kg-1 day-1) in rice grown in Bangladesh
(WHO, 1996). The results of this investigation indicate that some rice varieties sold in the local
markets of Almadinah Almunawarah, Saudi Arabia contain hazardous levels of one or more
of the toxic elements (arsenic, chromium, and lead). Additionally, the values of As
concentration measured in 70 rice samples on Saudi Arabia markets (average value of 0.136
± 0.086 mg kg-1), showed a variation from one country of origin to another: USA origin (0.257
Ch I-2 Bread and Trace Elements Exposure of the Lebanese Population via Lebanese White Bread
30
mg kg-1) > Thailand origin (0.200 mg kg-1) > Pakistani rice (0.147 mg kg-1) > Indian rice (0.103
mg kg-1) > Egyptian rice (0.097 mg kg-1). While rice samples from Suriname, Australia and
France showed higher values respectively: 0.290, 0.188 and 0.183 mg kg-1 respectively.
Canned foods such as canned vegetables, fruits, meat, drinks or fish are popular worldwide
and are considered to be important sources of TEs. And since they are highly consumed, they
make an important contribution to TEs. In Jordan, a first study of this type was carried out to
measure the levels of Pb, Zn, Cr, Ni, Cu, As and Cd in different brands of canned fruits and
vegetables present on the market, and compared them with other studies in other countries
and the authorized limits. All the studied samples showed values above the authorized limits.
In canned foods, the main role of the packaging material is to preserve the original
characteristics of the food and to protect it. Accordingly, several studies have shown that the
interactions between food and packaging are mainly due to the deterioration of these
packaging (corrosion, dissolution of the coating layer, aging by oxidation of food components,
etc.) and the nature intrinsic value of the preserved food (Bontos et al., 2016; Noureddine El
Moussawi et al., 2019; Vaireanu et al., 2018). The TEs can be present in food following the
use of stainless steel and Al materials during food preparation (Al, Ni), food packaging (Sn),
unpainted steel containers (Fe, Cr, Cu and Zn). In addition, leaching of solder materials may
lead to the appearance of Pb and Fe in canned foods (Kassouf et al., 2013; Noureddine El
Moussawi et al., 2020). This release can lead to gastrointestinal disturbances at high
concentrations (> 200 mg kg-1) (Arnich et al., 2012; Korfali and Hamdan, 2013).
In fish and seafood, the TEs such as Pb, Cd, Hg and As are considered as part of food safety
concern. Accordingly, the total Hg is known as a health concern for consumers, especially in
the coastal regions of South-East Asia, the Western Pacific, the Baltic Sea and the
Mediterranean area as per several studies in many countries, where the averages showed
values close to the toxicological reference values established by JECFA. However, the global
organizations have recommended limiting the consumption of certain shellfish (oysters and
scallop fish) following the assessment of high levels of Cd intake among consumers in Canada
(a consumption of 3 units per week shows values close to the threshold recommended by
JECFA). The elements Pb and As pose no risk to humans due to fish ingestion (Chiocchetti et
al., 2017). A study conducted by Sobolev et al. (2019) concerning the essential and non-
essential TEs present in the most seven consumed fish by indigenous peoples of the European
Ch I-2 Bread and Trace Elements Exposure of the Lebanese Population via Lebanese White Bread
31
Russian Arctic, showed similar concentrations of As as found in the literature (15-17 mg kg-1)
as reported by Sloth et al. (2005). The concentrations of Pb and Cd were lower than Hg in all
fish species. The authors suggest that the Hg origin might be a resultant of atmospheric
deposition due to human activities and/or an occurrence of natural processes.
In conclusion, the TEs in food can thus be the result of raw materials, food handling and
manufacturing process such as direct contact between food and TEs, processing equipment,
storage and packaging (Demirözü et al., 2003; Kassouf et al., 2013; Korfali and Hamdan, 2013).
I-2.1.2 Challenges of food contamination in Lebanon and food safety
In Lebanon, food industry constitutes about 18.2% of the factories, where the food safety
plays an important and essential role in the national economy and public health. Despite the
importance of the food sector for the Lebanese economy and industry, food safety remains a
major problem (Kamleh et al., 2012).
Epidemics of food poisoning are still a problem among the Lebanese population (Vapnek,
2005). According to SOER (2010), Lebanon suffers from serious problems. Firstly, the energy
availability, where the daily and prolonged power outages in the countries is the result of
production shortages capacity. Secondly, the unsustainable water management practices, the
state of wastewater management and the increasing water pollution showing that the
majority of the population has no source of safe drinking water, in addition to the need of
water filtration before use. All these problems may cause challenges to the Lebanese
population and affect the food industry and then form barriers to food safety. Meeting the
country’s water demand over the medium and long-term poses a significant challenge to the
Government of Lebanon. Accordingly, Harakeh et al. (2005) showed in their study, on
Lebanese Shawarma sandwiches, that 47.5% of the samples contained high levels of
Salmonella.
Other local studies conducted on the Lebanese food safety have indicated the presence of
pathogenic microorganisms (levels exceeding the international standards) such as E. coli,
Salmonella, Staphylococcus aureus, and Listeria monocytogenes (Borjac et al., 2019; Harakeh
et al., 2009; Kassaify et al., 2010). A study conducted by the MOPH in Lebanon in 2012 (MOPH,
2012), indicates that in 2010 there were 1926 cases of food borne and waterborne diseases
in Lebanon. Recently, food safety was of serious concern to the Lebanese people as a result,
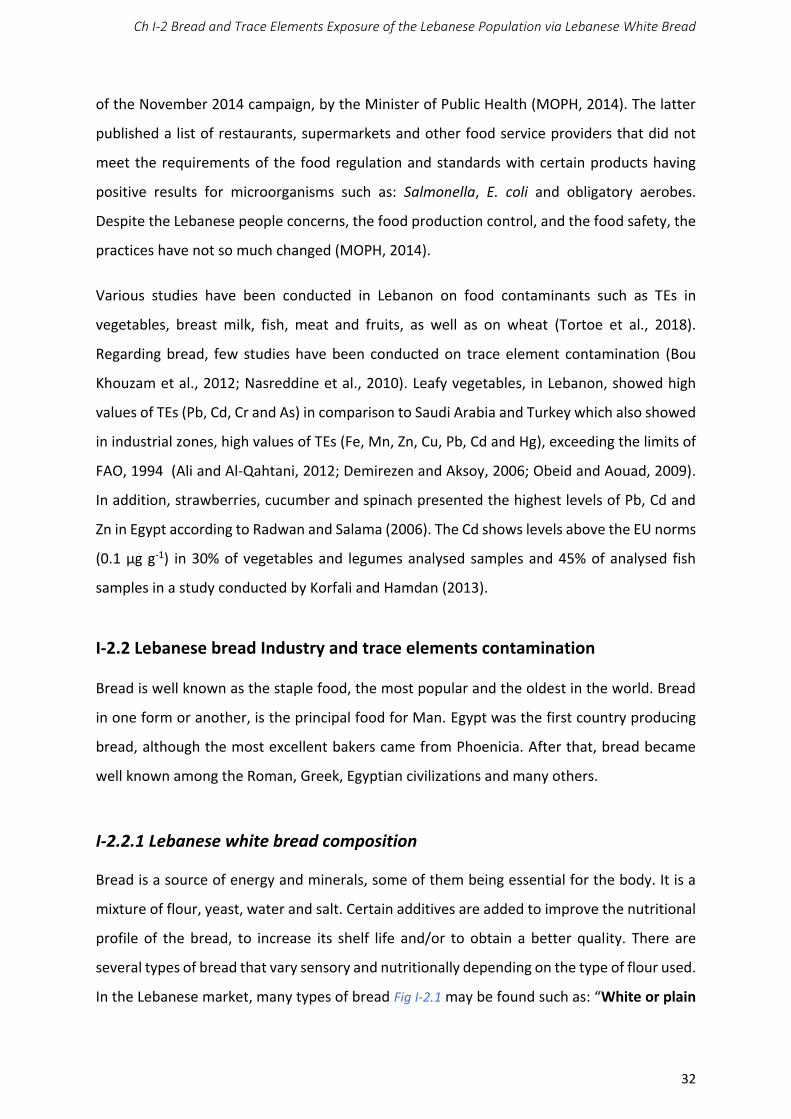
Ch I-2 Bread and Trace Elements Exposure of the Lebanese Population via Lebanese White Bread
32
of the November 2014 campaign, by the Minister of Public Health (MOPH, 2014). The latter
published a list of restaurants, supermarkets and other food service providers that did not
meet the requirements of the food regulation and standards with certain products having
positive results for microorganisms such as: Salmonella, E. coli and obligatory aerobes.
Despite the Lebanese people concerns, the food production control, and the food safety, the
practices have not so much changed (MOPH, 2014).
Various studies have been conducted in Lebanon on food contaminants such as TEs in
vegetables, breast milk, fish, meat and fruits, as well as on wheat (Tortoe et al., 2018).
Regarding bread, few studies have been conducted on trace element contamination (Bou
Khouzam et al., 2012; Nasreddine et al., 2010). Leafy vegetables, in Lebanon, showed high
values of TEs (Pb, Cd, Cr and As) in comparison to Saudi Arabia and Turkey which also showed
in industrial zones, high values of TEs (Fe, Mn, Zn, Cu, Pb, Cd and Hg), exceeding the limits of
FAO, 1994 (Ali and Al-Qahtani, 2012; Demirezen and Aksoy, 2006; Obeid and Aouad, 2009).
In addition, strawberries, cucumber and spinach presented the highest levels of Pb, Cd and
Zn in Egypt according to Radwan and Salama (2006). The Cd shows levels above the EU norms
(0.1 μg g-1) in 30% of vegetables and legumes analysed samples and 45% of analysed fish
samples in a study conducted by Korfali and Hamdan (2013).
I-2.2 Lebanese bread Industry and trace elements contamination
Bread is well known as the staple food, the most popular and the oldest in the world. Bread
in one form or another, is the principal food for Man. Egypt was the first country producing
bread, although the most excellent bakers came from Phoenicia. After that, bread became
well known among the Roman, Greek, Egyptian civilizations and many others.
I-2.2.1 Lebanese white bread composition
Bread is a source of energy and minerals, some of them being essential for the body. It is a
mixture of flour, yeast, water and salt. Certain additives are added to improve the nutritional
profile of the bread, to increase its shelf life and/or to obtain a better quality. There are
several types of bread that vary sensory and nutritionally depending on the type of flour used.
In the Lebanese market, many types of bread Fig I-2.1 may be found such as: “White or plain
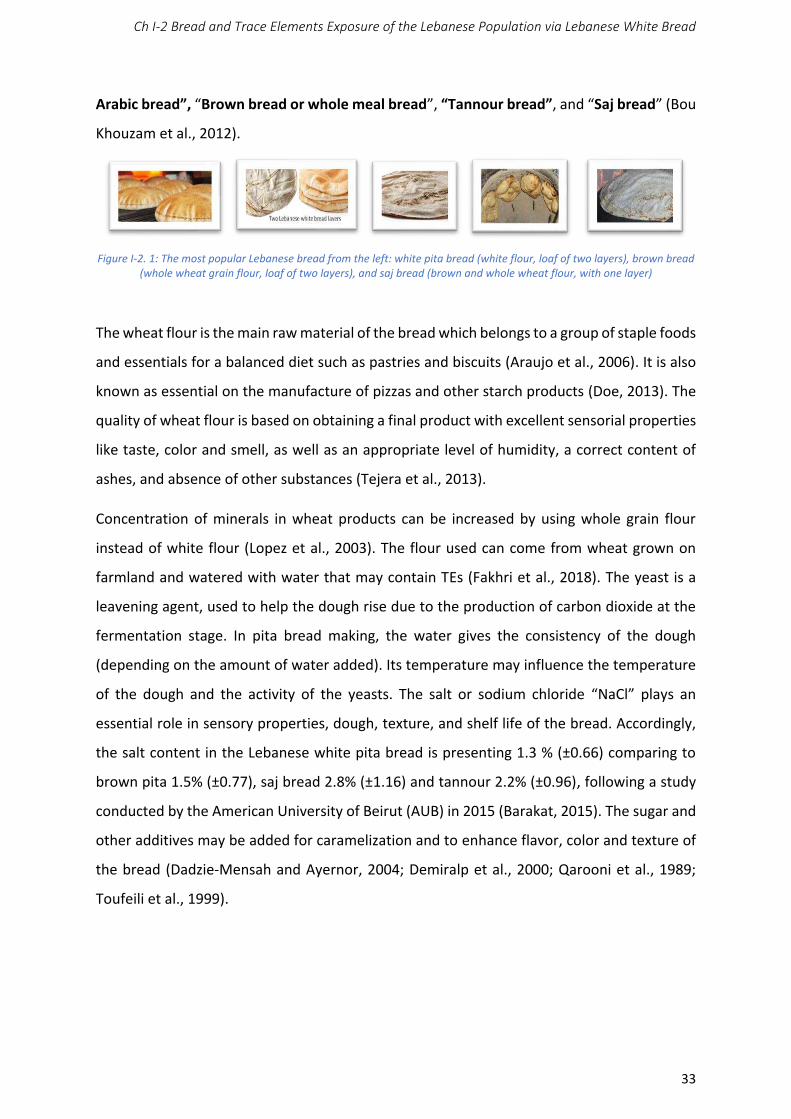
Ch I-2 Bread and Trace Elements Exposure of the Lebanese Population via Lebanese White Bread
33
Arabic bread”, “Brown bread or whole meal bread”, “Tannour bread”, and “Saj bread” (Bou
Khouzam et al., 2012).
Figure I-2. 1: The most popular Lebanese bread from the left: white pita bread (white flour, loaf of two layers), brown bread
(whole wheat grain flour, loaf of two layers), and saj bread (brown and whole wheat flour, with one layer)
The wheat flour is the main raw material of the bread which belongs to a group of staple foods
and essentials for a balanced diet such as pastries and biscuits (Araujo et al., 2006). It is also
known as essential on the manufacture of pizzas and other starch products (Doe, 2013). The
quality of wheat flour is based on obtaining a final product with excellent sensorial properties
like taste, color and smell, as well as an appropriate level of humidity, a correct content of
ashes, and absence of other substances (Tejera et al., 2013).
Concentration of minerals in wheat products can be increased by using whole grain flour
instead of white flour (Lopez et al., 2003). The flour used can come from wheat grown on
farmland and watered with water that may contain TEs (Fakhri et al., 2018). The yeast is a
leavening agent, used to help the dough rise due to the production of carbon dioxide at the
fermentation stage. In pita bread making, the water gives the consistency of the dough
(depending on the amount of water added). Its temperature may influence the temperature
of the dough and the activity of the yeasts. The salt or sodium chloride “NaCl” plays an
essential role in sensory properties, dough, texture, and shelf life of the bread. Accordingly,
the salt content in the Lebanese white pita bread is presenting 1.3 % (±0.66) comparing to
brown pita 1.5% (±0.77), saj bread 2.8% (±1.16) and tannour 2.2% (±0.96), following a study
conducted by the American University of Beirut (AUB) in 2015 (Barakat, 2015). The sugar and
other additives may be added for caramelization and to enhance flavor, color and texture of
the bread (Dadzie-Mensah and Ayernor, 2004; Demiralp et al., 2000; Qarooni et al., 1989;
Toufeili et al., 1999).
Ch I-2 Bread and Trace Elements Exposure of the Lebanese Population via Lebanese White Bread
34
Table I-2. 1: The main ingredients and manufacturing of different types of Lebanese bread
Bread
Flour Other ingredients and additives Cooking time Aspect
Wh
ite
wh
eat
Wh
ole
mea
l wh
eat
Wh
eat
wh
eat
bra
n
Wh
ole
co
rn
Co
rn
Yea
st
Su
gar
Sal
t
Wat
er
Pre
serv
ativ
e
Vit
amin
s
Min
ute
s
nb
of
laye
rs
Lebanese White
X X X X X ֊ ֊ 20 to 25 2
Lebanese Brown
X X X X X X E282 B1 / Folic
acid 5 to 7 2
Tannour X X X X X X X X ֊ ֊ 5 to 7 1
Saj X
X X
X ֊ X X ֊ ֊ 3 to 5 1
(X) : contain, (-): doesn’t contain, (nb of layers): number of layers, (B1): Thiamin.
I-2.2.2 Lebanese white bread processing
Pita bread is made with grain flour, water, salt and baker’s yeast. The flatbreads are the most
widely consumed bread category in the world. In Lebanon, as the majority countries of the
Middle East region, some bread types are still produced at home, and others can be found in
the markets.
I-2.2.2.1 Description and manufacturing process of Lebanese white bread
The majority of bread rolls go through the same basic steps when baking Figure I-2. 2. The dry
ingredients are weighed and transferred into the mess where water is added gradually. The
dough goes through a fermentation stage. During this phase, the size and volume of the
dough will increase due to the activity of the yeast. Once the lifting phase is over, the dough
is divided into round pieces. The conveyor belts transfer the pieces of dough into the
preheated oven. The cooking time and temperature vary depending on the type of bread.
After cooling, the bread is packed in plastic bags.
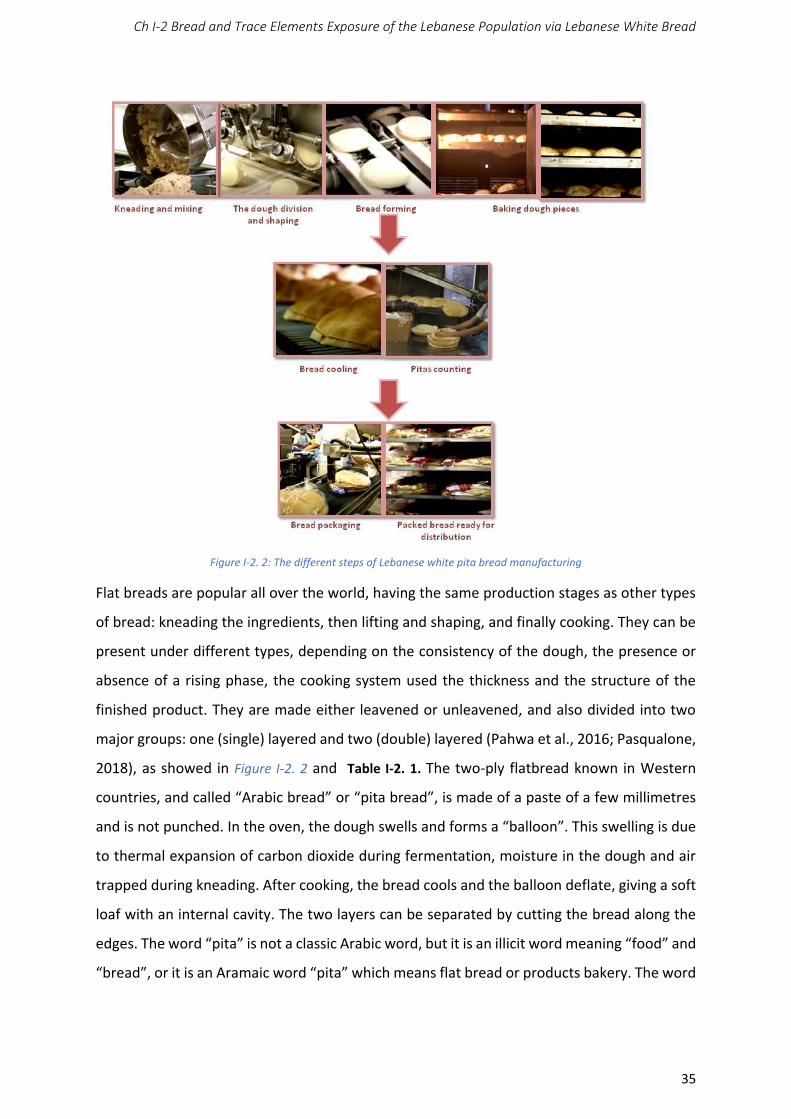
Ch I-2 Bread and Trace Elements Exposure of the Lebanese Population via Lebanese White Bread
35
Figure I-2. 2: The different steps of Lebanese white pita bread manufacturing
Flat breads are popular all over the world, having the same production stages as other types
of bread: kneading the ingredients, then lifting and shaping, and finally cooking. They can be
present under different types, depending on the consistency of the dough, the presence or
absence of a rising phase, the cooking system used the thickness and the structure of the
finished product. They are made either leavened or unleavened, and also divided into two
major groups: one (single) layered and two (double) layered (Pahwa et al., 2016; Pasqualone,
2018), as showed in Figure I-2. 2 and Table I-2. 1. The two-ply flatbread known in Western
countries, and called “Arabic bread” or “pita bread”, is made of a paste of a few millimetres
and is not punched. In the oven, the dough swells and forms a “balloon”. This swelling is due
to thermal expansion of carbon dioxide during fermentation, moisture in the dough and air
trapped during kneading. After cooking, the bread cools and the balloon deflate, giving a soft
loaf with an internal cavity. The two layers can be separated by cutting the bread along the
edges. The word “pita” is not a classic Arabic word, but it is an illicit word meaning “food” and
“bread”, or it is an Aramaic word “pita” which means flat bread or products bakery. The word
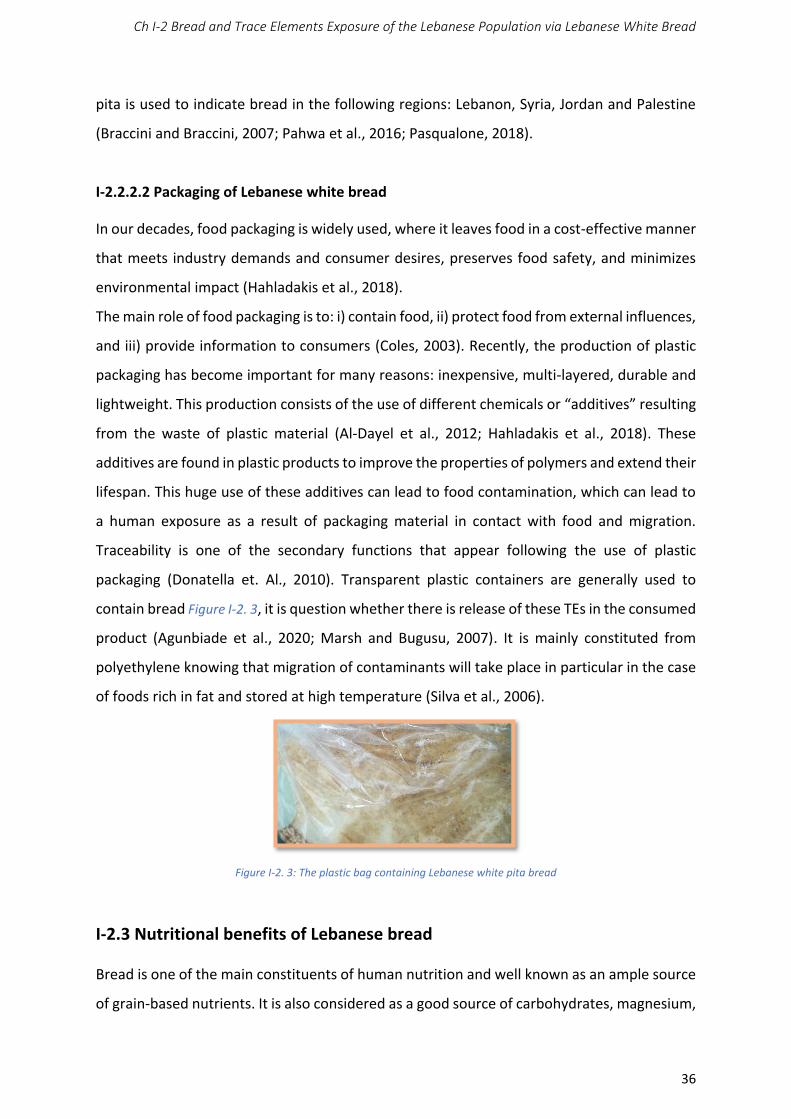
Ch I-2 Bread and Trace Elements Exposure of the Lebanese Population via Lebanese White Bread
36
pita is used to indicate bread in the following regions: Lebanon, Syria, Jordan and Palestine
(Braccini and Braccini, 2007; Pahwa et al., 2016; Pasqualone, 2018).
I-2.2.2.2 Packaging of Lebanese white bread
In our decades, food packaging is widely used, where it leaves food in a cost-effective manner
that meets industry demands and consumer desires, preserves food safety, and minimizes
environmental impact (Hahladakis et al., 2018).
The main role of food packaging is to: i) contain food, ii) protect food from external influences,
and iii) provide information to consumers (Coles, 2003). Recently, the production of plastic
packaging has become important for many reasons: inexpensive, multi-layered, durable and
lightweight. This production consists of the use of different chemicals or “additives” resulting
from the waste of plastic material (Al-Dayel et al., 2012; Hahladakis et al., 2018). These
additives are found in plastic products to improve the properties of polymers and extend their
lifespan. This huge use of these additives can lead to food contamination, which can lead to
a human exposure as a result of packaging material in contact with food and migration.
Traceability is one of the secondary functions that appear following the use of plastic
packaging (Donatella et. Al., 2010). Transparent plastic containers are generally used to
contain bread Figure I-2. 3, it is question whether there is release of these TEs in the consumed
product (Agunbiade et al., 2020; Marsh and Bugusu, 2007). It is mainly constituted from
polyethylene knowing that migration of contaminants will take place in particular in the case
of foods rich in fat and stored at high temperature (Silva et al., 2006).
Figure I-2. 3: The plastic bag containing Lebanese white pita bread
I-2.3 Nutritional benefits of Lebanese bread
Bread is one of the main constituents of human nutrition and well known as an ample source
of grain-based nutrients. It is also considered as a good source of carbohydrates, magnesium,

Ch I-2 Bread and Trace Elements Exposure of the Lebanese Population via Lebanese White Bread
37
iron, selenium, B vitamins and dietary fiber which are essential for humans. In fact, essential
minerals found in Lebanese bread are Cu, Fe, Mn, Zn, and Se which account for 36%, 25%,
30%, 22%, and 32% of respective recommended dietary allowance (RDA) values given for
these elements (Bou Khouzam et al., 2012).
The Arabic bread (Pita) is the most common type of bread consumed in Lebanon and the Arab
region. In one hand, a large pita loaf of approximately 122 g may contain about 170 calories,
and rich in carbohydrates with low dietary fiber content, noting that the majority of the
calories come from the high carbohydrate content. In the other hand, the pita bread is
characterized by having a low quantity of fat (1.6%), very low quantity of saturated fat and
cholesterol, and a fair amount of 16 g of proteins, comparing to respectively 6 g and 3 g in a
large and a small whole wheat pita loaf. In addition, the whole wheat pita bread may contain
10 mg of calcium and less than 2 mg of iron Table I-2. 2. Good bread quality is requiring good
manufacturing process, as monitoring and corrective measures in manufacturing procedures
and in the technological procedures of contamination and risk to the consumer (Mestek et
al., 2015; Soares et al., 2010).
Table I-2. 2: The calorific values and nutrition facts of Lebanese breads
Bread
Mass (g) Calorific
value (cal)
Nutrition Facts
Car
bo
hyd
rate
s (g
)
Die
tary
fib
er
con
ten
t (g
)
Fat
con
ten
t (g
)
Satu
rate
d f
at
&C
ho
lest
ero
l (g)
Pro
tein
s (g
)
Ca
(mg)
Fe (
mg)
Lebanese White
122
170
50 14 5 Low
quality* 16 10 < 2
Lebanese Brown
60
195
39 2 1.5 0.5 6 ֊ ֊
Tannour
38.5
96
22 2 ֊ 0 5.4 ֊ ֊
Saj
80
270
58 0 1 0 8 ֊ ֊
*Saturated fat makes up less than 10 percent of the total calories of that meal
I-2.4 Trace elements contamination of Lebanese bread
As we mentioned previously, Tes represent the main source of chemical contamination in
food and Tes are recognized worldwide as a danger to public health (Marín et al., 2018),
Ch I-2 Bread and Trace Elements Exposure of the Lebanese Population via Lebanese White Bread
38
where they bioaccumulate and enter the food chain (Gupta et al., 2019; Kumar et al., 2019;
Mitra et al., 2017).
Several few studies carried out in many countries have shown that the presence of TEs in
bread are partly linked to cereals, but strongly linked to the process of bread preparation
(kneading, lifting, shaping, and baking). In the cooking stage, the sources of trace element
contamination are diverse, such as the trace element surfaces that come into contact with
the material and the contamination of the air and the environment. In addition, all the fuel
used during cooking can emit TEs residues during process (Ahmed et al., 2000; Khaniki et al.,
2005). As a result, the flat bread samples collected from bakeries of Tehran, showed high
levels in Pb, Cd and specifically in Ni comparing to those present in the Romanian bread
(Khaniki et al., 2005; Storelli et al., 2017). Another study concerning the Iranian bread
conducted in Isfahan region in 2018, showed a contamination of wheat bread by both
elements Pb and Cd, this contamination was due to industrial and agricultural activities,
where the results showed average values exceeding the limits allowed by international and
national standards.
Consequently, many factors may influence the bread chemical contamination such as
contamination of ingredients, processing and cooking. A study conducted by (Ertl and
Goessler, 2018), studying concentrations of 27 elements, in cereals, flour, bread and pasta in
Austria, showed that TEs concentrations (especially Ni, Cd, Pb, Al and Cr) may be affected
during grinding and processing. The TEs in wheat flour showed successively values of 0.05 ±
0.001 mg kg-1, 0.036 ± 0.016 mg kg-1, 0.007 ± 0.001 mg kg-1, 0.06 ± 0.0036 mg kg-1, 0.005 ±
0.001 mg kg-1, 0.022 ± 0.004 mg kg-1, and less than 0.002 mg kg-1 for Pb, Cr, Co, Ni, As, Cd, and
Hg respectively. The elements Al and Cr showed values 2 times higher in flour than in cereals
due to grinding and processing. The cooking has been shown to be a source of lead
contamination (Ghoreishy et al., 2018), while a study conducted by Yusà et al. (2018) did not
take into consideration the effect of cooking and processing.
In Lebanon, a study conducted on the Lebanese population for total diet study “TDS” in 2010
(Nasreddine et al., 2010), and another in 2012 reported that the average consumption of
bread is about 136.8 g per day (Bou Khouzam et al., 2012). Among the very rare studies in
Lebanon concerning the trace element bread contamination, the latter determined the
contents of 20 elements in different three varieties of Lebanese bread (i.e., white, brown pita,
and Saj bread) throughout the country during the wet and dry seasons, where the
Ch I-2 Bread and Trace Elements Exposure of the Lebanese Population via Lebanese White Bread
39
concentrations of the elements Ag, Co, Hg, and others in Lebanese bread were similar to those
reported in other countries and where the toxic elements such as Cd and Pb were below
maximum levels set by the Lebanese Standards Institution “LIBNOR” (Bou Khouzam et al.,
2012). Due to the lack of sufficient data and information, our study was conducted in order
to have a state of data of TEs contents in bread, as it is the case in other countries such as
Egypt, Iran, South Africa, Nigeria, and Portugal and in Europe (Ahmed et al., 2000; ANSES,
2011; EFSA, 2012; Soares et al., 2010).
I-2.5 Potential Exposure and Risk Associated to Tes exposure of the Lebanese
population via the daily consumption of the Lebanese white bread
I-2.5.1 Potential exposure to chemical compounds and associated risk
As shown above, the micronutrients are essential or necessary for human nutrition, some not
essential or even toxic such as Pb, Hg, Cd and As (Counter and Buchanan, 2004). These
contaminants can pass from farm to fork and enter the human body through the food chain,
where it becomes toxic at sufficient high levels. The exposure to toxic elements can lead to
risks and problems for human health such as disorders of the nervous and endocrine system,
as well as reproductive and gastrointestinal tract problems, which are very well reported and
documented (Babaahmadifooladi et al., 2019; Nordberg and Nordberg, 2016; WHO, 1996).
For instance, the use of pesticides, fertilizers and other chemical compounds in different ways
has shown numerous advantages at the society level expectation. However, sometimes these
advantages are outweighed by certain disadvantages, in particular the toxic side properties
of the chemical compounds used Figure I-2. 4. The chemical exposure can lead to variable
effects, such as death and chemical carcinogenesis (Oliveira et al., 2007). The chemical
carcinogenesis is a multicausal process in which the normal cells become first initiated, then
malignant and invasive. The first experimental work on chemical carcinogenesis was carried
out in 1915, where at the end of the nineteenth century, the occupational chemicals exposure
showed carcinogenic effects (Luch, 2005).
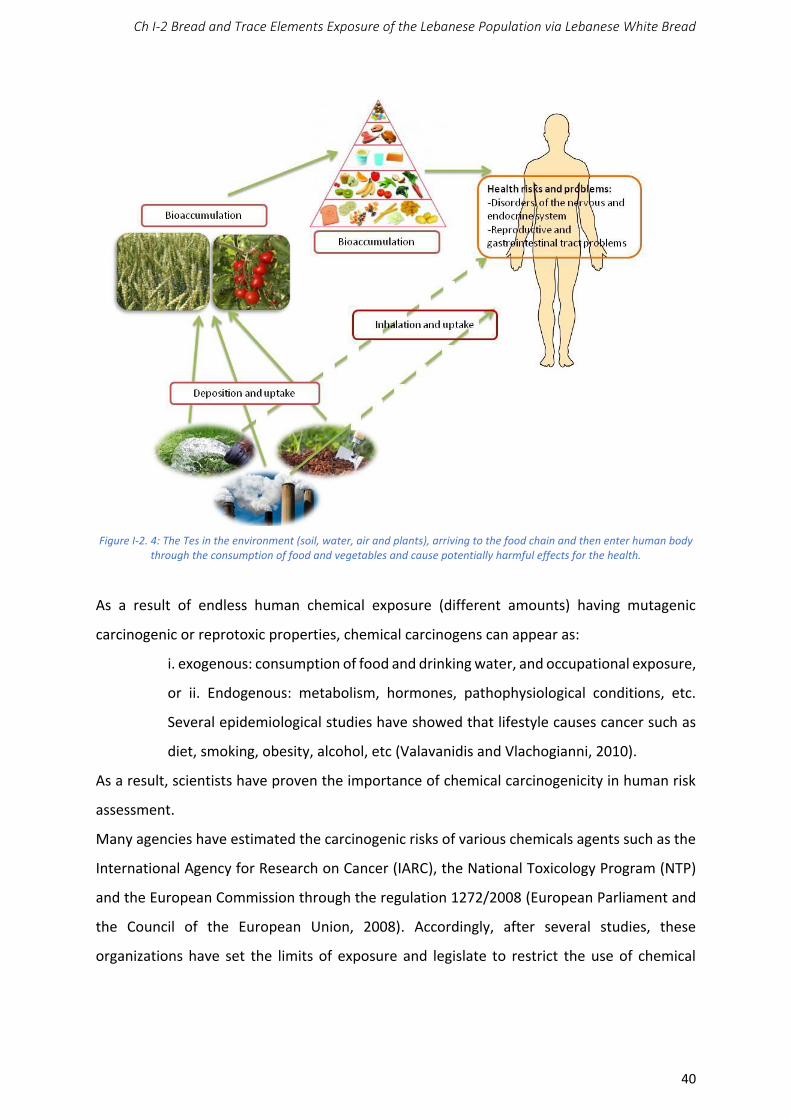
Ch I-2 Bread and Trace Elements Exposure of the Lebanese Population via Lebanese White Bread
40
Figure I-2. 4: The Tes in the environment (soil, water, air and plants), arriving to the food chain and then enter human body
through the consumption of food and vegetables and cause potentially harmful effects for the health.
As a result of endless human chemical exposure (different amounts) having mutagenic
carcinogenic or reprotoxic properties, chemical carcinogens can appear as:
i. exogenous: consumption of food and drinking water, and occupational exposure,
or ii. Endogenous: metabolism, hormones, pathophysiological conditions, etc.
Several epidemiological studies have showed that lifestyle causes cancer such as
diet, smoking, obesity, alcohol, etc (Valavanidis and Vlachogianni, 2010).
As a result, scientists have proven the importance of chemical carcinogenicity in human risk
assessment.
Many agencies have estimated the carcinogenic risks of various chemicals agents such as the
International Agency for Research on Cancer (IARC), the National Toxicology Program (NTP)
and the European Commission through the regulation 1272/2008 (European Parliament and
the Council of the European Union, 2008). Accordingly, after several studies, these
organizations have set the limits of exposure and legislate to restrict the use of chemical
Ch I-2 Bread and Trace Elements Exposure of the Lebanese Population via Lebanese White Bread
41
carcinogens in other applications and to protect the human population against carcinogenic
risk from these substances (Cohen et al., 2019; Valavanidis and Vlachogianni, 2010).
I-2.5.2 Potential exposure to trace elements in food and associated risk
Following the existing literature, it is crucial to quantify the content of TEs in food in order to
calculate roughly dietary exposure which is a requisite in the evaluation of risks associated to
food consumption (Marín et al., 2018; van der Fels-Klerx et al., 2014). Recently, several studies
have evaluated the exposure to TEs in foodstuffs, in different regions such as France (ANSES,
2011; Arnich et al., 2012), Spain (Marín et al., 2018), Italy (Storelli et al., 2017), China (Tang
and Huang, 2014), Saudi Arabia (Ali and Al-Qahtani, 2012), and Lebanon (Nasreddine et al.,
2010). It is essential to specify the food as consumed, in order to assess public health risks
associated with substances such as TEs in food. The toxicity of micronutrients may depend on
the chemical form of the element (Kelly et al., 2018). The risk arises on the fraction absorbed,
therefore available or bioaccessible by the body (Babaahmadifooladi et al., 2019; Turdi and
Yang, 2016). Therefore, it can be concluded that the origin of exposure and the estimation of
TEs in food can lead to a complete assessment of their ingestion levels and potential risks to
human health (Kim et al., 2015).
I-2.5.3 Thresholds of trace elements in food and their monitoring
In order to assess human dietary exposure to chemicals such as TEs, on one hand, the
methodology of Total Diet Studies (TDS) should be monitored and performed. The TDS study
is mainly based on daily food consumption, which represents the overall diet of the
population. Such data are needed to identify risk groups and assess the risk to consumer
health associated with chemical substances (ANSES, 2011).
On the other hand, in order to provide more realistic “background” exposure data, (ANSES,
2019) suggested the analysis of foods “as consumed”, that is to say washed, peeled and
cooked if necessary. This type of study allows international comparisons in terms of consumer
exposure. Accordingly, the World Health Organization (WHO) and the Food and Agriculture
Organization of the United Nations (ANSES, 2011; EFSA, 2011) have endorsed the Total Diet
Study (TDS), where the FAO determines TDS by the amount of various chemical contaminants
and nutrients that a person gets from their diet (type of food) in a day, a year or more.
Ch I-2 Bread and Trace Elements Exposure of the Lebanese Population via Lebanese White Bread
42
Various studies in several countries, investigating the dietary exposure to TEs, have been
carried out using the TDS approach (Ingenbleek et al., 2017; Papadopoulos et al., 2015; Turrini
et al., 2018; EFSA, 2011). In France, a TDS allows to underline the necessity to reduce exposure
to TEs such as Cd, Al, Ni, As, and Co by a diversified diet (food items and origins) (ANSES,
2019).
In Lebanon, a TDS approach study was carried out by Nasreddine et al. (2010) in order to
assess, the dietary exposure of the population to six essential TEs (Co, Cu, Fe, Mn, Ni and Zn)
and two toxic ones (Cd and Pb). This study, carried out in the (urban) capital of Beirut,
provided us an idea on the evaluation of the adult population exposure to TEs, as well as a
first estimation of TEs consumer exposure via food in Lebanon. In fact, the study of
Nasreddine et al. (2010) showed that bread and cereals were the main dietary source of the
following elements: Mn, Cu, Fe, and Ni respectively (0.97 mg day-1, 486.95 µg day-1, 4.87 mg
day-1 and 54.73 µg day-1). This is explained by the fact that Lebanese diet is highly dependent
on grains, where the authors found that bread and grain products contained the highest levels
of Mn, Ni and Fe respectively (3.0 mg kg-1, 169.01 µg kg-1 and 15.04 mg kg-1). In this study, the
main contributors to dietary Pb and Cd intake were vegetables (4.02 µg day-1 - 48.7% and 7.4
µg day-1 - 46.8% respectively) followed by bread and cereal products (2.6 µg day-1 - 31.4% and
4.89 µg day-1 - 30.9% respectively). In addition, bread and cereals contributed the most to the
intake of Ni (54.73 µg day-1).
A long-term exposure to TEs and other chemical contaminants can lead to various health
effects as well as chronic toxicity (Dorne et al., 2011). Trace elements can cause adverse
health effects by affecting several organs and systems. The fundamental mechanisms of trace
element toxicity include formation of free radicals thereby increasing oxidative stress,
interaction with and damage of biological molecules, as well as damage to DNA, which is
critical for carcinogenesis (Azeh Engwa et al., 2019). This is why an estimation of the daily
intake of these toxic TEs via food consumption must be performed.
Accordingly, the International scientific committees such as FAO/WHO, JEFCA, European
Union and others, mainly use the safety factor approach for establishing acceptable or
tolerable intakes of substances that exhibit thresholds of toxicity.
The acceptable daily intake (ADI) for humans is widely used to describe “safe” levels of intake;
and is defined as an estimate of the amount of a chemical that can be ingested daily over a
Ch I-2 Bread and Trace Elements Exposure of the Lebanese Population via Lebanese White Bread
43
lifetime without appreciable risk to health (WHO, 2007). These levels of intake, ADIs are set
due to several toxicological studies, including data from studies on various laboratory animals,
where highest dose level may not produce observable toxic effect. The ADI is expressed in
milligrams per kilogram of body weight per day (mg kg-1 per bw day-1) and especially used for
food additives.
In case of food contaminants such as trace elements, the tolerable intakes are expressed on
either a daily basis (TDI or tolerable daily intake) or weekly basis, but the calculation is similar.
It is an estimation of the ingested quantity of contaminants every day for all the life without
having any corporeal effects on his or her health.
Furthermore, other terms can be used in order to assess the exposure to TEs levels in
consumed food such as: PTWI, or provisional tolerable weekly intake, for contaminants that
may accumulate in the body and mainly used by JECFA, and PTDI or Provisional Tolerable
Daily Intake (PTDI) as showed by (Pipoyan et al., 2018) in their study of the exposure of the
Armenian population to TEs present in consumed fruits and vegetables, that the PTDI values
do not exceeded the FAO/WHO threshold values (500, 1000 and 20.71 μg day-1 kg-1 body
weight for Cu, Zn, and Ni respectively).
If there are no Health-based Guidance Value available, the human health risk can be
determined by the calculation of the Margin of Exposure (MOE), which was developed by
(EFSA, 2005) in order to assess genotoxic and carcinogenic impurities in food. The MOE is
calculated according to the following approach:
MOE = BMDL
Estimated Exposure Dose
Where the BMDL has the lower limit of the reference dose and which is presented by the unit
of BMDL: mg kg-1 per bw day-1 or ppm. When the latter presents the reference, value derived
from the reference dose (BMD) which extends the use of response data from animal studies.
Since the study of Nasreddine et al. (2010) showed that the bread was one of the major
contributors of TEs to the Lebanese food basket, we found that it was more judicious to focus
on this issue. There is an urgent need to specify the daily TEs intake by means of Lebanese
bread all over Lebanon. Several factors were considered such as the bread type, the amount
consumed which varies according to age, sex and socio-economic status of the consumer. All
the data were collected by dint of a national survey of bread consumption, as well as bread
Ch I-2 Bread and Trace Elements Exposure of the Lebanese Population via Lebanese White Bread
44
TEs analysis of the three most consumed brands in Lebanon. Using the survey data,
population categories of exposures to TEs via white bread consumption were calculated and
compared to the international health-based guidance values: tolerable daily intake (TDI),
tolerable weekly intake (TWI) or toxicological reference points, such as bench mark dose limit
(BMDL), to evaluate safety concerns.

Ch I-3 The international and national legislations of soil, wheat plant and bread
45
CHAPTER I-3
The international and national
legislations of soil, wheat plant and
bread
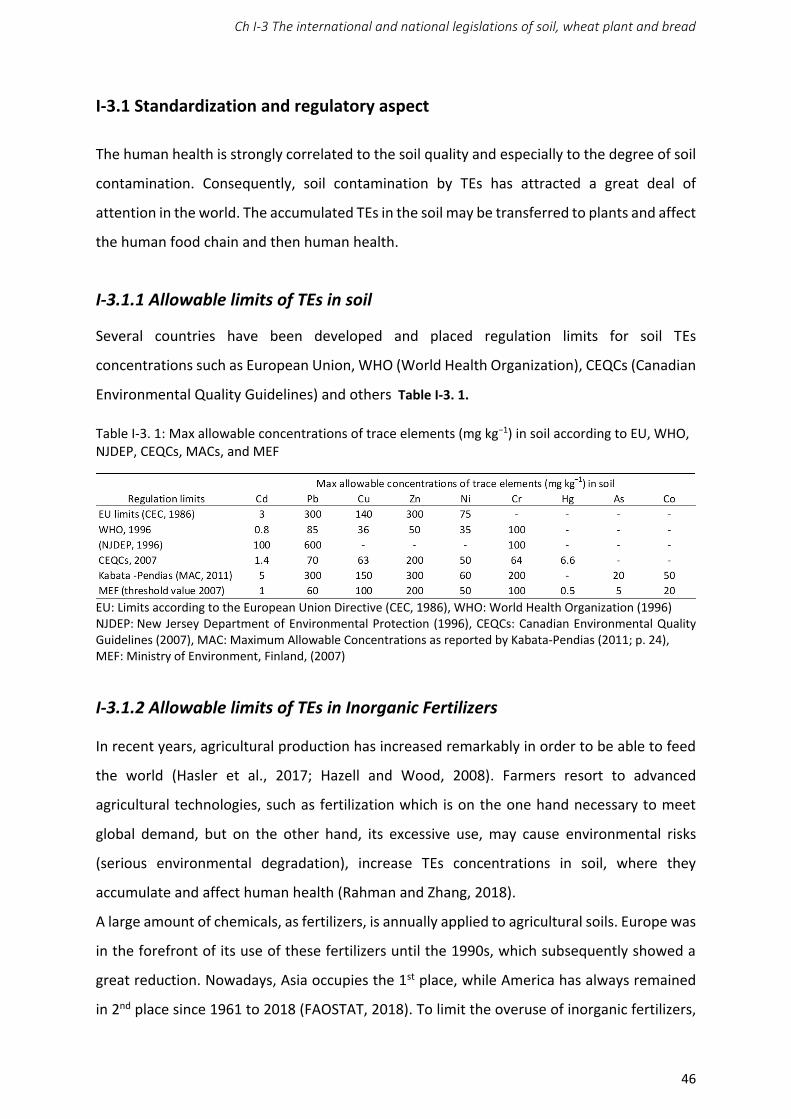
Ch I-3 The international and national legislations of soil, wheat plant and bread
46
I-3.1 Standardization and regulatory aspect
The human health is strongly correlated to the soil quality and especially to the degree of soil
contamination. Consequently, soil contamination by TEs has attracted a great deal of
attention in the world. The accumulated TEs in the soil may be transferred to plants and affect
the human food chain and then human health.
I-3.1.1 Allowable limits of TEs in soil
Several countries have been developed and placed regulation limits for soil TEs
concentrations such as European Union, WHO (World Health Organization), CEQCs (Canadian
Environmental Quality Guidelines) and others Table I-3. 1.
Table I-3. 1: Max allowable concentrations of trace elements (mg kg−1) in soil according to EU, WHO, NJDEP, CEQCs, MACs, and MEF
EU: Limits according to the European Union Directive (CEC, 1986), WHO: World Health Organization (1996) NJDEP: New Jersey Department of Environmental Protection (1996), CEQCs: Canadian Environmental Quality Guidelines (2007), MAC: Maximum Allowable Concentrations as reported by Kabata-Pendias (2011; p. 24), MEF: Ministry of Environment, Finland, (2007)
I-3.1.2 Allowable limits of TEs in Inorganic Fertilizers
In recent years, agricultural production has increased remarkably in order to be able to feed
the world (Hasler et al., 2017; Hazell and Wood, 2008). Farmers resort to advanced
agricultural technologies, such as fertilization which is on the one hand necessary to meet
global demand, but on the other hand, its excessive use, may cause environmental risks
(serious environmental degradation), increase TEs concentrations in soil, where they
accumulate and affect human health (Rahman and Zhang, 2018).
A large amount of chemicals, as fertilizers, is annually applied to agricultural soils. Europe was
in the forefront of its use of these fertilizers until the 1990s, which subsequently showed a
great reduction. Nowadays, Asia occupies the 1st place, while America has always remained
in 2nd place since 1961 to 2018 (FAOSTAT, 2018). To limit the overuse of inorganic fertilizers,
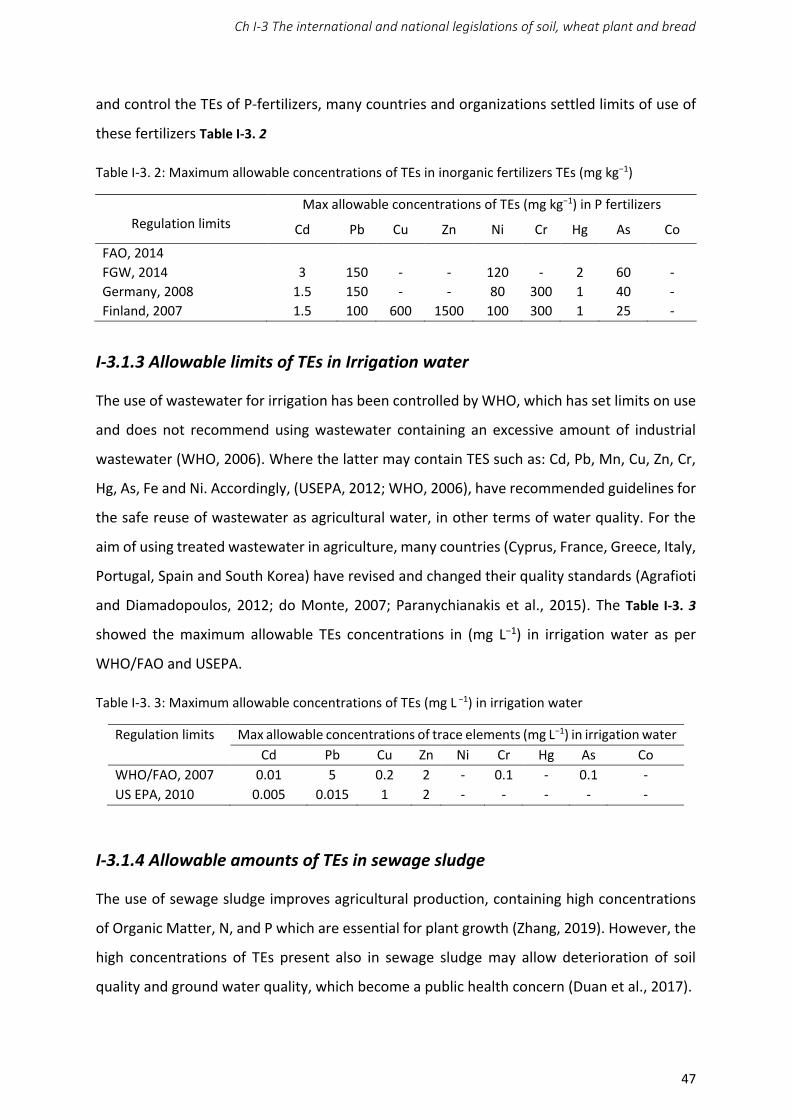
Ch I-3 The international and national legislations of soil, wheat plant and bread
47
and control the TEs of P-fertilizers, many countries and organizations settled limits of use of
these fertilizers Table I-3. 2
Table I-3. 2: Maximum allowable concentrations of TEs in inorganic fertilizers TEs (mg kg−1)
Regulation limits
Max allowable concentrations of TEs (mg kg−1) in P fertilizers
Cd Pb Cu Zn Ni Cr Hg As Co
FAO, 2014
FGW, 2014 3 150 - - 120 - 2 60 -
Germany, 2008 1.5 150 - - 80 300 1 40 -
Finland, 2007 1.5 100 600 1500 100 300 1 25 -
I-3.1.3 Allowable limits of TEs in Irrigation water
The use of wastewater for irrigation has been controlled by WHO, which has set limits on use
and does not recommend using wastewater containing an excessive amount of industrial
wastewater (WHO, 2006). Where the latter may contain TES such as: Cd, Pb, Mn, Cu, Zn, Cr,
Hg, As, Fe and Ni. Accordingly, (USEPA, 2012; WHO, 2006), have recommended guidelines for
the safe reuse of wastewater as agricultural water, in other terms of water quality. For the
aim of using treated wastewater in agriculture, many countries (Cyprus, France, Greece, Italy,
Portugal, Spain and South Korea) have revised and changed their quality standards (Agrafioti
and Diamadopoulos, 2012; do Monte, 2007; Paranychianakis et al., 2015). The Table I-3. 3
showed the maximum allowable TEs concentrations in (mg L−1) in irrigation water as per
WHO/FAO and USEPA.
Table I-3. 3: Maximum allowable concentrations of TEs (mg L −1) in irrigation water
Regulation limits Max allowable concentrations of trace elements (mg L−1) in irrigation water
Cd Pb Cu Zn Ni Cr Hg As Co
WHO/FAO, 2007 0.01 5 0.2 2 - 0.1 - 0.1 -
US EPA, 2010 0.005 0.015 1 2 - - - - -
I-3.1.4 Allowable amounts of TEs in sewage sludge
The use of sewage sludge improves agricultural production, containing high concentrations
of Organic Matter, N, and P which are essential for plant growth (Zhang, 2019). However, the
high concentrations of TEs present also in sewage sludge may allow deterioration of soil
quality and ground water quality, which become a public health concern (Duan et al., 2017).
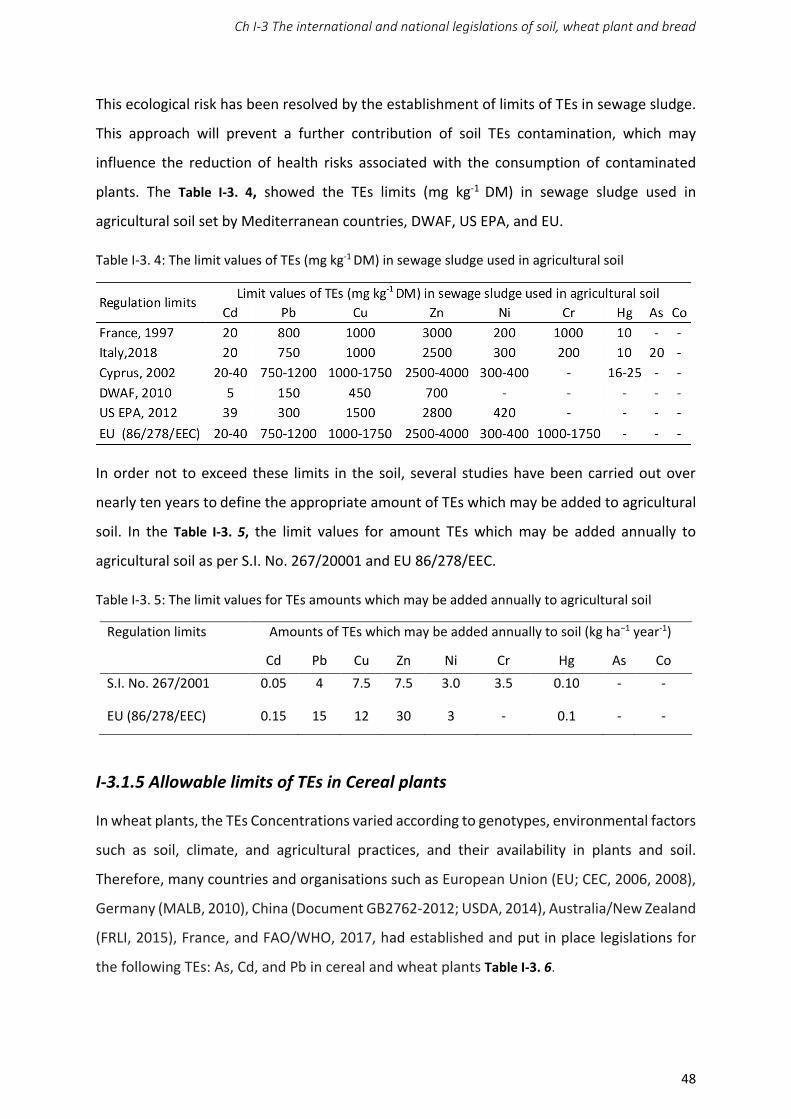
Ch I-3 The international and national legislations of soil, wheat plant and bread
48
This ecological risk has been resolved by the establishment of limits of TEs in sewage sludge.
This approach will prevent a further contribution of soil TEs contamination, which may
influence the reduction of health risks associated with the consumption of contaminated
plants. The Table I-3. 4, showed the TEs limits (mg kg-1 DM) in sewage sludge used in
agricultural soil set by Mediterranean countries, DWAF, US EPA, and EU.
Table I-3. 4: The limit values of TEs (mg kg-1 DM) in sewage sludge used in agricultural soil
In order not to exceed these limits in the soil, several studies have been carried out over
nearly ten years to define the appropriate amount of TEs which may be added to agricultural
soil. In the Table I-3. 5, the limit values for amount TEs which may be added annually to
agricultural soil as per S.I. No. 267/20001 and EU 86/278/EEC.
Table I-3. 5: The limit values for TEs amounts which may be added annually to agricultural soil
Regulation limits Amounts of TEs which may be added annually to soil (kg ha−1 year-1)
Cd Pb Cu Zn Ni Cr Hg As Co
S.I. No. 267/2001 0.05 4 7.5 7.5 3.0 3.5 0.10 - -
EU (86/278/EEC) 0.15 15 12 30 3 - 0.1 - -
I-3.1.5 Allowable limits of TEs in Cereal plants
In wheat plants, the TEs Concentrations varied according to genotypes, environmental factors
such as soil, climate, and agricultural practices, and their availability in plants and soil.
Therefore, many countries and organisations such as European Union (EU; CEC, 2006, 2008),
Germany (MALB, 2010), China (Document GB2762-2012; USDA, 2014), Australia/New Zealand
(FRLI, 2015), France, and FAO/WHO, 2017, had established and put in place legislations for
the following TEs: As, Cd, and Pb in cereal and wheat plants Table I-3. 6.
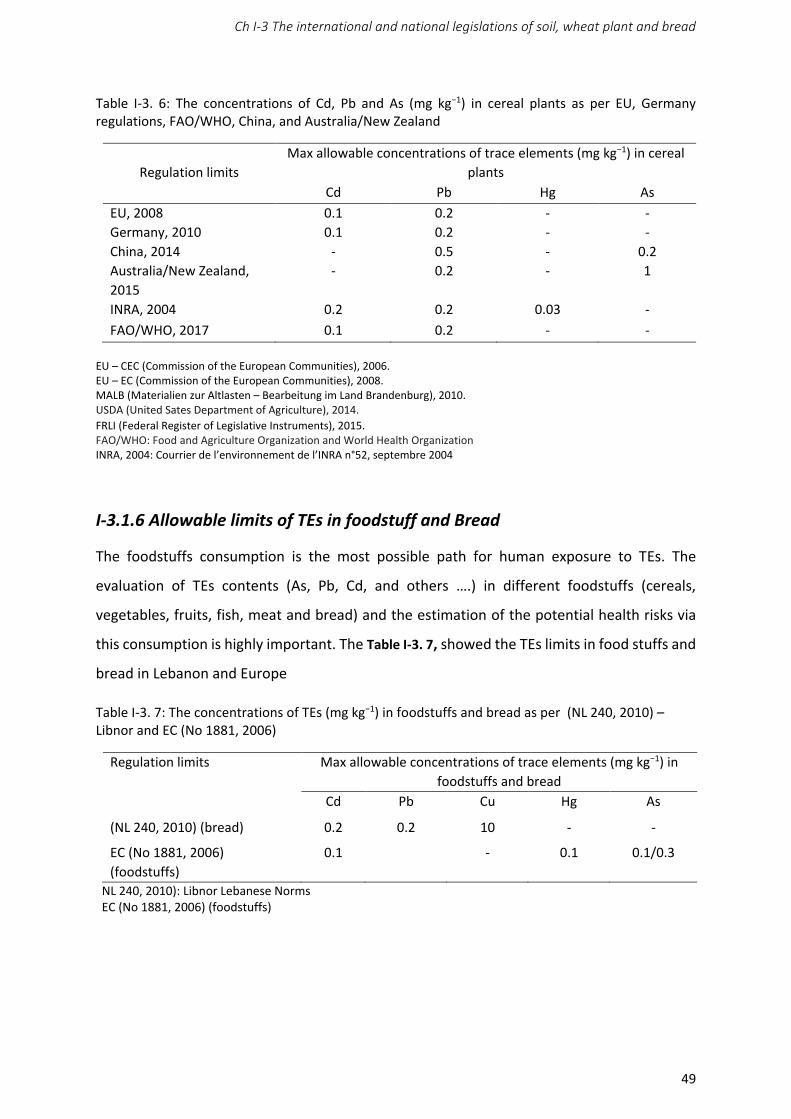
Ch I-3 The international and national legislations of soil, wheat plant and bread
49
Table I-3. 6: The concentrations of Cd, Pb and As (mg kg−1) in cereal plants as per EU, Germany regulations, FAO/WHO, China, and Australia/New Zealand
Regulation limits
Max allowable concentrations of trace elements (mg kg−1) in cereal
plants
Cd Pb Hg As
EU, 2008 0.1 0.2 - -
Germany, 2010 0.1 0.2 - -
China, 2014 - 0.5 - 0.2
Australia/New Zealand,
2015
- 0.2 - 1
INRA, 2004 0.2 0.2 0.03 -
FAO/WHO, 2017 0.1 0.2 - -
EU – CEC (Commission of the European Communities), 2006. EU – EC (Commission of the European Communities), 2008. MALB (Materialien zur Altlasten – Bearbeitung im Land Brandenburg), 2010. USDA (United Sates Department of Agriculture), 2014.
FRLI (Federal Register of Legislative Instruments), 2015. FAO/WHO: Food and Agriculture Organization and World Health Organization INRA, 2004: Courrier de l’environnement de l’INRA n°52, septembre 2004
I-3.1.6 Allowable limits of TEs in foodstuff and Bread
The foodstuffs consumption is the most possible path for human exposure to TEs. The
evaluation of TEs contents (As, Pb, Cd, and others ….) in different foodstuffs (cereals,
vegetables, fruits, fish, meat and bread) and the estimation of the potential health risks via
this consumption is highly important. The Table I-3. 7, showed the TEs limits in food stuffs and
bread in Lebanon and Europe
Table I-3. 7: The concentrations of TEs (mg kg−1) in foodstuffs and bread as per (NL 240, 2010) – Libnor and EC (No 1881, 2006)
Regulation limits Max allowable concentrations of trace elements (mg kg−1) in
foodstuffs and bread
Cd Pb Cu Hg As
(NL 240, 2010) (bread) 0.2 0.2 10 - -
EC (No 1881, 2006)
(foodstuffs)
0.1 - 0.1 0.1/0.3
NL 240, 2010): Libnor Lebanese Norms EC (No 1881, 2006) (foodstuffs)

PART II – MATERIAL AND METHODS
50
PART II – MATERIAL AND METHODS
Ch II-1 Geological, hydrogeological, hydrological and climatic context of the Bekaa valley
51
CHAPTER II-1
Geological, hydrogeological,
hydrological and climatic context of
the Bekaa valley
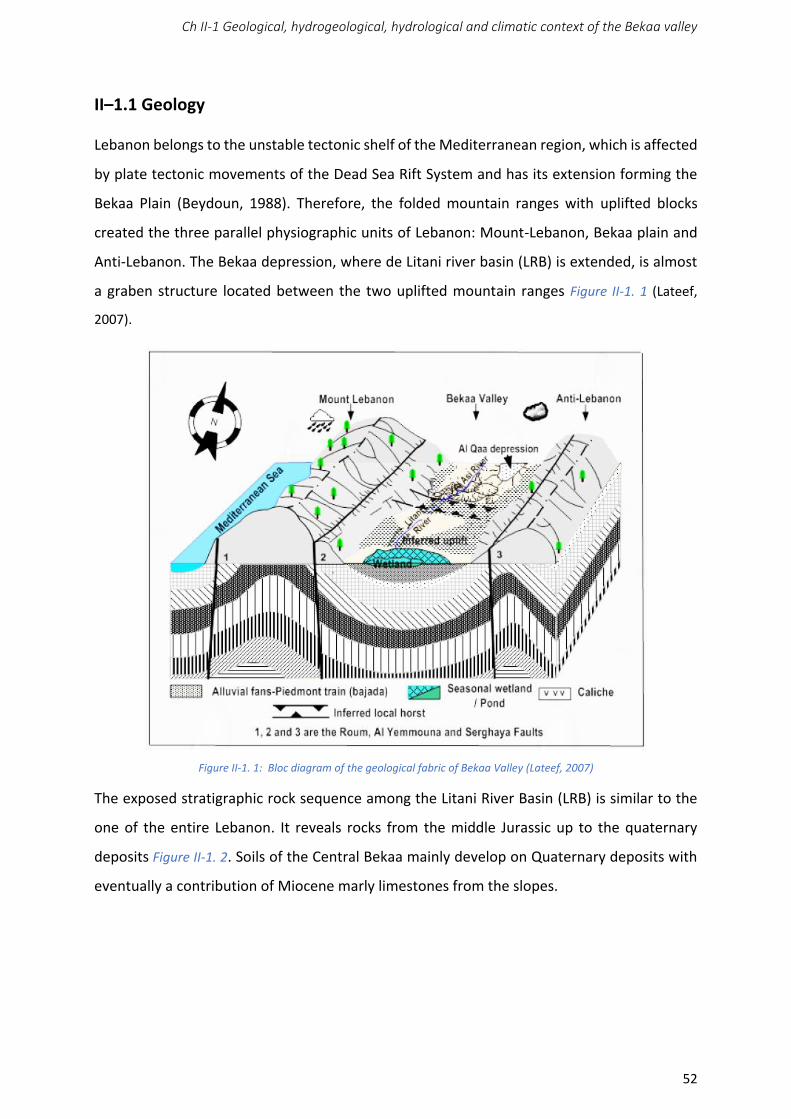
Ch II-1 Geological, hydrogeological, hydrological and climatic context of the Bekaa valley
52
II–1.1 Geology
Lebanon belongs to the unstable tectonic shelf of the Mediterranean region, which is affected
by plate tectonic movements of the Dead Sea Rift System and has its extension forming the
Bekaa Plain (Beydoun, 1988). Therefore, the folded mountain ranges with uplifted blocks
created the three parallel physiographic units of Lebanon: Mount-Lebanon, Bekaa plain and
Anti-Lebanon. The Bekaa depression, where de Litani river basin (LRB) is extended, is almost
a graben structure located between the two uplifted mountain ranges Figure II-1. 1 (Lateef,
2007).
Figure II-1. 1: Bloc diagram of the geological fabric of Bekaa Valley (Lateef, 2007)
The exposed stratigraphic rock sequence among the Litani River Basin (LRB) is similar to the
one of the entire Lebanon. It reveals rocks from the middle Jurassic up to the quaternary
deposits Figure II-1. 2. Soils of the Central Bekaa mainly develop on Quaternary deposits with
eventually a contribution of Miocene marly limestones from the slopes.
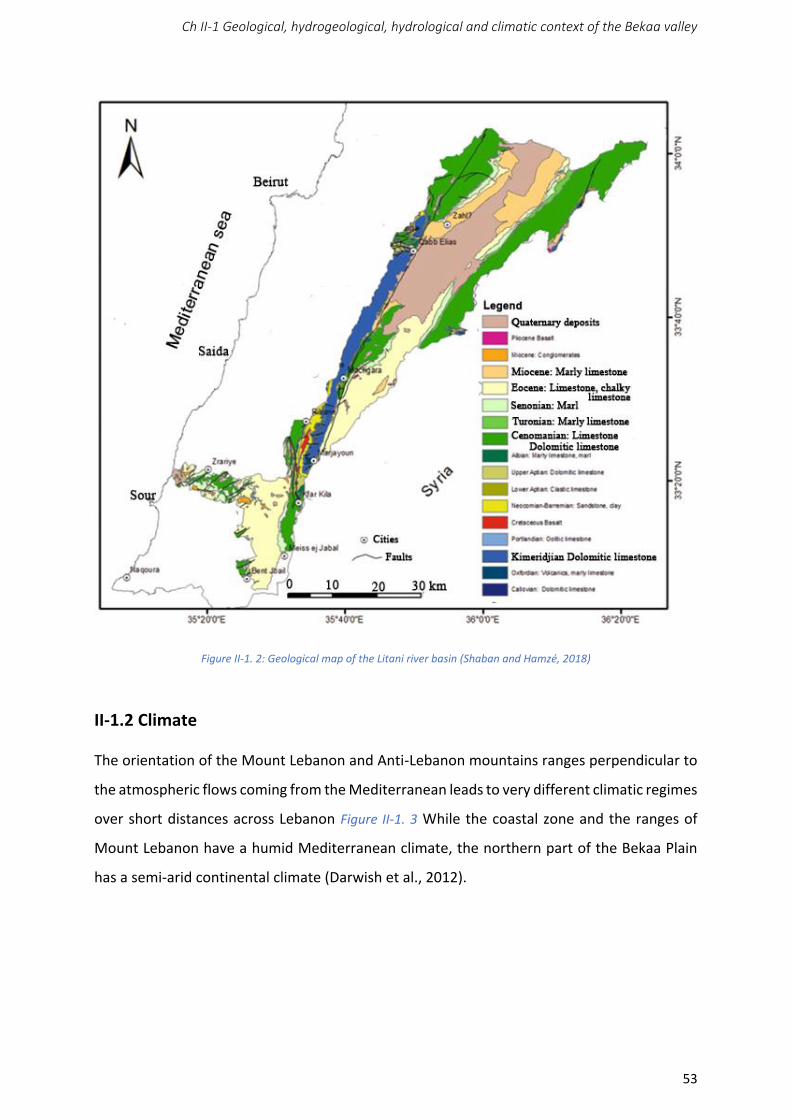
Ch II-1 Geological, hydrogeological, hydrological and climatic context of the Bekaa valley
53
Figure II-1. 2: Geological map of the Litani river basin (Shaban and Hamzé, 2018)
II-1.2 Climate
The orientation of the Mount Lebanon and Anti-Lebanon mountains ranges perpendicular to
the atmospheric flows coming from the Mediterranean leads to very different climatic regimes
over short distances across Lebanon Figure II-1. 3 While the coastal zone and the ranges of
Mount Lebanon have a humid Mediterranean climate, the northern part of the Bekaa Plain
has a semi-arid continental climate (Darwish et al., 2012).
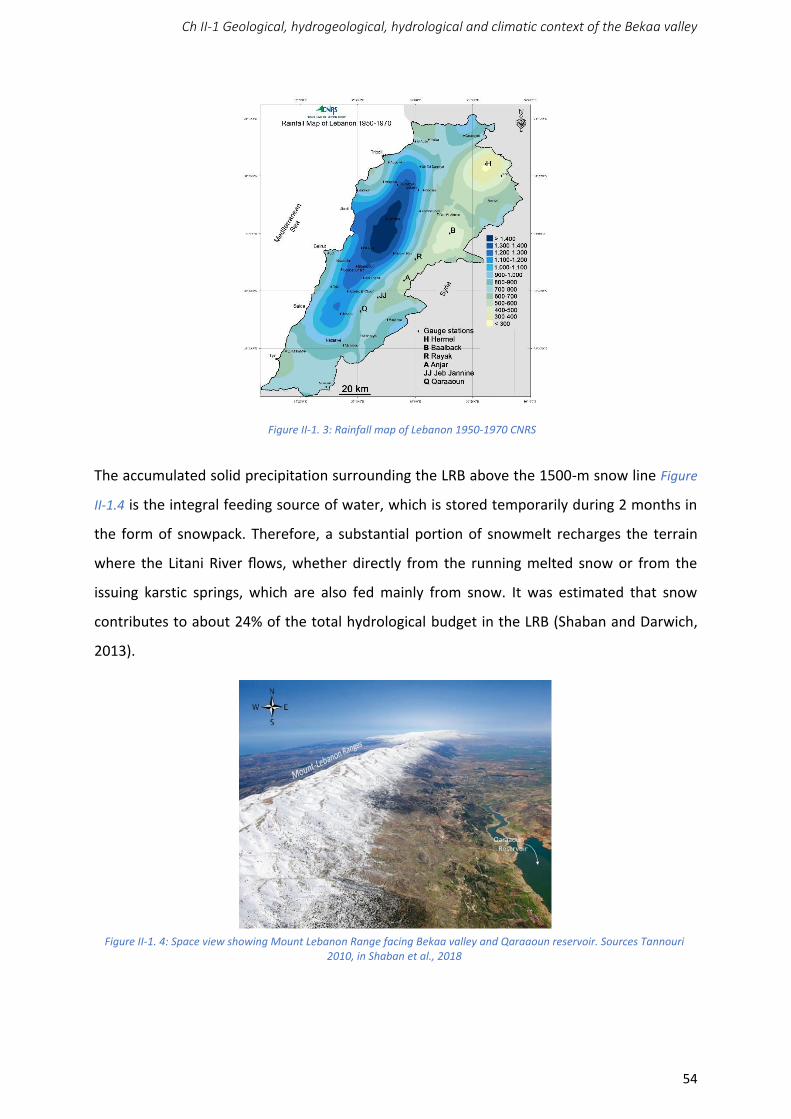
Ch II-1 Geological, hydrogeological, hydrological and climatic context of the Bekaa valley
54
The accumulated solid precipitation surrounding the LRB above the 1500-m snow line Figure
II-1.4 is the integral feeding source of water, which is stored temporarily during 2 months in
the form of snowpack. Therefore, a substantial portion of snowmelt recharges the terrain
where the Litani River flows, whether directly from the running melted snow or from the
issuing karstic springs, which are also fed mainly from snow. It was estimated that snow
contributes to about 24% of the total hydrological budget in the LRB (Shaban and Darwich,
2013).
Figure II-1. 4: Space view showing Mount Lebanon Range facing Bekaa valley and Qaraaoun reservoir. Sources Tannouri
2010, in Shaban et al., 2018
Figure II-1. 3: Rainfall map of Lebanon 1950-1970 CNRS
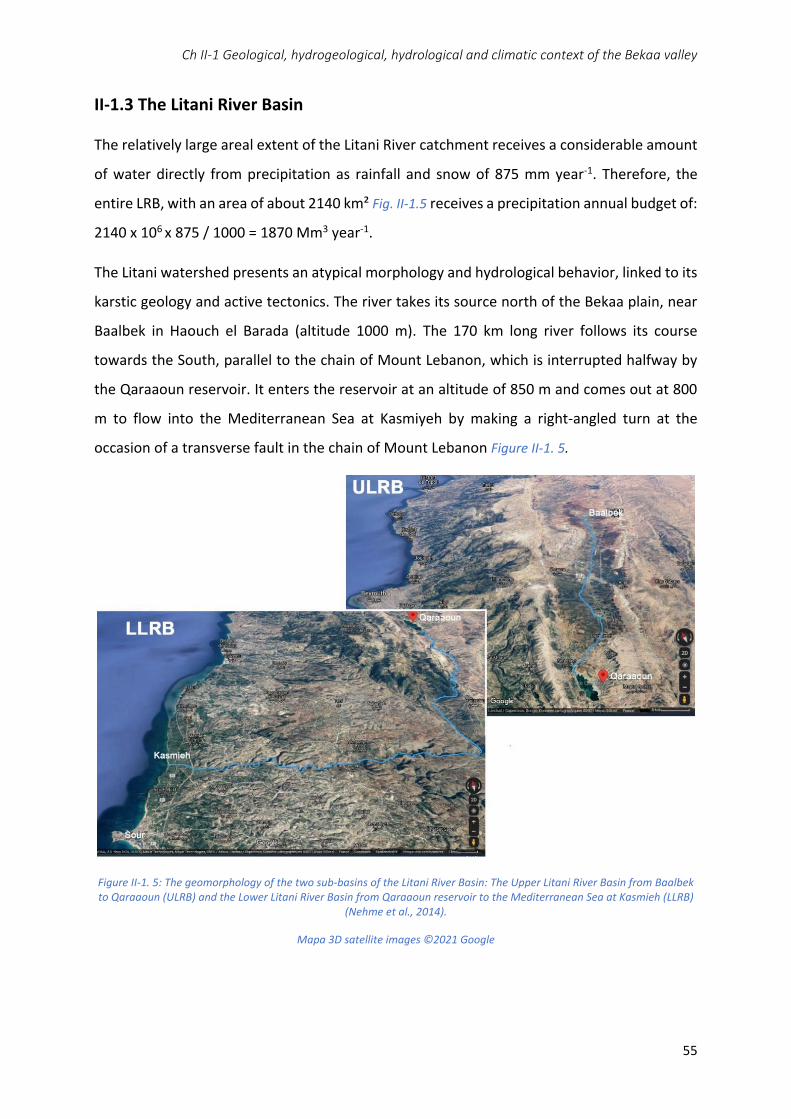
Ch II-1 Geological, hydrogeological, hydrological and climatic context of the Bekaa valley
55
II-1.3 The Litani River Basin
The relatively large areal extent of the Litani River catchment receives a considerable amount
of water directly from precipitation as rainfall and snow of 875 mm year-1. Therefore, the
entire LRB, with an area of about 2140 km² Fig. II-1.5 receives a precipitation annual budget of:
2140 x 106 x 875 / 1000 = 1870 Mm3 year-1.
The Litani watershed presents an atypical morphology and hydrological behavior, linked to its
karstic geology and active tectonics. The river takes its source north of the Bekaa plain, near
Baalbek in Haouch el Barada (altitude 1000 m). The 170 km long river follows its course
towards the South, parallel to the chain of Mount Lebanon, which is interrupted halfway by
the Qaraaoun reservoir. It enters the reservoir at an altitude of 850 m and comes out at 800
m to flow into the Mediterranean Sea at Kasmiyeh by making a right-angled turn at the
occasion of a transverse fault in the chain of Mount Lebanon Figure II-1. 5.
Figure II-1. 5: The geomorphology of the two sub-basins of the Litani River Basin: The Upper Litani River Basin from Baalbek
to Qaraaoun (ULRB) and the Lower Litani River Basin from Qaraaoun reservoir to the Mediterranean Sea at Kasmieh (LLRB)
(Nehme et al., 2014).
Mapa 3D satellite images ©2021 Google
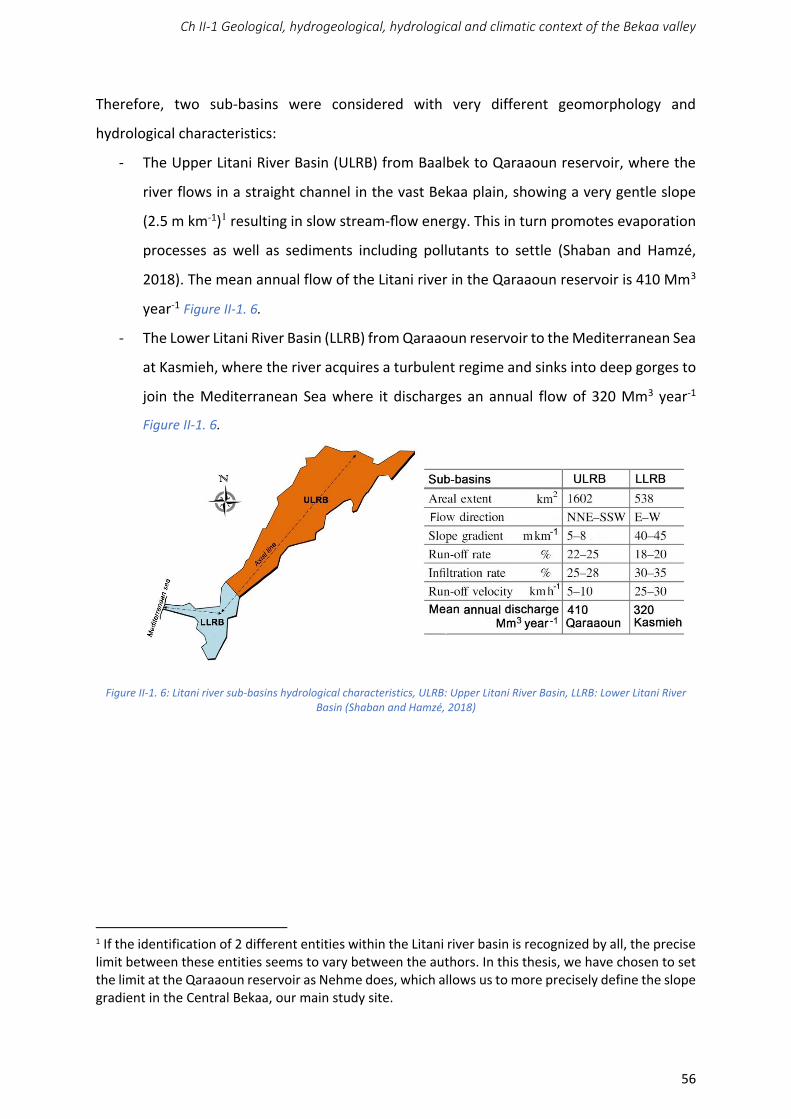
Ch II-1 Geological, hydrogeological, hydrological and climatic context of the Bekaa valley
56
Therefore, two sub-basins were considered with very different geomorphology and
hydrological characteristics:
- The Upper Litani River Basin (ULRB) from Baalbek to Qaraaoun reservoir, where the
river flows in a straight channel in the vast Bekaa plain, showing a very gentle slope
(2.5 m km-1)1 resulting in slow stream-flow energy. This in turn promotes evaporation
processes as well as sediments including pollutants to settle (Shaban and Hamzé,
2018). The mean annual flow of the Litani river in the Qaraaoun reservoir is 410 Mm3
year-1 Figure II-1. 6.
- The Lower Litani River Basin (LLRB) from Qaraaoun reservoir to the Mediterranean Sea
at Kasmieh, where the river acquires a turbulent regime and sinks into deep gorges to
join the Mediterranean Sea where it discharges an annual flow of 320 Mm3 year-1
Figure II-1. 6.
Figure II-1. 6: Litani river sub-basins hydrological characteristics, ULRB: Upper Litani River Basin, LLRB: Lower Litani River
Basin (Shaban and Hamzé, 2018)
1 If the identification of 2 different entities within the Litani river basin is recognized by all, the precise limit between these entities seems to vary between the authors. In this thesis, we have chosen to set the limit at the Qaraaoun reservoir as Nehme does, which allows us to more precisely define the slope gradient in the Central Bekaa, our main study site.
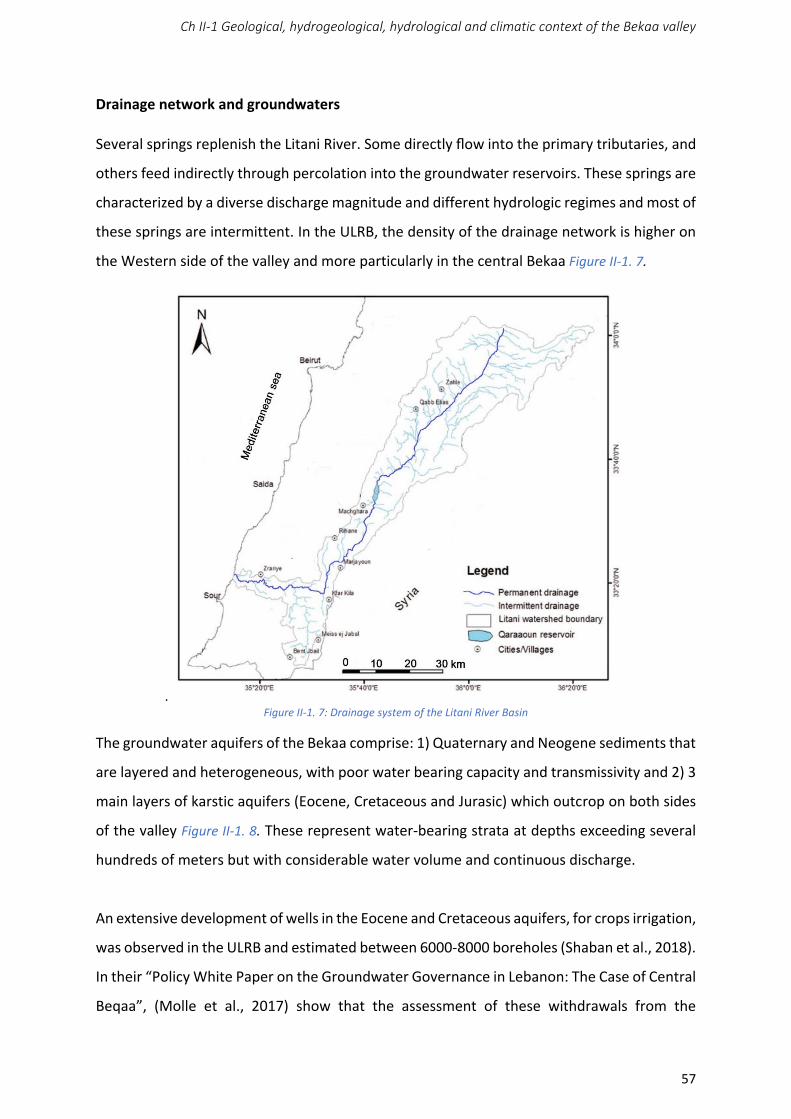
Ch II-1 Geological, hydrogeological, hydrological and climatic context of the Bekaa valley
57
Drainage network and groundwaters
Several springs replenish the Litani River. Some directly flow into the primary tributaries, and
others feed indirectly through percolation into the groundwater reservoirs. These springs are
characterized by a diverse discharge magnitude and different hydrologic regimes and most of
these springs are intermittent. In the ULRB, the density of the drainage network is higher on
the Western side of the valley and more particularly in the central Bekaa Figure II-1. 7.
. Figure II-1. 7: Drainage system of the Litani River Basin
The groundwater aquifers of the Bekaa comprise: 1) Quaternary and Neogene sediments that
are layered and heterogeneous, with poor water bearing capacity and transmissivity and 2) 3
main layers of karstic aquifers (Eocene, Cretaceous and Jurasic) which outcrop on both sides
of the valley Figure II-1. 8. These represent water-bearing strata at depths exceeding several
hundreds of meters but with considerable water volume and continuous discharge.
An extensive development of wells in the Eocene and Cretaceous aquifers, for crops irrigation,
was observed in the ULRB and estimated between 6000-8000 boreholes (Shaban et al., 2018).
In their “Policy White Paper on the Groundwater Governance in Lebanon: The Case of Central
Beqaa”, (Molle et al., 2017) show that the assessment of these withdrawals from the
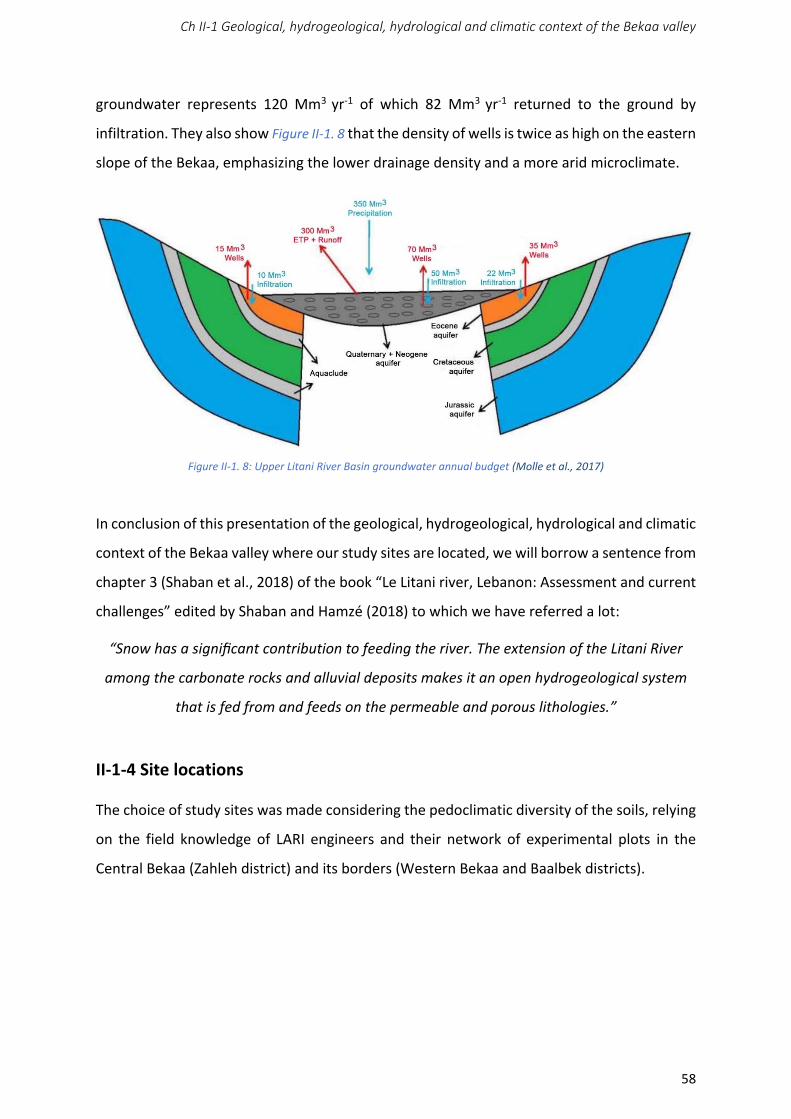
Ch II-1 Geological, hydrogeological, hydrological and climatic context of the Bekaa valley
58
groundwater represents 120 Mm3 yr-1 of which 82 Mm3 yr-1 returned to the ground by
infiltration. They also show Figure II-1. 8 that the density of wells is twice as high on the eastern
slope of the Bekaa, emphasizing the lower drainage density and a more arid microclimate.
Figure II-1. 8: Upper Litani River Basin groundwater annual budget (Molle et al., 2017)
In conclusion of this presentation of the geological, hydrogeological, hydrological and climatic
context of the Bekaa valley where our study sites are located, we will borrow a sentence from
chapter 3 (Shaban et al., 2018) of the book “Le Litani river, Lebanon: Assessment and current
challenges” edited by Shaban and Hamzé (2018) to which we have referred a lot:
“Snow has a significant contribution to feeding the river. The extension of the Litani River
among the carbonate rocks and alluvial deposits makes it an open hydrogeological system
that is fed from and feeds on the permeable and porous lithologies.”
II-1-4 Site locations
The choice of study sites was made considering the pedoclimatic diversity of the soils, relying
on the field knowledge of LARI engineers and their network of experimental plots in the
Central Bekaa (Zahleh district) and its borders (Western Bekaa and Baalbek districts).
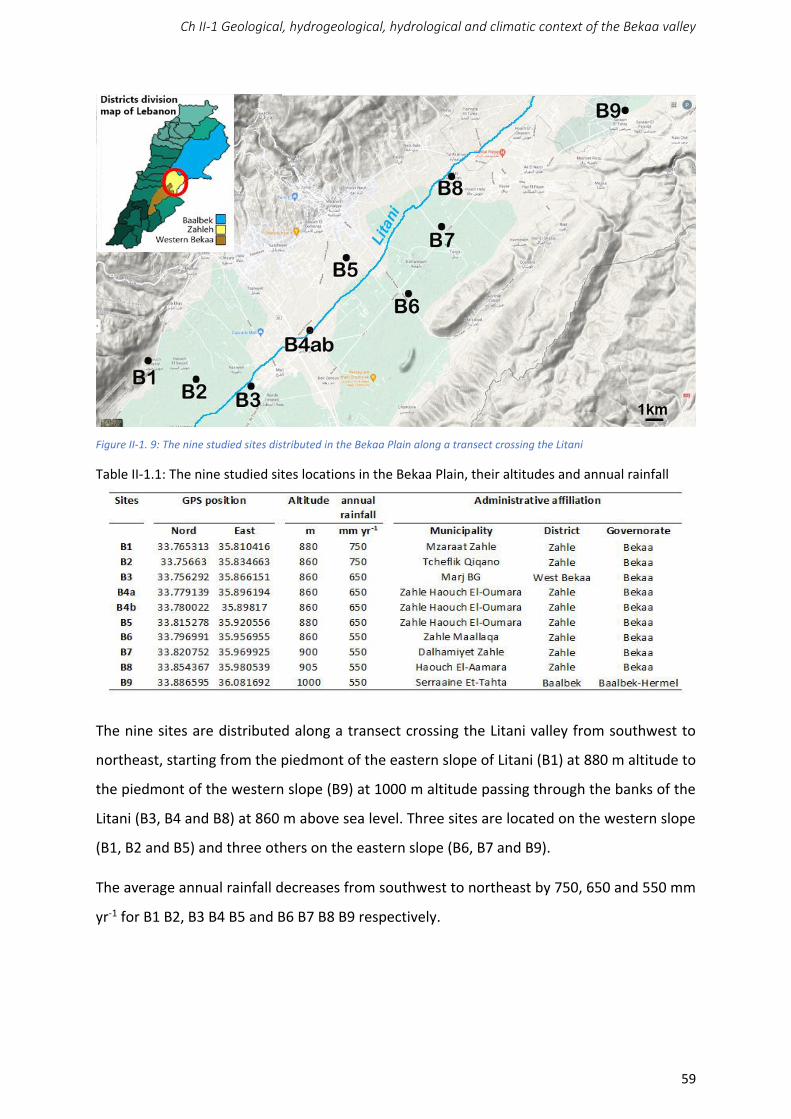
Ch II-1 Geological, hydrogeological, hydrological and climatic context of the Bekaa valley
59
Figure II-1. 9: The nine studied sites distributed in the Bekaa Plain along a transect crossing the Litani
Table II-1.1: The nine studied sites locations in the Bekaa Plain, their altitudes and annual rainfall
The nine sites are distributed along a transect crossing the Litani valley from southwest to
northeast, starting from the piedmont of the eastern slope of Litani (B1) at 880 m altitude to
the piedmont of the western slope (B9) at 1000 m altitude passing through the banks of the
Litani (B3, B4 and B8) at 860 m above sea level. Three sites are located on the western slope
(B1, B2 and B5) and three others on the eastern slope (B6, B7 and B9).
The average annual rainfall decreases from southwest to northeast by 750, 650 and 550 mm
yr-1 for B1 B2, B3 B4 B5 and B6 B7 B8 B9 respectively.
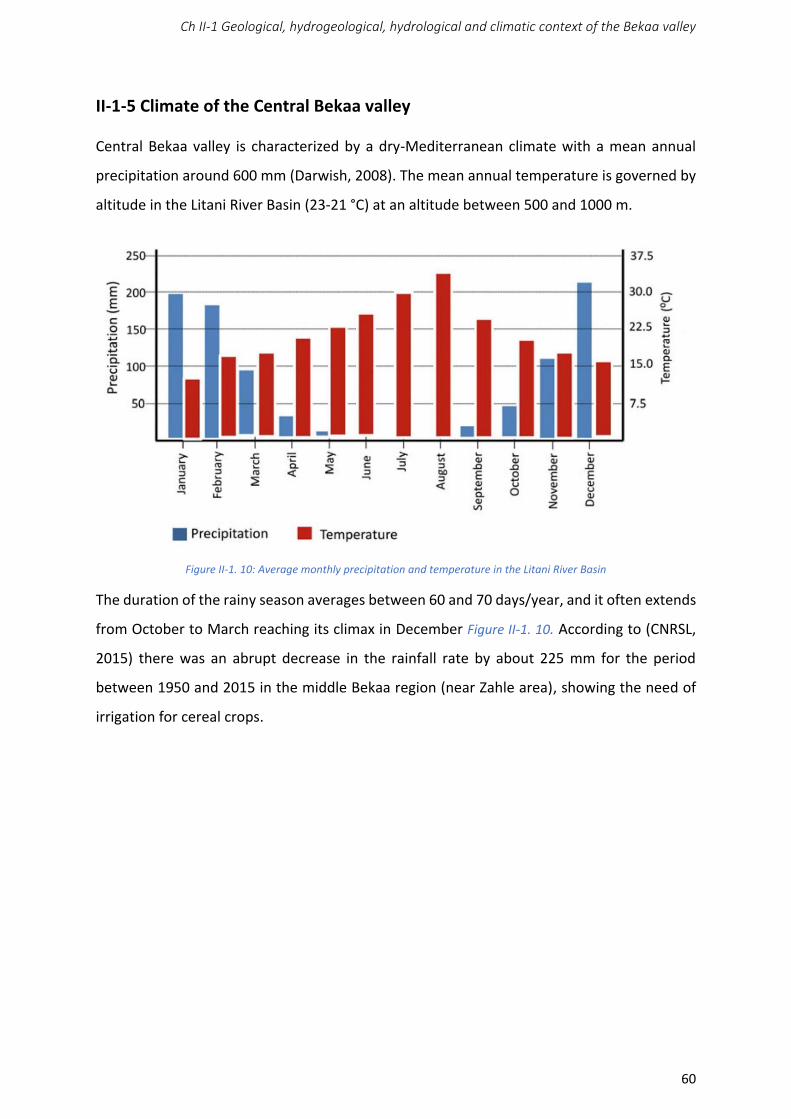
Ch II-1 Geological, hydrogeological, hydrological and climatic context of the Bekaa valley
60
II-1-5 Climate of the Central Bekaa valley
Central Bekaa valley is characterized by a dry-Mediterranean climate with a mean annual
precipitation around 600 mm (Darwish, 2008). The mean annual temperature is governed by
altitude in the Litani River Basin (23-21 °C) at an altitude between 500 and 1000 m.
Figure II-1. 10: Average monthly precipitation and temperature in the Litani River Basin
The duration of the rainy season averages between 60 and 70 days/year, and it often extends
from October to March reaching its climax in December Figure II-1. 10. According to (CNRSL,
2015) there was an abrupt decrease in the rainfall rate by about 225 mm for the period
between 1950 and 2015 in the middle Bekaa region (near Zahle area), showing the need of
irrigation for cereal crops.

Ch II-2 The studied matrices
61
CHAPTER II-2
The studied matrices
Ch II-2 The studied matrices
62
II-2.1 Soil samples
II-2.1.1 Sampling
The French norm “AFNOR NF X 31-427 standard” was applied to the soil samples collection
and respective wheat plants. In each plot, the topsoil layer (0-20 cm) was sampled, during
harvesting period (from the last week of May and the first week of June), using a stainless-
steel shovel at the corners, in the center and diagonally. The obtained 9 subsamples of each
plot were mixed, homogenized, and carried in a clean coded polyethylene bag. The collected
soil samples were brought the same day to LARI laboratories.
A quartering technique was applied to the overall homogenized sample to reduce the sample
size and form a composite sample. A soil sample of almost 1 kg will undergo the pre-
treatment.
The cleaned soil samples were dried according to the AFNOR NF X31-102 standard 24 in an
oven (Model 700 Memmert) at 40°C, until constant weight. Then soil samples were sieved at
2 mm and stored in plastic bottles in the refrigerator protected from the direct sunlight and
at a temperature below 4°C until analysis.
II-2.1.2 Physico chemical parameters of soil
The physico-chemical parameters of soil samples were measured as per the adopted norms.
They were determined to characterize the studied soils and to evaluate their effect on the
content and mobility of Tes in the soil. They included pH, conductivity (EC), soil texture, total
organic carbon, total limestone, active limestone, Available phosphorus (Olsen method) and
Exchangeable bases (EB).
II-2.1.2.1 Determination of soil pH
The method for measuring the pH (H2O) of soil samples prepared for analysis adopted follows
the AFNOR NF X 31-101 standard, it is an electrometric method. Where a mass of 40 g of
prepared soil sample is mixed with 100 mL of mineralized water, then stirred at 35-45 rpm for
one hour at room temperature of 20 ± 2°C. The mixture is allowed to stand for 30 minutes to
settle. Then the same process is repeated.
The “electron corporation Orion 5 star” thermo model pH meter is used for pH measurement.
Ch II-2 The studied matrices
63
II-2.1.2.2 Determination of electrical conductivity EC
The electrometric method of measuring EC in soil samples is carried out according to ISO
11265: 1994. The soil sample is extracted in an extraction ratio of 1: 5 (m/V) with water at a
temperature of (20 ± 2)°C in order to dissolve the electrolytes. The specific electrical
conductivity of the extract is measured at a temperature of 25°C.
The treated soil sample for pH measurement is used for measuring the electrical conductivity
of the supernatant using a “Thermo” model connectimeter.
II-2.1.2.3 Soil texture
The soil texture is determined using the modified Bouyoucos method (Beretta, 2014). A
volume of 50 mL of sodium hexametaphosphate solution (5%) was mixed to 50 g of soil
sample in a stirring-cup. Then 5 mL of H2O2 was added and the mixture was stirred for 20
minutes at high speed. Distilled water is added to the mixture and a first reading of
temperature and density is taken. After exactly 2 hours, a second reading is made. These
readings allowed us to determine the % of clay and silt, while the % of sand was calculated by
the difference of both %. The soil texture is determined by referring to the texture triangle.
II-2.1.2.4 Determination of soil organic matter content (SOM)
The method used is carried out according to the AFNOR NF X 31-109 standard. The WALKEY
and BLACK method was applied, by adding a known quantity of an oxidant to the soil under
well-defined conditions. In laboratory, SOM is oxidized by a mixture of potassium dichromate
and H2SO4. The excess potassium dichromate is titrated with a solution of ammoniacal ferrous
sulphate (AFS) FeSO4, (NH4)2SO4,6H2O. The organic matter content is evaluated by the organic
carbon thus determined.
The procedure consists of 2 steps, an oxidation step: in which 10 mL of potassium dichromate
(0.2 M) is added to 0.5-1 g of soil and 20 mL of sulphuric acid H2SO4, concentrated. For a
complete oxidation, the mixture was left 30minutes at room temperature. And a titration
step: a spatula of sodium fluoride NaF is then added to the mixture, and left until it cools. A
volume of 1 to 2 mL of the indicator diphenylamine was added to obtain a dark blue colour.
The titration was done by a standard solution of AFS.
Ch II-2 The studied matrices
64
II-2.1.2.5 Determination of total limestone
The method used follows the AFNOR NF X 31-105 standard. This method consists in a
volumetric determination of carbon dioxide (CO2) released under the action of a strong acid
(hydrochloric acid HCl 6N) at room temperature. A 0.3 to 0.5 g soil sample was weighed using
an analytical balance, to evaluate the carbonate content according to the BERNARD
calcimeter method, where 10 mL of HCl 6N were used.
II-2.1.2.6 Determination of active limestone content
The method used follows the AFNOR NF X 31-106 standard. Its purpose is to assess the
content of active limestone in soil samples prepared for analysis. Where the calcium fraction
presents in carbonates is precipitated by an ammonium oxalate solution. The method
adopted is the DROUINEAU method which covers an interval of 0 to 13% of active limestone.
It consists on the determination of the amount of unreacted ammonium oxalate following a
titration with a known concentration of potassium permanganate solution in the presence of
sulfuric acid.
An extraction took place before analysis following this procedure: A volume of 100 mL of
ammonium oxalate 0.2 N was added to 1 g of soil and agitated for 2 hours in a rocker stirrer,
at temperature between 18 and 22°C. The obtained substrate was filtered by filtered paper
and collected in a dry container. For analysis, 100 mL of demineralized water and 5 mL of
concentrated H2SO4 were added to 10 mL of filtrate, which were carried out on a hotplate at
70°C. A titration with potassium permanganate KMnO4 0.02N was performed. A blank test is
measured under the same conditions.
II-2.1.2.7 Determination of the available phosphorus content (Olsen method)
The available phosphorus content was determined per Olsen method by extraction using the
sodium bicarbonate (0.5 N; pH 8.5) for a fraction of 1/20 (mass/volume).
The phosphate extracted from 1.2 to 1.4 g of soil by using 25 mL of sodium bicarbonate
solution NaHCO3 through the phosphomolybdate method. After 30min shaking and filtration
of the substrate, the blue molybdophosphate complex was formed in a H2SO4 matrix and
reduced by ascorbic acid and catalyzed by antimony potassium tartrate. The absorbance was
measured by spectrophotometer at a wavelength of 282 nm. The standard solutions for
Ch II-2 The studied matrices
65
phosphorus were prepared from a solution of 2 ppm and NaHCO3 obtained from Sigma –
Aldrich. A UV/Vis spectrophotometer type “Metertech SP 80001” was used for P
determination.
II-2.1.2.8 Determination of exchangeable bases: K+, Na+, Ca2+ and Mg2+
The method used follows the AFNOR NF X 31-108 standard. Its aim is to determine the
content of exchangeable bases by ammonium acetate (1 mol L-1) at pH 7 (free of carbonates)
in soil samples after extraction by stirring with a mixing ratio. Extraction at 1/20 (m / V)
followed by filtration.
The determination of the exchangeable cations K+ and Na+ flame is by emission spectrometry,
while the exchangeable cations Ca2+ and Mg2+ by complexometric titration with EDTA.
The determination of the content of exchangeable K+ and Na+ is carried out by adding 50 mL
of neutral ammonium acetate to 5 g of soil, the mixture is then stirred with a rocker stirrer
for 45 minutes. A filtration by using filter paper was performed. The filtrate is used for the
determination of K+ and Na+ by a flame photometer of the “BioTech Engineering Management
Co. LTD” type at a wavelength of 766.5 nm. Calibration curves of 3 standards. Of
concentrations 5, 10 and 15 ppm, were prepared from a solution of 100 ppm of KCl and NaCl.
The demineralized water was used as a blank.
The determination of the Ca2+ and Mg2+ contents were carried out by a complexometric assay
with EDTA after extraction of the cations exchangeable with ammonium acetate. This is the
most common and reliable method
For the determination of Ca2+ alone, a 10 mL aliquot was diluted to approximately 100 mL
with distilled water. Then a volume of 10 mL of NaOH, 5N was added in order to bring the pH
to 12.0. A spatula of a colored indicator of pink color “murexide” was added. The mixture was
then titrated with a solution of EDTA, 0.005N in order to have a persistent purple color.
For the determination of Ca2+ and Mg2+, the same method was applied as that mentioned
before, but 1mL of the colored indicator “metallochrome” of bright red color was used there.
Titration with EDTA, 0.005N done until a persistent green color appears.
Ch II-2 The studied matrices
66
II-2.1.3 Trace elements determination in soil samples
The pre-treatment of soil samples consists of fine grinding with mortar and sieving to a
diameter < 250 µm, according to standard NF ISO 11464. Two methods of digestion were used
in order to mineralize a representative part of the composite soil samples after samples
preparation. Where the first consists of using three-acid mixture (9 mL HNO3, 2 mL HClO4, and
2 mL H2SO4) and named by “HAD” or the heating 3 acids digestion. This mixture was added to
0.5 g of soil sample or CRM, and heated up to 350°C for 2h 30min in a heating block. After
that, the mixture was stored an overnight at room temperature. The second method, known
as “MSD” or the microwave sulphuric digestion, consists of the microwave usage, by adding
9 mL of H2SO4 and 3ml of H2O2 to 0.5 g of soil sample or CRM in a Teflon receptacle tightly
closed. A microwave, type “Milestone – Ethos Plus”, power of 1000 W was reached in 10 min
and maintained at this level 10 min. Then, the power decreased gradually to 0 W, where the
cooling step was maintained for 20 min. This method was suggested by Milestone and was
subjected to a validation. After digestion, all samples were filtered and adjusted to 25 mL
using HNO3 1% before TEs analysis. The calibration standard solutions were prepared by
successive dilution using HNO3, 1%; all plastic lab ware used for sampling and sample
treatment was new or cleaned by soaking 24h first in 10% HNO3 then in ultra-pure water.
The TEs analysis was conducted by Atomic Absorption Spectrometry (flame iCE 3000 series
Thermo type, Thermo Fischer Scientific, Germany) for soil samples. Where liquid samples
were introduced in the spectrometer with an auto sampler using blank and standards for the
analysis of the following elements: As, Cd, Co, Cr, Cu, Ni and Pb. An acetylene/air flame was
used. A direct mercury analyser, DMA-80 Milestone (Sorisole, Italy) was used for a direct
measurement in soil samples. For the official or reference method for TEs analysis in soil, a
total digestion method was used by adding an acid mixture of 5mL of HF and 1.5 mL of HclO4
to 0.25 g of soil following the standard ISO 14869-1. The elements: Co, Cr, Cu and Ni were
then analyzed by Inductively Coupled Plasma Atomic Emission Spectroscopy (ICP-AES)
following the standard ISO 22036, while As, Cd and Pb were analyzed by Inductively Coupled
Plasma Mass Spectrometry (ICP-MS) following the standard ISO 17294-2.
Ch II-2 The studied matrices
67
II-2.1.4 Silicon determination
For silicon analysis, the protocol of the “Silicate test – MERK” kit was applied for soil samples
preparation. Where, a mass of 1-2 g of each soil sample was weighed exactly into
polyethylene tubes in triplicates. Twenty ml of CaCl2 SIGMA-ALDRICH, ≥ 97 % was added to
each tube and stirred for 16 h by “LABINCO” type rotary agitator, then centrifuged for 10 min
at 4000 rpm. This step is followed by filtration using syringe and Whatman 0.2 m cellulose
acetate filter. Samples were stored in polyethylene tubes in refrigerator at 4°C before Si
measurement. The analysis of Si was carried out by Molecular Absorption Spectrophotometry
“Thermo” type at a wavelength of 820 nm.
II-2.2 Wheat samples
II-2.2.1 Wheat plant production
Wheat cultivated plots were chosen from farms monitored by engineers from the Lebanese
Agronomic Research Institute (LARI). The choice of wheat varieties grown and the fertilization
and amendment practices are those recommended by local agrobusiness companies or
agricultural cooperatives. Irrigation practices combine withdrawals from the deep
groundwater (deep wells) and traditional withdrawals from surface waters: rivers and
irrigation canals.
The measurements and samples taken on the plant were carried out over two consecutive
climatic years (June 2016 and June 2017).
The chosen wheat varieties, of durum and soft wheat, in our study were released and
controlled by LARI. The durum wheat varieties: “Icarasha” and “Miki” were chosen, given their
high seeding rate (250 kg ha−1) and drought tolerance. These two cultivars were combined in
all the studied sites. While, the soft wheat variety “Naama 12”, has specific characteristics for
the Lebanese bread preparation according to the specifications requested by Lebanese flour
mills. “Naama 12” is also cultivated in the sites B1, B5, B6, and B9 as shown in Table II-2. 1. A
survey was carried out among the farmers concerning the supplementary irrigation (wells).
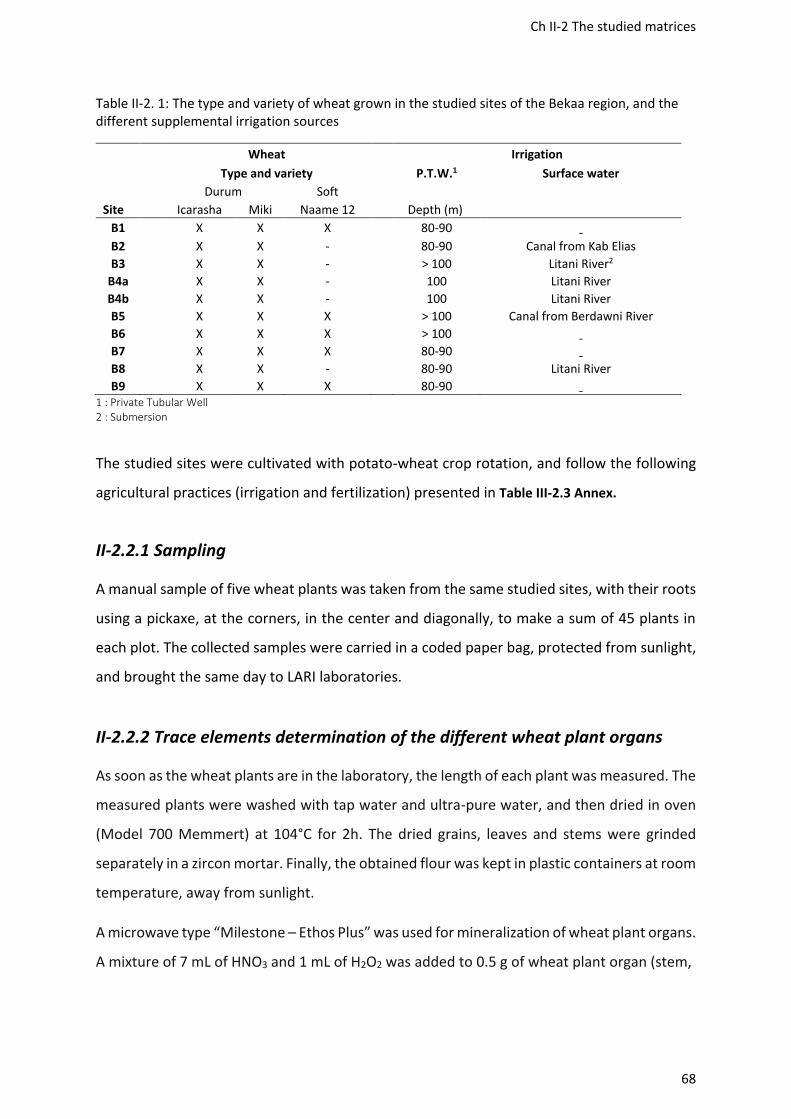
Ch II-2 The studied matrices
68
Table II-2. 1: The type and variety of wheat grown in the studied sites of the Bekaa region, and the different supplemental irrigation sources
Site
Wheat Irrigation
Type and variety P.T.W.1 Surface water
Durum Soft Icarasha Miki Naame 12 Depth (m)
B1 X X X 80-90 ˍ
B2 X X - 80-90 Canal from Kab Elias
B3 X X - > 100 Litani River2
B4a X X - 100 Litani River
B4b X X - 100 Litani River
B5 X X X > 100 Canal from Berdawni River
B6 X X X > 100 ˍ
B7 X X X 80-90 ˍ
B8 X X - 80-90 Litani River
B9 X X X 80-90 ˍ 1 : Private Tubular Well
2 : Submersion
The studied sites were cultivated with potato-wheat crop rotation, and follow the following
agricultural practices (irrigation and fertilization) presented in Table III-2.3 Annex.
II-2.2.1 Sampling
A manual sample of five wheat plants was taken from the same studied sites, with their roots
using a pickaxe, at the corners, in the center and diagonally, to make a sum of 45 plants in
each plot. The collected samples were carried in a coded paper bag, protected from sunlight,
and brought the same day to LARI laboratories.
II-2.2.2 Trace elements determination of the different wheat plant organs
As soon as the wheat plants are in the laboratory, the length of each plant was measured. The
measured plants were washed with tap water and ultra-pure water, and then dried in oven
(Model 700 Memmert) at 104°C for 2h. The dried grains, leaves and stems were grinded
separately in a zircon mortar. Finally, the obtained flour was kept in plastic containers at room
temperature, away from sunlight.
A microwave type “Milestone – Ethos Plus” was used for mineralization of wheat plant organs.
A mixture of 7 mL of HNO3 and 1 mL of H2O2 was added to 0.5 g of wheat plant organ (stem,
Ch II-2 The studied matrices
69
leaf, and seed) directly in a Teflon receptacle and digested in triplicate. Same as soil samples,
all wheat samples were filtered and adjusted to 25 mL using HNO3 1% after digestion and
before TEs analysis. The Teflon bombs underwent, after each use, to an acid treatment by
immersion in a 10% dilute HNO3 solution.
The same elements as for soil samples were measured in wheat plant organs by using Atomic
Absorption Spectrometer, Zeeman Graphite Furnace GF95Z, Thermo Electron Corporation M
series. Each sample was analyzed in triplicate.
Mercury was analysed by direct mercury analyzer DMA 80 Milestone (Sorisole, Italy) using 0.1
g of soil sample and wheat plant organ sample.
II-2.3 Irrigation water samples
A supplemental irrigation is applied during drought periods, by using private wells. These
wells are deep tube wells, where water is lifted with the help of a pumping set operated by
electricity.
The irrigation water sampling was carried out in November 2016 (rainfed period). The
collected samples from the studied sites B1, B2, B3, B4a, B4b, B5, B8, and B9 were brought to
the laboratory in 1.5 L plastic bottles, protected from the direct sunlight and at a temperature
below 4°C (in the refrigerator) until TEs analysis.
The determination of the following elements: As, Cd, Co, Ni, Pb and Hg in irrigation water
samples was performed by using the Atomic Absorption Spectrometer (AAS, Stafford House,
UK) Zeeman Graphite Furnace GF95Z Thermo Electron corporation M series. The element
mercury was analyzed by direct mercury analyzer DMA 80 Milestone (Sorisole, Italy) using 0.1
g of irrigation water sample. Each sample was analyzed in triplicate. To guarantee the method
reliability, a certified reference material (CRM; BCR-610) was analyzed at the same time as
samples. The recovery percentages obtained for the reference material were 110.8% for As,
91.3% for Cd, and 102.7% for Pb.
Ch II-2 The studied matrices
70
II-2.4 Bread samples
II-2.4.1 Survey of Lebanese bread consumption
A daily consumption of Lebanese pita bread survey was conducted on a target sample of 1000
individuals. This survey was carried out in 5 regions covering the entire Lebanese territory.
The present work used a cross-sectional study plan. Where participants were recruited using
a four-stage stratified cluster sampling method.
The sampling was based on the distribution of the Lebanese population in governorates: 41%
in Mount Lebanon, 20% in the north of Lebanon, including Akkar, 17% in the south of
Lebanon, including Nabatieh, 13% in the Bekaa including Baalbeck and Hermel, and 9% in
Beirut.
Individuals were equally distributed between men and women and grouped as follows: 800
adults (> 15 years old) and 200 young people (between 6 and 15 years old) (CAS, 2017).
Indeed, Lebanese residents are 49.7% Women and 50.3% men; regarding age, 24% of them
are less than or equal to 14 years old (CAS,2017).
A team of 8 data collectors trained and managed by a supervisor, collected the data in a period
of about two-month from April 14th, 2017 – June 5th 2017. The questionnaire was filled in 50
supermarkets around the country, all over the day by 1000 individuals. It required
approximately 7 minutes of time to be answered. The collectors interviewed face-to-face the
participants in each supermarket, filling instantly the questionnaire online by using an
electronic tablet.
The questionnaire composed of 4 pages, with a first introductive page, where the collectors
can find out if the participants were eligible for the study according to the following criteria:
if they were Lebanese, had lived at least fifteen years from the date of the survey, consumed
Lebanese bread for the same predefined period and had no chronic or serious illness.
Otherwise, children should meet the third criteria only; their answers were given by their
parents. The 2nd and the 3rd containing 44 questions and figures such as the size of Lebanese
pita bread, divided into 3 parts: Part 1. Consumption of Lebanese bread, Part 2.
Sociodemographic data, and Part 3. State of health. And a final page explaining the intensity
and measurement of physical activity which is characterized by the frequency, intensity,
duration and type of practice that define the amount of physical activity in a space-time (day,
Ch II-2 The studied matrices
71
week, etc.). Finally, 992 Lebanese consumers who completed all measures were enrolled in
this conducted study. The collected answers were transmitted in the “iSurvey” application for
data harmonization. The questionnaire is presented in Annex 1. The results of the survey were
used to determine the three most consumed brands of Lebanese white bread, among the 49
brands that are sold with different sales values in the Lebanese market and are distributed
among the Lebanese governorates.
II-2.4.2 Trace elements determination in bread samples
Accordingly, the sampling of these brands was carried out in Lebanese supermarkets to assess
the exposure of the Lebanese to seven TEs through the consumption of bread. The sampling
plan has been drawn up in accordance with European Commission regulation (EC) No
333/2007 modified by Regulation (EU) No 836/2011 and on the establishment of methods of
sampling and methods of analysis for the official control of lead, cadmium, mercury, tin
contents inorganic, 3-MCPD and benzo (a) pyrene in food.
The collected samples have been labelled B1, B2, and B3. From each selected brand, three
randomly sampled bags were collected and brought to the laboratory. Each bread bag had
seven pitas where three were randomly picked. Each pita was cut into 12 circular sectors with
a plastic knife on a polyethylene plate to prevent TEs contamination. Two pieces were
randomly drawn for analysis, to finally have 18 circular pita pieces for each brand (3 bags x 3
pitas x 2 pieces). Then these pita pieces were ground into powder using an agate mortar.
Samples of 0.5 g each were directly weighed after grinding in 50 mL Teflon tube. Then, 7 mL
of concentrated HNO3 and 1 mL of H2O2 were added to the preparation. The Teflon bombs
were closed and placed in the digester at 200°C for 15min (1000 W). Once the Teflon tubes
had cooled for at least 45 min, 3 mL HNO3 1% before the trace elements analysis. Each sample
was digested in triplicate.
The TEs (As, Co, Cd, Cr, Pb, and Ni) analysis in bread samples was performed using an Atomic
Absorption Spectrometer (AAS, Stafford House, UK) Zeeman Graphite Furnace GF95Z Thermo
Electron Corporation M series. Each digested sample was analysed in triplicate.
Ch II-2 The studied matrices
72
The certified reference material (CRM; BCR-191) underwent the same digestion protocol and
was analysed at the same time as the pita samples, to guarantee the method reliability. The
recovery percentages obtained for CRM were between 86 and 110%, representing 93.2%,
110.8%, 86.3%, and 110.1% respectively for Hg, Pb, Ni, and Cd. While, a spiking by a known
concentration (0.1 mg L-1) was applied before digestion for the other elements: As, Co, and Cr
which they don’t have reference materials available. The spiked bread was treated and
digested in the same way as the bread samples and analysed using an AAS. The recovery
percentages were 103.08% for As, 101.29% for Co, and 96.37% for Cr.
For Hg analysis, an acid mineralization is not required for all samples. It was analysed by direct
mercury analyzer DMA-80 Milestone (Sorisole, Italy). A sample of 0.2 g was directly weighted
in triplicate in a nickel boat or sample holder and then introduced in a quartz furnace (staying
at drying temperature 60 sec at drying temperature: 200 °C, 105 sec at ashing temperature:
650 °C) for measurement.
II-2.4.3 Exposure determination
The exposure to TEs was calculated for each interviewee consuming Lebanese white pita
bread. By taking into consideration the quantity of bread consumed per person, the body
weight, and the metal content of the bread consumed according to the brand. The elements:
As, Cr, Co, Ni, Pb, Hg and Cd were calculated and the results were expressed in terms of
median and 95th percentile using Ms-Excel for different population categories. This exposure
was expressed in µg kg-1 of body weight per week for the elements Cd and Hg, while in
µg kg-1 of body weight per day for the elements: Cr, Co, Ni, Pb, and As.

Part III - RESULTS AND DISCUSSION
73
PART III – RESULTS AND
DISCUSSION
Part III - RESULTS AND DISCUSSION
74
In the Mediterranean region, agricultural soils are seriously polluted with toxic trace
elements (TEs) which could enter the food chain via the soil-plant trophic chain. For food
safety reasons, the monitoring of TE concentrations in these agricultural soils is thus
imperative. The most powerful monitoring method for TE measurements is based on
perchloric acid (HClO4) and hydrofluoric acid (HF) digestion, commonly used as reference
total digestion (RTD) method, with consequent use of inductively coupled plasma optical
emission spectrometry (ICP-OES) and inductively coupled plasma mass spectrometry (ICP-
MS). Unfortunately, HF and HClO4 manipulations are highly dangerous and ICP-OES and ICP-
MS apparatus are very expensive, thus they are unaffordable, notably in developing countries.
In this paper, an alternative, microwave sulphuric digestion (MSD) method, combined with
atomic absorption spectroscopy (AAS) is proposed. First, the suggested method was validated
on a soil certified reference material, for the determination of 7 TEs (As, Cd, Co, Cr, Cu, Ni and
Pb). Second, the MSD method was applied on agricultural soil samples situated in the Bekaa
valley, East Lebanon and results were compared to those of RTD method. The MSD method,
coupled to AAS, offers a promising and feasible alternative to HF, as well as, aqua regia based
methods.
Ch III-1 Validation of a new method for monitoring trace elements in Mediterranean cereal soils
75
CHAPTER III-1
Validation of a new method for
monitoring trace elements in
Mediterranean cereal soils
Ch III-1 Validation of a new method for monitoring trace elements in Mediterranean cereal soils
76
III-1.1 Introduction
Trace elements (TEs) are the most studied soil contaminants in the world, and come both
from lithogenic sources (Rivera et al., 2015) and anthropogenic activities (Shang et al., 2019).
They are persistent, non-degradable and even though some are essential for living organisms,
they can adversely affect microorganisms, animals, plants and humans at high concentrations.
As a matter of fact, TEs can accumulate in plants to harmful concentrations, becoming a threat
for human health through the food chain (Antoniadis et al., 2019b). Accurate and routine
determination of their concentration in soil is thus necessary to assess their risk to directly
and indirectly enter the food chain.
Cereal production soils in the Mediterranean basin are regularly amended with organic
matter and phosphates bearing TEs and repeatedly irrigated with untreated wastewater
(Kassir et al., 2012; Korfali and Karaki, 2018). A regular monitoring of TE concentrations in
these agricultural soils is of great interest. Arsenic, Cd, Co, Cr, Cu, Ni and Pb are the most
monitored elements based on previous studies of TE determination in cereal production soils
of the Bekaa valley, East Lebanon (Darwish, T. et al., 2008). Nevertheless, less than 6% of
Lebanese arable lands have been checked so far for TE contamination (Darwish, 2018).
Although some countries introduced the nondestructive thick target particle induced X-ray
emission technique for the determination of trace elements in as received soil samples,
digestion methods are still widely practiced (Nsouli et al., 2004). However, the heterogeneous
and complex soil matrix, associating organic compounds and mineral constituents with
different physicochemical characteristics, does not allow a single solid phase digestion
method for the determination of TEs. To be acceptable, precision and accuracy for digestion
methods should be lower than 20% (Voica et al., 2012) for any set of targeted soil to be
analysed on a routine basis.
The digestion of samples containing TEs can be done using a dry method: in this case, the
sample is calcined in an oven at temperatures ranging between 450°C and 500°C. Dry ashing
offers the advantage of requiring few reagents like acids to solubilize ashes. However, dry
ashing can lead to a loss of analytes like As and Hg by volatilization.
Ch III-1 Validation of a new method for monitoring trace elements in Mediterranean cereal soils
77
To reduce the sample preparation time and losses by volatilization, wet digestion processes
are an attractive alternative to dry ashing methods for several samples such as biological
tissues, food and soils (Antoniadis et al., 2019b; Munoz et al., 2013). In this case, the sample
is mineralized in a mixture of acid at their boiling point. Different acids are usually used to
perform the wet mineralization: hydrochloric acid (HCl), nitric acid (HNO3), sulfuric acid
(H2SO4), perchloric acid (HClO4), hydrofluoric acid (HF). Several combinations were used for
the mineralization of soil samples (Funes Pinter et al., 2018; Kabata-Pendias and Mukherjee,
2007; Lin et al., 2019; Nguyen et al., 2019) but there is no consensus on the choice of the
mineralization reagent.
It is admitted that HF combined with HClO4 allows for a total dissolution of all elements
present in the sample but induces Si volatilization. However, HF is dangerous to handle. High
precautions and safe handling should be implemented in the laboratory to prevent accidents.
Despite this, serious accidents can always occur.
To avoid handling HF, sample attacks using a mixture of other strong acids are usually adopted
in routine analysis. HNO3 has high oxidant properties, most often used in wet mineralization,
especially when the analysis step is done by atomic absorption technics (Hoenig, 2001a). Its
relatively low boiling point (120°C) limits its efficiency. Therefore, HNO3 is commonly used in
a mixture with H2SO4 or HClO4 (boiling point at 340°C and 200°C respectively). HClO4 should
be handled carefully because when its concentration exceeds 85% above 150°C, it becomes
unstable and presents a serious explosion hazard. The combination of HNO3 with HCl is well-
known as “aqua regia mixture”. It has a high dissolution power and is usually used to evaluate
the trace element contamination level (Melaku et al., 2005). Aqua regia reagent gives a
pseudo-total concentration compared with the HF total method, especially for the following
elements (Cr, Ni, Zn and Pb) (Santoro et al., 2017).
Ammonium fluoride (NH4F) and ammonium bifluoride (NH4HF2) are used as a substitute for
HF. These compounds are safer than HF for the operator and have high boiling points (260°C
and 239.5°C) allowing sample digestion at high temperature in open vessels (Zhang, 2019).
To optimize the mineralization time, microwave heating is often performed. Hydrogen
peroxide (H2O2) is largely used in mixture with strong acids for the oxidation and destruction
of organic matter (Funes Pinter et al., 2018; Lin et al., 2019a; Nguyen et al., 2019b). Its
Ch III-1 Validation of a new method for monitoring trace elements in Mediterranean cereal soils
78
oxidation power is greatly enhanced in the presence of H2SO4 due to the formation of H2SO5
(Hoenig, 2001). Recently, Magladi et al. (2019) used a mixture of NH4HF2 and HNO3 in a
microwave oven to dissolve completely a wide range of silicate rock samples for trace element
determination. Certain analytes were not fully recovered using this method which limits its
field of application.
Most often, TEs concentration in the mineralization solutions is determined using inductively
coupled plasma optical emission spectrometry (ICP-OES) and inductively coupled plasma
mass spectrometry (ICP-MS) following ISO 22036 (“ISO 22036:2008. Soil quality.
Determination of trace elements in extracts of soil by inductively coupled plasma - atomic
emission spectrometry (ICP - AES),” 2008, p. 22036) and ISO 17294-2 (“ISO 17294-2:2016.
Water quality. Application of inductively coupled plasma mass spectrometry (ICP-MS). Part 2:
Determination of selected elements including uranium isotopes,” 2016, p. 17294) standards.
These devices are very expensive and have high maintenance costs but combines low
detection limits and a rapid multi-elemental determination in comparison with atomic
absorption spectroscopy (AAS). Therefore, it is important to have available a method for TE
analysis that is safe, green, inexpensive and accessible to a large number of laboratories. In
agreement with green analytical chemistry, an eco-friendly infrared digestion method was
recently developed for multi-element determination in soil sample by microwave induced
plasma atomic emission spectrometry (MIP OES) (Cora Jofre et al., 2020). This method
minimizes the reagents amounts, makes digestion safer and reduces waste.
The choice of a sample preparation method is crucial in the analysis of soil and sediment
samples. Proper choice reduces matrix effects in complex samples and subsequently limits
spectral and non-spectral interferences. The latter involves sample-introduction and plasma
related-interferences. This last point becomes very important when using plasma-based
atomic emission like ICP-OES and IC-PMS. Nitric acid is usually used to avoid spectral
interferences caused by other acids (Bizzi et al., 2017).
In this study, two digestion methods were compared using a soil certified reference material:
1) heating 3 acid digestion (HAD) with a mixture of HNO3, HClO4 and H2SO4, and 2) microwave
sulfuric digestion (MSD) using a mixture of H2SO4 and H2O2. The latter is proposed as a green,
simple and fast method for soil sample digestion. The use of H2SO4 in sample digestion in

Ch III-1 Validation of a new method for monitoring trace elements in Mediterranean cereal soils
79
combination with H2O2 is more advantageous than the use of NH4F and NH4F2. The latter are
safer than HF but remain more dangerous than H2SO4.
The measurement of As, Cd, Co, Cr, Cu, Ni and Pb concentrations was then conducted using
a flame atomic absorption spectrometer (AAS). AAS is less efficient than the widely used
plasma-based methods (ICP-OES and ICP-MS) because it is less sensitive and only allows the
determination of single elements. However, AAS is cheaper than plasma-based methods and
is available to a large number of laboratories. A validation of the selected digestion method
was done using a certified reference material (CRM). Afterward, the validated method (MSD
+ AAS) was applied on agricultural soil samples collected from the Bekaa region, located in
Lebanon, East Mediterranean. The results were compared to those obtained using the
reference total digestion method (RTD) (HF-based digestion + ICP/ICPMS).
III-1.2 Material and methods
III-1.2.1 Chemicals
The standard solutions for the elements As, Cd, Co, Cr, Cu, Ni and Pb of concentrations 1000
± 1 mg L-1 were obtained from Sigma-Aldrich. Nitric acid HNO3 65%, extra pure, sulphuric acid
H2SO4 95% and, perchloric acid HclO4 70% and hydrogen peroxide H2O2 30%, obtained from
Sigma-Aldrich, were used for digestion. A 1% HNO3 nitric acid was prepared from
concentrated acid (65% HNO3) and was used in the standard solution preparation. Ultrapure
water (>18 MΩ cm-1) was obtained from a Milli-Q apparatus (Boeco pure, Germany). The
Certified Reference Material (CRM) (SQC001-LRAA8753) for trace elements (As, Cd, Co, Cr,
Cu, Ni and Pb) in soil was purchased from Sigma Aldrich.
III-1.2.2 Sites and sampling
Lebanon is located in the eastern Mediterranean basin between 35° and 36°40′ E and
between 33° and 34°40′ N. The Bekaa Valley, an agricultural region where more than 90% of
Lebanese wheat production is produced (FAO, 2010), is mainly a plain area located between
Mount Lebanon in the west and the Anti-Lebanon mountains to the East. Eight sites where
soil samples were taken are selected along a transect crossing the central Bekaa valley from
southwest to northeast Figure III-1. 1.The soils of the sampling sites are Eutric and Vertic
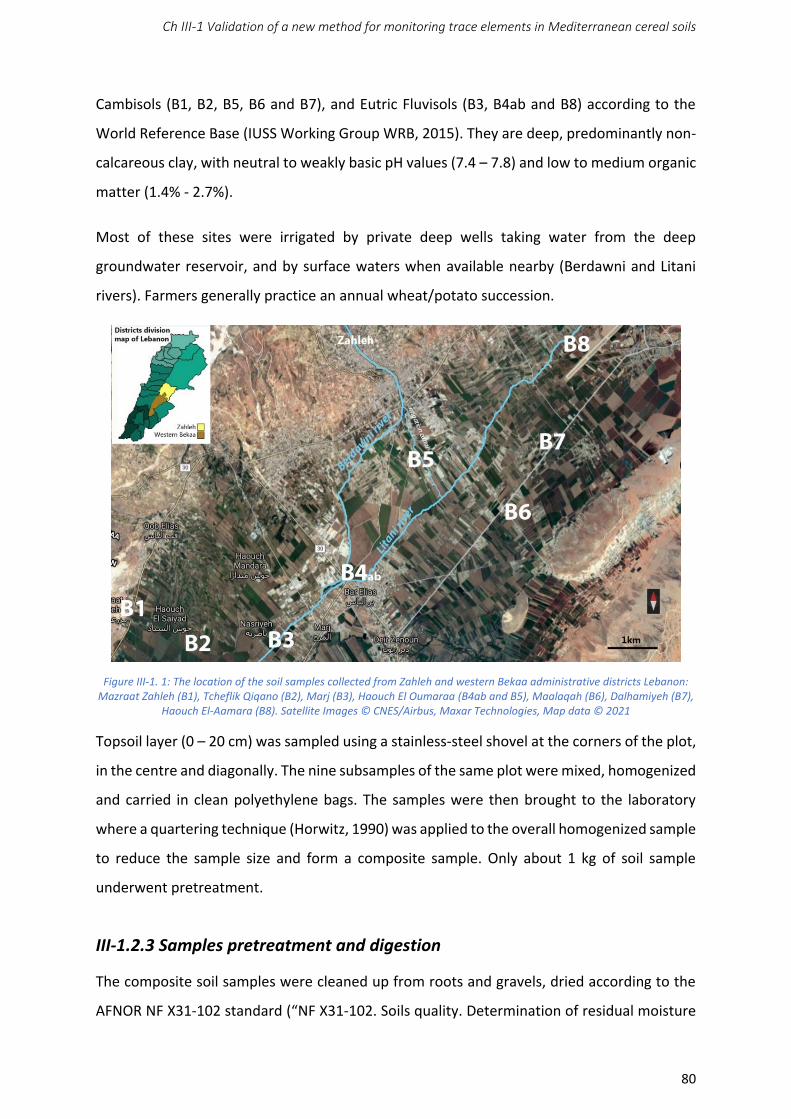
Ch III-1 Validation of a new method for monitoring trace elements in Mediterranean cereal soils
80
Cambisols (B1, B2, B5, B6 and B7), and Eutric Fluvisols (B3, B4ab and B8) according to the
World Reference Base (IUSS Working Group WRB, 2015). They are deep, predominantly non-
calcareous clay, with neutral to weakly basic pH values (7.4 – 7.8) and low to medium organic
matter (1.4% - 2.7%).
Most of these sites were irrigated by private deep wells taking water from the deep
groundwater reservoir, and by surface waters when available nearby (Berdawni and Litani
rivers). Farmers generally practice an annual wheat/potato succession.
Figure III-1. 1: The location of the soil samples collected from Zahleh and western Bekaa administrative districts Lebanon:
Mazraat Zahleh (B1), Tcheflik Qiqano (B2), Marj (B3), Haouch El Oumaraa (B4ab and B5), Maalaqah (B6), Dalhamiyeh (B7),
Haouch El-Aamara (B8). Satellite Images © CNES/Airbus, Maxar Technologies, Map data © 2021
Topsoil layer (0 – 20 cm) was sampled using a stainless-steel shovel at the corners of the plot,
in the centre and diagonally. The nine subsamples of the same plot were mixed, homogenized
and carried in clean polyethylene bags. The samples were then brought to the laboratory
where a quartering technique (Horwitz, 1990) was applied to the overall homogenized sample
to reduce the sample size and form a composite sample. Only about 1 kg of soil sample
underwent pretreatment.
III-1.2.3 Samples pretreatment and digestion
The composite soil samples were cleaned up from roots and gravels, dried according to the
AFNOR NF X31-102 standard (“NF X31-102. Soils quality. Determination of residual moisture

Ch III-1 Validation of a new method for monitoring trace elements in Mediterranean cereal soils
81
content of soils analytical test samples,” 1981, pp. 31–102) in an oven (Model 700 Memmert)
at 40°C, until constant weight and sieved at 2 mm. Then, soil samples were stored in plastic
bottles protected from the direct sunlight and at a temperature below 4°C (in the refrigerator)
until analysis.
Before mineralization, the soil samples were ground fine with a mortar and sieved (diameter
< 250 µm) following the standard NF ISO 11464 (“ISO 11464:2006. Soil quality. Pretreatment
of samples for physico-chemical analysis,” 2020, p. 2006). Two methods of digestion were
used in order to mineralize a representative part of the composite soil samples:
i) For the heating 3 acid digestion (HAD), a three-acid mixture (9 mL HNO3,
2 mL HClO4, 2 mL H2SO4) was added to 0.5 g of soil sample or CRM, followed
by heating up to 350°C for 2 h 30 min in a heating block. The mixture was
then stored at room temperature for one night.
ii) For the microwave sulphuric digestion (MSD), a microwave type
“Milestone – Ethos Easy” was used. Fifteen vessels can be processed
simultaneously This system controls the temperature in all vessels using a
direct contactless temperature sensor. An acid mixture of 9 mL of H2SO4
and 3 mL of H2O2 was added to 0.5 g of soil sample or CRM in a Teflon
receptacle tightly closed. A temperature of 200°C was reached in 10 min
and maintained at this level 10 min. Then, the temperature decreased
gradually where the cooling step was maintained for 20 min. This method
was suggested by Milestone and was subjected to a validation.
All digested samples were filtered and adjusted to 25 mL using HNO3 1% before analysis.
III-1.2.4 Apparatus for trace elements analysis
The analyses of TEs were conducted by atomic absorption spectrometry (flame iCE 3000
series – Thermo type, Thermo Fischer Scientific, Germany). An acetylene/air flame was used.
Liquid samples were introduced in the spectrometer with an auto sampler using blank and
standards for the analysis of the following elements: As, Cd, Co, Cr, Cu, Ni and Pb.
Calibration standard solutions were prepared by successive dilution, all plastic labware used
for sampling and sample treatment was new or cleaned by soaking 24 h first in 10% HNO3
then in ultra-pure water.
Ch III-1 Validation of a new method for monitoring trace elements in Mediterranean cereal soils
82
III-1.2.5 Official or reference methods for trace element analysis
For the reference total digestion (RTD) method, soil sample mineralization was done by a
mixture of HF (5 mL) and HClO4 (1.5 mL) acids added to 0.25 g previously ground soil below
250 µm following the standard ISO 14869-1 (“ISO 14869-1:2001. Soil quality. Dissolution for
the determination of total element content. Part 1: Dissolution with hydrofluoric and
perchloric acids,” 2001, p. 2001): 0.25 g of sample was transferred to a crucible and placed in
a furnace. The temperature reached progressively 450 °C over 1 h. The temperature was
maintained at 450 °C during 3h. After cooling, the ash was quantitatively transferred to a PTFE
evaporating dish with a minimum amount of water. 5 mL of HF and 1.5 mL of HClO4 were
added to the PTFE dish. The mixture was heated on a hot plate until the dense fumes of HClO4
and SiF4 cease. Before complete dryness, the dish was removed from the hot plate and
allowed to cool. 1 mL of HNO3 15 mol L-1 and 5 mL of water were added to dissolve the residue.
The latter was heated if needed to assist dissolution. The obtained solution was transferred
quantitatively to a 50 mL volumetric flask.
HF decomposes silicates to from volatile SiF4. The use of HClO4 is necessary to avoid the
precipitation of calcium in the form of fluoride (CaF2). To avoid the risks of a brutal oxidation
(acid ejection) of the organic matter (OM) by HClO4, the OM was previously destroyed by
calcining at 450°C. The hydrofluoric and perchloric acids were eliminated by evaporation at
the end of the reaction. The residue was dissolved in diluted nitric acid 2%. Trace elements
Co, Cr, Cu and Ni were then analysed by Inductively Coupled Plasma Atomic Emission
Spectroscopy (ICP-OES, Vista Pro, Varian, France) following the standard ISO 22036 (“ISO
22036:2008. Soil quality. Determination of trace elements in extracts of soil by inductively
coupled plasma - atomic emission spectrometry (ICP - AES),” 2008, p. 2008), while As, Cd and
Pb were analysed by Inductively Coupled Plasma Mass Spectrometry (ICP-MS, Thermo series
2, France) following the standard ISO 17294-2 (“ISO 17294-2:2016. Water quality. Application
of inductively coupled plasma mass spectrometry (ICP-MS). Part 2: Determination of selected
elements including uranium isotopes,” 2016, p. 17294).
Ch III-1 Validation of a new method for monitoring trace elements in Mediterranean cereal soils
83
III-1.2.6. Statistical analysis
All calculations related to the working range, linearity domain, limit of detection and limit of
quantification were realised using R-4.0.0 (R Core team, 2020) and Rstudio 1.2.5042 (RStudio
Team, 2016) with packages: “car” (Fox and Weisberg, 2018), “lmtest” (Zeileis and Hothorn,
2002) and “dplyr” (Wickham, 2020).
Analysis of variance was performed using XLSTAT 2018 to calculate repeatability and
intermediate precision.
Information about various statistical analysis are detailed in following paragraphs, especially
in section III-1.3.2.1 for working range, linearity domain, limit of detection and limit of
quantification and III-1.3.2.2 for repeatability and intermediate precision.
III-1.3 Results and Discussion
III-1.3.1 Choice of the best digestion method using the soil Certified Reference
Material CMR (SQC001)
To choose the best digestion method, the heating 3 acid digestion (HAD) and the microwave
sulfuric digestion (MSD) methods were both applied on the soil CRM (SQC001).
HNO3 is the most used acid in wet digestion. To overcome its limited efficiency due to its low
boiling point, it was used in combination with H2SO4 and HClO4 for the HAD digestion.
Moreover, HclO4 ameliorate the dissolution of sediment samples and insure a complete
recovery of trace elements (Révillon and Hureau-Mazaudier, 2009). For the MSD digestion,
H2SO4 was used because it has the highest boiling point. A mixture of H2SO4 and H2O2 was
used because H2SO4 enhances the oxidation power of H2O2.
After digestion, the TEs As, Cd, Co, Cr, Cu, Ni and Pb were determined by AAS. The relative
recovery, expressed in percentage was calculated using the following equation (Equation 1):
𝑅(%) = ��𝑥𝑟𝑒𝑓 × 100 (1)
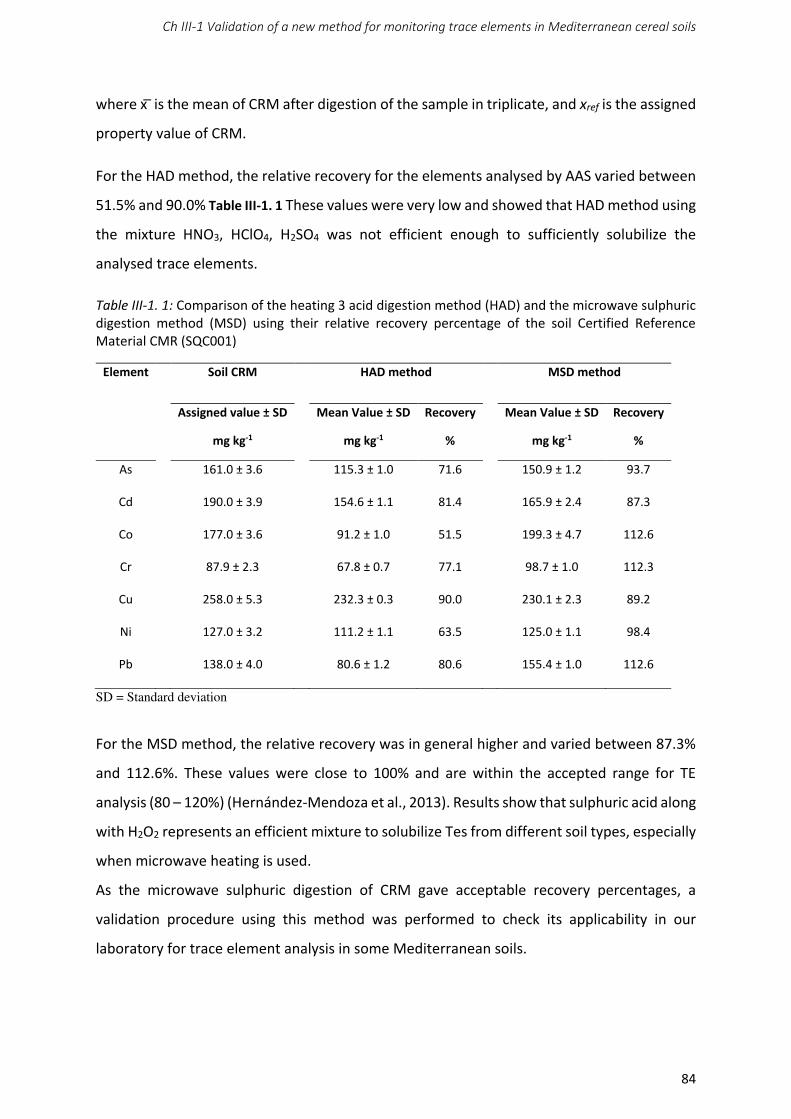
Ch III-1 Validation of a new method for monitoring trace elements in Mediterranean cereal soils
84
where x is the mean of CRM after digestion of the sample in triplicate, and xref is the assigned
property value of CRM.
For the HAD method, the relative recovery for the elements analysed by AAS varied between
51.5% and 90.0% Table III-1. 1 These values were very low and showed that HAD method using
the mixture HNO3, HClO4, H2SO4 was not efficient enough to sufficiently solubilize the
analysed trace elements.
Table III-1. 1: Comparison of the heating 3 acid digestion method (HAD) and the microwave sulphuric digestion method (MSD) using their relative recovery percentage of the soil Certified Reference Material CMR (SQC001)
Element Soil CRM HAD method MSD method
Assigned value ± SD
mg kg-1
Mean Value ± SD
mg kg-1
Recovery
%
Mean Value ± SD
mg kg-1
Recovery
%
As 161.0 ± 3.6 115.3 ± 1.0 71.6 150.9 ± 1.2 93.7
Cd 190.0 ± 3.9 154.6 ± 1.1 81.4 165.9 ± 2.4 87.3
Co 177.0 ± 3.6 91.2 ± 1.0 51.5 199.3 ± 4.7 112.6
Cr 87.9 ± 2.3 67.8 ± 0.7 77.1 98.7 ± 1.0 112.3
Cu 258.0 ± 5.3 232.3 ± 0.3 90.0 230.1 ± 2.3 89.2
Ni 127.0 ± 3.2 111.2 ± 1.1 63.5 125.0 ± 1.1 98.4
Pb 138.0 ± 4.0 80.6 ± 1.2 80.6 155.4 ± 1.0 112.6
SD = Standard deviation
For the MSD method, the relative recovery was in general higher and varied between 87.3%
and 112.6%. These values were close to 100% and are within the accepted range for TE
analysis (80 – 120%) (Hernández-Mendoza et al., 2013). Results show that sulphuric acid along
with H2O2 represents an efficient mixture to solubilize Tes from different soil types, especially
when microwave heating is used.
As the microwave sulphuric digestion of CRM gave acceptable recovery percentages, a
validation procedure using this method was performed to check its applicability in our
laboratory for trace element analysis in some Mediterranean soils.
Ch III-1 Validation of a new method for monitoring trace elements in Mediterranean cereal soils
85
III-1.3.2 Validation of the microwave sulphuric digestion method followed by
AAS using the soil Certified Reference Material CMR (SQC001)
To validate the new digestion using a mixture of H2SO4 and H2O2, before applying it for trace
element analysis in the soils, the following parameters were considered and determined:
working range including linearity, limit of detection of the analytical system (LOD), limit of
quantification (LOQ), precision including repeatability and intermediate precision, specificity
and trueness.
III-1.3.2.1 Working range, linearity domain, limit of detection (LOD) and limit of
quantification (LOQ)
The linearity of a method is often confused with the linearity of the instrument calibration
function. In fact, the linearity of a method characterizes its accuracy, whereas instrumental
linearity is concerned only with its own response. However, a response function does not
have to be linear for correct quantification. Many methods make effective use of calibration
models that are much more complex than just linearity (Gardiner, 1997; Hibbert and Gooding,
2005).
Calibration curves for each measured element were built using 4 or 5 points, depending on
the element, each point was triplicated. For some elements, quadratic regression y = 0 + 1x
+ 2x2 + gave better results and for some others, the best fit model was linear regression: y
= 0 + 1x + . It can happen when wide dynamic ranges and/or not isotopically pure internal
standards are considered (especially true in mass spectrometry) (Lavagnini and Magno, 2007).
The independent variable x is assumed unaffected by error. 0, 1, and 2 are the parameters
of the model and represents a normally distributed random error, with mean zero and
constant variance 2 [homoscedastic condition and 𝜀~𝒩(0, 𝜎2)] . The parameters are
unknown and ordinary least-squares regression provides their estimates “b” by using a set of
experimental data points (xi, yi).
The adequacy of the model has been tested in several ways: (i) by the use of an analysis of
variance test (ANOVA) called the lack of fit test (with replicate data); (ii) by inspection of the
behaviour of the residuals and (iii) by the evaluation of the determination coefficient R2
(square of correlation coefficient r). Models and main results of ANOVA tests are summarized
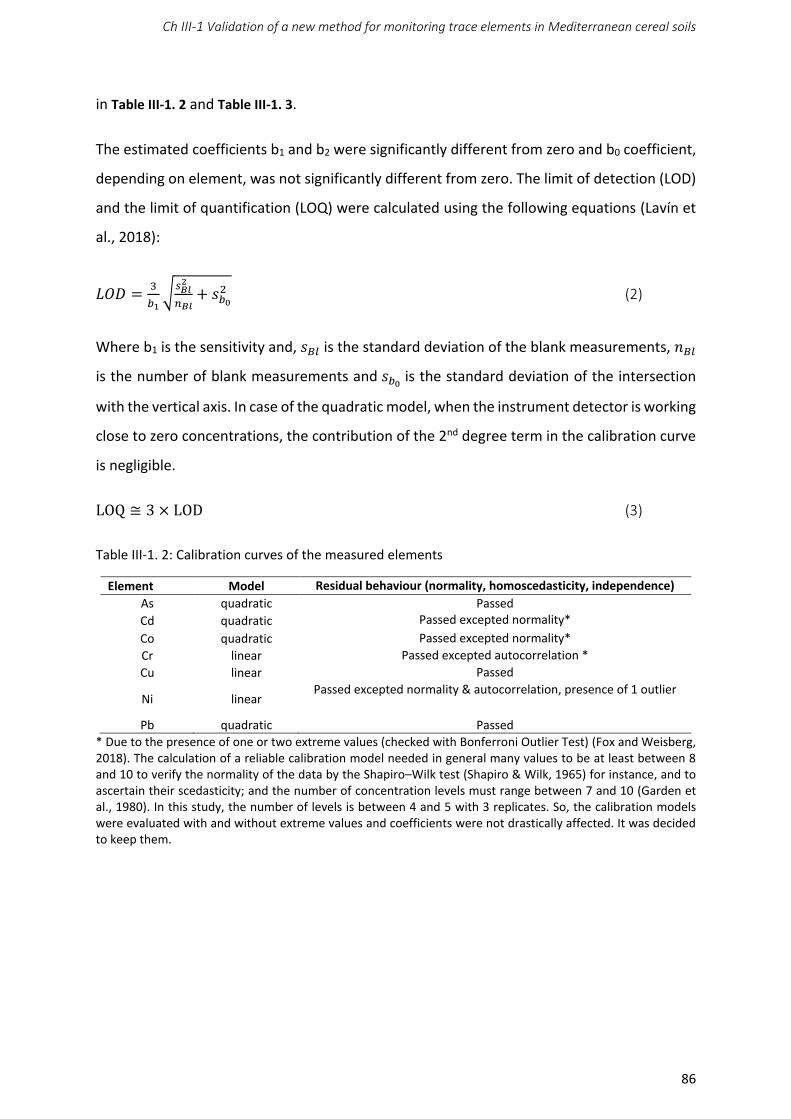
Ch III-1 Validation of a new method for monitoring trace elements in Mediterranean cereal soils
86
in Table III-1. 2 and Table III-1. 3.
The estimated coefficients b1 and b2 were significantly different from zero and b0 coefficient,
depending on element, was not significantly different from zero. The limit of detection (LOD)
and the limit of quantification (LOQ) were calculated using the following equations (Lavín et
al., 2018):
𝐿𝑂𝐷 = 3𝑏1 √𝑠𝐵𝑙2𝑛𝐵𝑙 + 𝑠𝑏02 (2)
Where b1 is the sensitivity and, 𝑠𝐵𝑙 is the standard deviation of the blank measurements, 𝑛𝐵𝑙 is the number of blank measurements and 𝑠𝑏0 is the standard deviation of the intersection
with the vertical axis. In case of the quadratic model, when the instrument detector is working
close to zero concentrations, the contribution of the 2nd degree term in the calibration curve
is negligible.
LOQ ≅ 3 × LOD (3)
Table III-1. 2: Calibration curves of the measured elements
Element Model Residual behaviour (normality, homoscedasticity, independence)
As quadratic Passed
Cd quadratic Passed excepted normality*
Co quadratic Passed excepted normality*
Cr linear Passed excepted autocorrelation *
Cu linear Passed
Ni linear Passed excepted normality & autocorrelation, presence of 1 outlier
Pb quadratic Passed
* Due to the presence of one or two extreme values (checked with Bonferroni Outlier Test) (Fox and Weisberg, 2018). The calculation of a reliable calibration model needed in general many values to be at least between 8 and 10 to verify the normality of the data by the Shapiro–Wilk test (Shapiro & Wilk, 1965) for instance, and to ascertain their scedasticity; and the number of concentration levels must range between 7 and 10 (Garden et al., 1980). In this study, the number of levels is between 4 and 5 with 3 replicates. So, the calibration models were evaluated with and without extreme values and coefficients were not drastically affected. It was decided to keep them.
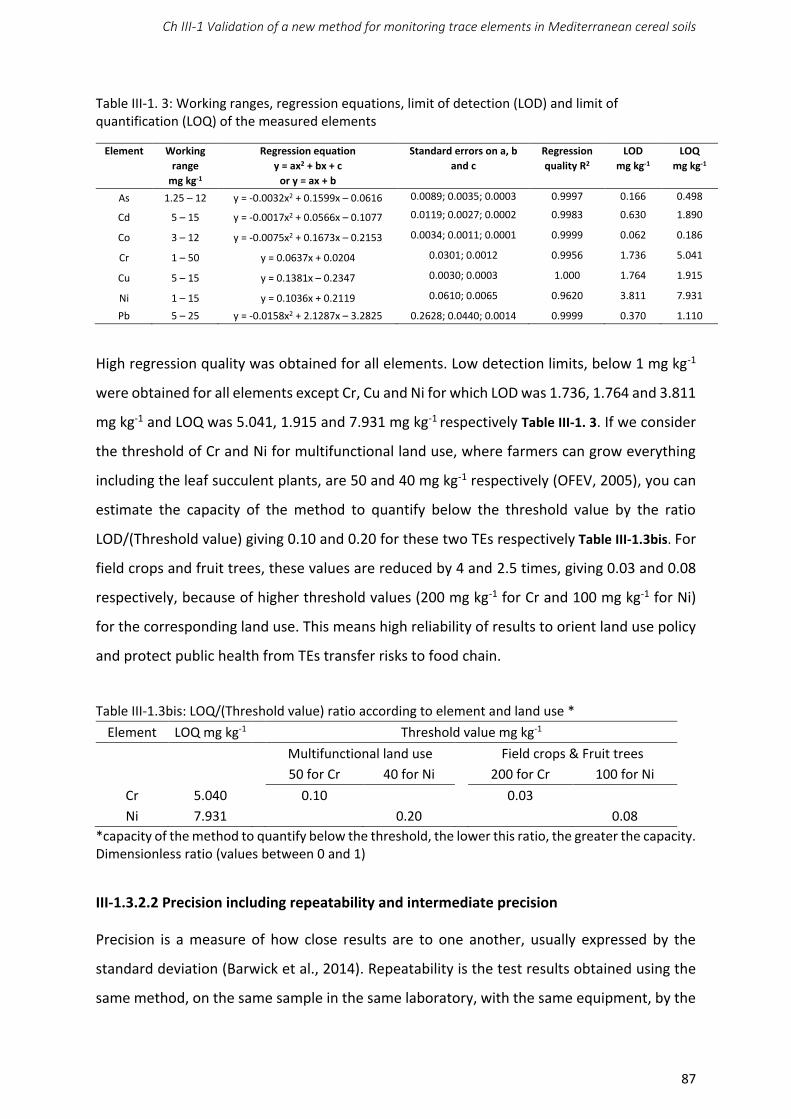
Ch III-1 Validation of a new method for monitoring trace elements in Mediterranean cereal soils
87
Table III-1. 3: Working ranges, regression equations, limit of detection (LOD) and limit of quantification (LOQ) of the measured elements
Element Working
range
mg kg-1
Regression equation
y = ax2 + bx + c
or y = ax + b
Standard errors on a, b
and c
Regression
quality R2
LOD
mg kg-1
LOQ
mg kg-1
As 1.25 – 12 y = -0.0032x2 + 0.1599x – 0.0616 0.0089; 0.0035; 0.0003 0.9997 0.166 0.498
Cd 5 – 15 y = -0.0017x2 + 0.0566x – 0.1077 0.0119; 0.0027; 0.0002 0.9983 0.630 1.890
Co 3 – 12 y = -0.0075x2 + 0.1673x – 0.2153 0.0034; 0.0011; 0.0001 0.9999 0.062 0.186
Cr 1 – 50 y = 0.0637x + 0.0204 0.0301; 0.0012 0.9956 1.736 5.041
Cu 5 – 15 y = 0.1381x – 0.2347 0.0030; 0.0003 1.000 1.764 1.915
Ni 1 – 15 y = 0.1036x + 0.2119 0.0610; 0.0065 0.9620 3.811 7.931
Pb 5 – 25 y = -0.0158x2 + 2.1287x – 3.2825 0.2628; 0.0440; 0.0014 0.9999 0.370 1.110
High regression quality was obtained for all elements. Low detection limits, below 1 mg kg-1
were obtained for all elements except Cr, Cu and Ni for which LOD was 1.736, 1.764 and 3.811
mg kg-1 and LOQ was 5.041, 1.915 and 7.931 mg kg-1 respectively Table III-1. 3. If we consider
the threshold of Cr and Ni for multifunctional land use, where farmers can grow everything
including the leaf succulent plants, are 50 and 40 mg kg-1 respectively (OFEV, 2005), you can
estimate the capacity of the method to quantify below the threshold value by the ratio
LOD/(Threshold value) giving 0.10 and 0.20 for these two TEs respectively Table III-1.3bis. For
field crops and fruit trees, these values are reduced by 4 and 2.5 times, giving 0.03 and 0.08
respectively, because of higher threshold values (200 mg kg-1 for Cr and 100 mg kg-1 for Ni)
for the corresponding land use. This means high reliability of results to orient land use policy
and protect public health from TEs transfer risks to food chain.
Table III-1.3bis: LOQ/(Threshold value) ratio according to element and land use *
Element LOQ mg kg-1 Threshold value mg kg-1 Multifunctional land use Field crops & Fruit trees 50 for Cr 40 for Ni 200 for Cr 100 for Ni
Cr 5.040 0.10 0.03
Ni 7.931 0.20 0.08
*capacity of the method to quantify below the threshold, the lower this ratio, the greater the capacity. Dimensionless ratio (values between 0 and 1)
III-1.3.2.2 Precision including repeatability and intermediate precision
Precision is a measure of how close results are to one another, usually expressed by the
standard deviation (Barwick et al., 2014). Repeatability is the test results obtained using the
same method, on the same sample in the same laboratory, with the same equipment, by the
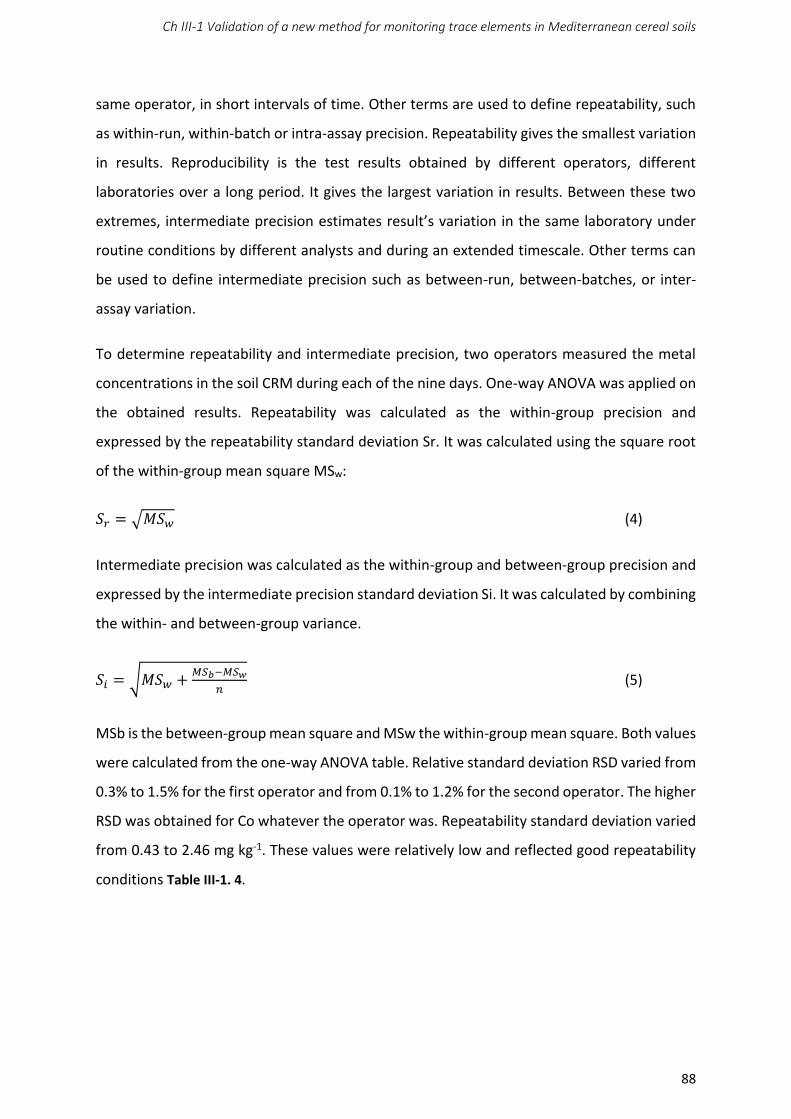
Ch III-1 Validation of a new method for monitoring trace elements in Mediterranean cereal soils
88
same operator, in short intervals of time. Other terms are used to define repeatability, such
as within-run, within-batch or intra-assay precision. Repeatability gives the smallest variation
in results. Reproducibility is the test results obtained by different operators, different
laboratories over a long period. It gives the largest variation in results. Between these two
extremes, intermediate precision estimates result’s variation in the same laboratory under
routine conditions by different analysts and during an extended timescale. Other terms can
be used to define intermediate precision such as between-run, between-batches, or inter-
assay variation.
To determine repeatability and intermediate precision, two operators measured the metal
concentrations in the soil CRM during each of the nine days. One-way ANOVA was applied on
the obtained results. Repeatability was calculated as the within-group precision and
expressed by the repeatability standard deviation Sr. It was calculated using the square root
of the within-group mean square MSw:
𝑆𝑟 = √𝑀𝑆𝑤 (4)
Intermediate precision was calculated as the within-group and between-group precision and
expressed by the intermediate precision standard deviation Si. It was calculated by combining
the within- and between-group variance.
𝑆𝑖 = √𝑀𝑆𝑤 + 𝑀𝑆𝑏−𝑀𝑆𝑤𝑛 (5)
MSb is the between-group mean square and MSw the within-group mean square. Both values
were calculated from the one-way ANOVA table. Relative standard deviation RSD varied from
0.3% to 1.5% for the first operator and from 0.1% to 1.2% for the second operator. The higher
RSD was obtained for Co whatever the operator was. Repeatability standard deviation varied
from 0.43 to 2.46 mg kg-1. These values were relatively low and reflected good repeatability
conditions Table III-1. 4.
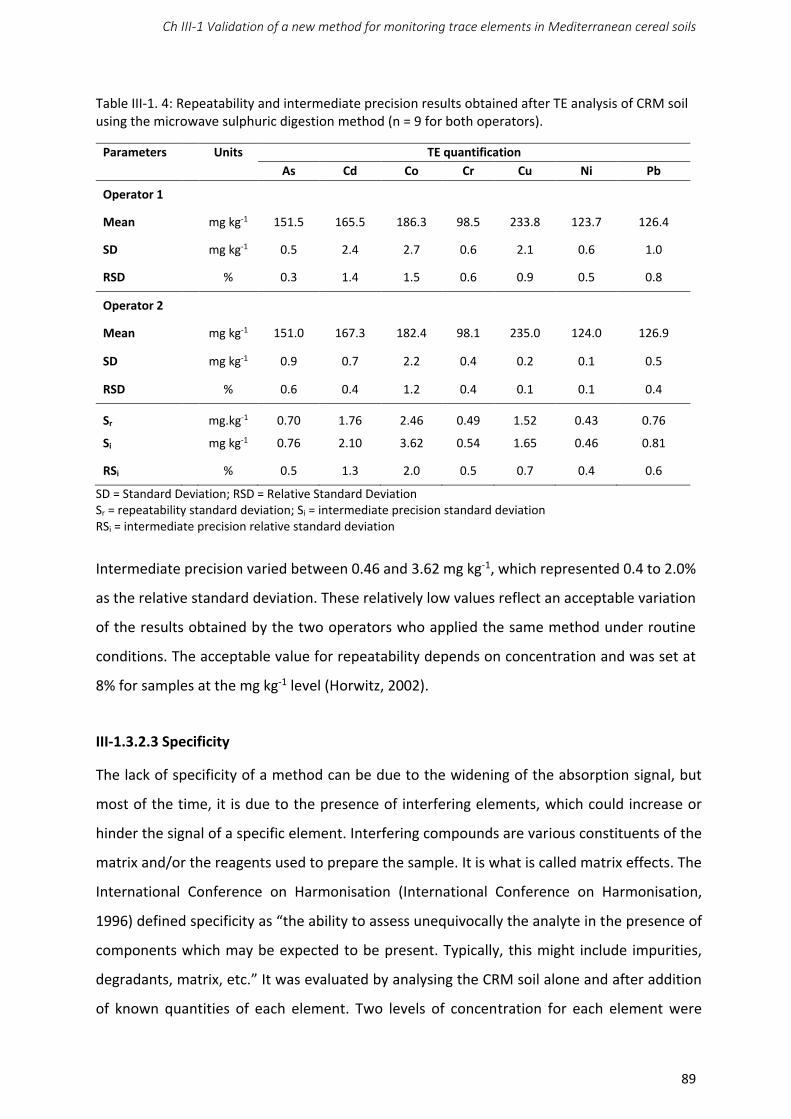
Ch III-1 Validation of a new method for monitoring trace elements in Mediterranean cereal soils
89
Table III-1. 4: Repeatability and intermediate precision results obtained after TE analysis of CRM soil using the microwave sulphuric digestion method (n = 9 for both operators).
Parameters Units TE quantification
As Cd Co Cr Cu Ni Pb
Operator 1
Mean mg kg-1 151.5 165.5 186.3 98.5 233.8 123.7 126.4
SD mg kg-1 0.5 2.4 2.7 0.6 2.1 0.6 1.0
RSD % 0.3 1.4 1.5 0.6 0.9 0.5 0.8
Operator 2
Mean mg kg-1 151.0 167.3 182.4 98.1 235.0 124.0 126.9
SD mg kg-1 0.9 0.7 2.2 0.4 0.2 0.1 0.5
RSD % 0.6 0.4 1.2 0.4 0.1 0.1 0.4
Sr mg.kg-1 0.70 1.76 2.46 0.49 1.52 0.43 0.76
Si mg kg-1 0.76 2.10 3.62 0.54 1.65 0.46 0.81
RSi % 0.5 1.3 2.0 0.5 0.7 0.4 0.6
SD = Standard Deviation; RSD = Relative Standard Deviation Sr = repeatability standard deviation; Si = intermediate precision standard deviation RSi = intermediate precision relative standard deviation
Intermediate precision varied between 0.46 and 3.62 mg kg-1, which represented 0.4 to 2.0%
as the relative standard deviation. These relatively low values reflect an acceptable variation
of the results obtained by the two operators who applied the same method under routine
conditions. The acceptable value for repeatability depends on concentration and was set at
8% for samples at the mg kg-1 level (Horwitz, 2002).
III-1.3.2.3 Specificity
The lack of specificity of a method can be due to the widening of the absorption signal, but
most of the time, it is due to the presence of interfering elements, which could increase or
hinder the signal of a specific element. Interfering compounds are various constituents of the
matrix and/or the reagents used to prepare the sample. It is what is called matrix effects. The
International Conference on Harmonisation (International Conference on Harmonisation,
1996) defined specificity as “the ability to assess unequivocally the analyte in the presence of
components which may be expected to be present. Typically, this might include impurities,
degradants, matrix, etc.” It was evaluated by analysing the CRM soil alone and after addition
of known quantities of each element. Two levels of concentration for each element were
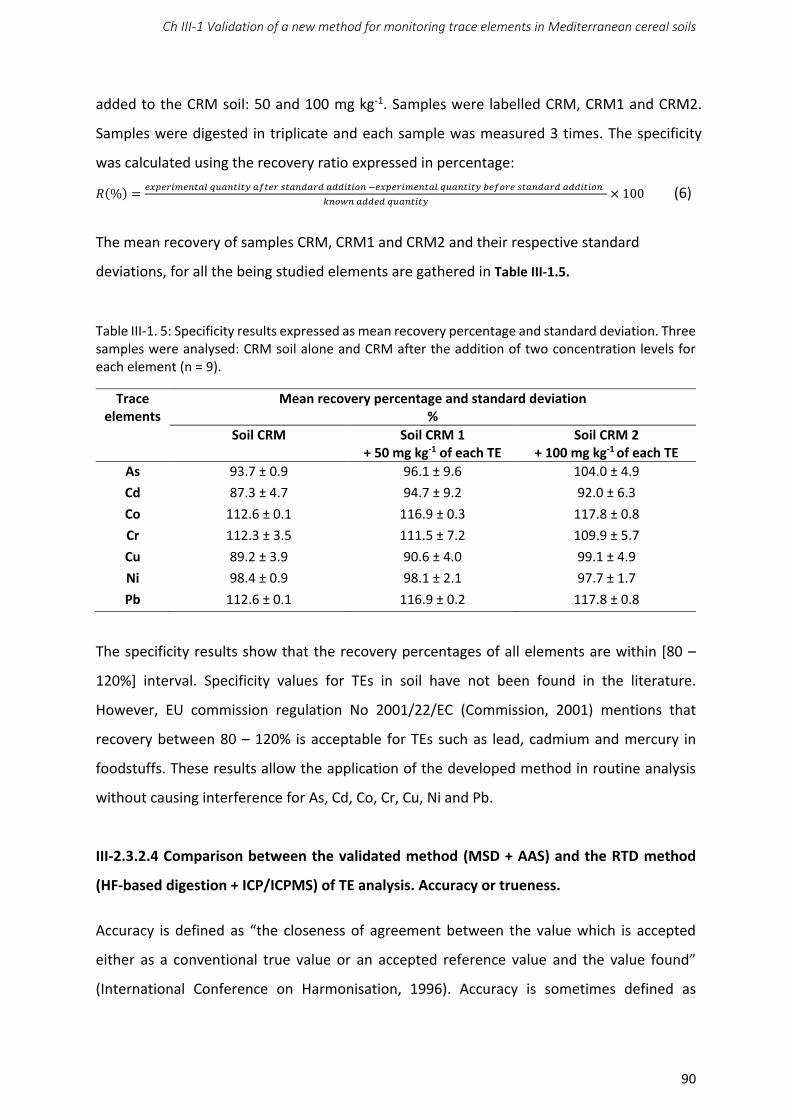
Ch III-1 Validation of a new method for monitoring trace elements in Mediterranean cereal soils
90
added to the CRM soil: 50 and 100 mg kg-1. Samples were labelled CRM, CRM1 and CRM2.
Samples were digested in triplicate and each sample was measured 3 times. The specificity
was calculated using the recovery ratio expressed in percentage: 𝑅(%) = 𝑒𝑥𝑝𝑒𝑟𝑖𝑚𝑒𝑛𝑡𝑎𝑙 𝑞𝑢𝑎𝑛𝑡𝑖𝑡𝑦 𝑎𝑓𝑡𝑒𝑟 𝑠𝑡𝑎𝑛𝑑𝑎𝑟𝑑 𝑎𝑑𝑑𝑖𝑡𝑖𝑜𝑛 −𝑒𝑥𝑝𝑒𝑟𝑖𝑚𝑒𝑛𝑡𝑎𝑙 𝑞𝑢𝑎𝑛𝑡𝑖𝑡𝑦 𝑏𝑒𝑓𝑜𝑟𝑒 𝑠𝑡𝑎𝑛𝑑𝑎𝑟𝑑 𝑎𝑑𝑑𝑖𝑡𝑖𝑜𝑛 𝑘𝑛𝑜𝑤𝑛 𝑎𝑑𝑑𝑒𝑑 𝑞𝑢𝑎𝑛𝑡𝑖𝑡𝑦 × 100 (6)
The mean recovery of samples CRM, CRM1 and CRM2 and their respective standard
deviations, for all the being studied elements are gathered in Table III-1.5.
Table III-1. 5: Specificity results expressed as mean recovery percentage and standard deviation. Three samples were analysed: CRM soil alone and CRM after the addition of two concentration levels for each element (n = 9).
Trace elements
Mean recovery percentage and standard deviation %
Soil CRM
Soil CRM 1 + 50 mg kg-1 of each TE
Soil CRM 2 + 100 mg kg-1 of each TE
As 93.7 ± 0.9 96.1 ± 9.6 104.0 ± 4.9
Cd 87.3 ± 4.7 94.7 ± 9.2 92.0 ± 6.3
Co 112.6 ± 0.1 116.9 ± 0.3 117.8 ± 0.8
Cr 112.3 ± 3.5 111.5 ± 7.2 109.9 ± 5.7
Cu 89.2 ± 3.9 90.6 ± 4.0 99.1 ± 4.9
Ni 98.4 ± 0.9 98.1 ± 2.1 97.7 ± 1.7
Pb 112.6 ± 0.1 116.9 ± 0.2 117.8 ± 0.8
The specificity results show that the recovery percentages of all elements are within [80 –
120%] interval. Specificity values for TEs in soil have not been found in the literature.
However, EU commission regulation No 2001/22/EC (Commission, 2001) mentions that
recovery between 80 – 120% is acceptable for TEs such as lead, cadmium and mercury in
foodstuffs. These results allow the application of the developed method in routine analysis
without causing interference for As, Cd, Co, Cr, Cu, Ni and Pb.
III-2.3.2.4 Comparison between the validated method (MSD + AAS) and the RTD method
(HF-based digestion + ICP/ICPMS) of TE analysis. Accuracy or trueness.
Accuracy is defined as “the closeness of agreement between the value which is accepted
either as a conventional true value or an accepted reference value and the value found”
(International Conference on Harmonisation, 1996). Accuracy is sometimes defined as
Ch III-1 Validation of a new method for monitoring trace elements in Mediterranean cereal soils
91
trueness. Accuracy can be determined by analysing a CRM and comparing the experimental
value to the assigned value. It is actually what we did in paragraph 3.1 where we obtained
recovery percentages between 87 and 112%. Another way to assess accuracy is to work on
real samples, to analyse them by the method being validated and to compare results with
that obtained from a reference method. In this study, TEs in soil samples from the Bekaa
governorate were determined by an MSD method using a mixture of H2SO4 and H2O2 followed
by AAS measurements. Microwave digestion and element analysis were done in triplicate.
Results from this method were compared to an external ISO reference which is the RTD
method where the same samples were digested by HF and HclO4 and analysed by ICP-AES or
ICP-MS. The RTD method allows for total digestion of soil samples.
Results were compared in terms of recovery percentage calculated using equation 1. They are
presented in Table III-1. 6.
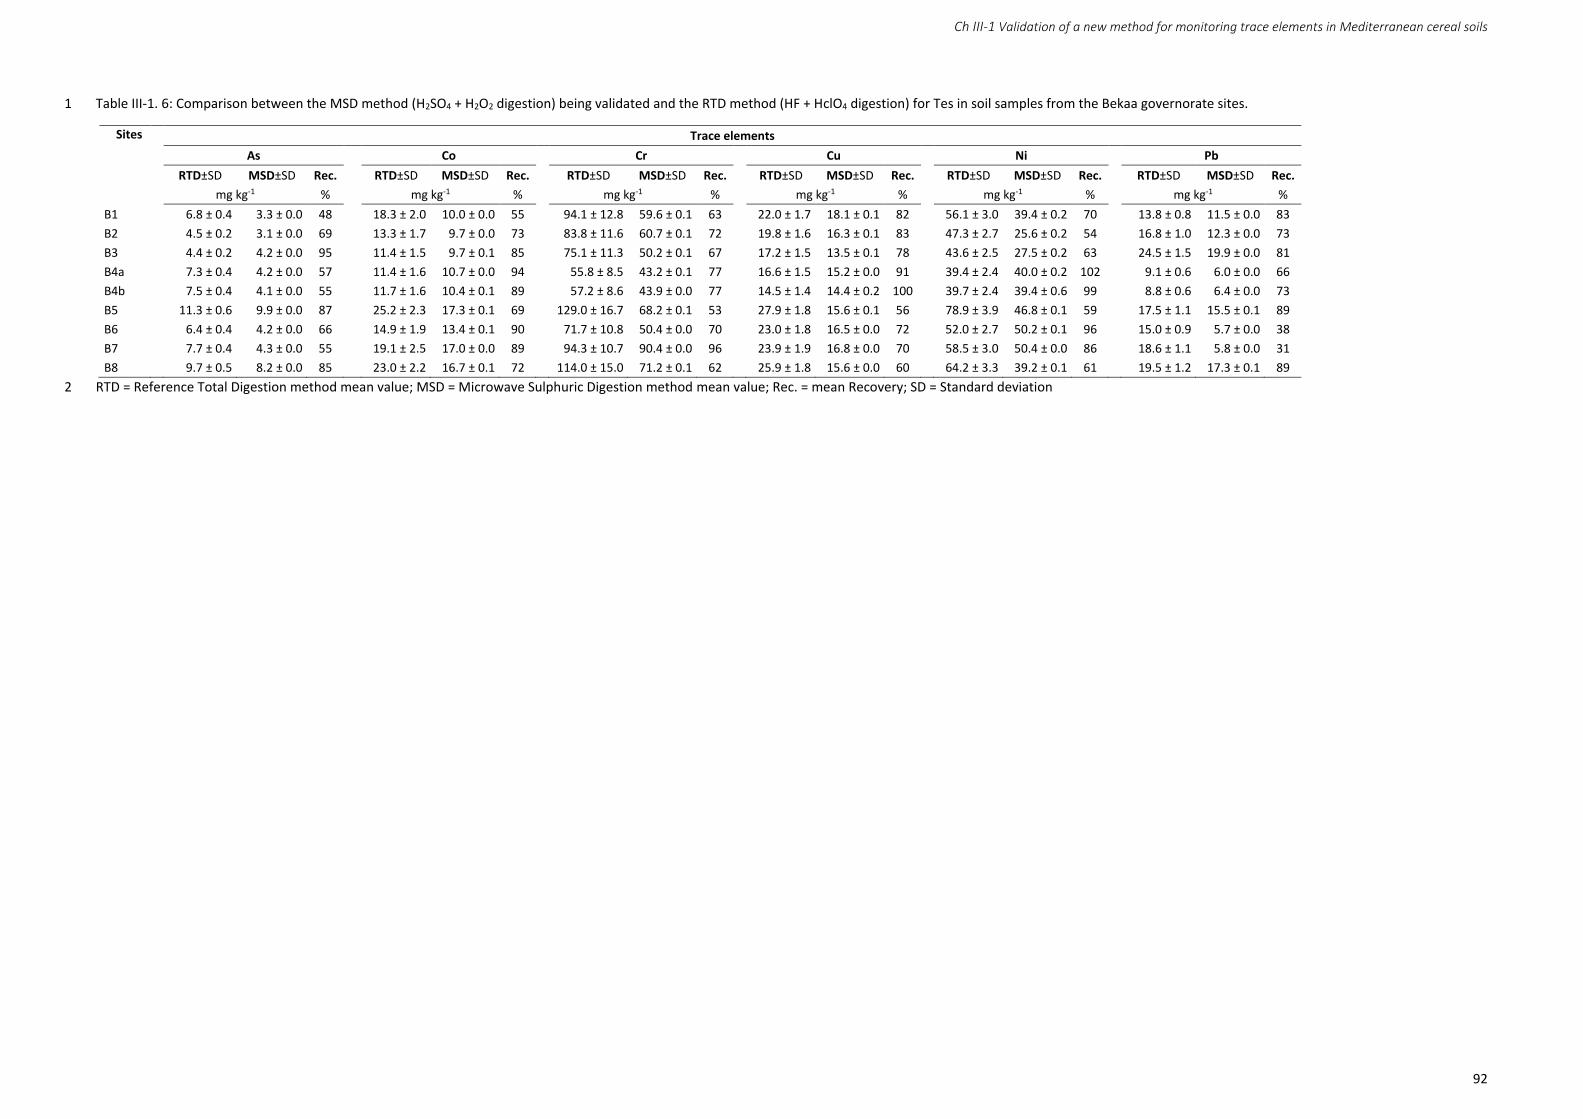
Ch III-1 Validation of a new method for monitoring trace elements in Mediterranean cereal soils
92
Table III-1. 6: Comparison between the MSD method (H2SO4 + H2O2 digestion) being validated and the RTD method (HF + HclO4 digestion) for Tes in soil samples from the Bekaa governorate sites. 1
Sites Trace elements As Co Cr Cu Ni Pb
RTD±SD MSD±SD Rec. RTD±SD MSD±SD Rec. RTD±SD MSD±SD Rec. RTD±SD MSD±SD Rec. RTD±SD MSD±SD Rec. RTD±SD MSD±SD Rec. mg kg-1 % mg kg-1 % mg kg-1 % mg kg-1 % mg kg-1 % mg kg-1 %
B1 6.8 ± 0.4 3.3 ± 0.0 48 18.3 ± 2.0 10.0 ± 0.0 55 94.1 ± 12.8 59.6 ± 0.1 63 22.0 ± 1.7 18.1 ± 0.1 82 56.1 ± 3.0 39.4 ± 0.2 70 13.8 ± 0.8 11.5 ± 0.0 83
B2 4.5 ± 0.2 3.1 ± 0.0 69 13.3 ± 1.7 9.7 ± 0.0 73 83.8 ± 11.6 60.7 ± 0.1 72 19.8 ± 1.6 16.3 ± 0.1 83 47.3 ± 2.7 25.6 ± 0.2 54 16.8 ± 1.0 12.3 ± 0.0 73
B3 4.4 ± 0.2 4.2 ± 0.0 95 11.4 ± 1.5 9.7 ± 0.1 85 75.1 ± 11.3 50.2 ± 0.1 67 17.2 ± 1.5 13.5 ± 0.1 78 43.6 ± 2.5 27.5 ± 0.2 63 24.5 ± 1.5 19.9 ± 0.0 81
B4a 7.3 ± 0.4 4.2 ± 0.0 57 11.4 ± 1.6 10.7 ± 0.0 94 55.8 ± 8.5 43.2 ± 0.1 77 16.6 ± 1.5 15.2 ± 0.0 91 39.4 ± 2.4 40.0 ± 0.2 102 9.1 ± 0.6 6.0 ± 0.0 66
B4b 7.5 ± 0.4 4.1 ± 0.0 55 11.7 ± 1.6 10.4 ± 0.1 89 57.2 ± 8.6 43.9 ± 0.0 77 14.5 ± 1.4 14.4 ± 0.2 100 39.7 ± 2.4 39.4 ± 0.6 99 8.8 ± 0.6 6.4 ± 0.0 73
B5 11.3 ± 0.6 9.9 ± 0.0 87 25.2 ± 2.3 17.3 ± 0.1 69 129.0 ± 16.7 68.2 ± 0.1 53 27.9 ± 1.8 15.6 ± 0.1 56 78.9 ± 3.9 46.8 ± 0.1 59 17.5 ± 1.1 15.5 ± 0.1 89
B6 6.4 ± 0.4 4.2 ± 0.0 66 14.9 ± 1.9 13.4 ± 0.1 90 71.7 ± 10.8 50.4 ± 0.0 70 23.0 ± 1.8 16.5 ± 0.0 72 52.0 ± 2.7 50.2 ± 0.1 96 15.0 ± 0.9 5.7 ± 0.0 38
B7 7.7 ± 0.4 4.3 ± 0.0 55 19.1 ± 2.5 17.0 ± 0.0 89 94.3 ± 10.7 90.4 ± 0.0 96 23.9 ± 1.9 16.8 ± 0.0 70 58.5 ± 3.0 50.4 ± 0.0 86 18.6 ± 1.1 5.8 ± 0.0 31
B8 9.7 ± 0.5 8.2 ± 0.0 85 23.0 ± 2.2 16.7 ± 0.1 72 114.0 ± 15.0 71.2 ± 0.1 62 25.9 ± 1.8 15.6 ± 0.0 60 64.2 ± 3.3 39.2 ± 0.1 61 19.5 ± 1.2 17.3 ± 0.1 89
RTD = Reference Total Digestion method mean value; MSD = Microwave Sulphuric Digestion method mean value; Rec. = mean Recovery; SD = Standard deviation2
Ch III-1 Validation of a new method for monitoring trace elements in Mediterranean cereal soils
93
All recovery values were below 100%, which was predictable because the MSD with a
mixture of H2SO4 and H2O2 does not induce a total mineralization of silicates compared
with the RTD method using a mixture of HF and HClO4. High recovery percentages
were obtained for Co, Cr and Cu. Two-thirds of the calculated recoveries were higher
than 70%, which is an acceptable value for trace analysis as defined by (AOAC 2002)
(Horwitz, 2002). The other third was between 50 and 70% except for 3 values (As for
B1 and Pb for B6 and B7). As, Co, Cr and Pb concentrations measured using the
validated MSD method were correlated with values obtained using the RTD method.
The relation was greatly improved for Pb (R2 = 0.9624* with a slope = 1.0486) when
B6 and B7 were removed. For Cr, the relationship was greatly improved when B7 was
not considered (R2 = 0.9074*) and indicated a reduction of the recovery percentage
with increased total concentrations. The most contaminated soil was B5, with the
highest concentrations for As, Co, Cr, Cu and Ni. This plot is occasionally irrigated by
pumping water from an irrigation canal from the Berdawni River, the catchment of
which drains the town of Zahleh. Nevertheless, all soils remained in the lower range
of concentrations found in soils worldwide for all elements (Kabata-Pendias and
Mukherjee, 2007). Cobalt, Cr, Cu and Ni concentrations were correlated indicating a
probable common geogenic origin. Arsenic was only correlated to Co and Ni, which
may be related to a more scattered occurrence due to anthropogenic inputs (Darwish,
T. et al., 2021). The lead concentration was not correlated to that of any of the other
elements, probably because two soils (B6 and B7) had a very low recovery rate. These
results confirm the reported low content in the soils of the Central Bekaa area and
depicted from the spatial distribution of total Pb in the soil surface (Darwish, T. et al.,
2004). The pattern of Pb concentration shows, above a weak geogenic background (4
– 14 mg kg-1), an anthropic contamination along heavy trafficked roads by atmospheric
deposition (Gupta, 2020) and surface accumulation gradient of Pb from foot-slope,
located downslope of Zahleh town, towards the Litani River (14 – 34 mg kg-1). This lead
is carried by water runoff from Zahleh agglomeration Figure III-1. 2. Where, topsoil
samples (0-15 cm depth) were collected from Central Bekaa area (1200 ha) by grid
system 1kmx2km, based on topography, lithology and land use. Sixty samples were
collected in 1997 before the introduction of unleaded fuel in 2000. The digestion of
samples was done by aqua regia mixture and Pb was analysed by means of ETA-AAS
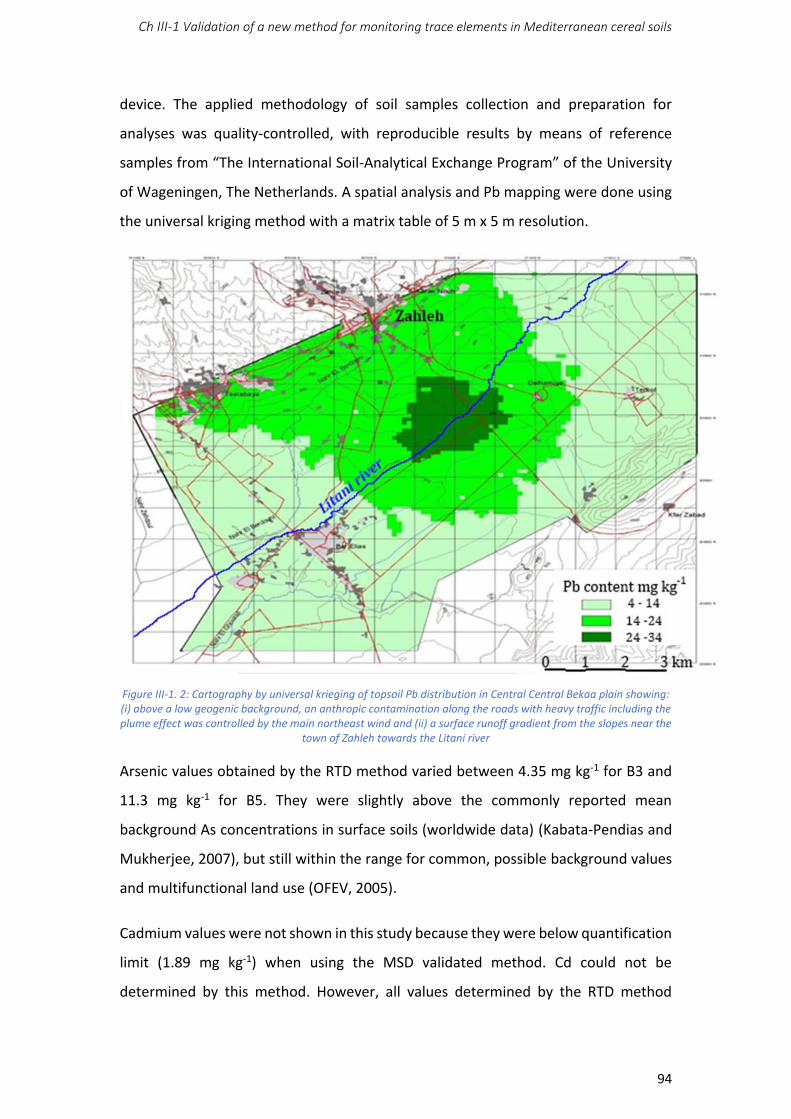
Ch III-1 Validation of a new method for monitoring trace elements in Mediterranean cereal soils
94
device. The applied methodology of soil samples collection and preparation for
analyses was quality-controlled, with reproducible results by means of reference
samples from “The International Soil-Analytical Exchange Program” of the University
of Wageningen, The Netherlands. A spatial analysis and Pb mapping were done using
the universal kriging method with a matrix table of 5 m x 5 m resolution.
Figure III-1. 2: Cartography by universal krieging of topsoil Pb distribution in Central Central Bekaa plain showing:
(i) above a low geogenic background, an anthropic contamination along the roads with heavy traffic including the
plume effect was controlled by the main northeast wind and (ii) a surface runoff gradient from the slopes near the
town of Zahleh towards the Litani river
Arsenic values obtained by the RTD method varied between 4.35 mg kg-1 for B3 and
11.3 mg kg-1 for B5. They were slightly above the commonly reported mean
background As concentrations in surface soils (worldwide data) (Kabata-Pendias and
Mukherjee, 2007), but still within the range for common, possible background values
and multifunctional land use (OFEV, 2005).
Cadmium values were not shown in this study because they were below quantification
limit (1.89 mg kg-1) when using the MSD validated method. Cd could not be
determined by this method. However, all values determined by the RTD method
Ch III-1 Validation of a new method for monitoring trace elements in Mediterranean cereal soils
95
varied between 0.23 mg kg-1 for B4b and 0.48 mg kg-1 for B8 and were defined within
the global average soil Cd concentration (0.06 – 1.1 mg kg-1) (Kabata-Pendias and
Mukherjee, 2007). Our values are in agreement with those found by Kanbar et al. (0.28
– 2.8 mg kg-1) in different Lebanese soils [52] and those found by Darwish in Bekaa
soils (0.28 – 0.48 mg kg-1) (Darwish, 2008).
Cobalt values obtained by the RTD method varied between 11.4 mg kg-1 for B3 and
25.2 mg kg-1 for B5. These values are close to the range of world values in surface soils
(4.5 – 12 mg kg-1) (Kabata-Pendias and Mukherjee, 2007). They are comparable to
those obtained for arid and semiarid regions (16.5 – 26.8 mg kg-1) (Jalali and Majeri,
2016). They are also in agreement with those found by Darwish in Bekaa soils (28.1-
28.5 mg kg-1) (Darwish, 2018).
Chromium values obtained by the RTD method varied between 55.8 mg kg-1 for B4a
and 129.0 mg kg-1 for B5. These values are higher than the world median content of
Cr in soils: 54 mg kg-1. They are within the sandy and light loamy soils range, which
contains Cr between 2 and 350 mg kg-1 (Kabata-Pendias and Mukherjee, 2007). They
are close to those found by Darwish in Bekaa soil samples (43.3 and 71.3 mg kg-1)
(Darwish, 2018) and do not exceed the limits for safe agricultural land use.
Copper values obtained by the RTD method varied between 14.5 mg kg-1 for B4b and
27.9 mg kg-1 for B5. These results are within the range for Cu concentration in soils (8
mg kg-1 in acid sandy soils to 80 mg kg-1 in heavy loamy soils) (Kabata-Pendias and
Mukherjee, 2007). They are in general lower than those obtained in other Lebanese
soils (25.3 – 54.2 mg kg-1) (Kanbar et al., 2014), among others Taalabaya (Zahleh
district) soils (35.7 mg kg-1) (Darwish, 2018), but conform to the values obtained in
Saadnaeal (Zahleh district) soils (17.0 mg kg-1).
Nickel values obtained by the RTD method varied between 39.4 mg kg-1 for B4a and
78.9 mg kg-1 for B5. These values are within the range of Ni concentration in soils
worldwide (0.2 – 450 mg kg-1) (Kabata-Pendias and Mukherjee, 2007). They are in
agreement with values obtained in Taalabaya soils (60.7 mg kg-1) but higher than
values obtained in Saadnaeal soils sampled at the same depth (33.7 mg kg-1) (Darwish,
Ch III-1 Validation of a new method for monitoring trace elements in Mediterranean cereal soils
96
2018).
Lead values obtained by the RTD method varied between 8.84 mg kg-1 for B4b and
24.48 mg kg-1 for B3. They are lower than the overall mean value of Pb in different
soils worldwide (25 mg kg-1) (Kabata-Pendias and Mukherjee, 2007). They are in
agreement with those obtained in other Lebanese soils (11.3 – 22.9 mg kg-1) (Kanbar
et al., 2014) and those obtained in Taalabaya soils (16.7 mg kg-1) and Saadnaeal soils
(10.0 mg kg-1) (Darwish, 2018).
In summary, the results obtained in this study are representative of soils with limited
trace elements contamination. The concentrations measured are within the same
range than the values obtained by Darwish for surface soils and soil profiles of the
Bekaa plain. He points to both a natural TE source with variation explained by the
alluvial-colluvial origin of the parent material but also to a limited anthropogenic
pollution due to a combination of inputs from cultivation and atmospheric deposition
which is modulated by soil organic content.
The correlations between TEs values were higher following the RTD method than the
validated one, suggesting that the RTD method can better trace the common origin of
the elements, which was mostly of geogenic origin, as also indicated by the observed
level of concentrations, which were close to the background level detected in North
Lebanon (Nsouli et al., 2004).
Aqua regia, which is a reference method for pseudo-total metal concentrations in
soils, gives extraction efficiency between 53 and 100%, depending on the element, as
compared to total concentrations (calculated for the certified material METRANAL-33
in Shahbazi and Beheshti) (Shahbazi and Beheshti, 2019). Although it is widely used,
resorption occurs (up to 470% for Cu) leading to underestimation of element
concentrations (Guedes et al., 2020) and other mild extraction procedures may
provide accurate results when trace element reactive fraction, not bound to silicates,
is to be recovered (Guedes et al., 2020). Our results fall within the same range of
efficiency as aqua regia and the validated method including the microwave digestion
with H2SO4 + H2O2 may offer a more feasible and workable alternative.
Ch III-1 Validation of a new method for monitoring trace elements in Mediterranean cereal soils
97
III-1.4 Conclusion
The microwave digestion with H2SO4 + H2O2 combined with flame-AAS measurement
was validated with CRM and after comparison with HF-based digestion. It allows for
routine but accurate characterization of calcareous and Ca-saturated soils with limited
contamination in As, Cd, Cu, Co, Cr and Pb. The tested soils, used for wheat
production, are irrigated with water of poor quality and need to be monitored for their
trace element concentrations regularly to prevent transfer to the food chain.
Recent microwave digestion methods were implemented according to green
chemistry, they have proved their efficiency for the determination of trace elements
in soil samples (Cora Jofre et al., 2020; Funes Pinter et al., 2018; Lin et al., 2019b;
Magaldi et al., 2019). In these studies, several reagents were used to dissolve soil or
sediment samples such as: HNO3, HclO4, HF, HCl, NH4HF2 and H2O2 before trace
element analysis using ICP-OES, ICP-MS or MIP-OES. These recent methods use
problematic reagents difficult to handle safely and/or very expensive analytical
devices.
The validated method offers an alternative to HF-based methods, as well as aqua
regia. It is green, safe and cheap method for trace element analysis in soil samples.
Other soil types will have to be tested to further extend its use to a larger range of
soils to cover the soil diversity in the Mediterranean area.
Ch III-2 Geogenic and anthropogenic origin of trace elements in the Central Bekaa soils
98
CHAPTER III-2
Geogenic and anthropogenic
origin of trace elements in
the Central Bekaa soils
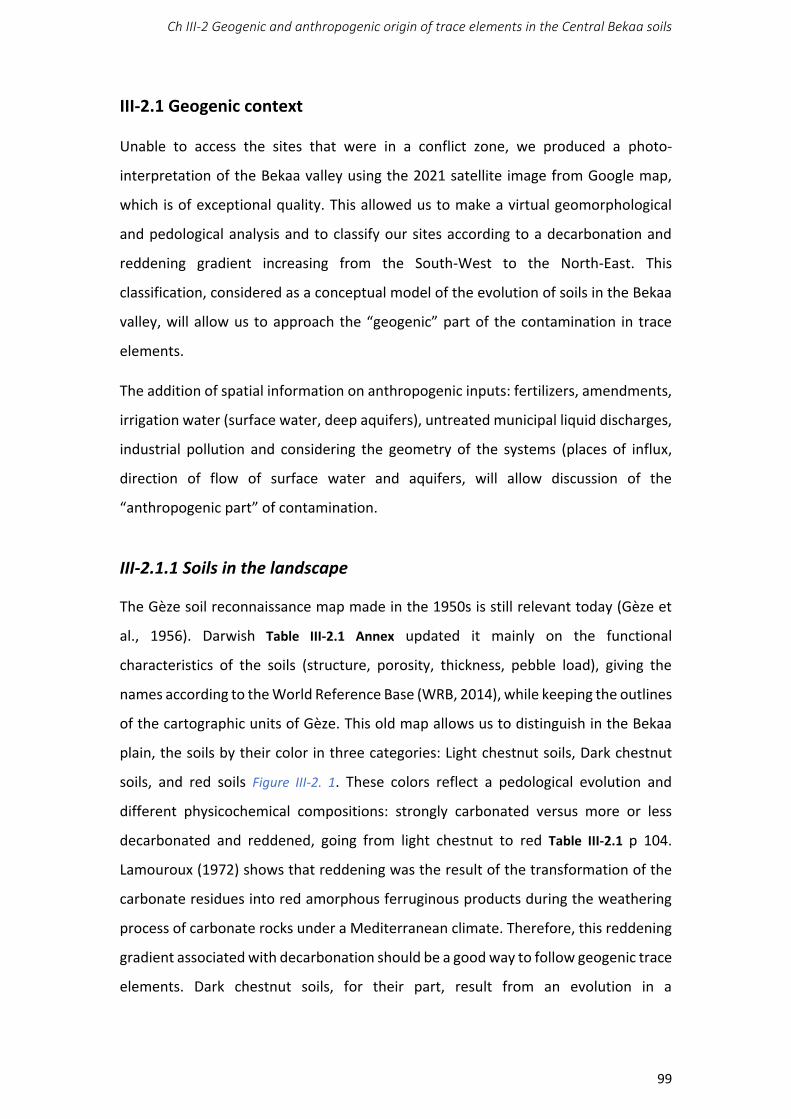
Ch III-2 Geogenic and anthropogenic origin of trace elements in the Central Bekaa soils
99
III-2.1 Geogenic context
Unable to access the sites that were in a conflict zone, we produced a photo-
interpretation of the Bekaa valley using the 2021 satellite image from Google map,
which is of exceptional quality. This allowed us to make a virtual geomorphological
and pedological analysis and to classify our sites according to a decarbonation and
reddening gradient increasing from the South-West to the North-East. This
classification, considered as a conceptual model of the evolution of soils in the Bekaa
valley, will allow us to approach the “geogenic” part of the contamination in trace
elements.
The addition of spatial information on anthropogenic inputs: fertilizers, amendments,
irrigation water (surface water, deep aquifers), untreated municipal liquid discharges,
industrial pollution and considering the geometry of the systems (places of influx,
direction of flow of surface water and aquifers, will allow discussion of the
“anthropogenic part” of contamination.
III-2.1.1 Soils in the landscape
The Gèze soil reconnaissance map made in the 1950s is still relevant today (Gèze et
al., 1956). Darwish Table III-2.1 Annex updated it mainly on the functional
characteristics of the soils (structure, porosity, thickness, pebble load), giving the
names according to the World Reference Base (WRB, 2014), while keeping the outlines
of the cartographic units of Gèze. This old map allows us to distinguish in the Bekaa
plain, the soils by their color in three categories: Light chestnut soils, Dark chestnut
soils, and red soils Figure III-2. 1. These colors reflect a pedological evolution and
different physicochemical compositions: strongly carbonated versus more or less
decarbonated and reddened, going from light chestnut to red Table III-2.1 p 104.
Lamouroux (1972) shows that reddening was the result of the transformation of the
carbonate residues into red amorphous ferruginous products during the weathering
process of carbonate rocks under a Mediterranean climate. Therefore, this reddening
gradient associated with decarbonation should be a good way to follow geogenic trace
elements. Dark chestnut soils, for their part, result from an evolution in a

Ch III-2 Geogenic and anthropogenic origin of trace elements in the Central Bekaa soils
100
hydromorphic environment and lead to very clayey soils rich in smectites (Lamouroux
et al., 1967).
Figure III-2. 1: Left Central Bekaa soil map (Gèze, 1956 in Nasser, 2018). Right Coverage of the Gèze soil
reconnaissance map on the administrative map of untreated municipalities outlet and the position of the sites
studied
To carry out our geomorphological characterization of soils, we crossed different
types of information:
- The GPS coordinates allowed us to position our sites on an administrative
map of the Litani watershed on which we draped the Gèze soil reconnaissance
map Figure III-2. 1 on the right.
- The Munsell color of the surface horizon of the soil, determined in the
laboratory on dry samples sieved at 2 mm, which is compared to the color
observed on the satellite map in the absence of plant cover;
- Finally, the geomorphological situation of the sites was apprehended using
the topographic curves and thanks to the “3D vision” function of Google.
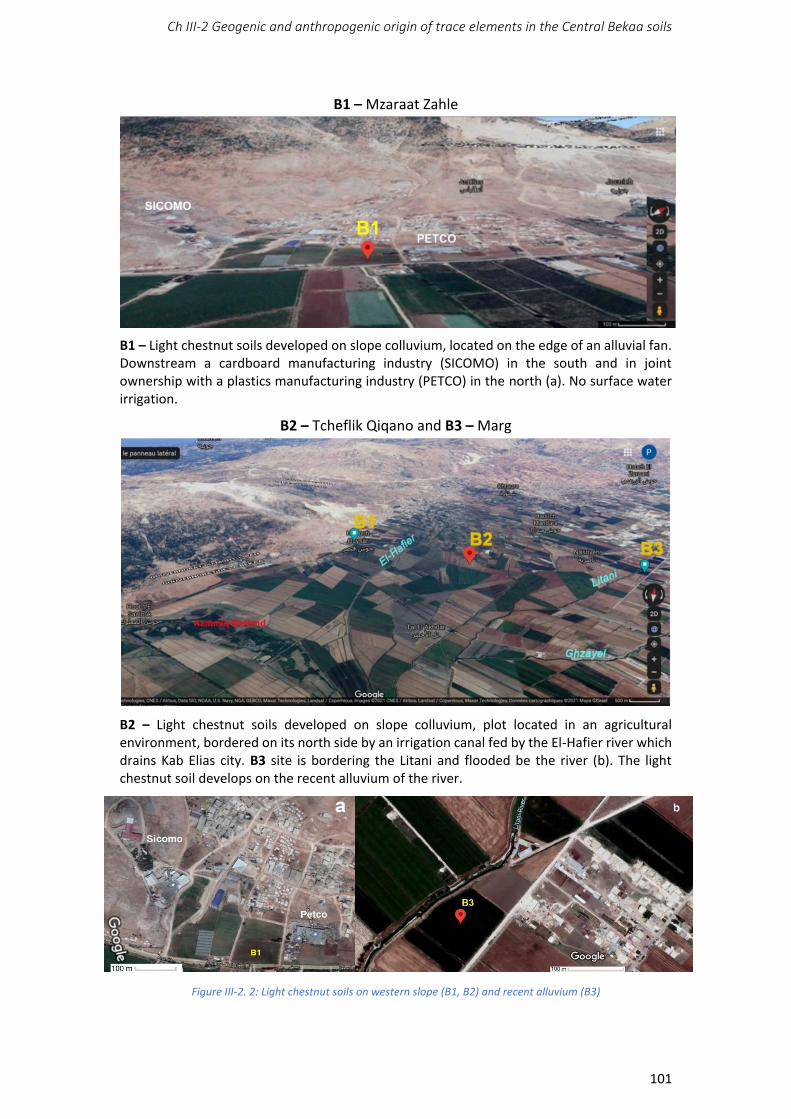
Ch III-2 Geogenic and anthropogenic origin of trace elements in the Central Bekaa soils
101
B1 – Mzaraat Zahle
B1 – Light chestnut soils developed on slope colluvium, located on the edge of an alluvial fan. Downstream a cardboard manufacturing industry (SICOMO) in the south and in joint ownership with a plastics manufacturing industry (PETCO) in the north (a). No surface water irrigation.
B2 – Tcheflik Qiqano and B3 – Marg
B2 – Light chestnut soils developed on slope colluvium, plot located in an agricultural environment, bordered on its north side by an irrigation canal fed by the El-Hafier river which drains Kab Elias city. B3 site is bordering the Litani and flooded be the river (b). The light chestnut soil develops on the recent alluvium of the river.
Figure III-2. 2: Light chestnut soils on western slope (B1, B2) and recent alluvium (B3)
Ch III-2 Geogenic and anthropogenic origin of trace elements in the Central Bekaa soils
102
B4ab- Zahleh Haouch El-Oumara Aradi
B4ab – Site bordering the Litani river, water is seen in the irrigation canals around the plots.
The light chestnut soil develops on the recent alluvium of the river. This site is adjoining to the
south with the municipality of Bar Elias and at one kilometer to the south of the industrial
zone of Taanayel. Two plots were initially chosen to compare different practices.
B5 – Zahle Haouch El-Oumara Aradi
B5 – Light chestnut soil developed on the alluvial fan issued from Wadi El Aarayech. The relief
is underlined by the orientation of the plots. The Berdawni river, whose course deviates
towards the southwest at the exit of Zahleh, passes to the west of the agglomeration of
Saadnayel then descends to the south, on the edge of the industrial zone of Taanayel.
This zoom on plot B5 shows the irrigation canals around
the plots that are supplied, at the exit of Zahleh, by the
Berdawni river.
Figure III-2. 3: Light chestnut soils in recent alluvium (B4) and in an alluvial fan on Western slope (B5)
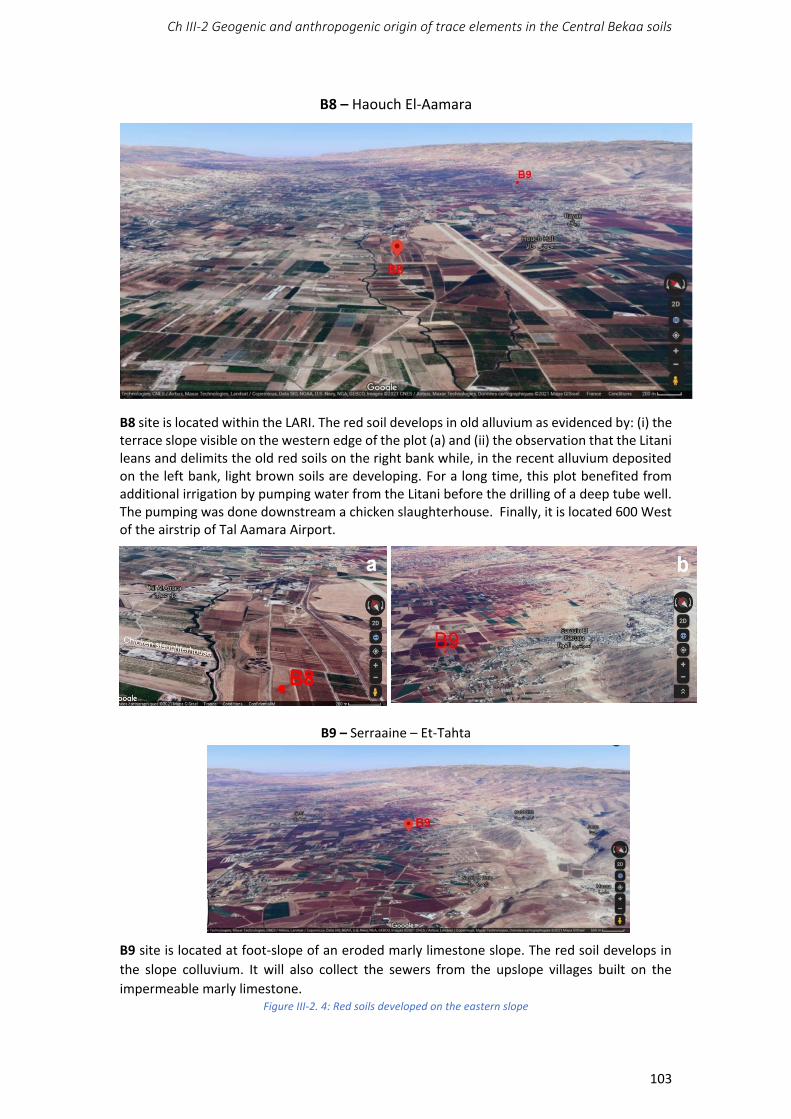
Ch III-2 Geogenic and anthropogenic origin of trace elements in the Central Bekaa soils
103
B8 – Haouch El-Aamara
B8 site is located within the LARI. The red soil develops in old alluvium as evidenced by: (i) the terrace slope visible on the western edge of the plot (a) and (ii) the observation that the Litani leans and delimits the old red soils on the right bank while, in the recent alluvium deposited on the left bank, light brown soils are developing. For a long time, this plot benefited from additional irrigation by pumping water from the Litani before the drilling of a deep tube well. The pumping was done downstream a chicken slaughterhouse. Finally, it is located 600 West of the airstrip of Tal Aamara Airport.
B9 – Serraaine – Et-Tahta
B9 site is located at foot-slope of an eroded marly limestone slope. The red soil develops in
the slope colluvium. It will also collect the sewers from the upslope villages built on the
impermeable marly limestone. Figure III-2. 4: Red soils developed on the eastern slope
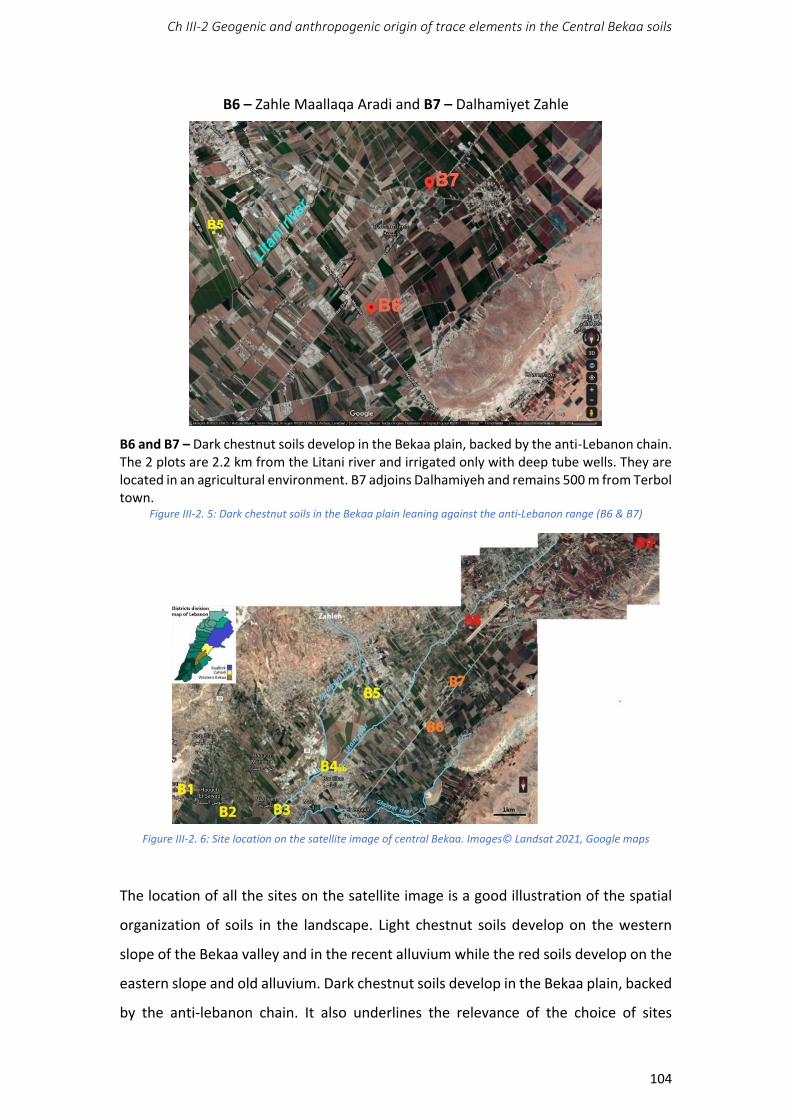
Ch III-2 Geogenic and anthropogenic origin of trace elements in the Central Bekaa soils
104
B6 – Zahle Maallaqa Aradi and B7 – Dalhamiyet Zahle
B6 and B7 – Dark chestnut soils develop in the Bekaa plain, backed by the anti-Lebanon chain. The 2 plots are 2.2 km from the Litani river and irrigated only with deep tube wells. They are located in an agricultural environment. B7 adjoins Dalhamiyeh and remains 500 m from Terbol town.
Figure III-2. 5: Dark chestnut soils in the Bekaa plain leaning against the anti-Lebanon range (B6 & B7)
Figure III-2. 6: Site location on the satellite image of central Bekaa. Images© Landsat 2021, Google maps
The location of all the sites on the satellite image is a good illustration of the spatial
organization of soils in the landscape. Light chestnut soils develop on the western
slope of the Bekaa valley and in the recent alluvium while the red soils develop on the
eastern slope and old alluvium. Dark chestnut soils develop in the Bekaa plain, backed
by the anti-lebanon chain. It also underlines the relevance of the choice of sites
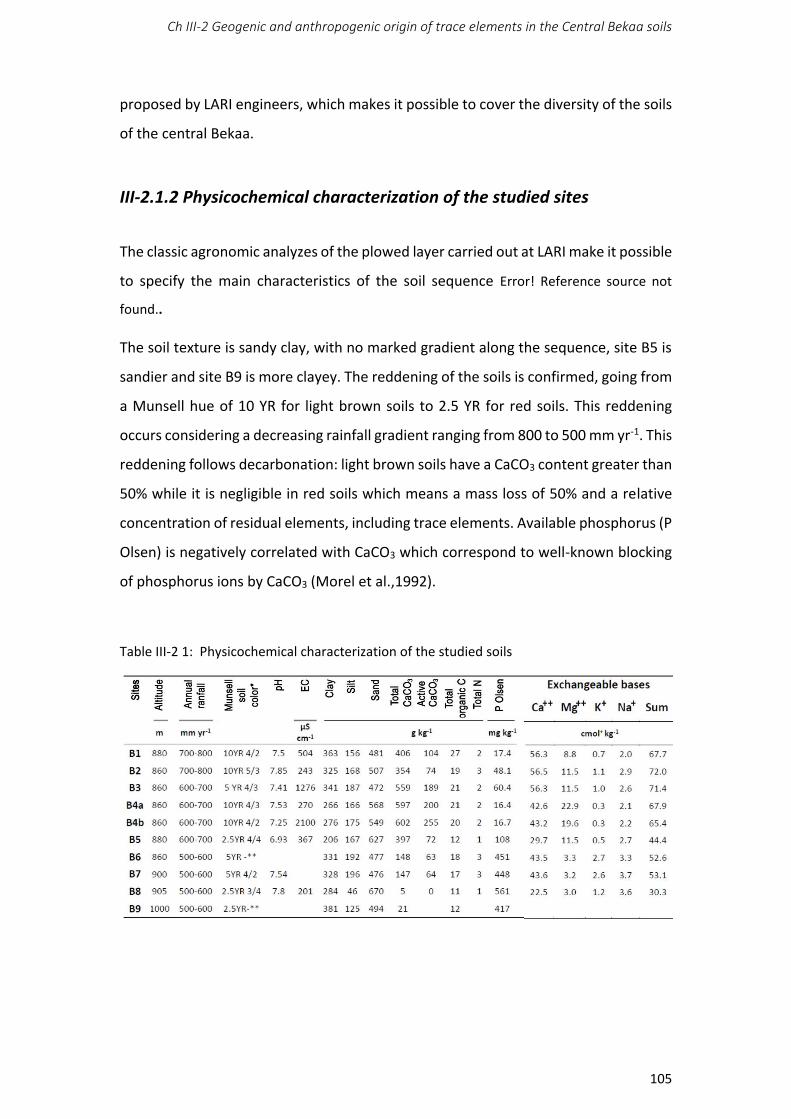
Ch III-2 Geogenic and anthropogenic origin of trace elements in the Central Bekaa soils
105
proposed by LARI engineers, which makes it possible to cover the diversity of the soils
of the central Bekaa.
III-2.1.2 Physicochemical characterization of the studied sites
The classic agronomic analyzes of the plowed layer carried out at LARI make it possible
to specify the main characteristics of the soil sequence Error! Reference source not
found..
The soil texture is sandy clay, with no marked gradient along the sequence, site B5 is
sandier and site B9 is more clayey. The reddening of the soils is confirmed, going from
a Munsell hue of 10 YR for light brown soils to 2.5 YR for red soils. This reddening
occurs considering a decreasing rainfall gradient ranging from 800 to 500 mm yr-1. This
reddening follows decarbonation: light brown soils have a CaCO3 content greater than
50% while it is negligible in red soils which means a mass loss of 50% and a relative
concentration of residual elements, including trace elements. Available phosphorus (P
Olsen) is negatively correlated with CaCO3 which correspond to well-known blocking
of phosphorus ions by CaCO3 (Morel et al.,1992).
Table III-2 1: Physicochemical characterization of the studied soils
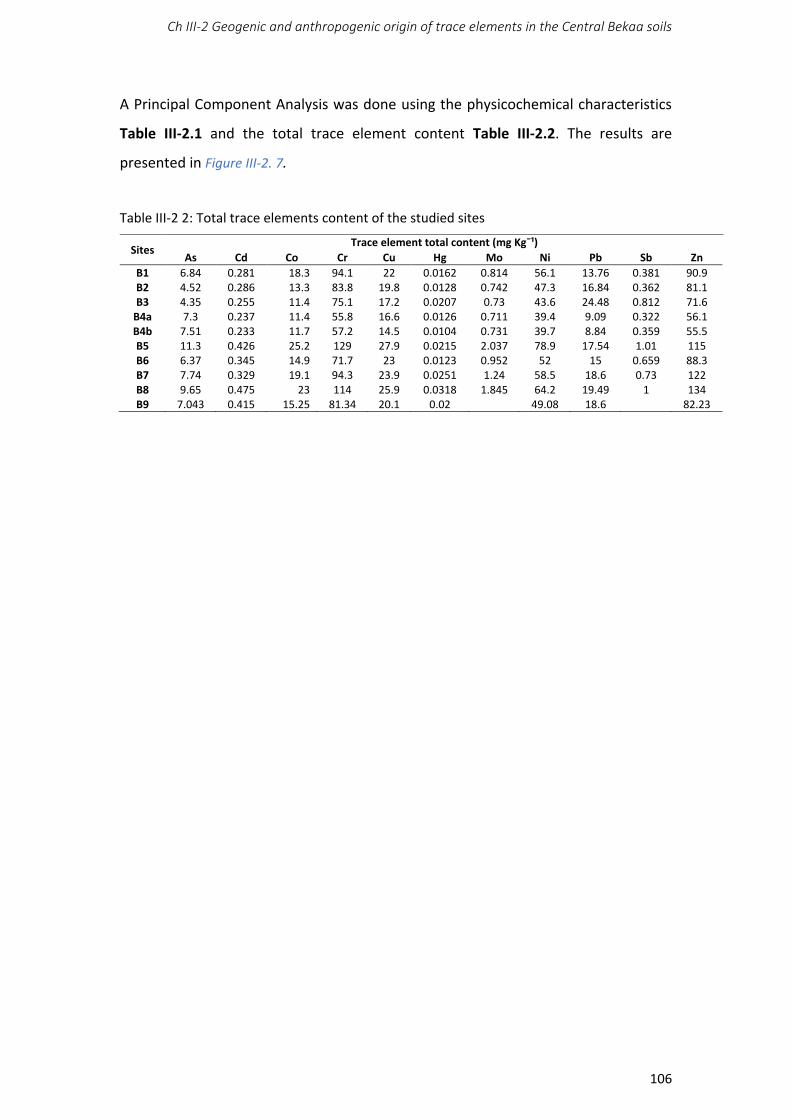
Ch III-2 Geogenic and anthropogenic origin of trace elements in the Central Bekaa soils
106
A Principal Component Analysis was done using the physicochemical characteristics
Table III-2.1 and the total trace element content Table III-2.2. The results are
presented in Figure III-2. 7.
Table III-2 2: Total trace elements content of the studied sites
Sites Trace element total content (mg Kg¯¹)
As Cd Co Cr Cu Hg Mo Ni Pb Sb Zn
B1 6.84 0.281 18.3 94.1 22 0.0162 0.814 56.1 13.76 0.381 90.9 B2 4.52 0.286 13.3 83.8 19.8 0.0128 0.742 47.3 16.84 0.362 81.1 B3 4.35 0.255 11.4 75.1 17.2 0.0207 0.73 43.6 24.48 0.812 71.6
B4a 7.3 0.237 11.4 55.8 16.6 0.0126 0.711 39.4 9.09 0.322 56.1 B4b 7.51 0.233 11.7 57.2 14.5 0.0104 0.731 39.7 8.84 0.359 55.5 B5 11.3 0.426 25.2 129 27.9 0.0215 2.037 78.9 17.54 1.01 115 B6 6.37 0.345 14.9 71.7 23 0.0123 0.952 52 15 0.659 88.3 B7 7.74 0.329 19.1 94.3 23.9 0.0251 1.24 58.5 18.6 0.73 122 B8 9.65 0.475 23 114 25.9 0.0318 1.845 64.2 19.49 1 134 B9 7.043 0.415 15.25 81.34 20.1 0.02 49.08 18.6 82.23
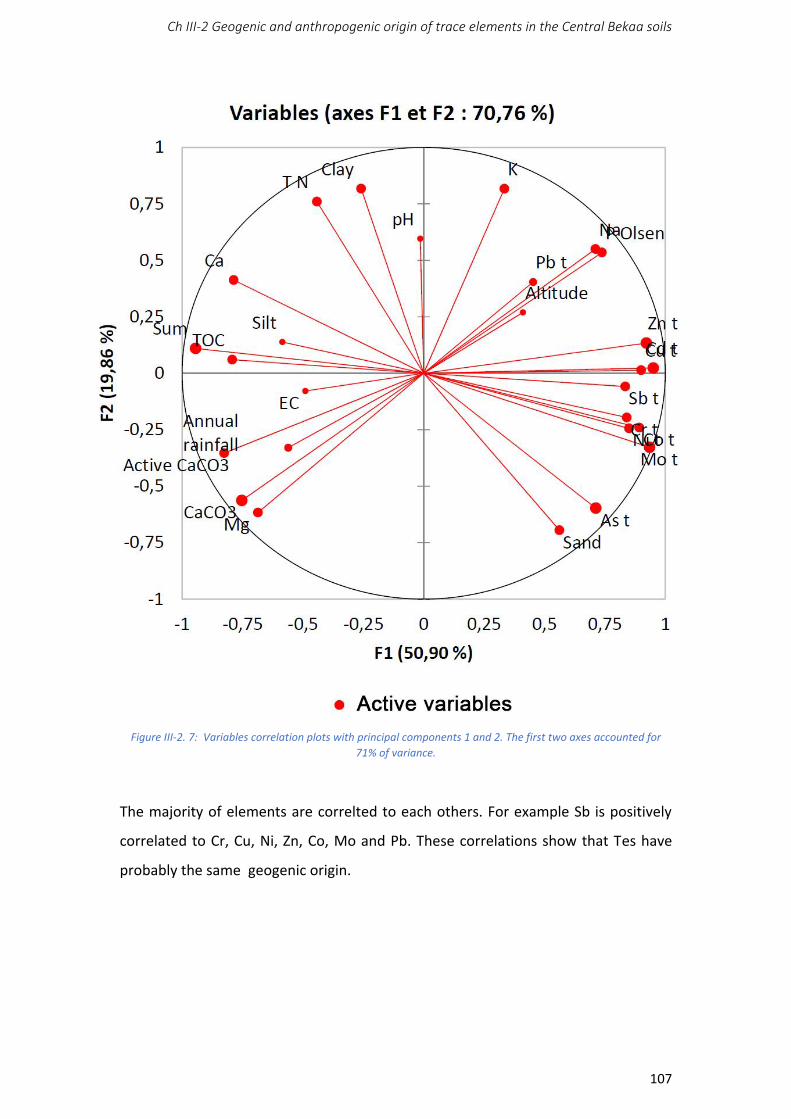
Ch III-2 Geogenic and anthropogenic origin of trace elements in the Central Bekaa soils
107
Figure III-2. 7: Variables correlation plots with principal components 1 and 2. The first two axes accounted for
71% of variance.
The majority of elements are correlted to each others. For example Sb is positively
correlated to Cr, Cu, Ni, Zn, Co, Mo and Pb. These correlations show that Tes have
probably the same geogenic origin.
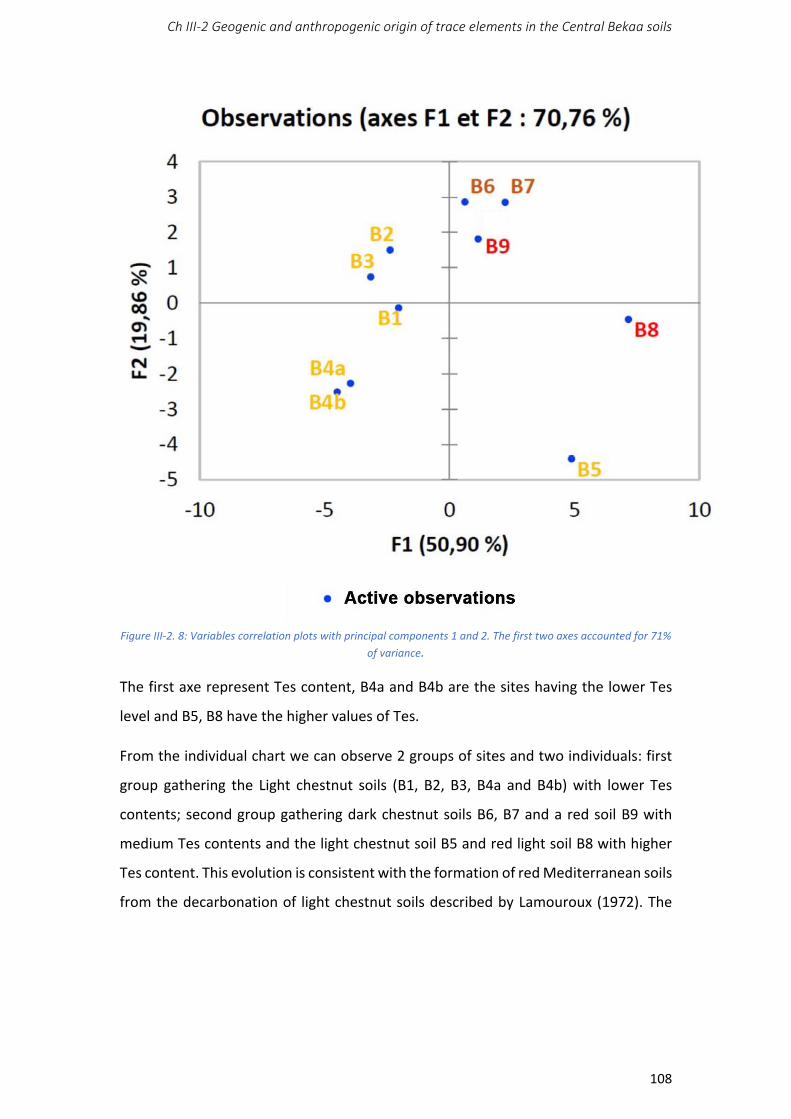
Ch III-2 Geogenic and anthropogenic origin of trace elements in the Central Bekaa soils
108
Figure III-2. 8: Variables correlation plots with principal components 1 and 2. The first two axes accounted for 71%
of variance.
The first axe represent Tes content, B4a and B4b are the sites having the lower Tes
level and B5, B8 have the higher values of Tes.
From the individual chart we can observe 2 groups of sites and two individuals: first
group gathering the Light chestnut soils (B1, B2, B3, B4a and B4b) with lower Tes
contents; second group gathering dark chestnut soils B6, B7 and a red soil B9 with
medium Tes contents and the light chestnut soil B5 and red light soil B8 with higher
Tes content. This evolution is consistent with the formation of red Mediterranean soils
from the decarbonation of light chestnut soils described by Lamouroux (1972). The
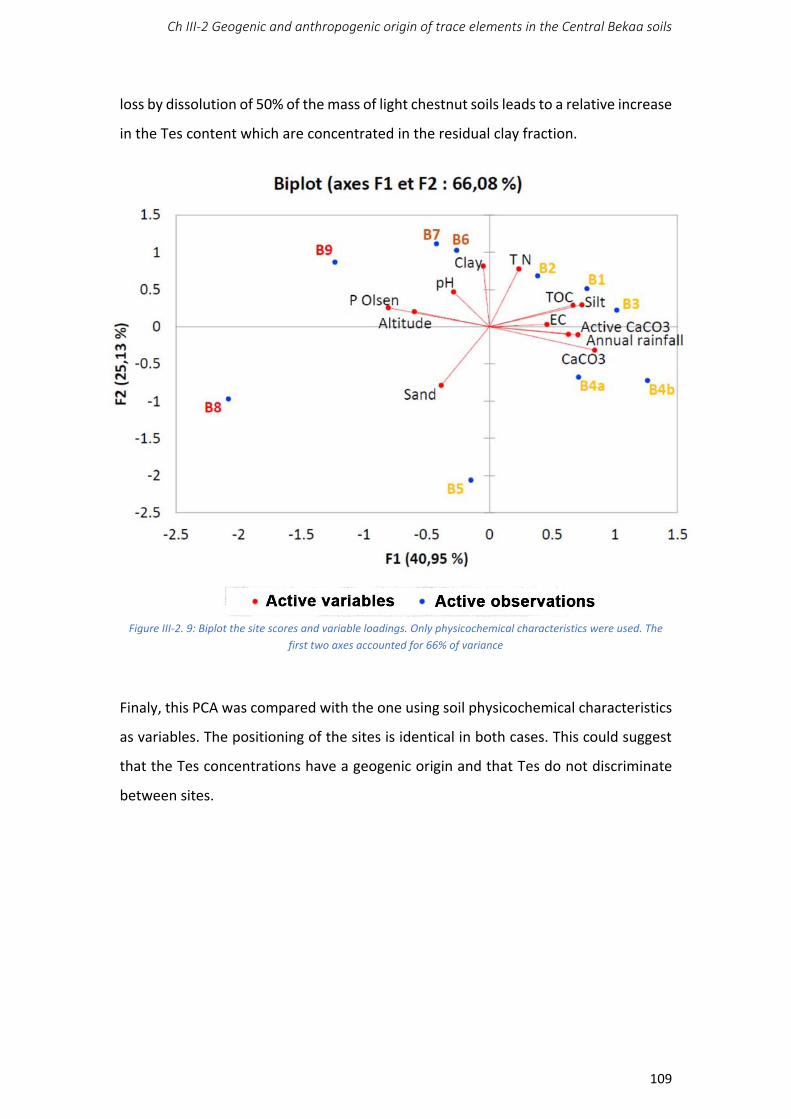
Ch III-2 Geogenic and anthropogenic origin of trace elements in the Central Bekaa soils
109
loss by dissolution of 50% of the mass of light chestnut soils leads to a relative increase
in the Tes content which are concentrated in the residual clay fraction.
Figure III-2. 9: Biplot the site scores and variable loadings. Only physicochemical characteristics were used. The
first two axes accounted for 66% of variance
Finaly, this PCA was compared with the one using soil physicochemical characteristics
as variables. The positioning of the sites is identical in both cases. This could suggest
that the Tes concentrations have a geogenic origin and that Tes do not discriminate
between sites.
Ch III-2 Geogenic and anthropogenic origin of trace elements in the Central Bekaa soils
110
III-2.2 Anthropogenic context
The types and varieties of wheat cultivated in the studied sites, the fertilization applied, as
well as the type of irrigation used are presented in Table III-2.2 Annex. All the plots were
cultivated by durum wheat (Icarasha and Miki mixed), while in addition to these two varieties
of durum wheat, the sites B1, B5, B6, B7, and B9 were grown by soft wheat (Naama 12).
Inorganic and organic fertilization is applied to all cultivated wheat plots, as well as organic
manure (cows and poultry) is added in some plots. Deep well water irrigation was used in all
studied sites, and surface water was used in B2, B3, B4a, B4b, B5, and B8.
III-2.2.1 Trace elements provided by fertilization and amendments
A Potato/Wheat crop rotation was applied in the studied sites Table III-2.3 Annex. The potato
cultivation was taking place during March with full irrigation (dry period from sowing to
harvesting). Before planting in March, an application of chicken manures was used (250 Kg N
ha-1), while during flowering and after flowering, a 2nd application of synthetic N fertilizer was
used (100 Kg N ha¯¹).
For wheat crop, the N fertilizers are applied twice, in the 1st application during the emergence
stage and sowing stage (230 Kg N ha-1 and 60 Kg N ha-1 respectively), and the 2nd during the
flowering stage (230 Kg N ha-1).
In addition to the N fertilization, the P fertilizers were applied only during sowing stage of
wheat plants (10 Kg P ha-1). This application may cause a contribution of TEs to soil. The
contribution of TEs to soils has been evaluated in relation to the use of phosphate fertilizers
in several countries, where European countries give an average for: As, Cd, Cr, Ni, and Pb Table
III-2 3.
Following analyzes carried out at LARI for the measurement of TEs in imported phosphate
fertilizers, the elements Cd, Cr, and Pb showed average values of 20.02, 27.40, and 42 mg kg-
1 respectively.
According to these values, an estimate of the contribution of these TEs could be done in the
studied soils, following an application of 10 kg of phosphate fertilizers ha-1 per cultivation
year.
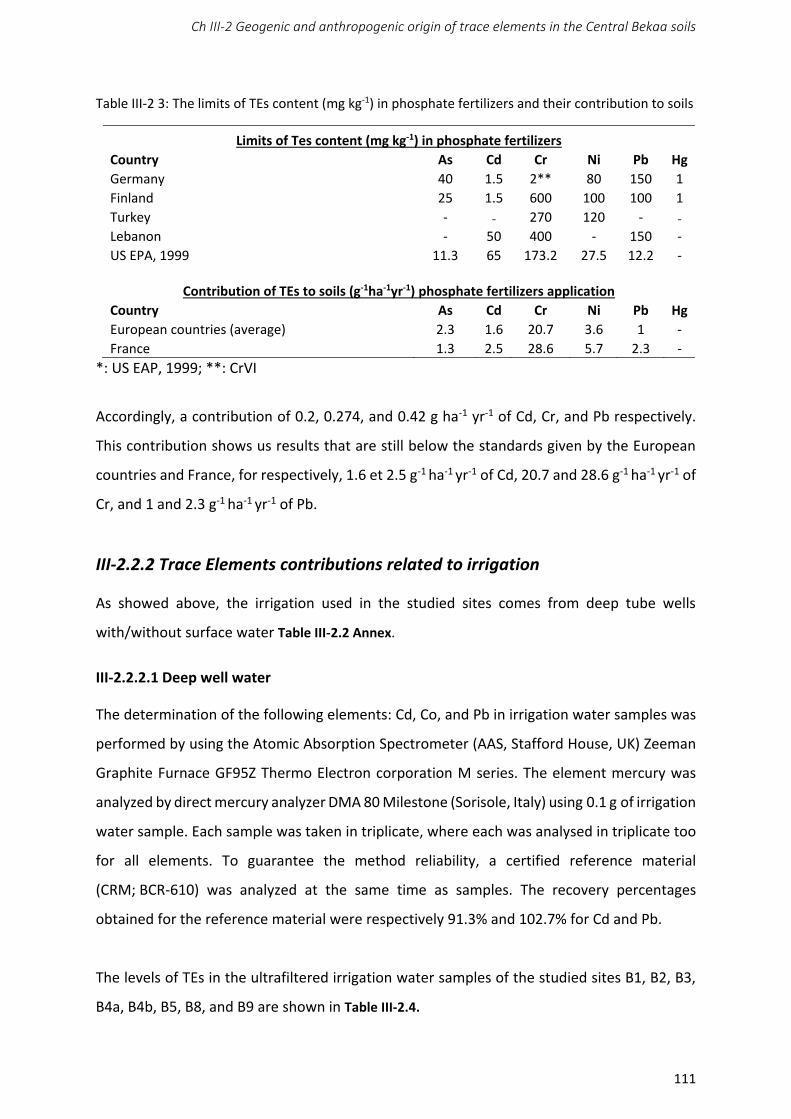
Ch III-2 Geogenic and anthropogenic origin of trace elements in the Central Bekaa soils
111
Table III-2 3: The limits of TEs content (mg kg-1) in phosphate fertilizers and their contribution to soils
Limits of Tes content (mg kg-1) in phosphate fertilizers
Country As Cd Cr Ni Pb Hg
Germany 40 1.5 2** 80 150 1
Finland 25 1.5 600 100 100 1
Turkey - - 270 120 - -
Lebanon - 50 400 - 150 -
US EPA, 1999 11.3 65 173.2 27.5 12.2 -
Contribution of TEs to soils (g-1ha-1yr-1) phosphate fertilizers application
Country As Cd Cr Ni Pb Hg
European countries (average) 2.3 1.6 20.7 3.6 1 -
France 1.3 2.5 28.6 5.7 2.3 -
*: US EAP, 1999; **: CrVI
Accordingly, a contribution of 0.2, 0.274, and 0.42 g ha-1 yr-1 of Cd, Cr, and Pb respectively.
This contribution shows us results that are still below the standards given by the European
countries and France, for respectively, 1.6 et 2.5 g-1 ha-1 yr-1 of Cd, 20.7 and 28.6 g-1 ha-1 yr-1 of
Cr, and 1 and 2.3 g-1 ha-1 yr-1 of Pb.
III-2.2.2 Trace Elements contributions related to irrigation
As showed above, the irrigation used in the studied sites comes from deep tube wells
with/without surface water Table III-2.2 Annex.
III-2.2.2.1 Deep well water
The determination of the following elements: Cd, Co, and Pb in irrigation water samples was
performed by using the Atomic Absorption Spectrometer (AAS, Stafford House, UK) Zeeman
Graphite Furnace GF95Z Thermo Electron corporation M series. The element mercury was
analyzed by direct mercury analyzer DMA 80 Milestone (Sorisole, Italy) using 0.1 g of irrigation
water sample. Each sample was taken in triplicate, where each was analysed in triplicate too
for all elements. To guarantee the method reliability, a certified reference material
(CRM; BCR-610) was analyzed at the same time as samples. The recovery percentages
obtained for the reference material were respectively 91.3% and 102.7% for Cd and Pb.
The levels of TEs in the ultrafiltered irrigation water samples of the studied sites B1, B2, B3,
B4a, B4b, B5, B8, and B9 are shown in Table III-2.4.
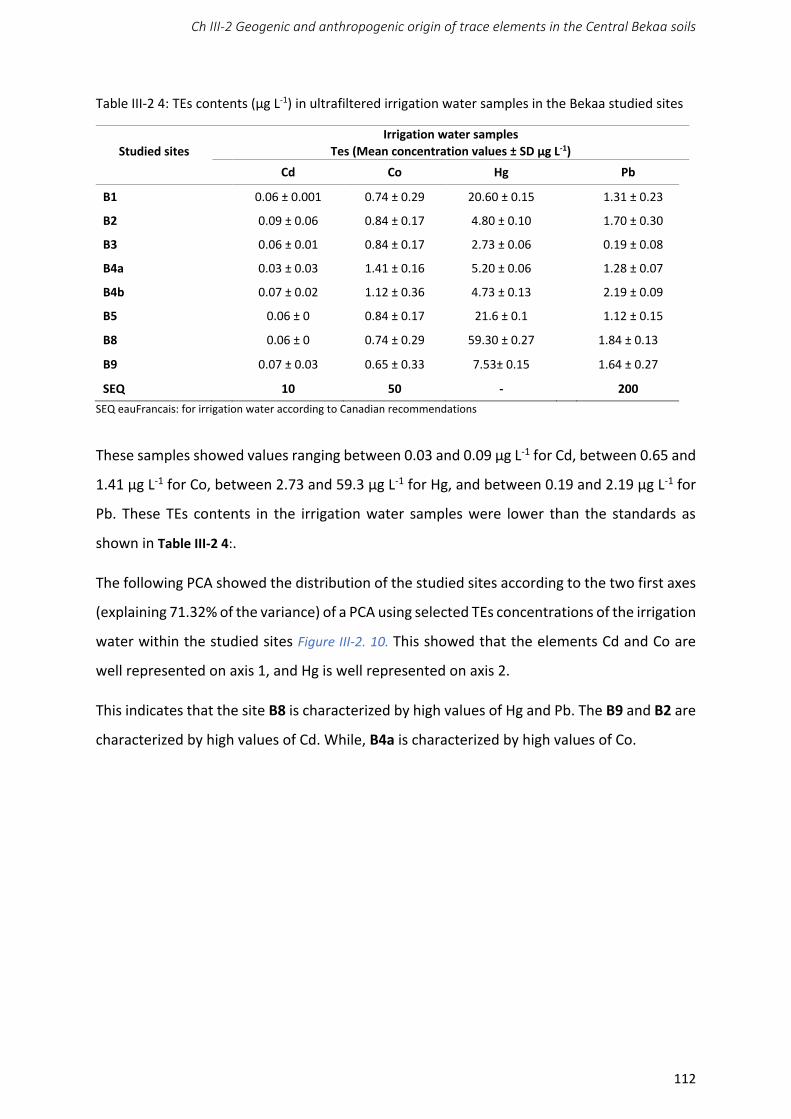
Ch III-2 Geogenic and anthropogenic origin of trace elements in the Central Bekaa soils
112
Table III-2 4: TEs contents (µg L-1) in ultrafiltered irrigation water samples in the Bekaa studied sites
Studied sites
Irrigation water samples
Tes (Mean concentration values ± SD µg L-1)
Cd Co Hg Pb
B1 0.06 ± 0.001 0.74 ± 0.29 20.60 ± 0.15 1.31 ± 0.23
B2 0.09 ± 0.06 0.84 ± 0.17 4.80 ± 0.10 1.70 ± 0.30
B3 0.06 ± 0.01 0.84 ± 0.17 2.73 ± 0.06 0.19 ± 0.08
B4a 0.03 ± 0.03 1.41 ± 0.16 5.20 ± 0.06 1.28 ± 0.07
B4b 0.07 ± 0.02 1.12 ± 0.36 4.73 ± 0.13 2.19 ± 0.09
B5 0.06 ± 0 0.84 ± 0.17 21.6 ± 0.1 1.12 ± 0.15
B8 0.06 ± 0 0.74 ± 0.29 59.30 ± 0.27 1.84 ± 0.13
B9 0.07 ± 0.03 0.65 ± 0.33 7.53± 0.15 1.64 ± 0.27
SEQ 10 50 - 200
SEQ eauFrancais: for irrigation water according to Canadian recommendations
These samples showed values ranging between 0.03 and 0.09 µg L-1 for Cd, between 0.65 and
1.41 µg L-1 for Co, between 2.73 and 59.3 µg L-1 for Hg, and between 0.19 and 2.19 µg L-1 for
Pb. These TEs contents in the irrigation water samples were lower than the standards as
shown in Table III-2 4:.
The following PCA showed the distribution of the studied sites according to the two first axes
(explaining 71.32% of the variance) of a PCA using selected TEs concentrations of the irrigation
water within the studied sites Figure III-2. 10. This showed that the elements Cd and Co are
well represented on axis 1, and Hg is well represented on axis 2.
This indicates that the site B8 is characterized by high values of Hg and Pb. The B9 and B2 are
characterized by high values of Cd. While, B4a is characterized by high values of Co.
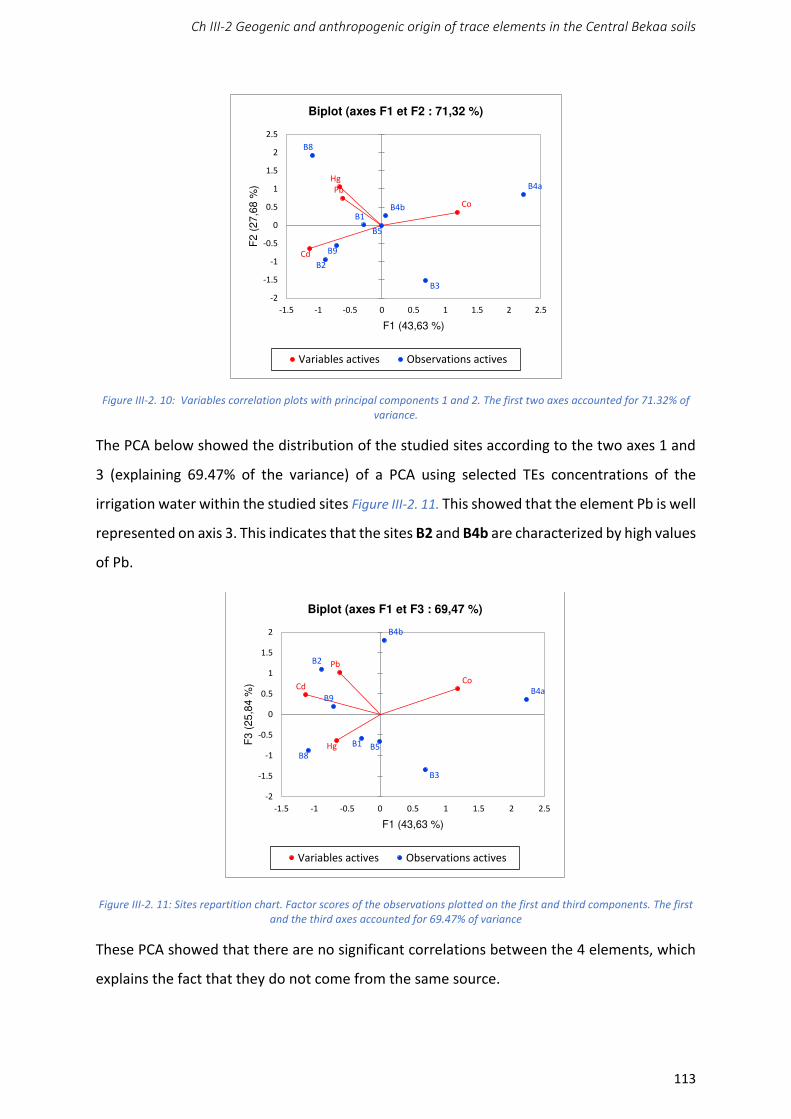
Ch III-2 Geogenic and anthropogenic origin of trace elements in the Central Bekaa soils
113
Figure III-2. 10: Variables correlation plots with principal components 1 and 2. The first two axes accounted for 71.32% of
variance.
The PCA below showed the distribution of the studied sites according to the two axes 1 and
3 (explaining 69.47% of the variance) of a PCA using selected TEs concentrations of the
irrigation water within the studied sites Figure III-2. 11. This showed that the element Pb is well
represented on axis 3. This indicates that the sites B2 and B4b are characterized by high values
of Pb.
Figure III-2. 11: Sites repartition chart. Factor scores of the observations plotted on the first and third components. The first
and the third axes accounted for 69.47% of variance
These PCA showed that there are no significant correlations between the 4 elements, which
explains the fact that they do not come from the same source.
Cd
Co
HgPb
B1
B2
B3
B4a
B4b
B5
B8
B9
-2
-1.5
-1
-0.5
0
0.5
1
1.5
2
2.5
-1.5 -1 -0.5 0 0.5 1 1.5 2 2.5
F2 (
27,6
8 %
)
F1 (43,63 %)
Biplot (axes F1 et F2 : 71,32 %)
Variables actives Observations actives
CdCo
Hg
Pb
B1
B2
B3
B4a
B4b
B5B8
B9
-2
-1.5
-1
-0.5
0
0.5
1
1.5
2
-1.5 -1 -0.5 0 0.5 1 1.5 2 2.5
F3 (
25,8
4 %
)
F1 (43,63 %)
Biplot (axes F1 et F3 : 69,47 %)
Variables actives Observations actives
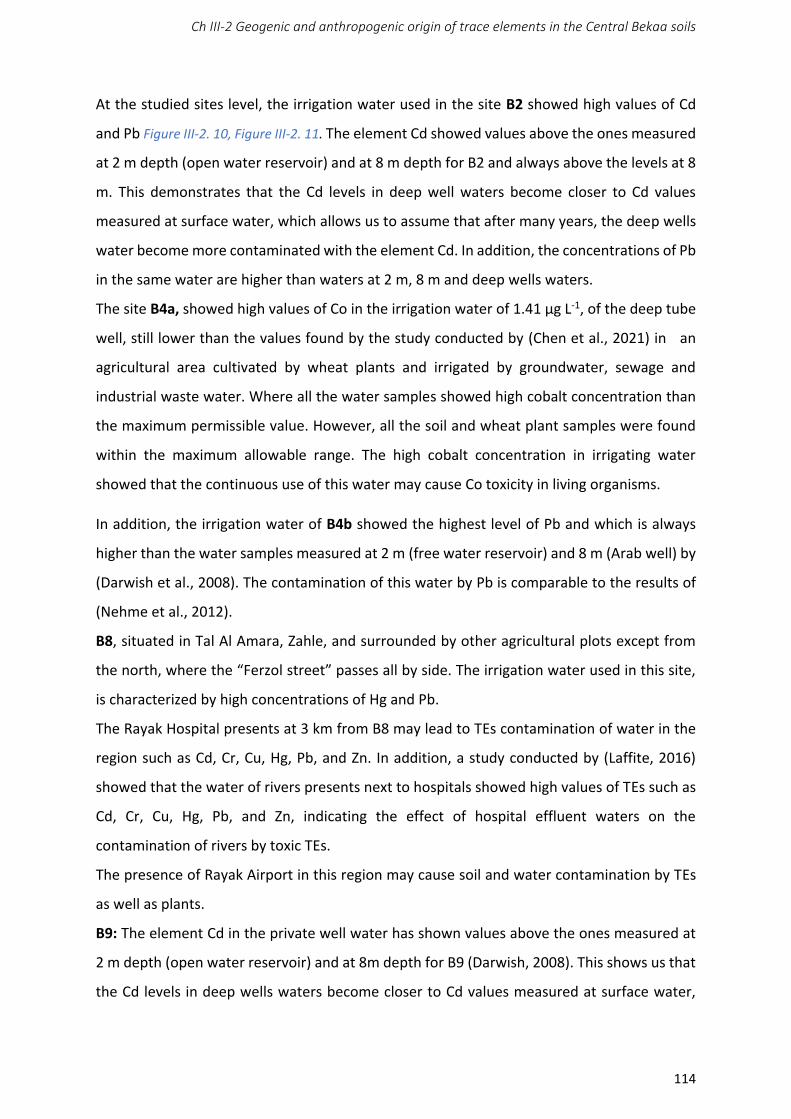
Ch III-2 Geogenic and anthropogenic origin of trace elements in the Central Bekaa soils
114
At the studied sites level, the irrigation water used in the site B2 showed high values of Cd
and Pb Figure III-2. 10, Figure III-2. 11. The element Cd showed values above the ones measured
at 2 m depth (open water reservoir) and at 8 m depth for B2 and always above the levels at 8
m. This demonstrates that the Cd levels in deep well waters become closer to Cd values
measured at surface water, which allows us to assume that after many years, the deep wells
water become more contaminated with the element Cd. In addition, the concentrations of Pb
in the same water are higher than waters at 2 m, 8 m and deep wells waters.
The site B4a, showed high values of Co in the irrigation water of 1.41 µg L-1, of the deep tube
well, still lower than the values found by the study conducted by (Chen et al., 2021) in an
agricultural area cultivated by wheat plants and irrigated by groundwater, sewage and
industrial waste water. Where all the water samples showed high cobalt concentration than
the maximum permissible value. However, all the soil and wheat plant samples were found
within the maximum allowable range. The high cobalt concentration in irrigating water
showed that the continuous use of this water may cause Co toxicity in living organisms.
In addition, the irrigation water of B4b showed the highest level of Pb and which is always
higher than the water samples measured at 2 m (free water reservoir) and 8 m (Arab well) by
(Darwish et al., 2008). The contamination of this water by Pb is comparable to the results of
(Nehme et al., 2012).
B8, situated in Tal Al Amara, Zahle, and surrounded by other agricultural plots except from
the north, where the “Ferzol street” passes all by side. The irrigation water used in this site,
is characterized by high concentrations of Hg and Pb.
The Rayak Hospital presents at 3 km from B8 may lead to TEs contamination of water in the
region such as Cd, Cr, Cu, Hg, Pb, and Zn. In addition, a study conducted by (Laffite, 2016)
showed that the water of rivers presents next to hospitals showed high values of TEs such as
Cd, Cr, Cu, Hg, Pb, and Zn, indicating the effect of hospital effluent waters on the
contamination of rivers by toxic TEs.
The presence of Rayak Airport in this region may cause soil and water contamination by TEs
as well as plants.
B9: The element Cd in the private well water has shown values above the ones measured at
2 m depth (open water reservoir) and at 8m depth for B9 (Darwish, 2008). This shows us that
the Cd levels in deep wells waters become closer to Cd values measured at surface water,
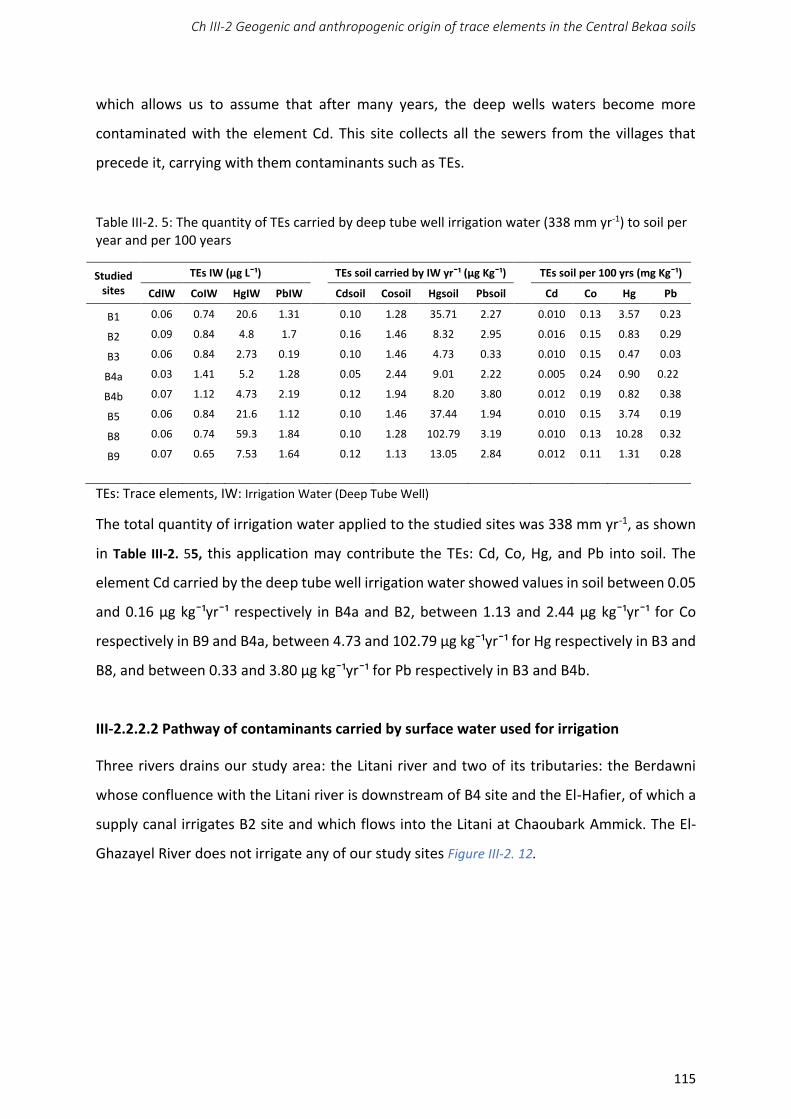
Ch III-2 Geogenic and anthropogenic origin of trace elements in the Central Bekaa soils
115
which allows us to assume that after many years, the deep wells waters become more
contaminated with the element Cd. This site collects all the sewers from the villages that
precede it, carrying with them contaminants such as TEs.
Table III-2. 5: The quantity of TEs carried by deep tube well irrigation water (338 mm yr-1) to soil per year and per 100 years
Studied sites
TEs IW (µg L¯¹) TEs soil carried by IW yr¯¹ (µg Kg¯¹) TEs soil per 100 yrs (mg Kg¯¹)
CdIW CoIW HgIW PbIW Cdsoil Cosoil Hgsoil Pbsoil Cd Co Hg Pb
B1 0.06 0.74 20.6 1.31 0.10 1.28 35.71 2.27 0.010 0.13 3.57 0.23
B2 0.09 0.84 4.8 1.7 0.16 1.46 8.32 2.95 0.016 0.15 0.83 0.29
B3 0.06 0.84 2.73 0.19 0.10 1.46 4.73 0.33 0.010 0.15 0.47 0.03
B4a 0.03 1.41 5.2 1.28 0.05 2.44 9.01 2.22 0.005 0.24 0.90 0.22
B4b 0.07 1.12 4.73 2.19 0.12 1.94 8.20 3.80 0.012 0.19 0.82 0.38
B5 0.06 0.84 21.6 1.12 0.10 1.46 37.44 1.94 0.010 0.15 3.74 0.19
B8 0.06 0.74 59.3 1.84 0.10 1.28 102.79 3.19 0.010 0.13 10.28 0.32
B9 0.07 0.65 7.53 1.64 0.12 1.13 13.05 2.84 0.012 0.11 1.31 0.28
TEs: Trace elements, IW: Irrigation Water (Deep Tube Well)
The total quantity of irrigation water applied to the studied sites was 338 mm yr-1, as shown
in Table III-2. 55, this application may contribute the TEs: Cd, Co, Hg, and Pb into soil. The
element Cd carried by the deep tube well irrigation water showed values in soil between 0.05
and 0.16 µg kg¯¹yr¯¹ respectively in B4a and B2, between 1.13 and 2.44 µg kg¯¹yr¯¹ for Co
respectively in B9 and B4a, between 4.73 and 102.79 µg kg¯¹yr¯¹ for Hg respectively in B3 and
B8, and between 0.33 and 3.80 µg kg¯¹yr¯¹ for Pb respectively in B3 and B4b.
III-2.2.2.2 Pathway of contaminants carried by surface water used for irrigation
Three rivers drains our study area: the Litani river and two of its tributaries: the Berdawni
whose confluence with the Litani river is downstream of B4 site and the El-Hafier, of which a
supply canal irrigates B2 site and which flows into the Litani at Chaoubark Ammick. The El-
Ghazayel River does not irrigate any of our study sites Figure III-2. 12.
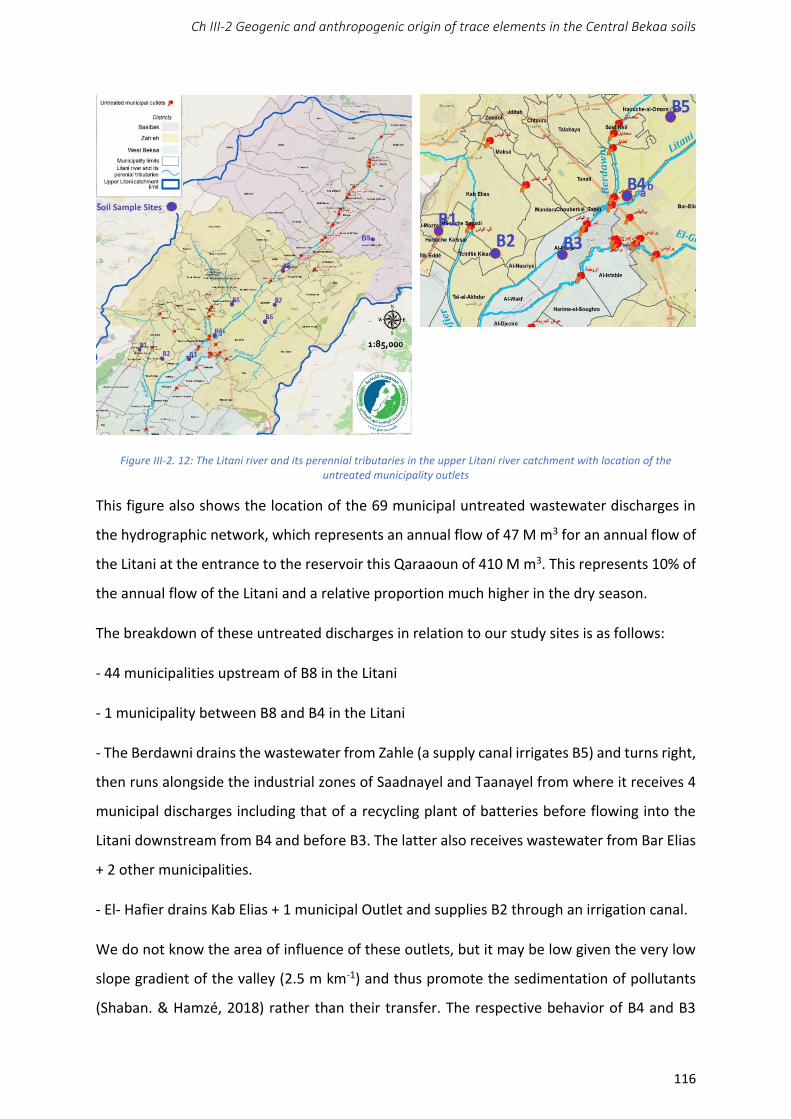
Ch III-2 Geogenic and anthropogenic origin of trace elements in the Central Bekaa soils
116
Figure III-2. 12: The Litani river and its perennial tributaries in the upper Litani river catchment with location of the
untreated municipality outlets
This figure also shows the location of the 69 municipal untreated wastewater discharges in
the hydrographic network, which represents an annual flow of 47 M m3 for an annual flow of
the Litani at the entrance to the reservoir this Qaraaoun of 410 M m3. This represents 10% of
the annual flow of the Litani and a relative proportion much higher in the dry season.
The breakdown of these untreated discharges in relation to our study sites is as follows:
- 44 municipalities upstream of B8 in the Litani
- 1 municipality between B8 and B4 in the Litani
- The Berdawni drains the wastewater from Zahle (a supply canal irrigates B5) and turns right,
then runs alongside the industrial zones of Saadnayel and Taanayel from where it receives 4
municipal discharges including that of a recycling plant of batteries before flowing into the
Litani downstream from B4 and before B3. The latter also receives wastewater from Bar Elias
+ 2 other municipalities.
- El- Hafier drains Kab Elias + 1 municipal Outlet and supplies B2 through an irrigation canal.
We do not know the area of influence of these outlets, but it may be low given the very low
slope gradient of the valley (2.5 m km-1) and thus promote the sedimentation of pollutants
(Shaban. & Hamzé, 2018) rather than their transfer. The respective behavior of B4 and B3
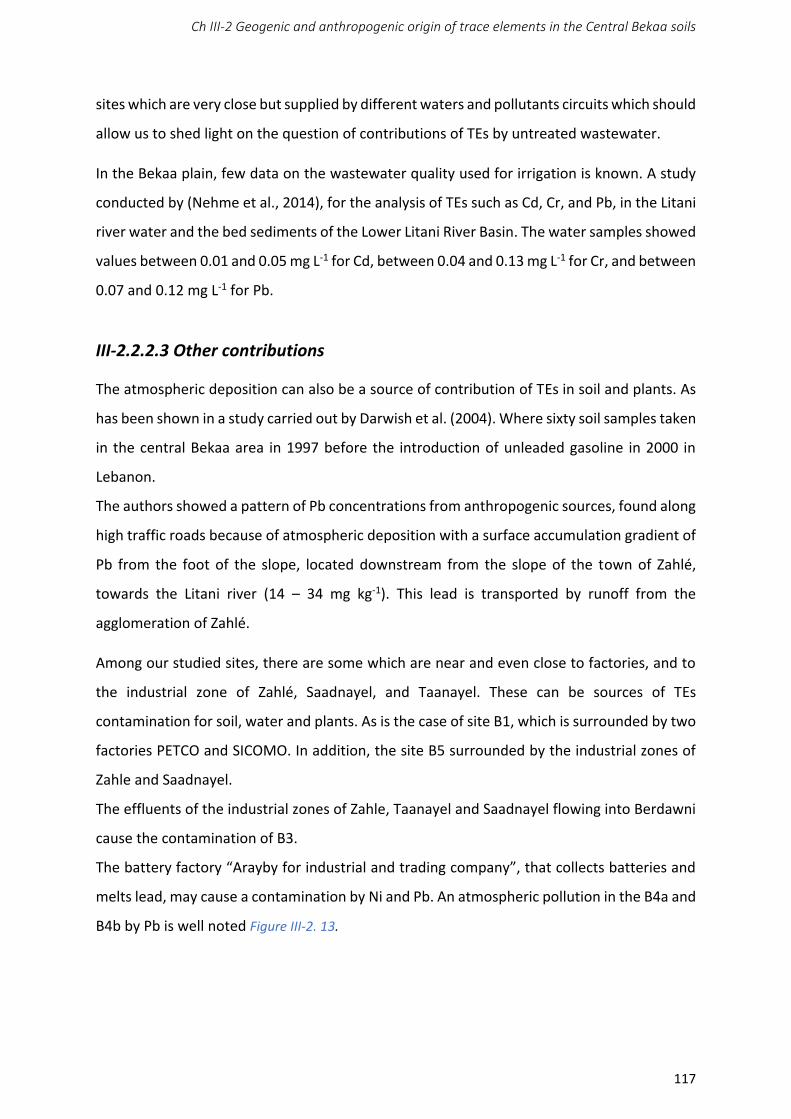
Ch III-2 Geogenic and anthropogenic origin of trace elements in the Central Bekaa soils
117
sites which are very close but supplied by different waters and pollutants circuits which should
allow us to shed light on the question of contributions of TEs by untreated wastewater.
In the Bekaa plain, few data on the wastewater quality used for irrigation is known. A study
conducted by (Nehme et al., 2014), for the analysis of TEs such as Cd, Cr, and Pb, in the Litani
river water and the bed sediments of the Lower Litani River Basin. The water samples showed
values between 0.01 and 0.05 mg L-1 for Cd, between 0.04 and 0.13 mg L-1 for Cr, and between
0.07 and 0.12 mg L-1 for Pb.
III-2.2.2.3 Other contributions
The atmospheric deposition can also be a source of contribution of TEs in soil and plants. As
has been shown in a study carried out by Darwish et al. (2004). Where sixty soil samples taken
in the central Bekaa area in 1997 before the introduction of unleaded gasoline in 2000 in
Lebanon.
The authors showed a pattern of Pb concentrations from anthropogenic sources, found along
high traffic roads because of atmospheric deposition with a surface accumulation gradient of
Pb from the foot of the slope, located downstream from the slope of the town of Zahlé,
towards the Litani river (14 – 34 mg kg-1). This lead is transported by runoff from the
agglomeration of Zahlé.
Among our studied sites, there are some which are near and even close to factories, and to
the industrial zone of Zahlé, Saadnayel, and Taanayel. These can be sources of TEs
contamination for soil, water and plants. As is the case of site B1, which is surrounded by two
factories PETCO and SICOMO. In addition, the site B5 surrounded by the industrial zones of
Zahle and Saadnayel.
The effluents of the industrial zones of Zahle, Taanayel and Saadnayel flowing into Berdawni
cause the contamination of B3.
The battery factory “Arayby for industrial and trading company”, that collects batteries and
melts lead, may cause a contamination by Ni and Pb. An atmospheric pollution in the B4a and
B4b by Pb is well noted Figure III-2. 13.
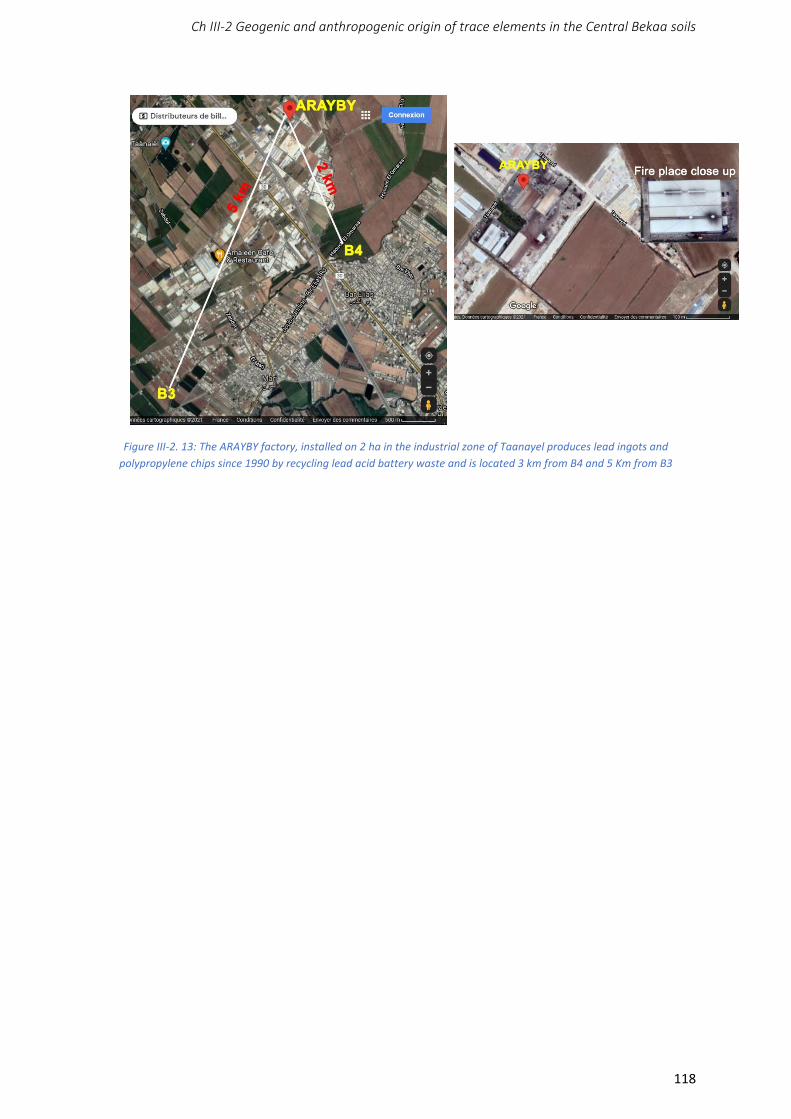
Ch III-2 Geogenic and anthropogenic origin of trace elements in the Central Bekaa soils
118
Figure III-2. 13: The ARAYBY factory, installed on 2 ha in the industrial zone of Taanayel produces lead ingots and
polypropylene chips since 1990 by recycling lead acid battery waste and is located 3 km from B4 and 5 Km from B3

Ch III-2 Geogenic and anthropogenic origin of trace elements in the Central Bekaa soils
119
III -2.3 Quantification and origin of trace elements available in the soil
The total and available (DTPAextraction) TEs were measured in soil samples of the studied
sites Table III-2.6. All the results are presented on the PCA Figure III-2. 14, Figure III-2. 15.
Table III-2.6: The total and the available TEs (DTPA extraction) concentrations in the studied soil samples (mg kg-1)
The total TEs measured in the studied soils present values between 4.35 and 11.3 mg kg-1 of
As respectively in B3 and B5. Between 0.23 and 0.48 mg kg-1 of Cd resepctively in B4b and B8.
The element Co showed values between 11.4 and 25.2 mg kg-1 respectively in (B3 and B4a)
and B5. The values of Cr varied between 55.8 and 129 mg kg-1 in respectively B4a and B5. The
Ni showed values between 39.4 and 78.9 mg kg-1 respectively in B4a and B5. The element Pb
presented values varying between 8.8 and 24.5 mg kg-1 in respectively B4b and B3. And the
values of Zn varied between 55.5 and 134 mg kg-1 in B4b and B8 respectively.
The available TEs by DTPA extraction Table III-2.6 showed values between 7.3 10-3 and 25.1 10-
3 mg kg-1 for As respectively in B4a and B9, between 27.4 10-3 and 81.4 10-3 mg kg-1 of Cd
respectively in B1 and B9, between 3.4 10-3 and 4.3 10-3 mg kg-1 of Cr respectively in B4b and
(B2, B8). And values between 0.05 and 0.69 mg kg-1 of Co respectively in B8 and B9, between
0.77 and 1.73 mg kg-1 of Cu respectively in B4b and B5, values ranging from 0.72 and 1.25 mg
kg-1 of Ni respectively in B8 and B4b, between 0.24 and 1.91 mg kg-1 of Pb respectively in B9
and B3, and between 0.54 and 9.56 mg kg-1 of Zn respectively in B8 and B2.
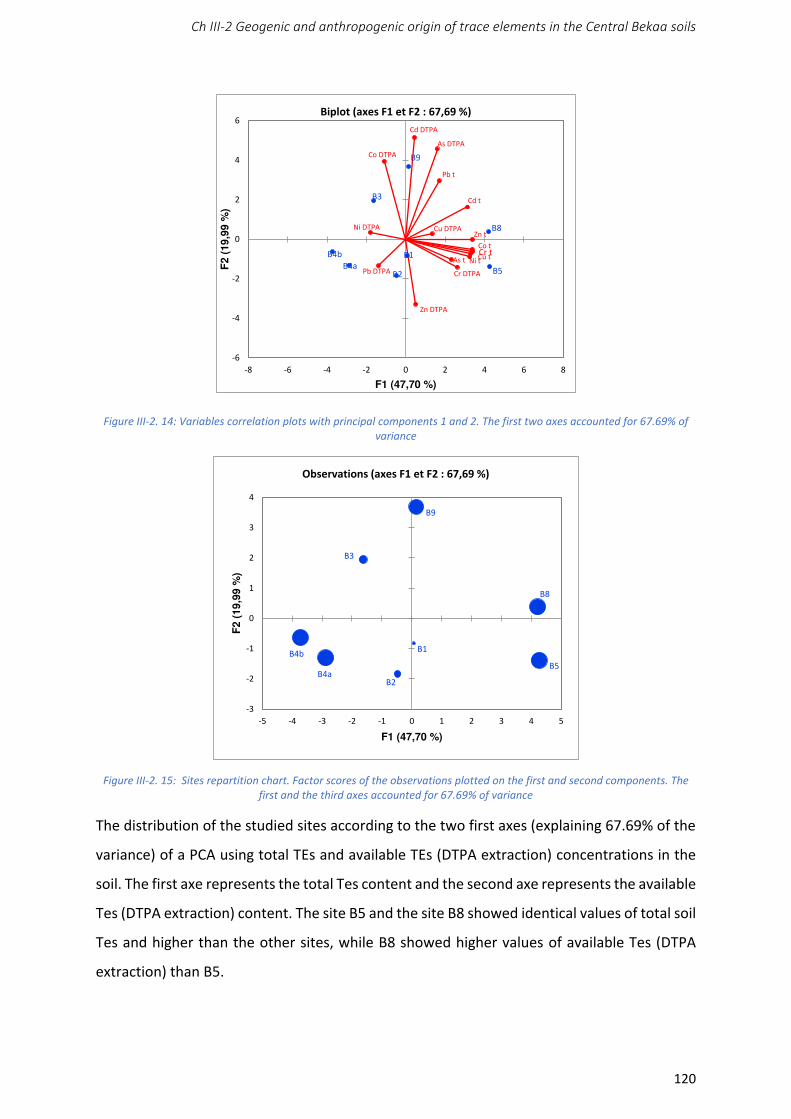
Ch III-2 Geogenic and anthropogenic origin of trace elements in the Central Bekaa soils
120
Figure III-2. 14: Variables correlation plots with principal components 1 and 2. The first two axes accounted for 67.69% of
variance
Figure III-2. 15: Sites repartition chart. Factor scores of the observations plotted on the first and second components. The
first and the third axes accounted for 67.69% of variance
The distribution of the studied sites according to the two first axes (explaining 67.69% of the
variance) of a PCA using total TEs and available TEs (DTPA extraction) concentrations in the
soil. The first axe represents the total Tes content and the second axe represents the available
Tes (DTPA extraction) content. The site B5 and the site B8 showed identical values of total soil
Tes and higher than the other sites, while B8 showed higher values of available Tes (DTPA
extraction) than B5.
B1
B2
B3
B4a
B4b
B5
B8
B9
Cr tCu t
Ni t
Zn t
Co t
As t
Cd t
Pb t
Pb DTPA Cr DTPA
Co DTPA
Ni DTPA Cu DTPA
Zn DTPA
As DTPA
Cd DTPA
-6
-4
-2
0
2
4
6
-8 -6 -4 -2 0 2 4 6 8
F2 (
19,9
9 %
)
F1 (47,70 %)
Biplot (axes F1 et F2 : 67,69 %)
B1
B2
B3
B4a
B4b
B5
B8
B9
-3
-2
-1
0
1
2
3
4
-5 -4 -3 -2 -1 0 1 2 3 4 5
F2 (
19,9
9 %
)
F1 (47,70 %)
Observations (axes F1 et F2 : 67,69 %)
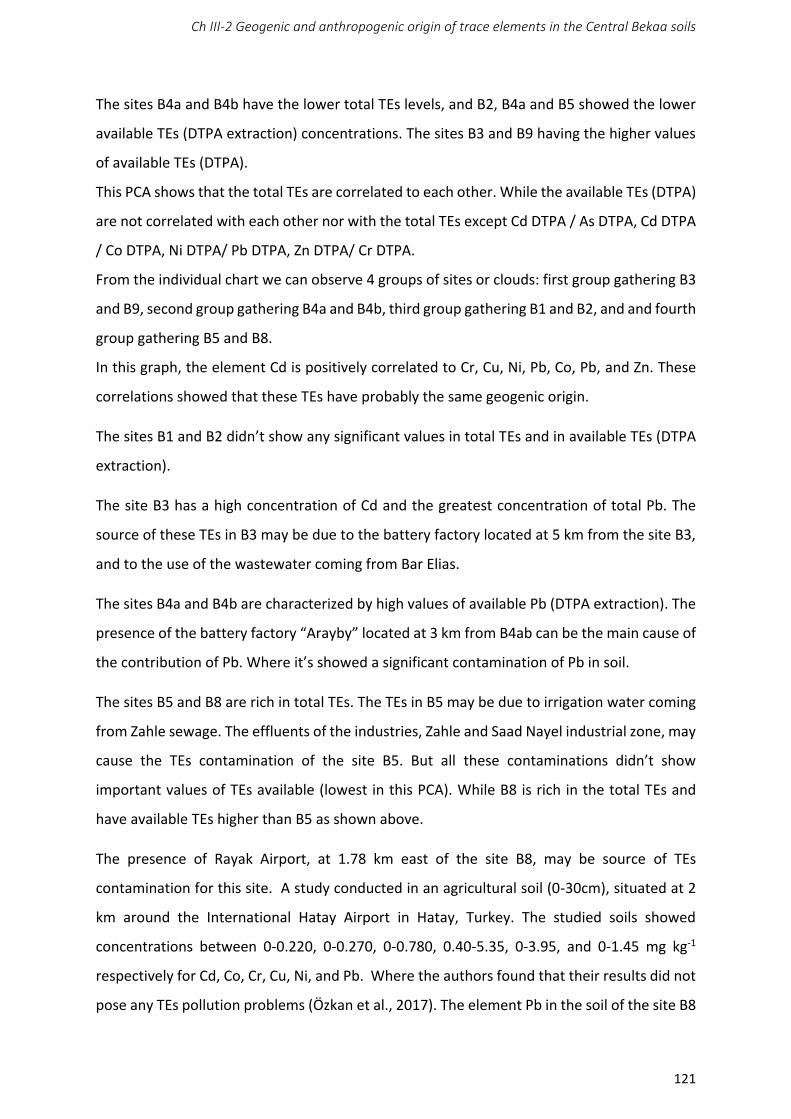
Ch III-2 Geogenic and anthropogenic origin of trace elements in the Central Bekaa soils
121
The sites B4a and B4b have the lower total TEs levels, and B2, B4a and B5 showed the lower
available TEs (DTPA extraction) concentrations. The sites B3 and B9 having the higher values
of available TEs (DTPA).
This PCA shows that the total TEs are correlated to each other. While the available TEs (DTPA)
are not correlated with each other nor with the total TEs except Cd DTPA / As DTPA, Cd DTPA
/ Co DTPA, Ni DTPA/ Pb DTPA, Zn DTPA/ Cr DTPA.
From the individual chart we can observe 4 groups of sites or clouds: first group gathering B3
and B9, second group gathering B4a and B4b, third group gathering B1 and B2, and and fourth
group gathering B5 and B8.
In this graph, the element Cd is positively correlated to Cr, Cu, Ni, Pb, Co, Pb, and Zn. These
correlations showed that these TEs have probably the same geogenic origin.
The sites B1 and B2 didn’t show any significant values in total TEs and in available TEs (DTPA
extraction).
The site B3 has a high concentration of Cd and the greatest concentration of total Pb. The
source of these TEs in B3 may be due to the battery factory located at 5 km from the site B3,
and to the use of the wastewater coming from Bar Elias.
The sites B4a and B4b are characterized by high values of available Pb (DTPA extraction). The
presence of the battery factory “Arayby” located at 3 km from B4ab can be the main cause of
the contribution of Pb. Where it’s showed a significant contamination of Pb in soil.
The sites B5 and B8 are rich in total TEs. The TEs in B5 may be due to irrigation water coming
from Zahle sewage. The effluents of the industries, Zahle and Saad Nayel industrial zone, may
cause the TEs contamination of the site B5. But all these contaminations didn’t show
important values of TEs available (lowest in this PCA). While B8 is rich in the total TEs and
have available TEs higher than B5 as shown above.
The presence of Rayak Airport, at 1.78 km east of the site B8, may be source of TEs
contamination for this site. A study conducted in an agricultural soil (0-30cm), situated at 2
km around the International Hatay Airport in Hatay, Turkey. The studied soils showed
concentrations between 0-0.220, 0-0.270, 0-0.780, 0.40-5.35, 0-3.95, and 0-1.45 mg kg-1
respectively for Cd, Co, Cr, Cu, Ni, and Pb. Where the authors found that their results did not
pose any TEs pollution problems (Özkan et al., 2017). The element Pb in the soil of the site B8
Ch III-2 Geogenic and anthropogenic origin of trace elements in the Central Bekaa soils
122
showed highest values (19.5 mg kg-1) comparing to these results. This may explain to us that
the presence of the airport does not present a risk for the contamination of neighboring soils,
and therefore the presence of high levels of Pb in the soil of B8, may be due to other sources
such as the used contaminated irrigation water from the Bekaa outlets.
In addition, the chicken slaughterhouses located near the site B8 may cause environmental
problem and be a source of TEs contamination. Where the effluents discharged from the
animal processing operations. For hygienic reasons, the chicken slaughterhouses use large
amounts of water in animal processing operations. The effluents may contain high amounts
of TEs which they are mainly coming from animal feed additives, food processing industry and
chemical treatment (Marianna, M., 2012; ISBN 978-953-51-0204-5). However, long-term
effluent discharge increases TEs levels in soil such as Cd, Co, Ni, Cu and Cr, which can lead to
the pollution of surface and groundwater resources (Matheyarasu et al., 2014).
The B9 site is characterized by As DTPA, Cd DTPA, and Co DTPA. In addition, The DTPA
extractable Cd was highest at site B9. Therefore, this allows us to expect high values of As, Cd,
and Co in soil which may be due to the runoff from the higher villages Figure III-2.14.
III -2.4 Conclusion
This interdisciplinary work aimed to follow the trace elements in the Lebanese white bread
industry: From the soil to the consumed bread, from farm to fork, combining the agronomic
and agrifood skills. But the field reality allowed us to study 2 segments of the chain: On the
one hand, the transfer of trace elements from the soil to the wheat grain, taking into account
the fertilization and the irrigation water. On the other hand, the exposure of the Lebanese
population linked to the Lebanese bread consumption: wheat used for making bread from
imports, as well as phosphate fertilizers.
Chapters III-1 and III-2 showed the soils studied in the Central Bekaa region, the geogenic and
anthropogenic origin of the trace elements in these soils, as well as the new method used and
validated for the analyses of the trace elements in these soils.
These chapters have shown us that between the source of the Litani and the site B8, there
are 44 discharges, this site is rich in total and available trace elements and high Pb contents
which may be due to the contaminated irrigation water by discharges of wastewater from the
Ch III-2 Geogenic and anthropogenic origin of trace elements in the Central Bekaa soils
123
district of Baalbeck. It has been observed that the site B3 can receive its contamination from
the effluents of the industrial zones of Zahlé, Taanayel and Saadnayel flowing into Berdawni
and from the wastewater coming from Bar Elias.
The presence of the battery recycling plant located 2 km from B4ab, which collects the
batteries and melts the lead, can cause contamination by Ni and Pb. It may also be the main
cause of Pb input, where it has shown significant contamination of Pb in the soil. In addition,
atmospheric pollution in B4a and B4b by Pb is well noted.
Site B5, which is located downstream of the Zahlé industrial zone and is fed by irrigation
canals, is rich in total trace elements (probably of geogenic origin: alluvial cone) and poor in
available trace elements. This may be due to irrigation water coming from Zahlé wastewater.
The site B9 which has no Surface Water, showed high values of As, Cd and Co available in the
soil, this could be due to runoff from villages located upstream.
The sites B8 and B4 as shown above, present various contaminations: B8 taking water from
the Litani at the outlet of the Baalbeck district and which is very polluted, while B4 taking this
water at the outlet of the Zahlé district and which is the least contaminated site. This
difference in contamination is explained by the fact that the slope of the Litani in the Central
Bekaa is very low, the water flow is slow which favors the sedimentation of trace elements.
In addition, abundant ephemeral springs on the western slope of the central Bekaa, fed by
the snowmelt, supply the Litani with unpolluted water and further reduce the concentrations
of trace elements by dilution. Finally, the observation of a single untreated sewer discharge
on this section crossing the mainly agricultural Zahlé district could explain the original
situation.
In conclusion, we can summarize that the contamination of these sites is anthropogenic from
industrial activities and runoff. In addition, we emphasize the need to consider the entire
hydrological functioning of the system formed by the Bekaa Valley and the two mountain
ranges that surround it to determine the origin of TEs contamination to manage it.
Ch III-3 Transfer of trace elements to wheat plant
124
CHAPTER III-3
Transfer of trace elements
to wheat plant
Analysis according to soil
types, silicon status and
origin of trace elements
Ch III-3 Transfer of trace elements to wheat plant
125
III-3.1 Introduction
The set of soils used for the soil-plant transfer study is slightly different and smaller than that
used for the soil-alone study and presented in the previous chapter. Arsenic, Cd and Pb were
considered. They were selected because they belong to the most problematic elements for
human health worldwide. Drinking water and foodstuffs are indeed the two main sources of
inorganic As (ESFA, 2009; Schoof et al., 1999; Cubadda et al., 2010), and wheat has been
identified as an emerging exposure route for arsenic in India (Suman et al., 2020). Cadmium
is readily transferred to plants, especially wheat grain, while Pb was one of the four trace
elements, together with Cd, mercury and tin that was given a special attention at the EU level
with regulatory thresholds in foodstuffs: maximum levels for Pb and Cd in wheat grain were
set up to 0.2 mg kg-1 wet weight by the European Commission (COMMISSION REGULATION
(EC) No 1881, 2006). As presented in Chapter III-1, wheat is the main cereal crop produced in
Lebanon (GIEWS, 2020).
In the chapter, we intend to find out whether wheat might be a significant source of As, Cd
and Pb, to decipher the link between the concentrations measured in wheat and those
observed in soils. Because the set of sites is not similar to that presented and discussed in
Chapter III-2, we will briefly present the 8 soils, their trace element concentrations and the
relationship with the pedological, physico-chemical properties and environmental
characteristics. We will then present and discuss the bioavailable concentrations as defined
by DTPA extractions and, we will present and discuss As, Cd and Pb concentrations in wheat
and their relationship with soil characteristics, including bioavailable Si.
III-3.2 Trace element concentrations in soils
All soils of the 8 sites Table III-2.1 (cf Ch III-2) were in the lower range of concentrations found
in soils worldwide for all trace elements, including As, Pb and Cd (Kabata-Pendias and
Mukherjee, 2007). More in details, as for the main soil set (cf Ch III-2), As was only correlated
to Co and Ni Table III-3.1 Annex, which may be related to a more scattered occurrence due
to anthropogenic inputs (Darwish et al. 2021) or a common geogenic origin given the low
measured As concentrations falling within the lower range of As concentrations in surface
soils worldwide (Adriano, 2001). The B5 soil presented the highest As concentrations (and
Ch III-3 Transfer of trace elements to wheat plant
126
other metals) probably due to its proximity with the town of Zahle and irrigation from the
Berdawni River.
On the contrary Pb was not correlated to any of the other elements (cf Ch III-2 Figure III-2.14)
highlighting a probable scattered contamination from traffic. Even in this eventuality, Pb
concentrations were lower than the mean worldwide Pb value (25 mg kg-1) Kabata-Pendias
and Mukherjee (2007) and, within the ranges of values reported by Adriano (2001). The Pb
concentrations of the studied sites are also in general agreement with the values of the Pb
map provided by Darwish et al. (2021) and those obtained in other Lebanese soils (11.3 – 22.9
mg kg-1) (Darwish et al., 2008), including soils of Central Bekaa (Taalabaya and Saadnayel
soils). The B3 site presented the highest Pb concentration, which can be explained by its
location downstream of the Litani River, the Zahle and Bar Elias towns and, most likely, by a
nearby recycling batteries smelter.
Cadmium concentrations were within the range of soil Cd average concentrations found
worldwide (Adriano, 2001; Kabata-Pendias and Mukherjee, 2007). Our values were lower
than those found by Kanbar et al. (2014) in some Lebanese soils, South of the Bekaa plain and,
within the range of those found by Darwish. et al. (2008) in Central Bekaa (0.28 – 0.48 mg kg-
1). However, unlike As and Pb, Cd concentrations were correlated to all other total trace
element concentrations (except for As and Pb), strongly calling for a geogenic origin as also
concluded by Nsouli et al. ( 2004) for North Lebanon soils.
We can conclude on both a natural TEs source with variation explained by the alluvial-colluvial
origin of the parent material, and soil type of various ages and, a limited anthropogenic
pollution due to inputs from irrigation and fertilizers and, atmospheric deposition from traffic
emissions or smelter, especially for the B3 and B5 sites.
In a similar Mediterranean environment, (Austruy et al., 2016) calculated an average natural
pedogeochemical background similar for Pb and Cd or slightly higher for As than the
concentrations obtained for the 8 sites. They also found that background concentrations were
higher for alluvial parent materials than for calcareous ones as observed at the studied sites.
This is an additional support to a limited soil contamination. Unfortunately, it is not possible
here to calculate similar average natural pedogeochemical background or enrichment factors
because we had no data on deep soil horizons. However, again, calculating ratios between
As, Pb and Cd and Fe or Al, we found that all sites fell within the same range except Pb for B3.
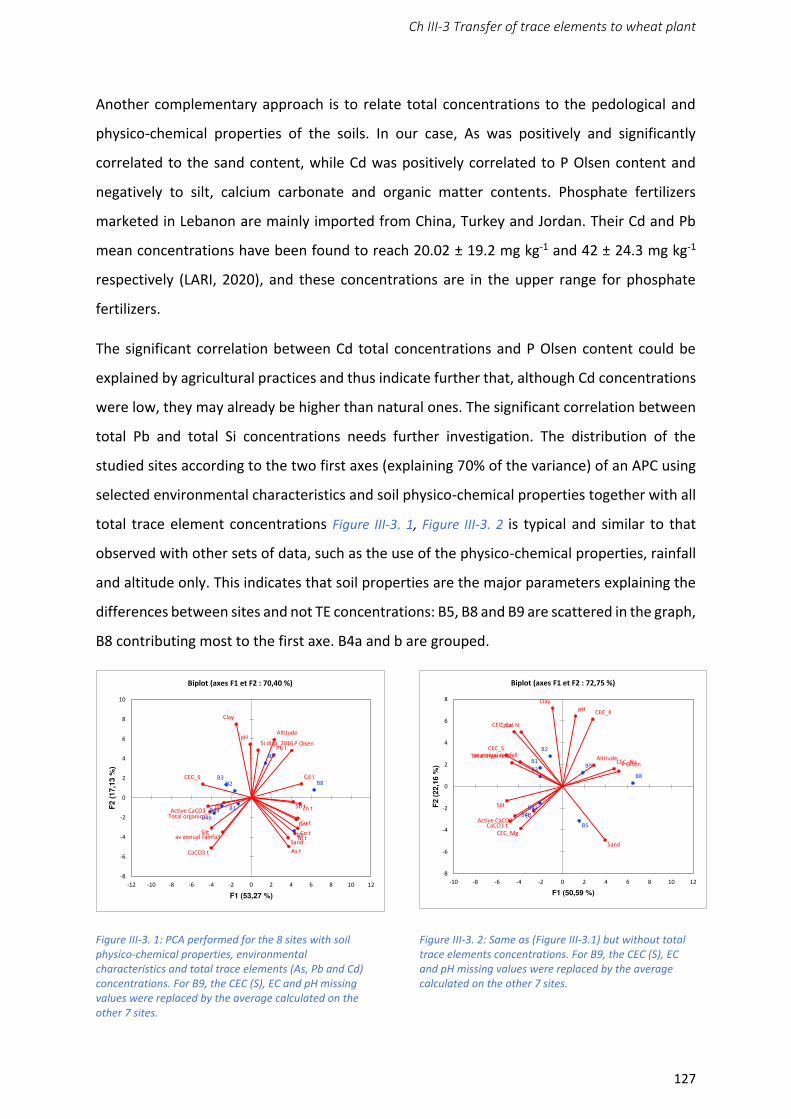
Ch III-3 Transfer of trace elements to wheat plant
127
Another complementary approach is to relate total concentrations to the pedological and
physico-chemical properties of the soils. In our case, As was positively and significantly
correlated to the sand content, while Cd was positively correlated to P Olsen content and
negatively to silt, calcium carbonate and organic matter contents. Phosphate fertilizers
marketed in Lebanon are mainly imported from China, Turkey and Jordan. Their Cd and Pb
mean concentrations have been found to reach 20.02 ± 19.2 mg kg-1 and 42 ± 24.3 mg kg-1
respectively (LARI, 2020), and these concentrations are in the upper range for phosphate
fertilizers.
The significant correlation between Cd total concentrations and P Olsen content could be
explained by agricultural practices and thus indicate further that, although Cd concentrations
were low, they may already be higher than natural ones. The significant correlation between
total Pb and total Si concentrations needs further investigation. The distribution of the
studied sites according to the two first axes (explaining 70% of the variance) of an APC using
selected environmental characteristics and soil physico-chemical properties together with all
total trace element concentrations Figure III-3. 1, Figure III-3. 2 is typical and similar to that
observed with other sets of data, such as the use of the physico-chemical properties, rainfall
and altitude only. This indicates that soil properties are the major parameters explaining the
differences between sites and not TE concentrations: B5, B8 and B9 are scattered in the graph,
B8 contributing most to the first axe. B4a and b are grouped.
Figure III-3. 1: PCA performed for the 8 sites with soil
physico-chemical properties, environmental
characteristics and total trace elements (As, Pb and Cd)
concentrations. For B9, the CEC (S), EC and pH missing
values were replaced by the average calculated on the
other 7 sites.
Figure III-3. 2: Same as (Figure III-3.1) but without total
trace elements concentrations. For B9, the CEC (S), EC
and pH missing values were replaced by the average
calculated on the other 7 sites.
B1
B2B3
B4aB4b
B5
B8
B9
Altitude
av annual rainfall
pH
EC
Clay
Silt
Sand
CaCO3 t
Active CaCO3Total organic C
P Olsen
CEC_S
Sb t
Cr tCu t
Ni t
Zn t
Co t
As t
Cd t
Pb tSi disp_2016
-8
-6
-4
-2
0
2
4
6
8
10
-12 -10 -8 -6 -4 -2 0 2 4 6 8 10 12
F2 (
17,1
3 %
)
F1 (53,27 %)
Biplot (axes F1 et F2 : 70,40 %)
B1
B2
B3
B4aB4b
B5
B8
B9Altitude
av annual rainfall
pH
EC
Clay
Silt
Sand
CaCO3 tActive CaCO3
Total organic C
Total N
P Olsen
CEC_Ca
CEC_Mg
CEC_K
CEC_Na
CEC_S
-8
-6
-4
-2
0
2
4
6
8
-10 -8 -6 -4 -2 0 2 4 6 8 10 12
F2 (
22,1
6 %
)
F1 (50,59 %)
Biplot (axes F1 et F2 : 72,75 %)
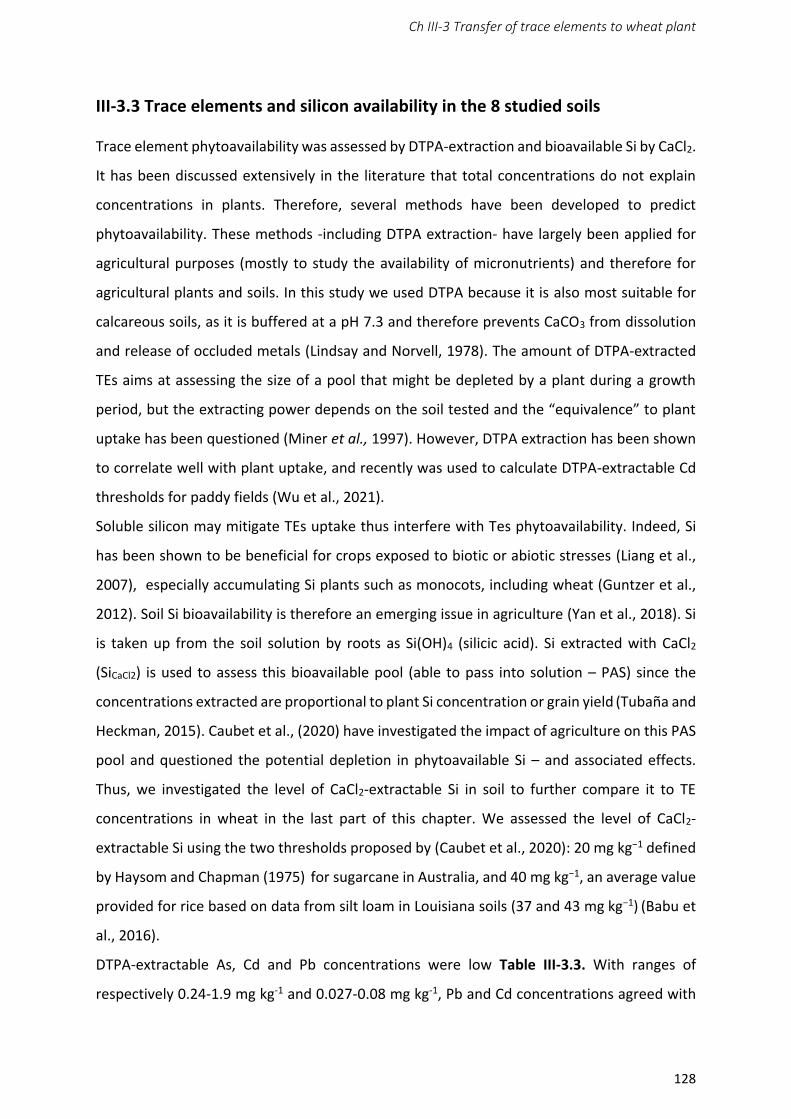
Ch III-3 Transfer of trace elements to wheat plant
128
III-3.3 Trace elements and silicon availability in the 8 studied soils
Trace element phytoavailability was assessed by DTPA-extraction and bioavailable Si by CaCl2.
It has been discussed extensively in the literature that total concentrations do not explain
concentrations in plants. Therefore, several methods have been developed to predict
phytoavailability. These methods -including DTPA extraction- have largely been applied for
agricultural purposes (mostly to study the availability of micronutrients) and therefore for
agricultural plants and soils. In this study we used DTPA because it is also most suitable for
calcareous soils, as it is buffered at a pH 7.3 and therefore prevents CaCO3 from dissolution
and release of occluded metals (Lindsay and Norvell, 1978). The amount of DTPA-extracted
TEs aims at assessing the size of a pool that might be depleted by a plant during a growth
period, but the extracting power depends on the soil tested and the “equivalence” to plant
uptake has been questioned (Miner et al., 1997). However, DTPA extraction has been shown
to correlate well with plant uptake, and recently was used to calculate DTPA-extractable Cd
thresholds for paddy fields (Wu et al., 2021).
Soluble silicon may mitigate TEs uptake thus interfere with Tes phytoavailability. Indeed, Si
has been shown to be beneficial for crops exposed to biotic or abiotic stresses (Liang et al.,
2007), especially accumulating Si plants such as monocots, including wheat (Guntzer et al.,
2012). Soil Si bioavailability is therefore an emerging issue in agriculture (Yan et al., 2018). Si
is taken up from the soil solution by roots as Si(OH)4 (silicic acid). Si extracted with CaCl2
(SiCaCl2) is used to assess this bioavailable pool (able to pass into solution – PAS) since the
concentrations extracted are proportional to plant Si concentration or grain yield (Tubaña and
Heckman, 2015). Caubet et al., (2020) have investigated the impact of agriculture on this PAS
pool and questioned the potential depletion in phytoavailable Si – and associated effects.
Thus, we investigated the level of CaCl2-extractable Si in soil to further compare it to TE
concentrations in wheat in the last part of this chapter. We assessed the level of CaCl2-
extractable Si using the two thresholds proposed by (Caubet et al., 2020): 20 mg kg−1 defined
by Haysom and Chapman (1975) for sugarcane in Australia, and 40 mg kg−1, an average value
provided for rice based on data from silt loam in Louisiana soils (37 and 43 mg kg−1) (Babu et
al., 2016).
DTPA-extractable As, Cd and Pb concentrations were low Table III-3.3. With ranges of
respectively 0.24-1.9 mg kg-1 and 0.027-0.08 mg kg-1, Pb and Cd concentrations agreed with
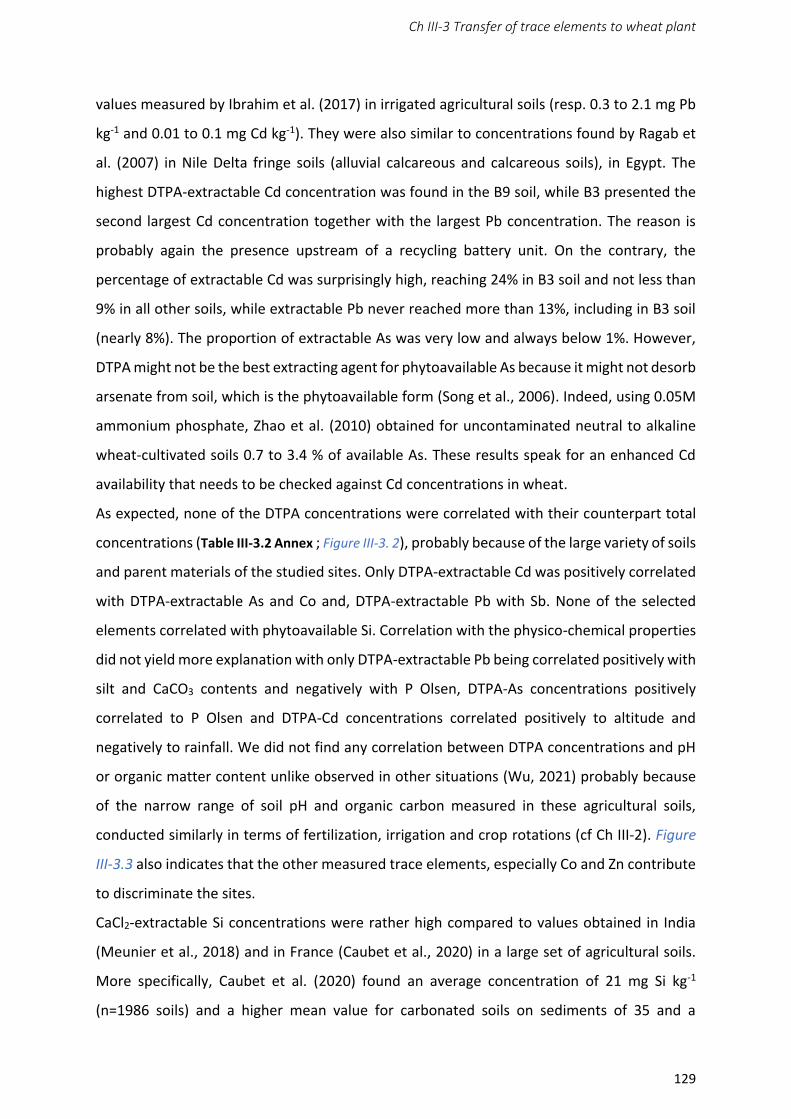
Ch III-3 Transfer of trace elements to wheat plant
129
values measured by Ibrahim et al. (2017) in irrigated agricultural soils (resp. 0.3 to 2.1 mg Pb
kg-1 and 0.01 to 0.1 mg Cd kg-1). They were also similar to concentrations found by Ragab et
al. (2007) in Nile Delta fringe soils (alluvial calcareous and calcareous soils), in Egypt. The
highest DTPA-extractable Cd concentration was found in the B9 soil, while B3 presented the
second largest Cd concentration together with the largest Pb concentration. The reason is
probably again the presence upstream of a recycling battery unit. On the contrary, the
percentage of extractable Cd was surprisingly high, reaching 24% in B3 soil and not less than
9% in all other soils, while extractable Pb never reached more than 13%, including in B3 soil
(nearly 8%). The proportion of extractable As was very low and always below 1%. However,
DTPA might not be the best extracting agent for phytoavailable As because it might not desorb
arsenate from soil, which is the phytoavailable form (Song et al., 2006). Indeed, using 0.05M
ammonium phosphate, Zhao et al. (2010) obtained for uncontaminated neutral to alkaline
wheat-cultivated soils 0.7 to 3.4 % of available As. These results speak for an enhanced Cd
availability that needs to be checked against Cd concentrations in wheat.
As expected, none of the DTPA concentrations were correlated with their counterpart total
concentrations (Table III-3.2 Annex ; Figure III-3. 2), probably because of the large variety of soils
and parent materials of the studied sites. Only DTPA-extractable Cd was positively correlated
with DTPA-extractable As and Co and, DTPA-extractable Pb with Sb. None of the selected
elements correlated with phytoavailable Si. Correlation with the physico-chemical properties
did not yield more explanation with only DTPA-extractable Pb being correlated positively with
silt and CaCO3 contents and negatively with P Olsen, DTPA-As concentrations positively
correlated to P Olsen and DTPA-Cd concentrations correlated positively to altitude and
negatively to rainfall. We did not find any correlation between DTPA concentrations and pH
or organic matter content unlike observed in other situations (Wu, 2021) probably because
of the narrow range of soil pH and organic carbon measured in these agricultural soils,
conducted similarly in terms of fertilization, irrigation and crop rotations (cf Ch III-2). Figure
III-3.3 also indicates that the other measured trace elements, especially Co and Zn contribute
to discriminate the sites.
CaCl2-extractable Si concentrations were rather high compared to values obtained in India
(Meunier et al., 2018) and in France (Caubet et al., 2020) in a large set of agricultural soils.
More specifically, Caubet et al. (2020) found an average concentration of 21 mg Si kg-1
(n=1986 soils) and a higher mean value for carbonated soils on sediments of 35 and a
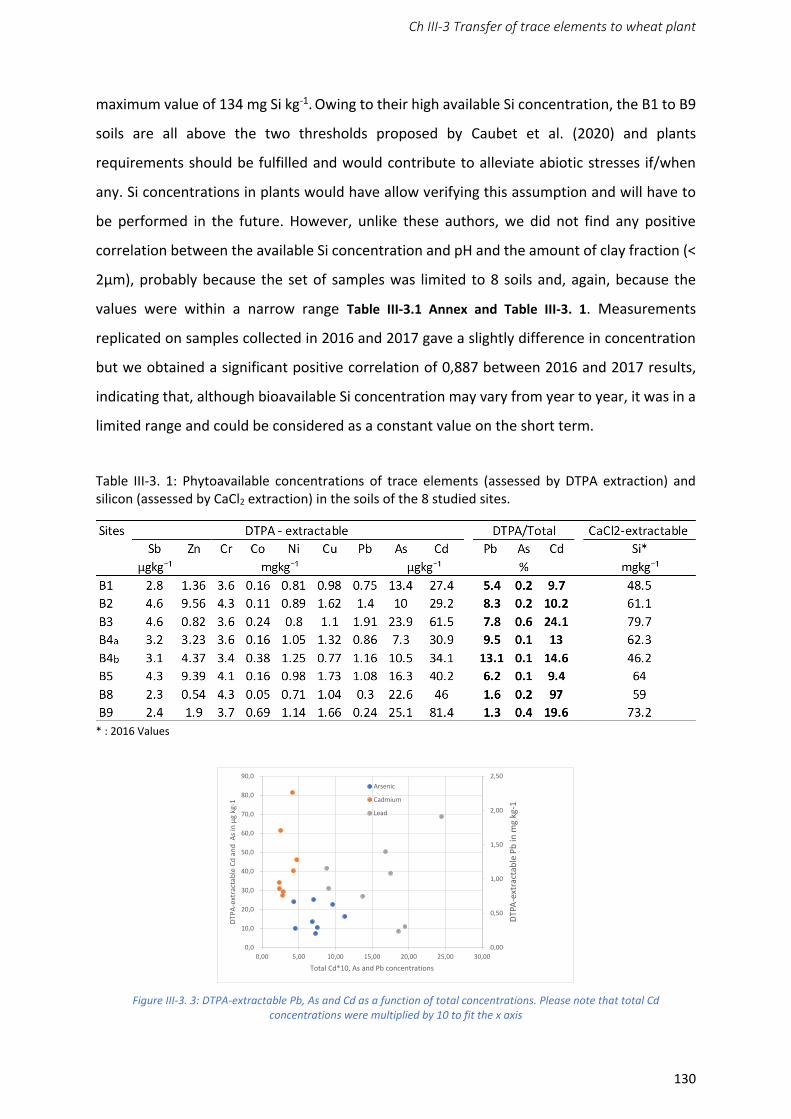
Ch III-3 Transfer of trace elements to wheat plant
130
maximum value of 134 mg Si kg-1. Owing to their high available Si concentration, the B1 to B9
soils are all above the two thresholds proposed by Caubet et al. (2020) and plants
requirements should be fulfilled and would contribute to alleviate abiotic stresses if/when
any. Si concentrations in plants would have allow verifying this assumption and will have to
be performed in the future. However, unlike these authors, we did not find any positive
correlation between the available Si concentration and pH and the amount of clay fraction (<
2µm), probably because the set of samples was limited to 8 soils and, again, because the
values were within a narrow range Table III-3.1 Annex and Table III-3. 1. Measurements
replicated on samples collected in 2016 and 2017 gave a slightly difference in concentration
but we obtained a significant positive correlation of 0,887 between 2016 and 2017 results,
indicating that, although bioavailable Si concentration may vary from year to year, it was in a
limited range and could be considered as a constant value on the short term.
Table III-3. 1: Phytoavailable concentrations of trace elements (assessed by DTPA extraction) and silicon (assessed by CaCl2 extraction) in the soils of the 8 studied sites.
* : 2016 Values
Figure III-3. 3: DTPA-extractable Pb, As and Cd as a function of total concentrations. Please note that total Cd
concentrations were multiplied by 10 to fit the x axis
0,00
0,50
1,00
1,50
2,00
2,50
0,0
10,0
20,0
30,0
40,0
50,0
60,0
70,0
80,0
90,0
0,00 5,00 10,00 15,00 20,00 25,00 30,00
DTP
A-e
xtra
ctab
le P
b in
mg
kg-1
DTP
A-e
xtra
ctab
le C
d a
nd
As
in µ
g kg
-1
Total Cd*10, As and Pb concentrations
Arsenic
Cadmium
Lead
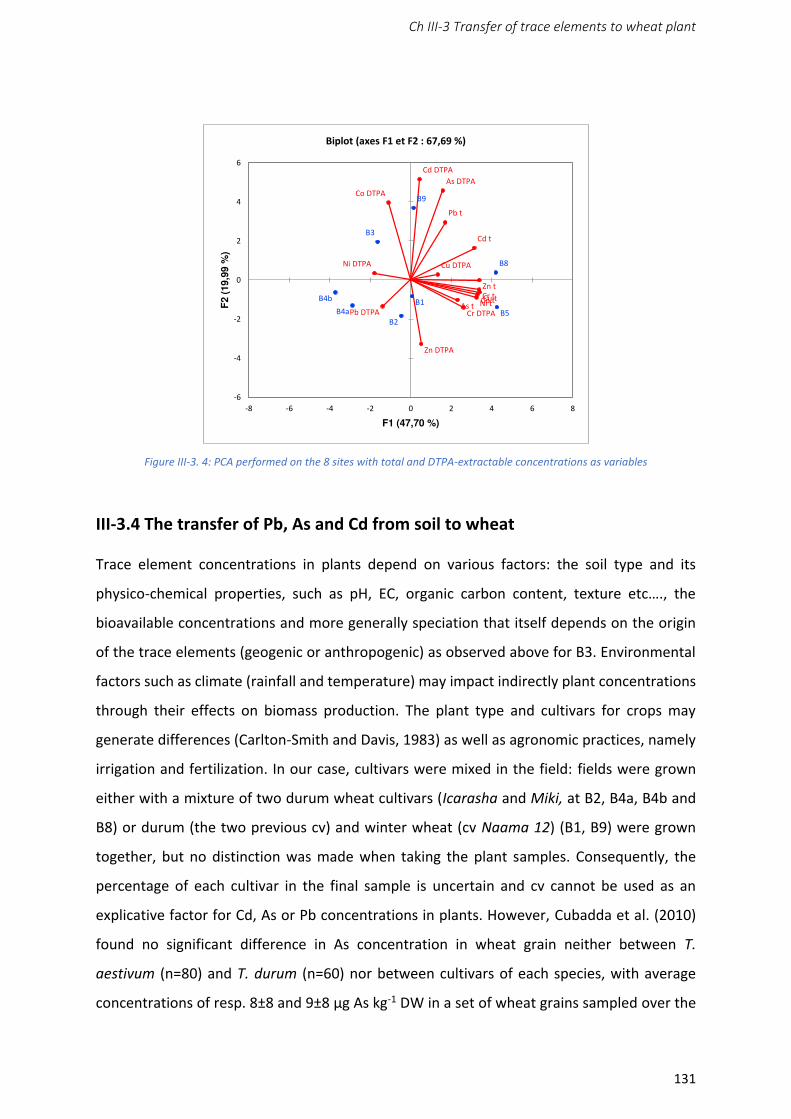
Ch III-3 Transfer of trace elements to wheat plant
131
Figure III-3. 4: PCA performed on the 8 sites with total and DTPA-extractable concentrations as variables
III-3.4 The transfer of Pb, As and Cd from soil to wheat
Trace element concentrations in plants depend on various factors: the soil type and its
physico-chemical properties, such as pH, EC, organic carbon content, texture etc…., the
bioavailable concentrations and more generally speciation that itself depends on the origin
of the trace elements (geogenic or anthropogenic) as observed above for B3. Environmental
factors such as climate (rainfall and temperature) may impact indirectly plant concentrations
through their effects on biomass production. The plant type and cultivars for crops may
generate differences (Carlton-Smith and Davis, 1983) as well as agronomic practices, namely
irrigation and fertilization. In our case, cultivars were mixed in the field: fields were grown
either with a mixture of two durum wheat cultivars (Icarasha and Miki, at B2, B4a, B4b and
B8) or durum (the two previous cv) and winter wheat (cv Naama 12) (B1, B9) were grown
together, but no distinction was made when taking the plant samples. Consequently, the
percentage of each cultivar in the final sample is uncertain and cv cannot be used as an
explicative factor for Cd, As or Pb concentrations in plants. However, Cubadda et al. (2010)
found no significant difference in As concentration in wheat grain neither between T.
aestivum (n=80) and T. durum (n=60) nor between cultivars of each species, with average
concentrations of resp. 8±8 and 9±8 µg As kg-1 DW in a set of wheat grains sampled over the
B1
B2
B3
B4a
B4b
B5
B8
B9
Cr tCu tNi t
Zn t
Co tAs t
Cd t
Pb t
Pb DTPA Cr DTPA
Co DTPA
Ni DTPA Cu DTPA
Zn DTPA
As DTPA
Cd DTPA
-6
-4
-2
0
2
4
6
-8 -6 -4 -2 0 2 4 6 8
F2
(19,9
9 %
)
F1 (47,70 %)
Biplot (axes F1 et F2 : 67,69 %)
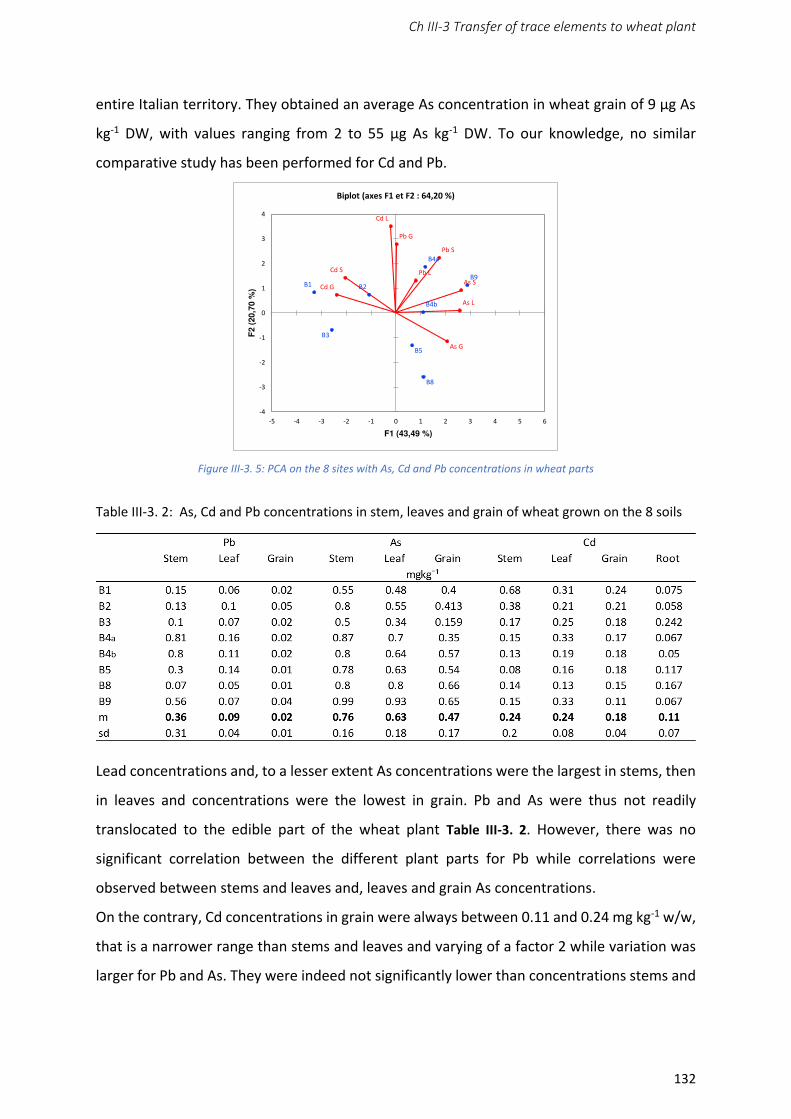
Ch III-3 Transfer of trace elements to wheat plant
132
entire Italian territory. They obtained an average As concentration in wheat grain of 9 µg As
kg-1 DW, with values ranging from 2 to 55 µg As kg-1 DW. To our knowledge, no similar
comparative study has been performed for Cd and Pb.
Figure III-3. 5: PCA on the 8 sites with As, Cd and Pb concentrations in wheat parts
Table III-3. 2: As, Cd and Pb concentrations in stem, leaves and grain of wheat grown on the 8 soils
Lead concentrations and, to a lesser extent As concentrations were the largest in stems, then
in leaves and concentrations were the lowest in grain. Pb and As were thus not readily
translocated to the edible part of the wheat plant Table III-3. 2. However, there was no
significant correlation between the different plant parts for Pb while correlations were
observed between stems and leaves and, leaves and grain As concentrations.
On the contrary, Cd concentrations in grain were always between 0.11 and 0.24 mg kg-1 w/w,
that is a narrower range than stems and leaves and varying of a factor 2 while variation was
larger for Pb and As. They were indeed not significantly lower than concentrations stems and
B1 B2
B3
B4a
B4b
B5
B8
B9As S
As L
As G
Pb S
Pb L
Pb G
Cd S
Cd L
Cd G
-4
-3
-2
-1
0
1
2
3
4
-5 -4 -3 -2 -1 0 1 2 3 4 5 6
F2 (
20,7
0 %
)
F1 (43,49 %)
Biplot (axes F1 et F2 : 64,20 %)
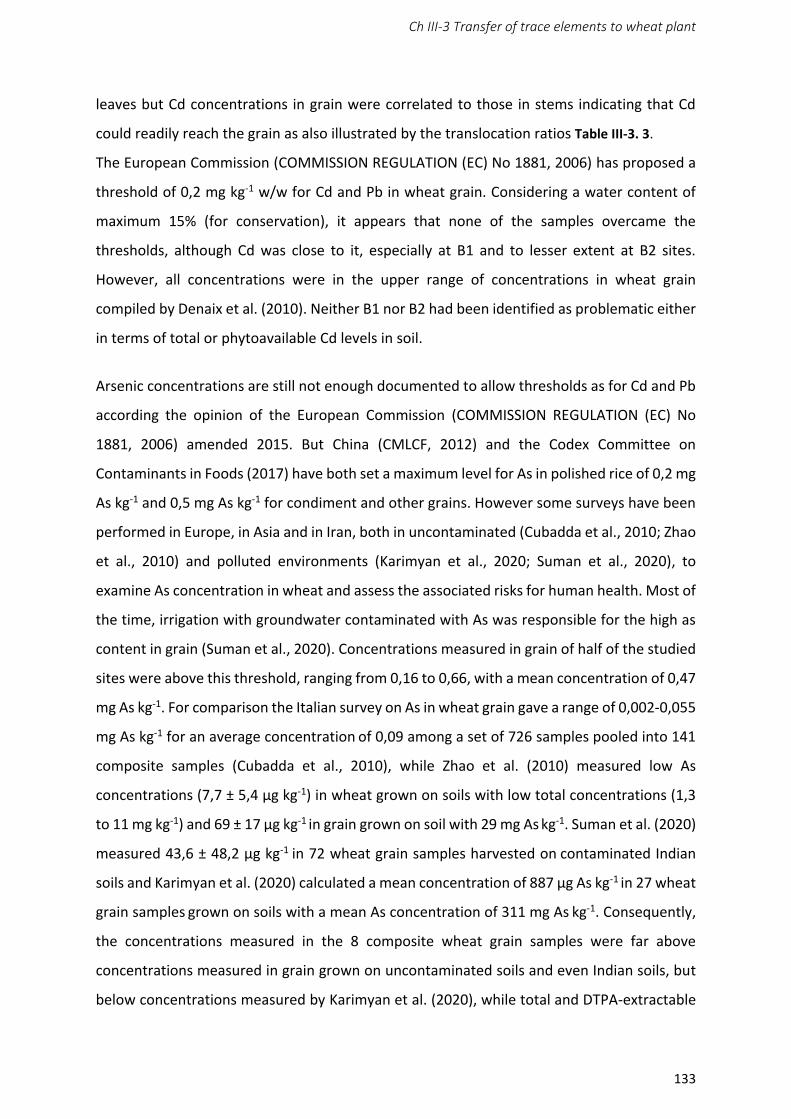
Ch III-3 Transfer of trace elements to wheat plant
133
leaves but Cd concentrations in grain were correlated to those in stems indicating that Cd
could readily reach the grain as also illustrated by the translocation ratios Table III-3. 3.
The European Commission (COMMISSION REGULATION (EC) No 1881, 2006) has proposed a
threshold of 0,2 mg kg-1 w/w for Cd and Pb in wheat grain. Considering a water content of
maximum 15% (for conservation), it appears that none of the samples overcame the
thresholds, although Cd was close to it, especially at B1 and to lesser extent at B2 sites.
However, all concentrations were in the upper range of concentrations in wheat grain
compiled by Denaix et al. (2010). Neither B1 nor B2 had been identified as problematic either
in terms of total or phytoavailable Cd levels in soil.
Arsenic concentrations are still not enough documented to allow thresholds as for Cd and Pb
according the opinion of the European Commission (COMMISSION REGULATION (EC) No
1881, 2006) amended 2015. But China (CMLCF, 2012) and the Codex Committee on
Contaminants in Foods (2017) have both set a maximum level for As in polished rice of 0,2 mg
As kg-1 and 0,5 mg As kg-1 for condiment and other grains. However some surveys have been
performed in Europe, in Asia and in Iran, both in uncontaminated (Cubadda et al., 2010; Zhao
et al., 2010) and polluted environments (Karimyan et al., 2020; Suman et al., 2020), to
examine As concentration in wheat and assess the associated risks for human health. Most of
the time, irrigation with groundwater contaminated with As was responsible for the high as
content in grain (Suman et al., 2020). Concentrations measured in grain of half of the studied
sites were above this threshold, ranging from 0,16 to 0,66, with a mean concentration of 0,47
mg As kg-1. For comparison the Italian survey on As in wheat grain gave a range of 0,002-0,055
mg As kg-1 for an average concentration of 0,09 among a set of 726 samples pooled into 141
composite samples (Cubadda et al., 2010), while Zhao et al. (2010) measured low As
concentrations (7,7 ± 5,4 µg kg-1) in wheat grown on soils with low total concentrations (1,3
to 11 mg kg-1) and 69 ± 17 µg kg-1 in grain grown on soil with 29 mg As kg-1. Suman et al. (2020)
measured 43,6 ± 48,2 µg kg-1 in 72 wheat grain samples harvested on contaminated Indian
soils and Karimyan et al. (2020) calculated a mean concentration of 887 µg As kg-1 in 27 wheat
grain samples grown on soils with a mean As concentration of 311 mg As kg-1. Consequently,
the concentrations measured in the 8 composite wheat grain samples were far above
concentrations measured in grain grown on uncontaminated soils and even Indian soils, but
below concentrations measured by Karimyan et al. (2020), while total and DTPA-extractable
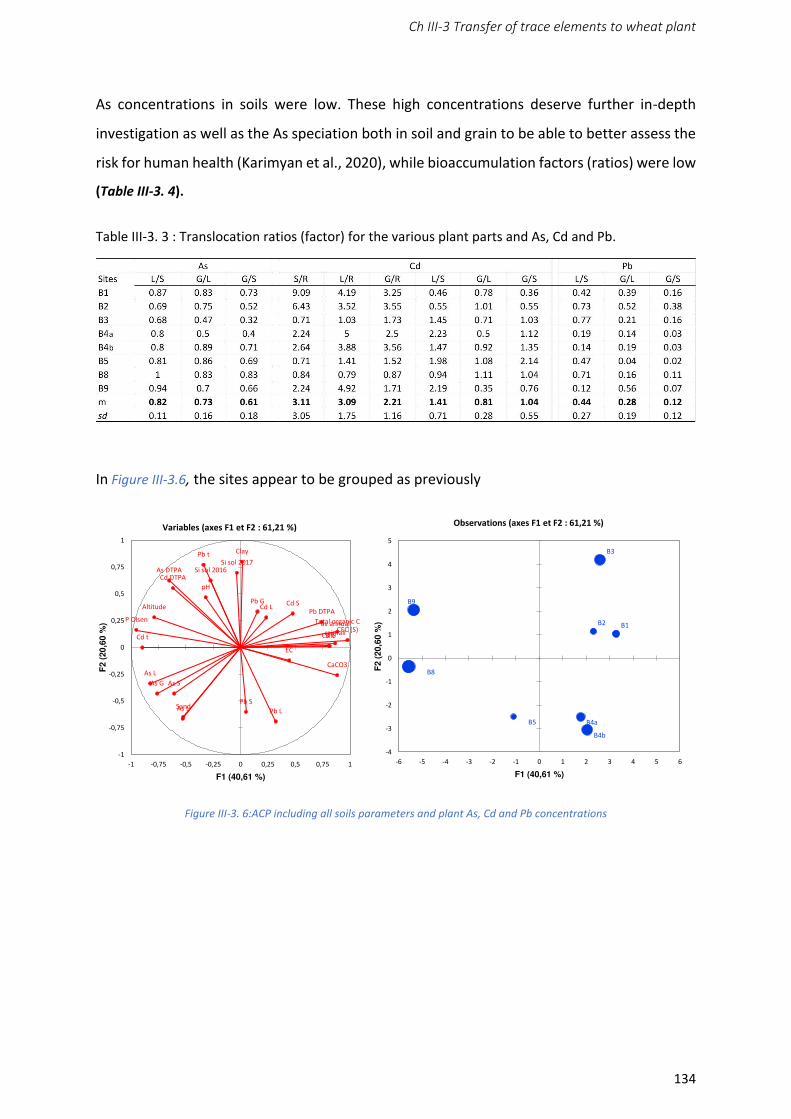
Ch III-3 Transfer of trace elements to wheat plant
134
As concentrations in soils were low. These high concentrations deserve further in-depth
investigation as well as the As speciation both in soil and grain to be able to better assess the
risk for human health (Karimyan et al., 2020), while bioaccumulation factors (ratios) were low
(Table III-3. 4).
Table III-3. 3 : Translocation ratios (factor) for the various plant parts and As, Cd and Pb.
In Figure III-3.6, the sites appear to be grouped as previously
Figure III-3. 6:ACP including all soils parameters and plant As, Cd and Pb concentrations
As S
As L
As G
Pb S
Pb L
Pb G Cd SCd L
Cd G
Pb DTPA
As DTPACd DTPA
Si sol 2016Si sol 2017
Altitude
av annual rainfall
pH
EC
Clay
Silt
Sand
CaCO3
Total organic CP Olsen
CEC (S)
As t
Cd t
Pb t
-1
-0,75
-0,5
-0,25
0
0,25
0,5
0,75
1
-1 -0,75 -0,5 -0,25 0 0,25 0,5 0,75 1
F2 (
20,6
0 %
)
F1 (40,61 %)
Variables (axes F1 et F2 : 61,21 %)
B1B2
B3
B4a
B4b
B5
B8
B9
-4
-3
-2
-1
0
1
2
3
4
5
-6 -5 -4 -3 -2 -1 0 1 2 3 4 5 6
F2 (
20,6
0 %
)
F1 (40,61 %)
Observations (axes F1 et F2 : 61,21 %)
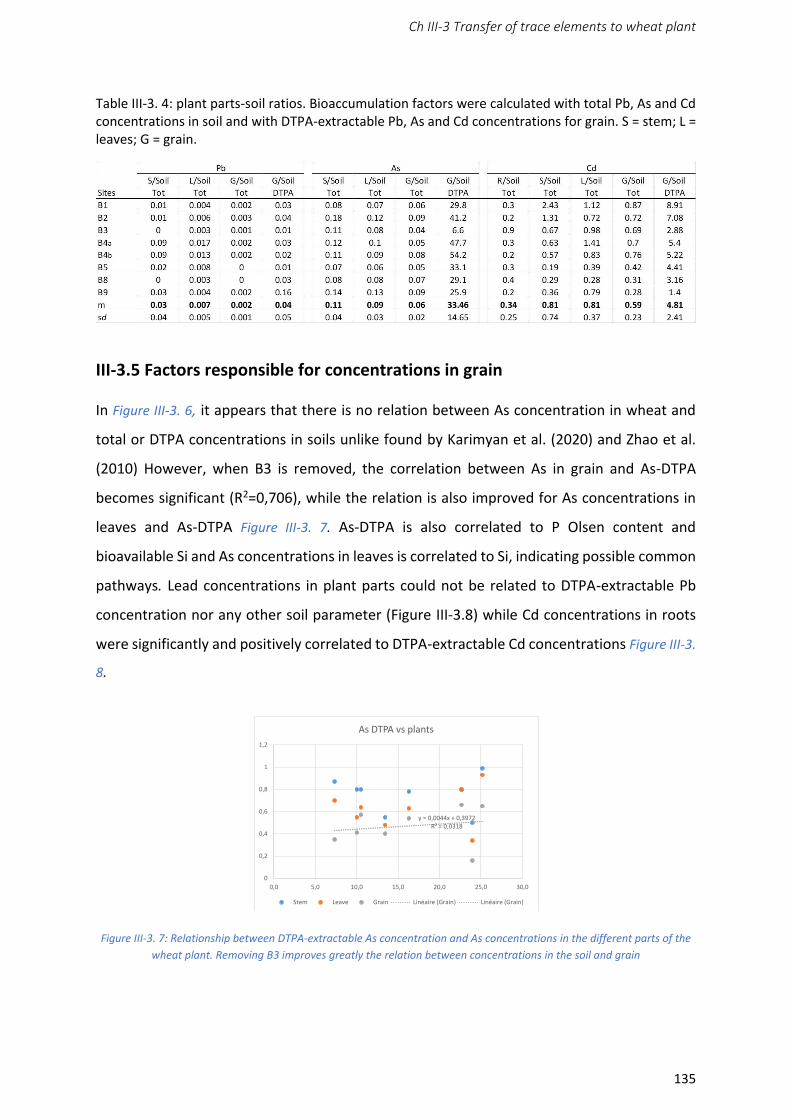
Ch III-3 Transfer of trace elements to wheat plant
135
Table III-3. 4: plant parts-soil ratios. Bioaccumulation factors were calculated with total Pb, As and Cd concentrations in soil and with DTPA-extractable Pb, As and Cd concentrations for grain. S = stem; L = leaves; G = grain.
III-3.5 Factors responsible for concentrations in grain
In Figure III-3. 6, it appears that there is no relation between As concentration in wheat and
total or DTPA concentrations in soils unlike found by Karimyan et al. (2020) and Zhao et al.
(2010) However, when B3 is removed, the correlation between As in grain and As-DTPA
becomes significant (R2=0,706), while the relation is also improved for As concentrations in
leaves and As-DTPA Figure III-3. 7. As-DTPA is also correlated to P Olsen content and
bioavailable Si and As concentrations in leaves is correlated to Si, indicating possible common
pathways. Lead concentrations in plant parts could not be related to DTPA-extractable Pb
concentration nor any other soil parameter (Figure III-3.8) while Cd concentrations in roots
were significantly and positively correlated to DTPA-extractable Cd concentrations Figure III-3.
8.
Figure III-3. 7: Relationship between DTPA-extractable As concentration and As concentrations in the different parts of the
wheat plant. Removing B3 improves greatly the relation between concentrations in the soil and grain
y = 0,0044x + 0,3972R² = 0,0318
0
0,2
0,4
0,6
0,8
1
1,2
0,0 5,0 10,0 15,0 20,0 25,0 30,0
As DTPA vs plants
Stem Leave Grain Linéaire (Grain) Linéaire (Grain)
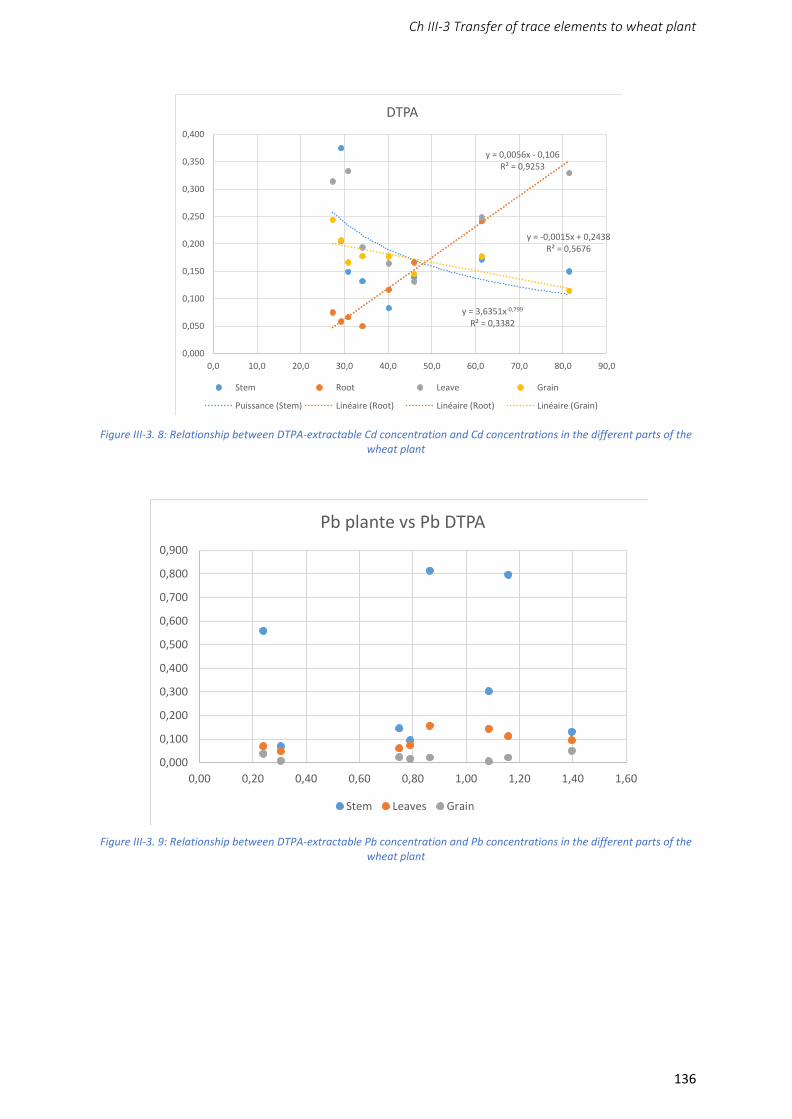
Ch III-3 Transfer of trace elements to wheat plant
136
Figure III-3. 8: Relationship between DTPA-extractable Cd concentration and Cd concentrations in the different parts of the
wheat plant
Figure III-3. 9: Relationship between DTPA-extractable Pb concentration and Pb concentrations in the different parts of the
wheat plant
y = 3,6351x-0,799
R² = 0,3382
y = 0,0056x - 0,106R² = 0,9253
y = -0,0015x + 0,2438R² = 0,5676
0,000
0,050
0,100
0,150
0,200
0,250
0,300
0,350
0,400
0,0 10,0 20,0 30,0 40,0 50,0 60,0 70,0 80,0 90,0
DTPA
Stem Root Leave Grain
Puissance (Stem) Linéaire (Root) Linéaire (Root) Linéaire (Grain)
0,000
0,100
0,200
0,300
0,400
0,500
0,600
0,700
0,800
0,900
0,00 0,20 0,40 0,60 0,80 1,00 1,20 1,40 1,60
Pb plante vs Pb DTPA
Stem Leaves Grain
Ch III-3 Transfer of trace elements to wheat plant
137
III-3.6 Conclusion
In 2007, Lebanon was self-sufficient for only 15% of its needs in wheat (FAO, 2008). Since
then, areas cultivated with wheat have been highly variable (Caiserman et al., 2019), with 28%
of the Central Bekaa area cultivated in wheat in 2011 (Hassan et al., 2013).
However, with the actual crisis, it might have to rely more on its domestic production. In that
context, it was important to investigate the level of Cd, As and Pb in wheat, the relationships
with soil and environmental factors to assess risks for human health and also identify ways to
limit the potential exposure to metals and metalloids.
As far as the 8 studied sites are concerned, soil contamination appeared limited with only one
site (B3) presenting a significant anthropic contamination associated to industrial activities.
Irrigation, although it had been shown in Ch III-2 that some waters used for irrigation were
contaminated, did not appear as a significant source of contamination for soils. However As
was able to reach the grain since concentrations in grain were found high and correlated to
DTPA-extractable As, while Pb concentrations in grain are very low and Cd concentrations
were somewhat to be monitored. Indeed, Cd concentrations in grains were close to
thresholds values, Cd concentration in roots were correlated to DTPA-extractable Cd and
translocation factors were often above 1, indicating that Cd was readily translocated to the
grain. Cd from fertilizers is proposed as a plausible source of contamination.
In the Chapter III-3, the site B3 showed significant anthropogenic contamination
rather associated with industrial activities as shown before. The irrigation with well water did
not appear to be a significant source of soil contamination. As concentrations in wheat grains
showed high levels and correlated with As bioavailable. The Pb concentrations in wheat grains
were very low. While the Cd concentrations presented values identical to the threshold
values.
At the root level, the Cd concentrations were correlated with available Cd. The translocation
factors were often greater than 1, indicating that Cd was easily translocated into grain, which
is mainly due to the fertilizers.
Ch III-4 Lebanese Population Exposure to Trace Elements via White Bread Consumption
138
CHAPTER III-4
Lebanese Population Exposure to
Trace Elements via White Bread
consumption
Ch III-4 Lebanese Population Exposure to Trace Elements via White Bread Consumption
139
In the 2nd segment of this thesis, the trace elements in the consumed Lebanese white bread
and the exposure of the Lebanese population to these trace elements were studied. To be
able to know the consumption of Lebanese white bread and the exposure of the population
to trace elements present in the bread, a survey was carried out as the 1st work.
The objective of characterizing the risk is to compare the exposure to the safety thresholds.
To evaluate the population exposure, the contamination must be assessed, in other word to
evaluate the amount of trace elements present in the consumed bread by measuring them.
And on the other hand, the consumption of bread, in other words knowing the quantity of
Lebanese bread consumed per day and per person and this was determined following the
completion of an investigation.
This survey was carried out and which facilitated the assessment of the risk associated with a
route of oral exposure to trace elements. Based on this survey carried out, among 49 brands
consumed in Lebanon, 3 industrial bakeries B1, B2 and B3 were the most consumed. Where
B1 has 28.9%, B2 30.1% and B3 17.1%. These 3 brands were chosen for analysis of: As, Cd, Co,
Cr, Hg, Ni and Pb.
The population exposure was studied taking into account: the amount of bread consumed
per person, the body weight and the trace elements content of the consumed bread according
to the brand.
Exposures were calculated in B1 and B3, to be in the worst-case scenario, where results
demonstrated that B3 showed the highest exposure to: As, Cd, Co, Cr, Hg and Pb. While for
Ni, the brand B1 was the main source of exposure.
In conclusion, it was found that there are no risks for Hg, Cd, Cr, and Co. For the element Ni,
the exposure presented an excess for the most exposed populations. While only the
elements, As and Pb showed safety issues where the exposure margins are very low.
Ch III-4 Lebanese Population Exposure to Trace Elements via White Bread Consumption
140
III-4.1 Introduction
Bread is a source of energy and minerals, some of them being essential for the body.
Essential minerals found in Lebanese bread are Cu, Fe, Mn, Zn, and Se which account for
36%, 25%, 30%, 22%, and 32% of respective recommended dietary allowance (RDA) values
given for these elements (Bou Khouzam et al., 2012).
Besides the quality of bread as nutriment, its safety must be assured and monitored in
terms of putative contaminants like trace elements (TEs).
Indeed, trace elements represent the main food chemical contamination and are globally
recognized as a public health hazard (Marín et al., 2018). They occur either from natural
process (lithogenic and pedogenic routes) and/or anthropogenic activities. The latter
include industrial, agricultural (pesticides, fertilizers), and untreated wastewater (Chaza et
al., 2018). This leads to the contamination of the different environmental matrices, including
water, soil, air, and plants (Baize et al., 2009; Gupta et al., 2019). In general, plants can
uptake TEs mainly by absorbing them from polluted soils, and transporting them further
to its different parts (roots, stem, leaves, and grains) (Mitra, 2017). The bioaccumulation
of TEs in plants, especially those that enter the food chain, can be dangerous to human
health due to the fact of their eventual toxicity (Gupta et al., 2019).
Trace elements such as lead, arsenic, cadmium, and mercury are relevant toxic elements
(Counter and Buchanan, 2004). According to the existing literature, it is mandatory to
quantify the contents of trace elements in foodstuffs in order to estimate dietary
exposure, an essential step for risk assessment related to food consumption (Marín et al.,
2018; van der Fels-Klerx et al., 2014).
Currently, many studies have been undertaken in different countries to assess exposure to
TEs occurring in their relative foodstuffs such as France (Arnich et al., 2012), Spain (Marín et
al., 2018), Italy (Storelli et al., 2017), China (Tang and Huang, 2014), Saudi Arabia (Ali and Al-
Qahtani, 2012), and Lebanon (Nasreddine et al., 2010. In addition, the European Food
Safety Authority (EFSA) panel on contaminants in the food chain has given its scientific
opinion on the risks to public health related to the presence of As, Cd, Hg, and Ni in food (EFSA,
2012, 2009, 2015). Such studies should be representative of specific food as consumed by
the population. In France, total diet studies (TDS) are national surveys routinely realized to
assess public health risks associated with substances such as contaminants in food. They
Ch III-4 Lebanese Population Exposure to Trace Elements via White Bread Consumption
141
underline the necessity to reduce exposure to elements such as Cd, Al, Ni, As, and Co by a
diversified diet (food items and origins) (ANSES, 2019).
(Nasreddine et al., 2010) studied, using the TDS approach, the dietary exposure of the adult
Lebanese urban population to six essential micro-nutriments (i.e., Co, Cu, Fe, Mn, Ni, and
Zn) and two toxic heavy metals (i.e., Cd and Pb). This study constitutes a first estimate of
the consumer exposure to trace elements through the diet in Lebanon. These authors
determined that the average urban adult daily bread consumption was 136.8 g day-1 and
that mean exposure was found to be satisfactory for most trace elements. However, the
survey included only adult people living in the district of Beirut, thus preventing the
extrapolation of the results to the whole country; indeed, agricultural areas are sections of
high bread consumption.
Previous studies in Egypt, Iran, South Africa, Nigeria, and Portugal determined TEs contents
in bread (Ahmed et al., 2000; Soares et al., 2010). In Lebanon, Bou Khouzam and co-authors
determined the contents of 20 elements in three varieties of Lebanese bread (i.e., white,
brown pita, and Saj bread) throughout the country during the wet and dry seasons (Bou
Khouzam et al., 2012). Toxic elements such as Cd and Pb were below maximum levels set
by the Lebanese regulatory agency (Libnor) (NL 240, 2010).
Bread is an integral part of the daily diet, but the types of bread and amounts ingested
vary according to the age, sex, and socio-economic status of the individual. As a result,
and as consumer behavior evolves over time, there is a need for up-to-date information on
daily TEs intake via Lebanese bread consumption throughout Lebanon, including rural areas.
The Lebanese standards (NL 240, 2010) provide only Pb, Cu, and Cd maximum levels in
bread as food item contamination vectors. However, other TEs could be present (Bou
Khouzam et al., 2012; Nasreddine et al., 2010). As exposition represents the combination
of consumption of bread potentially contaminated, it is of first interest to compare
exposure with safety levels in order to monitor any safety preoccupation concerns for the
Lebanese population. For this reason, this study was directed by a public institute
(Lebanese Agricultural Research Institute—LARI) to assess exposure to trace elements via
Lebanese pita consumption.
As, Cd, Co, Cr, Hg, Ni, and Pb were selected in this study based on previous studies of
trace element composition of Lebanese bread (Bou Khouzam et al., 2012; Nasreddine et
al., 2010) and based on the Lebanese bread standard Libnor (NL 240, 2010). In contrast to
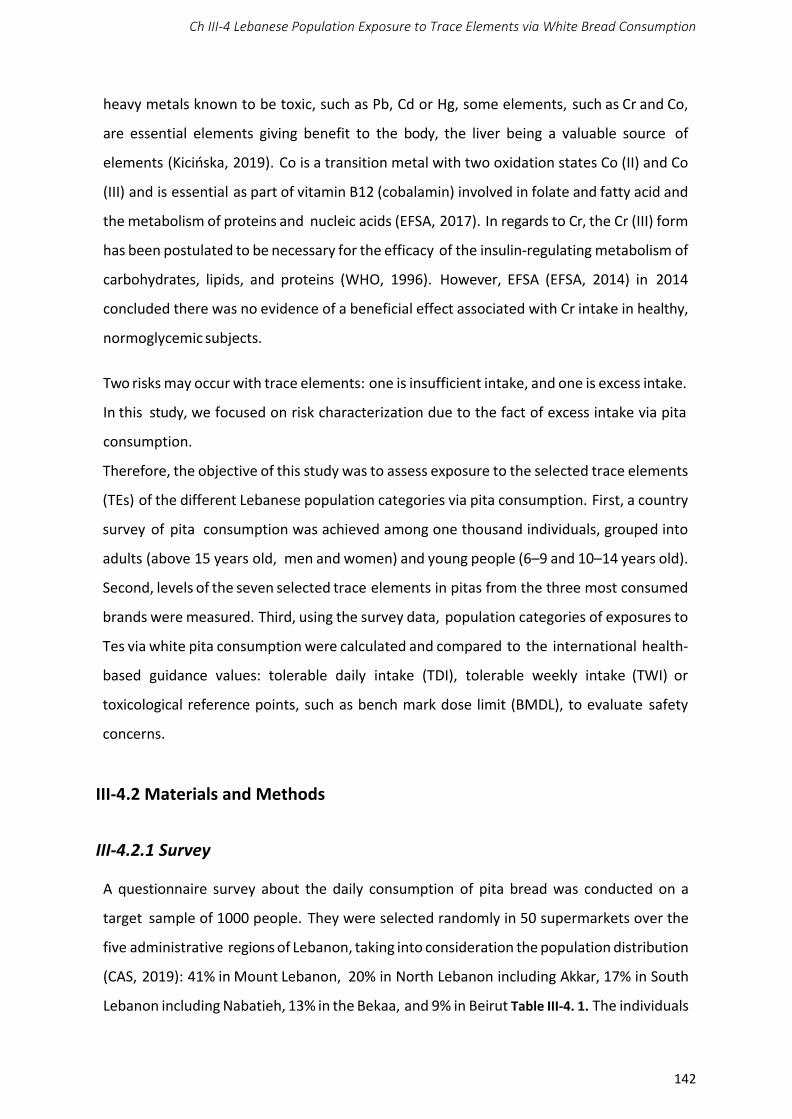
Ch III-4 Lebanese Population Exposure to Trace Elements via White Bread Consumption
142
heavy metals known to be toxic, such as Pb, Cd or Hg, some elements, such as Cr and Co,
are essential elements giving benefit to the body, the liver being a valuable source of
elements (Kicińska, 2019). Co is a transition metal with two oxidation states Co (II) and Co
(III) and is essential as part of vitamin B12 (cobalamin) involved in folate and fatty acid and
the metabolism of proteins and nucleic acids (EFSA, 2017). In regards to Cr, the Cr (III) form
has been postulated to be necessary for the efficacy of the insulin-regulating metabolism of
carbohydrates, lipids, and proteins (WHO, 1996). However, EFSA (EFSA, 2014) in 2014
concluded there was no evidence of a beneficial effect associated with Cr intake in healthy,
normoglycemic subjects.
Two risks may occur with trace elements: one is insufficient intake, and one is excess intake.
In this study, we focused on risk characterization due to the fact of excess intake via pita
consumption.
Therefore, the objective of this study was to assess exposure to the selected trace elements
(TEs) of the different Lebanese population categories via pita consumption. First, a country
survey of pita consumption was achieved among one thousand individuals, grouped into
adults (above 15 years old, men and women) and young people (6–9 and 10–14 years old).
Second, levels of the seven selected trace elements in pitas from the three most consumed
brands were measured. Third, using the survey data, population categories of exposures to
Tes via white pita consumption were calculated and compared to the international health-
based guidance values: tolerable daily intake (TDI), tolerable weekly intake (TWI) or
toxicological reference points, such as bench mark dose limit (BMDL), to evaluate safety
concerns.
III-4.2 Materials and Methods
III-4.2.1 Survey
A questionnaire survey about the daily consumption of pita bread was conducted on a
target sample of 1000 people. They were selected randomly in 50 supermarkets over the
five administrative regions of Lebanon, taking into consideration the population distribution
(CAS, 2019): 41% in Mount Lebanon, 20% in North Lebanon including Akkar, 17% in South
Lebanon including Nabatieh, 13% in the Bekaa, and 9% in Beirut Table III-4. 1. The individuals
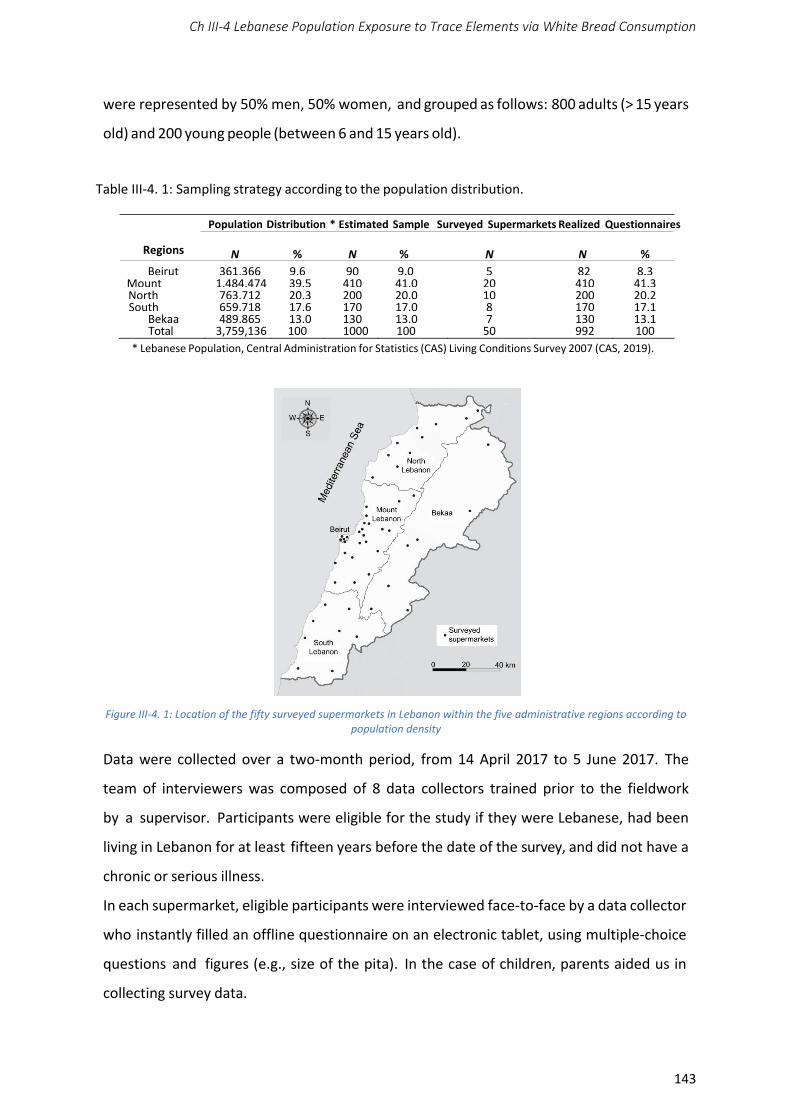
Ch III-4 Lebanese Population Exposure to Trace Elements via White Bread Consumption
143
were represented by 50% men, 50% women, and grouped as follows: 800 adults (> 15 years
old) and 200 young people (between 6 and 15 years old).
Table III-4. 1: Sampling strategy according to the population distribution.
Population Distribution * Estimated Sample Surveyed Supermarkets Realized Questionnaires
Regions N % N % N N %
Beirut 361,366 9.6 90 9.0 5 82 8.3 Mount 1,484,474 39.5 410 41.0 20 410 41.3North 763,712 20.3 200 20.0 10 200 20.2South 659,718 17.6 170 17.0 8 170 17.1
Bekaa 489,865 13.0 130 13.0 7 130 13.1Total 3,759,136 100 1000 100 50 992 100
* Lebanese Population, Central Administration for Statistics (CAS) Living Conditions Survey 2007 (CAS, 2019).
Figure III-4. 1: Location of the fifty surveyed supermarkets in Lebanon within the five administrative regions according to
population density
Data were collected over a two-month period, from 14 April 2017 to 5 June 2017. The
team of interviewers was composed of 8 data collectors trained prior to the fieldwork
by a supervisor. Participants were eligible for the study if they were Lebanese, had been
living in Lebanon for at least fifteen years before the date of the survey, and did not have a
chronic or serious illness.
In each supermarket, eligible participants were interviewed face-to-face by a data collector
who instantly filled an offline questionnaire on an electronic tablet, using multiple-choice
questions and figures (e.g., size of the pita). In the case of children, parents aided us in
collecting survey data.
Ch III-4 Lebanese Population Exposure to Trace Elements via White Bread Consumption
144
In addition to information on the daily consumption of pita bread, age, gender, body
weight, and socio-economic status of the interviewed individuals, data were also collected
on the level of education, address (urban or rural), job description, and health status (e.g.,
smoking habit, alcohol consumption and physical activity of the individual). Each
questionnaire consisted of 44 questions (Supplementary Materials, Survey) which required
approximately 7 min to complete. The collected answers were transmitted in the “iSurvey”
application for data harmonization.
III-4.2.2 Chemicals
Standard solutions (1 g L-1) of Hg, As, Co, Cr, Cd, Ni, and Pb were purchased from Fluka. In
addition, HNO3 65%, H2O2 30%, and the BCR (Community Bureau of Reference) certified
reference material for bread trace elements (BCR-191) were purchased from Sigma–Aldrich.
Deionized water, obtained from a BOECO pure UV/UF water purification system, was used
in all experiments.
III-4.2.3 Sampling for Trace Elements Analysis
Based on the survey data, three Lebanese white pita brands were determined as the most
consumed by the Lebanese population. These brands were tagged as B1, B2, and B3.
Three randomly sampled bags of each of the selected pita brands were collected. Each
bread bag had seven pitas where three were randomly picked. Each pita was cut into 12
circular sectors with a plastic knife on a polyethylene plate to prevent trace element
contamination. Two pieces were randomly drawn for analysis, creating 18 (3 bags × 3 pitas
× 2 pieces) circular pita pieces for each brand. Before sample digestion, pita pieces were
ground into powder using an agate mortar.
III-4.2.4 Sample Digestion for Trace Elements Analysis
Digestion of samples was done using an Anton Paar microwave (multiwave 3000—Rotor
8SXF 100, Graz, Austria). Samples of 0.5 g each were directly weighed after grinding in 50
mL Teflon tube. Then, 7 mL of concentrated HNO3 and 1 mL of H2O2 were added to the
preparation. The Teflon bombs were closed and placed in the digester at 200 ◦C for 15 min
Ch III-4 Lebanese Population Exposure to Trace Elements via White Bread Consumption
145
(1000 W). Once the Teflon tubes had cooled for at least 45 min, 3 mL of the digested samples
were transferred to 25 mL polyethylene tubes and diluted with HNO3 1% before the trace
elements analysis. Each sample was digested in triplicate.
III-4.2.5 Analysis of Trace Elements
The determination of trace elements (As, Co, Cd, Cr, Pb, and Ni) in pita samples was
performed using an Atomic Absorption Spectrometer (AAS, Stafford House, UK) Zeeman
Graphite Furnace GF95Z Thermo Electron corporation M series. Each pita sample was
digested in triplicate and each digested sample was analyzed in triplicate. Mercury was
analyzed by direct mercury analyzer DMA 80 Milestone (Sorisole, Italy) using 0.2 g of pita
sample.
To guarantee the method reliability, a certified reference material (CRM; BCR-191)
underwent the same digestion protocol and was analyzed at the same time as the pita
samples. The recovery percentages obtained for the reference material were 93.2% for
Hg, 110.8% for Pb, 86.3% for Ni, and 110.1% for Cd. For the other elements, As, Co, and
Cr, for which reference materials were not available, bread samples were spiked by a known
concentration (0.1 mg L-1) of each of the above listed elements before digestion. The spiked
bread was treated and digested in the same way as the bread samples and analyzed using
an AAS. The recovery percentages were 103.08% for As, 101.29% for Co, and 96.37% for Cr.
III-4.2.6 Exposure Determination
An exposure calculation was conducted for each respondent. They took into account the
quantity of bread consumed by person, body weight, and the metal content of the
consumed bread according to its brand. Results were expressed in terms of the median
and 95th percentile using Ms-Excel for different population categories.
III-4.2.7 Statistical Analysis
In order to avoid a lack of representativeness of the selected samples of the surveyed
population, a weighting adjustment technique was applied using auxiliary variables such as
gender, age, and region by comparing the observed frequency distribution of each variable
with its population distribution (Bethlelem, 2008).
Ch III-4 Lebanese Population Exposure to Trace Elements via White Bread Consumption
146
Data processing and statistical adjustments were analyzed using Sphinx IQ2 (Le Sphinx®,
Chavanod, France) for survey data and R Studio version 1.0.153 with R version 3.5.0 (R Core
team, 2020; RStudio Team, 2016).
Kruskal–Wallis non-parametric tests (Sprent, 2001) completed by a multi-comparison
Fisher’s test (α = 0.05) were conducted to test for significant differences in consumption by
region. Analysis of variances (ANOVAs) completed by a multi-comparison Tukey’s test (α
= 0.05) were also executed to test differences in trace element contents among brands.
They were performed with R using the “agricolae” package (De Mendiburu, 2020).
Median and percentile non-parametric tests (α = 0.05) (Sprent, 2001) were realized to
check significant differences in the level of trace element exposures between age and
gender. They were performed using R and the “rcompanion” package (Mangiafico, 2019).
Principal component analysis (PCA) was applied to examine the relationships among the
trace element contents of the breads using XLSTAT 2018. The results are presented by loading
and score plots.
Multivariate correspondence analysis was done to explore relationships among
consumption behaviors and socioeconomic data (Ganassali, 2014).
III-4.3 Results
III-4.3.1 Survey Results
Based on a target sample of 1000 people, the surveyed sample consisted of 992 individuals
with the following demographic characteristics: a sex ratio of 0.992, a proportion of 19.4%
young people (8.9% children aged from 6 to 9 years old and 10.5% teenagers aged from 10
to 14 years old) and 80.6% adults, and 70.6% living in an urban area. Compared to the
overall Lebanese population (where the sex ratio is 0.962, 23% are young people, 77%
adults, and 87% live in urban areas (CAS, 2019) there was a significant difference risk of
5% in terms of young people/adults and rural/urban ratios between the surveyed sample
and the population distribution of Lebanon, which could lead to a bias. Consequently, a
weighing adjustment in respect to these variables was performed to make a possible
inference at the population level. The weighted numbers of respondents corresponded to
228 young people (i.e., 95 children and 133 teenagers) and 764 adults.
White pita was the type of bread most consumed according to the surveyed sample: 77%
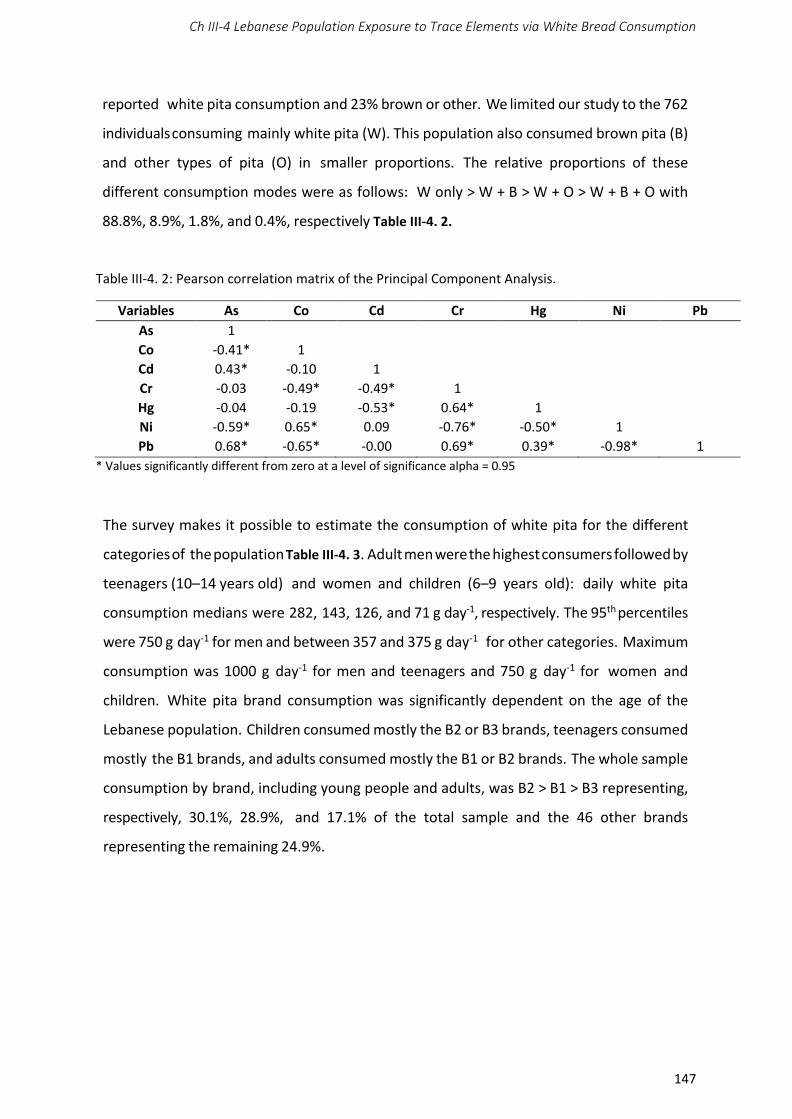
Ch III-4 Lebanese Population Exposure to Trace Elements via White Bread Consumption
147
reported white pita consumption and 23% brown or other. We limited our study to the 762
individuals consuming mainly white pita (W). This population also consumed brown pita (B)
and other types of pita (O) in smaller proportions. The relative proportions of these
different consumption modes were as follows: W only > W + B > W + O > W + B + O with
88.8%, 8.9%, 1.8%, and 0.4%, respectively Table III-4. 2.
Table III-4. 2: Pearson correlation matrix of the Principal Component Analysis.
Variables As Co Cd Cr Hg Ni Pb
As 1
Co -0.41* 1
Cd 0.43* -0.10 1
Cr -0.03 -0.49* -0.49* 1
Hg -0.04 -0.19 -0.53* 0.64* 1
Ni -0.59* 0.65* 0.09 -0.76* -0.50* 1
Pb 0.68* -0.65* -0.00 0.69* 0.39* -0.98* 1
* Values significantly different from zero at a level of significance alpha = 0.95
The survey makes it possible to estimate the consumption of white pita for the different
categories of the population Table III-4. 3. Adult men were the highest consumers followed by
teenagers (10–14 years old) and women and children (6–9 years old): daily white pita
consumption medians were 282, 143, 126, and 71 g day-1, respectively. The 95th percentiles
were 750 g day-1 for men and between 357 and 375 g day-1 for other categories. Maximum
consumption was 1000 g day-1 for men and teenagers and 750 g day-1 for women and
children. White pita brand consumption was significantly dependent on the age of the
Lebanese population. Children consumed mostly the B2 or B3 brands, teenagers consumed
mostly the B1 brands, and adults consumed mostly the B1 or B2 brands. The whole sample
consumption by brand, including young people and adults, was B2 > B1 > B3 representing,
respectively, 30.1%, 28.9%, and 17.1% of the total sample and the 46 other brands
representing the remaining 24.9%.
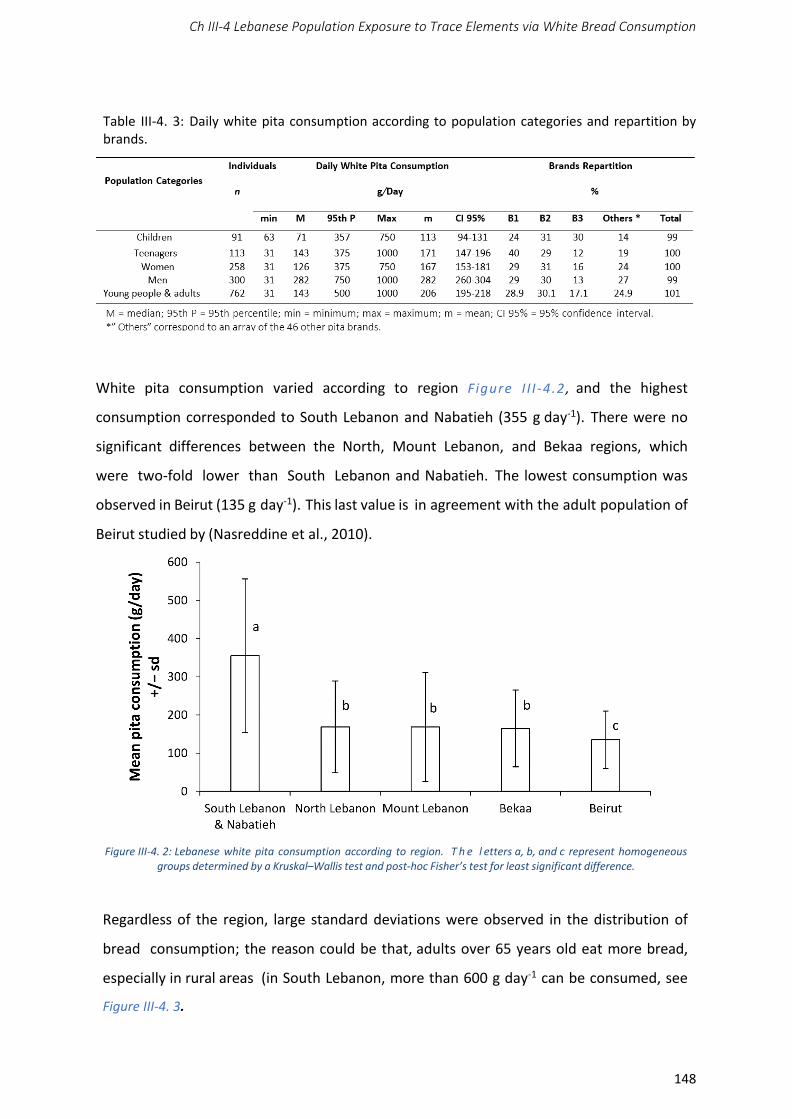
Ch III-4 Lebanese Population Exposure to Trace Elements via White Bread Consumption
148
Table III-4. 3: Daily white pita consumption according to population categories and repartition by brands.
White pita consumption varied according to region Figure I I I -4 .2 , and the highest
consumption corresponded to South Lebanon and Nabatieh (355 g day-1). There were no
significant differences between the North, Mount Lebanon, and Bekaa regions, which
were two-fold lower than South Lebanon and Nabatieh. The lowest consumption was
observed in Beirut (135 g day-1). This last value is in agreement with the adult population of
Beirut studied by (Nasreddine et al., 2010).
Figure III-4. 2: Lebanese white pita consumption according to region. T h e l etters a, b, and c represent homogeneous
groups determined by a Kruskal–Wallis test and post-hoc Fisher’s test for least significant difference.
Regardless of the region, large standard deviations were observed in the distribution of
bread consumption; the reason could be that, adults over 65 years old eat more bread,
especially in rural areas (in South Lebanon, more than 600 g day-1 can be consumed, see
Figure III-4. 3.
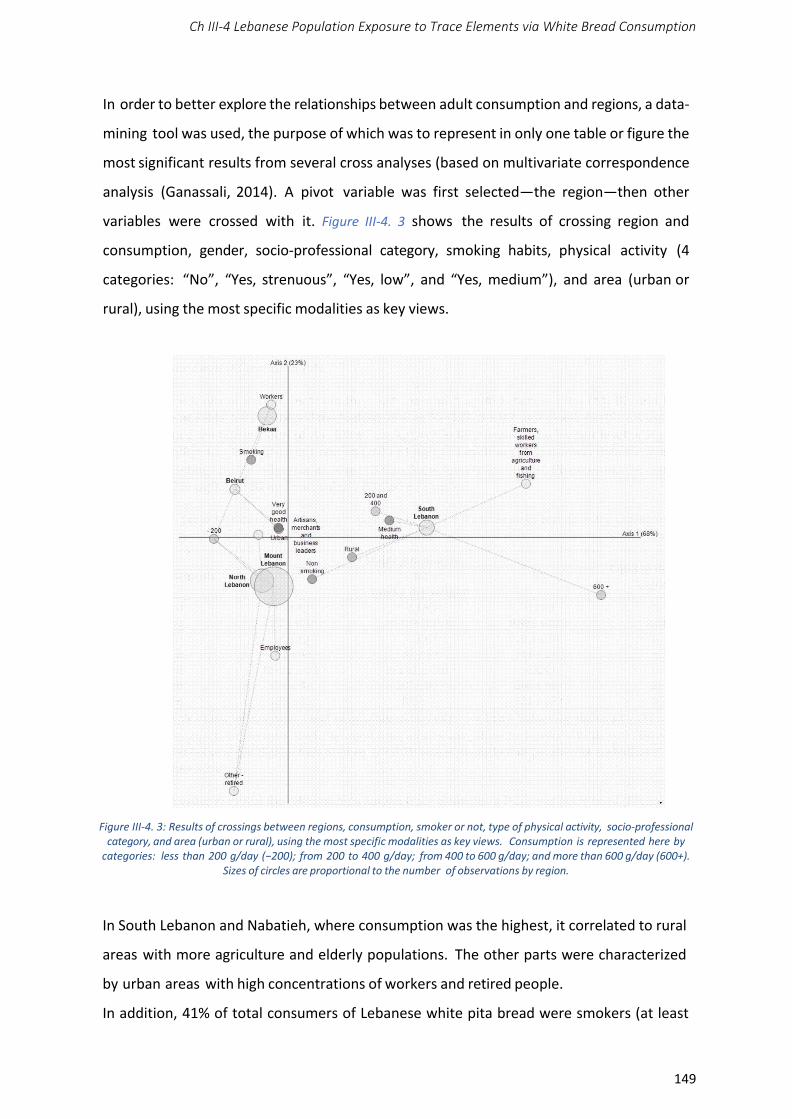
Ch III-4 Lebanese Population Exposure to Trace Elements via White Bread Consumption
149
In order to better explore the relationships between adult consumption and regions, a data-
mining tool was used, the purpose of which was to represent in only one table or figure the
most significant results from several cross analyses (based on multivariate correspondence
analysis (Ganassali, 2014). A pivot variable was first selected—the region—then other
variables were crossed with it. Figure III-4. 3 shows the results of crossing region and
consumption, gender, socio-professional category, smoking habits, physical activity (4
categories: “No”, “Yes, strenuous”, “Yes, low”, and “Yes, medium”), and area (urban or
rural), using the most specific modalities as key views.
Figure III-4. 3: Results of crossings between regions, consumption, smoker or not, type of physical activity, socio-professional
category, and area (urban or rural), using the most specific modalities as key views. Consumption is represented here by
categories: less than 200 g/day (−200); from 200 to 400 g/day; from 400 to 600 g/day; and more than 600 g/day (600+).
Sizes of circles are proportional to the number of observations by region.
In South Lebanon and Nabatieh, where consumption was the highest, it correlated to rural
areas with more agriculture and elderly populations. The other parts were characterized
by urban areas with high concentrations of workers and retired people.
In addition, 41% of total consumers of Lebanese white pita bread were smokers (at least
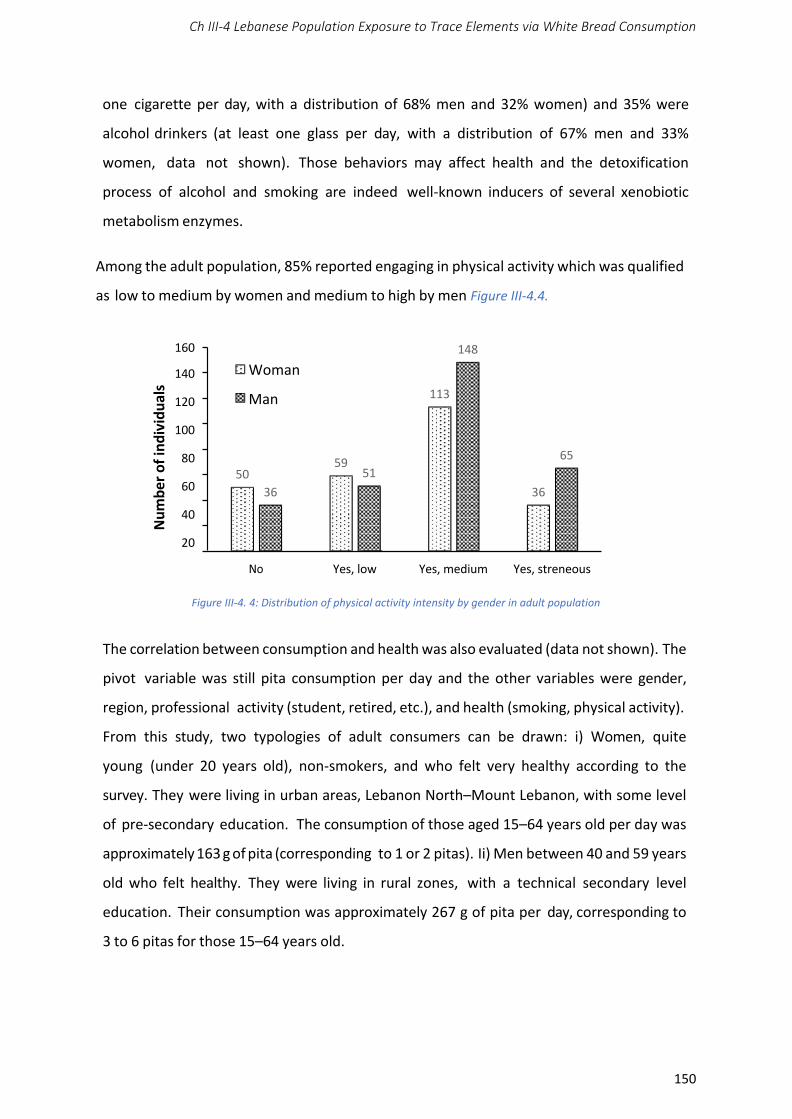
Ch III-4 Lebanese Population Exposure to Trace Elements via White Bread Consumption
150
one cigarette per day, with a distribution of 68% men and 32% women) and 35% were
alcohol drinkers (at least one glass per day, with a distribution of 67% men and 33%
women, data not shown). Those behaviors may affect health and the detoxification
process of alcohol and smoking are indeed well-known inducers of several xenobiotic
metabolism enzymes.
Among the adult population, 85% reported engaging in physical activity which was qualified
as low to medium by women and medium to high by men Figure III-4.4.
Figure III-4. 4: Distribution of physical activity intensity by gender in adult population
The correlation between consumption and health was also evaluated (data not shown). The
pivot variable was still pita consumption per day and the other variables were gender,
region, professional activity (student, retired, etc.), and health (smoking, physical activity).
From this study, two typologies of adult consumers can be drawn: i) Women, quite
young (under 20 years old), non-smokers, and who felt very healthy according to the
survey. They were living in urban areas, Lebanon North–Mount Lebanon, with some level
of pre-secondary education. The consumption of those aged 15–64 years old per day was
approximately 163 g of pita (corresponding to 1 or 2 pitas). Ii) Men between 40 and 59 years
old who felt healthy. They were living in rural zones, with a technical secondary level
education. Their consumption was approximately 267 g of pita per day, corresponding to
3 to 6 pitas for those 15–64 years old.
Nu
mb
er o
f in
div
idu
als
160
140
120
100
80
60
40
20
148
Woman
Man 113
59 65
50 51
36 36
Yes, low Yes, medium Yes, streneous
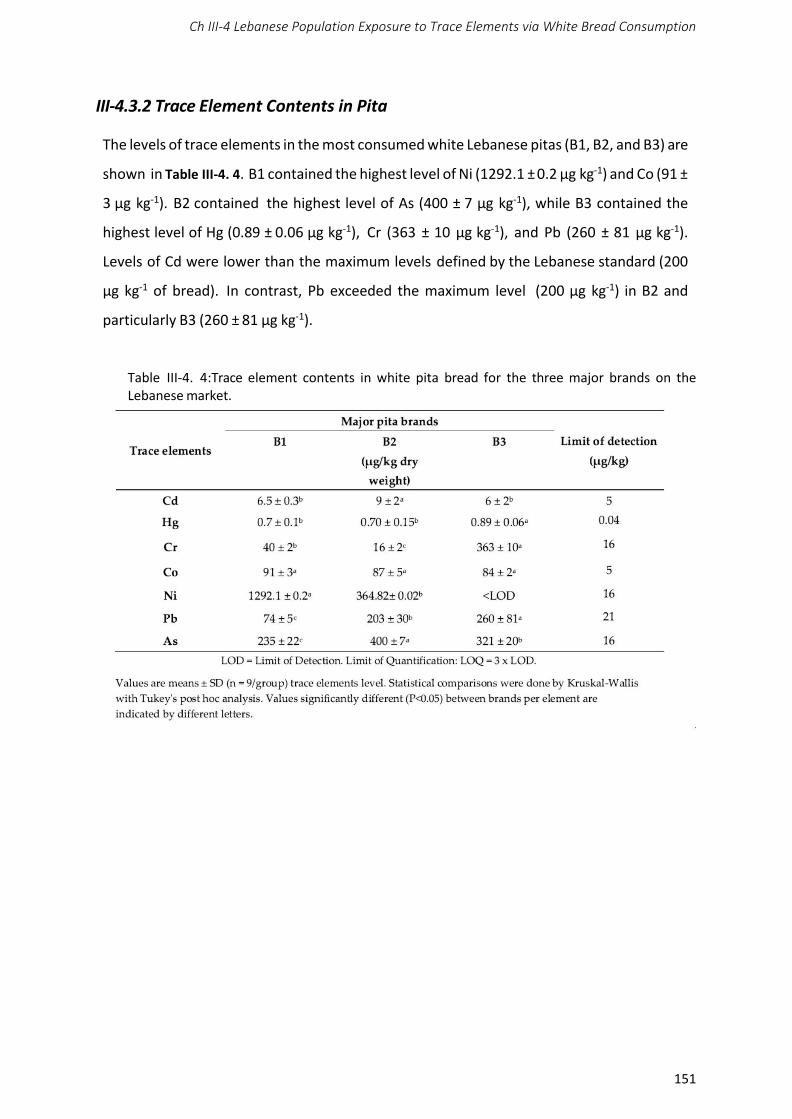
Ch III-4 Lebanese Population Exposure to Trace Elements via White Bread Consumption
151
III-4.3.2 Trace Element Contents in Pita
The levels of trace elements in the most consumed white Lebanese pitas (B1, B2, and B3) are
shown in Table III-4. 4. B1 contained the highest level of Ni (1292.1 ± 0.2 µg kg-1) and Co (91 ±
3 µg kg-1). B2 contained the highest level of As (400 ± 7 µg kg-1), while B3 contained the
highest level of Hg (0.89 ± 0.06 µg kg-1), Cr (363 ± 10 µg kg-1), and Pb (260 ± 81 µg kg-1).
Levels of Cd were lower than the maximum levels defined by the Lebanese standard (200
µg kg-1 of bread). In contrast, Pb exceeded the maximum level (200 µg kg-1) in B2 and
particularly B3 (260 ± 81 µg kg-1).
Table III-4. 4:Trace element contents in white pita bread for the three major brands on the Lebanese market.
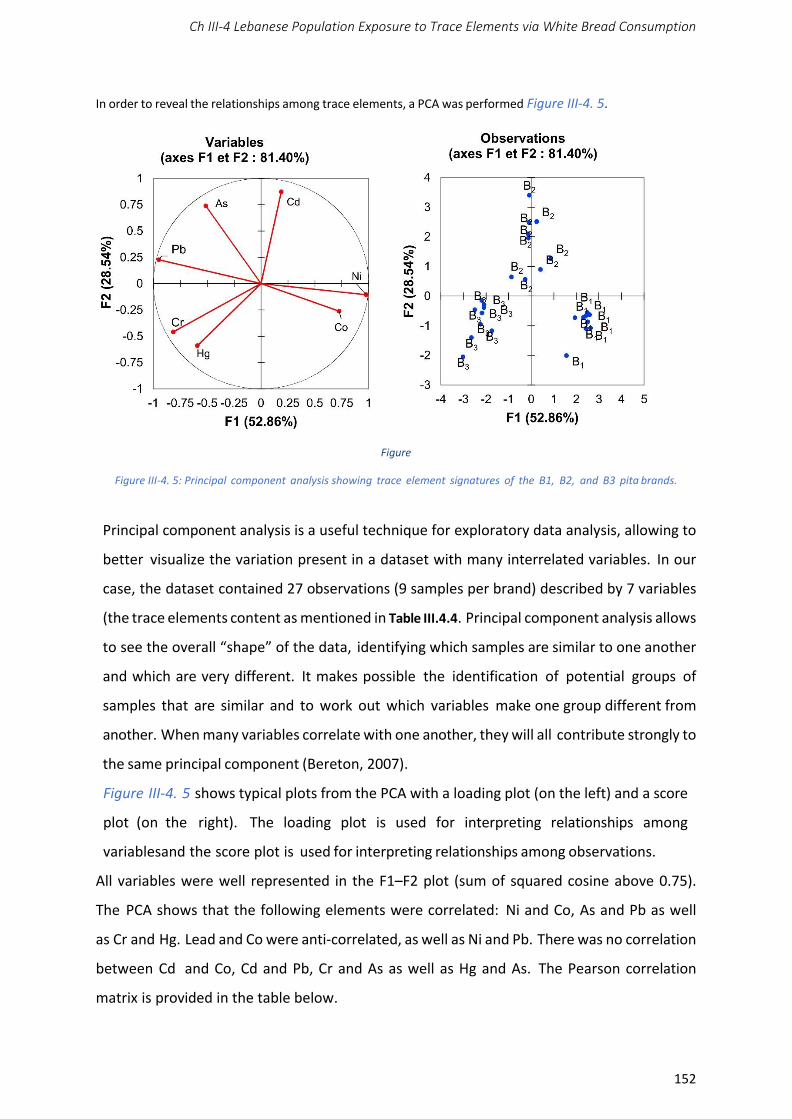
Ch III-4 Lebanese Population Exposure to Trace Elements via White Bread Consumption
152
In order to reveal the relationships among trace elements, a PCA was performed Figure III-4. 5.
Figure
Figure III-4. 5: Principal component analysis showing trace element signatures of the B1, B2, and B3 pita brands.
Principal component analysis is a useful technique for exploratory data analysis, allowing to
better visualize the variation present in a dataset with many interrelated variables. In our
case, the dataset contained 27 observations (9 samples per brand) described by 7 variables
(the trace elements content as mentioned in Table III.4.4. Principal component analysis allows
to see the overall “shape” of the data, identifying which samples are similar to one another
and which are very different. It makes possible the identification of potential groups of
samples that are similar and to work out which variables make one group different from
another. When many variables correlate with one another, they will all contribute strongly to
the same principal component (Bereton, 2007).
Figure III-4. 5 shows typical plots from the PCA with a loading plot (on the left) and a score
plot (on the right). The loading plot is used for interpreting relationships among
variablesand the score plot is used for interpreting relationships among observations.
All variables were well represented in the F1–F2 plot (sum of squared cosine above 0.75).
The PCA shows that the following elements were correlated: Ni and Co, As and Pb as well
as Cr and Hg. Lead and Co were anti-correlated, as well as Ni and Pb. There was no correlation
between Cd and Co, Cd and Pb, Cr and As as well as Hg and As. The Pearson correlation
matrix is provided in the table below.

Ch III-4 Lebanese Population Exposure to Trace Elements via White Bread Consumption
153
Table III-4. 5: Pearson correlation matrix of the Principal Component Analysis.
Variables As Co Cd Cr Hg Ni Pb
As 1
Co -0.41* 1
Cd 0.43* -0.10 1
Cr -0.03 -0.49* -0.49* 1
Hg -0.04 -0.19 -0.53* 0.64* 1
Ni -0.59* 0.65* 0.09 -0.76* -0.50* 1
Pb 0.68* -0.65* -0.00 0.69* 0.39* -0.98* 1
* Values significantly different from zero at a level of significance alpha = 0.95
We observed three separate groups: B1, B2, and B3. The dispersion in B2 and B3 was larger
than in B1; this dispersion can be explained by a more homogeneous sampling for B1.
III-4.3.3 Trace Element Exposures
The population categories’ exposure to Cd, Hg, Cr, Co, Ni, Pb, and As via white pita consumption
according the most consumed brands is presented in Table III-4. 6.
Using statistics, we observed that, for most of the cases, the B3 brand was the origin of the
highest trace elements exposure. In regards to nickel, B1 was the main source of the highest
exposure. We further decided to keep B3 Tes data to calculate exposures Table III-4. 6. Using
a worst-case scenario for all element levels, except for nickel for which the B1 data were
retained.
For young people, there was no significant difference among both populations in terms of
exposure to any element. In contrast, we found significant differences between men and
women for all elements except nickel. Men, at the 95th percentile, were always more exposed
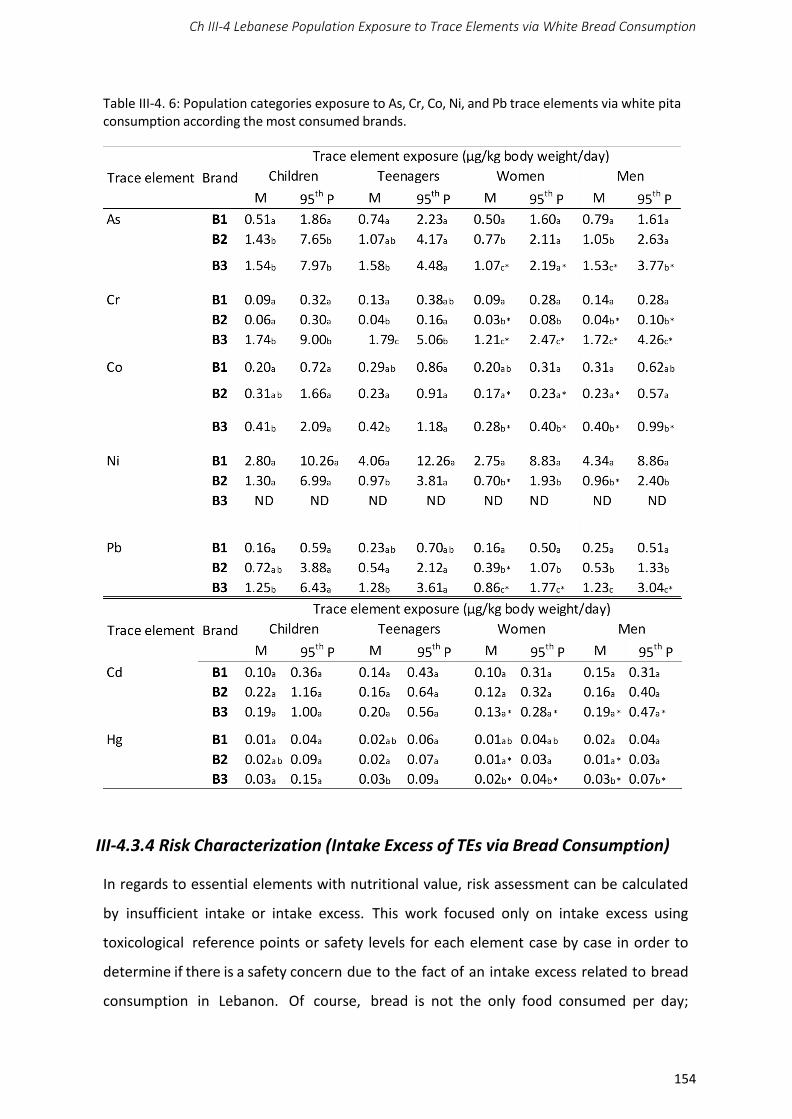
Ch III-4 Lebanese Population Exposure to Trace Elements via White Bread Consumption
154
Table III-4. 6: Population categories exposure to As, Cr, Co, Ni, and Pb trace elements via white pita consumption according the most consumed brands.
III-4.3.4 Risk Characterization (Intake Excess of TEs via Bread Consumption)
In regards to essential elements with nutritional value, risk assessment can be calculated
by insufficient intake or intake excess. This work focused only on intake excess using
toxicological reference points or safety levels for each element case by case in order to
determine if there is a safety concern due to the fact of an intake excess related to bread
consumption in Lebanon. Of course, bread is not the only food consumed per day;
Ch III-4 Lebanese Population Exposure to Trace Elements via White Bread Consumption
155
however, in this study we show that the most exposed population—men and teenagers—
can consume up to 1000 g of bread per day.
Considering chromium levels in bread, represented mostly by Cr (III)—the major form in food
(Novotnik et al., 2013), exposures to Cr ranged from 1.21 to 9 µg kg-1 bw day-1 which
represents only 3% of the European TDI (EFSA, 2014) for the most exposed population
(children at the 95th percentile) Table III-4. 7 in regards to pita consumption. Concerning
cobalt, only the exposure related to children lead to an excess (131%) of the French TDI Table
III.4.9 (ANSES, 2019ANS).
Regarding cadmium, the most exposed population were children at the 95th percentile
followed by teenagers and then men and women. The most exposed population
represented 40% of the European tolerable weekly intake (TWI) fixed by the EFSA (EFSA,
2009) Table III-4. 7.
Exposures to mercury were also very low (ranging from 0.02 to 0.15 µg kg-1 bw week-1) even
for the most exposed population (children at the 95th percentile) leading to 11.5% of the
TWI fixed by the (EFSA, 2012).
However, before concluding on safety in this survey in regards to Hg, Cd, Cr or Co, it is
important to take into account exposure from other food items in the context of the
Lebanese population’s total diet.
Concerning nickel, the situation is already worrying when taking into account only pita
consumption. Teenagers were the most exposed population followed by children and then
adults, regardless of sex Table III-4. 8. The European TDI was exceeded for all exposures for
teenagers and men and only at the 95th percentile (3 to 4 fold) for children and women.
Table III.4.9 shows that the margins of exposure (MOE) in regard to lead, determined with a
BMDL0.1 based on neurotoxic effect (EFSA, 2010), were very low (between 0.08 and 0.58)
whatever the population. The most exposed populations in decreasing order were
children, teenagers, men, and women. The calculated MOEs suggest a safety level of
preoccupation regardless of the population in terms of lead exposure via bread
consumption.
The same safety preoccupations can be observed with arsenic considering As is represented
by its inorganic form. The EFSA has concluded that 0.3 to 8 µg kg-1 bw day-1 should be used
as a point of reference (EFSA, 2009a). Thus, these values were used for MOE calculation to
assess risk characterization. Table III.4.9 shows that the MOEs were very low regardless of the

Ch III-4 Lebanese Population Exposure to Trace Elements via White Bread Consumption
156
population in both scenarios. The most exposed populations were children followed by
teenagers and then men and women. The MOE data suggest a worrying risk in regard to As
exposure linked to pita consumption regardless of the population in this survey.
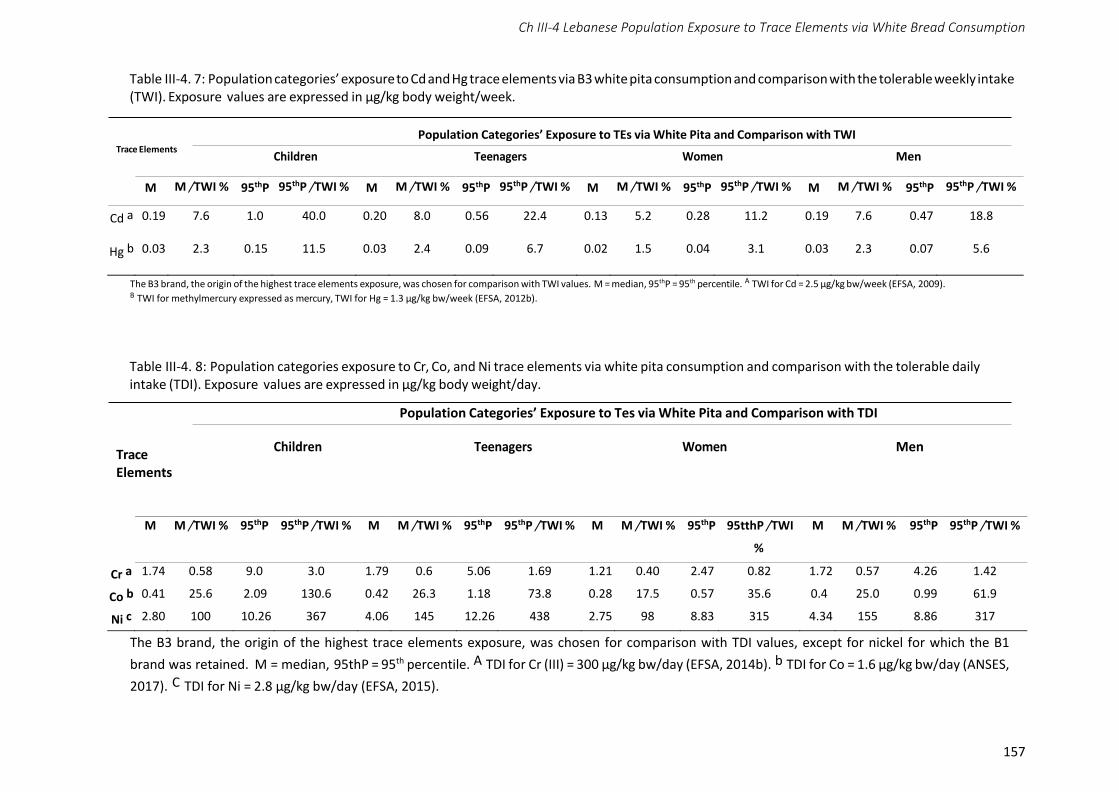
Ch III-4 Lebanese Population Exposure to Trace Elements via White Bread Consumption
157
Table III-4. 7: Population categories’ exposure to Cd and Hg trace elements via B3 white pita consumption and comparison with the tolerable weekly intake (TWI). Exposure values are expressed in µg/kg body weight/week.
Trace Elements
Population Categories’ Exposure to TEs via White Pita and Comparison with TWI
Children Teenagers Women Men
M M /TWI % 95thP 95thP /TWI % M M /TWI % 95thP 95thP /TWI % M M /TWI % 95thP 95thP /TWI % M M /TWI % 95thP 95thP /TWI %
Cd a 0.19 7.6 1.0 40.0 0.20 8.0 0.56 22.4 0.13 5.2 0.28 11.2 0.19 7.6 0.47 18.8
Hg b 0.03 2.3 0.15 11.5 0.03 2.4 0.09 6.7 0.02 1.5 0.04 3.1 0.03 2.3 0.07 5.6
The B3 brand, the origin of the highest trace elements exposure, was chosen for comparison with TWI values. M = median, 95thP = 95th percentile. A TWI for Cd = 2.5 µg/kg bw/week (EFSA, 2009). B TWI for methylmercury expressed as mercury, TWI for Hg = 1.3 µg/kg bw/week (EFSA, 2012b).
Table III-4. 8: Population categories exposure to Cr, Co, and Ni trace elements via white pita consumption and comparison with the tolerable daily intake (TDI). Exposure values are expressed in µg/kg body weight/day.
Trace Elements
Population Categories’ Exposure to Tes via White Pita and Comparison with TDI
Children Teenagers Women Men
M M /TWI % 95thP 95thP /TWI % M M /TWI % 95thP 95thP /TWI % M M /TWI % 95thP 95tthP /TWI M M /TWI % 95thP 95thP /TWI %
%
Cr a 1.74 0.58 9.0 3.0 1.79 0.6 5.06 1.69 1.21 0.40 2.47 0.82 1.72 0.57 4.26 1.42
Co b 0.41 25.6 2.09 130.6 0.42 26.3 1.18 73.8 0.28 17.5 0.57 35.6 0.4 25.0 0.99 61.9
Ni c 2.80 100 10.26 367 4.06 145 12.26 438 2.75 98 8.83 315 4.34 155 8.86 317
The B3 brand, the origin of the highest trace elements exposure, was chosen for comparison with TDI values, except for nickel for which the B1
brand was retained. M = median, 95thP = 95th percentile. A TDI for Cr (III) = 300 µg/kg bw/day (EFSA, 2014b). b TDI for Co = 1.6 µg/kg bw/day (ANSES,
2017). C TDI for Ni = 2.8 µg/kg bw/day (EFSA, 2015).
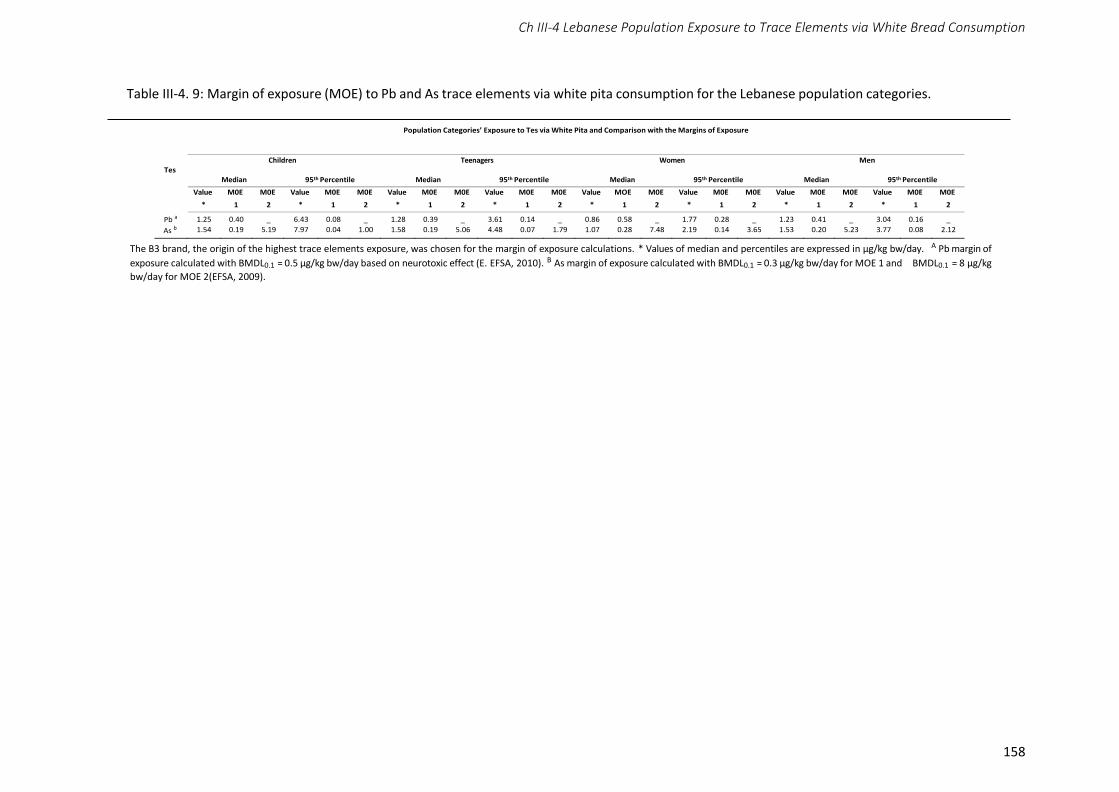
Ch III-4 Lebanese Population Exposure to Trace Elements via White Bread Consumption
158
Table III-4. 9: Margin of exposure (MOE) to Pb and As trace elements via white pita consumption for the Lebanese population categories.
Population Categories’ Exposure to Tes via White Pita and Comparison with the Margins of Exposure
Children Teenagers Women Men Tes
Median 95th Percentile Median 95th Percentile Median 95th Percentile Median 95th Percentile
Value M0E M0E Value M0E M0E Value M0E M0E Value M0E M0E Value MOE M0E Value M0E M0E Value M0E M0E Value M0E M0E
* 1 2 * 1 2 * 1 2 * 1 2 * 1 2 * 1 2 * 1 2 * 1 2
Pb a 1.25 0.40 _ 6.43 0.08 _ 1.28 0.39 _ 3.61 0.14 _ 0.86 0.58 _ 1.77 0.28 _ 1.23 0.41 _ 3.04 0.16 _
As b 1.54 0.19 5.19 7.97 0.04 1.00 1.58 0.19 5.06 4.48 0.07 1.79 1.07 0.28 7.48 2.19 0.14 3.65 1.53 0.20 5.23 3.77 0.08 2.12
The B3 brand, the origin of the highest trace elements exposure, was chosen for the margin of exposure calculations. * Values of median and percentiles are expressed in µg/kg bw/day. A Pb margin of
exposure calculated with BMDL0.1 = 0.5 µg/kg bw/day based on neurotoxic effect (E. EFSA, 2010). B As margin of exposure calculated with BMDL0.1 = 0.3 µg/kg bw/day for MOE 1 and BMDL0.1 = 8 µg/kg
bw/day for MOE 2(EFSA, 2009).
Ch III-4 Lebanese Population Exposure to Trace Elements via White Bread Consumption
159
III-4.4 Discussion
III-4.4.1 Survey
The direct input of the answers to the questions asked by the data collectors on electronic
tablets made it possible to calculate exposure values to TEs at the level of the individual
insofar as we had all the necessary data at this scale: age, gender, body weight, daily intake,
and brand of pita. The most recent works on this topic were based on a survey conducted
in 2001 and for which the calculation of exposure from the intake was based on the average
body weight of the whole surveyed sample (Nasreddine et al., 2010, 2006). This survey was
based on a nationally representative survey, a real sample covering 992 Lebanese consumers.
To our knowledge, this was the first survey assessing the pita diet in Lebanon in different
Lebanese regions covering young people and adults. Previous studies focused on adults in
the Beirut area only. There was a large standard deviation in the distribution of bread
consumption among adults in all regions. This could be explained by the fact that people
aged 65 and over eat a lot of bread.
The use of the questionnaire responses provided a good overview of pita consumption by
region, age, and gender. It allowed for the drawing of typologies of people living in
these regions too. The combination of estimates on consumption from the survey and the
analytical results from pita experiments made it possible to do a risk evaluation.
The exposure study was done on a population consuming mainly white pita (762
individuals out of 992). The remaining population who did not consume white bread
would be, in principle, more exposed to trace elements based on the article by Bou
Khouzam et al. (2012) which emphasizes that Lebanese brown bread is more contaminated
than white.
III-4.4.2 Risk Characterization
In terms of risk characterization linked to the seven trace elements analyzed in the pita
bread, a highly consumed foodstuff, two of the trace elements, Cd and Hg, appeared to not
be a safety concern. The results for Cd are in accordance with Nasreddine et al. (2010) study
conducted on the total diet in an adult urban population. Bread may not be the main food
involved in the highest exposure to Cd, as these authors showed that the main contributors
Ch III-4 Lebanese Population Exposure to Trace Elements via White Bread Consumption
160
to the dietary intake of Cd in a Beirut TDS were vegetables (46.8%) followed by breads and
cereal-based products (30.9%). Same as for Cd, bread is not the main source of Hg, for which
it is fish and seafood, which is a concern for high fish consumers (ANSES, 2019) and,
particularly, pregnant women (EFSA, 2012b). We found between 0.70 and 0.89 µg kg-1 of
Hg in Lebanese pita which is by far less than in the study of Mestek and co-workers (Mestek
et al., 2015) who found 13 µg kg-1 of Hg in bread in the Czech Republic.
In our study, total chromium was analyzed. The B3 pita contained the highest level of
Cr (0.36 mg kg-1 of dry weight). It is known that the major form of Cr in food is Cr (III), and
the major contributor of Cr is bread (8%) followed by bakery products. For children, it is milk
(9%) followed by pasta (6%) (Soares et al., 2010). In this study, the analytical data from the
two brands (B1 and B2) were in accordance with Soares (Soares et al., 2010) team who
quantified the total chromium contents (47.3 ± 20.0 µg kg-1) of dry weight white bread
samples.
Compared to Cr (VI), Cr (III) is considered an essential element for humans and authorized
in food supplements in Europe without any upper limit (Directive 2002 /46 EC, 2002). But,
in 2010, the (EFSA, 2010a) recommended that total Cr does not exceed 250 µg/day, a value
established by the WHO (WHO, 1996). Furthermore, Cr (III) can complex with lactate and
picolinate, causing concern as it has been demonstrated to be genotoxic (EFSA, 2014). In
contrast, Cr (VI) is known to be highly toxic and carcinogenic (Group 1,(IARC, 2012). It also
induces skin dermatitis, then the interconversion will be of relevance in terms of risk
assessment.
Even if data on the presence of Cr (VI) in food are missing, it is considered that food is a
large reducing medium and that oxidation of Cr (III) to Cr (VI) would not occur. Additionally,
most of the Cr (VI) is considered to be reduced in the stomach to Cr (III) (EFSA, 2014b).
Humans are exposed to Cr mainly via food, but it can be present also in water. Concerning
bottled water in Lebanese markets (Semerjian, 2014), a study of the physicochemical and
heavy metal parameters in 32 samples of bottled waters, 25 of these samples showed
values below 1 µg L-1 for Cr, while the other samples showed values ranging between 1 and
4 µg L-1 in the drinking water. Although naturally occurring Cr (VI) is rarely found in the
environment, its presence in ground and surface waters, as a consequence of oxidation of
Cr (III)-bearing minerals by Mn (IV) oxides, has been reported recently (Ščančar and Milačič,
Ch III-4 Lebanese Population Exposure to Trace Elements via White Bread Consumption
161
2014). Furthermore, in terms of the total quantity found in bread, we do not know its
respective part coming from the wheat flour or water used during the bread-making
process. Wheat are among species that demonstrate the ability to bio-accumulate
chromium the most, just after tomato (Gupta et al., 2019). An average value of Cr below
0.05 mg kg-1 of dry weight was measured in wheat seeds in Swedish long-term soil-fertility
experiments between 1967 and 2003 (Kirchmann et al., 2009).
The recipient might also be a source of contamination if Cr is released. Indeed, migration
of chromium from steel material occurred in the past mostly from Asia (China) and was
above the upper legal limits for food contact material (RASFF, 2019).
The EFSA panel recommended the generation of data using sensitive analytical
methodologies which specifically measure the content of Cr (III) and Cr (VI) in food and
drinking water in different EU Member States (EFSA, 2014); the issue is the same for
Lebanon. However, Cr speciation is difficult to conduct, especially in complex matrices.
Chromium speciation depends on several factors such as pH, concentration, oxidation
state, and complexation with natural components present in the matrix such as peptide
(Ščančar and Milačič, 2014). Soares and co-workers (Soares et al., 2010) mentioned the
presence of Cr (VI) in bread after extraction of Cr by alkaline solutions. However, (Novotnik
et al., 2013) demonstrated that the only Cr species in bread is Cr (III) by spiking with enriched
isotopes of 53Cr (III) and 50Cr (VI), a more accurate quantification, and using HPLC-ICP-MS.
Thus, we made a characterization in regard to Cr (III) and, in this way, there were no safety
concerns in this study for Cr (III) in Lebanese pita bread.
For cobalt, the exposure of young people under 15 years old at the 95th percentile exceeded
the TDI by a percentage of 131%. Bread and cereals are significant source of Co exposure
(18.1%), with a daily intake of cobalt estimated to be around 11.4 µg/day according to the
Nasreddine study (Nasreddine et al., 2010). Indeed, in their study they found 6.36 µg kg-1
of cobalt in bread and cereals. In this study, the level of Co was 91 µg/kg for the B1 pita
brand, which is 7 fold more than in Australian bread and 13.5 fold higher than the data
from the Nasreddine study (Nasreddine et al., 2010) but 1.8 fold less than in Ethiopian bread
(Ergetie et al., 2012).
Ch III-4 Lebanese Population Exposure to Trace Elements via White Bread Consumption
162
In Lebanon, imported flour samples used in Lebanese white pita presented values for
cobalt between 2 ± 2 and 33 ± 7 µg kg-1 which is far less than in the pita. Cobalt
contamination can also occur during bread preparation via the water used. The mean level
of Co in tap water is approximately 9 µg L-1 (IRAL, personal communication). In 2013, the
Environmental Working Group’s (EWG Tap Water, 2019) mission detected Co in only one
sample (6 analyzed) and found 1.01 µg L-1 (EWG Tap Water, 2019). Furthermore, cobalt
can also be released from food contact materials (FCMs) as it is used in ceramics (Saisine,
2010); thus, we can wonder if cobalt migration can occur from recipients used for making
bread in Lebanon.
Several forms of cobalt (II) (sulphate, dichloride) are classified as presumed human
carcinogens via the inhalatory route (European Parliament and the Council of the European
Union, 2008). The IARC classified the soluble form of cobalt II in class 2B but as metal, Co
was classified in 2A (IARC, 2012). Although Co (II) salts are able to induce genotoxicity in vitro
and in vivo after oral or parenteral exposure; however, there is a lack of carcinogenesis
studies in humans and animals following an oral route (EFSA, 2009). The EFSA concluded
that it cannot be excluded that cobalt could have a non-threshold toxicological effect (EFSA,
2012). In France, ANSES made the recommendation to reduce food exposure to cobalt in
infants under 3 years old (ANSES, 2019). Thus, for cobalt, the daily intake from all dietary
sources may be quite pertinent to monitor in order to determine the total exposure of
young people under 15 years old in Lebanon.
In regards to nickel, the B1 brand contained the highest value (1292 µg kg-1), which was
above values found in studies for Nigerian, Ethiopian, and Spanish bread (Cuadrado et al., 2000;
Ergetie et al., 2012; Onianwa et al., 2001) but under those obtained in Iranian bread (Khaniki
et al., 2005). However, for another brand the value (365 µg kg-1) was in the same range.
The average daily intake of nickel was estimated at 126.27 µg day-1 bread and cereals
contributing to a 54.73 µg day-1 Ni intake in the Lebanese adult urban population
(Nasreddine et al., 2010).
In a French TDS study regarding the infant population, the value determined in bread
was approximately 69.5 µg kg-1 (ANSES, 2019). The contribution of drinking water to total
Ch III-4 Lebanese Population Exposure to Trace Elements via White Bread Consumption
163
exposure to nickel was very small across dietary surveys and age classes (EFSA, 2015). We
do not have an explanation, but this high level could be due to the recipient used by bakers.
Using the TDI 2.8 µg kg-1 bw day-1 (EFSA, 2015) for oral chronic exposure, the data
demonstrate that the percentage of Ni TDI was exceeded 3 to 4 fold for all populations with
the 10–14 years old range being the most exposed. These data are in accordance with the TDS
studies also showing a safety concern in France for very young people (<3 years old) (ANSES,
2019).
Nickel compounds and metallic nickel are classified as human carcinogens, respectively,
group 1 and group 2B after inhalation (IARC, 2012). Available studies in animals suggest
that exposure to nickel salts lead to renal effects and increases neonatal mortality with the
kidney being the principal target. Reproductive and developmental toxicity were the critical
effects after chronic oral exposure retained for risk characterization. However, oral
exposure to nickel salts could be at the origin of contact dermatitis for sensitive
populations. Indeed, oral nickel can also cause an oral and chronic effect in people dermally
sensitized (EFSA, 2015).
In humans, absorption of Ni varies according to the method of exposure (in water it is 40
fold more absorbed compared to food; 0.7% and the bioavailability varies with the food type
(ATSDR, 2005). There are no maximum levels in food for nickel; in contrast, a value of 20
µg L-1 is fixed in water intended for human consumption and in mineral waters in Europe
(Commission Directive 2003/40/EC, 2003; Council Directive 98 83 EC, 1998).
In this study, arsenic exposure was more worrying, as we found a high level of arsenic for
all brand analyzed (235–400 µg kg-1) which is around 63 fold higher than those found in a
bread study in the UK (Sadee et al., 2015) and 32 fold higher than those mentioned in a
French infant TDS study (ANSES, 2019). (Bou Khouzam et al., 2012) mentioned seasonal
variation in the arsenic concentration in bread (33 µg kg-1 in dry season, which is 4 fold
higher than in wet season). Arsenic was not studied by (Nasreddine et al., 2010) and
calculated MOEs were very low for all bakeries and the population. These data are in
accordance with the data and risk characterization in 19 countries in Europe (EFSA, 2009),
for example, in France where there is a safety concern with MOEs lower than 36 (ANSES,
2019), suggesting that the situation in Lebanon is worrying. The inorganic form of As, which
is known to be toxic, may cause human malignancies. It was classified as carcinogenic
Ch III-4 Lebanese Population Exposure to Trace Elements via White Bread Consumption
164
(group 1) in Reference (IARC, 1987). The toxicity, due to the inorganic form, occurs by an
epigenetic mechanism, and there is increasing evidence that early life exposure affecting
fetal and infant growth (Vahter, 2008) may cause chronic disease later in life (Godfrey, 2000).
This highlights the urgent need to obtain data on the effect of the toxicity of As on
development (ANSES, 2019). Arsenic passes through the placental barrier in humans (Hall
et al., 2007), resulting in similar levels (ATSDR, 2005) in both the fetus and mother. Both
the inorganic form and its methylated metabolites are transferred (Concha et al., 1998).
The effect of As on the endocrine system has also been investigated for many years
showing a disruption on the gonadal, adrenal, and thyroid endocrine systems (Sun et al.,
2016). Furthermore, it is having been shown a toxic effect due to an interaction between Cd
and As (Lin et al., 2016; Su et al., 2017). Drinking water, crops irrigated with contaminated
water, and food prepared with contaminated water are sources of exposure (Kapaj et al.,
2006).
The EFSA’s recommendation is to reduce inorganic arsenic exposure in food and develop
robust validated methods to determine the inorganic form (EFSA, 2009). We do not
distinguish between organic and inorganic form of As in this study. It is known that arsenic
intake is higher from solid foods than from liquids.
Furthermore, speciation plays a major role in determining the amount of arsenic
absorbed after consumption of As contaminated food as well as bioavailability with
significant interspecies differences for organic arsenic. Regards to inorganic form,
absorption can be high as demonstrated with contaminated rice (Juhasz et al., 2006; Raber
et al., 2012).
Representative data on speciation are indeed scarce. The EFSA panel assumed a proportion
of the contaminant to inorganic form (the toxic one) to vary between 50 (best case) to 100%
(worst case) of the total arsenic reported in food commodities in Europe, other than fish
and seafood (EFSA, 2009). Furthermore, in bread, 92% of the inorganic form has been
found (D’Amato et al., 2011). Cereals and cereal-based products were identified as largely
contributing to the daily exposure to inorganic arsenic, as it was quantified as 53 µg up to 72
µg of arsenic per kilo for all cereals and cereal product categories. In wheat samples, it was
demonstrated that 91% to 95% of As was in the inorganic form (D’Amato et al., 2011; Raber
et al., 2012). In wheat plants cultivated in the Bekaa region, the element As presented values
Ch III-4 Lebanese Population Exposure to Trace Elements via White Bread Consumption
165
between 288.3 ± 14.7 and 743.7 ± 25.4 mg kg-1. In the irrigation water used in the Bekaa
sites cultivated for wheat plants, the As content varied between 0.8 ± 0.3 µg L-1 and 1.2 ±
0.2 µg L-1 (IRAL data). Indeed, the level of As in drinking water in Lebanon varied between
1.2 and 4.5 µg L-1. Water used for making bread can be the main contributor to the level of
arsenic in the pita with the main form recovered in drinking water as inorganic. It is important
to note than that change in the speciation of As can occur during food preparation (Devesa
et al., 2008).
Concerning the level of lead in the different brands: B2 and B3 contents were more than 2.5
fold higher than B1 (74, 203, and 260 µg kg-1, respectively). The order of magnitude of B1
is in accordance with Turkish, Iranian, Ethiopian, and Spanish studies on bread (Cuadrado
et al., 2000; Ergetie et al., 2012) and 7 fold more higher than in data on the Czech Republic
(Mestek et al., 2015). The B3 pita lead content was 32 fold higher than Lebanese data
(Nasreddine et al., 2010) which focused on Beirut. The authors noticed that the lead
exposure in Beirut was even two fold lower compared to a previous study (Nasreddine et al.,
2006). Thus, our data were not in accordance, but it took into account all the Lebanese
regions including rural ones. The lead origin may be from wheat. Several samples of
Lebanese wheat cultivated in the Bekaa region were studied, showing values of lead varying
between 4.5 and 23 µg kg-1 but far less than in the bread, noting that the lead values in
Lebanese wheat samples were lower than the values showing in wheat samples in Saudi
Arabian markets (2.81 ± 0.08 mg kg-1 dry weight) (Ali and Al-Qahtani, 2012). While, the lead
levels, measured in five wheat flour samples in Lebanese markets varied between 0.0045
± 0.002 and 0.023 ± 0.016 mg kg-1 dry weight, they were lower than values presented in
wheat flour samples in the Canary Islands and used for bread production (varying
between 0.037 ± 0.013 and 0.056 ± 0.045 mg kg-1 fresh weight) (Tejera et al., 2013).
Furthermore, lead can also be a contaminant issued from recipient food contact materials or
water used for bread making.
Human data show that the developing nervous system is a critical target in children.
Various water soluble and insoluble lead can induce tumors in rodents, especially renal
tumors as a carcinogenic/promoter; brain gliomas were also observed. Classified lead
compounds are probably carcinogenic to humans on the basis of limited evidence of
Ch III-4 Lebanese Population Exposure to Trace Elements via White Bread Consumption
166
carcinogenicity in humans and sufficient evidence in animals (IARC, 2012).
It is important to note that due to the long lead half-life, chronic exposure is of most concern
and children absorb lead after ingestion to a much greater extent (70% of the amount of lead
ingested) than adults (20%) (ATSDR, 2010).
All MOEs calculated with exposure only via pita consumption in this study were very low, but
in the same range than in France and Europe (ANSES, 2016, 2011; EFSA, 2010), suggesting
an exposure safety concern and that it is necessary to decrease Pb exposure, for example, by
varying the diet due to the difficulty in reducing Pb contamination.
For both lead and arsenic, this contamination occurred for all bread brands analyzed in this
study and there is a safety concern Error! Reference source not found..
Ch III-4 Lebanese Population Exposure to Trace Elements via White Bread Consumption
167
III-4.5 Conclusions
This was the first study conducted all over Lebanon showing the exposure of different
categories of Lebanese population to trace elements via bread. A survey of daily
consumption of pita bread was conducted on a sample of 992 people. Among the four
categories (i.e., children, teenagers, women, and men), white bread was the most
consumed. Men consumed the highest quantity (282 g/day). The survey revealed that
three brands of white pita were the most consumed: B1, B2, and B3.
Seven trace elements (i.e., As, Cd, Co, Cr, Hg, Ni, and Pb) were quantified in pitas coming from
B1, B2, and B3. B1 was characterized by high levels of Ni and Co. B2 was characterized by the
presence of As and Cd, and B3 was characterized by the presence of Cr, Hg, and Pb. Lead
concentrations exceeded the authorized limits of the Lebanese standard for bread in the two
brands. Further analysis should be performed on soil, wheat, flour, and water in order to
determine the source of the contamination and to reduce exposure.
The B3 brand was at the origin of the highest trace element exposure, except for nickel for
which B1 was retained. In terms of risk characterization, there was no safety concern
due to the fact of pita consumption for all studied categories with Hg, Cd, Cr, and for Co
except the 95th percentile of the children category (6–9 years old). Nickel exposure showed
an excess of the TDI up to 4 fold for the most exposed populations (95th percentile). There
were safety concerns related to As and Pb, as the margins of exposure were very low. To
our knowledge, this is the first time that exposure to As was studied in the Lebanese
population. To confirm these observed data, it is urgent to analyze the inorganic arsenic
form levels in bread. Experiments are currently being run to study any cocktail effects
(synergistic) using pertinent bioassays due to the exposure to the sum of trace element
identified in bread. The ultimate objectives are to protect the Lebanese population by
reducing exposures to populations particularly exposed to Tes presenting safety concern
and to make recommendations, as bread is only one part of the daily diet.

GENERAL CONCLUSION & PERSPECTIVES
168
GENERAL CONCLUSION
&
PERSPECTIVES
GENERAL CONCLUSION & PERSPECTIVES
169
In the context of food safety, it was relevant to study the Lebanese white bread since it
constitutes an essential part of the daily diet of the Lebanese population. The study of trace
elements in the Lebanese white bread and their traceability throughout the bread chain,
allowed us to initiate from the wheat cultivated soils in the Bekaa plain, considering the
cultivated wheat plants, and reaching the Lebanese white bread. This enabled us to study the
exposure of the population to these elements.
The different themes addressed in this thesis are :
1. The approach of a new method of extraction of trace elements in the soil of
the Bekaa Plain.
2. The analysis of geogenic and anthropogenic contamination of soils by TEs in
the Bekaa Plain and their transfer to the cultivated wheat plants.
3. The exposure of the Lebanese population to trace elements present in
Lebanese white bread consumed daily.
Our study allowed us to validate a new method for monitoring trace elements in the
Mediterranean cereal soils. It consists of microwave digestion, with H2SO4 + H2O2 combined
with the measurement of flame-AAS, of wheat cultivated soil samples in the Bekaa region.
This validated method is found efficient for routine TEs characterization of calcareous and Ca-
saturated soils with limited contamination in As, Cd, Cu, Co, Cr and Pb, hence presenting a
great substitute to advanced methods on Hydrofluoric acid, as well as aqua regia.
This cheap and safe method of analysis adapted to developing countries, should be verified
on different soil types to further extend its use in the Mediterranean area.
We have chosen a field approach to take into account the bioclimatic and anthropogenic
factors on the transfer of elements. The 9 sites chosen by LARI allow us to take into account
the diversity of soils. The anthropogenic contamination mainly coming from industrial works
of the industrial zones in Zahle, Taanayel, and Saadnayel present close to our sites. As well as
sewage and runoff carried by surface water.
Among the sites studied in this work, the site B3 showed a contamination by trace elements
in soils cultivated by wheat, where this contamination is of anthropogenic origin from intense
industrial activities in the area. Due to the current crisis in Lebanon, it is essential to be able
to rely more on the local production of wheat and thus the production of bread. In this
GENERAL CONCLUSION & PERSPECTIVES
170
context, it was important to study the level of contamination by TEs of wheat produced
locally, to be able to assess the risks to human health and to identify means of limiting
potential exposure to metals and metalloids. In this study, the analysis of locally produced
wheat grains showed high As values, correlated with As extractable by DTPA. The element Pb
showed extremely low concentrations in wheat grains, while Cd values were close to limit
values. The latter were found to correlate with Cd extractable by DTPA and translocation
factors were often greater than 1, showing that Cd was easily translocated into the grain.
Although in this thesis, for the first time in Lebanon, the exposure of different categories of
Lebanese population to trace elements via bread consumption was studied. A survey of a daily
consumption of the Lebanese white bread was conducted. This survey was carried out at the
level of 992 individuals distributed in 4 categories: children, teenagers, women, and men. This
survey showed that white bread was the most consumed, especially by men (282 g per day).
According to the questionnaire, three most famous bakery’s brands of white bread designated
by B1, B2, and B3 were collected and analyzed for the presence of seven trace elements (As,
Cd, Co, Cr, Hg, Ni, and Pb).
In consequence, the brand B1 was characterized by high levels of Ni and Co, the brand B2 was
characterized by the presence of As and Cd, while the brand B3 was characterized by the
presence of Cr, Hg, and Pb. Where the Pb concentrations exceeded the authorized limits of the
Lebanese standard for bread (NL 240:2010).
According to the Lebanese population’s exposure, the B3 brand was at the origin of the highest
TEs exposure, except for Ni for which B1 was retained. From a risk characterization point of
view, there was no safety concern due to the fact of pita consumption for all studied
categories with Hg, Cd, Cr, and for Co except the 95th percentile of the children category (6–
9 years old). Nickel exposure showed an excess of the TDI up to 4 fold for the most exposed
populations (95th percentile). There were safety concerns related to As and Pb, as the margins
of exposure were very low.
Finally, this multidisciplinary thesis shed light on the Tracking Trace Elements from Soil to
Lebanese Bread and Population’s Exposure. Ranging from the characterization of the soil of
the Bekaa plain, passing through the quality of wheat grown in the plain from a Tes point of
view, the contamination of Lebanese white bread in the market, as well as the exposure of
GENERAL CONCLUSION & PERSPECTIVES
171
the population to trace elements in the bread consumed. In addition, it encouraged a new
method of extraction of trace elements from soil.
Following this study, other types of soil should be tested to further extend its use to a wider
range of soils to cover the diversity of soils in the Mediterranean region.
According to the current crisis, it may have to rely more on its local production. In this context,
it was important to study the level of Cd, As and Pb in wheat, the relationships with soil and
environmental factors to assess the risks to human health and to identify ways to limit
potential exposure to metals and metalloids.
To our knowledge, this is the first time that exposure to As was studied in the Lebanese
population. To confirm these observed data, it is urgent to analyze the inorganic arsenic form
levels in bread. The ultimate objectives are to protect the Lebanese population by reducing
exposures to populations particularly exposed to TEs presenting safety concern and to make
recommendations, as bread is the important part of the daily diet.

REFERENCES
172
REFERENCES

REFERENCES
173
Adriano, 1986. Trace Elements in the Terrestrial Environment | Domy C. Adriano | Springer [WWW Document]. URL https://www.springer.com/gp/book/9781475719079 (accessed 9.13.21).
Adriano, D.C., 2001. Trace Elements in Terrestrial Environments, 2nd ed. Springer New York, New York, NY. https://doi.org/10.1007/978-0-387-21510-5
Agrafioti, E., Diamadopoulos, E., 2012. A strategic plan for reuse of treated municipal wastewater for crop irrigation on the Island of Crete. Agric. Water Manag. 105, 57–64. https://doi.org/10.1016/j.agwat.2012.01.002
Agunbiade, S.O., Ojezele, O.J., Barinemene, M., 2020. Storage environment/packaging materials impacting bread spoilage under ambient conditions: A comparative analysis. Chem. Int. 6, 131–136. https://doi.org/10.31221/OSF.IO/DXKT5
Ahmed, M.T., Abdel Hadi, E.S., El Samahy, S., Youssof, K., 2000. The influence of baking fuel on residues of polycyclic aromatic hydrocarbons and heavy metals in bread. J. Hazard. Mater. 80, 1–8. https://doi.org/10.1016/S0304-3894(00)00300-9
Akinyele, I.O., Shokunbi, O.S., 2015. Concentrations of Mn, Fe, Cu, Zn, Cr, Cd, Pb, Ni in selected Nigerian tubers, legumes and cereals and estimates of the adult daily intakes. Food Chem. 173, 702–708. https://doi.org/10.1016/j.foodchem.2014.10.098
Al-Dayel, O., Al-Horayess, O., Hefni, J., Al-Durahim, A., Alajy, T., 2012. Contamination of Foods by Migration of Some Elements from Plastics Packaging. Food Qual. https://doi.org/10.5772/33161
Ali, M.H.H., Al-Qahtani, K.M., 2012. Assessment of some heavy metals in vegetables, cereals and fruits in Saudi Arabian markets. Egypt. J. Aquat. Res. 38, 31–37. https://doi.org/10.1016/j.ejar.2012.08.002
Al-Khatib, I.A., Sato, C., 2009. Solid health care waste management status at health care centers in the West Bank – Palestinian Territory. Waste Manag. 29, 2398–2403. https://doi.org/10.1016/j.wasman.2009.03.014
Almeselmani, M., Abdullah, F., Hareri, F., Naaesan, M., Adel Ammar, M., ZuherKanbar, O., Alrzak Saud, A., 2011. Effect of Drought on Different Physiological Characters and Yield Component in Different Varieties of Syrian Durum Wheat. J. Agric. Sci. 3, 127–133. https://doi.org/10.5539/jas.v3n3p127
Alowitz, M.J., Scherer, M.M., 2002. Kinetics of Nitrate, Nitrite, and Cr(VI) Reduction by Iron Metal. Environ. Sci. Technol. 36, 299–306. https://doi.org/10.1021/es011000h
Angelakis, A., 2001. Wastewater reclamation and reuse in Eureau countries. Water Policy 3, 47–59. https://doi.org/10.1016/S1366-7017(00)00028-3
ANSES, 2019. OPINION of the French Agency for Food, Environmental and Occupational Health & Safety on the risks associated with the consumption of food supplements for joint conditions containing glucosamine and/or chondroitin sulphate [WWW Document].
ANSES, 2017. Risk of introduction of lumpy skin disease into France ANSES opinion Collective expert report [WWW Document].
ANSES, 2016. ANSES Infant Total Diet Study (iTDS). Available online: https://www.anses.fr/en/system/files/ ERCA2010SA0317RaEN.pdf (accessed on 26 July 2019). [WWW Document].
ANSES, 2011a. ANSES. Second French Total Diet Study (TDS 2) Report 1. Inorganic Contaminants, Minerals, Persistent Organic Pollutants, Mycotoxins and Phytoestrogens. ANSES Opinion. Available online: https://www.anses. Fr/en/system/files/PASER2006sa0361Ra1EN.pdf (accessed on 26 July 2019). [WWW Document].
ANSES, 2011b. Contaminants inorganiques, minéraux, polluants organiques persistants, mycotoxines, phyto-estrogènes. Rapport d’expertise. [WWW Document].
Antoniadis, V., Golia, E.E., Liu, Y.-T., Wang, S.-L., Shaheen, S.M., Rinklebe, J., 2019a. Soil and maize contamination by trace elements and associated health risk assessment in the industrial area of Volos, Greece. Environ. Int. 124, 79–88. https://doi.org/10.1016/j.envint.2018.12.053
Antoniadis, V., Levizou, E., Shaheen, S.M., Ok, Y.S., Sebastian, A., Baum, C., Prasad, M.N.V., Wenzel, W.W., Rinklebe, J., 2017. Trace elements in the soil-plant interface: Phytoavailability, translocation, and phytoremediation–A review. Earth-Sci. Rev. 171, 621–645. https://doi.org/10.1016/j.earscirev.2017.06.005
REFERENCES
174
Antoniadis, V., Shaheen, S.M., Levizou, E., Shahid, M., Niazi, N.K., Vithanage, M., Ok, Y.S., Bolan, N., Rinklebe, J., 2019b. A critical prospective analysis of the potential toxicity of trace element regulation limits in soils worldwide: Are they protective concerning health risk assessment? – A review. Environ. Int. 127, 819–847. https://doi.org/10.1016/j.envint.2019.03.039
Araujo, R.G.O., Dias, F. de S., Macedo, S.M., Santos, W.N.L. dos, Ferreira, S.L.C., 2006. Method development for the determination of manganese in wheat flour by slurry sampling flame atomic absorption spectrometry. Food Chem. 101, 397–400. https://doi.org/10.1016/j.foodchem.2005.10.024
Arif et al., 2016. Influence of High and Low Levels of Plant-Beneficial Heavy Metal Ions on Plant Growth and Development. https://doi.org/10.3389/fenvs.2016.00069
Arnich, N., Sirot, V., Rivière, G., Jean, J., Noël, L., Guérin, T., Leblanc, J.C., 2012a. Dietary exposure to trace elements and health risk assessment in the 2nd French Total Diet Study. Food Chem. Toxicol. 50, 2432–2449. https://doi.org/10.1016/j.fct.2012.04.016
Atafar, Z., Mesdaghinia, A., Nouri, J., Homaee, M., Yunesian, M., Ahmadimoghaddam, M., Mahvi, A.H., 2010. Effect of fertilizer application on soil heavy metal concentration. Environ. Monit. Assess. 160, 83–89. https://doi.org/10.1007/s10661-008-0659-x
ATSDR, A., 2010. Agency for Toxic Substances and Disease Registry Case Studies in Environmental Medicine (CSEM) Lead Toxicity, ATSDR [WWW Document].
ATSDR, A., 2005. TOXICOLOGICAL PROFILE FOR NICKEL U.S. DEPARTMENT OF HEALTH AND HUMAN SERVICES Public Health Service Agency for Toxic Substances and Disease Registry [WWW Document].
Austruy, A., Laplanche, C., Mombo, S., Dumat, C., Deola, F., Gers, C., 2016. Ecological changes in historically polluted soils: Metal(loid) bioaccumulation in microarthropods and their impact on community structure. Geoderma 271, 181–190. https://doi.org/10.1016/j.geoderma.2016.02.011
Awika, J.M., 2011. Major cereal grains production and use around the world. ACS Symp. Ser. 1089, 1–13. https://doi.org/10.1021/bk-2011-1089.ch001
Azeh Engwa, G., Udoka Ferdinand, P., Nweke Nwalo, F., N. Unachukwu, M., 2019. Mechanism and Health Effects of Heavy Metal Toxicity in Humans. Poisoning Mod. World – New Tricks Old Dog. https://doi.org/10.5772/intechopen.82511
Azzi, V., 2017. Les apports des métaux traces par les fertilisants chimiques 174haracteri dans les sols libanais : investigation sur leur devenir et leur transfert To cite this version : HAL Id : tel-01535848.
Azzi, V., Kanso, A., Kazpard, V., Kobeissi, A., Lartiges, B., El Samrani, A., 2017. Lactuca sativa growth in compacted and non-compacted semi-arid alkaline soil under phosphate fertilizer treatment and cadmium contamination. Soil Tillage Res. 165, 1–10. https://doi.org/10.1016/j.still.2016.07.014
Babaahmadifooladi, M., Jacxsens, L., Wiele, T.V.D., Laing, G.D., 2019. Gap analysis of nickel bioaccessibility and bioavailability in different food matrices and its impact on the nickel exposure assessment. Food Res. Int. 108866–108866. https://doi.org/10.1016/j.foodres.2019.108866
Babu, T., Tubana, B., Paye, W., Kanke, Y., Datnoff, L., 2016. Establishing Soil Silicon Test Procedure and Critical Silicon Level for Rice in Louisiana Soils. Commun. Soil Sci. Plant Anal. 47, 1578–1597. https://doi.org/10.1080/00103624.2016.1194996
Baize, D., 2009. Cadmium in soils and cereal grains after sewage-sludge application on 174harac soils: A review. Sustain. Agric. 845–856. https://doi.org/10.1007/978-90-481-2666-8_51
Baize, D., 1997. Teneurs 174harac en Eléments Traces métalliques dans les sols (France). INRA, Paris, 408 p. – References – Scientific Research Publishing [WWW Document]. URL https://www.scirp.org/(S(i43dyn45teexjx455qlt3d2q))/reference/referencespapers.aspx?referenceid=1612778 (accessed 8.18.21).
Baize, D., Bellanger, L., Tomassone, R., 2009. Relationships between concentrations of trace metals in wheat grains and soil. Agron. Sustain. Dev. 29, 297–312. https://doi.org/10.1051/agro:2008057
REFERENCES
175
Baize, D., Courbe, C., Suc, O., Schwartz, C., Terce, M., Bispo, A., Sterckman, T., Ciesielski, H., 2006. Épandages De Boues D’Épuration Urbaines Sur Des Terres Agricoles : Impacts Sur La Composition En Éléments En Traces Des Sols Et Des Grains De Blé Tendre. Courrier de l’environnement INRA 35–61.
Baize, D., Sterckeman, T., 2001. Of the necessity of knowledge of the natural pedo-geochemical background content in the evaluation of the contamination of soils by trace elements. Sci. Total Environ. 264, 127–139. https://doi.org/10.1016/S0048-9697(00)00615-X
Barakat, N.G., 2015. American University of Beirut an assessment of sodium levels in different breads and bread intake in the Lebanese population.
Barberon and Geldner, 2014. Radial Transport of Nutrients: The Plant Root as a Polarized Epithelium.
Barłóg, P., Hlisnikovský, L., Kunzová, E., 2020a. Concentration of trace metals in winter wheat and spring barley as a result of digestate, cattle slurry, and mineral fertilizer application. Environ. Sci. Pollut. Res. 27, 4769–4785. https://doi.org/10.1007/s11356-019-07304-2
Barone, A., Ioanna, F., Storelli, M.M., Quaglia, N.C., Barone, G., Giacominelli-Stuffler, R., Dambrosio, A., Busco, A., 2017. Traditional Italian cheeses: Trace element levels and estimation of dietary intake. J. Food Compos. Anal. 66, 205–211. https://doi.org/10.1016/j.jfca.2017.12.025
Barwick, V., Bravo, P.P.M., Ellison, S.L., Engman, J., Gjengedal, E.L., Lund, U.O., Magnusson, B., Müller, H.-T., Patriarca, M., Pohl, B., 2014. The fitness for purpose of analytical methods, B. Magnusson and U. Örnemark. Ed. Eurachem.
Beretta, A.N., Silbermann, A.V., Paladino, L., Torres, D., Bassahun, D., Musselli, R., García-Lamohte, A., 2014. Soil texture analyses using a hydrometer: modification of the Bouyoucos method. Cienc. E Investig. Agrar. 41, 25–26. https://doi.org/10.4067/S0718-16202014000200013
Bethlehem, 2009. Applied Survey Methods: A Statistical Perspective Wiley Series in Survey Methodology, illustrated ed. John Wiley & Sons, 2009.
Bontos, M.D., Enache, A.I., Vaireanu, D.Io., 2016. An electrochemical impedance spectroscopy-based method to reveal the potential interactions between fizzy drinks and their packaging materials. Rev. Chim. 67, 897–901.
Borjac, J., El Joumaa, M., Kawach, R., Youssef, L., Blake, D.A., 2019. Heavy metals and organic compounds contamination in leachates collected from Deir Kanoun Ras El Ain dump and its adjacent canal in South Lebanon. Heliyon 5. https://doi.org/10.1016/j.heliyon.2019.e02212
Bou Khouzam, R., Pohl, P., Al Ayoubi, B., Jaber, F., Lobinski, R., 2012a. Concentrations of toxic and essential elements in Lebanese bread. Pure Appl. Chem. 84, 181–190. https://doi.org/10.1351/PAC-CON-11-07-22
Braccini, G.P., Braccini, P., 2007. E dei suoi corradicali est-europei , turchi , e dell ’ area semitica levantina 117–136.
Brizio, P., Benedetto, A., Squadrone, S., Curcio, A., Pellegrino, M., Ferrero, M., Abete, M.C., 2016a. Heavy metals and essential elements in Italian cereals. Food Addit. Contam. Part B Surveill. 9, 261–267. https://doi.org/10.1080/19393210.2016.1209572
Burton et al., 2003. Manure Management: Treatment Strategies for Sustainable Agriculture, Editions Quae, 2003-Farm manure. Ed. Bizzi, C.A., Pedrotti, M.F., Silva, J.S., Barin, J.S., Nóbrega, J.A., Flores, E.M.M., 2017. Microwave-assisted digestion methods: towards greener approaches for plasma-based analytical techniques. J. Anal. At. Spectrom. 32, 1448–1466. https://doi.org/10.1039/C7JA00108H
Caiserman, A., Dumas, D., Bennafla, K., Faour, G., Amiraslani, F., 2019. Application of Remotely Sensed Imagery and Socioeconomic Surveys to Map Crop Choices in the Bekaa Valley (Lebanon). Agriculture 9, 57. https://doi.org/10.3390/agriculture9030057
Cambier, P., Pot, V., Mercier, V., Michaud, A., Benoit, P., Revallier, A., Houot, S., 2014. Impact of long-term organic residue recycling in agriculture on soil solution composition and trace metal leaching in soils. Sci. Total Environ. 499, 560–573. https://doi.org/10.1016/j.scitotenv.2014.06.105
REFERENCES
176
Carlton-Smith, C. H, Davis, R. D (1983). Comparative uptake of heavy metals by forage crops grown on sludge-treated soil. International conference heavy metals in the environment, 4th International Conference on Heavy Metals in the Environment Sept. 1983, Heidelberg, Germany), CEP Consultants, Edinburgh (UK), pp 393-396]
CAS, 2019. CAS Central Administration for Statistics. Population of Lebanon. Life expectancy of Lebanon. Density of population in Lebanon. Available online: http://en.worldstat.info/Asia/Lebanon/ (accessed on 16 July 2019).
Casali, C.A., Moterle, D.F., Rheinheimer, D. dos S., Brunetto, G., Corcini, A.L.M., Kaminski, J., Melo, G.W.B. de, 2008. Formas e dessorção de cobre em solos cultivados com videira na Serra Gaúcha do Rio Grande do Sul. Rev. Bras. Ciênc. Solo 32, 1479–1487. https://doi.org/10.1590/s0100-06832008000400012
Caubet, M., Cornu, S., Saby, N.P.A., Meunier, J.-D., 2020. Agriculture increases the bioavailability of silicon, a beneficial element for crop, in temperate soils. Sci. Rep. 10, 19999. https://doi.org/10.1038/s41598-020-77059-1
Chandran et al., 2012. Accumulation of heavy metals in wastewater irrigated crops in Madurai, India | Semantic Scholar.
Chaza, C., Rayane, S., Sopheak, N., Moomen, B., Baghdad, O., 2018. Distribution of Organochlorine Pesticides and Heavy Metals in Lebanese Agricultural Soil: Case Study—Plain of Akkar. Int. J. Environ. Res. 12, 631–649. https://doi.org/10.1007/s41742-018-0120-0
Chen, F., Khan, Z.I., Zafar, A., Ma, J., Nadeem, M., Ahmad, K., Mahpara, S., Wajid, K., Bashir, H., Munir, M., Malik, I.S., Ashfaq, A., Ugulu, I., Dogan, Y., Yang, Y., 2021. Evaluation of toxicity potential of cobalt in wheat irrigated with wastewater: health risk implications for public. Environ. Sci. Pollut. Res. 28, 21119–21131. https://doi.org/10.1007/s11356-020-11815-8
Chen, X.X., Liu, Y.M., Zhao, Q.Y., Cao, W.Q., Chen, X.P., Zou, C.Q., 2020. Health risk assessment associated with heavy metal accumulation in wheat after long-term phosphorus fertilizer application. Environ. Pollut. 262. https://doi.org/10.1016/j.envpol.2020.114348
Cherfi, A., Abdoun, S., Gaci, O., 2014. Food survey: Levels and potential health risks of chromium, lead, zinc and copper content in fruits and vegetables consumed in Algeria. Food Chem. Toxicol. 70, 48–53. https://doi.org/10.1016/j.fct.2014.04.044
Chibuike, G.U., Obiora, S.C., 2014. Heavy metal polluted soils: Effect on plants and bioremediation methods. Appl. Environ. Soil Sci. 2014. https://doi.org/10.1155/2014/752708
Chiocchetti, G., Jadán-Piedra, C., Vélez, D., Devesa, V., 2017. Metal(loid) contamination in seafood products, Critical Reviews in Food Science and Nutrition. https://doi.org/10.1080/10408398.2016.1161596
Clarkson and Lüttge, 1989. Mineral Nutrition: Divalent Cations, Transport and Compartmentation | SpringerLink.
CNRSL (National Council for Scientific Research, Lebanon) (2015) Regional coordination on improved water resources management and capacity building. Regional project. GEF, WB
Cohen, S.M., Boobis, A.R., Dellarco, V.L., Doe, J.E., Fenner-Crisp, P.A., Moretto, A., Pastoor, T.P., Schoeny, R.S., Seed, J.G., Wolf, D.C., 2019. Chemical carcinogenicity revisited 3: Risk assessment of carcinogenic potential based on the current state of knowledge of carcinogenesis in humans. Regul. Toxicol. Pharmacol. 103, 100–105. https://doi.org/10.1016/j.yrtph.2019.01.017
Coles, R. (Ed.), 2003. Food packaging technology, Packaging technology series. Blackwell Publ. [u.a.], Oxford.
Commission Directive 2003/40/EC, C.D. 2003/40/EC, 2003. Commission Directive 2003 40 EC.pdf [WWW Document].
Commission, E., 2001. Commission Directive 2001/22/EC of 8 March 2001 laying down the sampling methods and the methods of analysis for the official control of the levels of lead, cadmium, mercury and 3-MCPD in foodstuffs. Off. J. 50, 14–21.
Commission Regulation (EC) No 1881 setting maximum levels for certain contaminants in foodstuffs [WWW Document], 2006.
REFERENCES
177
Concha, G., Vogler, G., Lezcano, D., Nermell, B., Vahter, M., 1998. Exposure to Inorganic Arsenic Metabolites during Early Human Development 6.
Cora Jofre, F., Larregui, D.N., Savio, M., 2020. An eco-friendly infrared method for rapid soil sample preparation for multielemental determination by microwave induced plasma atomic emission spectrometry. Microchem. J. 159, 105448. https://doi.org/10.1016/j.microc.2020.105448
Coskun, D., Deshmukh, R., Sonah, H., Menzies, J.G., Reynolds, O., Ma, J.F., Kronzucker, H.J., Bélanger, R.R., 2019. The controversies of silicon’s role in plant biology. New Phytol. 221, 67–85. https://doi.org/10.1111/nph.15343
Council Directive 98 83 EC, C.Di. 98 83 E., 1998. COUNCIL DIRECTIVE 98/83/EC of 3 November 1998 on the quality of water intended for human consumption [WWW Document].
Counter, S.A., Buchanan, L.H., 2004. Mercury exposure in children: A review. Toxicol. Appl. Pharmacol. 198, 209–230. https://doi.org/10.1016/j.taap.2003.11.032
Cuadrado, C., Kumpulainen, J., Carbajal, A., Moreiras, O., 2000. Cereals contribution to the total dietary intake of heavy metals in Madrid, Spain. J. Food Compos. Anal. 13, 495–503. https://doi.org/10.1006/jfca.2000.0937
Cubadda, F., Ciardullo, S., D’Amato, M., Raggi, A., Aureli, F., Carcea, M., 2010. Arsenic Contamination of the Environment−Food Chain: A Survey on Wheat as a Test Plant To Investigate Phytoavailable Arsenic in Italian Agricultural Soils and as a Source of Inorganic Arsenic in the Diet. J. Agric. Food Chem. 58, 10176–10183. https://doi.org/10.1021/jf102084p
Dadzie-Mensah, E., Ayernor, G.S., 2004. Functional role of ascorbic acid in bread-making. J. Ghana Sci. Assoc. 2, 10–15. https://doi.org/10.4314/jgsa.v2i2.17851
D’Amato, M., Aureli, F., Ciardullo, S., Raggi, A., Cubadda, F., 2011. Arsenic speciation in wheat and wheat products using ultrasound- and microwave-assisted extraction and anion exchange chromatography-inductively coupled plasma mass spectrometry. J Anal Spectrom 26, 207–213. https://doi.org/10.1039/C0JA00125B
Darwish, et al., 2008. Preliminary contamination hazard assessment of land ressources in central bekaa plain of Lebanon. Leban. Sci. J. 9, 3–15.
Darwish, T., 2018. Status of heavy metals in agricultural soils and the need for adapted soil thresholds, case study from Lebanon., in: Global Symposium on Soil Pollution. Presented at the Be the solution to soil pollution, FAO, Rome, Italy, pp. 85–91.
Darwish, T., Atallah, T., Francis, R., Saab, C., Jomaa, I., Shaaban, A., Sakka, H., Zdruli, P., 2011. Observations on soil and groundwater contamination with nitrate: A case study from Lebanon-East Mediterranean. Agric. Water Manag. 99, 74–84. https://doi.org/10.1016/j.agwat.2011.07.016
Darwish, T., Hamze, M., Nsouli, B., 2021. Ecological risks from trace elements in polluted Quaternary agricultural soils of East Mediterranean. Leban. Sci. J. Press.
Darwish, T., Jomaa, I., 2008. Preliminary contamination hazard assessment of land resources in Central.
Darwish, T., Jomaa, I., Awad, M., Boumetri, R., 2008. Preliminary contamination hazard assessment of land resources in Central Bekaa plain of Lebanon. Leban. Sci. Jounal 9, 3–15.
Darwish, T., Mueller, H. W., Hobler, M., Jomaa, I., 2004. Approach to assess soil contamination II: Evaluation of heavy metal contamination of main arable Lebanese soils. Presented at the 8th International Meeting on Soils with Mediterranean Type of Climate. Extended Abstracts. 9-11 February, Marrakech, Morocco: 131-133.
Darwish, T.M., Jomaa, I., Awad, M., Boumetri, R., 2008. Preliminary Contamination Hazard Assessment of Land Resources in. Leban. Sci. J. 9, 3–15.
Demiralp, H., Çelik, S., Köksel, H., 2000. Effects of oxidizing agents and defatting on the electrophoretic patterns of flour proteins during dough mixing. Eur. Food Res. Technol. 211, 322–325. https://doi.org/10.1007/s002170000177
Demirezen, D., Aksoy, A., 2006. Heavy metal levels in vegetables in Turkey are within safe limits for Cu, Zn, Ni and exceeded for Cd and Pb. J. Food Qual. 29, 252–265. https://doi.org/10.1111/j.1745-4557.2006.00072.x
REFERENCES
178
Demirözü, B., Saldamli, I., Gürsel, B., Uçak, A., Çetinyokuş, F., Yüzbaşi, N., 2003. Determination of some metals which are important for food quality control in bread. J. Cereal Sci. 37, 171–177. https://doi.org/10.1006/jcrs.2002.0491
Laurence Denaix, Christophe Nguyen, Valerie Sappin-Didier, Andre Schneider (2010) Synthèse sur la contamination en cadmium des productions végétales de grandes cultures
Devesa, V., Vélez, D., Montoro, R., 2008. Effect of thermal treatments on arsenic species contents in food. Food Chem. Toxicol. 46, 1–8. https://doi.org/10.1016/j.fct.2007.08.021
Directive 2002 /46 EC, D. 2002/46 E., 2002. DIRECTIVE 2002/46/EC OF THE EUROPEAN PARLIAMENT AND OF THE COUNCIL of 10 June 2002 on the approximation of the laws of the Member States relating to food supplements (Text with EEA relevance) [WWW Document].
Do Monte, M.H.F.M., 2007. Guidelines for Good Practice of Water Reuse for Irrigation: Portuguese Standard NP 4434, in: Zaidi, M.K. (Ed.), Wastewater Reuse–Risk Assessment, Decision-Making and Environmental Security, NATO Science for Peace and Security Series. Springer Netherlands, Dordrecht, pp. 253–265. https://doi.org/10.1007/978-1-4020-6027-4_25
Doe, E.D., 2013. Levels of Selected Heavy Metals in Wheat Flour on the Ghanaian Market: A Determination by Atomic Absorption Spectrometry. Am. J. Appl. Chem. 1, 17. https://doi.org/10.11648/j.ajac.20130102.11
Dorne, J.L.C.M., Kass, G.E.N., Bordajandi, L.R., Amzal, B., Bertelsen, U., Castoldi, A.F., Heppner, C., Eskola, M., Fabiansson, S., Ferrari, P., Scaravelli, E., Dogliotti, E., Fuerst, P., Boobis, A.R., Verger, P., 2011. Human risk assessment of heavy metals: principles and applications. Met. Ions Life Sci. 8, 27–60. https://doi.org/10.1515/9783110436624-007
Duan, B., Zhang, W., Zheng, H., Wu, C., Zhang, Q., Bu, Y., 2017. Disposal Situation of Sewage Sludge from Municipal Wastewater Treatment Plants (WWTPs) and Assessment of the Ecological Risk of Heavy Metals for Its Land Use in Shanxi, China. Int. J. Environ. Res. Public. Health 14, 823. https://doi.org/10.3390/ijerph14070823
EFSA, 2015. Scientific Opinion on the risks to public health related to the presence of nickel in food and drinking water1 EFSA Panel on Contaminants in the Food Chain (CONTAM)2, 3 European Food Safety Authority (EFSA), Parma, Italy [WWW Document]. URL https://data.europa.eu/doi/10.2903/j.efsa.2015.4002 (accessed 7.18.21).
EFSA, 2014a. Scientific Opinion on the risks to public health related to the presence of chromium in food and drinking water [WWW Document]. EFSA J. URL https://data.europa.eu/doi/10.2903/j.efsa.2014.3595 (accessed 7.23.21).
EFSA, 2014b. Scientific Opinion on the risks to public health related to the presence of chromium in food and drinking water. EFSA J. 12. https://doi.org/10.2903/j.efsa.2014.3595
EFSA, 2012a. Risk assessment of contaminants in food and feed European Food Safety Authority (EFSA), Parma, Italy [WWW Document]. EFSA J.
EFSA, 2012b. Mercury in food – EFSA updates advice on risks for public health | European Food Safety Authority 1–3.
EFSA, 2012c. Scientific Opinion on safety and efficacy of cobalt compounds (E3) as feed additives for all animal species [WWW Document]. EFSA J. URL https://data.europa.eu/doi/10.2903/j.efsa.2012.2791 (accessed 7.18.21).
EFSA, 2010a. Scientific Opinion on the safety of chromium picolinate as a source of chromium added for nutritional purposes to foodstuff for particular nutritional uses and to foods intended for the general population1 EFSA Panel on Food Additives and Nutrient Sources added to Food (ANS)2, 3 European Food Safety Authority (EFSA), Parma, Italy [WWW Document]. EFSA J. URL https://data.europa.eu/doi/10.2903/j.efsa.2010.1883 (accessed 7.18.21).
EFSA, 2010b. Scientific Opinion on Lead in Food1 EFSA Panel on Contaminants in the Food Chain (CONTAM)2, 3 European Food Safety Authority (EFSA), Parma, Italy [WWW Document]. EFSA J. URL https://data.europa.eu/doi/10.2903/j.efsa.2010.1570 (accessed 7.23.21).
REFERENCES
179
EFSA, 2009. Cadmium in food ‐ Scientific opinion of the Panel on Contaminants in the Food Chain [WWW Document]. URL https://data.europa.eu/doi/10.2903/j.efsa.2009.980 (accessed 7.23.21).
EFSA, 2005. Opinion of the Scientific Committee on a request from EFSA related to A Harmonised Approach for Risk Assessment of Substances Which are both Genotoxic and Carcinogenic [WWW Document]. EFSA J. URL https://data.europa.eu/doi/10.2903/j.efsa.2005.282 (accessed 7.23.21).
EFSA, E., 2017. Dietary Reference Values for nutrients Summary report European Food Safety Authority (EFSA) [WWW Document].
EFSA, E., 2011. JOINT GUIDANCE OF EFSA, FAO AND WHO Towards a harmonised Total Diet Study approach: a guidance document. EFSA J. https://doi.org/10.2903/j.efsa.2011.2450
EFSA, E., 2010. EFSA 2010 Scientific Opinion on Lead in Food.pdf.
EFSA, E., 2009a. Scientific Opinion on Arsenic in Food. EFSA J. 7, 1351–1351. https://doi.org/10.2903/j.efsa.2009.1351
EFSA, E., 2009b. Scientific Opinion on the use of cobalt compounds as additives in animal nutrition. EFSA J. https://doi.org/10.2903/j.efsa.2009.1383
EFSA, E. (European F.S., 2009. Cadmium in food Scientific Opinion of the Panel on Contaminants in the Food Chain Adopted on 30 January 2009
Hussein El Hage Hassan, Abdulrahim Ibrahim, Salah Hajj Hassan, Ghaleb Faour. Le blé dans la plaine de la Bekaa. Analyse géographique de cette culture à l’aide d’un Système d’Information Géographique.. Hannon. Revue Libanaise de Géographie, Université Libanaise, 2013, XXVI, pp.114. ⟨hal-02963099
Environment Protection and Heritage Council, Australian Health Ministers’ Conference, Natural Resource Management Ministerial Council, 2006. National guidelines for water recycling: managing health and environmental risks (phase 1) Australia [WWW Document]. URL http://www.ephc.gov.au/pdf/water/WaterRecyclingGuidelines-02_Nov06_.pdf (accessed 7.13.21).
Ergetie, Z., Berhane, A., Tsega, B., Hymete, A., 2012. Comparative analysis of Trace metals in bread from five bakeries in Addis Ababa , Ethiopia. Glob. Adv. Res. J. Pharm. Pharmacol. GARJPP Vol 21 Pp 363-367 January 2013 Available Online Httpgarjorggarjppindexhtm Copyr. © 2013 Glob. Adv. Res. J. 363–367.
Ertl, K., Goessler, W., 2018. Grains, whole flour, white flour, and some final goods: an elemental comparison. Eur. Food Res. Technol. 244, 2065–2075. https://doi.org/10.1007/s00217-018-3117-1
Esteban, 2021. Exposition aux métaux de la population française : résultats de l’étude ESTEBAN [WWW Document]. URL https://www.santepubliquefrance.fr/presse/2021/exposition-aux-metaux-de-la-population-francaise-resultats-de-l-etude-esteban (accessed 9.13.21).
EURACTIV, 2021. fertilzers in Europe [WWW Document]. URL https://www.euractiv.com/topics/fertilisers/ (accessed 9.13.21).
European Parliament and the Council of the European Union, 2008a. Regulation (Ec) 1272/2008 of the European Parliament and of the Council. Off. J. Eur. Union L 353/1, 1355.
European Parliament and the Council of the European Union, 2008b. Regulation (Ec) 1272/2008 of the European Parliament and of the Council [WWW Document]. Off. J. Eur. Union. URL http://eur-lex.europa.eu/LexUriServ/LexUriServ.do?uri=OJ:L:2008:353:0001:0001:EN:PDF
EWG Tap Water, E.T.W.D., 2019. EWG. EWG’s Tap Water Database: Contaminants in Your Water. Available online: https://www.ewg.org/tapwater//system-contaminant.php?pws=MO5010458&contamcode=1081?pws= MO5010458&contamcode=1081 (accessed on 18 July 2019). [WWW Document]. URL (accessed 7.18.81).
Fakhri, Y., Bjørklund, G., Bandpei, A.M., Chirumbolo, S., Keramati, H., Hosseini Pouya, R., Asadi, A., Amanidaz, N., Sarafraz, M., Sheikhmohammad, A., Alipour, M., Baninameh, Z., Mohseni, S.M., Sarkhosh, M., Ghasemi, S.M., 2018. Concentrations of arsenic and lead in rice (Oryza sativa L.) in Iran: A systematic review and carcinogenic risk assessment. Food Chem. Toxicol. 113, 267–277. https://doi.org/10.1016/j.fct.2018.01.018
FAO, 2010. Résultats globaux du module de base du recensement de l’agriculture 2010 [WWW Document].
REFERENCES
180
FAO, 2008. AQUASTAT – FAO_s Global Information System on Water and Agriculture.pdf [WWW Document].
FAOSTAT, F., 2018. FAOSTAT ANALYTICAL BRIEF 13 Inorganic fertilizers 1961-2018 [WWW Document].
Ferreccio, C., González, C., Milosavjlevic, V., Marshall, G., Sancha, A.M., Smith, A.H., 2000. Lung Cancer and Arsenic Concentrations in Drinking Water in Chile: Epidemiology 11, 673–679. https://doi.org/10.1097/00001648-200011000-00010
Font-Palma, C., 2019. Methods for the Treatment of Cattle Manure—A Review. C 5, 27–27. https://doi.org/10.3390/c5020027
Formentini, T.A., Mallmann, F.J.K., Pinheiro, A., Fernandes, C.V.S., Bender, M.A., da Veiga, M., dos Santos, D.R., Doelsch, E., 2015. Copper and zinc accumulation and fractionation in a clayey Hapludox soil subject to long-term pig slurry application. Sci. Total Environ. 536, 831–839. https://doi.org/10.1016/j.scitotenv.2015.07.110
Funes Pinter, I., Salomon, M.V., Gil, R., Mastrantonio, L., Bottini, R., Piccoli, P., 2018. Arsenic and trace elements in soil, water, grapevine and onion in Jáchal, Argentina. Sci. Total Environ. 615, 1485–1498. https://doi.org/10.1016/j.scitotenv.2017.09.114
Gammon, D.W., Moore, T.B., O’Malley, M.A., 2010. A Toxicological Assessment of Sulfur as a Pesticide, Third Edit. Ed, Hayes’ Handbook of Pesticide Toxicology. Elsevier Inc. https://doi.org/10.1016/B978-0-12-374367-1.00088-4
Ganassali, G., 2014. Enquêtes et analyse de données avec Sphinx.
Garden, J.S., Mitchell, D.G., Mills, W.N., 1980. Nonconstant variance regression techniques for calibration-curve-based analysis. Anal. Chem. 52, 2310–2315.
Gardiner, W.P., 1997. Statistical Analysis Methods for Chemists. https://doi.org/10.1039/9781847551924
Gèze, B., 1956 – Carte de reconnaissance des sols du Liban au 1/200 000e, Station agronomique Libano-française (Ed.) Tell-Amara, 52 p. + annex
Ghoreishy, F., Salehi, M., Fallahzade, J., 2018. Cadmium and lead in rice grains and wheat breads in Isfahan (Iran) and human health risk assessment. Hum. Ecol. Risk Assess. 0, 1–11. https://doi.org/10.1080/10807039.2018.1456898
GIEWS, 2020. GIEWS – Global Information and Early Warning System 2020.pdf [WWW Document].
Giraldo, P., Benavente, E., Manzano-Agugliaro, F., Gimenez, E., 2019. Worldwide research trends on wheat and barley: A bibliometric comparative analysis. Agronomy 9. https://doi.org/10.3390/agronomy9070352
Godfrey, G., 2000. . Am. J. Clin. Nutr. 71, 1344S-1352S. https://doi.org/10.1111/j.1365-277X.2005.00612.x
Grant, C.A., Clarke, J.M., Duguid, S., Chaney, R.L., 2008. Selection and breeding of plant cultivars to minimize cadmium accumulation. Sci. Total Environ. 390, 301–310. https://doi.org/10.1016/j.scitotenv.2007.10.038
Guedes, L.G., Melo, V.F., Batista, A.H., 2020. The classic aqua regia and EPA 3051A methods can mislead environmental assessments and certifications: Potentially harmful elements resorption in short-range order materials. Chemosphere 251, 126356. https://doi.org/10.1016/j.chemosphere.2020.126356
Guntzer, F., Keller, C., Meunier, J.D., 2012. Benefits of plant silicon for crops: A review. Agron. Sustain. Dev. 32, 201–213. https://doi.org/10.1007/s13593-011-0039-8
Guo, G., Lei, M., Wang, Y., Song, B., Yang, J., 2018. Accumulation of as, cd, and pb in sixteen wheat cultivars grown in contaminated soils and associated health risk assessment. Int. J. Environ. Res. Public. Health 15. https://doi.org/10.3390/ijerph15112601
Gupta, N., Yadav, K.K., Kumar, V., Kumar, S., Chadd, R.P., Kumar, A., 2019. Trace elements in soil-vegetables interface: Translocation, bioaccumulation, toxicity and amelioration – A review. Sci. Total Environ. 651, 2927–2942. https://doi.org/10.1016/j.scitotenv.2018.10.047
Gupta, V., 2020. Vehicle-Generated Heavy Metal Pollution in an Urban Environment and Its Distribution into Various Environmental Components, in: Shukla, V., Kumar, N. (Eds.), Environmental Concerns and Sustainable Development: Volume 1: Air, Water and Energy Resources. Springer, Singapore, pp. 113–127. https://doi.org/10.1007/978-981-13-5889-0_5
REFERENCES
181
Hahladakis, J.N., Velis, C.A., Weber, R., Iacovidou, E., Purnell, P., 2018. An overview of chemical additives present in plastics: Migration, release, fate and environmental impact during their use, disposal and recycling. J. Hazard. Mater. 344, 179–199. https://doi.org/10.1016/j.jhazmat.2017.10.014
Hakeem, K.R., Akhtar, M.S., Abdullah, S.N.A., 2016. Plant, soil and microbes: Volume 1: Implications in crop science. Plant Soil Microbes Vol. 1 Implic. Crop Sci. 1–366. https://doi.org/10.1007/978-3-319-27455-3
Hall, M., Gamble, M., Slavkovich, V., Liu, X., Levy, D., Cheng, Z., Geen, A.V., Yunus, M., Rahman, M., Pilsner, J.R., Graziano, J., 2007. Research | Children ’ s Health Determinants of Arsenic Metabolism : Blood Arsenic Metabolites , Plasma Folate , Cobalamin , and Homocysteine Concentrations in Maternal – Newborn Pairs 115, 1503–1509. https://doi.org/10.1289/ehp.9906
Hao, H.Z., Zhong, R.G., Xiao, R., Liu, C.W., Zhong, X.B., 2012. The Effect of Transpiration for Heavy Metal Uptake of Hyperaccumulators. Appl. Mech. Mater. 178–181, 901–904. https://doi.org/10.4028/www.scientific.net/AMM.178-181.901
Harakeh, S., Saleh, I., Zouhairi, O., Baydoun, E., Barbour, E., Alwan, N., 2009. Science of the Total Environment Antimicrobial resistance of Listeria monocytogenes isolated from dairy-based food products. Sci. Total Environ. 407, 4022–4027. https://doi.org/10.1016/j.scitotenv.2009.04.010
Harakeh, S., Yassine, H., Gharios, M., Barbour, E., Hajjar, S., 2005. Isolation, molecular characterization and antimicrobial resistance patterns of Salmonella and Escherichia coli isolates from meat-based fast food in Lebanon 341, 33–44. https://doi.org/10.1016/j.scitotenv.2004.09.025
Hasler, K., Olfs, H.-W., Omta, O., Bröring, S., 2017. Drivers for the Adoption of Different Eco-Innovation Types in the Fertilizer Sector: A Review. Sustainability 9, 2216. https://doi.org/10.3390/su9122216
Haysom, M. B. C. & Chapman, L. S. Some aspects of the calcium silicate trials at Mackay. Proc. Queens. Soc. Sugar Cane Technol. 42, 117–122 (1975)]
Hazell, P., Wood, S., 2008. Drivers of change in global agriculture. Philos. Trans. R. Soc. B Biol. Sci. 363, 495–515. https://doi.org/10.1098/rstb.2007.2166
Hernández-Mendoza, H., Mejuto, M., Cardona, A.I., García-Álvarez, A., Millán, R., Yllera, A., 2013. Optimization and Validation of a Method for Heavy Metals Quantification in Soil Samples by Inductively Coupled Plasma Sector Field Mass Spectrometry (ICP-SFMS). Am. J. Anal. Chem. 4, 9–15. https://doi.org/10.4236/ajac.2013.410A2002
Hibbert, D.B., Gooding, J.J., 2005. Data Analysis for Chemistry: An Introductory Guide for Students and Laboratory Scientists. Oxford University Press, Oxford, New York.
Hoenig, M., 2001a. Preparation steps in environmental trace element analysis — facts and traps. Talanta 54, 1021–1038. https://doi.org/10.1016/S0039-9140(01)00329-0
Horwitz, W., 2002. AOAC guidelines for single laboratory validation of chemical methods for dietary supplements and botanicals. Gaithersburg MD USA AOAC Int. 12–9.
Horwitz, W., 1990. Nomenclature for sampling in analytical chemistry (Recommendations 1990). Pure Appl. Chem. 62, 1193–1208. https://doi.org/10.1351/pac199062061193
Hossain, 2012. Molecular Mechanism of Heavy Metal Toxicity and Tolerance in Plants: Central Role of Glutathione in Detoxification of Reactive Oxygen Species and Methylglyoxal and in Heavy Metal Chelation.
Hossain, M.M., Khatun, M.A., Haque, M.N., Bari, M.A., Alam, M.F., Mandal, A., Kabir, A.H., 2018. Silicon alleviates arsenic-induced toxicity in wheat through vacuolar sequestration and ROS scavenging. Int. J. Phytoremediation 20, 796–804. https://doi.org/10.1080/15226514.2018.1425669
Huang, Y., Wang, L., Wang, W., Li, T., He, Z., Yang, X., 2019. Science of the Total Environment Current status of agricultural soil pollution by heavy metals in China : A meta-analysis. Sci. Total Environ. 651, 3034–3042. https://doi.org/10.1016/j.scitotenv.2018.10.185
IARC, I., 2012. IARC. IARC Monographs Volume 100C. In Chromium (VI) Compounds; International Agency for Research on Cancer: Lyon, France, 2012. [WWW Document].
REFERENCES
182
Ibrahim, M. S.; A. Abd- Elgalil ; O. Negim and M. Nazir (2017) Evaluation of DTPA-Extractable some Heavy Metals in Soils and Water in Qena Governorate, Egypt. J. Soil Sci. and Agric. Eng., Mansoura Univ., Vol. 8 (12): 683 – 691
Ingenbleek, L., Jazet, E., Dzossa, A.D., Adebayo, S.B., Ogungbangbe, J., Dansou, S., Diallo, Z.J., Kouebou, C., Adegboye, A., Hossou, E., Coulibaly, S., Eyangoh, S., Le Bizec, B., Verger, P., Kamanzi, J., Merten, C., Leblanc, J.C., 2017. Methodology design of the regional Sub-Saharan Africa Total Diet Study in Benin, Cameroon, Mali and Nigeria. Food Chem. Toxicol. 109, 155–169. https://doi.org/10.1016/j.fct.2017.08.017
International Conference on Harmonisation, 1996. Q 2 (R1) Validation of Analytical Procedures: Text and Methodology.
Islam, M.S., Proshad, R., Asadul Haque, M., Hoque, M.F., Hossin, M.S., Islam Sarker, M.N., 2018. Assessment of heavy metals in foods around the industrial areas: health hazard inference in Bangladesh. Geocarto Int. 0, 000. https://doi.org/10.1080/10106049.2018.1516246
ISO 11464:2006. Soil quality. Pretreatment of samples for physico-chemical analysis [WWW Document], 2020. . ISO. URL https://www.iso.org/cms/render/live/en/sites/isoorg/contents/data/standard/03/77/37718.html (accessed 12.23.20).
ISO 14869-1:2001. Soil quality. Dissolution for the determination of total element content. Part 1: Dissolution with hydrofluoric and perchloric acids [WWW Document], 2001. . ISO. URL https://www.iso.org/cms/render/live/en/sites/isoorg/contents/data/standard/02/84/28454.html (accessed 11.2.20).
ISO 17294-2:2016. Water quality. Application of inductively coupled plasma mass spectrometry (ICP-MS). Part 2: Determination of selected elements including uranium isotopes [WWW Document], 2016. . ISO. URL https://www.iso.org/cms/render/live/en/sites/isoorg/contents/data/standard/06/29/62962.html (accessed 11.2.20).
ISO 22036:2008. Soil quality. Determination of trace elements in extracts of soil by inductively coupled plasma – atomic emission spectrometry (ICP – AES) [WWW Document], 2008. . ISO. URL https://www.iso.org/cms/render/live/en/sites/isoorg/contents/data/standard/04/06/40653.html (accessed 11.2.20).
IUSS Working Group WRB, 2015. World reference base for soil resources 2014 International soil classification system for naming soils and creating legends for soil maps (Text). World Soil Resources Reports No. 106. FAO, Rome.
Jadia, C.D., Fulekar, M.H., 2009. Phytoremediation of heavy metals: Recent techniques. Afr. J. Biotechnol. Vol 8 6 Pp 921-928 20 March 2009 Available Online HttpwwwacademicjournalsorgAJB ISSN 1684–5315 © 2009 Acad. J. 8.
Jalali, M., Majeri, M., 2016. Cobalt sorption–desorption behavior of calcareous soils from some Iranian soils. Geochemistry 76, 95–102. https://doi.org/10.1016/j.chemer.2015.11.004
Jayaraj, R., Megha, P., Sreedev, P., 2016. Review Article. Organochlorine pesticides, their toxic effects on living organisms and their fate in the environment. Interdiscip. Toxicol. 9, 90–100. https://doi.org/10.1515/intox-2016-0012
Jeong, H., Kim, H., Jang, T., 2016. Irrigation water quality standards for indirect wastewater reuse in agriculture: A contribution toward sustainablewastewater reuse in South korea. Water Switz. 8. https://doi.org/10.3390/w8040169
Jiao, W., Chen, W., Chang, A.C., Page, A.L., 2012. Environmental risks of trace elements associated with long-term phosphate fertilizers applications: A review. Environ. Pollut. 168, 44–53. https://doi.org/10.1016/j.envpol.2012.03.052
Jolly et al., 2013. Transfer of metals from soil to vegetables and possible health risk assessment | SpringerLink [WWW Document]. URL https://link.springer.com/article/10.1186/2193-1801-2-385 (accessed 8.19.21).
Juhasz, A.L., Smith, E., Weber, J., Rees, M., Rofe, A., Kuchel, T., Sansom, L., Naidu, R., 2006. In vivo assessment of arsenic bioavailability in rice and its significance for human health risk assessment. Environ. Health Perspect. 114, 1826–1831. https://doi.org/10.1289/ehp.9322
REFERENCES
183
Juhasz, A.L., Weber, J., Smith, E., 2011. Predicting arsenic relative bioavailability in contaminated soils using meta analysis and relative bioavailability-bioaccessibility regression models. Environ. Sci. Technol. 45, 10676–10683. https://doi.org/10.1021/es2018384
Juste, C., 1988. Appréciation de la mobilité et de la biodisponibilité des éléments en traces du sol. Undefined.
K, M., 2012. Assessment of pesticide residues and trace element contamination in market gardens of Togo. Afr. J. Environ. Sci. Technol. 6, 380–390. https://doi.org/10.5897/ajest11.215
Kabata-Pendias, A., 1995. Agricultural Problems Related to Excessive Trace Metal Contents of Soils, in: Förstner, U., Salomons, W., Mader, P. (Eds.), Heavy Metals. Springer Berlin Heidelberg, Berlin, Heidelberg, pp. 3–18. https://doi.org/10.1007/978-3-642-79316-5_1
Kabata-Pendias, A., Mukherjee, A.B., 2007. Trace Elements from Soil to Human. Springer-Verlag, Berlin Heidelberg. https://doi.org/10.1007/978-3-540-32714-1
Kamleh, R., Toufeili, I., Ajib, R., Kanso, B., Haddad, J., 2012. Estimation of the shelf-life of halloumi cheese using survival analysis. Czech J. Food Sci. 30, 512–519. https://doi.org/10.17221/233/2011-cjfs
Kanbar, H.J., Hanna, N., El Samrani, A.G., Kazpard, V., Kobaissi, A., Harb, N., Amacha, N., 2014. Metal binding in soil cores and sediments in the vicinity of a dammed agricultural and industrial watershed. Environ. Monit. Assess. 186, 8793–8806. https://doi.org/10.1007/s10661-014-4044-7
Kapaj, S., Peterson, H., Liber, K., Bhattacharya, P., 2006. Human Health Effects From Chronic Arsenic Poisoning–A Review. J. Environ. Sci. Health Part A 41, 2399–2428. https://doi.org/10.1080/10934520600873571
Karimyan, K., Alimohammadi, M., Maleki, A., Yunesian, M., Nodehi, R.N., Foroushani, A.R., 2020. The mobility of arsenic from highly polluted farmlands to wheat: Soil–Plant transfer model and health risk assessment. Land Degrad. Dev. 31, 1560–1572. https://doi.org/10.1002/ldr.3552
Kassaify, Z.G., Najjar, M., Toufeili, I., Malek, A., 2010. Microbiological and chemical profile of 183haracte qishta (heat-coagulated milk). East. Mediterr. Health J. 16, 926–931. https://doi.org/10.26719/2010.16.9.926
Kassir, L.N., Darwish, T., Shaban, A., Olivier, G., Ouaini, N., 2012. Mobility and bioavailability of selected trace elements in Mediterranean red soil amended with phosphate fertilizers: Experimental study. Geoderma 189–190, 357–368. https://doi.org/10.1016/j.geoderma.2012.05.017
Kassouf, A., Chebib, H., Lebbos, N., Ouaini, R., 2013. Migration of iron, lead, cadmium and tin from tinplate-coated cans into chickpeas. Food Addit. Contam. – Part Chem. Anal. Control Expo. Risk Assess. 30, 1987–1992. https://doi.org/10.1080/19440049.2013.832399
Kaur, H., Greger, M., 2019. A Review on Si Uptake and Transport System. Plants 8, 81. https://doi.org/10.3390/plants8040081
Kelly, B.C., Naing, A., Pi, N., Bayen, S., Chan, P., Chou, M., Huan, B., 2018. Ecotoxicology and Environmental Safety Human exposure to trace elements in central Cambodia : In fl uence of seasonal hydrology and food-chain bioaccumulation behaviour 162, 112–120. https://doi.org/10.1016/j.ecoenv.2018.06.071
Khan, I., Awan, S.A., Rizwan, M., Ali, S., Hassan, M.J., Brestic, M., Zhang, X., Huang, L., 2021. Effects of silicon on heavy metal uptake at the soil-plant interphase: A review. Ecotoxicol. Environ. Saf. 222, 112510. https://doi.org/10.1016/j.ecoenv.2021.112510
Khan, Z.I., Firdos, A., Ahmad, K., Ashraf, M., Bibi, Z., Akram, N.A., Rizwan, Y., Al-Qurainy, F., 2015. Assessment of Hazardous and Essential Elements in a Food Crop Irrigated with Municipal Sewage Water: Risk Appraisal for Public Health. Hum. Ecol. Risk Assess. 21, 2126–2136. https://doi.org/10.1080/10807039.2015.1017879
Khaniki, G.R.J., Yunesian, M., Mahvi, A.H., Nazmara, S., 2005. Trace Metal Contaminants in Iranian Flat Breads. J. Agric. Soc. Sci. 1–4.
Kicińska, 2019. . Soil Tillage Res. 205. https://doi.org/DOI:10.1016/j.still.2020.104817
Kim, C., Lee, J., Kwon, S., Yoon, H., 2015. Total Diet Study : For a Closer-to-real Estimate of Dietary Exposure to Chemical Substances 31, 227–240.
REFERENCES
184
Kirchmann, H., Mattsson, L., Eriksson, J., 2009. Trace element concentration in wheat grain: Results from the Swedish long-term soil fertility experiments and national monitoring program. Environ. Geochem. Health 31, 561–571. https://doi.org/10.1007/s10653-009-9251-8
Kominko, H., Gorazda, K., Wzorek, Z., 2017. The Possibility of Organo-Mineral Fertilizer Production from Sewage Sludge. Waste Biomass Valorization 8, 1781–1791. https://doi.org/10.1007/s12649-016-9805-9
Korea, K., 2011. Korea Environmental Policy Bulletin - ...al Management Master Plan_KEPB2006.pdf.
Korfali, S.I., Hamdan, W.A., 2013. Essentail and Toxic Metals in Lebanese Marketed Canned Food: Impact of Metal Cans. J. Food Res. 2, 19–19. https://doi.org/10.5539/jfr.v2n1p19
Korfali, S.I., Karaki, H., 2018. Speciation of Metals in Soils and Water: Risk Assessment. Environ. Process. 5, 101–125. https://doi.org/10.1007/s40710-018-0328-1
Kouchou, A., El Ghachtouli, N., Duplay, J., Ghazi, M., Elsass, F., Thoisy, J.C., Bellarbi, M., Ijjaali, M., Rais, N., 2020. Evaluation of the environmental and human health risk related to metallic contamination in agricultural soils in the Mediterranean semi-arid area (Saiss plain, Morocco). Environ. Earth Sci. 79, 1–22. https://doi.org/10.1007/s12665-020-8880-1
Kovačič, G.R., Lešnik, M., Vršič, S., 2013. An overview of the copper situation and usage in viticulture. Bulg. J. Agric. Sci. 19, 50–59.
Kratz, S., Godlinski, F., Schnug, E., 2011. Heavy Metal Loads to Agricultural Soils in Germany from the Application of Commercial Phosphorus Fertilizers and Their Contribution to Background Concentration in Soils, in: Merkel, B., Schipek, M. (Eds.), The New Uranium Mining Boom, Springer Geology. Springer Berlin Heidelberg, Berlin, Heidelberg, pp. 755–762. https://doi.org/10.1007/978-3-642-22122-4_86
Kratz, S., Schick, J., Schnug, E., 2016. Trace elements in rock phosphates and P containing mineral and organo-mineral fertilizers sold in Germany. Sci. Total Environ. 542, 1013–1019. https://doi.org/10.1016/j.scitotenv.2015.08.046
Krzesłowska, 2011. The cell wall in plant cell response to trace metals: polysaccharide remodeling and its role in defense strategy. Acta Physiol Plant. https://doi.org/10.1007/s11738-010-0.581-z
Kumar, S., Prasad, S., Yadav, K.K., Shrivastava, M., Gupta, N., Nagar, S., Bach, Q.V., Kamyab, H., Khan, S.A., Yadav, S., Malav, L.C., 2019. Hazardous heavy metals contamination of vegetables and food chain: Role of sustainable remediation approaches – A review. Environ. Res. 179, 108792. https://doi.org/10.1016/j.envres.2019.108792
Kwasniewski, M., 2014 et al., 2014. Persistence of elemental sulfur spray residue on grapes during ripening and vinification. Am. J. Enol. Vitic. 65, 453–462. https://doi.org/10.5344/ajev.2014.14027
Lamichhane, J.R., Dachbrodt-Saaydeh, S., Kudsk, P., Messéan, A., 2016. Conventional Pesticides in Agriculture: Benefits Versus Risks. Plant Dis. 100, 10–24. https://doi.org/10.1094/PDIS-05-15-0574-FE
Lamouroux, M., Paquet, H., Pinta, M., Millot, G. 1967, Notes préliminaires sur les minéraux argileux des 184haracteriz et des sols méditerranéens du Liban Sciences Géologiques, bulletins et mémoires, 20-4, 277-291
Lamouroux, M. 1972 – État et comportement du fer dans les sols formés sur roches 184haracteri au Liban. Science du sol, 1, 1972, 85-101.
LARI, 2020. Lebanese Agricultural Research Institute [WWW Document].
Lateef, A. s. A., 2007. Geological History of the Bekaa Valley-Lebanon. Second Int. Conf. Geol. Tethys Cairo Univ. March 2007 P.391-402.
Lavagnini, I., Magno, F., 2007. A statistical overview on univariate calibration, inverse regression, and detection limits: Application to gas chromatography/mass spectrometry technique. Mass Spectrom. Rev. 26, 1–18. https://doi.org/10.1002/mas.20100
Lavín, Á., Vicente, J.D., Holgado, M., Laguna, M.F., Casquel, R., Santamaría, B., Maigler, M.V., Hernández, A.L., Ramírez, Y., 2018. On the Determination of Uncertainty and Limit of Detection in Label-Free Biosensors. Sensors 18, 2038. https://doi.org/10.3390/s18072038
REFERENCES
185
Lente, I., Ofosu-Anim, J., Brimah, A.K., Atiemo, S., 2014. Heavy metal pollution of vegetable crops irrigated with wastewater in Accra, Ghana. West Afr. J. Appl. Ecol. 22, 41–58.
Li, G., Zheng, M., Tang, J., Shim, H., Cai, C., 2018. Effect of Silicon on Arsenic Concentration and Speciation in Different Rice Tissues. Pedosphere 28, 511–520. https://doi.org/10.1016/S1002-0160(17)60409-0
Liang, Y., Sun, W., Zhu, Y.-G., Christie, P., 2007. Mechanisms of silicon-mediated alleviation of abiotic stresses in higher plants: A review. Environ. Pollut. 147, 422–428. https://doi.org/10.1016/j.envpol.2006.06.008
Likar, M., Vogel-Mikuš, K., Potisek, M., Hančević, K., Radić, T., Nečemer, M., Regvar, M., 2015. Importance of soil and vineyard management in the determination of grapevine mineral composition. Sci. Total Environ. 505, 724–731. https://doi.org/10.1016/j.scitotenv.2014.10.057
Lin, T., Chen, X., Li, B., Chen, P., Guo, M., Zhou, X., Zhong, S., Cheng, X., 2019. Geographical origin identification of Spodoptera litura (Lepidoptera: Noctuidae) based on trace element profiles using tobacco as intermedium planted on soils from five different regions. Microchem. J. 146, 49–55. https://doi.org/10.1016/j.microc.2018.12.051
Lin, X., Gu, Y., Zhou, Q., Mao, G., Zou, B., Zhao, J., 2016. Combined toxicity of heavy metal mixtures in liver cells: Combined toxicity of heavy metal mixtures in liver cells. J. Appl. Toxicol. 36, 1163–1172. https://doi.org/10.1002/jat.3283
Lindsay, W.L., Norvell, W.A., 1978. Development of a DTPA Soil Test for Zinc, Iron, Manganese, and Copper. Soil Sci. Soc. Am. J. 42, 421–428. https://doi.org/10.2136/sssaj1978.03615995004200030009x
Liu, K., Lv, J., He, W., Zhang, H., Cao, Y., Dai, Y., 2015. Major factors influencing cadmium uptake from the soil into wheat plants. Ecotoxicol. Environ. Saf. 113, 207–213. https://doi.org/10.1016/j.ecoenv.2014.12.005
Lopez, H.W., Duclos, V., Coudray, C., Krespine, V., Feillet-Coudray, C., Messager, A., Demigné, C., Rémésy, C., 2003. Making bread with sourdough improves mineral bioavailability from reconstituted whole wheat flour in rats. Nutrition 19, 524–530. https://doi.org/10.1016/S0899-9007(02)01079-1
Luch, A., 2005. Nature and nurture – Lessons from chemical carcinogenesis. Nat. Rev. Cancer 5, 113–125. https://doi.org/10.1038/nrc1546
Macalady, D.L., Walton-Day, K., 2011. Redox Chemistry and Natural Organic Matter (NOM): Geochemists’ Dream, Analytical Chemists’ Nightmare, in: Tratnyek, P.G., Grundl, T.J., Haderlein, S.B. (Eds.), ACS Symposium Series. American Chemical Society, Washington, DC, pp. 85–111. https://doi.org/10.1021/bk-2011-1071.ch005
Magaldi, T.T., Navarro, M.S., Enzweiler, J., 2019. Assessment of Dissolution of Silicate Rock Reference Materials with Ammonium Bifluoride and Nitric Acid in a Microwave Oven. Geostand. Geoanalytical Res. 43, 189–208. https://doi.org/10.1111/ggr.12242
Mantovi, P., Bonazzi, G., Maestri, E., Marmiroli, N., 2003. Accumulation of copper and zinc from liquid manure in agricultural soils and crop plants. Plant Soil 250, 249–257. https://doi.org/10.1023/A:1022848131043
Manyele, S., Anicetus, H., 2009. Management of medical waste in Tanzania hospitals. Tanzan. J. Health Res. 8. https://doi.org/10.4314/thrb.v8i3.45117
Manzoor, J., Sharma, M., Wani, K.A., 2018. Heavy metals in vegetables and their impact on the nutrient quality of vegetables: A review. J. Plant Nutr. 41, 1744–1763. https://doi.org/10.1080/01904167.2018.1462382
Marín, S., Pardo, O., Sánchez, A., Sanchis, Y., Vélez, D., Devesa, V., Font, G., Yusà, V., 2018. Assessment of metal levels in foodstuffs from the Region of Valencia (Spain). Toxicol. Rep. 5, 654–670. https://doi.org/10.1016/j.toxrep.2018.05.005
Marsh, K., Bugusu, B., 2007. Food packaging – Roles, materials, and environmental issues: Scientific status summary. J. Food Sci. 72. https://doi.org/10.1111/j.1750-3841.2007.00301.x
Matheyarasu et al., 2014. Impacts of Abattoir Waste-Water Irrigation on Soil Fertility and Productivity | IntechOpen [WWW Document]. URL https://www.intechopen.com/chapters/47789 (accessed 9.20.21).
Melaku, S., Dams, R., Moens, L., 2005. Determination of trace elements in agricultural soil samples by inductively coupled plasma-mass spectrometry: Microwave acid digestion versus aqua regia extraction. Anal. Chim. Acta 543, 117–123. https://doi.org/10.1016/j.aca.2005.04.055
REFERENCES
186
Melton, E.D., Swanner, E.D., Behrens, S., Schmidt, C., Kappler, A., 2014. The interplay of microbially mediated and abiotic reactions in the biogeochemical Fe cycle. Nat. Rev. Microbiol. 12, 797–808. https://doi.org/10.1038/nrmicro3347
Merrington, G., Oliver, I., Smernik, R.J., McLaughlin, M.J., 2003. The influence of sewage sludge properties on sludge-borne metal availability. Adv. Environ. Res. 8, 21–36. https://doi.org/10.1016/S1093-0191(02)00139-9
Mestek, O., Komínková, J., Šantrůček, J., Kačer, P., Mališová, K., Mestek, O., Komínková, J., Šantrůček, J., Kačer, P., Mališová, K., 2015. Analyses of trace metals , peptide ligands of trace metals and mercury speciation in home prepared bread Analyses of trace metals , peptide ligands of trace metals and mercury speciation in home prepared bread 2299. https://doi.org/10.3184/095422912X13325261626531
Meunier, J.-D., Sandhya, K., Prakash, N.B., Borschneck, D., Dussouillez, P., 2018. pH as a proxy for estimating plant-available Si? A case study in rice fields in Karnataka (South India). Plant Soil 432, 143–155. https://doi.org/10.1007/s11104-018-3758-7
Mikhael, M., 2016. The Lebanese Wheat Market : A Lay of the Land. Blominvest Bank 1–7.
Mitra, G., 2017. Essential Plant Nutrients and Recent Concepts about their Uptake, in: Naeem, M., Ansari, A.A., Gill, S.S. (Eds.), Essential Plant Nutrients. Springer International Publishing, Cham, pp. 3–36. https://doi.org/10.1007/978-3-319-58841-4_1
Molina, M., Aburto, F., Calderón, R., Cazanga, M., Escudey, M., 2009. Trace element composition of selected fertilizers used in Chile: Phosphorus fertilizers as a source of long-term soil contamination. Soil Sediment Contam. 18, 497–511. https://doi.org/10.1080/15320380902962320
Molina-Roco, M., Escudey, M., Antilén, M., Arancibia-Miranda, N., Manquián-Cerda, K., 2018. Distribution of contaminant trace metals inadvertently provided by phosphorus fertilisers: movement, chemical fractions and mass balances in contrasting acidic soils. Environ. Geochem. Health 40, 2491–2509. https://doi.org/10.1007/s10653-018-0115-y
Molle, F., Nassif, M.H., Jaber, B., Closas, A., Baydoun, S., 2017. Groundwater governance in Lebanon : the case of central Beqaa : a policy white paper 36.
Morel, C., Plenchette, C., Fardeau, JC. La fertilisation 186haracter raisonnée de la culture du blé. Agronomie, EDP Sciences, 1992, 12 (8), pp.565-579. Ffhal-00885501f
Morgan, J.N., 1999. Effects of Processing on Heavy Metal Content of Foods, in: Jackson, L.S., Knize, M.G., Morgan, J.N. (Eds.), Impact of Processing on Food Safety, Advances in Experimental Medicine and Biology. Springer US, Boston, MA, pp. 195–211. https://doi.org/10.1007/978-1-4615-4853-9_13
Moustafa, A., Hamze, M., 2019. Assessment of heavy metal and metalloids pollution in soils and groundwater in Akkar Northen Lebanon. J. Appl. Sci. Res. https://doi.org/10.22587/jasr.2019.15.6.3
Munoz, R.A.A., Almeida, E.S., Angnes, L., 2013. Sample Preparation Techniques for the Electrochemical Determination of Metals in Environmental and Food Samples, in: Reference Module in Chemistry, Molecular Sciences and Chemical Engineering. Elsevier. https://doi.org/10.1016/B978-0-12-409547-2.05750-4
Naeem, A., Saifullah, Ghafoor, A., Farooq, M., 2015. Suppression of cadmium concentration in wheat grains by silicon is related to its application rate and cadmium accumulating abilities of cultivars: Cd concentration in wheat. J. Sci. Food Agric. 95, 2467–2472. https://doi.org/10.1002/jsfa.6976
Nasreddine, L., Hwalla, N., Sibai, A., Hamzé, M., Parent-Massin, D., 2006. Food consumption patterns in an adult urban population in Beirut, Lebanon. Public Health Nutr. 9, 194–203. https://doi.org/10.1079/phn2005855
Nasreddine, L., Nashalian, O., Naja, F., Itani, L., Parent-Massin, D., Nabhani-Zeidan, M., Hwalla, N., 2010. Dietary exposure to essential and toxic trace elements from a Total diet study in an adult Lebanese urban population. Food Chem. Toxicol. 48, 1262–1269. https://doi.org/10.1016/j.fct.2010.02.020
Nehme, N., Haydar, C., Koubaissy, B., Fakih, M., Awad, S., 2014. The distribution of heavy metals in the Lower River. Phys. Procedia 55, 456–463. https://doi.org/10.1016/j.phpro.2014.07.066
REFERENCES
187
Nehme, N., Haydar, C., Koubeissy, B., Fakih, M., Awad, S., Toufaily, J., Villieras, F., Hamieh, T., 2012. Metal concentrations in river water and bed sediments of the Lower Litani River Bassin, Lebanon. J. Adv. Chem. 8, 1590–1601. https://doi.org/10.24297/jac.v8i2.4040
NF X31-102. Soils quality. Determination of residual moisture content of soils analytical test samples [WWW Document], 1981. URL https://www.boutique.afnor.org/standard/x31-102/soils-quality-determination-of-resudual-moisture-content-of-soils-analytical-test-samples/article/894202/fa015457 (accessed 11.2.20).
Nguyen, C.T.T., Wasson, R.J., Estrada, E.S., Cantarero, S.I., Teo, C., Ziegler, A.D., 2019. Soil elemental analysis in a high conservation tropical forest in Singapore. J. Environ. Manage. 232, 999–1011. https://doi.org/10.1016/j.jenvman.2018.11.106
Nordberg, M., Nordberg, G.F., 2016. Trace element research-historical and future aspects. J. Trace Elem. Med. Biol. https://doi.org/10.1016/j.jtemb.2016.04.006
Noureddine El Moussawi, S., Camel, V., Cladière, M., Lebbos, N., Chébib, H., Ouaini, R., 2020. Parameters influencing the migration of trace metals in uncoated fruit cans. J. Food Process. Preserv. 1–12. https://doi.org/10.1111/jfpp.14653
Noureddine El Moussawi, S., Ouaini, R., Matta, J., Chébib, H., Cladière, M., Camel, V., 2019. Simultaneous migration of bisphenol compounds and trace metals in canned vegetable food. Food Chem. 288, 228–238. https://doi.org/10.1016/j.foodchem.2019.02.116
Novotnik, B., Zuliani, T., Ščančar, J., Milačič, R., 2013. Chromate in food samples: an artefact of wrongly applied analytical methodology? J. Anal. At. Spectrom. 28, 558. https://doi.org/10.1039/c3ja30233d
Nsouli, B., Darwish, T., Thomas, J.-P., Zahraman, K., Roumié, M., 2004. Ni, Cu, Zn and Pb background values determination in representative Lebanese soil using the thick target PIXE technique. Nucl. Instrum. Methods Phys. Res. Sect. B Beam Interact. Mater. At., Proceedings of the Sixteenth International Conference on Ion Beam Analysis 219–220, 181–186. https://doi.org/10.1016/j.nimb.2004.01.050
Nziguheba, G., Smolders, E., 2008. Inputs of trace elements in agricultural soils via phosphate fertilizers in European countries. Sci. Total Environ. 390, 53–57. https://doi.org/10.1016/j.scitotenv.2007.09.031
Obeid, P.J., Aouad, S., 2009. Measurement of Levels of Heavy Metal Contamination in Vegetables Grown and Sold in Selected Areas in Lebanon.
OFEV, O. 187haract de l’environnement, 2005. Sols pollués. Évaluation de la menace et mesures de protection. Cf Eikmann and Klocke, 1993.
Oliveira, P.A., Colaço, A., Chaves, R., Guedes-Pinto, H., De-La-Cruz, L.F.P., Lopes, C., 2007. Chemical carcinogenesis. An. Acad. Bras. Cienc. 79, 593–916. https://doi.org/10.1590/s0001-37652007000400004
Onianwa, P.C., Adeyemo, A.O., Idowu, O.E., Ogabiela, E.E., 2001. Copper and zinc contents of Nigerian foods and estimates of the adult dietary intakes. Food Chem. 72, 89–95. https://doi.org/10.1016/S0308-8146(00)00214-4
Ortega, E., Iglesias, R., 2009. Reuse of treated municipal wastewater effluents in Spain: Regulations and most common technologies, including extensive treatments. Desalination Water Treat. 4, 148–160. https://doi.org/10.5004/dwt.2009.370
Oyekunle, J.A.O., Adekunle, A.S., Ogunfowokan, A.O., Olutona, G.O., Omolere, O.B., 2014. Bromate and trace metal levels in bread loaves from outlets within Ile-Ife Metropolis, Southwestern Nigeria. Toxicol. Rep. 1, 224–230. https://doi.org/10.1016/j.toxrep.2014.05.007
Pahwa, A., Kaur, A., Puri, R., 2016a. Influence of Hydrocolloids on the Quality of Major Flat Breads: A Review 2016.
Papadopoulos, A., Sioen, I., Cubadda, F., Ozer, H., Oktay Basegmez, H.I., Turrini, A., Lopez Esteban, M.T., Fernandez San Juan, P.M., Sokolić-Mihalak, D., Jurkovic, M., De Henauw, S., Aureli, F., Vin, K., Sirot, V., 2015. TDS exposure project: Application of the analytic hierarchy process for the prioritization of substances to be analyzed in a total diet study. Food Chem. Toxicol. 76, 46–53. https://doi.org/10.1016/j.fct.2014.11.015
REFERENCES
188
Paranychianakis, N.V., Salgot, M., Snyder, S.A., Angelakis, A.N., 2015. Water Reuse in EU States: Necessity for Uniform Criteria to Mitigate Human and Environmental Risks. Crit. Rev. Environ. Sci. Technol. 45, 1409–1468. https://doi.org/10.1080/10643389.2014.955629
Partey, S.T., Thevathasan, N.V., Zougmoré, R.B., Preziosi, R.F., 2016. Improving maize production through nitrogen supply from ten rarely-used organic resources in Ghana. Agrofor. Syst. https://doi.org/10.1007/s10457-016-0035-8
Pasqualone, A., 2018. Traditional flat breads spread from the Fertile Crescent: Production process and history of baking systems. J. Ethn. Foods 5, 10–19. https://doi.org/10.1016/j.jef.2018.02.002
Pérez-Esteban, J., Escolástico, C., Ruiz-Fernández, J., Masaguer, A., Moliner, A., 2013. Bioavailability and extraction of heavy metals from contaminated soil by Atriplex halimus. Environ. Exp. Bot., Plant Functioning in a Changing Global and Polluted Environment 88, 53–59. https://doi.org/10.1016/j.envexpbot.2011.12.003
Pipoyan, D., Beglaryan, M., Stepanyan, S., Merendino, N., Stepanyan, S., 2018. Dietary Exposure Assessment of Potentially Toxic Trace Elements in Fruits and Vegetables Sold in Town of Kapan , Armenia.
Pirsaheb, M., Fattahi, N., Sharafi, K., Khamotian, R., Atafar, Z., 2016. Essential and toxic heavy metals in cereals and agricultural products marketed in Kermanshah, Iran, and human health risk assessment. Food Addit. Contam. Part B Surveill. 9, 15–20. https://doi.org/10.1080/19393210.2015.1099570
Policy Dpt EU, I., 2017. Possible impacts of Brexit on EU development and humanitarian policies 42.
Punshon, T., Jackson, B.P., Meharg, A.A., Warczack, T., Scheckel, K., Guerinot, M.L., 2017. Understanding arsenic dynamics in agronomic systems to predict and prevent uptake by crop plants. Sci. Total Environ. 581–582, 209–220. https://doi.org/10.1016/j.scitotenv.2016.12.111
Qarooni, J., Wootton, M., McMaster, G., 1989. Factors affecting the quality of Arabic bread—additional ingredients. J. Sci. Food Agric. 48, 235–244. https://doi.org/10.1002/jsfa.2740480210
Qian, X., Wang, Z., Shen, G., Chen, X., Tang, Z., Guo, C., Gu, H., Fu, K., 2018. Heavy metals accumulation in soil after 4 years of continuous land application of swine manure: A field-scale monitoring and 188haracter estimation. Chemosphere 210, 1029–1034. https://doi.org/10.1016/j.chemosphere.2018.07.107
Raber, G., Stock, N., Hanel, P., Murko, M., Navratilova, J., Francesconi, K.A., 2012. An improved HPLC–ICPMS method for determining inorganic arsenic in food: Application to rice, wheat and tuna fish. Food Chem. 134, 524–532. https://doi.org/10.1016/j.foodchem.2012.02.113
Radwan, M.A., Salama, A.K., 2006. Market basket survey for some heavy metals in Egyptian fruits and vegetables. Food Chem. Toxicol. 44, 1273–1278. https://doi.org/10.1016/j.fct.2006.02.004
Ragab M.M., Antar, A., Talha, N., El-Shahawy, M. (2007). ‘Factors Affecting Chemical DTPA-Extractabilily of Some Heavy Metals From Different Soil Types in Egypt’, Alexandria Science Exchange Journal, 28, pp. 183-191. Doi: 10.21608/asejaiqjsae.2007.1887
Rahman, Zhang, 2018. Effects of Fertilizer Broadcasting on the Excessive Use of Inorganic Fertilizers and Environmental Sustainability. Sustainability 10, 759. https://doi.org/10.3390/su10030759
Rai, P., Soo, S., Zhang, M., Fai, Y., Kim, K., 2019. Heavy metals in food crops : Health risks , fate , mechanisms , and management. Environ. Int. 125, 365–385. https://doi.org/10.1016/j.envint.2019.01.067
Ratnaike, R.N., 2003. Acute and chronic arsenic toxicity. Postgrad. Med. J. 79, 391–396. https://doi.org/10.1136/pmj.79.933.391
Rawashdeh, N.K., Haddad, N.I., Al-Ajlouni, M.M., Turk, M.A., 2007. Phenotypic diversity of durum wheat (Triticum durum Desf.) from Jordan. Genet. Resour. Crop Evol. 54, 129–138. https://doi.org/10.1007/s10722-005-2636-3
Révillon, S., Hureau-Mazaudier, D., 2009. Improvements in Digestion Protocols for Trace Element and Isotope Determinations in Stream and Lake Sediment Reference Materials (JSd-1, JSd-2, JSd-3, JLk-1 and LKSD-1). Geostand. Geoanalytical Res. 33, 397–413. https://doi.org/10.1111/j.1751-908X.2009.00008.x
Rivera, M.B., Fernández-Caliani, J.C., Giráldez, M.I., 2015. Geoavailability of lithogenic trace elements of environmental concern and supergene enrichment in soils of the Sierra de Aracena Natural Park (SW Spain). Geoderma 259–260, 164–173. https://doi.org/10.1016/j.geoderma.2015.06.009
REFERENCES
189
Rizwan, M., Meunier, J.-D., Miche, H., Keller, C., 2012. Effect of silicon on reducing cadmium toxicity in durum wheat (Triticum turgidum L. cv. Claudio W.) grown in a soil with aged contamination. J. Hazard. Mater. 209–210, 326–334. https://doi.org/10.1016/j.jhazmat.2012.01.033
Roberts, 2014. Cadmium and phosphorous fertilizers: The issues and the science. Procedia Eng. 83, 52–59. https://doi.org/10.1016/j.proeng.2014.09.012
Roukoz, K., Issa, S., 2004. The Potential Risk of Groundwater Contamination by Heavy Metals under Different Agricultural Practices. Ann. Rech. Sci. 323–340.
Rstudio Team, Rs.T., 2016. Rstudio Team (2016) Rstudio Integrated 2016.pdf.
Saab, M.T.A., Sellami, M.H., Giorio, P., Basile, A., Bonfante, A., Rouphael, Y., Fahed, S., Jomaa, I., Stephan, C., Kabalan, R., Massaad, R., Todorovic, M., Albrizio, R., 2019. Assessing the potential of cereal production systems to adapt to contrasting weather conditions in the Mediterranean region. Agronomy 9. https://doi.org/10.3390/agronomy9070393
Sadee, B., Foulkes, M.E., Hill, S.J., 2015. Coupled techniques for arsenic speciation in food and drinking water: a review. J. Anal. At. Spectrom. 30, 102–118. https://doi.org/10.1039/C4JA00269E
Safari, Y., Delavar, M.-A., Zhang, C., Noori, Z., Rahmanian, M., 2018. Assessing cadmium risk in wheat grain using soil threshold values. Int. J. Environ. Sci. Technol. 15, 887–894. https://doi.org/10.1007/s13762-017-1422-z
Saisine, A.D.E.L.A., 2010. Afssa – Saisine n ° 2010-SA-0109 Saisine ( s ) liée ( s ) n ° 2008-SA-0392 de l ’ Agence française de sécurité sanitaire des aliments 189haracte à une demande d ’ avis sur un projet d ’ arrêté modifiant l ’ arrêté du 4 décembre 2008 fixant les conditions d ’ 1–5.
Sall, A.T., Chiari, T., Legesse, W., Seid-ahmed, K., 2019. Cultivation and Potential Expansion in Sub-Saharan Africa. https://doi.org/10.3390/agronomy9050263
Santoro, A., Held, A., Linsinger, T.P.J., Perez, A., Ricci, M., 2017. Comparison of total and aqua regia extractability of heavy metals in sewage sludge: The case study of a certified reference material. TrAC – Trends Anal. Chem. 89, 34–40. https://doi.org/10.1016/j.trac.2017.01.010
Ščančar, J., Milačič, R., 2014. A critical overview of Cr speciation analysis based on high performance liquid chromatography and spectrometric techniques. J. Anal. At. Spectrom. 29, 427–443. https://doi.org/10.1039/c3ja50198a
Schaeffer, A., Amelung, W., Hollert, H., Kaestner, M., Kandeler, E., Kruse, J., Miltner, A., Ottermanns, R., Pagel, H., Peth, S., Poll, C., Rambold, G., Schloter, M., Schulz, S., Streck, T., Roß-Nickoll, M., 2016. The impact of chemical pollution on the resilience of soils under multiple stresses: A conceptual framework for future research. Sci. Total Environ. 568, 1076–1085. https://doi.org/10.1016/j.scitotenv.2016.06.161
Semerjian, L.A., 2014. Quality assessment of various bottled waters marketed in Lebanon Quality assessment of various bottled waters marketed in Lebanon. https://doi.org/10.1007/s10661-010-1333-7
Serelis, K.G., Kafkala, I.G., Parpodis, K., Lazaris, S., 2017. Anthropogenic and Geogenic Contamination Due To Heavy Metals in the Vast Area of Vari, Attica. Bull. Geol. Soc. Greece 43, 2390. https://doi.org/10.12681/bgsg.11639
Shaban, A., Hamzé, M., 2018. The Litani River, Lebanon: An Assessment and Current Challenges, The Litani River, Lebanon: An Assessment and Current Challenges. https://doi.org/10.1007/978-3-319-76300-2
Shahbazi, K., Beheshti, M., 2019. Comparison of three methods for measuring heavy metals in calcareous soils of Iran. SN Appl. Sci. 1, 1541. https://doi.org/10.1007/s42452-019-1578-x
Shahid, M., Raza, Z., Sajid, M., 2016. Hybrid Bio-inspired Scheduling Algorithms for Batch of Tasks on Heterogeneous Computing System. Int. J. Bio-Inspired Comput. 1, 1. https://doi.org/10.1504/IJBIC.2016.10004299
Shang, E., Xu, E., Zhang, H., Huang, C., 2019. Temporal-spatial trends in potentially toxic trace element pollution in farmland soil in the major grain-producing regions of China. Sci. Rep. 9, 19463. https://doi.org/10.1038/s41598-019-55278-5
REFERENCES
190
Shi, G.L., Li, D.J., Wang, Y.F., Liu, C.H., Hu, Z.B., Lou, L.Q., Rengel, Z., Cai, Q.S., 2019. Accumulation and distribution of arsenic and cadmium in winter wheat (Triticum aestivum L.) at different developmental stages. Sci. Total Environ. 667, 532–539. https://doi.org/10.1016/j.scitotenv.2019.02.394
Shraim, A.M., 2017. Rice is a potential dietary source of not only arsenic but also other toxic elements like lead and chromium. Arab. J. Chem. 10, S3434–S3443. https://doi.org/10.1016/j.arabjc.2014.02.004
Silva, A.S., García, R.S., Cooper, I., Franz, R., Losada, P.P., 2006. Compilation of analytical methods and guidelines for the determination of selected model migrants from plastic packaging. Trends Food Sci. Technol. 17, 535–546. https://doi.org/10.1016/j.tifs.2006.04.009
Simonsen, L.O., Harbak, H., Bennekou, P., 2012. Cobalt metabolism and toxicology—A brief update. Sci. Total Environ. 432, 210–215. https://doi.org/10.1016/j.scitotenv.2012.06.009
Singh, B.R., Gupta, S.K., Azaizeh, H., Shilev, S., Sudre, D., Song, Y., Mench, M., 2011. Safety of food crops on land contaminated with trace elements 1349–1366. https://doi.org/10.1002/jsfa.4355
Sloth, J.J., Julshamn, K., Lundebye, A.K., 2005. Total arsenic and inorganic arsenic content in Norwegian fish feed products. Aquac. Nutr. 11, 61–66. https://doi.org/10.1111/j.1365-2095.2004.00334.x
Soares, M.E., Vieira, E., De Lourdes Bastos, M., 2010. Chromium speciation analysis in bread samples. J. Agric. Food Chem. 58, 1366–1370. https://doi.org/10.1021/jf903118v
Sobolev, N., Aksenov, A., Sorokina, T., Chashchin, V., Ellingsen, D.G., Nieboer, E., Varakina, Y., Veselkina, E., Kotsur, D., Thomassen, Y., 2019. Essential and non-essential trace elements in fish consumed by indigenous peoples of the European Russian Arctic. Environ. Pollut. 253, 966–973. https://doi.org/10.1016/j.envpol.2019.07.072
SOER, 2010. State of the Environment Report (SOER 2010 Lebanon) – Land Resources.pdf [WWW Document].
Song, J., Zhao, F.-J., McGrath, S.P., Luo, Y.-M., 2006. INFLUENCE OF SOIL PROPERTIES AND AGING ON ARSENIC PHYTOTOXICITY. Environ. Toxicol. Chem. 25, 1663. https://doi.org/10.1897/05-480R2.1
Spiegel, H., Baumgarten, A., Dersch, G., Pfundtner, E., Sandén, T., 2019. Impact of Mineral P Fertilization on Trace Elements in Cropland Soils 93–110. https://doi.org/10.1007/978-3-030-26265-5_4
Stolt, J.P., Sneller, F.E.C., Bryngelsson, T., Lundborg, T., Schat, H., 2003. Phytochelatin and cadmium accumulation in wheat. Environ. Exp. Bot. 49, 21–28. https://doi.org/10.1016/S0098-8472(02)00045-X
Storelli, A., Ioanna, F., Storelli, M.M., Quaglia, N.C., Barone, G., Giacominelli-Stuffler, R., Dambrosio, A., Busco, A., 2017. Traditional Italian cheeses: Trace element levels and estimation of dietary intake. J. Food Compos. Anal. 66, 205–211. https://doi.org/10.1016/j.jfca.2017.12.025
Su, H., Li, Z., Fiati Kenston, S., Shi, H., Wang, Y., Song, X., Gu, Y., Barber, T., Aldinger, J., Zou, B., Ding, M., Zhao, J., Lin, X., 2017. Joint Toxicity of Different Heavy Metal Mixtures after a Short-Term Oral Repeated-Administration in Rats. Int. J. Environ. Res. Public. Health 14, 1164. https://doi.org/10.3390/ijerph14101164
Sudhakar, Suresh, Dhamodham T, 2015. Determination of Heavy Metals in Sugar Industry Effluent. https://doi.org/10.13140/RG.2.1.3612.8160
Suman, S., Sharma, P.K., Siddique, A.B., Rahman, Md.A., Kumar, R., Rahman, M.M., Bose, N., Singh, S.K., Ghosh, A.K., Matthews, H., Mondal, D., 2020. Wheat is an emerging exposure route for arsenic in Bihar, India. Sci. Total Environ. 703, 134774. https://doi.org/10.1016/j.scitotenv.2019.134774
Sun, H.J., Xiang, P., Luo, J., Hong, H., Lin, H., Li, H.B., Ma, L.Q., 2016. Mechanisms of arsenic disruption on gonadal, adrenal and thyroid endocrine systems in humans: A review. Environ. Int. 95, 61–68. https://doi.org/10.1016/j.envint.2016.07.020
Svane, S., Karring, H., 2019. A comparison of the transition metal concentrations in the faeces, urine, and manure slurry from different livestock animals related to environmentally relevant microbial processes. Cogent Chem. 5. https://doi.org/10.1080/23312009.2019.1644702
Sverdrup, H.U., Ragnarsdóttir, K.V., 2014. Natural Resources in a Planetary Perspective. Geochem. Perspect. 3, 129–130.
REFERENCES
191
Taiz and Zeiger, Z., 2002. Taiz, L. and Zeiger, E. (2002) Plant Physiology (Third Edition). Sinauer Associates, Inc., Publishers, Sunderland, 67-86. – References – Scientific Research Publishing [WWW Document]. URL https://www.scirp.org/(S(351jmbntvnsjt1aadkposzje))/reference/ReferencesPapers.aspx?ReferenceID=1404412 (accessed 8.19.21).
Tang, J., Huang, Z., 2014. Exposure assessment of heavy metals (Cd , Hg , and Pb ) by the intake of local foods from Zhejiang , China. https://doi.org/10.1007/s10653-014-9594-7
Tao, Y., Zhang, S., Jian, W., Yuan, C., Shan, X., 2006. Effects of oxalate and phosphate on the release of arsenic from contaminated soils and arsenic accumulation in wheat. Chemosphere 65, 1281–1287. https://doi.org/10.1016/j.chemosphere.2006.04.039
Tebo, B.M., Bargar, J.R., Clement, B.G., Dick, G.J., Murray, K.J., Parker, D., Verity, R., Webb, S.M., 2004. BIOGENIC MANGANESE OXIDES: Properties and Mechanisms of Formation. Annu. Rev. Earth Planet. Sci. 32, 287–328. https://doi.org/10.1146/annurev.earth.32.101802.120213
Tejera, R.L., Luis, G., González-Weller, D., Caballero, J.M., Gutiérrez, Á.J., Rubio, C., Hardisson, A., 2013. Metales en harina de trigo; 191 harac 191 haracteriz y control de su seguridad. Nutr. Hosp. 28, 506–513. https://doi.org/10.3305/nh.2013.28.2.6287
Teng, Y., Feng, D., Wu, J., Zuo, R., Song, L., Wang, J., 2015. Distribution, bioavailability, and potential ecological risk of Cu, Pb, and Zn in soil in a potential groundwater source area. Environ. Monit. Assess. 187. https://doi.org/10.1007/s10661-015-4541-3
Thawornchaisit, U., Polprasert, C., 2009. Evaluation of phosphate fertilizers for the stabilization of cadmium in highly contaminated soils. J. Hazard. Mater. 165, 1109–1113. https://doi.org/10.1016/j.jhazmat.2008.10.103
Thomas, C.L., Acquah, G.E., Whitmore, A.P., McGrath, S.P., Haefele, S.M., 2019. The effect of different organic fertilizers on yield and soil and crop nutrient concentrations. Agronomy 9. https://doi.org/10.3390/agronomy9120776
Tortoe, C., Ofori, H., Akonor, P.T., Oduro-Obeng, H., 2018a. Trace metal concentrations in three pastry products prepared from root and tuber and cereal crops composite flours. Cogent Chem. 4. https://doi.org/10.1080/23312009.2018.1429157
Toufeili, I., Ismail, B., Shadarevian, S., Baalbaki, R., Khatkar, B.S., Bell, A.E., Schofield, J.D., 1999. The role of gluten proteins in the baking of Arabic bread. J. Cereal Sci. 30, 255–265. https://doi.org/10.1006/jcrs.1999.0286
Tubaña, B.S., Babu, T., Datnoff, L.E., 2016. A review of silicon in soils and plants and its role in us agriculture: History and future perspectives. Soil Sci. 181, 393–411. https://doi.org/10.1097/SS.0000000000000179
Tubaña, B.S., Heckman, J.R., 2015. Silicon in Soils and Plants. https://doi.org/10.1007/978-3-319-22930-0
Turdi, M., Yang, L., 2016. Trace Elements Contamination and Human Health Risk Assessment in Drinking Water from the Agricultural and Pastoral Areas of Bay County ,. https://doi.org/10.3390/ijerph13100938
Turrini, A., Lombardi-Boccia, G., Aureli, F., Cubadda, F., D’Addezio, L., D’Amato, M., D’Evoli, L., Darnerud, P.O., Devlin, N., Dias, M.G., Jurković, M., Kelleher, C., Le Donne, C., López Esteban, M., Lucarini, M., Martinez Burgos, M.A., Martínez-Victoria, E., McNulty, B., Mistura, L., Nugent, A., Oktay Basegmez, H.I., Oliveira, L., Ozer, H., Perelló, G., Pite, M., Presser, K., Sokolić, D., Vasco, E., Volatier, J.L., 2018. A conceptual framework for the collection of food products in a Total Diet Study. Food Addit. Contam. – Part Chem. Anal. Control Expo. Risk Assess. 35, 171–190. https://doi.org/10.1080/19440049.2017.1384577
USEPA, 2005. Guidelines for Carcinogen Risk Assessment Risk Assessment Forum U.S. Environmental Protection Agency Washington, DC [WWW Document].
USEPA, U., 2012. 2012 Guidelines for Water Reuse 643.
USGS, 2018. Phosphate Rock Statistics and Information [WWW Document]. URL https://www.usgs.gov/centers/nmic/phosphate-rock-statistics-and-information (accessed 9.13.21).
Vahter, M., 2008. Health effects of early life exposure to arsenic. Basic Clin. Pharmacol. Toxicol. 102, 204–211. https://doi.org/10.1111/j.1742-7843.2007.00168.x
Vaireanu, D.-I., Cojocaru, A., Maior, I., Ciobotaru, I.-A., 2018. Food Packaging Interactions in Metal Cans, Reference Module in Food Science. Elsevier. https://doi.org/10.1016/b978-0-08-100596-5.22398-6

REFERENCES
192
Valavanidis, P.A., Vlachogianni, T., 2010. “ Metal Pollution in Ecosystems . Ecotoxicology Studies and Risk Assessment in the Marine Environment .” Ecotoxicology.
Van der Fels-Klerx, H.J., Edwards, S.G., Kennedy, M.C., O’Hagan, S., O’Mahony, C., Scholz, G., Steinberg, P., Chiodini, A., 2014. A framework to determine the effectiveness of dietary exposure mitigation to chemical contaminants. Food Chem. Toxicol. 74, 360–371. https://doi.org/10.1016/j.fct.2014.10.027
Van Der Perk, M., Jetten, V., Heskes, E., Segers, M., Wijntjens, I., 2004. Transport and retention of copper fungicides in vineyards. IAHS-AISH Publ. 437–443.
Vapnek, J., 2005. Perspectives and guidelines on food legislation , with a new model food law.
Verbeeck, M., Salaets, P., Smolders, E., 2020. Trace element concentrations in mineral phosphate fertilizers used in Europe: A balanced survey. Sci. Total Environ. 712, 136419. https://doi.org/10.1016/j.scitotenv.2019.136419
Vergine, M., Aprile, A., Sabella, E., Genga, A., Siciliano, M., Rampino, P., Lenucci, M.S., Luvisi, A., Bellis, L. De, 2017. Cadmium Concentration in Grains of Durum Wheat (Triticum turgidum L. subsp. Durum). J. Agric. Food Chem. 65, 6240–6246. https://doi.org/10.1021/acs.jafc.7b01946
Violante, A., Cozzolino, V., Perelomov, L., Caporale, A.G., Pigna, M., 2010. Mobility and bioavailability of heavy metals and metalloids in soil environments. J. Soil Sci. Plant Nutr. 10, 268–292. https://doi.org/10.4067/S0718-95162010000100005
Wang, J., Vanga, S.K., Saxena, R., Orsat, V., Raghavan, V., 2018. Effect of climate change on the yield of cereal crops: A review. Climate 6. https://doi.org/10.3390/cli6020041
Weitbrecht, K., Schwab, S., Rupp, C., Bieler, E., Dürrenberger, M., Bleyer, G., Schumacher, S., Kassemeyer, H.H., Fuchs, R., Schlücker, E., 2021. Microencapsulation – An innovative technique to improve the fungicide efficacy of copper against grapevine downy mildew. Crop Prot. 139. https://doi.org/10.1016/j.cropro.2020.105382
Werfelli, N., Ben Ayed, R., Abassi, M., Béjaoui, Z., 2021. Contamination Assessment of Durum Wheat and Barley Irrigated with Treated Wastewater through Physiological and Biochemical Effects and Statistical Analyses. J. Food Qual. 2021, 1–10. https://doi.org/10.1155/2021/6626184
WHO, 2007. Exposure of children to chemical hazards in food ENHIS / WHO https://www.euro.who.int/__data/assets/pdf_file/0003/97446/4.4.
WHO, 1996. Trace elements in human nutrition health https://apps.who.int/iris/handle/10665/37931
WHO, W., 2006. WHO waste water 2006 https://www.who.int/water_sanitation_health/sanitation-waste.
Wickham, H., 2020. A Grammar of Data Manipulation. R package version 0.8. 5. 700. R-Proj. Orgpackage Dplyr Httpscranr-Proj. 701.
Wijayawardena, M.A.A., Naidu, R., Megharaj, M., Lamb, D., Thavamani, P., Kuchel, T., 2015. Using soil properties to predict in vivo bioavailability of lead in soils. Chemosphere 138, 422–428. https://doi.org/10.1016/j.chemosphere.2015.06.073
Woldetsadik, D., Drechsel, P., Keraita, B., Itanna, F., Gebrekidan, H., 2017. Heavy metal accumulation and health risk assessment in wastewater-irrigated urban vegetable farming sites of Addis Ababa, Ethiopia. Int. J. Food Contam. 4. https://doi.org/10.1186/s40550-017-0053-y
Wu, al., 2021. Cadmium threshold for acidic and multi-metal contaminated soil according to Oryza sativa L. Cadmium accumulation: Influential factors and prediction model. https://doi.org/10.1016/j.ecoenv.2020.111420
Wuana, R.A., Okieimen, F.E., 2011. Heavy Metals in Contaminated Soils: A Review of Sources, Chemistry, Risks and Best Available Strategies for Remediation. ISRN Ecol. 2011, 1–20. https://doi.org/10.5402/2011/402647
Xiong, T.-T., Leveque, T., Austruy, A., Goix, S., Schreck, E., Dappe, V., Sobanska, S., Foucault, Y., Dumat, C., 2014. Foliar uptake and metal(loid) bioaccessibility in vegetables exposed to particulate matter. Environ. Geochem. Health 36, 897–909. https://doi.org/10.1007/s10653-014-9607-6
REFERENCES
193
Xynias, I.N., Mylonas, I., Korpetis, E.G., Ninou, E., Tsaballa, A., Avdikos, I.D., Mavromatis, A.G., 2020. Durum wheat breeding in the Mediterranean region: Current status and future prospects. Agronomy 10, 1–27. https://doi.org/10.3390/agronomy10030432
Yadav, K., Gupta, N., Kumar, A., Reece, L.M., Singh, N., Rezania, S., Ahmad Khan, S., 2018. Mechanistic understanding and holistic approach of phytoremediation: A review on application and future prospects. Ecol. Eng. 120, 274–298. https://doi.org/10.1016/j.ecoleng.2018.05.039
Yan, G., Nikolic, M., Ye, M., Xiao, Z., Liang, Y., 2018. Silicon acquisition and accumulation in plant and its significance for agriculture. J. Integr. Agric. 17, 2138–2150. https://doi.org/10.1016/S2095-3119(18)62037-4
Yanardağ, A.B., Mermut, A.R., Cano, Á.F., Garces, D.M.C., Yanardağ, İ.H., 2016. Cadmium contents of soils and durum and bread wheats on Harran Plain, southeast Turkey. Turk J Agric For 11.
Yang, Y., Zhang, F.S., Li, H.F., Jiang, R.F., 2009. Accumulation of cadmium in the edible parts of six vegetable species grown in Cd-contaminated soils. J. Environ. Manage. 90, 1117–1122. https://doi.org/10.1016/j.jenvman.2008.05.004
Yusà, V., Vélez, D., Sanchis, Y., Sánchez, A., Marín, S., Devesa, V., Font, G., Pardo, O., 2018. Assessment of metal levels in foodstuffs from the Region of Valencia (Spain). Toxicol. Rep. 5, 654–670. https://doi.org/10.1016/j.toxrep.2018.05.005
Zeileis, A., Hothorn, T., 2002. Diagnostic checking in regression relationships. R News 2: 7–10. HttpCRAN R-Proj. OrgdocRnews.
Zhang, X.-Y., Tang, L.-S., Zhang, G., Wu, H.-D., 2009. Heavy Metal Contamination in a Typical Mining Town of a Minority and Mountain Area, South China. Bull. Environ. Contam. Toxicol. 82, 31–38. https://doi.org/10.1007/s00128-008-9569-4
Zhang, Z., 2019. Effects of microplastics on wastewater and sewage sludge treatment and their removal: A review. Chem. Eng. J. 382, 122955. https://doi.org/10.1016/j.cej.2019.122955
Zhao, F.-J., McGrath, S.P., Meharg, A.A., 2010. Arsenic as a Food Chain Contaminant: Mechanisms of Plant Uptake and Metabolism and Mitigation Strategies. Annu. Rev. Plant Biol. 61, 535–559. https://doi.org/10.1146/annurev-arplant-042809-112152
Zhou, S., Chen, S., Yuan, Y., Lu, Q., 2015. Influence of Humic Acid Complexation with Metal Ions on Extracellular Electron Transfer Activity. Sci. Rep. 5, 17067. https://doi.org/10.1038/srep17067
Zhou, X.-Y., Wang, X.-R., 2019. Impact of industrial activities on heavy metal contamination in soils in three major urban agglomerations of China. J. Clean. Prod. 230, 1–10. https://doi.org/10.1016/j.jclepro.2019.05.098
Zwolak, A. et al., 2019. Sources of Soil Pollution by Heavy Metals and Their Accumulation in Vegetables: a Review. Water. Air. Soil Pollut. 230. https://doi.org/10.1007/s11270-019-4221-y
ABSTRACT
194
ABSTRACT
In Lebanon, the agri-food industry represents 18% of the industrial sector and yet food safety
remains a major problem. In this interdisciplinary thesis, we followed the Trace Elements (TEs)
in the Lebanese white bread sector “from farm to fork” based on the reality on the ground,
and on two links in the sector: (i) the geogenic or anthropogenic origin of TEs present in the
soil and their transfer to the wheat grain, for which 10 plots cultivated in wheat, covering the
diversity of soils, irrigation practices and anthropogenic environments of the central Bekaa
were chosen; (ii) the exposure of populations to TEs present in bread, for which a survey of
consumption habits across Lebanon was carried out on 992 individuals (children, adolescents,
women and men) and the quantification of TEs present in bread from the 3 biggest bakeries.
A new microwave digestion with H2SO4 + H2O2 combined with flame – Atomic Absorption
Spectrometry measurement was validated with Certified Reference Material and after
comparison with Hydrofluoric-based digestion. It allows routine but accurate quantification
of TEs As, Cd, Cu, Co, Cr and Pb, “green” and inexpensive, suitable for calcareous or calcium-
saturated Mediterranean soils.
In soils, the total TE contents and the bioavailable quantity by DTPA extraction are not
correlated. Thus, the B5 and B8 sites have the highest total contents, probably of geogenic
origin, but B8 is richer in bioavailable forms linked to industrial activities. Likewise, the B3 and
B9 sites, which have low to medium total TE contents, have on the contrary the highest
bioavailable TE contents of anthropogenic origin.
In wheat, the level of Cd, As and Pb was studied in roots, stems, leaves and grains. The As
contents in grains are high and correlate with the DTPA-extractable As in soil, while the Pb
contents in the grain are very low. The Cd content in grains is close to the threshold values.
Root Cd content correlates with extractable Cd and translocation factors are often greater
than 1, showing that Cd is easily transferred to grain. The high Cd content (20 mg kg-1) of
phosphate fertilizers imported into Lebanon is the plausible source of this contamination,
hence the importance of its monitoring.
The Lebanese bread consumption survey showed that white bread is consumed the most and
men the greatest consumers (282 g d-1). Arsenic, Cd, Co, Cr, Hg, Ni and Pb have been analyzed
in white bread from the 3 most consumed brands. There is no health risk with respect to the
elements Hg, Cd, Cr and Co, with the exception of the 95th percentile of 6-9 years old children.
ABSTRACT
195
Exposure to nickel, on the other hand, showed an excess of total food intake up to 4 times for
the most exposed populations (95th percentile). There are food safety issues related to As and
Pb because the exposure margins are very low.
Given the current crisis in Lebanon where it will be necessary to rely more on local production,
it is important to monitor the levels of As, Cd and Pb in wheat, the relationships with the soil
and environmental factors, to assess the risks to human health and identify ways to limit
potential exposure to metals and metalloids. To our knowledge, this is the first time that
exposure to Arsenic has been studied in the Lebanese population. These observations need
to be confirmed, and there is an urgent need to determine the speciation of inorganic arsenic
forms in bread.
RÉSUMÉ
196
RÉSUMÉ
Au Liban, l’industrie agro-alimentaire représente 18% du secteur industriel et cependant la
sécurité sanitaire reste un problème majeur. Dans cette thèse interdisciplinaire, nous avons
suivi les Éléments Traces (ÉTs) dans la filière du pain blanc libanais « de la fourche à la
fourchette » en se basant sur la réalité du terrain, et sur deux maillons de la filière : (i) l’origine
géogénique ou anthropique des ÉTs présents dans le sol et leur transfert dans le grain de blé,
pour lequel 10 parcelles cultivées en blé, couvrant la diversité des sols, des pratiques
d’irrigation et des environnements anthropiques de la Békaa centrale ont été choisies ; (ii)
l’exposition des populations aux ÉTs présents dans le pain, pour laquelle une enquête sur les
habitudes de consommation sur tout le Liban a été réalisée sur 992 individus (enfants,
adolescents, femmes et hommes) et la quantification des ÉTs présents dans le pain des 3 plus
grandes boulangeries.
Une nouvelle méthode d’extraction et de quantification des ÉTs basée sur une digestion par
micro-ondes avec l’acide sulfurique et le peroxyde d'hydrogène et combinée à la
spectrométrie d’absorption atomique par flamme a été validée avec des matériaux de
références certifiés et après comparaison avec la digestion « totale » basée sur une attaque
à l’acide fluorhydrique. Elle permet une quantification de routine des ÉTs As, Cd, Cu, Co, Cr et
Pb, « verte » et peu coûteuse, adaptée aux sols méditerranéens calcaires ou saturés en
calcium.
Dans les sols, la teneur totale en ÉTs et la quantité biodisponible par extraction DTPA ne sont
pas corrélées. Ainsi les sites B5 et B8 présentent les teneurs totales les plus élevées
probablement d’origine géogénique, mais B8 est plus riche en formes biodisponibles liés aux
activités industrielles. De même les sites B3 et B9 qui présentent des teneurs totales en ÉTs
faible à moyenne, présentent au contraire les teneurs en ÉTs biodisponibles les plus fortes
d’origine anthropique.
Dans le blé, le niveau de Cd, As et Pb a été étudié (racines, tiges, feuilles et grains). Les teneurs
en As dans le grain sont élevées et corrélées à l'As du sol DTPA-extractible au, tandis que les
teneurs en Pb dans le grain sont très faibles. La teneur en Cd des grains est proche des valeurs
seuils. La teneur en Cd des racines est corrélée au Cd extractible et les facteurs de
translocation sont souvent supérieurs à 1, montrant que le Cd est facilement transféré dans
le grain. La teneur en Cd élevée (20 mg kg-1) des engrais phosphatés importés au Liban est la
source plausible de cette contamination, d’où l’importance de sa surveillance.
RÉSUMÉ
197
L’enquête sur la consommation du pain libanais a montré que le pain blanc est le plus
consommé et les hommes les plus grands consommateurs (282 g j¯¹). L’Arsenic, le Cd, le Co,
le Cr, le Hg, le Ni et le Pb ont été analysés dans le pain blanc des 3 marques les plus
consommées. Il n'y a pas de risque sanitaire vis-à-vis des éléments Hg, Cd, Cr et Co, à
l'exception du 95ecentile des 6-9 ans. L'exposition au nickel par contre a montré un excès de
l’apport alimentaire total jusqu'à 4 fois pour les populations les plus exposées (95ème
percentile). Il y a des problèmes de sécurité liés à l'As et au Pb car les marges d'exposition
sont très faibles.
Compte tenu de la crise actuelle au Liban où il faudra s'appuyer davantage sur la production
locale, il est important de suivre les teneurs en As, Cd et Pb dans le blé, les relations avec le
sol et les facteurs environnementaux, pour évaluer les risques pour la santé humaine et
identifier les moyens de limiter l'exposition potentielle aux métaux et métalloïdes. A notre
connaissance, c'est la première fois que l'exposition à l'Arsenic est étudiée dans la population
libanaise. Il faut confirmer ces observations, et il est urgent de déterminer la spéciation des
formes d'arsenic inorganique dans le pain.

ANNEX
a1
ANNEX
ANNEX 1
a2
ANNEX 1: Survey and questionnaire related
to Lebanese bread consumption
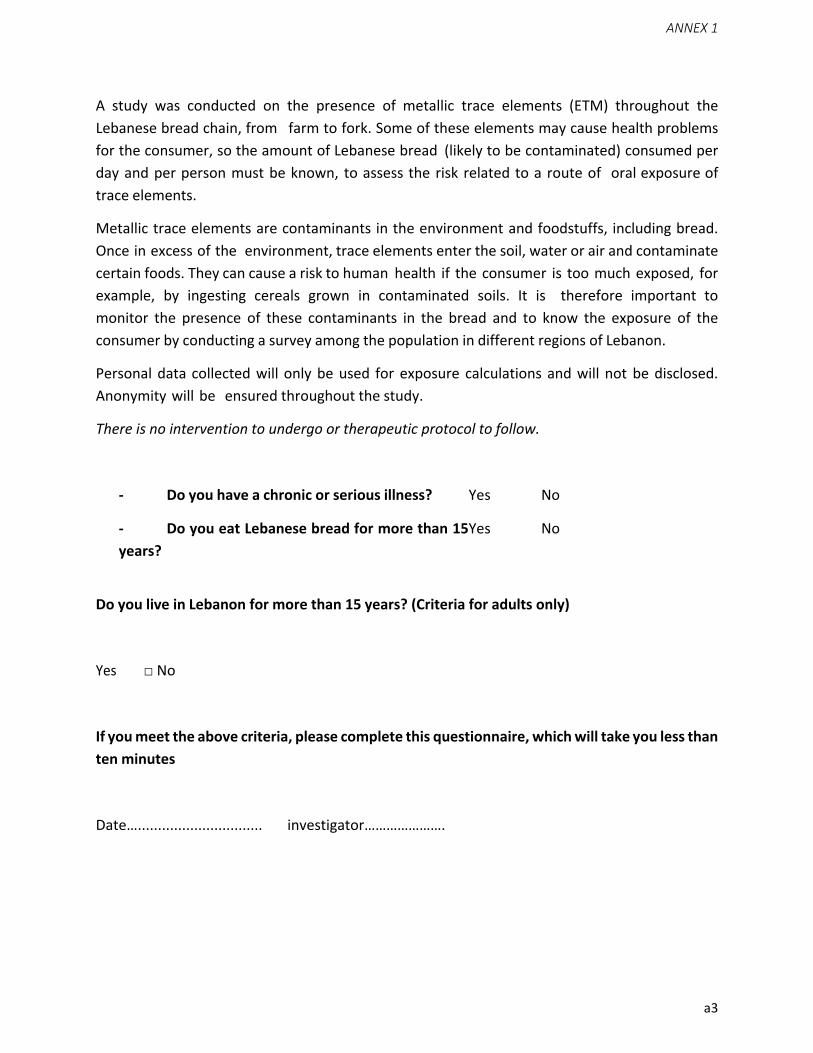
ANNEX 1
a3
A study was conducted on the presence of metallic trace elements (ETM) throughout the
Lebanese bread chain, from farm to fork. Some of these elements may cause health problems
for the consumer, so the amount of Lebanese bread (likely to be contaminated) consumed per
day and per person must be known, to assess the risk related to a route of oral exposure of
trace elements.
Metallic trace elements are contaminants in the environment and foodstuffs, including bread.
Once in excess of the environment, trace elements enter the soil, water or air and contaminate
certain foods. They can cause a risk to human health if the consumer is too much exposed, for
example, by ingesting cereals grown in contaminated soils. It is therefore important to
monitor the presence of these contaminants in the bread and to know the exposure of the
consumer by conducting a survey among the population in different regions of Lebanon.
Personal data collected will only be used for exposure calculations and will not be disclosed.
Anonymity will be ensured throughout the study.
There is no intervention to undergo or therapeutic protocol to follow.
- Do you have a chronic or serious illness? Yes No
- Do you eat Lebanese bread for more than 15
years?
Yes No
Do you live in Lebanon for more than 15 years? (Criteria for adults only)
Yes □ No
If you meet the above criteria, please complete this questionnaire, which will take you less than
ten minutes
Date…............................... investigator………………….

ANNEX 1
a4
Part 1. Consumption of Lebanese bread
What is the kind of Lebanese bread eaten?
1 □ White bread 2 □ Brown bread 3 □ Other please specify: ............ .. ......
What is the brand of bread most consumed?
1 □ Brand 1 2 □ Brand 2 3 □ Brand 3
4 □ Brand 4 5 □ Others please specify: .................................
What is the size of pita consumed?
1 □ Small 2 □ Medium 3 □ Large
What is the number of pitas consumed per day?
1 □ 2 □ 3 □ 4 □ Others please specify: ...................... ....
Part 2. Sociodemographic data
5. Age: | | |
Gender: 1 □ Man 2 □ Woman
Place of residence:

ANNEX 1
a5
1 □ Beirut 2 □ Mount Lebanon 3 □ North Lebanon 4 □ South Lebanon and Nabatieh 5 □ Bekaa
Region: 1 □ Urban 2 □ Rural
Level of education:
1 □ Secondary 2 □ Technical secondary 3 □ Secondary
4 □ Technical University 5 □ Non-technical University
Economic activity:
1 □ Works 2 □ Seeks a job first
3 □ Unemployed 4 □ Studied
5 □ Study and work 6 □ Retired or annuitant
7 □ Other inactive
If you work (or have worked), the profession:
0 □ Armed Forces
□ Members of the executive and legislative bodies, senior managers of public administration,
executives and senior company executives
□ Intellectual and scientific professions 3 □ Intermediate professions
4 □ Employees of administrative type 5 □ Service, store and market sellers
6 □ Farmers and skilled workers in agriculture and fisheries 7 □ Artisans and handcraft workers
8 □ Plant and machine operators and assembly workers 9 □ Workers and unskilled workers
10 □ Other specify: ....................................................... ...
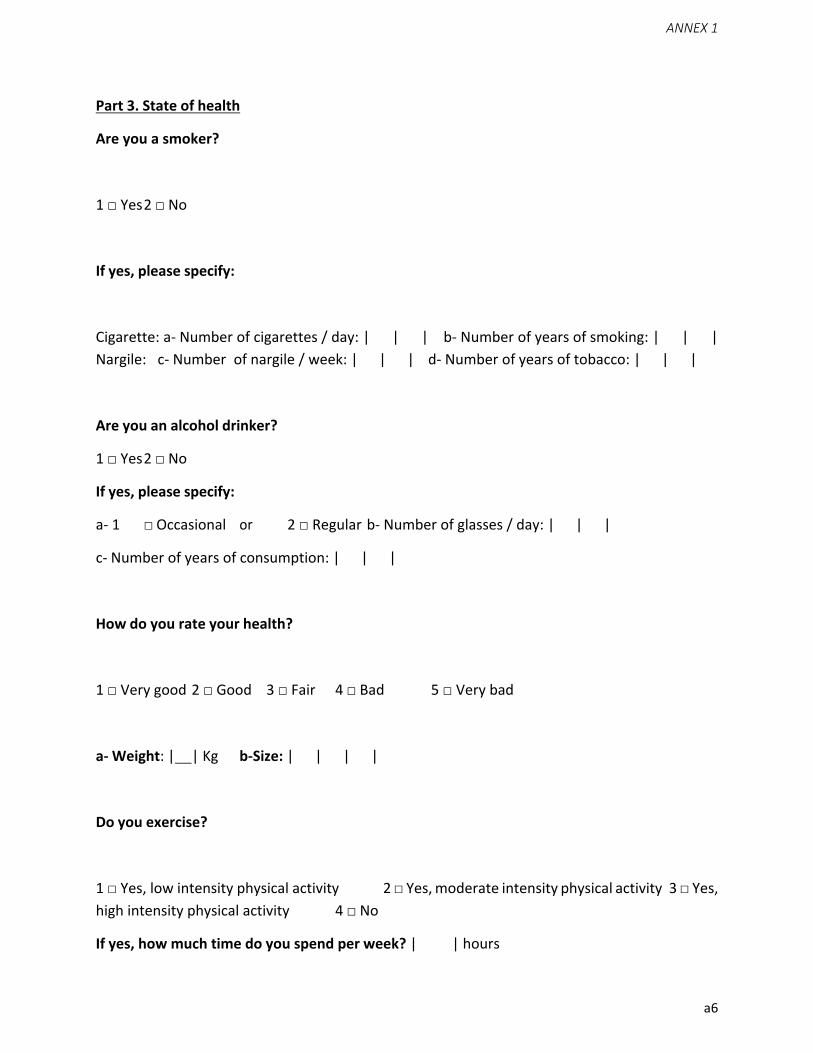
ANNEX 1
a6
Part 3. State of health
Are you a smoker?
1 □ Yes 2 □ No
If yes, please specify:
Cigarette: a- Number of cigarettes / day: | | | b- Number of years of smoking: | | |
Nargile: c- Number of nargile / week: | | | d- Number of years of tobacco: | | |
Are you an alcohol drinker?
1 □ Yes 2 □ No
If yes, please specify:
a- 1 □ Occasional or 2 □ Regular b- Number of glasses / day: | | |
c- Number of years of consumption: | | |
How do you rate your health?
1 □ Very good 2 □ Good 3 □ Fair 4 □ Bad 5 □ Very bad
a- Weight: | | Kg b-Size: | | | |
Do you exercise?
1 □ Yes, low intensity physical activity 2 □ Yes, moderate intensity physical activity 3 □ Yes, high intensity physical activity 4 □ No
If yes, how much time do you spend per week? | | hours
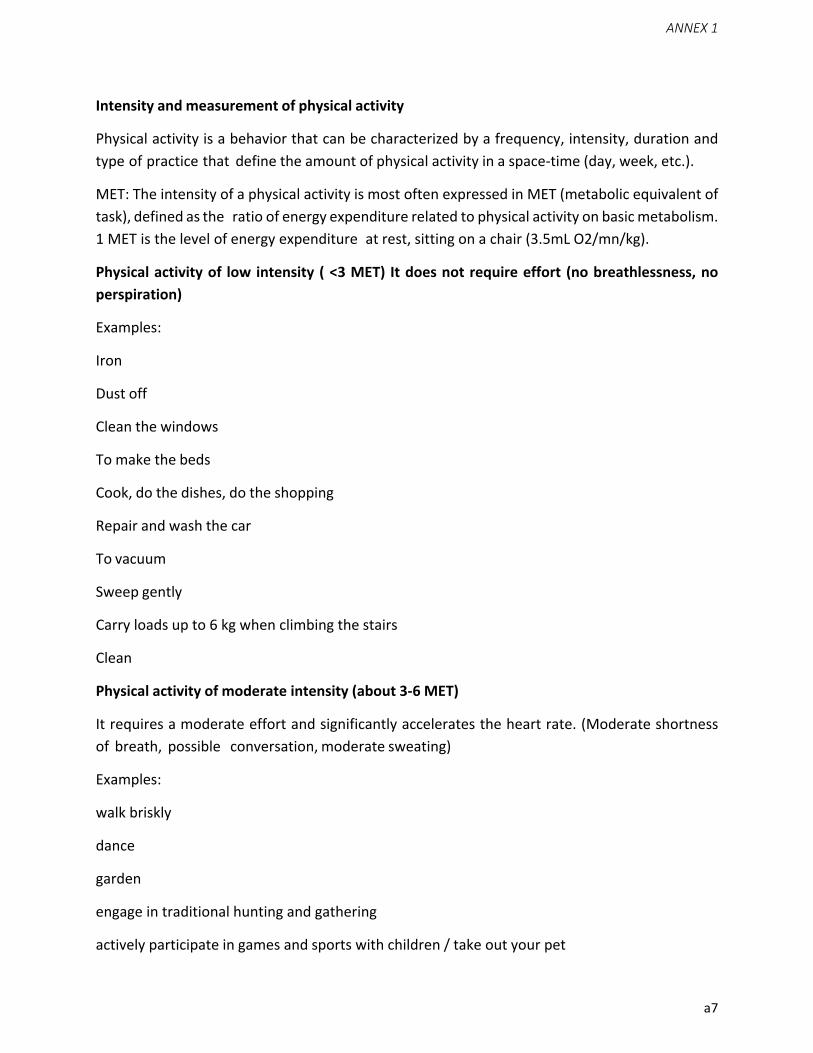
ANNEX 1
a7
Intensity and measurement of physical activity
Physical activity is a behavior that can be characterized by a frequency, intensity, duration and
type of practice that define the amount of physical activity in a space-time (day, week, etc.).
MET: The intensity of a physical activity is most often expressed in MET (metabolic equivalent of
task), defined as the ratio of energy expenditure related to physical activity on basic metabolism.
1 MET is the level of energy expenditure at rest, sitting on a chair (3.5mL O2/mn/kg).
Physical activity of low intensity ( <3 MET) It does not require effort (no breathlessness, no
perspiration)
Examples:
Iron
Dust off
Clean the windows
To make the beds
Cook, do the dishes, do the shopping
Repair and wash the car
To vacuum
Sweep gently
Carry loads up to 6 kg when climbing the stairs
Clean
Physical activity of moderate intensity (about 3-6 MET)
It requires a moderate effort and significantly accelerates the heart rate. (Moderate shortness
of breath, possible conversation, moderate sweating)
Examples:
walk briskly
dance
garden
engage in traditional hunting and gathering
actively participate in games and sports with children / take out your pet
ANNEX 1
a8
do crafts (For ex: roof repairs, painting)
lift / move loads <11kg
High intensity physical activity (approximately> 6 MET)
It requires a great effort, the breath is shortened and the heart rate accelerates considerably.
(Marked breathlessness, difficult conversation, heavy transpiration)
Examples:
run
walk briskly / climb at fast pace
ride a bike at high speed
do aerobics
swim at high speed
play sports and competitive games (For ex: traditional games, football, volleyball, hockey,
basketball)
doing hard work
lift / move heavy loads of 11 kg or more

ANNEX 2
a9
ANNEX 2: Toxicological data sheet for As

ANNEX 2
a10
Generalities
Arsenic is a chemical element with symbol As and atomic number 33.
It is a metalloid and a natural component of the earth’s crust. It is widely distributed throughout
the environment in the air, water and land. It is present in two forms, organic and inorganic,
where the inorganic arsenic, is the more toxic form (EFSA, 2009).
Arsenic occurs naturally as trace component in rocks and sediments. It is released into
groundwater due to these geologic sources and also as a result of human activities such as
mining, various uses in industry, in animal feed, and as a pesticide. In drinking-water supplies,
arsenic poses a problem because it is toxic at low levels and is a known carcinogen. The organic
and inorganic arsenic compounds may enter the plant food chain from agricultural products or
from soil irrigated with arsenic contaminated water (Ratnaike, 2003).
The primary use of arsenic is in alloys of lead (for example, in car batteries). Arsenic and its
compounds, especially the trioxide, is used in the production of pesticides, treated wood
products, herbicides, and insecticides (Naidu, R. et al. 2006). However, these applications are
declining due to the toxicity of arsenic and its compounds:
• Contaminated water used for drinking, food preparation and irrigation of food crops
poses the greatest threat to public health from arsenic.
• Long-term exposure to arsenic from drinking-water and food can cause cancer and skin
lesions. It has also been associated with cardiovascular disease and diabetes.
• The early childhood exposure, has been linked to negative impacts on cognitive
development and increased deaths in young adults.
• The most important action in affected communities is the prevention of further exposure
to arsenic by provision of a safe water supply.
• Industrial activities: Agricultural pesticides and herbicides. Paints, fungicides, insecticides,
wood preservatives, and cotton desiccants. Manufacture of semiconductors, light
emitting diodes, and components of lasers and microwave circuits, in the processing of
ANNEX 2
a11
glass, pigments, textiles, paper, metal adhesives, and ammunition Arsenic is present as a
contaminant in many traditional remedies.
• Arsenic is also used in the hide tanning process and, to a limited extent, in pesticides, feed
additives and pharmaceuticals. Arsenic trioxide is now used to treat acute promyelocytic
leukaemia.
• Combustion of fossil products.
The International Agency for Research on Cancer (IARC) has listed As as a human carcinogen since
1980. Terminology Arsenicosis is a chronic illness resulting from drinking water with high levels
of As over a long period of time. It is commonly known as As poisoning. Arseniasis means chronic
arsenical poisoning, also called arsenicalism; the term arsenicism refers to a disease condition
caused by slow poisoning with As. Arsenic exerts its toxicity by inactivating up to 200 enzymes,
especially those involved in cellular energy pathways and DNA synthesis and repair.
In addition, (Ferreccio et al., 2000), showed in their study a positive correlation between
ingestion of inorganic As and lung cancer in humans in Chile. It is already known that cigarette
smoking is a main risk factor for lung cancer.
Arsenic exposure
Arsenic toxicity is a global health problem affecting many millions of people (Ratnaike, 2003). In
Europe, the food is the main source of exposure to As for the population. EFSA opinion mainly focuses on
inorganic arsenic which can be found in groundwater (EFSA, 2009).
Arsenic exposure occurs:
• from inhalation
• By absorption through the skin
• By ingestion of contaminated drinking water and food
Arsenic in food occurs as relatively nontoxic organic compounds (arsenobentaine and
arsenocholine). Seafood, fish, and algae are the richest organic sources (Ratnaike, 2003).
ANNEX 2
a12
People are exposed to elevated levels of inorganic arsenic (toxic) through drinking contaminated
water, using contaminated water in food preparation and irrigation of food crops, industrial
processes, eating contaminated food and smoking tobacco.
A long-term exposure to inorganic arsenic, mainly through drinking-water and food, can lead to
chronic arsenic poisoning, neurotoxicity, skin lesions, cancers, diabetes, and glucose metabolism
change, and cancer.
Human exposure:
1. Inhalation exposure
People who smoke tobacco can also be exposed to the natural inorganic arsenic content of
tobacco because tobacco plants can take up arsenic naturally present in the soil. The exposure is
greater when tobacco plants were treated by lead arsenate insecticide. According to the
California Air Resources Board and the Department of Health Services in USA, 2020, smokers may
breathe between 0.8 to 2.4 µg of inorganic arsenic per pack of 20 cigarettes (with approximately
40 percent of it being deposited in the respiratory tract). Ferreccio et al.(2000), found arsenic
from tobacco and drinking water to have a synergistic effect.
2. Dermal exposure
Dermal contact when handling preserved wood products containing arsenic could result in
arsenic exposure. However, very little is known regarding the chemical form, conditions for
absorption, kinetics, or other information needed to make a statement regarding skin absorption
in specific populations. Toxic effects have been reported in the occupational literature from
splashes of arsenic trichloride or arsenic acid on worker’s skin (Garb and Hine 1977). The dermal
exposure may lead to illness, but to a lesser extent than ingestion or inhalation routes of
exposure.
Children who play on wood structures treated with CCA have increased likelihood of dermal
contact or ingestion of the arsenical through normal mouthing and play activities (“Guidelines for
ANNEX 2
a13
Carcinogen Risk Assessment Risk Assessment Forum U.S. Environmental Protection Agency
Washington, DC,” 2005).
3. Ingestion exposure via drinking-water and food
The greatest threat to public health from arsenic originates from contaminated groundwater.
The risk of As contamination is generally much higher in groundwater compared to surface water.
Inorganic arsenic is naturally present at high levels exceeding 10µg L-1 in the groundwater of a
number of countries, including Argentina, Bangladesh, Chile, China, India, Mexico, and the United
States of America. Drinking-water, crops irrigated with contaminated water and food prepared
with contaminated water are the sources of exposure (Kapaj et al., 2006).
Fish, shellfish, meat, poultry, dairy products and cereals can also be dietary sources of arsenic,
although exposure from these foods is generally much lower compared to exposure through
contaminated groundwater. In seafood, arsenic is mainly found in its less toxic organic form
(EFSA, 2009). High consumers of rice in Europe, such as certain ethnic groups, are estimated to
have a daily dietary exposure of inorganic arsenic of about 1 µg kg-1 b.w. per day
In food, cereal grains and cereal based products, food for special dietary uses, bottled water,
coffee and beer, rice grains and rice-based products, fish and vegetables were identified as
largely contributing to the inorganic arsenic daily exposure in the European population.
The temporary WHO guideline for As in drinking water is 10 µg L-1. On the basis of investigations
initiated by the National Academy of Sciences, it was concluded that this standard did not
eliminate the risks of skin, lung, and prostate cancer from long-term exposure to low As
concentrations in drinking water.
ANNEX 2
a14
Absorption
The exposure to arsenic occurs primarily through ingestion (mostly solid foods) and also through
inhalation and absorption through the skin. It is found in foods mainly in relatively non-toxic
organic form (arsenobentaine and arsenocholine).
Organic and inorganic arsenic compounds can enter the plant food chain from agricultural
products produced or from soils irrigated with contaminated arsenic water.
Metabolism
The organic compounds may lead to high levels of arsenic in the blood but are rapidly excreted
unchanged in the urine. The major site of absorption of As in the human body, is the small
intestine by an electrogenic process involving a proton (H+) gradient, where the pH is 5.0
(Ratnaike, 2003).
The arsenic intestinal absorption is considered as a complex process having several underlying
molecular pathways and mechanisms, and it all depends on the chemical form in which it is found
Calatayud et al., 2015).
The As in its both forms are absorbed, it undergoes hepat 14 haracterizatiion to form
monométhylarsonic acid and dimethylarsinic acid that are less toxic but not really safe (DJ.
Thompson, 1993, HV. Aposhian, 1997,(Ratnaike, 2003).
Distribution
After acute poisoning, the studies show that the highest concentration of arsenic is in the kidneys
and liver. In chronic arsenic ingestion, arsenic accumulates in the liver, kidneys, heart, and lungs
and smaller amounts in the muscles, nervous system, gastrointestinal tract, and spleen. Though
most arsenic is cleared from these sites, residual amounts remain in the keratin-rich tissues, nails,
hair, and skin. After about two weeks of ingestion, arsenic is deposited in the hair and nails.
ANNEX 2
a15
Elimination
Organic compounds cause raised arsenic levels in blood but are rapidly excreted unchanged in
urine.
The elimination of the toxic is done by the vomitings and the faeces, the urines, the pharenas and
the skin. For mineral compounds, it is quite slow for 15 to 40 days, vomiting and stool can
eliminate most of the poison at the time of ingestion. elimination of organic compounds,
introduced by the venous vein would be achieved in 48 hours.
Fifty percent of the ingested dose may be eliminated in the urine during three to five days.
Dimethylarsinic acid is the dominant urinary metabolite (60%–70%) compared with
monomethylarsonic acid. A small amount of inorganic arsenic is also excreted unchanged.
Toxicity in humans
Arsenic in drinking water can affect human health and is considered as one of the most significant
environmental causes of cancer in the world (WHO, 2018). Inorganic arsenic known as
carcinogenic found in water is highly toxic while organic arsenic found in seafood is less harmful
to health Chronic arsenic toxicity results in multisystem disease.
Health effects
• Acute effects
The acute arsenic poisoning is associated initially with nausea, vomiting, abdominal pain, and
severe diarrhea. Encephalopathy and peripheral neuropathy are also reported. The immediate
symptoms of acute arsenic poisoning include vomiting, abdominal pain and diarrhea. These are
followed by lack of feeling and tingling of the extremities, muscle cramping and death, in extreme
cases.
• Treatment: The elimination is done:
By gastric lavage as early as possible with pure or calcined magnesia.
ANNEX 2
a16
By hydroelectrolytic re-equilibration by serum glucose infusion. of sodium and
potassium.
By rehydration
By treatment of hepatic impairment by hepato-protectors.
• Long-term effects
Alcoholics are the most predisposed, the general action of the As is that of a cellular poison which
blocks the thiol groups of enzymes and proteins fixed on a radical R: it is a thioloprive body.
The first symptoms of long-term exposure to high levels of inorganic arsenic are usually observed
in the skin, and include pigmentation changes, skin lesions and hard patches on the palms and
soles of the feet (hyperkeratosis). These occur after a minimum exposure of approximately five
years and may be a precursor to skin cancer.
A long-term ingestion of inorganic arsenic may cause developmental effects, diabetes,
pulmonary disease, and cardiovascular disease. Arsenic-induced myocardial infarction, and may
cause mortality. Arsenic is also associated with adverse pregnancy outcomes and infant
mortality, with impacts on child health (Farzan). The exposure in early childhood has been linked
to increases in mortality in young adults due to multiple cancers, lung disease, heart attacks, and
kidney failure. In China, areas that have chronic arsenism also have increased levels of fluoride
in the drinking water. There are suggestions that the combination of the two could increase the
risk to human health due to potential synergism.
Numerous studies have demonstrated negative impacts of arsenic exposure on cognitive
development, intelligence, and memory (Tolins et al. 2014).
Classification of Cancer
• Skin Cancer
A significant relationship between As exposure and skin cancer has been observed. The arsenite
can play a role in the enhancement of UV-induced skin cancers. This element is associated with
cancers of skin and internal organs, as well as with vascular disease.
ANNEX 2
a17
• Bladder Cancer
In a U.S. study, there was an elevated risk of bladder cancer in smokers that were exposed to As
in drinking water near 200 µg L-1, compared with smokers consuming lower As levels. These data
suggest that As is synergistic with smoking at relatively high As levels (200 µg L-1). Bates M. et al.
(2004), highlighted that latency of As exposure causing bladder cancer can be very long (more
than 40 years).
• Lung Cancer
The mortality from lung cancer was significantly increased with increasing As ingestion
(Hopenhayn-Rich et al., 1998). In addition, As and cigarette smoke are synergistic, thus increasing
the risk of lung cancer. In a recent Taiwanese study, residents in arseniasis-endemic areas were
followed during an 8-year period.
An increased risk of lung cancer was associated with high levels of As exposure via drinking water.
The authors suggested that reduction in As exposure should reduce the lung cancer risk in
cigarette smokers.
The studies indicated that the mortality from lung cancer declined after the levels of As in the
well water were reduced.
WHO response
Arsenic is one of WHO’s 10 chemicals of major public health concern. WHO’s work to reduce
arsenic exposure includes setting guideline values, reviewing evidence, and providing risk
management recommendations. WHO publishes a guideline value for arsenic in its Guidelines for
drinking-water quality, these Guidelines are intended for use as the basis for regulation and
standard setting worldwide. The current recommended limit of arsenic in drinking-water is 10
μg L-1, although this guideline value is designated as provisional because of practical difficulties
in removing arsenic from drinking-water.
Risk characterization
Regarding the organic form of arsenic, there is no VTR available
ANNEX 2
a18
The EFSA, 2009, concluded that the overall range of BMDL01 values of 0.3 to 8 μg kg-1 b.w. per
day should be used instead of a single reference point in the risk characterization for inorganic
arsenic.
Non-carcinogenic effects of chronic arsenic ingestion have been detected at arsenic doses of the
order of 0.01 mg kg-1 per day and above as per EPA, 2000.
ANNEX 3
a19
ANNEX 3: Toxicological data sheet for Cd
ANNEX 3
a20
Generalities
It is a metal found in the earth’s crust (0.1mg kg-1). It is discovered by Fredrich Stromeyer in 1817,
has the symbol Cd and has an atomic number 48, an atomic mass 112.4 g mol-1, a melting point
321°C, and a boiling point 767°C. The pure cadmium is a soft and silver-white metal. This metal
is soluble in acids but not in alkalis, the cadmium chloride and cadmium sulfate are soluble in
water.
In the atmosphere the cadmium (CdO) may be present in dust or fumes, this metal can be used
in industries (metallurgy, electric batteries, paint pigments): oxide, chloride, sulphate, nitrate or
sulphide. It is well known that we can find this element in cigarette smoke as fine particles of
cadmium oxide, depositing mainly in the cells (ANSES, 2011). Cadmium oxide (CdO) may be
present in the atmosphere in the form of dust or fumes. This last term applies to particles
resulting mainly from the oxidation of Cd and which therefore have a finer granulometry than
the dust resulting from the setting suspension of cadmium oxide powder. it can be present as
effluents from many combustion processes such as waste incineration.
It is used in industrial and agricultural activities (phosphate fertilizer) as in Ni-Cd batteries,
pigments, coatings and veneer. (Morrow 2001). Cadmium contained in agricultural soils, due to
atmospheric deposition or direct application methods such as phosphate fertilizer application
and municipal waste composting (Morrow 2001), and water can be taken by certain crops and
aquatic organisms and accumulates in the food chain. In surface freshwater or groundwater,
outside polluted areas, the cadmium concentration is generally less than 1 μg L-1. While, in
France, the limit value for the concentration of cadmium in water intended for human
consumption is 5 μg L-1.
Cadmium levels in the soil, principally derived from natural sources, phosphate fertilizers and
sewage sludge will naturally impact upon this cadmium uptake of plant. However, this effect is
secondary to the type of crop grown and the agricultural practices followed with respect to
tillage, Aiming and crop rotation. Via the roots, the element cadmium entered the plants and
thus cadmium easily enters the plants through their roots and passes to the food chain.
ANNEX 3
a21
Exposure
The human may be exposed to cadmium through ingestion of food and drinking water or
inhalation of particulates from ambient air or tobacco smoke. The majority of cadmium may
enter the human body directly or indirectly from terrestrial foods (plants and meat from animals).
This element may be transferred to plant via absorption from the soil or via deposition on the
edible plant parts from the atmosphere.
In Lebanon, the exposure level may be even higher in light of the increased pollution due to the
garbage crisis that started in 2015 (Azar et al., 2016)
As per(Nasreddine et al., 2006), and following a study on the dietary exposure of an adult urban
population to three heavy metals (lead, cadmium and mercury) and to radionuclides, the average
dietary intakes of cadmium is 17 percent, of the appropriate provisional tolerable weekly intakes
(PTWI).
Routes of exposure
Oral exposure
1. Via food
For nonsmokers, food is the major source of cadmium exposure (NTP, 2005). The main source of cadmium
exposure in human is diet especially the cadmium-rich diets such as fruits, vegetables, cereals, shellfish,
crustaceans, oysters, scallops, mussels, offal and others. In addition, rice is considered as the most
accumulating crop with high concentrations of cadmium if grown on cadmium-polluted soil.
2. Via drinking water
Cadmium exposure from drinking-water is relatively non important compared to diet exposure.
However, impurities in the zinc of galvanized pipes and solders in fittings, water heaters, water
coolers and taps can sometimes lead to increased cadmium levels in drinking water.
ANNEX 3
a22
Absorption
A small amount of the cadmium in food and water (about 1–10%) will enter the human body
through the digestive tract. If there is not enough iron or other nutrients in the diet, the cadmium
is taken from the food more than usual.
The form in which cadmium is present in food, affects the cadmium absorption (Crews et al.,
2000). A high cadmium level presents in food and drinking water will severely irritate the
stomach, and lead to vomiting and diarrhea, and sometimes death. The estimated cadmium
absorption ranged from 1.1 to 10.6% (Vanderpool and Reeves, 2001).
The unabsorbed cadmium is retained in the gastrointestinal tract where some may be trapped in
the intestinal mucosa without passing into the blood or lymph. While the absorbed cadmium is
first transferred to the liver through the blood where it is bond to proteins to form complexes
that are transported to the kidneys. Once it is accumulated in kidneys, it damages filtering
mechanisms and kidney.
A small quantity of cadmium absorbed for a long period, may lead to a build-up of cadmium in
the kidneys which may cause damage of kidneys, or allows the bones to become fragile and break
easily. The severity of bone effects increased after menopause.
The level of absorption depends on the type of absorption: 2% to 6% of the cadmium ingested is
actually taken up into the body (ATSDR 1997), in contrast 30% to 64% of inhaled cadmium is
absorbed by the body.
In conclusion, the kidney and liver are the two specific target tissues in which cadmium
accumulates. It can be also accumulated in muscles.
The daily intake of cadmium is generally between 10 and 35 μg (generally less than 20 μg). Since
January 2009, the European Food Safety Authority (EFSA) has set a lower tolerable weekly intake
(DHT) of cadmium than in the past, equal to 2.5 μg kg-1 of body weight per week, while set by
JECFA, joint FAO/WHO committee is 7 μg kg-1 body weight per week. Depending on the food the
absorption rate is between 1 and 10%.
According to EFSA, the exposure rate of certain subgroups such as vegetarians, children, smokers
and people living in heavily contaminated areas could reach more than twice the DHT.
Distribution
ANNEX 3
a23
Most of the cadmium that enters the human body goes to kidney and liver where they can remain
for long time.
In human body, the cadmium is mainly accumulated in the liver and kidneys and in other tissues
particularly muscle, skin, and bone.
Systemic cadmium is widely distributed in the body, knowing that at birth, cadmium levels in the
liver and kidneys are almost zero. In human life, the cadmium levels in the kidneys increase
progressively up to the age of 50-60 years, with an average level of –0 - 50 μg g-1, then stabilize
or decrease slightly. While, in the liver, the cadmium levels increase rapidly to–1 - 2 μg g-1 at
20-25 years of age, then increase much more slowly thereafter (ATSDR, 2008).
The most dangerous characteristic of cadmium is that it accumulates throughout lifetime. The
cadmium coming from the lung or the gastrointestinal tract is transported in blood plasma. In
the blood plasma, it bounds to albumin. Cadmium bound to albumin is preferentially taken up by
the liver. In the liver, cadmium induces the synthesis of metallothionein and a few days after
exposure metallothionein-bound cadmium appears in the blood plasma. Because of its low
molecular weight, cadmium-metallothionein is efficiently filtered through the glomeruli and
thereafter taken up by the tubules
Metabolism
The preferred complexing agents of cadmium are metallothioneins (MT) which are low molecular
weight proteins rich in cysteine and containing sulfhydryl groups. MTs are synthesized in the liver,
kidneys and also other organs, including the intestines and lungs [OEHHA, 2006]. The cadmium
can be transported in the blood by forming bound to MTs, albumin or erythroytes. The small size
of Cd-MT complex in the kidneys facilitates the passage of cadmium through the glomeruli to the
renal tubules where it easily penetrates by pinocytosis into the tubular cells by binding in
particular to apical megalin and cubilin. Pinocytosis vacuoles fuse with lysosomes whose enzymes
degrade TM and release cadmium. Cadmium then recombines with MTs synthesized by tubular
cells and can accumulate in the kidneys, in non-toxic complexed form, for several decades
[OEHHA, 2006]. As it is absorbed, cadmium continues to accumulate in the kidneys until the renal
MT is saturated. Free residual cadmium then causes lesions in the tubular cells (ANSES 2012).
ANNEX 3
a24
Retention
The largest proportion of retained cadmium is that inhaled, compared to the ingested one. It is
estimated that 42% of a cadmium is retained in the body 5 days after exposure (as per analysis
of fecal excretion.
Women aged 53 to 64 are at the same time most sensitive to the retention of cadmium (which
seems to decrease slightly) and osteoporosis (Hood, 2006). (Ernie Hood, « Putting a Load on Your
Bones: Low-Level Cadmium Exposure and Osteoporosis » [archive] Environ Health Perspect.
2006;114(6): A369–A370).
Elimination and excretion
Most cadmium ingested is not absorbed and is excreted in the feces. Although oral absorption of
cadmium is lowest, after ingestion more than 90% of the cadmium is contained in the feces.
Intestinal elimination of ingested labeled cadmium takes several days, weeks or months,
indicating retention. Cadmium in intestinal mucosal cells gradually evacuated by the fecal route
[OEHHA, 2006]. Absorbed cadmium is excreted very slowly, with urinary and fecal excretion.
Toxicity
Cadmium, a well-known human carcinogen, can lead to renal disease, bone loss, and has a
detrimental effect on cognitive ability (Cao et al., 2009; Jeong et al., 2015; Kippler et al., 2012;
Sanders et al., 2015; Tian et al., 2009).
Human exposure to toxic chemicals is suspected of being responsible for a wide range of human
health disorders. The kidney is the critical target organ of cadmium, due to excessive
accumulation of cadmium in the kidneys it may cause also other health effects such as: stomach
problems, bone demineralization, reproductive failure and even infertility, damage in the central
nervous system, immune system and respiratory system also possibly of DNA damage or cancer
development (OSHA, 2013).
ANNEX 3
a25
They are characterized by degeneration of the proximal tubules and urinary leakage of molecular
proteins that can be translated by various signs of proximal tubular involvement such as:
enzymuria, aminoaciduria, glycosuria, hypercalciuria, hyperphosphaturia.
At a later stage, tubular involvement extends to the distal tubule, and glomerular involvement
can be observed. In the case of severe intoxication, the lesions produced can lead to kidney
failure.
Urinary phosphor-calcium leakage can lead to bone involvement that results in osteomalacia and
predominant demineralization in the pelvis, which is the site of bone fissures and spontaneous
fractures. More recent data on human exposure to cadmium in the general population have been
associated with an increased risk of prostate cancer, kidney bladder, breast, uterus and testis.
In the European Union, certain inorganic cadmium derivatives are known to be toxic to human
fertility and fetal development and have a possible effect on human fertility and development
fetal (Exposure of the French population to environmental chemical Institute for Public Health
Surveillance). Several studies have found significantly higher cadmium body burdens in women
with lower iron stores (Kippler et al. 2009).
Cadmium genotoxicity
Palus et al. (2003) noted from their study of workers occupationally exposed to cadmium that
there are statistically significant increases in micronucleus levels and sister chromatid exchanges,
as well as DNA fragmentation. And moreover, people living in polished areas showed an increase
in lymphocyte micronuclei and severe chromosomal aberrations.
Carcinogenic effects in humans
In 1993, IARC has classified cadmium and its compound as cancerogenic for lung especially for
workers exposed to cadmium. Although, as per Sorahan & Esmen (2004), a significant increase in
cases of cancer of the pharynx was noticed with cumulative exposure to cadmium.
An increase in mortality rates from lung cancer was detected in case of individuals who worked
in the Ni–Cd battery-producing industry.
ANNEX 3
a26
A hospital-based case control study using cadmium measurements in toenails (Vinceti et al.,
2007) showed a odds ratio significantly increased at the highest concentrations. A nested case-
control study in a cohort did not find this association, using the same biological sample taken at
baseline as the exposure measure (Platz et al.2002).
A cancer of the pancreas has been noticed in 2006 by Kriegelet al.
In other hand, this metal has recently been shown to be an endocrine disruptor because of its
estrogenic abilities at extremely low doses like other metals such as mercury and lead.
In animals, lead, cadmium, arsenic, mercury, zinc or nickel, can also induce endocrine disruption
(Iavicoli et al., 2009; Bogdan et al., 2011). Cadmium in the blood produces in female rats the
growth of the mammary glands, as well as an increase in the weight and size of the uterus. In
rats’ cadmium disrupts the hormonal system.
Risk characterization
The World Health Organization (W–O - ENHIS, 2009) has established a provisional tolerable
weekly intake (PTWI) for cadmium at 7 µg kg-1 of body weight, this PTWI weekly value
corresponds to a daily tolerable intake level of 70 µg of cadmium for the average 70 kg man and
60 µg of cadmium per day for the average 60 kg woman. In 2009, EFSA proposed a tolerable
weekly intake of 2.5 μg kg-1 bw per week using a Benchmark Dose (BMD) approach modeling the
dose-response relationship between urinary cadmium and excretion of beta-2 urinary
microglobulin (EFSA, 2009). This notice relates to the construction of VTRs for cadmium and its
compounds in relation to repeated exposure by inhalation.
According to the JECFA, a PTWI of cadmium is calculated on the assumption that 5% of all the
dietary cadmium is absorbed and is proposed to be applied to long-term consumption. This PTWI
is established to be 0.007 μg g-1 bw for cadmium per week (Obeid P. et al., 2014).
The U.S. Environmental Protection Agency (EPA) established a reference dose of food intake of
cadmium of 0.001 μg g-1 bw per day, and the limit of intake of cadmium through drinking water
of 0.0005 μg g-1 bw per day. Such difference of intake of reference doses between food and water
is due to the difference in the levels of absorption of cadmium (EFSA, 2009).
ANNEX 4
a27
ANNEX 4: Toxicological data sheet for Co
ANNEX 4
a28
Generalities
Cobalt is a chemical element having a symbol ”Co" and atomic number 27. It was discovered in
1730 (Moreno-Rojas et al., 2016) and can be naturally present in the environment. The cobalt
exists in different forms: Co2+, Co3+, the first form being the most stable. Cobalt is an essential
biochemical element in the body, Co is a component of vitamin B12 (ATSDR 2004). It has been
identified in high levels in liver, and also in muscles, lungs, lymph nodes, heart, skin, bones, hair,
stomach, brain, kidneys, plasma, and bladder of unexposed subjects (INRS 2015).
It is also used in processing of ores such as nickel and copper, in manufacturing of rechargeable
batteries, aircraft engines, and parts for gas turbine engines. In addition, it can be used in
cemented carbides and diamond tools, in animal feed additives, drying agents for inks, paints
and varnishes dyes and pigments, glass bleaches, floor coverings for enameling porcelains,
humidity indicators, magnetic recording media, rubber adhesion promoters for radial steel belt
tires and vitamin B12 (B. Shedd, 2013).
Human exposure
Exposure of the general population to cobalt is mainly dietary.
Via the food
Cobalt is present in high levels in chocolate, shellfish, dried fruits and oilseeds and pasta (EFSA,
2009). The element Co is known to be a component of vitamin B12, the major dietary sources of
vitamin B12 being animal products such as meat (especially liver), fish, poultry, seafood, milk,
cheese and eggs.
Naturally, food containing cobalt, according to Biego et al. (1998) is supplied by dairy products
(32%), fish and seafood, crustaceans (20%), oils, sugars and condiments (16%) and plant products
(9%) (AFFSA, 2009).
ANNEX 4
a29
Via the drinking water
Concentrations in water vary with region, there are no regulations concerning cobalt levels in
drinking water. In 1991 the International Agency for Research on Cancer (IARC) estimated from
samples of uncontaminated water, that the cobalt concentration was in the order of 1 -10
μg L-1. In the United States, cobalt concentrations measured in drinking water are generally less
than 1-2 μg L-1 (ATSDR, 2012).
Absorption
The gastrointestinal absorption of soluble cobalt compounds such as cobalt chloride is greater
than that of insoluble compounds such as cobalt oxide (Lauwerys & Lison, 1994). the water-
soluble cobalt salts are rapidly absorbed from the small intestine (Leggett, 2008). After
absorption of Co2+, the level of cobalt concentration in blood and serum is high in the beginning
and then decreases rapidly and gradually, due to tissue uptake, mainly in liver and kidney, and
excreted by urine or feces (Simonsen et al., 2012).
The Co is absorbed orally into the gastrointestinal tract at a rate varying between 5 and 45%
(Lauwerys & Lison, 1994). The oral absorption varies and depends on the iron concentrations,
the sex, the dose, the solubility of the compound and the nutritional status of the individuals.
Thus, an iron deficiency will affect the absorption since the latter regulates the expression of
carriers in the intestine and therefore a deficiency will induce an increase in the absorption of
cobalt diet (INVS, 2016), ATSDR 2004). In addition, cobalt absorption is higher in women
compared to men studies (Dominique Lison, 2015).
Cobalt is accumulated primarily in liver, kidney, pancreas, and heart. It does not appear to
accumulate with age (AFSSA 2002).
Distribution
After it is breathed in or eaten, some of it leaves the body quickly in the feces.
ANNEX 4
a30
Metabolism
In human body, the tissue partitioning and biokinetics of cobalt in cells and tissues are closely
related to the uptake of calcium with cobalt partitioning primarily into tissues with a high calcium
turn-over, and with cobalt accumulation and retention in tissues with a slow turn-over of the
cells. In the human red cells, the membrane transport pathway for cobalt (Co2+) uptake appears
to be shared with calcium (Ca2+) (Simonsen et al., 2011).
Elimination
In human body, most cobalt is eliminated by the urinary route and to a lesser extent by the fecal
route (Lauwerys & Lison, 1994). Urinary excretion is independent of the dose and solubility of
the compounds, whereas fecal excretion is proportional to the dose (INRS, 2016). The elimination
is depending on the route of exposure, the dose and type of cobalt, and nutritional status (ANSES
2013).
After ingestion of cobalt dichloride, the elimination is mostly fecal. The fecal excretion is
proportional to the dose, whereas urinary excretion is independent of the dose and solubility of
the compounds (Health Canada, 2011).
The renal excretion is initially rapid but decreasing over the first days with retention in tissues for
several years (Lauwerys and Lison, 1994; Mosconi et al., 1994). During the first 24h, 40% was
eliminated, increasing to about 70% after a week. However, after 1 month about 20% was
retained and about 10% after 1 year, with the possibility that this amount of cobalt is
permanently retained (Simonsen et al., 2012).
Toxicity
Acute toxicity
The ingestion of cobalt may lead to cardiomyopathie, respiratory effects, gastrointestinal effects,
vomiting and nausea. It can also cause death for important doses (IARC, 2005).
ANNEX 4
a31
The toxic effects may occur after exposure to very high concentrations or following long-term
chronic exposure to low concentrations of cobalt (Cámara-Martos & Moreno-Rojas, 2016).
Genotoxic toxicity
Cobalt particles can affect the integrity of DNA both by production of activated species of oxygen
and by inhibiting the excision repair system (ANSES 2013). It can cause chromosomal aberrations
in vivo and in vitro. A DNA breakage is induced by cobalt metal. The genotoxicity is attributed to
oxidative stress and oxidative damage to DNA (Green et al., 2013). Similarly, cobalt can induce
apoptosis by changing morphology and DNA fragmentation (De Boeck, Kirsch- Volders, & Lison,
2003). An oxidative DNA damage, leads to a pulmonary mutation that will contribute to an
apparition of cancer (Behl et al., 2015).
Carcinogenic Toxicity
The element cobalt has been clearly identified as the cause of respiratory diseases especially
when is in metallic form (Lison et al. 2001). The inhalation of cobalt in industries appears to
increase the risk of lung cancer and especially during chronic exposure to tungsten carbide-
related cobalt (ANSES, 2013); This complex is classified according to IARC as probably
carcinogenic to humans (category 2A) whereas cobalt alone is classified as possibly carcinogenic
to humans (category 2B) (Suh et al., 2016). Similarly, a higher risk of cervical cancer is observed
in women working in a cobalt-containing environment, but these studies remain inconclusive
(Cámara-Martos & Moreno-Rojas, 2016).
Risk characterization
The average exposure is estimated at 0.18 μg g-1 bw per day in adults (0.–7 - 0.21) and 0.31 μg
kg-1 bw per day in children (0.29-0.36) in Europe.
The TDI limit (1.6 μg kg-1 bw per day) in adults following an experimental study on rodents (ANSES
2009).

ANNEX 5
a32
ANNEX 5: Toxicological data sheet for Cr
ANNEX 5
a33
Generalities
The element Chromium (Cr) was discovered in 1798 by the French chemist Vaquelin in Siberian
red lead ore (M. Costa et al. 1997). Chromium is a natural metallic element of the Ea’th's crust
with symbol ”Cr" and atomic number 24. It is the first element in group 6. The name of the
element is derived from the Greek word chrōma, meaning color, because many chromium
compounds are intensely colored. The term "total chromium" refers to trivalent and hexavalent
compounds.
The Chrome III (trivalent) and Chrome VI (hexavalent) compounds are found in the environment.
The industrial discharges are the main cause of the presence of the chromium VI (INERIS, 2005,
ATSDR, 2012). Chromium metal is of high value for its high corrosion resistance and hardness.
In the United States, trivalent chromium Cr (III) ion is considered an essential nutrient in humans
for glucides and lipid metabolism and to potentialize the insulin action. It is also designated an
essential nutrient in Japan and for adults in France (ANSES, 2011). However, in 2014, the
European Food Safety Authority, acting for the European Union, concluded that there was not
sufficient evidence for chromium to be recognized as essential.
While chromium metal and Cr(III) ions are not considered toxic, hexavalent chromium (Cr(VI) is
toxic and carcinogenic ( group 1, IARC, 1990) .
The chromium VI in the environment comes mainly from the industries that use it. It can be
rejected:
in the atmosphere (industries, or by re- suspension from soils) in waters (industries, soil erosion,
atmospheric deposition, sewage treatment plants) in soils (spreading of sewage sludge,
fertilizers, atmospheric deposition) (INERIS, 2005, 2010).
Although naturally occurring Cr (VI) is rarely found in the environment, its presence in ground
and surface waters, as a consequence of oxidation of Cr (III)-bearing minerals by Mn (IV) oxides,
has been reported recently (Scancar 2014).
ANNEX 5
a34
Production and use of Chromium
• 90% of chromium are used in the production of stainless steels, special steels and alloys
(INERIS, 2011).
• Chromium is also used in chemical industry, in metal or plastic surface treatments, in
wood industry (conservation), in the production of pigments and dyes (dyes, paints,
cosmetics, ceramics, etc.) (INERIS, 2011).
• Leather tanning (INERIS, 2011).
• In the manufacture of magnetic tapes, the manufacture of vitamins K (INERIS, 2011).
Human Exposure to Chromium VI
Exposure of the general population to total chromium is mainly oral following absorption of food
and drinking water. Chromium VI is not intended to accumulate in fish and plants (INERIS, 2005),
but according to (WHO, 2011), the main source of exposure to total chromium is food, of which
drinking water. This tap water, however, represents less than 1% of the total daily dietary
exposure to chromium, according to (ANSES, 2012). The French agency also states that among
adults, the majority contributors to chromium intake are bread (8%), dry bakery products (5%)
and alcoholic beverages (5%). In children, the majority contributors to chromium intake are milk
(9%) and pasta (6%). The share represented by chromium VI could not be identified in these data.
People living near plants emitting chromium VI into the atmosphere may be exposed to this
compound by inhalation. Smokers are also exposed to chromium VI by this route as long as a
cigarette contains it. Indoor air in smo’er's homes contains 10 to 400 times more chromium than
in outdoor air (ATSDR, 2012).
Oral Exposure
1. Via the food
We lack data on the presence of CRVI in the food and it is considered that food is by and large
reducing medium and that oxydation of CR III to CRVI would not be favored (EFSA, 2014).
ANNEX 5
a35
2. Via the drinking water
In contrast, water intended for human consumption is usually treated with different oxidizing
agents to make it potable, then it would promote the presence of CR (VI) over the trivalent form.
Occupational exposure
The respiratory route is the main route of occupational exposure to chromium VI. Indeed, people
working in the aforementioned industries, especially metallurgies and tanneries, are likely to be
exposed to this compound by inhalation: chromium VI can be found in fumes or dusts from
industrial processes using it (ATSDR, 2012, INRS, 2009, INERIS, 2005).
Absorption
At human dietary exposure levels chromium absorption is relatively low (< 10 % of the ingested
dose) and depends on its valence state and ligands. Most of the ingested Cr(VI) is considered to
be reduced in the stomach to Cr(III), however, Cr(VI) is able to cross cellular membranes( efsa ,
20014) . The interconversion of Cr(VI) to Cr(III) will be of relevance for risk assessment since, ,
Cr(VI) compounds are much more toxic than Cr (III) compounds.
Distribution
In humans, the hexavalent Cr exposure, after inhalation or ingestion, can have systemic effects
that are distant from the site of exposure. the Cr VI is known as isostructural with sulfate and
phosphate at physiological pH, it can be carried throughout the body and even into the brain. It
is a competition between the extracellular reducing capacity and the uptake of chromate by cells.
If the exposure is high, the levels of Cr VI may be elevated in many different organs. Depending
on the genetic susceptibility of an individual, this could pose a significant risk of cancer induction
in any organ.
In the United States, autopsy studies indicate that chromium concentrations in the body are the
highest in kidney, liver, lung, aorta, heart, pancreas, and spleen at birth and tend to decrease
with age. The levels in liver and kidney declined after the second decade of life. The aorta, heart,
ANNEX 5
a36
and spleen levels declined rapidly between the first 45 days of life and 10 years, with low levels
persisting throughout life. The level in the lung declined early, but increased again from mid-life
to old age (Schroeder et al. 1962).
Elimination
Chromium may be transferred to infants via breast milk as indicated by breast milk levels of
chromium in women exposed occupationally (Shmitova 1980) or via normal levels in the diet
(Casey and Hambidge 1984). It has been demonstrated that in healthy women, the levels of
chromium measured in breast milk are independent of serum chromium levels, urinary
chromium excretion, or dietary intake of chromium (Anderson et al. 1993, Mohamedshah et al.
1998), but others (Engelhardt et al. 1990) have disputed this observation.
Chromium toxicities
Reproductive/Developmental Effects:
Chromium VI
Few studies have shown that there are reproductive effects in humans exposed by inhalation to
chromium (VI), which can lead to complications during pregnancy and childbirth.
Oral studies have reported serious developmental effects in mice, such as reproductive
abnormalities and effects, including reduction in litter size, reduction in sperm count and
degeneration of the outer cell layer of the seminiferous tubules.
Chromium III
There is no information available on the effects of chromium (III) on reproduction or
development in humans. In addition, a study conducted in mice fed high levels of chromium (III)
in their drinking water didnt show a lear idea for reproductive effects, although various
characteristics of the study preclude a definitive conclusion.
ANNEX 5
a37
No developmental effects were reported in the offspring of rats fed chromium (III) during their
period of development.
Carcinogenic effects in humans
Chromium VI was first recognized as a nasal carcinogen in Scotland in the late 1800s among
chrome pigment workers. It is classified as a certain carcinogen for humans (IARC, 19–0 - US EPA,
1998) only during exposure by inhalation.
This classification was mainly based on studies carried out on worker populations (ANSES 2012,
IARC 2012). In humans, the associated cancer is that of the lungs. Some data also imply an
increase in nasal cancers and sinuses (IARC, 2012).
However, the relationship is no longer linear at low doses since chromium VI is transformed into
chromium III in the stomach, then current scientific data do not allow to conclude on the link
between exposure to chromium VI and these cancers in humans (IARC, 2012).
Carcinogenic effects in animals
In rodents, the exposure to high doses of oral chromium VI has been able to show an increase in
stomach, intestines and oral cavity cancers (WHO, 2011, ASTDR, 2012, IARC, 2012); hepatic and
gastrointestinal effects have been observed (US-EPA, 2010, ANSES, 2012, ATSDR, 2012).
However, the relationship is no longer linear at low doses since chromium VI is transformed into
chromium III in the stomach, current scientific data do not allow to conclude on the link between
exposure to chromium VI and these cancers in humans (IARC, 2012). the ATSDR also reports
effects on reproduction in animals.
Other toxic effects (for chronic exposure)
• Respiratory exposure to Cr VI: Irritation of the nasal mucosa, asthma, cough, shortness of
breath, wheezing and to the development of chromium allergies.
• Oral exposure to Cr VI: In humans, chronic exposure to chromium VI via drinking water
causes gastrointestinal effects (mouth ulcers, diarrhea, abdominal pain, dyspepsia and
ANNEX 5
a38
vomiting) and hematological effects (anemia, leukocytosis and immature neutrophils)
(ANSES, 2012).
The chronic exposure to chromium VI via drinking water causes gastrointestinal effects (mouth
ulcers, diarrhea, abdominal pain, dyspepsia and vomiting) and hematological effects (anemia,
leukocytosis and immature neutrophils) to human (ANSES, 2012).
Risk characterization: Chromium VI
Knowing that the toxicity of Cr VI comes mainly from food consumption, in France, ANSES did not
create a VTR but, as part of a health risk assessment (ANSES, 2012), selected the following values
for oral exposure:
• For non-carcinogenic effects (threshold effects): 1 μg kg-1 bw per day, (as ATSDR in 2008,
US-EPA in 2010 and WHO in 2011).
• For carcinogenic effects (no-threshold effects): 0.5 (mg kg-1 bw per day, (such as OEHHA
* in 2011, US-EPA in 2010 and WHO in 2011).
Recent developments
In 2012, ANSES assessed the risk of exceeding the threshold values in drinking water (50 μg L-1)
and drew the following conclusions: In order to protect the health of the population, the
maximum concentration of chromium VI in drinking water should be of the order of 6μg L-1
(provisional objective). However, given the current analytical difficulties of such low chromium
VI measurements, the agency proposes to measure total chromium in first intention and
chromium VI if the limit is exceeded (6 μg L-1). ANSES also asks to be able to determine exactly
the share of exposure attributable to water in relation to food. This share is known (1%) for total
chromium, but not for chromium VI. This would make it possible to define whether priority
actions should focus on food or drinking water.

ANNEX 6
a39
ANNEX 6: Toxicological data sheet for Pb
ANNEX 6
a40
Generalities
Lead is a greyish blue metal, malleable and conductive. It is widespread throughout the
environment. It can be present in two different forms: organic and inorganic.
The element lead is used in gasoline, aviation fuel, acid batteries for motor vehicles. However,
also it can be in many other products, such as pigments, paints, solder, stained glass, lead crystal
glassware, ammunition, ceramic glazes, jewelry, toys and in some cosmetics and traditional
medicines. In addition, the drinking water delivered through lead pipes or pipes joined with lead
solder may contain lead. Much of the lead in global commerce is now obtained from recycling.
Human exposure
Oral exposure
1. Via the food
The most important pathway whereby atmospheric lead enters the food chain is thought to be
direct foliar contamination of plants. The air deposits raise the level of lead in soil, may result in
an increased uptake of lead through the roots.
In addition, there is another source of lead in diet which is food containers, containing lead such
as storage in lead-soldered cans which is banned actually in EU, ceramic vessels with lead glazes
and leaded crystal glass which is strictly regulated under EU legislation related to food contact
materials. Lead solder detected in can will eventually leach into the food product (Food safety,
2009).
Cereal products, potatoes, cereal grains (except rice), leafy vegetables and water are the most
contributors of lead in Europe. Depending on the country but six categories (beverages; cereals
and fine bakery wares; fruits and vegetables; salts, spices, soups and sauces; sweeteners, honeys
and confectionery; meat and its products) contributed most to lead dietary exposure,
contributing close to 83 % (Leblanc et al., 2005).
The most contaminated foods are crustaceans, mollusks, and offal. Noting that, bread and rusks,
soups, vegetables, fruits, drinking water, non-alcoholic beverages, sugars and derivatives are
considered as lead carriers (INVS, 2006). In Lebanon, the food groups that contributed most to
the dietary intake of lead were cereals and cereal-based products (45.3%), vegetables and
ANNEX 6
a41
potatoes (17.6%), drinking water (16.2%), and fruits and fruit juices (9.9%) (Nasserdine et al.,
2006).
In a published study of lead exposures in Lebanese adult urban populations (Nasreddine et al.,
2006), the exposure assessment was performed using a TDS approach, as recommended by
(WHO, 1996). Five “total diets” were collected during 2003–2004, it was noticed that the average
concentrations of lead in different food groups (bread and toast, biscuit and toast, rice, pizza,
pasta, cakes, fruits, vegetables, potatoes, cheese, milk, yogurt, meat chicken and others) was
ranged between 2 and 35 µg kg-1. The highest concentrations were observed in cereal-based
products such as breads, pastries and pizzas, while the lowest concentrations were found in
yoghurt-based products, potatoes and rice.
Via Drinking-water
Lead pipes used for household drinking water can contaminate water. The Drinking Water
Directive, as recommended by WHO in 2013, sets a limit of 25 μg L-1 for lead in drinking water,
while it is 10 μg L-1 for the EPA. In Lebanon, a study of Total Diet Study performed in 2006, it was
shown that the lead concentration mean in drinking water samples was 3.0 µg kg-1, far less than
the range of lead concentration in food (2 to 35 µg kg-1) (Nassredine et al., 2006).
According to the infant total diet study published by ANSES in France in 2016, drinking water
contributed at about 14% of the average lead exposure in children aged 13 to 36 months.
Absorption
Pb can be absorbed by the body through ingestion (Moore et al.,1980) and transmitted through
the placenta (Angell et al., 1982). Indeed, the rate of absorption by the human body is often
directly related to the chemical form and especially the solubility of the chemical species
considered (Pichard, 2000).
The bioavailability of lead depends on its solubility in the gastrointestinal tract with an estimation
of 15 to 20 % for adults (SKER and Bergdahl, 2007). There is an age dependency in lead absorption
(rat pups absorb 40 to 50 times more than adult rats via the diet (EFSA, 2009). Pregnant woman
ANNEX 6
a42
and children absorb lead after ingestion much greater (70% of the amount of lead ingested) than
adults (20%) (ATDSR, 2000). Furthermore, nutritional iron status affects lead absorption leading
to an increase when deficient, the same with a calcium deficiency (Ziegler et al., 1978 and EFSA,
2009).
Distribution
After lead absorption, the lead passes into the blood before reaching tissues. In the human blood,
lead is found mainly in red blood cells (99%) and only 1% in plasma. Lead is rapidly mobilized by
erythrocytes and then distributed in all soft organs. Lead enters a rapidly replenishing biological
reserve and is distributed in the soft tissues (blood, liver, lungs, spleen, kidneys and bone
marrow), or slowly renewed, and is then released into the body. Blood lead concentration is
therefore a good indicator of exposure from any source. Blood lead represents approximately 2%
of the total body pool. Lead is a cumulative toxicant distributes in the liver, kidneys, pancreas,
ovaries, spleen, heart (Moore et al., 1977).
In the absence of a significant pathway of excretion, more than 90% of the absorbed lead is
redistributed and fixed in the bones, where it accumulates, indeed in human adults 90 % of the
total body burden of lead is found in the bones.
In contrast, concentrations in soft tissues are relatively constant (Barry, 1975). During
breastfeeding, maternal lead can be transferred to infants and can contribute to lead infant blood
between 40-80 % (Gulson et al, 1998). The most recent studies were performed in Mexico with
a lead content in breast milk reaching 0.0011 mg L-1 (Ettinger et al., 2004). An Austrian study
estimated a mean lead content of 0.0016 mg L-1 in breast milk (Gundacker et al., 2002).
Formula concentrates but also water can contribute to the lead content in ready-to-consume
infant formula. Lower and upper bound lead content in ready-to-consume infant formula were
calculated to be 0.0020 and 0.0047 mg kg-1, respectively then infant formula might contain up
more lead than breast milk (EFSA, 2009).
ANNEX 6
a43
Metabolism
Once assimilated, lead is quickly present in the bloodstream (Bergeson, 2008). Then, it settles in
the bones and teeth. Only a small amount of lead accumulated in the bones will be released and
gradually eliminated in the urine.
The distribution of lead varies with the mode of absorption. In case of digestive absorption,
hepatic and intestinal levels are three times higher than by pulmonary route (INSERM, 2006).
In the brain, lead easily passes the blood-brain barrier, it enters the brain very quickly, but this
absorption is inhibited in the presence of albumin, cysteine or EDTA.
In bones, lead has been shown to inhibit osteoblastic activity by reducing osteocalcin synthesis
(Long et al., 1990, Markowitz et al., 1988, Klein and Wirren, 1993), leading to morphometric or
densitometric changes.
Teeth are known also to be a lead storage site, mainly at the dentine level, in areas adjacent to
the pulp. In case of pregnant women, lead passes through the placenta in the first trimester and
gives approximately the same maternal and umbilical blood lead levels (Bellinger et al., 1987,
Goyer 1990, Wan et coll., 1996).
Elimination
The excretion of lead can be affected by several ways: urine (mostly 75% of the lead), faces,
sweat, saliva, hair and nails (INSERM, 2006).
Urine elimination forms about 75% of the eliminated lead. According to Alessio et al. (1978a),
lead that is in free form, is removed only by glomerol filtration when blood lead levels are within
normal limits. While lead presents as not assimilated in the digestive system is eliminated by the
feces (Thompson, 1971). In addition, lead elimination may be sweaty when the subject is exposed
to heat (Asayama et al., 1975).
Toxicity
Numerous data from occupationally exposed groups in the population have been generated;
neurotoxicity, mutagenicity, carcinogenicity, cardiovascular endocrine, and developmental
ANNEX 6
a44
effects. Most of these endpoints were studied in animals. In 2016, lead was believed to have
resulted in 540,000 deaths (Dapul H. et al., 2014).
More recently, it appears that exposure to lead during pregnancy may lead to epigenetic changes
transmissible not only to children but also to the further generation (Sen A. et al., 2015).
Acute toxicity
In rodents, LD 50 values for salt lead are greater than 2,000 mg kg-1 bw, depending on the form
ranging from 300 up to 4000 after multiple oral short exposure (JECFA, 2000).
Chronic exposure
Lead effect is a poison at chronic exposure which represents a much higher risk. Muscle
weakness, gastrointestinal symptoms, poor psychometric results, mood disturbances, and
peripheral neuropathy symptoms can occur after lead exposure.
Saturnine gout has been identified as commonly occurring among individuals who were
chronically exposed to lead.
It can seriously affect behavior, this effect at low exposure depending on the development state
(IARC, 2006), the developing nervous system being the critical target. In human, attention deficit
hyperactivity disorder (ADHD) demonstrated impulsivity leading to cognitive impairment (Cory-
Slechta DA et al., 2003).
Lead genotoxicity
Lead chloride, acetate, oxide, and tetroxide were negative in several mutagenicity tests
(Salmonella typhimurium and Saccharomyces cerevisiae). In contrast, lead chromate and
bromide were positive in Ames test due to active moety (chromate and bromide). A cytogenetic
damage was noticed in a study using exfoliated buccal cells and where a measurement of Blood
lead was performed, reporting abnormalities such as chromatid and chromosomal deficiencies
and breaks fractures (Umair A., 2015, EFSA 2012), concluded that lead genotoxicity may be due
to indirect genotoxin (ROS) and experiments suggest that lead is an indirect mutagen acting by
inhibiting both nucleotide excision repair and base excision repair.
ANNEX 6
a45
Reprotoxicity
Odland et al. in 1999 reported that exposure to organic lead affects the metabolism of steroid
hormones in human and mice.
Several studies of men exposed occupationally to lead have shown: a reduction in fertility, semen
volume and sperm counts, decreased sperm motility and an increase in abnormal sperm
morphology. Current evidence suggests that chronic exposure to lead during pregnancy is
associated with adverse outcomes including spontaneous abortion, premature birth, fetal
growth restriction, neurodevelopmental delay and maternal hypertension (FAO/WHO 2011,
UKTIS 2016).
Carcinogenic effects in humans
Various water soluble and insoluble lead can induce tumors in rodents (especially renal tumors)
as carcinogenic/promoter agent, brain gliomas were also observed (IARC, 2006) but these effects
were observed at high doses compared to human intake. The International Agency for Research
on Cancer (IARC) classified lead compounds as probably carcinogenic to humans (Group 2A) on
the basis of limited evidence of carcinogenicity in humans and sufficient evidence in animals
(IARC, 2006).
But organic lead compounds were considered not to be classifiable for carcinogenicity (Group 3)
because there was inadequate evidence for carcinogenicity in humans and animals (IARC, 2006).
Risk characterization
The Panel on Contaminants in the Food Chain of EFSA, 2009 identified developmental
neurotoxicity in young children, but cardiovascular effects and nephrotoxicity in adults as the
critical effects for the risk assessment. The respective BMDLs derived from blood lead levels in
μg L-1 (corresponding dietary intake values in μg kg-1 b.w. per day) were: developmental
neurotoxicity BMDL01, 12 (0.50); effects on systolic blood pressure BMDL01, 36 (1.50); effects
on prevalence of chronic kidney disease BMDL10, 15 (0.63), and margin of exposure is applied.
Most pharmaceutical companies have set a limit for maximum daily intake of lead as 1.0 μg g-1,
ANNEX 6
a46
however prolonged intake at even this low level is hazardous to human body (Ab Latif Wan et al.,
2015).
The daily intake of lead determined in the present study (18.5 mg day-1) is in the same range of
to those obtained in France, Sweden, Finland, the Czech Republic, Canada and the UK, but lower
than intake determined in Cuba, Italy, Guatemala, Spain, Japan and China (Nassredine et al.,
2006). Estimates of adult mean lead dietary exposure in European countries are in the range of
0.36 to 1.24 μg kg-1 bw per day. The adult 95th percentile lead dietary exposure is in the range
0.73 to 2.43 μg kg-1 bw per day and 0.36 to 1.24 on average and for infant (1-3 years age) 1.10 to
3.10 up to 1.71 to 5.51 µg kg-1 bw per day for high exposure (EFSA, 2010).
Assuming a body weight of 68 kg, total exposure from these categories would be 0.74 μg kg-1 bw
per day in Egypt.
Regulation
The maximum levels for lead in foodstuffs are set up in the Regulation (EC) No 1881/2006. For
Lebanon standard (n.d.), the maximum level of lead is 0.2 mg kg-1 of Lebanese white bread.
EPA has set the maximum contaminant level goal for lead in drinking water at zero because lead
is a toxic metal that can be harmful to human health even at low exposure levels. Lead is
persistent, and it can bioaccumulate in the body over time.

ANNEX 7
a47
ANNEX 7: Tables Annex
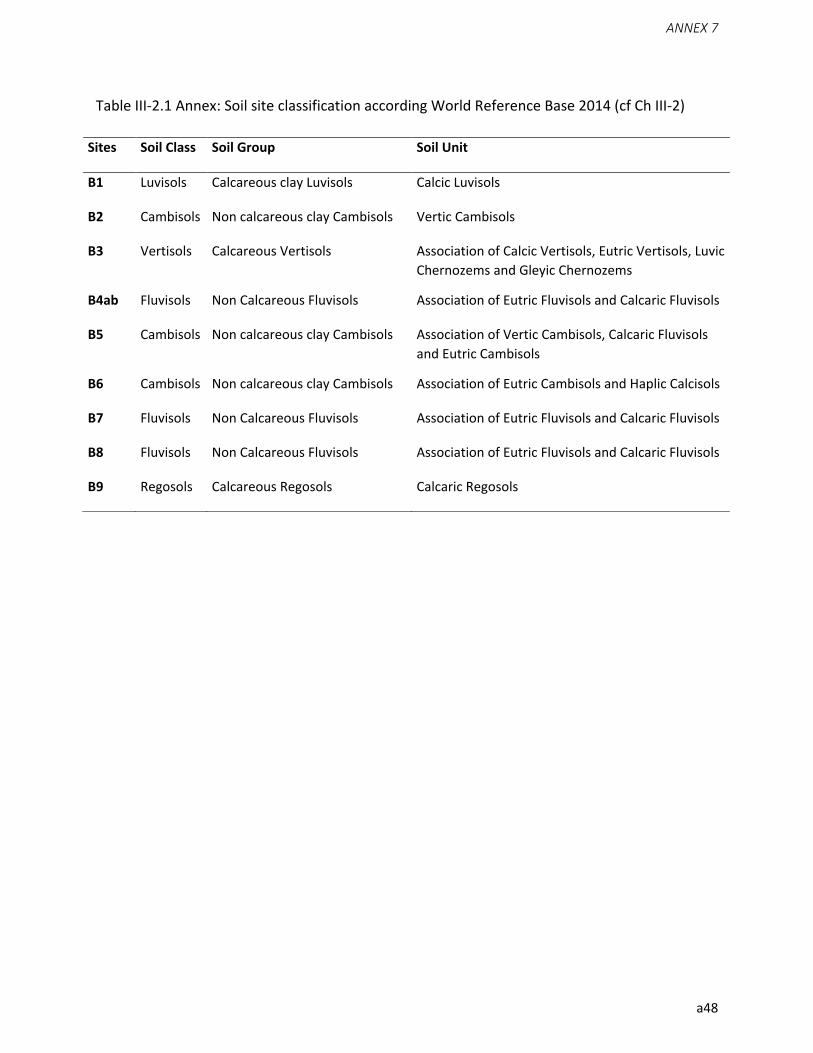
ANNEX 7
a48
Table III-2.1 Annex: Soil site classification according World Reference Base 2014 (cf Ch III-2)
Sites Soil Class Soil Group Soil Unit
B1 Luvisols Calcareous clay Luvisols Calcic Luvisols
B2 Cambisols Non calcareous clay Cambisols Vertic Cambisols
B3 Vertisols Calcareous Vertisols Association of Calcic Vertisols, Eutric Vertisols, Luvic
Chernozems and Gleyic Chernozems
B4ab Fluvisols Non Calcareous Fluvisols Association of Eutric Fluvisols and Calcaric Fluvisols
B5 Cambisols Non calcareous clay Cambisols Association of Vertic Cambisols, Calcaric Fluvisols
and Eutric Cambisols
B6 Cambisols Non calcareous clay Cambisols Association of Eutric Cambisols and Haplic Calcisols
B7 Fluvisols Non Calcareous Fluvisols Association of Eutric Fluvisols and Calcaric Fluvisols
B8 Fluvisols Non Calcareous Fluvisols Association of Eutric Fluvisols and Calcaric Fluvisols
B9 Regosols Calcareous Regosols Calcaric Regosols
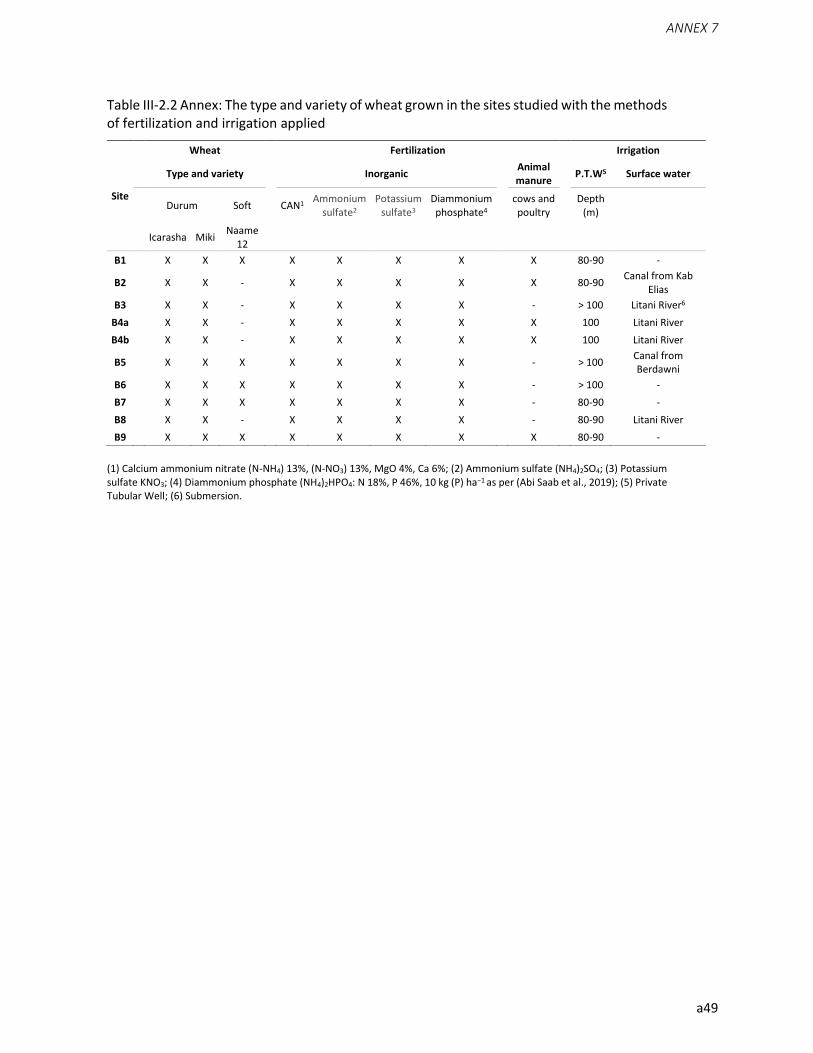
ANNEX 7
a49
Table III-2.2 Annex: The type and variety of wheat grown in the sites studied with the methods of fertilization and irrigation applied
(1) Calcium ammonium nitrate (N-NH4) 13%, (N-NO3) 13%, MgO 4%, Ca 6%; (2) Ammonium sulfate (NH4)2SO4; (3) Potassium sulfate KNO3; (4) Diammonium phosphate (NH4)2HPO4: N 18%, P 46%, 10 kg (P) ha−1 as per (Abi Saab et al., 2019); (5) Private Tubular Well; (6) Submersion.
Site
Wheat Fertilization Irrigation
Type and variety Inorganic Animal manure
P.T.W5 Surface water
Durum Soft CAN1 Ammonium
sulfate2 Potassium
sulfate3 Diammonium phosphate4
cows and poultry
Depth (m)
Icarasha Miki Naame
12
B1 X X X X X X X X 80-90 -
B2 X X - X X X X X 80-90 Canal from Kab
Elias
B3 X X - X X X X - > 100 Litani River6
B4a X X - X X X X X 100 Litani River
B4b X X - X X X X X 100 Litani River
B5 X X X X X X X - > 100 Canal from Berdawni
B6 X X X X X X X - > 100 -
B7 X X X X X X X - 80-90 -
B8 X X - X X X X - 80-90 Litani River
B9 X X X X X X X X 80-90 -
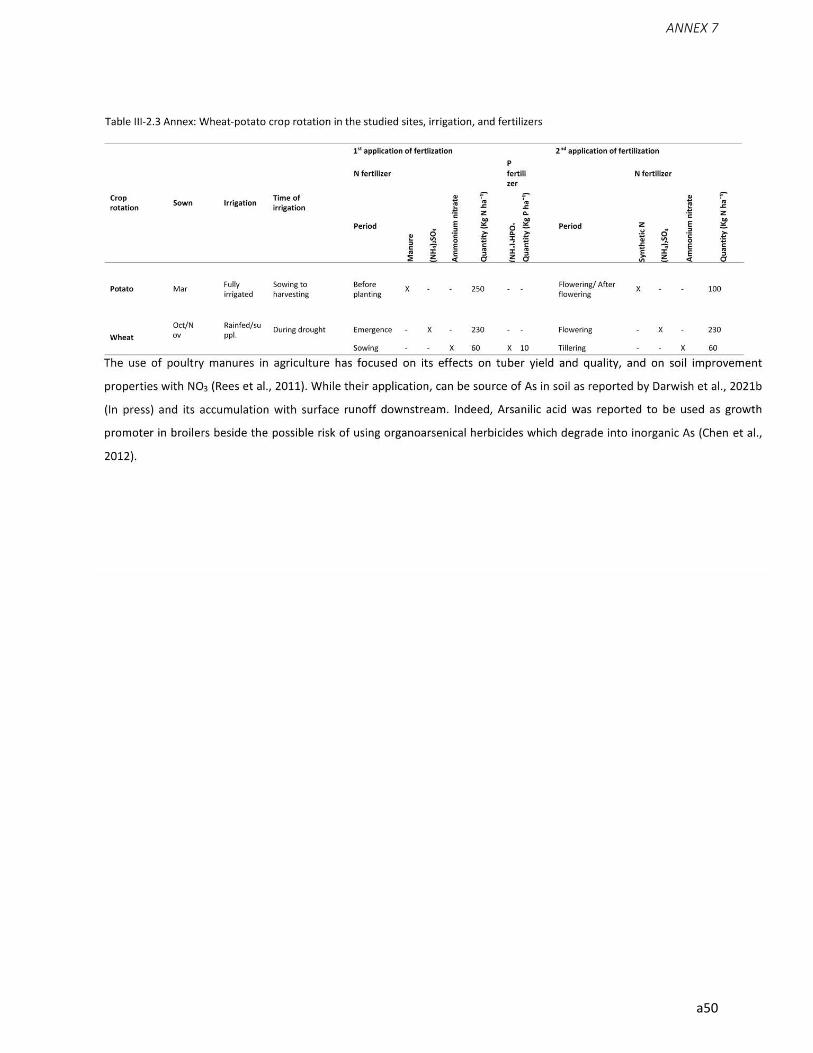
ANNEX 7
a50
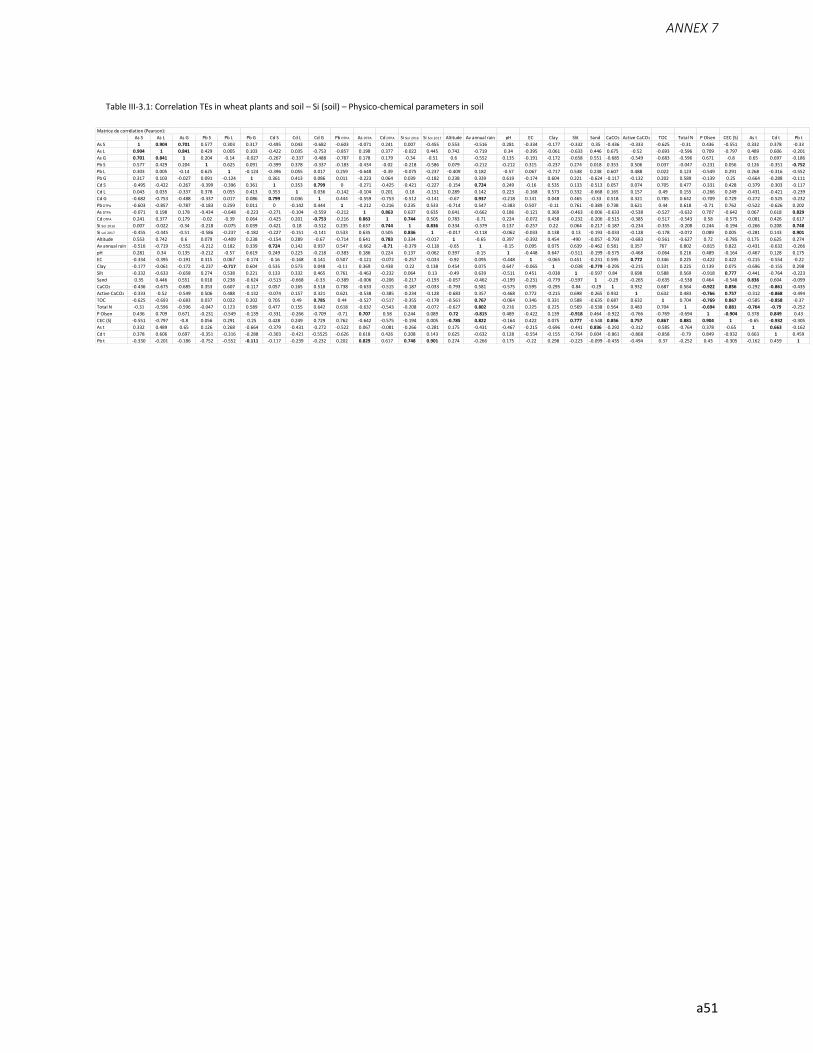
ANNEX 7
a51
As S As L As G Pb S Pb L Pb G Cd S Cd L Cd G Pb DTPA As DTPA Cd DTPA Si sol 2016 Si sol 2017 Altitude Av annual rain pH EC Clay Slit Sand CaCO3 Active CaCO3 TOC Total N P Olsen CEC (S) As t Cd t Pb t
As S 1 0.904 0.701 0.577 0.303 0.317 -0.495 0.043 -0.682 -0.603 -0.071 0.241 0.007 -0.455 0.553 -0.516 0.281 -0.334 -0.177 -0.332 0.35 -0.436 -0.333 -0.625 -0.31 0.436 -0.551 0.332 0.378 -0.33
As L 0.904 1 0.841 0.429 0.005 0.103 -0.422 0.035 -0.753 -0.857 0.198 0.377 -0.022 0.445 0.742 -0.719 0.34 -0.395 -0.061 -0.633 0.446 0.675 -0.52 -0.693 -0.596 0.709 -0.797 0.489 0.606 -0.201
As G 0.701 0.841 1 0.204 -0.14 -0.027 -0.267 -0.337 -0.488 -0.787 0.178 0.179 -0.34 -0.51 0.6 -0.552 0.135 -0.191 -0.172 -0.658 0.551 -0.685 -0.549 -0.683 -0.596 0.671 -0.8 0.65 0.697 -0.186
Pb S 0.577 0.429 0.204 1 0.625 0.091 -0.399 0.378 -0.337 -0.183 -0.434 -0.02 -0.218 -0.586 0.079 -0.212 -0.212 0.315 -0.237 0.274 0.018 0.353 0.506 0.037 -0.047 -0.231 0.056 0.126 -0.351 -0.752
Pb L 0.303 0.005 -0.14 0.625 1 -0.124 -0.396 0.055 0.017 0.259 -0.648 -0.39 -0.075 -0.237 -0.409 0.182 -0.57 0.067 -0.717 0.538 0.238 0.607 0.488 0.022 0.123 -0.549 0.291 0.268 -0.316 -0.552
Pb G 0.317 0.103 -0.027 0.091 -0.124 1 0.361 0.413 0.086 0.011 -0.223 0.064 0.039 -0.182 0.238 0.339 0.619 -0.174 0.604 0.221 -0.624 -0.117 -0.132 0.202 0.589 -0.139 0.25 -0.664 -0.288 -0.111
Cd S -0.495 -0.422 -0.267 -0.399 -0.396 0.361 1 0.353 0.799 0 -0.271 -0.425 -0.421 -0.227 -0.154 0.724 0.249 -0.16 0.535 0.133 -0.513 0.057 0.074 0.705 0.477 -0.331 0.428 -0.379 -0.303 -0.117
Cd L 0.043 0.035 -0.337 0.378 0.055 0.413 0.353 1 0.036 -0.142 -0.104 0.201 0.18 -0.151 0.289 0.142 0.223 -0.168 0.573 0.332 -0.668 0.165 0.157 0.49 0.155 -0.266 0.249 -0.431 -0.421 -0.239
Cd G -0.682 -0.753 -0.488 -0.337 0.017 0.086 0.799 0.036 1 0.444 -0.559 -0.753 -0.512 -0.141 -0.67 0.937 -0.218 0.141 0.048 0.465 -0.33 0.518 0.321 0.785 0.642 -0.709 0.729 -0.272 -0.525 -0.232
Pb DTPA -0.603 -0.857 -0.787 -0.183 0.259 0.011 0 -0.142 0.444 1 -0.212 -0.216 0.235 0.533 -0.714 0.547 -0.383 0.507 -0.11 0.761 -0.389 0.738 0.621 0.44 0.618 -0.71 0.762 -0.522 -0.626 0.202
As DTPA -0.071 0.198 0.178 -0.434 -0.648 -0.223 -0.271 -0.104 -0.559 -0.212 1 0.863 0.637 0.635 0.641 -0.662 0.186 -0.121 0.369 -0.463 -0.006 -0.633 -0.538 -0.527 -0.632 0.707 -0.642 0.067 0.618 0.829
Cd DTPA 0.241 0.377 0.179 -0.02 -0.39 0.064 -0.425 0.201 -0.753 -0.216 0.863 1 0.744 0.505 0.783 -0.71 0.224 -0.072 0.438 -0.232 -0.206 -0.515 -0.385 -0.517 -0.543 0.58 -0.575 -0.081 0.426 0.617
Si sol 2016 0.007 -0.022 -0.34 -0.218 -0.075 0.039 -0.421 0.18 -0.512 0.235 0.637 0.744 1 0.836 0.334 -0.379 0.137 -0.257 0.22 0.064 -0.217 -0.187 -0.234 -0.355 -0.208 0.244 -0.194 -0.266 0.208 0.748
Si sol 2017 -0.455 -0.445 -0.51 -0.586 -0.237 -0.182 -0.227 -0.151 -0.141 0.533 0.635 0.505 0.836 1 -0.017 -0.118 -0.062 -0.033 0.138 0.13 -0.193 -0.033 -0.128 -0.178 -0.072 0.089 0.005 -0.281 0.143 0.901
Altitude 0.553 0.742 0.6 0.079 -0.409 0.238 -0.154 0.289 -0.67 -0.714 0.641 0.783 0.334 -0.017 1 -0.65 0.397 -0.392 0.454 -490 -0.057 -0.793 -0.683 -0.561 -0.627 0.72 -0.785 0.175 0.625 0.274
Av annual rain -0.516 -0.719 -0.552 -0.212 0.182 0.339 0.724 0.142 0.937 0.547 -0.662 -0.71 -0.379 -0.118 -0.65 1 -0.15 0.095 0.075 0.639 -0.462 0.581 0.357 767 0.802 -0.815 0.822 -0.431 -0.632 -0.266
pH 0.281 0.34 0.135 -0.212 -0.57 0.619 0.249 0.223 -0.218 -0.383 0.186 0.224 0.137 -0.062 0.397 -0.15 1 -0.448 0.647 -0.511 -0.199 -0.575 -0.468 -0.064 0.216 0.489 -0.164 -0.467 0.128 0.175
EC -0.334 -0.395 -0.191 0.315 0.067 -0.174 -0.16 -0.168 0.141 0.507 -0.121 -0.072 -0.257 -0.033 -0.92 0.095 -0.448 1 -0.065 0.451 -0.231 0.595 0.772 0.346 0.225 -0.422 0.422 -0.215 -0.554 -0.22
Clay -0.177 -0.061 -0.172 -0.237 -0.717 0.604 0.535 0.573 0.048 -0.11 0.369 0.438 0.22 0.138 0.454 0.075 0.647 -0.065 1 -0.038 -0.779 -0.295 -0.215 0.331 0.225 0.139 0.075 -0.696 -0.155 0.298
Silt -0.332 -0.633 -0.658 0.274 0.538 0.221 0.133 0.332 0.465 0.761 -0.463 -0.232 0.064 0.13 -0.49 0.639 -0.511 0.451 -0.038 1 -0.597 0.84 0.698 0.588 0.569 -0.918 0.777 -0.441 -0.764 -0.223
Sand 0.35 0.446 0.551 0.018 0.238 -0.624 -0.513 -0.668 -0.33 -0.389 -0.006 -0.206 -0.217 -0.193 -0.057 -0.462 -0.199 -0.231 -0.779 -0.597 1 -0.29 -0.265 -0.635 -0.538 0.464 -0.548 0.836 0.604 -0.099
CaCO3 -0.436 -0.675 -0.685 0.353 0.607 -0.117 0.057 0.165 0.518 0.738 -0.633 -0.515 -0.187 -0.033 -0.793 0.581 -0.575 0.595 -0.295 0.84 -0.29 1 0.932 0.687 0.564 -0.922 0.856 -0.292 -0.861 -0.435
Active CaCO3 -0.333 -0.52 -0.549 0.506 0.488 -0.132 -0.074 0.157 0.321 0.621 -0.538 -0.385 -0.234 -0.128 -0.683 0.357 -0.468 0.772 -0.215 0.698 -0.265 0.932 1 0.632 0.483 -0.766 0.757 -0.312 -0.868 -0.494
TOC -0.625 -0.693 -0.683 0.037 0.022 0.202 0.705 0.49 0.785 0.44 -0.527 -0.517 -0.355 -0.178 -0.561 0.767 -0.064 0.346 0.331 0.588 -0.635 0.687 0.632 1 0.704 -0.769 0.867 -0.585 -0.858 -0.37
Total N -0.31 -0.596 -0.596 -0.047 0.123 0.589 0.477 0.155 0.642 0.618 -0.632 -0.543 -0.208 -0.072 -0.627 0.802 0.216 0.225 0.225 0.569 -0.538 0.564 0.483 0.704 1 -0.694 0.881 -0.764 -0.79 -0.252
P Olsen 0.436 0.709 0.671 -0.231 -0.549 -0.139 -0.331 -0.266 -0.709 -0.71 0.707 0.58 0.244 0.089 0.72 -0.815 0.489 -0.422 0.139 -0.918 0.464 -0.922 -0.766 -0.769 -0.694 1 -0.904 0.378 0.849 0.43
CEC (S) -0.551 -0.797 -0.8 0.056 0.291 0.25 0.428 0.249 0.729 0.762 -0.642 -0.575 -0.194 0.005 -0.785 0.822 -0.164 0.422 0.075 0.777 -0.548 0.856 0.757 0.867 0.881 0.904 1 -0.65 -0.932 -0.305
As t 0.332 0.489 0.65 0.126 0.268 -0.664 -0.379 -0.431 -0.272 -0.522 0.067 -0.081 -0.266 -0.281 0.175 -0.431 -0.467 -0.215 -0.696 -0.441 0.836 -0.292 -0.312 -0.585 -0.764 0.378 -0.65 1 0.663 -0.162
Cd t 0.378 0.606 0.697 -0.351 -0.316 -0.288 -0.303 -0.421 -0.5525 -0.626 0.618 0.426 0.208 0.143 0.625 -0.632 0.128 -0.554 -0.155 -0.764 0.604 -0.861 -0.868 -0.858 -0.79 0.849 -0.932 0.663 1 0.459
Pb t -0.330 -0.201 -0.186 -0.752 -0.552 -0.111 -0.117 -0.239 -0.232 0.202 0.829 0.617 0.748 0.901 0.274 -0.266 0.175 -0.22 0.298 -0.223 -0.099 -0.435 -0.494 0.37 -0.252 0.43 -0.305 -0.162 0.459 1
Matrice de corrélation (Pearson):
Table III-3.1: Correlation TEs in wheat plants and soil – Si (soil) – Physico-chemical parameters in soil
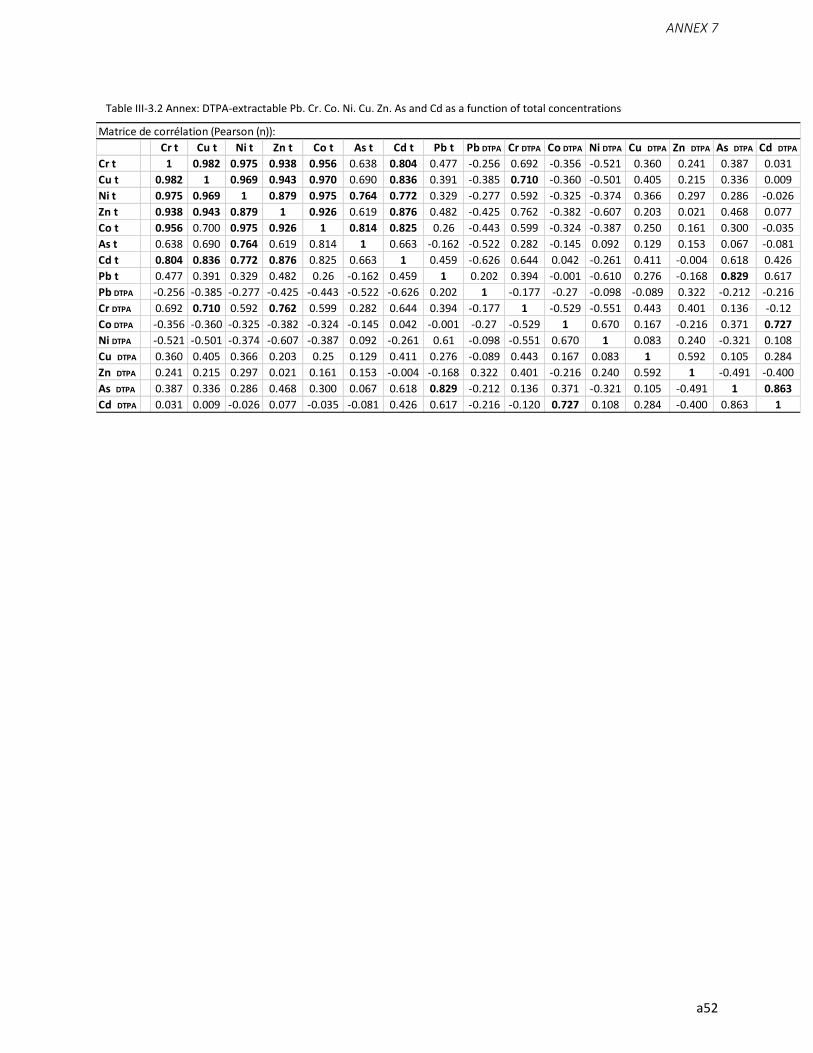
ANNEX 7
a52
Cr t Cu t Ni t Zn t Co t As t Cd t Pb t Pb DTPA Cr DTPA Co DTPA Ni DTPA Cu DTPA Zn DTPA As DTPA Cd DTPA
Cr t 1 0.982 0.975 0.938 0.956 0.638 0.804 0.477 -0.256 0.692 -0.356 -0.521 0.360 0.241 0.387 0.031
Cu t 0.982 1 0.969 0.943 0.970 0.690 0.836 0.391 -0.385 0.710 -0.360 -0.501 0.405 0.215 0.336 0.009
Ni t 0.975 0.969 1 0.879 0.975 0.764 0.772 0.329 -0.277 0.592 -0.325 -0.374 0.366 0.297 0.286 -0.026
Zn t 0.938 0.943 0.879 1 0.926 0.619 0.876 0.482 -0.425 0.762 -0.382 -0.607 0.203 0.021 0.468 0.077
Co t 0.956 0.700 0.975 0.926 1 0.814 0.825 0.26 -0.443 0.599 -0.324 -0.387 0.250 0.161 0.300 -0.035
As t 0.638 0.690 0.764 0.619 0.814 1 0.663 -0.162 -0.522 0.282 -0.145 0.092 0.129 0.153 0.067 -0.081
Cd t 0.804 0.836 0.772 0.876 0.825 0.663 1 0.459 -0.626 0.644 0.042 -0.261 0.411 -0.004 0.618 0.426
Pb t 0.477 0.391 0.329 0.482 0.26 -0.162 0.459 1 0.202 0.394 -0.001 -0.610 0.276 -0.168 0.829 0.617
Pb DTPA -0.256 -0.385 -0.277 -0.425 -0.443 -0.522 -0.626 0.202 1 -0.177 -0.27 -0.098 -0.089 0.322 -0.212 -0.216
Cr DTPA 0.692 0.710 0.592 0.762 0.599 0.282 0.644 0.394 -0.177 1 -0.529 -0.551 0.443 0.401 0.136 -0.12
Co DTPA -0.356 -0.360 -0.325 -0.382 -0.324 -0.145 0.042 -0.001 -0.27 -0.529 1 0.670 0.167 -0.216 0.371 0.727
Ni DTPA -0.521 -0.501 -0.374 -0.607 -0.387 0.092 -0.261 0.61 -0.098 -0.551 0.670 1 0.083 0.240 -0.321 0.108
Cu DTPA 0.360 0.405 0.366 0.203 0.25 0.129 0.411 0.276 -0.089 0.443 0.167 0.083 1 0.592 0.105 0.284
Zn DTPA 0.241 0.215 0.297 0.021 0.161 0.153 -0.004 -0.168 0.322 0.401 -0.216 0.240 0.592 1 -0.491 -0.400
As DTPA 0.387 0.336 0.286 0.468 0.300 0.067 0.618 0.829 -0.212 0.136 0.371 -0.321 0.105 -0.491 1 0.863
Cd DTPA 0.031 0.009 -0.026 0.077 -0.035 -0.081 0.426 0.617 -0.216 -0.120 0.727 0.108 0.284 -0.400 0.863 1
Matrice de corrélation (Pearson (n)):
Table III-3.2 Annex: DTPA-extractable Pb, Cr, Co, Ni, Cu, Zn, As and Cd as a function of total concentrations
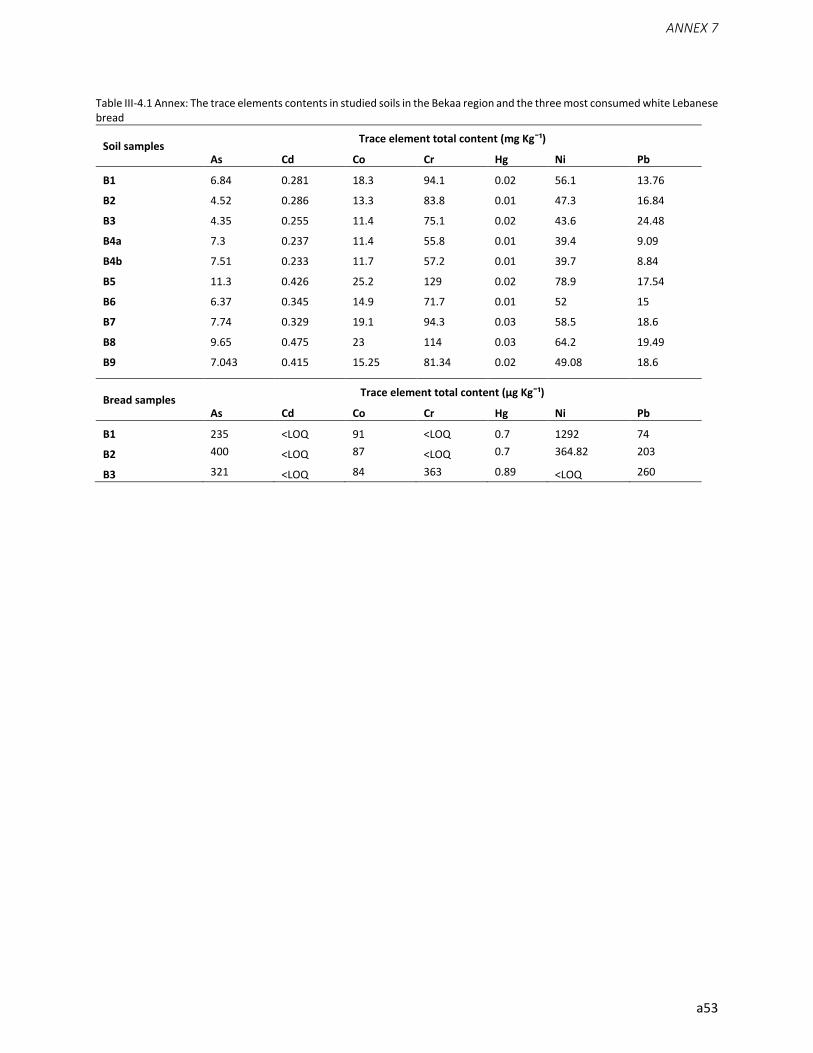
ANNEX 7
a53
Table III-4.1 Annex: The trace elements contents in studied soils in the Bekaa region and the three most consumed white Lebanese bread
Soil samples Trace element total content (mg Kg¯¹)
As Cd Co Cr Hg Ni Pb
B1 6.84 0.281 18.3 94.1 0.02 56.1 13.76
B2 4.52 0.286 13.3 83.8 0.01 47.3 16.84
B3 4.35 0.255 11.4 75.1 0.02 43.6 24.48
B4a 7.3 0.237 11.4 55.8 0.01 39.4 9.09
B4b 7.51 0.233 11.7 57.2 0.01 39.7 8.84
B5 11.3 0.426 25.2 129 0.02 78.9 17.54
B6 6.37 0.345 14.9 71.7 0.01 52 15
B7 7.74 0.329 19.1 94.3 0.03 58.5 18.6
B8 9.65 0.475 23 114 0.03 64.2 19.49
B9 7.043 0.415 15.25 81.34 0.02 49.08 18.6
Bread samples Trace element total content (µg Kg¯¹)
As Cd Co Cr Hg Ni Pb
B1 235 <LOQ 91 <LOQ 0.7 1292 74
B2 400 <LOQ 87 <LOQ 0.7 364.82 203
B3 321 <LOQ 84 363 0.89 <LOQ 260

PUBLISHED ARTICLES
PUBLISHED ARTICLES
foods
Article
Lebanese Population Exposure to Trace Elements viaWhite Bread Consumption
Nada Lebbos 1, Claude Daou 2, Rosette Ouaini 2, Hanna Chebib 2, Michel Afram 1, Pierre Curmi 3,
Laurence Dujourdy 4 , Elias Bou-Maroun 5,* and Marie-Christine Chagnon 6
1 Lebanese Agricultural Research Institute LARI, Heavy metals Department, Beirut PO Box 90-1965, Lebanon;[email protected] (N.L.); [email protected] (M.A.)
2 Lebanese University, Faculty of Science II, Laboratoire d’Analyse Chimique (LAC),Fanar PO Box 90656, Lebanon; [email protected] (C.D.); [email protected] (R.O.);[email protected] (H.C.)
3 AgroSup Dijon, Univ. Bourgogne Franche-Comté, Biogéosciences UMR 6282, F-21000 Dijon, France;[email protected]
4 Service d’Appui à la recherche, AgroSup Dijon, F-21000 Dijon, France; [email protected] AgroSup Dijon, Univ. Bourgogne Franche-Comté, PAM UMR A 02.102,
Procédés Alimentaires et Microbiologiques, F-21000 Dijon, France6 Univ. Bourgogne Franche-Comté, INSERM U1231, NUTOX, Derttech “Packtox”, AgroSup Dijon,
F-21000 Dijon, France; [email protected]* Correspondence: [email protected]; Tel.: +33-3-80-77-40-80
Received: 17 October 2019; Accepted: 9 November 2019; Published: 14 November 2019�����������������
Abstract: The objective of this study was to assess Lebanese population exposure to trace elements(TEs) via white pita consumption. A survey of white pita consumption was achieved among onethousand Lebanese individuals, grouped into adults (above 15 years old, men, and women) andyoung people (6–9 and 10–14 years old). The most consumed pita brands, labeled B1, B2, and B3,were selected. Levels of TEs (i.e., As, Cd, Co, Cr, Hg, Ni, and Pb) in B1, B2, B3 pitas were measured.The highest contents of TEs in pitas were: Ni (1292 µg/kg) and Co (91 µg/kg) in B1; As (400 µg/kg) andCd (< 15 µg/kg) in B2; Cr (363 µg/kg), Pb (260 µg/kg), and Hg (0.89 µg/kg) in B3. The pita brand B3was the source of the highest TEs exposure, except for Ni for which it was B1. Daily exposures to TEsdue to the fact of pita consumption were compared to safety levels. There were no safety concerns forHg, Cd, Cr or Co (except the 95th percentile of 6–9 years old). An excess of the Ni tolerable dailyintake was observed for the most exposed populations. The very low margins of exposure for As andPb suggest a worrying risk for the Lebanese population.
Keywords: survey; trace elements analysis; Lebanese pita; human exposure; risk characterization
1. Introduction
Bread is a source of energy and minerals, some of them being essential for the body. Essentialminerals found in Lebanese bread are Cu, Fe, Mn, Zn, and Se which account for 36%, 25%, 30%, 22%,and 32% of respective recommended dietary allowance (RDA) values given for these elements [1].
Besides the quality of bread as nutriment, its safety must be assured and monitored in terms ofputative contaminants like trace elements (TEs).
Indeed, trace elements represent the main food chemical contamination and are globally recognizedas a public health hazard [2]. They occur either from natural process (lithogenic and pedogenic routes)and/or anthropogenic activities. The latter include industrial, agricultural (pesticides, fertilizers),and untreated wastewater [3]. This leads to the contamination of the different environmental matrices,including water, soil, air, and plants [4,5]. In general, plants can uptake TEs mainly by absorbing
Foods 2019, 8, 574; doi:10.3390/foods8110574 www.mdpi.com/journal/foods

Foods 2019, 8, 574 2 of 20
them from polluted soils, and transporting them further to its different parts (roots, stem, leaves,and grains) [6]. The bioaccumulation of TEs in plants, especially those that enter the food chain, can bedangerous to human health due to the fact of their eventual toxicity [5].
Traces elements such as lead, arsenic, cadmium, and mercury are relevant toxic elements [7].According to the existing literature, it is mandatory to quantify the contents of trace elements infoodstuffs in order to estimate dietary exposure, an essential step for risk assessment related to foodconsumption [2,8].
Currently, many studies have been undertaken in different countries to assess exposure to TEsoccurring in their relative foodstuffs such as France [9], Spain [2], Italy [10], China [11], Saudi Arabia [12],and Lebanon [13]. In addition, the European Food Safety Authority (EFSA) panel on contaminants inthe food chain has given its scientific opinion on the risks to public health related to the presence of Ni,Hg, and As in food [14–16]. Such studies should be representative of specific food as consumed by thepopulation. In France, total diet studies (TDS) are national surveys routinely realized to assess publichealth risks associated with substances such as contaminants in food. They underline the necessityto reduce exposure to elements such as Cd, Al, Ni, As, and Co by a diversified diet (food items andorigins) [17].
Nasreddine et al. [13] studied, using the TDS approach, the dietary exposure of the adult Lebaneseurban population to six essential micro-nutriments (i.e., Co, Cu, Fe, Mn, Ni, and Zn) and two toxicheavy metals (i.e., Cd and Pb). This study constitutes a first estimate of the consumer exposure totrace elements through the diet in Lebanon. These authors determined that the average urban adultdaily bread consumption was 136.8 g/day and that mean exposure was found to be satisfactory formost trace elements. However, the survey included only adult people living in the district of Beirut,thus preventing the extrapolation of the results to the whole country; indeed, agricultural areas aresections of high bread consumption.
Previous studies in Egypt, Iran, South Africa, Nigeria, and Portugal determined TEs contents inbread [18–22]. In Lebanon, Bou Khouzam and co-authors [1] determined the contents of 20 elements inthree varieties of Lebanese bread (i.e., white, brown pita, and Saj bread) throughout the country duringthe wet and dry seasons. Toxic elements such as Cd and Pb were below maximum levels set by theLebanese regulatory agency, (The Lebanese Standards Institution—Libnor) [23].
Bread is an integral part of the daily diet, but the types of bread and amounts ingested varyaccording to the age, sex, and socio-economic status of the individual. As a result, and as consumerbehavior evolves over time, there is a need for up-to-date information on daily ETs intake via Lebanesebread consumption throughout Lebanon, including rural areas.
The Lebanese standards [23] provide only Pb, Cu, and Cd maximum levels in bread as fooditem contamination vectors. However, other TEs could be present [1,13]. As exposition representsthe combination of consumption of bread potentially contaminated, it is of first interest to compareexposure with safety levels in order to monitor any safety preoccupation concerns for the Lebanesepopulation. For this reason, this study was directed by a public institute (Lebanese AgriculturalResearch Institute—LARI) to assess exposure to trace elements via Lebanese pita consumption.
As, Cd, Co, Cr, Hg, Ni, and Pb were selected in this study based on previous studies of traceelement composition of Lebanese bread [1,13] and based on the Lebanese bread standard Libnor,NL 240 [23]. In contrast to heavy metals known to be toxic, such as Pb, Cd or Hg, some elements,such as Cr and Co, are essential elements giving benefit to the body, the liver being a valuable sourceof elements [24]. Co is a transition metal with two oxidation states Co (II) and Co (III) and is essentialas part of vitamin B12 (cobalamin) involved in folate and fatty acid and the metabolism of proteins andnucleic acids [25]. In regards to Cr, the Cr (III) form has been postulated to be necessary for the efficacyof the insulin-regulating metabolism of carbohydrates, lipids, and proteins [26]. However, EFSA [27]in 2014 concluded there was no evidence of a beneficial effect associated with Cr intake in healthy,normoglycemic subjects.
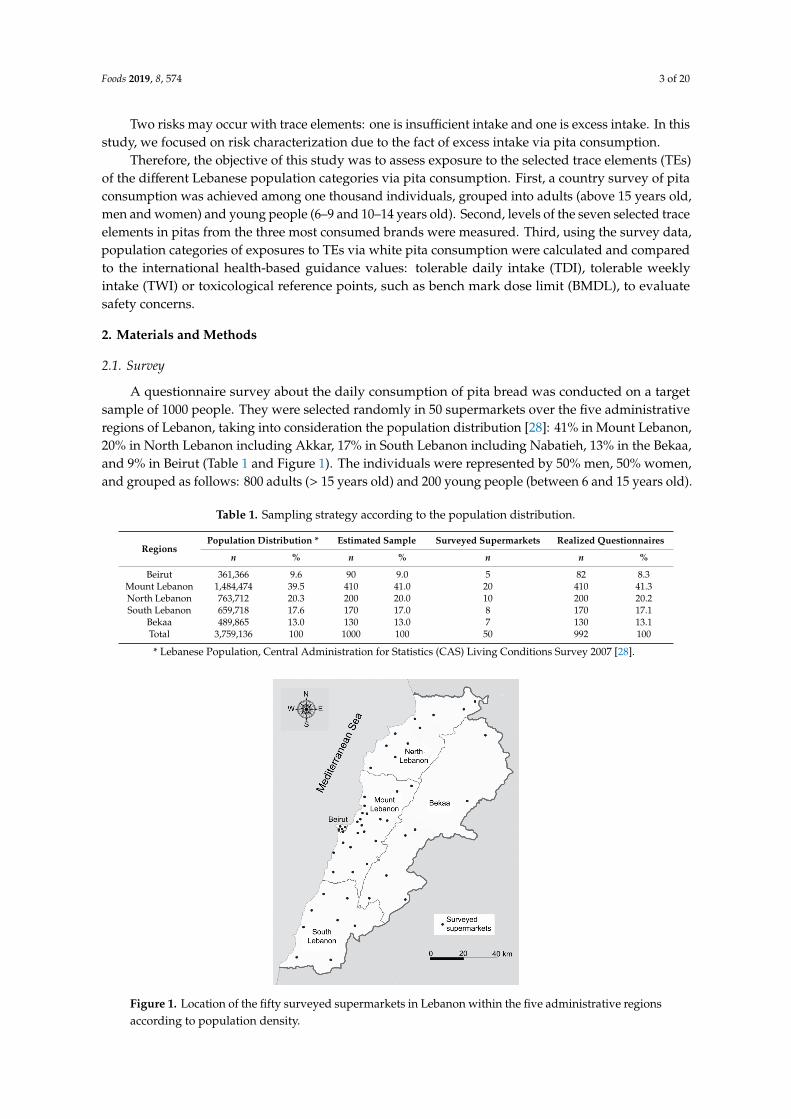
Foods 2019, 8, 574 3 of 20
Two risks may occur with trace elements: one is insufficient intake and one is excess intake. In thisstudy, we focused on risk characterization due to the fact of excess intake via pita consumption.
Therefore, the objective of this study was to assess exposure to the selected trace elements (TEs)of the different Lebanese population categories via pita consumption. First, a country survey of pitaconsumption was achieved among one thousand individuals, grouped into adults (above 15 years old,men and women) and young people (6–9 and 10–14 years old). Second, levels of the seven selected traceelements in pitas from the three most consumed brands were measured. Third, using the survey data,population categories of exposures to TEs via white pita consumption were calculated and comparedto the international health-based guidance values: tolerable daily intake (TDI), tolerable weeklyintake (TWI) or toxicological reference points, such as bench mark dose limit (BMDL), to evaluatesafety concerns.
2. Materials and Methods
2.1. Survey
A questionnaire survey about the daily consumption of pita bread was conducted on a targetsample of 1000 people. They were selected randomly in 50 supermarkets over the five administrativeregions of Lebanon, taking into consideration the population distribution [28]: 41% in Mount Lebanon,20% in North Lebanon including Akkar, 17% in South Lebanon including Nabatieh, 13% in the Bekaa,and 9% in Beirut (Table 1 and Figure 1). The individuals were represented by 50% men, 50% women,and grouped as follows: 800 adults (> 15 years old) and 200 young people (between 6 and 15 years old).
Table 1. Sampling strategy according to the population distribution.
RegionsPopulation Distribution * Estimated Sample Surveyed Supermarkets Realized Questionnaires
n % n % n n %
Beirut 361,366 9.6 90 9.0 5 82 8.3Mount Lebanon 1,484,474 39.5 410 41.0 20 410 41.3North Lebanon 763,712 20.3 200 20.0 10 200 20.2South Lebanon 659,718 17.6 170 17.0 8 170 17.1
Bekaa 489,865 13.0 130 13.0 7 130 13.1Total 3,759,136 100 1000 100 50 992 100
* Lebanese Population, Central Administration for Statistics (CAS) Living Conditions Survey 2007 [28].
Figure 1. Location of the fifty surveyed supermarkets in Lebanon within the five administrative regionsaccording to population density.

Foods 2019, 8, 574 4 of 20
Data were collected over a two-month period, from 14 April 2017 to 5 June 2017. The teamof interviewers was composed of 8 data collectors trained prior to the fieldwork by a supervisor.Participants were eligible for the study if they were Lebanese, had been living in Lebanon for at leastfifteen years before the date of the survey, and did not have a chronic or serious illness.
In each supermarket, eligible participants were interviewed face-to-face by a data collector whoinstantly filled an offline questionnaire on an electronic tablet, using multiple-choice questions andfigures (e.g., size of the pita). In the case of children, parents aided us in collecting survey data.
In addition to information on the daily consumption of pita bread, age, gender, body weight,and socio-economic status of the interviewed individuals, data were also collected on the level ofeducation, address (urban or rural), job description, and health status (e.g., smoking habit, alcoholconsumption and physical activity of the individual). Each questionnaire consisted of 44 questions(Supplementary Materials, Survey) which required approximately 7 min to complete. The collectedanswers were transmitted in the “iSurvey” application for data harmonization.
2.2. Chemicals
Standard solutions (1 g/L) of Hg, As, Co, Cr, Cd, Ni, and Pb were purchased from Fluka. In addition,HNO3 65%, H2O2 30%, and the BCR (Community Bureau of Reference) certified reference material forbread trace elements (BCR-191) were purchased from Sigma–Aldrich. Deionized water, obtained froma BOECOpure UV/UF water purification system, was used in all experiments.
2.3. Sampling for Trace Elements Analysis
Based on the survey data, three Lebanese white pita brands were determined as the most consumedby the Lebanese population. These brands were tagged as B1, B2, and B3.
Three randomly sampled bags of each of the selected pita brands were collected. Each breadbag had seven pitas where three were randomly picked. Each pita was cut into 12 circular sectorswith a plastic knife on a polyethylene plate to prevent trace element contamination. Two pieces wererandomly drawn for analysis, creating 18 (3 bags × 3 pitas × 2 pieces) circular pita pieces for eachbrand. Before sample digestion, pita pieces were ground into powder using an agate mortar.
2.4. Sample Digestion for Trace Elements Analysis
Digestion of samples was done using an Anton Paar microwave (multiwave 3000—Rotor 8SXF100, Graz, Austria). Samples of 0.5 g each were directly weighed after grinding in 50 mL Teflon tube.Then, 7 mL of concentrated HNO3 and 1 mL of H2O2 were added to the preparation. The Teflon bombswere closed and placed in the digester at 200 ◦C for 15 min (1000 W). Once the Teflon tubes had cooledfor at least 45 min, 3 mL of the digested samples were transferred to 25 mL polyethylene tubes anddiluted with HNO3 1% before the trace elements analysis. Each sample was digested in triplicate.
2.5. Analysis of Trace Elements
The determination of trace elements (As, Co, Cd, Cr, Pb, and Ni) in pita samples was performedusing an Atomic Absorption Spectrometer (AAS, Stafford House, UK) Zeeman Graphite FurnaceGF95Z Thermo Electron corporation M series. Each pita sample was digested in triplicate and eachdigested sample was analyzed in triplicate. Mercury was analyzed by direct mercury analyzer DMA80 Milestone (Sorisole, Italy) using 0.2 g of pita sample.
To guarantee the method reliability, a certified reference material (CRM; BCR-191) underwentthe same digestion protocol and was analyzed at the same time as the pita samples. The recoverypercentages obtained for the reference material were 93.2% for Hg, 110.8% for Pb, 86.3% for Ni,and 110.1% for Cd. For the other elements, As, Co, and Cr, for which reference materials were notavailable, bread samples were spiked by a known concentration (0.1 mg/L) of each of the above listedelements before digestion. The spiked bread was treated and digested in the same way as the bread
Foods 2019, 8, 574 5 of 20
samples and analyzed using an AAS. The recovery percentages were 103.08% for As, 101.29% for Co,and 96.37% for Cr.
2.6. Exposure Determination
An exposure calculation was conducted for each respondent. They took into account the quantityof bread consumed by person, body weight, and the metal content of the consumed bread accordingto its brand. Results were expressed in terms of the median and 95th percentile using Ms-Excel fordifferent population categories.
2.7. Statistical Analysis
In order to avoid a lack of representativeness of the selected samples of the surveyed population,a weighting adjustment technique was applied using auxiliary variables such as gender, age, and regionby comparing the observed frequency distribution of each variable with its population distribution [29].
Data processing and statistical adjustments were analyzed using Sphinx IQ2 (Le Sphinx®,Chavanod, France) for survey data and R Studio version 1.0.153 with R version 3.5.0 [30,31].
Kruskal–Wallis non-parametric tests [32] completed by a multi-comparison Fisher’s test (α = 0.05)were conducted to test for significant differences in consumption by region. Analysis of variances(ANOVAs) completed by a multi-comparison Tukey’s test (α = 0.05) were also executed to testdifferences in trace element contents among brands. They were performed with R using the “agricolae”package [33].
Median and percentile non-parametric tests (α = 0.05) [32] were realized to check significantdifferences in the level of trace element exposures between age and gender. They were performedusing R and the “rcompanion” package [34].
Principal component analysis (PCA) was applied to examine the relationships among the traceelement contents of the breads using XLSTAT 2018. The results are presented by loading and score plots.
Multivariate correspondence analysis was done to explore relationships among consumptionbehaviors and socioeconomic data [35].
3. Results
3.1. Survey Results
Based on a target sample of 1000 people, the surveyed sample consisted of 992 individuals withthe following demographic characteristics: a sex ratio of 0.992, a proportion of 19.4% young people(8.9% children aged from 6 to 9 years old and 10.5% teenagers aged from 10 to 14 years old) and 80.6%adults, and 70.6% living in an urban area. Compared to the overall Lebanese population (where thesex ratio is 0.962, 23% are young people, 77% adults, and 87% live in urban areas [36]) there was asignificant difference risk of 5% in terms of young people/adults and rural/urban ratios between thesurveyed sample and the population distribution of Lebanon, which could lead to a bias. Consequently,a weighing adjustment in respect to these variables was performed to make a possible inferenceat the population level. The weighted numbers of respondents corresponded to 228 young people(i.e., 95 children and 133 teenagers) and 764 adults.
White pita was the type of bread most consumed according to the surveyed sample: 77% reportedwhite pita consumption and 23% brown or other. We limited our study to the 762 individuals consumingmainly white pita (W). This population also consumed brown pita (B) and other types of pita (O) insmaller proportions. The relative proportions of these different consumption modes were as follows:W only >W + B >W + O >W + B + O with 88.8%, 8.9%, 1.8%, and 0.4%, respectively (SupplementaryMaterials, Table S1).
The survey makes it possible to estimate the consumption of white pita for the different categories ofthe population (Table 2). Adult men were the highest consumers followed by teenagers (10–14 years old)and women and children (6–9 years old): daily white pita consumption medians were 282, 143, 126,
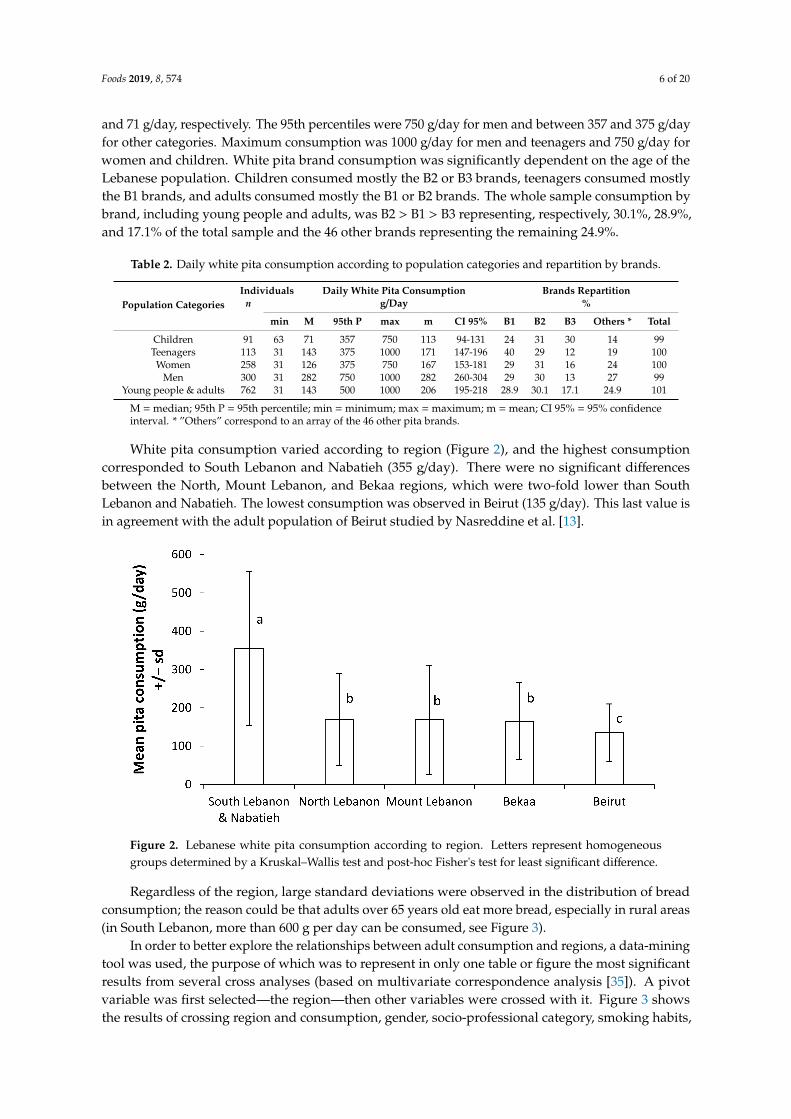
Foods 2019, 8, 574 6 of 20
and 71 g/day, respectively. The 95th percentiles were 750 g/day for men and between 357 and 375 g/dayfor other categories. Maximum consumption was 1000 g/day for men and teenagers and 750 g/day forwomen and children. White pita brand consumption was significantly dependent on the age of theLebanese population. Children consumed mostly the B2 or B3 brands, teenagers consumed mostlythe B1 brands, and adults consumed mostly the B1 or B2 brands. The whole sample consumption bybrand, including young people and adults, was B2 > B1 > B3 representing, respectively, 30.1%, 28.9%,and 17.1% of the total sample and the 46 other brands representing the remaining 24.9%.
Table 2. Daily white pita consumption according to population categories and repartition by brands.
Population Categories
Individuals Daily White Pita Consumption Brands Repartition
n g/Day %
min M 95th P max m CI 95% B1 B2 B3 Others * Total
Children 91 63 71 357 750 113 94-131 24 31 30 14 99Teenagers 113 31 143 375 1000 171 147-196 40 29 12 19 100
Women 258 31 126 375 750 167 153-181 29 31 16 24 100Men 300 31 282 750 1000 282 260-304 29 30 13 27 99
Young people & adults 762 31 143 500 1000 206 195-218 28.9 30.1 17.1 24.9 101
M =median; 95th P = 95th percentile; min =minimum; max =maximum; m =mean; CI 95% = 95% confidenceinterval. * ”Others” correspond to an array of the 46 other pita brands.
White pita consumption varied according to region (Figure 2), and the highest consumptioncorresponded to South Lebanon and Nabatieh (355 g/day). There were no significant differencesbetween the North, Mount Lebanon, and Bekaa regions, which were two-fold lower than SouthLebanon and Nabatieh. The lowest consumption was observed in Beirut (135 g/day). This last value isin agreement with the adult population of Beirut studied by Nasreddine et al. [13].
Figure 2. Lebanese white pita consumption according to region. Letters represent homogeneousgroups determined by a Kruskal–Wallis test and post-hoc Fisher's test for least significant difference.
Regardless of the region, large standard deviations were observed in the distribution of breadconsumption; the reason could be that adults over 65 years old eat more bread, especially in rural areas(in South Lebanon, more than 600 g per day can be consumed, see Figure 3).
In order to better explore the relationships between adult consumption and regions, a data-miningtool was used, the purpose of which was to represent in only one table or figure the most significantresults from several cross analyses (based on multivariate correspondence analysis [35]). A pivotvariable was first selected—the region—then other variables were crossed with it. Figure 3 showsthe results of crossing region and consumption, gender, socio-professional category, smoking habits,
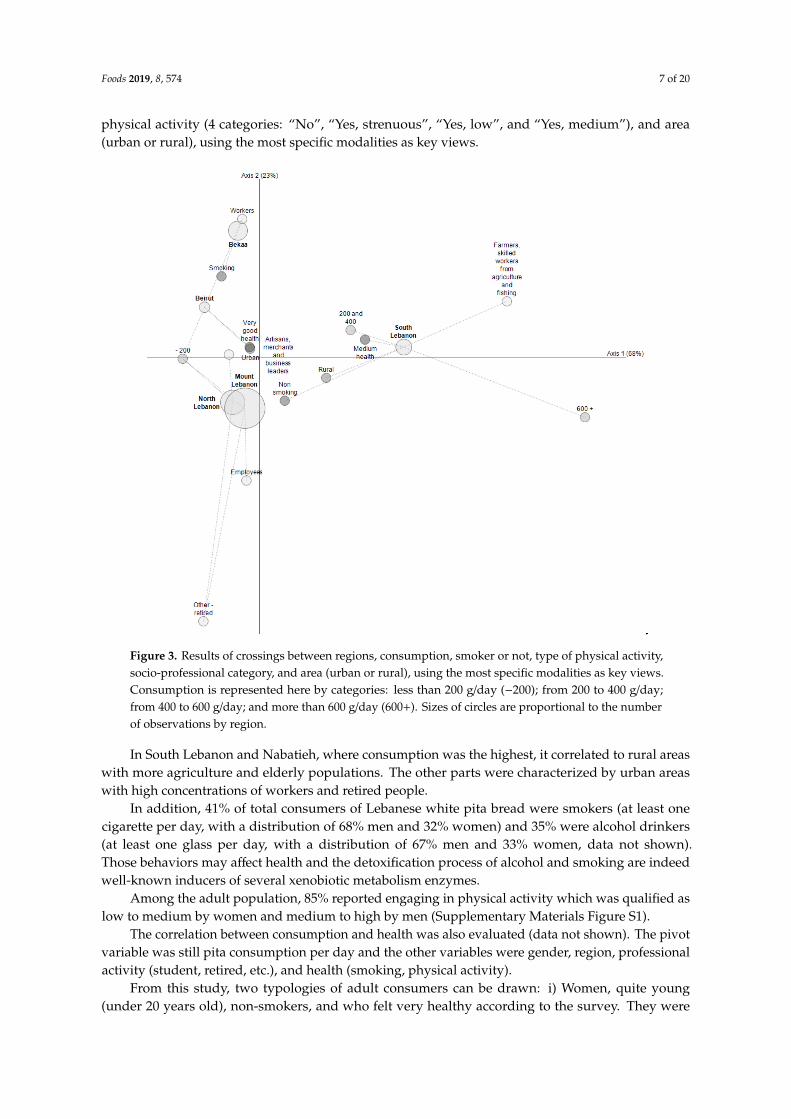
Foods 2019, 8, 574 7 of 20
physical activity (4 categories: “No”, “Yes, strenuous”, “Yes, low”, and “Yes, medium”), and area(urban or rural), using the most specific modalities as key views.
Figure 3. Results of crossings between regions, consumption, smoker or not, type of physical activity,socio-professional category, and area (urban or rural), using the most specific modalities as key views.Consumption is represented here by categories: less than 200 g/day (−200); from 200 to 400 g/day;from 400 to 600 g/day; and more than 600 g/day (600+). Sizes of circles are proportional to the numberof observations by region.
In South Lebanon and Nabatieh, where consumption was the highest, it correlated to rural areaswith more agriculture and elderly populations. The other parts were characterized by urban areaswith high concentrations of workers and retired people.
In addition, 41% of total consumers of Lebanese white pita bread were smokers (at least onecigarette per day, with a distribution of 68% men and 32% women) and 35% were alcohol drinkers(at least one glass per day, with a distribution of 67% men and 33% women, data not shown).Those behaviors may affect health and the detoxification process of alcohol and smoking are indeedwell-known inducers of several xenobiotic metabolism enzymes.
Among the adult population, 85% reported engaging in physical activity which was qualified aslow to medium by women and medium to high by men (Supplementary Materials Figure S1).
The correlation between consumption and health was also evaluated (data not shown). The pivotvariable was still pita consumption per day and the other variables were gender, region, professionalactivity (student, retired, etc.), and health (smoking, physical activity).
From this study, two typologies of adult consumers can be drawn: i) Women, quite young(under 20 years old), non-smokers, and who felt very healthy according to the survey. They were
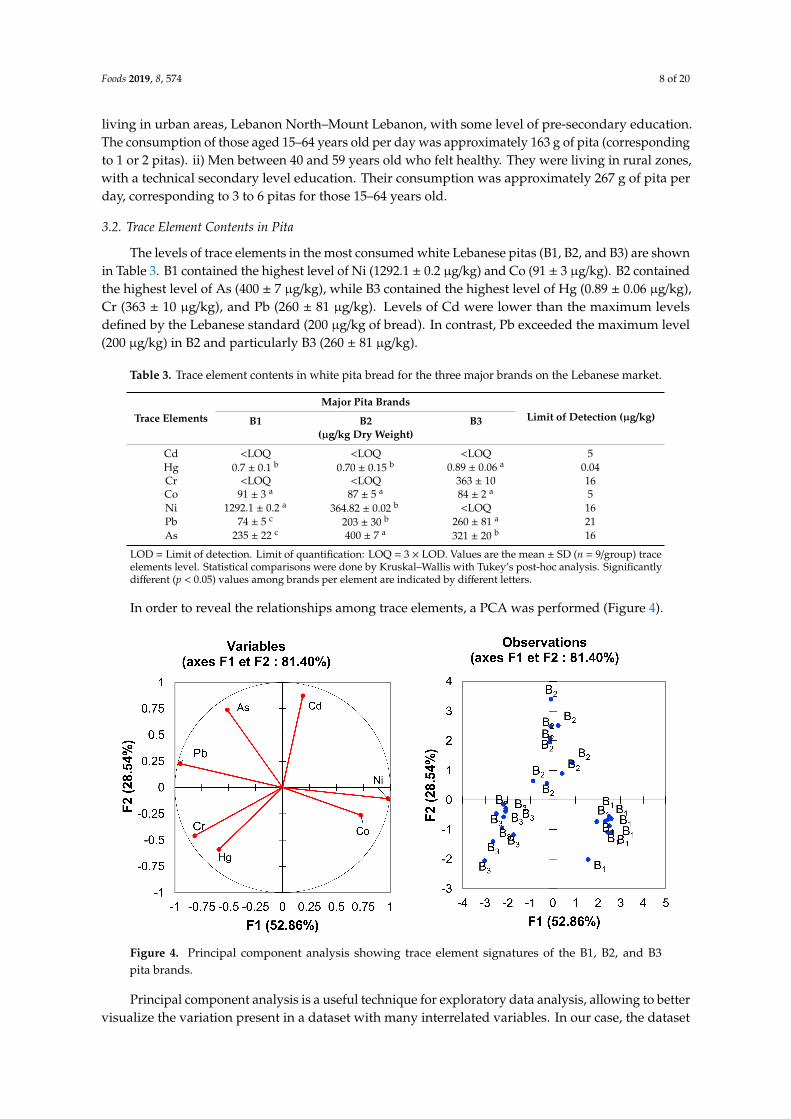
Foods 2019, 8, 574 8 of 20
living in urban areas, Lebanon North–Mount Lebanon, with some level of pre-secondary education.The consumption of those aged 15–64 years old per day was approximately 163 g of pita (correspondingto 1 or 2 pitas). ii) Men between 40 and 59 years old who felt healthy. They were living in rural zones,with a technical secondary level education. Their consumption was approximately 267 g of pita perday, corresponding to 3 to 6 pitas for those 15–64 years old.
3.2. Trace Element Contents in Pita
The levels of trace elements in the most consumed white Lebanese pitas (B1, B2, and B3) are shownin Table 3. B1 contained the highest level of Ni (1292.1 ± 0.2 µg/kg) and Co (91 ± 3 µg/kg). B2 containedthe highest level of As (400 ± 7 µg/kg), while B3 contained the highest level of Hg (0.89 ± 0.06 µg/kg),Cr (363 ± 10 µg/kg), and Pb (260 ± 81 µg/kg). Levels of Cd were lower than the maximum levelsdefined by the Lebanese standard (200 µg/kg of bread). In contrast, Pb exceeded the maximum level(200 µg/kg) in B2 and particularly B3 (260 ± 81 µg/kg).
Table 3. Trace element contents in white pita bread for the three major brands on the Lebanese market.
Trace Elements
Major Pita Brands
Limit of Detection (µg/kg)B1 B2 B3
(µg/kg Dry Weight)
Cd <LOQ <LOQ <LOQ 5Hg 0.7 ± 0.1 b 0.70 ± 0.15 b 0.89 ± 0.06 a 0.04Cr <LOQ <LOQ 363 ± 10 16Co 91 ± 3 a 87 ± 5 a 84 ± 2 a 5Ni 1292.1 ± 0.2 a 364.82 ± 0.02 b <LOQ 16Pb 74 ± 5 c 203 ± 30 b 260 ± 81 a 21As 235 ± 22 c 400 ± 7 a 321 ± 20 b 16
LOD = Limit of detection. Limit of quantification: LOQ = 3 × LOD. Values are the mean ± SD (n = 9/group) traceelements level. Statistical comparisons were done by Kruskal–Wallis with Tukey’s post-hoc analysis. Significantlydifferent (p < 0.05) values among brands per element are indicated by different letters.
In order to reveal the relationships among trace elements, a PCA was performed (Figure 4).
Figure 4. Principal component analysis showing trace element signatures of the B1, B2, and B3pita brands.
Principal component analysis is a useful technique for exploratory data analysis, allowing to bettervisualize the variation present in a dataset with many interrelated variables. In our case, the dataset
Foods 2019, 8, 574 9 of 20
contained 27 observations (9 samples per brand) described by 7 variables (the trace elements contentas mentioned in Table 3). Principal component analysis allows to see the overall “shape” of the data,identifying which samples are similar to one another and which are very different. It makes possiblethe identification of potential groups of samples that are similar and to work out which variablesmake one group different from another. When many variables correlate with one another, they will allcontribute strongly to the same principal component [37].
Figure 4 shows typical plots from the PCA with a loading plot (on the left) and a score plot (on theright). The loading plot is used for interpreting relationships among variables and the score plot isused for interpreting relationships among observations.
All variables were well represented in the F1–F2 plot (sum of squared cosine above 0.75). ThePCA shows that the following elements were correlated: Ni and Co, As and Pb as well as Cr andHg. Lead and Co were anti-correlated, as well as Ni and Pb. There was no correlation between Cdand Co, Cd and Pb, Cr and As as well as Hg and As. The Pearson correlation matrix is provided inSupplementary Materials Table S2. We observed three separate groups: B1, B2, and B3. The dispersionin B2 and B3 was larger than in B1; this dispersion can be explained by a more homogeneous samplingfor B1.
3.3. Trace Element Exposures
The population categories’ exposure to Cd, Hg, Cr, Co, Ni, Pb, and As via white pita consumptionaccording the most consumed brands is presented in Supplementary Materials Table S3. Using statistics,we observed that, for most of the cases, the B3 brand was the origin of the highest trace elementsexposure. In regards to nickel, B1 was the main source of the highest exposure. We further decidedto keep B3 TE data to calculate exposures (Table 4) using a worst-case scenario for all element levels,except for nickel for which the B1 data were retained.
Table 4. Population categories’ exposure to trace elements via white pita consumption: Cd and Hgare expressed in µg/kg body weight/week while Cr, Co, Ni, Pb, and As are expressed in µg/kg bodyweight/day
Population Categories’ Exposure to TEs via White Pita Consumption
TEs Children Teenagers Women Men
M 1 95th P 1 M 1 95th P 1 M 1 95th P 1 M 1 95th P 1
Cd 0.19 1.00 0.20 0.56 0.13 a 0.28 * 0.19 b 0.47 **Hg 0.03 0.15 0.03 0.09 0.02 a 0.04 * 0.03 b 0.07 **Cr 1.74 9.00 1.79 5.06 2.47 a 2.47 * 1.72 b 4.26 **Co 0.41 2.09 0.42 1.18 0.28 a 0.57 * 0.40 b 0.99 **Ni 2.80 10.26 4.06 12.26 2.77 a 10.26 * 4.34 a 12.26 *Pb 0.69 3.59 0.71 2.01 0.48 a 1.77 * 1.23 b 3.04 **As 1.54 7.97 1.58 4.49 1.07 a 2.19 * 1.53 b 3.77 **
The B3 brand, the origin of the highest trace elements exposure, was chosen for comparison with toxicologicalreference values except for nickel for which the B1 brand was retained. 1 M = median, 95th P = 95th percentile.Statistical tests were performed separately for young people and adults for the median and the 95th percentile.Values with different letters (a,b) in each row indicate a significant difference among medians at p < 0.05. Valueswith different stars (*,**) in each row show significant difference among 95th percentiles at p < 0.05.
For young people, there was no significant difference among both populations in terms of exposureto any element. In contrast, we found significant differences between men and women for all elementsexcept nickel. Men, at the 95th percentile, were always more exposed.
3.4. Risk Characterization (Intake Excess of TEs via Bread Consumption)
In regards to essential elements with nutritional value, risk assessment can be calculated byinsufficient intake or intake excess. This work focused only on intake excess using toxicologicalreference points or safety levels for each element case by case in order to determine if there is a safety
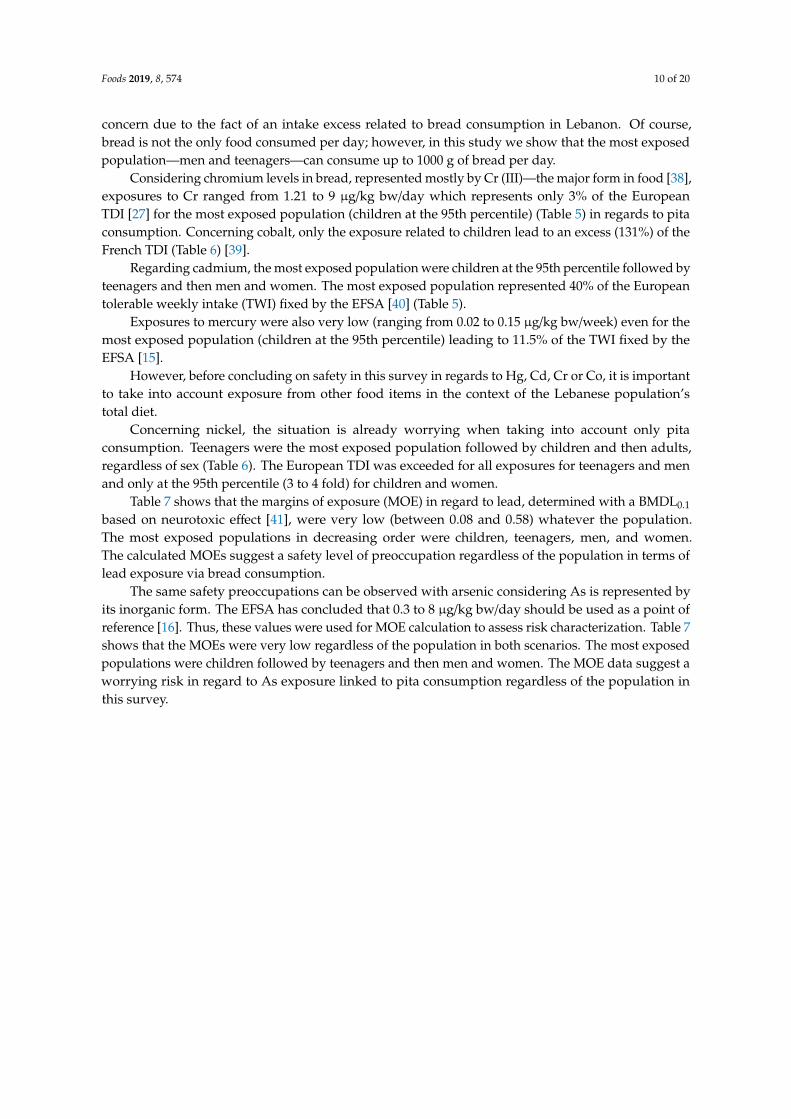
Foods 2019, 8, 574 10 of 20
concern due to the fact of an intake excess related to bread consumption in Lebanon. Of course,bread is not the only food consumed per day; however, in this study we show that the most exposedpopulation—men and teenagers—can consume up to 1000 g of bread per day.
Considering chromium levels in bread, represented mostly by Cr (III)—the major form in food [38],exposures to Cr ranged from 1.21 to 9 µg/kg bw/day which represents only 3% of the EuropeanTDI [27] for the most exposed population (children at the 95th percentile) (Table 5) in regards to pitaconsumption. Concerning cobalt, only the exposure related to children lead to an excess (131%) of theFrench TDI (Table 6) [39].
Regarding cadmium, the most exposed population were children at the 95th percentile followed byteenagers and then men and women. The most exposed population represented 40% of the Europeantolerable weekly intake (TWI) fixed by the EFSA [40] (Table 5).
Exposures to mercury were also very low (ranging from 0.02 to 0.15 µg/kg bw/week) even for themost exposed population (children at the 95th percentile) leading to 11.5% of the TWI fixed by theEFSA [15].
However, before concluding on safety in this survey in regards to Hg, Cd, Cr or Co, it is importantto take into account exposure from other food items in the context of the Lebanese population’stotal diet.
Concerning nickel, the situation is already worrying when taking into account only pitaconsumption. Teenagers were the most exposed population followed by children and then adults,regardless of sex (Table 6). The European TDI was exceeded for all exposures for teenagers and menand only at the 95th percentile (3 to 4 fold) for children and women.
Table 7 shows that the margins of exposure (MOE) in regard to lead, determined with a BMDL0.1
based on neurotoxic effect [41], were very low (between 0.08 and 0.58) whatever the population.The most exposed populations in decreasing order were children, teenagers, men, and women.The calculated MOEs suggest a safety level of preoccupation regardless of the population in terms oflead exposure via bread consumption.
The same safety preoccupations can be observed with arsenic considering As is represented byits inorganic form. The EFSA has concluded that 0.3 to 8 µg/kg bw/day should be used as a point ofreference [16]. Thus, these values were used for MOE calculation to assess risk characterization. Table 7shows that the MOEs were very low regardless of the population in both scenarios. The most exposedpopulations were children followed by teenagers and then men and women. The MOE data suggest aworrying risk in regard to As exposure linked to pita consumption regardless of the population inthis survey.
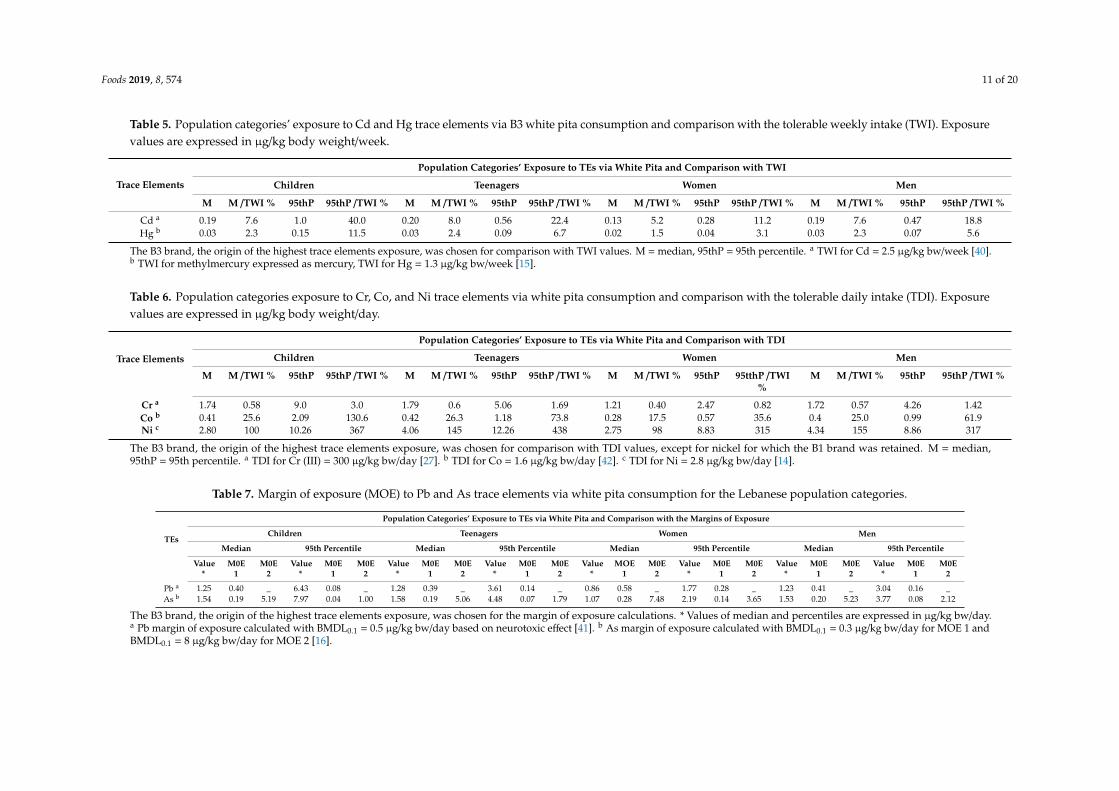
Foods 2019, 8, 574 11 of 20
Table 5. Population categories’ exposure to Cd and Hg trace elements via B3 white pita consumption and comparison with the tolerable weekly intake (TWI). Exposurevalues are expressed in µg/kg body weight/week.
Trace Elements
Population Categories’ Exposure to TEs via White Pita and Comparison with TWI
Children Teenagers Women Men
M M /TWI % 95thP 95thP /TWI % M M /TWI % 95thP 95thP /TWI % M M /TWI % 95thP 95thP /TWI % M M /TWI % 95thP 95thP /TWI %
Cd a 0.19 7.6 1.0 40.0 0.20 8.0 0.56 22.4 0.13 5.2 0.28 11.2 0.19 7.6 0.47 18.8Hg b 0.03 2.3 0.15 11.5 0.03 2.4 0.09 6.7 0.02 1.5 0.04 3.1 0.03 2.3 0.07 5.6
The B3 brand, the origin of the highest trace elements exposure, was chosen for comparison with TWI values. M =median, 95thP = 95th percentile. a TWI for Cd = 2.5 µg/kg bw/week [40].b TWI for methylmercury expressed as mercury, TWI for Hg = 1.3 µg/kg bw/week [15].
Table 6. Population categories exposure to Cr, Co, and Ni trace elements via white pita consumption and comparison with the tolerable daily intake (TDI). Exposurevalues are expressed in µg/kg body weight/day.
Trace Elements
Population Categories’ Exposure to TEs via White Pita and Comparison with TDI
Children Teenagers Women Men
M M /TWI % 95thP 95thP /TWI % M M /TWI % 95thP 95thP /TWI % M M /TWI % 95thP 95tthP /TWI%
M M /TWI % 95thP 95thP /TWI %
Cr a 1.74 0.58 9.0 3.0 1.79 0.6 5.06 1.69 1.21 0.40 2.47 0.82 1.72 0.57 4.26 1.42Co b 0.41 25.6 2.09 130.6 0.42 26.3 1.18 73.8 0.28 17.5 0.57 35.6 0.4 25.0 0.99 61.9Ni c 2.80 100 10.26 367 4.06 145 12.26 438 2.75 98 8.83 315 4.34 155 8.86 317
The B3 brand, the origin of the highest trace elements exposure, was chosen for comparison with TDI values, except for nickel for which the B1 brand was retained. M = median,95thP = 95th percentile. a TDI for Cr (III) = 300 µg/kg bw/day [27]. b TDI for Co = 1.6 µg/kg bw/day [42]. c TDI for Ni = 2.8 µg/kg bw/day [14].
Table 7. Margin of exposure (MOE) to Pb and As trace elements via white pita consumption for the Lebanese population categories.
TEs
Population Categories’ Exposure to TEs via White Pita and Comparison with the Margins of Exposure
Children Teenagers Women Men
Median 95th Percentile Median 95th Percentile Median 95th Percentile Median 95th Percentile
Value*
M0E1
M0E2
Value*
M0E1
M0E2
Value*
M0E1
M0E2
Value*
M0E1
M0E2
Value*
MOE1
M0E2
Value*
M0E1
M0E2
Value*
M0E1
M0E2
Value*
M0E1
M0E2
Pb a 1.25 0.40 _ 6.43 0.08 _ 1.28 0.39 _ 3.61 0.14 _ 0.86 0.58 _ 1.77 0.28 _ 1.23 0.41 _ 3.04 0.16 _As b 1.54 0.19 5.19 7.97 0.04 1.00 1.58 0.19 5.06 4.48 0.07 1.79 1.07 0.28 7.48 2.19 0.14 3.65 1.53 0.20 5.23 3.77 0.08 2.12
The B3 brand, the origin of the highest trace elements exposure, was chosen for the margin of exposure calculations. * Values of median and percentiles are expressed in µg/kg bw/day.a Pb margin of exposure calculated with BMDL0.1 = 0.5 µg/kg bw/day based on neurotoxic effect [41]. b As margin of exposure calculated with BMDL0.1 = 0.3 µg/kg bw/day for MOE 1 andBMDL0.1 = 8 µg/kg bw/day for MOE 2 [16].
Foods 2019, 8, 574 12 of 20
4. Discussion
4.1. Survey
The direct input of the answers to the questions asked by the data collectors on electronic tabletsmade it possible to calculate exposure values to TEs at the level of the individual insofar as we had allthe necessary data at this scale: age, gender, body weight, daily intake, and brand of pita. The mostrecent works on this topic were based on a survey conducted in 2001 and for which the calculation ofexposure from the intake was based on the average body weight of the whole surveyed sample [13,43].
This survey was based on a nationally representative survey, a real sample covering 992 Lebaneseconsumers. To our knowledge, this was the first survey assessing the pita diet in Lebanon in differentLebanese regions covering young people and adults. Previous studies focused on adults in the Beirutarea only. There was a large standard deviation in the distribution of bread consumption among adultsin all regions. This could be explained by the fact that people aged 65 and over eat a lot of bread.
The use of the questionnaire responses provided a good overview of pita consumption by region,age, and gender. It allowed for the drawing of typologies of people living in these regions too.The combination of estimates on consumption from the survey and the analytical results from pitaexperiments made it possible to do a risk evaluation.
The exposure study was done on a population consuming mainly white pita (762 individualsout of 992). The remaining population who did not consume white bread would be, in principle,more exposed to trace elements based on the article by Bou Khouzam et al. [1] which emphasizes thatLebanese brown bread is more contaminated than white.
4.2. Risk Characterization
In terms of risk characterization linked to the seven trace elements analyzed in the pita bread,a highly consumed foodstuff, two of the trace elements, Cd and Hg, appeared to not be a safety concern.The results for Cd are in accordance with the Nasreddine [13] study conducted on the total diet inan adult urban population. Bread may not be the main food involved in the highest exposure to Cd,as these authors showed that the main contributors to the dietary intake of Cd in a Beirut TDS werevegetables (46.8%) followed by breads and cereal-based products (30.9%). Same as for Cd, bread is notthe main source of Hg, for which it is fish and seafood, which is a concern for high fish consumers [17]and, particularly, pregnant women [15]. We found between 0.70 and 0.89 µg/kg of Hg in Lebanesepita which is by far less than in the study of Mestek and co-workers [44] who found 13 µg/kg of Hg inbread in the Czech Republic.
In our study, total chromium was analyzed. The B3 pita contained the highest level of Cr(0.36 mg/kg of dry weight). It is known that the major form of Cr in food is Cr (III), and the majorcontributor of Cr is bread (8%) followed by bakery products. For children, it is milk (9%) followed bypasta (6%) [22]. In this study, the analytical data from the two brands (B1 and B2) were in accordancewith Soares’ [22] team who quantified the total chromium contents (47.3 ± 20.0 µg/kg) of dry weightwhite bread samples.
Compared to Cr (VI), Cr (III) is considered an essential element for humans and authorized infood supplements in Europe without any upper limit [45]. But, in 2010, the EFSA [46] recommendedthat total Cr does not exceed 250 µg/day, a value established by the WHO [26]. Furthermore, Cr (III) cancomplex with lactate and picolinate, causing concern as it has been demonstrated to be genotoxic [27].In contrast, Cr (VI) is known to be highly toxic and carcinogenic (Group 1, [47]). It also induces skindermatitis, then the interconversion will be of relevance in terms of risk assessment.
Even if data on the presence of Cr (VI) in food are missing, it is considered that food is a largereducing medium and that oxidation of Cr (III) to Cr (VI) would not occur. Additionally, most of theCr (VI) is considered to be reduced in the stomach to Cr (III) [27].
Humans are exposed to Cr mainly via food, but it can be present also in water. Concerningbottled water in Lebanese markets [48], a study of the physicochemical and heavy metal parameters
Foods 2019, 8, 574 13 of 20
in 32 samples of bottled waters, 25 of these samples showed values below 1 µg/L for Cr, while theother samples showed values ranging between 1 and 4 µg/L in the drinking water. Although naturallyoccurring Cr (VI) is rarely found in the environment, its presence in ground and surface waters, as aconsequence of oxidation of Cr (III)-bearing minerals by Mn (IV) oxides, has been reported recently [49].Furthermore, in terms of the total quantity found in bread, we do not know its respective part comingfrom the wheat flour or water used during the bread-making process. Wheat are among species thatdemonstrate the ability to bio-accumulate chromium the most, just after tomato [5]. An average valueof Cr below 0.05 mg/kg of dry weight was measured in wheat seeds in Swedish long-term soil-fertilityexperiments between 1967 and 2003 [50].
The recipient might also be a source of contamination if Cr is released. Indeed, migration ofchromium from steel material occurred in the past mostly from Asia (China) and was above the upperlegal limits for food contact material [51].
The EFSA panel recommended the generation of data using sensitive analytical methodologieswhich specifically measure the content of Cr (III) and Cr (VI) in food and drinking water in differentEU Member States [27]; the issue is the same for Lebanon. However, Cr speciation is difficult toconduct, especially in complex matrices. Chromium speciation depends on several factors such aspH, concentration, oxidation state, and complexation with natural components present in the matrixsuch as peptide [49]. Soares and co-workers [22] mentioned the presence of Cr (VI) in bread afterextraction of Cr by alkaline solutions. However, Novotnik et al. [38] demonstrated that the only Crspecies in bread is Cr (III) by spiking with enriched isotopes of 53Cr (III) and 50Cr (VI), a more accuratequantification, and using HPLC-ICP-MS. Thus, we made a characterization in regards to Cr (III) and,in this way, there were no safety concerns in this study for Cr (III) in Lebanese pita bread.
For cobalt, the exposure of young people under 15 years old at the 95th percentile exceeded theTDI by a percentage of 131%. Bread and cereals are significant source of Co exposure (18.1%), with adaily intake of cobalt estimated to be around 11.4 µg/day according to the Nasreddine study [13].Indeed, in their study they found 6.36 µg/kg of cobalt in bread and cereals. In this study, the level ofCo was 91 µg/kg for the B1 pita brand, which is 7 fold more than in Australian bread and 13.5 foldhigher than the data from the Nasreddine study [13] but 1.8 fold less than in Ethiopian bread [52].
In Lebanon, imported flour samples used in Lebanese white pita presented values for cobaltbetween 2 ± 2 and 33 ± 7 µg/kg which is far less than in the pita. Cobalt contamination can also occurduring bread preparation via the water used. The mean level of Co in tap water is approximately9 µg/L (IRAL, personal communication). In 2013, the Environmental Working Group’s (EWG) missiondetected Co in only one sample (6 analyzed) and found 1.01 µg/L [53]. Furthermore, cobalt can alsobe released from food contact materials (FCMs) as it is used in ceramics [54]; thus, we can wonder ifcobalt migration can occur from recipients used for making bread in Lebanon.
Several forms of cobalt (II) (sulphate, dichloride) are classified as presumed human carcinogensvia the inhalatory route [55]. The IARC classified the soluble form of cobalt II in class 2B but as metal,Co was classified in 2A [56]. Although Co (II) salts are able to induce genotoxicity in vitro and in vivoafter oral or parenteral exposure; however, there is a lack of carcinogenesis studies in humans andanimals following an oral route [57]. The EFSA concluded that it cannot be excluded that cobalt couldhave a non-threshold toxicological effect [58]. In France, ANSES made the recommendation to reducefood exposure to cobalt in infants under 3 years old [39]. Thus, for cobalt, the daily intake from alldietary sources may be quite pertinent to monitor in order to determine the total exposure of youngpeople under 15 years old in Lebanon.
In regards to nickel, the B1 brand contained the highest value (1292 µg/kg), which was abovevalues found in studies for Nigerian, Ethiopian, and Spanish bread [52,59,60] but under those obtainedin Iranian bread [61]. However, for another brand the value (365 µg/kg) was in the same range.
The average daily intake of nickel was estimated at 126.27 µg/day bread and cereals contributingto a 54.73 µg/day Ni intake in the Lebanese adult urban population [13].
Foods 2019, 8, 574 14 of 20
In a French TDS study regarding the infant population, the value determined in bread wasapproximately 69.5 µg/kg [39]. The contribution of drinking water to total exposure to nickel wasvery small across dietary surveys and age classes [14]. We do not have an explanation, but this highlevel could be due to the recipient used by bakers. Using the TDI 2.8 µg/kg bw/day [14] for oralchronic exposure, the data demonstrate that the percentage of Ni TDI was exceeded 3 to 4 fold for allpopulations with the 10–14 years old range being the most exposed. These data are in accordance withthe TDS studies also showing a safety concern in France for very young people (<3 years old) [39].
Nickel compounds and metallic nickel are classified as human carcinogens, respectively, group1 and group 2B after inhalation [62]. Available studies in animals suggest that exposure to nickelsalts lead to renal effects and increases neonatal mortality with the kidney being the principal target.Reproductive and developmental toxicity were the critical effects after chronic oral exposure retainedfor risk characterization. However, oral exposure to nickel salts could be at the origin of contactdermatitis for sensitive populations. Indeed, oral nickel can also cause an oral and chronic effect inpeople dermally sensitized [14].
In humans, absorption of Ni varies according to the method of exposure (in water it is 40 foldmore absorbed compared to food; 0.7% and the bioavailability varies with the food type [63]). There areno maximum levels in food for nickel; in contrast, a value of 20 µg/L is fixed in water intended forhuman consumption and in mineral waters in Europe [64,65].
In this study, arsenic exposure was more worrying, as we found a high level of arsenic for allbrand analyzed (235–400 µg/kg) which is around 63 fold higher than those found in a bread study inthe UK [66] and 32 fold higher than those mentioned in a French infant TDS study [39]. Bou Khouzamet al. [1] mentioned seasonal variation in the arsenic concentration in bread (33 µg/kg in dry season,which is 4 fold higher than in wet season). Arsenic was not studied by Nasreddine et al. [13] andcalculated MOEs were very low for all bakeries and the population. These data are in accordance withthe data and risk characterization in 19 countries in Europe [16], for example, in France where there isa safety concern with MOEs lower than 36 [39], suggesting that the situation in Lebanon is worrying.
The inorganic form of As, which is known to be toxic, may cause human malignancies. It wasclassified as carcinogenic (group 1) in Reference [67]. The toxicity, due to the inorganic form, occurs byan epigenetic mechanism, and there is increasing evidence that early life exposure affecting fetal andinfant growth [68] may cause chronic disease later in life [69]. This highlights the urgent need to obtaindata on the effect of the toxicity of As on development [39]. Arsenic passes through the placentalbarrier in humans [70], resulting in similar levels in both the fetus and mother. Both the inorganicform and its methylated metabolites are transferred [71]. The effect of As on the endocrine systemhas also been investigated for many years showing a disruption on the gonadal, adrenal, and thyroidendocrine systems [72]. Furthermore, it is has been shown a toxic effect due to an interaction betweenCd and As [73,74]. Drinking water, crops irrigated with contaminated water, and food prepared withcontaminated water are sources of exposure [75].
The EFSA’s recommendation is to reduce inorganic arsenic exposure in food and develop robustvalidated methods to determine the inorganic form [16]. We do not distinguish between organic andinorganic form of As in this study. It is known that arsenic intake is higher from solid foods thanfrom liquids.
Furthermore, speciation plays a major role in determining the amount of arsenic absorbedafter consumption of As contaminated food as well as bioavailability with significant interspeciesdifferences for organic arsenic. Regards to inorganic form, absorption can be high as demonstratedwith contaminated rice [76,77].
Representative data on speciation are indeed scarce. The EFSA panel assumed a proportion of thecontaminant to inorganic form (the toxic one) to vary between 50 (best case) to 100% (worst case) of thetotal arsenic reported in food commodities in Europe, other than fish and seafood [16]. Furthermore,in bread, 92% of the inorganic form has been found [78]. Cereals and cereal-based products wereidentified as largely contributing to the daily exposure to inorganic arsenic, as it was quantified as 53 µg
Foods 2019, 8, 574 15 of 20
up to 72 µg of arsenic per kilo for all cereals and cereal product categories. In wheat samples, it wasdemonstrated that 91% to 95% of As was in the inorganic form [77,78]. In wheat plants cultivated inthe Bekaa region, the element As presented values between 288.3 ± 14.7 and 743.7 ± 25.4 mg/kg. In theirrigation water used in the Bekaa sites cultivated for wheat plants, the As content varied between0.8 ± 0.3 µg/L and 1.2 ± 0.2 µg/L (IRAL data). Indeed, the level of As in drinking water in Lebanonvaried between 1.2 and 4.5 µg/L [79]. Water used for making bread can be the main contributor to thelevel of arsenic in the pita with the main form recovered in drinking water as inorganic. It is importantto note than that change in the speciation of As can occur during food preparation [80].
Concerning the level of lead in the different brands: B2 and B3 contents were more than 2.5 foldhigher than B1 (74, 203, and 260 µg/kg, respectively). The order of magnitude of B1 is in accordancewith Turkish, Iranian, Ethiopian, and Spanish studies on bread [52,59] and 7 fold more higher than indata on the Czech Republic [44]. The B3 pita lead content was 32 fold higher than Lebanese data [13]which focused on Beirut. The authors noticed that the lead exposure in Beirut was even two fold lowercompared to a previous study [43]. Thus, our data were not in accordance, but it took into account allthe Lebanese regions including rural ones. The lead origin may be from wheat. Several samples ofLebanese wheat cultivated in the Bekaa region were studied, showing values of lead varying between4.5 and 23 µg/kg but far less than in the bread, noting that the lead values in Lebanese wheat sampleswere lower than the values showing in wheat samples in Saudi Arabian markets (2.81 ± 0.08 mg/kgdry weight) [12]. While, the lead levels, measured in five wheat flour samples in Lebanese marketsvaried between 0.0045 ± 0.002 and 0.023 ± 0.016 mg/kg dry weight, they were lower than valuespresented in wheat flour samples in the Canary Islands and used for bread production (varyingbetween 0.037 ± 0.013 and 0.056 ± 0.045 mg/kg fresh weight) [81].
Furthermore, lead can also be a contaminant issued from recipient food contact materials or waterused for bread making.
Human data show that the developing nervous system is a critical target in children. Variouswater soluble and insoluble lead can induce tumors in rodents, especially renal tumors as acarcinogenic/promoter; brain gliomas were also observed. Classified lead compounds are probablycarcinogenic to humans on the basis of limited evidence of carcinogenicity in humans and sufficientevidence in animals [56].
It is important to note that due to the long lead half-life, chronic exposure is of most concern andchildren absorb lead after ingestion to a much greater extent (70% of the amount of lead ingested) thanadults (20%) [82].
All MOEs calculated with exposure only via pita consumption in this study were very low, but inthe same range than in France and Europe [17,39,41], suggesting an exposure safety concern and that itis necessary to decrease Pb exposure, for example, by varying the diet due to the difficulty in reducingPb contamination.
For both lead and arsenic, this contamination occurred for all bread brands analyzed in this studyand there is a safety concern (Supplementary Materials Table S3).
5. Conclusions
This was the first study conducted all over Lebanon showing the exposure of different categoriesof Lebanese population to trace elements via bread. A survey of daily consumption of pita bread wasconducted on a sample of 992 people. Among the four categories (i.e., children, teenagers, women,and men), white bread was the most consumed. Men consumed the highest quantity (282 g/day).The survey revealed that three brands of white pita were the most consumed: B1, B2, and B3.
Seven trace elements (i.e., As, Cd, Co, Cr, Hg, Ni, and Pb) were quantified in pitas coming from B1,B2, and B3. B1 was characterized by high levels of Ni and Co. B2 was characterized by the presence ofAs and Cd, and B3 was characterized by the presence of Cr, Hg, and Pb. Lead concentrations exceededthe authorized limits of the Lebanese standard for bread in the two brands. Further analysis should be
Foods 2019, 8, 574 16 of 20
performed on soil, wheat, flour, and water in order to determine the source of the contamination andto reduce exposure.
The B3 brand was at the origin of the highest trace element exposure, except for nickel for whichB1 was retained. In terms of risk characterization, there was no safety concern due to the fact ofpita consumption for all studied categories with Hg, Cd, Cr, and for Co except the 95th percentileof the children category (6–9 years old). Nickel exposure showed an excess of the TDI up to 4 foldfor the most exposed populations (95th percentile). There were safety concerns related to As and Pb,as the margins of exposure were vey low. To our knowledge, this is the first time that exposure toAs was studied in the Lebanese population. To confirm these observed data, it is urgent to analyzethe inorganic arsenic form levels in bread. Experiments are currently being run to study any cocktaileffects (synergistic) using pertinent bioassays due to the exposure to the sum of trace element identifiedin bread. The ultimate objectives are to protect the Lebanese population by reducing exposures topopulations particularly exposed to TE presenting safety concern and to make recommendations,as bread is only one part of the daily diet.
Supplementary Materials: The following are available online at http://www.mdpi.com/2304-8158/8/11/574/s1,Survey and questionnaire related to Lebanese bread consumption. Figure S1: Distribution of physical activityintensity by gender in adult population. Table S1-a: Cross-tabulation of consumed pita type occurrences for thetotal 992 respondents in the number of individuals. Table S1-b: Types of consumed bread for the subpopulationconsuming mainly white pita (762 individuals). Table S2: Pearson correlation matrix of the principal componentanalysis. Table S3: Population categories’ exposure to Cd, Hg, Cr, Co, Ni, Pb, and As trace elements via white pitaconsumption according the most consumed brands.
Author Contributions: Conceptualization, C.D., R.O., H.C., P.C., E.B.-M. and M.-C.C.; Formal analysis, N.L., L.D.and E.B.-M.; Funding acquisition, C.D., M.A. and P.C.; Investigation, N.L.; Methodology, N.L., P.C., L.D., E.B.-M.and M.-C.C.; Project administration, M.A., P.C. and M.-C.C.; Supervision, C.D., R.O., H.C., M.A., P.C. and E.B.-M.;Validation, N.L. and E.B.-M.; Writing—original draft, N.L.; Writing—review and editing, C.D., R.O., H.C., P.C.,L.D., E.B.-M. and M.-C.C.
Funding: This research was funded by the project PHC-Cèdre (bilateral French–Lebanese funding program) andthe Lebanese Agricultural Research Institute (LARI).
Acknowledgments: The authors warmly thank and express their gratitude to Jacqueline Saad Harfouche for herhelp in the survey implementation.
Conflicts of Interest: The authors declare no conflict of interest. The funders had no role in the design of thestudy; in the collection, analyses, or interpretation of data; in the writing of the manuscript, or in the decision topublish the results.
References
1. Bou Khouzam, R.; Pohl, P.; Al Ayoubi, B.; Jaber, F.; Lobinski, R. Concentrations of toxic and essential elementsin Lebanese bread. Pure Appl. Chem. 2012, 84, 181–190. [CrossRef]
2. Marín, S.; Pardo, O.; Sánchez, A.; Sanchis, Y.; Vélez, D.; Devesa, V.; Font, G.; Yusà, V. Assessment of metallevels in foodstuffs from the Region of Valencia (Spain). Toxicol. Rep. 2018, 5, 654–670. [CrossRef] [PubMed]
3. Chaza, C.; Rayane, S.; Sopheak, N.; Moomen, B.; Baghdad, O. Distribution of Organochlorine Pesticidesand Heavy Metals in Lebanese Agricultural Soil: Case Study—Plain of Akkar. Int. J. Environ. Res. 2018,12, 631–649. [CrossRef]
4. Baize, D.; Bellanger, L.; Tomassone, R. Relationships between concentrations of trace metals in wheat grainsand soil. Agron. Sustain. Dev. 2009, 29, 297–312. [CrossRef]
5. Gupta, N.; Yadav, K.K.; Kumar, V.; Kumar, S.; Chadd, R.P.; Kumar, A. Trace elements in soil-vegetablesinterface: Translocation, bioaccumulation, toxicity and amelioration—A review. Sci. Total Environ. 2019,651, 2927–2942. [CrossRef]
6. Mitra, G. Essential Plant Nutrients and Recent Concepts about their Uptake. In Essential Plant Nutrients:
Uptake, Use Efficiency, and Management; Naeem, M., Ansari, A.A., Gill, S.S., Eds.; Springer InternationalPublishing: Cham, Switzerland, 2017; pp. 3–36. ISBN 978-3-319-58841-4.
7. Counter, S.A.; Buchanan, L.H. Mercury exposure in children: A review. Toxicol. Appl. Pharmacol. 2004,198, 209–230. [CrossRef]
Foods 2019, 8, 574 17 of 20
8. (Ine)Van der Fels-Klerx, H.J.; Edwards, S.G.; Kennedy, M.C.; O’Hagan, S.; O’Mahony, C.; Scholz, G.;Steinberg, P.; Chiodini, A. A framework to determine the effectiveness of dietary exposure mitigation tochemical contaminants. Food Chem. Toxicol. 2014, 74, 360–371. [CrossRef]
9. Arnich, N.; Sirot, V.; Rivière, G.; Jean, J.; Noël, L.; Guérin, T.; Leblanc, J.-C. Dietary exposure to trace elementsand health risk assessment in the 2nd French Total Diet Study. Food Chem. Toxicol. 2012, 50, 2432–2449.[CrossRef]
10. Barone, G.; Dambrosio, A.; Storelli, A.; Busco, A.; Ioanna, F.; Quaglia, N.C.; Giacominelli-Stuffler, R.;Storelli, M.M. Traditional Italian cheeses: Trace element levels and estimation of dietary intake. J. Food
Compos. Anal. 2018, 66, 205–211. [CrossRef]11. Tang, J.; Huang, Z.; Pan, X.-D. Exposure assessment of heavy metals (Cd, Hg, and Pb) by the intake of local
foods from Zhejiang, China. Environ. Geochem. Health 2014, 36, 765–771. [CrossRef]12. Ali, M.H.H.; Al-Qahtani, K.M. Assessment of some heavy metals in vegetables, cereals and fruits in Saudi
Arabian markets. Egypt. J. Aquat. Res. 2012, 38, 31–37. [CrossRef]13. Nasreddine, L.; Nashalian, O.; Naja, F.; Itani, L.; Parent-Massin, D.; Nabhani-Zeidan, M.; Hwalla, N. Dietary
exposure to essential and toxic trace elements from a Total diet study in an adult Lebanese urban population.Food Chem. Toxicol. 2010, 48, 1262–1269. [CrossRef] [PubMed]
14. EFSA. Scientific Opinion on the risks to public health related to the presence of nickel in food and drinkingwater. EFSA J. 2015, 13, 4002.
15. EFSA. Scientific Opinion on the risk for public health related to the presence of mercury and methylmercuryin food. EFSA J. 2012, 10, 2985.
16. EFSA. Scientific Opinion on Arsenic in Food. EFSA J. 2009, 7, 1351. [CrossRef]17. ANSES. Second French Total Diet Study (TDS 2) Report 1. Inorganic Contaminants, Minerals, Persistent
Organic Pollutants, Mycotoxins and Phytoestrogens. ANSES Opinion. Available online: https://www.anses.fr/en/system/files/PASER2006sa0361Ra1EN.pdf (accessed on 26 July 2019).
18. Ahmed, M.T.; Abdel Hadi, E.-S.; El Samahy, S.; Youssof, K. The influence of baking fuel on residues ofpolycyclic aromatic hydrocarbons and heavy metals in bread. J. Hazard. Mater. 2000, 80, 1–8. [CrossRef]
19. Ghoreishy, F.; Salehi, M.; Fallahzade, J. Cadmium and lead in rice grains and wheat breads in Isfahan (Iran)and human health risk assessment. Hum. Ecol. Risk Assess. An Int. J. 2019, 25, 924–934. [CrossRef]
20. Mathebula, M.W.; Mandiwana, K.; Panichev, N. Speciation of chromium in bread and breakfast cereals.Food Chem. 2017, 217, 655–659. [CrossRef]
21. Oyekunle, J.A.O.; Adekunle, A.S.; Ogunfowokan, A.O.; Olutona, G.O.; Omolere, O.B. Bromate and tracemetal levels in bread loaves from outlets within Ile-Ife Metropolis, Southwestern Nigeria. Toxicol. Rep. 2014,1, 224–230. [CrossRef]
22. Soares, M.E.; Vieira, E.; De Lourdes Bastos, M. Chromium speciation analysis in bread samples. J. Agric.
Food Chem. 2010, 58, 1366–1370. [CrossRef]23. Libnor. NL 240 Arabic Lebanese Bread; Libnor: Beirut, Lebanon, 2011.24. Kicinska, A.; Glichowska, P.; Mamak, M. Micro- and macroelement contents in the liver of farm and wild
animals and the health risks involved in liver consumption. Environ. Monit. Assess. 2019, 191, 132. [CrossRef][PubMed]
25. EFSA. Dietary Reference Values for nutrients Summary report. EFSA Sup. Publ. 2017, 14, e15121E.26. World Health Organization. Trace Elements in Human Nutrition and Health; WHO: Geneva, Switzerland, 1996.27. EFSA. Scientific Opinion on the risks to public health related to the presence of chromium in food and
drinking water. EFSA J. 2014, 12, 3595.28. CAS Central Administration of Statistics. Living Conditions Survey. Available online: http://www.cas.gov.
lb/index.php/demographic-and-social-en (accessed on 16 July 2019).29. Bethlehem, J. Applied Survey Methods—A Statistical Perspective; Wiley: Hoboken, NJ, USA, 2009.30. R Core Team. R: A language and Environment for Statistical Computing; R Foundation for Statistical Computing:
Vienna, Austria, 2018.31. RStudio Team. RStudio: Integrated Development for R; RStudio Inc.: Boston, MA, USA, 2016.32. Sprent, P.; Smeeton, N.C. Applied Nonparametric Statistical Methods; Chapman & Hall/CRC:
Boca Raton, FL, USA, 1989.33. Mendiburu, F. De Agricolae: Statistical Procedures for Agricultural Research; Scientific Research Publishing:
Wuhan, China, 2019.
Foods 2019, 8, 574 18 of 20
34. Mangiafico, S. Rcompanion: Functions to Support Extension Education Program Evaluation; The ComprehensiveR Archive Network: New Jersey, NJ, USA, 2019.
35. Ganassali, S. Enquêtes et Analyse de Données Avec Sphinx; Pearson Education France: Montreuil, France, 2014;ISBN 978-2-326-00073-5.
36. CAS Central Administration for Statistics. Population of Lebanon. Life expectancy of Lebanon. Density ofpopulation in Lebanon. Available online: http://en.worldstat.info/Asia/Lebanon/ (accessed on 16 July 2019).
37. Brereton, R.G. Applied Chemometrics for Scientists; John Wiley & Sons: Hoboken, NJ, USA, 2007;ISBN 978-0-470-05777-3.
38. Novotnik, B.; Zuliani, T.; Šcancar, J.; Milacic, R. Chromate in food samples: An artefact of wrongly appliedanalytical methodology? J. Anal. At. Spectrom. 2013, 28, 558–566. [CrossRef]
39. ANSES Infant Total Diet Study (iTDS). Available online: https://www.anses.fr/en/system/files/ERCA2010SA0317RaEN.pdf (accessed on 26 July 2019).
40. EFSA. Cadmium in food—Scientific opinion of the Panel on Contaminants in the Food Chain. EFSA J. 2009,7, 980.
41. EFSA. Scientific Opinion on Lead in Food. EFSA J. 2010, 8, 1570. [CrossRef]42. Available online: https://www.anses.fr/fr/system/files/PASER2006sa0361.pdf (accessed on 26 July 2019).43. Nasreddine, L.; Hwalla, N.; Sibai, A.; Hamzé, M.; Parent-Massin, D. Food consumption patterns in an adult
urban population in Beirut, Lebanon. Public Health Nutr. 2006, 9, 194–203. [CrossRef]44. Mestek, O.; Komínková, J.; Šantrucek, J.; Kacer, P.; Mališová, K.; Koplík, R. Analyses of trace metals, peptide
ligands of trace metals and mercury speciation in home prepared bread. Chem. Speciat. Bioavailab. 2012,24, 79–88. [CrossRef]
45. European Parliament. Directive 2002/46/EC of the European Parliament and of the Council of 10 June 2002 onthe approximation of the laws of the Member States relating to food supplements (Text with EEA relevance).Off. J. Eur. Communities 2002, 183, 51–57.
46. EFSA. Scientific Opinion on the safety of chromium picolinate as a source of chromium added for nutritionalpurposes to foodstuff for particular nutritional uses and to foods intended for the general population. EFSA J.
2010, 8, 1883.47. IARC. IARC Monographs Volume 100C. In Chromium (VI) Compounds; International Agency for Research on
Cancer: Lyon, France, 2012.48. Semerjian, L.A. Quality assessment of various bottled waters marketed in Lebanon. Environ. Monit. Assess.
2011, 172, 275–285. [CrossRef] [PubMed]49. Šcancar, J.; Milacic, R. A critical overview of Cr speciation analysis based on high performance liquid
chromatography and spectrometric techniques. J. Anal. At. Spectrom. 2014, 29, 427–443. [CrossRef]50. Kirchmann, H.; Mattsson, L.; Eriksson, J. Trace element concentration in wheat grain: Results from the
Swedish long-term soil fertility experiments and national monitoring program. Environ. Geochem. Health
2009, 31, 561–571. [CrossRef] [PubMed]51. RASFF. RASFF Portal. Available online: https://webgate.ec.europa.eu/rasff-window/portal/?event=
openRecallList&StartRow=44601 (accessed on 26 July 2019).52. Ergetie, Z.; Berhane, A.; Bayew, T.; Hymete, A. Comparative analysis of Trace metals in bread from five
bakeries in Addis Ababa, Ethiopia. Glob. Adv. Res. J. Pharm. Pharmacol. 2013, 2, 363–367.53. EWG. EWG’s Tap Water Database: Contaminants in Your Water. Available online:
https://www.ewg.org/tapwater//system-contaminant.php?pws=MO5010458&contamcode=1081?pws=MO5010458&contamcode=1081 (accessed on 18 July 2019).
54. Available online: https://www.anses.fr/fr/system/files/MCDA2010sa0095.pdf (accessed on 26 July 2019).55. Available online: https://eur-lex.europa.eu/LexUriServ/LexUriServ.do?uri=OJ:L:2008:353:0001:1355:en:PDF
(accessed on 26 July 2019).56. IARC. IARC Monographs on the Evaluation of Carcinogenic Risks to Humans. In Cobalt in Hard Metals
and Cobalt Sulfate, Gallium Arsenide, Indium Phosphide and Vanadium Pentoxide; the International Agency forResearch on Cancer: Lyon, France, 2006.
57. EFSA. Scientific Opinion on the use of cobalt compounds as additives in animal nutrition. EFSA J. 2009,7, 1383. [CrossRef]
Foods 2019, 8, 574 19 of 20
58. EFSA. Scientific Opinion on safety and efficacy of cobalt compounds (E3) as feed additives for all animalspecies: Cobaltous acetate tetrahydrate, basic cobaltous carbonate monohydrate and cobaltous sulphateheptahydrate, based on a dossier submitted by TREAC EEIG. EFSA J. 2012, 10, 2791.
59. Cuadrado, C.; Kumpulainen, J.; Carbajal, A.; Moreiras, O. Cereals Contribution to the Total Dietary Intake ofHeavy Metals in Madrid, Spain. J. Food Compos. Anal. 2000, 13, 495–503. [CrossRef]
60. Onianwa, P.C.; Lawal, J.A.; Ogunkeye, A.A.; Orejimi, B.M. Cadmium and Nickel Composition of NigerianFoods. J. Food Compos. Anal. 2000, 13, 961–969. [CrossRef]
61. Khaniki, G.R.J.; Yunesian, M.; Mahvi, A.H.; Nazmara, S. Trace metal contaminants in Iranian flat breads.J. Agric. Soc. Sci. (Pak.) 2005, 1, 301–303.
62. IARC Monographs on the Evaluation of Carcinogenic Risks to Humans. Arsenic, Metals, Fibres and Dusts;IARC Publication: Lyon, France, 2012.
63. ATSDR. Toxicological Profile for Nickel; Agency for Toxic Substances and Disease Registry, US Department ofHealth and Human Services: Atlanta, GA, USA, 2005.
64. European Commission. Commission Directive 2003/40/EC Commission Directive 2003/40/EC of 16 May2003 establishing the list, concentration limits and labelling requirements for the constituents of naturalmineral waters and the conditions for using ozone-enriched air for the treatment of natural mineral watersand spring waters. Off. J. Eur. Communities 2003, 126, 34–39.
65. European. Council Directive 98/83/EC Council Directive 98/83/EC of 3 November 1998 on the quality ofwater intended for human consumption. Off. J. Eur. Communities 1998, 330, 32–54.
66. Sadee, B.; Foulkes, M.E.; Hill, S.J. Coupled techniques for arsenic speciation in food and drinking water:A review. J. Anal. At. Spectrom. 2014, 30, 102–118. [CrossRef]
67. IARC. Overall Evaluations of Carcinogenicity: An Updating of IARC Monographs Volumes 1 to 42; IARC Publication:Lyon, France, 1987.
68. Vahter, M. Health Effects of Early Life Exposure to Arsenic. Basic Clin. Pharmacol. Toxicol. 2008, 102, 204–211.[CrossRef] [PubMed]
69. Godfrey, K.M.; Barker, D.J. Fetal nutrition and adult disease. Am. J. Clin. Nutr. 2000, 71, 1344S–1352S.[CrossRef] [PubMed]
70. Hall, M.; Gamble, M.; Slavkovich, V.; Liu, X.; Levy, D.; Cheng, Z.; van Geen, A.; Yunus, M.; Rahman, M.;Pilsner, J.R.; et al. Determinants of Arsenic Metabolism: Blood Arsenic Metabolites, Plasma Folate, Cobalamin,and Homocysteine Concentrations in Maternal–Newborn Pairs. Environ. Health Perspect. 2007, 115, 1503–1509.[CrossRef]
71. Concha, G.; Vogler, G.; Lezcano, D.; Nermell, B.; Vahter, M. Exposure to inorganic arsenic metabolites duringearly human development. Toxicol. Sci. 1998, 44, 185–190. [CrossRef]
72. Sun, H.-J.; Xiang, P.; Luo, J.; Hong, H.; Lin, H.; Li, H.-B.; Ma, L.Q. Mechanisms of arsenic disruption ongonadal, adrenal and thyroid endocrine systems in humans: A review. Environ. Int. 2016. [CrossRef]
73. Lin, X.; Gu, Y.; Zhou, Q.; Mao, G.; Zou, B.; Zhao, J. Combined toxicity of heavy metal mixtures in liver cells.J. Appl. Toxicol. 2016, 36, 1163–1172. [CrossRef]
74. Su, H.; Li, Z.; Fiati Kenston, S.S.; Shi, H.; Wang, Y.; Song, X.; Gu, Y.; Barber, T.; Aldinger, J.; Zou, B.; et al.Joint Toxicity of Different Heavy Metal Mixtures after a Short-Term Oral Repeated-Administration in Rats.Int. J. Environ. Res. Public Health 2017. [CrossRef]
75. Kapaj, S.; Peterson, H.; Liber, K.; Bhattacharya, P. Human Health Effects From Chronic ArsenicPoisoning–A Review. J. Environ. Sci. Health Part A 2006, 41, 2399–2428. [CrossRef]
76. Juhasz, A.L.; Smith, E.; Weber, J.; Rees, M.; Rofe, A.; Kuchel, T.; Sansom, L.; Naidu, R. In VivoAssessment of Arsenic Bioavailability in Rice and Its Significance for Human Health Risk Assessment.Environ. Health Perspect. 2006, 114, 1826–1831. [CrossRef]
77. Raber, G.; Stock, N.; Hanel, P.; Murko, M.; Navratilova, J.; Francesconi, K.A. An improved HPLC–ICPMSmethod for determining inorganic arsenic in food: Application to rice, wheat and tuna fish. Food Chem. 2012,134, 524–532. [CrossRef]
78. D’Amato, M.; Aureli, F.; Ciardullo, S.; Raggi, A.; Cubadda, F. Arsenic speciation in wheat and wheat productsusing ultrasound- and microwave-assisted extraction and anion exchange chromatography-inductivelycoupled plasma mass spectrometry. J. Anal. At. Spectrom. 2011, 26, 207–213. [CrossRef]
79. Lebanon Utilities. Lebanon Water Quality Report. Available online: http://www.lebanon-utilities.com/wp-content/uploads/2017/04/Lebanon-Water-Quality-Report-2016.pdf (accessed on 26 July 2019).

Foods 2019, 8, 574 20 of 20
80. Devesa, V.; Vélez, D.; Montoro, R. Effect of thermal treatments on arsenic species contents in food. Food Chem.
Toxicol. 2008, 46, 1–8. [CrossRef] [PubMed]81. Tejera, R.L.; Luis, G.; González-Weller, D.; Caballero, J.M.; Gutiérrez, Á.J.; Rubio, C.; Hardisson, A. Metals in
wheat flour; comparative study and safety control. Nutr. Hosp. 2013. [CrossRef]82. ATSDR. Environmental Medicine (CSEM) Lead Toxicity; Agency for Toxic Substances and Disease Registry,
US Department of Health and Human Services: Atlanta, GA, USA, 2010.
© 2019 by the authors. Licensee MDPI, Basel, Switzerland. This article is an open accessarticle distributed under the terms and conditions of the Creative Commons Attribution(CC BY) license (http://creativecommons.org/licenses/by/4.0/).

Supplementary data

1
Foods 2019, 8, 574; doi:10.3390/foods8110574 www.mdpi.com/journal/foods
Manuscript Title: Lebanese population exposure to trace elements via white bread consumption
Supplementary data
Survey and questionnaire related to Lebanese bread consumption.
A study was conducted on the presence of metallic trace elements (ETM) throughout the Lebanese bread chain, from
farm to fork. Some of these elements may cause health problems for the consumer, so the amount of Lebanese bread
(likely to be contaminated) consumed per day and per person must be known, to assess the risk related to a route of
oral exposure of trace elements.
Metallic trace elements are contaminants in the environment and foodstuffs, including bread. Once in excess of the
environment, trace elements enter the soil, water or air and contaminate certain foods. They can cause a risk to human
health if the consumer is too much exposed, for example, by ingesting cereals grown in contaminated soils. It is
therefore important to monitor the presence of these contaminants in the bread and to know the exposure of the
consumer by conducting a survey among the population in different regions of Lebanon.
Personal data collected will only be used for exposure calculations and will not be disclosed. Anonymity will be
ensured throughout the study.
There is no intervention to undergo or therapeutic protocol to follow.
- Do you have a chronic or serious illness? □ Yes □ No
- Do you eat Lebanese bread for more than 15 years? □ Yes □ No
- Do you live in Lebanon for more than 15 years? (Criteria for adults only)
□ Yes □ No
If you meet the above criteria, please complete this questionnaire, which will take you less than ten minutes
Date.................................. investigator………………….
Part 1. Consumption of Lebanese bread
1. What is the kind of Lebanese bread eaten?
1 □ White bread 2 □ Brown bread 3 □ Other please specify: ............ .. ......
2. What is the brand of bread most consumed?
1 □ Brand 1 2 □ Brand 2 3 □ Brand 3
4 □ Brand 4 5 □ Others please specify: .................................
3. What is the size of pita consumed?
1 □ Small 2 □ Medium 3 □ Large
4. What is the number of pitas consumed per day?
1 □ 2 □ 3 □ 4 □ Others please specify: ...................... ....
Part 2. Sociodemographic data
5. Age: | __ | __ |
6. Gender: 1 □ Man 2 □ Woman
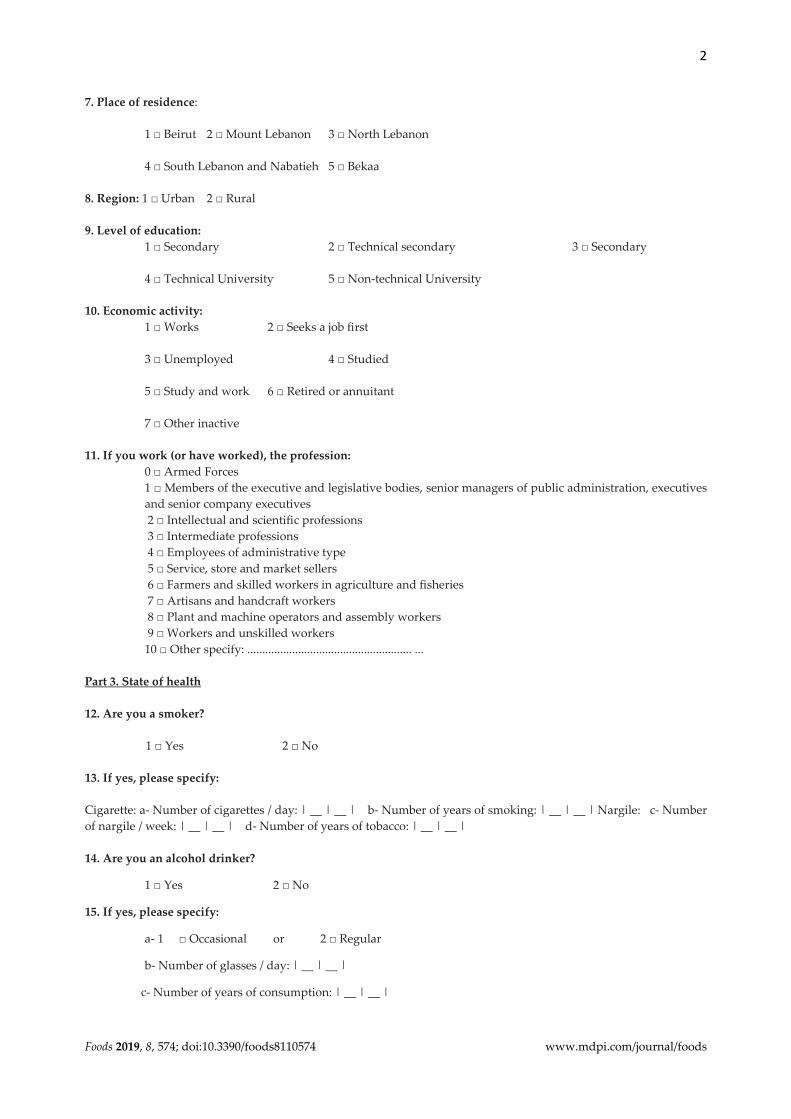
2
Foods 2019, 8, 574; doi:10.3390/foods8110574 www.mdpi.com/journal/foods
7. Place of residence:
1 □ Beirut 2 □ Mount Lebanon 3 □ North Lebanon
4 □ South Lebanon and Nabatieh 5 □ Bekaa
8. Region: 1 □ Urban 2 □ Rural
9. Level of education:
1 □ Secondary 2 □ Technical secondary 3 □ Secondary
4 □ Technical University 5 □ Non-technical University
10. Economic activity:
1 □ Works 2 □ Seeks a job first
3 □ Unemployed 4 □ Studied
5 □ Study and work 6 □ Retired or annuitant
7 □ Other inactive
11. If you work (or have worked), the profession:
0 □ Armed Forces
1 □ Members of the executive and legislative bodies, senior managers of public administration, executives
and senior company executives
2 □ Intellectual and scientific professions
3 □ Intermediate professions
4 □ Employees of administrative type
5 □ Service, store and market sellers
6 □ Farmers and skilled workers in agriculture and fisheries
7 □ Artisans and handcraft workers
8 □ Plant and machine operators and assembly workers
9 □ Workers and unskilled workers
10 □ Other specify: ....................................................... ...
Part 3. State of health
12. Are you a smoker?
1 □ Yes 2 □ No
13. If yes, please specify:
Cigarette: a- Number of cigarettes / day: | __ | __ | b- Number of years of smoking: | __ | __ | Nargile: c- Number
of nargile / week: | __ | __ | d- Number of years of tobacco: | __ | __ |
14. Are you an alcohol drinker?
1 □ Yes 2 □ No
15. If yes, please specify:
a- 1 □ Occasional or 2 □ Regular
b- Number of glasses / day: | __ | __ |
c- Number of years of consumption: | __ | __ |
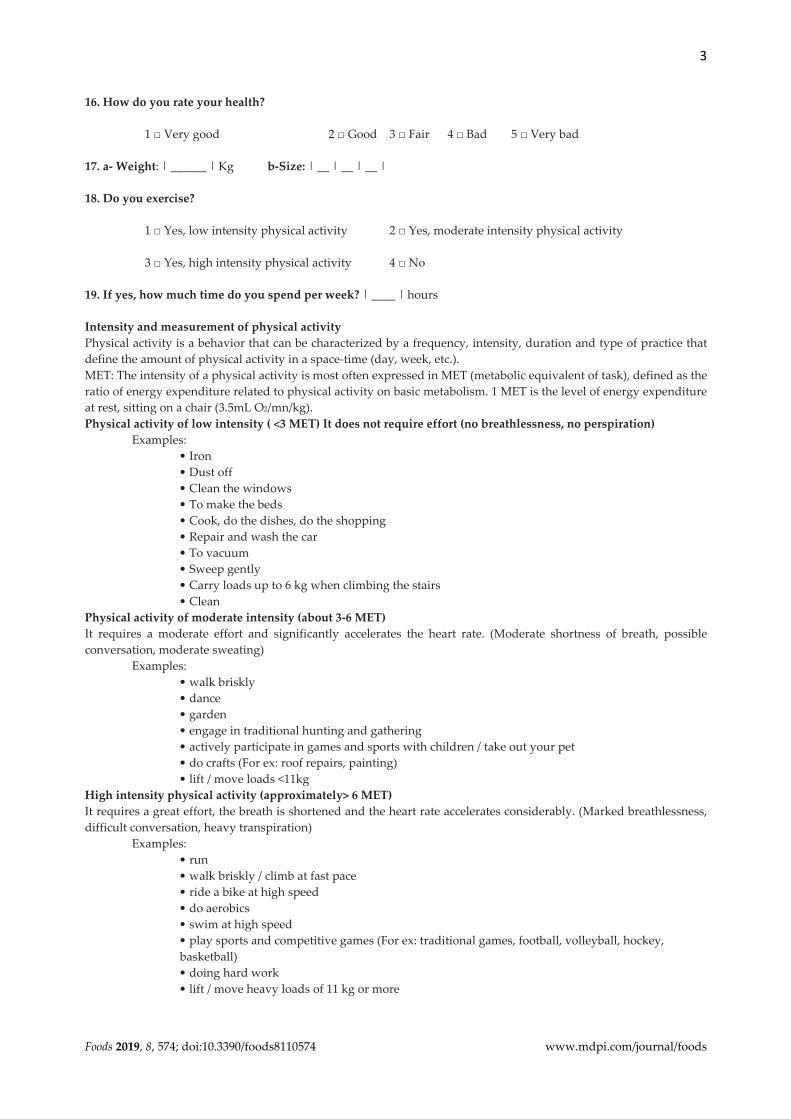
3
Foods 2019, 8, 574; doi:10.3390/foods8110574 www.mdpi.com/journal/foods
16. How do you rate your health?
1 □ Very good 2 □ Good 3 □ Fair 4 □ Bad 5 □ Very bad
17. a- Weight: | ______ | Kg b-Size: | __ | __ | __ |
18. Do you exercise?
1 □ Yes, low intensity physical activity 2 □ Yes, moderate intensity physical activity
3 □ Yes, high intensity physical activity 4 □ No
19. If yes, how much time do you spend per week? | ____ | hours
Intensity and measurement of physical activity
Physical activity is a behavior that can be characterized by a frequency, intensity, duration and type of practice that
define the amount of physical activity in a space-time (day, week, etc.).
MET: The intensity of a physical activity is most often expressed in MET (metabolic equivalent of task), defined as the
ratio of energy expenditure related to physical activity on basic metabolism. 1 MET is the level of energy expenditure
at rest, sitting on a chair (3.5mL O2/mn/kg).
Physical activity of low intensity ( <3 MET) It does not require effort (no breathlessness, no perspiration)
Examples:
� Iron
� Dust off
� Clean the windows
� To make the beds
� Cook, do the dishes, do the shopping
� Repair and wash the car
� To vacuum
� Sweep gently
� Carry loads up to 6 kg when climbing the stairs
� Clean
Physical activity of moderate intensity (about 3-6 MET)
It requires a moderate effort and significantly accelerates the heart rate. (Moderate shortness of breath, possible
conversation, moderate sweating)
Examples:
� walk briskly
� dance
� garden
� engage in traditional hunting and gathering
� actively participate in games and sports with children / take out your pet
� do crafts (For ex: roof repairs, painting)
� lift / move loads <11kg
High intensity physical activity (approximately> 6 MET)
It requires a great effort, the breath is shortened and the heart rate accelerates considerably. (Marked breathlessness,
difficult conversation, heavy transpiration)
Examples:
� run
� walk briskly / climb at fast pace
� ride a bike at high speed
� do aerobics
� swim at high speed
� play sports and competitive games (For ex: traditional games, football, volleyball, hockey,
basketball)
� doing hard work
� lift / move heavy loads of 11 kg or more
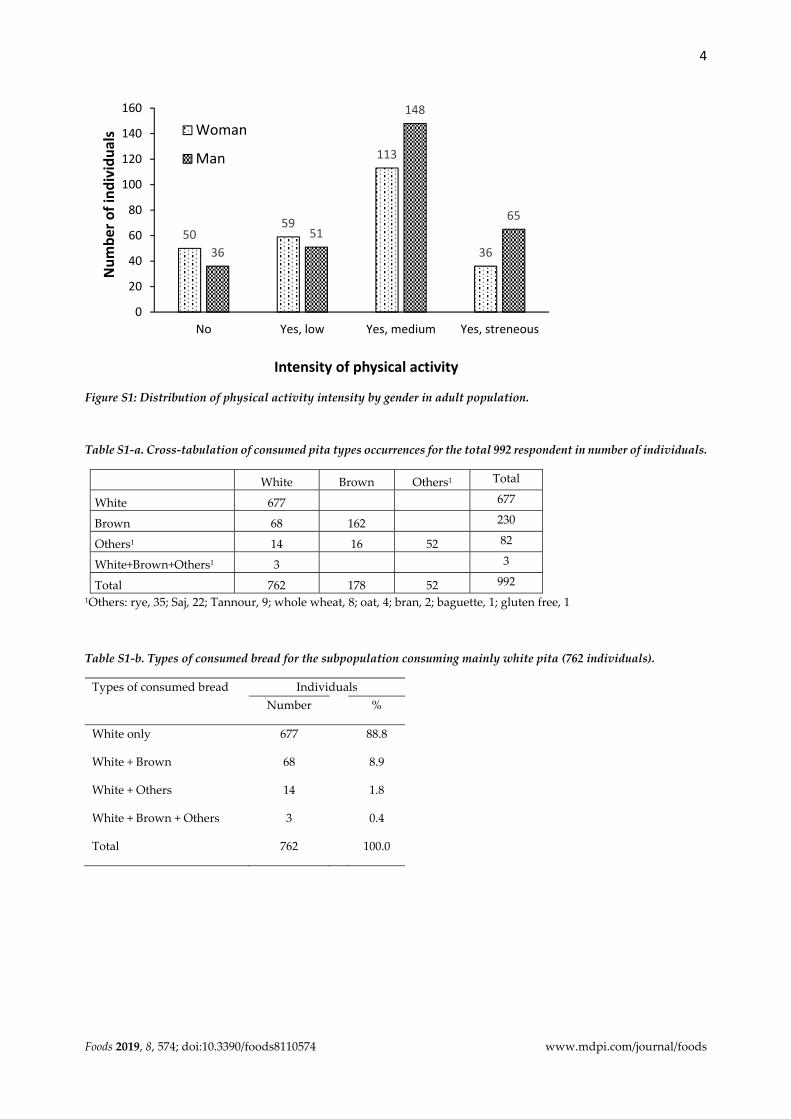
4
Foods 2019, 8, 574; doi:10.3390/foods8110574 www.mdpi.com/journal/foods
Figure S1: Distribution of physical activity intensity by gender in adult population.
Table S1-a. Cross-tabulation of consumed pita types occurrences for the total 992 respondent in number of individuals.
White Brown Others1 Total
White 677 677
Brown 68 162 230
Others1 14 16 52 82
White+Brown+Others1 3 3
Total 762 178 52 992
1Others: rye, 35; Saj, 22; Tannour, 9; whole wheat, 8; oat, 4; bran, 2; baguette, 1; gluten free, 1
Table S1-b. Types of consumed bread for the subpopulation consuming mainly white pita (762 individuals).
Types of consumed bread Individuals
Number %
White only 677 88.8
White + Brown 68 8.9
White + Others 14 1.8
White + Brown + Others 3 0.4
Total 762 100.0
5059
113
363651
148
65
0
20
40
60
80
100
120
140
160
No Yes, low Yes, medium Yes, streneous
Num
ber o
f ind
ivid
uals
Intensity of physical activity
Woman
Man
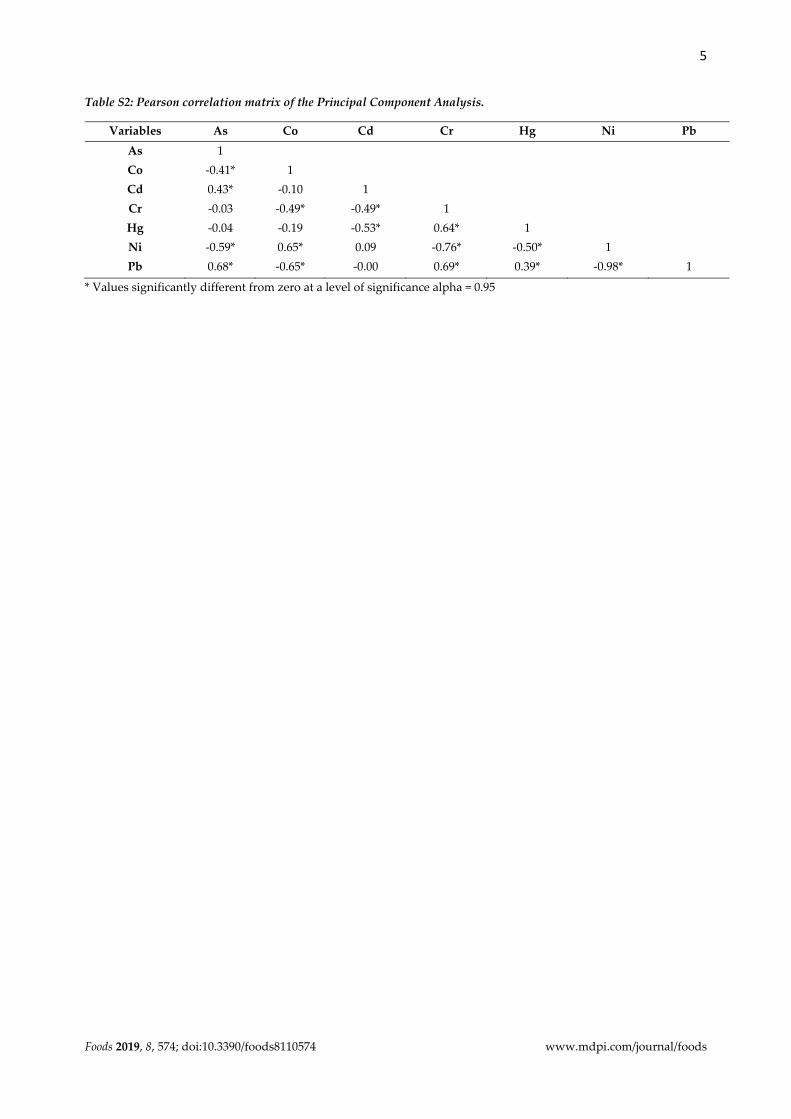
5
Foods 2019, 8, 574; doi:10.3390/foods8110574 www.mdpi.com/journal/foods
Table S2: Pearson correlation matrix of the Principal Component Analysis.
Variables As Co Cd Cr Hg Ni Pb
As 1
Co -0.41* 1
Cd 0.43* -0.10 1
Cr -0.03 -0.49* -0.49* 1
Hg -0.04 -0.19 -0.53* 0.64* 1
Ni -0.59* 0.65* 0.09 -0.76* -0.50* 1
Pb 0.68* -0.65* -0.00 0.69* 0.39* -0.98* 1
* Values significantly different from zero at a level of significance alpha = 0.95
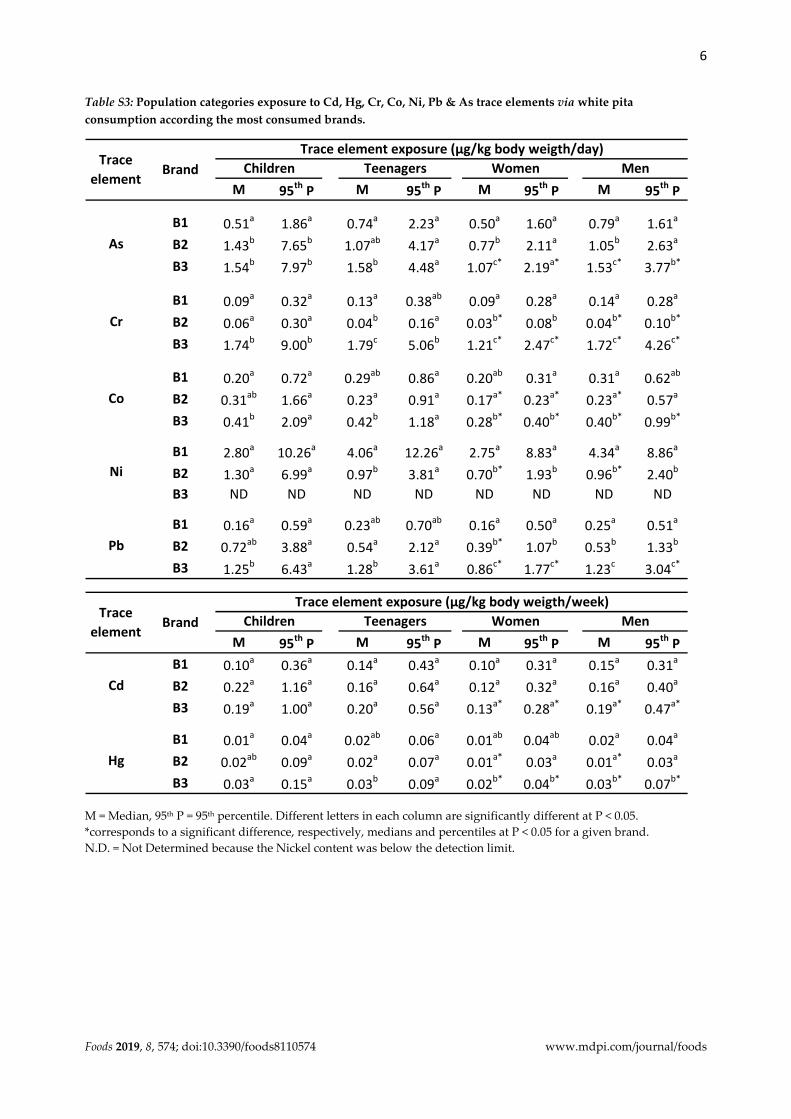
6
Foods 2019, 8, 574; doi:10.3390/foods8110574 www.mdpi.com/journal/foods
Table S3: Population categories exposure to Cd, Hg, Cr, Co, Ni, Pb & As trace elements via white pita
consumption according the most consumed brands.
M = Median, 95th P = 95th percentile. Different letters in each column are significantly different at P < 0.05.
*corresponds to a significant difference, respectively, medians and percentiles at P < 0.05 for a given brand.
N.D. = Not Determined because the Nickel content was below the detection limit.
M 95th P M 95th P M 95th P M 95th P
B1 0.51a 1.86a 0.74a 2.23a 0.50a 1.60a 0.79a 1.61a
B2 1.43b 7.65b 1.07ab 4.17a 0.77b 2.11a 1.05b 2.63a
B3 1.54b 7.97b 1.58b 4.48a 1.07c* 2.19a* 1.53c* 3.77b*
B1 0.09a 0.32a 0.13a 0.38ab 0.09a 0.28a 0.14a 0.28a
B2 0.06a 0.30a 0.04b 0.16a 0.03b* 0.08b 0.04b* 0.10b*
B3 1.74b 9.00b 1.79c 5.06b 1.21c* 2.47c* 1.72c* 4.26c*
B1 0.20a 0.72a 0.29ab 0.86a 0.20ab 0.31a 0.31a 0.62ab
B2 0.31ab 1.66a 0.23a 0.91a 0.17a* 0.23a* 0.23a* 0.57a
B3 0.41b 2.09a 0.42b 1.18a 0.28b* 0.40b* 0.40b* 0.99b*
B1 2.80a 10.26a 4.06a 12.26a 2.75a 8.83a 4.34a 8.86a
B2 1.30a 6.99a 0.97b 3.81a 0.70b* 1.93b 0.96b* 2.40b
B3 ND ND ND ND ND ND ND ND
B1 0.16a 0.59a 0.23ab 0.70ab 0.16a 0.50a 0.25a 0.51a
B2 0.72ab 3.88a 0.54a 2.12a 0.39b* 1.07b 0.53b 1.33b
B3 1.25b 6.43a 1.28b 3.61a 0.86c* 1.77c* 1.23c 3.04c*
BrandTrace element exposure (µg/kg body weigth/day)
Children Teenagers Women Men
Co
Ni
Pb
As
Trace element
Cr
M 95th P M 95th P M 95th P M 95th PB1 0.10a 0.36a 0.14a 0.43a 0.10a 0.31a 0.15a 0.31a
B2 0.22a 1.16a 0.16a 0.64a 0.12a 0.32a 0.16a 0.40a
B3 0.19a 1.00a 0.20a 0.56a 0.13a* 0.28a* 0.19a* 0.47a*
B1 0.01a 0.04a 0.02ab 0.06a 0.01ab 0.04ab 0.02a 0.04a
B2 0.02ab 0.09a 0.02a 0.07a 0.01a* 0.03a 0.01a* 0.03a
B3 0.03a 0.15a 0.03b 0.09a 0.02b* 0.04b* 0.03b* 0.07b*
Cd
Hg
Trace element Brand
Trace element exposure (µg/kg body weigth/week)Children Teenagers Women Men
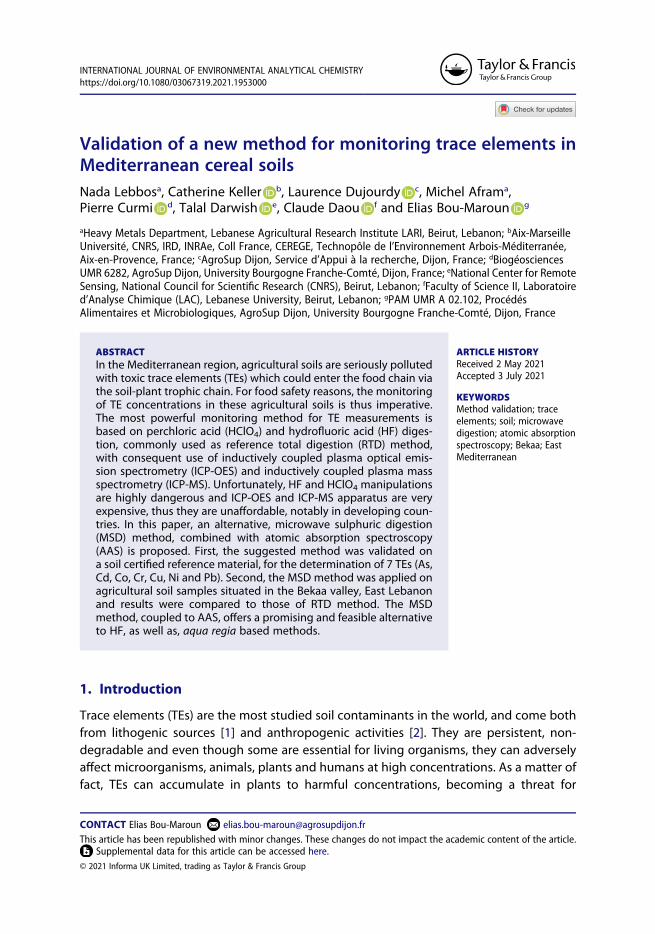
Validation of a new method for monitoring trace elements in Mediterranean cereal soils
Nada Lebbosa, Catherine Keller b, Laurence Dujourdy c, Michel Aframa, Pierre Curmi d, Talal Darwish e, Claude Daou f and Elias Bou-Maroun g
aHeavy Metals Department, Lebanese Agricultural Research Institute LARI, Beirut, Lebanon; bAix-Marseille Université, CNRS, IRD, INRAe, Coll France, CEREGE, Technopôle de l’Environnement Arbois-Méditerranée, Aix-en-Provence, France; cAgroSup Dijon, Service d’Appui à la recherche, Dijon, France; dBiogéosciences UMR 6282, AgroSup Dijon, University Bourgogne Franche-Comté, Dijon, France; eNational Center for Remote Sensing, National Council for Scientific Research (CNRS), Beirut, Lebanon; fFaculty of Science II, Laboratoire d’Analyse Chimique (LAC), Lebanese University, Beirut, Lebanon; gPAM UMR A 02.102, Procédés Alimentaires et Microbiologiques, AgroSup Dijon, University Bourgogne Franche-Comté, Dijon, France
ABSTRACT
In the Mediterranean region, agricultural soils are seriously polluted with toxic trace elements (TEs) which could enter the food chain via the soil-plant trophic chain. For food safety reasons, the monitoring of TE concentrations in these agricultural soils is thus imperative. The most powerful monitoring method for TE measurements is based on perchloric acid (HClO4) and hydrofluoric acid (HF) diges-tion, commonly used as reference total digestion (RTD) method, with consequent use of inductively coupled plasma optical emis-sion spectrometry (ICP-OES) and inductively coupled plasma mass spectrometry (ICP-MS). Unfortunately, HF and HClO4 manipulations are highly dangerous and ICP-OES and ICP-MS apparatus are very expensive, thus they are unaffordable, notably in developing coun-tries. In this paper, an alternative, microwave sulphuric digestion (MSD) method, combined with atomic absorption spectroscopy (AAS) is proposed. First, the suggested method was validated on a soil certified reference material, for the determination of 7 TEs (As, Cd, Co, Cr, Cu, Ni and Pb). Second, the MSD method was applied on agricultural soil samples situated in the Bekaa valley, East Lebanon and results were compared to those of RTD method. The MSD method, coupled to AAS, offers a promising and feasible alternative to HF, as well as, aqua regia based methods.
ARTICLE HISTORY
Received 2 May 2021 Accepted 3 July 2021
KEYWORDS
Method validation; trace elements; soil; microwave digestion; atomic absorption spectroscopy; Bekaa; East Mediterranean
1. Introduction
Trace elements (TEs) are the most studied soil contaminants in the world, and come both from lithogenic sources [1] and anthropogenic activities [2]. They are persistent, non- degradable and even though some are essential for living organisms, they can adversely affect microorganisms, animals, plants and humans at high concentrations. As a matter of fact, TEs can accumulate in plants to harmful concentrations, becoming a threat for
CONTACT Elias Bou-Maroun [email protected]
This article has been republished with minor changes. These changes do not impact the academic content of the article.Supplemental data for this article can be accessed here.
INTERNATIONAL JOURNAL OF ENVIRONMENTAL ANALYTICAL CHEMISTRY
https://doi.org/10.1080/03067319.2021.1953000
© 2021 Informa UK Limited, trading as Taylor & Francis Group
human health through the food chain [3]. Accurate and routine determination of their concentration in soil is thus necessary to assess their risk to directly and indirectly enter the food chain.
Cereal production soils in the Mediterranean basin are regularly amended with organic matter and phosphates bearing TEs and repeatedly irrigated with untreated wastewater [4,5]. Regular monitoring of TE concentrations in these agricultural soils is of great interest. Arsenic, Cd, Co, Cr, Cu, Ni and Pb are the most monitored elements based on previous studies of TE determination in cereal production soils of the Bekaa valley, East Lebanon [6]. Nevertheless, less than 6% of Lebanese arable lands have been checked so far for TE contamination [7].
Although some countries introduced the nondestructive thick target particle induced X-ray emission technique for the determination of trace elements in as received soil samples, digestion methods are still widely practiced [8]. However, the heterogeneous and complex soil matrix, associating organic compounds and mineral constituents with different physicochemical characteristics, does not allow a single solid phase digestion method for the determination of TEs. To be acceptable, precision and accuracy of diges-tion methods should be lower than 20% [9] for any set of targeted soil to be analysed on a routine basis.
The digestion of samples containing TEs can be done using a dry method: in this case, the sample is calcined in an oven at temperatures ranging between 450°C and 500°C. Dry ashing offers the advantage of requiring fewer reagents like acids to solubilise ashes. However, dry ashing can lead to a loss of analytes like As and Hg by volatilisation.
To reduce the sample preparation time and losses by volatilisation, wet digestion processes are an attractive alternative to dry ashing methods for several samples such as biological tissues, food and soils [3,10]. In this case, the sample is mineralised in a mixture of acids at their boiling point. Different acids are usually used to perform the wet mineralisation: hydrochloric acid (HCl), nitric acid (HNO3), sulphuric acid (H2SO4), perchloric acid (HClO4), hydrofluoric acid (HF). Several combinations were used for the mineralisation of soil samples [11–14] but there is no consensus on the choice of the mineralisation reagent.
It is shown that HF combined with HClO4 allows for a total dissolution of all elements present in the sample but induces Si volatilisation. However, HF is dangerous to handle. High precautions and safe handling should be implemented in the laboratory to prevent accidents. Despite this, serious accidents can always occur.
To avoid handling HF, sample attacks using a mixture of other strong acids are usually adopted in routine analysis. HNO3 has high oxidant properties, most often used in wet mineralisation, especially when the analysis step is done by atomic absorption technics [15]. Its relatively low boiling point (120°C) limits its efficiency. Therefore, HNO3 is commonly used in a mixture with H2SO4 or HClO4 (boiling point at 340°C and 200°C, respectively). HClO4 should be handled carefully because when its concentration exceeds 85% above 150°C, it becomes unstable and presents a serious explosion hazard. The combination of HNO3 with HCl is well-known as ‘aqua regia mixture’. It has a high dissolution power and is usually used to evaluate the trace element contamination level [16]. Aqua regia reagent gives a pseudo-total concentration compared with the HF total method, especially for the following elements (Cr, Ni, Zn and Pb) [17].
2 N. LEBBOS ET AL.
Ammonium fluoride (NH4F) and ammonium bifluoride (NH4HF2) are used as a substitute for HF. These compounds are safer than HF for the operator and have high boiling points (260°C and 239.5°C) allowing sample digestion at high temperature in open vessels [18].
To optimise the mineralisation time, microwave heating is often performed. Hydrogen peroxide (H2O2) is largely used in mixture with strong acids for the oxidation and destruction of organic matter [11–13]. Its oxidation power is greatly enhanced in the presence of H2SO4 due to the formation of H2SO5 [15]. Recently, Magdali et al. [19] used a mixture of NH4HF2 and HNO3 in a microwave oven to dissolve completely a wide range of silicate rock samples for trace element deter-mination. Certain analytes were not fully recovered using this method which limits its field of application.
Most often, TEs concentration in the mineralisation solutions is determined using inductively coupled plasma optical emission spectrometry (ICP-OES) and inductively coupled plasma mass spectrometry (ICP-MS) following ISO 22036 [20] and ISO 17294–2 [21] standards. These devices are very expensive and have high mainte-nance costs but combines low detection limits and a rapid multi-elemental determi-nation in comparison with atomic absorption spectroscopy (AAS). Therefore, it is important to have available a method for TE analysis that is safe, green, inexpensive and accessible to a large number of laboratories. In agreement with green analytical chemistry, an eco-friendly infrared digestion method was recently developed for multi-element determination in soil sample by microwave induced plasma atomic emission spectrometry (MIP-OES) [22]. This method minimises the reagents amounts, makes digestion safer and reduces waste.
The choice of a sample preparation method is crucial in the analysis of soil and sediment samples. Proper choice reduces matrix effects in complex samples and subse-quently limits spectral and non-spectral interferences. The latter involves sample- introduction and plasma related-interferences. This last point becomes very important when using plasma-based atomic emission like ICP-OES and ICP-MS. Nitric acid is usually used to avoid spectral interferences caused by other acids [23].
In this study, two digestion methods were compared using a soil certified reference material: 1) heating 3 acid digestion (HAD) with a mixture of HNO3, HClO4 and H2SO4, and 2) microwave sulphuric digestion (MSD) using a mixture of H2SO4 and H2O2. The latter is proposed as a green, simple and fast method for soil sample digestion. The use of H2SO4 in sample digestion in combination with H2O2
is more advantageous than the use of NH4F and NH4F2. The latter are safer than HF but remain more dangerous than H2SO4.
The measurement of As, Cd, Co, Cr, Cu, Ni and Pb concentrations were then conducted using a flame atomic absorption spectrometer (AAS). AAS is less efficient than the widely used plasma-based methods (ICP-OES and ICP-MS) because it is less sensitive and only allows the determination of single elements. However, AAS is cheaper than plasma-based methods and is available to a large number of labora-tories. A validation of the selected digestion method was done using a certified reference material (CRM). Afterwards, the validated method (MSD + AAS) was applied on agricultural soil samples collected from the Bekaa region, located in Lebanon, East
INTERNATIONAL JOURNAL OF ENVIRONMENTAL ANALYTICAL CHEMISTRY 3
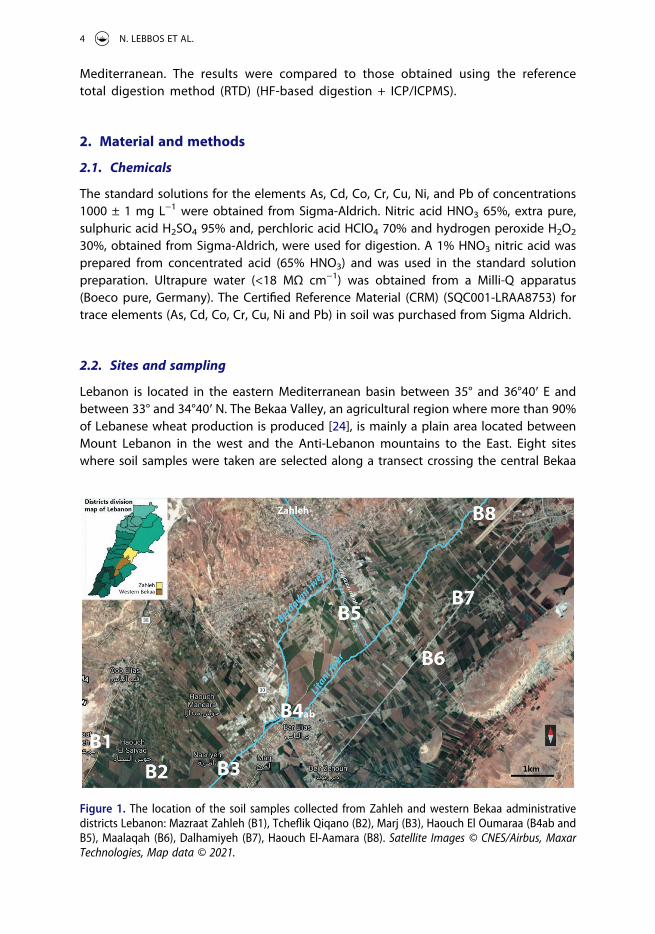
Mediterranean. The results were compared to those obtained using the reference total digestion method (RTD) (HF-based digestion + ICP/ICPMS).
2. Material and methods
2.1. Chemicals
The standard solutions for the elements As, Cd, Co, Cr, Cu, Ni, and Pb of concentrations 1000 ± 1 mg L−1 were obtained from Sigma-Aldrich. Nitric acid HNO3 65%, extra pure, sulphuric acid H2SO4 95% and, perchloric acid HClO4 70% and hydrogen peroxide H2O2
30%, obtained from Sigma-Aldrich, were used for digestion. A 1% HNO3 nitric acid was prepared from concentrated acid (65% HNO3) and was used in the standard solution preparation. Ultrapure water (<18 MΩ cm−1) was obtained from a Milli-Q apparatus (Boeco pure, Germany). The Certified Reference Material (CRM) (SQC001-LRAA8753) for trace elements (As, Cd, Co, Cr, Cu, Ni and Pb) in soil was purchased from Sigma Aldrich.
2.2. Sites and sampling
Lebanon is located in the eastern Mediterranean basin between 35° and 36°40′ E and between 33° and 34°40′ N. The Bekaa Valley, an agricultural region where more than 90% of Lebanese wheat production is produced [24], is mainly a plain area located between Mount Lebanon in the west and the Anti-Lebanon mountains to the East. Eight sites where soil samples were taken are selected along a transect crossing the central Bekaa
Figure 1. The location of the soil samples collected from Zahleh and western Bekaa administrative districts Lebanon: Mazraat Zahleh (B1), Tcheflik Qiqano (B2), Marj (B3), Haouch El Oumaraa (B4ab and B5), Maalaqah (B6), Dalhamiyeh (B7), Haouch El-Aamara (B8). Satellite Images © CNES/Airbus, Maxar
Technologies, Map data © 2021.
4 N. LEBBOS ET AL.
valley from southwest to northeast (Figure 1). The soils of the sampling sites are Eutric and Vertic Cambisols (B1, B2, B5, B6 and B7), and Eutric Fluvisols (B3, B4ab and B8) according to the World Reference Base [25]. They are deep, predominantly non-calcareous clay, with neutral to weakly basic pH values (7.4–7.8) and low to medium organic matter (1.4–2.7%).
Most of these sites were irrigated by private tube wells taking water from the deep groundwater reservoir, and by surface waters when available nearby (Berdawni and Litani rivers). Farmers generally practice an annual wheat/potato succession.
Topsoil layer (0–20 cm) was sampled using a stainless-steel shovel at the corners of the plot, in the centre and diagonally. The nine subsamples of the same plot were mixed, homogenised and carried in clean polyethylene bags. The samples were then brought to the laboratory where a quartering technique [26] was applied to the overall homogenised sample to reduce the sample size and form a composite sample. Only about 1 kg of soil sample underwent pretreatment.
2.3. Samples pretreatment and digestion
The composite soil samples were cleaned up from roots and gravels, dried according to the AFNOR NF X31-102 standard [27] in an oven (Model 700 Memmert) at 40°C, until constant weight and sieved at 2 mm. Then, soil samples were then stored in plastic bottles protected from the direct sunlight and at a temperature below 4°C (in the refrigerator) until analysis.
Before mineralisation, the soil samples were ground fine with a mortar and sieved (diameter <250 µm) following the standard NF ISO 11464 [28]. Two methods of digestion were used in order to mineralise a representative part of the composite soil samples:
i) For the heating three acid digestion (HAD), a three-acid mixture (9 mL HNO3, 2 mL HClO4, 2 mL H2SO4) was added to 0.5 g of soil sample or CRM, followed by heating up to 350°C for 2h30 min in a heating block. The mixture was then stored at room temperature for one night. ii) For the microwave sulphuric digestion (MSD), a microwave type ‘Milestone – Ethos Easy’ was used. Fifteen vessels can be processed simultaneously. This system controls the temperature in all vessels using a direct contactless temperature sensor. An acid mixture of 9 mL of H2SO4 and 3 mL of H2O2 were added to 0.5 g of soil sample or CRM in a Teflon receptacle tightly closed. A temperature of 200°C was reached in 10 min and maintained at this level 10 min. Then, the temperature decreased gradually where the cooling step was maintained for 20 min. This method was suggested by Milestone and was subjected to a validation.
All digested samples were filtered and adjusted to 25 mL using HNO3 1% before analysis.
2.4. Apparatus for TE analysis
The analyses of TEs were conducted by atomic absorption spectrometry (flame iCE 3000 series – Thermo type, Thermo Fischer Scientific, Germany). An acetylene/air flame was used. Liquid samples were introduced in the spectrometer with an auto sampler using blank and standards for the analysis of the following elements: As, Cd, Co, Cr, Cu, Ni and Pb.
Calibration standard solutions were prepared by successive dilution, all plastic labware used for sampling and sample treatment was new or cleaned by soaking 24 h first in 10% HNO3 then in ultra-pure water.
INTERNATIONAL JOURNAL OF ENVIRONMENTAL ANALYTICAL CHEMISTRY 5
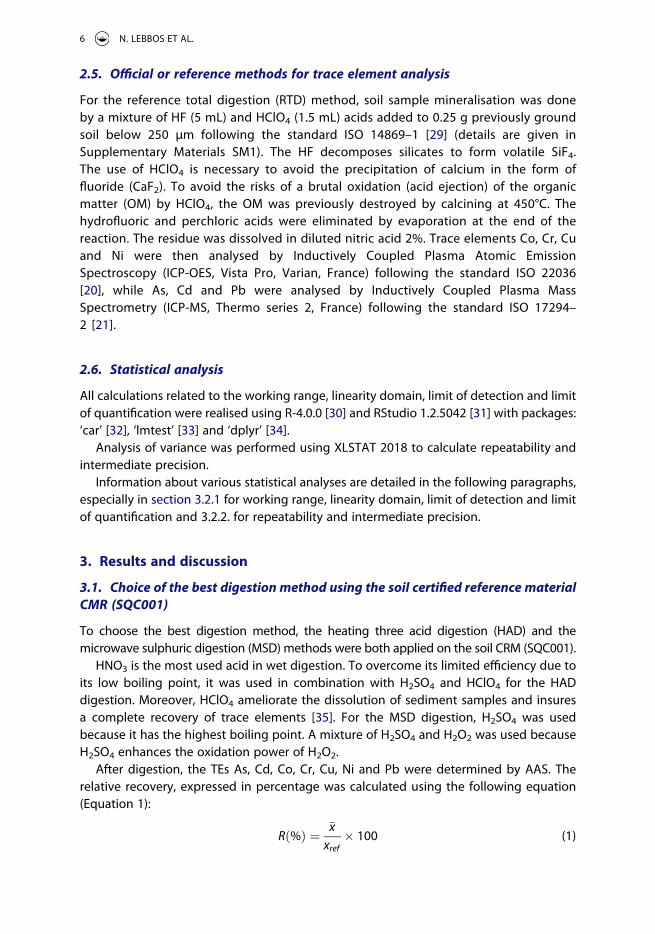
2.5. Official or reference methods for trace element analysis
For the reference total digestion (RTD) method, soil sample mineralisation was done by a mixture of HF (5 mL) and HClO4 (1.5 mL) acids added to 0.25 g previously ground soil below 250 µm following the standard ISO 14869–1 [29] (details are given in Supplementary Materials SM1). The HF decomposes silicates to form volatile SiF4. The use of HClO4 is necessary to avoid the precipitation of calcium in the form of fluoride (CaF2). To avoid the risks of a brutal oxidation (acid ejection) of the organic matter (OM) by HClO4, the OM was previously destroyed by calcining at 450°C. The hydrofluoric and perchloric acids were eliminated by evaporation at the end of the reaction. The residue was dissolved in diluted nitric acid 2%. Trace elements Co, Cr, Cu and Ni were then analysed by Inductively Coupled Plasma Atomic Emission Spectroscopy (ICP-OES, Vista Pro, Varian, France) following the standard ISO 22036 [20], while As, Cd and Pb were analysed by Inductively Coupled Plasma Mass Spectrometry (ICP-MS, Thermo series 2, France) following the standard ISO 17294– 2 [21].
2.6. Statistical analysis
All calculations related to the working range, linearity domain, limit of detection and limit of quantification were realised using R-4.0.0 [30] and RStudio 1.2.5042 [31] with packages: ‘car’ [32], ‘lmtest’ [33] and ‘dplyr’ [34].
Analysis of variance was performed using XLSTAT 2018 to calculate repeatability and intermediate precision.
Information about various statistical analyses are detailed in the following paragraphs, especially in section 3.2.1 for working range, linearity domain, limit of detection and limit of quantification and 3.2.2. for repeatability and intermediate precision.
3. Results and discussion
3.1. Choice of the best digestion method using the soil certified reference material
CMR (SQC001)
To choose the best digestion method, the heating three acid digestion (HAD) and the microwave sulphuric digestion (MSD) methods were both applied on the soil CRM (SQC001).
HNO3 is the most used acid in wet digestion. To overcome its limited efficiency due to its low boiling point, it was used in combination with H2SO4 and HClO4 for the HAD digestion. Moreover, HClO4 ameliorate the dissolution of sediment samples and insures a complete recovery of trace elements [35]. For the MSD digestion, H2SO4 was used because it has the highest boiling point. A mixture of H2SO4 and H2O2 was used because H2SO4 enhances the oxidation power of H2O2.
After digestion, the TEs As, Cd, Co, Cr, Cu, Ni and Pb were determined by AAS. The relative recovery, expressed in percentage was calculated using the following equation (Equation 1):
R %ð Þ ¼�x
xref� 100 (1)
6 N. LEBBOS ET AL.
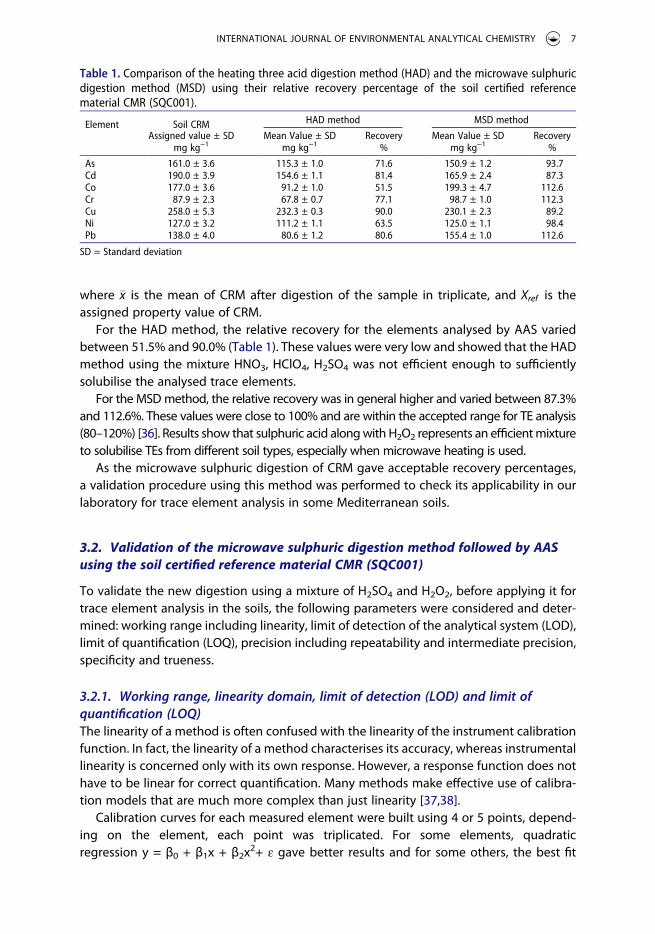
where �x is the mean of CRM after digestion of the sample in triplicate, and Xref is the assigned property value of CRM.
For the HAD method, the relative recovery for the elements analysed by AAS varied between 51.5% and 90.0% (Table 1). These values were very low and showed that the HAD method using the mixture HNO3, HClO4, H2SO4 was not efficient enough to sufficiently solubilise the analysed trace elements.
For the MSD method, the relative recovery was in general higher and varied between 87.3% and 112.6%. These values were close to 100% and are within the accepted range for TE analysis (80–120%) [36]. Results show that sulphuric acid along with H2O2 represents an efficient mixture to solubilise TEs from different soil types, especially when microwave heating is used.
As the microwave sulphuric digestion of CRM gave acceptable recovery percentages, a validation procedure using this method was performed to check its applicability in our laboratory for trace element analysis in some Mediterranean soils.
3.2. Validation of the microwave sulphuric digestion method followed by AAS
using the soil certified reference material CMR (SQC001)
To validate the new digestion using a mixture of H2SO4 and H2O2, before applying it for trace element analysis in the soils, the following parameters were considered and deter-mined: working range including linearity, limit of detection of the analytical system (LOD), limit of quantification (LOQ), precision including repeatability and intermediate precision, specificity and trueness.
3.2.1. Working range, linearity domain, limit of detection (LOD) and limit of
quantification (LOQ)
The linearity of a method is often confused with the linearity of the instrument calibration function. In fact, the linearity of a method characterises its accuracy, whereas instrumental linearity is concerned only with its own response. However, a response function does not have to be linear for correct quantification. Many methods make effective use of calibra-tion models that are much more complex than just linearity [37,38].
Calibration curves for each measured element were built using 4 or 5 points, depend-ing on the element, each point was triplicated. For some elements, quadratic regression y = β0 + β1x + β2x2+ ɛ gave better results and for some others, the best fit
Table 1. Comparison of the heating three acid digestion method (HAD) and the microwave sulphuric digestion method (MSD) using their relative recovery percentage of the soil certified reference material CMR (SQC001).
Element Soil CRM HAD method MSD method
Assigned value ± SD mg kg−1
Mean Value ± SD mg kg−1
Recovery %
Mean Value ± SD mg kg−1
Recovery %
As 161.0 ± 3.6 115.3 ± 1.0 71.6 150.9 ± 1.2 93.7Cd 190.0 ± 3.9 154.6 ± 1.1 81.4 165.9 ± 2.4 87.3Co 177.0 ± 3.6 91.2 ± 1.0 51.5 199.3 ± 4.7 112.6Cr 87.9 ± 2.3 67.8 ± 0.7 77.1 98.7 ± 1.0 112.3Cu 258.0 ± 5.3 232.3 ± 0.3 90.0 230.1 ± 2.3 89.2Ni 127.0 ± 3.2 111.2 ± 1.1 63.5 125.0 ± 1.1 98.4Pb 138.0 ± 4.0 80.6 ± 1.2 80.6 155.4 ± 1.0 112.6
SD = Standard deviation
INTERNATIONAL JOURNAL OF ENVIRONMENTAL ANALYTICAL CHEMISTRY 7
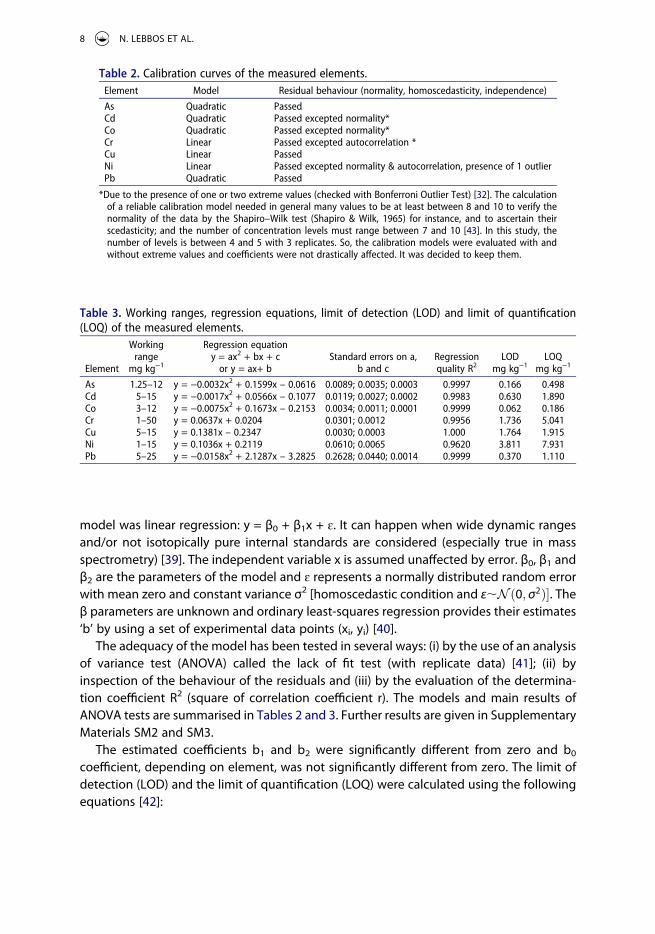
model was linear regression: y = β0 + β1x + ɛ. It can happen when wide dynamic ranges and/or not isotopically pure internal standards are considered (especially true in mass spectrometry) [39]. The independent variable x is assumed unaffected by error. β0, β1 and β2 are the parameters of the model and ɛ represents a normally distributed random error with mean zero and constant variance σ2 [homoscedastic condition and ε,N 0; σ2ð Þ�. The β parameters are unknown and ordinary least-squares regression provides their estimates ‘b’ by using a set of experimental data points (xi, yi) [40].
The adequacy of the model has been tested in several ways: (i) by the use of an analysis of variance test (ANOVA) called the lack of fit test (with replicate data) [41]; (ii) by inspection of the behaviour of the residuals and (iii) by the evaluation of the determina-tion coefficient R2 (square of correlation coefficient r). The models and main results of ANOVA tests are summarised in Tables 2 and 3. Further results are given in Supplementary Materials SM2 and SM3.
The estimated coefficients b1 and b2 were significantly different from zero and b0
coefficient, depending on element, was not significantly different from zero. The limit of detection (LOD) and the limit of quantification (LOQ) were calculated using the following equations [42]:
Table 2. Calibration curves of the measured elements.
Element Model Residual behaviour (normality, homoscedasticity, independence)
As Quadratic PassedCd Quadratic Passed excepted normality*Co Quadratic Passed excepted normality*Cr Linear Passed excepted autocorrelation *Cu Linear PassedNi Linear Passed excepted normality & autocorrelation, presence of 1 outlierPb Quadratic Passed
*Due to the presence of one or two extreme values (checked with Bonferroni Outlier Test) [32]. The calculation of a reliable calibration model needed in general many values to be at least between 8 and 10 to verify the normality of the data by the Shapiro–Wilk test (Shapiro & Wilk, 1965) for instance, and to ascertain their scedasticity; and the number of concentration levels must range between 7 and 10 [43]. In this study, the number of levels is between 4 and 5 with 3 replicates. So, the calibration models were evaluated with and without extreme values and coefficients were not drastically affected. It was decided to keep them.
Table 3. Working ranges, regression equations, limit of detection (LOD) and limit of quantification (LOQ) of the measured elements.
Element
Working range mg kg−1
Regression equation y = ax2 + bx + c or y = ax+ b
Standard errors on a, b and c
Regression quality R2
LOD mg kg−1
LOQ mg kg−1
As 1.25–12 y = −0.0032x2 + 0.1599x – 0.0616 0.0089; 0.0035; 0.0003 0.9997 0.166 0.498Cd 5–15 y = −0.0017x2 + 0.0566x – 0.1077 0.0119; 0.0027; 0.0002 0.9983 0.630 1.890Co 3–12 y = −0.0075x2 + 0.1673x – 0.2153 0.0034; 0.0011; 0.0001 0.9999 0.062 0.186Cr 1–50 y = 0.0637x + 0.0204 0.0301; 0.0012 0.9956 1.736 5.041Cu 5–15 y = 0.1381x – 0.2347 0.0030; 0.0003 1.000 1.764 1.915Ni 1–15 y = 0.1036x + 0.2119 0.0610; 0.0065 0.9620 3.811 7.931Pb 5–25 y = −0.0158x2 + 2.1287x – 3.2825 0.2628; 0.0440; 0.0014 0.9999 0.370 1.110
8 N. LEBBOS ET AL.
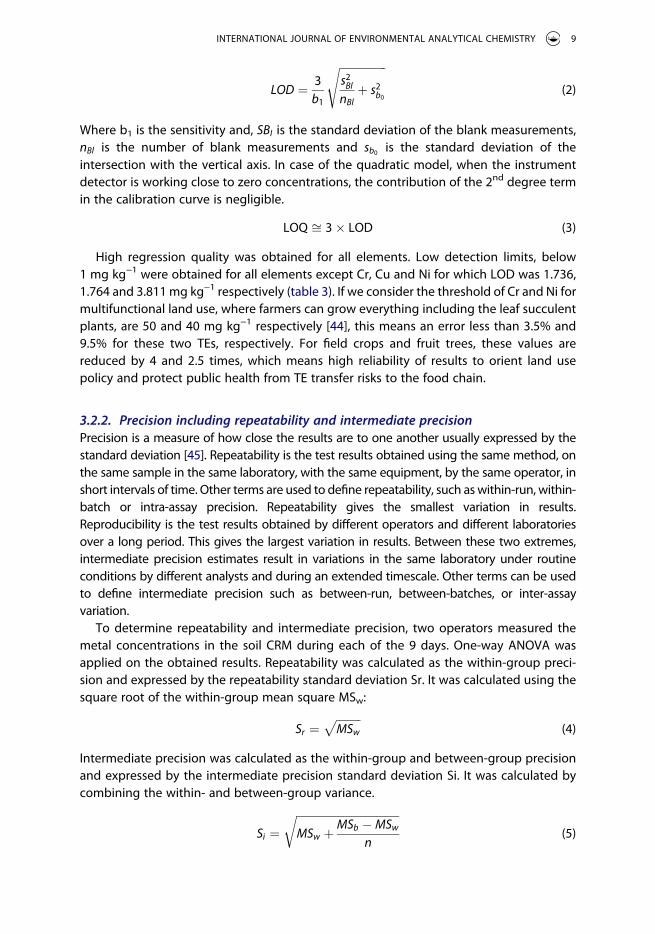
LOD ¼3
b1
ffiffiffiffiffiffiffiffiffiffiffiffiffiffiffiffiffi
s2Bl
nBlþ s2
b0
s
(2)
Where b1 is the sensitivity and, SBI is the standard deviation of the blank measurements, nBl is the number of blank measurements and sb0 is the standard deviation of the
intersection with the vertical axis. In case of the quadratic model, when the instrument detector is working close to zero concentrations, the contribution of the 2nd degree term in the calibration curve is negligible.
LOQ ffi 3 � LOD (3)
High regression quality was obtained for all elements. Low detection limits, below 1 mg kg−1 were obtained for all elements except Cr, Cu and Ni for which LOD was 1.736, 1.764 and 3.811 mg kg−1 respectively (table 3). If we consider the threshold of Cr and Ni for multifunctional land use, where farmers can grow everything including the leaf succulent plants, are 50 and 40 mg kg−1 respectively [44], this means an error less than 3.5% and 9.5% for these two TEs, respectively. For field crops and fruit trees, these values are reduced by 4 and 2.5 times, which means high reliability of results to orient land use policy and protect public health from TE transfer risks to the food chain.
3.2.2. Precision including repeatability and intermediate precision
Precision is a measure of how close the results are to one another usually expressed by the standard deviation [45]. Repeatability is the test results obtained using the same method, on the same sample in the same laboratory, with the same equipment, by the same operator, in short intervals of time. Other terms are used to define repeatability, such as within-run, within- batch or intra-assay precision. Repeatability gives the smallest variation in results. Reproducibility is the test results obtained by different operators and different laboratories over a long period. This gives the largest variation in results. Between these two extremes, intermediate precision estimates result in variations in the same laboratory under routine conditions by different analysts and during an extended timescale. Other terms can be used to define intermediate precision such as between-run, between-batches, or inter-assay variation.
To determine repeatability and intermediate precision, two operators measured the metal concentrations in the soil CRM during each of the 9 days. One-way ANOVA was applied on the obtained results. Repeatability was calculated as the within-group preci-sion and expressed by the repeatability standard deviation Sr. It was calculated using the square root of the within-group mean square MSw:
Sr ¼ffiffiffiffiffiffiffiffiffi
MSw
p
(4)
Intermediate precision was calculated as the within-group and between-group precision and expressed by the intermediate precision standard deviation Si. It was calculated by combining the within- and between-group variance.
Si ¼
ffiffiffiffiffiffiffiffiffiffiffiffiffiffiffiffiffiffiffiffiffiffiffiffiffiffiffiffiffiffiffiffiffiffiffiffiffi
MSw þMSb � MSw
n
r
(5)
INTERNATIONAL JOURNAL OF ENVIRONMENTAL ANALYTICAL CHEMISTRY 9
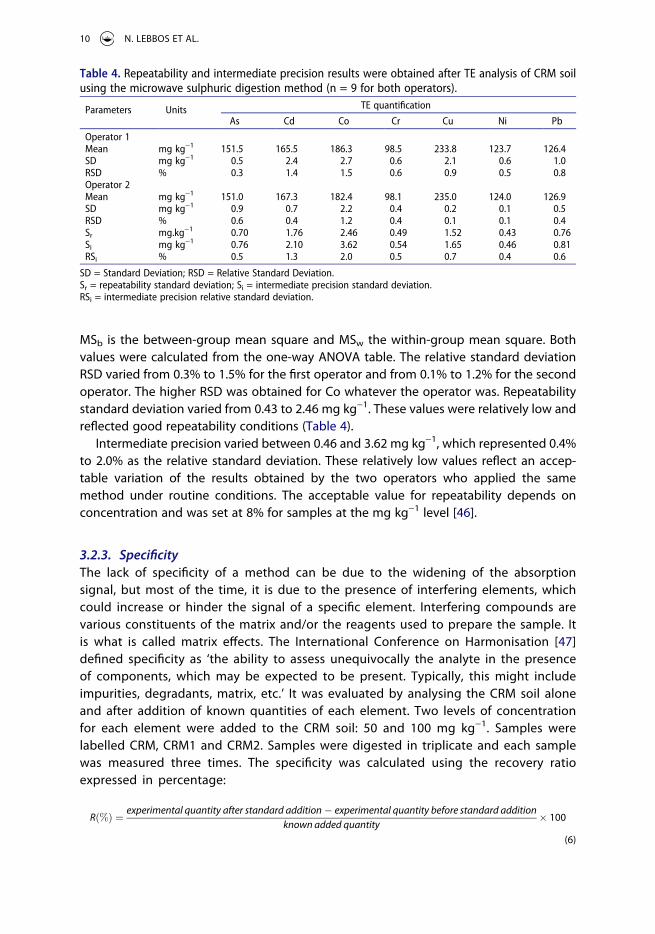
MSb is the between-group mean square and MSw the within-group mean square. Both values were calculated from the one-way ANOVA table. The relative standard deviation RSD varied from 0.3% to 1.5% for the first operator and from 0.1% to 1.2% for the second operator. The higher RSD was obtained for Co whatever the operator was. Repeatability standard deviation varied from 0.43 to 2.46 mg kg−1. These values were relatively low and reflected good repeatability conditions (Table 4).
Intermediate precision varied between 0.46 and 3.62 mg kg−1, which represented 0.4% to 2.0% as the relative standard deviation. These relatively low values reflect an accep-table variation of the results obtained by the two operators who applied the same method under routine conditions. The acceptable value for repeatability depends on concentration and was set at 8% for samples at the mg kg−1 level [46].
3.2.3. Specificity
The lack of specificity of a method can be due to the widening of the absorption signal, but most of the time, it is due to the presence of interfering elements, which could increase or hinder the signal of a specific element. Interfering compounds are various constituents of the matrix and/or the reagents used to prepare the sample. It is what is called matrix effects. The International Conference on Harmonisation [47] defined specificity as ‘the ability to assess unequivocally the analyte in the presence of components, which may be expected to be present. Typically, this might include impurities, degradants, matrix, etc.’ It was evaluated by analysing the CRM soil alone and after addition of known quantities of each element. Two levels of concentration for each element were added to the CRM soil: 50 and 100 mg kg−1. Samples were labelled CRM, CRM1 and CRM2. Samples were digested in triplicate and each sample was measured three times. The specificity was calculated using the recovery ratio expressed in percentage:
R %ð Þ ¼experimental quantity after standard addition � experimental quantity before standard addition
known added quantity� 100
(6)
Table 4. Repeatability and intermediate precision results were obtained after TE analysis of CRM soil using the microwave sulphuric digestion method (n = 9 for both operators).
Parameters Units TE quantification
As Cd Co Cr Cu Ni Pb
Operator 1Mean mg kg−1 151.5 165.5 186.3 98.5 233.8 123.7 126.4SD mg kg−1 0.5 2.4 2.7 0.6 2.1 0.6 1.0RSD % 0.3 1.4 1.5 0.6 0.9 0.5 0.8Operator 2Mean mg kg−1 151.0 167.3 182.4 98.1 235.0 124.0 126.9SD mg kg−1 0.9 0.7 2.2 0.4 0.2 0.1 0.5RSD % 0.6 0.4 1.2 0.4 0.1 0.1 0.4Sr mg.kg−1 0.70 1.76 2.46 0.49 1.52 0.43 0.76Si mg kg−1 0.76 2.10 3.62 0.54 1.65 0.46 0.81RSi % 0.5 1.3 2.0 0.5 0.7 0.4 0.6
SD = Standard Deviation; RSD = Relative Standard Deviation. Sr = repeatability standard deviation; Si = intermediate precision standard deviation. RSi = intermediate precision relative standard deviation.
10 N. LEBBOS ET AL.
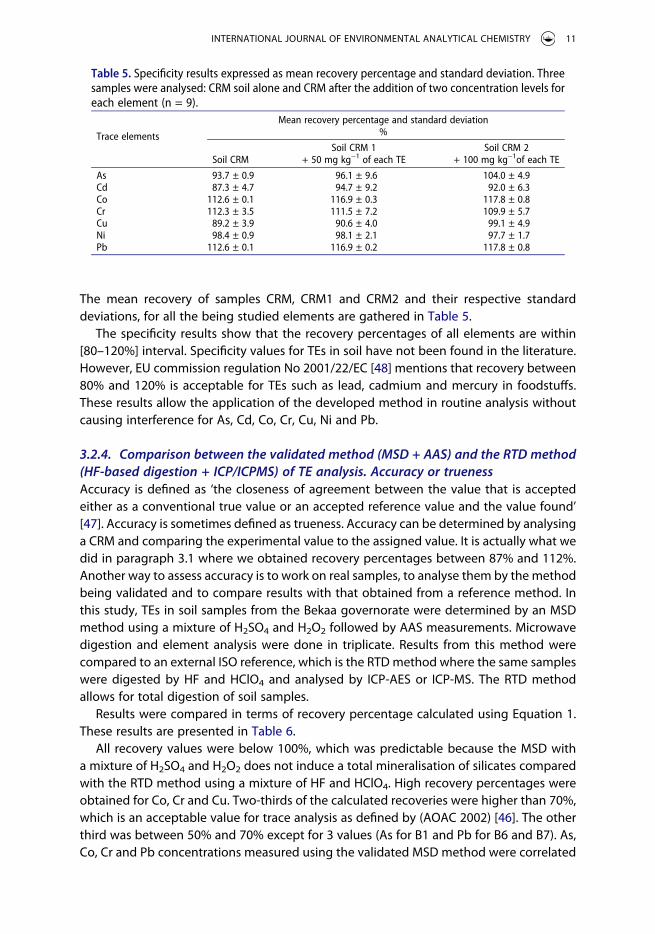
The mean recovery of samples CRM, CRM1 and CRM2 and their respective standard deviations, for all the being studied elements are gathered in Table 5.
The specificity results show that the recovery percentages of all elements are within [80–120%] interval. Specificity values for TEs in soil have not been found in the literature. However, EU commission regulation No 2001/22/EC [48] mentions that recovery between 80% and 120% is acceptable for TEs such as lead, cadmium and mercury in foodstuffs. These results allow the application of the developed method in routine analysis without causing interference for As, Cd, Co, Cr, Cu, Ni and Pb.
3.2.4. Comparison between the validated method (MSD + AAS) and the RTD method
(HF-based digestion + ICP/ICPMS) of TE analysis. Accuracy or trueness
Accuracy is defined as ‘the closeness of agreement between the value that is accepted either as a conventional true value or an accepted reference value and the value found’ [47]. Accuracy is sometimes defined as trueness. Accuracy can be determined by analysing a CRM and comparing the experimental value to the assigned value. It is actually what we did in paragraph 3.1 where we obtained recovery percentages between 87% and 112%. Another way to assess accuracy is to work on real samples, to analyse them by the method being validated and to compare results with that obtained from a reference method. In this study, TEs in soil samples from the Bekaa governorate were determined by an MSD method using a mixture of H2SO4 and H2O2 followed by AAS measurements. Microwave digestion and element analysis were done in triplicate. Results from this method were compared to an external ISO reference, which is the RTD method where the same samples were digested by HF and HClO4 and analysed by ICP-AES or ICP-MS. The RTD method allows for total digestion of soil samples.
Results were compared in terms of recovery percentage calculated using Equation 1. These results are presented in Table 6.
All recovery values were below 100%, which was predictable because the MSD with a mixture of H2SO4 and H2O2 does not induce a total mineralisation of silicates compared with the RTD method using a mixture of HF and HClO4. High recovery percentages were obtained for Co, Cr and Cu. Two-thirds of the calculated recoveries were higher than 70%, which is an acceptable value for trace analysis as defined by (AOAC 2002) [46]. The other third was between 50% and 70% except for 3 values (As for B1 and Pb for B6 and B7). As, Co, Cr and Pb concentrations measured using the validated MSD method were correlated
Table 5. Specificity results expressed as mean recovery percentage and standard deviation. Three samples were analysed: CRM soil alone and CRM after the addition of two concentration levels for each element (n = 9).
Trace elements
Mean recovery percentage and standard deviation %
Soil CRMSoil CRM 1
+ 50 mg kg−1 of each TESoil CRM 2
+ 100 mg kg−1of each TE
As 93.7 ± 0.9 96.1 ± 9.6 104.0 ± 4.9Cd 87.3 ± 4.7 94.7 ± 9.2 92.0 ± 6.3Co 112.6 ± 0.1 116.9 ± 0.3 117.8 ± 0.8Cr 112.3 ± 3.5 111.5 ± 7.2 109.9 ± 5.7Cu 89.2 ± 3.9 90.6 ± 4.0 99.1 ± 4.9Ni 98.4 ± 0.9 98.1 ± 2.1 97.7 ± 1.7Pb 112.6 ± 0.1 116.9 ± 0.2 117.8 ± 0.8
INTERNATIONAL JOURNAL OF ENVIRONMENTAL ANALYTICAL CHEMISTRY 11
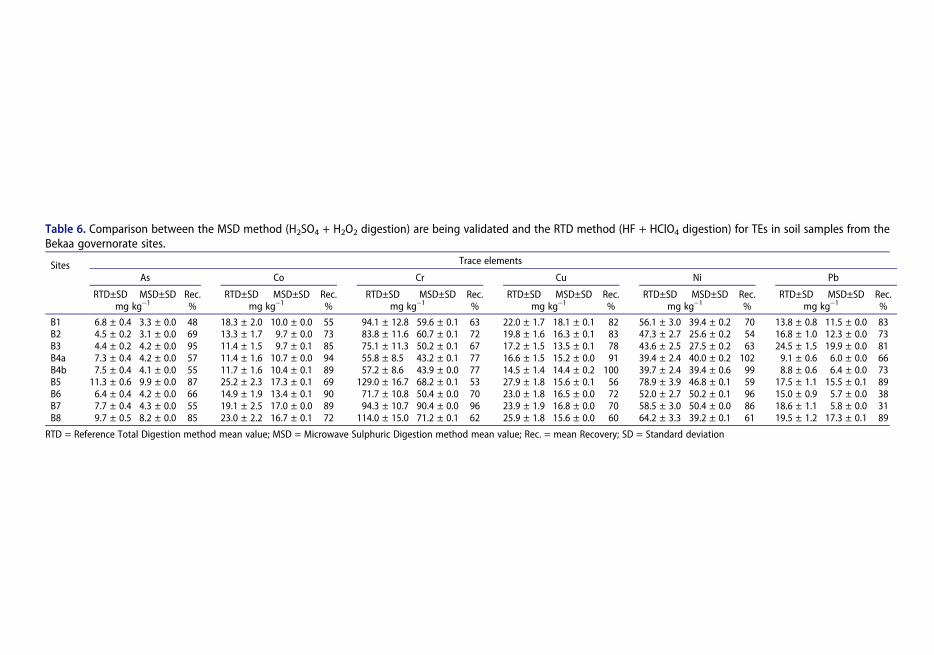
Table 6. Comparison between the MSD method (H2SO4 + H2O2 digestion) are being validated and the RTD method (HF + HClO4 digestion) for TEs in soil samples from the Bekaa governorate sites.
Sites Trace elements
As Co Cr Cu Ni Pb
RTD±SD MSD±SD Rec. RTD±SD MSD±SD Rec. RTD±SD MSD±SD Rec. RTD±SD MSD±SD Rec. RTD±SD MSD±SD Rec. RTD±SD MSD±SD Rec.mg kg−1 % mg kg−1 % mg kg−1 % mg kg−1 % mg kg−1 % mg kg−1 %
B1 6.8 ± 0.4 3.3 ± 0.0 48 18.3 ± 2.0 10.0 ± 0.0 55 94.1 ± 12.8 59.6 ± 0.1 63 22.0 ± 1.7 18.1 ± 0.1 82 56.1 ± 3.0 39.4 ± 0.2 70 13.8 ± 0.8 11.5 ± 0.0 83B2 4.5 ± 0.2 3.1 ± 0.0 69 13.3 ± 1.7 9.7 ± 0.0 73 83.8 ± 11.6 60.7 ± 0.1 72 19.8 ± 1.6 16.3 ± 0.1 83 47.3 ± 2.7 25.6 ± 0.2 54 16.8 ± 1.0 12.3 ± 0.0 73B3 4.4 ± 0.2 4.2 ± 0.0 95 11.4 ± 1.5 9.7 ± 0.1 85 75.1 ± 11.3 50.2 ± 0.1 67 17.2 ± 1.5 13.5 ± 0.1 78 43.6 ± 2.5 27.5 ± 0.2 63 24.5 ± 1.5 19.9 ± 0.0 81B4a 7.3 ± 0.4 4.2 ± 0.0 57 11.4 ± 1.6 10.7 ± 0.0 94 55.8 ± 8.5 43.2 ± 0.1 77 16.6 ± 1.5 15.2 ± 0.0 91 39.4 ± 2.4 40.0 ± 0.2 102 9.1 ± 0.6 6.0 ± 0.0 66B4b 7.5 ± 0.4 4.1 ± 0.0 55 11.7 ± 1.6 10.4 ± 0.1 89 57.2 ± 8.6 43.9 ± 0.0 77 14.5 ± 1.4 14.4 ± 0.2 100 39.7 ± 2.4 39.4 ± 0.6 99 8.8 ± 0.6 6.4 ± 0.0 73B5 11.3 ± 0.6 9.9 ± 0.0 87 25.2 ± 2.3 17.3 ± 0.1 69 129.0 ± 16.7 68.2 ± 0.1 53 27.9 ± 1.8 15.6 ± 0.1 56 78.9 ± 3.9 46.8 ± 0.1 59 17.5 ± 1.1 15.5 ± 0.1 89B6 6.4 ± 0.4 4.2 ± 0.0 66 14.9 ± 1.9 13.4 ± 0.1 90 71.7 ± 10.8 50.4 ± 0.0 70 23.0 ± 1.8 16.5 ± 0.0 72 52.0 ± 2.7 50.2 ± 0.1 96 15.0 ± 0.9 5.7 ± 0.0 38B7 7.7 ± 0.4 4.3 ± 0.0 55 19.1 ± 2.5 17.0 ± 0.0 89 94.3 ± 10.7 90.4 ± 0.0 96 23.9 ± 1.9 16.8 ± 0.0 70 58.5 ± 3.0 50.4 ± 0.0 86 18.6 ± 1.1 5.8 ± 0.0 31B8 9.7 ± 0.5 8.2 ± 0.0 85 23.0 ± 2.2 16.7 ± 0.1 72 114.0 ± 15.0 71.2 ± 0.1 62 25.9 ± 1.8 15.6 ± 0.0 60 64.2 ± 3.3 39.2 ± 0.1 61 19.5 ± 1.2 17.3 ± 0.1 89
RTD = Reference Total Digestion method mean value; MSD = Microwave Sulphuric Digestion method mean value; Rec. = mean Recovery; SD = Standard deviation
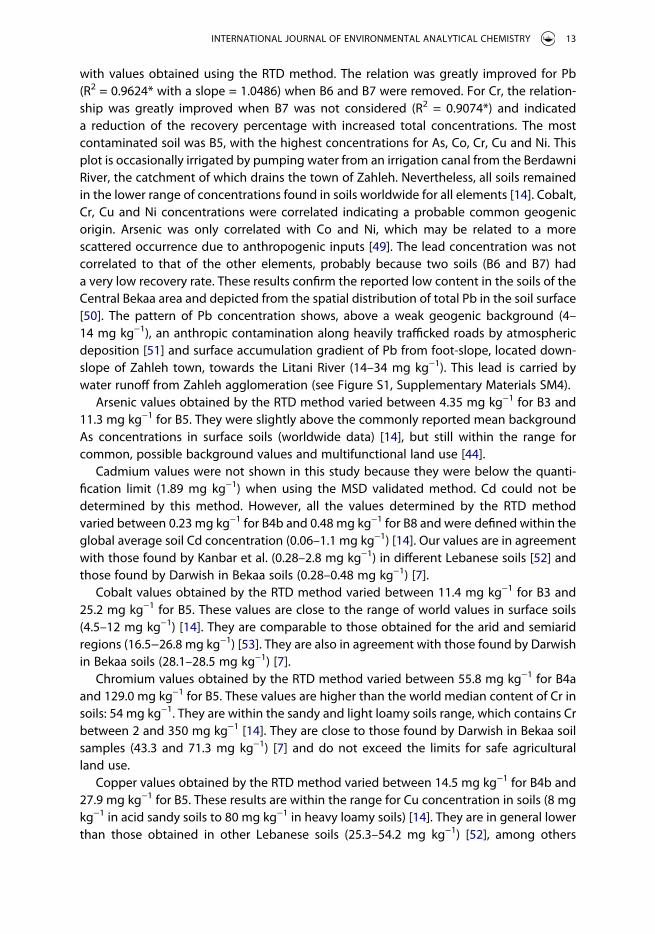
with values obtained using the RTD method. The relation was greatly improved for Pb (R2 = 0.9624* with a slope = 1.0486) when B6 and B7 were removed. For Cr, the relation-ship was greatly improved when B7 was not considered (R2 = 0.9074*) and indicated a reduction of the recovery percentage with increased total concentrations. The most contaminated soil was B5, with the highest concentrations for As, Co, Cr, Cu and Ni. This plot is occasionally irrigated by pumping water from an irrigation canal from the Berdawni River, the catchment of which drains the town of Zahleh. Nevertheless, all soils remained in the lower range of concentrations found in soils worldwide for all elements [14]. Cobalt, Cr, Cu and Ni concentrations were correlated indicating a probable common geogenic origin. Arsenic was only correlated with Co and Ni, which may be related to a more scattered occurrence due to anthropogenic inputs [49]. The lead concentration was not correlated to that of the other elements, probably because two soils (B6 and B7) had a very low recovery rate. These results confirm the reported low content in the soils of the Central Bekaa area and depicted from the spatial distribution of total Pb in the soil surface [50]. The pattern of Pb concentration shows, above a weak geogenic background (4– 14 mg kg−1), an anthropic contamination along heavily trafficked roads by atmospheric deposition [51] and surface accumulation gradient of Pb from foot-slope, located down-slope of Zahleh town, towards the Litani River (14–34 mg kg−1). This lead is carried by water runoff from Zahleh agglomeration (see Figure S1, Supplementary Materials SM4).
Arsenic values obtained by the RTD method varied between 4.35 mg kg−1 for B3 and 11.3 mg kg−1 for B5. They were slightly above the commonly reported mean background As concentrations in surface soils (worldwide data) [14], but still within the range for common, possible background values and multifunctional land use [44].
Cadmium values were not shown in this study because they were below the quanti-fication limit (1.89 mg kg−1) when using the MSD validated method. Cd could not be determined by this method. However, all the values determined by the RTD method varied between 0.23 mg kg−1 for B4b and 0.48 mg kg−1 for B8 and were defined within the global average soil Cd concentration (0.06–1.1 mg kg−1) [14]. Our values are in agreement with those found by Kanbar et al. (0.28–2.8 mg kg−1) in different Lebanese soils [52] and those found by Darwish in Bekaa soils (0.28–0.48 mg kg−1) [7].
Cobalt values obtained by the RTD method varied between 11.4 mg kg−1 for B3 and 25.2 mg kg−1 for B5. These values are close to the range of world values in surface soils (4.5–12 mg kg−1) [14]. They are comparable to those obtained for the arid and semiarid regions (16.5−26.8 mg kg−1) [53]. They are also in agreement with those found by Darwish in Bekaa soils (28.1–28.5 mg kg−1) [7].
Chromium values obtained by the RTD method varied between 55.8 mg kg−1 for B4a and 129.0 mg kg−1 for B5. These values are higher than the world median content of Cr in soils: 54 mg kg−1. They are within the sandy and light loamy soils range, which contains Cr between 2 and 350 mg kg−1 [14]. They are close to those found by Darwish in Bekaa soil samples (43.3 and 71.3 mg kg−1) [7] and do not exceed the limits for safe agricultural land use.
Copper values obtained by the RTD method varied between 14.5 mg kg−1 for B4b and 27.9 mg kg−1 for B5. These results are within the range for Cu concentration in soils (8 mg kg−1 in acid sandy soils to 80 mg kg−1 in heavy loamy soils) [14]. They are in general lower than those obtained in other Lebanese soils (25.3–54.2 mg kg−1) [52], among others
INTERNATIONAL JOURNAL OF ENVIRONMENTAL ANALYTICAL CHEMISTRY 13
Taalabaya (Zahleh district) soils (35.7 mg kg−1) [7], but conform to the values obtained in Saadnaeal (Zahleh district) soils (17.0 mg kg−1).
Nickel values obtained by the RTD method varied between 39.4 mg kg−1 for B4a and 78.9 mg kg−1 for B5. These values are within the range of Ni concentration in soils worldwide (0.2–450 mg kg−1) [14]. These results are in agreement with values obtained in Taalabaya soils (60.7 mg kg−1) but higher than values obtained in Saadnaeal soils sampled at the same depth (33.7 mg kg−1) [7].
Lead values obtained by the RTD method varied between 8.84 mg kg−1 for B4b and 24.48 mg kg−1 for B3. These values are lower than the overall mean value of Pb in different soils worldwide (25 mg kg−1) [14]. These results are in agreement with those obtained in other Lebanese soils (11.3–22.9 mg kg−1) [52] and those obtained in Taalabaya soils (16.7 mg kg−1) and Saadnaeal soils (10.0 mg kg−1) [7].
In summary, the results obtained in this study are representative of soils with limited trace elements contamination. The concentrations measured are within the same range than the values obtained by Darwish for surface soils and soil profiles of the Bekaa plain. He points to both a natural TE source with variation explained by the alluvial-colluvial origin of the parent material but also to a limited anthropogenic pollution due to a combination of inputs from cultivation and atmospheric deposition which is modulated by soil organic content.
The correlations between TE values were higher following the RTD method than the validated one, suggesting that the RTD method can better trace the common origin of the elements, which were mostly of geogenic origin as also indicated by the observed level of concentrations, which were close to the background level detected in North Lebanon [8].
Aqua regia, which is a reference method for pseudo-total metal concentrations in soils, gives an extraction efficiency between 53% and 100%, depending on the element as compared to the total concentrations (calculated for the certified material METRANAL-33 in Shahbazi and Beheshti) [54]. Although it is widely used, resorption occurs (up to 470% for Cu) leading to underestimation of element concentrations [55] and other mild extraction procedures may provide accurate results when the trace element reactive fraction, not bound to silicates, is to be recovered [55]. Our results fall within the same range of efficiency as aqua regia and the validated method including the microwave digestion with H2SO4 + H2O2 may offer a more feasible and workable alternative.
4. Conclusion
The microwave digestion with H2SO4 + H2O2 combined with flame-AAS measurement was validated with CRM and after comparison with HF-based digestion. This allows for routine but accurate characterisation of calcareous and Ca-saturated soils with limited contamination in As, Cd, Cu, Co, Cr and Pb. The tested soils, used for wheat production, are irrigated with water of poor quality and need to be monitored for their trace element concentrations regularly to prevent transfer to the food chain.
Recent microwave digestion methods were implemented according to green chem-istry, they have proved their efficiency for the determination of trace elements in soil samples [11,12,19,22]. In these studies, several reagents were used to dissolve soil or
14 N. LEBBOS ET AL.
sediment samples such as: HNO3, HClO4, HF, HCl, NH4HF2 and H2O2 before trace element analysis using ICP-OES, ICP-MS or MIP-OES. These recent methods uses problematic reagents difficult to handle safely and/or expensive analytical devices.
The validated method offers an alternative to HF-based methods, as well as aqua regia. It is a green, safe and cheap method for trace element analysis in soil samples. Other soil types will have to be tested in order to further extend its use to a larger range of soils to cover the soil diversity in the Mediterranean area.
Funding
This research was funded by the project PHC-Cèdre (bilateral French–Lebanese funding program) and the Lebanese Agricultural Research Institute (LARI).
ORCID
Catherine Keller http://orcid.org/0000-0001-8455-2926Laurence Dujourdy http://orcid.org/0000-0001-8318-6979Pierre Curmi http://orcid.org/0000-0001-6546-1172Talal Darwish http://orcid.org/0000-0002-7830-3154Claude Daou http://orcid.org/0000-0002-2634-4819Elias Bou-Maroun http://orcid.org/0000-0003-0208-858X
References
[1] M.B. Rivera, J.C. Fernández-Caliani and M.I. Giráldez, Geoderma 259–260, 164 (2015). doi:10.1016/j.geoderma.2015.06.009.
[2] E. Shang, E. Xu, H. Zhang and C. Huang, Rep. 9, 19463 (2019).[3] V. Antoniadis, E.E. Golia, Y.-T. Liu, S.-L. Wang, S.M. Shaheen and J. Rinklebe, Environ. Int. 124,
79 (2019). doi:10.1016/j.envint.2018.12.053.[4] L.N. Kassir, T. Darwish, A. Shaban, G. Olivier and N. Ouaini, Geoderma 189–190, 357 (2012).
doi:10.1016/j.geoderma.2012.05.017.[5] S.I. Korfali and H. Karaki, Process 5, 101 (2018). doi:10.1007/s40710-018-0328-1.[6] T. Darwish, I. Jomaa, M. Awad and R. Boumetri, Leb. Sci. J. 9, 3 (2008).[7] T. Darwish, Presented at Global Symposium on Soil Pollution (FAO, Rome, Italy, 2018) p. 85.[8] B. Nsouli, T. Darwish, J.-P. Thomas, K. Zahraman and M. Roumié, Nucl. Instrum. Methods Phys.
Res. Sect. B. 219–220, 181 (2004). doi:10.1016/j.nimb.2004.01.050.[9] C. Voica, A. Dehelean, A. Iordache and I. Geana, Rom. Rep. Phys. 64, 221 (2012).
[10] R.A.A. Munoz, E.S. Almeida and L. Angnes, Reference Module in Chemistry, Molecular Sciences and Chemical Engineering (Elsevier, Waltham, 2013), pp. 1–10.
[11] I. Funes Pinter, M.V. Salomon, R. Gil, L. Mastrantonio, R. Bottini and P. Piccoli, Sci. Total Environ. 615, 1485 (2018). doi:10.1016/j.scitotenv.2017.09.114.
[12] T. Lin, X. Chen, B. Li, P. Chen, M. Guo, X. Zhou, S. Zhong and X. Cheng, Microchem. J. 146, 49 (2019). doi:10.1016/j.microc.2018.12.051.
[13] C.T.T. Nguyen, R.J. Wasson, E.S. Estrada, S.I. Cantarero, C. Teo and A.D. Ziegler, J. Environ. Manage. 232, 999 (2019). doi:10.1016/j.jenvman.2018.11.106.
[14] A. Kabata-Pendias and A.B. Mukherjee, Trace Elements from Soil to Human (Springer-Verlag, Berlin Heidelberg, 2007).
[15] M. Hoenig, Talanta 54, 1021 (2001). doi:10.1016/S0039-9140(01)00329-0.[16] S. Melaku, R. Dams and L. Moens, Chim. Acta. 543, 117 (2005). doi:10.1016/j.aca.2005.04.055.[17] A. Santoro, A. Held, T.P.J. Linsinger, A. Perez and M. Ricci, TrAC Trends Anal. Chem. 89, 34
(2017). doi:10.1016/j.trac.2017.01.010.
INTERNATIONAL JOURNAL OF ENVIRONMENTAL ANALYTICAL CHEMISTRY 15
[18] W. Zhang and Z. Hu, Acta Part B. 160, 105690 (2019). doi:10.1016/j.sab.2019.105690.[19] T.T. Magaldi, M.S. Navarro and J. Enzweiler, Geostand. Geoanal. Res 43, 189 (2019).
doi:10.1111/ggr.12242.[20] ISO 22036:2008, Soil Quality. Determination of Trace Elements in Extracts of Soil by Inductively
Coupled Plasma - Atomic Emission Spectrometry (ICP - AES) (International Organization for Standardization (ISO), Geneva, Switzerland, 2008).
[21] ISO 17294-2:2016, Water Quality. Application of Inductively Coupled Plasma Mass Spectrometry (ICP-MS). Part 2: Determination of Selected Elements Including Uranium Isotopes (International Organization for Standardization (ISO), Geneva, Switzerland, 2016).
[22] F. Cora Jofre, D.N. Larregui and M. Savio, Microchem. J. 159, 105448 (2020). doi:10.1016/j. microc.2020.105448.
[23] C.A. Bizzi, M.F. Pedrotti, J.S. Silva, J.S. Barin, J.A. Nóbrega, E.M.M. Flores and J. Anal, Spectrom 32, 1448 (2017).
[24] Food and Agriculture Organization, Résultats globaux du module de base du recensement de l’agriculture, 2010.
[25] IUSS Working Group WRB, World Reference Base for Soil Resources 2014 International Soil Classification System for Naming Soils and Creating Legends for Soil Maps, World Soil Resources Reports No. 106 (FAO, Rome, 2015). <https://ec.europa.eu/jrc/en/publication/ world-reference-base-soil-resources-2014-international-soil-classification-system-naming- soils-and >.
[26] W. Horwitz, Pure Appl. Chem. 62, 1193 (1990). doi:10.1351/pac199062061193.[27] NF X31-102, Soils Quality. Determination of Residual Moisture Content of Soils Analytical Test
Samples (Afnor, La Plaine Saint-Denis, France, 1981).[28] ISO 11464:2006, Soil Quality. Pretreatment of Samples for Physico-chemical Analysis
(International Organization for Standardization (ISO), Geneva, Switzerland, 2006).[29] ISO 14869-1:2001, Soil Quality. Dissolution for the Determination of Total Element Content.
Part 1: Dissolution with Hydrofluoric and Perchloric Acids (International Organization for Standardization (ISO), Geneva, Switzerland, 2001).
[30] RCore Team, R, A Language and Environment for Statistical Computing (R Foundation for Statistical Computing, Vienna, Austria, 2020).
[31] RStudio Team, RStudio: Integrated Development for R. RStudio (PBC, Boston, MA, 2020).[32] J. Fox and S. Weisberg, An R Companion to Applied Regression (Sage publications, California,
US, 2018).[33] A. Zeileis and T. Hothorn, R News 2, 7 (2002).[34] H. Wickham, A Grammar of Data Manipulation, R package version 0.8. 5. 700, R-Project. Org/
Package= Dplyr. 2020.[35] S. Révillon and D. Hureau-Mazaudier, Geoanal. Res. 33, 397 (2009). doi:10.1111/j.1751-
908X.2009.00008.x.[36] H. Hernández-Mendoza, M. Mejuto, A.I. Cardona, A. García-Álvarez, R. Millán and A. Yllera, Am.
J. Anal. Chem. 4, 9 (2013). doi:10.4236/ajac.2013.410A2002.[37] D.B. Hibbert and J.J. Gooding, Data Analysis for Chemistry: An Introductory Guide for Students
and Laboratory Scientists (Oxford University Press, Oxford, New York, 2005).[38] W.P. Gardiner, Statistical Analysis Methods for Chemists (Royal Society of Chemistry,
Cambridge, 1997).[39] B.J. Millard, Quantitative Mass Spectrometry (Heyden, London, 1978).[40] I. Lavagnini and F. Magno, Mass Spectrom. Rev. 26, 1 (2007). doi:10.1002/mas.20100.[41] A.M. Committee, Analyst 119, 2363 (1994). DOI:10.1039/an9941902363.[42] Á. Lavín, J.D. Vicente, M. Holgado, M.F. Laguna, R. Casquel, B. Santamaría, M.V. Maigler, A.
L. Hernández and Y. Ramírez, Sensors 18, 2038 (2018). doi:10.3390/s18072038.[43] J.S. Garden, D.G. Mitchell and W.N. Mills, Anal. Chem. 52, 2310 (1980). doi:10.1021/
ac50064a017.[44] Federal Office for the Environment, Sols pollués. Évaluation de la menace et mesures de
protection. Cf Eikmann and Klocke, 1993 (Office Fédéral de l'Environnement (OFEFP), Berne, Switzerland, 2005).
16 N. LEBBOS ET AL.
[45] V. Barwick, P.P.M. Bravo, S.L. Ellison, J. Engman, E.L. Gjengedal, U.O. Lund, B. Magnusson, H.- T. Müller, M. Patriarca and B. Pohl, The Fitness for Purpose of Analytical Methods, edited by B. Magnusson and U. Örnemark (Eurachem, Teddington, UK, 2014).
[46] W. Horwitz, AOAC Guidelines for Single Laboratory Validation of Chemical Methods for Dietary Supplements and Botanicals, Gaithersburg (AOAC International, MD, USA, 2002), p. 12–19.
[47] International Conference on Harmonisation, Q 2 (R1) Validation of Analytical Procedures: Text and Methodology, 1996.
[48] European Commission, Off. J. 50, 14 (2001).[49] T. Darwish, M. Hamze and B. Nsouli, Lebanese Sci. J. 2021. In press.[50] T. Darwish, H.W. Mueller, M. Hobler and I. Jomaa, Approach to Assess Soil Contamination II:
Evaluation of Heavy Metal Contamination of Main Arable Lebanese Soils (INRA Morocco, Marrakech, Morocco, 2004), p. 131.
[51] V. Gupta, in Environmental Concerns and Sustainable Development: Volume 1: Air, Water and Energy Resources, edited by V. Shukla and N. Kumar (Springer, Singapore, 2020), p. 113.
[52] H.J. Kanbar, N. Hanna, A.G. El Samrani, V. Kazpard, A. Kobaissi, N. Harb and N. Amacha, Environ. Monit. Assess. 186, 8793 (2014). doi:10.1007/s10661-014-4044-7.
[53] M. Jalali and M. Majeri, Geochem 76, 95 (2016). doi:10.1016/j.chemer.2015.11.004.[54] K. Shahbazi and M. Beheshti, SN Appl. Sci. 1, 1541 (2019). doi:10.1007/s42452-019-1578-x.[55] L.G. Guedes, V.F. Melo and A.H. Batista, Chemosphere 251, 126356 (2020). doi:10.1016/j.
chemosphere.2020.126356.
INTERNATIONAL JOURNAL OF ENVIRONMENTAL ANALYTICAL CHEMISTRY 17

Supplementary data
������������ ����������������������������������������������������������� ������������������������������� �!�"#�$%&��'�((�$ ���)$�&*��+),�)$�- �.%*#�(�/0$�1 �2%�$$��!)$1% �3�(�(�+�$4%�# �!(�)���+��) �5(%���6�)7.�$�)&�� �8�9�:������������������������������������������������������������������������������������������;<=�>�?�8@ABC98D�EFGH�I��0���1J(��4���"$�&�0�$$���"����*$)*%�(���&��J(�*���%&���0)$&�&*�F�3#��"�1J�$�")$��$��*#���J$�I$���%K�(-�LHE�M!��K�$�N�#F�3#��"�1J�$�")$��4���1�%&"�%&����"�LHE�M!��)$%&I�O#F�/0"�$�*��(%&I �"#����#�4���P)�&"%"�"%K�(-�"$�&�0�$$���"����23Q5��K�J�$�"%&I��%�#�4%"#���1%&%1)1��11�)&"��0�4�"�$F�H�1���0�RQ��&��NFH�1���0�R!(SL�4�$��������"��"#��23Q5��%�#F�3#��1%T")$��4���#��"����&���#�"�J(�"��)&"%(�"#����&���0)1����0�R!(SL��&��U%QL�*����F�6�0�$��*�1J(�"���$-&��� �"#���%�#�4���$�1�K���0$�1�"#��#�"�J(�"���&���((�4���"��*��(F�N�1���0�R�SO�NH�1�(��7N��&��H�1���0�4�"�$�4�$��������"���%���(K��"#��$��%�)�F�3#��(�""�$�4���#��"���%0�&������"�����%�"��%���()"%�&F�3#����"�%&�����()"%�&�4���"$�&�0�$$���P)�&"%"�"%K�(-�"����HE�1��K�()1�"$%*�0(��VF�� �W�9�������������������������X������������������������������3#��K�(%��"%�&��0�"#��(%&��$�$�I$���%�&�1���(�%����&��)�%&I��&�/�SY/�"��(���&����K�$�(�"��"��J�$0�$1����&�"#���%00�$�&"�J�$�1�"�$���)*#���Z�7�[\]_\ab�\_b\�c�de_e�\d�fghcg\_�\i_�bcjckclgl_�dk�\i_�bhdm_�g �\i_�c\_el_m\�nop�q_�li_lr�"#�"�"#�-��$���%00�$�&"�0$�1�Es �7�Q%�#�$t��"��"���&�"#���%I&%0%*�&*���0�"#��$�I$���%�&�1���(��&���&�"#��(%&��$%"-��0�"#��1���( �7�u]evc�wg\bdab�\_b\�\d�li_lr�\i_�c _m_ _l_�dk�\i_�e_bc]ghb�ngvb_l_�dk�g]\dldee_hg\cdxy�7�U#�J%$�t��"��"�"��K�$%0-�"#��&�$1�(%"-��0�"#��$��%�)�(� �7�6$�)�#7zgjgab�\_b\�\d�f_eck{�\i_�i{md\i_bcb�dk�id|dj__c\{�dk�\i_�e_bc]ghb}�~&�*�����0�&�&7&�$1�(%"- �%"�%��J���%�(��"��"$�&�0�$1�"#����"��"��1�V��"#�1�&�$1�(F�Q�$��)"�*�$$�(�"%�& �%&�"#��*�����0�*�(%�$�"%�& �"#��J#�&�1�&�&�1�-��JJ��$��&��1�-�����)��"��"#��
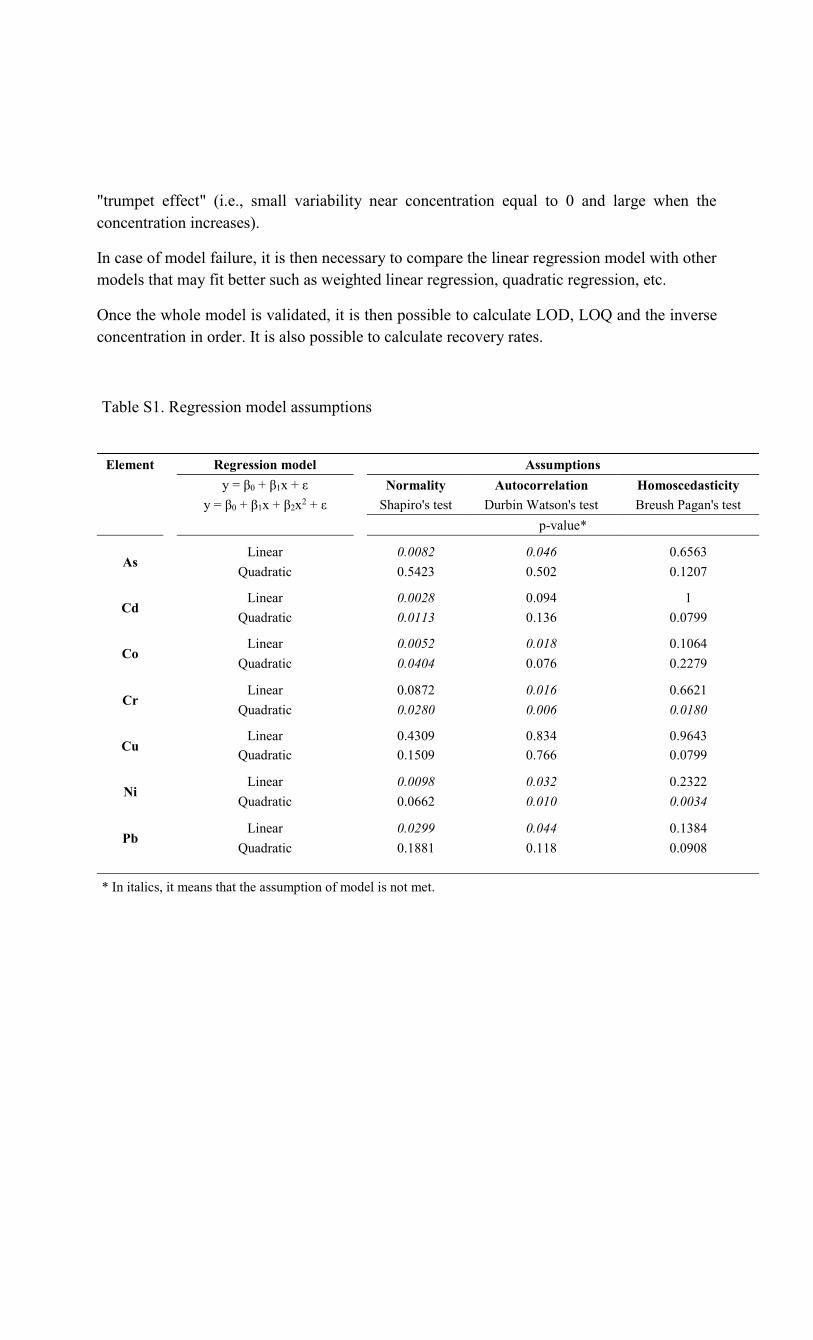
���������������� � ���������������������������������������������������������������������������������������� ��������������������������������������������������������������������������������������������������������������������������������������������������������������������������������� ������������������������������������������������������������������ �!�� �"������������������������������������� ��������������������������������������������� �#�����$% �&����������������������������'()*)+,� -)./)0012+�*23)(� 4005*6,12+0�7�8�9��:�9%;�:�<�� =2/*>(1,?� 45,2@2//)(>,12+� A2*20@)3>0,1@1,?�7�8�9��:�9%;�:�9BCB�:�<� $������D������� !������E�����D������� F������G����D��������H�����I�40� ������ JKJJLM� JKJNO� � PQPR�"�������� � QSBR� � Q�B� � %B�T�U3� ������ JKJJML� � �VS� %�"�������� JKJWWX� � %RP� � �TVV�U2� ������ JKJJYM� JKJWL� � %�PS�"�������� JKJNJN� � �TP� � BBTV�U/� ������ � �ZTB� JKJWO� � PPB%�"�������� JKJMLJ� JKJJO� JKJWLJ�U5� ������ � SR�V� � ZRS� � VPSR�"�������� � %Q�V� � TPP� � �TVV�=1� ������ JKJJ[L� JKJXM� � BRBB�"�������� � �PPB� JKJWJ� JKJJXN�\]� ������ JKJM[[� JKJNN� � %RZS�"�������� � %ZZ%� � %%Z� � �V�Z�I����������������������������������������������������������
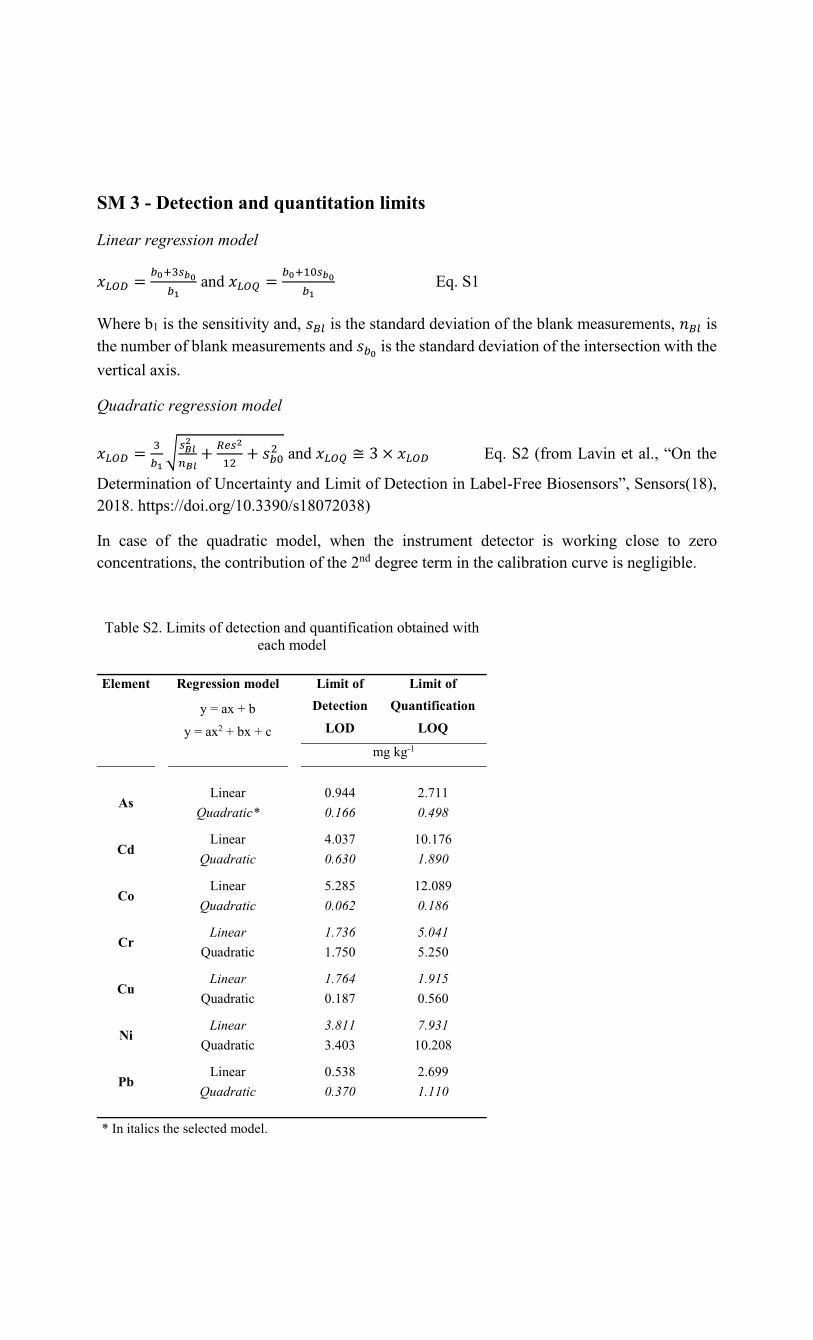
��������������� ����� ��� ��������������������������������� !"#$%&'()*&%+ ,-.� !"/$%&'01)*&%+ 234�56�789:9�;6�<=�>89�=9-=<><?<>@�,-.A�BCD�<=�>89�=>,-.,:.�.9?<,><E-�EF�>89�;G,-H�I9,=J:9I9->=A�KCD�<=�>89�-JI;9:�EF�;G,-H�I9,=J:9I9->=�,-.�B%&�<=�>89�=>,-.,:.�.9?<,><E-�EF�>89�<->9:=9L><E-�M<>8�>89?9:><L,G�,N<=4�OP����Q�R������������������ !"#$(%+S)TUVWTUXYZ)V0[ XB%1[�,-.� !"/\] !"#�� _a�bc�defgh�ijklm�no�jpaq�rsm�otnu9>9:I<-,><E-�EF�v-L9:>,<->@�,-.�w<I<>�EF�u9>9L><E-�<-�w,;9Gxyfnn�zlg{nm{gf{|q�bnm{gf{d}~�q���6�4�8>>�=���.E<4E:��6�4�����=6����������-�L,=9�EF�>89�3J,.:,><L�IE.9GA�M89-�>89�<-=>:JI9->�.9>9L>E:�<=�ME:H<-��LGE=9�>E��9:E�LE-L9->:,><E-=A�>89�LE->:<;J><E-�EF�>89��-.�.9�:99�>9:I�<-�>89�L,G<;:,><E-�LJ:?9�<=�-9�G<�<;G94��,;G9�5�4�w<I<>=�EF�.9>9L><E-�,-.�3J,-><F<L,><E-�E;>,<-9.�M<>8�9,L8�IE.9G��������� ���������������� ������� ���������@���,N���;� �������� �� ��� ����@���,N����;N���L�� ���� ����I��H�x6���� w<-9,:� �4���� �4�66�OP����Q�R�� ������ ��� ¡�¢�� w<-9,:� �4���� 6�46�£�OP����Q�R� ���¤�� ��¡ ��¢�� w<-9,:� ¥4��¥� 6�4����OP����Q�R� ����¦� ���¡��¢�� ������� ��§¤�� �����©J,.:,><L� 64�¥�� ¥4�¥��¢�� ������� ��§��� �� ��©J,.:,><L� �46��� �4¥£��ª� ������� ¤�¡��� §� ¤��©J,.:,><L� �4���� 6�4����«¬� w<-9,:� �4¥��� �4£���OP����Q�R� ��¤§�� �������-�<>,G<L=�>89�=9G9L>9.�IE.9G4
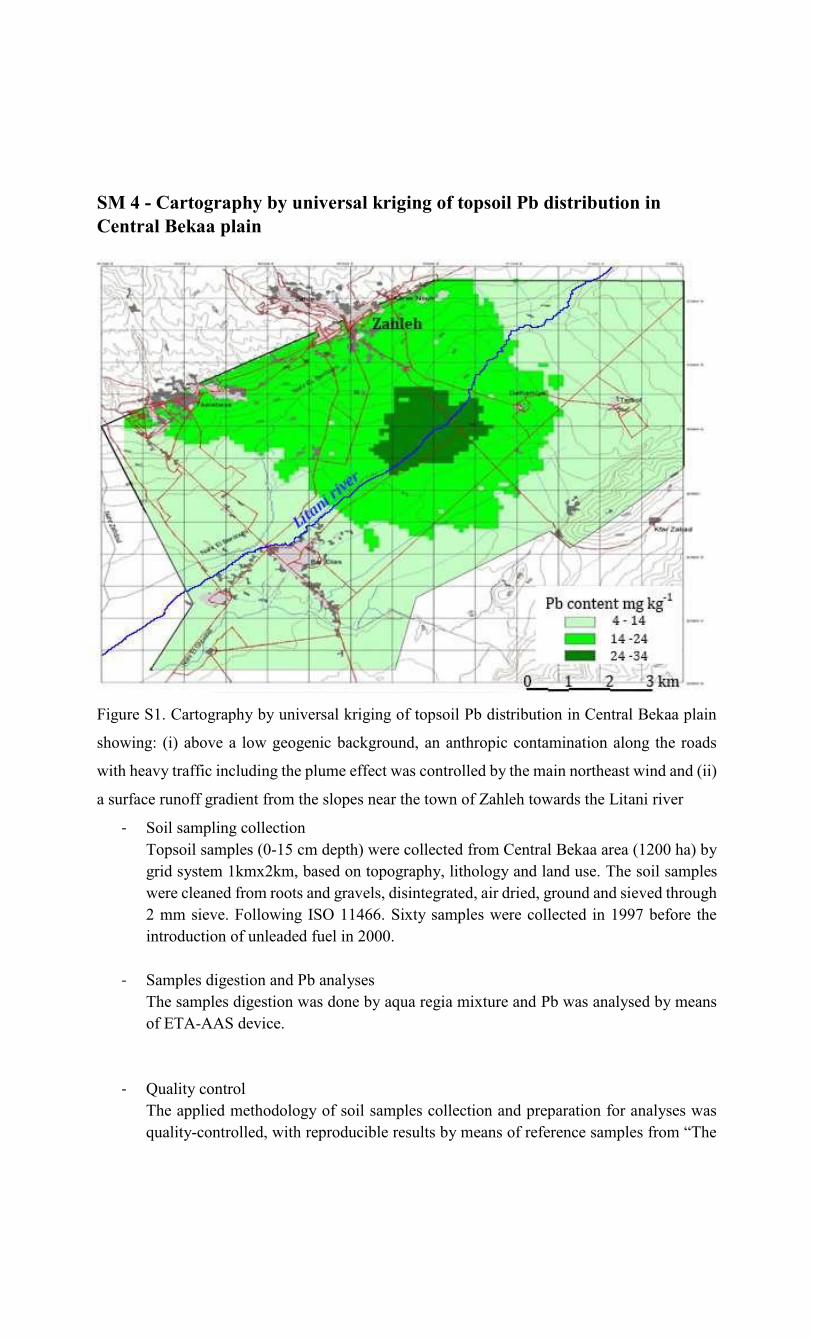
�������������� �����������������������������������������������������������������
���� !�"#$�%& '(� &)*+�,+��-�.! /&0�1 ���-��(2�'()/(�0�3,�4�/' �,�'�(-��-�%!-' &0�5!1&&�)0&�-�/*(6�-�7�8�9�&,(.!�&�0(6��!(�!-�:�,&:1� (�-4;�&-�&-'* ()�:�:(-'&<�-&'�(-�&0(-��'*!� (&4/�6�'*�*!&.+�' &22�:��-:0�4�-��'*!�)0�<!�!22!:'�6&/�:(-' (00!4�,+�'*!�<&�-�-( '*!&/'�6�-4�&-4�8��9�&�/� 2&:!� �-(22�� &4�!-'�2 (<�'*!�/0()!/�-!& �'*!�'(6-�(2�=&*0!*�'(6& 4/�'*!�>�'&-�� �.! �?�"(�0�/&<)0�-��:(00!:'�(-�@()/(�0�/&<)0!/�8AB#C�:<�4!)'*9�6! !�:(00!:'!4�2 (<�%!-' &0�5!1&&�& !&�8#DAA�*&9�,+�� �4�/+/'!<�#1<ED1<;�,&/!4�(-�'()(� &)*+;�0�'*(0(�+�&-4�0&-4��/!$�@*!�/(�0�/&<)0!/�6! !�:0!&-!4�2 (<� (('/�&-4�� &.!0/;�4�/�-'!� &'!4;�&� �4 �!4;�� (�-4�&-4�/�!.!4�'* (��*�D�<<�/�!.!$��(00(6�-��F"G�##HII$�"�E'+�/&<)0!/�6! !�:(00!:'!4��-�#JJK�,!2( !�'*!��-' (4�:'�(-�(2��-0!&4!4�2�!0��-�DAAA$�?�"&<)0!/�4��!/'�(-�&-4�3,�&-&0+/!/�@*!�/&<)0!/�4��!/'�(-�6&/�4(-!�,+�&L�&� !��&�<�E'� !�&-4�3,�6&/�&-&0+/!4�,+�<!&-/�(2�M@NBNN"�4!.�:!$�?�O�&0�'+�:(-' (0�@*!�&))0�!4�<!'*(4(0(�+�(2�/(�0�/&<)0!/�:(00!:'�(-�&-4�) !)& &'�(-�2( �&-&0+/!/�6&/�L�&0�'+BPQRSTQUUVWX�YZS[�TV\TQW]PZUV�TV_]US_� �aVbR_�Qc�TVcVTVRPV�_ba\UV_�cTQa�de[V�

���������������� ������������������������������ !��" �#��$���� ����%&��'��(����)*+,�-��������*�*��)./0�--��1�-��������*�*��)./0�--��12���)���3*��1�(�3��4��*�5��1��10��(�)2��(�0����6��/��780680��*�3����+
Copyright © 2022 FDOKUMEN


![Hamilton Beach Artisan Bread Maker [29888] - Use & Care](https://static.fdokumen.com/doc/165x107/6324aafb051fac18490ce4cf/hamilton-beach-artisan-bread-maker-29888-use-care.jpg)