Lean tool selection in a die casting unit: a fuzzy-based decision support heuristic
33
This article was downloaded by: [Indian Institute of Technology - Kharagpur] On: 05 June 2015, At: 11:30 Publisher: Taylor & Francis Informa Ltd Registered in England and Wales Registered Number: 1072954 Registered office: Mortimer House, 37-41 Mortimer Street, London W1T 3JH, UK International Journal of Production Research Publication details, including instructions for authors and subscription information: http://www.tandfonline.com/loi/tprs20 Lean tool selection in a die casting unit: a fuzzy-based decision support heuristic R. K. Singh a , S. Kumar a , A. K. Choudhury b & M. K. Tiwari c a Department of Production Engineering , Birla Institute of Technology , Mesra, Ranchi-835 215, India b Department of Manufacturing Engineering , National Institute of Foundry and Forge Technology , Ranchi-834 003, India c Department of Forge Technology , National Institute of Foundry and Forge Technology , Ranchi-834 003, India Published online: 22 Feb 2007. To cite this article: R. K. Singh , S. Kumar , A. K. Choudhury & M. K. Tiwari (2006) Lean tool selection in a die casting unit: a fuzzy-based decision support heuristic, International Journal of Production Research, 44:7, 1399-1429, DOI: 10.1080/00207540500272980 To link to this article: http://dx.doi.org/10.1080/00207540500272980 PLEASE SCROLL DOWN FOR ARTICLE Taylor & Francis makes every effort to ensure the accuracy of all the information (the “Content”) contained in the publications on our platform. However, Taylor & Francis, our agents, and our licensors make no representations or warranties whatsoever as to the accuracy, completeness, or suitability for any purpose of the Content. Any opinions and views expressed in this publication are the opinions and views of the authors, and are not the views of or endorsed by Taylor & Francis. The accuracy of the Content should not be relied upon and should be independently verified with primary sources of information. Taylor and Francis shall not be liable for any losses, actions, claims, proceedings, demands, costs, expenses, damages, and other liabilities whatsoever or howsoever caused arising directly or indirectly in connection with, in relation to or arising out of the use of the Content. This article may be used for research, teaching, and private study purposes. Any substantial or systematic reproduction, redistribution, reselling, loan, sub-licensing, systematic supply, or distribution in any form to anyone is expressly forbidden. Terms &
-
Upload
independent -
Category
Documents
-
view
3 -
download
0
Transcript of Lean tool selection in a die casting unit: a fuzzy-based decision support heuristic

This article was downloaded by: [Indian Institute of Technology - Kharagpur]On: 05 June 2015, At: 11:30Publisher: Taylor & FrancisInforma Ltd Registered in England and Wales Registered Number: 1072954 Registeredoffice: Mortimer House, 37-41 Mortimer Street, London W1T 3JH, UK
International Journal of ProductionResearchPublication details, including instructions for authors andsubscription information:http://www.tandfonline.com/loi/tprs20
Lean tool selection in a die castingunit: a fuzzy-based decision supportheuristicR. K. Singh a , S. Kumar a , A. K. Choudhury b & M. K. Tiwari ca Department of Production Engineering , Birla Institute ofTechnology , Mesra, Ranchi-835 215, Indiab Department of Manufacturing Engineering , National Institute ofFoundry and Forge Technology , Ranchi-834 003, Indiac Department of Forge Technology , National Institute of Foundryand Forge Technology , Ranchi-834 003, IndiaPublished online: 22 Feb 2007.
To cite this article: R. K. Singh , S. Kumar , A. K. Choudhury & M. K. Tiwari (2006) Lean toolselection in a die casting unit: a fuzzy-based decision support heuristic, International Journal ofProduction Research, 44:7, 1399-1429, DOI: 10.1080/00207540500272980
To link to this article: http://dx.doi.org/10.1080/00207540500272980
PLEASE SCROLL DOWN FOR ARTICLE
Taylor & Francis makes every effort to ensure the accuracy of all the information (the“Content”) contained in the publications on our platform. However, Taylor & Francis,our agents, and our licensors make no representations or warranties whatsoever as tothe accuracy, completeness, or suitability for any purpose of the Content. Any opinionsand views expressed in this publication are the opinions and views of the authors,and are not the views of or endorsed by Taylor & Francis. The accuracy of the Contentshould not be relied upon and should be independently verified with primary sourcesof information. Taylor and Francis shall not be liable for any losses, actions, claims,proceedings, demands, costs, expenses, damages, and other liabilities whatsoeveror howsoever caused arising directly or indirectly in connection with, in relation to orarising out of the use of the Content.
This article may be used for research, teaching, and private study purposes. Anysubstantial or systematic reproduction, redistribution, reselling, loan, sub-licensing,systematic supply, or distribution in any form to anyone is expressly forbidden. Terms &

Conditions of access and use can be found at http://www.tandfonline.com/page/terms-and-conditions
Dow
nloa
ded
by [
Indi
an I
nstit
ute
of T
echn
olog
y -
Kha
ragp
ur]
at 1
1:30
05
June
201
5
International Journal of Production Research,Vol. 44, No. 7, 1 April 2006, 1399–1429
Lean tool selection in a die casting unit: a fuzzy-based
decision support heuristic
R. K. SINGH*y, S. KUMARy, A. K. CHOUDHURYz
and M. K. TIWARI}
yDepartment of Production Engineering,
Birla Institute of Technology, Mesra, Ranchi-835 215, India
zDepartment of Manufacturing Engineering,
National Institute of Foundry and Forge Technology,
Ranchi-834 003, India
}Department of Forge Technology,
National Institute of Foundry and Forge Technology,
Ranchi-834 003, India
(Received July 2005)
Lean manufacturing philosophy asks for elimination of wastes hidden in the man-ufacturing system by focusing on product value stream and eliminating non-valueadding activities through continuous improvement efforts. Value stream mappingmethodology is subjected to principles of continuous improvement in order toimprove the productivity of the process and quality of the product. It providesvarious tools for data collection and analysis, and identifies the wastes occurring indifferent stages of manufacturing process. The role of value streammapping is veryimportant in the identification and subsequently reduction of the wastes. To selectthe detailed mapping tools for the identification of waste at micro level is a com-plex decision making problem. In this paper, a case study related to a die castingunit has been taken. A hierarchy related to the decision problem has beendeveloped to select the value stream mapping tools. Here, a fuzzy logic basedmulti-preference, multi-criteria, and multi-person decision making heuristic hasbeen developed to solve a problem pertaining to above case study. The proposedmethodology enjoys logical support from existing decision making tools andpertinently maps the inside details of the underlying problem.
Keywords: Lean manufacturing; Group decision making; Analytical hierarchyprocess; Value stream mapping; Multi attribute utility theory; Fuzzy logic
1. Introduction
In order to cope with the ever-increasing competition, many companies are focusingon continuous improvement of all the aspects of business and simultaneously devel-oping and refining the manufacturing process to minimize the overall waste.Lean manufacturing is widely recognized as a mechanism for ensuring improvementin the manufacturing processes. It combines the advantage of craft and massproduction, while avoiding the high cost of the former and rigidity of the latter
*Corresponding author. Email: [email protected]
International Journal of Production Research
ISSN 0020–7543 print/ISSN 1366–588X online # 2006 Taylor & Francis
http://www.tandf.co.uk/journals
DOI: 10.1080/00207540500272980
Dow
nloa
ded
by [
Indi
an I
nstit
ute
of T
echn
olog
y -
Kha
ragp
ur]
at 1
1:30
05
June
201
5
(Womack et al. 1990). Lean manufacturing has been evolved from the ToyotaProduction System (TPS) (Ohno 1988, Shingo 1992), a manufacturing philosophythat shortens the time line between the customer order and shipment by eliminatingthe waste. Thus, the goal of lean manufacturing is to reduce the wastes in terms ofhuman effort, inventory, time to market and manufacturing space, and becomehighly responsive to customer demand while producing world class quality productsin the most efficient and economic manner (Liker 1998, CITEC 2004, Connstep2004). Waste has many forms and can be found at any time and place inside theorganization. Several researchers have attempted to compile a list of wastes affectingthe organization. Notably, Hines et al. (1998) have considered a list of 10 wastespresent in the manufacturing company.
A value stream is defined as the value-added and non-value-added actionsrequired in order to bring specific products, services, or combination of productsand services, to a customer (Womack and Jones 1996, Rother and Shook 1999).Value stream mapping is used to design inventory systems for continuous flow in anymanufacturing system. From the literature survey, it is observed that variousresearchers have applied value stream mapping by employing two differentapproaches, i.e. current and future state mapping (Rother and Shook 1999) anddetailed value stream mapping (Hines and Rich 1997, Hines et al. 1998). Currentand future state mapping advocated by Rother and Shook (1999) provides a blueprint for implementation of lean manufacturing concepts by identifying waste and itssources, and illustrate how the information and material should flow.
On the other hand, Hines et al. (1998) provided a new methodology forimplementing lean philosophy in manufacturing organizations, and is knownas value stream management. It develops value stream mapping into a morestrategic and holistic method and overcome the problems associated withthem. Various detailed mapping tools identified by Hines et al. (1998) are illustratedin table 1.
Detailed mapping tools are applied to identify the micro level wastes and itssubsequent reduction. However, application of inappropriate mapping tools mayresult in the additional wastage of resources such as time, money, and reductionof employee’s confidence in the lean philosophy. Thus, there arises a need to developan effective technique to select appropriate mapping tools to minimize the wastes. Inthis context, Hines and Rich (1997) have proposed a methodology known as valuestream analysis tool (VALSAT). The methodology aims to provide a decision-support system to identify wastes and corresponding value stream mapping toolsfor its analysis at micro level. It is simple in nature but prone to the judgmentalinconsistency caused due to the biased view of the decision makers while allocatingthe emphasis to different alternatives.
In order to do away with the judgmental inconsistency, today’s organizationsprefer a group or team to take part in the key decision-making process. Bettercooperation and collaboration among the group drives an organization towardsperfection. Further, working in a group provides a wide range of advantages bysharing information, generating ideas, making decisions, and reviewing the effectsof the decisions. Ideally, the group will reach a better decision than an individualbecause the collective knowledge and skill of the group is greater than an indi-vidual. Individual accountability is also dispersed in a group decision making(GDM) scenario. Various researchers have focused their attention on increasing
1400 R. K. Singh et al.
Dow
nloa
ded
by [
Indi
an I
nstit
ute
of T
echn
olog
y -
Kha
ragp
ur]
at 1
1:30
05
June
201
5
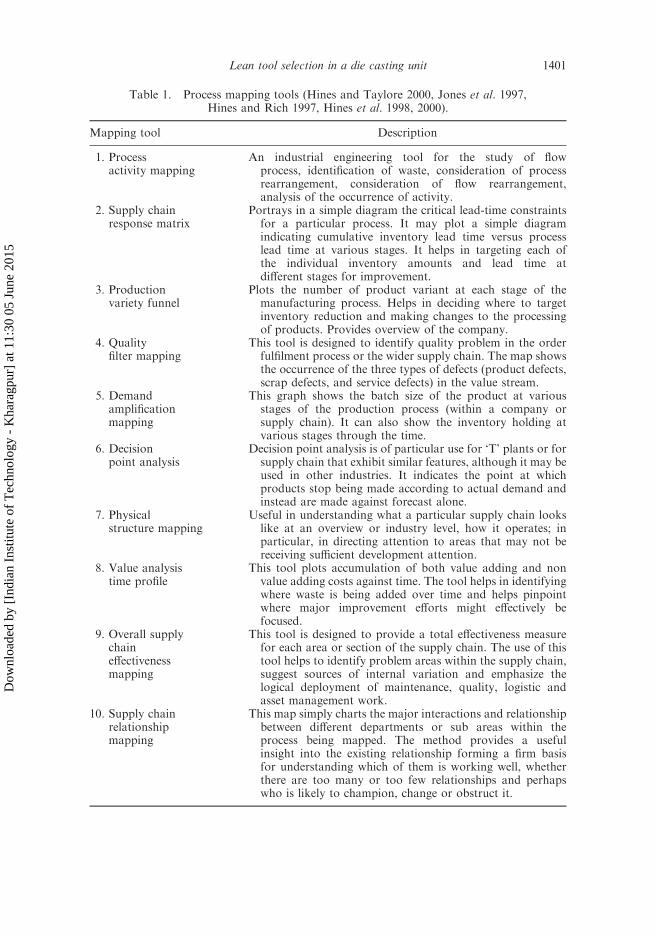
Table 1. Process mapping tools (Hines and Taylore 2000, Jones et al. 1997,Hines and Rich 1997, Hines et al. 1998, 2000).
Mapping tool Description
1. Processactivity mapping
An industrial engineering tool for the study of flowprocess, identification of waste, consideration of processrearrangement, consideration of flow rearrangement,analysis of the occurrence of activity.
2. Supply chainresponse matrix
Portrays in a simple diagram the critical lead-time constraintsfor a particular process. It may plot a simple diagramindicating cumulative inventory lead time versus processlead time at various stages. It helps in targeting each ofthe individual inventory amounts and lead time atdifferent stages for improvement.
3. Productionvariety funnel
Plots the number of product variant at each stage of themanufacturing process. Helps in deciding where to targetinventory reduction and making changes to the processingof products. Provides overview of the company.
4. Qualityfilter mapping
This tool is designed to identify quality problem in the orderfulfilment process or the wider supply chain. The map showsthe occurrence of the three types of defects (product defects,scrap defects, and service defects) in the value stream.
5. Demandamplificationmapping
This graph shows the batch size of the product at variousstages of the production process (within a company orsupply chain). It can also show the inventory holding atvarious stages through the time.
6. Decisionpoint analysis
Decision point analysis is of particular use for ‘T’ plants or forsupply chain that exhibit similar features, although it may beused in other industries. It indicates the point at whichproducts stop being made according to actual demand andinstead are made against forecast alone.
7. Physicalstructure mapping
Useful in understanding what a particular supply chain lookslike at an overview or industry level, how it operates; inparticular, in directing attention to areas that may not bereceiving sufficient development attention.
8. Value analysistime profile
This tool plots accumulation of both value adding and nonvalue adding costs against time. The tool helps in identifyingwhere waste is being added over time and helps pinpointwhere major improvement efforts might effectively befocused.
9. Overall supplychaineffectivenessmapping
This tool is designed to provide a total effectiveness measurefor each area or section of the supply chain. The use of thistool helps to identify problem areas within the supply chain,suggest sources of internal variation and emphasize thelogical deployment of maintenance, quality, logistic andasset management work.
10. Supply chainrelationshipmapping
This map simply charts the major interactions and relationshipbetween different departments or sub areas within theprocess being mapped. The method provides a usefulinsight into the existing relationship forming a firm basisfor understanding which of them is working well, whetherthere are too many or too few relationships and perhapswho is likely to champion, change or obstruct it.
1401Lean tool selection in a die casting unit
Dow
nloa
ded
by [
Indi
an I
nstit
ute
of T
echn
olog
y -
Kha
ragp
ur]
at 1
1:30
05
June
201
5
the ability of the group to make the quality decisions (Bordogna et al. 1997,Bryson 1996, Herrera et al. 1996). Hence, a multi-person scenario hasbeen modelled to solve the problem related to selection of wastes and valuestream tools.
It is natural to think that all the decision makers have their own beliefs andthinking, therefore to make the GDM process more egalitarian in nature theyshould express their views in their own way (Herrera-Viedma et al. 2002, Herreraet al. 1996). On the basis of series of questions, decision makers (DMs) express theiropinion via different preference elicitation methods. Here, we have included threepreference techniques to incorporate the flexibility in expressing views (by the DMs)in the decision-making process. They are, namely, utility functions, multiplicativepreference relationships, and rank ordering of the alternatives. However, to incor-porate their opinions in a GDM scenario, we need a uniform representation of theirideas. Therefore, in this paper, each of the preference techniques are transformedinto multiplicative preference relationships. The motivation to transform otherpreference techniques into multiplicative preference relationships is to utilize theinherent advantages associated with the indirect evaluation techniques (Saaty1980). In this way, we have democratized the GDM scenario by applying themulti-preference setting.
In order to determine the overall wastes affecting the organization, we need totake care of the opinions of the various DMs (shop managers/section in charge).Since, it is quite likely that these opinions may be contradictory in nature; we need toevolve a technique to cope with such instances. To attempt such problems, multi-attribute utility theory (MAUT) has played a key role (Keeny and Raiffa 1993,Winston 2004, Malakooti and Raman 2000) in deciding the tradeoffs between theconflicting factors. The proposed heuristic utilizes the advantages associated withMAUT and thus helps in developing an effective decision support system toimplement value stream mapping.
In the work carried out by Hines and Rich (1997), a linguistic relationship hasbeen established between the tools and the wastes. However, this incorporates uncer-tainty in the decision-making process. To avoid the vagueness and imprecisioninherent in the relationships, we have utilized fuzzy theory concepts in thedecision-making scenario (Zadeh 1965, and Ross 1997). It helps in transformingthe linguistic data into crisp data.
In this paper, we have proposed a fuzzy logic based multi-criteria, multi-preference, and multi-person decision support heuristic to determine the wastespresent in the organization. It also deals with the selection of detailed valuestream mapping tools for reducing these wastes at the micro level. The incentiveof developing such a model is to evolve a mathematical and logical framework tocarry out the work. In this paper, we have taken up a case study of a die casting unitfor the application of the proposed heuristic. A hierarchical structure of evaluationcriteria involved in selection of tools is developed. In the case study, the authors werepart of a lean implementation team and have rated the various shops/sections using amulti-attribute utility function (MAUF) to determine the overall wastes affecting theorganization and selecting a set of value stream mapping tools to identify and sub-sequently minimize them.
1402 R. K. Singh et al.
Dow
nloa
ded
by [
Indi
an I
nstit
ute
of T
echn
olog
y -
Kha
ragp
ur]
at 1
1:30
05
June
201
5
This article has been divided into seven sections. Section 2 details the stepsinvolved in the implementation of lean manufacturing, stages of value stream map-ping and the difficulties inherent in their application. Problem environment isdetailed in section 3. Background of the solution methodology is provided insection 4. The efficacy of the proposed methodology has been illustrated with anexample in section 5. In section 6, results obtained have been discussed. Finally,section 7 concludes the research work with final remarks.
2. Complexity involved in the lean
Current and future state mapping (value stream mapping) approach (Monden 1993,Ohno 1988, Rother and Shook 1999) examines the flow of material and information,and focuses attention on the whole value stream for a product rather than discreteproduction process. The technique includes performing a review of the manufactur-ing processes with the input from staff and production personnel. It suggests creatinga ‘current state map’ and a ‘future state map’ through a series of specific fact-findingquestions, on the basis of known information. These maps provide a visual repre-sentation of the operations and what it could look like in the future. A work planof activities is constructed in order to reach the future state from the current state.The questions addressed in the transformation of current state into future state arerelated with Takt time (Takt is the German word for a conductor’s baton), finishedgoods supermarket, continuous flow, pull system supermarket, identificationof pacemaker, production mix levelling at pacemaker, Kanban pull system, smallbatch size, pitch-based work increment, and identification of necessary processimprovements.
However, the aforementioned approach is not able to offer the micro levelanalysis of the manufacturing processes. Therefore, a newer technique known asdetailed value stream mapping has been advocated by Hines and Rich (1997).This methodology takes into account the drawbacks associated with the currentand future state mapping. Ten detailed value stream mapping tools have beensuggested by Hines et al. (1998) to conduct the micro level analysis of the wastes.Major steps suggested by Hines et al. (1998) are listed as follows:
1. Develop top level ‘big picture map’ of key processes.2. Understand specific operating environment and waste.3. Select second level mapping tools.4. Undertake detailed mapping.5. Identify areas where third level analysis is required and subsequently
undertake it.6. Analyse objective and subjective data and develop timed implemen-
tation plan.7. Determine the fourth level implementation tools (table 2) to eliminate the
waste.8. Draw future state map and provide training to the implementation team
members.
1403Lean tool selection in a die casting unit
Dow
nloa
ded
by [
Indi
an I
nstit
ute
of T
echn
olog
y -
Kha
ragp
ur]
at 1
1:30
05
June
201
5

In the third step of the implementation procedure, i.e. about selection ofappropriate detailed mapping tools, the middle level executives of various depart-ments are asked to rank the wastes in a predefined scale. The scores given bythe members of different departments are averaged with regard to each waste.Thereafter, a correlation table (table 3) is constructed which gives a linguistic rela-tion between the wastes and the tools. These linguistic relations aid in determiningthe correlated weights. These weights are multiplied by the score of each waste togive a correlation score for each tool. All the scores are added to give total valuescore for each mapping tool. On the basis of final score, three to six tools are selectedfor mapping.
Problems with the conventional approaches are:
1. It provides equal weight to all the decision makers, irrespective of the factthat they hail from different shops/sections. Therefore, they may have abiased view with regard to effect of different wastes on the performance ofthe organization.
2. The decision makers are provided only one way to convey their opinions.Thus, it is quite likely that they may not be able to clearly express their views.It requires a multi-preference setting to resolve the issue.
3. Linguistic type of data is not properly processed. This raises vagueness in theentire decision making method.
4. In the decision analysis field, indirect evaluation methods, i.e. pair-wisecomparison methods (Saaty 1980), helps in modelling the situation morerealistically. However, in the detailed value stream mapping methodology,direct evaluation techniques are utilized.
The next section deals with the study of the organization, where lean toolswere applied.
Table 2. The fourth level implementation toolkit.
1. Five step housekeeping2. Five W1H
(when, why, what,where, who, how)
3. Five why’s4. Andon boards5. Batch size reduction6. Cellular manufacturing7. Continues flow8. Cross functional
work team9. Failure mode and
effect (FMEA)10. Failure tree
analysis11. Flow production12. Danger management13. Internal communications
and relationshipmanagement
14. Jidoka15. Kaiku16. Kaizen events17. Layout change18. Levelled production19. Line balancing20. Morning market21. Point of use
storage (POUS)22. Poka yoke23. Problem solving24. Production control
boards25. Pull/kanban systems26. QS 900027. Quality at source28. Quality circles29. Quality function
deployment (QFD)30. Schedule stability
31. Setup reduction32. Skill matrix (I, L, U)33. Small lot production
(one piece flow)34. Standardized work35. Statistical process control36. Suggestion schemes37. Takt time38. Team preparation39. Theory of constraint
(TOC)40. TOC TP
(thinking process)41. Time and motion study42. Total productive
maintenance (TPM)43. Visual control44. Waste elimination45. Material handling
analysis
1404 R. K. Singh et al.
Dow
nloa
ded
by [
Indi
an I
nstit
ute
of T
echn
olog
y -
Kha
ragp
ur]
at 1
1:30
05
June
201
5
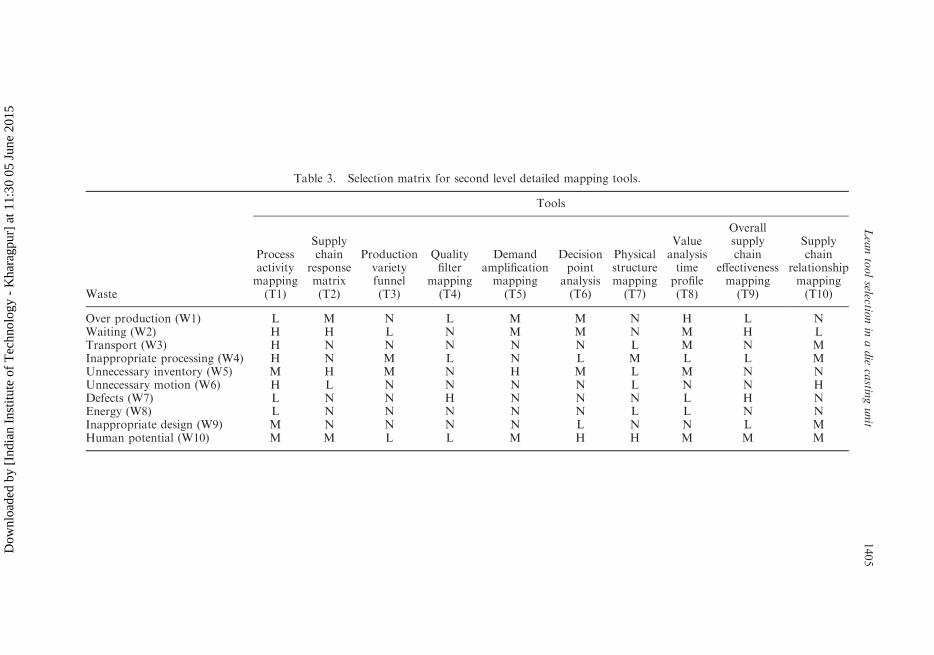
Table 3. Selection matrix for second level detailed mapping tools.
Waste
Tools
Processactivitymapping(T1)
Supplychain
responsematrix(T2)
Productionvarietyfunnel(T3)
Qualityfilter
mapping(T4)
Demandamplificationmapping(T5)
Decisionpoint
analysis(T6)
Physicalstructuremapping(T7)
Valueanalysistimeprofile(T8)
Overallsupplychain
effectivenessmapping(T9)
Supplychain
relationshipmapping(T10)
Over production (W1) L M N L M M N H L NWaiting (W2) H H L N M M N M H LTransport (W3) H N N N N N L M N MInappropriate processing (W4) H N M L N L M L L MUnnecessary inventory (W5) M H M N H M L M N NUnnecessary motion (W6) H L N N N N L N N HDefects (W7) L N N H N N N L H NEnergy (W8) L N N N N N L L N NInappropriate design (W9) M N N N N L N N L MHuman potential (W10) M M L L M H H M M M
1405
Leantoolselectio
nin
adie
castin
gunit
Dow
nloa
ded
by [
Indi
an I
nstit
ute
of T
echn
olog
y -
Kha
ragp
ur]
at 1
1:30
05
June
201
5
3. Case study
The die casting unit under observation was established in 1978 and is engagedin designing and manufacturing various types of precision machined componentsusing pressure and gravity die-casting processes. The main customers of thecompany are ordinance factories, automobile industries, and textile machinemanufacturers. The bulk of the orders received by the company are from theIndian ordinance factories.
To describe and represent an overview of production process a big picturemap of the whole unit is developed. The big picture map represents the currentstate of the die casting unit. It is developed by using the method suggested byRother and Shook (1999). The five basic phases in developing the big picturemap are:
1. Define customer requirements. Collection of information regarding productfamily, customer demand (when, where, how many, and how often), parts tobe manufactured, and stock to be stored.
2. Map information flows. Gathering data on customer forecast, and how thisinformation is processed within the organization.
3. Map physical flows. Data collection for material flow should start at theshipping department and continue to the die casting section. Snap shotdata, such as inventory levels before each stage, process cycle time, numberof workers, machine up time, percentage defect, and changeover times, areobserved.
4. Linking physical and information flows. Information pertaining to the abovethree stages and its link with scheduling information are primarily taken care.It also describes work instructions and actions taken during the emergency/failure.
5. The map is completed by making the above information visual and includinga timeline of total lead time versus the value adding time.
Except for the inventory levels, all other time spans recorded on the big picturemap are based on average time.
The movement of materials through different processes/facilities during manu-facturing is shown in figure 1. The process starts with placing an aluminium-alloyingot in an oil-fired furnace and heating for a sufficient duration. When the metalmelts and achieves a suitable temperature, it is poured into the pouring basin(chamber) of the die casting machine. An operator carries out the task of pouringthe metal with the help of a ladle. When the metal solidifies inside the dies under thepressure of the plunger, the cast product is taken out by removing the ejector pin andthen placed in a bin.
The cast product then goes to the trimming and fettling shop where extra projec-tions are removed. The trimmed product moves to machine shop 1 where thecleaning operation is performed (external and internal holes are cleaned and burrsare removed). In the next step semi-finished products visit machine shop 2 wherethe different holes and grooves are made as the dimensions given in the drawing.If necessary, chamfering and threading operations are performed in machine shop 3.Surface finishing and electroplating are performed subsequently in the next stage.The product is then moved to the inspection shop. Finally, the finished product is
1406 R. K. Singh et al.
Dow
nloa
ded
by [
Indi
an I
nstit
ute
of T
echn
olog
y -
Kha
ragp
ur]
at 1
1:30
05
June
201
5
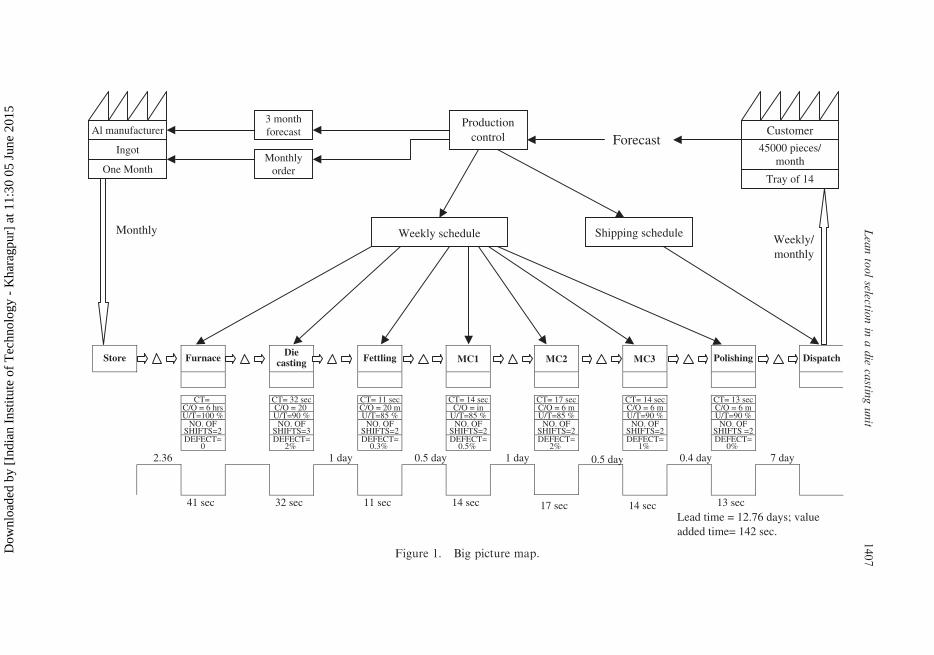
Store Furnace Diecasting Fettling MC1 MC2 MC3 Polishing Dispatch
CT= 13 secC/O = 6 mU/T=90 %
NO. OFSHIFTS =2 DEFECT=
0%
CT= 14 secC/O = 6 mU/T=90 %
NO. OFSHIFTS =2DEFECT=
1%
CT= 17 secC/O = 6 mU/T=85 %
NO. OFSHIFTS =2DEFECT=
2%
CT= 14 secC/O = in
U/T=85 %NO. OF
SHIFTS =2DEFECT=
0.5%
CT= 11 secC/O = 20 mU/T=85 %
NO. OFSHIFTS =2DEFECT=
0.3%
CT= 32 secC/O = 20 U/T=90 %
NO. OFSHIFTS =3DEFECT=
2%
CT= C/O = 6 hrsU/T=100 %
NO. OFSHIFTS =2DEFECT=
0
2.36 1 day 0.5 day 1 day 0.5 day 0.4 day 7 day
41 sec 32 sec 11 sec 14 sec 17 sec 14 sec 13 sec Lead time = 12.76 days; valueadded time= 142 sec.
Al manufacturer
Ingot
One Month
3 monthforecast
Monthlyorder
Productioncontrol Customer
45000 pieces/month
Tray of 14
Forecast
Weekly schedule Shipping schedule Weekly/monthly
Monthly
Figure 1. Big picture map.
1407
Leantoolselectio
nin
adie
castin
gunit
Dow
nloa
ded
by [
Indi
an I
nstit
ute
of T
echn
olog
y -
Kha
ragp
ur]
at 1
1:30
05
June
201
5
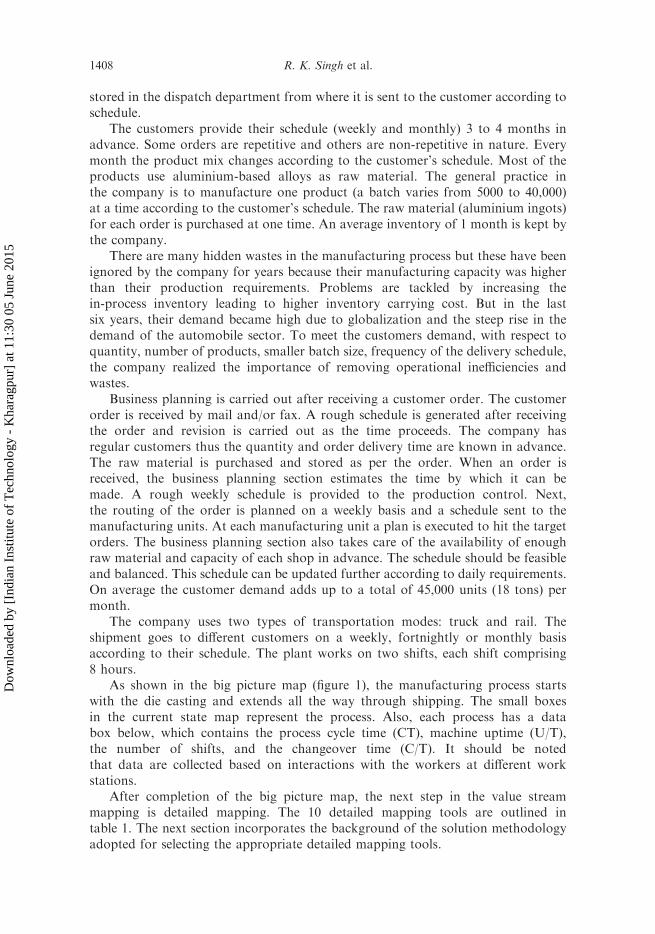
stored in the dispatch department from where it is sent to the customer according toschedule.
The customers provide their schedule (weekly and monthly) 3 to 4 months inadvance. Some orders are repetitive and others are non-repetitive in nature. Everymonth the product mix changes according to the customer’s schedule. Most of theproducts use aluminium-based alloys as raw material. The general practice inthe company is to manufacture one product (a batch varies from 5000 to 40,000)at a time according to the customer’s schedule. The raw material (aluminium ingots)for each order is purchased at one time. An average inventory of 1 month is kept bythe company.
There are many hidden wastes in the manufacturing process but these have beenignored by the company for years because their manufacturing capacity was higherthan their production requirements. Problems are tackled by increasing thein-process inventory leading to higher inventory carrying cost. But in the lastsix years, their demand became high due to globalization and the steep rise in thedemand of the automobile sector. To meet the customers demand, with respect toquantity, number of products, smaller batch size, frequency of the delivery schedule,the company realized the importance of removing operational inefficiencies andwastes.
Business planning is carried out after receiving a customer order. The customerorder is received by mail and/or fax. A rough schedule is generated after receivingthe order and revision is carried out as the time proceeds. The company hasregular customers thus the quantity and order delivery time are known in advance.The raw material is purchased and stored as per the order. When an order isreceived, the business planning section estimates the time by which it can bemade. A rough weekly schedule is provided to the production control. Next,the routing of the order is planned on a weekly basis and a schedule sent to themanufacturing units. At each manufacturing unit a plan is executed to hit the targetorders. The business planning section also takes care of the availability of enoughraw material and capacity of each shop in advance. The schedule should be feasibleand balanced. This schedule can be updated further according to daily requirements.On average the customer demand adds up to a total of 45,000 units (18 tons) permonth.
The company uses two types of transportation modes: truck and rail. Theshipment goes to different customers on a weekly, fortnightly or monthly basisaccording to their schedule. The plant works on two shifts, each shift comprising8 hours.
As shown in the big picture map (figure 1), the manufacturing process startswith the die casting and extends all the way through shipping. The small boxesin the current state map represent the process. Also, each process has a databox below, which contains the process cycle time (CT), machine uptime (U/T),the number of shifts, and the changeover time (C/T). It should be notedthat data are collected based on interactions with the workers at different workstations.
After completion of the big picture map, the next step in the value streammapping is detailed mapping. The 10 detailed mapping tools are outlined intable 1. The next section incorporates the background of the solution methodologyadopted for selecting the appropriate detailed mapping tools.
1408 R. K. Singh et al.
Dow
nloa
ded
by [
Indi
an I
nstit
ute
of T
echn
olog
y -
Kha
ragp
ur]
at 1
1:30
05
June
201
5
4. Background of the proposed methodology
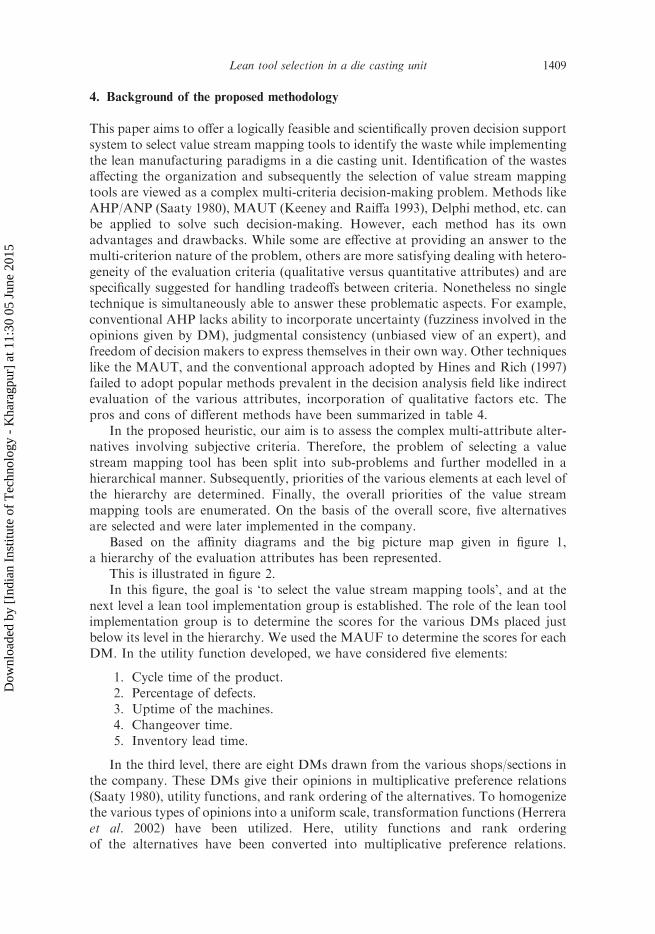
This paper aims to offer a logically feasible and scientifically proven decision supportsystem to select value stream mapping tools to identify the waste while implementingthe lean manufacturing paradigms in a die casting unit. Identification of the wastesaffecting the organization and subsequently the selection of value stream mappingtools are viewed as a complex multi-criteria decision-making problem. Methods likeAHP/ANP (Saaty 1980), MAUT (Keeney and Raiffa 1993), Delphi method, etc. canbe applied to solve such decision-making. However, each method has its ownadvantages and drawbacks. While some are effective at providing an answer to themulti-criterion nature of the problem, others are more satisfying dealing with hetero-geneity of the evaluation criteria (qualitative versus quantitative attributes) and arespecifically suggested for handling tradeoffs between criteria. Nonetheless no singletechnique is simultaneously able to answer these problematic aspects. For example,conventional AHP lacks ability to incorporate uncertainty (fuzziness involved in theopinions given by DM), judgmental consistency (unbiased view of an expert), andfreedom of decision makers to express themselves in their own way. Other techniqueslike the MAUT, and the conventional approach adopted by Hines and Rich (1997)failed to adopt popular methods prevalent in the decision analysis field like indirectevaluation of the various attributes, incorporation of qualitative factors etc. Thepros and cons of different methods have been summarized in table 4.
In the proposed heuristic, our aim is to assess the complex multi-attribute alter-natives involving subjective criteria. Therefore, the problem of selecting a valuestream mapping tool has been split into sub-problems and further modelled in ahierarchical manner. Subsequently, priorities of the various elements at each level ofthe hierarchy are determined. Finally, the overall priorities of the value streammapping tools are enumerated. On the basis of the overall score, five alternativesare selected and were later implemented in the company.
Based on the affinity diagrams and the big picture map given in figure 1,a hierarchy of the evaluation attributes has been represented.
This is illustrated in figure 2.In this figure, the goal is ‘to select the value stream mapping tools’, and at the
next level a lean tool implementation group is established. The role of the lean toolimplementation group is to determine the scores for the various DMs placed justbelow its level in the hierarchy. We used the MAUF to determine the scores for eachDM. In the utility function developed, we have considered five elements:
1. Cycle time of the product.2. Percentage of defects.3. Uptime of the machines.4. Changeover time.5. Inventory lead time.
In the third level, there are eight DMs drawn from the various shops/sections inthe company. These DMs give their opinions in multiplicative preference relations(Saaty 1980), utility functions, and rank ordering of the alternatives. To homogenizethe various types of opinions into a uniform scale, transformation functions (Herreraet al. 2002) have been utilized. Here, utility functions and rank orderingof the alternatives have been converted into multiplicative preference relations.
1409Lean tool selection in a die casting unit
Dow
nloa
ded
by [
Indi
an I
nstit
ute
of T
echn
olog
y -
Kha
ragp
ur]
at 1
1:30
05
June
201
5
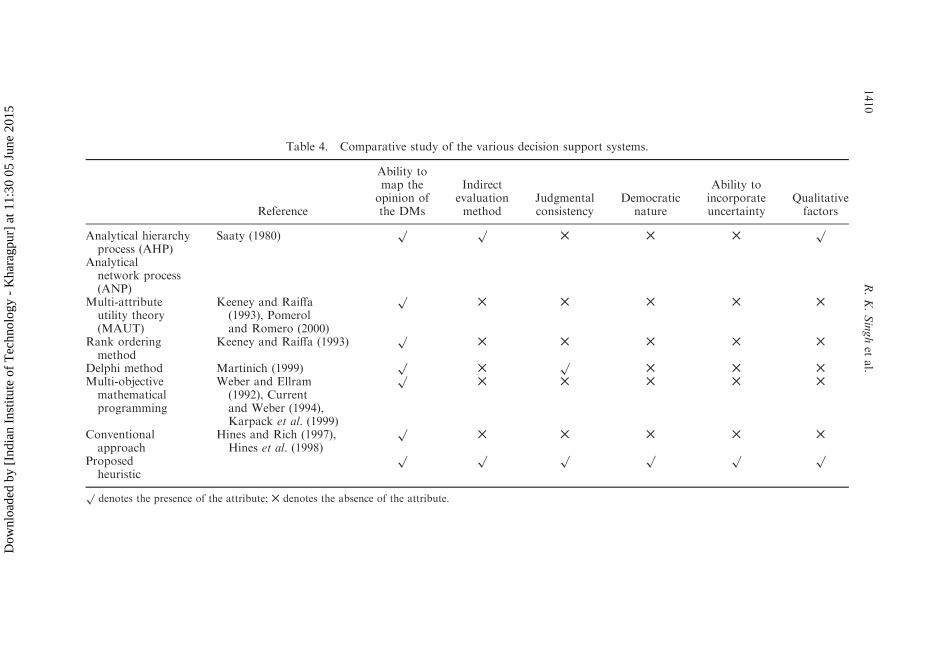
Table 4. Comparative study of the various decision support systems.
Reference
Ability tomap theopinion ofthe DMs
Indirectevaluationmethod
Judgmentalconsistency
Democraticnature
Ability toincorporateuncertainty
Qualitativefactors
Analytical hierarchyprocess (AHP)
Saaty (1980)p p
5 5 5p
Analyticalnetwork process(ANP)
Multi-attributeutility theory(MAUT)
Keeney and Raiffa(1993), Pomeroland Romero (2000)
p5 5 5 5 5
Rank orderingmethod
Keeney and Raiffa (1993)p
5 5 5 5 5
Delphi method Martinich (1999)p
5p
5 5 5
Multi-objectivemathematicalprogramming
Weber and Ellram(1992), Currentand Weber (1994),Karpack et al. (1999)
p5 5 5 5 5
Conventionalapproach
Hines and Rich (1997),Hines et al. (1998)
p5 5 5 5 5
Proposedheuristic
p p p p p p
pdenotes the presence of the attribute; 5 denotes the absence of the attribute.
1410
R.K.Singhet
al.
Dow
nloa
ded
by [
Indi
an I
nstit
ute
of T
echn
olog
y -
Kha
ragp
ur]
at 1
1:30
05
June
201
5
All the wastes affecting the organization are placed in the next level. The set ofwastes are the same for each DM. Each DM gives an opinion regarding thewastes affecting their shops/sections. All the value mapping tools are listed, whichform the lowest level of the hierarchy. Here, a linguistic relationship has been estab-lished between the tools and the wastes. We have utilized the fuzzy theory to map thelinguistic relationships into fuzzy numbers. These fuzzy relationships are then defuz-zified into crisp data. These crisp data are then finally used to determine the overallscore of the alternatives.
In the proposed methodology, we have used MAUF to determine the weightsrelated to each DM. Utility function U(x)¼U(x1, x2, . . . , xn) for any combination ofoutcomes (xi, x2, . . . , xn) for n alternatives (X1, X2, . . . ,Xn) can be expressed as either(1) an additive model or (2) a multiplicative function of the individual attributeutility functions U1(x1),U2(x2), . . . ,Un(xn) (Keeney and Raiffa 1976). Here, wehave used the additive model, where each of the attributes is independent innature. The utility U(x) for n attributes (X1,X2, . . . ,Xn) can be expressed as:
UðxÞ ¼Xni¼1
ki �UiðxiÞ ð1Þ
DM1 DM2 DM3 DM4 DM5 DM6 DM7 DM8
W1W2W3W4W5W6W7W8W9W10
W1W2W3W4W5W6W7W8W9W10
W1W2W3W4W5W6W7W8W9W10
W1W2W3W4W5W6W7W8W9W10
W1W2W3W4W5W6W7W8W9W10
W1W2W3W4W5W6W7W8W9W10
W1W2W3W4W5W6W7W8W9W10
W1W2W3W4W5W6W7W8W9W10
T1 T2 T3 T4 T5 T6 T7 T8 T9 T10
To select detailed value stream mapping tools
Lean implementation team
Figure 2. Hierarchy of the value stream mapping tool selection decision problem. DM,decision maker; W, waste (as sequenced in table 3); T, detailed value stream mapping tools(as sequenced in table 1).
1411Lean tool selection in a die casting unit
Dow
nloa
ded
by [
Indi
an I
nstit
ute
of T
echn
olog
y -
Kha
ragp
ur]
at 1
1:30
05
June
201
5

where ki¼weight (scaling factors) for the ith attribute and Ui(xi)¼ utility ofthe outcome xi for the ith attribute. The attributes used in the development of themodel are:
(i) Cycle time defect percentage.(ii) Uptime.(iii) Inventory lead time.(iv) Change over time.
These attributes are selected keeping in view the impact they have on the overallwastes in the organization. Table 5 presents the impact of these attributes on thewastes of the organization.
The individual utility functions for each of the attributes have been enumeratedas follows:
U1iðx1Þ : Utility value of the cycle time for shop=section i
¼Cycle time of individual section=shop
Total cycle timeð2Þ
U2iðx2Þ : Utility value of the percentage defects for shop=section i
¼ Percentage of the defect ð3Þ
U3iðx3Þ : Utility value of the uptime for shop=section i
¼ Percentage of the machine availability ð4Þ
U4iðx4Þ : Utility value of the inventory lead time for shop=section i
¼Inventory lead time of individual section=shop
Total inventory lead timeð5Þ
U5iðx5Þ : Utility value of the change over time for shop=section i
¼Change over time of individual section=shop for a given batch size
Total cycle time� batch sizeð6Þ
To determine the scaling factors (weights), mentioned in the utility functions,an AHP-based methodology has been employed. Keeping in view the impact ofthese aforementioned attributes on the overall profit of the organization, amultiplicative preference relationship matrix is developed. This kind of approacheliminated the role of experience in the determination of weights (Pomeroland Romero 2000), thus helped in reducing the imprecision and vagueness in thedecision process.
A nine-point numerical scale, presented in table 6 has been recommended toquantify the magnitude of the strength of the pair wise comparison (Saaty 1980).
In the proposed model, the shop floor manager/section officers use the multi-preference methodology to present their views regarding the various wastes affectingthe organization. The preferences used by the DMs are multiplicative preferencerelationship, rank ordering of the alternatives, and utility functions. Each oneexpresses his preferences in a unique way. Thus, a need arises for different preference
1412 R. K. Singh et al.
Dow
nloa
ded
by [
Indi
an I
nstit
ute
of T
echn
olog
y -
Kha
ragp
ur]
at 1
1:30
05
June
201
5

structures to be standardized in a single preference structure (Devedzie andPap 1999). We have considered the multiplicative preference relations as ourbase for the uniform representation of the information. The information is smoothedout utilizing the transformation functions developed. Details related to the transfor-mation function have been given in the Appendix.
Table 5. Attributes used in utility function for providing weight to departmentsand their relation with different waste.
Change over time Lean advocates small batch and production of all the productsin each batch. This requires a shorter changeover time. Highchangeover time results in larger batch size leading to highinventory level.
Percentage defect Defect leads to many losses like loss of material, labour time,machine time, floor space, and lost business opportunities.By checking defect rate manufacturing cost can be restricted.
Up time As machine down time increases the capacity of the plantdecreases. Breakdown of a machine at early process stagemay result in halting of complete line. To handle thesesituations companies generally keep inventory buffer oradopt overproduction policy.
Inventory High inventory leads to higher inventory carrying cost andhigher floor space requirement. According to leanphilosophy inventory is mother of all evils, because ithides other waste/problems existing in the organization.Lean advocates one piece flow or flow of materialaccording to customer pull. By reducing inventory levelother types of waste present in the system can be exposedfor removal.
Cycle time As the cycle time decreases it results in reduction of processlead time leading to improved productivity Hear cycle timeis actually value adding time.
Table 6. Saaty’s 1–9 scale for pair wise comparison.
Intensity of importance Definition Explanation
1 Equal importance Two activities contributeequally to the objective.
3 Moderate importance Experience and judgment slightlyfavour one over the other.
5 Strong importance Experience and judgment stronglyfavour one over the other.
7 Very strong importance An activity is strongly favouredand its dominance is demonstratedin practice.
9 Absolute importance The importance of one over anotheraffirmed on the highest possible order.
2, 4, 6, 8 Intermediate values Used to represent compromise betweenthe priorities listed above.
Reciprocal ofabove non-zeronumbers
If activity i has one of the above non-zero numbers assigned to itwhen compared to activity j, then j has the reciprocal valuewhen compared with i.
1413Lean tool selection in a die casting unit
Dow
nloa
ded
by [
Indi
an I
nstit
ute
of T
echn
olog
y -
Kha
ragp
ur]
at 1
1:30
05
June
201
5
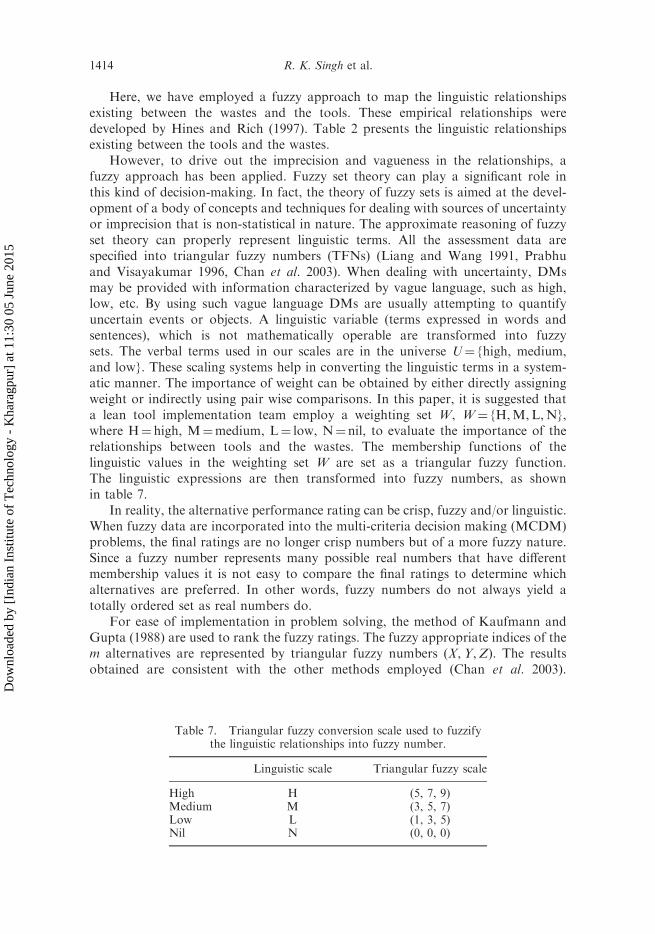
Here, we have employed a fuzzy approach to map the linguistic relationshipsexisting between the wastes and the tools. These empirical relationships weredeveloped by Hines and Rich (1997). Table 2 presents the linguistic relationshipsexisting between the tools and the wastes.
However, to drive out the imprecision and vagueness in the relationships, afuzzy approach has been applied. Fuzzy set theory can play a significant role inthis kind of decision-making. In fact, the theory of fuzzy sets is aimed at the devel-opment of a body of concepts and techniques for dealing with sources of uncertaintyor imprecision that is non-statistical in nature. The approximate reasoning of fuzzyset theory can properly represent linguistic terms. All the assessment data arespecified into triangular fuzzy numbers (TFNs) (Liang and Wang 1991, Prabhuand Visayakumar 1996, Chan et al. 2003). When dealing with uncertainty, DMsmay be provided with information characterized by vague language, such as high,low, etc. By using such vague language DMs are usually attempting to quantifyuncertain events or objects. A linguistic variable (terms expressed in words andsentences), which is not mathematically operable are transformed into fuzzysets. The verbal terms used in our scales are in the universe U¼ {high, medium,and low}. These scaling systems help in converting the linguistic terms in a system-atic manner. The importance of weight can be obtained by either directly assigningweight or indirectly using pair wise comparisons. In this paper, it is suggested thata lean tool implementation team employ a weighting set W, W¼ {H,M,L,N},where H¼ high, M¼medium, L¼ low, N¼ nil, to evaluate the importance of therelationships between tools and the wastes. The membership functions of thelinguistic values in the weighting set W are set as a triangular fuzzy function.The linguistic expressions are then transformed into fuzzy numbers, as shownin table 7.
In reality, the alternative performance rating can be crisp, fuzzy and/or linguistic.When fuzzy data are incorporated into the multi-criteria decision making (MCDM)problems, the final ratings are no longer crisp numbers but of a more fuzzy nature.Since a fuzzy number represents many possible real numbers that have differentmembership values it is not easy to compare the final ratings to determine whichalternatives are preferred. In other words, fuzzy numbers do not always yield atotally ordered set as real numbers do.
For ease of implementation in problem solving, the method of Kaufmann andGupta (1988) are used to rank the fuzzy ratings. The fuzzy appropriate indices of them alternatives are represented by triangular fuzzy numbers (X,Y,Z). The resultsobtained are consistent with the other methods employed (Chan et al. 2003).
Table 7. Triangular fuzzy conversion scale used to fuzzifythe linguistic relationships into fuzzy number.
Linguistic scale Triangular fuzzy scale
High H (5, 7, 9)Medium M (3, 5, 7)Low L (1, 3, 5)Nil N (0, 0, 0)
1414 R. K. Singh et al.
Dow
nloa
ded
by [
Indi
an I
nstit
ute
of T
echn
olog
y -
Kha
ragp
ur]
at 1
1:30
05
June
201
5
Kaufmann and Gupta (1988) recommended three criteria in determining the bestpreference alternative as follows:
(a) Compare the ranking values:
Ranking value ¼Xþ 2Yþ Z
4ð7Þ
(b) Evaluate the most possible value Y.(c) Compare the range X�Z.
However, we have utilized criteria (a) only in determining the crisp numberrepresenting the relationships between tools and wastes.
After enumerating the defuzzified values pertaining to tool and wastesrelationships, overall weights for the alternative tools are calculated. Here, wehave computed the overall weights by considering the utility functions for eachdepartment, Eigen vectors for each waste, and defuzzified values related to thetool–waste relationship. Five value mapping tools are selected on the basis of theoverall score estimates.
In the next section, we detail the solution methodology in the form ofan algorithm.
5. Solution methodology
The solution methodology of the proposed model has been described in thealgorithmic form to explain the steps involved in the selection of value streammapping tools.
5.1 Algorithm
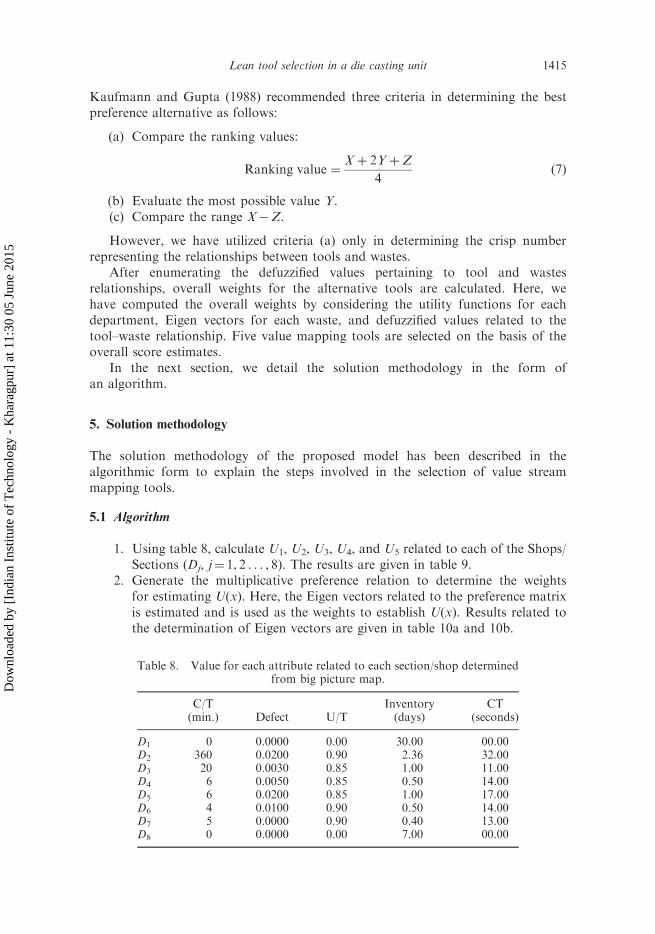
1. Using table 8, calculate U1, U2, U3, U4, and U5 related to each of the Shops/Sections (Dj, j¼ 1, 2 . . . , 8). The results are given in table 9.
2. Generate the multiplicative preference relation to determine the weightsfor estimating U(x). Here, the Eigen vectors related to the preference matrixis estimated and is used as the weights to establish U(x). Results related tothe determination of Eigen vectors are given in table 10a and 10b.
Table 8. Value for each attribute related to each section/shop determinedfrom big picture map.
C/T(min.) Defect U/T
Inventory(days)
CT(seconds)
D1 0 0.0000 0.00 30.00 00.00D2 360 0.0200 0.90 2.36 32.00D3 20 0.0030 0.85 1.00 11.00D4 6 0.0050 0.85 0.50 14.00D5 6 0.0200 0.85 1.00 17.00D6 4 0.0100 0.90 0.50 14.00D7 5 0.0000 0.90 0.40 13.00D8 0 0.0000 0.00 7.00 00.00
1415Lean tool selection in a die casting unit
Dow
nloa
ded
by [
Indi
an I
nstit
ute
of T
echn
olog
y -
Kha
ragp
ur]
at 1
1:30
05
June
201
5

3. Enumerate the U(x) for each section/shops by using equation (1). Tables 11aand 11b present the related results obtained.
4. Generate the different preference structures of the respective DMs, i.e.(preference rank ordering of the alternatives, multiplicative preferencerelation and utility functions). They are represented as follows: preferenceordering of alternatives as O j, multiplicative preference relation as A j, whereA j
����, A j¼ (a j
sm), where ajsm indicates a ratio of the preference intensity
of alternative �s to �m. It is rated on a 1 to 9 scale. Utility functions arerepresented as U j where DMj ( jth decision maker) represents his preferenceson � as set of n utility values U j
¼ {Ujs ; s¼ 1, . . . , n), Uj
s 2 [0, 1]. Tables 12to 15 present the preferences of the various DMs.
5. Available information is transformed into multiplicative preferencerelationship by different transformation functions. The transformationfunctions are given in the Appendix.
Table 9. Utility values calculated for each attribute pertainingto each section/shop.
U1 U2 U3 U4 U5
D1 0.000000 0.000000 0.000000 0.701590 0.000000D2 0.042772 0.020000 0.900000 0.055192 0.363636D3 0.002376 0.003000 0.850000 0.023386 0.125000D4 0.000713 0.005000 0.850000 0.011693 0.159091D5 0.000713 0.020000 0.850000 0.023386 0.193182D6 0.000475 0.010000 0.900000 0.011693 0.159091D7 0.000594 0.000000 0.900000 0.009355 0.147727D8 0.000000 0.000000 0.000000 0.163704 0.000000
Table 10a. Multiplicative preference relationship to determine the weights used toenumerate the utility function.
C/T Defect U/T Inventory CT
C/T 1.0000 0.1429 0.2000 0.1429 0.2000Defect 7.0000 1.0000 0.3333 1.0000 3.0000U/T 5.0000 3.0000 1.0000 0.3333 1.0000Inventory 7.0000 1.0000 3.0000 1.0000 3.0000CT 5.0000 0.3333 1.0000 0.3333 1.0000Sum 25.0000 5.4762 5.5333 2.8095 8.2000
C/T, Changeover time; U/T, Machine up time; CT, Process cycle time.
Table 10b. Eigen vectors determined for table 10a.
C/T Defect U/T Inventory CT Eigen vector
C/T 0.04000 0.02609 0.03614 0.05085 0.02439 0.03549Defect 0.28000 0.18261 0.06024 0.35593 0.36585 0.24893U/T 0.20000 0.54783 0.18072 0.11864 0.12195 0.23383Inventory 0.28000 0.18261 0.54217 0.35593 0.36585 0.34531CT 0.20000 0.06087 0.18072 0.11864 0.12195 0.13644
1416 R. K. Singh et al.
Dow
nloa
ded
by [
Indi
an I
nstit
ute
of T
echn
olog
y -
Kha
ragp
ur]
at 1
1:30
05
June
201
5
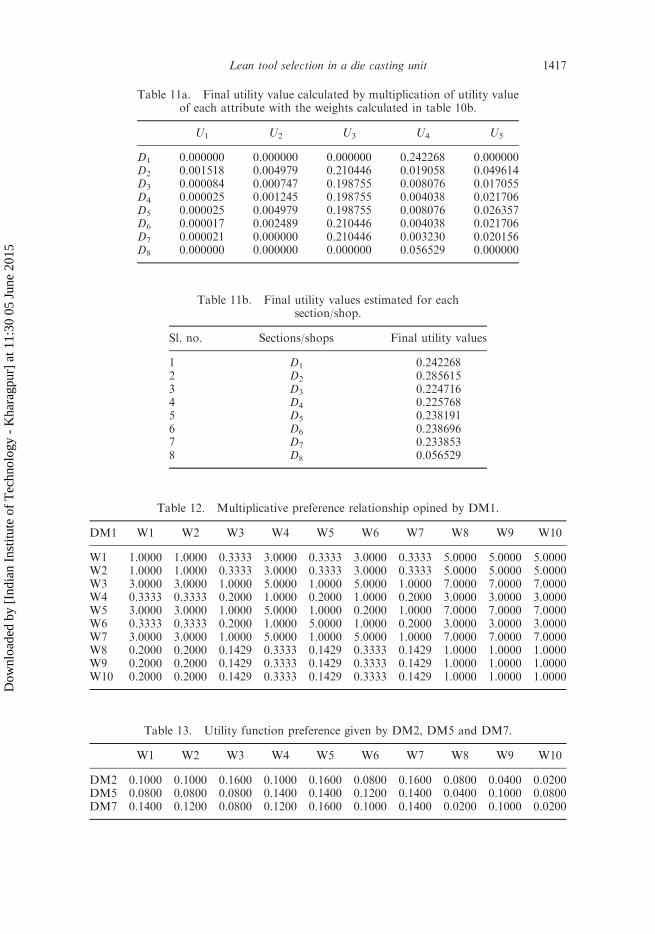
Table 11a. Final utility value calculated by multiplication of utility valueof each attribute with the weights calculated in table 10b.
U1 U2 U3 U4 U5
D1 0.000000 0.000000 0.000000 0.242268 0.000000D2 0.001518 0.004979 0.210446 0.019058 0.049614D3 0.000084 0.000747 0.198755 0.008076 0.017055D4 0.000025 0.001245 0.198755 0.004038 0.021706D5 0.000025 0.004979 0.198755 0.008076 0.026357D6 0.000017 0.002489 0.210446 0.004038 0.021706D7 0.000021 0.000000 0.210446 0.003230 0.020156D8 0.000000 0.000000 0.000000 0.056529 0.000000
Table 11b. Final utility values estimated for eachsection/shop.
Sl. no. Sections/shops Final utility values
1 D1 0.2422682 D2 0.2856153 D3 0.2247164 D4 0.2257685 D5 0.2381916 D6 0.2386967 D7 0.2338538 D8 0.056529
Table 12. Multiplicative preference relationship opined by DM1.
DM1 W1 W2 W3 W4 W5 W6 W7 W8 W9 W10
W1 1.0000 1.0000 0.3333 3.0000 0.3333 3.0000 0.3333 5.0000 5.0000 5.0000W2 1.0000 1.0000 0.3333 3.0000 0.3333 3.0000 0.3333 5.0000 5.0000 5.0000W3 3.0000 3.0000 1.0000 5.0000 1.0000 5.0000 1.0000 7.0000 7.0000 7.0000W4 0.3333 0.3333 0.2000 1.0000 0.2000 1.0000 0.2000 3.0000 3.0000 3.0000W5 3.0000 3.0000 1.0000 5.0000 1.0000 0.2000 1.0000 7.0000 7.0000 7.0000W6 0.3333 0.3333 0.2000 1.0000 5.0000 1.0000 0.2000 3.0000 3.0000 3.0000W7 3.0000 3.0000 1.0000 5.0000 1.0000 5.0000 1.0000 7.0000 7.0000 7.0000W8 0.2000 0.2000 0.1429 0.3333 0.1429 0.3333 0.1429 1.0000 1.0000 1.0000W9 0.2000 0.2000 0.1429 0.3333 0.1429 0.3333 0.1429 1.0000 1.0000 1.0000W10 0.2000 0.2000 0.1429 0.3333 0.1429 0.3333 0.1429 1.0000 1.0000 1.0000
Table 13. Utility function preference given by DM2, DM5 and DM7.
W1 W2 W3 W4 W5 W6 W7 W8 W9 W10
DM2 0.1000 0.1000 0.1600 0.1000 0.1600 0.0800 0.1600 0.0800 0.0400 0.0200DM5 0.0800 0.0800 0.0800 0.1400 0.1400 0.1200 0.1400 0.0400 0.1000 0.0800DM7 0.1400 0.1200 0.0800 0.1200 0.1600 0.1000 0.1400 0.0200 0.1000 0.0200
1417Lean tool selection in a die casting unit
Dow
nloa
ded
by [
Indi
an I
nstit
ute
of T
echn
olog
y -
Kha
ragp
ur]
at 1
1:30
05
June
201
5

6. Calculate Eigen vectors of the alternative �ms to quantify the dominanceof the alternative �s over others relative to each DM’s opinion. Table 16exhibits the Eigen vectors pertaining to the wastes for each DM.
7. Using the utility functions developed for each department and the Eigenvectors pertaining to each waste for each DM, overall wastes affecting theorganization are determined in table 17a. Different wastes along with theirscores are listed in table 17b.
8. Fuzzify the linguistic relationships given in table 3 by utilizing the resultsshown in table 7. Related results are given in table 18.
9. Utilizing equation 7, defuzzify the results calculated in table 18. Thedefuzzified values are given in table 19.
Table 14. Rank ordering preference expressed by DM3, DM4, and DM6.
W1 W2 W3 W4 W5 W6 W7 W8 W9 W10
DM3 8 6 6 4 9 4 9 1 3 2DM4 7 8 4 3 10 4 8 1 4 2DM6 8 7 4 6 10 4 8 1 3 1
Table 15. Multiplicative preference relationship given by DM8.
DM8 W1 W2 W3 W4 W5 W6 W7 W8 W9 W10
W1 1.0000 1.5000 0.3333 0.2857 0.1333 0.6667 0.1429 1.5000 0.2857 1.0000W2 0.6667 1.0000 0.2857 0.3333 0.1111 0.3333 0.1333 1.0000 0.2000 0.6667W3 3.0000 3.5000 1.0000 0.6667 0.1818 1.5000 0.2000 3.5000 0.6667 0.3333W4 3.5000 3.0000 1.5000 1.0000 0.2000 3.0000 0.2857 5.0000 1.0000 3.5000W5 7.5000 9.0000 5.5000 5.0000 1.0000 7.0000 1.5000 9.0000 5.0000 7.5000W6 1.5000 3.0000 0.6667 0.3333 0.1429 1.0000 0.1818 3.0000 0.3333 1.5000W7 7.0000 7.5000 5.0000 3.5000 0.6667 5.5000 1.0000 7.5000 3.5000 7.0000W8 0.6667 1.0000 0.2857 0.2000 0.1111 0.3333 0.1333 1.0000 0.2000 0.6667W9 3.5000 5.0000 1.5000 1.0000 0.2000 3.0000 3.5000 5.0000 1.0000 0.2857W10 1.0000 1.5000 3.0000 0.2857 0.1333 0.6667 0.1429 1.5000 3.5000 1.0000
Table 16. Eigen vectors of various departments for each waste.
DM1 DM2 DM3 DM4 DM5 DM6 DM7 DM8
W1 0.1003 0.1000 0.1602 0.1253 0.0800 0.1554 0.1400 0.0311W2 0.1003 0.1000 0.0983 0.1600 0.0800 0.1217 0.1200 0.0231W3 0.2035 0.1600 0.0983 0.0603 0.0800 0.0585 0.0800 0.0610W4 0.0484 0.1000 0.0603 0.0472 0.1400 0.0953 0.1200 0.0945W5 0.1785 0.1600 0.2045 0.2607 0.1400 0.2531 0.1600 0.2925W6 0.1000 0.0800 0.0603 0.0603 0.1200 0.0585 0.1000 0.0478W7 0.2035 0.1600 0.2045 0.1600 0.1400 0.1554 0.1400 0.2315W8 0.0218 0.0800 0.0290 0.0290 0.0400 0.0281 0.0200 0.0220W9 0.0218 0.0400 0.0473 0.0603 0.1000 0.0458 0.1000 0.1308W10 0.0218 0.0200 0.0370 0.0370 0.0800 0.0281 0.0200 0.0656
1418 R. K. Singh et al.
Dow
nloa
ded
by [
Indi
an I
nstit
ute
of T
echn
olog
y -
Kha
ragp
ur]
at 1
1:30
05
June
201
5
10. Append all the final priority weights with respect to each alternative valuemapping tools and inform the DMs about the selected alternatives. Resultsare elicited in table 20.
Now, we discuss the results obtained from the proposed methodology.
6. Results and discussion
For implementing the value stream mapping approach in an organization varioussteps are to be followed. The first is to develop better understanding of thecustomer requirements, mission, and strategic direction set by the company. Thelean philosophy and its benefits must be clearly presented to the top managementto gain their confidence. Two teams are then made for the purpose of leanimplementation.
The first team consists of some top level and middle level management people.The purpose of forming this team is to identify resources required for the project andto make them available, to clear obstacles during data collection, analysis,and implementation. In the next stage, a big picture map is developed for getting
Table 17a. Overall scores of various departments after multiplying them with theweights of various departments.
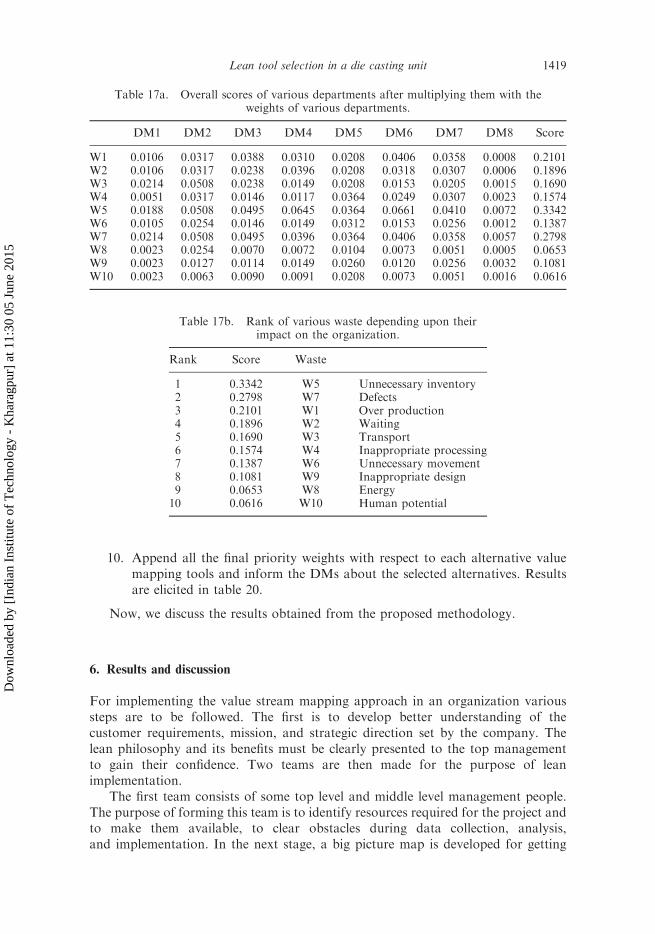
DM1 DM2 DM3 DM4 DM5 DM6 DM7 DM8 Score
W1 0.0106 0.0317 0.0388 0.0310 0.0208 0.0406 0.0358 0.0008 0.2101W2 0.0106 0.0317 0.0238 0.0396 0.0208 0.0318 0.0307 0.0006 0.1896W3 0.0214 0.0508 0.0238 0.0149 0.0208 0.0153 0.0205 0.0015 0.1690W4 0.0051 0.0317 0.0146 0.0117 0.0364 0.0249 0.0307 0.0023 0.1574W5 0.0188 0.0508 0.0495 0.0645 0.0364 0.0661 0.0410 0.0072 0.3342W6 0.0105 0.0254 0.0146 0.0149 0.0312 0.0153 0.0256 0.0012 0.1387W7 0.0214 0.0508 0.0495 0.0396 0.0364 0.0406 0.0358 0.0057 0.2798W8 0.0023 0.0254 0.0070 0.0072 0.0104 0.0073 0.0051 0.0005 0.0653W9 0.0023 0.0127 0.0114 0.0149 0.0260 0.0120 0.0256 0.0032 0.1081W10 0.0023 0.0063 0.0090 0.0091 0.0208 0.0073 0.0051 0.0016 0.0616
Table 17b. Rank of various waste depending upon theirimpact on the organization.
Rank Score Waste
1 0.3342 W5 Unnecessary inventory2 0.2798 W7 Defects3 0.2101 W1 Over production4 0.1896 W2 Waiting5 0.1690 W3 Transport6 0.1574 W4 Inappropriate processing7 0.1387 W6 Unnecessary movement8 0.1081 W9 Inappropriate design9 0.0653 W8 Energy10 0.0616 W10 Human potential
1419Lean tool selection in a die casting unit
Dow
nloa
ded
by [
Indi
an I
nstit
ute
of T
echn
olog
y -
Kha
ragp
ur]
at 1
1:30
05
June
201
5

Table 18. Fuzzified correlation matrix to represent the linguistic relations between wastes and the tools.
Tool 1 Tool 2 Tool 3 Tool 4 Tool 5 Tool 6 Tool 7 Tool 8 Tool 9 Tool 10
1 3 5 3 5 7 0 0 0 1 3 5 3 5 7 3 5 7 0 0 0 5 7 9 1 3 5 0 0 05 7 9 5 7 9 1 3 5 0 0 0 3 5 7 3 5 7 0 0 0 3 5 7 5 7 9 1 3 55 7 9 0 0 0 0 0 0 0 0 0 0 0 0 0 0 0 1 3 5 3 5 7 0 0 0 3 5 75 7 9 0 0 0 3 5 7 1 3 5 0 0 0 1 3 5 3 5 7 1 3 5 1 3 5 3 5 73 5 7 5 7 9 3 5 7 0 0 0 5 7 9 3 5 7 1 3 5 3 5 7 0 0 0 0 0 05 7 9 1 3 5 0 0 0 0 0 0 0 0 0 0 0 0 1 3 5 0 0 0 0 0 0 5 7 91 3 5 0 0 0 0 0 0 5 7 9 0 0 0 0 0 0 0 0 0 1 3 5 5 7 9 0 0 01 3 5 0 0 0 0 0 0 0 0 0 0 0 0 0 0 0 1 3 5 1 3 5 0 0 0 0 0 03 5 7 0 0 0 0 0 0 0 0 0 0 0 0 1 3 5 0 0 0 0 0 0 1 3 5 3 5 73 5 7 3 5 7 1 3 5 1 3 5 3 5 7 5 7 9 5 7 9 3 5 7 3 5 7 3 5 7
1420
R.K.Singhet
al.
Dow
nloa
ded
by [
Indi
an I
nstit
ute
of T
echn
olog
y -
Kha
ragp
ur]
at 1
1:30
05
June
201
5
an overall picture of the company related to products and processes. This maphelps in describing the actual process followed in the company to the top levelmanagement and thus helps them in utilizing it for the improvement.
The next stage is formation of a cross functional team composed of middle levelmanagement people and personnel from different departments of the company. Thebasic purpose of this team is data collection, its analysis, and implementation ofshortcomings. The information gathered from the second team is provided to thelean consultants who are in this case the authors of the article. They are providingknowledge, support, training and advice to the company for implementation of leanconcept. From the big picture map, an overview of the company is obtained but it isrealized that further detailed mapping is required to get micro level informationof the wastes.
As discussed earlier the first step for identification of this detailed mapping tool isidentification of the waste having more impact on the organization. A questionnaireis prepared for gathering information from the executives of the company. In ourcase, the company is small scale and only a few departments exist. We gatheredinformation by selecting a team of DMs from different shops and sections throughwhich the product physically flows. To stress the influence of waste the leanconsultant group listed the critical points and presented it to the DMs. A question-naire is provided to the DMs to seek their opinion. Owing to different levels ofanalytical and inferential ability of the DMs, we have offered three options forsoliciting their opinion. The DMs are asked to provide data in the format inwhich they can more clearly present their opinion. Another problem is concernedwith fixed mind set and difficult to change attitude of few DMs who may have certainbiased views towards particular options. They may not faithfully reflect their trueopinion and the same may not be healthy for growth of the unit under consideration.For example, a DM may view high inventory to be a critical problem in his shopand thus may generalize his observation in the context of overall organization.On the other hand, another DM facing problems like machine down time andhigh defect rate may prefer ‘overproduction’ to alleviate the current problem. Totackle this problem, data from the current state map is used to generate utilityfunction for giving emphasis to the various DMs and their opinions. Data providedby the various DMs is homogenized and multiplied by the weights assigned tothe respective shops/sections. Finally, this data is normalized and overall scores
Table 19. Defuzzified value of tool waste correlation.
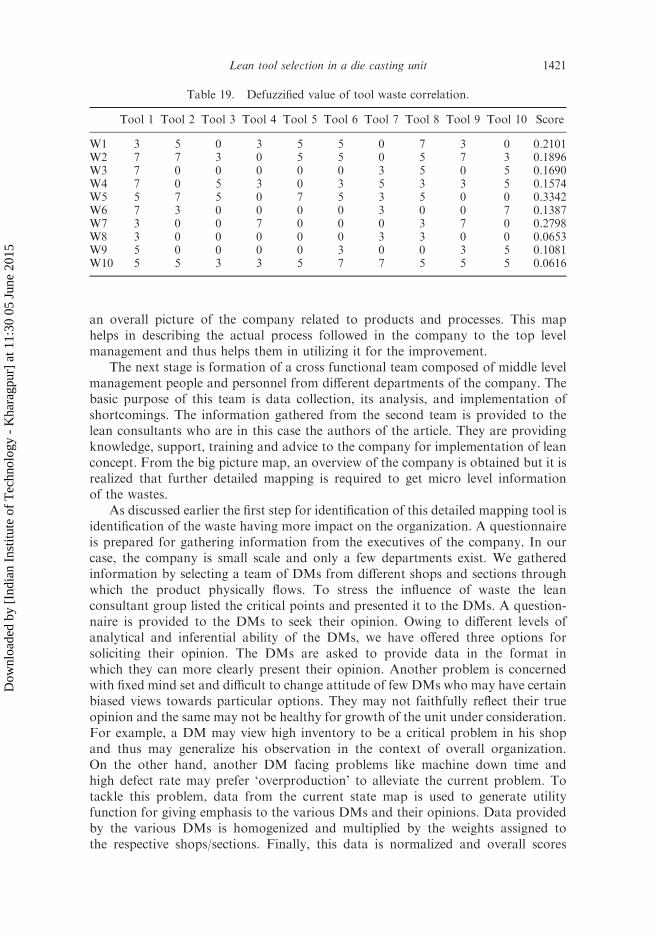
Tool 1 Tool 2 Tool 3 Tool 4 Tool 5 Tool 6 Tool 7 Tool 8 Tool 9 Tool 10 Score
W1 3 5 0 3 5 5 0 7 3 0 0.2101W2 7 7 3 0 5 5 0 5 7 3 0.1896W3 7 0 0 0 0 0 3 5 0 5 0.1690W4 7 0 5 3 0 3 5 3 3 5 0.1574W5 5 7 5 0 7 5 3 5 0 0 0.3342W6 7 3 0 0 0 0 3 0 0 7 0.1387W7 3 0 0 7 0 0 0 3 7 0 0.2798W8 3 0 0 0 0 0 3 3 0 0 0.0653W9 5 0 0 0 0 3 0 0 3 5 0.1081W10 5 5 3 3 5 7 7 5 5 5 0.0616
1421Lean tool selection in a die casting unit
Dow
nloa
ded
by [
Indi
an I
nstit
ute
of T
echn
olog
y -
Kha
ragp
ur]
at 1
1:30
05
June
201
5
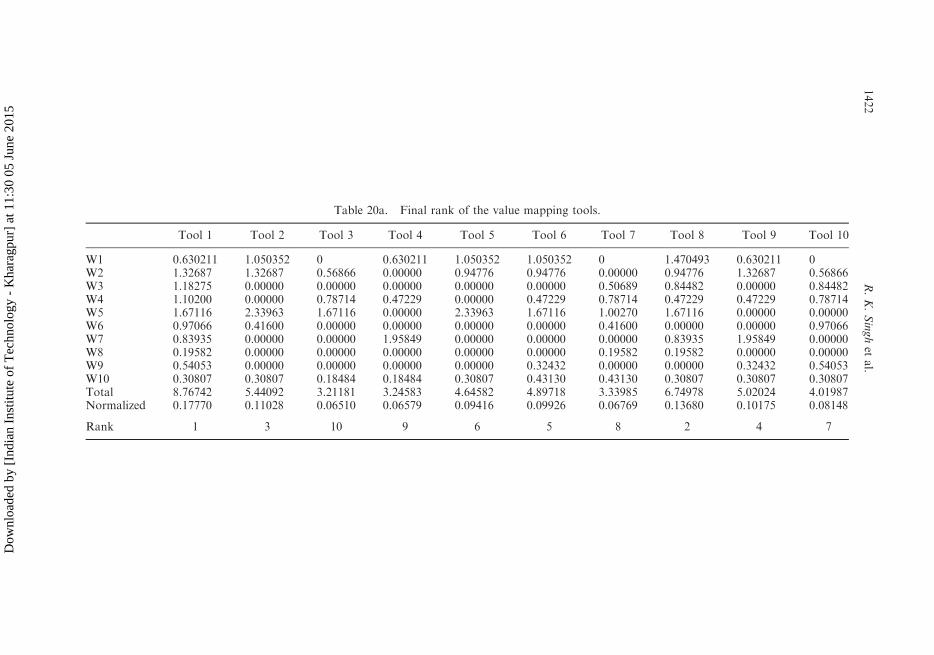
Table 20a. Final rank of the value mapping tools.
Tool 1 Tool 2 Tool 3 Tool 4 Tool 5 Tool 6 Tool 7 Tool 8 Tool 9 Tool 10
W1 0.630211 1.050352 0 0.630211 1.050352 1.050352 0 1.470493 0.630211 0W2 1.32687 1.32687 0.56866 0.00000 0.94776 0.94776 0.00000 0.94776 1.32687 0.56866W3 1.18275 0.00000 0.00000 0.00000 0.00000 0.00000 0.50689 0.84482 0.00000 0.84482W4 1.10200 0.00000 0.78714 0.47229 0.00000 0.47229 0.78714 0.47229 0.47229 0.78714W5 1.67116 2.33963 1.67116 0.00000 2.33963 1.67116 1.00270 1.67116 0.00000 0.00000W6 0.97066 0.41600 0.00000 0.00000 0.00000 0.00000 0.41600 0.00000 0.00000 0.97066W7 0.83935 0.00000 0.00000 1.95849 0.00000 0.00000 0.00000 0.83935 1.95849 0.00000W8 0.19582 0.00000 0.00000 0.00000 0.00000 0.00000 0.19582 0.19582 0.00000 0.00000W9 0.54053 0.00000 0.00000 0.00000 0.00000 0.32432 0.00000 0.00000 0.32432 0.54053W10 0.30807 0.30807 0.18484 0.18484 0.30807 0.43130 0.43130 0.30807 0.30807 0.30807Total 8.76742 5.44092 3.21181 3.24583 4.64582 4.89718 3.33985 6.74978 5.02024 4.01987Normalized 0.17770 0.11028 0.06510 0.06579 0.09416 0.09926 0.06769 0.13680 0.10175 0.08148
Rank 1 3 10 9 6 5 8 2 4 7
1422
R.K.Singhet
al.
Dow
nloa
ded
by [
Indi
an I
nstit
ute
of T
echn
olog
y -
Kha
ragp
ur]
at 1
1:30
05
June
201
5
pertinent to different types of waste affecting the organization are evaluated. It isobserved that waste, like excessive storage, delay of information and products, havethe maximum impact on the performance of the organization. Defect-related wasteslike frequent errors in material/product, quality problems resulting in scrap andrework are also identified as major wastes. List of wastes according to their orderof impact are listed in table 17b.
The tools selected for identifying the value-adding and non-value-addingactivities are process activity mapping, value analysis time profile, supply chainresponse matrix, overall supply chain effectiveness mapping, and decision pointanalysis. These tools can easily map and provide insight of the wastes and theplaces where they have an impact. For example, by using the process activitymap, the manufacturing process or complete order fulfilment process can beanalysed in the form of various activities performed at different stages. All theseactivities can be analysed by using 5 W1H (when, why, what, where, who, how).This mapping tool helps in minimizing the non-value adding activities and necessarynon-value-adding activities. Process activity mapping also helps in reducing the timerequired for value-adding activities. All these actions result in reduction of theproduction lead time. The second mapping tool selected is value analysis time profile,which is harder to map and should be left until last. This tool plots the accumulationof both value-adding and non-value-adding cost against time. It is an excellent toolkit for mapping where the money is wasted. The third tool selected is the supplychain response matrix which provides information about percentage of inventorylead time with total production lead time, and helps in reducing the inventory leadtime at various stages. The fourth tool is the overall supply chain effectiveness matrix(Nakajima 1988) that can be used to map the effectiveness of each step of supplychain of the company and in identifying the sources of variation. The proper analysisof this tool is very helpful in application of maintenance, quality, logistics,and facility management. The fifth tool selected is decision point analysis which isbasically used to map the design of the value stream by ascertaining the point in themanufacturing system where it transforms itself from pull to push type. It also dealswith the detailed analysis of the WIP movement in the organization. Various ‘whatif’ scenarios can be tested by shifting the decision point from one stage to another.Depending upon the insight provided by the detailed mapping tools, other leanimplementation tools shown in table 2 can be selected and utilized for removingthe specific wastes/problems.
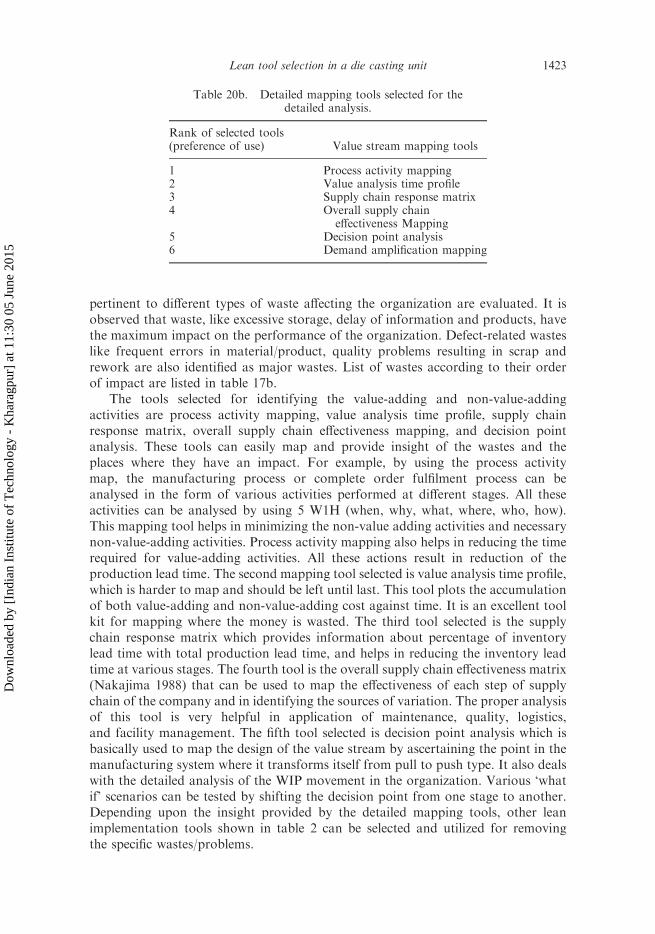
Table 20b. Detailed mapping tools selected for thedetailed analysis.
Rank of selected tools(preference of use) Value stream mapping tools
1 Process activity mapping2 Value analysis time profile3 Supply chain response matrix4 Overall supply chain
effectiveness Mapping5 Decision point analysis6 Demand amplification mapping
1423Lean tool selection in a die casting unit
Dow
nloa
ded
by [
Indi
an I
nstit
ute
of T
echn
olog
y -
Kha
ragp
ur]
at 1
1:30
05
June
201
5
7. Conclusion
Lean manufacturing should be understood as a business theory by which themanufacturing process is reconceived as a competitive weapon. The concept callsfor removing all non-value-adding activities that often cause bottlenecks, and otherforms of waste, from the production process. Eliminating waste from manufacturingreduces production time and cost while maximizing the quality and customer service.For example, by eliminating waste, lean manufacturing can reduce inventories, lowerthe cost of production, save on shop floor and storage space, and reduction inlabour costs without decreasing job opportunities. To implement this philosophyin the organization, value stream mapping is a major course of action. However, toidentify the wastes across the organization and the selection of value stream mappingtools is a complex decision-making problem. There arises a need for a logical andreasonable methodology to address the problem of such magnitude. In this paper, wehave carried out a fuzzy-based, multi-preference, multi-person, and multi-criteriadecision-support heuristic to address the issue. We have also utilized MAUTto give scores for the various DMs. In the last step of the methodology, a fuzzy-logic-based approach has been adopted to establish the relation between the toolsand the wastes. Finally, based on the overall score, five tools were selected to identifythe wastes. The effect of adopting the lean philosophy was shown in variousperformance measures of the company. A remarkable improvement is observed inon-time delivery and machine availability.
Future scope of the findings in this paper will be to adopt consensus supportsystems to find out the weights that are associated with the various attributes ofthe different implementation tools. Another enhancement would be to amplify theefficacy of the proposed methodology by introduction of another feedback loop sothat the regret factor can be analysed.
In conclusion, a major contribution of the paper is to provide a logicaland rational methodology for the selection of detailed value stream mappingtools and thus resulting in identification and elimination of wastes present in theorganization.
Acknowledgements
The authors are indebted to the learned referee for the insightful comments thathelped immensely in improving an earlier version of the text. We are also thankful tothe editor-in-chief Professor John E. Middle for his bold decision regarding themajor revision, which gave us the opportunity to learn several new things andinclude them in the text thus enhancing its worth.
Appendix
As each decision maker (DM) is characterized by their own ideas, attitudes, motiva-tions and personality, it is quite natural to think that different experts will providetheir preferences in different ways. The DMs will provide their preferences in utilityfunctions, preference ordering of the alternatives, and multiplicative preferencerelation (Chiclana et al. 1996a, 1996b, 1998, Tanino 1990, Saaty 1980, Seo and
1424 R. K. Singh et al.
Dow
nloa
ded
by [
Indi
an I
nstit
ute
of T
echn
olog
y -
Kha
ragp
ur]
at 1
1:30
05
June
201
5
Sakawa 1985). The use of multiplicative preference relations in representing anexpert’s opinion about a set of alternatives appears to be a useful tool in modellingdecision processes and is easy to aggregate as far as group preferences are consid-ered. The justification of the various transformation functions utilized for homoge-nising the various modes of information into multiplicative preference relationshipsare as follows.
A1. Utility functions
Here, the DM presents his preferences on X as a set of n utility valuesUi
¼ {uis, s¼ 1, . . . , n}, uis 2 [0, 1], where uis represents the utility evaluation given bythe DM DMi to the alternative �s. Therefore, the higher the evaluation, the betterthe alternative satisfies the DM. Any transformation function must satisfy the fol-lowing properties:
(i) The transformation function h relating the multiplicative preference relationwith the utility function for DMi, Ki
sm¼ h(uis, uim), should depend only on thevalues of u i
s and uim. This transformation function must satisfy the fact that themore the value of uis the more is Ksm
i , and the more the value of uim the less is thevalue of Ksm
i .
Proof: Function h should obtain the preference of any alternative over any otheralternative depending on the value of the quotient between the respective utilityvalues of the alternatives, i.e.
hðuis, uimÞ ¼ h
uisuim
� �ðA1Þ
where, � is a non-decreasing function. This type of transformation function � havebeen studied and further developed by Chiclana et al. (1998). Here, uis=u
im is
interpreted as a ratio of the preference intensity for �s to that of �m, i.e. �s isuis=u
im times as good as �m, and assuming a reciprocal multiplicative preference
relation, a possible transformation function to obtain the intensity of preferenceof the alternative �s over alternative �m for DMi, Ksm
i may be defined as
Kism ¼ �1
uisuim
� �¼
ðuis=uimÞ
uis=uim
� �þ uiv=u
is
� �
¼ðuisÞ
2
ðuisÞ2þ ðuimÞ
2, s 6¼ m:
¼ 92ððUisÞ2=ððUi
sÞ2þðUi
mÞ2ÞÞ�1Þ
ðA2Þ
In addition to the above discussion, the transformation function must satisfycertain other properties. They are as follows:
ðaÞ hðuim, uisÞ � hðuis, u
imÞ ¼ 1 8 uis, u
im 2 ½1=9, 9�: ðA3Þ
1425Lean tool selection in a die casting unit
Dow
nloa
ded
by [
Indi
an I
nstit
ute
of T
echn
olog
y -
Kha
ragp
ur]
at 1
1:30
05
June
201
5
This property deals with the reciprocity condition.
ðbÞ hðuis, uisÞ ¼ 1 8 uis 2 ½0, 1� ðA4Þ
indicates the indifference of an expert between two alternatives verifying his criterionwith the same intensity.
ðcÞ hðuim, 0Þ ¼ 9 8 uim 2 ½0, 1� ðA5Þ
implies that if a DM has a prior knowledge that an alternative does not satisfy hiscriterion, then any alternative satisfying his criterion with a positive value should bepreferred with the maximum degree of preference, i.e. nine.
ðdÞ h uis, uim
� �> 1 if uis > uim: 8 uis, u
im"½0, 1� ðA6Þ
Finally, property (d) indicates that between two alternatives, the expert gives adefinite preference to the alternative with the higher evaluations over the other.
(ii) As per the need of the utility functions, h(�) has to be non decreasing in the firstand non-increasing in the second argument. A theoretical proof pertaining to theabove statement is given as follows:
We assume that hðuis, uimÞ ¼
1
1þ dðuis, uimÞ
ðA7Þ
where d [0� 1]� [0� 1]!Rþ is a function of same nature as h (i.e. is non-decreasingin first, and non-decreasing in second argument). We express that d is a separablefunction and the assumption is also based on the fact that the set of utility values aregiven on the basis of a positive ratio scale. We then have
hðuis, uimÞ ¼
1
1þ t0 uis, uim
� �� t00 uis, u
im
� � ðA8Þ
where t0 and t00 is " [0,1] and have the same sign but t0 is non-increasing in the firstdomain and non-decreasing in the second one and the reverse is true for t00. Now,from the earlier discussion, we have
t0ðuisÞ � t00ðuimÞ ¼ 1, 8 uis 2 ½0, 1� ðA9Þ
Therefore, t0 ¼ 1/t00, with t00(t) 6¼ 0 for any t belonging to the domain of definitionof t00. But, we also have from property (c), t00(0)¼ 0, so that t00: [0, 1]!Rþ, and for�¼ 0, t0(�) is not defined, therefore, the expression h transforms into
h uis, uim
� �¼
t00 uim� �
t00 uim� �
þ t00 uis� � ðA10Þ
(iii) The function h(�) should be continuous in nature as it must reflect the changesin the utility valuations u i
s , uim. To validate the above-mentioned propositions, let us
consider the following.
h uis, uim
� �¼ ½r0 uis, u
im
� ��2, 8 uis, u
im 2 ½0, 1� ðA11Þ
1426 R. K. Singh et al.
Dow
nloa
ded
by [
Indi
an I
nstit
ute
of T
echn
olog
y -
Kha
ragp
ur]
at 1
1:30
05
June
201
5
where r0 (uis, uim)2 [0, 1]. Considering the equation (A6) we can have the following
transformation.
r0 uis, uim
� �� �2þ r0 uim, u
is
� �� �2¼ 1, 8 uis, u
im 2 ½0, 1� ðA12Þ
The above equation can be converted into a parametric equation of two contin-uous functions (i.e. sine and cosine). Hence, the transforming function must becontinuous in nature.
A2. Preference ordering of the alternatives
Here, decision maker DMi provides his preferences on X as an individual preferenceordering, Oi
¼ {oi, . . . , oi(n)}, where Oi(.) is a permutation function over the index set{1, . . . , n} for the DMi (Chiclana et al. 1996a, 1996b, 1998, Tanino 1990, 1988, Saaty1980, Seo and Sakawa 1985), n is the maximum number of alternatives. Therefore,according to the view point of each DM, an ordered vector of alternatives, from thebest one to the worst one is given in the form of preference ordering of alternatives.Various theoretical justifications for the properties associated with the transforma-tion function are as follows:
The transformation function must only depend on the values of oi(s) andoi(m), i.e.
kism ¼ f oiðsÞ, oiðmÞ� �
ðA13Þ
It must be a non-increasing function of the first argument and a non-decreasingfunction of the second argument. To satisfy the above conditions the function fshould depend on the difference between the alternatives’ positions. It should givea value of importance or utility to each alternative in such a way that the lower theposition of an alternative, the higher the utility. The preference of the best alternativeover the worst alternative is the maximum preference and has a value of nine.
Therefore, the utility associated with an alternative is
uis ¼ v n� oiðsÞ� �
ðA14Þ
where v is a non-decreasing function. Thus, for
uis ¼ v n� oiðsÞ� �
¼n� oiðsÞ
n� 1ðA15Þ
Several researchers like (Tanino 1988, 1990) have done considerable work in thisregard. However, we have utilized the transformation function adopted by Chiclanaet al. (1998) for transforming the rank ordering of the alternatives into multiplicativepreference relation.
kism ¼ g0ðoiðsÞ � oiðmÞÞ ¼ 1=2 1þ ðoiðsÞ � oiðmÞÞ=ðn� 1Þ� �
¼ 9ðoiðsÞ�oiðmÞÞ=ðn�1Þ
ðA16Þ
Thus, by adopting the above transformation function all the requisite propertiesare met. Such as:
fðoiðsÞ, oiðmÞÞ 2 ½1=9, 9�, 8 s,m ðA17Þ
1427Lean tool selection in a die casting unit
Dow
nloa
ded
by [
Indi
an I
nstit
ute
of T
echn
olog
y -
Kha
ragp
ur]
at 1
1:30
05
June
201
5
fðoiðsÞ, oiðmÞÞ � fðoiðmÞ, oiðsÞÞ ¼ 1�, 8 s,m ðA18Þ
fðoiðsÞ, oiðmÞÞ ¼ 1 if oiðmÞ ¼ oiðsÞ, 8 s,m ðA19Þ
fðoiðsÞ, oiðmÞÞ > 1 if oiðsÞ > oiðmÞ, 8 s,m ðA20Þ
References
Bordogna, G., Fedrizzi, M. and Pasi, G., A linguistic modeling of consensus in group decision-making based on OWA operators. IEEE Trans. on Systems, Man and Cybernetics:Part A. Systems and Humans, 1997, 27, 126–132.
Bryson, N., Group decision-making and the analytic hierarchy process: exploring theconsensus-relevant information content. Computers & Op. Res., 1996, 23, 27–35.
Chan, F.T.S., Chan, H.K. and Chan, M.H., An integrated fuzzy decision support system formulti criterion decision-making problems. Proceedings of Institution of MechanicalEngineers: Part B, 2003, 217, 11–27.
Chiclana, F., Herrera, F. and Herrera-Viedma, E., Integrating three representative models infuzzy multipurpose decision-making based on fuzzy preference relations. Fuzzy SetsSyst., 1998, 97, 277–291.
Chiclana, F., Herrera, F., Herrera-Viedma, E. and Payotos, M.C., A classification method ofalternatives for multiple preference ordering criteria based on fuzzy majority. J. FuzzyMath., 1996a, 4, 17–29.
Chiclana, F., Herrera, F. and Herrera-Viedma, E., Preference relations as the informationrepresentation base in multiperson decision making, Proceedings of the 6th InternationalConference on Information Processing and Management of Uncertainty in KnowledgeBased Systems, Granada, 1996b, 1, 459–464.
CITEC Manufacturing and Technology Solution, Lean manufacturing. Available online at:http:/www.citec.org/lean_manufacturing.html (accessed 7 September 2004).
Connstep Inc. Available online at: http://www.connstep.com/web/frames.nsf/pages/products(accessed 8 September 2004).
Current, J. and Weber, C., Application of Facility location modeling constructs to vendorselection problem. Euro. J. Op. Res., 1994, 76, 387–392.
Devedzie, G.B. and Pap, E., Multi-criteria-multistages linguistic evaluation and ranking ofmachine tools. Fuzzy Sets and Systems, 1999, 102, 451–461.
Herrera, F., Herrera-Viedma, E. and Verdegray, J.L., A model of consensus in group decision-making under linguistic assessments. Fuzzy Sets and Systems, 1996, 78, 73–87.
Herrera-Viedma, E., Herrera, F. and Chiclana, F., A consensus model for multipersondecision making with different preference structures. IEEE Trans. on Systems, Manand Cybernetics, 2002, 32, 394–402.
Hines, P. and Rich, N., The seven value stream mapping tools. Int. J. Op. & Prod. Manage.,1997, 17(1), 46–64.
Hines, P., Lamming, R., Jones, D., Cousion, P. and Risch, N., Value Stream Management:Strategy and Excellence in Supply Chain, 2000 (Financial Times: Harlow, England).
Hines, P., Rich, N., Bicheno, J., Brunt, D., Taylore, D., Utterwoth, C. and Sullivan, J., 1998,Value stream Management, Int. J. Logist. Manage., 9(1), 25–42.
Hines, P. and Taylore, D., Going Lean, 2000 (Lean Enterprise Research Centre,Cardiff Business School: Cardiff, UK).
Jones, D.T., Hines, P. and Rich, N., Lean logistics, Int. J. Phys. Distrib. & Logist., 1997,27(3/4), 53–73.
Karpack, B., Kuncu, E. and Kasuganti, R., An application of visual interactive goalprogramming: a case in vendor selection decisions. J. Multi-criteria Decision Analysis,1999, 8, 93–105.
Kaufmann, A. and Gupta, M.M., Fuzzy Mathematical Model in Engineering and ManagementScience, 1988 (Elsevier: Amsterdam, The Netherlands).
1428 R. K. Singh et al.
Dow
nloa
ded
by [
Indi
an I
nstit
ute
of T
echn
olog
y -
Kha
ragp
ur]
at 1
1:30
05
June
201
5

Keeney, R.L. and Raiffa, H., Decisions with Multiple Objectives: Preferences and ValueTradeoffs, 1976 (John Wiley and Sons Inc.: New York, NY).
Keeney, R.L. and Raiffa, H., Decision with Multiple Objectives, 1993 (Cambridge UniversityPress: Cambridge, UK).
Liang, G.S. and Wang, M.J., A fuzzy-multicriterion decision making method for facility sitelocation. Int. J. Prod. Res., 1991, 29(11), 2313–2330.
Liker, J.K., Becoming Lean, 1998 (Productivity Press: Portland, OR).Malakooti, B. and Raman, V., Clustering and selection of multiple criteria alternatives using
unsupervised and supervised learning. J. Intel. Manuf., 2000, 11, 435–453.Martinich, J.S., Production and Operation Management: An Applied Modern Approach,
1997 (John Wiley and Sons: New Jersey).Monden, Y., Toyota Production System: An Integrated Approach to Just in Time, 2nd ed.,
1993 (Industrial Engineering and Management Press: Norcross, GA).Nakajima, S., TPM: An Introduction to TPM, 1988 (Productivity Press: Cambridge, MA).Ohno, T., Toyota Production System: Beyond Large-Scale Production (Productivity Press:
Portland, Oregon)Pomerol, J.C. and Romero, S.B., 2000, Multicriterion Decision in Management: Principles
and Practice, 1988 (Kluwer Academic Publishers: Boston, MA)Prabhu, T.R. and Visayakumar, K., Fuzzy hierarchical decision making method (FHDM):
a methodology for technology choice. Int. J. Computer Appl. Tech., 1996, 9(5), 322–329.Ross, T.J., Fuzzy Logic with Engineering Applications, 1997 (McGraw-Hill: New York, NY).Rother, M. and Shook, J., Learning to See: Value Stream Mapping to Add Value and Eliminate
Muda, 1.2 ed., 1999 (The Lean Enterprise institute Inc.: Brookline, MA).Saaty, T.L., The Analytic Hierarchy Process, 1980 (McGraw-Hill: New York).Seo, F. and Sakawa, M., Fuzzy multi attribute utility analysis for collective choice.
IEEE Trans. on Systems, Man and Cybernetics, 1985, C(15), 45–53.Shingo, S., The Shingo Prize Production Management System: Improving Process Function,
1992 (Productivity Press: Cambridge, MA).Tanino, T., Fuzzy preference relations in group decision making. In Non-Conventional
Preference Relations in Decision Making, edited by J. Kacprzyk and M. Roubens,pp. 54–71, 1988 (Springer: Berlin).
Tanino, T., On Group Decision Making Under Fuzzy Preferences. Multiperson Decision MakingUsing Fuzzy Sets and Possibility Theory, 1990 (Kluwer: Norwell, MA).
Weber, C.A, and Ellram, L.M., Supplier selection using multi-objective programming:a decision support system approach. Int. J. Phys. Dist. & Logist. Manage., 1992,23(2), 3–14.
Winston, W.L., Operation Research, Applications and Algorithms, 4th ed., 2004 (DuxburyPress: California).
Womack, J.P. and Jones, D.T., Lean Thinking: Banish Waste and Create Wealth in YourCorporation, 1996 (Simon and Schuster: London).
Womack, J.P., Jones, D.T. and Roos, D., The Machine That Changed The World (Macmillan:New York).
Zadeh, L.A., 1965, Fuzzy sets. Inform. & Cont., 1990, 8, 338–353.
1429Lean tool selection in a die casting unit
Dow
nloa
ded
by [
Indi
an I
nstit
ute
of T
echn
olog
y -
Kha
ragp
ur]
at 1
1:30
05
June
201
5