Structural Efficiency of Hollow Reinforced Concrete Beams ...
Upload
tu-darmstadtCategory
view
0download
0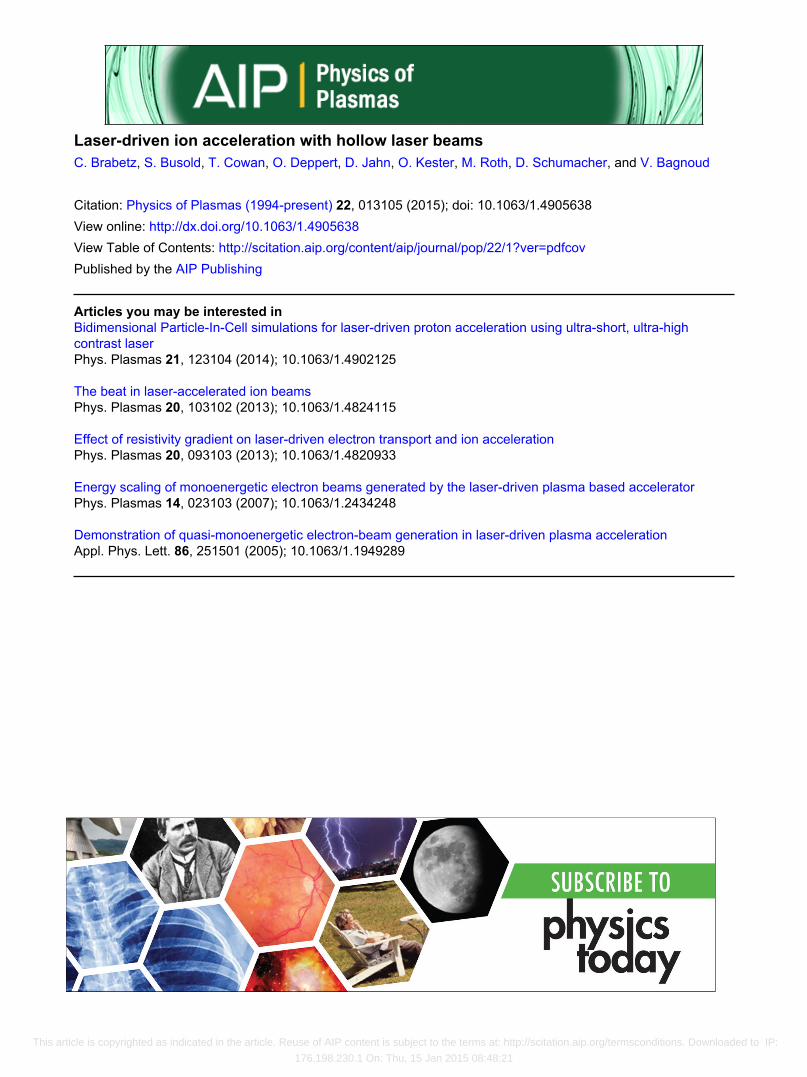
Laser-driven ion acceleration with hollow laser beamsC. Brabetz, S. Busold, T. Cowan, O. Deppert, D. Jahn, O. Kester, M. Roth, D. Schumacher, and V. Bagnoud Citation: Physics of Plasmas (1994-present) 22, 013105 (2015); doi: 10.1063/1.4905638 View online: http://dx.doi.org/10.1063/1.4905638 View Table of Contents: http://scitation.aip.org/content/aip/journal/pop/22/1?ver=pdfcov Published by the AIP Publishing Articles you may be interested in Bidimensional Particle-In-Cell simulations for laser-driven proton acceleration using ultra-short, ultra-highcontrast laser Phys. Plasmas 21, 123104 (2014); 10.1063/1.4902125 The beat in laser-accelerated ion beams Phys. Plasmas 20, 103102 (2013); 10.1063/1.4824115 Effect of resistivity gradient on laser-driven electron transport and ion acceleration Phys. Plasmas 20, 093103 (2013); 10.1063/1.4820933 Energy scaling of monoenergetic electron beams generated by the laser-driven plasma based accelerator Phys. Plasmas 14, 023103 (2007); 10.1063/1.2434248 Demonstration of quasi-monoenergetic electron-beam generation in laser-driven plasma acceleration Appl. Phys. Lett. 86, 251501 (2005); 10.1063/1.1949289
This article is copyrighted as indicated in the article. Reuse of AIP content is subject to the terms at: http://scitation.aip.org/termsconditions. Downloaded to IP:
176.198.230.1 On: Thu, 15 Jan 2015 08:48:21

Laser-driven ion acceleration with hollow laser beams
C. Brabetz,1,2,a) S. Busold,2,3 T. Cowan,4,5 O. Deppert,6 D. Jahn,6 O. Kester,1,2 M. Roth,6
D. Schumacher,2 and V. Bagnoud2,3
1Goethe-Universit€at Frankfurt am Main, 60323 Frankfurt, Germany2GSI Helmholtzzentrum f€ur Schwerionenforschung GmbH, 64291 Darmstadt, Germany3Helmholtz-Institut Jena, 07743 Jena, Germany4Helmholtz-Zentrum Dresden-Rossendorf, 01328 Dresden, Germany5Technische Universit€at Dresden, 01069 Dresden, Germany6Technische Universit€at Darmstadt, 64277 Darmstadt, Germany
(Received 27 August 2014; accepted 23 December 2014; published online 8 January 2015)
The laser-driven acceleration of protons from thin foils irradiated by hollow high-intensity laser
beams in the regime of target normal sheath acceleration (TNSA) is reported for the first time. The
use of hollow beams aims at reducing the initial emission solid angle of the TNSA source, due to a
flattening of the electron sheath at the target rear side. The experiments were conducted at the
PHELIX laser facility at the GSI Helmholtzzentrum f€ur Schwerionenforschung GmbH with laser
intensities in the range from 1018 W cm�2 to 1020 W cm�2. We observed an average reduction of
the half opening angle by ð3:0760:42Þ� or ð13:262:0Þ% when the targets have a thickness between
12 lm and 14 lm. In addition, the highest proton energies were achieved with the hollow laser
beam in comparison to the typical Gaussian focal spot. VC 2015 AIP Publishing LLC.
[http://dx.doi.org/10.1063/1.4905638]
I. OVERVIEW
In the field of laser-driven ion acceleration, the cur-
rently most used and best understood mechanism is the tar-
get normal sheath acceleration (TNSA).1,2 In this scheme, a
high-intensity laser beam is focused onto a solid thin target
where it produces a plasma at the front surface and hot elec-
trons that travel through the target. On the rear side, the
electrons create a quasi-static electric field capable of field
ionization and acceleration of light particles, mostly pro-
tons, present in the contamination layer at the surface of the
target. The ions and electrons expand into the vacuum
behind the target as a quasineutral plasma cloud. Such parti-
cle beams, originating from the target rear side contamina-
tion layer, have outstanding properties like ultra-low
emittance3 and a pulse duration comparable to the laser
pulse duration. The properties of these beams like their
divergence and exponential energy spectrum can be directly
linked to the spatial distribution of the electron sheath; in
particular, spatial density gradients are influencing directly
the particle emission direction.4 The laser intensities typi-
cally used for such experiments range form 1018 W cm�2 to
1020 W cm�2 with laser pulse durations from a few tens of
fs up to some ps. The maximum proton energy Ep;max is
depending on the electron density ne and the hot-electron
temperature kBTe,5 which scales as the ponderomotive
potential with dimensionless electric field amplitude a0 as
kBTe / a0 /ffiffiffiffiffiffiffiffiffi
Ilaser
p. Only a weak scaling with the target
thickness or laser pulse duration was measured by Robson
et al.6 for a Gaussian beam.
TNSA has been widely studied and is now used at many
facilities throughout the world, delivering ion energies up to
tens of MeV. Laser-accelerated ions are promising candi-
dates for several applications due to short-scale acceleration
length, high energy, and large particle numbers. Possible
applications are as an injector for conventional post-acceler-
ation,7,8 astrophysical phenomena,9 proton radiography,10 or
for medical ion treatment.11
Some TNSA properties, like the exponential energy
spectrum, make it difficult to inject the ions without energy
filtering and losses into conventional structures. The half
opening angle of the outgoing ion beam is energy-dependent
and reaches up to 30� for low ion energies, which can be too
large due to geometrical acceptance of following elements.
Several different approaches for reducing the divergence are
known, e.g., target shaping or with external plasma cells.12
But other publications show that the ion beam shape can also
be influenced by the laser focal spot shape.4
In this paper, we show that one can reduce the initial
divergence of laser-accelerated ions by use of engineered
laser beam shapes. This is done with a spiral phase element
(SPE)13 inserted early in the laser amplifier to produce a hol-
low, doughnut-like laser focus profile at the target surface.14
The experimental data are supported by particle-in-cell (PIC)
simulations. The experiments were done on the petawatt-
class laser facility PHELIX15 (petawatt high energy laser for
heavy ion experiments) located at GSI Helmholtzzentrum
f€ur Schwerionenforschung GmbH, Germany. Basic laser pa-
rameters for this experiment were FWHM laser pulse dura-
tion sL¼ 650 fs, laser beam energy EL¼ 70 J, and a contrast
level of about 10�7.
II. SIMULATION
In preparation for the experiments two-dimensional
particle-in-cell simulations were performed with thea)Electronic mail: [email protected]
1070-664X/2015/22(1)/013105/6/$30.00 VC 2015 AIP Publishing LLC22, 013105-1
PHYSICS OF PLASMAS 22, 013105 (2015)
This article is copyrighted as indicated in the article. Reuse of AIP content is subject to the terms at: http://scitation.aip.org/termsconditions. Downloaded to IP:
176.198.230.1 On: Thu, 15 Jan 2015 08:48:21
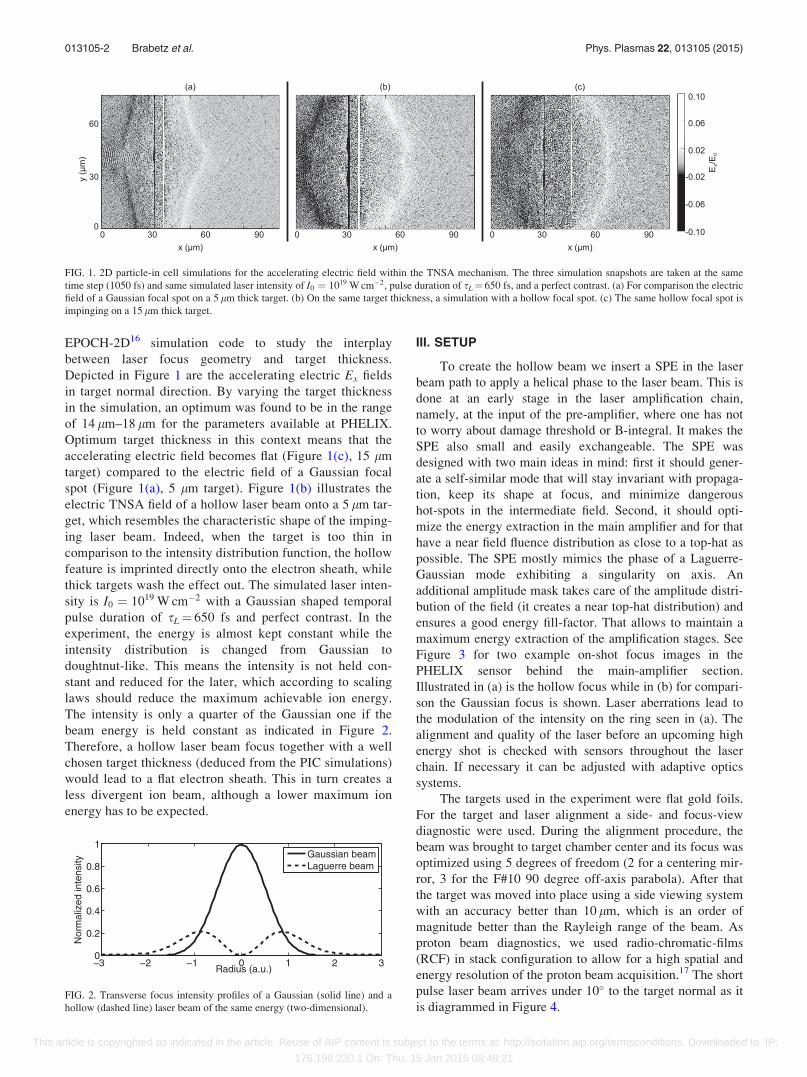
EPOCH-2D16 simulation code to study the interplay
between laser focus geometry and target thickness.
Depicted in Figure 1 are the accelerating electric Ex fields
in target normal direction. By varying the target thickness
in the simulation, an optimum was found to be in the range
of 14 lm–18 lm for the parameters available at PHELIX.
Optimum target thickness in this context means that the
accelerating electric field becomes flat (Figure 1(c), 15 lm
target) compared to the electric field of a Gaussian focal
spot (Figure 1(a), 5 lm target). Figure 1(b) illustrates the
electric TNSA field of a hollow laser beam onto a 5 lm tar-
get, which resembles the characteristic shape of the imping-
ing laser beam. Indeed, when the target is too thin in
comparison to the intensity distribution function, the hollow
feature is imprinted directly onto the electron sheath, while
thick targets wash the effect out. The simulated laser inten-
sity is I0 ¼ 1019 W cm�2 with a Gaussian shaped temporal
pulse duration of sL¼ 650 fs and perfect contrast. In the
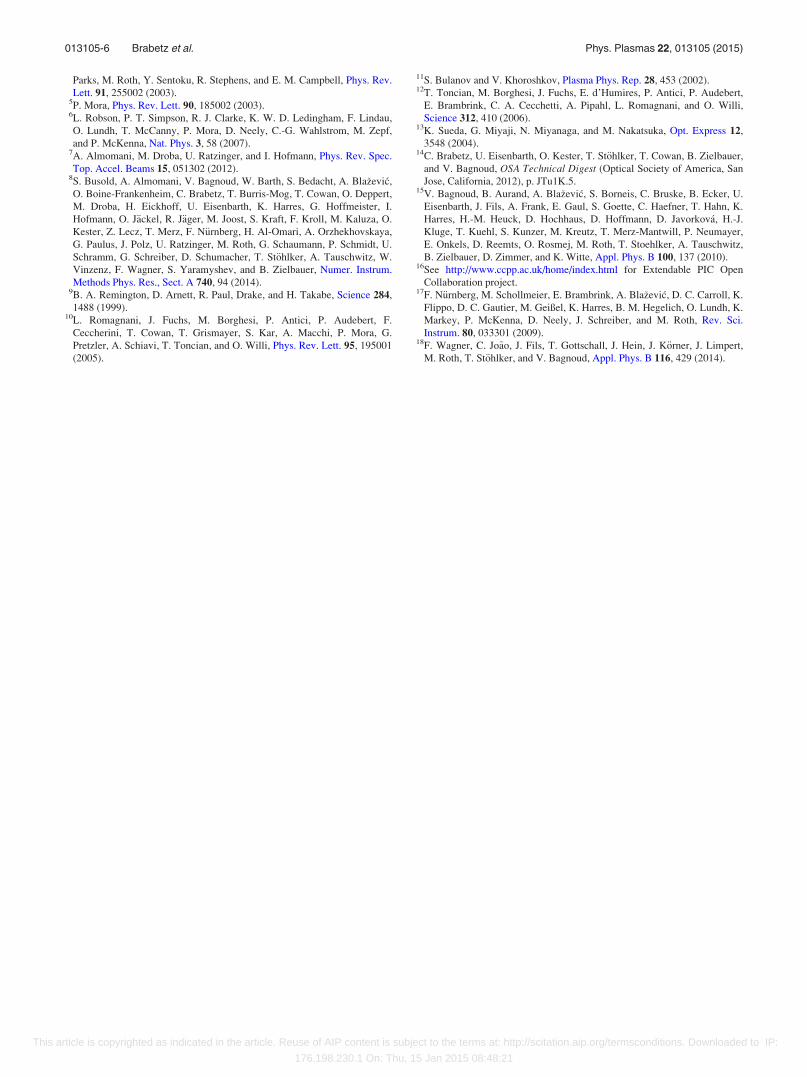
experiment, the energy is almost kept constant while the
intensity distribution is changed from Gaussian to
doughtnut-like. This means the intensity is not held con-
stant and reduced for the later, which according to scaling
laws should reduce the maximum achievable ion energy.
The intensity is only a quarter of the Gaussian one if the
beam energy is held constant as indicated in Figure 2.
Therefore, a hollow laser beam focus together with a well
chosen target thickness (deduced from the PIC simulations)
would lead to a flat electron sheath. This in turn creates a
less divergent ion beam, although a lower maximum ion
energy has to be expected.
III. SETUP
To create the hollow beam we insert a SPE in the laser
beam path to apply a helical phase to the laser beam. This is
done at an early stage in the laser amplification chain,
namely, at the input of the pre-amplifier, where one has not
to worry about damage threshold or B-integral. It makes the
SPE also small and easily exchangeable. The SPE was
designed with two main ideas in mind: first it should gener-
ate a self-similar mode that will stay invariant with propaga-
tion, keep its shape at focus, and minimize dangerous
hot-spots in the intermediate field. Second, it should opti-
mize the energy extraction in the main amplifier and for that
have a near field fluence distribution as close to a top-hat as
possible. The SPE mostly mimics the phase of a Laguerre-
Gaussian mode exhibiting a singularity on axis. An
additional amplitude mask takes care of the amplitude distri-
bution of the field (it creates a near top-hat distribution) and
ensures a good energy fill-factor. That allows to maintain a
maximum energy extraction of the amplification stages. See
Figure 3 for two example on-shot focus images in the
PHELIX sensor behind the main-amplifier section.
Illustrated in (a) is the hollow focus while in (b) for compari-
son the Gaussian focus is shown. Laser aberrations lead to
the modulation of the intensity on the ring seen in (a). The
alignment and quality of the laser before an upcoming high
energy shot is checked with sensors throughout the laser
chain. If necessary it can be adjusted with adaptive optics
systems.
The targets used in the experiment were flat gold foils.
For the target and laser alignment a side- and focus-view
diagnostic were used. During the alignment procedure, the
beam was brought to target chamber center and its focus was
optimized using 5 degrees of freedom (2 for a centering mir-
ror, 3 for the F#10 90 degree off-axis parabola). After that
the target was moved into place using a side viewing system
with an accuracy better than 10 lm, which is an order of
magnitude better than the Rayleigh range of the beam. As
proton beam diagnostics, we used radio-chromatic-films
(RCF) in stack configuration to allow for a high spatial and
energy resolution of the proton beam acquisition.17 The short
pulse laser beam arrives under 10� to the target normal as it
is diagrammed in Figure 4.
FIG. 1. 2D particle-in cell simulations for the accelerating electric field within the TNSA mechanism. The three simulation snapshots are taken at the same
time step (1050 fs) and same simulated laser intensity of I0 ¼ 1019 W cm�2, pulse duration of sL¼ 650 fs, and a perfect contrast. (a) For comparison the electric
field of a Gaussian focal spot on a 5 lm thick target. (b) On the same target thickness, a simulation with a hollow focal spot. (c) The same hollow focal spot is
impinging on a 15 lm thick target.
−3 −2 −1 0 1 2 30
0.2
0.4
0.6
0.8
1
Radius (a.u.)
Nor
mal
ized
inte
nsity
Gaussian beamLaguerre beam
FIG. 2. Transverse focus intensity profiles of a Gaussian (solid line) and a
hollow (dashed line) laser beam of the same energy (two-dimensional).
013105-2 Brabetz et al. Phys. Plasmas 22, 013105 (2015)
This article is copyrighted as indicated in the article. Reuse of AIP content is subject to the terms at: http://scitation.aip.org/termsconditions. Downloaded to IP:
176.198.230.1 On: Thu, 15 Jan 2015 08:48:21

IV. EXPERIMENTS
To cover a large parameter range, we studied foil thick-
nesses from 3 lm to 20 lm in the experiments. Beside vary-
ing the target thickness, the beam shape was also varied:
from Gaussian for reference to the Laguerre-Gaussian-like
mode LG01. For reproducible measurements, the target foil
was always aligned to the best focal position. The energy of
the shots was varied within the 12 cm round subaperture of
the PHELIX beam, delivering 50 J–80 J of laser energy on
the target (for the Gaussian and the ring shaped beam). The
laser pulse duration was always held constant at sL¼ 650 fs.
We also had the opportunity to apply the new ultrafast opti-
cal parametric amplifier of PHELIX to conduct some experi-
ments with ultra-high temporal contrast.18 With this method
a temporal contrast level better than 10�10 is reached beside
the normal contrast level of PHELIX of about 10�7. This
was done to study the influence of the pre-plasma on the ion
acceleration.
First the comparison of ring and Gaussian focal spot
geometries and their effect on the maximum proton
energy in the TNSA regime are studied. This is illustrated in
Figure 5, where the maximum proton energy at the cut-off is
plotted against the calculated laser intensity. The laser inten-
sity is inferred from the measured focal spot size and the
on-shot measured laser energy. The focal spot size is meas-
ured at the FWHM for the Gaussian and the ring, while for
the latter the inner dark area is factored in. This is realized
by applying a mask at FWHM threshold level and measure
the area (count the pixel) that are above this limit. For the
two displayed focus images in Figure 3, this method yields
Aring¼ 5223 pixel for the ring and AGaus¼ 2299 pixel for the
Gaussian one. A particular care has been taken to minimize
the impact of on-shot aberrations. An adaptive optics loop
has been used and the beam wavefront is also recorded dur-
ing the shot to ensure that no large distortion happens to the
beam (see Figure 3 for on-shot focus images). Changing the
focal spot geometry from a Gaussian shaped to the smallest
ring focal spot with the SPE, the focus radius doubled and
therefore the intensity drops to a quarter if the energy of the
laser beam is kept constant (Figure 2). The variation in inten-
sity is induced by different energies delivered from the
PHELIX laser system. The maximum proton energy is meas-
ured with RCF stacks. A typical energy detection gap
between the last RCF films is about 2 MeV, and therefore, an
energy error of þ2 MeV is assumed for all shots.
It is observed that the data points with a Gaussian focal
spot (blue triangles) fit very well to a power scaling Ep;max
¼ a� Iblaser with b ¼ 0:73 6 0:04. The same power scaling
FIG. 3. Comparison of the on-shot
focal spots measured after the main-
amplifier, normalized to the intensity
of the Gaussian spot (b). (a) The hol-
low focus and (b) the Gaussian focus.
In (a), the effect of the remaining laser
aberrations is seen and modulate the
intensity by a factor of 2 on the ring.
FIG. 4. Sketch of the used experiment
setup.
1018
1019
1020
10
20
30
40
50
Laser intensity (W cm−2)
Max
imum
pro
ton
ener
gy (
MeV
)
Gaussian focal spotfit GaussianRing focal spotfit ring
FIG. 5. The different focal spot geometries and their effect on the maximum
proton energy in the TNSA regime. With applied phase mask (LG01, green
circles) for laser beam shaping, a stronger coupling to the laser intensity can
be observed in comparison to the shots with the Gaussian focal spot (blue
triangles). The fit yield for the ring b ¼ 1:3260:08 and b ¼ 0:7360:04 for
the Gaussian case of the power scaling.
013105-3 Brabetz et al. Phys. Plasmas 22, 013105 (2015)
This article is copyrighted as indicated in the article. Reuse of AIP content is subject to the terms at: http://scitation.aip.org/termsconditions. Downloaded to IP:
176.198.230.1 On: Thu, 15 Jan 2015 08:48:21

is assumed for shots with the SPE (green circles). As illus-
trated in the figure with a steeper gradient a stronger cou-
pling to the laser intensity Ilaser is found in comparison to
the Gaussian focal spot, which result in an exponent
b ¼ 1:32 6 0:08 for the ring. Also notable is that the highest
proton energies were reached with the phase mask exceeding
35.8 MeV (the detection limit of the used RCF configura-
tion). One possible explanation for this unexpected feature is
that the ring focal spot also shapes the front-plasma surface.
Due to the ponderomotive force the electron density in the
central dark area increase. This pile up can lead to increased
energy transfer from the laser to accelerating electrons inside
the plasma. This assumption is supported by measuring the
hot (up to 7 MeV) electrons of a Gaussian and a ring laser
shot. In both cases, the hot electron temperature was nearly
the same, while one would expect a reduced temperature for
the later with reduced laser intensity. We measured an elec-
tron temperature kBTe ¼ ð3:3360:12ÞMeV for the Gaussian
beam and ð3:2860:22ÞMeV for the hollow beam.
Illustrated in Figure 6 is the dependency of the scaled
maximum proton energy Ep;max=Iblaser on the target thickness,
which was varied between 3 lm and 20 lm. The lower blue
triangles are shots with the Gaussian focal spot where no
clear dependency on the target thickness is observed. The
green circles represent shots with the SPE and normal
PHELIX contrast level. A relation between the maximum
proton energy and the target thickness is observed. The
measured optimum target thickness range is from 12 lm to
14 lm. This can be explained with the conducted PIC
simulations (see Figures 1(b) and 1(c)). If the target thick-
ness is too thin, the rear-side electron sheath exhibits the
same hollow feature as the impinging laser. Therefore, in the
center, the electric field is lower and more protons are accel-
erated to only lower energies. Going towards the optimum
target thickness, i.e., the electron sheath resembles the
desired flat sheath, the maximum accelerating electric field is
applied over the whole focal area. We have the maximum
proton energy. For even thicker targets the electrons scatter
to a larger region on the rear side and therefore lower the
maximum electric field, which leads also to lower proton
energies.
In addition, experiments with the best temporal contrast
level available, i.e., better than 10�10, were conducted, and
the results are illustrated in the same figure (red triangles for
the Gaussian focal spot and red circles for shots with hollow
beam). Again, no clear dependency on the target thickness is
observed in the case of a Gaussian focal spot: no visible dif-
ference could be observed for experimental data collected
with both temporal levels. The trend of the red circles (SPE)
indicates that there is also an optimum target thickness in the
same range, as it was observed with the normal contrast
level. However, more data would be necessary to confirm
this trend and fully measure the suspected optimum.
The measurements of the envelope half opening angle
of shots on targets with the optimum target thicknesses are
plotted in Figure 7. If the accelerating electron sheath
approaches the desired flat shape a more directed proton
beam is expected. That means that fewer protons should be
scattered into the border region of the outgoing proton beam
from the laser-driven ion acceleration. Analyzing the proton
beam size in each RCF layer of an experiment at a fixed pro-
ton intensity should reveal a smaller proton imprint area as it
is illustrated. The threshold for the proton beam boundary
was set to a fixed value of 2000 protons per pixel (one pixel
is approximately 25 lm� 25 lm). This limit was chosen to
distinguish clearly from the occurring background (mostly
electron) signal. Each of the plotted data points represents an
RCF layer in a shot and is scaled to the corresponding maxi-
mum proton energy for comparison. In total, 15 shots are0 5 10 15 20 25
0.2
0.4
0.6
0.8
1
Target thickness (µm)
Nor
mal
ized
max
imum
pro
ton
ener
gy /
(lase
r in
tens
ity)b
Ring focal spotRing, best contrast
0 5 10 15 20 250.2
0.4
0.6
0.8
1
Target thickness (µm)
Nor
mal
ized
max
imum
pro
ton
ener
gy /
(lase
r in
tens
ity)b
Gaussian focal spotGaussian, best contrast
(a)
(b)
FIG. 6. Scaling of the maximum proton energy with different target thick-
nesses. The blue triangles represent shots with a normal Gaussian focal spot.
The green circles represent shots with the SPE and normal PHELIX contrast
level. In red circles and triangles drawn are the shots with the best PHELIX
laser contrast level, i.e., 10�10.
0.2 0.3 0.4 0.5 0.6 0.7 0.85
10
15
20
25
30
35
enve
lope
hal
f ope
ning
ang
le (
°)
Normalized maximum proton energy
Gaussian focal spotRing focal spotfit Gaussianfit ring
FIG. 7. The comparison of different focal spot geometries with normalized
measured proton energies and their effect on the envelope half opening
angle. Observed is, we achieve a smaller envelop half opening angle with an
applied phase mask, given by the two average lines (blue triangles for a
Gaussian focal spot, green circles for a ring focal spot). The last layer is
always omitted because of the weak proton beam signal therein.
013105-4 Brabetz et al. Phys. Plasmas 22, 013105 (2015)
This article is copyrighted as indicated in the article. Reuse of AIP content is subject to the terms at: http://scitation.aip.org/termsconditions. Downloaded to IP:
176.198.230.1 On: Thu, 15 Jan 2015 08:48:21

displayed: 10 for the hollow laser beam and 5 for the
Gaussian one. The scaling by the reached maximum proton
energy is necessary because the opening angle is energy-
dependent. The size of the proton signal in a RCF can be
converted to an opening angle with the measured distance of
the RCF stack to the laser-matter interaction. They are fitted
with a polynomial of type hðEp=Ep;maxÞ ¼ a2 � ðEp=Ep;maxÞ2þ a1 � ðEp=Ep;maxÞ þ a0. It is observed in Figure 7 to
achieve a smaller envelope divergence with an applied phase
mask, given by green circled data points (the parameters are
a2 ¼ �22:86; a1 ¼ �0:18; a0 ¼ 27:76). The blue triangles
represent the data that were recorded with the Gaussian focal
spot (which parameters are a2 ¼ �25:07; a1 ¼ 0:33; a0
¼ 31:25). In average, the reduction is ð3:0760:42Þ�, which
corresponds to ð13:2 6 2:0Þ% for target thicknesses from
12 lm to 14 lm.
Despite the effect of aberrations on the laser focal spot,
the influence on the electron sheath is driven by the symme-
try. The flattening of the sheath is dependent on the size of
the hollow feature and proper target thickness, as it was dem-
onstrated with the PIC simulations. Therefore, we see a sym-
metric reduction in the divergence of the outgoing proton
beam despite the not-homogeneous but still symmetric laser
focal spot (see example proton profiles in the Appendix).
V. CONCLUSION
In the frame of these experiments laser-driven proton
acceleration was studied within the target normal sheath
acceleration regime with an emphasis on varying the trans-
versal laser focus profile to manipulate the generated proton
beam via the electron sheath. The goal of these experiments
was to change the initial conditions of the emitted ion beam
from the TNSA source. The accelerated proton beam exhib-
its a large divergence angle. To reduce this energy-
dependent (up to 60�) opening angle the demonstrated
method shapes the rear side electron sheath using specially
shaped laser beams. This can be done using helical phase
plates. The result is a hollow focal spot on the target with an
intensity minimum in the center. Main diagnostic for the
generated protons within the conducted experiments were
the radiochromic films.
We experimentally showed that one can create and use
shaped beams at a petawatt-scale laser facility. This was the
first time that laser-driven ion acceleration with a hollow
laser beam was experimentally demonstrated. The experi-
mental data concerning the envelope divergence are in agree-
ment with the simulations predicting a flat electron sheath.
Improvements on the laser-driven ion acceleration with
shaped laser beams were demonstrated and compared to
laser-driven ion acceleration with Gaussian focal spots. The
initial proton beam parameter, the envelope half opening
angle, was reduced by ð3:0760:42Þ� or in other words
ð13:262:0Þ%. The scaling of the maximum proton energy
Ep;max with a different power of Ilaser was experimentally
verified for experiments with a hollow laser focus. It
appeared that the highest proton energies were achieved with
the hollow laser beam exceeding 35.8 MeV. Also, the de-
pendency of the proton energy as well as the opening angle
on the target thickness with the hollow beam was demon-
strated within the target thickness range of 5 lm–20 lm.
With further improvements to the laser beam quality
(more homogeneous shape of the laser focal spot), the effect
on the protons will increase. Then, the application of this
method for envelope divergence reduction will have an influ-
ence on conventional structural elements next in line or
downstream experiments. Less particles are lost, e.g., due to
the acceptance of the used ion optics so the capture effi-
ciency increases. Or in the connected experiments a higher
proton flux is achieved.
ACKNOWLEDGMENTS
The authors want to thank the PHELIX laser team for
their excellent work. Financial support was granted by
HIC4FAIR.
APPENDIX: EXAMPLE RCF PROFILES
In Figure 8 are two examples for recorded RCF shown,
which correspond to a proton energy of 11.0 MeV and
22.1 MeV, respectively. Displayed are two shots: the upper
one for the Gaussian focal spot and the lower one with the
SPE. Both are with similar parameters concerning the target
and laser energy.
1S. C. Wilks, A. B. Langdon, T. E. Cowan, M. Roth, M. Singh, S. Hatchett,
M. H. Key, D. Pennington, A. MacKinnon, and R. A. Snavely, Phys.
Plasmas 8, 542 (2001).2R. A. Snavely, M. H. Key, S. P. Hatchett, T. E. Cowan, M. Roth, T. W.
Phillips, M. A. Stoyer, E. A. Henry, T. C. Sangster, M. S. Singh, S. C.
Wilks, A. MacKinnon, A. Offenberger, D. M. Pennington, K. Yasuike, A.
B. Langdon, B. F. Lasinski, J. Johnson, M. D. Perry, and E. M. Campbell,
Phys. Rev. Lett. 85, 2945 (2000).3T. E. Cowan, J. Fuchs, H. Ruhl, A. Kemp, P. Audebert, M. Roth, R.
Stephens, I. Barton, A. Bla�zevic, E. Brambrink, J. Cobble, J. Fern�andez,
J.-C. Gauthier, M. Geissel, M. Hegelich, J. Kaae, S. Karsch, G. P. Le
Sage, S. Letzring, M. Manclossi, S. Meyroneinc, A. Newkirk, H. P�epin,
and N. Renard-LeGalloudec, Phys. Rev. Lett. 92, 204801 (2004).4J. Fuchs, T. E. Cowan, P. Audebert, H. Ruhl, L. Gremillet, A. Kemp, M.
Allen, A. Bla�zevic, J.-C. Gauthier, M. Geissel, M. Hegelich, S. Karsch, P.
FIG. 8. Example of proton profiles in RCF with a size of
47.5 mm� 47.5 mm. Both shots were on a 17 lm thick gold target and the
distance of the RCF to the source corresponds to 40 mm.
013105-5 Brabetz et al. Phys. Plasmas 22, 013105 (2015)
This article is copyrighted as indicated in the article. Reuse of AIP content is subject to the terms at: http://scitation.aip.org/termsconditions. Downloaded to IP:
176.198.230.1 On: Thu, 15 Jan 2015 08:48:21
Parks, M. Roth, Y. Sentoku, R. Stephens, and E. M. Campbell, Phys. Rev.
Lett. 91, 255002 (2003).5P. Mora, Phys. Rev. Lett. 90, 185002 (2003).6L. Robson, P. T. Simpson, R. J. Clarke, K. W. D. Ledingham, F. Lindau,
O. Lundh, T. McCanny, P. Mora, D. Neely, C.-G. Wahlstrom, M. Zepf,
and P. McKenna, Nat. Phys. 3, 58 (2007).7A. Almomani, M. Droba, U. Ratzinger, and I. Hofmann, Phys. Rev. Spec.
Top. Accel. Beams 15, 051302 (2012).8S. Busold, A. Almomani, V. Bagnoud, W. Barth, S. Bedacht, A. Bla�zevic,
O. Boine-Frankenheim, C. Brabetz, T. Burris-Mog, T. Cowan, O. Deppert,
M. Droba, H. Eickhoff, U. Eisenbarth, K. Harres, G. Hoffmeister, I.
Hofmann, O. J€ackel, R. J€ager, M. Joost, S. Kraft, F. Kroll, M. Kaluza, O.
Kester, Z. Lecz, T. Merz, F. N€urnberg, H. Al-Omari, A. Orzhekhovskaya,
G. Paulus, J. Polz, U. Ratzinger, M. Roth, G. Schaumann, P. Schmidt, U.
Schramm, G. Schreiber, D. Schumacher, T. St€ohlker, A. Tauschwitz, W.
Vinzenz, F. Wagner, S. Yaramyshev, and B. Zielbauer, Numer. Instrum.
Methods Phys. Res., Sect. A 740, 94 (2014).9B. A. Remington, D. Arnett, R. Paul, Drake, and H. Takabe, Science 284,
1488 (1999).10L. Romagnani, J. Fuchs, M. Borghesi, P. Antici, P. Audebert, F.
Ceccherini, T. Cowan, T. Grismayer, S. Kar, A. Macchi, P. Mora, G.
Pretzler, A. Schiavi, T. Toncian, and O. Willi, Phys. Rev. Lett. 95, 195001
(2005).
11S. Bulanov and V. Khoroshkov, Plasma Phys. Rep. 28, 453 (2002).12T. Toncian, M. Borghesi, J. Fuchs, E. d’Humires, P. Antici, P. Audebert,
E. Brambrink, C. A. Cecchetti, A. Pipahl, L. Romagnani, and O. Willi,
Science 312, 410 (2006).13K. Sueda, G. Miyaji, N. Miyanaga, and M. Nakatsuka, Opt. Express 12,
3548 (2004).14C. Brabetz, U. Eisenbarth, O. Kester, T. St€ohlker, T. Cowan, B. Zielbauer,
and V. Bagnoud, OSA Technical Digest (Optical Society of America, San
Jose, California, 2012), p. JTu1K.5.15V. Bagnoud, B. Aurand, A. Bla�zevic, S. Borneis, C. Bruske, B. Ecker, U.
Eisenbarth, J. Fils, A. Frank, E. Gaul, S. Goette, C. Haefner, T. Hahn, K.
Harres, H.-M. Heuck, D. Hochhaus, D. Hoffmann, D. Javorkov�a, H.-J.
Kluge, T. Kuehl, S. Kunzer, M. Kreutz, T. Merz-Mantwill, P. Neumayer,
E. Onkels, D. Reemts, O. Rosmej, M. Roth, T. Stoehlker, A. Tauschwitz,
B. Zielbauer, D. Zimmer, and K. Witte, Appl. Phys. B 100, 137 (2010).16See http://www.ccpp.ac.uk/home/index.html for Extendable PIC Open
Collaboration project.17F. N€urnberg, M. Schollmeier, E. Brambrink, A. Bla�zevic, D. C. Carroll, K.
Flippo, D. C. Gautier, M. Geißel, K. Harres, B. M. Hegelich, O. Lundh, K.
Markey, P. McKenna, D. Neely, J. Schreiber, and M. Roth, Rev. Sci.
Instrum. 80, 033301 (2009).18F. Wagner, C. Jo~ao, J. Fils, T. Gottschall, J. Hein, J. K€orner, J. Limpert,
M. Roth, T. St€ohlker, and V. Bagnoud, Appl. Phys. B 116, 429 (2014).
013105-6 Brabetz et al. Phys. Plasmas 22, 013105 (2015)
This article is copyrighted as indicated in the article. Reuse of AIP content is subject to the terms at: http://scitation.aip.org/termsconditions. Downloaded to IP:
176.198.230.1 On: Thu, 15 Jan 2015 08:48:21
Copyright © 2022 FDOKUMEN


![[ITA] Acceleration methods for PageRank](https://static.fdokumen.com/doc/165x107/6321641780403fa2920cb95c/ita-acceleration-methods-for-pagerank.jpg)