Large volume injection of 1-octanol as sample diluent in reversed phase liquid chromatography:...
10
Journal of Pharmaceutical and Biomedical Analysis 54 (2011) 1163–1172 Contents lists available at ScienceDirect Journal of Pharmaceutical and Biomedical Analysis journal homepage: www.elsevier.com/locate/jpba Large volume injection of 1-octanol as sample diluent in reversed phase liquid chromatography: Application in bioanalysis for assaying of indapamide in whole blood Stefan Udrescu a , Iulia Daniela Sora a , Florin Albu a , Victor David b , Andrei Medvedovici a,b,∗ a Bioanalytical Laboratory, SC Labormed Pharma SA, #44B Th. Pallady Blvd., Bucharest 032266, Romania b University of Bucharest, Faculty of Chemistry, Department of Analytical Chemistry, #90 Panduri Av., Bucharest 050663, Romania article info Article history: Received 22 September 2010 Received in revised form 1 December 2010 Accepted 3 December 2010 Available online 13 December 2010 Keywords: Strong immiscible diluents Large volume injection Indapamide Whole blood LC-ESI/MS 2 abstract Large volume injection of samples in strong diluents immiscible with the mobile phases used in reversed phase liquid chromatography (RPLC) has been recently introduced in practice. In the present work, the potential of the technique has been evaluated for bioanalytical applications. The process consists of the liquid–liquid extraction of indapamide from whole blood into 1-octanol, followed by the direct injection from the organic layer into the LC. Detection was made through negative electrospray ionization (ESI) and tandem mass spectrometry (MS 2 ). The method was developed, validated, and successfully applied to a large number of samples in two bioequivalence studies designed for indapamide 1.5 mg sustained release and 2.5 mg immediate release pharmaceutical formulations. The performance of the analytical method is discussed based on data resulting from the validation procedure and the completion of the bioequivalence studies. © 2010 Elsevier B.V. All rights reserved. 1. Introduction The main purpose of bioanalysis is the determination of selected compounds in biological matrices [1,2]. Two challenging problems relate to the sample preparation step in bioanalytical processes: elimination of the biological matrix to sustain method’s selectivity and enrichment of the target compounds to achieve low quantita- tion limits. Protein precipitation methods and extraction processes are more often used to support the above mentioned goals. Liquid–liquid extraction readily isolates analytes in water immiscible solvents. The sample transfer to the chromatographic system is usually preceded by the removal of the extraction solvent (under gas stream, eventually thermally assisted) and re- dissolution of the dry residue in a solvent compatible with the mobile phase, to further support a large injected volume. Evapo- ration step may add random errors to the experimental results and seriously lengthens the duration of the analytical process. It would be highly preferable to inject large volumes of the organic phase directly to the chromatographic column. However, it is generally accepted that if the injection solvent is stronger than the mobile phase, the chromatographic peaks will be broadened and/or dis- ∗ Corresponding author at: University of Bucharest, Faculty of Chemistry, Depart- ment of Analytical Chemistry, #90 Panduri Av., Bucharest 050663, Romania. E-mail address: [email protected] (A. Medvedovici). torted [3–8]. Some practical solutions to accommodate stronger diluents to large volume injection – reversed phase liquid chro- matography (RPLC) through application of pulsed elution gradients have been proposed [9]. Recent studies demonstrated that band broadening/peak distortion does not occur if the dilution solvent has an increased retention compared to target compounds [10]. This also applies for dilution solvents, which are not miscible with the mobile phase and exhibit enhanced affinity for the station- ary phase compared to target analytes [11,12]. The reduction of the retention factors characterizing the target compounds should be considered, because the highly retained dilution solvent “satu- rates” a proportional amount of the stationary phase [11]. The use of water-immiscible solvents as diluents in RPLC has been recently highlighted for the assay of related impurities in active ingredi- ents [13], antioxidants in pharmaceutical formulations [14] and ginkgolic acid in standardized extracts [15]. Additional phenomena related to similarity/dissimilarity of the viscosities characterizing injection solvent and the chromatographic eluent, namely the vis- cous fingering problem, should also be taken in consideration under these particular conditions [16]. Accordingly, if the injection sol- vent is less viscous than the eluent, chromatographic peaks tend to have fronting. By the opposite, a more viscous injection solvent should be fingered by the backward eluent, leading to peak tailing [17,18]. The basic phenomena relating to large volume injection of diluents non-miscible with the mobile phase, more precisely 0731-7085/$ – see front matter © 2010 Elsevier B.V. All rights reserved. doi:10.1016/j.jpba.2010.12.005
-
Upload
independent -
Category
Documents
-
view
1 -
download
0
Transcript of Large volume injection of 1-octanol as sample diluent in reversed phase liquid chromatography:...

Lcb
Sa
b
a
ARRAA
KSLIWL
1
creata
issdmrsbdap
m
0d
Journal of Pharmaceutical and Biomedical Analysis 54 (2011) 1163–1172
Contents lists available at ScienceDirect
Journal of Pharmaceutical and Biomedical Analysis
journa l homepage: www.e lsev ier .com/ locate / jpba
arge volume injection of 1-octanol as sample diluent in reversed phase liquidhromatography: Application in bioanalysis for assaying of indapamide in wholelood
tefan Udrescua, Iulia Daniela Soraa, Florin Albua, Victor Davidb, Andrei Medvedovici a,b,∗
Bioanalytical Laboratory, SC Labormed Pharma SA, #44B Th. Pallady Blvd., Bucharest 032266, RomaniaUniversity of Bucharest, Faculty of Chemistry, Department of Analytical Chemistry, #90 Panduri Av., Bucharest 050663, Romania
r t i c l e i n f o
rticle history:eceived 22 September 2010eceived in revised form 1 December 2010ccepted 3 December 2010
a b s t r a c t
Large volume injection of samples in strong diluents immiscible with the mobile phases used in reversedphase liquid chromatography (RPLC) has been recently introduced in practice. In the present work, thepotential of the technique has been evaluated for bioanalytical applications. The process consists of theliquid–liquid extraction of indapamide from whole blood into 1-octanol, followed by the direct injection
vailable online 13 December 2010
eywords:trong immiscible diluentsarge volume injectionndapamide
hole blood
from the organic layer into the LC. Detection was made through negative electrospray ionization (ESI)and tandem mass spectrometry (MS2). The method was developed, validated, and successfully appliedto a large number of samples in two bioequivalence studies designed for indapamide 1.5 mg sustainedrelease and 2.5 mg immediate release pharmaceutical formulations. The performance of the analyticalmethod is discussed based on data resulting from the validation procedure and the completion of thebioequivalence studies.
C-ESI/MS2
. Introduction
The main purpose of bioanalysis is the determination of selectedompounds in biological matrices [1,2]. Two challenging problemselate to the sample preparation step in bioanalytical processes:limination of the biological matrix to sustain method’s selectivitynd enrichment of the target compounds to achieve low quantita-ion limits. Protein precipitation methods and extraction processesre more often used to support the above mentioned goals.
Liquid–liquid extraction readily isolates analytes in watermmiscible solvents. The sample transfer to the chromatographicystem is usually preceded by the removal of the extractionolvent (under gas stream, eventually thermally assisted) and re-issolution of the dry residue in a solvent compatible with theobile phase, to further support a large injected volume. Evapo-
ation step may add random errors to the experimental results anderiously lengthens the duration of the analytical process. It would
e highly preferable to inject large volumes of the organic phaseirectly to the chromatographic column. However, it is generallyccepted that if the injection solvent is stronger than the mobilehase, the chromatographic peaks will be broadened and/or dis-∗ Corresponding author at: University of Bucharest, Faculty of Chemistry, Depart-ent of Analytical Chemistry, #90 Panduri Av., Bucharest 050663, Romania.
E-mail address: [email protected] (A. Medvedovici).
731-7085/$ – see front matter © 2010 Elsevier B.V. All rights reserved.oi:10.1016/j.jpba.2010.12.005
© 2010 Elsevier B.V. All rights reserved.
torted [3–8]. Some practical solutions to accommodate strongerdiluents to large volume injection – reversed phase liquid chro-matography (RPLC) through application of pulsed elution gradientshave been proposed [9]. Recent studies demonstrated that bandbroadening/peak distortion does not occur if the dilution solventhas an increased retention compared to target compounds [10].This also applies for dilution solvents, which are not miscible withthe mobile phase and exhibit enhanced affinity for the station-ary phase compared to target analytes [11,12]. The reduction ofthe retention factors characterizing the target compounds shouldbe considered, because the highly retained dilution solvent “satu-rates” a proportional amount of the stationary phase [11]. The useof water-immiscible solvents as diluents in RPLC has been recentlyhighlighted for the assay of related impurities in active ingredi-ents [13], antioxidants in pharmaceutical formulations [14] andginkgolic acid in standardized extracts [15]. Additional phenomenarelated to similarity/dissimilarity of the viscosities characterizinginjection solvent and the chromatographic eluent, namely the vis-cous fingering problem, should also be taken in consideration underthese particular conditions [16]. Accordingly, if the injection sol-vent is less viscous than the eluent, chromatographic peaks tend
to have fronting. By the opposite, a more viscous injection solventshould be fingered by the backward eluent, leading to peak tailing[17,18].The basic phenomena relating to large volume injection ofdiluents non-miscible with the mobile phase, more precisely

1 l and
npai[woam[bloat[poctireptfwdesc(piptececfvavmtapisr
2
2
gm3TRcfy
164 S. Udrescu et al. / Journal of Pharmaceutica
-alkanes, were described earlier by our group [11], as a com-letion of studies carried out with strong miscible diluents (suchs acetonitrile, methanol, i-propyl alcohol and tetrahydrofuran)n 100% aqueous mobile phases, discussed by Loeser and Drumm10]. Some theoretical aspects are further discussed in the presentork, in Section 3. These theoretical assumptions were previ-
usly verified for injection of relative polar compounds suchs isosorbide-2 and -5 nitrates, pentoxifylline, tropicamide andethyl-p-hydroxybenzoate in n-hexane, n-heptane and i-octane
12]. We have also applied this approach for the assay of traces ofutylated hydroxyanisole used as antioxidant in statines formu-
ations [14]. Another interesting application referred to the assayf ginkgolic acids in standardized Ginkgo biloba extracts, whichvoided the tedious sample preparation procedure described inhe compendial specific monograph [15]. Recently, Loeser et al.13] extended the application field through using ethyl acetate, i-ropyl acetate and methyl-i-butylketone as diluents for the assayf polar related impurities in a relatively non-polar active pharma-eutical ingredient during the drug development phase. Althoughhis approach has been used in these applications, its advantagesn being used within the framework of large scale studies, whereobustness is crucial, have not been yet verified. As liquid–liquidxtraction in water immiscible solvents is largely used in sam-le preparation processes related to bioanalysis, we consideredhat the development, validation and application of this approachor an LC/(-)ESI/MS2 method designed for a bioequivalence studyould be specifically interesting. Our choice was oriented toward aifficult biological matrix, the whole blood. Such a matrix, if inad-quately processed, may induce serious interferences in the ionource of the mass spectrometric detector, leading to reduced pre-ision and accuracy. Indapamide, a moderate lipophilic moleculelog Kow = 2.66), was selected as a target compound, owing itsarticularity of binding on the surface of the red cells, induc-
ng the objective need of its assay directly in blood (and not inlasma or serum). The isolation of the compound was achievedhrough liquid–liquid extraction, from whole blood to octanol. Thextraction solvent was 1-octanol because it fulfills all appropriateonditions needed for large volume injection of samples in dilu-nts non-miscible with the mobile phase (in relation to the targetompound indapamide and internal standard in use), as it resultsrom Refs. [10,11] and all argumentation presented later. A largeolume (75 �l) from the organic layer was injected into the LC oper-ted under reverse phase conditions. The method was successfullyalidated and used for two consecutive bioequivalence studies: aultidose bioequivalence study for a sustained release pharmaceu-
ical formulation (coated tablets) containing 1.5 mg of indapamidend a single dose bioequivalence study for an immediate releaseharmaceutical formulation (coated tablets) containing 2.5 mg of
ndapamide. The reliability of the method when used for such largecale applications and the intrinsic quality of the experimentalesults are discussed further in the present work.
. Experimental
.1. Reagents
All solvents (methanol, acetonitrile) were HPLC gradientrade from Merck (Darmstadt, Germany). Water for chro-atography (resistivity minimum 18.2 M� and TOC maximum
0 ppb) was produced within the laboratory by means of a
KA Lab HP 6UV/UF instrument and used during experiments.eference standards were obtained from European Pharma-opoeia (Council of Europe, Strasbourg, France), batch no. 4or indapamide (4-chloro-N-[(2-methyl-2,3-dihydro-1H-indol-1-l]-3-sulphamoylbenzamide) and batch no. 1c for 5-chloro-2-Biomedical Analysis 54 (2011) 1163–1172
methoxy-N-[2-(4-sulphamoyl phenyl)ethyl]benzamide, used asinternal standard (IS). 1-Octanol and formic acid were extra puregrade from Merck. Sodium chloride from Merck was pro-analysisgrade.
2.2. Equipment
Experiments were performed on a system built up from Agilentseries 1200 modules (Agilent Technology, Waldbronn, Germany)as following: degasser (G1322 A); binary pump SL (G1312 B); ther-mostated autosampler (G1367 C); column thermostat (G1330 B).Detection was made through a MS/MS triple quadrupole detector(G2571 A) using an atmospheric pressure electrospray ion source(ESI), operated under negative mode. System control, data acquisi-tion and interpretation were made with the Agilent Mass Huntersoftware version B 01.00 (B48). Alternative diode array detection(DAD) and refractive index detection (RID) modes used to asseseffects arising on large volume injection of the non-miscible dilu-ent were achieved by means of the Agilent 1200 SL series (G1315C)and Agilent 1100 G1362 modules, respectively.
2.3. Chromatographic method
The chromatographic separation was carried out on a ZorbaxSB C18 Rapid Resolution, 50 mm length × 4.6 mm internal diam-eter × 1.8 �m particle size column, thermostated at 40 ◦C. Such ashort column was preferred to increase the method’s throughput(considering the increased number of samples being analyzed).Elution conditions were optimized in order to conserve adequatechromatographic resolution and to control matrix effects arisingwithin the ion source of the mass spectrometer. A PhenomenexC18 guard cartridge (2 mm length, 4 mm internal diameter) wasused to protect the column inlet. The column was operated undergradient conditions, at a flow rate of 0.8 ml/min. The components ofthe mobile phase were aqueous 0.1% formic acid and a mixture ace-tonitrile/methanol in 1/1 volumetric ratio. The following gradientprofile (including the re-equilibration step) was applied:
Time (min) Organic modifier (%) Flow rate (ml/min)
0 5 0.82 45 0.85.5 45 0.85.51 100 0.86.0 100 0.86.50 100 1.26.51 5 1.27.5 5 1.2
The flow rate increase at the end of the gradient is howeverneeded for a faster elimination of 1-octanol from the column. Ahigher flow rate over the whole gradient profile would produceenhanced throughput through shortening the run (without a sensi-ble loss in term of efficiency, as in such conditions, the van Deemterplot for a 1.8 �m particle size stationary phase is almost flat). How-ever, flow rate limitation up to 0.8 ml/min was required by theproper functioning of the ESI source.
The injection volume was 75 �l. An accurate and reproducibleinjection process was obtained only through reducing the dispens-ing speed of the autosampler from the normal speed of 1000 downto 100 �l/min, to compensate for the high viscosity of 1-octanol.Additional column re-equilibration (at 0.8 ml/min and 5% organicmodifier) is obtained during the injection process, which takes
about 2 min.Investigation of effects produced through injection of large vol-umes of octanol in the column was carried out under isocraticelution conditions, consecutively using acetonitrile, methanol ora mixture acetonitrile/methanol (1:1 (v/v)) as organic modifier in
S. Udrescu et al. / Journal of Pharmaceutical and Biomedical Analysis 54 (2011) 1163–1172 1165
F hrouga
taaaclabom
2
oiflmfpiw3sm
2
wa5qart2
the single dose one. The protocols of the bioequivalence stud-
ig. 1. Design of a vial allowing extraction, centrifugation and sample withdrawal tnother vial of the organic layer after centrifugation.
he mobile phase. A solution of 0.1% formic acid was used as thequeous component. The flow rate of the mobile phase was sett 0.8 ml/min. Injection volumes of 1, 10, 50, 75 and 100 �l werepplied. The concentrations of the tested solutions in octanol werehosen in order to produce a loading of 1 �g amount from each ana-yte in the column. Resulting chromatograms were UV monitoredt 235 nm. Retention and peak shapes were evaluated. To asses theehavior of the diluent in the chromatographic column, injectionsf different volumes (1, 10, 25, 50, 75 and 100 �l) of 1-octanol wereonitored with a RID.
.4. MS detection
A MRM scan type was performed under negative polarity. Theperational parameters of the ESI source were the following: dry-ng gas temperature 350 ◦C; pressure of the nebulising gas 60 psi;ow of the drying gas 13 l/min; capillary potential 4000 V. The frag-entor energy was set to 150 V. Collision energy of 25 V was used
or both compounds. The MRM transitions used for quantitativeurposes (quantifier) were the following: m/z 364 to m/z 190 for
ndapamide, and m/z 367 to m/z 170 for IS. Qualifier transitionsere the following: m/z 364 to m/z 132 for indapamide, and m/z
67 to m/z 127 for IS. The column effluent is diverted from the ionource (by means of a six ports valve) from minutes 0 to 4 and afterinute 6, respectively.
.5. Sample preparation
Spiked blank blood samples used during method validationere vortexed for homogenization at least 12 h at 4 ◦C. Whole blood
liquots of 0.5 ml were extracted with 0.75 ml 1-octanol containing0 ng/ml IS. For blood samples resulting from the single dose bioe-
uivalence study made for the 2.5 mg indapamide coated tablets,dilution by a factor of 3.33 (v/v) with 0.9% aqueous sodium chlo-ide solution was required. After 15 min of vortexing (2000 rpm),he Eppendorf tubes were centrifuged for 5 min at 9000 × g and5 ◦C. A portion of about 0.6 ml from the supernatant was trans-
h controlling the depth of the injection needle, making unnecessary the transfer to
ferred in the injection vial. A volume of 75 �l was thus injected inthe chromatographic column.
To reduce sample manipulation, the extraction, centrifugation,and injection of sample into the LC were performed by using asingle vial. After centrifugation one withdraws an aliquot volumefrom the octanol upper layer while carefully controlling the depthof the needle when inserted into the vial. Thus the transfer of thesupernatant to a new vial is omitted and sample manipulation isreduced, ultimately resulting in the elimination of potential errors.A special inner geometry of the vial used for extraction, centrifu-gation and injection makes possible the withdrawal of the octanollayer, and minimizes the risk of accidental blood carry over, as illus-trated in Fig. 1. Experimentally, only few vials have been in-housecrafted from polypropylene material to verify the previous assump-tions. Such a design could successfully lead to a minimization of themanipulation of the sample, making sample preparation step moresimple and straightforward.
2.6. Methodology of the bioequivalence studies
The analytical method was applied for assessment of two bioe-quivalence studies: a multidose one, referring to controlled releaseformulations (coated tablets) containing 1.5 mg of indapamide,and a single dose study for immediate release formulations con-taining 2.5 mg of the active ingredient. The multidose study (twoperiods, cross-over, controlled, randomized, fasting conditions)enrolled 25 healthy volunteers, while the single dose one (twoperiods, cross-over, controlled, randomized, fasting conditions) 24healthy volunteers. 17 sampling times (including the pre-dosesampling) were made during the multidose study, and 15 for
ies were formally accepted by the evaluation department of theRomanian National Medicines Agency and received the approval ofthe National Ethics Committee. Pharmacokinetic parameters weredetermined by means of the KineticaTM software (version 4.4.1)from Thermo Electron Corporation, U.S.A.

1 l and Biomedical Analysis 54 (2011) 1163–1172
3
cmsctfitats
scisppf(cs
A
A
S
wr
htaipmqTparAcepth
k
sepi
arTpT
166 S. Udrescu et al. / Journal of Pharmaceutica
. Results and discussion
Good chromatographic efficiency with acceptable peak shapesan be achieved by injecting large volumes of diluents non-iscible with the mobile phase if the following conditions are
imultaneously fulfilled [11,13]: (i) the diluent has an increasedhromatographic retention compared to the target analytes; (ii)he solubility of the diluent in the mobile phase is low enough toorce the saturation of the stationary phase in the column head,mmediately after injection; (iii) elimination of the diluent fromhe column before another injection. On the other hand, a specialttention should also be paid to the difference of viscosity betweenhe sample diluent and the mobile phase, potentially inducing peakymmetry distortion [17].
Additionally, changes in the chromatographic resolution mea-ured between analytes should be evaluated, as the “apparent”olumn length is proportionally reduced with the increase of thenjected volume (and consequently, a specific amount from thetationary phase is blocked through saturation with diluent). Therinciple of this approach is based on partition equilibriums takinglace immediately after sample injection (Vinj). The analyte (A) dif-uses out of the injection plug (the diluent S) in the mobile phasem), according to equilibrium (1). The analyte and the diluent areompeting for adsorption to the hydrocarbonaceous ligand in thetationary phase (L), according to following processes (2) and (3):
S � Am; (1)
m + L � A · L; KA = [A · L]st
[A]m[L]st(2)
m + L � S · L; KS = [S · L]st
[S]m[L]st(3)
here st and m indexes refer to the stationary and mobile phases,espectively.
Due to the high amount of S loaded in the column and its higherydrophobic character compared to A, equilibrium (1) is shiftedoward right and equilibrium (2) toward left, as long as the entiremount of the diluent is adsorbed onto L. When the diluent hasncreased viscosity than the mobile phase, the low viscosity mobilehase penetrates into the viscous plug, sending “fingers” of greaterobility ahead of the normal position of the front. As a conse-
uence, typical “waves” at the rear of the peaks may be observed.he process was exhaustively described in [18]. In this way, aortion from the stationary phase (�V) in the head of column isvailable only to the diluent. �V is proportional to Vinj, according toelation �V = �Vinj, where � is a constant. Consequently, compoundparticipates to the retention mechanism in the chromatographic
olumn based on a remaining available stationary phase volumequal to Vs − �Vinj (considering the initial volume of the stationaryhase as Vs). Based on these assumptions, the dependence betweenhe retention factor of compound A (kA) and Vinj, for a mobile phaseaving the volume Vm, is illustrated by the following relationship:
A = KA Vs
Vm− �
KA
VmVinj (4)
On the other hand, the sample diluent is also used as extractionolvent during the sample preparation step. Obviously, consistentxtraction yields are necessary. The selectivity of the extractionrocess is also important, as the coextracted matrix may affect
onization yields of the target compounds in the MS source.By choosing 1-octanol as extraction solvent and, consequently,
s diluent for injected samples, the condition of an increasedetention of the diluent compared to target analytes was fulfilled.he reversed phase mechanism achieves the separation of com-ounds according to the increase of their hydrophobic character.herefore, the values of log P (or log Kow, representing the deci-
Fig. 2. Reduction of the retention times of the target compounds with the increaseof the injected volume (the sample diluent is 1-octanol; working conditions aredescribed in Section 2 and further discussed in the text).
mal logarithm of the partition coefficient of a compound betweenn-octanol and water) should be considered as relevant for theelution order. In this particular case, the calculated log Kow val-ues by means of the fragment theory [19] indicate the followingelution order: IS (log Kow = 2.51), indapamide (log Kow = 2.66) andoctanol (log Kow = 2.81; the shake-flask experimental value of 3.0 isalso available). However, when formic acid is added to the mobilephase, the hydrophobicity descriptor governing the retention pro-cess becomes log D, which considers all species of the analyteinvolved into partition between mobile and stationary phases. Inacidic media, due to the protonation of the tertiary amino moietyfrom the structure of indapamide, the log D value is lower than itslog Kow, which may explain the observed elution order.
Optimization of the chromatographic method was based onthe study of retention and peak symmetry obtained under iso-cratic elution conditions. Acetonitrile, methanol and the 1/1 (v/v)mixture between acetonitrile and methanol were successively con-sidered as organic modifiers in the mobile phase. The aqueouscomponent was 0.1% formic acid and the flow rate was 0.8 ml/min.Isocratic experiments were made successively for 25% acetoni-trile, or 35% methanol or 30% acetonitrile/methanol mixture inthe mobile phase. In each of the elution conditions, 1, 10, 50, 75and 100 �l volumes from the solutions of the target compoundsin octanol and the pure diluent were injected. The amount of eachanalyte loaded to column, regardless of the injected volume, was1 �g. Separations were UV monitored, at 234 nm (in case of ana-lyte’s solutions) and through RID (for the diluent only). Betweensuccessive chromatograms, after injection of solutions of targetcompounds, the column was flushed with 100% organic solvent for5 min, and then re-equilibrated at the mobile phase composition foranother 5 min (for elimination of the octanol plug). According to ourearlier assumptions (see Eq. (3)) and to experiments described in[11,12], retention factors linearly decrease with the increase of theinjected volume, as illustrated in Fig. 2. Negative numbers in Fig. 2are the slopes (b) of the linear regression functions k = a + bVinj.
In the case of an asymmetrical and/or a distortioned profile, theretention time was considered as corresponding to the maximumof the registered peak. For a better insight on the chromatographicresults, Table 1 enlists peak characteristics of the target analytes
S. Udrescu et al. / Journal of Pharmaceutical and Biomedical Analysis 54 (2011) 1163–1172 1167
Table 1Peak characteristics for studied analytes under different elution conditions and different injection volumes in 1-octanol.
Elution conditions Peak parameters Injected volume (�l)
1 10 50 75 100
Indapamide IS Indapamide IS Indapamide IS Indapamide IS Indapamide IS
25% ACN
Peak width (min) 0.206 0.278 0.269 0.305 0.241 0.459 0.235 0.644 0.246 0.591Symmetry (10% height) 1.11 1.07 1.50 1.17 6.44 2.06 2.73 1.78 1.20 2.72Symmetry (integrator) 0.92 0.94 0.71 0.89 0.25 0.42 0.53 0.52 0.9 0.33Skew 0.22 0.20 0.77 0.31 0.67 0.45 0.95 0.56 0.01 0.29
35% MeOH
Peak width (min) 0.19 0.316 0.184 0.279 0.25 0.256 0.165 0.25 0.138 0.209Symmetry (10% height) 1.17 1.13 1.28 1.08 3.14 1.19 5.63 1.68 7.87 2.41Symmetry (integrator) 0.88 0.93 0.82 0.96 0.37 0.88 0.26 0.67 0.22 0.53Skew 0.55 0.31 0.81 0.26 0.64 0.37 0.65 0.59 0.67 0.75
15% ACN + 15% MeOH
Peak width (min) 0.238 0.376 0.233 0.351 0.333 0.296 0.216 0.286 0.191 0.255Symmetry (10% height) 1.13 1.10 1.16 1.05 2.57 1.11 4.52 1.36 5.68 1.78Symmetry (integrator) 0.91 0.94 0.89 0.96 0.42 0.92 0.30 0.78 0.27 0.64Skew 0.20 0.14 0.48 0.11 0.53 0.17 0.64 0.35 0.65 0.50
imcbfmceawm
aliatrbdir
mdapctti
tv7
mvpdpa(da
Gradient
Peak width (min) 0.054 0.065 0.059Symmetry (10% height) 1.23 1.17 1.33Symmetry (integrator) 0.84 0.87 0.78Skew 0.60 0.45 0.10
n the above mentioned elution conditions as well as in the opti-ized elution gradient (described in Section 2). For a meaningful
haracterization of peak shapes, the following characteristics haveeen considered: the peak width at half height; the asymmetryactor computed at 10% from the peak height; the integrator asym-
etry factor (according to USP, 〈6 2 1〉 general chapter); the skew,alculated from the third central statistical moment (an alternativexpression of peak asymmetry, as positive values indicates tailingnd negative values, fronting). Experimental peak data treatmentas made using the commercially available peak performanceacro from Agilent.In all cases, injection of 10 �l volumes from octanol solutions of
nalytes produces fair symmetry and undistorted peak shapes. Forarger injection volumes, distortion effects may affect the first elut-ng peak (indapamide) or both peaks, as shown in Fig. 3A (examplesre given for 75 �l injected volume). RID monitoring of octanol elu-ion from column (Fig. 3B) unambiguously demonstrates that theetention factor kSF of the solvent front, as defined in [10], is placedeyond the elution interval of the target compounds. The first con-ition to achieve large volume injection of non-miscible diluents
s thus fulfilled in the case of octanol (diluent must have increasedetention compared to target compounds).
However, in some cases, profiles of both peaks in the chro-atogram are seriously distorted, such phenomena being produced
ue to the relative miscibility of the diluent with the mobile phasend a subsequent local inadequate saturation of the stationaryhase with octanol, representing an infringement of the secondondition exposed at the beginning of this section (the solubility ofhe diluent in the mobile phase is low enough to force the satura-ion of the stationary phase in the column head, immediately afternjection).
When only the first eluting peak is affected, it makes more senseo involve viscous fingering effects as responsible (it is to note thatiscosities at 25 ◦C for octanol, methanol, acetonitrile and water are.21, 0.54, 0.38 and 1.0 cP, respectively [20]).
From functional dependences in Fig. 2, we may observe that theost important decrease of the retention factors with the injected
olume was obtained when the organic modifier in the mobilehase is the mixture acetonitrile/methanol, suggesting that theiluent (octanol) better saturates a larger bulk of the stationary
hase. Consequently, a gradient profile was applied, starting withn increased content of the aqueous component in the mobile phase95% – see conditions in Section 2). As observable in Fig. 3, the gra-ient successfully eliminates the distortion of the indapamide peaknd provides increased apparent efficiency.0.071 0.049 0.056 0.045 0.046 0.037 0.0441.28 1.33 1.23 1.43 1.15 2.63 1.180.81 0.78 0.84 0.76 0.86 0.62 0.840.42 1.05 0.42 1.00 0.36 1.07 0.37
Elution of both analytes in a narrow retention window of4.8–5.4 min may produce, in some way, the equalization of theresidual matrix profiles reaching ion source simultaneously to thetarget compounds. Obviously, the effect has low efficiency com-pared to the case of using isotope labeled IS (when co-elutionbetween analyte and IS is achieved), when a rigorously similarpattern of residual matrix occurs during ionization, but majordiscrepancies between the ionization behavior of the target com-pounds is somehow avoided.
The increased water content in the mobile phase at the begin-ning of the chromatographic run forces the saturation of thestationary phase with octanol in the head of column. The gra-dient profile (composition and flow rate, as described in Section2) applied after elution of the target compounds accelerates theelution of the octanol plug from the column, and meanwhile, isfavorable to elution of the residual matrix brought by the samplesprepared from human blood.
The analytical method was validated according to the guidelinesin force [21,22]. The general quality characteristics of the validatedmethod are enlisted in Table 2. The LLOQ of the method was foundat 0.5 ng/ml concentration level and the linearity interval of theresponse function ranges up to 100 ng/ml. The response functionfitting model was the 1/x2 weighted linear regression (R2 = 0.9918).Precision of the experimental validation data was placed below ofthe 15% RSD threshold, as well as accuracy, expressed as %bias andsituated within the ±15% interval (for the LLOQ level, acceptedinterval is ±20%). The determined LLOQ level is lower comparedto data reported earlier [23]. However, our previous experimentalapproach for determination of indapamide in plasma was basedon liquid–liquid extraction in t-butyl-methyl ether, using a largesample volume (1 ml) and needing organic solvent evaporation anda four folds sample concentration. It is not the main purpose ofthis work to present a detailed approach relating to the validationstep, but only to highlight some specific features relating with theextraction of the target compounds and the direct large volumeinjection of the diluent non-miscible with the mobile phase intothe chromatographic column. A special focus will be made on theintrinsic quality of the analytical results obtained after applicationof the method on incurred samples resulting from two differentbioequivalence studies (different designs, different strengths of the
pharmaceutical formulations considered for bioequivalence).Selectivity, recovery and matrix effects merit a distinct discus-sion, as these characteristics are strongly related to the method’sintrinsic quality. The recovery over the entire analytical processand the influence of the residual co-extracted blood matrix were

1168 S. Udrescu et al. / Journal of Pharmaceutical and Biomedical Analysis 54 (2011) 1163–1172
F n injea pikedc
aoi5
TQ
ig. 3. Retention behavior of analytes and related peak distortion effects appearing ond elution conditions (A). The MS/MS trace obtained for an indapamide blood shromatographic column (B).
ssessed through comparison of results obtained during analysisf the following spiked solutions: (set 1) solutions of indapamiden octanol having concentrations of 1.5, 7.5, 35 and 75 ng/ml and0 ng/ml IS; (set 2) solutions of indapamide in bulk octanol previ-
able 2uality characteristics of the analytical method, as resulting from the validation procedu
Stage Characteristics
LinearityLOD = 0.3 ng/ml (S/N = 3); LLOQ = 0.5 ng/ml (S/N ≥ 5);RSD% ∈ [4.4/9.7]%; %bias ∈ [−7.4/8.0]%; Response fun
PrecisionQC levels = 1.5/7.5/35/75 ng/ml; Repeatability: n = 10Repeatability: RSD% ∈ [0.8/1.3]%; %bias ∈ [−7.9/8.1]%Intermediate precision: RSD% ∈ [7.3/8.5]%; %bias ∈ [−
Stability
Freeze/thaw: n = 5; Conc. levels = 4 (as per precision)Long term (−40 ◦C) = 3 months; n = 4; Conc. levels = 4Short term (25 ◦C) = 8 h; n = 5; Conc. levels = 4 (as perPost-preparative (25 ◦C) = 48 h; n = 6; Conc. levels = 4IS (stock solution; 4 ◦C) = 30 days; n = 12; RSD% (peak
Dilution Integrity
Dilution ratios = 1/10; 1/5; 1/2; Dilution fluid: a) who1/10: whole blood; mean RSD% = 5.4%; mean %bias =1/5: whole blood; mean RSD% = 2.8%; mean %bias = 51/2: whole blood; mean RSD% = 0.1%; mean %bias = −
ction of samples dissolved in octanol, in relation with the mobile phase compositionsample at LLOQ (A-detail). The elution behavior of the octanol plug through the
ously used to extract a blank blood sample having concentrationsof 1.5, 7.5, 35 and 75 ng/ml and 50 ng/ml IS; (set 3) solutions ofindapamide spiked in aqueous 0.9% sodium chloride having con-centrations of 1.5, 7.5, 35 and 75 ng/ml and 50 ng/ml IS; (set 4)
re.
ULOQ = 100 ng/ml; Conc. levels = 0.5/1/5/10/25/50/80 ng/ml; samples/level: n = 6ction = linear, weighted 1/x2
; Intermediate precision: n = 6
3.0/3.3]%; RSD% ∈ [0.7/3.5]%; %bias ∈ [−8.0/12.5]%(as per precision); RSD% ∈ [0.9/2.2]%; %bias ∈ [−14.3/12.8]%precision); RSD% ∈ [0.8/3.9]%; %bias ∈ [−8/14.6]%(as per precision); RSD% ∈ [0.5/4.9]%; %bias ∈ [−9.6/12.8]%area) = 7.8%le blood; b) aqueous 0.9% NaCl; samples per case: n = 3
13.9%; aq. 0.9% NaCl; mean RSD% = 0.8%; mean %bias = 7.9%;.8%; aq. 0.9% NaCl; mean RSD% = 0.8%; mean %bias = 2.7%;2.9%; aq. 0.9% NaCl; mean RSD% = 2.6%; mean %bias = −5.9%;

S. Udrescu et al. / Journal of Pharmaceutical and Biomedical Analysis 54 (2011) 1163–1172 1169
Table 3Evaluation of the octanol/blood extraction yield and effect of the residual co-extracted blood matrix on the MS response of target compounds.
Peak areas
Indapamide IS
1.5 ng/ml 7.5 ng/ml 35 ng/ml 75 ng/ml 50 ng/ml
Set 1121,787 696,629 2,883,654 5,569,383 1,527,922RSD = 1.9%, n = 6 RSD = 0.7%, n = 6 RSD = 0.3%, n = 6 RSD = 0.7%, n = 6 RSD = 1.1%, n = 24
Set 2122,764 662,025 2,775,036 5,654,088 1,155,967RSD = 1.7%, n = 6 RSD = 0.6%, n = 6 RSD = 0.9%, n = 6 RSD = 0.7%, n = 6 RSD = 0.9%, n = 24
Set 3124,920 680,971 2,867,846 5,532,825 1,585,842RSD = 4.0%, n = 6 RSD = 1.2%, n = 6 RSD = 1.6%, n = 6 RSD = 0.9%, n = 6 RSD = 0.5%, n = 24
Set 494,997 540,420 2,375,364 5,004,375 1,199,021RSD = 1.4%, n = 6 RSD = 0.7%, n = 6 RSD = 0.7%, n = 6 RSD = 0.5%, n = 6 RSD = 1.2%, n = 24
Residual co-extracted matrixeffects (S2 × 100/S1)
100.8% 95.0% 96.2% 101.5%75.7%98.4% (RSD = 3.3%)
sts(iCseemitpftep
0fiibtgs
mfw5nImi
pbommcfbt
s
During analysis of incurred samples, the working sequence con-sisted in a calibration set (8 concentration levels), a quality control(QC) set (4 concentration levels, two replicates per concentrationlevel, one series from replicates is analyzed immediately after cal-ibration and the second one before the end of the sequence) and
Octanol/aqueous 0.9% NaClextraction yield (S3 × 100/S1)
102.6% 97.8%99.8% (RSD = 2%)
Octanol/blood extractionyield (S4 × 100/S2)
77.4% 81.6%83.3% (RSD = 5.8%)
olutions of indapamide spiked in blank blood having concentra-ions of 1.5, 7.5, 35 and 75 ng/ml and 50 ng/ml IS. Solutions fromets 1 and 2 were directly injected in the chromatographic column75 �l), while samples from sets 3 and 4 were processed accord-ng to the sample preparation procedure described in Section 2.omparison of peak areas for indapamide and IS determined inolutions from sets 2 and 1 (expressed as percentage) shows theffects of the residual co-extracted matrix, but not the effects ofxtraction. Comparison of peak areas for indapamide and IS deter-ined in solutions from sets 3 and 1 (expressed as percentage)
llustrates the extraction yields from aqueous 0.9% sodium chlorideo octanol (no residual co-extracted matrix effects appear). Com-arison of peak areas for indapamide and IS determined in solutionsrom sets 4 and 2 (expressed as percentage) illustrates the extrac-ion yields from blood to octanol (the residual co-extracted matrixffects equally appear in both sets). Results of the experiments areresented in Table 3.
Both analytes are almost quantitatively extracted from aqueous.9% sodium chloride in octanol. Indapamide is about 80% extractedrom whole blood in octanol and the co-extracted residual matrixs practically not affecting its ionization yield in MS source. Thenternal standard is quantitatively extracted from whole blood,ut suppression of ionization arises within the MS source inhe presence of the residual co-extracted matrix. However, thelobal recoveries of the target analyte and IS are substantiallyimilar.
Matrix factors (MFs) for the target compound and IS were deter-ined according to the protocol described in the latest guideline in
orce [22], including hyperlipaemic blood sample. Determinationsere made at spiked concentrations of 1.5 ng/ml indapamide and
0 ng/ml IS. MF for indapamide (different blank blood samples = 6,= 3 for each type) was found 0.77 (with a RSD% of 8.1%). MF for
S (n = 18) was found 0.79 (with a RSD% of 7.1%). Accordingly, theean normalized MF was 0.98 (with a RSD% of 6.7%, with variation
nterval between 0.94 and 1.1).Residual peak areas integrated at the retention time of inda-
amide in the chromatograms of the six different batches of thelank blood samples being processed (including the hyperlipaemicne) represented 1.5–7.9% from the peak areas integrated in chro-atograms of spiked samples at the LLOQ level in the respectiveatrixes. The residual peak areas integrated in the chromatograms
orresponding to the incurred samples collected pre-dose (blanks)
rom each of the clinical phases and from both studies are placedelow the method LOD level, as illustrated in Fig. 4. The two excep-ions (from 98 samples) are still placed below LLOQ.Results obtained during validation, under the dilution integritytage (see Table 1), are of a special interest. One can observe that
99.5% 99.3%103.8%
85.6% 88.5%103.7%
blood dilution with aqueous 0.9% NaCl (isotonic solution) may beapplied without altering the resulting quantitative data. This fea-ture is particularly interesting, if considering the limited availabilityof blank blood samples belonging to each volunteer participatingto the clinical trials necessary for sample dilution when deter-mined nominal concentrations were exceeding the linearity range.Many of the samples resulting from the single dose bioequivalencestudy of 2.5 mg indapamide immediate release formulations sensi-bly overcome the method’s ULOQ. Consequently, the decision wastaken to apply a dilution by a factor of 3.33 for all incurred samples,according to findings made under the dilution integrity study. Dilu-tion was made with aqueous isotonic solution, without affectingprecision and accuracy of the experimental results.
Some carry over effects could be observed on the mass transitionof indapamide (see in Fig. 3A the MS trace shown as a detail). How-ever, the extent of the carry over effect, compared to the responseobtained at the LLOQ concentration level for indapamide, did notrequire additional measures for its elimination.
Fig. 4. Residual responses at the retention time of indapamide (according to itsspecific mass transition) observed in samples withdrawn pre-dose administrationfrom volunteers enrolled in the bioequivalence studies, during both phases.
1170 S. Udrescu et al. / Journal of Pharmaceutical and Biomedical Analysis 54 (2011) 1163–1172
F sociats mulatf ethod
io
smittat
2cltnca
taqprfiw4itprittrsto
samples were reanalyzed, while for the single dose one 96 samples.Data from incurred sample reanalysis were treated according to theBland–Altman approach [24,25]. According to the Bland–Altmanapproach, 33% from the total number of the reanalyzed incurredsamples may be placed out-side the accuracy interval of ±20%.
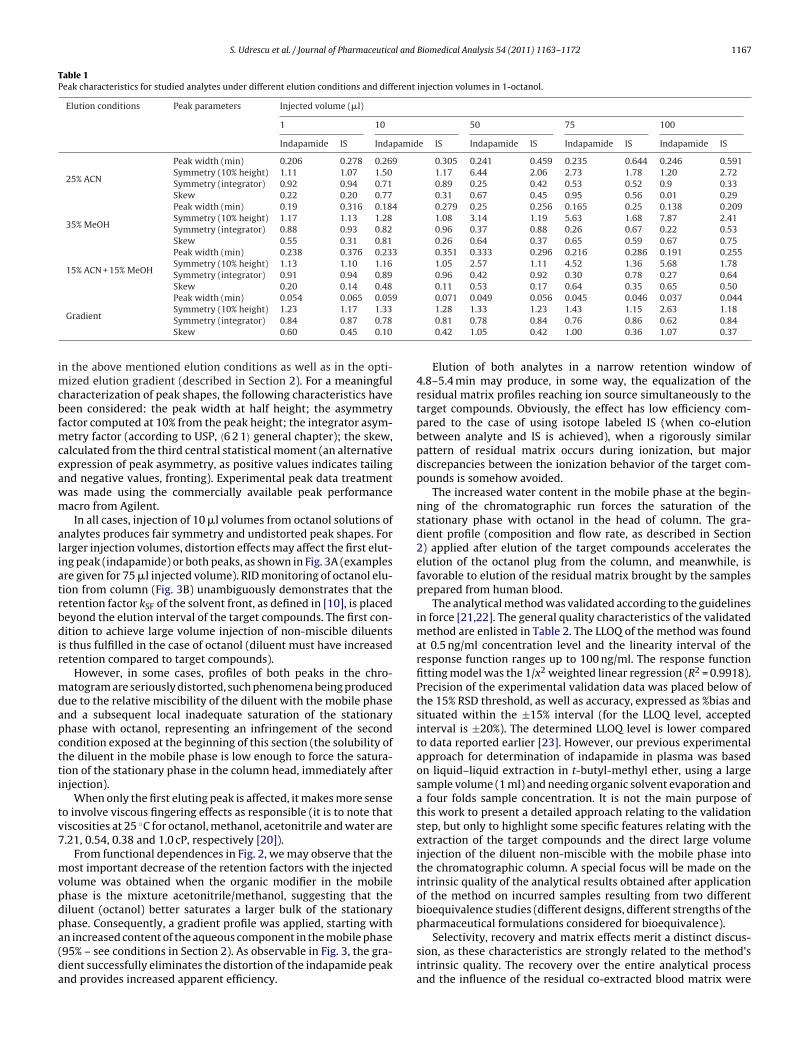
ig. 5. Variation of the slopes of the regressions calculated from calibration sets astudies (the multidose study designed for 1.5 mg indapamide controlled release forormulations), illustrating the reproducibility features of the proposed analytical m
ncurred samples from one volunteer, introduced in the increasedrder of the sampling time for both phases.
The slopes of the regressions characterizing the calibrationets processed during all working sequences resulting from theultidose 1.5 mg indapamide study and the single dose 2.5 mg
ndapamide one are plotted together in Fig. 5. Data are presented inhe sequential order, noting that the multidose study was precedinghe single dose one. Presented data sustain the reproducibility char-cteristics of the proposed analytical method over a large period ofime and a great number of analyzed samples.
Only one QC sample (at the highest concentration level) from00 (0.5%) was placed outside the ±15% accuracy interval duringompletion of the multidose study. Eleven QC samples (10 at theowest concentration level) from 192 (5.73%) were placed outsidehe accuracy limit during completion of the single dose study. Inone of the working sequences, two QC samples at the same con-entration level were simultaneously placed outside the allowedccuracy interval.
The relative standard deviations computed for the retentionime values of indapamide and IS peaks in chromatograms ofll incurred samples (n = 1668) analyzed during the two bioe-uivalence studies on a single chromatographic column (havingreviously supported the validation stage) are 1.48 and 1.52%,espectively (4.95 ± 0.073 min for indapamide and 5.25 ± 0.079 minor IS). During the multidose study, the mean peak area of ISn all incurred samples was 399,871 ± 101,376 (RSD% = 25.4%),
hile during the single dose study, the mean peak area was31,282 ± 53,671 (RSD% = 12.4%). Sample dilution with aqueous
sotonic solution improved stability of the MS response. It iso mention that the MS source was not cleaned during com-letion of a whole bioequivalence study. The mean normalizedesponse (the normalized responses were calculated by divid-ng the ratios between the analyte and IS peak areas withhe calculated concentration values resulting from interpola-
ion in the corresponding calibrations, and roughly illustrate theesponse per concentration unit) determined for all incurredamples in a study was: 0.0294 ± 0.005 (RSD% = 17%) for the mul-idose study and 0.0296 ± 0.0024 (RSD% = 8.0%) for the single dosene.ed to the working sequences processed during completion of the two bioanalyticalions and the single dose study designed for 2.5 mg indapamide immediate release.
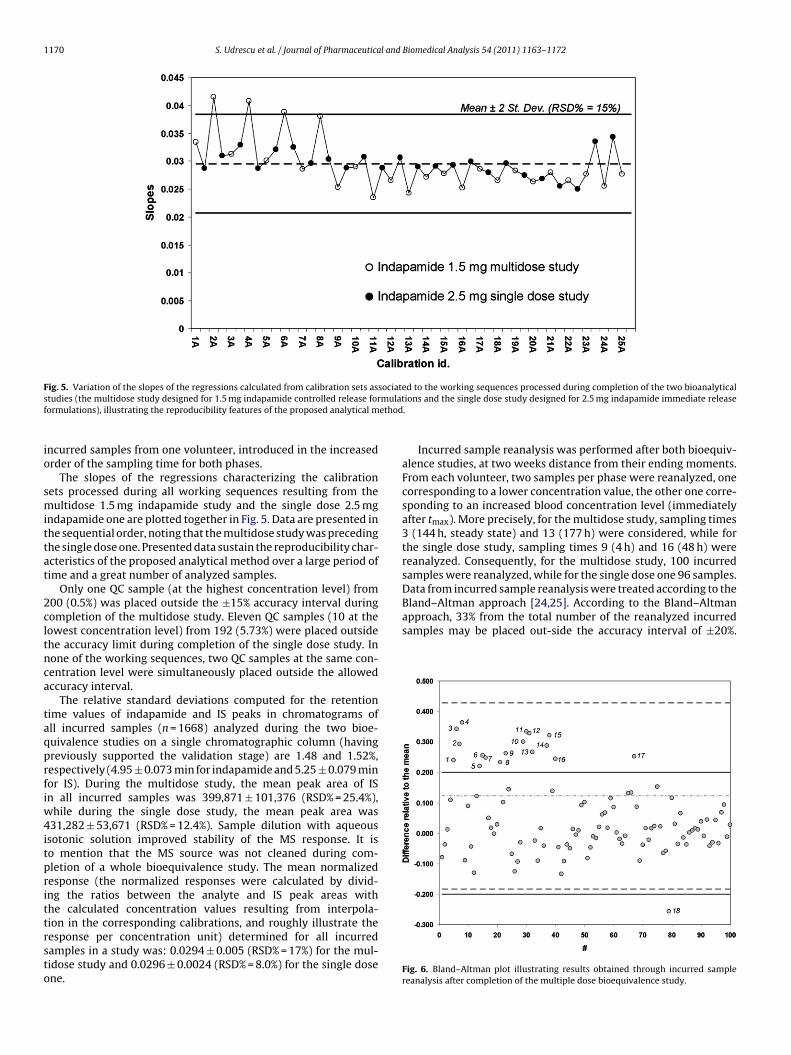
Incurred sample reanalysis was performed after both bioequiv-alence studies, at two weeks distance from their ending moments.From each volunteer, two samples per phase were reanalyzed, onecorresponding to a lower concentration value, the other one corre-sponding to an increased blood concentration level (immediatelyafter tmax). More precisely, for the multidose study, sampling times3 (144 h, steady state) and 13 (177 h) were considered, while forthe single dose study, sampling times 9 (4 h) and 16 (48 h) werereanalyzed. Consequently, for the multidose study, 100 incurred
Fig. 6. Bland–Altman plot illustrating results obtained through incurred samplereanalysis after completion of the multiple dose bioequivalence study.

S. Udrescu et al. / Journal of Pharmaceutical and Biomedical Analysis 54 (2011) 1163–1172 1171
Table 4Comparison between the principal pharmacokinetic parameters determined during the single dose bioequivalence study of 2.5 mg indapamide immediate release pharma-ceutical formulations under fasting administration conditions, and data from literature.
Reference Present work [26] [27]
Matrix Blood Blood BloodExtraction solvent 1-Octanol t-Butyl methyl ether Diethyl etherSample preparation Direct large volume injection
of the extractEvaporation to dryness, residuedissolution in the mobile phase
Evaporation to dryness, dissolutionof the residue in the mobile phase
LLOQ 0.5 ng/ml 5 ng/ml 10 ng/mlAdministered dose 2.5 mg 2.5 mg 5 mgPharmaceutical formulation Reference Reference Reference
Pharmacokinetic parameters (mean ± SD)
Cmax (ng/ml) 154.5 ± 28 135 ± 24 358 ± 43AUClast (ng/ml h) 2964 ± 860 2027 ± 339 6290 ± 899
RtF
tvfaicbaae
dorpmutgts
4
papwomowtitrbMaoos
[[
[[[
[
AUCtotal (ng/ml h) 3222 ± 818
esults obtained after reanalysis of incurred samples selected fromhe multidose bioanalytical study are graphically illustrated inig. 6.
For the multidose study, 18 reanalyzed incurred samples from aotal of 100 produced results out-side the allowed accuracy inter-al. For the single dose study, 21 reanalyzed incurred samplesrom a total of 96 (21.9%) produced results falling out the acceptedccuracy limits. Apparently, results obtained through reanalyzingncurred samples from the single dose study are somehow worstompared to the multiple dose study. However, a justification maye advanced, as each of the experimental results was corrected by3.33 multiplication factor (compensating sample dilution with
n isotonic solution). This operation leads also to amplification ofxperimental errors by the same factor.
The pharmacokinetic parameters determined by means of theata resulting from application of the proposed analytical methodn the incurred samples were compared to similar values recentlyeported in literature [26,27]. The available literature data refers toharmacokinetic parameters produced by 2.5 mg indapamide for-ulations, during single dose bioequivalence studies carried out
nder fasting administration conditions made on Chinese popula-ion. Comparison is given in Table 4. Pharmacokinetic data are inood agreement, which sustain the intrinsic quality attributes ofhe proposed analytical method based on large volume injection ofamples using octanol as diluent.
. Conclusions
The approach of large volume injection of octanol as sam-le diluent non-miscible with the mobile phase was successfullypplied in large scale routine procedures in bioanalysis. Its princi-le was demonstrated by making extraction of indapamide fromhole blood samples in octanol, followed by the direct injection
f a large volume from the organic layer directly to the chro-atographic column. A specific geometry of the vial to avoid the
rganic phase transfer after extraction and centrifugation stepsas also proposed. The experimental approach sensibly shortens
he duration of the analysis and readily enhances on the sensitiv-ty of the assay. Despite the complex composition of the blood,he residual matrix transferred in the chromatographic column iseduced. Further elimination of residual matrix effects is possibley strictly controlling the admission of the column effluent in the
S source (through the divert valve placed before the ion source)nd through application of fast gradient elution profile at the endf each run (simultaneously used to achieve elimination of the bulkf the diluent from the stationary phase). The column life time isignificantly increased (validation and two successive bioequiva-
[
[[
[
2161 ± 383 7529 ± 1323
lence studies have been performed on a single column, meaningaround 3000 injected samples). The quality attributes of the ana-lytical method were evidenced by means of the results obtainedduring validation and analysis/reanalysis of the incurred samples.The proposed method is accurate, precise and rugged. Pharmacoki-netic parameters calculated from the single dose bioequivalencestudy achieved for 2.5 mg indapamide immediate release formula-tions were compared with similar data from literature and they arein good agreement, which additionally confirm the quality of theproposed analytical method.
The present approach, as an extension of the basic princi-ple relating to large volume injection of non-miscible diluentsin the bioanalytical field should only be considered as a modelstudy. Although the present work illustrates an application forindapamide (as target compound) and 1-octanol (as extractingagent and non-miscible sample diluent), when considered togetherwith the previously published results [12–15] make us confidentabout the spreading potential of this analytical technique to otheranalytes and diluents. Further work will be undoubtedly neces-sary to generalize the statements and to diversify the applicationfields.
References
[1] H. Hill, Bioanalysis 1 (2009) 3–7.[2] H. Hill, Bioanalysis 1 (2009) 1359–1364.[3] L.R. Snyder, J.J. Kirkland, Introduction to Modern Liquid Chromatography, 2nd
ed., Wiley, New York, 1979.[4] L.R. Snyder, J.J. Kirkland, J.L. Glajch, Practical HPLC Method Development, Wiley,
New York, 1988.[5] J. Layne, T. Farcas, I. Rustamov, F. Ahmed, J. Chromatogr. A 913 (2001)
233–242.[6] J.W. Dolan, LC-GC North Am. 22 (2004) 26–30.[7] V. David, A. Medvedovici, Sample introduction techniques for HPLC, in: J. Cazes
(Ed.), Encyclopedia for Chromatography On-Line, Taylor & Francis Publications,New York, 2006.
[8] I. Lovin, F. Albu, F. Tache, V. David, A. Medvedovici, Microchem. J. 75 (2003)179–187.
[9] Y. Li, Y. Suna, F. Dua, K. Yuanc, C. Li, J. Chromatogr. A 1193 (2008) 109–116.10] E. Loeser, P. Drumm, J. Sep. Sci. 29 (2006) 2847–2852.11] A. Medvedovici, V. David, V. David, C. Georgita, J. Liq. Chromatogr. Related
Technol. 30 (2007) 199–213.12] S. Udrescu, A. Medvedovici, V. David, J. Sep. Sci. 31 (2008) 2939–2945.13] E. Loeser, S. Babiak, P. Drumm, J. Chromatogr. A 1216 (2009) 3409–3412.14] V. David, C. Barcutean, C. Georgita, A. Medvedovici, Rev. Roum. Chim. 5 (2006)
445–451.15] S. Udrescu, I.D. Sora, V. David, A. Medvedovici, J. Liq. Chromatogr. Related Tech-
nol. 33 (2010) 133–149.
16] S. Keunchkarian, M. Reta, L. Romero, C.B. Castells, J. Chromatogr. A 1119 (2006)20–28.17] C.B. Castells, R.C. Castells, J. Chromatogr. A 805 (1998) 55–61.18] D. Cherrak, E. Guernet, P. Cardot, C. Herrenknecht, M. Czok, Chromatographia
46 (1997) 647–654.19] W.M. Meylan, P.H. Howard, J. Pharm. Sci. 84 (1995) 83–92.

1 l and
[
[
[
[
[Lausecker, Bioanalysis 1 (2009) 1049–1056.
172 S. Udrescu et al. / Journal of Pharmaceutica
20] R.C. Reid, J.M. Prausnitz, B.E. Poling, The Properties of Gases & Liquids, Interna-tional Edition, McGraw-Hill, Singapore, 1988.
21] Guidance for Industry: Bioanalytical Method Validation, U.S. Department ofHealth and Human Services, FDA, CDER, CVM, 2001.
22] Guideline on Validation of Bioanalytical Methods, European Medicines AgencyEMEA/CPMP/EWP/19221, 2009.
23] F. Albu, C. Georgita, V. David, A. Medvedovici, J. Chromatogr. B 816 (2005)35–40.
[[
[
Biomedical Analysis 54 (2011) 1163–1172
24] P. Timmerman, S. Luedtke, P. van Amsterdam, M. Brudny-Kloeppel, B.
25] F.E. Lytle, R.K. Julian, A.M. Tabert, Bioanalysis 1 (2009) 705–714.26] X. Gao, J. Chen, N. Mei, W. Tao, W. Jiang, X. Jiang, Chromatographia 61 (2005)
581–585.27] T.J. Hang, W. Zhao, J. Liu, M. Song, Y. Xie, Z. Zhang, J. Shen, Y. Zhang, J. Pharm.
Biomed. Anal. 40 (2006) 202–205.


![[Cool] Gas Chromatography and Lipids](https://static.fdokumen.com/doc/165x107/6325a4b1852a7313b70e98e9/cool-gas-chromatography-and-lipids.jpg)