Large earthquake-triggered landslides and mountain belt erosion: The Tsaoling case, Taiwan
9
C. R. Geoscience 337 (2005) 1164–1172 http://france.elsevier.com/direct/CRAS2A/ Tectonics Large earthquake-triggered landslides and mountain belt erosion: The Tsaoling case, Taiwan Rou-Fei Chen a,b,∗ , Yu-Chang Chan b , Jacques Angelier a,c , Jyr-Ching Hu d , Chung Huang d , Kuo-Jen Chang e , Tian-Yuan Shih f a Observatoire océanologique de Villefranche-sur-Mer, université Pierre-et-Marie-Curie, Géosciences Azur, Port de la Darse, BP 48, 06235 Villefranche-sur-Mer cedex, France b Institute of Earth Sciences, Academia Sinica, P.O. Box 1-55, Nankang, Taipei, Taiwan c Institut universitaire de France, 103, bd Saint-Michel, 75005 Paris, France d Department of Geosciences, National Taiwan University, P.O. Box 13-318, Taipei, Taiwan e Laboratoire de dynamique de la lithosphère, université Montpellier-2, France f Department of Civil Engineering, National Chiao-Tung University, 1001, Ta Hsueh Rd, Hsinchu, Taiwan Received 8 April 2004; accepted after revision 18 April 2005 Available online 21 July 2005 Written on invitation of the Editorial Board Abstract The 1999 Chi-Chi earthquake triggered the catastrophic Tsaoling landslide in central Taiwan. We mapped the landslide area and estimated the landslide volume, using high-resolution digital elevation model from airborne LiDAR (Light Detection and Ranging), satellite images, aerial photographs and topographic maps. The comparison between cut and fill volumes, about 0.126 and 0.150 km 3 , respectively, suggests a volume increase of 19% due to decompaction during landsliding. In April 2002, the cut and fill volumes were about 0.137 and 0.116 km 3 , respectively. These estimates suggest that 2.5 years after the event, the volume of landslide debris removed by river erosion was nearly 0.045 km 3 . Such a large value highlights the importance of landslide processes for erosion and long-term denudation in the Taiwan mountain belt. To cite this article: R.-F. Chen et al., C. R. Geoscience 337 (2005). 2005 Académie des sciences. Published by Elsevier SAS. All rights reserved. Résumé Glissements de terrain déclenchés par forts tremblements de terre et érosion de chaîne de montagne : l’exemple de Tsaoling, Taiwan. En 1999, le séisme de Chi-Chi a déclenché un glissement de terrain catastrophique à Tsaoling, dans le centre de Taiwan. Nous avons cartographié le site et estimé le volume déplacé, en utilisant un modèle numérique à haute résolution LiDAR (Light Detection and Ranging, aéroporté), des images satellites, photographies aériennes et cartes topographiques. Le bilan des volumes évacué et accumulé, environ 0,126 et 0,150 km 3 , respectivement, indique une augmentation de volume de * Corresponding author. E-mail address: [email protected] (R.-F. Chen). 1631-0713/$ – see front matter 2005 Académie des sciences. Published by Elsevier SAS. All rights reserved. doi:10.1016/j.crte.2005.04.017
Transcript of Large earthquake-triggered landslides and mountain belt erosion: The Tsaoling case, Taiwan
/
ion:
slide areaon andbout 0.12602, thent, theof
le centrerésolutionques. Lee de
C. R. Geoscience 337 (2005) 1164–1172http://france.elsevier.com/direct/CRAS2A
Tectonics
Large earthquake-triggered landslides and mountain belt erosThe Tsaoling case, Taiwan
Rou-Fei Chena,b,∗, Yu-Chang Chanb, Jacques Angeliera,c, Jyr-Ching Hud,Chung Huangd, Kuo-Jen Change, Tian-Yuan Shihf
a Observatoire océanologique de Villefranche-sur-Mer, université Pierre-et-Marie-Curie, Géosciences Azur, Port de la Darse,BP 48, 06235 Villefranche-sur-Mer cedex, France
b Institute of Earth Sciences, Academia Sinica, P.O. Box 1-55, Nankang, Taipei, Taiwanc Institut universitaire de France, 103, bd Saint-Michel, 75005 Paris, France
d Department of Geosciences, National Taiwan University, P.O. Box 13-318, Taipei, Taiwane Laboratoire de dynamique de la lithosphère, université Montpellier-2, France
f Department of Civil Engineering, National Chiao-Tung University, 1001, Ta Hsueh Rd, Hsinchu, Taiwan
Received 8 April 2004; accepted after revision 18 April 2005
Available online 21 July 2005
Written on invitation of the Editorial Board
Abstract
The 1999 Chi-Chi earthquake triggered the catastrophic Tsaoling landslide in central Taiwan. We mapped the landand estimated the landslide volume, using high-resolution digital elevation model from airborne LiDAR (Light DetectiRanging), satellite images, aerial photographs and topographic maps. The comparison between cut and fill volumes, aand 0.150 km3, respectively, suggests a volume increase of 19% due to decompaction during landsliding. In April 20cut and fill volumes were about 0.137 and 0.116 km3, respectively. These estimates suggest that 2.5 years after the evevolume of landslide debris removed by river erosion was nearly 0.045 km3. Such a large value highlights the importancelandslide processes for erosion and long-term denudation in the Taiwan mountain belt.To cite this article: R.-F. Chen et al.,C. R. Geoscience 337 (2005). 2005 Académie des sciences. Published by Elsevier SAS. All rights reserved.
Résumé
Glissements de terrain déclenchés par forts tremblements de terre et érosion de chaîne de montagne : l’exemple deTsaoling, Taiwan. En 1999, le séisme de Chi-Chi a déclenché un glissement de terrain catastrophique à Tsaoling, dansde Taiwan. Nous avons cartographié le site et estimé le volume déplacé, en utilisant un modèle numérique à hauteLiDAR (Light Detection and Ranging, aéroporté), des images satellites, photographies aériennes et cartes topographibilan des volumes évacué et accumulé, environ 0,126 et 0,150 km3, respectivement, indique une augmentation de volum
* Corresponding author.E-mail address: [email protected](R.-F. Chen).
1631-0713/$ – see front matter 2005 Académie des sciences. Published by Elsevier SAS. All rights reserved.doi:10.1016/j.crte.2005.04.017
R.-F. Chen et al. / C. R. Geoscience 337 (2005) 1164–1172 1165
n 0,137 etla rivière
rosion et
19 %, due à la décompaction pendant le glissement de terrain. En avril 2002, ces volumes étaient devenus enviro0,116 km3. Ces évaluations suggèrent que, 2,5 ans après l’événement, le volume de débris enlevé par érosion deatteint presque 0,045 km3. Une si grande valeur accentue l’importance des processus de glissements de terrain pour l’éla dénudation à long terme dans la chaîne de montagnes de Taiwan.Pour citer cet article : R.-F. Chen et al., C. R. Geoscience337 (2005). 2005 Académie des sciences. Published by Elsevier SAS. All rights reserved.
Keywords: Landslide; LiDAR images; Earthquake; River erosion; Taiwan
Mots-clés : Glissement de terrain ; Image LiDAR ; Séisme ; Érosion torrentielle ; Taiwan
onte du
entrn-sur-
rtest de
s-
aen-unng-blét a
ute
ale
delesdu
ans-nté-
l’île
eau-on-erau-ges,
sse-t 39
s ce-tre
ne,entho-
tal
truc-der-
mes deDesents
im-nt, et
utreau
ont42.agess dedé-79,ient
Version française abrégée
1. Introduction
À Taiwan, de grands glissements de terrain se sproduits en secteur montagneux près de l’épicentrséisme de Chi-Chi du 21 septembre 1999 (Fig. 1a),provoqués par ce séisme(Mw = 7,6), qui a causé2450 décès et de grandes destructions dans le couest de Taiwan[2]. De tels séismes peuvent déclecher des milliers de glissements de terrains sur desfaces de plus de 100 000 km2 [11]. Les facteurs litho-logiques, séismiques, climatiques (typhons et foprécipitations) accroissent le risque de glissementerrain dans la partie montagneuse de l’île.
À Tsaoling (Fig. 1a–b), au moins cinq grands glisements de terrain se sont produits pendant les XIXe etXXe siècles[7–9,14]. Le séisme de Chi-Chi (1999)déclenché un glissement de terrain qui a mobiliséviron 0,125 km3 de roches et de sols, qui ont créébarrage naturel de 5 km de long sur la rivière Chishui. Un cinquième du glissement de terrain a comla rivière de Chingshui, le reste a franchi la rivière eatteint le versant opposé.
Nous avons utilisé un modèle numérique à harésolution LiDAR[18,19] (Light Detection and Ran-ging, aéroporté), avec lequel la résolution horizontatteint 1 m et la résolution verticale 0,15 m[15], pourproduire un modèle numérique de terrain (MNT)haute résolution à Tsaoling. Nous avons analysécaractéristiques géomorphologiques de la cicatriceglissement et de l’amas de débris, puis estimé le trfert de volume, en comparant les configurations arieures et postérieures au glissement de 1999.
2. Le glissement de terrain de Tsaoling
Le séisme le plus destructeur du XXe siècle à Tai-wan, le séisme de Chi-Chi, a frappé le centre de
e
le 21 septembre 1999[10]. Il a été provoqué par unrupture le long de la faille de Chelungpu, un chevchement majeur près du front de la chaîne de mtagnes de Taiwan[1,4,13]. Des dizaines de milliers dbâtiments se sont effondrés, des équipements hydliques ont été endommagés, avec rupture de barraponts, digues, levées et systèmes d’irrigation.
Ce tremblement de terre a déclenché deux gliments géants, à Chiufenerhshan et Tsaoling, tuanet 29 personnes respectivement. Nous analysonlui de Tsaoling, à 30 km au sud-ouest de l’épicendu séisme de Chi-Chi (Fig. 1a). Le village de Tsaolingest situé dans la vallée de la Chingshui (Fig. 1b), un af-fluent de la Choshui. Le substratum rocheux, pliocècomprend le schiste de Chinshui, où le glissems’est opéré, et la formation schisto-gréseuse de Clan (Fig. 1c–d). Tsaoling est situé sur le flanc oriend’un synclinal NNE–SSW.
Les glissements majeurs successifs et les destions associées ont été répertoriés pendant les 140nières années dans la région de Tsaoling[8,16,17]. Ilsont été déclenchés par de fortes précipitations, comen 1942, 1951 et 1979, ou par des tremblementterre destructeurs, comme en 1862, 1941 et 1999.ruptures de barrages naturels créés par des glissemont eu lieu en 1898, 1951, 1979 et 1999. Un séismeportant (estimé àM = 7,0) a déclenché le glissemede terrain le plus ancien connu à Tsaoling en 1862le barrage ainsi créé s’est rompu en 1898. Un aséisme majeur a induit un glissement de terrainmême endroit en 1941, et de fortes précipitations l’réactivé, avec un barrage plus volumineux, en 19La rupture du barrage a causé de grands dommen aval, tuant 137 personnes après plusieurs jourfortes pluies en 1951. De fortes précipitations ontclenché le troisième glissement de terrain en 19sans perte humaine, car les habitants à l’aval ava
1166 R.-F. Chen et al. / C. R. Geoscience 337 (2005) 1164–1172
999ladet etlac
-é de
ionfiéent
t dese-ousréc
isésaé-r
le-t) et
lculn-ontnesdesèles-et à
ter-deles
oto-i-n%ain.dier
02
r
rllesve-
etal.
on,
lis-g-ent,
-pré-lesitenden :
-meis-ble
oi-Tto-Ten-facenequeLe
r épi-
esentet
eau.ion,e etea
été évacués. En raison du séisme de Chi-Chi en 1plus de 0,125 km3 de roche et de terre ont bloquégorge de la rivière de Chingshui sur une distance5 km. Un barrage de débris haut de 50 m en amonde 150 m en aval s’est formé soudainement, et und’une capacité estimée à 0,046 km3 au moins s’est développé. Le glissement de 1999 avait été précédmouvements précurseurs[5].
3. L’analyse volumétrique du glissement de terrain
Après le glissement de septembre 1999, la régdu glissement de terrain de Tsaoling a été modipar l’érosion de la rivière, particulièrement pendales typhons. Nous avons calculé le changemenvolume en avril 2002, soit 2,5 ans après le glisment de terrain. Les techniques ayant changé, navons dû comparer des données de natures et de psions différentes. Les modèles topographiques utilétaient le MNT Taiwan, dérivé des photographiesriennes de 1986 (Fig. 2a) et un MNT obtenu à partide l’analyse LiDAR en 2002 (Fig. 2b). La résolutionest d’environ 1 m (verticalement) et 40 m (horizontament) dans le premier cas, 0,15–1 m (verticalemen2 m (horizontalement) dans le deuxième cas[15]. Parconséquent, les incertitudes majeures dans nos catirent souvent leur origine du MNT Taiwan. Ces icertitudes vont de 6 à 20 % suivant les calculs, et spour la plupart de 9 %. Les photographies aérienprises de 1986 à 1999, avant le séisme, indiquentchangements mineurs. La différence entre les modde 1986 et de 2002 (Fig. 2c) est principalement imputable au glissement de terrain de Tsaoling en 1999l’érosion des 2,5 années suivantes.
Le changement de volume lié au glissement derain de Tsaoling, immédiatement après le séismeChi-Chi, a pu être précisé par comparaison entremodèles numériques de précision 10× 10 m avantet après le glissement de terrain, réalisés par phgrammétrie[3]. Le volume de la cicatrice était d’envron 0,126 km3 et le volume d’accumulation d’enviro0,150 km3, soit une augmentation de volume de 19par décompaction pendant le glissement de terrNous utilisons cette donnée co-sismique pour étul’effet de l’érosion postérieure par la rivière.
Notre calcul fondé sur la situation en avril 20a fourni un volume de cicatrice,V1 (Fig. 3), d’envi-ron 0,137 km3, soit 0,011 km3 de plus que la valeu
,
i-
s
co-sismique, et un volume d’accumulation,V2, d’envi-ron 0,116 km3, soit 0,034 km3 de moins que la valeuco-sismique. Ces différences sont significatives. Eindiquent l’érosion réalisée en 2,5 ans par enlèment des débris du glissement par la rivière, soitVe =0,045 km3. Il s’agit d’un maximum, car l’érosion d1986 à 1999, quoique limitée, est incluse dans ce toLe volume total de matériel accumulé avant érosiV2 +Ve, est de 0,161 km3. On écritV1δ = V2 +Ve, oùδ est le coefficient de décompaction pendant le gsement (Fig. 3b). La comparaison suggère une aumentation de volume de 17,5 % pendant le glissemcompatible avec l’estimation co-sismique (19 %).
Le climat subtropical de Taiwan joue un rôle important, avec en moyenne quatre typhons et unecipitation de 2515 mm par an, de même queséismes fréquents et l’incision fluviatile rapide indupar le soulèvement actif[6]. Une étude récente eNouvelle-Guinée a souligné l’effet de glissementsterrain déclenchés par les séismes pour l’érosio0,58 mm an−1, à comparer avec 0,2–0,4 mm an−1 pourles autres processus[12]. L’étude de 15 séismes historiques a fourni une relation simple entre le volutotal V (en m3) de matériau glissé, et le moment sémique Mo (en dyne cm), et prétendue extrapola[12] : V = Mo/1018,9, pour 1,4× 1024 � Mo � 1029.
Le moment séismique du séisme de Chi-Chi avsine 3,38 × 1027 dynecm, selon les données CMde Harvard. L’équation suggère donc un volumetal d’environ 4,26 km3. Une étude d’images SPO[14] a indiqué que le séisme de Chi-Chi avait déclché 9272 glissements de terrain, couvrant une surtotale de 128 km2, indiquant une épaisseur moyende 33 m. Cette valeur est acceptable, suggérantl’équation est valable en grossière approximation.changement du taux de dénudation dans le secteucentral fera l’objet d’une autre note.
4. Conclusion
Le glissement de Tsaoling illustre l’influence dfacteurs géologiques sur le phénomène de glissemet l’importance de l’analyse pour évaluer le risqueplanifier les ouvrages et gérer les ressources enDepuis 1980, les investigations incluent télédétectphotogrammétrie, enquêtes de terrain, surveillancessais de laboratoire[8]. Le glissement d’une massd’environ 0,125 km3 est envisagé pour l’avenir. L
R.-F. Chen et al. / C. R. Geoscience 337 (2005) 1164–1172 1167
tée,ao-
lu-Rentent
mor-sse-ionmeré-
eurege-
t ca-le
breu-nent
éva-néeslsdunt deo-
onanstionernede
ruc-urt,
n-be
ancenofca-
out
ousgy,rav-
lidea-0th-outg-of
rest
lso-
nly.g)ttedtailtergh-f theso-alIn-afte-very
ob-
gh-redai-the
esti-par-
en-he
lt, a
construction d’un réservoir de rechange est discumais la probable réactivation du glissement de Tsling affecte de tels plans.
Le modèle numérique altimétrique à haute résotion (MNT) dérivé des données aéroportées LiDAnous a permis une analyse détaillée de l’éboulemdestructif de Tsaoling, déclenché par le tremblemde terre de 1999. Les observations géologiques etphologiques le long des dépôts de surface de gliment et d’avalanche ont amélioré la compréhensdu processus d’éboulement et l’évaluation du volud’éboulement. La combinaison de ces donnéescentes avec les données – moins précises – antériau glissement permet la détermination des chanments volumétriques pendant et après l’événementastrophique de 1999 à Tsaoling. En avril 2002,volume de la cicatrice était d’environ 0,137 km3. Envi-ron 8 % de ce volume reflètent l’érosion de septem1999 à avril 2002. Environ 29 % du volume d’accmulation de 0,116 km3 ont été enlevés par érosiopendant les 2,5 années qui ont suivi le tremblemde terre.
Il en ressort que le volume de la masse glisséecué par le fleuve de Chingshui pendant ces 2,5 anavoisine 0,045 km3. Comparé aux chiffres habituede l’érosion, ce grand volume montre l’efficacitéprocessus de glissement de terrain en tant qu’agedislocation qui facilite l’érosion ultérieure. Les prpriétés mécaniques affaiblies de la masse glisséelargement accru le taux d’érosion à long terme dle secteur d’étude. La haute probabilité de répétide tels événements mérite attention en ce qui concl’évaluation des risques. L’impact des glissementsterrain provoqués par le tremblement de terre destteur de Chi-Chi sur les bilans de dénudation, à comoyen et long terme, sera analysé ultérieurement.
1. Introduction
In Taiwan, large landslides occurred in the moutainous area near the epicentre of the 21 Septem1999 Chi-Chi earthquake (Fig. 1a), triggered by theMw = 7.6 earthquake, which resulted in more th2450 human casualties and widespread damage intral Taiwan[2]. Earthquake shaking is a major agentlandslide generation, with the largest earthquakespable of triggering thousands of landslides through
s
t
r
-
areas of more than 100 000 km2 [11]. In Taiwan, land-slide hazard reaches high levels in the mountainpart of the island where argillaceous slate litholoearthquakes, typhoons and heavy rainfall favour gitational sliding.
In central Taiwan, the most representative landsarea is Tsaoling (Fig. 1a and b), where at least five mjor dip slope failures occurred during the 19th and 2centuries[7–9,14]. The 1999 Chi-Chi earthquake triggered a catastrophic landslide, which mobilised ab0.125 km3 of rock and soil that slid across the Chinshui River and created a 5-km-long dam. One fifththe landslide mass dropped into the Chingshui, the(about 0.1 km3) jumped over the river.
The establishment of digital elevation mode(DEM) facilitated neotectonic and quantitative gemorphology studies in Taiwan. The most commoused DEM has a 40× 40 m horizontal resolutionThe airborne LiDAR (Light Detection and Rangininvolves a new technology that uses a transmilaser beam to reconstruct the morphology in de[18,19]. Through combined use of laser transmitwith high repeating-pulse frequency (RPF) and hispeed scanning system, dense measurements oterrain surface were obtained, giving a spatial relution of up to 1 m horizontal and 0.15 m vertic[15]. The Global Positioning System (GPS) andertial Navigation Systems (INS) on board of aircrallowed accurate positioning of the LiDAR data. Bcause the LiDAR laser pulse scans the surface athigh frequencies, up to 80 kHz, a DEM with a 2× 2 mhorizontal resolution, or even better, was routinelytained.
We used the airborne LiDAR data to generate hiresolution DEMs near the Tsaoling landslide triggeby the 1999 Chi-Chi earthquake in west-central Twan, and to map geomorphological features alongsliding surface and avalanche deposits. We alsomated the landslide-related mass transfer by coming the pre-landslide DEMs and our recent DEM.
2. The Tsaoling landslide
The most destructive earthquake of the 20th ctury in Taiwan, the Chi-Chi earthquake, struck twest-central island on 21 September 1999[10]. Itwas caused by rupture along the Chelungpu Fau
1168 R.-F. Chen et al. / C. R. Geoscience 337 (2005) 1164–1172
star at the
ile noire à; le cadre
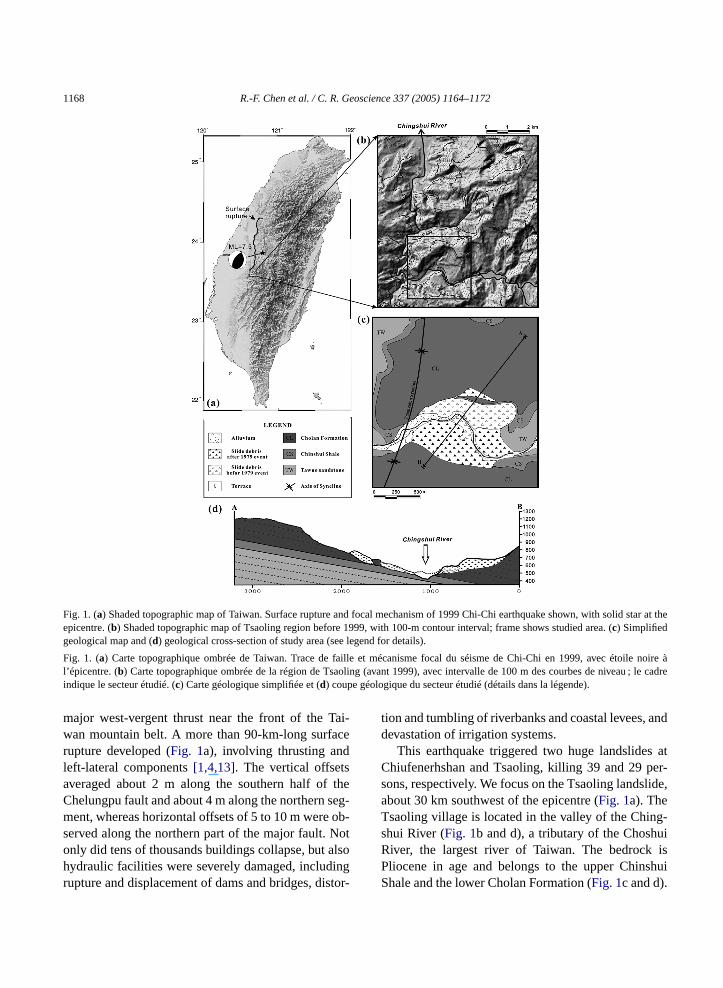
Fig. 1. (a) Shaded topographic map of Taiwan. Surface rupture and focal mechanism of 1999 Chi-Chi earthquake shown, with solidepicentre. (b) Shaded topographic map of Tsaoling region before 1999, with 100-m contour interval; frame shows studied area. (c) Simplifiedgeological map and (d) geological cross-section of study area (see legend for details).
Fig. 1. (a) Carte topographique ombrée de Taiwan. Trace de faille et mécanisme focal du séisme de Chi-Chi en 1999, avec étol’épicentre. (b) Carte topographique ombrée de la région de Tsaoling (avant 1999), avec intervalle de 100 m des courbes de niveauindique le secteur étudié. (c) Carte géologique simplifiée et (d) coupe géologique du secteur étudié (détails dans la légende).
ai-ce
theeg-ob-otlso
ingtor-
and
ater-ide,
g-uiishui
major west-vergent thrust near the front of the Twan mountain belt. A more than 90-km-long surfarupture developed (Fig. 1a), involving thrusting andleft-lateral components[1,4,13]. The vertical offsetsaveraged about 2 m along the southern half ofChelungpu fault and about 4 m along the northern sment, whereas horizontal offsets of 5 to 10 m wereserved along the northern part of the major fault. Nonly did tens of thousands buildings collapse, but ahydraulic facilities were severely damaged, includrupture and displacement of dams and bridges, dis
tion and tumbling of riverbanks and coastal levees,devastation of irrigation systems.
This earthquake triggered two huge landslidesChiufenerhshan and Tsaoling, killing 39 and 29 psons, respectively. We focus on the Tsaoling landslabout 30 km southwest of the epicentre (Fig. 1a). TheTsaoling village is located in the valley of the Chinshui River (Fig. 1b and d), a tributary of the ChoshRiver, the largest river of Taiwan. The bedrockPliocene in age and belongs to the upper ChinsShale and the lower Cholan Formation (Fig. 1c and d).
R.-F. Chen et al. / C. R. Geoscience 337 (2005) 1164–1172 1169
entale
Thehetoneonata
re-oc-
oc-5162,by
99.
thea-
amea-
ideageralll
asevachi
iverhtnlyca-
uithe
fri-de-liparlyt-
mi-ingbeof
let,foread
re-
od-in-ars
999gh
andEMnd
al)m
nsiesula-
theceostdif-
lings.deuldeen
eout9%
theic
me
02
a
are
The Chinshui Shale, in which landslide detachmtook place, consists of massive mudstone and shwith intercalated fine-grained sandstone layers.Cholan Formation, which conformably rests on tChinshui Shale, is composed of fine-grained sandswith variable amounts of shale. Tsaoling is locatedthe east flank of a NNE-trending syncline. The strstrike 030–070◦ (azimuth) with a dip 30–40◦SE in thewest limb of the syncline, 030–060◦ with a dip 40◦NWin the east limb, and 140◦ with a dip 14◦SW in thelandslide area.
The occurrence of successive landslides andlated destruction in the Tsaoling area has been dumented for the past 140 years[8,16,17]. Historicalcatastrophic dip slope failures have repeatedlycurred, triggered by heavy rainfalls, as in 1942, 19and 1979, or by destructive earthquakes, as in 181941 and 1999. Ruptures of natural dams createdlandslides took place in 1898, 1951, 1979 and 19A major earthquake with estimatedM = 7.0 triggeredthe oldest recorded landslide at Tsaoling in 1862;natural dam thus created failed in 1898. Another mjor earthquake induced a second landslide at the slocation in 1941, and heavy rainfall led to its reactivtion, with a larger natural dam, in 1942. The landsldam failed by overtopping and caused serious damin downstream valleys, killing 137 people after sevedays of intensive rainfalls in 1951. A heavy rainfaactivated the third landslide in 1979; no fatality wreported because downstream residents had beenuated before dam failure. As a result of the Chi-Cearthquake in 1999, more than 0.125 km3 of rock andearth masses blocked the gorge of the Chingshui Ralong a distance of 5 km. A debris dam with a heigof 50 m upstream and 150 m downstream suddeformed, and the Tsaoling Lake having an estimatedpacity larger than 0.046 km3 developed.
The landslide resulted from failure of the ChinshShale that underlies the Cholan sandstone. Fromengineering point of view, the Chinshui shale is aable, silty mudstone with weak cementation thatteriorates readily upon wetting and drying. The ssurface of the 1999 landslide was smooth and neplanar, parallel to bedding. It formed within alternaing beds of fine sandstone and shale with ripple lanation, or in shale. The shale is weathered by slakand probably by sulphuric acid, which is inferred toa major cause of intermittent failure. The top margin
,
-
the 1999 landslide coincided with a V-shaped scarpclearly recognised on aerial photographs taken bethe landslide. This indicates that this landslide hslightly moved before the 1999 event, providing pcursory signal[5].
3. Volumetric analysis of the Tsaoling landslide
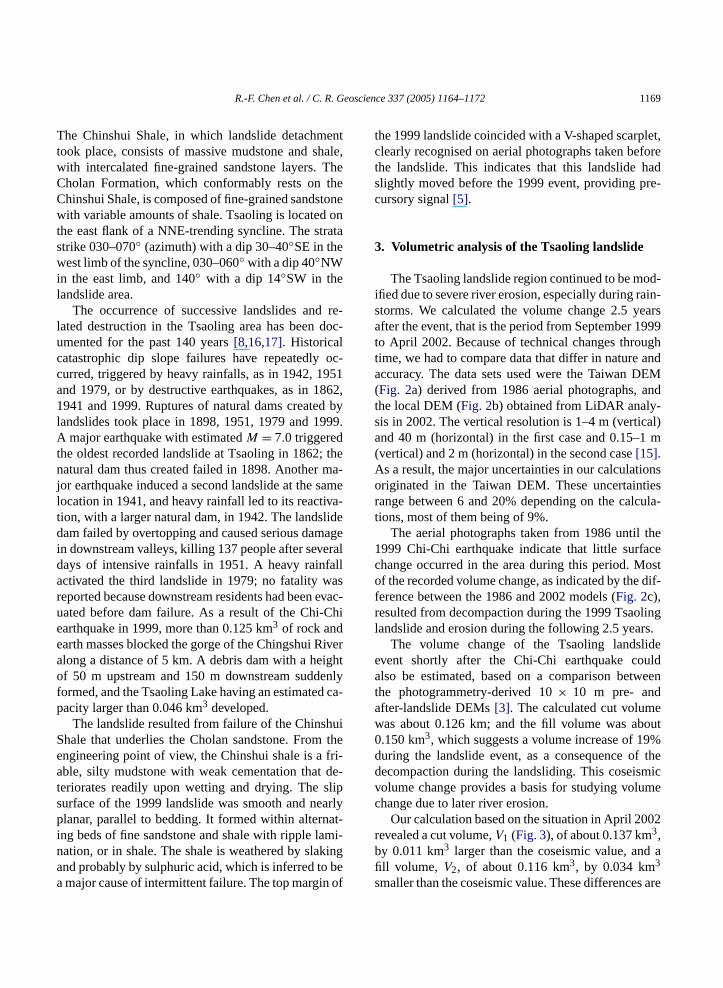
The Tsaoling landslide region continued to be mified due to severe river erosion, especially during rastorms. We calculated the volume change 2.5 yeafter the event, that is the period from September 1to April 2002. Because of technical changes throutime, we had to compare data that differ in natureaccuracy. The data sets used were the Taiwan D(Fig. 2a) derived from 1986 aerial photographs, athe local DEM (Fig. 2b) obtained from LiDAR analy-sis in 2002. The vertical resolution is 1–4 m (verticand 40 m (horizontal) in the first case and 0.15–1(vertical) and 2 m (horizontal) in the second case[15].As a result, the major uncertainties in our calculatiooriginated in the Taiwan DEM. These uncertaintrange between 6 and 20% depending on the calctions, most of them being of 9%.
The aerial photographs taken from 1986 until1999 Chi-Chi earthquake indicate that little surfachange occurred in the area during this period. Mof the recorded volume change, as indicated by theference between the 1986 and 2002 models (Fig. 2c),resulted from decompaction during the 1999 Tsaolandslide and erosion during the following 2.5 year
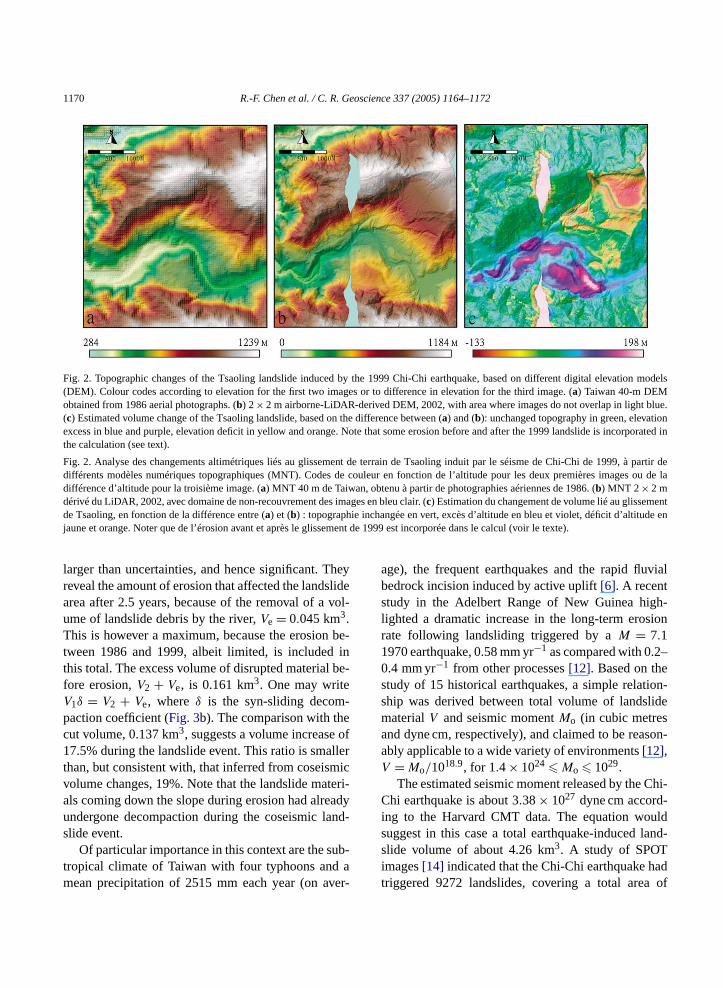
The volume change of the Tsaoling landslievent shortly after the Chi-Chi earthquake coalso be estimated, based on a comparison betwthe photogrammetry-derived 10× 10 m pre- andafter-landslide DEMs[3]. The calculated cut volumwas about 0.126 km; and the fill volume was ab0.150 km3, which suggests a volume increase of 1during the landslide event, as a consequence ofdecompaction during the landsliding. This coseismvolume change provides a basis for studying voluchange due to later river erosion.
Our calculation based on the situation in April 20revealed a cut volume,V1 (Fig. 3), of about 0.137 km3,by 0.011 km3 larger than the coseismic value, andfill volume, V2, of about 0.116 km3, by 0.034 km3
smaller than the coseismic value. These differences
1170 R.-F. Chen et al. / C. R. Geoscience 337 (2005) 1164–1172
n models
blue.ionrporated in
à partir des ou de la
entde en
Fig. 2. Topographic changes of the Tsaoling landslide induced by the 1999 Chi-Chi earthquake, based on different digital elevatio(DEM). Colour codes according to elevation for the first two images or to difference in elevation for the third image. (a) Taiwan 40-m DEMobtained from 1986 aerial photographs. (b) 2× 2 m airborne-LiDAR-derived DEM, 2002, with area where images do not overlap in light(c) Estimated volume change of the Tsaoling landslide, based on the difference between (a) and (b): unchanged topography in green, elevatexcess in blue and purple, elevation deficit in yellow and orange. Note that some erosion before and after the 1999 landslide is incothe calculation (see text).
Fig. 2. Analyse des changements altimétriques liés au glissement de terrain de Tsaoling induit par le séisme de Chi-Chi de 1999,différents modèles numériques topographiques (MNT). Codes de couleur en fonction de l’altitude pour les deux premières imagedifférence d’altitude pour la troisième image. (a) MNT 40 m de Taiwan, obtenu à partir de photographies aériennes de 1986. (b) MNT 2 × 2 mdérivé du LiDAR, 2002, avec domaine de non-recouvrement des images en bleu clair. (c) Estimation du changement de volume lié au glissemde Tsaoling, en fonction de la différence entre (a) et (b) : topographie inchangée en vert, excès d’altitude en bleu et violet, déficit d’altitujaune et orange. Noter que de l’érosion avant et après le glissement de 1999 est incorporée dans le calcul (voir le texte).
heylidevol-
be-inbe-
-eofller
icteri-adynd-
b-aer-
vial
h-ion
–
on-ide
on-
Chi--ld
and-
adof
larger than uncertainties, and hence significant. Treveal the amount of erosion that affected the landsarea after 2.5 years, because of the removal of aume of landslide debris by the river,Ve = 0.045 km3.This is however a maximum, because the erosiontween 1986 and 1999, albeit limited, is includedthis total. The excess volume of disrupted materialfore erosion,V2 + Ve, is 0.161 km3. One may writeV1δ = V2 + Ve, where δ is the syn-sliding decompaction coefficient (Fig. 3b). The comparison with thcut volume, 0.137 km3, suggests a volume increase17.5% during the landslide event. This ratio is smathan, but consistent with, that inferred from coseismvolume changes, 19%. Note that the landslide maals coming down the slope during erosion had alreundergone decompaction during the coseismic laslide event.
Of particular importance in this context are the sutropical climate of Taiwan with four typhoons andmean precipitation of 2515 mm each year (on av
age), the frequent earthquakes and the rapid flubedrock incision induced by active uplift[6]. A recentstudy in the Adelbert Range of New Guinea higlighted a dramatic increase in the long-term erosrate following landsliding triggered by aM = 7.11970 earthquake, 0.58 mm yr−1 as compared with 0.20.4 mm yr−1 from other processes[12]. Based on thestudy of 15 historical earthquakes, a simple relatiship was derived between total volume of landslmaterialV and seismic momentMo (in cubic metresand dyne cm, respectively), and claimed to be reasably applicable to a wide variety of environments[12],V = Mo/1018.9, for 1.4× 1024 � Mo � 1029.
The estimated seismic moment released by theChi earthquake is about 3.38× 1027 dyne cm according to the Harvard CMT data. The equation wousuggest in this case a total earthquake-induced lslide volume of about 4.26 km3. A study of SPOTimages[14] indicated that the Chi-Chi earthquake htriggered 9272 landslides, covering a total area
R.-F. Chen et al. / C. R. Geoscience 337 (2005) 1164–1172 1171
ithnt
laulé et
tirets.02
Fig. 3. Explanation of volume change calculation, 1999 Tsaoling landslide. (a) Schematic map (in 2002) of the 1999 landslide area, wlocation of cross-section (A–B). (b) Schematic presentation of the cut, fill and eroded volumes (V1,V2, andVe, respectively) in cross-sectiowithout scale; 2002 profile as solid line, 1986 profile as dotted line, late 1999 profile as dashed line.V1δ = (V2 + Ve), δ being the coefficienof syn-sliding decompaction. (c) Topographic profiles in 1986 (dotted line) and 2002 (solid line).
Fig. 3. Explication du calcul des changements de volume, glissement de terrain de Tsaoling en 1999. (a) Carte schématique (en 2002) dezone de glissement de terrain de 1999, avec localisation de la coupe (A–B). (b) Présentation schématique des volumes arraché, accumérodé (V1,V2 et Ve), en coupe sans échelle ; profil de 2002 en trait continu, profil de 1986 en trait pointillé, profil de la fin 1999 enV1δ = (V2 + Ve), δ étant le coefficient de décompaction pendant le glissement. (c) Profils topographiques en 1986 (pointillé) et en 20(continu).
orling
er),oxi-Chirth-
s toandingca
er-on-
llopeck-mce-but
ings.)
ledthehi-er-de-
lideTheon
128 km2, giving an average thickness of 33 m fthese landslides. This value is reasonable (the Tsaolandslide is thicker, but many landslides are thinnsuggesting that the equation is valid as a raw apprmation. The change in denudation rate in the Chi-earthquake epicentral area will be analysed in a focoming paper.
4. Conclusion
The Tsaoling landslide provides case exampleevaluate geological factors in landslide occurrencethe influence of landslide on water resource plannand hazard assessment. Investigations have beenried out since 1980, involving remote sensing and aial photograph analyses, field surveys and in situ m
r-
itoring and laboratory tests[8]. Based on structuraanalysis, a tensile zone is expected to exist in the sbetween 1050 and 1100 m in elevation, and a roslide involving a mass movement of about 0.125 k3
in the future is possible. The construction of a replament reservoir at the landslide site is discussed,consideration of possible reactivation of the Tsaollandslide raises obvious concerns about such plan
The high-resolution digital elevation model (DEMderived from the recent airborne LiDAR data enabus to map and analyse in more detail than beforedestructive Tsaoling landslide triggered by 1999 CChi earthquake. Geological and morphological obsvations along the sliding surface and avalancheposits led to better understanding of the landsprocess and estimation of the landslide volume.LiDAR data allowed comprehensive investigation
1172 R.-F. Chen et al. / C. R. Geoscience 337 (2005) 1164–1172
ringeseear-hicet-
lingut
thisril
w-
g-d totsthe
diseakifi-thealsntsas
im-Chiratesed
i-i-nce
30ces
un-n).
.e
wan,
ngan,
ofce
g,in,tudyake,
aland-ng.
re-elt:
rea,4–
an,
i-cha-
ctive00)
Soc.
idessmi-
-Y.rup--24
un-nal
th-ual.nd-
83–
on
lina
spatial patterns and morphological features occuralong the sliding surface and fill area. Combining threcent data with the less accurate but numerouslier data issued from aerial photographs, topograpmaps and satellite images, we evaluated the volumric changes before, during and after the 1999 Tsaocatastrophic landslide event. In April 2002, the cvolume was about 0.137 km3. The comparison withcoseismic estimates suggests that about 8% ofvolume reflect erosion from September 1999 to Ap2002. About 29% of the fill volume, 0.116 km3, havebeen removed by erosion during the 2.5 years folloing the earthquake.
The volume of landslide evacuated by the Chinshui River during these 2.5 years is thus estimatebe up to 0.045 km3. With respect to usual amounof erosion, this large volume shows how effectivelandslide process may be, as an agent of rock massruption that facilitates subsequent erosion. The wmechanical properties of the landslide mass signcantly increased the long-term denudation rate instudy area. The study of the Tsaoling landslide revethat the probability for repeated major landslide eveis very high, which deserves careful considerationfar as natural hazard mitigation is concerned. Thepact of landslides caused by the destructive Chi-earthquake on erosion budgets and denudationover the short, medium and long-term will be analysin further studies.
Acknowledgements
The LiDAR raw data were provided by the Agrcultural and Forestry Aerial Survey Institute of Tawan. This research was supported by National ScieCouncil of Taiwan grant NSC 90-2116-M-001–0and by Taiwan–France cooperation in Earth Scien(French Institute in Taipei and National Science Cocil of Taiwan), and by the French CNRS (Pics Taiwa
References
[1] J. Angelier, J.-C. Lee, H.-T. Chu, J.-C. Hu, C.-Y. Lu, Y.-CChan, T.-J. Lin, Y. Font, B. Deffontaines, Y.-B. Tsai, Lséisme de Chichi (1999) et sa place dans l’orogène de TaiC. R. Geoscience 333 (2001) 5–21.
-
[2] Central Geological Survey (MOEA), Surface ruptures alothe Chelungpu fault during the Chi-Chi earthquake, Taiw25 000:1, 1999, 4 maps.
[3] H.-H. Cheng, Photogrammetric digital data processingTsau-Lin big landslide, in: ACRS, Taipei, 2000, conferenposter.
[4] W.-S. Chen, B.-S. Huang, Y.-G. Chen, Y.-H. Lee, C.-N. YanC.H. Lo, H.-C. Chang, Q.-C. Sun, N.-W. Huang, C.-C. LS.-H. Sung, K.-J. Lee, 1999 Chi-Chi earthquake: a case son the role of thrust-ramp structures for generating earthquBull. Seismol. Soc. Am. 91 (2001) 986–994.
[5] M. Chigira, W.-N. Wang, T. Furuya, T. Kamai, Geologiccauses and geomorphological precursors of the Tsaoling lslide triggered by the 1999 Chi-Chi earthquake, Taiwan, EGeol. 68 (2003) 259–273.
[6] N. Hovius, C.P. Stark, H.-T. Chu, J.-C. Lin, Supply andmoval of sediment in a landslide-dominated mountain bCentral Range, Taiwan, J. Geol. 108 (2000) 73–89.
[7] T.-L. Hsu, H.-P. Leung, Mass movements in the Tsaoling aYunlin-Hsien, Taiwan, Proc. Geol. Soc. China 20 (1977) 11118.
[8] J.-J. Hung, Chi-Chi earthquake induced landslides in TaiwEarthquake Eng. Eng. Seismol. 2 (2000) 25–32.
[9] J.-J. Hung, C.-T. Lee, M.-L. Lin, Tsao-Ling rockslides, Tawan, catastrophic landslides: effects, occurrence, and menisms, Geol. Soc. Am. Rev. Eng. Geol. 15 (2002) 91–115.
[10] H. Kao, W.-P. Chen, The Chi-Chi earthquake sequence: aout-of-sequence thrust faulting in Taiwan, Science 30 (202346–2349.
[11] D.K. Keefer, Landslides caused by earthquakes, Geol.Am. Bull. 95 (1984) 406–421.
[12] D.K. Keefer, The importance of earthquake-induced landslto long-term slope erosion and slope-failure hazards in seically active region, Geomorphology 10 (1994) 265–284.
[13] J.-C. Lee, H.-T. Chu, J. Angelier, Y.-C. Chan, J.-C. Hu, C.Lu, R.-J. Rau, Geometry and structure of northern surfaceture of the 1999Mw = 7.6 Chi-Chi, Taiwan earthquake: Influence from inherited fold belt structures, J. Struct. Geol.(2002) 173–192.
[14] H.-W. Liao, Landslides triggered by Chi-Chi earthquake,published Master Thesis, Institute of Geophysics, NatioCentral University, Chung-Li, 2000, 90 p.
[15] T.-Y. Shih, M.-H. Peng, Preliminary results of mapping earquake hazard with airborne Lidar system trials, in: 21st Annmeeting of Geodesy, Hsinchu, Taiwan, 2002, pp. 449–456
[16] Taiwan Provincial Water Conservancy Bureau, Tsaoling Laslide Archives, Taiwan, ROC, 1999 (in Chinese).
[17] Y.-B. Tsai, A study of disastrous earthquakes in Taiwan, 161895, Bull. Inst. Earth Sci. Acad. Sin. 5 (1985) 1–44.
[18] A. Wehr, U. Lohr, Airborne laser scanning – an introductiand overview, ISPRS JPRS 54 (1999) 68–82.
[19] S.A. White, Y. Wang, Utilizing DEMs derived from LIDARdata to analyze morphologic change in the North Carocoastline, Remote Sens. Environ. 85 (2003) 39–47.