
LAPPEENRANNAN TEKNILINEN YLIOPISTO - LUTPub
101
LUT UNIVERSITY LUT School of Energy Systems LUT Mechanical Engineering Mikael Parvikoski METHOLOGY FOR REAL-TIME HULL FATIGUE MONITORING OF AN ALU- MINIUM VESSEL 20.11.2020 Examiner(s): Prof. Timo Björk M. Sc (tech) Leo Siipola
-
Upload
khangminh22 -
Category
Documents
-
view
3 -
download
0
Transcript of LAPPEENRANNAN TEKNILINEN YLIOPISTO - LUTPub
LUT UNIVERSITY
LUT School of Energy Systems
LUT Mechanical Engineering
Mikael Parvikoski
METHOLOGY FOR REAL-TIME HULL FATIGUE MONITORING OF AN ALU-
MINIUM VESSEL
20.11.2020
Examiner(s): Prof. Timo Björk
M. Sc (tech) Leo Siipola
ABSTRACT
LUT University
LUT School of Energy Systems
LUT Mechanical Engineering
Mikael Parvikoski
Methodology for Real-Time Hull Fatigue Monitoring of an Aluminium Vessel
Master’s thesis
2020
100 pages, 34 figures, 5 tables and 1 appendix
Examiner: Professor Timo Björk
Master of Science Leo Siipola
Keywords: aluminium, vessel, ship, real-time, hull, structure, monitoring, health, fatigue,
SHM, HSMS, end-of-life, state-of-the-art
In this study, a general methodology of monitoring the real-time fatigue onboard aluminium
vessels was created. The created methodology was briefly demonstrated by using a case
example of a new build aluminium vessel. The requirements for hull fatigue monitoring of
the case vessel was discussed with the owner party.
The goal of this work was to find out what is needed for producing a real-time fatigue mon-
itoring system aboard an aluminium vessel. This includes the determination of methods for
real-time fatigue calculation, aspects of data collection and benefits from such system.
The methodology was constructed with the support of a literature review, previous studies
on the subject and current methods of ship design by regulatory parties. The methods pre-
sented are generally approved for use by the major class societies.
The initial requirements and regulations for monitoring greatly affects the process of imple-
mentation and the scope of data collection. For real-time fatigue monitoring, critical struc-
tures need to be found, analysed for severity and instrumentation planned. Further under-
standing of the responses can be achieved by collecting reference data, such as sea states,
vessel motions and locational information.
For the case vessel, an evaluation based on the created methodology was completed and a
structural model was produced. The global FE-model was analysed against a wave slamming
sea state. The responses were achieved by using an One-way FSI-method between the CFD-
and FEA-solvers. Further analysis was conducted by local sub-models and the structures
with stress responses were analysed for their criticality and instrumentation possibilities.

TIIVISTELMÄ
LUT-Yliopisto
LUT Energiajärjestelmät
LUT Kone
Mikael Parvikoski
Metodologia Reaaliaikaiseen Rungon Käyttöikätarkasteluun Alumiinisessa Aluksessa
Diplomityö
2020
100 sivua, 34 kuvaa, 5 taulukkoa ja 1 liite
Tarkastaja: Professori Timo Björk
Diplomi-insinööri Leo Siipola
Hakusanat: alumiini, alus, laiva, reaaliaikainen, runko, rakenne, seuranta, eheys, väsymi-
nen, väsymisenseuranta, runkorakenteiden seurantajärjestelmä, huipputek-
niikka, käyttöikä
Tässä työssä luotiin yleispätevä metodologia reaaliaikaisen väsymisen seuraamiseksi alu-
miinisille aluksille. Luotua metodologiaa demonstroitiin käyttämällä uudisrakenteista ta-
pausesimerkkiä alumiinialuksesta. Tapausesimerkkiin liittyvistä vaatimuksista rungon väsy-
misseurannalle keskusteltiin omistavan tahon kanssa.
Työn tavoitteena oli selvittää, mitä tarvitaan reaaliaikaisen väsymisvalvontajärjestelmän
tuottamiseen alumiiniselle alukselle. Tähän sisältyy reaaliaikaisen väsymislaskennan mene-
telmien, tiedonkeruuseen liittyvien kohtien ja hyötyjen arvioimisen selvittäminen.
Metodologian rakentumista tuettiin käyttämällä hyödyksi kirjallisuusselvitystä, aiheeseen
liittyviä aiempia tutkimuksia ja nykyisiä hyväksyttyjä metodeja laivasuunnittelussa. Ylei-
sesti, esitetyt menetelmät ovat suurimpien luokituslaitosten hyväksymiä.
Seurannalle asetetut vaatimukset ja säännökset vaikuttavat suuresti tällaisen järjestelmän
täytäntöönpanoon ja tiedonkeruun laajuuteen. Reaaliaikaista väsymisenseurantaa varten on
löydettävä kriittiset rakenteet, analysoitava niiden vaikutus lujuuteen ja suunnitella paikalli-
nen instrumentointi. Aluksen vasteita kuormitukseen voidaan paremmin ymmärtää ja hyö-
dyntää keräämällä referenssidataa mm. aaltotapauksista, aluksen liikkeistä ja sijainneista.
Tapausesimerkille suoritettiin metodologian mukainen arviointi ja luotiin rakennelaskenta-
malli. Globaali FE-malli altistettiin aallon iskukuormaa vastaaville aalto-olosuhteille. Ra-
kenteelliset reaktiot saatiin käyttämällä yksisuuntaista FSI-menetelmää CFD- ja FEA-ratkai-
sijoiden välillä. Rakenteiden jatkotutkimus suoritettiin käyttämällä paikallisia alimalleja.
Rakenteet, joissa havaittiin jännityskeskittymiä analysoitiin niiden kriittisyyden ja instru-
mentoinnin osalta.

ACKNOWLEDGEMENTS
I want to thank Elomatic Oy for helping to search and provide this excellent topic. I also
want to thank Professor Timo Björk for the support on understanding the fundamentals of
the approaches presented and great teaching throughout my studies at LUT. I wish to thank
Leo Siipola for his continued guidance, comments and evaluation during the production of
this work.
The COVID19-pandemic surely didn’t help with progress of this thesis, but after hours and
hours of conference calls, the completion was reached. In hindsight, video conference tools
proved their value quite fine. I hope everyone has managed to stay healthy.
Special thanks to the rest of my co-workers at Elomatic and an unnamed party for the per-
mission to use the case study in this work. Last but certainly not least, I would like to warmly
thank my family and my lovely girlfriend for their continued support throughout my studies.
Mikael Parvikoski
Lappeenranta 20.11.2020
5
TABLE OF CONTENTS
ABSTRACT .......................................................................................................................... 1
TIIVISTELMÄ .................................................................................................................... 2
ACKNOWLEDGEMENTS ................................................................................................ 3
TABLE OF CONTENTS .................................................................................................... 5
LIST OF SYMBOLS AND ABBREVIATIONS ............................................................... 8
1 INTRODUCTION ..................................................................................................... 10
1.1 Background information and regulations concerning the case vessel ................. 11
1.2 Research questions ............................................................................................... 11
1.3 Goal and limitations ............................................................................................. 11
1.4 Methods and hypothesis ....................................................................................... 12
2 PRELIMINARY DEFINITION FOR HULL MONITORING ............................. 14
2.1 Regulatory rules and guidelines for health monitoring ....................................... 15
2.2 Aluminium as material ......................................................................................... 16
2.3 Structural loads .................................................................................................... 17
2.3.1 Static loads ............................................................................................... 17
2.3.2 Frequency based dynamic loads .............................................................. 17
2.3.3 Slamming loads ........................................................................................ 18
2.3.4 Operational loads ..................................................................................... 19
2.4 Load detection by instruments and notations ...................................................... 19
2.5 Hull load response ............................................................................................... 20
2.6 Recognision of possible structure failure causes ................................................. 21
2.6.1 Failure by overload .................................................................................. 21
2.6.2 Failure by cyclic loading .......................................................................... 22
3 ANALYSIS METHODS FOR LOADS AND RESPONSES.................................. 24
3.1 Modelling the hydromechanics ............................................................................ 24
3.1.1 Semi-empirical methods .......................................................................... 26
3.1.2 Strip and Green function methods ........................................................... 26
3.1.3 Experimental methods ............................................................................. 27
3.1.4 Computational fluid dynamics ................................................................. 27
3.2 Critical detail recognition .................................................................................... 28

6
3.2.1 Simple beam theory ................................................................................. 29
3.2.2 Finite element method ............................................................................. 29
3.3 Failure mechanism estimation ............................................................................. 30
3.3.1 Plastic deformation .................................................................................. 30
3.3.2 Buckling ................................................................................................... 31
3.3.3 Static fracture ........................................................................................... 32
3.3.4 Fatigue fracture ........................................................................................ 32
4 REAL-TIME HEALTH CONDITION .................................................................... 34
4.1 Data collection ..................................................................................................... 35
4.1.1 Short-term data ........................................................................................ 36
4.1.2 Long-term data ......................................................................................... 37
4.1.3 Data storage ............................................................................................. 37
4.2 Technology .......................................................................................................... 38
4.2.1 Strain gauges ............................................................................................ 39
4.2.2 Pressure transducers ................................................................................. 41
4.2.3 GPS and INS ............................................................................................ 41
4.2.4 Wave radar and altimeter ......................................................................... 42
4.2.5 Data loggers and compute units ............................................................... 42
4.3 Input ..................................................................................................................... 42
4.3.1 Structural behaviour ................................................................................. 43
4.3.2 Material performance ............................................................................... 43
4.4 Pre-processing ...................................................................................................... 43
4.4.1 Cyclic load spectrum ............................................................................... 44
4.4.2 Stress determination and fatigue capacity ............................................... 48
4.4.3 Nominal stress method ............................................................................. 49
4.4.4 Structural Hot-Spot stress method ........................................................... 50
4.4.5 Effective notch stress method .................................................................. 53
4.4.6 4R method ................................................................................................ 54
4.4.7 Local strain method ................................................................................. 56
4.4.8 Fracture mechanics .................................................................................. 56
4.4.9 Capacity and load cycle relation .............................................................. 57
4.5 Post-processing .................................................................................................... 58
4.5.1 Damage estimation method ..................................................................... 58

7
4.5.2 On demand and storage ............................................................................ 59
4.5.3 Mechanical prognostics ........................................................................... 61
5 BENEFITS AND FEEDBACK FROM SHM ......................................................... 64
5.1 Design stage ......................................................................................................... 64
5.2 Feedback coupling ............................................................................................... 64
5.2.1 Load/response estimation ........................................................................ 65
5.2.2 Shape sensing ........................................................................................... 65
5.3 Hull service and life longevity improvement ...................................................... 66
6 THE METHODOLOGY CONCEPT ...................................................................... 69
7 CASE STUDY ............................................................................................................ 73
7.1 The requirements for hull monitoring .................................................................. 74
7.2 Regulations .......................................................................................................... 74
7.3 Design evaluation ................................................................................................ 74
7.4 Preliminary instrumentation needs ...................................................................... 75
7.5 Load and response analyses ................................................................................. 75
7.6 Design model ....................................................................................................... 76
7.7 Global calculation model ..................................................................................... 76
7.8 Structural analysis ................................................................................................ 80
7.8.1 Wave simulation ...................................................................................... 80
7.8.2 Fluid Structure Interaction ....................................................................... 81
7.8.3 Structural FEA ......................................................................................... 81
7.8.4 Sub-model evaluation for monitoring ...................................................... 82
7.9 Data collection evaluation ................................................................................... 85
7.10 Instrument technology ......................................................................................... 85
7.11 Real-time health condition surveillance .............................................................. 85
7.12 Mechanical prognostics ....................................................................................... 86
7.13 Maintenance and repair ........................................................................................ 86
8 DISCUSSION & CONCLUSIONS .......................................................................... 88
REFERENCES ................................................................................................................... 90
APPENDICES
APPENDIX I: Specifications for hull monitoring systems by class societies.

8
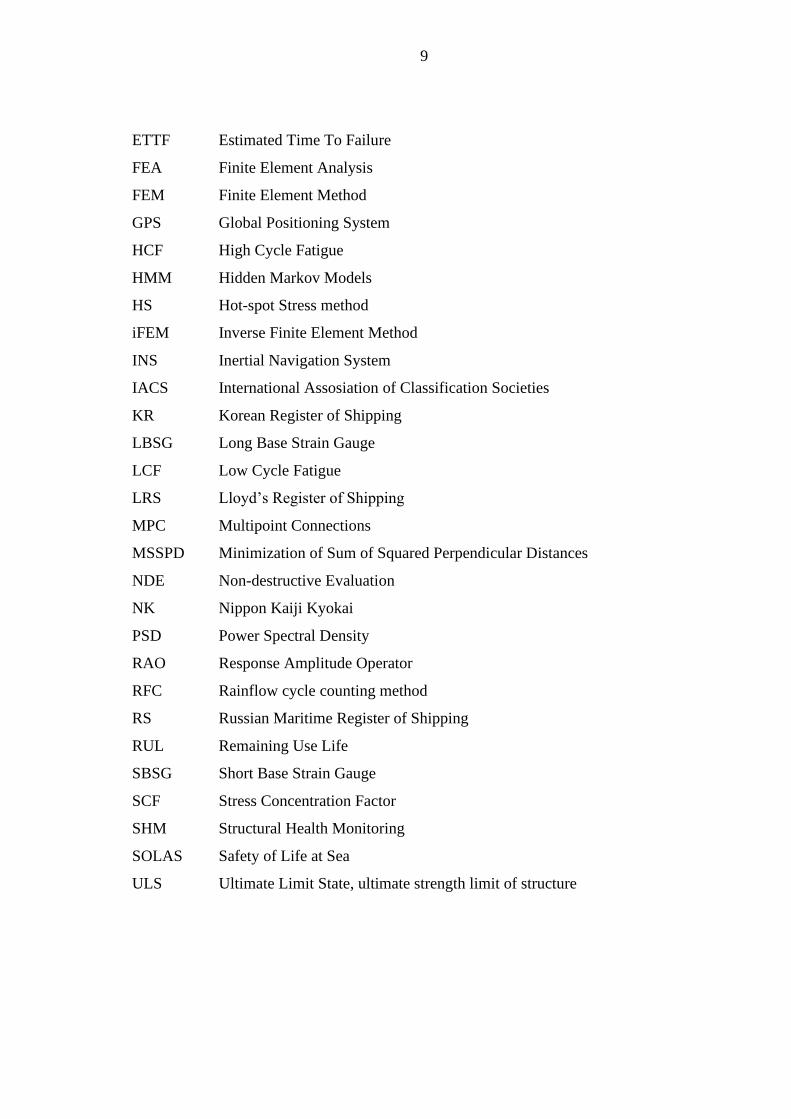
LIST OF SYMBOLS AND ABBREVIATIONS
Δ Displacement
σres Residual stress
BH Hull breadth
𝐷 Accumulated damage as per Palmgren-Miner rule
�� Damage rate expressed in time-domain
FAT Fatigue class of structural detail [MPa]
LH Hull length
ni Cycle amount for stress range i
Ni Cycle capacity for stress range i
R Stress ratio
Rm Material ultimate strength
rtrue Weld toe radius
Vmax Max. speed
1-D One-dimensional
2-D Two-dimensional
3-D Three-dimensional
ABS American Bureau of Shipping
ANN Artificial Neural Network
BV Bureau Veritas
CAD Computer Aided Design
CBM Condition-Based-Maintenance
CCEB Current-Condition-Evaluation-Based
CFD Computational Fluid Dynamics
CFRP Carbon-Fibre-Reinforced-Polymer
CSR Common Structural Rules
DNV-GL Det Norske Veritas - Germanischer Lloyd
ENS Effective Notch Stress method
EOC Environmental and Operational Condition
9
ETTF Estimated Time To Failure
FEA Finite Element Analysis
FEM Finite Element Method
GPS Global Positioning System
HCF High Cycle Fatigue
HMM Hidden Markov Models
HS Hot-spot Stress method
iFEM Inverse Finite Element Method
INS Inertial Navigation System
IACS International Assosiation of Classification Societies
KR Korean Register of Shipping
LBSG Long Base Strain Gauge
LCF Low Cycle Fatigue
LRS Lloyd’s Register of Shipping
MPC Multipoint Connections
MSSPD Minimization of Sum of Squared Perpendicular Distances
NDE Non-destructive Evaluation
NK Nippon Kaiji Kyokai
PSD Power Spectral Density
RAO Response Amplitude Operator
RFC Rainflow cycle counting method
RS Russian Maritime Register of Shipping
RUL Remaining Use Life
SBSG Short Base Strain Gauge
SCF Stress Concentration Factor
SHM Structural Health Monitoring
SOLAS Safety of Life at Sea
ULS Ultimate Limit State, ultimate strength limit of structure
10
1 INTRODUCTION
Controlled life cycle and reliability are important aspects for a product in this constantly
renewing world. New innovations for creating more reliable and efficient designs is in a key
role for future proofing a product to minimize the impact on the environment and saving
costs. The current aspiration in certain applications is to remove risks for premature failure
which could lead to the end of the products service life.
These trends are also affecting the maritime industry. A drive to create even more reliable
and environmentally friendly solutions for offshore structures and vessels has already gen-
erated a lot of discussion and actions for new innovations from the top operators. Digital
twins of an operating ship give deeper insight into the vessel health during operation by
utilizing sensor monitoring (Storhaug, 2019).
This master’s thesis is a concept design project of creating a methodology for real-time fa-
tigue monitoring of an aluminium vessel using maritime proven technologies. The example
case used for this thesis is designed according to the VTT workboat instructions, an organi-
zational guide for building workboats from the Finnish open publishing, fully state-owned
LLC (VTT LLC, 2020). The workboat instructions are based on a European standard for
small crafts on the sea, called SFS-EN-12215. The workboat guide acts as a set of instruc-
tions for a regulatory approval for operation of the vessel when sailing under the Finnish flag
(VTT Expert Services Oy, 2016).
The research is produced for Elomatic Oy as a part of an improving monitoring platform,
under development to enhance the use of collectable data and improved design cycles for
future projects. The platform under development is set to enhance the data collection on
every aspect and providing more essential data to customers for greater control over the life
cycle of their application. Including more sub-systems into the mainframe creates a variable
platform to further grasp knowledge and ingenuity for design improvement when the data
sets are combined.

11
1.1 Background information and regulations concerning the case vessel
As the aluminium vessel is a new build, the customer has asked for certain characteristics
for efficient use in demanding environmental conditions. The vessel should be operational
at any climate year around and reach operational speeds of over 20 knots. The main dimen-
sions for the vessel are; length of 20 m, width of 6 m and the displacement of 50 t.
The VTT workboat guide has several categories of ship classes, ranging from A to D. The
design classes feature different significant wave heights and typical wind loads as measured
in the Beaufort scale (VTT Expert Services Oy, 2016, pp. 15-16). The case example is set in
class A, with the highest demand for environmental loads. The ship has an extra notation for
ice driving capabilities, requiring additional strengthening.
1.2 Research questions
The methodology achieved in this study aims to answer at least the following research ques-
tions:
- What prerequisites are there for hull structural health monitoring?
- What data is needed for real-time fatigue monitoring?
- How is the functionality of such system ensured and utilized?
These questions are covered and analysed throughout the study. As the questions could be
answered indirectly during the study script, a compilation of answers is discussed in the late
chapters.
1.3 Goal and limitations
This study aims to compose a methodology for a real-time fatigue monitoring on an alumin-
ium vessel. Building the fully working system is based on multiple aspects in addition to this
study, including the measuring devices fitted on the vessel, the ready computer system for
continuous calculation and devices displaying the real-time damage rate.
The real-time fatigue methodology in this work is focused on instrumented monitoring and
continuous calculation method. Other methods are however briefly discussed in context for
comparison to long-term monitoring.

12
This study is dedicated on reflecting the needs to produce a structural health monitoring
(SHM) system for the hull of an aluminium vessel by discussing the needed components of
theory and using a concept case of an aluminium vessel built for real purposes. This includes
determining the correct method for the real-time calculation, finding the most critical details
for data collection, monitoring and estimating the benefits from a ready system. The system
with included peripherals is not considered in this study. This noted however, the thinking
process will always feature a line of thought on the ready system as it helps to understand
the complete functionality. This study does not feature experimental testing and relies
mostly on information found from literature.
The global strength of the case vessel is not in the focus, this step has already been addressed
in the design stages so far and doesn’t need to be reviewed. The global and local load re-
sponses are used to find the critical details in the case study. However, if structural details
are found with insufficient strength, design changes are proposed.
1.4 Methods and hypothesis
As most vessels are built to sail according to a regulatory approval, the regulations should
be studied and reviewed for notations regarding this kind of a system. The review should
always be based on the design guidelines to which the vessel is designed for and being built
upon. Recommended practices can be utilised though if available.
Next, the critical details and failure modes need to be found. This requires an analysis based
on vessel global and local loads acting on the structures. As many vessels experience heavy
use and climate conditions, the global loads should be based on the most common and critical
environmental and operational conditions (EOC’s).
The found critical details are then evaluated for their potential failure, either by overload
situation exceeding the load bearing capacity or cyclic, fatigue inducing loads leading to
crack propagation and final fracture. The structural details are then individually assessed for
the type of calculation method should be used and what is their role in the bigger picture for
hull reliability.

13
Real-time calculation is based on constantly updating situation on the vessel’s structures;
thus, continuous data collection is needed. The data needed is evaluated and its uses ana-
lysed. The devices used to collect the data and their role in the system is discussed and re-
viewed.
The hypothesis for the study is to produce a methodology for real-time fatigue monitoring
and calculation concept for aluminium vessels. When this study is further developed to a
system-state design it will benefit the customer by enabling the use of condition based
maintenance schedules and better understanding of the vessels behaviour during operation.
The better understanding of vessels conditions under use improves crew driving performance
and lessens the caused damage.
14
2 PRELIMINARY DEFINITION FOR HULL MONITORING
In this chapter, the main behaviour characteristics of a ship’s hull in operation is discussed.
It is important to recognise the basic load and response events for constructing of a hull
monitoring system. The use of monitoring systems is growing fast due to the increased in-
terest in environmental health and through regulatory matters. The SHM-systems imple-
mented however are different when considering dissimilar ship types. Guan (2015, p. 5)
expressed the potential solution for hull SHM-systems as follows: “An ideal technique for
ship hull monitoring should possess the features of simplicity, reliability, scalability and
affordability.”
A convention party Safety of Life at Sea (SOLAS) has taken the monitoring in ships as a
safety measure against accidents. As far as from year 2004, the regulatory guidelines have
required ships with over 500 gross tonnage to have a monitoring system capable of recording
positional data, such as speed, coordinates and other safety related information to ensure that
the ship is operational and on-call. (Hulkkonen, et al., 2019, p. 416; Phelps & Morris, 2013,
p. 8)
From a methodology viewpoint, it is important to recognise what is relative to construct a
SHM-system on board an aluminium vessel and how it should be utilized. Aluminium as a
material already brings differences in the application of the SHM-system. Usually alumin-
ium is used on smaller vessels with more complex structures and thus have more local fatigue
behaviour compared to larger ships. Recent trend is however bringing aluminium to larger
vessels as well, as demonstrated by the recent build contract for 13 000 gross tonnage, 130
m long twin hull high speed passenger ship by Incat Tasmania Pty Ltd in Australia (Incat,
2019).

15
2.1 Regulatory rules and guidelines for health monitoring
As with many aspects in shipbuilding, regulatory guides and rules are to be followed for
approval of usage. The major class societies recognise these SHM-systems for their envi-
ronmental and safety benefits. All regulatory guides and rules concerning SHM from major
class societies are listed in Table 1. More detailed specifications are listed in Appendix 1.
Table 1. Class remarks and guides for SHM-systems on ships (Dessi, et al., 2018, p. 96).
Classification Society Recommended practise or
rule Notation
Lloyd’s Register of Shipping
(LR)
ShipRight Digital Compli-
ance: Procedure for the Ap-
proval of Digital Health
Management Systems
SEA (HSS), SEA (ICE)
Det Norske Veritas –
Germanischer Lloyd
(DNV-GL)
DNV GL Hull HMON HMON
American Bureau of Ship-
ping (ABS/ABS ice)
Guide for Hull condition
monitoring systems
HM1, HM2, HM3, ILM
(ICE)
Bureau Veritas (BV) Rules for Classification:
MON-HULL MON-HULL
Russian Maritime Register of
Shipping (RS)
Part XVII: Section 17: Nota-
tion of HMS for hull moni-
toring systems fitted onboard
HMS
Nippon Kaiji Kyokai (NK) Rules for Hull Monitoring
Systems HMS
Korean Register of Shipping
(KR)
Rules for Classification: Ad-
ditional installations – Hull
monitoring systems
HMS
China Classification Society
(CCS) Hull Monitoring Systems HMS
16
2.2 Aluminium as material
As the current trend is to favour more environmentally friendly solutions for naval new-
builds, aluminium has proven to be a great material for lightweight designs. It should be
noted though, that aluminium has inferior strength capabilities when compared to traditional
ship-building steels. As discussed by a few studies, structures built from aluminium are not
as well researched even up to this date. (Sielski, 2007, pp. 1-4; Soliman, et al., 2019, p. 2)
Aluminium extruded profiles give designers great opportunities to utilise the material as they
please by enabling the use for more non-standardised cross-sections. The extended freedom
is better for designing lightweight crafts due to great performance gains. (Tveiten, et al.,
2007, p. 255)
The uses for aluminium are not only limited to strength and weight ratio, but other ad-
vantages over more traditional steel materials are found. Most commonly, 5000- and 6000-
series aluminium’s are used in commercial and bureaucracy ship applications requiring high
speed and reliability. 5000-series aluminium alloys have great corrosive properties, advan-
tageous in parts in direct contact with corrosive and salty seawater. 6000-series offers gains
in weldability. (Sielski, 2008, p. 2)
Despite the great strength to weight ratio, possibility for extruded complex profiles and su-
periority in corrosive properties, aluminium certainly has some trade-offs. Under cyclic load-
ing, aluminium has much higher crack propagation rate than traditional steel in shipbuilding.
If steel and aluminium are used in similar conditions, aluminium structures would fail due
to fatigue faster than steel. This is even more critical in high speed crafts experiencing more
slamming loads large in scale. (Soliman, et al., 2019, pp. 5-6; Sielski, 2007, p. 5)
Usually created during fabrication, residual stresses are also heavily influenced by material
properties. Aluminium has much higher thermal expansion coefficient as mentioned before.
This leads into greater distortion under temperature variation, such as in an event of welding.
Greater distortion could potentially mean larger concentrations of residual stresses, but alu-
minium has elastic modulus of only one-third compared to steel. These together cause larger
distortions but lower residual stresses. Of course, dissimilar alloys behave differently, but in
general they have quite similar characteristics. (Sielski, 2008, p. 4)

17
2.3 Structural loads
To construct a hull monitoring system for real-time fatigue calculations, the loads affecting
the vessels structures must be found. All seagoing vessels experience static and dynamic
loads during their operation. The effect on fatigue by load type varies based on the ships
EOC demands and type. It is important to recognise situations which might cause failure due
to overloading and concurring events that affect the vessels fatigue life by cyclic loading.
2.3.1 Static loads
As the ship stays afloat during calm seas or otherwise in stable water, the hull of the ship
experiences hydrostatic pressure due to buoyancy forces caused by the displaced water. The
opposing forces caused by ship weight inertia effects and buoyancy by displaced water
causes shear and bending moment on the hull structures. The variation of these types of loads
along the length of the ship are usually minimal in smaller vessels and more pronounced in
bulk carriers due to the constant shifting of cargo weight amounts. (Phelps & Morris, 2013,
p. 2)
2.3.2 Frequency based dynamic loads
Hull fatigue in vessels is mostly caused by dynamic, wave induced loads. The pressure on
the hull varies as the ship moves in the ocean. In the worst case scenario, extreme sea con-
ditions may lead into premature failure of critical hull structures (Smith, 2007, p. 1).
Waves of the sea are considered as low frequency loads and are usually dominant in slower,
larger ships such as bulk carriers, cruise ships and container vessels. The case example used
in this study is a higher speed, partially planning craft constructed from aluminium operating
in vastly changing conditions and has more complex EOC demands. Low frequency loads
could still be present in smaller vessels and should not be neglected. The prediction of ship
reaction in waves gets more complex as high sea states can represent non-linearity. The most
significant sea states usually still represent and lead to low amplitude loads and thus act more
linearly (Sielski, et al., 2002, p. 100).
Variating loads from engine and propulsion systems causing vibrations on the vessel hull
are considered high frequency loads. All loads operating near the ships natural frequency
can be considered excitation inducing. The amount of excitation force is mostly dependent

18
on the natural frequency of the ship and offset mass of the vibration source. High displace-
ment responses cause damage and contribute to fatigue life. Class societies usually use on
board comfortability standards for vibrations e.g. acceptable levels of excitation aboard ships
for approval (Lloyd's, 2015, p. 1).
Springing and whipping are also continuums from these low and high cycle dynamic loading
scenarios. In springing, excitation forces from waves cause the hull to resonate. The excita-
tion period could be long enough to cause fatigue damage accumulation; thus, decreasing
the life of the ship. Whipping is caused by wave impact on hull resulting in high frequency
oscillations, also potentially leading to fatigue damage accumulation. Springing is however
considered more dominant in larger vessels with lower natural frequencies. (White, et al.,
2012, pp. 1-2)
2.3.3 Slamming loads
Singular or combined effects of major heave and pitch motions result in bow lift and impact
against opposing waves, causing high peak stresses and violent transient vibrations ulti-
mately affecting the damage accumulation. These slamming events are very known to hap-
pen for high speed vessels capable of planing (Phelps & Morris, 2013, p. 3). In heavier seas,
a high-speed jump of the wave crest could potentially cause damage to the vessel if the bow
impacts between wave trough and crest at a certain angle.
Slamming load effect on fatigue should be assessed along with global wave loads (Magoga,
et al., 2017, p. 1). Slamming inherently causes the mentioned whipping and springing, the
vessels response to high frequency and sudden impact. Magoga (2017) assesses whipping as
a reaction from slamming loads to contribute greatly to accumulated damage in their re-
search. The research however also notifies, that the occurrences depicted in the study are a
source of only one vessel and few strain gauges. The structural response to whipping could
potentially have less effect in different locations of the hull not included in their research.
As expressed by Daidola & Mishkevich (1995, p. 23): “Perhaps the most significant factors
which govern or influence slamming conditions are the length of ship, sea severity, ship
speed, and course angle relative to predominant sea, ship loading condition, overall ship

19
form as it affects ship motion, and also fullness or flatness of bottom forward.” The states
for perfect slamming are quite complex.
2.3.4 Operational loads
Specialized smaller vessels have vastly different operational demands compared to larger,
heavily standardized ships carrying cargo; bulk or passengers. All the different operational
requirements bring more load cases to be considered when designing the vessels. Depending
on operational needs, the loads caused by them could affect the fatigue damage accumulated
and can be evaluated in the fatigue calculations. If certain operational equipment are critical
for functionality and needed constantly, structural monitoring should be considered to fore-
see the possible need for maintenance and sudden failure prevention. Operational loads could
consist of, but are not limited to following:
- Helicopter landing equipment
- Ice-breaking capability
- Onboard weaponry or defence systems
- Rescue, contamination and towing equipment usage
- Cargo space dynamics, moving in transit
- Cargo handling cranes
2.4 Load detection by instruments and notations
It should be noted that small and sudden loads are not easily recognised by the measuring
devices. Vibrations, such as whipping and springing have high occurrence frequencies. High
frequency loads should be measured using higher sampling frequencies (Phelps & Morris,
2013, p. 3).
Longer duration loads are easier to detect with measuring devices, such as strain gauges,
accelerometers and pressure transducers. On smaller vessels, detection is harder due to very
local load occurrences and more complex geometry. Due to less material usage, temperature
variation is also more pronounced on smaller vessels. This temperature variation should be
noted at least in the case of strain gauges usage to avoid distorted results (HBM, 2020).
20
Thermal changes have different effects based on the material being used. Elongation of a
structure is down to the thermal expansion coefficients, which are dependent on the material.
Aluminium has higher coefficient than steel, so temperature variations have larger effect on
vessels built using aluminium (Zhang, et al., 2013, p. 8).
2.5 Hull load response
When any of the loads described in Chapter 2.2 are in effect on the vessel of interest, the
hull has a response by transmitting the forces onwards through the primary, secondary and
tertiary structures. These responses are recognised by all the major class societies part of
International Assosiation of Classification Societies (IACS). (Hopkinson, et al., 2002, p. 5)
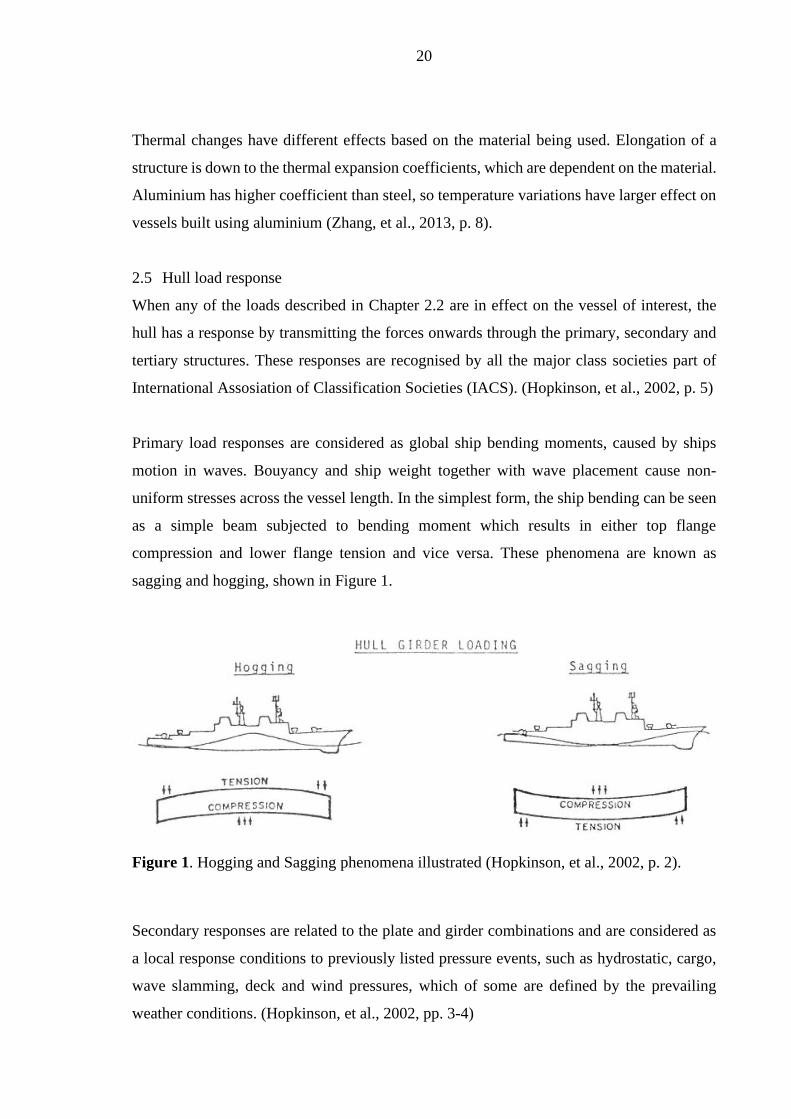
Primary load responses are considered as global ship bending moments, caused by ships
motion in waves. Bouyancy and ship weight together with wave placement cause non-
uniform stresses across the vessel length. In the simplest form, the ship bending can be seen
as a simple beam subjected to bending moment which results in either top flange
compression and lower flange tension and vice versa. These phenomena are known as
sagging and hogging, shown in Figure 1.
Figure 1. Hogging and Sagging phenomena illustrated (Hopkinson, et al., 2002, p. 2).
Secondary responses are related to the plate and girder combinations and are considered as
a local response conditions to previously listed pressure events, such as hydrostatic, cargo,
wave slamming, deck and wind pressures, which of some are defined by the prevailing
weather conditions. (Hopkinson, et al., 2002, pp. 3-4)
21
The same conditional effects are also responsible for the tertiary structure responses. Tertiary
responses are referred as local plate stresses bound by orthogonal stiffeners. The lateral loads
and pressures on the local plates are added to the primary and secondary load responses. The
effect of this addition is dependent on the location, nature of the load and area of effect.
(Hopkinson, et al., 2002, p. 4)
The responses to wave loads are described as Response Amplitude Operators (RAO) in the
maritime industry, and consist of the ship’s transfer functions in various sea states. Sielski
(2002) describes RAO’s as: “The amount of response to a unit wave height of some hull
response parameter, such as bending moment. The value of the response is determined over
the range of all anticipated wave encounter frequencies.” RAO’s can be used to describe
many behaviour elements, such as stress, moment, displacements and angular
misalignments.
2.6 Recognision of possible structure failure causes
After recognision of hull responses for the ship type of interest, it is important to know how
the load responses further develop into failure mechanisms and which mechanisms are
noteworthy for the SHM-system to track and notify off.
2.6.1 Failure by overload
As noted earlier, aluminium has inferior strength capabilities when compared to traditional
ship building steel materials. Aluminium as a material in shipbuilding has been generally
used on smaller vessels, less prone for global strength failure due to different hull geometry
and load characteristics. Specialised small crafts usually have highly irregular EOC load
scenarios and thus are prone for overload induced failure mechanisms. (Sheinberg, et al.,
2011, p. 2)
Overload is an event where the structures load bearing capacity has been exceeded by an
extreme load. Typically, this event leads into failure of the structure by stability loss. In naval
applications, this type of an event is prone to occur when there is a sudden change in weather
conditions or poor judgement by the crew of choosing to operate in conditions which are not
suitable for the vessel and surpass the weather conditions set by the design codes.
22
Common behaviour in overload situations is buckling of the structure; thus, stability loss.
Buckling is a phenomenon related to the geometry of a structure and the material properties
(Phelps & Morris, 2013, p. 4). The possible buckling locations in an event of overload should
be studied on ship to ship basis to find the most critical details.
2.6.2 Failure by cyclic loading
Fatigue has been a known failure mechanism of ships for a long time. Class societies have a
set of rules for calculation and prediction of such failure events for many ship types, mainly
for the ones built from steel. Fatigue calculation rules for smaller vessels, frequently built
from aluminium, are not yet addressed widely by the class societies, though some recom-
mended practices do exist (Sielski, 2008, pp. 3-4).
For larger ships, the fatigue life can evaluated using by simple beam theory. The assessment
is then based on the scantling value calculated with estimation of cycles during ships lifetime
and using the global load scenarios. This method is applied to multiple girder sections. Local
fatigue is also considered in larger ships, especially in widely known location, such as open-
ings and girder discontinuities, end connections and crossings. (Phelps & Morris, 2013, p.
5)
When addressing smaller vessels with more complex geometries, potentially out of reach for
simplified methods, the local fatigue is more predominant. The hull structures aboard smaller
vessels, also the ones built using aluminium, have vastly different structural configurations
based on their EOC needs. Though their framing systems have similarities to larger, heavily
standardised ships, the variation in operational needs and structure complexity leads into less
standard procedures for fatigue assessment.
Det Norske Veritas – Germanischer Lloyd (DNV-GL) has however a fatigue analysis meth-
odology guide for fatigue life estimation to high speed and light crafts. This guide points out
the most known critical areas such as stiffener transitions, all cross-structures, discontinuities
of structural members, pillar connections and engine foundations. The criteria relies on
global and local load scenarios, mostly for the frequently occurring EOC loads. (DNVGL-
RU-HSLC, 2019, p. 21)

23
The mentioned practise emphasizes on individuality per structural detail and basis on fatigue
calculation by Palmgren-Miner linear cumulative damage usage, which will be covered in
more detail in Chapter 4.5. The specified criteria by DNV-GL should be satisfied with S-N
data of mean value. (DNVGL-RU-HSLC, 2019, p. 21)
Categorization to high-cycle fatigue (HCF) and low-cycle fatigue (LCF) is helpful in esti-
mation of criticality. Events especially contributing to LCF are potentially dangerous if very
frequent. LCF is due to cyclic loading event passing the natural yield limit of the material
and has a low cycle count until failure. LCF is usually caused by tension and compression
by large loading and unloading events contributing to high strains. LCF is evaluated by
strain and not stress. (DNVGL-CG-0129, 2015, p. 211)
HCF is the usual fatigue caused by vessels movement in waves, contributing to stresses un-
der the material’s yield limit and evaluated through stress-cycle-correlation. HCF also in-
cludes the fatigue effects resulting from vibration and structure excitation.
24
3 ANALYSIS METHODS FOR LOADS AND RESPONSES
When constructing a SHM-system, the steps for producing a working system is dependent
on few notations:
- What are the minimum requirements by regulatory standards if there are any?
- What is wanted from the system?
- How accurate system is needed?
These notations define the need of data collection and overall complexity of the calculation
during each step in building the intended system. Most accurate systems can give predictions
of remaining hull life during operation by conducting continuous load history- and 2D-Rain-
flow analysis. The most simple systems however, could only utilize the calculated fatigue
capacity by using the pre-processed values and weather prediction models (Hulkkonen, et
al., 2019, pp. 425-426). Vessels with highly predictable voyages could utilize the weather
prediction models quite comfortably. SHM-systems can be very individualized due to the
nature of different ship types and their operational needs.
3.1 Modelling the hydromechanics
Still nowadays, aluminium vessels are considered as small, agile and as described earlier,
not as widely researched as their steel counterparts. This has an effect for load determination
when in search of the load responses for critical detail analysis. The global load scenarios
used to find the responses are defined by regulatory parties, usually referred as Common
Structural Rules (CSR). However, as the purpose is to analyse detail structures in the ship’s
hull, direct calculation methods are to be utilised.
There are multiple methods for assessing the hydromechanics for aluminium vessels, some
known for decades and some proven better for modern day. For SHM-systems, the correct
sea state modelling in finding the critical hull structures is key. Potential sea state evaluation
can be completed with several methods, ranging from simple semi-empirical equations to
complex hydromechanics simulations using computed bodies of water (Sielski, et al., 2002,
pp. 60-62).

25
As time and computational power can be limited, the methods for modelling the hydrome-
chanics can be arranged by their accuracy and impact on computational needs as shown by
Figure 2.
Figure 2. Hydromechanic modelling and computational effort (Rosen, et al., 2020).
The hydrodynamic pressures on hull can be represented by few methods with various accu-
racy’s and suitability’s for different ship types. In most complex methods, ships motion in
waves can be considered as hydroelastic, coupling the hydrodynamics and structural elastic-
ity (Hirdaris, et al., 2010).
The vessel behaviour in waves can be modelled as following:
- Quasi-Static
- Quasi-Dynamic
- Hydroelastic
Quasi-Static considers the hydromechanics as a static pressure on the hull, neglecting the
inertia effects due to slow application of the load. The calculation model is then being held
by nodal constraints and the hull is rigid. This means that the Quasi-Static method doesn’t
feature harmonic responds to vibrations caused by sudden impacts, such as slamming loads.
Using semi-empirical equations as global strength analysis for pressure distribution on ves-
sel hull is considered Quasi-Static. (Piro, 2013, p. 7)

26
Quasi-Dynamic is similar in sense of hull rigidity but includes the effects of inertia for model
stabilization against the hydrodynamic hull pressures; thus, giving a better representation of
vessels reaction is waves. Quasi-Dynamic analysis could consist of retrieving hull pressures
by using strip and panel methods in time domain explained in Chapter 3.1.2 or modelling
the waves by using Computational Fluid Dynamics (CFD) discussed in Chapter 3.1.4.
Hydroelastic model features the effects from the Quasi-Dynamic approach, but also consid-
ers the elastic behaviour of hull structures. This means that vibration effects, such as har-
monic responses from sudden impact loads can be simulated. In larger ships, problematic
springing phenomenon in heavy seas can be assessed by using the hydroelastic approach.
(Piro, 2013, pp. 1-3)
3.1.1 Semi-empirical methods
For defining the moments and forces the hull structures faces, the design rules usually point
out the prevailing bending moments and pressures for the most key load cases of static
strength design and scantlings against limit states. For example, the design code can define
the global wave moments and bow slamming forces. The rationally based design always
considers the extreme values for the loads. Depending on ship type and assumed worst load-
ing conditions, the loads described for direct calculation are often developed from the rule
scantling semi-empirical formulae and are based on equivalent regular waves and other pre-
sumed loads depending on whether global or local strength is studied. Their uses in direct
calculation is however established. (Hughes & Paik, 2010, pp. 118, 131, 161)
3.1.2 Strip and Green function methods
Wave interaction with a vessels hull is considered as a three-dimensional (3-D) problem.
Strip method reduces this problem into a 2-D form for more efficient calculation procedures.
The outer hull is divided into multiple strips and the hydrodynamic pressure on the hull is
assessed by the 2-D flow on the surface using analytical or panel method for each strip.
Method fails in waves shorter than one-third of ships length. (Hughes & Paik, 2010, pp. 157-
158)
27
This method has multiple variations, such as a non-linear interpretation to accommodate
high speed crafts by introducing the effects from planing. Commonly they still lack the ef-
fects from uniform reactions of hull panels to pressure and the 3-D effects of hydromechan-
ics. (Razola, 2013, pp. 22-24)
Green function method, sometimes also referred as the panel method, is based on dividing
the outer hull into small surfaces. In this method, a velocity potential is set for every wetted
surface based on the displaced water and actions that cause lift, such as manoeuvring condi-
tions. (Hughes & Paik, 2010, p. 158)
Many third-party software’s utilize these methods for simulated wave responses on ship
hulls and for plotting hull pressures for further analysis by direct calculation. For a few ex-
amples, GL ShipLoad uses frequency based linear strip method (Rörup, et al., 2008, p. 2)
and Ansys Aqwa uses the 3-D panel or Green function method for hydrodynamic estimations
(ANSYS, 2010).
3.1.3 Experimental methods
As the regulatory formulas are developed to be used for ship scantling checks and stress
reactions to limit states during the iterative design phases, their role in finding fatigue and
overload critical structures for operational situations can be too inaccurate; thus, the use of
experimental methods have been helpful in retrieving wanted RAO’s for more irregular sea
states.
Conducting water tank experiments for scale model vessels is however very time consuming
and costly. The towing experiments can’t also depict correctly many sea states, wave forms
and wave slamming events. Pressure data interpolation to further studies, e.g. direct calcu-
lation for global strength, is proven to be difficult as well. (Johnson, et al., 2018, p. 634)
3.1.4 Computational fluid dynamics
Vessels facing highly irregular operating conditions would benefit mostly from more simu-
lated calculation methods as well as from combining well established methods with more
state-of-the-art solutions. As computer processing power has taken notable leaps during the
28
last few decades, complex calculation tasks can be completed by using more advanced meth-
ods, such as Computational Fluid Dynamics (CFD).
CFD enables a wide variety of simulation possibilities. Inclusions of multiple sea states in
correct wave forms and manoeuvring conditions give a more realistic representation of the
vessel’s behaviour in the given conditions. The uses of CFD in manoeuvring conditions were
already recognised and discussed by Bertram (2000, p. 16) in the beginning of 21st century.
The simulation of manoeuvring conditions and ship behaviour, such as whipping and spring-
ing in CFD is now possible (Hirdaris, et al., 2010).
If possible, more state-of-the-art solutions should be utilised in defining the load character-
istics when constructing a SHM-system. As SHM-systems for specialised vessels them-
selves are mostly state-of-the-art applications, there is no reason to use older and possibly
outdated technologies for defining load characteristics to modern vessels. Especially analy-
sis of fast boats benefit greatly from CFD (Garbatov, et al., 2009, p. 805).
CFD shows its strengths best when used along with Finite Element Method (FEM). The
coupling can be divided into one- and two-way scenarios. With one-way scenario, the pres-
sure and inertia reactions are solely carried from the CFD solver into Finite Element Analysis
(FEA). The method employs rigid body motions to the FE-mesh for structural analysis. Two-
way coupling or co-simulation is used to transfer reactions between the two methods. This
way, all displacement experienced by the FE-model can be transferred back to CFD, updat-
ing the fluid domain correctly. The two-way method can be divided to a weaker and stronger
couplings. (Lakshmynarayanana, 2017, p. 76; Takami & Iijima, 2019, pp. 346-359)
3.2 Critical detail recognition
As the key interest is to find and recognise structures prone for failure due to overload or
fatigue, the vessels hull has to be studied by conducting direct calculation or 3-D numerical
procedures. These methods can also be utilised in global, longitudinal, beam and detailed
strength assessment if the design code allows for it. It is possible to use analytical methods
to estimate stress concentrations, but the task would be far too tedious to complete due to
possibly a high number of hotspots and critical structures.
29
3.2.1 Simple beam theory
Most prismatic structural profiles can be considered as a simplified beam section. This sec-
tion can be then analysed for adequate section modulus against cyclic loading. These meth-
ods would be only applicable for assessing the stress and damage on stiffener sections and
as such are more suitable for vessels with more concurring structures. Methodology for as-
sessing beam section fatigue life has been established by the members of IACS. This sim-
plified method enables faster criticality recognition and fatigue life assessment of critical
girder sections and stiffeners, but can’t represent local stress concentration behaviour
(Sielski, et al., 2002, p. 88).
3.2.2 Finite element method
FEM can be used to find the critical structures and to evaluate a need for fatigue assessment
and locations for measuring devices during operation. Depending on the source for the load
cases, whether the analysis will be based on regulatory semi-empirical hull pressures from
extreme conditions, computer simulation with CFD or something else, the combination of
load cases should be estimated based on the operational situations for a more realistic ap-
proach and viable for multiple load cases simultaneously. (Zilakos, et al., 2013, p. 282)
This method consists of multiple FE-models. A whole ship, also known as global FE-model
is used for global load FEA to find stress responses and hotspot stress areas for further anal-
ysis. Whether the area is considered critical for overload or fatigue, local model is created
for fine detailed analysis either to estimate the ultimate capacity for high stresses or number
of cycles for failure. (DNVGL-CG-0129, 2015, pp. 77-94)
The implementation of loads and boundary conditions for a comprehensive FEA is always
bound to the source of the load scenario deprivation. When using loads depicted by the de-
sign codes for global and local cases, the implementation is usually dictated by the code.
When using more state-of-the-art load simulation methods, such as CFD for hull pressures
to various sea states, the implementation of loads could be based around different domains,
such as time (Takami & Iijima, 2019, pp. 351-352).
30
3.3 Failure mechanism estimation
When critical structural elements are found, the possible prevailing failure mechanisms are
to be assessed. Failure mechanisms are introduced by two groups of loads; overload and
cyclic. Overload is a load surpassing the ultimate strength and cyclic as notable load events
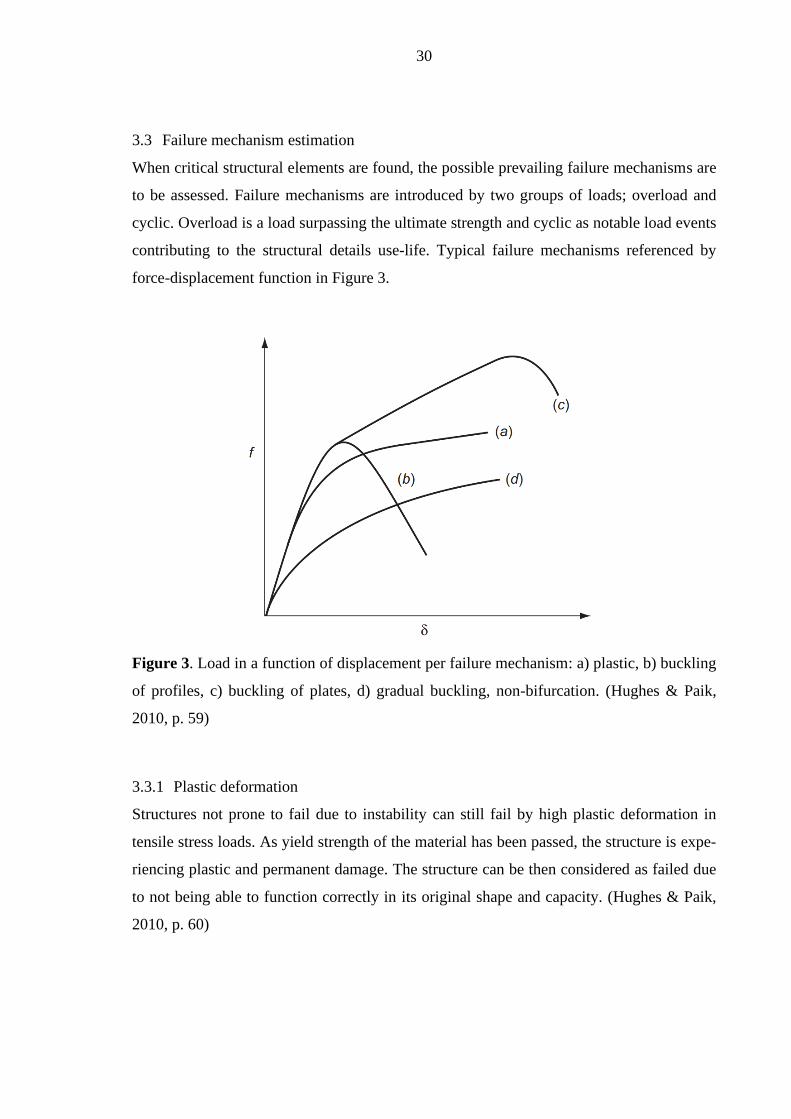
contributing to the structural details use-life. Typical failure mechanisms referenced by
force-displacement function in Figure 3.
Figure 3. Load in a function of displacement per failure mechanism: a) plastic, b) buckling
of profiles, c) buckling of plates, d) gradual buckling, non-bifurcation. (Hughes & Paik,
2010, p. 59)
3.3.1 Plastic deformation
Structures not prone to fail due to instability can still fail by high plastic deformation in
tensile stress loads. As yield strength of the material has been passed, the structure is expe-
riencing plastic and permanent damage. The structure can be then considered as failed due
to not being able to function correctly in its original shape and capacity. (Hughes & Paik,
2010, p. 60)
31
In calculation, local plastic deformation can be assumed to accumulate when stress levels
are passed the real yield limit of the material. Local yielding is present even earlier. Geom-
etry has a great effect when assessing tensile behaviour. Simple beams transfer bending
stress to localised tensile stress on the beam flange, when plates, usually uniformly loaded
experience yielding at centre and edges (Smith, 2007, p. 5).
As already discussed, when using direct calculation, such as with FEM, the stresses surpas-
sing the elastic region of the material should be studied further for probable failure. High
stresses found in global load analysis over large areas could have dramatic effects in terms
of structural capacity. Iterative and non-linear models should be used for maximum result
accuracy.
3.3.2 Buckling
High compressive loads on a beam or plate section could cause stability loss of the structure
if the combined compressive load exceeds the load bearing capacity of studied structural
geometry. Buckling can be a local when a part of the structure fails and/or global when the
whole cross-section loses stability and collapses. This phenomenon is dependent on the
structural geometry and material strength. (Vukelic & Vizentin, 2017, pp. 136-137; Phelps
& Morris, 2013, p. 4)
Designing a vessel according to rule scantling methods are frequently based on the structural
buckling capacity and if calculated correctly buckling shouldn’t occur during regular use.
However, when more state-of-the-art methods are used for non-regular load events, such as
slamming in extreme seas, a linear eigenvalue method can be used to determine if global
buckling occurrence is found. This method is commonly recommended by many class soci-
eties as well in design scantling check procedure. (SFS-EN ISO 12215-5, 2019; DNVGL-
CG-0128, 2015)
Further analysis can be conducted by using non-linear FEA by implementing initial imper-
fections and elasto-plastic material model. With this method, the accurate final mode shape
for stability loss and ultimate strength is found. The non-linear method finds the more local
buckling behaviour, present in smaller and more complex vessel geometries. (Ozdemir &
Ergin, 2013, pp. 301-302)
32
3.3.3 Static fracture
In general, keeping tensile stress below the materials Ultimate Limit State (ULS), which also
describes the ultimate tensile strength commonly, sudden fractures due to high static loads
won’t occur. Design codes frequently implement safety factors for stress depending on the
structure and application to combat uncertainty of the occurring tension component. (Hughes
& Paik, 2010, p. 62)
When constructing the SHM-system, possible locations for static fractures should be studied.
Typically, high tensile stresses occur during heavy hogging and sagging conditions. In hog-
ging condition, the deck structure is in tensile pull and hull outer shell in compression. In
sagging, the roles are reversed (Hopkinson, et al., 2002, p. 2). Instrumenting a warning sys-
tem for high loads by implementing sensors to key locations based on direct calculations is
a great way to prevent stresses exceeding the ULS. Due to the crystal structure of aluminium
alloys brittle failure is not possible.
3.3.4 Fatigue fracture
It is estimated that several ships continue operation even though being inspected and noted
for fatigue cracks along their hull structures. This is possible due to some implementation
issues in the rules. These neglections could quickly lead into severe damages and global
catastrophes. (Knudsen & Hassler, 2011, pp. 1-2)
Ship structures contain a lot of welds and cut edges from which a crack will most likely
initiate. The locations for these pre-existing cracks should be studied and evaluated for the
SHM-system implementation. Common cause for pre-existing cracks can be found from
manufacturing processes such as heat input from welding, material hardening processes and
even chemical agents. The crack propagation rate is determined by material, cyclic load in-
terval and intensity. (Broberg, 1999, pp. 27-38)
As the pre-existing cracks can be impossible to see, assumptions of correct initiation loca-
tions must be made. Discontinuities such as welds and cross section changes with high stress
concentrations are the most predominant locations for fatigue crack propagation; thus, pos-
sible areas for a fracture.
33
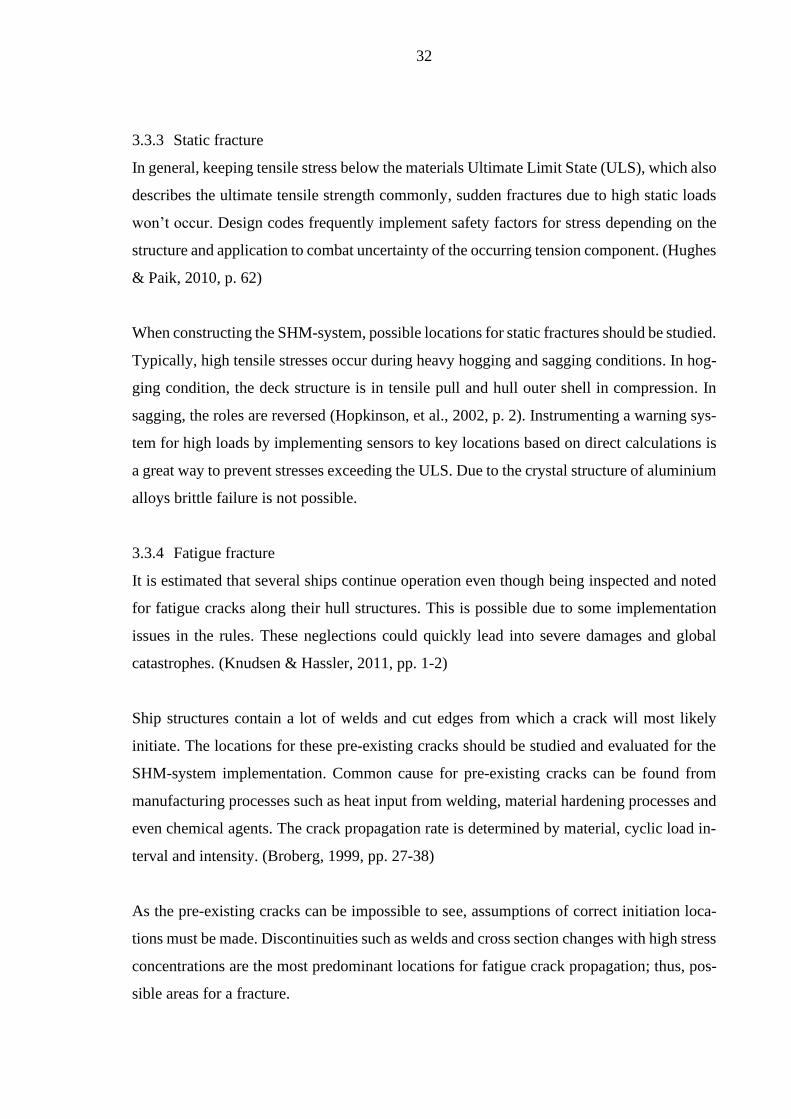
For cost and time savings, every possible structural defect is not found during Non-destruc-
tive Evaluation (NDE) and visual inspection. However, a thorough analysis method, such as
FEM, can be used find these structural hotspots as a preventive measure. Design changes
can be introduced at early design stages if areas prone for defects are found in these analyses.
Some fatigue crack initiation spots are shown in Figure 4. (Nair, et al., 2017, p. 12)
Figure 4. Possible fatigue crack initiation locations in welded joints (Niemi, et al., 2018, p.
6).
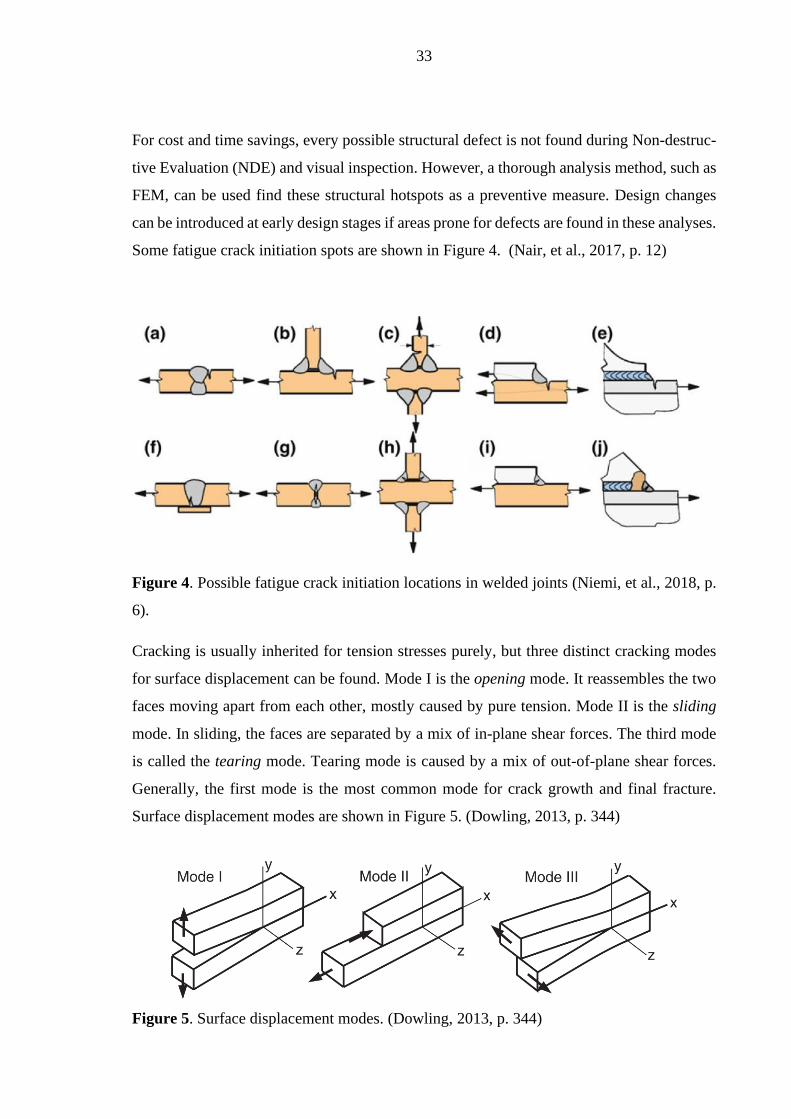
Cracking is usually inherited for tension stresses purely, but three distinct cracking modes
for surface displacement can be found. Mode I is the opening mode. It reassembles the two
faces moving apart from each other, mostly caused by pure tension. Mode II is the sliding
mode. In sliding, the faces are separated by a mix of in-plane shear forces. The third mode
is called the tearing mode. Tearing mode is caused by a mix of out-of-plane shear forces.
Generally, the first mode is the most common mode for crack growth and final fracture.
Surface displacement modes are shown in Figure 5. (Dowling, 2013, p. 344)
Figure 5. Surface displacement modes. (Dowling, 2013, p. 344)

34
4 REAL-TIME HEALTH CONDITION
The term ‘real-time’ is often conceptualized differently when SHM-systems are discussed.
The calculation procedure however defines which types of methods are using continuous
data sets for updated damage rates in operation and post-processed end-of-life analysis. As
this study is more focused on the real-time condition and continuous data set collection,
methodology of numerical methods for end-of-life and damage accumulation predictions are
only covered for comparison.
As time-domain based fatigue calculation methods are generally applicable by design codes
for vessels, this section mostly covers their use instead of other methods, such as those based
on frequency domain using power spectral density (PSD). Time-domain based methods have
been proven to be the most accurate and regarded as the “golden standard” in the industry
(Ugras, et al., 2018). Computational power has also significantly increased during the last
decades, real-time time-domain approaches are no longer restricted by performance.
Real-time monitoring systems rely on instrumented approaches to either warn the user of
current hull action state exceeding predefined limit states and/or continuous calculation of
the damage resulting from hull loads. The scope of the system can vary from simple warning
states to real-time damage rate display and remaining life evaluation. (ABS, 2020, pp. 4-10)
Although, depending on the chosen methods for different calculation procedures, amount of
data processing, ship type and wanted capability from the SHM-system, the basis for such
system could be summed to a graph representing the steps for real-time fatigue analysis
based on local strain effects prone to cause fatigue cracks. A simple concept of such real-
time calculation system based loosely on the flowchart of SSC-410 (Kramer, et al., 2000, p.
24) can be divided into three phases as shown by Figure 6.

35
Figure 6. One concept for real-time fatigue calculation in time-domain.
4.1 Data collection
For life-time evaluation of vessel fatigue behavior, multiple data sets can be utilized in
unison for further understanding of which type of combined loading has the greatest effect
on fatigue damage. For example, strain gauge measurements along with significant wave
height, heading and speed data produces deeper insight on which of these combinations are
worst for certain structural details in terms of damage accumulation. (Torkildsen, et al.,
2005, pp. 6-8)
The needed data for accurate health monitoring and lifetime evaluation varies by ship type
and EOC characteristics. As discussed in Chapter 2.2, hull loads should be assessed on vessel
basis by looking at their operational profile and requirements for usage. The data collection
is simply divided to two subgroups; short-term- and long-term-data. Both methods offer
36
substantial benefits when compared to more traditional probabilistic weighted sea method
based on wave statistics as they rely on actual cyclic data (Thompson, 2020, p. 2).
4.1.1 Short-term data
By utilizing short-term data collected during various EOC’s which have been speculated to
contribute the most to the vessels service life, multiple profiles for damage accumulation can
be made. The data is collected during sea trials and maiden voyages of the ship and then the
different load components are assigned with probabilities of occurrence. The data can be
strain measurements along with heading, speed and wave information. The instruments can
then be removed and operational parameters for different scenarios created based on the
other information gathered. This removes the need for using continuous strain gauge meas-
urements and large amounts of data to browse through. (Soliman, et al., 2019, pp. 12-16)
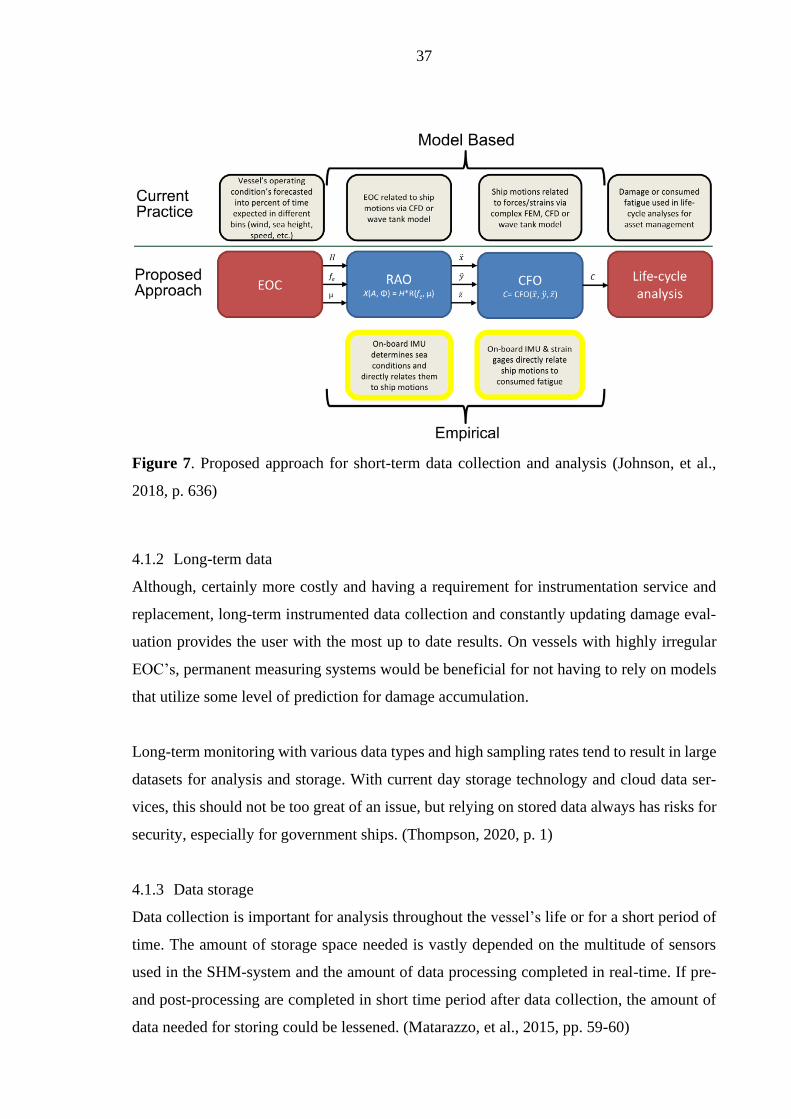
As short-term data collection relies on created operational profiles, a sudden change in use-
cases potentially disrupts the semi-prediction calculation for damage and use-life. This re-
quires the creation of updated profiles for the changed operational use. In this regard, it
would be more feasible to tie the stress reactions from strain gauge measurements to other
data, such as the already mentioned wave information, heading and speed. This collection of
hull responses to EOC’s can be used to derive RAO’s for damage evaluation during opera-
tion. This is shown in Figure 7 by Johnson et al. (2018) in their research. (Johnson, et al.,
2018, p. 635)
37
Figure 7. Proposed approach for short-term data collection and analysis (Johnson, et al.,
2018, p. 636)
4.1.2 Long-term data
Although, certainly more costly and having a requirement for instrumentation service and
replacement, long-term instrumented data collection and constantly updating damage eval-
uation provides the user with the most up to date results. On vessels with highly irregular
EOC’s, permanent measuring systems would be beneficial for not having to rely on models
that utilize some level of prediction for damage accumulation.
Long-term monitoring with various data types and high sampling rates tend to result in large
datasets for analysis and storage. With current day storage technology and cloud data ser-
vices, this should not be too great of an issue, but relying on stored data always has risks for
security, especially for government ships. (Thompson, 2020, p. 1)
4.1.3 Data storage
Data collection is important for analysis throughout the vessel’s life or for a short period of
time. The amount of storage space needed is vastly depended on the multitude of sensors
used in the SHM-system and the amount of data processing completed in real-time. If pre-
and post-processing are completed in short time period after data collection, the amount of
data needed for storing could be lessened. (Matarazzo, et al., 2015, pp. 59-60)
38
Technology is constantly evolving; sensor sampling rates are high and storage capacity has
cheapened over the years. Growth in network size and wireless data transfer speeds have
enabled the use of many wireless variations in sensor equipment as shown in studies by
Johnson et al. (2017) and Swartz et al. (2009).
4.2 Technology
As addressed by the previous chapter, data can be acquisitioned for multitudes of vessel hull
motions and reactions to waves. All datasets have their contribution to SHM-systems aboard
ships. Dependant of course by the ship type and her EOC’s.
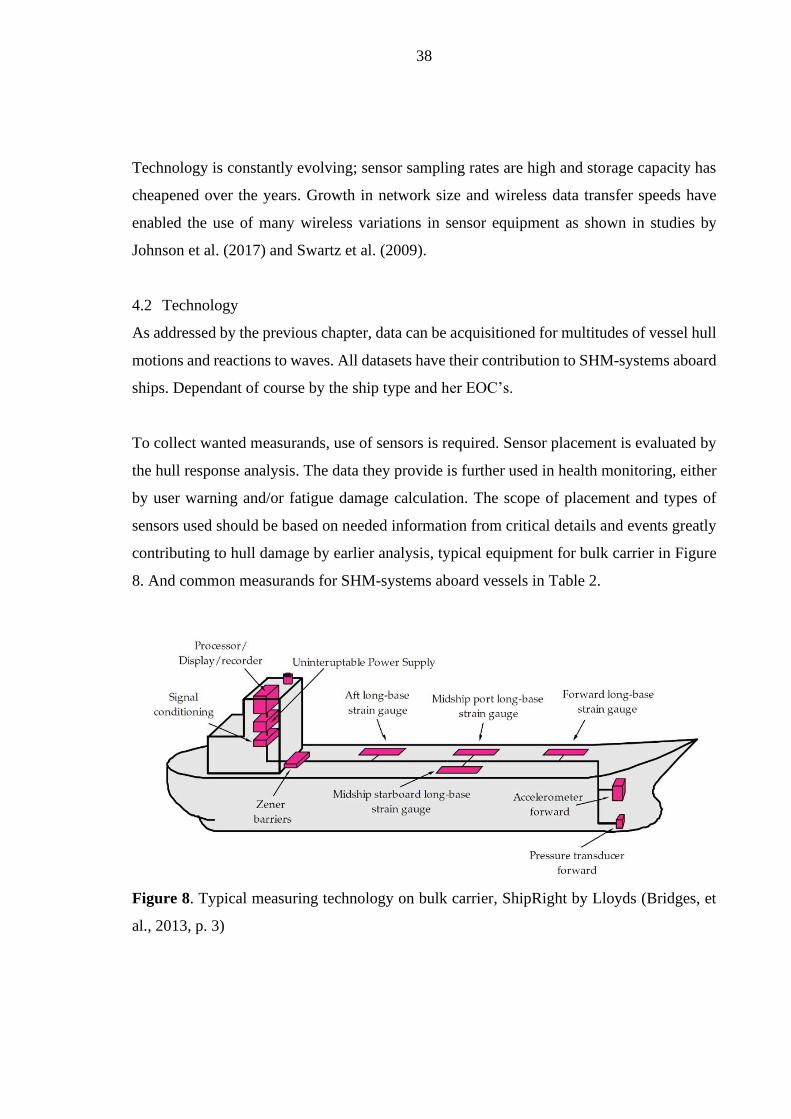
To collect wanted measurands, use of sensors is required. Sensor placement is evaluated by
the hull response analysis. The data they provide is further used in health monitoring, either
by user warning and/or fatigue damage calculation. The scope of placement and types of
sensors used should be based on needed information from critical details and events greatly
contributing to hull damage by earlier analysis, typical equipment for bulk carrier in Figure
8. And common measurands for SHM-systems aboard vessels in Table 2.
Figure 8. Typical measuring technology on bulk carrier, ShipRight by Lloyds (Bridges, et
al., 2013, p. 3)
39
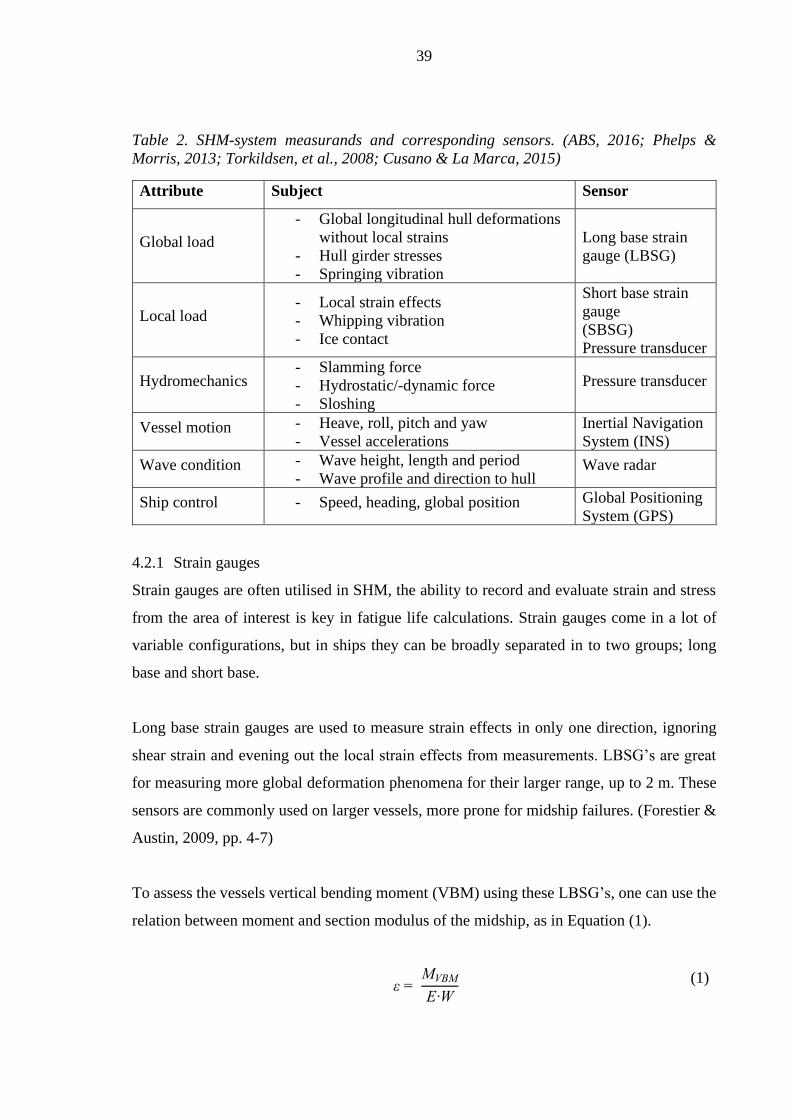
Table 2. SHM-system measurands and corresponding sensors. (ABS, 2016; Phelps &
Morris, 2013; Torkildsen, et al., 2008; Cusano & La Marca, 2015)
Attribute Subject Sensor
Global load
- Global longitudinal hull deformations
without local strains
- Hull girder stresses
- Springing vibration
Long base strain
gauge (LBSG)
Local load - Local strain effects
- Whipping vibration
- Ice contact
Short base strain
gauge
(SBSG)
Pressure transducer
Hydromechanics - Slamming force
- Hydrostatic/-dynamic force
- Sloshing
Pressure transducer
Vessel motion - Heave, roll, pitch and yaw
- Vessel accelerations
Inertial Navigation
System (INS)
Wave condition - Wave height, length and period
- Wave profile and direction to hull Wave radar
Ship control - Speed, heading, global position Global Positioning
System (GPS)
4.2.1 Strain gauges
Strain gauges are often utilised in SHM, the ability to record and evaluate strain and stress
from the area of interest is key in fatigue life calculations. Strain gauges come in a lot of
variable configurations, but in ships they can be broadly separated in to two groups; long
base and short base.
Long base strain gauges are used to measure strain effects in only one direction, ignoring
shear strain and evening out the local strain effects from measurements. LBSG’s are great
for measuring more global deformation phenomena for their larger range, up to 2 m. These
sensors are commonly used on larger vessels, more prone for midship failures. (Forestier &
Austin, 2009, pp. 4-7)
To assess the vessels vertical bending moment (VBM) using these LBSG’s, one can use the
relation between moment and section modulus of the midship, as in Equation (1).
ε =
MVBM
E∙W
(1)

40
Where E is the elastic modulus and W is the section modulus of the current ship section.
Thermal variations need to be considered for accuracy. (Cusano & La Marca, 2015, pp. 4-5)
Short base strain gauges are for measuring local stress components and can be directly used
for fatigue calculations by measuring hot-spot stresses. Local strains contribute mostly to
crack propagation and local plastic deformation. SBSG’s prove their usefulness in complex
structures and ability to measure strain and shear in multiple directions and planes. Tri-axial
rosette placement enables the retrieval of all principle and shear stresses. (Phelps & Morris,
2013, pp. 23-25)
Strain gauges can be subjected by electromagnetic interference, usually caused by the use of
ferrous alloys and magnetizable equipment aboard. Aluminium alloys used on ships is non-
ferrous; thus, doesn’t contribute to this phenomenon. Electromagnetic emissions are also
recognised by class societies and should be handled anyway. (DNVGL-RU-NAVAL, 2015)
By using fibre optic strain sensors, immune to electromagnetic fields, interference problem
is solved. They also can be routed to use less cabling due to multi-fibre cables. Reduced
noise is a certain benefit when analysing the results. (Torkildsen, et al., 2008, pp. 2-3; Phelps
& Morris, 2013, p. 3; Chang, et al., 2003, p. 263)
In particular, strain gauges need to be temperature compensated to produce accurate results.
The compensation is solved by using dummy sensors for neglecting the expansions and con-
tractions caused by temperature changes. The dummy sensor only measures the length
change by temperature and doesn’t receive the strain from the loading. (Phelps & Morris,
2013, pp. 25-26; Cusano & La Marca, 2015, p. 5)
Generally, strain gauges can be used in multiple formations to obtain princible stresses.
When the direction of stresses is not known, tri-axial rosettes are used. Derivation of stress
components are achieved with specific strain gauge placements (Hoffman, 2012, pp. 21-26,
44-48). Strain gauges can be used for following applications (Niemi, 1996, p. 37; Hoffman,
2012, pp. 36, 46):
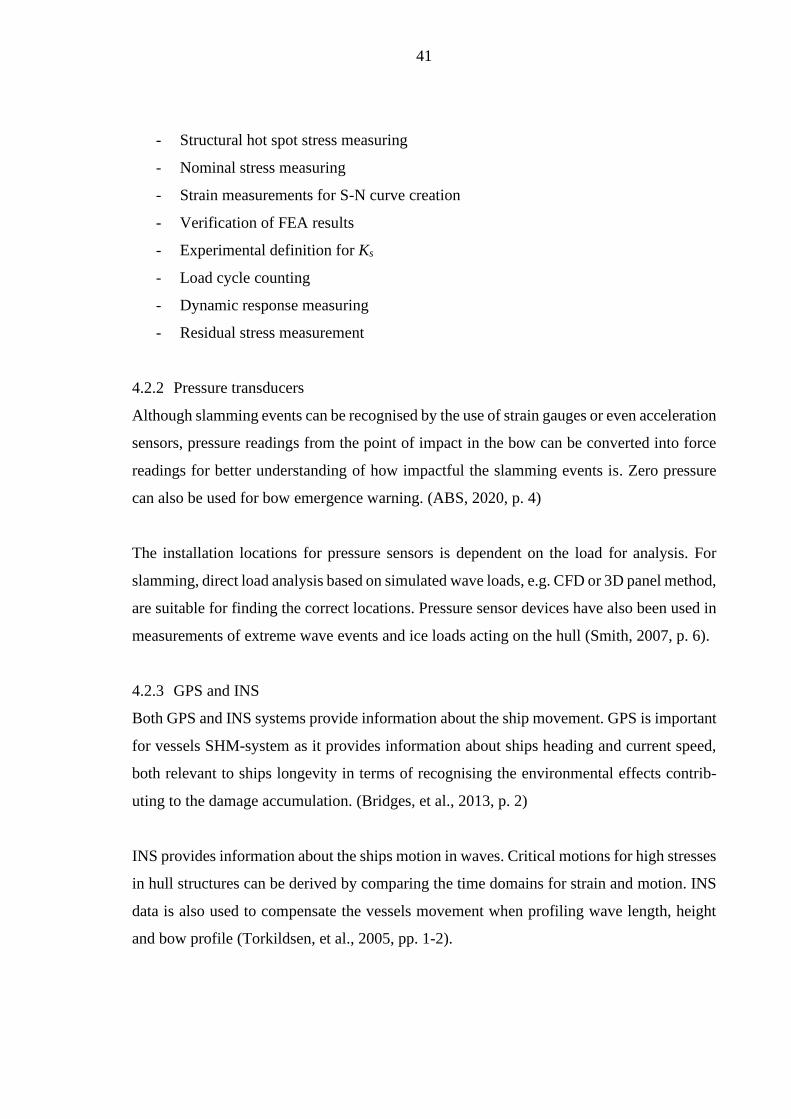
41
- Structural hot spot stress measuring
- Nominal stress measuring
- Strain measurements for S-N curve creation
- Verification of FEA results
- Experimental definition for Ks
- Load cycle counting
- Dynamic response measuring
- Residual stress measurement
4.2.2 Pressure transducers
Although slamming events can be recognised by the use of strain gauges or even acceleration
sensors, pressure readings from the point of impact in the bow can be converted into force
readings for better understanding of how impactful the slamming events is. Zero pressure
can also be used for bow emergence warning. (ABS, 2020, p. 4)
The installation locations for pressure sensors is dependent on the load for analysis. For
slamming, direct load analysis based on simulated wave loads, e.g. CFD or 3D panel method,
are suitable for finding the correct locations. Pressure sensor devices have also been used in
measurements of extreme wave events and ice loads acting on the hull (Smith, 2007, p. 6).
4.2.3 GPS and INS
Both GPS and INS systems provide information about the ship movement. GPS is important
for vessels SHM-system as it provides information about ships heading and current speed,
both relevant to ships longevity in terms of recognising the environmental effects contrib-
uting to the damage accumulation. (Bridges, et al., 2013, p. 2)
INS provides information about the ships motion in waves. Critical motions for high stresses
in hull structures can be derived by comparing the time domains for strain and motion. INS
data is also used to compensate the vessels movement when profiling wave length, height
and bow profile (Torkildsen, et al., 2005, pp. 1-2).
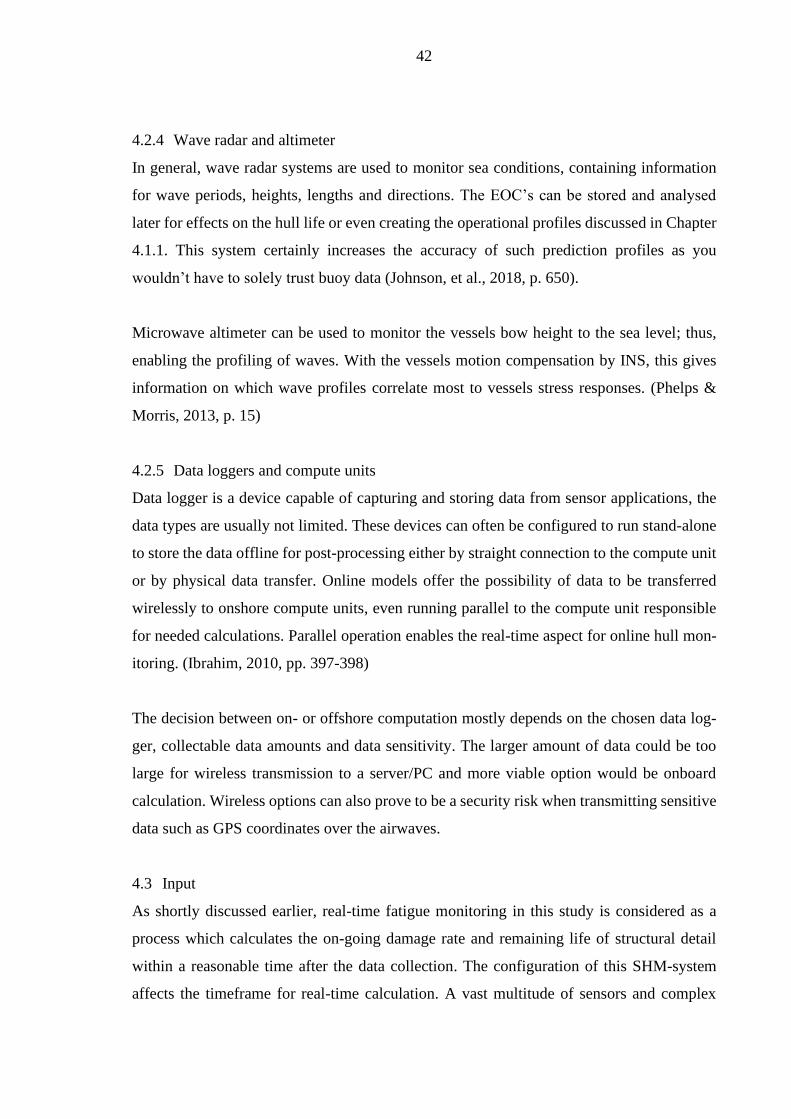
42
4.2.4 Wave radar and altimeter
In general, wave radar systems are used to monitor sea conditions, containing information
for wave periods, heights, lengths and directions. The EOC’s can be stored and analysed
later for effects on the hull life or even creating the operational profiles discussed in Chapter
4.1.1. This system certainly increases the accuracy of such prediction profiles as you
wouldn’t have to solely trust buoy data (Johnson, et al., 2018, p. 650).
Microwave altimeter can be used to monitor the vessels bow height to the sea level; thus,
enabling the profiling of waves. With the vessels motion compensation by INS, this gives
information on which wave profiles correlate most to vessels stress responses. (Phelps &
Morris, 2013, p. 15)
4.2.5 Data loggers and compute units
Data logger is a device capable of capturing and storing data from sensor applications, the
data types are usually not limited. These devices can often be configured to run stand-alone
to store the data offline for post-processing either by straight connection to the compute unit
or by physical data transfer. Online models offer the possibility of data to be transferred
wirelessly to onshore compute units, even running parallel to the compute unit responsible
for needed calculations. Parallel operation enables the real-time aspect for online hull mon-
itoring. (Ibrahim, 2010, pp. 397-398)
The decision between on- or offshore computation mostly depends on the chosen data log-
ger, collectable data amounts and data sensitivity. The larger amount of data could be too
large for wireless transmission to a server/PC and more viable option would be onboard
calculation. Wireless options can also prove to be a security risk when transmitting sensitive
data such as GPS coordinates over the airwaves.
4.3 Input
As shortly discussed earlier, real-time fatigue monitoring in this study is considered as a
process which calculates the on-going damage rate and remaining life of structural detail
within a reasonable time after the data collection. The configuration of this SHM-system
affects the timeframe for real-time calculation. A vast multitude of sensors and complex
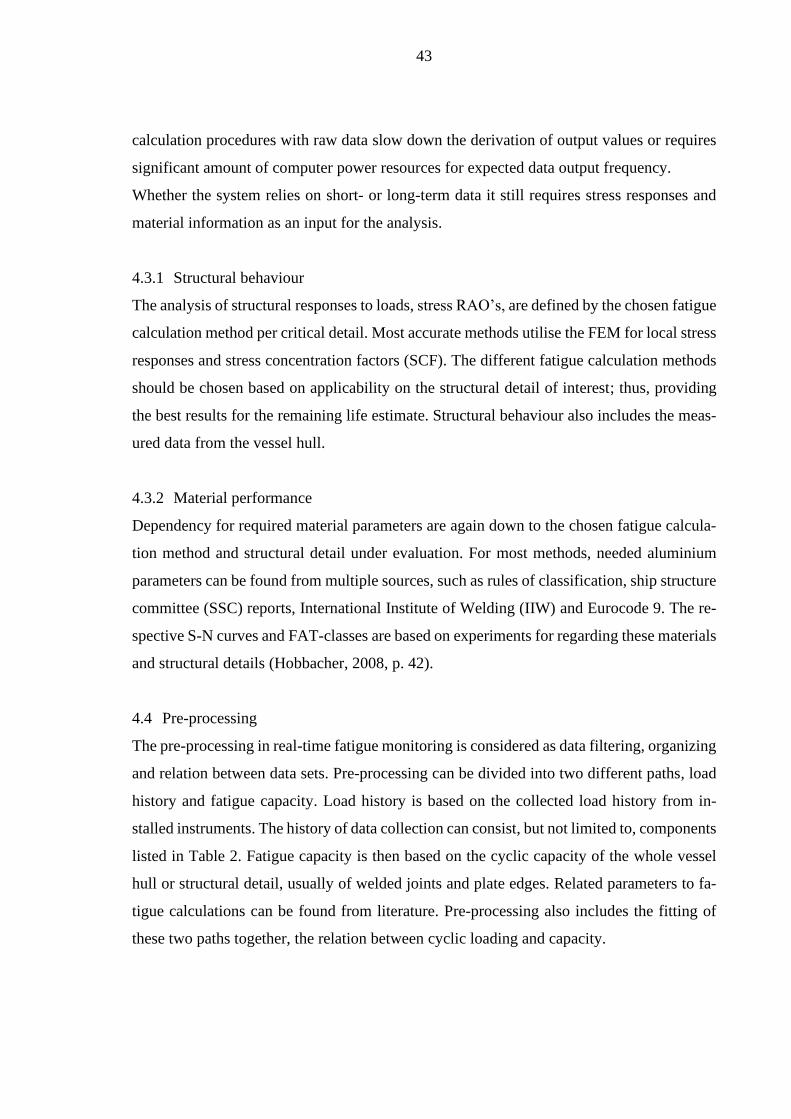
43
calculation procedures with raw data slow down the derivation of output values or requires
significant amount of computer power resources for expected data output frequency.
Whether the system relies on short- or long-term data it still requires stress responses and
material information as an input for the analysis.
4.3.1 Structural behaviour
The analysis of structural responses to loads, stress RAO’s, are defined by the chosen fatigue
calculation method per critical detail. Most accurate methods utilise the FEM for local stress
responses and stress concentration factors (SCF). The different fatigue calculation methods
should be chosen based on applicability on the structural detail of interest; thus, providing
the best results for the remaining life estimate. Structural behaviour also includes the meas-
ured data from the vessel hull.
4.3.2 Material performance
Dependency for required material parameters are again down to the chosen fatigue calcula-
tion method and structural detail under evaluation. For most methods, needed aluminium
parameters can be found from multiple sources, such as rules of classification, ship structure
committee (SSC) reports, International Institute of Welding (IIW) and Eurocode 9. The re-
spective S-N curves and FAT-classes are based on experiments for regarding these materials
and structural details (Hobbacher, 2008, p. 42).
4.4 Pre-processing
The pre-processing in real-time fatigue monitoring is considered as data filtering, organizing
and relation between data sets. Pre-processing can be divided into two different paths, load
history and fatigue capacity. Load history is based on the collected load history from in-
stalled instruments. The history of data collection can consist, but not limited to, components
listed in Table 2. Fatigue capacity is then based on the cyclic capacity of the whole vessel
hull or structural detail, usually of welded joints and plate edges. Related parameters to fa-
tigue calculations can be found from literature. Pre-processing also includes the fitting of
these two paths together, the relation between cyclic loading and capacity.

44
4.4.1 Cyclic load spectrum
Measured vessel responses are highly variable and usually contain a lot of noise, depending
on the sampling rate. The raw data retrieved from multitude of instruments must be con-
verted to a more convenient form to fit into fatigue life calculations. The transformation of
stress responses can be achieved by using an already proven methods, such as range-pair
counting, level-crossing counting, reservoir counting and rainflow counting (RFC). (Marsh,
et al., 2016, pp. 757-758).
Rainflow counting first introduced by Matsuishi and Endo (1968) is the most used method
and has been approved in multiple design guidelines, such as Eurocode (SFS-EN 1999-1-3,
2007) and ship fatigue guidelines by DNV-GL (DNVGL-CG-0129, 2015) and ABS (ABS,
2020). RFC has seen modifications also to suit modern computers for cycle counting. A best
example of this is the modified method developed by Downing and Socie. Their method
‘One pass’ is based on the full hysteresis loop of stress-strain behaviour. It checks for peaks
as they occur rather than waiting for the full load spectrum to complete. (Downing & Socie,
1982, pp. 1-3)
Load cycle counting is often paired with the stress-strain behaviour of the material on hand.
The stress-strain hysteresis loop is a cyclic representation of materials strain-stress relation
and it is based on the elastic-plastic behaviour. This hysteresis loop cycle representation is
particularly useful in damage estimation as well by connecting it to the chosen cycle count-
ing method, especially in variable amplitude loading. Relation between stress-strain and load
cycle counting in Figure 9. (Okamura, et al., 1979)

45
Figure 9. Relation of stress-strain and load cycle counting (Passipoularidis & Brøndsted,
2010, p. 44)
The RFC-method is not however compatible for real-time cycle counting in its original form
as it is solely based on the history of loading from peak to peak. The history relation leads
to increased amount of calculation needed for finding fatigue cycles; thus, not very suitable
for real-time applications. History relation also leads into delayed data processing and dis-
play for the user.
For the applications that require a continuous cycle counting and current damage rate eval-
uation, a method of real-time RFC has been created by Musallam and Johnson (2012). They
call their method for Rainflow cycle counting “The On-line method”. This method is based
on two buffers after which the cycles are calculated as full- and half-cycles. As the original
method is based on similar approach of full- and half-cycle association, the results from this
real-time counterpart can be expected to be the same. The method has been developed first
hand for thermal fatigue calculation solutions but can be used on other quantities as well.
In short, the recursive for minimum driven procedure is as follows; Load sequence starts,
first value is set as minimum and placed in min-stack. Second value arrives, it is checked
against the first one. If it is greater than the first, it is set as maximum and placed in max-
stack. Next value arrives, it is less than the first minimum, a half-cycle is counted and the
delta between first minimum and first maximum is calculated. Next value arrives, it is greater
than stored minimum but less than the stacked maximum, a full cycle is realised and calcu-
lated. The procedure can be driven either with max or min values, meaning that in either
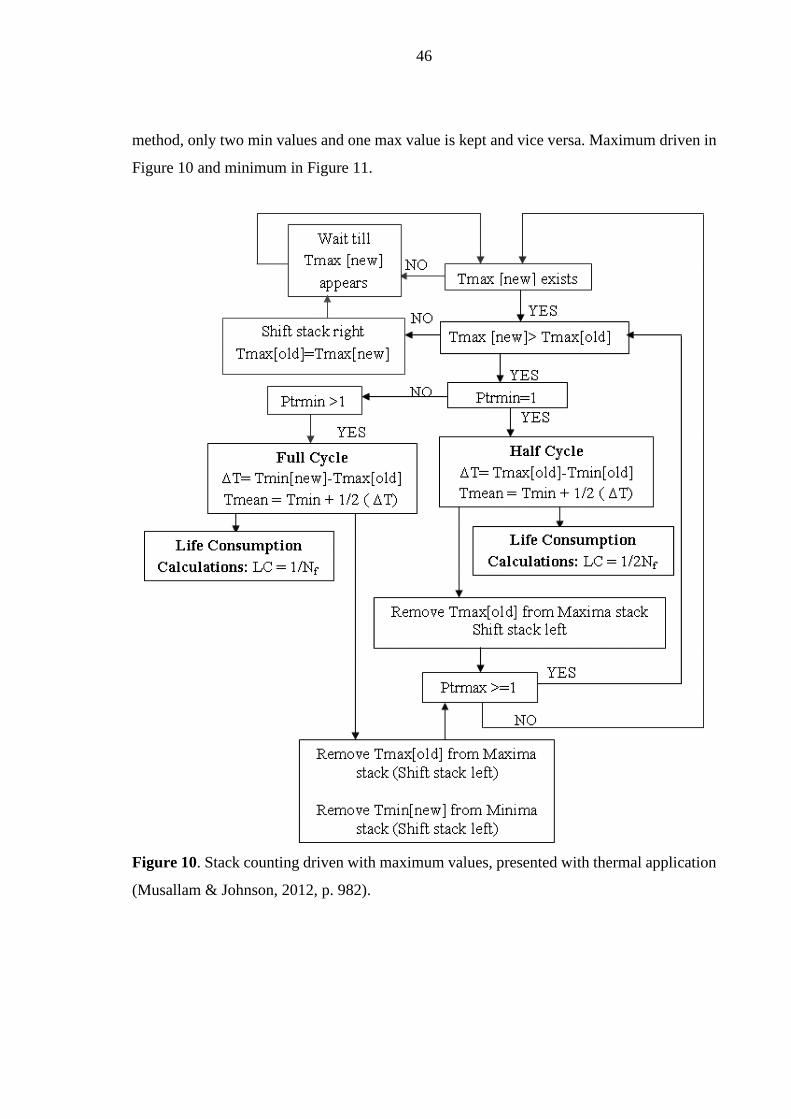
46
method, only two min values and one max value is kept and vice versa. Maximum driven in
Figure 10 and minimum in Figure 11.
Figure 10. Stack counting driven with maximum values, presented with thermal application
(Musallam & Johnson, 2012, p. 982).

47
Figure 11. Stack counting with minimum values, presented with thermal application
(Musallam & Johnson, 2012, p. 982).
The code produced for this method can run fast, but more experiments should be completed
to see how it copes with quickly alternating loads, such as vibrations by whipping and spring-
ing phenomena. Cycle counting from thermal spectra shown in Figure 12.
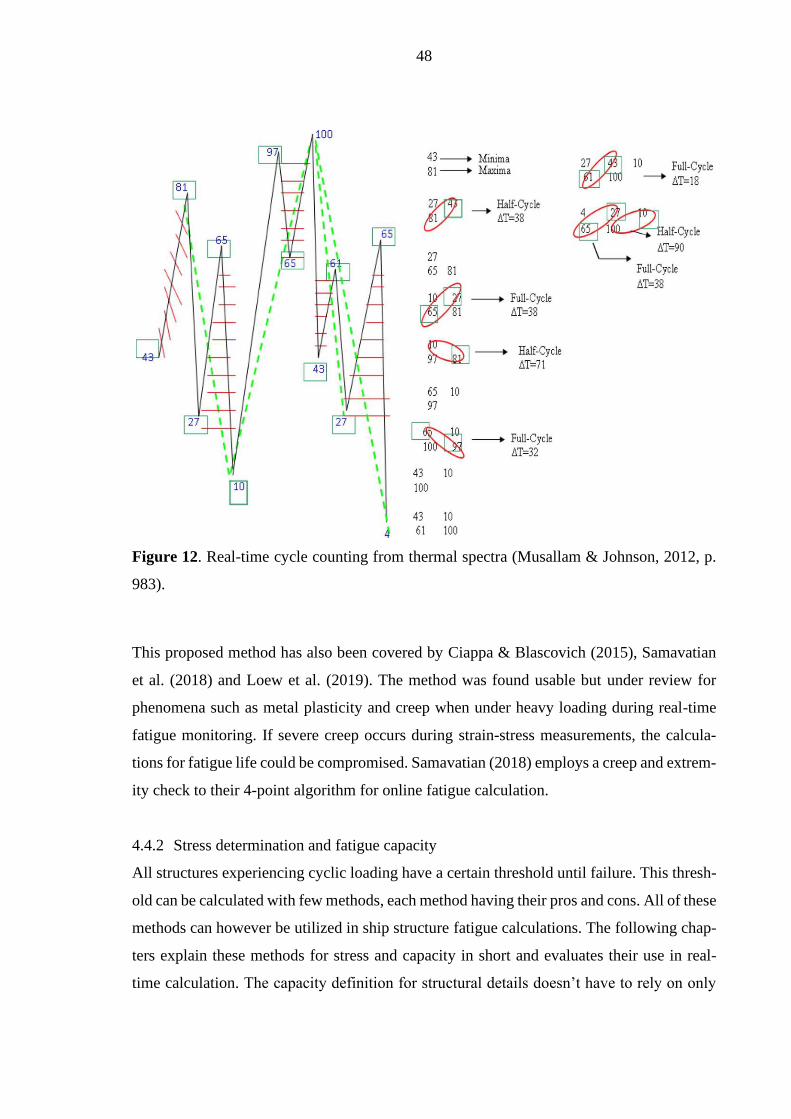
48
Figure 12. Real-time cycle counting from thermal spectra (Musallam & Johnson, 2012, p.
983).
This proposed method has also been covered by Ciappa & Blascovich (2015), Samavatian
et al. (2018) and Loew et al. (2019). The method was found usable but under review for
phenomena such as metal plasticity and creep when under heavy loading during real-time
fatigue monitoring. If severe creep occurs during strain-stress measurements, the calcula-
tions for fatigue life could be compromised. Samavatian (2018) employs a creep and extrem-
ity check to their 4-point algorithm for online fatigue calculation.
4.4.2 Stress determination and fatigue capacity
All structures experiencing cyclic loading have a certain threshold until failure. This thresh-
old can be calculated with few methods, each method having their pros and cons. All of these
methods can however be utilized in ship structure fatigue calculations. The following chap-
ters explain these methods for stress and capacity in short and evaluates their use in real-
time calculation. The capacity definition for structural details doesn’t have to rely on only

49
one method. Suitable methods for all critical details can be decided individually, basics for
choosing the correct method can be seen as in Table 3.
Table 3. Choosing the fatigue calculation method based on stress raisers (Kozak & Gorski,
2011).
4.4.3 Nominal stress method
Nominal stress method is the most simple and fastest method computationally and analyti-
cally to solve the stresses and fatigue capacity of a structural detail. The method is based on
solving nominal stress on the sectional area of interest analytically, with direct calculation
methods or experimentally. Macrogeometrical phenomena, discontinuities and misalign-
ments must be included by stress factors in order to achieve accurate results. Simple example
of nominal stress in Figure 13. (Hobbacher, 2008, pp. 21-23; Niemi & Kemppi, 1993, p.
232)
Figure 13. Simple representation of nominal stress on a beam sectional area (Hobbacher,
2008, p. 21)
When concerning fatigue with nominal method, the amount of cycles is calculated using S-
N curves. The S-N curves are based on experimental data for real joints. Many structural
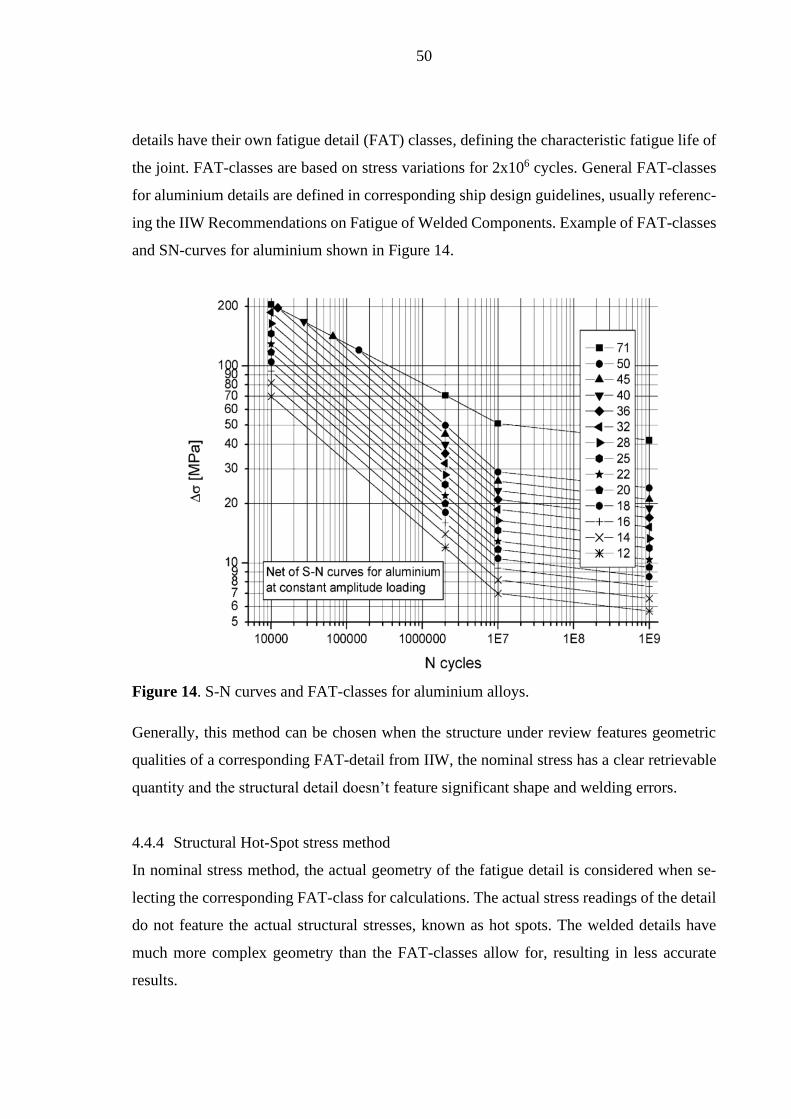
50
details have their own fatigue detail (FAT) classes, defining the characteristic fatigue life of
the joint. FAT-classes are based on stress variations for 2x10⁶ cycles. General FAT-classes
for aluminium details are defined in corresponding ship design guidelines, usually referenc-
ing the IIW Recommendations on Fatigue of Welded Components. Example of FAT-classes
and SN-curves for aluminium shown in Figure 14.
Figure 14. S-N curves and FAT-classes for aluminium alloys.
Generally, this method can be chosen when the structure under review features geometric
qualities of a corresponding FAT-detail from IIW, the nominal stress has a clear retrievable
quantity and the structural detail doesn’t feature significant shape and welding errors.
4.4.4 Structural Hot-Spot stress method
In nominal stress method, the actual geometry of the fatigue detail is considered when se-
lecting the corresponding FAT-class for calculations. The actual stress readings of the detail
do not feature the actual structural stresses, known as hot spots. The welded details have
much more complex geometry than the FAT-classes allow for, resulting in less accurate
results.

51
Hot-spot stress method (HS) for fatigue is considered to solve this problem by taking an
advantage of FEM or measured strain to feature the complex geometry in the analysis and
producing the structural stresses as a result. The availability of increased computer perfor-
mance has enabled the possibility of such analyses to be completed in relatively short span
of time. The FEM has also enabled the designers to create formulas for calculations in ad-
vance for stress estimation. (Niemi, et al., 2018, pp. 1-2)
The type of hot-spot stress method you should use depends on the structural detail under
evaluation, the choice is between type A and B. Type A hot-spots are typically on the plate
surface, enabling for a linear extrapolation of stresses through-thickness. Type B hot spots
are located generally on the plate edge; thus, through thickness effects are neglected. Type
A and B hot-spots presented in Figure 15.
Figure 15. The types of hot-spot stress points on a gusset. (Lee, et al., 2010, p. 202)
In type A hot-spots, the stress distribution can be linearly estimated by using set ranges from
the weld boundary. Usually the number of points and the distances are defined by the design
code relevant for the vessel. Example of linear extrapolation in Figure 16. (Hobbacher, 2008,
pp. 26-28)
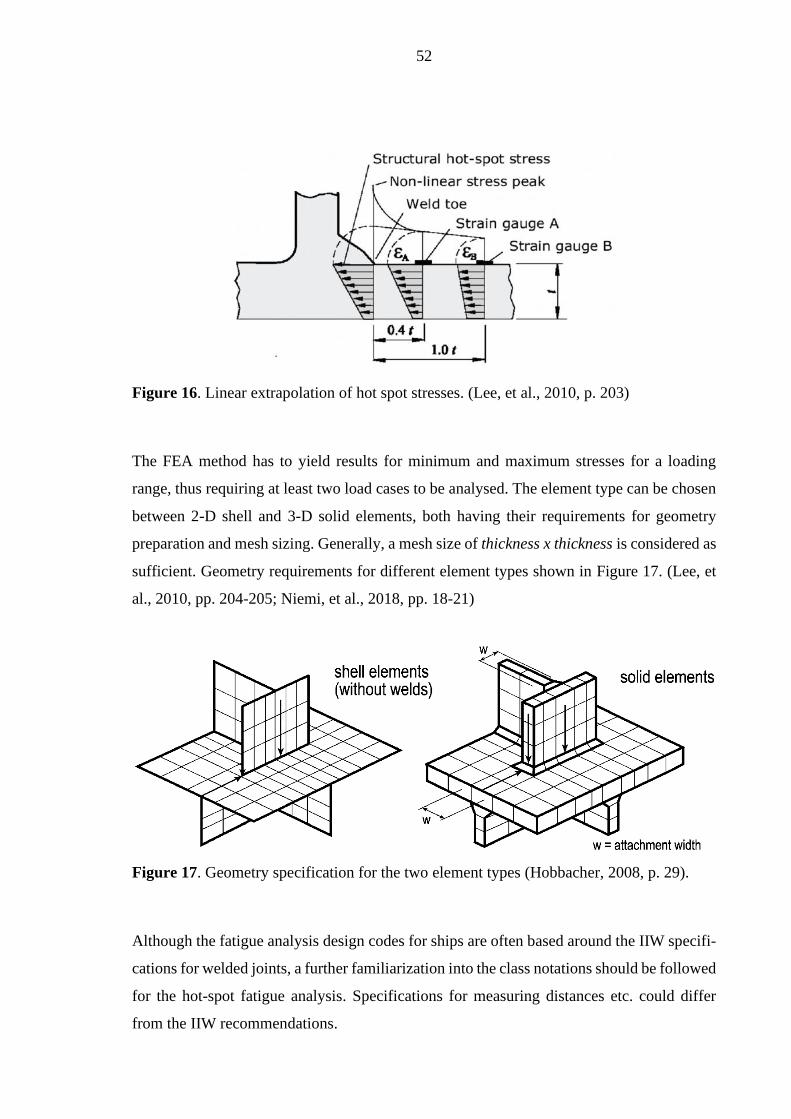
52
Figure 16. Linear extrapolation of hot spot stresses. (Lee, et al., 2010, p. 203)
The FEA method has to yield results for minimum and maximum stresses for a loading
range, thus requiring at least two load cases to be analysed. The element type can be chosen
between 2-D shell and 3-D solid elements, both having their requirements for geometry
preparation and mesh sizing. Generally, a mesh size of thickness x thickness is considered as
sufficient. Geometry requirements for different element types shown in Figure 17. (Lee, et
al., 2010, pp. 204-205; Niemi, et al., 2018, pp. 18-21)
Figure 17. Geometry specification for the two element types (Hobbacher, 2008, p. 29).
Although the fatigue analysis design codes for ships are often based around the IIW specifi-
cations for welded joints, a further familiarization into the class notations should be followed
for the hot-spot fatigue analysis. Specifications for measuring distances etc. could differ
from the IIW recommendations.

53
4.4.5 Effective notch stress method
The Effective notch stress method (ENS) is based on the idea of parametrizing the stress
occurring at the weld root (Fricke & Kahl, 2007, pp. 2-3). The ENS method is able to de-
scribe the total stress at the root and toe, including the non-linearity by the notch. The notch
method assumes a linear-elastic material behaviour and an effective notch instead of the
actual notch geometry with the radius of r = 1 mm which has been set for steel and alumin-
ium and plates at least 5 mm thick. For thinner plates, using 0.05mm is accepted. The basis
of ENS geometry idealisation is shown in Figure 18.
Figure 18. ENS method geometry idealisation (Hobbacher, 2008, p. 35).
ENS requires a high-quality mesh to include all macro- and micro-geometrical effects from
the joint. The meshing sizes are recommended in the respective IIW document by A. Hob-
bacher. The Stress Concentration Factors (SCF) are retrieved from the FEA and further uti-
lised in fatigue calculations.
ENS provides advantage to nominal and HS method by taking the local notch geometry,
such as weld leg and theoretical throat into consideration. The modelled weld is still only a
representation of the real geometry and surface quality; thus, the weld quality must be on
par for accurate results. Porous or poorly executed weld geometry will not reach the intended
lifetime calculated with ENS or any other methods. (Fricke, 2013, p. 763)

54
4.4.6 4R method
The 4R method, developed from 3R method, is a combination of the local strain methods,
Smith-Watson-Topper (SWT) criterion and the previously mentioned ENS method. The
method has been developed to overcome the held back possibility of the ENS method in
terms of actual weld geometry, residual and mean stresses, plus material strength parameters.
Björk et al. (2018, p. 2) explains that the method is named after the four parameters it uses
in addition to the ENS:
- “material ultimate strength, Rm
- applied stress ratio, R
- residual stress, σres
- weld toe geometrical quality in terms of rtrue”
The method follows the approach of the ENS method and continues by the definition of the
stress ratios and residual stresses. SCF’s can be derived by using the FEA as mentioned in
the previous chapter in the ENS method. The ENS weld quality is further adjusted in the
refinement of the weld toe radius by the actual notch radius. Methodology of stresses shown
in Figure 19.
Figure 19. Methodology for stresses of 4R method (Björk, et al., 2018, p. 2).
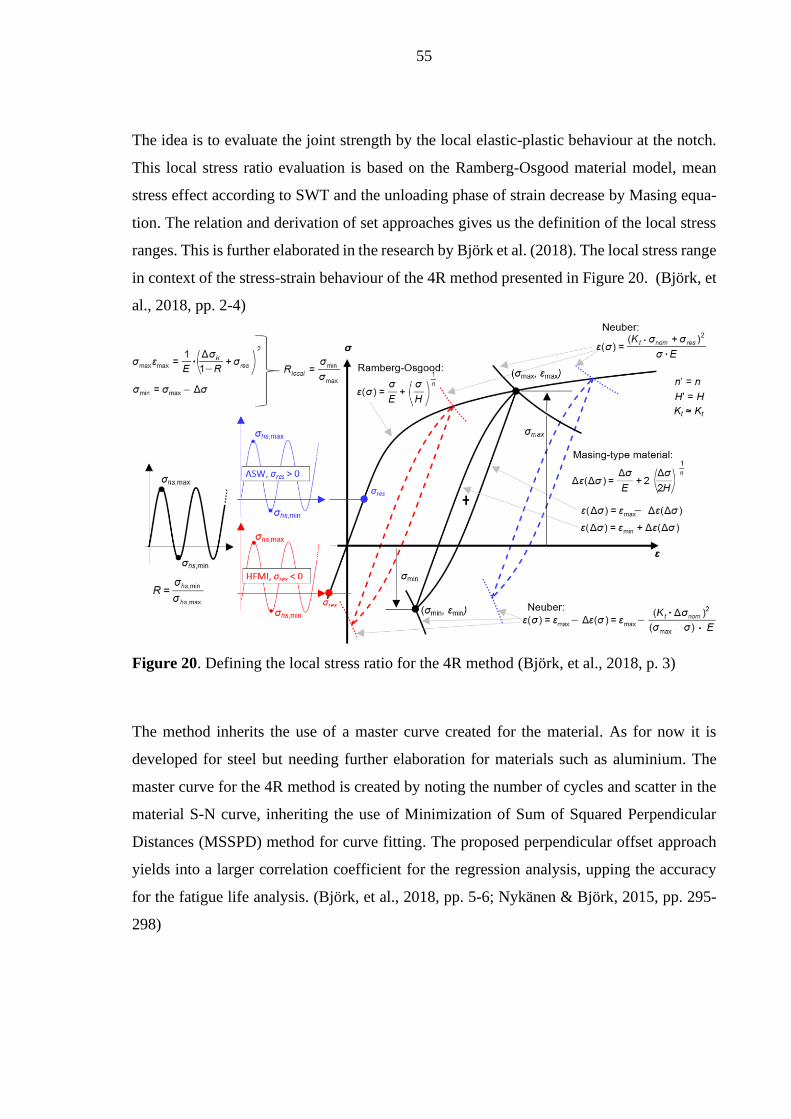
55
The idea is to evaluate the joint strength by the local elastic-plastic behaviour at the notch.
This local stress ratio evaluation is based on the Ramberg-Osgood material model, mean
stress effect according to SWT and the unloading phase of strain decrease by Masing equa-
tion. The relation and derivation of set approaches gives us the definition of the local stress
ranges. This is further elaborated in the research by Björk et al. (2018). The local stress range
in context of the stress-strain behaviour of the 4R method presented in Figure 20. (Björk, et
al., 2018, pp. 2-4)
Figure 20. Defining the local stress ratio for the 4R method (Björk, et al., 2018, p. 3)
The method inherits the use of a master curve created for the material. As for now it is
developed for steel but needing further elaboration for materials such as aluminium. The
master curve for the 4R method is created by noting the number of cycles and scatter in the
material S-N curve, inheriting the use of Minimization of Sum of Squared Perpendicular
Distances (MSSPD) method for curve fitting. The proposed perpendicular offset approach
yields into a larger correlation coefficient for the regression analysis, upping the accuracy
for the fatigue life analysis. (Björk, et al., 2018, pp. 5-6; Nykänen & Björk, 2015, pp. 295-
298)

56
4.4.7 Local strain method
Loads surpassing yield strength are often not allowed by the design codes for seagoing ves-
sels. If such occurrences are allowed and common, the fatigue capacity must be defined
through local strain method. For full analysis, the local strain analysis is followed by fracture
mechanics. With these methods, the failure is analysed by crack initiation, propagation and
final fracture. The local strain life is calculated by using a similar approach to the stress-life
methods but require a description for the strain life – curve (ε-N). This yields for the use of
Ramberg-Osgood stress-strain relation and modified damage parameters. Local strain
method can be used for both LCF and HCF. (Fatemi, 2020a, pp. 43-45; Fiedler & Vormwald,
2016, pp. 31-37)
4.4.8 Fracture mechanics
The basis of fracture mechanics is the definition for the crack growth speed. This knowledge
requires the information for stress intensity factors, fracture toughness of the material, initial
crack size or estimation and the final crack size to calculate when the final fracture occurs.
The method is usually used in maritime applications when initial crack can be assumed or
recognised using NDT’s for flaws to ensure safe operation despite the crack. Fracture me-
chanics are used together with S-N or ε-N life methods to form a fatigue life estimate from
the crack nucleation to final fracture, shown as Equation (2). (Fatemi, 2020b, pp. 4-6;
Kramer, et al., 2000, p. 4, 61)
Ntotal = Nnucleation + Ngrowth (2)
Where the growth period is expressed with Paris power law and presented on a logarithmic
scale for linear portion of the growth and a linear slope coefficient shown in Figure 21
(Fricke, 2013, p. 756). Paris relation for linear crack growth rate is expressed as in Equation
(3).
da
dN = C(∆K)
m (3)
Where C and m are material coefficients and ∆K represents the stress intensity.

57
Figure 21. Logarithmic presentation of the crack growth until failure (Kramer, et al., 2000,
p. 133).
The IIW document for fatigue by Hobbacher (2008, p. 115) recommends the fracture me-
chanics to be used in the following cases:
a) “The Miner’s summation is sensitive to the exact location of the knee point of the
fatigue resistance S-N curve,
b) The spectrum of fatigue actions (loads) varies in service or is changed, and so the
sequence of loads becomes significant or
c) The resistance S-N curve of a pre-damaged component has to be estimated.”
4.4.9 Capacity and load cycle relation
To build a real-time fatigue and damage accumulation calculation method, the relation be-
tween load cycles and fatigue capacity must be realised. The current DNV-GL methodology
for design life calculation is based around the linear damage sum and cumulation by
Palmgren - Miner’s rule. The method involves setting the damage total sum and counting
how many set stress range cycles it takes to reach this total sum. If the ship reaches the set
value before the intended lifetime, the iterative process re-designs the failed details and the
analysis is done again. (DNVGL-CG-0129, 2015, p. 53)

58
4.5 Post-processing
As the pre-processing has been established, fatigue capacity calculation and cycle collection
decided, the data needs to be transformed into a form which can be made use off. The data
can then be useful for the end-user to improve upon design aspects, vessel operation and
periodical service. The post-processing can be configured to run onboard the vessel or on-
shore, again, depending on the collected amount of data and the performance requirements
for calculation.
4.5.1 Damage estimation method
The vessel fatigue calculations rely on Palmgren-Miner rule for damage accumulation. As it
is mentioned in previous chapters (2.6.2, 4.4.9) to be an approved and recommended method
for life cycle estimation by multiple design codes. It is also endorsed to be used in hull con-
dition monitoring systems in real-time damage calculation. Here, online fracture mechanics
and real-time crack growth monitoring is ignored as they’ve not been verified for accuracy
by design codes for ship hull condition monitoring. However, it is recommended to use the
measured data for scheduled crack growth calculations to ensure that the predicted life by
linear damage methods are correct. (ABS, 2020, pp. 7-8)
The Palmgren-Miner linear cumulative damage rule is based around multiple stress ranges
contributing together to the damage sum. In short, the Miner’s rule represents the propor-
tional amount of damage by the ratio between stress cycles and cycles to failure for the
corresponding stress range. There exists a plethora of variations for this rule, but as it is
generally approved by design guidelines in its original form, only the original is discussed
in more detail. The rule is defined as Equation (4). (Hobbacher, 2008, pp. 109-110)
D = ∑ ni
Ni
k
i=1
(4)
Where ni represents the number on cycles for the stress range of interest and Ni shows the
number of cycles until failure for that same range. The fatigue capacity is evaluated using
the chosen fatigue calculation method. The Miner’s rule provides more accurate and reliable
results when the stress spectrum represents narrow-band random loading. The use of Miner’s
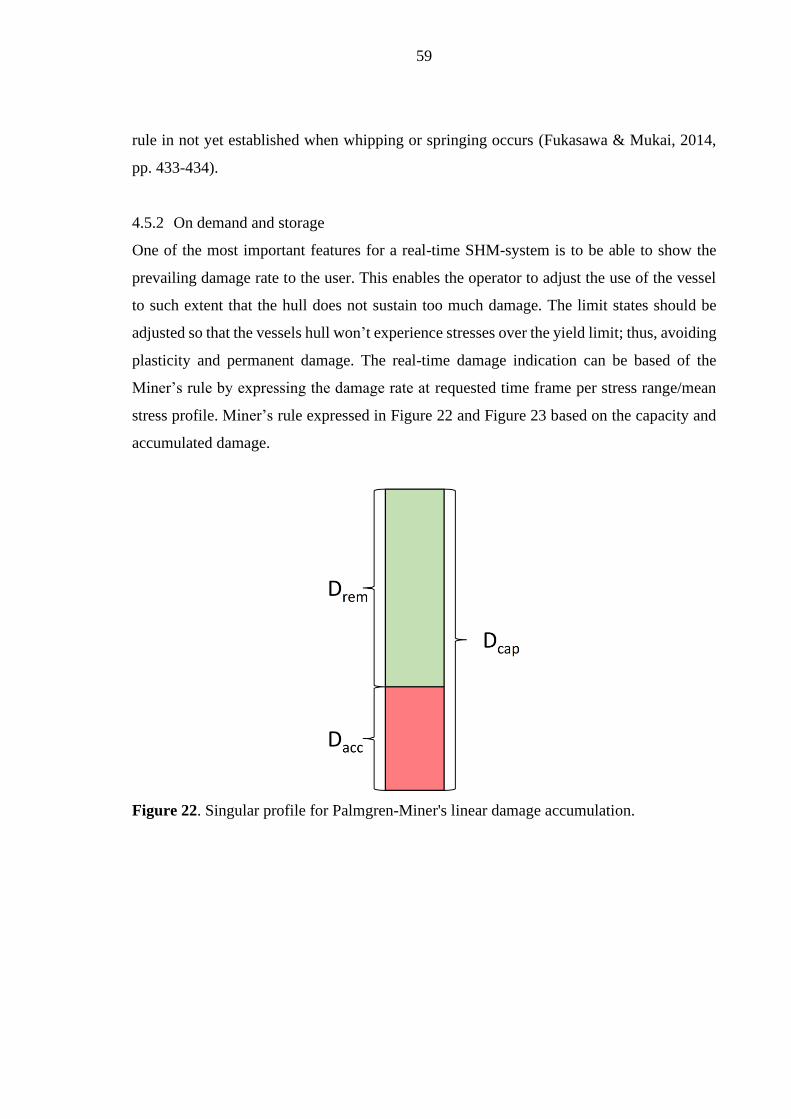
59
rule in not yet established when whipping or springing occurs (Fukasawa & Mukai, 2014,
pp. 433-434).
4.5.2 On demand and storage
One of the most important features for a real-time SHM-system is to be able to show the
prevailing damage rate to the user. This enables the operator to adjust the use of the vessel
to such extent that the hull does not sustain too much damage. The limit states should be
adjusted so that the vessels hull won’t experience stresses over the yield limit; thus, avoiding
plasticity and permanent damage. The real-time damage indication can be based of the
Miner’s rule by expressing the damage rate at requested time frame per stress range/mean
stress profile. Miner’s rule expressed in Figure 22 and Figure 23 based on the capacity and
accumulated damage.
Figure 22. Singular profile for Palmgren-Miner's linear damage accumulation.

60
Figure 23. Multiple profiles for linear damage accumulation.
As the linear accumulation is represented by Equation (4) and is based on summation of the
cycle profiles, the prevailing damage rate can be simply calculated in a selected time interval
and presented to the user. This way the user has a clear vision of the damage caused to the
vessel by the current conditions and manoeuvres. Simple representation of the Miner’s dam-
age rule in a selected time frame could be as in Equation (5).
Drate = ∑ Dcalc.
T
t
(5)
Here, the Drate represents the cumulated damage in the selected time frame, Dcalc. the damage
sum calculated for cycles in time delta, 𝑇 is the elapsed time since start and 𝑡 is the chosen
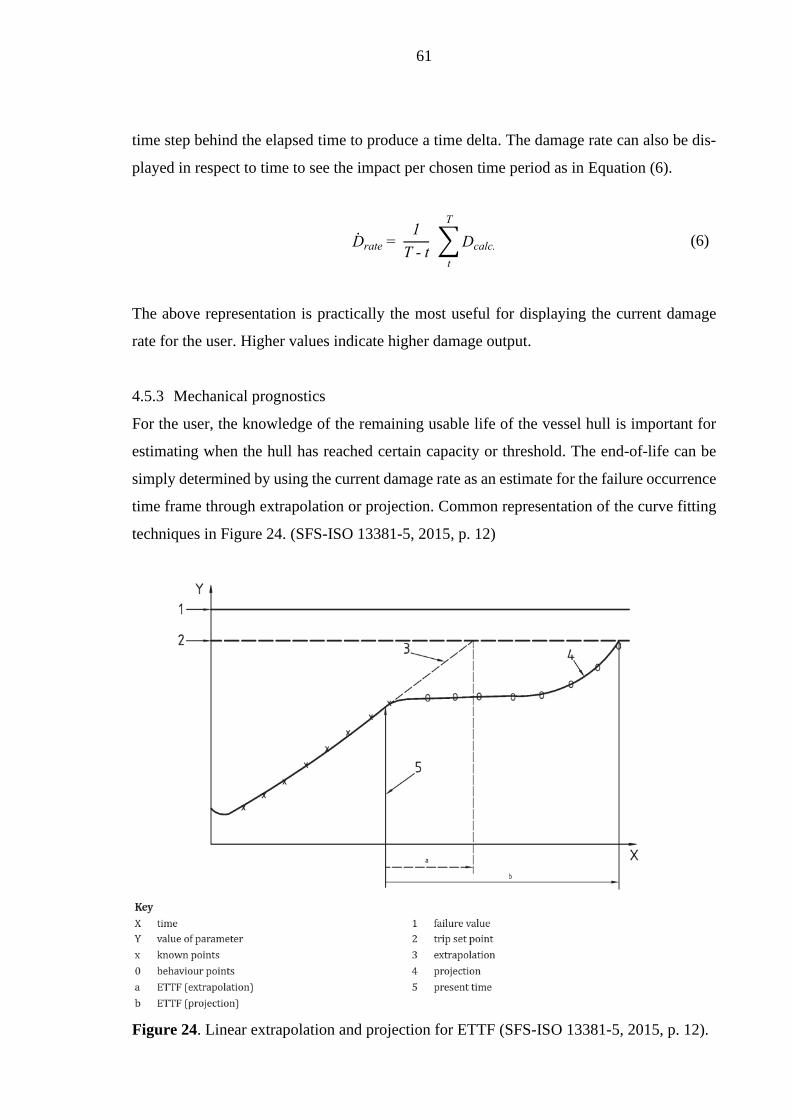
61
time step behind the elapsed time to produce a time delta. The damage rate can also be dis-
played in respect to time to see the impact per chosen time period as in Equation (6).
Drate = 1
T - t ∑ Dcalc.
T
t
(6)
The above representation is practically the most useful for displaying the current damage
rate for the user. Higher values indicate higher damage output.
4.5.3 Mechanical prognostics
For the user, the knowledge of the remaining usable life of the vessel hull is important for
estimating when the hull has reached certain capacity or threshold. The end-of-life can be
simply determined by using the current damage rate as an estimate for the failure occurrence
time frame through extrapolation or projection. Common representation of the curve fitting
techniques in Figure 24. (SFS-ISO 13381-5, 2015, p. 12)
Figure 24. Linear extrapolation and projection for ETTF (SFS-ISO 13381-5, 2015, p. 12).
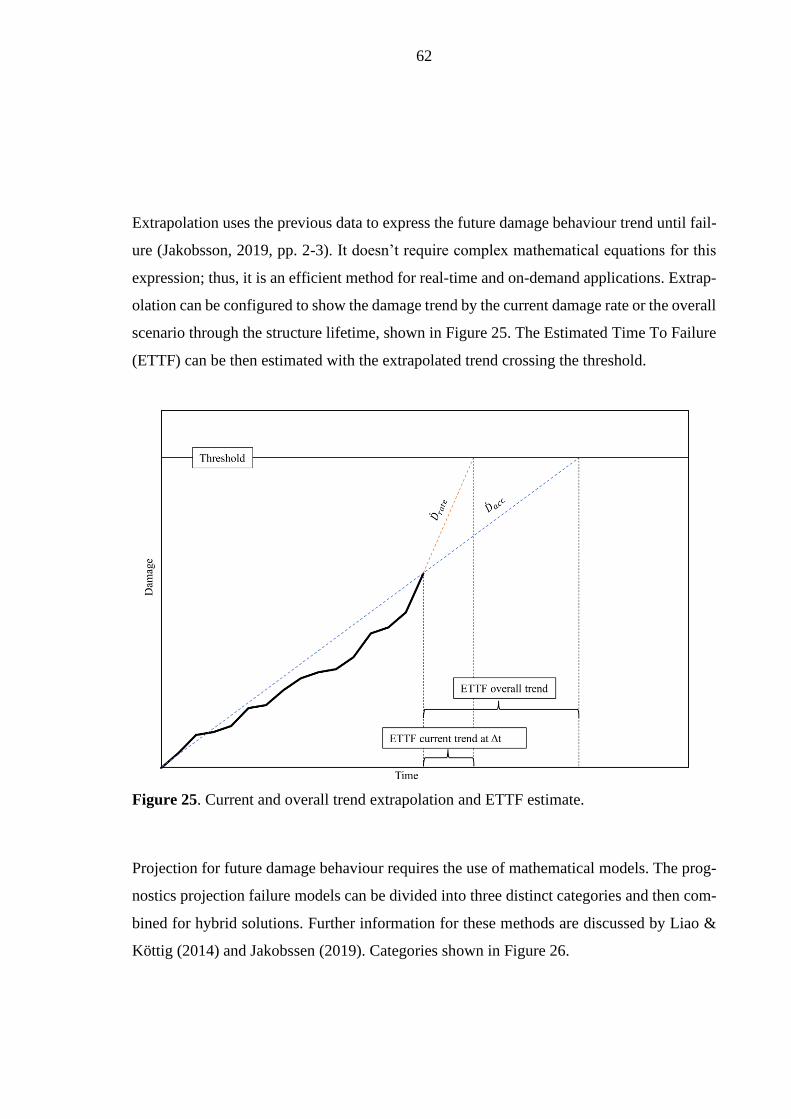
62
Extrapolation uses the previous data to express the future damage behaviour trend until fail-
ure (Jakobsson, 2019, pp. 2-3). It doesn’t require complex mathematical equations for this
expression; thus, it is an efficient method for real-time and on-demand applications. Extrap-
olation can be configured to show the damage trend by the current damage rate or the overall
scenario through the structure lifetime, shown in Figure 25. The Estimated Time To Failure
(ETTF) can be then estimated with the extrapolated trend crossing the threshold.
Figure 25. Current and overall trend extrapolation and ETTF estimate.
Projection for future damage behaviour requires the use of mathematical models. The prog-
nostics projection failure models can be divided into three distinct categories and then com-
bined for hybrid solutions. Further information for these methods are discussed by Liao &
Köttig (2014) and Jakobssen (2019). Categories shown in Figure 26.

63
Figure 26. Prognostics models for future failure estimation (Liao & Köttig, 2014, p. 192).
Experience-based models are created by using events from history and engineering experi-
ence. This method employs rules which are generally easy to understand and logical. The
collected expert knowledge can however lead into false results when it comes to complex
systems. (Liao & Köttig, 2014, p. 192)
Data-driven methods use the cumulated data history to create a prediction for future behav-
iour. The matched behaviour can be achieved with statistics models (e.g. Hidden Markov
Models – HMM), artificial intelligence (e.g. Artificial Neural Network - ANN) and reliabil-
ity functions (e.g. Weibull distribution). These methods are used to create a correlation be-
tween the collected data and damage. (Liao & Köttig, 2014, pp. 192-193)
Physics-based models are created by the knowledge of the systems failure mechanisms. The
physics phenomena, such as strain effects and crack growth, are used as the degradation
processes to assess the failure life. The models are usually created during development and
can be used for similar products by parameter modifications. (Liao & Köttig, 2014, p. 194)

64
5 BENEFITS AND FEEDBACK FROM SHM
Most structural health monitoring systems are implemented to achieve safety, environmental
and financial gain, but it may sometimes be unclear when such benefits can be noticed. Mon-
itoring of a structural detail does not increase the capacity; thus, the benefits rarely are im-
mediate, depending on the level of monitoring and post-processing. This chapter discusses
the benefits and feedback potential from such systems now that we have reviewed the meth-
odology behind them by using literature and conducted studies.
5.1 Design stage
Implementing a state-of-the-art SHM-system capable of accurate real-time local fatigue cal-
culations requires detailed structural analyses for proper sensor installation locations and
setup. The conducted analyses have a direct effect in helping to understand problems in the
vessel structures not noticed during the design procedure or otherwise not reachable with the
design methods proposed by the design code of the vessel.
Depending on the chosen sea state modelling method for the structural analysis, more accu-
rate EOC simulations provide a great platform to improve the design over the same fleet
production or even to future new-built projects. The benefits can be seen in both, structural
strength modifications and performance gains through the better understanding of ship be-
haviour in various sea states simulated. The long-term instrumentation provides the design-
ers a deeper understanding of the actual ship responses when in operation.
5.2 Feedback coupling
Although detailed structural analyses can be used to find the critical details for overload and
fatigue, simulation of all relevant EOC’s can be very costly and time consuming. To assess
the vessel structural deformation and stress response further during the operation, load/re-
sponse estimation or shape sensing technologies can be used for full structure analysis with-
out needing vast amounts of sensory outputs. (Hess, et al., 2018, pp. 409-410)
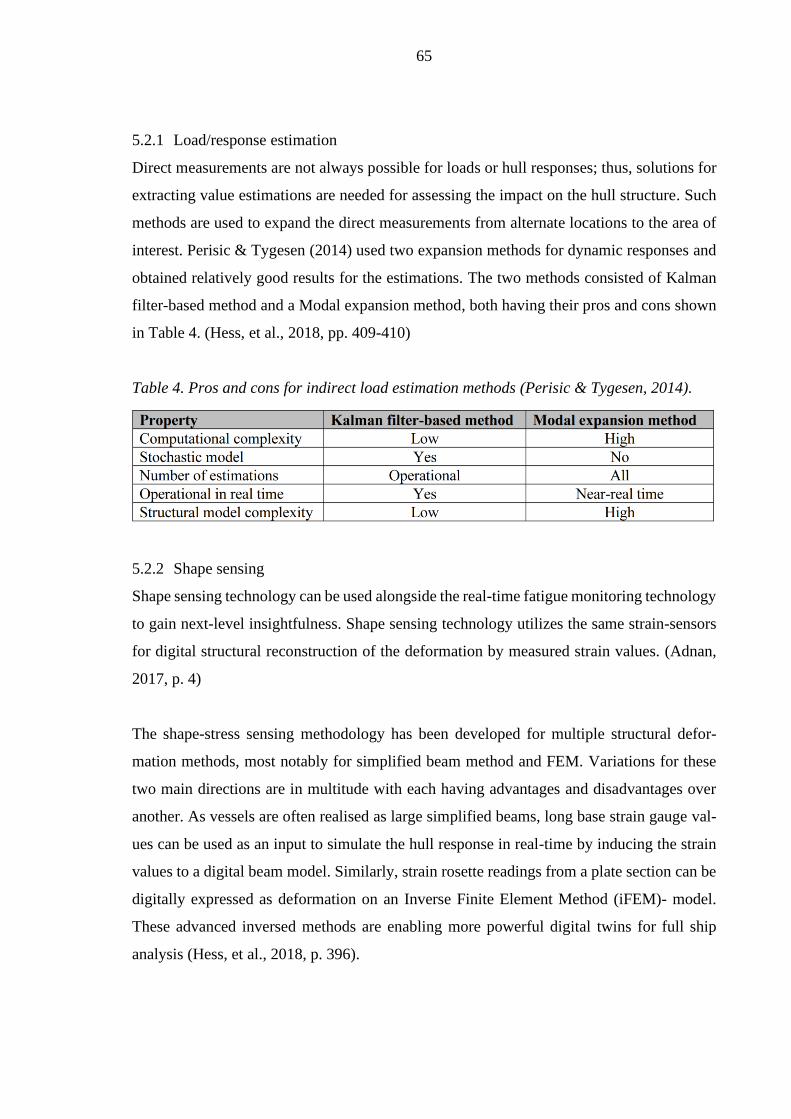
65
5.2.1 Load/response estimation
Direct measurements are not always possible for loads or hull responses; thus, solutions for
extracting value estimations are needed for assessing the impact on the hull structure. Such
methods are used to expand the direct measurements from alternate locations to the area of
interest. Perisic & Tygesen (2014) used two expansion methods for dynamic responses and
obtained relatively good results for the estimations. The two methods consisted of Kalman
filter-based method and a Modal expansion method, both having their pros and cons shown
in Table 4. (Hess, et al., 2018, pp. 409-410)
Table 4. Pros and cons for indirect load estimation methods (Perisic & Tygesen, 2014).
5.2.2 Shape sensing
Shape sensing technology can be used alongside the real-time fatigue monitoring technology
to gain next-level insightfulness. Shape sensing technology utilizes the same strain-sensors
for digital structural reconstruction of the deformation by measured strain values. (Adnan,
2017, p. 4)
The shape-stress sensing methodology has been developed for multiple structural defor-
mation methods, most notably for simplified beam method and FEM. Variations for these
two main directions are in multitude with each having advantages and disadvantages over
another. As vessels are often realised as large simplified beams, long base strain gauge val-
ues can be used as an input to simulate the hull response in real-time by inducing the strain
values to a digital beam model. Similarly, strain rosette readings from a plate section can be
digitally expressed as deformation on an Inverse Finite Element Method (iFEM)- model.
These advanced inversed methods are enabling more powerful digital twins for full ship
analysis (Hess, et al., 2018, p. 396).
66
The iFEM has been established as a methodology for possessing benefits over the more
simplified methods. The iFEM as a method is also far branched. Studies on various element
types and simulating of physical phenomena appear continuously as the method arouses in-
terest in the science community. Adnan (2017, p. 20) expressed the user benefits as such:
- “The iFEM methodology does not require any loading and/or material information
to reconstruct the three-dimensional displacement field of the structure.
- The iFEM formulation does not require the entire structure to be installed with strain
sensors to monitor the entire structural displacements. Only few locations need to be
instrumented with any type of strain sensors such as strain rosettes, strain gauges,
fibre optic cables.
- The iFEM methodology is free from complex structural geometry and/or boundary
conditions.
- The iFEM algorithm can provide robust, stable, and accurate displacement results
even with the strain measurements have inherent errors (e.g., noise).
- The iFEM framework is sufficiently fast for real-time monitoring applications.”
These benefits are certainly great for maritime applications to accommodate the prevailing
conditions ships are facing, such as vibrations introduced as noise in the strain gauge read-
ings and the discussed methods for real-time fatigue monitoring of hull structures. Currently,
SHM systems with active couplings and full-field stress analyses are used in aerospace in-
dustry, but studies such as Adnan’s (2017) show that the marine industry has a potential of
employing a such concept.
5.3 Hull service and life longevity improvement
As most of the marine applications are designed assuming the worst load conditions, a great
life benefit can be achieved by employing a robust system for remaining life estimation and
hull service intervals. Structural health monitoring plays a big role by enabling the use of
Condition-Based-Maintenance (CBM) methods instead of the more traditional time based
and scheduled maintenance procedures. The use condition of vessel can change during her
lifetime, so being able to schedule maintenance and inspection according to the deterioration
can provide advantages to a more traditional methods. CBM is suitable for both, on- and off-
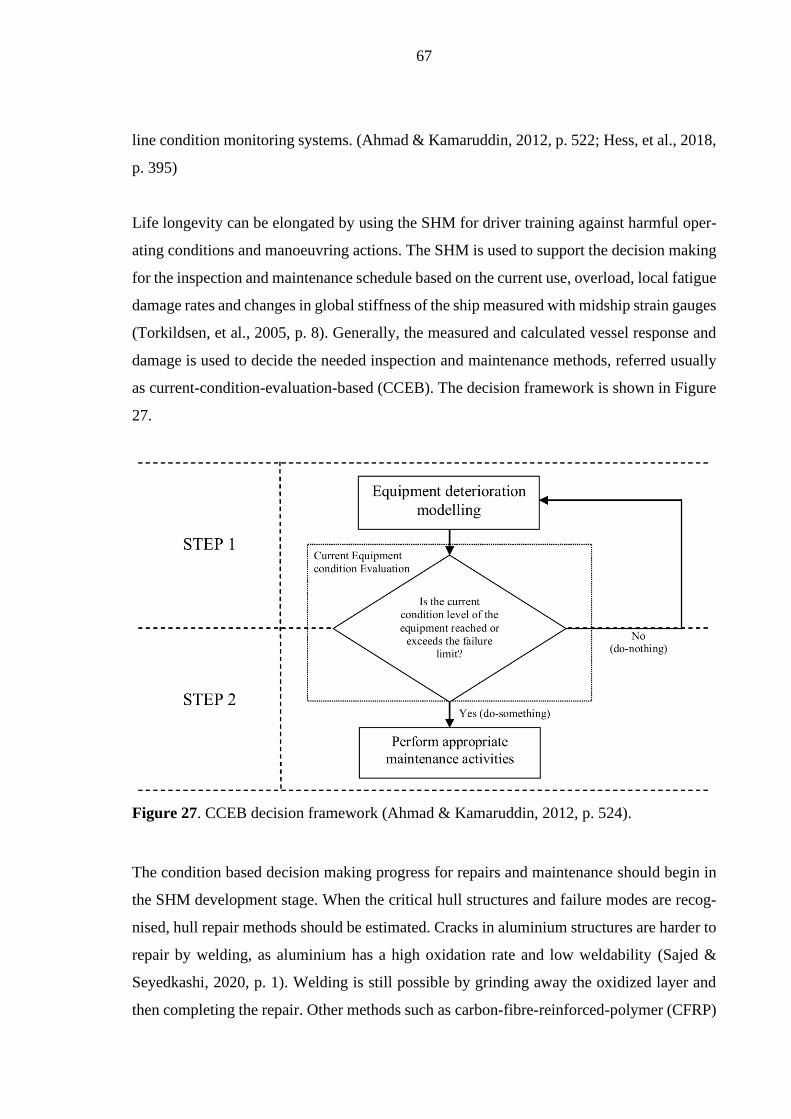
67
line condition monitoring systems. (Ahmad & Kamaruddin, 2012, p. 522; Hess, et al., 2018,
p. 395)
Life longevity can be elongated by using the SHM for driver training against harmful oper-
ating conditions and manoeuvring actions. The SHM is used to support the decision making
for the inspection and maintenance schedule based on the current use, overload, local fatigue
damage rates and changes in global stiffness of the ship measured with midship strain gauges
(Torkildsen, et al., 2005, p. 8). Generally, the measured and calculated vessel response and
damage is used to decide the needed inspection and maintenance methods, referred usually
as current-condition-evaluation-based (CCEB). The decision framework is shown in Figure
27.
Figure 27. CCEB decision framework (Ahmad & Kamaruddin, 2012, p. 524).
The condition based decision making progress for repairs and maintenance should begin in
the SHM development stage. When the critical hull structures and failure modes are recog-
nised, hull repair methods should be estimated. Cracks in aluminium structures are harder to
repair by welding, as aluminium has a high oxidation rate and low weldability (Sajed &
Seyedkashi, 2020, p. 1). Welding is still possible by grinding away the oxidized layer and
then completing the repair. Other methods such as carbon-fibre-reinforced-polymer (CFRP)

68
retrofitting to existing cracks on steel structures has been studied by Wang et al. (2015) and
Hu et al. (2016). Their researches were focused on extending the fatigue life by employing
CFRP-plating on top of crack initiation location. This method has been reviewed for alumin-
ium structures as well by Pramanik et al. (2017).

69
6 THE METHODOLOGY CONCEPT
The generated methodology for real-time hull fatigue monitoring consists of three main
branches; Definition for SHM, Analysis methods and constructing the actual SHM-system
for monitoring the hull condition. The methodology is presented on simple flowchart con-
sisting of different phases for building the system.
Installing a hull structural health monitoring system for real-time fatigue calculation consists
of multiple steps. At each step it is necessary to consider whether the chosen methods pro-
duce results that meet the initial requirements for the monitoring. The initial requirements
affects the scope of data collection and the analysis methods. The produced steps offers few
ways to conduct real-time on-demand hull structural health monitoring.
The path for the SHM-system creation begins by assessing the vessel type, regulations and
the requirements. The operational demands vary greatly across the different vessel types,
some ships experience heavy static loads by cargo and some are designed to sail year around,
even in icy conditions. These different demands for operation affect the data collection and
the extent of the structural analyses.
Whether the vessel is a new-build or already in use, regulations concerning the hull moni-
toring system must be considered. Although such advanced systems are not generally re-
quired up-to-this-date, the rules determine for example how the data should be managed and
at what sampling rate it should be recorded at. Further elaboration for these rules are in
Appendix 1.
The vessel design evaluation is important for assessing the structural complexity of the ship.
The structural complexity has a direct effect on the needed structural analyses for critical
details. The evaluation also includes the materials used and the overall design/scantling pro-
cess of the vessel. Already performed structural analyses can also prove useful in designing
the hull SHM and real-time fatigue calculations.

70
Preliminary evaluation for the scope of data collection are based on the information require-
ments set for the system to produce. Detailed CBM and ETTF require a substantial use of
sensory outputs for fatigue critical details if on-demand results are required. Usage of refer-
ence data is recommended for assessing the accurate EOC’s in which the most damage oc-
curs. The relation between damage and EOC’s can be used for crew training along with
warning states for high sea and stress states.
The operational loads and hull responses are needed for structural analyses. The loads vary
from simple static pressure to stochastic wave events leading to slamming and vibrations.
The hull responses are evaluated based on their criticality for structural health and most
common/critical responses should be monitored. The structural failure possibilities are noted
and used for preliminary definition of repairs and CBM.
Chosen analysis methods for the operational loads are directly related to the accuracy of the
hull monitoring system. The most advanced methods utilise the hydroelastic vessel behav-
iour in waves and nonlinearity of local strain effects. The chosen load modelling technique
also has a direct effect on which structural analysis method can be used for the hull re-
sponses. As for the SHM-system configuration, regulations should be studied for reference.
The structural analysis is used for recognising critical hull structures prone for failure, either
static or dynamic. Depending on the chosen structural analysis methods, global and local
strength can be assessed. The found critical structures are then studied for possible failure
mechanisms. Failure mechanisms range from instability to cyclic fracture by fatigue.
As the critical structures are found, instrumentation is needed for real-time structural health
monitoring. The data collection can be short- or long-term, both having their own ad-
vantages. Short-term monitoring is used for profiling the responses and developing a damage
model running on reference data or predicted voyages. Long-term measurement is used
through vessel life and is better for highly stochastic load scenarios, where hull responses
vary greatly. The choice comes down to the preliminary requirements for the monitoring.
Since direct instrumented measurements are not always possible, response expansion meth-
ods could be needed.

71
Handling the data can be configured to run onboard or onshore with modern data loggers.
The on-line calculation of fatigue damage requires adequate processing power; thus, a capa-
ble compute unit is needed. Data sensitivity should be considered too as wireless transmis-
sions are vulnerable to data breaches. Local computation and storage offer a more secure
solution.
The term “real-time monitoring” of SHM-systems can be often conceptualised differently.
Here, the real-time refers to direct measurement and calculation of responses and damage
rates as they occur. For responses, this requires the use of limit states and warning systems
for high damage and stresses. The load cycles must then be calculated with an on-line method
capable of efficient stress/strain loop retrieval. The damage calculation must be completed
as the cycle is found and then it can be used for on-demand display or prognostics.
Prognostics is known as a discipline for estimating the remaining useful life of a system. The
mechanical prognostics for a vessel hull can be configured with extrapolation or projection
for the ETTF. The estimation can be directly used for creating CBM-schedules to prevent
sudden failure and elongate the life of the vessel. The full methodology for generating hull
SHM-systems for real-time fatigue monitoring is shown in Figure 28.
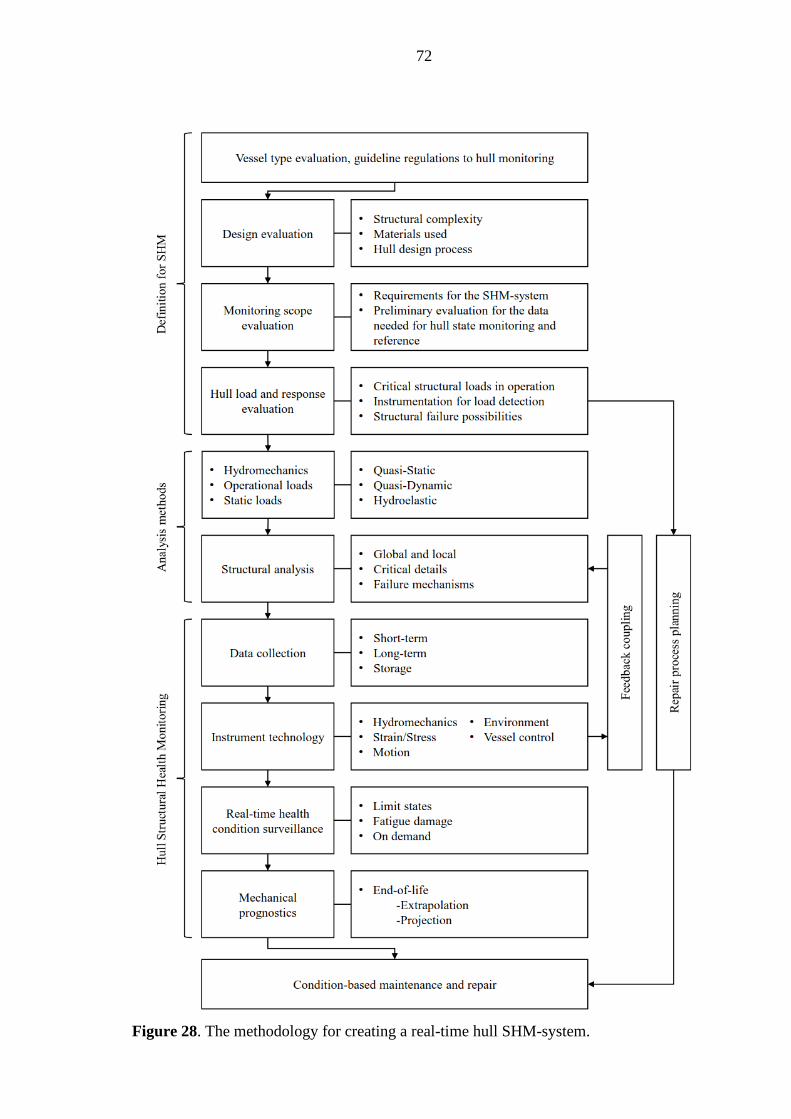
72
Figure 28. The methodology for creating a real-time hull SHM-system.
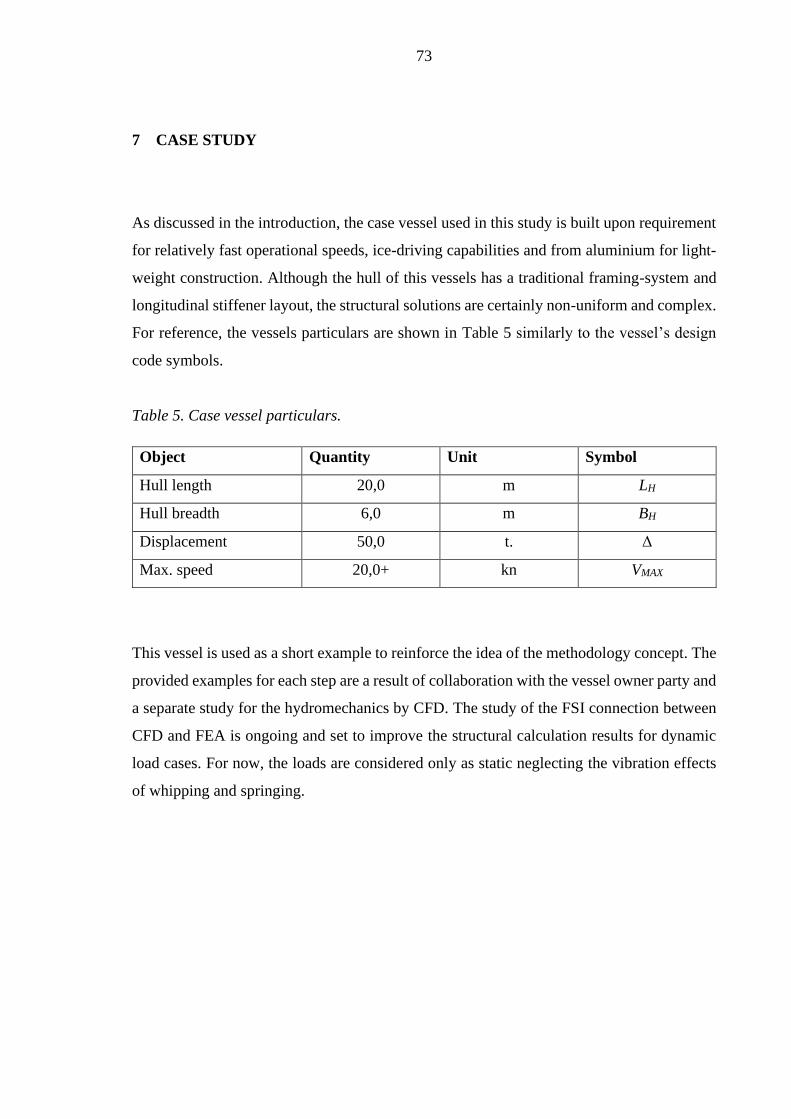
73
7 CASE STUDY
As discussed in the introduction, the case vessel used in this study is built upon requirement
for relatively fast operational speeds, ice-driving capabilities and from aluminium for light-
weight construction. Although the hull of this vessels has a traditional framing-system and
longitudinal stiffener layout, the structural solutions are certainly non-uniform and complex.
For reference, the vessels particulars are shown in Table 5 similarly to the vessel’s design
code symbols.
Table 5. Case vessel particulars.
Object Quantity Unit Symbol
Hull length 20,0 m LH
Hull breadth 6,0 m BH
Displacement 50,0 t. Δ
Max. speed 20,0+ kn VMAX
This vessel is used as a short example to reinforce the idea of the methodology concept. The
provided examples for each step are a result of collaboration with the vessel owner party and
a separate study for the hydromechanics by CFD. The study of the FSI connection between
CFD and FEA is ongoing and set to improve the structural calculation results for dynamic
load cases. For now, the loads are considered only as static neglecting the vibration effects
of whipping and springing.
74
7.1 The requirements for hull monitoring
As noted earlier, to define the SHM-system for a vessel, requirements must be clear what is
needed from the system and how much data is needed to reach the set goals. For this vessel,
the requirements are as follows:
- On-demand hull structural analysis:
- Current damage rate
- Indicate too high usage by colour coded warning signals (green, yellow, red)
- Warn driver of potential permanent deformation
- End-of-life analysis:
- Producing timelines for damage outputs
- Current and past trends for damage rate developments
- Forecasted time to end-of-life
- Improved maintenance:
- Using the data to schedule the hull inspection and repairs more efficiently
- Data management
- No wireless transmission of locational data, security concerns
7.2 Regulations
The design code for this vessel does not contain any information or requirements for a hull
monitoring system. Only notations for the intended systems concerns the electrical safety
for the on-board measuring devices and compute-units. The system must be calculated for
its power drain to ensure that overloading of the batteries and power delivery systems does
not happen. List of demands for electrical safety in the VTT Workboat guide. (VTT Expert
Services Oy, 2016, p. 184)
7.3 Design evaluation
The vessel is structurally very heterogeneous and complex. The main framework consists of
bulkheads in different sizes due to the shape of the outer hull. Deck stiffeners are extruded
aluminium profiles with snipped ends, however, usually placed through the bulkheads to
allow deck flexing. As the vessel is intended for all-year-around use, it is intended to have a
de-icing system. The de-icing system needs air convection; thus, the hull features multiple
holes in the bulkheads for the heat to pass through.

75
This aluminium vessel is designed mainly from 5000- and 6000-series aluminium for its
main hull structures, providing good protection against corrosion and sufficient strength to
weight rating. The vessel scantlings are based on the required efficient section moduli
against the significant wave for vessel class A. The ice-driving capabilities are achieved by
using an ice-belt structure against the ice pressure defined by the regulations. The ice contact
zone is defined by the regulations as well, requiring the use of reinforced structures close to
the waterline.
7.4 Preliminary instrumentation needs
The requirements for the SHM-system state that the user wants constant information about
the prevailing damage rates and estimation for the remaining useful life of the vessel. As the
vessel faces varying EOC’s, long-term damage monitoring and limit state warning systems
would be beneficial. Collection of reference data, such as vessel motions, positions and sea
states would provide better understanding against the most crucial events against structural
integrity. The scope for such systems are defined by the structural analysis, whether the
monitoring should focus on global and/or local phenomena.
7.5 Load and response analyses
The operational demands and intended uses for the vessel have a very stochastic nature; thus,
the creation of load cases for normal operation is quite challenging. However, the forward
speed effects are important to consider as most of the ships loading is caused by wave contact
and not by distributed mass and bending moments from cargo. The vessel does not carry
cargo other than the crew and occasional operational equipment. Infrequent ice-driving is
not considered to cause significant fatigue damage but the stress limit states can be moni-
tored against permanent damage.
The case vessel is relatively fast and small, most of the loading is probable to be caused by
irregular sea states and sudden wave slamming events leading to larger amplitude vibration
of whipping and springing. CFD enables the simulation of these effects through a FEA cou-
pling. With CFD and FEA coupling, the simulation of vessel manoeuvring and planing con-
dition is also possible.
76
Aluminium has a higher crack propagation rate than common shipbuilding steel, local fa-
tigue cracking is probably the most predominant failure mode for these hull structures. These
structural hot spots are best recognised by using direct calculation methods, such as FEM.
Other failures, such as local buckling and local plastic deformation are possible in case of
overload scenarios by slamming.
At this stage, the repair procedures for cracks and aforementioned possible failure modes are
pre-considered. The ready-built vessel has tight spaces restricting the possibilities for repair
methods requiring bulky machinery, the aforementioned CFRP-method by installing rein-
forcements on the crack growth locations can prove to be useful.
7.6 Design model
The vessel is designed by using CADMATIC Hull, a design software suited for hull structure
generation with high levels of parametrisation, flexibility and rule-based engineering tools.
The model can be exported as a step-file containing relevant geometrical information to a
chosen third party-software, such as FE-tools. (CADMATIC, 2020)
In this case, FE-method is found most suitable for analysis due to irregular and complex
structures in the vessels hull. The fine detail geometry is exported as a step-file and fed into
the chosen FE-tool for further modifications and global analysis.
7.7 Global calculation model
The calculation model needs optimisation for efficient calculation and performance. Model
reduction is completed by using SpaceClaim, part of the Ansys product family. SpaceClaim
is a Computer Aided Design (CAD)-modelling software and features powerful geometry
manipulation tools for FEA, enabling faster geometry simplification and preparation for
meshing and analysis. (SpaceClaim, 2020)
As the global calculation model is used for finding the critical details for further analysis,
the geometry can’t be simplified too much. Some smaller fillets, openings, stiffeners are
removed and/or replaced with simplifications. The simplified structures should still transfer
loads and distribute stresses as the original design would. Some simplifications are shown
in Figure 29. (Siipola, 2018)

77
Figure 29. Simplified geometry in SpaceClaim.
The model reduction and simplification also help with the midsurfacing of the structures.
Midsurfacing is required for the use of 2-D shell elements in FE-analysis. The midsurfacing
creates a surface between two planars on the solid selected. The selection of coincident sur-
faces was completed manually and by thickness range. Midsurfaced example in Figure 30.

78
Figure 30. Midsurfaced geometry in SpaceClaim.
As the original solid geometry structures are connected and then midsurfaced, the connection
between the continuous structures are lost. The created surfaces must be extended and
trimmed to share the topology of the original model. This step can be time consuming and
prone to cause geometry errors. SpaceClaim Midsurface-tool has automated extension and
trimming setup, but in the case model used here, they didn’t work as intended causing ge-
ometry errors and distortions. All geometry modifications were completed manually. Space-
Claim gives midsurfaced bodies the original thickness of the geometry; thus, saving time.
As the needed connections are established and the midsurface model has similar strength
characteristics to the original, the meshing procedure can begin.
As the vessel still features smaller tertiary structures transmitting forces, the mesh quality
and size is chosen to accommodate these geometries. Defeaturing of such geometries could
lead into false results and some fatigue critical details could go unnoticed. As ship structures
are being constructed mostly out of plates and beams, a combination of 2-D shell and 1-D
beam elements was chosen. 1-D and 2-D elements are great for their lesser computational
effort and relative accuracy even in small details. However, when assessing further details
in the hull structures, it should be noted that 2-D elements cannot represent perpendicular
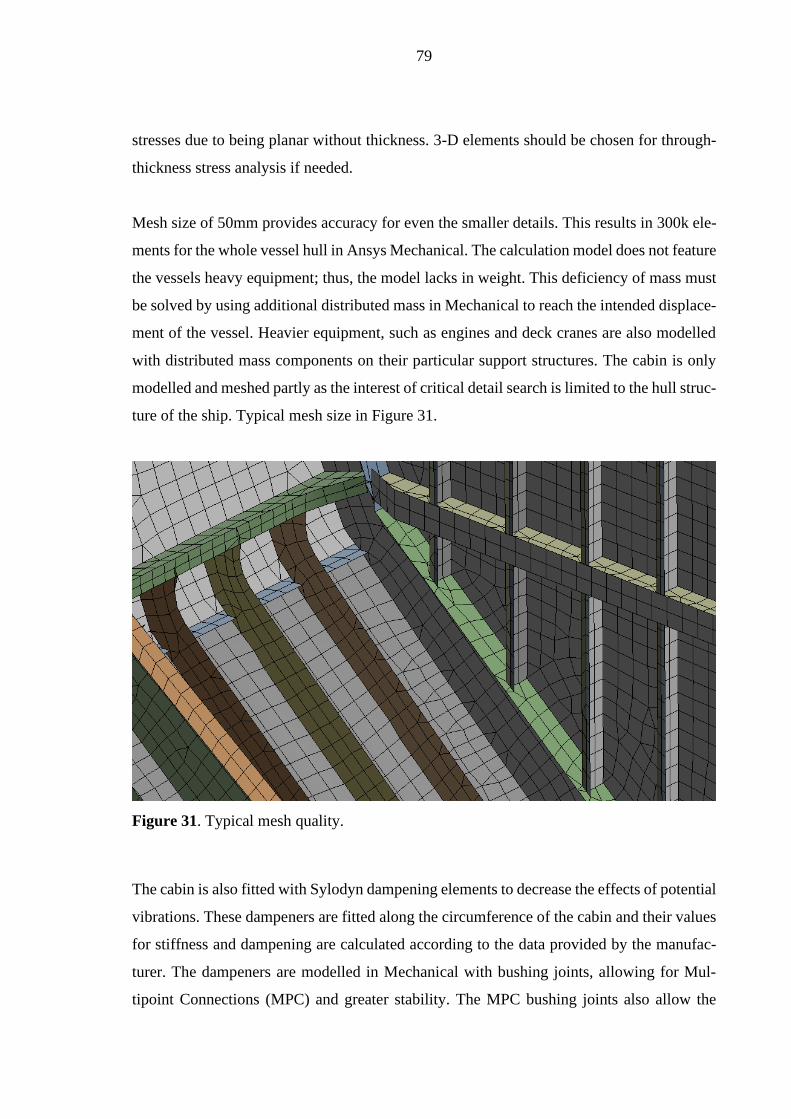
79
stresses due to being planar without thickness. 3-D elements should be chosen for through-
thickness stress analysis if needed.
Mesh size of 50mm provides accuracy for even the smaller details. This results in 300k ele-
ments for the whole vessel hull in Ansys Mechanical. The calculation model does not feature
the vessels heavy equipment; thus, the model lacks in weight. This deficiency of mass must
be solved by using additional distributed mass in Mechanical to reach the intended displace-
ment of the vessel. Heavier equipment, such as engines and deck cranes are also modelled
with distributed mass components on their particular support structures. The cabin is only
modelled and meshed partly as the interest of critical detail search is limited to the hull struc-
ture of the ship. Typical mesh size in Figure 31.
Figure 31. Typical mesh quality.
The cabin is also fitted with Sylodyn dampening elements to decrease the effects of potential
vibrations. These dampeners are fitted along the circumference of the cabin and their values
for stiffness and dampening are calculated according to the data provided by the manufac-
turer. The dampeners are modelled in Mechanical with bushing joints, allowing for Mul-
tipoint Connections (MPC) and greater stability. The MPC bushing joints also allow the
80
usage of actual damping values, increasing the accuracy of the results. Bushings are defined
separately for each dampener.
As the model is created by midsurfacing an existing solid CAD-model, topology errors are
possible. As the midsurfacing creates a planar surface between the top and bottom of a plate
section, perpendicular intersections are left open requiring for extension. These sections can
be extended manually by manipulating the geometry or attempting to use node merging.
Detached mesh and structures can be found by conducting a modal analysis. The analysis
can be completed with a simple fixed nodal constraint in the aft of the vessel. The resulting
modal shapes clearly highlight the loose and/or detached structures for topology repairs.
7.8 Structural analysis
The highest slamming force is a sum of multiple parameters, including the relation between
bow and the wave in terms of speed and the angle of attack, as explained in Chapter 2.3.3.
The conditions for highest slamming forces are quite complex; thus, experimental simula-
tions for the worst case are needed for this vessel. For the detail wave simulations, Simcenter
STAR-CCM+ is chosen for advanced CFD-calculations.
7.8.1 Wave simulation
STAR-CCM+ features built-in wave simulation tools. The wanted wave length, period and
height are used as inputs for the simulation. The software is also capable of producing a
forward speed for the vessel, enabling performance analyses and statistics. The slamming
conditions are defined by experiments for highest pressure delta and selected for structural
analysis. For now, only slamming conditions are used for testing the fluid structure interac-
tion between STAR-CCM+ and Ansys Mechanical. The CFD simulations are completed in
a separate study.
As slamming is a sum of multiple factors, experimental investigation is required for the ves-
sel of interest to find the worst combination of EOC’s and forward speeds. As CFD-calcula-
tions are heavy on performance and require a lot of time, using other methods for the ship
behaviour in waves should be considered. In this case, Ansys Aqwa is used for hydrody-
namic diffraction and response analysis.
81
The hydrodynamic simulation was used for finding a ship response most likely contributing
to the slamming. The ship forward speed was adjusted using the wave encounter period and
wave height matched the common occurrence of the vessels operational area. The attack
angle between the bow and the wave was minimized for maximum impact force. The best
slamming case found was further studied in CFD by implementing a turbulent wave simu-
lation model for accuracy.
7.8.2 Fluid Structure Interaction
FSI will be employed by one-way-method, transferring the pressure values from the CFD to
FEA by file-based-coupling. The most significant wave load scenarios are simulated in
STAR and the resulting pressures mapped to the global calculation model built in Ansys.
The mapped pressures are imported back to the FEM-software for global and local structural
analysis.
As the simulated load scenarios are dynamic, multiple load steps are processed. The loads
are transferred into Ansys by using the built-in external data component, in which the pres-
sures are defined for global coordinate locations. The pressures are imported and mapped on
the ship hull individually. As the simulation was ran against few wave periods, the results
were analysed manually and the maximum force impact modes were looked for. Two pres-
sure interactions were chosen to test the FSI-method. The first pressure plot featured a max-
imum pressure on the ice-belt area, contributing to higher stress responses in the bow flare.
The second pressure plot chosen featured a slamming of the bow thruster tunnels, showing
higher stresses on the structures closer to the ship sides.
7.8.3 Structural FEA
The two chosen pressure plots were analysed by conducting a global static response study;
thus, no hydroelastic response between the structure and the fluid is considered. The struc-
tural response is achieved with inertia relief boundary conditions. The inertia forces caused
by the implemented pressure field are counterbalanced with accelerations. With the inertia
relief method, false boundary results are avoided (Rosen, et al., 2020). In the inertia relief
method only rigid body movements should be eliminated. As the analysis is 3-D, six degrees
of freedom are restrained.
82
The global calculation model is inspected for stress hot-spots. The analyses for these two
load cases did not show stress behaviour over or close to the materials yield limits. At this
stage, ruling out the possibilities for static failures, such as buckling or large plastic defor-
mation. Distinctive stress hot-spots leading to fatigue failure have been found and must be
studied further.
7.8.4 Sub-model evaluation for monitoring
For this example, structural discontinuities with high stress concentrations are studied. As
discussed in chapter 3.3.4, there are three distinct surface displacement modes for crack
growth. These modes are mostly caused by high tension and shear stresses in structural dis-
continuities. The selected pressure load cases generated three distinct locations for stress
concentrations all in close proximity of welds. These locations require further analysis by
using local calculation models by employing cut boundary displacements from the global
model. The plots shown are principle stresses from these selected sub-models.
The sub-models are used for evaluating the monitoring and fatigue calculation methods. The
mesh sizing generally follows the recommendations by DNV-GL: Fatigue assessment of
ship structures: Appendix E. The sub-models are created by using solid mesh elements for
complex stress behaviour and through thickness effects. The general mesh size for the sub-
models are 15x15x15mm and in close proximity of the hot spot detail, the element size is
reduced to the lowest plate thickness of the attachment.
The first sub-model is retrieved from a WT-bulkhead of the ship. The hot-spot stress is lo-
cated on the connection of two stiffeners close to the side of the vessel. As the stress response
clearly shows that the concentration is located on the connection itself, all relevant welds are
modelled for increased accuracy. Plot of the principal stress response for this first sub-model
is shown in Figure 32.

83
Figure 32. Stress hot-spot of stiffener connection in the first sub-model.
The stress concentration is located on the plate edge and in a tight location for strain gauge
measurements. The plate edge is under tension; thus, mode I surface displacement is the
most likely scenario for crack growth. For fatigue damage monitoring, strain gauge meas-
urements of structural hot-spot stresses are possible, but requires alteration of the horizontal
stiffener. The flange must be cut to make room for the strain gauges to be fitted. The stress
measurement method for type B hot-spot should be used. Increased accuracy can be achieved
by using ENS- or 4R-method for fatigue damage calculations, but measuring the needed
stress components from this detail can be difficult due to tight spaces and the complex ge-
ometry.
The second sub-model consists of a longitudinal deck stringer directly under the cabin struc-
ture. The stress concentration is on the flange connection butt joint. The joint is under tension
from the angular misalignment and prone to opening type (mode I) surface displacement.
Here, the hot-spot stresses are measured as type A. Nominal stresses are easier to measure
as there is room for instrumentation away from structural discontinuities, enabling the use
of more advanced fatigue calculation methods. Stress concentration shown in Figure 33.

84
Figure 33. Stress concentration on longitudinal stringer flange butt joint.
The third sub-model is a connection between a transverse stiffener and the ice-stringer. The
stress concentration is located on the cut-out plate section and can be measured as type B
hot-spot. As the surface is rounded, it is generally harder to extrapolate the measured stress
results to the weld toe. Measurement of nominal stresses for advanced fatigue calculation
methods is difficult due to complex geometry. The structural detail is under tension, poten-
tially leading into mode I crack opening. Third sub-model shown in Figure 34.
Figure 34. Stress hot-spot on ice-stringer connection.
85
The found stress hot-spots are generally applicable for stress/cycle monitoring, but should
be rechecked for their relevance to the overall hull fatigue life by finding the stress ranges
by continued analysis over the whole slamming wave event. Structural detail with high stress
value per singular load case only tells us the static situation.
7.9 Data collection evaluation
The requirements for constant on-demand damage outputs and warning systems for high
usage behaviour indicates the need for a long-term and permanent solution for data collec-
tion. Monitoring the found stress hot-spots for cyclic behaviour and potential permanent
damage from high static loads is needed. Storage for long-term data can be achieved with
local on-board equipment. After a set period of time, offloading this data to onshore storage
would be beneficial. Local storage is a better choice if sensitive locational data is handled.
7.10 Instrument technology
Stress cycles are collected with strain gauges. As local fatigue damage seems most likely,
SBSG’s in the structural details are sufficient for this job. During the measurement of hull
stress responses, other data is handled and collected during operation, leading to potential
electromagnetic interference, e.g. noise, in the measured responses. Noise can be eliminated
by using fibre optic strain gauges.
Collection of reference data, such as wave forms and periods can help understand which
situations are most critical for the health of the hull. Additional instruments for accurate
EOC estimation are needed, but usage of existing locational data and weather information
from third party providers is also sufficient for evaluation. Zero pressure warning systems
are not needed since the vessel is designed for semi-planing condition, bow emerging from
water level is regular.
7.11 Real-time health condition surveillance
Since the instrumentation is based on local responses, the damage and health condition mon-
itoring is based on the readings acquired from the SBSG’s. The on-demand damage can be
shown from the structural detail experiencing the highest current damage rate and/or stress.
86
Warning system can be set for yield limit exceedance to alert the driver for causing perma-
nent damage to the hull.
The colour coded warning signals for damage rates should be adjusted based on the stress
value related to the damage output. Damage caused by stresses over the yield limit are ex-
pressed as red and so forth. Adjustment of the colour coded damage rates should be done
after acquiring more knowledge on how the stress and damage fluctuations occur.
The stress cycle counting must be able to record even the smallest oscillation during the
operation. As slamming is assumed to be the most crucial load case for the fatigue life,
whipping and springing can only be measured with high sampling rates. Noise reduction is
also a key to eliminate any false cycles from the results. Equipment recording tests and cal-
ibration is required.
7.12 Mechanical prognostics
For the on-demand of the end-of-life condition analysis, a simple extrapolation of the current
damage rate with the previous information is the most efficient method for real-time evalu-
ation. Extrapolation provides enough accuracy for onboard management decisions to ship
guidance and operation.
Separate prediction based models can be used alongside the real-time evaluation. These
models can be built based on the knowledge learned during the ship operation. If enough
data is collected, statistics based prediction model would be most beneficial. E.g. the statis-
tical model can be based off the planned operational schedule and past statistics for damage
behaviour in similar conditions.
7.13 Maintenance and repair
In the current state, no hull maintenance or checking periods are in use. With the collected
knowledge of damage accumulation, setting up a condition based maintenance, or at least an
inspection period is easier. The inspection schedules can be planned at set damage intervals
or when high stress events occur during normal use. As the critical structural details are
already known, repairs for specific structures can be planned beforehand when scenarios

87
with limit state exceedance happen. Constructing a decision framework for such inspec-
tion/maintenance periods as shown in Chapter 5.3 becomes easier when the vessel behaviour
is better known through long-term monitoring.

88
8 DISCUSSION & CONCLUSIONS
In this study, a concept methodology for real-time hull fatigue monitoring for aluminium
vessels was created and briefly affirmed by using a case study of an ongoing design project.
The foundation for the methodology was supported by previously conducted studies and
various ship design codes. Relevance to terms such as structural health monitoring and hull
structural monitoring was quickly discovered.
The methodology in this study emphasizes the real-time aspect of structural health monitor-
ing and fatigue calculation. The sub-methods introduced are previous findings and tech-
niques used in structural health monitoring concepts. The methodology provides a simple
approach for the creation of a SHM-system capable of real-time fatigue monitoring and end-
of-life evaluation. The focus of such system should always support the initial requirements
for operation and the regulations for the vessel. The final decision for each sub-method is
down to the definition and particular needs for such system. After development of such
methodology concept in this study, following conclusions can be made:
- Building the SHM-system is greatly affected by the set initial requirements and reg-
ulations concerning the instrumentation usage and the available analysis methods,
e.g. hydromechanic responses and methods for fatigue calculations.
- Constructing a real-time fatigue monitoring system requires the collection of other
reference data to unlock the full potential of such system. Damage outputs combined
to further information, such as speed, heading and wave form provides deeper insight
for the operator on which actions are harmful for the hull integrity. The entirety of
this insight is known as hull structural health monitoring.
- The topic of structural health monitoring is broad and particularly divided between
actual and simulated responses. Real-time calculation discussed in this study focused
on the vessel responses directly measured from the actual vessel and available for the
user in a short span of time.
89
The methodology overall focuses on the real-time aspect of continuous data set collection
and on the use of real-world responses of the hull structures. The provided options are those
of regulatory parties, such as standards and design codes, and previous studies on the subject.
When a previous study and its findings are discussed, clear remarks are given. The infor-
mation used in this study is up-to-date and from reputable sources.
The subject of structural health monitoring for ships in the case of real-time fatigue moni-
toring is a broad topic and requires more research. In addition to this concept methodology,
further studies should focus on creating the individual methods for different ship types, e.g.
bulk carriers, cruise ships etc. based on the concept provided here. This methodology is gen-
erally also applicable for steel ships, providing that the design procedures are similar.
Further studies are needed also for the individual analysis methods discussed by this study.
The creation and testing of a robust cycle-counting method for hull responses from high
stresses to smaller effects such as whipping and springing by slamming is needed. Although,
a cycle-counting method is presented, its uses in highly oscillating loads is not verified. For
expansion of this method, a reliability program plan should be constructed alongside it to
further understand the impact of various failures.
The natural continuum for the case study of this research is the additional development of
the FSI method for state-of-the-art wave response simulations. The automation of such pro-
cess enables faster recognition of critical hull details and possibly a hydroelastic simulation
capable of whipping and springing responses.
For the case study briefly analysed here, further study into the device fitting and actual real-
time response calculations are needed. The information of the capability for running multiple
fatigue calculations aboard this vessel is important for assessing the need of instrumenting
every structural hot-spot found. The further research for this case example could also study
the possibility of using response expansion methods.
90
REFERENCES
ABS, 2020. American Bureau of Shipping: Guide for Hull Condition Monitoring Systems.
Houston: American Bureau of Shipping. 21 p.
Adnan, K., 2017. Structural Health Monitoring of Marine Structures by using Inverse Finite
Element Method, Glasgow: University of Strathclyde. 213 p.
Ahmad, R. & Kamaruddin, S., 2012. A review of condition-based maintenance decision-
making. European J. of Industrial Engineering, August, pp. 519-541. DOI:
10.1504/EJIE.2012.048854
ANSYS, 2010. Ansys AQWA. [Online] Available at: https://www.ansys.com/-
/media/ansys/corporate/resourcelibrary/brochure/ansys-aqwa-
brochure.pdf?la=en&hash=AF455251F33595AE29F106325A01256C9BFF66C2
[Accessed 5 May 2020].
Bertram, V., 2000. Practical Ship Hydrodynamics. 1st ed. Oxford: Butterworth Heinemann.
270 p. ISBN: 0750648511
Björk, T. et al., 2018. Fatigue strength assessment of duplex and super-duplex stainless steels
by 4R method. Welding in the World, 62(1285). 20 p. DOI: 10.1007/s40194-018-0657-8
Bridges, R. et al., 2013. Ice load monitoring systems, ShipRight sea event analysis procedure
for ice. Proceedings of the 22nd International Conference on Port and Ocean Engineering
under Arctic Conditions, 9 June. Espoo: Lloyd's Register Group Limited. 13 p. ISSN:
03766756
Broberg, K., 1999. Cracks and Fracture. 1st ed. Dublin: Academic Press. 752 p. ISBN:
0121341305
91
CADMATIC, 2020. CADMATIC Homepage. [Online] Available at:
https://www.cadmatic.com/en/marine/ [Accessed 6 May 2020].
Chang, P., Alison, F. & Liu, S., 2003. Review Paper: Health Monitoring of Civil
Infrastructure. Structural Health Monitoring, 2(3). Maryland: Sage Publications. pp. 257-
267. DOI: 10.1177/145792103036169
Ciappa, M. & Blascovich, A., 2015. Reliability odometer for real-time and in situ lifetime
measurement of power devices. Microelectronics Reliability, August, 55(9-10). Zurich:
Elsevier ltd. pp. 1351-1356. DOI: 10.1016/j.microrel.2015.06.095
Cusano, G. & La Marca, S., 2015. Evaluation and forecasting of elapsed fatigue life of ship
structures by analysing data from full scale ship structural monitoring, Genova: CETENA.
13 p. DOI: 10.17265/2159-5879/2015.02.002
Daidola, J. & Mishkevich, V., 1995. SSC-385 Hydrodynamic Impact on Displacement Ship
Hulls, Washington: Ship Structure Committee. 204 p.
Dessi, D. et al., 2018. Experimental methods. Proceedings of the 20th International Ship and
Offshore Structures Congress (ISSC 2018), Volume 2. Amsterdam: IOS Press and authors,
pp. 73-142. DOI:10.3233/978-1-61499-864-8-73
DNVGL-CG-0128, 2015. DNV GL rules for classification: Buckling. Edition October 2015.
Oslo: DNV GL AS, 123 p.
DNVGL-CG-0129, 2015. DNV GL rules for classification: Fatigue assessment of ship
structures. Edition October 2015. Oslo: DNV GL AS, 235 p.
DNVGL-RU-HSLC, 2019. DNV GL rules for classification: High speed and light craft (RU-
HSLC) - Part 3 Structures, equipment - Ch. 9 Direct calculation methods. Edition July 2020.
Oslo: DNV GL AS, 23 p.
92
DNVGL-RU-NAVAL, 2015. DNV GL rules for classification: Naval vessels (RU-NAVAL)
- Part 3 Surface ships - Ch. 1 Hull structures and ship equipment. Edition December 2015.
Oslo: DNV GL AS, 405 p.
Dowling, N. E., 2013. Mechanical Behaviour of Materials. Fourth edition. Essex: Pearson
Education Limited, 975 p. ISBN 13: 978-0-273-76455-7
Downing, S. & Socie, D., 1982. Simple rainflow counting algorithms. International Journal
of Fatigue, 4(1), pp. 31-40. DOI: 10.1016/0142-1123(82)90018-4
Fatemi, A., 2020a. efatigue. [Online] Available at:
https://www.efatigue.com/training/Chapter_5.pdf [Accessed 12 August 2020].
Fatemi, A., 2020b. efatigue. [Online] Available at:
https://www.efatigue.com/training/Chapter_6.pdf [Accessed 12 August 2020].
Fiedler, M. & Vormwald, M., 2016. Considering fatigue load sequence effects by applying
the Local Strain Approach and a fracture mechanics based damage parameter. Theoretical
and Applied Fracture Mechanics, 21 January, 83(2016). Darmstadt: Elsevier Ltd, pp. 31-41.
DOI: 10.1016/j.tafmec.2016.01.003
Forestier, J. & Austin, S., 2009. Hull Structure Monitoring System and VDR.Southhampton:
European Maritime Data Management, 48 p.
Fricke, W., 2013. IIW guideline for the assessment of weld root fatigue. Weld World, 57(6).
Hamburg: International Institute of Welding IIW, pp. 753-791. DOI: 10.1007/s40194-013-
0066-y
Fricke, W. & Kahl, A., 2007. Local Stress Analysis of Welded Ship Structural Details under
Consideration of the Real Weld Profile. Hamburg: International Institute of Welding (IIW).
Fukasawa, T. & Mukai, K., 2014. On the effects of hull-girder vibration upon fatigue
strength of a Post-Panamax container ship disaggregated by short-tern sea state.
93
International Journal of Naval Architecture and Ocean Engineering, 6(2). Osaka: SNAK, pp.
431-441. DOI: 10.2478/IJNAOE-2013-0190
Garbatov, Y., Rudan, S. & Guedes Soares, C., 2009. Fatigue assessment of welded
trapezoidal joints of a very fast ferry subjected to combined load. Engineering Structures,
32(2010). Lisbon: Elsevier Ltd, pp. 800-807. DOI: 10.1016/j.engstruct.2009.12.007
Guan, S., 2015. Current and Future Tendency of Monitoring Technology for Integrity
Assessment and Life Extension of the Hull Structure of Floating Production Storage and
Offloading (FPSO) Vessel. Dublin: DNV GL AS, 7 p. DOI: 10.1115/OMAE2015-41020
HBM, 2020. Strain-Gauge-Based Measurements of Ice Loads on Ships. [Online]
Available at: https://www.hbm.com/en/6725/article-temperature-compensation-of-strain-
gauges/ [Accessed 8 April 2020].
Hess, P. et al., 2018. Structural longetivity. Volume II. Amsterdam: IOS Press and authors,
pp. 391-449. DOI: 10.3233/978-1-61499-864-8-391
Hirdaris, S., White, N., Angoshtari, N. & Johnson, M., 2010. Wave loads and flexible fluid-
structure interactions: Current developments and future directions. Ships and Offshore
structures, 15 October, 5(4). London: Taylor & Francis, pp. 307-325. DOI:
10.1080/17445301003626263
Hobbacher, A., 2008. Recommendations for fatigue design of welded joints and
components. Paris: International Institute of Welding (IIW), 149 p.
Hoffman, K., 2012. An Introduction to Stress Analysis and Transducer Design using Strain
Gauges. 1st edition. HBM. 257 p.
Hopkinson, J., Gupta, M. & Sefcsick, P., 2002. SSC-418 Compensation for Openings in
primary Structural Members os Ships, Washington D.C.: Ship Structure Committee. 150 p.

94
Hughes, O. & Paik, J. K., 2010. Ship structural analysis and design. 1st edition. Jersey
City(New Jersey): The Society of Naval Architects and Marine Engineers. 576 p. ISBN No.
978-0-939773-78-3
Hulkkonen, T., Manderbacka, T. & Sugimoto, K., 2019. Digital Twin for Monitoring
Remaining Fatigue life of Critical Hull Structures, 18th Conference on Computer
Applications and Information Technology in the Maritime Industries. Tullamore: NAPA,
pp. 415 - 427.
Hu, LL., Zhao, X.-L. & Feng, P., 2016. Fatigue Behavior of Cracked High-Strength Steel
Plates Strengthened by CFRP Sheets. Journal of Composites for Construction, April. DOI:
10.1061/(ASCE)CC.1943-5614.0000698
Ibrahim, D., 2010. A Data Logger for Teaching Data Capturing and Analysis to Engineering
Students. Computer Applications in Engineering Education, 12 September, 18(2), pp. 397-
405. DOI: 10.1002/cae.20281
Incat, 2019. Incat Tasmania Pty Ltd: The World's largest aluminium ship. [Online] Available
at: https://www.incat.com.au/the-worlds-largest-aluminium-ship/ [Accessed 22 April 2020].
Jakobsson, E., 2019. Data-driven Condition Monitoring in Mining Vehicles, Linköping:
Linköping University. 36 p.
Johnson, N., Lynch, J. & Collette, M., 2018. Response and fatigue assessment of high speed
aluminium hulls using short-term wireless hull monitoring. Structure and Infrastructure
Engineering 14(5). London: Taylor & Francis pp. 634-651. DOI:
10.1080/15732479.2017.1380676
Knudsen, O. & Hassler, B., 2011. IMO legislation and its implementation: Accident risk,
vessel deficiencies and national administrative practices. Marine Policy. Stockholm:
Elsevier Ltd., pp. 201-207. DOI: 10.1016/j.marpol.2010.09.006
95
Kozak, J. & Gorski, Z., 2011. Fatigue strength determination of ship - part 1. Analytical
methods for determining fatigue strength. Polish Maritime Research, 18(2), pp. 28-36. DOI:
10.2478/v10012-011-0009-8
Kramer, R. K., Rampolla, B. & Magnusson, A., 2000. SSC-410 Fatigue of aluminum
structural weldments, Washington: Ship Structure Committee. 211 p.
Lakshmynarayanana, A., 2017. Application of 3-D CFD modelling for dynamic behaviour
of Ship in waves. Southhampton: University of Southhampton. 219 p.
Lee, J.-M.et al., 2010. Comparison of hot spot stress evaluation methods for welded
structures. International Journal of Naval Architecture and Ocean Engineering, 2(4). Busan:
SNAK, pp. 200-210. DOI: 10.2478/IJNAOE-2013-0037
Liao, L. & Köttig, F., 2014. Review of Hybrid Prognostics Approaches for Remaining
Useful Life Prediction of Engineered Systems, and an Application to Battery Life Prediction.
Palo Alto: IEEE, 27 February, 63(1), pp. 191-208. DOI: 10.1109/TR.2014.2299152
Lloyd's, 2015. Guidance notes: General Overview of Ship Structural Vibration Problems.
London: Lloyd's Register Group Limited. 18 p.
Loew, S., Obradovic, D. & Bottasso, C. L., 2019. Direct Online Rainflow-counting and
Indirect Fatigue Penalization Methods for Model Predictive Control. Naples: IEEE, pp.
3371-3376. DOI: 10.23919/ECC.2019.8795911
Magoga, T. et al., 2017. Identification of slam events experienced by a high-speed craft.
Ocean Engineering, 1 August, Volume 140. Tasmania: Elsevier Ltd, pp. 309-321. DOI:
10.1016/j.oceaneng.2016.07.017
Marsh, G. et al., 2016. Review and application of Rainflow residue processing techniques
for accurate fatigue damage estimation. International journal of fatigue, 82(3) Nottingham:
Elsevier Ltd., pp. 757-765. DOI: 10.1016/j.ijfatigue.2015.10.007
96
Matarazzo, T., Shahidi, S., Chang, M. & Pakzad, S., 2015. Are today’s SHM procedures
suitable for tomorrow’s bigdata? Bethlehem: The Society for Experimental Mechanics., pp.
59-65. DOI: 10.1007/978-3-319-15230-1_7
Matsuishi, M. & Endo, T., 1968. Fatigue of metals subject to varying stress. Japan: Japan
Society of Mechanical Engineers. 37 p.
Musallam, M. & Johnson, M. C., 2012. An Efficient Implementation of the Rainflow
Counting Algorithm for Life Consumption Estimation. Manchester: IEEE, 61(4), pp. 978-
986. DOI: 10.1109/TR.2012.2221040
Nair, A., Sivaprasad, K. & Nandakumar, C., 2017. Crack assessment criteria for ship hull
structure based on ship operational life, Cogent Engineering. 4(1), Kochi: Taylor & Francis
14 p. DOI: 10.1080/23311916.2017.1345044
Niemi, E., 1996. Hitsattujen rakenteiden väsymistarkastelussa käytettävät jännitykset.
Tampere: Metalliteollisuuden kustannus Oy. 45 p. ISBN: 951-817-650-7
Niemi, E., Fricke, W. & Maddox, S. J., 2018. Structural Hot-Spot Stress Approach to Fatigue
Analysis of Welded Components. Paris: Springer Nature Singapore Pte Ltd. 76 p. DOI:
10.1007/978-981-10-5568-3_1
Niemi, E. & Kemppi, J., 1993. Hitsatun rakenteen suunnittelun perusteet. Helsinki:
Opetushallitus. 337 p. ISBN: 951-37-1115-3
Nykänen, T. & Björk, T., 2015. Assessment of fatigue strength of steel butt-welded joints in
as-welded condition - Alternative approaches for curve fitting and mean stress effect
analysis. Marine Structures, 44(2015). Lappeenranta: Elsevier Ltd., pp. 288-310. DOI:
10.1016/j.marstruc.2015.09.005
Okamura, H., Sakai, S. & Susuki, I., 1979. Cumulative fatigue damage under random loads.
Fatigue of Engineering Materials and Structures, Volume 1. Tokyo: Fatigue of engineering
Ltd., pp. 409-419.
97
Ozdemir, M. & Ergin, A., 2013. Nonlinear buckling behaviour of stiffened sgip panels. In:
Analysis and Design of Marine Structures. London: Taylor & Francis, pp. 301-308. DOI:
10.1201/b15120-41
Passipoularidis, V. & Brøndsted, P., 2010. Fatigue Evaluation Algorithms: Review, Risoe:
Risø Nationallaboratoriet for Bæredygtig Energi. 65 p. ISBN: 978-87-550-3835-6
Perisic, N. & Tygesen, U., 2014. Cost-Effective Load Monitoring Methods for Fatigue Life
Estimation of Offshore Platform. California: ASME. DOI: 10.1115/OMAE2014-23865
Phelps, B. & Morris, B., 2013. Review of Hull Structural Monitoring Systems for Navy
Ships. Fishermans Bend: Commonwealth of Australia. 39 p.
Piro, D., 2013. A Hydroelastic Method for the Analysis of Global Ship Response Due to
Slamming Events, Michigan: The University of Michigan. 120 p.
Pramanik, A. et al., 2017. Joining of carbon fibre reinforced polymer (CFRP) composites
and aluminium alloys – A review. Composites: Part A, 10 June. Bentley: Elsevier Ltd., pp.
1-29. DOI: 10.1016/j.compositesa.2017.06.007
Razola, M., 2013. On Structural Design of High-Speed Craft. Stockholm:
Universitetsservice US AB. 32 p. ISBN 978-91-7501-650-4
Rosen, A., Garme, K., Razola, M. & Begovic, E., 2020. Numerical modelling of structure
responses for high-speed planing craft. Ocean Engineering 217. Stockholm: Elsevier Ltd.,
13 p. DOI: 10.1016/j.oceaneng.2020.107897
Rörup, J., Schellin, T. & Rathje, H., 2008. Load Generation for Structural Strength Analysis
of Large Containerships. pp. 89-99. DOI: 10.1115/OMAE2008-57121
Sajed, M. & Seyedkashi, H., 2020. Multilayer friction stir plug welding: A novel solid-state
method to repair cracks and voids in thick aluminum plates. CIRP Journal of Manufacturing

98
Science and Technology, 20 August. Birjand: Elsevier Ltd., 11 p. DOI:
10.1016/j.cirpj.2020.07.009
Samavatian, V., Iman-Eini, H. & Avenas, Y., 2018. An efficient online time-temperature-
dependent creep-fatigue rainflow counting algorithm. International Journal of Fatigue, 26
June, 116(2018). Tehran: Elsevier Ltd., pp. 284-292. DOI: 10.1016/j.ijfatigue.2018.06.037
SFS-EN 1999-1-3, 2007. Eurocode 9: Design of aluminium structures - Part 1-3: Structures
susceptible to fatigue. Helsinki: Finnish Standards Association SFS, 97 p.
SFS-EN ISO 12215-5, 2019. Small craft - Hull construction and scantlings - Part 5: Design
pressures for monohulls, design stresses, scantlings determination. Helsinki: Finnish
Standards Association SFS. 126 p.
SFS-ISO 13381-5, 2015. Condition monitoring and diagnostics of machines. Prognostics.
Part 1. General guidelines, Helsinki: Finnish Standards Association SFS. 25 p.
Sheinberg, R., Cleary, C., Stambaugh, K. & Storhaug, G., 2011. Investigation of Wave
Impact and Whipping Response on the Fatigue Life and. Baltimore: American Society of
Naval Engineers, 8 p.
Sielski, R., 2008. Research needs in aluminum structure. 10th International Symposium on
Practical Design of Ships and Other Floating Structures. Houston, Texas: American Bureau
of Shipping, 8 p.
Sielski, R., Wilkins, J. & Hults, J., 2002. Supplemental Commercial Design Guidance for
Fatigue. Williamsburg Ct.: Ship Structure Committee, 374 p.
Siipola, L., 2018. Modern methods in ship structure analysis. [Online]
Available at: https://blog.elomatic.com/en/modern-methods-in-ship-structure-analysis-
[Accessed 6 May 2020].

99
Smith, C., 2007. Extreme Waves and Ship Design. Houston: American Bureau of Shippping.
8 p.
Soliman, M., Barone, G. & Frangopol, D., 2019. Fatigue Reliability and Service Life
Prediction of Aluminum Naval Ship. Loughborough: Sage. 30 p. DOI:
10.1177/1475921714546059
SpaceClaim, 2020. Ansys SpaceClaim Homepage. [Online] Available at:
http://www.spaceclaim.com/en/default [Accessed 6 May 2020].
Storhaug, G., 2019. DNV GL - Digital twins and sensor monitoring. [Online]
Available at: https://www.dnvgl.com/expert-story/maritime-impact/Digital-twins-and-
sensor-monitoring.html [Accessed 18 March 2020].
Takami, T. & Iijima, K., 2019. Numerical investigation into combined global and local
hydroelastic response in a large container ship based on two-way coupled CFD and FEA.
Journal of Marine Science and Technology, Issue Japan. Tokyo, pp. 346-362. DOI:
10.1007/s00773-019-00668-7
Thompson, I., 2020. Virtual hull monitoring of a naval vessel using hindcast data and
reconstructed 2-D wave spectra. Marine Structures, May, Volume 71. Darthmouth: Elsevier
Ltd., pp. 1-14. DOI: 10.1016/j.marstruc.2020.102730
Torkildsen, H. et al., 2005. Development and Applications of Full-Scale Ship Hull Health
Monitoring Systems for the Royal Norwegian Navy. Recent Developments in Non-Intrusive
Measurement Technology for Military Application on Model- and Full-Scale Vehicles.
Kjeller: RTO-NATO, pp. 22-1 - 22-14. Proceedings from RTO-MP-AVT-124.
Tveiten, B., Wang, X. & Berge, S., 2007. Fatigue Assessment of Aluminum Ship Details by
Hot-Spot Stress Approach. Florida: Society of Naval Architects and Marine Engineers., pp.
255-271. DOI: 10.1115/OMAE2011-50201
100
Ugras, R. C. et al., 2018. Real time high cycle fatigue estimation algorithm and load history
monitoring for vehicles by the use of frequency domain methods. Mechanical Systems and
Signal Processing, 118. Istanbul: Elsevier Ltd., pp. 290-304. DOI:
10.1016/j.ymssp.2018.08.043
Wang, H.-T., Wu, G. & Jiang, J.-B., 2015. Fatigue Behavior of Cracked Steel Plates
Strengthened with Different CFRP Systems and Configurations. Journal of Composites for
Construction, November. DOI: 10.1061/(ASCE)CC.1943-5614.0000647
White, N., Wang, Z. & Lee, Y., 2012. Guidance Notes on Whipping and Springing
Assessment. London: Lloyd's Register Group Ltd., 15 p.
VTT Expert Services Oy, 2016. Ammattiveneohjeisto, versio 2016.2. 268 p.
VTT LLC, 2020. VTT Research - Governance and Principles. [Online] Available at:
https://www.vttresearch.com/en/vtts-governance-and-principles [Accessed 23 March
2020].
Vukelic, G. & Vizentin, G., 2017. Common Case Studies of Marine Structural Failures.
Failure Analysis and Prevention. Rijeka: IntechOpen, pp. 135-151. DOI:
10.5772/intechopen.72789
Zhang, B., Li, X. & Li, D., 2013. Assessment of thermal expansion coefficient for pure
metals. Computer Coupling of Phase Diagrams and Thermochemistry, 43. Xiangtan:
Elsevier Ltd., pp. 7-17. DOI: 10.1016/j.calphad.2013.08.006
Zilakos, I. et al., 2013. A FE based numerical tool for crack assessment in ship structures
employing the CSR loading scheme. In: Analysis and Design of Marine Structures. Athens:
Taylor & Francis Group, pp. 281-289.

Appendix I
Tabular specifications for hull monitoring systems by class societies. (Hess, et al., 2018, p.
408)